EUROPEAN COMMISSION
Brussels, 18.11.2022
SWD(2022) 751 final
COMMISSION STAFF WORKING DOCUMENT
Education and Training Monitor 2022
Accompanying the document
Communication from the Commission to the European Parliament, the Council, the European Economic and Social Committee and the Committee of the Regions
on progress towards the achievement of the European Education Area
{COM(2022) 700 final} - {SWD(2022) 750 final}
Contents
Executive summary
Part 1. The right of learning
Chapter 1. A new indicator brings the conversation closer to the roots of inequity in education
1.1.
Socio-economic status has an immense effect on educational performance
1.2.
Complementary evidence on specific disadvantaged groups adds further texture
1.3.
Specific policies can alleviate inequities but remain underexploited
Chapter 2. A level playing field is set in the early years
2.1.
Future progress requires broadening access and improving affordability
2.2.
Inclusive ECEC reaches out to children who stand to benefit from it the most
2.3.
Quality of ECEC provision took a hit during COVID-19
Part 2. The time of learning
Chapter 3. A better responsiveness is needed for future decreases in early school leaving
3.1.
Past successes in reducing early school leaving rates are no cause for complacency
3.2.
A return to education and training is difficult and costly
3.3.
Future progress requires a policy focus on young people at highest risk
Chapter 4. A diverse and evolving landscape characterises vocational education and training
4.1.
VET and work-based learning provide skills for today and for the future
4.2.
The mobility of VET learners was interrupted by the pandemic
4.3.
VET is a pathway onto the labour market
Chapter 5. An expansion of higher education masks persisting disparities
5.1.
Progress in tertiary educational attainment is led by young women
5.2.
Gender stereotypes persist in study choice
5.3.
Learning mobility remains limited and highly unbalanced
Chapter 6. An era of transitions demands lifelong skills development
6.1.
Increasing participation in adult learning is a renewed priority
6.2.
There are signs of recovery amid a strikingly uneven country performance
6.3.
Adult learning is rare among people with a low level of education and in rural areas
Part 3. The kind of learning
Chapter 7. A policy focus on key competences looks beyond basic skills
7.1.
Underachievement in basic skills goes down with instruction time
7.2.
Multilingualism may be on the rise
7.3.
Citizenship attitudes evolve with education
Chapter 8. A focus on digital and sustainability competences concerns learners of all ages
8.1.
Member States are trying to keep up with an accelerated digital transition
8.2.
Adult learning will be needed to reach the Digital Decade objectives
8.3.
Gender and socio-economic gaps are replicated in sustainability competence areas
Executive summary
The Education and Training Monitor’s comparative report comprises a broad, cross-EU analysis of education and training systems to go alongside 27 more in-depth country reports. The comparative report tracks progress towards achieving the EU-level targets agreed as part of the strategic framework for European cooperation in the field. Seven EU-level targets have been set, and this report complements them with numerous supporting indicators to shed light on context and possible policy levers. In addition, the 2022 edition starts with a brand new EU-level indicator – developed in response to a request from the Council – to be used as a broad measure of the equity of EU education and training systems. The 2022 Education and Training Monitor accompanies a Commission progress report on the European Education Area.
A new indicator brings the conversation closer to the roots of inequity in education
No education and training system manages to decouple performance from socio-economic status. Young people from disadvantaged socio-economic backgrounds are almost six times more likely to underachieve at age 15 than those from advantaged socio-economic backgrounds, suggesting a strong intergenerational transmission of educational disadvantage. Such inequities do not emerge at age 15 and do not stop there. Stepping up the focus on equity in education is likely to support future progress in all existing EU-level target domains. The 2022 Education and Training Monitor demonstrates key equity challenges across other domains, with underperformance widespread among specific population sub-groups, and often clustered in the same schools or areas.
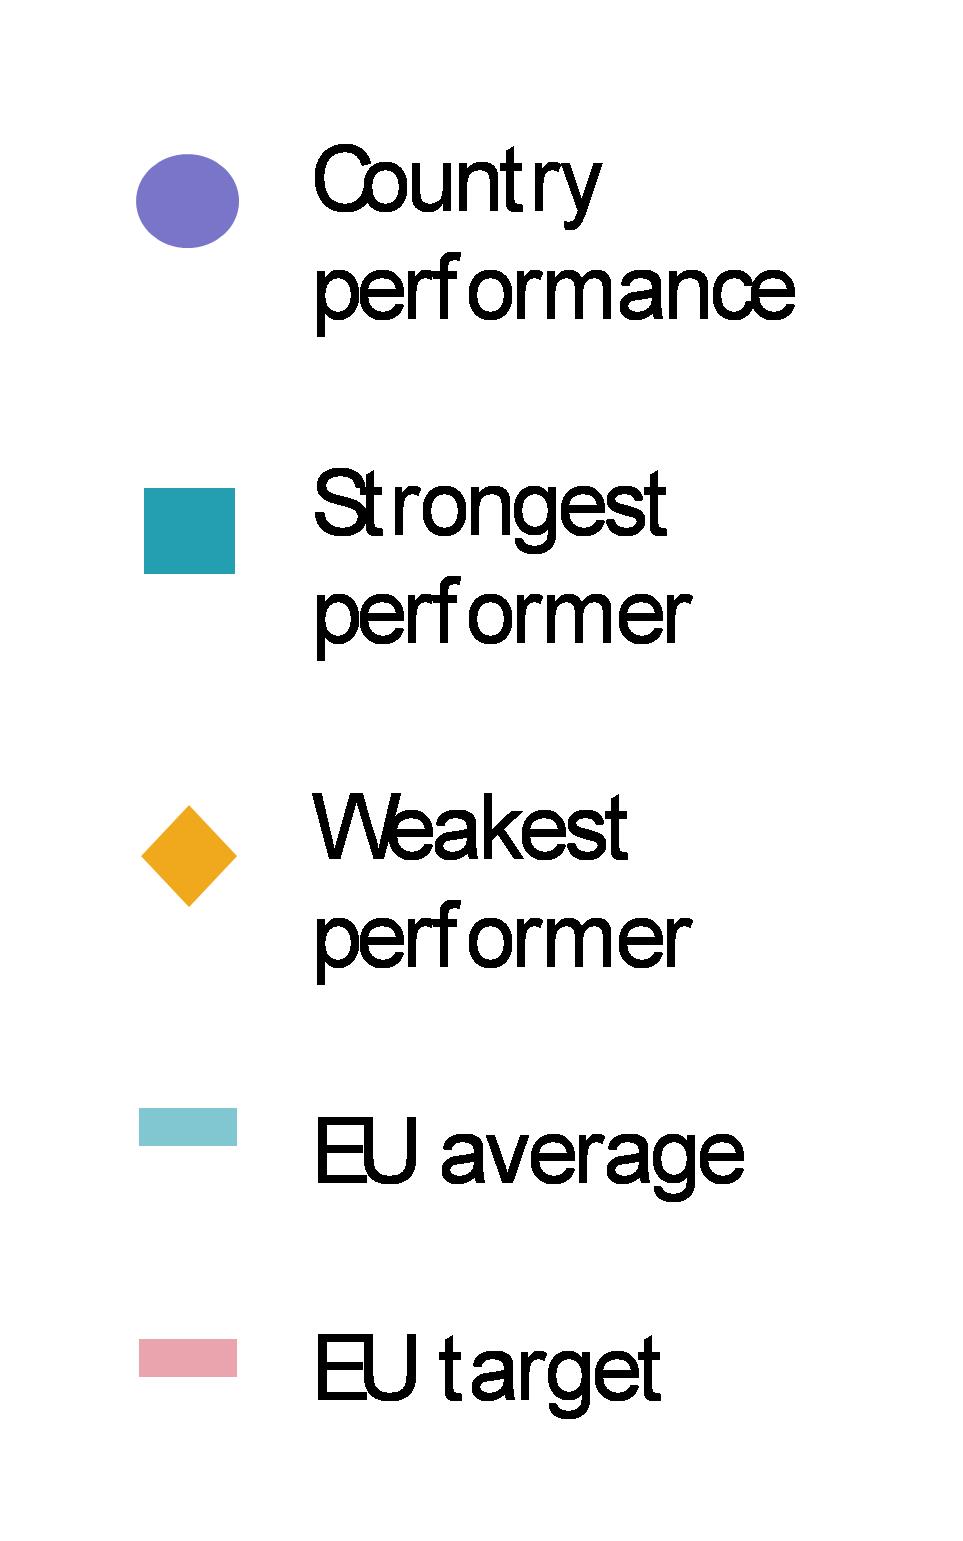
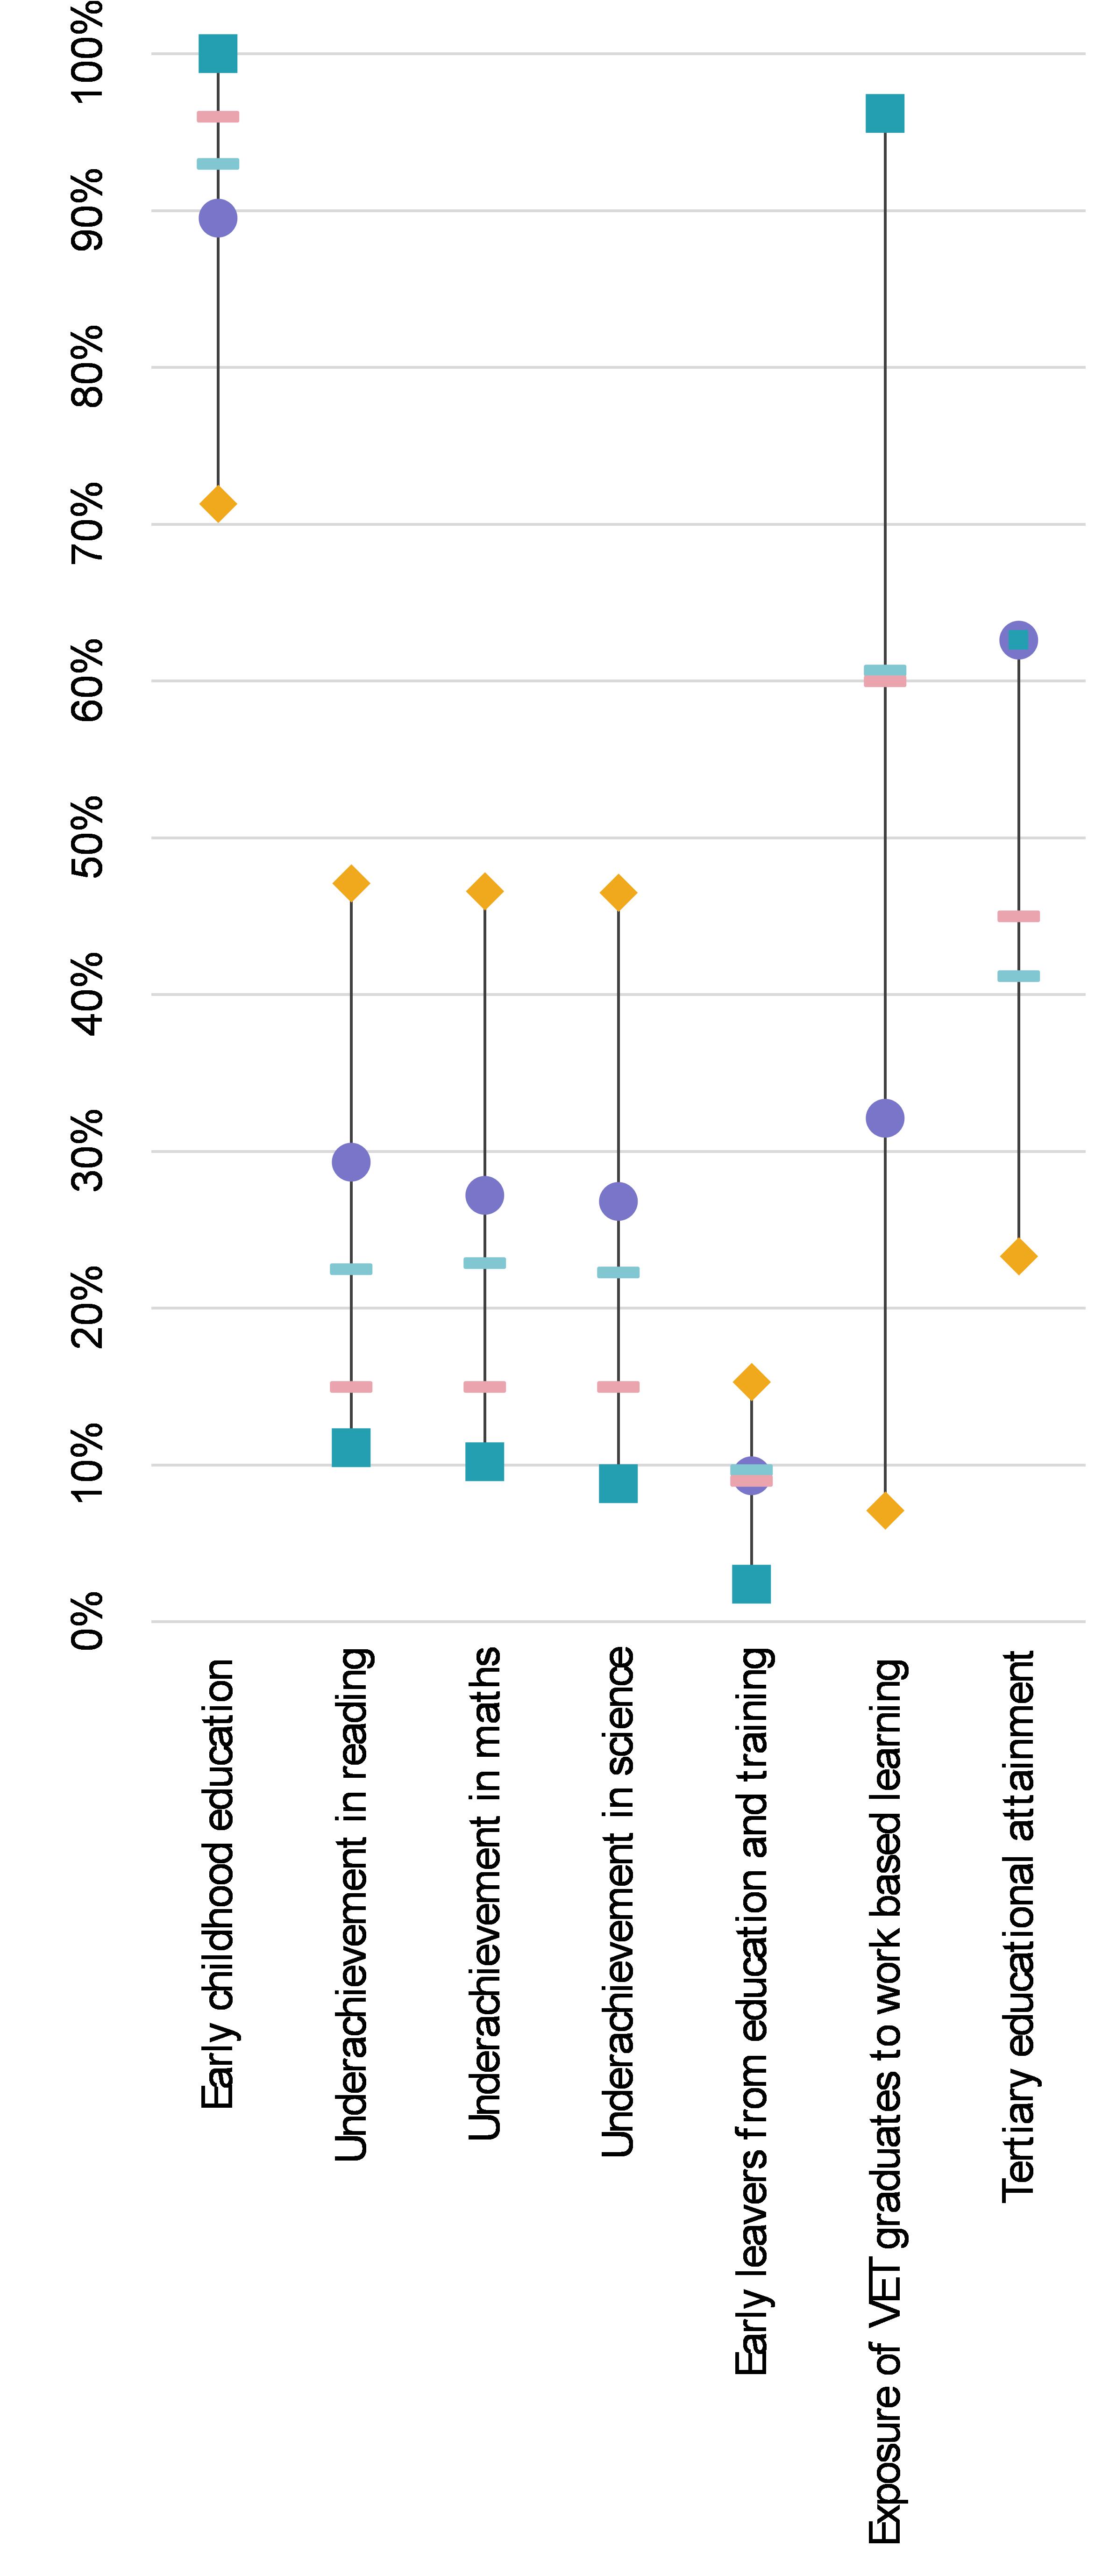
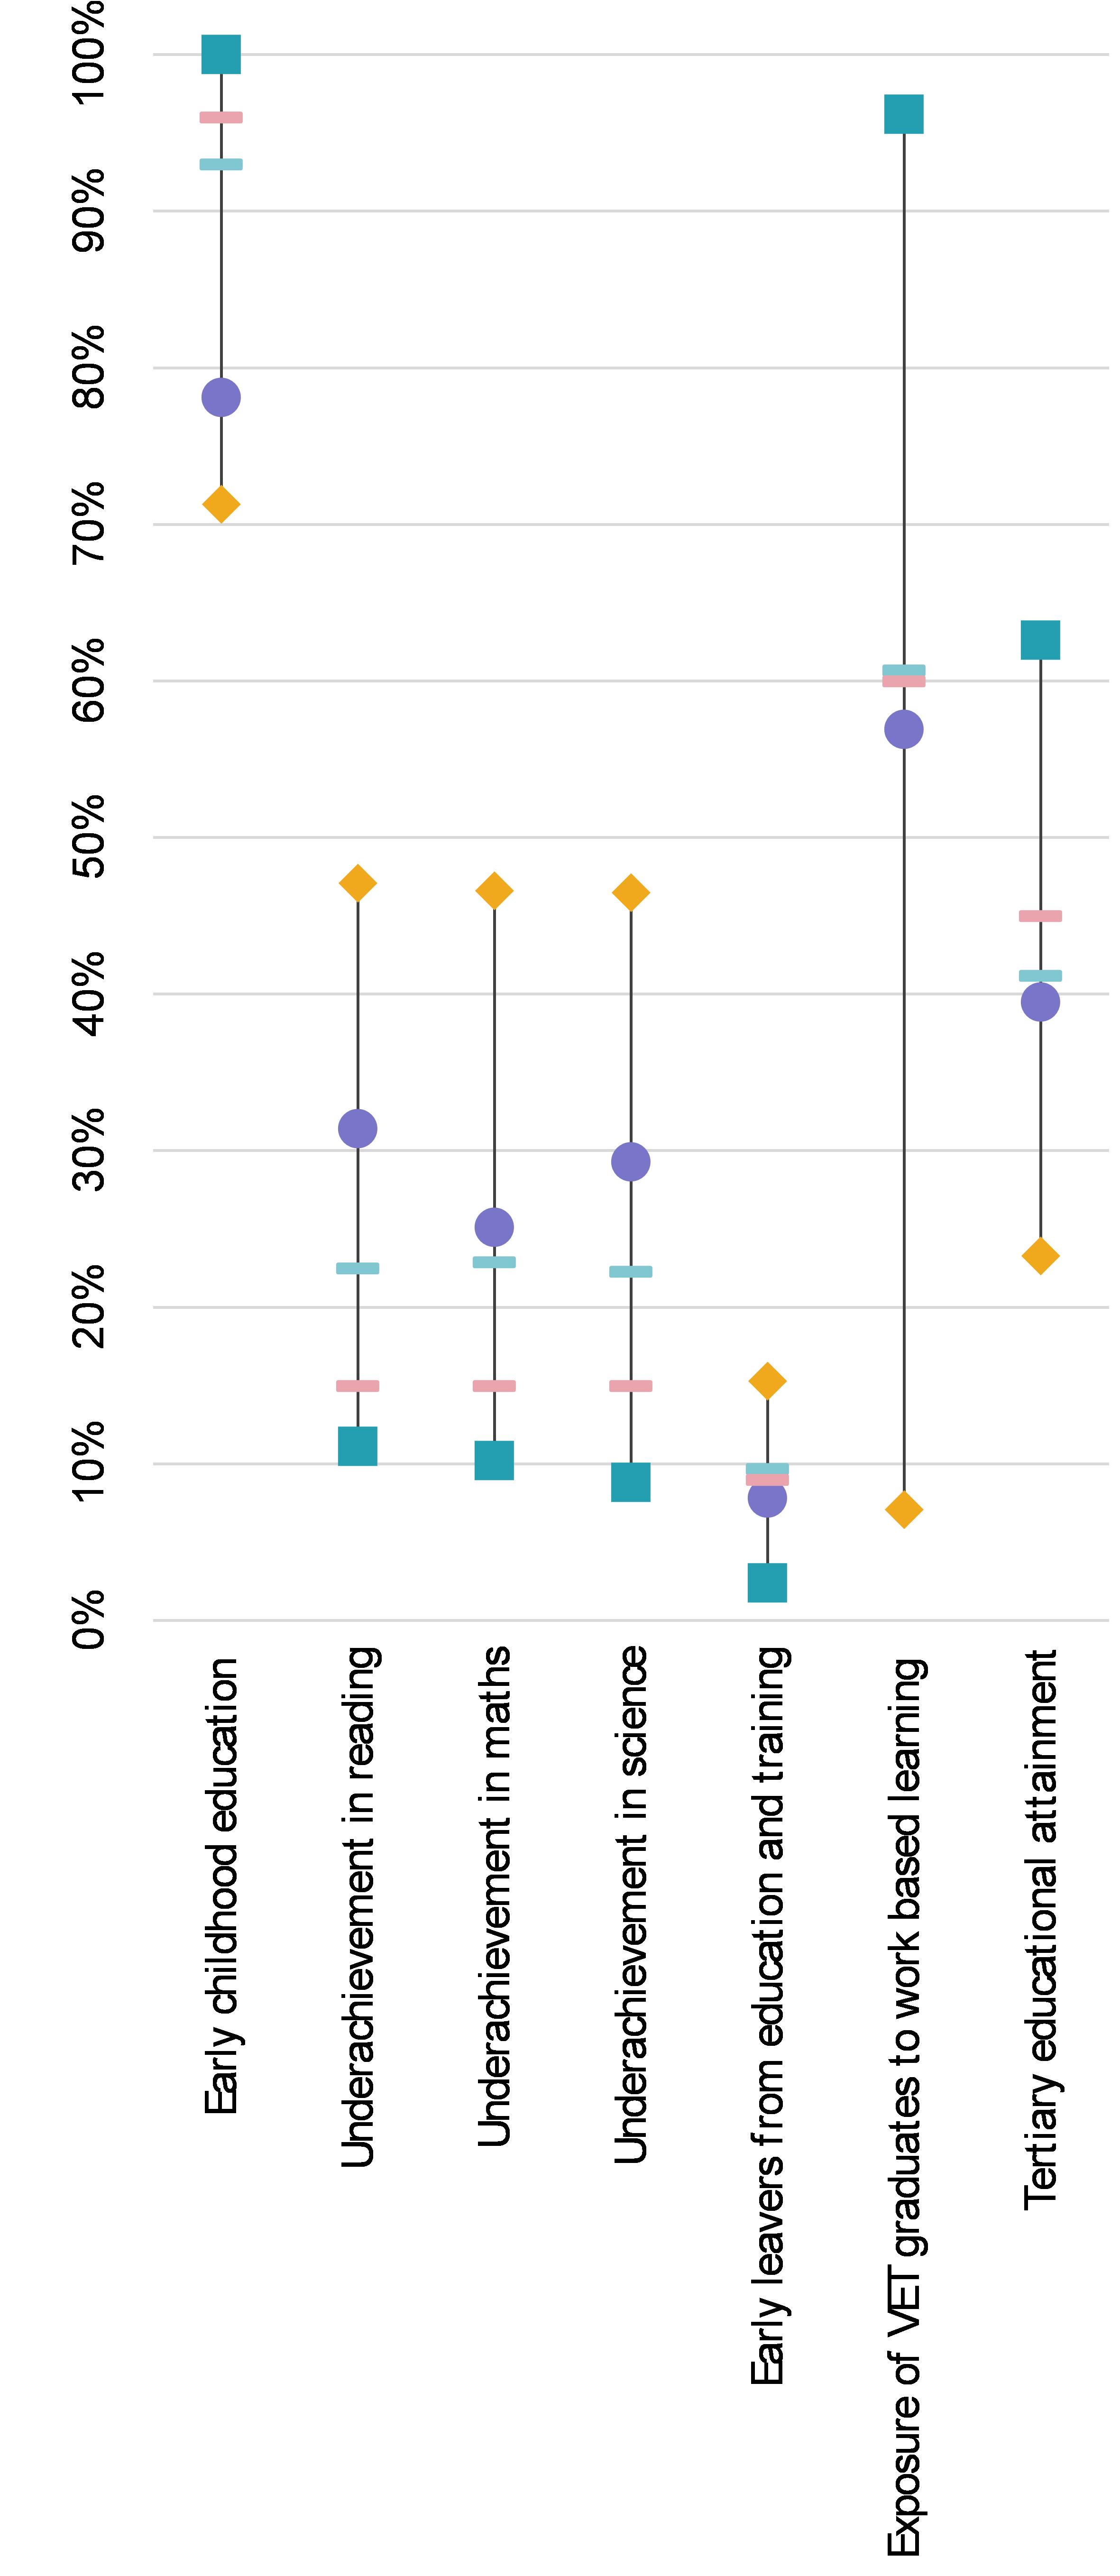
A summary of country performance with regards to the EU-level targets under the
EEA Strategic framework Resolution
.
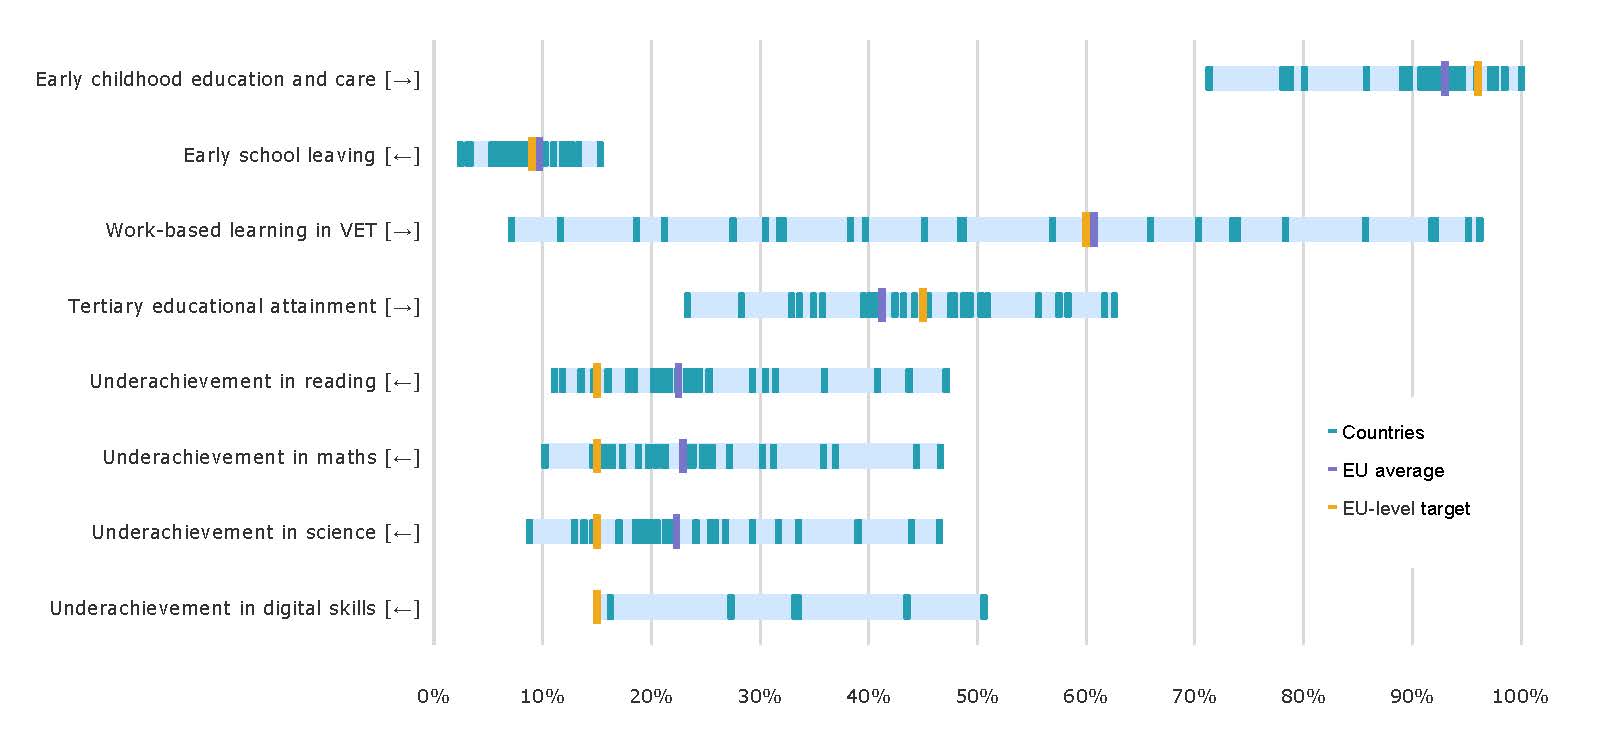
Source: Eurostat (EU Labour Force Survey 2021 and UOE 2020), OECD (PISA 2018) and IEA (ICILS 2018). Note: the EU-level target on adult learning is omitted as data supporting the main indicator will only be available as of 2023.
A level playing field is set in the early years
Quality early childhood education and care (ECEC) is a major contributor to equity when it can reach children from disadvantaged socio-economic backgrounds. Participation in ECEC contributes to better cognitive outcomes and better prospects, especially for vulnerable children. At 93.0% in 2020, the overall share of children between the age of 3 and the start of compulsory primary education enrolled in ECEC has remained stable. Yet children from disadvantaged backgrounds continue to encounter obstacles to participation. Several EU countries have recently broadened access by extending the age of the ECEC place guarantee or improving affordability. Even though closures and restrictions were not as ubiquitous as at other education levels, the COVID-19 pandemic put pressure on the quality of provision, and a spotlight on pre-existing structural issues.
A better responsiveness is needed for future decreases in early school leaving
At 9.7% in 2021, the share of early leavers from education and training continues to fall and remains on track to achieving the 2030 target of less than 9%. Approximately 3.1 million young people are now disengaged from education and training while having attained lower secondary qualifications at most, with only 42.3% of them being employed. Future progress may require refocusing on the most disadvantaged and hardest-to-reach young people. For instance, young people whose parents have a low level of education are nine times more likely to be early school leavers than young people whose parents have a high level of education. The Pathways to School Success proposal links low attainment and low achievement in education, supporting a wide range of actors in their capacity to respond to the real-world needs of today’s young people.
A diverse and evolving landscape characterises vocational education and training
Nearly half (48.7%) of all pupils enrolled in upper secondary education are in vocational education and training (VET). The 2022 Education and Training Monitor captures progress towards three key objectives for the VET sector, covering work-based learning, mobility and graduate employability. In terms of work-based learning, newly collected data reveal major differences between countries. While at EU level, the 2025 target seems within reach, the full impact of the COVID-19 pandemic is yet to be captured. The pandemic has also interrupted a gradual increase in VET learner mobility, with some recovery beginning in May 2021. Furthermore, at 76.4% in 2021, the employment rates of recent VET graduates suffered from the pandemic too, with recovery remaining incomplete.
An expansion of higher education masks persisting disparities
In 2021, 41.2% of 25-34 year-olds had a tertiary-level qualification, keeping the EU on track towards meeting its 2030 target of at least 45%. However, decades of educational expansion have coincided with an ever-widening gender gap, reaching 11.1 percentage points in favour of women. Evidence suggests that gender gaps emerge long before tertiary education and widen along the education trajectory, as mirrored in most data on new entrants, enrolments and completion. Study choice also retains a strong gender divide, and women remain underrepresented in disciplines such as ICT and engineering. In addition, tertiary educational attainment rates are 48.6 percentage points higher among young people whose parents have a high level of education than they are among young people whose parents have a low level of education.
An era of transitions demands lifelong skills development
In 2021, 10.8% of adults aged 25 to 64 participated in formal or non-formal learning activities over the preceding 4 weeks, showing a recovery from pandemic-induced drops the previous year. While adult learning in the preceding 4 weeks has increased among the unemployed (now 12.7%), it is still much less prevalent among people with a low level of education (4.3%) and people living in rural areas (7.8%). These data build on a new, more granular definition of adult learning – and will be improved again next year with the reference period for learning activities being extended to 12 months. It is the 12-month reference period that will be used for the EU-level targets for both 2025 and 2030, as well as for national targets set by the Member States.
A policy focus on key competences looks beyond basic skills
The fact that underachievement in basic skills is associated with less time being allocated for instruction could spell bad news for the learning losses that may have resulted from physical school closures. However, there are other key competences beyond reading, maths and science that should not be overlooked in a post-COVID-19 world. The 2022 Education and Training Monitor looks at the latest evidence on key competence domains such as multilingualism and citizenship. Firstly, almost two thirds of lower secondary students now learn at least two foreign languages, strengthening intercultural understanding. Secondly, in terms of civic awareness, substantial shares of young people give priority to issues such as inequality (42.8%) and climate change (39.4%).
A focus on digital and sustainability competences concerns learners of all ages
The promotion of digital and sustainability competences can benefit from them being mainstreamed in compulsory education as cross-curricular subjects. It will also benefit from the boosting of teachers’ confidence and skills. Yet ensuring a basic proficiency in digital and sustainability competences has particular implications for adult learning, making sure that learners who already left the formal education and training systems do not miss out on the opportunities provided by an accelerating twin transition. Moreover, it should be emphasised that these competence domains are marked by the same inequities that permeate the entirety of education and training. For instance, boys are more likely to underachieve in digital skills than girls, and engagement in environmental protection activities is more prevalent among young people from advantaged socio-economic backgrounds in several Member States.
Part 1. The right of learning
The right to education is enshrined in the Universal Declaration of Human Rights and a cornerstone of the rights-based Sustainable Development Goal 4 for education, contributing to a fair society of equal opportunities. At EU level, it is the European Pillar of Social Rights that plays a key role in battling inequalities between and within Member States. Efforts to improve equity and inclusion in education and training complement the EU equality strategies adopted in 2020-21. They form a strategic priority of European cooperation in education and training towards the European Education Area and beyond.
Equitable education and training systems are not about equal educational attainment or equal educational achievement. Instead, they are expected to ensure that young people’s educational performance is decoupled from individual circumstances such as socio-economic status – the latter often captured by parental education and occupation, or household income. Moreover, inclusive education and training systems are responsive to the outcomes and experiences faced by specific population sub-groups.
Part 1 of this report puts equity front and centre. It starts off with a brand new EU-level indicator on equity in education and training, in response to an invitation to propose one as part of the
EEA Strategic framework Resolution
. The proposed approach affirms the objective to decouple education outcomes from socio-economic status. The new indicator is based on the OECD’s Programme for International Student Achievement (PISA). Part 1 then continues with a chapter on access to quality early childhood education and care, which levels the playing field in a truly equitable education and training system.
Box 1. Evidence suggests physical school closures have widened educational inequities
National research suggests that where learning loss occurred, it typically exacerbated educational inequalities stemming from pre-existing socio-economic gaps. In the Netherlands, for example, learning losses were 60% higher among students living in households where neither parent had achieved qualifications above lower secondary education level. Similarly, a study from Belgium found a correlation between the extent of the learning loss and school characteristics, with schools with higher shares of disadvantaged student populations experiencing larger learning losses. Studies from some other Member States showed similar patterns.
Several key factors were likely to influence children’s vulnerability to learning loss. Parental education likely played an important role, as parents with lower educational achievement may have found it more difficult to provide their children with adequate learning support at home during physical school closures. Children living in single-parent households may have been particularly vulnerable, especially where single parents were employed and experienced work-life balance difficulties that prevented them from providing appropriate learning support. Migrant status of parents and children contributed to learning vulnerability, as parents may have struggled to provide learning support to their children due to language barriers or differences in educational systems between countries.
Above all, learning loss was concentrated among children experiencing socio-economic disadvantages, such as low household income, lack of access to educational tools, lack of internet access, or lack of parental support in learning. Migrant and displaced children, especially refugees and asylum-seekers, were more vulnerable to educational disruption where they had limited access to resources necessary for online learning. Children from certain minority ethnic backgrounds, such as Roma, experienced such poor digital infrastructure too. Limited internet access in certain remote rural locations was also likely to contribute to learning loss.
Source:
Employment and Social Developments in Europe (ESDE) review 2022
.
Chapter 1. A new indicator brings the conversation closer to the roots of inequity in education
1.1.
Socio-economic status has an immense effect on educational performance
For the very first time, Figure 1 contrasts severe educational underperformance among learners from disadvantaged socio-economic backgrounds with that of learners from advantaged socio-economic backgrounds. Severe underperformance here means a low score on all three PISA scales simultaneously (reading, maths and science). Socio-economic status is captured by the OECD’s index for economic, social and cultural status, comparing its lowest and highest quarters. This broad measure of inequity tops no fewer than 35 percentage points in Romania (39.0) and Bulgaria (38.3). The gap is 19.3 percentage points on average across the EU, with students of low socio-economic status 5.6 times more likely to underachieve in school education than students of high socio-economic status.
Figure 1. Educational underperformance is coupled with socio-economic status
Source: European Commission (Joint Research Centre) calculations based on OECD’s PISA 2018 data. Note: countries are shown in descending order according to the percentage point difference between the lowest and highest quarters of socio-economic status in terms of average underachievement in reading, maths and science (combined). Figures on top of each bar denote the ratio between the two values.
The outsized role of socio-economic status is not limited to a minority of Member States, but there are huge disparities between countries as to the size of underachievement gaps. Firstly, a gap of under 10 percentage points only exists in Estonia and Finland (5.1 and 9.9, respectively). These two countries are generally top performers in PISA and thereby show that there is no inherent trade-off between excellence and equity. Secondly, country variation is so substantial that students from advantaged socio-economic backgrounds in some countries are still much more likely to underperform than students from disadvantaged socio-economic backgrounds in other countries.
Box 2. How does the new EU-level indicator compare with the existing EU-level targets on underachievement in reading, maths and science?
The new EU-level indicator for equity in education uses a combined measure of severe educational underachievement. Instead of looking at low achievement in reading, maths and science separately – as is the approach of the complementary EU-level target on underachievement in basic skills (Section 7.1) – it captures underperformance on all three proficiency scales simultaneously.
It is more likely for a 15-year-old to have a low score on one PISA scale than on all three PISA scales simultaneously. Across the EU, the shares of underachievement in reading (22.5%), maths (22.9%) and science (22.3%) are all higher than the share of underachievement in all three domains combined (13.0%). This illustrates how the new EU-level indicator on equity is built on a more severe definition of educational underachievement. Here, eight Member States yield shares above 15%: Bulgaria (32.0%), Romania (29.8%), Cyprus (25.7%), Malta (22.6%), Greece (19.9%), Luxembourg (17.4%), Slovakia (16.9%) and Hungary (15.4%).
Underachievement gaps by socio-economic status are also different when looking at the three PISA domains separately as opposed to combined (Figure 2). The new EU-level indicator for equity in education is more favourable to some countries and less favourable to others. Some Member States compare more positively with the EU average, such as Czechia (in particular when compared to reading and maths separately), Slovenia (maths, reading) and Denmark (science). Other Member States compare more negatively with the EU average, such as Malta (in particular when compared to reading separately) and Cyprus (maths).
Figure 2. The underachievement gap between low and high socio-economic status when combining reading, maths and science, and when looking at them separately
|
|
Combined
|
Reading
|
Maths
|
Science
|
Source: European Commission (Joint Research Centre) calculations based on OECD’s PISA 2018 data. Note: the indicator captures the percentage point difference between the lowest and highest quarters of socio-economic status in terms of average underachievement in reading, maths and science (seperately); countries are shown in descending order according to average underachievement gap in reading, maths and science (combined).
Even though education and training systems all across the EU try to eliminate any negative effects arising from learners’ individual circumstances, low socio-economic status may be the largest single explanatory factor obstructing equality of opportunity for many different disadvantaged groups. Low socio-economic status permeates the school experience in various ways. Its effects are evident for the youngest age brackets with comparative data available and even extend to 15-year-olds’ expectations of completing tertiary education in the future. Socio-economic status is so engrained in education and training systems that learners with low socio-economic status may end up clustered in schools with a concentration of similarly disadvantaged peers.
The passing down of educational disadvantage throughout the generations remains pervasive in all EU-level target domains covered in the 2022 Education and Training Monitor with proxies for socio-economic background available. For instance, young people whose parents have a low level of education are nine times more likely to become early school leavers (Chapter 3) and 48.6 percentage points less likely to attain a tertiary educational qualification (Chapter 5) when compared to young people whose parents have a high level of education.
1.2.
Complementary evidence on specific disadvantaged groups adds further texture
Inclusive education presupposes an assessment of the disadvantage experienced by specific population sub-groups. Some elements of this disadvantage may be due to socio-economic status, whereas others could be attributed to factors such as prejudice, discrimination, language barriers or a lack of appropriate services.
Women outperform men in virtually all EU-level education statistics. Combined underachievement in reading, maths and science is about 3 percentage points less common among girls (with the socio-economic gap in underachievement being nearly identical). The risk of early leaving from education and training is 3.5 percentage points lower among girls (Chapter 3) and tertiary educational attainment is no less than 11.1 percentage points more common among women (Chapter 5). Education and training systems do nonetheless contribute towards engraining outdated gender stereotypes. Gender equality measures in education are particularly targeted at creating a better gender balance in certain fields of study, and at developing equality plans, particularly in higher education institutions.
Migrant young people are 12.9 percentage points more likely to become early school leavers than the overall EU average (Chapter 3). They are 7.1 percentage points less likely to attain a tertiary education qualification (Chapter 5). The later migrants arrive in the education trajectory, the more education and training systems struggle to integrate them. The underperformance gap between low and high socio-economic status is 20.9 percentage points when the test language is not spoken at home, versus 17.4 percentage points when it is (Figure 3). The difference is much more pronounced in Hungary (59.1 versus 27.8), Romania (64.2 versus 37.7), Slovakia (49.2 versus 23.9) and Portugal (40.2 versus 20.2).
Figure 3. A different home language widens inequities further in some Member States
Source: European Commission (Joint Research Centre) calculations based on OECD’s PISA 2018 data. Note: countries are shown in descending order according to the underachievement gap among students who speak the test language at home. The difference between the test language being spoken at home or not in terms of underachievement gaps between low and high socio-economic status is not statistically significant at the 0.05 level for Cyprus, Ireland and Poland.
The new EU-level indicator domain on inclusion and equity must always remain a work in progress, taking on board the latest evidence as the knowledge base is strengthened further over time. Such a flexible approach enables the monitoring exercise to acknowledge, for instance, periodical data on young people from racial and ethnic minorities who are marginalised and/or discriminated against, young people with disabilities and/or special education needs, and school-age refugees (Box 4). Furthermore, non-discrimination in education is itself a sub-dimension that may strengthen the EU-level indicator domain on inclusion and equity in the future.
Box 3. Investigating the share of out-of-school 15-year-olds
Another fundamentally overlooked issue may be that of out-of-school young people, who do not have a chance to underperform in the first place. Figure 4 captures the share of unenrolled 15-year-olds across the EU. These 15-year-olds may be at different stages of each country’s educational pathway (whether lower or upper secondary education), yet still at compulsory schooling age in most Member States. It is worth noting that low performing countries in Figure 1 (Romania, Bulgaria) also yield significant shares of out-of-school young people in Figure 4 (16.8% and 14.5% respectively). Further investigation of this indicator is warranted.
Figure 4. Around 3% of all 15-year-olds are not enrolled in the national education system
Source: Eurostat (UOE 2020). Note: the indicator combines demography and enrolment statistics, approximating the share of 15-year-olds not enrolled in domestic formal education.
1.3.
Specific policies can alleviate inequities but remain underexploited
Equity and inclusion in education and training is a challenge across all Member States. Just like the scope and determinants of the problem vary from country to country, so do the various education and training systems in terms of institutional stratification and specific policy measures to alleviate the effects of socio-economic status. This section summarises a few examples of the top-level financial and non-financial support that is provided by (and to) the education and training systems across the EU.
Most Member States provide additional financial support for schools with disadvantaged students, either upon application or it is allocated automatically. Only Croatia, Cyprus, Greece, Hungary, Malta, Luxembourg and Romania do not report such measures. Moreover, top-level regulations or recommendations on the socio-economic composition of schools exist in Belgium (Flemish Community), Hungary, Romania, Slovakia, Spain and Portugal, while the school catchment area can be adjusted in France, Hungary and Slovenia.
A
2022 OECD report
using data from the 2018 Teaching and Learning International Survey (TALIS) highlights how experienced schoolteachers with, for instance, high levels of self-efficacy or digital skills tend to be clustered in socio-economically advantaged schools. The same report also confirms, through a combination of TALIS and PISA data, that there is a direct link between an uneven distribution of experienced teachers and lower than average reading scores. Remedial policies could tackle such disproportionate clustering, but the latest EU comparative overview suggests that neither financial nor non-financial incentives are commonplace.
Firstly, financial support to teachers in disadvantaged schools (increased basic statutory salaries, allowances or other financial support) is crucial. However, it is not prevalent across the EU. Only nine countries report such top-level incentives (France, Greece, Hungary, Lithuania, Poland, Romania, Slovakia, Slovenia and Sweden). Secondly, non-financial incentives in terms of better working conditions or career benefits can raise the attractiveness of teaching in disadvantaged schools. Yet only six Member States report such incentives (Belgium, France, Lithuania, Slovenia, Spain and Portugal).
Box 4. Welcoming Ukrainian refugees
Russia’s invasion of Ukraine forced many people to flee their homes. Women and children in particular are seeking protection from the war and Eurostat data suggest that over 1.4 million of children and young people are beneficiaries of international protection. Key priorities concern support to Ukrainian young people, to the education systems in Member States that are welcoming them as well as to Ukrainian teachers. Early evidence points at the difficulties of making sure school-age refugees are actually enrolled in school.
School education in most EU education and training systems promote the integration of newly arrived children from Ukraine into regular classes, combined with intensive support for learning the language of instruction (and other subjects). Relatively fewer education systems favour the initial integration of refugee learners in separate classes. However, there is general consensus that longer-term efforts need to be focused on the integration of these learners into local schools.
This requires support to education systems in several fields: (1) organising reception and admission processes (including expanding capacity); (2) preparing educational institutions and staff to include displaced children; (3) running targeted activities to help include displaced children in education; (4) engaging with displaced families and communities and helping them maintain the link with Ukraine; (5) taking long-term measures to promote inclusive education; and (6) taking specific measures for early childhood education and care. The majority of education systems also provide top-level support for refugee learners who wish to follow distance learning according to the Ukrainian curriculum.
In higher education, Member States report a variety of large-scale measures to support the integration of refugee students, with most having had measures in place since before the Russian invasion of Ukraine. Only six higher education systems monitor the integration of refugees in their institutions, mostly tracking enrolment data, with no longer-term monitoring yet established. Recognition of previous educational attainment can be a particular challenge, particularly when evidence of qualifications cannot be provided. This is the reason why article 7 on the recognition of qualifications held by refugees and displaced persons was included in the Lisbon Recognition Convention.
In the field of vocational education and training (VET) and adult learning, the Commission has invited Member States to (1) ensure that people's skills and qualifications can be valued, assessed and quickly recognised, regardless of whether documentation is available; (2) provide targeted upskilling and reskilling opportunities, VET and/or practical workplace experience; (3) ensure quick access to initial VET, including apprenticeships, and explore ways to prolong ongoing stays of Ukrainian vocational learners; and (4) make opportunities available for adults fleeing Russia's war of aggression against Ukraine to access general education, including through second chance schooling, as well as enrolment in higher education institutions.
In higher education, public funding is rarely provided on the basis of equity targets. Only in France and Italy are higher education institutions rewarded for meeting agreed targets in widening access, participation or completion. Top-level financial support in higher education is more commonly geared toward student accommodation, transport and meals. Only in Belgium, Ireland and Sweden is no such indirect support reported.
In terms of non-financial measures to support equity in higher education, only seven systems require or recommend higher education institutions to offer staff training on diversity or inclusion (Figure 5). While eight systems offer higher education institutions financial support for such training, an additional nine offer non-financial support, such as administrative support or pedagogical materials and instructors.
Figure 5. A third of all Member States do not support higher education institutions in their offer of staff training on diversity or inclusion

Source:
Eurydice 2022
.
In a nutshell
No education and training system manages to decouple performance from socio-economic status. Young people from disadvantaged socio-economic backgrounds are almost six times more likely to underachieve at age 15 than those from advantaged socio-economic backgrounds, suggesting a strong intergenerational transmission of educational disadvantage. Such inequities do not emerge at age 15 and do not stop there. Stepping up the focus on equity in education is likely to support future progress in all existing EU-level target domains. The 2022 Education and Training Monitor demonstrates key equity challenges across other domains, with underperformance widespread among specific population sub-groups, and often clustered in the same schools or areas.
Chapter 2. A level playing field is set in the early years
EU-level 2030 target: ‘At least 96% of children between 3 years old and the starting age for compulsory primary education should participate in early childhood education and care, by 2030.’
2.1.
Future progress requires broadening access and improving affordability
The seeds for equal opportunities are sown on the first step of the education ladder – the phase of early childhood education and care (ECEC). The benefits of high quality ECEC have been widely documented, especially for vulnerable children. Broadening access to quality ECEC has the potential to level the playing field in education and training. Five Member States have now reached the EU-level 2030 target (Belgium, Denmark, France, Ireland and Spain), which stipulates an ECEC participation rate of at least 96% among children between the age of 3 and the national starting age for compulsory primary education.
Between 2019 and 2020, the EU average barely increased at all, from 92.9% to 93.0% (Figure 6). The most prominent improvement was recorded in Greece and Finland. A similar pattern is visible in the age group from 4 years upwards, which yields higher ECEC participation shares in all countries. All these figures still predate the COVID-19 pandemic.
Figure 6. A number of countries are catching up on their ECEC participation rates
Source: Eurostat (UOE 2020). Note: the age brackets’ upper limits are defined by each country’s
starting age for compulsory primary education
.
Besides the EU-level target domain stemming from the
EEA Strategic framework Resolution
, the European Child Guarantee provides guidance to Member States on how to prevent and combat social exclusion of children in need, by ensuring they can access key services (Box 5). Meanwhile, the Barcelona targets support the development of childcare facilities for young children with a view to increasing parental labour market participation and improving work-life balance (Box 6). Broadening access to affordable ECEC caters to all these policy objectives.
Member States continue their efforts to increase access to ECEC, by introducing a legal entitlement or compulsory ECEC. In Bulgaria, pre-school education will become compulsory for 4-year-olds in 2023-24. Spain is progressively increasing the offer of public places in the first cycle of ECEC in order to meet all requests that concern children under the age of 3. In Lithuania, a legal entitlement to pre-school education is being introduced for 4-year-olds as of 2023, 3-year-olds as of 2024 and 2-year-olds as of 2025. Romania sets out to lower the starting age of compulsory education to 4 in 2023 and to 3 in 2030. Cyprus is planning to introduce compulsory education for 4-year-olds from 2024.
Affordability remains as big an issue. In 2016, 29.4% of all families reported difficulties in affording formal childcare services. This share reached 48.3% among low-income families. Member States continue to increase affordability of ECEC provision. For instance, the Cypriot national recovery and resilience plan aims to gradually extending free compulsory pre-primary education to the age of 4.
Box 5. Child Guarantee
In 2019, Commission President Ursula von der Leyen
announced
the creation of a European Child Guarantee to ensure that every child in Europe at risk of poverty or social exclusion has access to the most basic of rights like healthcare and education. The objective of the European Child Guarantee, which the Council
adopted
in June 2021, is to prevent and combat social exclusion by guaranteeing the access of children in need to a set of key services: ECEC; education (including school-based activities); healthcare; nutrition; and housing.
While most children in the EU already have access to these services, inclusive and truly universal access is vital for ensuring equal opportunities for all children, in particular those who experience social exclusion due to poverty or other forms of disadvantage. The European Child Guarantee itself will be effective only within a broader set of integrated measures, as outlined in the
European Pillar of Social Rights action plan
, and within a broader policy framework of the
EU strategy on the Rights of the Child
.
The
2021 Council Recommendation
asks Member States to submit action plans for implementing the Child Guarantee. The action plans should cover the period until 2030 and take into account national, regional and local circumstances, as well as existing policy actions and measures to support children in need. The main purpose of the national action plans is to describe the existing and planned national and sub-national policy measures, which aim to improve access for children in need to the set of key services covered by the European Child Guarantee.
2.2.
Inclusive ECEC reaches out to children who stand to benefit from it the most
Broad participation in ECEC contributes towards an inclusive, equitable education and training system. At country level, there is a correlation between the new main indicator for inclusion and equity (Chapter 1) and the share of ECEC participation as measured by the respective EU-level target. Member States with smaller underperformance gaps between low and high socio-economic status groups tend to have ECEC participation rates above or very close to the EU average. Conversely, the eight most inequitable education and training systems all have below-average ECEC participation rates.
However, a broad ECEC participation rate may mask strong disparities by socio-economic status itself. Using a different data source enables a focus on children at risk of poverty or social exclusion. In almost all EU countries, the share of children at risk of poverty or social exclusion who are in formal childcare is consistently lower than the share among children not at risk (Figure 7). The participation gap is 7.5 percentage points on average, and ranges from 1.5 percentage points in Spain to no fewer than 35.7 percentage points in Croatia.
Figure 7. Children at risk of poverty or social exclusion are less likely to participate in formal childcare
Source: Eurostat (EU-SILC 2020). Note: [*] breakdown not available for Luxembourg and Ireland; breakdown unreliable due to small sample sizes for Denmark, Cyprus, Malta, Latvia and the Netherlands; no EU-SILC data on participation in childcare are available for Italy (Ireland, Italy and Luxembourg are not included in the EU average); the upper limit for age brackets is set out by each country’s
starting age for compulsory primary education
.
Box 6. Barcelona targets
As announced in the
European Pillar of Social Rights action plan
, the revision of the 2002 Barcelona targets are part of the European care strategy. The Barcelona targets were first agreed by EU leaders in 2002 to improve the way childcare is provided across the EU and encourage Member States to remove disincentives to parental labour market participation.
The
2022 Commission proposal
for a Council Recommendation to revise the Barcelona targets encourages Member States to increase participation in ECEC, in particular for children in vulnerable situations or from disadvantaged backgrounds. Among the recommendations on flanking measures on quality, accessibility, staff, governance and data collection, two new targets are proposed. These ensure that, by 2030, at least 50% of children below the age of 3 participate in formal childcare; and at least 96% of children between the age of 3 and the starting age for compulsory primary education participate in ECEC.
As discussed in Chapter 1, there is more to inclusion and equity than socio-economic status. Providing ECEC to refugee children remains a structural challenge to be tackled by many EU countries. Pilot actions on Roma inclusion have demonstrated that ECEC may overcome the educational disadvantage that Roma children face. For children with special education needs, access to quality ECEC is key to countering segregation. However, organising inclusive education for specific groups requires dedicated policy attention. Needs assessments, coupled with adapting services and support, are prerequisites for finding the right setting to ensure mainstreaming.
Lockdowns due to COVID-19 affected ECEC provision. Overall, ECEC closures were shorter and less extensive compared to restrictions in primary and secondary education, whether as a recognition of the critical importance of ECEC for children’s development, the impossibility to replace provision with online equivalents, or because of parents’ need for reliable childcare support. Nonetheless, disadvantaged children and families are reported to have suffered disproportionately from closed or restricted services.
When ECEC providers were closed, targeted policies to increase affordability, granting priority access, proactively reaching out to families and building trust with children and families all helped minimise the impacts of COVID-19 on accessibility. For example, in Belgium (Flemish Community) and Berlin, even during the first 2020 lockdown, centres were kept open for children of parents with essential jobs as well as for socially disadvantaged children.
2.3.
Quality of ECEC provision took a hit during COVID-19
Among the core quality pillars of ECEC service provision (Box 7) are ECEC workers. During the pandemic, staff shortages, the perception of being undervalued and difficult working conditions all grew. Stakeholders reported recruitment and retention challenges during the pandemic as well as problems paying salaries due to closures – but also renewed demands for recognition, better working conditions and professional development. Meanwhile, professionals reported increased workloads and stress levels and a lack of managerial support. Stakeholders agree that the ECEC sector could have been better supported by COVID-19 policy responses and measures.
Box 7. Five quality pillars guide Member State ECEC policy
The foundations for high-quality ECEC are access to services, workforce, curriculum, monitoring and evaluation, governance and funding. In Czechia, an amendment of the Child Group Act in August 2021 ensures stable and predictable financing for ECEC providers, sets a maximum amount that parents of young children should pay for ECEC service and imposes new technical standards. The Recovery and Resilience Fund will also support childcare facilities, comprising the creation of more than 7,000 places for children below the age of 3 and the refurbishment of more than 300 facilities by 2025.
As part of the whole-of-government First 5 strategy (2019-2028), Ireland introduced the Core Funding stream in September 2022. This new funding model aims to improve pay and conditions for the ECEC workforce as a whole and increase affordability for parents, as well as ensure a stable income to providers. Actions have been mapped to strengthen professional standards for those working in early learning and care, and to commit to a graduate-led workforce in ECEC by 2028. A more integrated governance will be centralised in a new agency for ECEC containing functions currently performed by separate agencies.
In Denmark, an evaluation study provides evidence that the updated and modernised ECEC curriculum, introduced in 2018, is now widely used and has provided a direction for the work in ECEC facilities in Denmark. The evaluation hints at less progress for disadvantaged children. An investment of DKK 1.8 billion (EUR 242.1 million) yearly from 2024 onwards aims at improving staff/children ratios and training more ECEC staff.
Perhaps due to the pandemic and many professionals leaving or wanting to leave the profession, it is now widely recognised that professional development and working conditions (including wages) for all ECEC staff need to be substantially improved. Regarding the 3+ age bracket, 19 countries require at least one staff member with a tertiary-level qualification in education sciences, while in 22 countries continuing professional development (CPD) is mandatory or a prerequisite for promotion.
In addition, positive developments have also been observed during the pandemic. In several Member States, the shift from ‘controlling’ monitoring processes to ‘supportive’ processes were widely appreciated by ECEC staff during the crisis. In Italy, for example, quality management at municipal ECEC centres continued to be carried out internally by pedagogical coordinators within a collegial framework. The crisis, moreover, appears to have been dealt with more effectively by ECEC systems with structural financing, a good organisation and an integrated structure, without having recourse to extra support measures to ensure the sector’s viability. This confirms that governance and funding are an important principle in the
EU Quality Framework for ECEC
, and illustrates the effect that top-level measures can have on the resilience of ECEC systems.
In a nutshell
Quality early childhood education and care (ECEC) is a major contributor to equity when it can reach children from disadvantaged socio-economic backgrounds. Participation in ECEC contributes to better cognitive outcomes and better prospects, especially for vulnerable children. At 93.0% in 2020, the overall share of children between the age of 3 and the start of compulsory primary education enrolled in ECEC has remained stable. Yet children from disadvantaged backgrounds continue to encounter obstacles to participation. Several EU countries have recently broadened access by extending the age of the ECEC place guarantee or improving affordability. Even though closures and restrictions were not as ubiquitous as at other education levels, the COVID-19 pandemic put pressure on the quality of provision, and a spotlight on pre-existing structural issues.
Part 2. The time of learning
The time to learn continues long after compulsory education ends, even if the learning activities of a 15-year-old and a 64-year-old have little in common. Compulsory education ends at age 15 across seven Member States, although no 15-year-old reaches the minimum standard of upper secondary educational attainment. Enrolment, on average, remains at 97.2%. At age 34, only 4.5% are still enrolled in formal education. Learning activities shift toward non-formal learning for most adults over 25. Indeed, most learning of 25-64 year-olds concerns non-formal learning, comprising three quarters of all participation in 2021 (8.0% against a total of 10.8%).
Part 2 of this report concerns formal and non-formal learning for young people and adults across the EU. It showcases four EU-level target domains from the
EEA Strategic framework Resolution
. These cover a disengagement from school before the level of upper secondary educational attainment (Chapter 3), the exposure to work-based learning in vocational education (Chapter 4), tertiary educational attainment levels (Chapter 5) and the participation in learning activities among 25-64 year-olds (Chapter 6).
Two important cross-cutting considerations from Part 1 are carried over into Part 2. The first is the cross-cutting equity dimension. For instance, in Chapter 3, early school leaving rates are shown to signal deeply rooted patterns of exclusion and inequity. In Chapters 4 and 5, sizeable gender gaps are documented across the vocational and higher education sectors, both in terms of attainment levels and fields of study.
A second cross-cutting consideration concerns the teaching profession. In Chapters 1 and 2, it became clear that the burden of quality and equity is on the shoulders of teachers and school leaders. While expectations are not always realistic, it is clear that the teaching profession requires considerable amounts of top-level support to deal with the numerous challenges it is faced with. It also requires a better cross-EU monitoring to enable mutual learning and a better understanding of key obstacles and potential policy levers (Box 8).
Box 8. Monitoring the teaching profession
The COVID-19 crisis seems to have only increased the heavy demands on teachers, wo are expected to deal with remote teaching, ever-evolving digital tools and practices, overcoming learning loss, and ensuring equal access to quality learning. Meanwhile, a complex interplay of working conditions, professional development, career progression, teacher appraisal, mobility, well-being and demographic factors all play their part in regional, national and EU-level teacher shortages.
Teachers receive recognition in the
EEA Strategic framework Resolution
, which identifies them as the backbone of the learning process and one of the main contributors to achieving its aims. A solid evidence base can help make the right policy decisions. However, from a monitoring perspective, the teaching profession is one of the more complex, multifaceted domains in education and training. Many policy-relevant sub-dimensions interact, from input, output and effect angles. Aspects like school climate, teaching practices and well-being interact in their influence on students’ acquisition of knowledge, skills and attitudes.
To provide structure to the monitoring, the Commission is preparing a dashboard that will bring together multiple equivalent indicators across different sub-dimensions, while remaining digestible for policy debate. Focusing on the attractiveness of the teaching career, the purpose of the dashboard is to assist Member States in monitoring supply and demand, but also important contributing factors such as training and professional development, working conditions, and the emotional well-being of teachers. Quantitative as well as qualitative indicators will capture phenomena at the central level, and should allow for a meaningful cross-EU comparison.
Chapter 3. A better responsiveness is needed for future decreases in early school leaving
EU-level 2030 target: ‘The share of early leavers from education and training should be less than 9% by 2030.’
3.1.
Past successes in reducing early school leaving rates are no cause for complacency
The share of early leavers from education and training continued to fall in 2021, even if disengagement during COVID-19 may still affect early school leaving rates in the future. On average across the EU, 18-24 year-olds without upper secondary educational attainment and no longer in education or training amounted to 9.7% of their cohort in 2021, down from 10.2% in 2019 and 9.9% in 2020 (Figure 8). This corresponds to approximately 3.1 million young people.
Some 16 Member States have early school leaving rates below 9% (the 2030 target for the EU as a whole), with top performers being Croatia (2.4%), Slovenia (3.1%), Greece (3.2%) and Ireland (3.3%). Five Member States maintain early school leaving rates of 12% or higher. Early leavers are more likely to be male (11.4%) than female (7.9%) – a phenomenon that snowballs into vast gender disparities in higher education (Chapter 5).
The last 10 years of progress tell a success story of positive upward convergence. Average early school leaving rates dropped 2.9 percentage points from 12.6% in 2012, with reductions of over 5 percentage points in Portugal (14.6), Spain (11.4), Greece (8.1), Malta (7.1), Ireland (6.6) and Belgium (5.3). On the other hand, between 2012 and 2021, no progress was observed in nine Member States. However, for 2021, only four of these countries have 2021 early school leaving rates above 9% (Germany, Luxembourg, Denmark and Hungary).
Figure 8. 10 years of decreasing early school leaving rates illustrate a positive upward convergence
Source: Eurostat (EU Labour Force Survey). Note: data for Croatia have low reliability due to small sample size. Breaks in time series for Czechia and France (2013), the Netherlands (2013, 2019), Poland (2013, 2018), Luxembourg and Hungary (2015), Denmark (2016, 2017), Belgium, Ireland and Malta (2017), Sweden (2018), Germany (2020) and for all countries in 2014 and 2021.
Upper secondary educational attainment has long been regarded as a minimum threshold. An estimated 84.6% of 20-24 year-olds had at least such qualifications in 2021, up from 82.8% 5 years prior. Less than 80% of young people have already attained at least upper secondary education in Denmark (75.4%), Luxembourg (76.6%), Germany (77.1%) and Spain (78.8%). The share is over 95% in Croatia (96.9%), Ireland (96.1%) and Greece (95.7%).
These two indicators – early school leaving and upper secondary attainment – mask an age group in transition, as well as different structures of education and training systems across the EU. Firstly, at 18, all young people across the EU have reached the end of their compulsory schooling age. An average of 82.1% still participates in education and training, but this participation rate drops to 29.2% for 24-year-olds. The share of early leavers increases from an average of 7.6% at age 18 to 11.1% at age 24.
Figure 9. Most young people with at most lower secondary educational attainment are still in formal education
Source: Eurostat (EU Labour Force Survey). Note: the lower bars are equal to a country’s early school leaving rate. Participation in non-formal education is higher in reality, as young people participating in both formal and non-formal education are recorded only under formal education.
Secondly, in some countries, large shares of the combined 18-24 age bracket with at most lower secondary educational attainment are still enrolled in formal education (Figure 9). In terms of early school leaving, in order to strengthen prevention and early intervention (Section 3.3), it is necessary to understand whether young people forego the transition from lower secondary education to upper secondary education altogether or whether they attempt upper secondary education and drop out before attaining any formal qualifications. While comparative data struggle to capture the difference, administrative education registers can shed a light at the national level.
3.2.
A return to education and training is difficult and costly
Without at least upper secondary educational attainment, young people face a precarious labour market integration and an employment disadvantage that is likely to persist throughout working age. With educational requirements for entering the EU labour market constantly increasing, the social exclusion of early school leavers is only expected to become more pronounced. Only 42.3% of early leavers from education and training were employed in 2021, with the remaining share either wanting to work (34.0%) or not (23.7%).
Youth unemployment (15-29 age bracket), which stood at 13.0% on average across the EU in 2021, reached 22.4% for young people without at least upper secondary educational attainment. It is worth emphasising that young people have been most affected by job losses due to the economic impact of the COVID-19 crisis, with particular downturns for young people with low levels of education or disadvantaged socio-economic backgrounds.
Enabling undereducated young people to return to education and training is particularly difficult and costly. The Commission’s reinforced Youth Guarantee (Box 9) helps 15-29 year-olds who are not in employment, education or training (NEET) find offers of employment, apprenticeships, continued education or traineeships. The NEET rate is higher among young people with at most lower secondary education (15.5% compared to an average of 13.1%), but a return to formal education is exceedingly rare. Only about 10% of offers concern continued education each year, with the latest figure at 10.2% (2020 monitoring data).
Box 9. The reinforced Youth Guarantee
The reinforced Youth Guarantee is a commitment given by all Member States to ensure that all young people under the age of 30 receive a good quality offer of employment, continued education, apprenticeship or traineeship within a period of 4 months of registering with public employment services. All EU countries have committed to the implementation of the reinforced Youth Guarantee in a
2020 Council Recommendation.
The Youth Guarantee has created opportunities for young people and acted as a powerful driver for structural reforms and innovation. As a result, most public employment services have improved and expanded their services for young people. A network of national Youth Guarantee coordinators ensures there is a direct link between the Commission and authorities managing the Youth Guarantee in each Member State.
The Recommendation is backed up by significant EU financing under NextGenerationEU and the long-term EU budget. The EU provides policy support and mutual learning activities to help Member States strengthen the infrastructure and measures for the reinforced Youth Guarantee. The EU also monitors the progress made across Member States.
Enabling a return to education requires strong partnerships between public employment services and the education and training sector. Undereducated young people may not be eager return to education, and would benefit from a more diversified continued education offer. For instance, bridging courses or second chance education programmes can help early leavers from education and training and low-skilled young people ease their way back into formal education and training more carefully. VET pedagogies and work-based learning (Chapter 4) may be particularly responsive to the (re)engagement of young people.
3.3.
Future progress requires a policy focus on young people at highest risk
The
2022 Commission proposal
for a Council Recommendation on Pathways to School Success links early school leaving to the ‘early warning’ indicator of underachievement at age 15 (Section 7.1). It aims to improve the responsiveness of schools to the needs of young people who may be struggling. Such responsiveness goes beyond a narrow definition of educational performance and requires a broad range of actors to become involved. This section covers three possible gaps in schools’ responsiveness.
The first challenge is the decoupling of educational performance from socio-economic status, as emphasised in Chapter 1. Ad hoc data from 2021 (Figure 10) confirm a striking disparity in EU average early school leaving rates between young people whose parents have a low level of education (26.1%) and young people whose parents have a high level of education (2.9%). This means the risk of leaving school early is nine times higher among the former group than it is among the latter. Such socio-economic gaps exist, albeit to varying degrees, across all Member States for which the breakdown can be assessed reliably. It is another sobering example of how educational disadvantage can be passed down from previous generations – a vicious cycle that education and training systems are supposed to break.
Figure 10. New evidence sheds light on parental education and parental country of birth
Source: Eurostat (EU Labour Force Survey 2021 ad hoc module for parental education and EU Labour Force Survey 2021 for parental country of birth and total). Note: parental education denotes the highest level of education successfully completed between the father and the mother of the respondent; low reliability for females born in the reporting country with parent(s) born outside the EU.
Secondly, new comparative data reveal that children from migrant parents or parents from other EU countries who were themselves born in the reporting country do not have early school leaving rates that are substantially different from the overall average (Figure 10). Only first-generation migrants and EU mobile young people face, on average, high risks of early school leaving – and the difference between the two groups is remarkably small. Past editions of the Education and Training Monitor already established that, among young people born outside the reporting country, the number of years since arrival is a major determining factor for the disadvantage faced. In terms of early leavers from education and training, special attention is needed for young people arriving in the reporting country during – and especially towards the end of – mandatory schooling age.
Box 11. Recent examples of prevention and early intervention
Italy’s community education pacts were introduced in the 2020-21 ‘plan for schools’. The pacts are agreements between, among others, schools, local authorities, and public and private institutions. Initially implemented largely as a form of support to help schools reopen safely, the pacts are proving instrumental in combating educational poverty and reducing early school leaving. Essentially, the pacts strengthen the role of the school as a social and community focal point and learning hub, enriching the education offer and learning opportunities.
In Bulgaria, reducing the share of early school leavers is among the priorities of the 2021-30 strategic framework for developing education, training and learning. For 2030, the Bulgarian authorities have set themselves the target of reducing the rate of early leavers from education and training to 7%. A coordination mechanism, uniting efforts of different ministries and stakeholders, continues to operate. The coordinated approach is designed to ensure outreach to out-of-school children, inclusion in compulsory education and prevention of dropout.
In Cyprus, the Commission supported a 2021 project aimed at re-engaging students at risk of school dropout and offering new opportunities to those who already dropped out. The project investigated the causes for students disengaging and dropping out from secondary education, and the policy measures Cyprus has to address these causes. The project has informed the Cypriot authorities on providing equitable educational opportunities that can engage students struggling in school and re-engage those who prematurely left education and training.
Thirdly, lengthy periods of physical school closures and lockdown measures across 2020-22 have put an immense pressure on the well-being of adolescents, which is – among many other potentially devastating repercussions – strongly associated with educational outcomes. Schools and teachers often proved ill-equipped to identify such problems, connect to the young people affected and help young people get the appropriate support. Future editions of the Education and Training Monitor will aim to capture the overlooked dimension of well-being at school through regular data collections.
In a nutshell
At 9.7% in 2021, the share of early leavers from education and training continues to fall and remains on track to achieving the 2030 target of less than 9%. Approximately 3.1 million young people are now disengaged from education and training while having attained lower secondary qualifications at most, with only 42.3% of them being employed. Future progress may require refocusing on the most disadvantaged and hardest-to-reach young people. For instance, young people whose parents have a low level of education are nine times more likely to be early school leavers than young people whose parents have a high level of education. The Pathways to School Success proposal links low attainment and low achievement in education, supporting a wide range of actors in their capacity to respond to the real-world needs of today’s young people.
Chapter 4. A diverse and evolving landscape characterises vocational education and training
EU-level 2025 target: ‘at least 60% of recent graduates from VET should benefit from exposure to work-based learning during their vocational education and training by 2025’
4.1.
VET and work-based learning provide skills for today and for the future
Vocational education and training (VET) aims to equip young people and adults with the knowledge, skills and competences required in specific occupations or more broadly on the labour market. It covers a wide range of qualifications: initial VET at secondary level, continuing VET for adults and vocationally oriented education and training at higher levels.In recent years, the offer of VET programmes has become more diverse, driven by the importance of lifelong learning and the needs of a changing labour market, notably the green and digital transitions.
Nearly half of all pupils in upper secondary education in the EU (48.7% in 2020) are enrolled in VET (as opposed to programmes with a general orientation). In absolute numbers, this corresponds to over 8.7 million students in upper secondary VET programmes. The share of VET in upper secondary education varies considerably across EU Member States, from less than 25% in Cyprus, Ireland and Lithuania to over 70% in Czechia and Slovenia (Figure 11).
Figure 11. Across the EU, nearly half of all pupils enrolled in upper secondary education are in vocational programmes
Source: Eurostat (UOE 2020).
In addition to pupils enrolled in upper secondary vocational education, 1.3 million learners were enrolled in post-secondary, non-tertiary vocational education in 2020, with the vocationally oriented programmes covering 94% of all students at this level. An additional 1.3 million were enrolled in short-cycle vocational education at tertiary level (98% of all students at this level are in vocational streams). Indeed, higher level VET is gaining importance.
The
2020 Council Recommendation
on VET sets out key principles to ensure VET provides quality learning opportunities for young people and adults. The Recommendation is strongly focused on increased flexibility, increased opportunities for work-based learning and apprenticeships, and improved quality assurance. The Recommendation also sets three EU-level objectives to be achieved by 2025: (1) at least 60% of recent VET graduates benefit from some form of work-based learning during their studies; (2) at least 8% of VET learners study abroad (see Section 4.2); and (3) at least 82% of VET graduates are employed (see Section 4.3).
Box 12. A spotlight on apprenticeships
The
2018 Council Recommendation
on a European Framework for Quality and Effective Apprenticeships (EFQEA) aims to increase the employability and personal development of apprentices and help develop a highly skilled and qualified workforce, responsive to labour market needs and a cohesive society.
Some 3 years after the EFQEA Recommendation was adopted, the Commission examined how EU Member States had put the framework and the criteria it set into practice. Key findings of the
report
show that most Member States had criteria on learning and working conditions in place. Further progress is needed in implementing framework conditions, notably graduate tracking. The report also indicates that the framework supports Member States in incrementally and continuously improving their apprenticeship schemes, including on those criteria that were already partially in place in 2018. In conclusion, the analysis confirms that the EFQEA remains a key instrument to improve the quality and effectiveness of apprenticeships across the EU.
The Commission continues to help Member States implement the framework and, more broadly, it helps the wider apprenticeship community by improving the supply, quality and image of apprenticeships, as well as the mobility of apprentices, also through the
European Alliance for Apprenticeships
and the
Apprenticeship Support Services
.
For learners in VET, work-based learning is highly beneficial: it equips them with the technical skills and knowledge that are specific to their chosen profession, as well as more general work-related skills. Work-based learning can make for a more rewarding learning experience for young people that are eager to discover the world of work. Young people’s skills that are relevant to the labour market, as well as their contacts with employers, can smoothen school-to-work transitions.
Newly collected data reveal substantial differences across Member States (Figure 12). In several countries, notably Romania, Poland and Greece, work-based learning in VET remains rather exceptional (with less than 20% of learners exposed to it). By contrast, in Germany, the Netherlands, Spain and Austria, over 90% of learners in VET have gained work experience as part of their curriculum. In 2021, the EU average stood at 61%, thereby just exceeding the level of the 2025 target.
Figure 12. VET pupils and students’ participation in work-based learning varies strongly across Member States
Source: Eurostat (EU Labour Force Survey 2021). Note: the indicator captures the share of 20-34 year-olds who had a work experience of at least 1 month as part of the curriculum and have graduated from medium-level VET (upper secondary or post-secondary non-tertiary) in the last 3 years. Low reliability of data for Germany, Cyprus and Hungary. Data are not available for Bulgaria, Denmark and Latvia.
On average, close to 40% of VET learners who were engaged in work-based learning had paid work experience, with male students paid more often than female students in every Member State. However, behind this average there are large differences between countries (ranging from 94.5% in Germany to 2.3% in Italy). Work-based learning experience that lasted for long periods (7 months or longer) is common practice in only a few Member States, including Germany, Austria and the Netherlands.
4.2.
The mobility of VET learners was interrupted by the pandemic
Supporting VET learner and staff mobility abroad has been a cornerstone of European cooperation in VET. It has provided a wide range of personal, professional and academic benefits to participants, whether gaining new transferable skills, boosting self-confidence or contributing to cultural awareness and open-mindedness.
Figure 13. The gradual increase in VET mobility was interrupted by the COVID pandemic
Source: Erasmus+, 2014-2022. Note: the indicator refers to the number of VET learners taking part in mobility experiences abroad (KA1), presented by the month in which their mobility experience started. The data include all VET learner mobility that took place in that period, as reported by project beneficiaries. This includes mobility related to projects funded under the 2019 and 2020 calls of the previous programming period that are ongoing and not yet finalised (e.g. projects that have been postponed due to COVID-19 travel restrictions). The data were extracted in August 2022, from the Erasmus+ mobilities records for the programming periods 2014-20 and 2021-27. Due to lags in reporting, data for the most recent period are preliminary, and are likely to be revised upwards.
However, COVID-19 suspended practical training in most sectors (Box 13) and greatly affected transnational mobility. Seasonal fluctuations notwithstanding, the demand for EU-funded VET mobility had been growing steadily for years until the COVID-19 pandemic disrupted all education and training activities. Figure 13 confirms this gradual increase in VET mobility participants over the years, and its interruption at the start of the COVID-19 pandemic in March 2020, with some recovery beginning in May 2021.
Box 13. The impact of COVID-19 lockdown measures on work-based learning
The impact of lockdown measures on learning may have been particularly damaging in certain fields of VET. In addition to school closures, VET students were often affected by closures and social distancing requirements of businesses where the practical part of the combined school-and-workplace programmes was due to take place. This may have resulted in cancellation and/or postponement of substantial parts of workplace-based education, with negative consequences for students’ learning.
The limitations and closures of workplace-based education varied strongly by sector. For example, healthcare and the food industry often continued their vocational education programmes, whereas lockdowns led to lengthy interruptions in leisure and tourism. As a result, participation in (certain fields of) VET fell in some countries.
In Germany, the number of new apprenticeships dropped by 9.3% in 2020 compared with 2019 (from about 510 870 to 463 331) and 23% of German companies reported knowledge transfer gaps in VET due to the pandemic. The Finnish National Agency for Education estimated a reduction of 4% in the number of VET graduates in 2021 compared with the previous year. In the Netherlands, VET learners had difficulties finding internships and the quality of internships was perceived to have deteriorated.
Source:
Employment and Social Developments in Europe (ESDE) review 2022
.
In addition, it is worth looking at the duration of VET mobility, albeit largely pre-COVID. Overall, from 2014 to 2020, the average VET placement abroad lasted 31 days. The duration of VET learner mobility varied significantly depending on the country concerned (Figure 14). These differences in duration were mainly due to national circumstances, as the offer for support provided by Erasmus does not vary across countries. Only 7% of VET learners remained abroad for over 3 months.
Figure 14. Average VET mobility duration ranges from 2 weeks to 2 months
Source: Erasmus+. Note: the indicator refers to the average duration of the outgoing mobility experiences abroad, of VET learners taking part in Erasmus+ projects (KA1), by sending country. The data include all VET learner mobility that took place as part of Erasmus+ projects approved in the period 2014-20, as reported by project beneficiaries. The data were extracted in August 2022, from the Erasmus+ mobilities records for the programming period 2014-20.
4.3.
VET is a pathway onto the labour market
The employment of recent graduates is an important benchmark for VET, given the aim to equip learners with skills for specific occupations or the labour market in general. By 2025, the EU has set a target of 82% for the employment rate of medium-level VET graduates. In 2021, this rate stood at 76.4% (Figure 15). In terms of employment, the VET graduates clearly outperformed graduates from medium-level general education (61.7%), though lagged behind the average employment rate of graduates from tertiary education (84.9%).
Figure 15. In most Member States, recent VET graduates have good employment prospects
Source: Eurostat (EU Labour Force Survey). Note: the indicator captures the employment rates of young people aged 20 to 34 who are no longer in education and training, having graduated 1-3 years prior from VET at upper secondary or post-secondary non-tertiary level. Break in series for Germany in 2020 and for all countries in 2021. Low reliability for Cyprus (all years) and Luxembourg (2019 and 2020).
Again, the COVID-19 pandemic has strongly affected the employment of VET graduates. Across the EU on average, their employment rate dropped by nearly 3 percentage points between 2019 and 2020. Decreases occurred in nearly all Member States, except for Romania and Latvia. The recovery remains incomplete at EU level, with an increase by 0.7 percentage points between 2020 and 2021. The recovery is driven by a starkly diverse pattern across countries. In 12 Member States, there was a (continued) decline, whereas the remaining 15 Member States recorded an increase.
In a nutshell
Nearly half (48.7%) of all pupils enrolled in upper secondary education are in vocational education and training (VET). The 2022 Education and Training Monitor captures progress towards three key objectives for the VET sector, covering work-based learning, mobility and graduate employability. In terms of work-based learning, newly collected data reveal major differences between countries. While at EU level, the 2025 target seems within reach, the full impact of the COVID-19 pandemic is yet to be captured. The pandemic has also interrupted a gradual increase in VET learner mobility, with some recovery beginning in May 2021. Furthermore, at 76.4% in 2021, the employment rates of recent VET graduates suffered from the pandemic too, with recovery remaining incomplete.
Chapter 5. An expansion of higher education masks persisting disparities
EU-level 2030 target: ‘The share of 25-34 year-olds with tertiary educational attainment should be at least 45%, by 2030.’
5.1.
Progress in tertiary educational attainment is led by young women
Higher levels of educational attainment are associated with higher employment rates, lower unemployment, better job prospects and higher earnings. Highly educated young people (84.9%) were more likely to be employed in 2021 compared to those with a medium level of education (77.5%) and those with a low level of education (54.8%). The higher education sector has an essential role to play in Europe’s post-pandemic recovery and in shaping sustainable and resilient societies, of which deeper and more effective transnational cooperation is a key element.
The tertiary educational attainment rate of 25-34 year-olds in the EU stood at 41.2% in 2021. This continues the steady growth seen in the past decade, up from 34.1% in 2012 and 37.6% in 2017 (Figure 16). In all but three Member States, attainment rates have increased compared to 2017
. At EU level, the current rate is 3.8 percentage points shy of the 45% target for 2030, with 13 Member States surpassing it in 2021. Top performers are Luxembourg (62.6%), Ireland (61.7%), Cyprus (58.3%), Lithuania (57.5%) and the Netherlands (55.6%). Eight Member States have yet to reach 40%.
Figure 16. 10 years of educational expansion has brought about higher shares of tertiary level attainment
Source: Eurostat (EU Labour Force Survey). Note: breaks in time series for Belgium (2017), Denmark (2016, 2017), Germany (2020), Ireland (2017), France (2013), Luxembourg (2015), the Netherlands (2013, 2019), and Sweden (2018), and for all countries in 2014 and 2021.
Three dimensions of inequality in educational attainment are worth emphasising here: the gender gap, the socio-economic gap and the effect of first-generation migration and EU mobility. Firstly, there is a sizeable and persistent gender gap in tertiary educational attainment across the EU, which has been expanding over the previous decades (Figure 17) and is now substantial across all Member States. Educational attainment at this level is much more common among women than men in the 25-34 age group. At 46.8%, the female EU average has exceeded the target. In contrast, the attainment rate for men was 35.7% in 2021, 11.1 percentage points lower than the rate for women.
Figure 17. The gender gap increased from 4.3 percentage points in 2002 to 11.1 percentage points in 2021
Source: Eurostat (EU Labour Force Survey). Note: breaks in time series in 2014 and 2021.
Reducing the gender gap will be necessary if the EU level target is to be reached by 2030. This will require institutional changes at tertiary level to ensure equal opportunities and gender equality, but there is also a need for measures at lower education levels. Evidence suggests that gender gaps are already prevalent in secondary education (Chapter 3) and continue to widen along the education trajectory. At the time of entry into first-cycle programmes, a gender gap is already well-established and increases through to completion of tertiary education. Moreover, there are large gender differences across fields of study, which will be examined closer in Section 5.2.
Box 14. A higher education sector observatory
In 2023, the Commission will set up a European Higher Education Sector Observatory to provide evidence on progress made in implementing the European strategy for universities. The observatory will combine the best of the current EU data tools and capacities (including ETER, U-Multirank, Eurostudent and Eurograduate) in one single place, while further improving their use and relevance for policymakers, universities, students and researchers.
Streamlining and upgrading existing European data sources will enable institutions and governments to strengthen their evidence base on key topics such as inclusion, learning outcomes, progress on digital, green and entrepreneurial skills, technology transfer, employability, students and labour market needs, strengthening research careers, open science, the institutions’ role in innovation ecosystems, and transnational cooperation in the higher education sector.
The Observatory will make it possible to compare, analyse and showcase the higher education sector’s performance across various fields – thereby supporting the transformation of higher education institutions. By building on the synergies between the existing data tools, it will ensure focused and purpose-driven monitoring, eliminating potential overlaps and decreasing data collection burden on higher education institutions.
Secondly, ad hoc data from 2021 confirm that tertiary educational attainment is often passed down from previous generations (Figure 18). The EU average tertiary educational attainment rates are 48.6 percentage points higher among young people whose parents have a high level of education (70.8%) than they are among young people whose parents have a low level of education (22.2%). Far from decoupling educational performance and socio-economic status (Chapter 1), parental education proves a robust determinant of tertiary educational attainment across the EU.
Figure 18. New evidence sheds light on parental education and parental country of birth
Source: Eurostat (EU Labour Force Survey 2021 ad hoc module for parental education and EU Labour Force Survey 2021 for parental country of birth and total). Note: parental education denotes the highest level of education successfully completed between the father and the mother of the respondent.
Thirdly, new evidence confirms that the children of migrant parents or parents from other EU countries do not yield lower tertiary educational attainment rates on average across the EU (Figure 18). A young person born in the reporting country has similar chances of obtaining a higher education qualification if their parent(s) were born in another EU country (42.6%), outside the EU (42.4%) or in the reporting country (42.2). Only first-generation migration (34.1%) and EU mobility (38.5%) are associated with lower likelihoods of tertiary educational attainment. The gender gap is smaller among the latter two groups, amounting to 5.7 and 5.8 percentage points, respectively.
5.2.
Gender stereotypes persist in study choice
Challenging gender prejudices and stereotypes throughout the education cycle, from early childhood education to adult learning, can reduce gender imbalances in other areas of life. Gender gaps in education choices are significant and, like the attainment gap, they persist over time. Figure 19 shows the distribution of women and men enrolled in higher education in the EU in 2020 across broad fields of study.
Men are underrepresented in the fields of education (21.5%); health and welfare (28.1%); arts and humanities (35.5%); and social sciences, journalism and information (35.6%). This contrasts female enrolment in the STEM (science, technology, engineering and mathematics) disciplines, where women only represent 31.3% of the enrolled students despite good employment opportunities in this area. Sweden (37.2%), Romania (36.8%), Italy (36.2%) and Poland (35.6%) are the only Member States where the female enrolment shares in STEM disciplines exceed 35%.
Figure 19. There are strong gender disparities across fields of study

Source: Eurostat (UOE 2020). Note: the indicator covers students enrolled in tertiary education.
Existing research provides evidence of a complex set of determinants as regards the gender gap in STEM, highlighting aspects such as the educational context, the structure of the labour market and cultural values and social norms in society. An example is the persistent labelling of study areas as either ‘feminine’ or ‘masculine’, which may result in study choices being limited to what is ‘suitable’ for either women or men. Reducing these barriers is important in order to allow young women and men to choose their study pathways more freely, without gender stereotypes constraining their possibilities (Box 15).
Box 15. Tackling gender stereotypes in study choice
In March 2022, Ireland published recommendations on gender balance in STEM education, expanding further on actions identified in its 2017-19 STEM Education Implementation Plan. These recommendations cover four key areas for action: (1) instilling a whole school culture change, to include early years leaders and educators, school leaders, teachers, learners and parents/guardians; (2) providing effective support for early years educators and teachers; (3) widening learner access to STEM; and (4) supporting a societal and cultural shift to address current barriers to gender balance in STEM.
The Estonian Social Affairs Ministry commissioned a study on women's representation in ICT education and the labour market. The study resulted in the following policy recommendations: (1) technology lessons and activities should be directed to boys and girls equally; (2) ICT should be a compulsory part of the national curriculum, either as a separate subject or integrated with other lessons; and (3) gender mainstreaming among teachers should be promoted and developed systematically. The recommendations were reflected in the updated 2022 curriculum for technology education, which stipulates that the division of students into study groups be gender-neutral and based on students' interests and preferences.
In Czechia, a 2004-18 project called Break the Waves (Prolomit vlny) aimed to increase equal opportunities for women and men in the labour market and education, by tackling occupational segregation. The project was conducted by a non-profit organisation. One of the work strands aimed to support non-gender-stereotyped career choices for girls and boys at the end of primary and secondary schools, by helping career counsellors and education providers change gender stereotypes in educational choices. The project produced, among other things, a handbook on gender-sensitive school management, a gender auditing methodology and a gender equality tool for teachers.
Closing the gender gap in STEM is likely to foster economic growth via both higher productivity and increased labour market activity. One example is Europe’s digital transition (Chapter 8), which sees an increased need for skilled labour in the ICT sector. This is addressed through a proposed EU-level target under the
Digital Decade
of reaching 20 million employed ICT specialists by 2030. In 2021, there were 8.9 million employed ICT specialists in the EU, but only 19.1% of them were female. This is consistent across Member States, with none having female shares exceeding 30%. To achieve the Digital Decade objectives, education will play a central role, with the 2021-27
Digital Education Action Plan
being one of the key enablers.
5.3.
Learning mobility remains limited and highly unbalanced
The opportunity for learners to move abroad to study, as well as the broader cooperation across borders, are strong drivers for improving the quality of education and training institutions. Mobility is an essential part of lifelong learning and an important means to improve personal development, employability, and adaptability. Moreover, learning mobility can increase cooperation between education institutions and step up transnational cooperation.
There were close to 4.1 million graduates from tertiary education in 2020 originating in the EU. Of these, approximately 550 000 completed parts of or all their studies abroad. This equates to a graduate mobility rate of 13.5%, which is on par with developments in recent years. Limited progress may hint at barriers to mobility that would need to be removed if the EU is to move towards achieving a European Education Area by 2025. An additional obstacle, yet to be fully reflected in the data on mobile graduates, is the COVID-19 pandemic. As was documented for the VET sector in Chapter 4, the pandemic significantly affected the globalisation of higher education (see Box 16).
Figure 20. A temporary stay abroad remains the favoured option for most mobile graduates
Source: European Commission calculations based on Eurostat (UOE 2020 on inward degree mobile and outward credit mobile graduates in the EU and EEA) and OECD (on EU-originating graduates and students in the other OECD countries). Note: calculations and metadata are detailed in the downloadable Excel file.
A temporary stay abroad was the favoured option for most mobile graduates, as indicated in Figure 20. At 9.1%, the credit mobility rate was more than double that of the degree mobility rate (4.3%) at EU level. Luxembourg (85.4%) had by far the highest outbound mobility rate in 2020, almost 50 percentage points above the second highest rate found in Cyprus (35.5%). Together with the Netherlands (24.3%) and Slovakia (20.8%), they are the only countries exceeding 20%
. In 2020, the rate for most Member States was between 10% and 20%. However, six countries have yet to reach 10%
.
Box 16. Learning mobility during COVID-19
COVID-19 resulted in large disruptions to the higher education sector and caused a major break in international student mobility. Campus closures and travel restrictions led to a move to online education both for domestic and international students.
The expected short-term impact of the pandemic on student mobility is a decrease in international enrolments. A recent
study
on university applications from foreign students in the United Kingdom found that the pandemic led to a reduction in applications of between 11% and 14% in 2020, which does not appear to have been driven by Brexit. These findings are in line with drops in international enrolments seen in many other countries in the academic year 2020-21
.
It is too early to predict the long-term impact of the pandemic on international student mobility. While short-term drops in enrolments are expected, it is still unknown whether the pandemic will alter the perception of studying abroad in the medium- and long-term. A rapid transformation of the way learning was organised during COVID-19 has shown that physical mobility is not the only option for internationalisation. Virtual mobility could reach more students but may reduce the number of students going abroad.
The EU’s inward graduate degree mobility rate was higher than the outward degree mobility rate in 2020 (8.0% compared to 4.3%)
. More than two in three (70.4%) inward degree mobile graduates originated outside the EU
. Stimulating mobility, as well as attracting and retaining talented students (alongside academics and researchers), can help maximise Europe’s global influence as regards values, education, research and societal impact
.
Figure 21 provides information on degree mobility balance in 2020, including mobility both within and outside the EU
. It is important to strive for a balance in the mobility flows to optimise what is often referred to as ‘brain circulation’. Figure 21 illustrates how balanced a system is in comparison to its outward degree mobility rate. Positive values on the x-axis indicate an imbalance in favour of inward mobility, whereas negative values indicate an imbalance in favour of outbound mobility. The most balanced country in 2020 was Romania, while the most imbalanced countries were the Netherlands and Denmark.
Figure 21. Most Member States receive more students than they send abroad
Source: European Commission calculations based on Eurostat (UOE 2020 on degree mobility) and OECD (degree mobility). Note: calculations and metadata are detailed in the downloadable Excel file.
Most Member States receive more students than the number of those going abroad, indicated by the cluster on the right-hand side of the x-axis. Countries with a high importing balance tend to have lower outbound mobility rates, albeit with substantial variation between countries. In 2020, Denmark and the Netherlands were the highest net importing countries, with mobility imbalances of more than 80%. Moreover, the outbound mobility rates in these countries (2.1% and 2.2%, respectively) were among the lowest in the EU.
The variation in outward mobility rates of net exporting countries is substantially higher than observed among net importing countries. Luxembourg, Slovakia, Greece, and Cyprus were the highest net exporting countries (above 40%), and saw outward mobility rates of 76.9%, 19.9%, 4.9% and 40.2%, respectively.
Figure 22. Intra-EU degree mobility is highly unbalanced across Member States
Source: European Commission calculations based on Eurostat (UOE 2020 on degree mobility). Note: calculations and metadata are detailed in the downloadable Excel file.
Considering only intra-EU degree mobility, the depiction of balance takes on a very different form (Figure 22). In 2020, Italy, Luxembourg, Slovakia, Lithuania, Cyprus and Croatia had the highest net export of degree mobile students to other Member States relative to how many students they received. A further 10 Member States also recorded a mobility flow imbalance in favour of outbound mobility. Notably, many countries move from being net import countries to net export countries if only intra-EU mobility is considered
.
In a nutshell
In 2021, 41.2% of 25-34 year-olds had a tertiary-level qualification, keeping the EU on track towards meeting its 2030 target of at least 45%. However, decades of educational expansion have coincided with an ever-widening gender gap, reaching 11.1 percentage points in favour of women. Evidence suggests that gender gaps emerge long before tertiary education and widen along the education trajectory, as mirrored in most data on new entrants, enrolments and completion. Study choice also retains a strong gender divide, and women remain underrepresented in disciplines such as ICT and engineering. In addition, tertiary educational attainment rates are 48.6 percentage points higher among young people whose parents have a high level of education than they are among young people whose parents have a low level of education.
Chapter 6. An era of transitions demands lifelong skills development
EU-level 2025 target: ‘At least 47% of adults aged 25-64 should have participated in learning during the last 12 months, by 2025’.
EU-level 2030 target: ‘At least 60% of adults aged 25-64 should have participated in learning during the last 12 months, by 2030’.
6.1.
Increasing participation in adult learning is a renewed priority
The COVID-19 pandemic has made it clear that everybody needs basic digital skills for study, work and daily life, whereas the green transition calls for new skills and attitudes (see Chapter 8). Meanwhile, skills shortages have become a standard fixture on the EU labour market. In 2019, labour shortages were at their highest in around half of the Member States, declining during the pandemic but increasing again in 2021. Eurofound
reported
that, in a context of post-pandemic recovery and transition to a climate-neutral economy, the construction, energy, manufacturing and transport sectors were likely to need additional labour supply and new skills the most.
Stepping up the development of the existing labour force’s skills can play a major role in tackling skills shortages. Therefore, increasing participation in adult learning has become a priority issue and was the focus of one of three headline targets for social policy welcomed by EU leaders in 2021, which aims to ensure 60% of adults are participating in learning every year by 2030. The 2025 EU-level target of 47% adults participating in learning annually has become a milestone towards reaching the 2030 target. In addition, Member States have set national targets by 2030 (Box 17).
Box 17. National targets for 2030
Achieving the 2025 and 2030 EU-level targets requires sustained measures, and in some countries radical reforms, to increase adult learning participation. On 16 June 2022, the employment and social affairs ministers of EU Member States presented their 2030 national targets for (a) the employment rate; (b) reducing the number of people at risk of poverty; and (c) participation in adult learning. The overview below shows the 2030 national targets for adult learning, compared to a 2016 baseline (the latest data available using the same 12-month reference period).
|
|
Baseline
(2016)
|
Target
(2030)
|
|
Baseline
(2016)
|
Target
(2030)
|
|
EU
|
37.4
|
60.0
|
Latvia
|
39.0
|
60.0
|
|
Belgium
|
39.4
|
60.9
|
Lithuania
|
25.0
|
53.7
|
|
Bulgaria
|
11.8
|
35.4
|
Luxembourg
|
42.6
|
62.5
|
|
Czechia
|
22.8
|
45.0
|
Hungary
|
54.8
|
60.0
|
|
Denmark
|
50.4
|
60.0
|
Malta
|
32.8
|
57.6
|
|
Germany
|
46.4
|
65.0
|
Netherlands
|
57.1
|
62.0
|
|
Estonia
|
33.9
|
52.3
|
Austria
|
55.3
|
62.0
|
|
Ireland
|
46.0
|
64.2
|
Poland
|
20.9
|
51.7
|
|
Greece
|
16.0
|
40.0
|
Portugal
|
38.0
|
60.0
|
|
Spain
|
30.4
|
60.0
|
Romania
|
5.8
|
17.4
|
|
France
|
48.4
|
65.0
|
Slovenia
|
40.3
|
60.0
|
|
Croatia
|
26.9
|
55.0
|
Slovakia
|
42.6
|
50.0
|
|
Italy
|
33.9
|
60.0
|
Finland
|
51.4
|
60.0
|
|
Cyprus
|
44.8
|
61.0
|
Sweden
|
58.8
|
60.0
|
Source: 2022 press release ‘
Commission welcomes Member States' targets for a more social Europe by 2030
‘.
The
2022 Council Recommendation
on ‘individual learning accounts’ outlines how Member States can stimulate participation in adult learning by closing support gaps and fostering the integration of financial and non-financial support (Box 18). The
2022 Council Recommendation
on a European approach to micro-credentials for lifelong learning and employability aims to increase transparency concerning the quality and recognition of short training courses, which constitute the bulk of adult learning (Box 19).
6.2.
There are signs of recovery amid a strikingly uneven country performance
While future EU-level monitoring of adult learning will use a 12-month reference period, the most recent data available concern participation in adult learning participation over the 4 weeks preceding the survey. There was a near-universal decrease of adult learning in the past 4 weeks between 2019 and 2020 (from 10.8% to 9.1% in the EU average, with drops in all Member States except Greece, Spain and Lithuania), likely due to the health measures introduced because of COVID-19, which disrupted learning provision, especially at the workplace. However, a near-universal increase of adult learning was observed between 2020 and 2021 (from 9.1% back to 10.8%, with increases in all Member States except Germany, Greece, and France). This may be due, in part, to the more granular measurement as of 2021, or to the relaxation of COVID-19 measures, making it easier for adults to participate in learning activities again.
Figure 23. Adult learning took a hit during COVID-19 and picked up again in 2021
Source: Eurostat (EU Labour Force Survey). Note: breaks in time series for Germany (2020) and for all countries in 2021.
Most adult learning in the 4 weeks preceding the survey concerns non-formal learning, comprising three quarters of all participation in 2021 (8.0% against a total of 10.8%). This share is almost the same as it was in 2019, while it was a bit lower in 2020. Adult learners mostly follow short courses, more likely to be organised in non-formal settings. Non-formal learning represent less than half of all adult learning in only a couple of countries with a very low rate of participation. Most non-formal adult learning is job-related, but 1.9% of adults reported reporting participation only in non-formal learning that was not related to their job.
Box 18. Individual learning accounts
The aim of the
2022 Council Recommendation
on individual learning accounts is to promote adult participation in learning through direct financial support and complementary services. It invites Member States to consider setting up individual learning accounts to encourage adults to participate in training. Every adult, whether at work or not, is recommended to receive a personal account with training entitlements, which they can spend throughout their career on training courses that are relevant to the labour market and quality-assured, chosen from a registry of eligible opportunities.
In France, the use of individual learning accounts (‘compte personnel de formation’, CPF) has increased rapidly during the pandemic, against an overall trend of falling adult learning participation. The number of CPF-funded training courses increased from 489,000 in 2019 to 1 million in 2020, and then to 2.1 million in 2021. Workers in the accommodation and catering sector, which was particularly affected by the COVID-19 pandemic, recorded the strongest increase, suggesting that the CPF allowed many workers to use the period of low economic activity for (online) training. Following a 2019 reform that made it more user-friendly, use of the CPF has increased, in particular among low qualified adults, who are now well represented among CPF users. France provided additional incentives for the acquisition of digital skills, supported by the Recovery and Resilience Facility.
The Netherlands has introduced individual learning budgets, allowing adults to claim a budget of up to EUR 1 000 per year to spend on eligible training activities (‘STAP’ scheme). STAP replaces an income tax deduction for training expenses, after an evaluation found this income tax deduction only had limited success in encouraging people to take up additional training. In contrast, the STAP budget is available to all adults on the Dutch labour market regardless of whether their income is sufficiently high to pay income taxes, and it does not require pre-financing by individuals. In the first application period (March-April 2022), the budget was exhausted after 3 days: 36 000 individuals received a STAP budget, enrolling in 4 000 different training programmes managed by 235 different providers.
Greece is setting up a scheme of Lifelong Skilling Accounts with support from the Recovery and Resilience Facility, helping people to take up training that responds to their individual needs. The initiative includes a new national register of eligible training providers, based on a revised quality assurance system. The scheme is part of a comprehensive reform, which also envisages an investment in general skills programmes for 500 000 participants and aims to develop basic- and medium-level digital skills, skills for the green transition and financial literacy skills. A National Skills Council will annually revise the national skills strategy.
More adult women (11.6%) than men (10.1%) participated in learning in the 4 weeks preceding the survey, with proportions stable throughout recent years. This pattern is repeated across many Member States, with only few exceptions. Some countries record a particularly strong female predominance. Three women participate in learning activities for every two men in Denmark (26.6% against 18.1%) and Finland (35.8% against 25.5%). The female share is twice the male share in Latvia (11.5% against 5.5%) and Croatia (6.4% against 3.7%).
Higher female participation is also the case among unemployed adults, with 14.3% of women participating in learning activities versus 11.2% of men. In total, adult learning among unemployed people has increased at EU level to 12.7% (from 10.5% in 2020 and 10.7% in 2019), possibly thanks to active labour market policies that responded to the impact of the pandemic. Differences between countries remain huge, with almost half of unemployed people in Sweden participating in learning compared to less than 1 in 10 in eleven other Member States.
6.3.
Adult learning is rare among people with a low level of education and in rural areas
The participation of adults with a low level of education remains below half of the general rate, with an EU average of 4.3%, exactly the same as in 2019, recovering from the rate of 3.4% in 2020. Adults with a low level of education whose parents have a high level of education are four times as likely to participate in learning as adults with a low level of education whose parents also have a low level of education (14.2% versus 3.5%). This suggests that socio-economic status has a strong influence on learning participation, going beyond what is reflected in an adult’s own formal educational attainment.
Figure 24 captures non-formal learning across three levels of educational attainment. It confirms that most non-formal learning is job-related and substantially more prevalent among people with higher levels of education than it is among people with lower levels of education. However, Figure 24 also illustrates how age plays into the participation rates for the three groups, here including people beyond the working age. While participation in general decreases with age at all levels of attainment, among people who are highly educated, participation in job-related non-formal learning has a clear peak in the mid-age groups, something that does not occur among people with medium or low levels of education.
Figure 24. Non-formal learning is led by people who are highly educated below the age of 55
Source: Eurostat (EU Labour Force Survey 2021). Note: ‘Not job-related’ non-formal learning is more prevalent than suggested by the figure, as adults who have participated in both job-related and not job-related non-formal learning are only recorded under job-related non-formal education.
More generally, younger adults participate in formal and non-formal adult learning substantially more than older adults, with the EU average rate of the 25-34 age bracket (18.2%) about twice the rate of the 45-54 age bracket (9.2%). While one in four highly-qualified young adults participate in learning (24.9%), the participation rate (8.3%) of young adults with lower levels of qualification (25 to 34 years) is lower than the rate (9.9%) among highly-qualified older people (55 to 74 years).
As can be seen in Figure 25, the prevalence of adult learning in the 4 weeks preceding the survey is different when living in a city (13.6%), in a smaller town (9.8%) or in a rural area (7.8%) – which may in part reflect the proximity of training opportunities in more densely populated areas. In Malta, the distribution is balanced, and in Estonia, the Netherlands and Sweden, the gap is relatively small. However, in Austria, Cyprus, Czechia, Germany and Latvia, the participation rate in rural areas is about half the rate in cities, and in another seven Member States – Bulgaria, Romania, Croatia, Greece, Lithuania, Poland and Slovakia – it is less than half.
Figure 25. Adult learning is low in rural areas for the majority of Member States
Source: Eurostat (EU Labour Force Survey 2021).
The share of adult learning in the past 4 weeks among those born outside of the reporting country (11.0%) is very similar to the overall EU average rate (10.8%), with a slightly higher share for those born in non-EU countries (11.5%) and a lower share for adults born in other Member States (9.8%). In most countries, data are close to the average pattern, with only a few exceptions. In Lithuania, participation of adults born in the EU (12.4% in 2021) is much higher than that of adults born in non-EU countries (5.5%), while the opposite is true for Hungary (5.3% for those born in other Member States against 11.6% for adults born in non-EU countries).
Box 19. Micro-credentials
Most adult learning takes the form of short, non-formal courses, which is increasingly leading to micro-credentials being awarded. The
2022 Council Recommendation
on a European approach to micro-credentials aims to ensure the quality, recognition and understanding of micro-credentials, making it easier for individuals, employers, and education and training institutions to trust and appreciate them. Micro-credentials have huge potential to shape a better supply of targeted upskilling and reskilling courses, and to motivate people to take advantage of them, knowing that their new skills will be certified in a clear and credible document. Micro-credentials open the possibility for people to accumulate, or ‘stack’, different competences, which can be documented and recognised by learning providers, employers, and sectors – as well as across countries.
In Ireland, certificates released after short courses have been included in the National Framework of Qualifications since its establishment in 2003. In the Netherlands, micro-credentials (‘edubadges’) can be issued online and their recipients can store and share them with employers or education providers. In Croatia, ‘micro-qualifications’ have become part of formal adult education following the 2021 adoption of the new Adult Education Act, and units of learning outcomes related to short training courses can lead to partial or full qualifications. In Spain, recent legislation has integrated a number of micro-credentials into formal VET, which can be stacked and lead to a formal VET certificate. Latvia also allows micro-credentials to be accumulated in order to get a full qualification or used as standalone qualifications. Estonia is revising its Adult Education Act to regulate the content, provision, quality framework and duration of learning experiences leading to the award of micro-credentials.
In a nutshell
In 2021, 10.8% of adults aged 25 to 64 participated in formal or non-formal learning activities over the preceding 4 weeks, showing a recovery from pandemic-induced drops the previous year. While adult learning in the preceding 4 weeks has increased among the unemployed (now 12.7%), it is still much less prevalent among people with a low level of education (4.3%) and people living in rural areas (7.8%). These data build on a new, more granular definition of adult learning – and will be improved again next year with the reference period for learning activities being extended to 12 months. It is the 12-month reference period that will be used for the EU-level targets for both 2025 and 2030, as well as for national targets set by the Member States.
Part 3. The kind of learning
Quality education equips young people with the knowledge, skills and attitudes required to thrive in life and to cope with the various challenges they will face. Parts 1 and 2 of this report already touched upon a number of important dimensions of quality education, such as learning mobility, teaching and the way equitable education and training systems feed into quality learning for all. Part 3 looks at educational achievement as a proxy for quality education and an illustration of the kind of learning that is behind the educational credentials, diplomas and certificates mentioned in Part 2.
The final part of this report aims to broaden the focus on reading, maths and science and to expand coverage to other key competences in a lifelong learning perspective. Such an approach may, over time, reveal common characteristics and synergies that can improve our education and training systems. The
2018 Council Recommendation
on key competences for lifelong learning singles out eight broad domains: (1) literacy; (2) multilingualism; (3) mathematics (and science, technology and engineering); (4) digital; (5) personal, social and learning to learn; (6) citizenship; (7) entrepreneurship; and (8) cultural awareness and expression. Not all of these key competence domains lend themselves easily to cross-EU comparisons, but the quantitative and qualitative evidence is improving.
The Recommendation also refers to numerous ‘horizontal enablers’ that can be expected to benefit the development of most – if not all – key competences in an education and training system. Such enablers include cross-discipline learning, whole school approaches, learner continuity, cross-sectorial cooperation, the active participation and decision making of learners, guidance and support for innovative learning methodologies, and competence-oriented approaches in initial teacher education, continuing professional development and staff exchanges.
The
2020 Commission Communication
on achieving the European Education Area by 2025 continues the work on these ‘horizontal enablers’, and introduces additional enablers such as micro-credentials. The
2020 Commission Communication
on the European Skills Agenda strengthens the focus on the digital and green transition (see Chapter 8), while adding objectives on adult learning and the digital skills of the adult population. The European Skills Agenda also adds further ‘horizontal enablers’ such as individual learning accounts.
Box 20. Learning losses due to physical school closures
While there is no comparable EU-level evidence, national studies show large variation in the impacts of physical school closures on learning progress. This reflects considerable cross-country variation in the intensity of the pandemic, length and extent of school closures, different modes of distance or hybrid learning adopted, readiness to move towards online learning (and its efficiency), and also the type, scope and timing of measures adopted to mitigate learning loss.
The magnitude of reported learning loss varied significantly by country, subject, level of education, and school closure length. Declines were recorded in the Flemish Community of Belgium (maths and Dutch among sixth grade students), Italy (maths among primary school students), the Netherlands (maths, spelling and reading among students in grade 4-7) and Germany (reading comprehension, operations and numeracy among fifth grade students). Other national studies found less conclusive evidence or no evidence at all of learning loss. In addition, there may have been some learning recovery during the second year of the COVID-19 pandemic in countries that recorded learning losses in 2020.
Some pre-COVID-19 studies suggest that remedial measures could be effective in addressing educational disruption. In a March 2021 survey on COVID-19, 76% of participating Member States reported providing remedial measures to reduce learning loss at upper secondary level. These included specific supports for students in upper secondary grades ending with a national examination (65% of Member States) and for students in programmes with a vocational orientation (53%). In addition, 71% of countries reported introducing specific measures for disadvantaged students. More than 60% of Member States introduced supports for students at risk of early school leaving or grade repetition, as well as for students unable to access distance learning. Remedial actions were often preceded by an assessment of the gaps in student learning (71% of countries).
Source:
Employment and Social Developments in Europe (ESDE) review 2022
.
Chapter 7. A policy focus on key competences looks beyond basic skills
7.1.
Underachievement in basic skills goes down with instruction time
EU-level 2030 target: ‘The share of low-achieving 15-year-olds in reading, mathematics and science should be less than 15% by 2030.’
Underachievement in reading, maths and science is captured by data from the OECD’s PISA, with its most recent 2018 round well documented in previous editions of the Education and Training Monitor. Across the EU, the shares of underachievement in reading (22.5%), maths (22.9%) and science (22.3%) are all quite a distance from the 2030 target of below 15% and have actually increased when compared to the 2015 PISA round.
With PISA widely regarded as the benchmark for international comparisons in educational achievement, there is great interest in seeing whether its 2022 round will confirm further increases in underachievement, or whether any learning losses resulting from the 2020-21 physical school closures will have been remedied in the interim. In this section, further analysis of PISA 2018 data suggests that instruction time does correlate with underachievement, which may not bode well in terms of COVID-19 effects.
Instruction time is not the definitive hallmark of quality education, yet there is a clear association between the number of annual hours 14-year-olds were expected to spend overall in regular lessons and the underachievement rate in reading at age 15 (Figure 26). Three out of the four bottom performing countries with respect to underachievement in reading are also the countries with the lowest intended instruction time at age 14 (Cyprus, Romania and Malta).
Figure 26. Cyprus, Romania and Malta may benefit from increasing the instruction time
Source: OECD (PISA 2018) and Eurydice. Note: the values in the horizontal axis correspond to the intended instruction time (number of hours per year) in public institutions (no data for Austria, Latvia, the Netherlands and Sweden). The size of bubbles represents the degree of flexibility in time allocation, measured as the average of the share of vertical and horizontal subject flexibility over the total instruction time.
In Denmark, which has the highest number of hours and the highest share of language classes, the underachievement rate is 16.0%. In France, with a share of language classes that is closer to the EU average, the underachievement rate increases to 20.9%. Lower shares of language classes are also observed in countries with higher underachievement, such as Greece (8.1%) and Bulgaria (9.2%).
Furthermore, there is a group of countries (Estonia, Finland, Czechia, Ireland, and Belgium) where underachievement rates are below the EU average, while neither the instruction time nor the share of language classes are out of the ordinary. These countries share a varying degree of flexibility in the allocation of instruction time (as depicted by the bubble size in Figure 26), whether it be ‘vertical flexibility’, as in Estonia, Czechia, Finland, or ‘horizontal flexibility’ in Belgium and Ireland. These findings suggest that a higher degree of school autonomy could act as a leverage to tackle underachievement.
7.2.
Multilingualism may be on the rise
The EU's motto ‘united in diversity’ symbolises the essential contribution of linguistic diversity. Languages unite people, make other countries and their cultures accessible, and strengthen intercultural understanding. Foreign language skills play a vital role in boosting employability and mobility. Yet too many Europeans still leave school without a working knowledge of a foreign language. For this reason, the EU has set the improvement of language teaching and learning as a priority.
In 2016, 78.7% of young adults (25-34 years) reported they knew at least one foreign language, but only 36.8% declared knowing more than one foreign language, the latter fairly stable across time. Evidence suggests that proficiency among young adults may pick up in the future as younger cohorts age. In primary education, a strong majority of pupils are in contact with a foreign language (86.1% in 2020). Moreover, the share of lower secondary students learning more than one foreign language has been increasing in recent years, rising from 46.3% in 2015 to 59.2% in 2020 (Figure 27).
Figure 27. The exposure of school-age youth to foreign languages bodes well for the improvement of multilingual proficiency among young adults
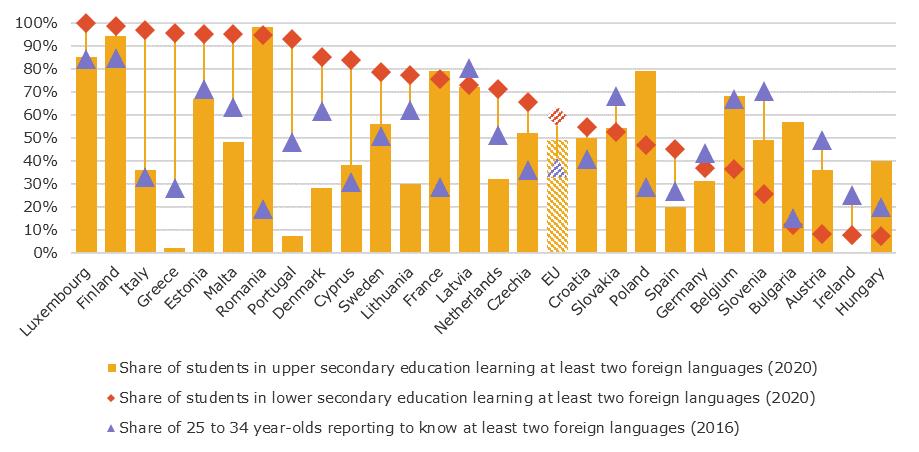
Source: Eurostat (UOE 2020; Adult Education Survey 2016).
The share of students who continue studying a second foreign language in upper secondary education (49.0% across the EU in 2020) tends to be lower than in primary and lower secondary education. Remarkable exceptions are Bulgaria, Hungary, Poland and Belgium, where the share from lower to upper secondary education increases by over 30 percentage points, followed by an increase of over 20 percentage points in Austria and Slovenia.
Some 60.0% of students enrolled in general programmes in upper secondary education are taught at least two foreign languages on average across the EU, compared to only 35.1% of students in vocational programmes. This pattern is observed in all countries except Italy, where students in vocational education are more likely to learn a second foreign language than their peers in general education (48.1% versus 24.7% in 2020).
Box 21. Entrepreneurship competence
Entrepreneurship competence refers to the capacity to act upon opportunities and ideas, and to transform them into values for other people. It is founded upon (1) creativity, (2) critical thinking and problem solving, (3) taking initiative, (4) perseverance and (5) the ability to work collaboratively in order to plan and manage projects that are of cultural, social or financial value.
According to the 2021
Global Entrepreneurship Monitor (GEM)
, there is still insufficient training provided throughout primary and secondary education across the EU as regards creating or managing small and medium-sized enterprises (with Finland and the Netherlands being the only exceptions). At post-secondary and tertiary levels, the situation improves and five additional Member States can be added to the list (Spain, France, Lithuania, Germany and Luxembourg).
The European entrepreneurship competence framework (
EntreComp
) is a reference framework that explains what is meant by an entrepreneurial mindset. EntreComp offers a comprehensive description of the knowledge, skills and attitudes that people need to be entrepreneurial and to create financial, cultural or social value for other people. EntreComp comprises three key areas with 15 entrepreneurship competences, defined through learning outcomes – what a learner knows, understands and can do. The learning outcomes are mapped across eight different levels of progression, from beginner to expert.
EntreComp can be used in a variety of ways including: (1) supporting policy and practice to develop entrepreneurial skills; (2) assessing entrepreneurial skills; and (3) helping to train educators, trainers and teachers. EntreComp can be used across sectors and be a key tool used for collaboration and development work by educators, trainers, employers, professional bodies and policymakers.
Regarding the actual languages studied, in primary education the preferred language remains English (84.1%), and to a lesser extent French (5.5%) and German (3.4%). These are also the main languages studied in lower secondary education (98.3%, 30.6% and 21.4%, respectively), with the addition of Spanish (17.7%). Upper secondary education features a similar – though slightly more balanced – pattern, for English (88.1%), French (18.9%), German (20.0%) and Spanish (18.0%).
The Commission is strengthening the central role of multilingualism by: (1) working with Member States and leading experts in language education to modernise language teaching; and (2) strengthening the evidence base for language policy, in collaboration with the Eurydice network and Eurostat, as well as with external partners such as UNESCO, OECD and the Council of Europe. For instance, results from the 2022 Adult Education Survey will provide valuable information, in particular for the younger age groups (from 18 years old).
Crucially, the question remains whether language policies, curricula, instruction and learning can actually lead to students becoming proficient in foreign languages. The next PISA cycle will include an optional module to assess the English language proficiency of 15-year-old students.
7.3.
Citizenship attitudes evolve with education
Citizenship competence is the ability to act as responsible citizens and to fully participate in civic and social life, based on an understanding of social, economic, legal and political concepts and structures, as well as global developments and sustainability. Education plays an essential role in teaching fundamental values and promoting social inclusion in order to strengthening social cohesion and democratic participation.
The
2022 European Parliament Resolution
on implementing citizenship education actions called for the development of tangible and measurable EU objectives on citizenship education. The results from the 2022 edition of the International Civic and Citizenship Education Study (
ICCS
), expected to be published in 2023, will provide a solid basis to inform such tangible and measurable EU objectives on citizenship education. In the meantime, a 2021 Eurobarometer
Youth Survey
sheds light on various citizenship attitudes and hints at how such attitudes evolve as young people progress through the education and training system.
Looking at the Youth Survey’s results, a prioritisation of various civic issues reveals clear differences based on the age at which the respondents left the education system (Figure 28), which could be regarded as a proxy for educational attainment. Young people who left early tend to give less priority to issues such as tackling poverty and inequality, improving people’s health and well-being and combating climate change, when compared to those with a higher educational attainment or still in the education system. In fact, young people who left before the age of 16 indicate, on average, unemployment as their number one priority. Young people with higher levels of educational attainment or still in the education system attribute less relevance to issues such as terrorism or online threats. Instead, they tend to prioritise civic issues such as protecting human rights and democracy, freedom of speech and gender equality.
Figure 28. Young people’s priorities shift from unemployment to inequality and climate change the longer they spend time in education
Source: Eurobarometer Youth Survey 2021.
Citizenship competence has strong links to other competence domains, which is particularly evident in light of the green and digital transition (Chapter 8). Firstly, sustainability is a prominent sub-dimension of citizenship competence, and a clear civic priority for young people (Figure 28). Secondly, as part of the 2021-27
Digital Education Action Plan
, the Commission has been working on guidelines for teachers and educators to tackle disinformation – a civic issue that has been gaining substantial momentum in recent years.
Box 22. Personal, social and learning to learn competence
The personal, social and learning to learn key competence is the ability to reflect upon oneself, manage time and information effectively, work with others in a constructive way, remain resilient and manage one’s own learning and career. It includes the ability to cope with uncertainty and complexity, learn to learn, and support one’s physical and emotional well-being.
LifeComp
is a conceptual framework, which the Commission developed to establish a shared understanding on the personal, social and learning to learn key competence. LifeComp describes nine competences that are structured across three intertwined competence areas (personal, social and learning to learn). These nine competences are: (1) self-regulation, (2) flexibility; (3) well-being; (4) empathy; (5) communication; (6) collaboration; (7) growth mind-set; (8) critical thinking; and (9) managing learning. The conceptual framework can be used as a basis for developing curricula and learning activities.
In a nutshell
The fact that underachievement in basic skills is associated with less time being allocated for instruction could spell bad news for the learning losses that may have resulted from physical school closures. However, there are other key competences beyond reading, maths and science that should not be overlooked in a post-COVID-19 world. The 2022 Education and Training Monitor looks at the latest evidence on key competence domains such as multilingualism and citizenship. Firstly, almost two thirds of lower secondary students now learn at least two foreign languages, strengthening intercultural understanding. Secondly, in terms of civic awareness, substantial shares of young people give priority to issues such as inequality (42.8%) and climate change (39.4%).
Chapter 8. A focus on digital and sustainability competences concerns learners of all ages
EU-level target: ‘the share of low-achieving eight-graders in computer and information literacy should be less than 15%, by 2030.’
8.1.
Member States are trying to keep up with an accelerated digital transition
All of education and training sectors, from early childhood education through to adult learning, have a role to play in addressing the latest competence requirements. Today, being digitally competent is needed to participate in democratic life, work and lifelong learning. Yet in 2021, 46% of the EU’s adults (aged 16-74) and 29% of young people (aged 16-24) were assumed to have an insufficient level of digital skills. In a technology-driven society where these skills are a general requirement in daily life and across most occupations and sectors, all EU citizens should have the right to acquire basic digital skills.
To support Member States’ education and training systems in adapting sustainably and effectively to the digital age, the 2021-27
Digital Education Action Plan
sets out two priority areas: (1) fostering the development of a high-performing digital education ecosystem and (2) improving digital skills and competences for the digital transformation.
The COVID-19 pandemic expedited the digital transition, but also drew attention to pre-existing digital skills gaps and exposed new emerging inequalities in the EU. With the digital transformation accelerating, it is essential that education and training systems adjust accordingly. Acknowledging the need to equip young people at an early stage with the skills required to be prepared for the digital age, an ambitious EU-level target has been set to reduce underachievement in digital skills.
Before to the pandemic, more than one in three students on average in Member States participating in the International Computer and Information Literacy Study (ICILS) performed below the threshold for underachievement. Moreover, as depicted in Figure 29, the ICILS showed evidence of a gender gap in favour of girls in average performance, with a higher share of underachieving boys. The gender gap is consistent across all proficiency levels in ICILS, except for the highest level. Despite outperforming boys during compulsory education, relatively few women chose to pursue studies and careers in ICT related fields (see Chapter 5).
Figure 29. Boys are more likely to underachieve in digital skills than girls
Source: IEA (ICILS 2018). Note: underachievement is defined as performance below the level 2 threshold (492 score points) on the ICILS computer and information literacy scale. The results from Italy are not comparable with those of other Member States and have been excluded from the figure.
Most Member States start compulsory teaching of digital competence at school in primary education. In 13 Member States, compulsory teaching of digital competence already starts in the first grade. At this level, the most common approach is to teach digital competence as a cross-curricular subject. However, it is common for different approaches to co-exist within the same education system. This is also seen in lower secondary education, where the general tendency is to teach digital competence as a compulsory separate subject while many education systems allow for more than one approach.
Although most education systems dictate specific learning outcomes for digital competence, its assessment in national tests is still uncommon in primary and lower secondary education. Only three education systems (France, Malta and Austria) assess students’ digital competences through specific national tests related to individual student achievement. In Denmark and France, digital competence is assessed through non-specific national tests, albeit only in lower secondary education. The remaining systems rely on sample-based tests, do not test digital competences through national tests, or do not organise national tests in any competence area.
A key enabling factor for effective digital education and training concerns teachers and trainers who are confident and skilled in using digital technology to support their teaching and adapted pedagogy (Box 23). Before the COVID-19 pandemic, only 37.5% of lower secondary teachers in the EU felt that they were well or very well prepared to use digital technologies for teaching. Currently, only 15 education systems include teacher-specific digital competences for all teacher profiles as a mandatory component in the curricula of initial teacher education for primary and lower secondary education. In another three systems (Latvia, Luxembourg and Malta), digital competences are only compulsory for some teacher profiles.
Box 23. Digital skills and the importance of more equitable teacher allocation
Data from
TALIS
2018 show that pre-service teacher education and training is a major driver of teachers’ adoption of digital technology for their teaching activities. Teachers can only integrate technology into their teaching if they themselves acquire basic digital skills and are competent enough to tailor technology use to their own teaching. However, having qualified teachers is only part of the equation. If they are unequally distributed across schools, this could lead to achievement gaps widening.
Effective teachers do not necessarily work in the schools that need them the most, which can give rise to socio-economic inequalities in student performance. This is one of the findings from a
2022 OECD report
. Moreover, as mentioned in Box 1 at the start of this report, early evidence suggests that learning losses due to the COVID-19 pandemic were more prominent among disadvantaged students than those from more affluent backgrounds. Unequal access to good quality digital infrastructure, equipment, and teachers who were trained in and feel capable of using ICT are likely determinants.
Top-level requirements to appoint a digital school coordinator and establish a school digital plan are not common across Member States. Actions in these areas are often left to the discretion of school leaders, which implies that practices vary and not every school benefits from such actions. Similarly, criteria related to digital education in external school evaluation are not widespread. In the 23 Member States where external school evaluation is a requirement, only 13 have specific criteria related to digital education.
8.2.
Adult learning will be needed to reach the Digital Decade objectives
Looking beyond compulsory education, this section addresses digital skills of the adult population. In 2021, 54% of 16-74 year-olds reported having at least basic digital skills, men (56%) more frequently than women (52%). This is some way off the EU’s ambitions for the
Digital Decade
, with at least 80% of the population reporting basic digital skills by 2030. Figure 30 shows that the Netherlands (79%), Finland (79%) and Ireland (70%) are the top performers in the EU. Seven Member States have yet to reach 50%.
Figure 30. Not a single Member State reaches the EU-level target of at least 80% of 16-74 year-olds reporting basic digital skills
Source: Eurostat (EU survey on the use of ICT in households and by individuals 2021). Note: data are unreliable for Ireland (16-19 and 20-24) and Croatia (16-19).
Comparing the digital skills level of the general population to that of young people, there is evidence of an age gap in digital skills at EU level. At 16 to 19 years, the approximate age in the latter stages of upper secondary education, the share reporting to have at least basic digital skills was 69% in 2021, 15 percentage points higher than the general population. In the 20-24 age bracket, when many enter higher education for the first time, the share increases to 73%. Mirroring the findings of the test-based assessment of digital skills in ICILS, 72% of 16-24 year-old women report to have at least basic digital skills, compared to 70% of 16-24 year-old men.
Box 24. Structured Dialogue with Member States on digital education and skills
The Structured Dialogue with Member States on digital education and skills delivers on Action 1 of the 2021-27
Digital Education Action Plan
, and aims to increase the political visibility and commitments on digital education and skills. The Structured Dialogue took place throughout 2022 in the form of bilateral and EU-level discussions with the Member States. It brought together different strands of policy into an integrated approach, seeking to make the most of the synergies between different policy fields – education, digitalisation, labour and finance. The dialogue also benefited from the involvement of the private sector, social partners and civil society.
The dialogue allowed Member State authorities and other participants to share experiences, best practices and success stories, while drawing lessons from each other's less successful initiatives. The outcomes of the dialogue will feed into future actions at EU level on digital education and skills, including the upcoming proposals for Council Recommendations on enabling factors for digital education and on improving the way digital skills are provided in education and training programmes.
As younger cohorts age, there will be a natural increase in the overall digital skill levels of the general population, as implied by Figure 31. However, this increase by itself would not be sufficient to achieve the ambitions of the Digital Decade. There are also other notable gaps that need to be addressed, such as a prominent urban-rural divide and a pronounced disadvantage among migrants.
Figure 31. There is a strong cohort effect in the perceived level of digital skills among 16-74 year-olds
Source: Eurostat (EU survey on the use of ICT in households and by individuals 2021).
Increasing adult learning (Chapter 6) is paramount in order to close the digital skills gap. Unfortunately, the fact that adult learning is less prevalent among people with lower levels of education does not bode well for the digital transition, as it is these people who will most need such upskilling. Indeed, there is a strong link between educational attainment and individuals’ perceived level of digital skills. At EU level, adults with a low level of education (32%) are at a clear disadvantage compared to those with a medium level (50%) and high level (79%) of education.
8.3.
Gender and socio-economic gaps are replicated in sustainability competence areas
Education and training can help achieve an environmentally sustainable, circular and climate-neutral world. Supporting the green transition is one of the key objectives of the
Recovery and Resilience Plans
and EU-level policy coordination is now being coordinated through several initiatives. Sustainability is high on young people’s minds: a Eurobarometer from May 2022 suggests that poverty and inequality, as well as protecting the environment and fighting climate change are the top priorities among today’s young people (Section 7.3).
Learners need to draw on several interlinked competences to live, work and act in a sustainable way. Learning for the green transition and sustainable development requires whole-institution approaches, reviewing the curricula, programmes and learning environments. On the bright side, one of the positive effects of the COVID-19 pandemic is its potential to transform education. For instance, it appears to have opened up space for re-designing curricula and strategies in teaching sustainability in higher education institutions.The
2022 European Strategy for Universities
supports the higher education sector in adopting whole-institution approaches to achieving the green transition and sustainable development.
Box 25. Sustainability competences according to GreenComp
The Commission has developed a European sustainability competence reference framework –
GreenComp
. It defines sustainability as ‘prioritising the needs of all life forms and of the planet by ensuring that human activity does not exceed planetary boundaries’. Sustainability competences are defined as those that empower ‘learners to embody sustainability values, and embrace complex systems, in order to take or request action that restores and maintains ecosystem health and enhances justice, generating visions for sustainable futures’.
The framework focuses on developing sustainability knowledge, skills and attitudes for learners so they can think, plan and act with sustainability in mind. GreenComp consists of 12 competences organised into four areas: (1) embodying sustainability values (valuing sustainability, supporting fairness and promoting nature); (2) embracing complexity in sustainability (systems thinking, critical thinking and problem framing); (3) envisioning sustainable futures (futures literacy, adaptability and exploratory thinking); and (4) acting for sustainability (political agency, collective action and individual initiative).
GreenComp can serve a wide range of purposes, including curricula review, design of teacher education programmes, policy development, certification, assessment, and monitoring and evaluation.
In school education, environmental sustainability topics form a compulsory part of curricula. In primary education, children often study nature and the need to take care for the environment in the integrated science subject, or they discuss it in the learning areas covering social and environmental aspects. In lower secondary education, learning about environmental sustainability topics takes place in biology, geography, physics and chemistry lessons. Environmental sustainability topics are included in science subjects in all Member States. In addition to that, they are covered as a cross-curricular theme in just under half of the Member States (Figure 32).
Figure 32. Environmental sustainability is a cross-curricular theme in just under half of the Member States

Source:
Eurydice 2022
. Note: the indicator covers primary and lower secondary education.
Furthermore, evidence shows that strong gender and socio-economic disparities permeate environmental knowledge and attitudes. According to a
2022 report by the Commission and the OECD
, students from disadvantaged socio-economic backgrounds are less likely to care about the environment or to be aware about environmental problems than their peers from advantaged socio-economic backgrounds. They also have lower levels of achievement in science and engage less in pro-environmental behaviour (Figure 33).
Figure 33. Engagement in environmental protection activities is more prevalent among young people from advantaged socio-economic backgrounds in several Member States
Source: OECD/European Commission calculations based on PISA 2018 data. Note: data are unavailable for Belgium, Cyprus, Czechia, Denmark, Finland, Luxembourg, the Netherlands and Sweden. Socio-economic gaps are statistically significant at the 0.05 level only for Croatia, Spain, Portugal, Austria, France, Germany, Ireland, Bulgaria, Estonia and Hungary.
Whereas boys seem more aware of environmental problems such as nuclear waste, the increased greenhouse gases in the atmosphere, use of genetically modified organisms and the consequences of clearing forests for other land use, girls reported higher levels of awareness of water shortage, air pollution and extinction of plants and animals. When looking at science content areas, boys performed better in physical, earth and science areas, and girls performed better in biology. These results seem to mirror gender stereotypes in STEM study choice (Section 5.2), with women more likely to pursue degrees in ‘biology and related sciences’ (a subfield of the broader ‘natural sciences, mathematics and statistics’ field) than in other STEM fields.
In a nutshell
The promotion of digital and sustainability competences can benefit from them being mainstreamed in compulsory education as cross-curricular subjects. It will also benefit from the boosting of teachers’ confidence and skills. Yet ensuring a basic proficiency in digital and sustainability competences has particular implications for adult learning, making sure that learners who already left the formal education and training systems do not miss out on the opportunities provided by an accelerating twin transition. Moreover, it should be emphasised that these competence domains are marked by the same inequities that permeate the entirety of education and training. For instance, boys are more likely to underachieve in digital skills than girls, and engagement in environmental protection activities is more prevalent among young people from advantaged socio-economic backgrounds in several Member States.