EUROPEAN COMMISSION
Brussels, 22.2.2017
SWD(2017) 77 final
COMMISSION STAFF WORKING DOCUMENT
Country Report Italy 2017
Including an In-Depth Review on the prevention and correction of macroeconomic imbalances
Accompanying the document
COMMUNICATION FROM THE COMMISSION TO THE EUROPEAN PARLIAMENT, THE COUNCIL, THE EUROPEAN CENTRAL BANK AND THE EUROGROUP
2017 European Semester: Assessment of progress on structural reforms,
prevention and correction of macroeconomic imbalances, and results of in-depth reviews
under Regulation (EU) No 1176/2011
{COM(2017) 90 final}
{SWD(2017) 67 final to SWD(2017) 93 final}
Contents
Executive summary1
1.Economic situation and outlook5
2.Progress with country-specific recommendations14
3.Summary of the main findings from the MIP in-depth review19
4.Reform priorities26
4.1.Public finances and taxation26
4.2.Financial sector31
4.3.Labour market, education and social policies40
4.4.Investment48
4.5.Sectoral policies52
4.6.Public administration57
A.Overview table61
B.MIP Scoreboard69
C.Standard tables70
References75
LIST OF Tables
1.1Key economic, financial and social indicators for Italy social indicators for Ital 13
2.1 Summary table on 2016 CSR assessment16
3.1.MIP Assessment Matrix (*) - Italy24
4.2.1.Italian banking sector key indicators31
4.2.2.Key indicators on the Italian banking sector by segment, Q2 201633
4.2.3.Bank bonds by seniority, holding sector and size of issuing bank, Q2 201634
B.1.MIP scoreboard - Italy69
C.1.Financial market indicators70
C.2.Labour market and social indicators71
C.3.Labour market and social indicators (continued)72
C.4.Product market performance and policy indicators73
C.5.Green growth74
LIST OF Graphs
1.1.Growth accounting for Italy, by period5
1.2.Real GDP and components6
1.3.Net capital stock6
1.4.Real GDP and domestic demand components at macro-regional level6
1.5.GDP deflator growth and contributions8
1.6.Real GDP and employment growth8
1.7.Employment developments and contributions by age group9
1.8.Bank credit to firms by firm size and risk profile10
1.9.Italian public finance indicators12
1.10.Evolution of Italy’s public debt-to-GDP ratio under different debt sustainability analyses12
3.1.Drivers of change in Italy's public debt-to-GDP ratio20
3.2.Italy’s export performance, exchange rate and cost competitiveness indicators21
3.3.Price competitiveness based on producer prices in manufacturing, 12-month averages22
4.1.1.Evolution of government real primary expenditure and potential GDP growth26
4.1.2.Long-term projections of gross public pensions expenditure27
4.2.1.Net non-performing debt instruments as % of total own funds for solvency purposes, Q2 201635
4.2.2.Relationship between banks’ loan growth and asset quality36
4.2.3.Cumulative distribution of the Italian bad-loan stock by loan value and number of borrowers, Q3 201636
4.3.1.Contribution to annual employment growth by contractual status40
4.3.2.Public expenditure on labour market policies, 201443
4.3.3.Voucher-based workers and average number of paid vouchers per worker, 2008-201544
4.3.4.People at risk of poverty or social exclusion by NUTS 2 region, 201545
4.3.5.General government nominal expenditure by function, 2007-201447
4.4.1.Investment, current prices48
4.4.2.Change in investment by type of asset, current prices48
4.4.3.Investment by macro-sector, current prices49
4.5.1.Goods market efficiency, 201652
4.5.2.Restrictiveness indicator by profession, 201653
4.5.3.Responsiveness of public administration to the needs of SMEs54
4.5.4.Ease of doing business in 2017 and the number of reforms done in 2010-201655
4.6.1.Government effectiveness indicator, 201657
4.6.2.Percentage breakdown of the average salary of non-managerial civil servants, 201457
4.6.3.Ratio of time-barred criminal cases to total resolved criminal cases per instance60
LIST OF Boxes
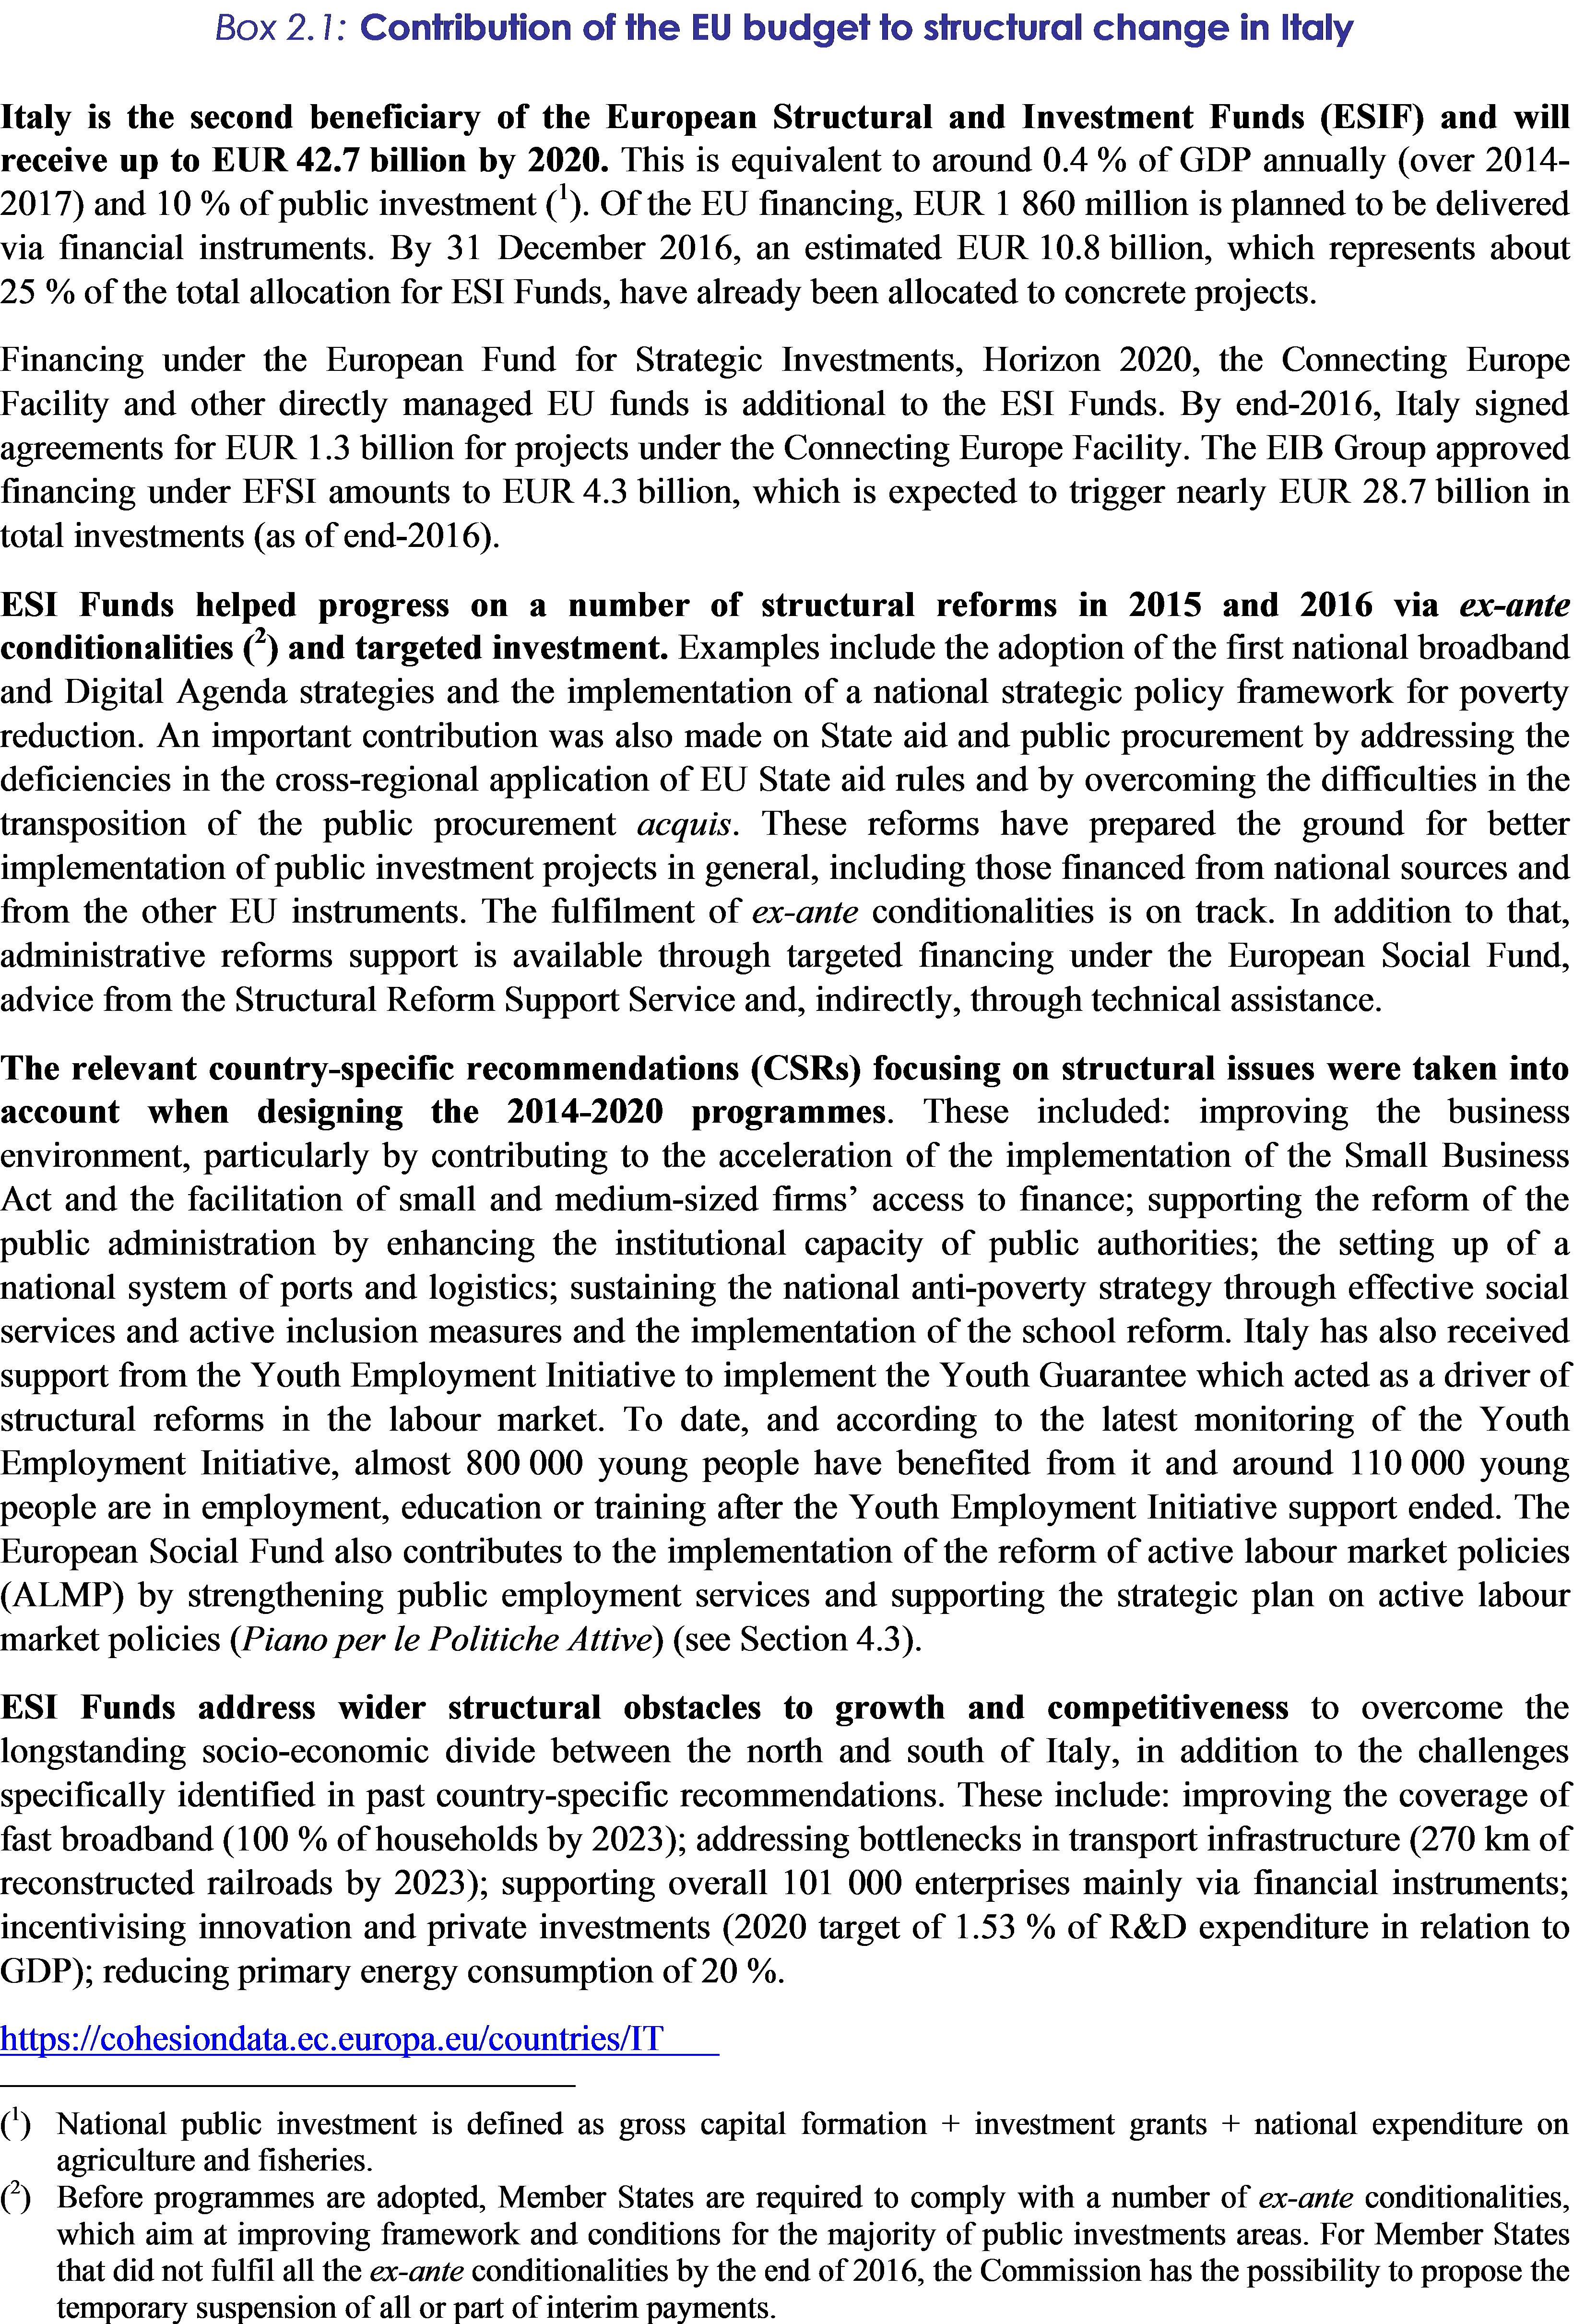
2.1.Contribution of the EU budget to structural change in Italy18
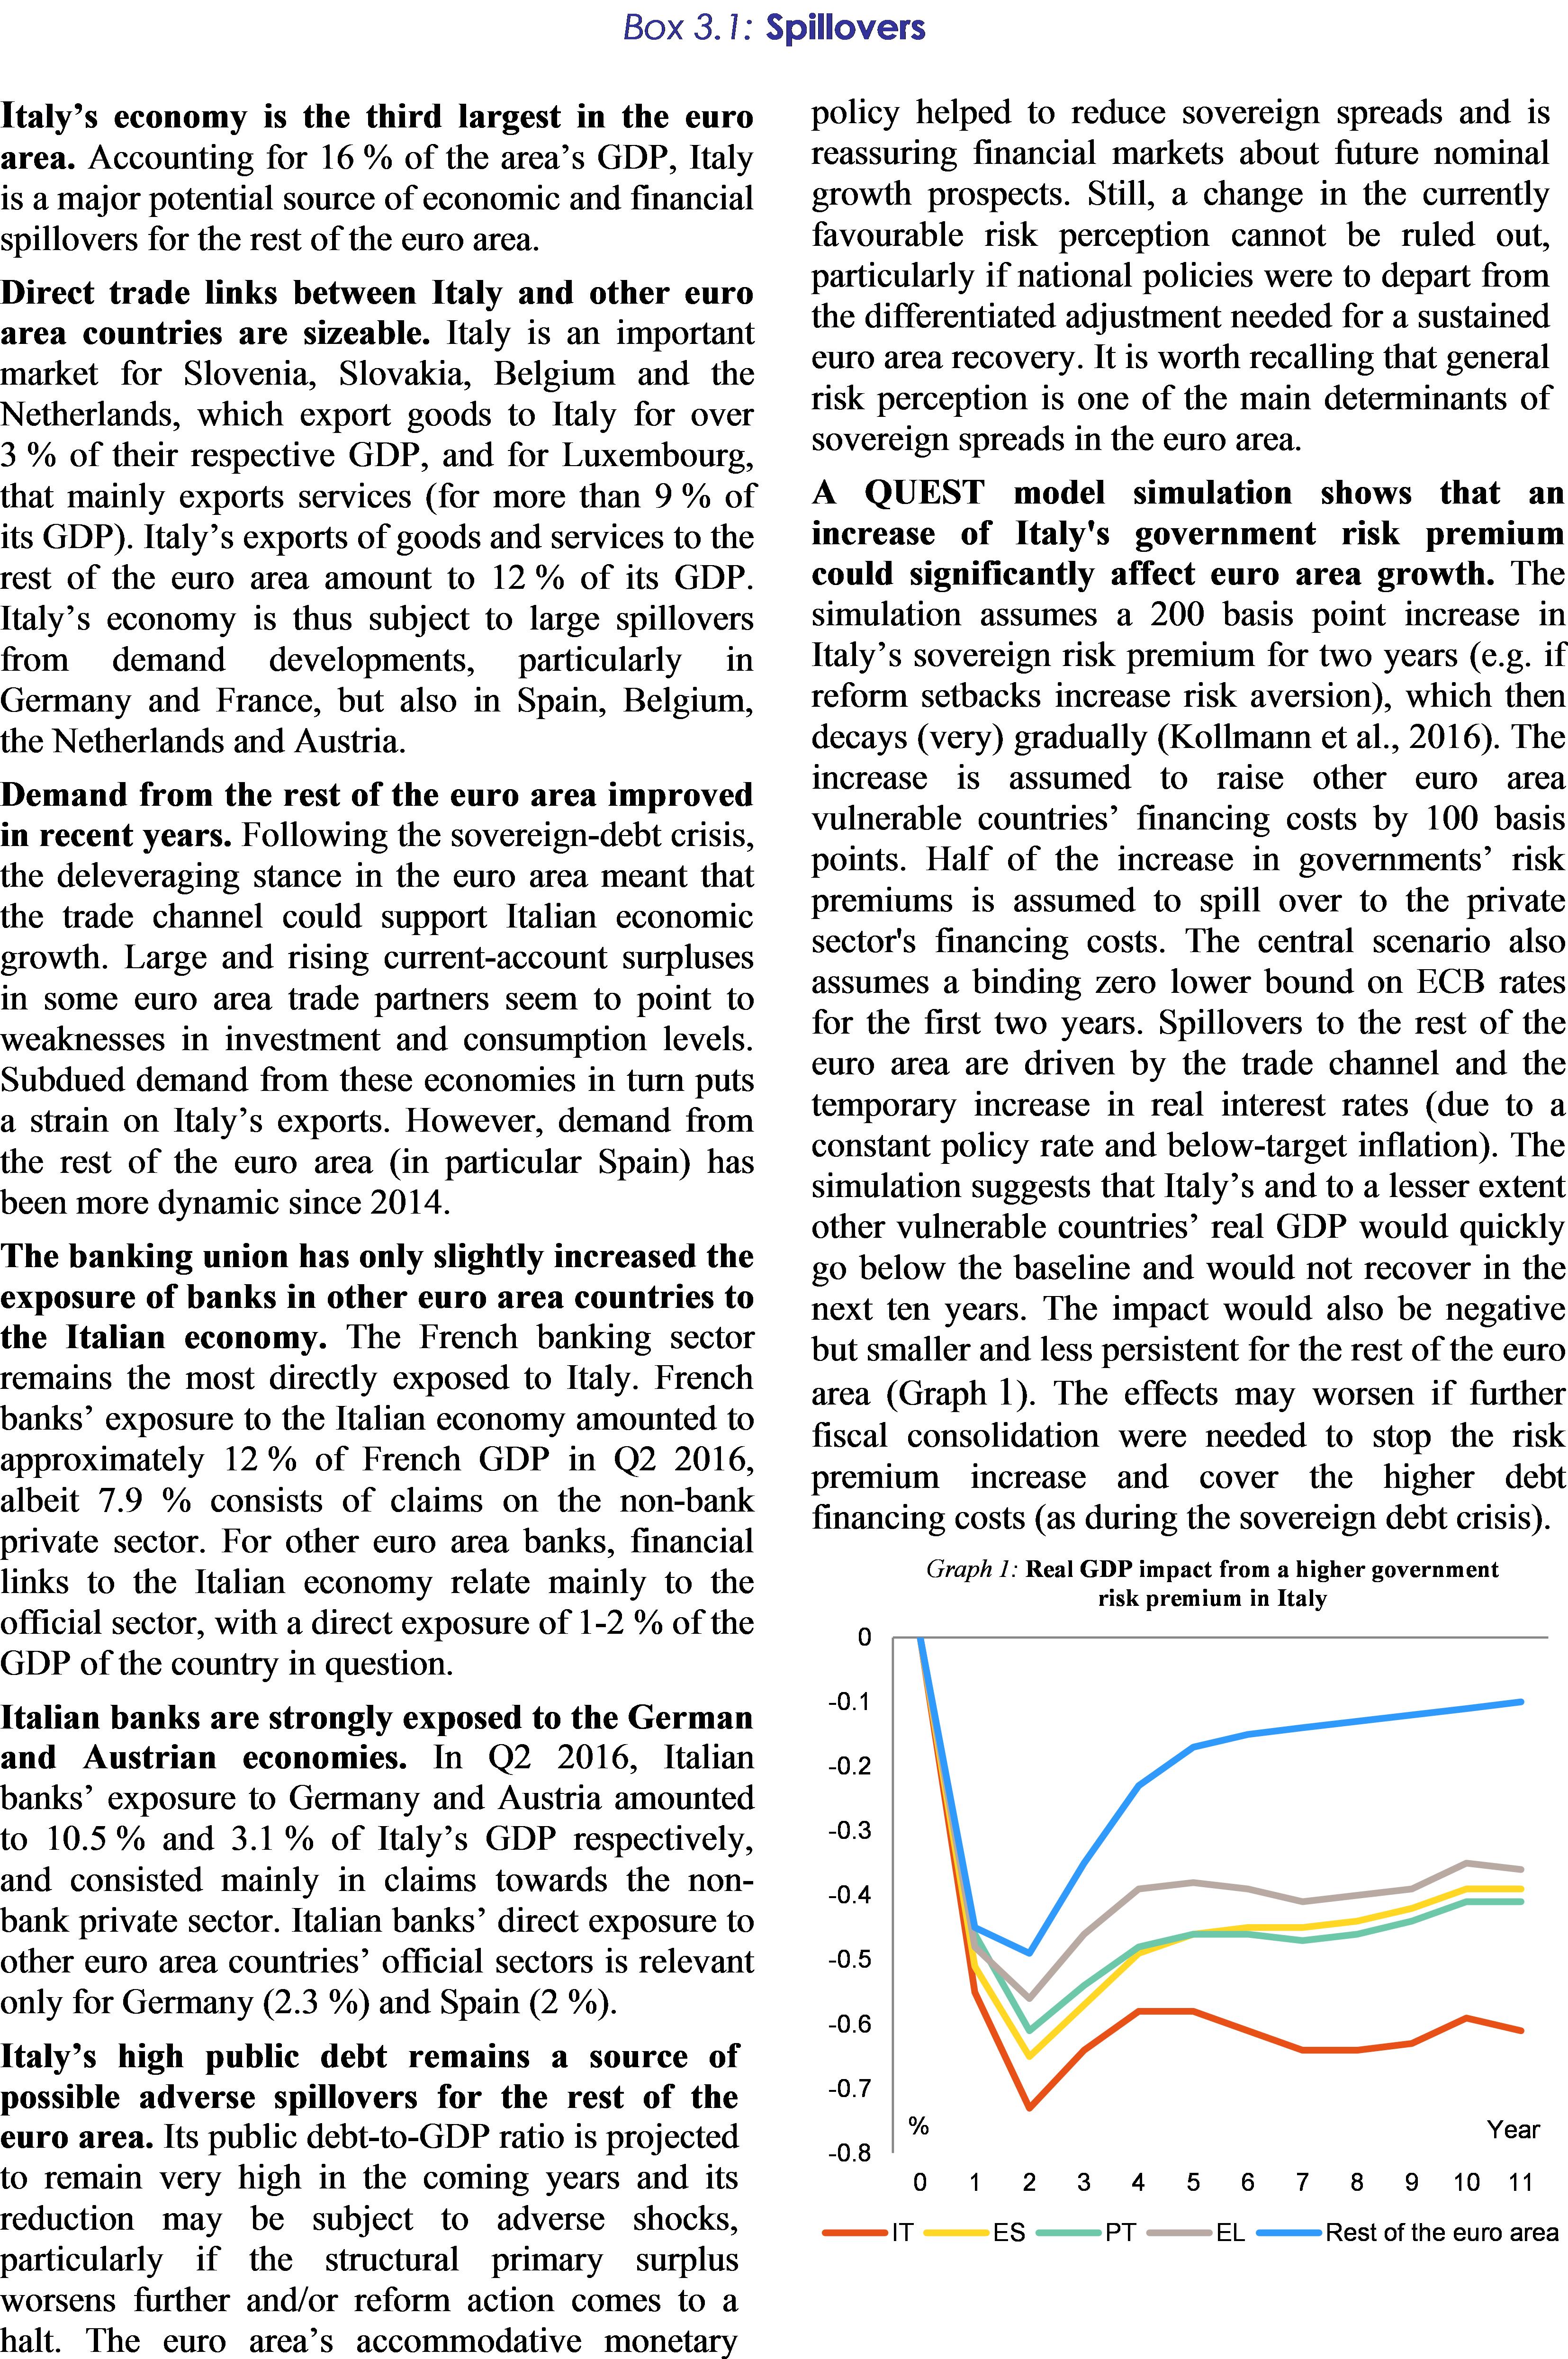
3.1.Spillovers23
4.1.1.Distributional effects of a tax shift from labour to consumption30
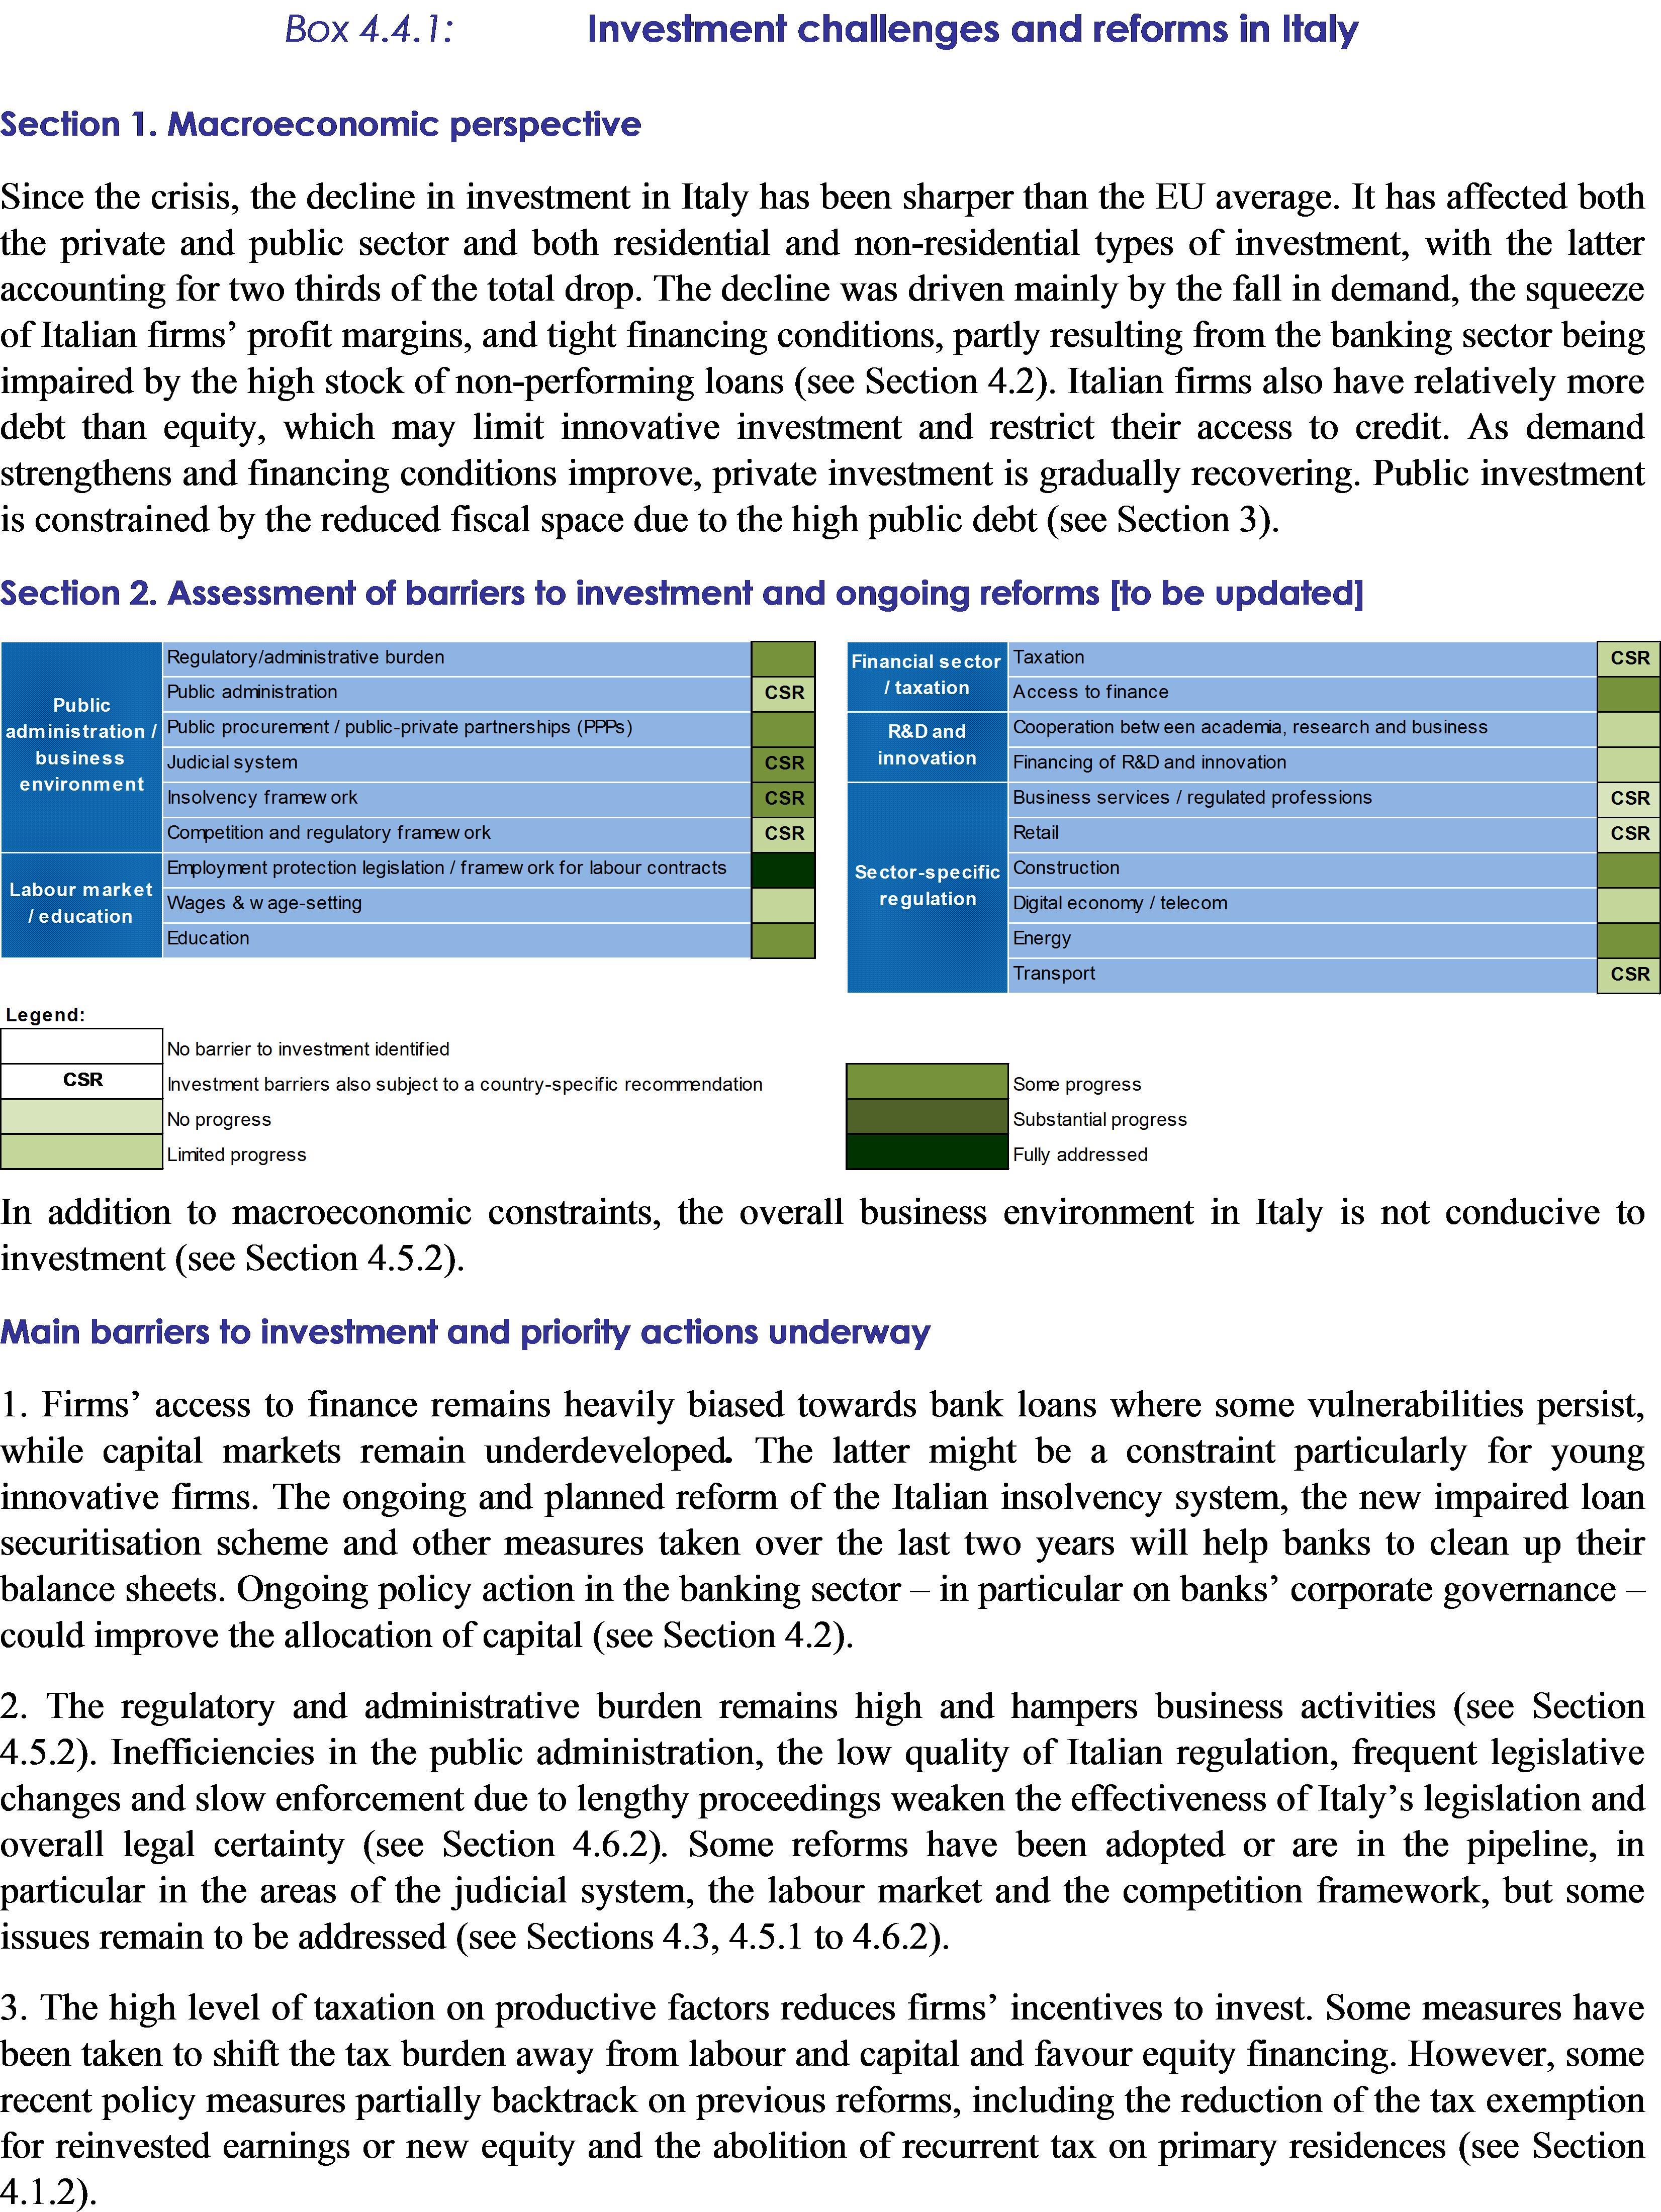
4.4.1.Investment challenges and reforms in Italy51
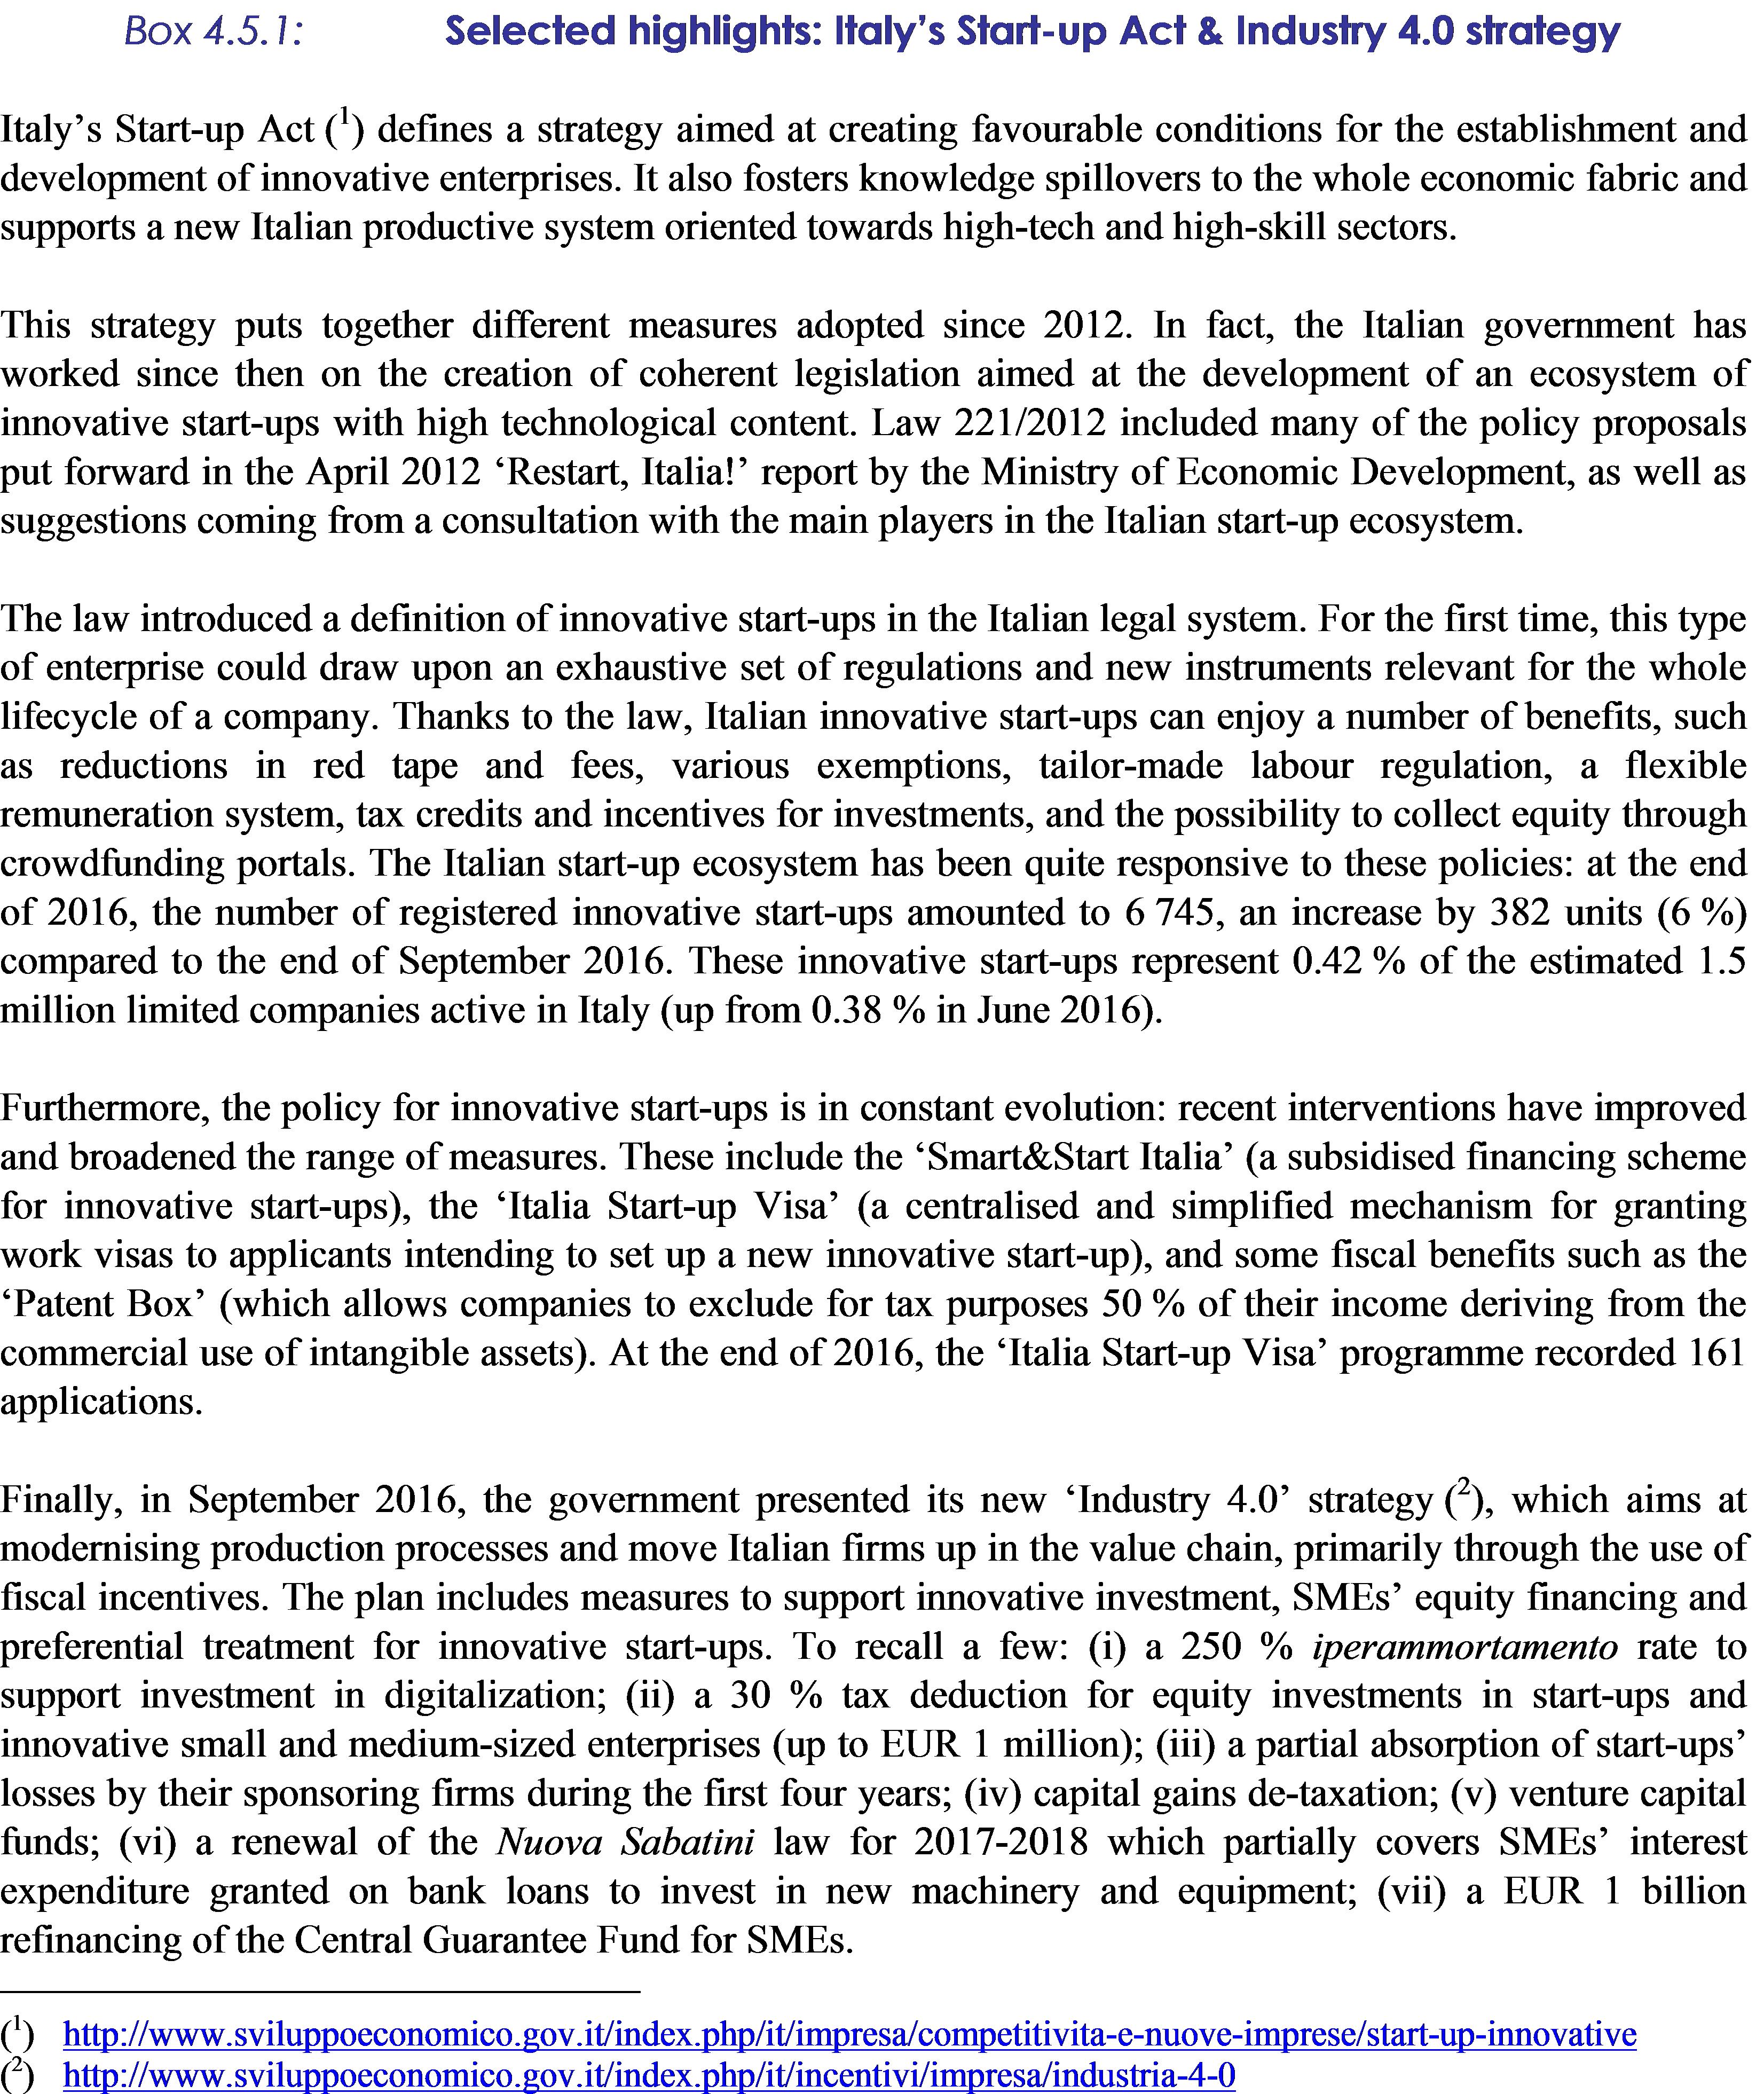
4.5.1.Selected highlights: Italy’s Start-up Act & Industry 4.0 strategy56
Executive summary
This report assesses Italy’s economy in the light of the European Commission’s Annual Growth Survey published on 16 November 2016. In the survey, the Commission calls on EU Member States to redouble their efforts on the three elements of the virtuous triangle of economic policy — boosting investment, pursuing structural reforms and ensuring responsible fiscal policies. In so doing, Member States should focus on enhancing social fairness in order to deliver more inclusive growth. At the same time, the Commission published the Alert Mechanism Report (AMR) that initiated the sixth round of the macroeconomic imbalance procedure. The in-depth review, which the 2017 AMR concluded should be undertaken for the Italian economy, is presented in this report.
A moderate recovery continued in 2016. Real GDP is expected to have grown by 0.9 % in 2016 after 0.7 % in 2015 (and growth is set to remain around 1 % in 2017-2018). However, the projected recovery is set to remain more moderate than in the euro area. Global demand dynamics are expected to lead to stronger export growth albeit external competitiveness is not yet improving. In the banking sector, the high level of non-performing loans compounded by structurally low profitability weakens banks’ capacity to support investment and economic recovery. Headline HICP inflation is expected to accelerate to 1.4 % in 2017 and 1.3 % in 2018, from around zero in 2014-2016, mainly due to higher energy prices.
The labour market is improving gradually. Labour market conditions have been improving since 2014, with headcount employment growing by 0.8 % in 2015 and 1.2 % in 2016, thanks to labour market reforms, the abolition of regional taxes on permanent employment, and temporary tax incentives for new permanent hires. Employment is expected to increase further in 2017-2018, albeit at a more moderate pace. Labour market participation is also increasing. The higher activity rate supports growth prospects in the medium term, but in the short term it entails a higher unemployment rate, which is set to remain above 11 % in 2017-2018 given the modest recovery.
However, longstanding structural weaknesses and the legacy of the crisis continue to weigh on the economic recovery. Italy’s real GDP growth was close to zero over the last 15 years, as against average annual growth of around 1.2 % in the rest of the euro area, as productivity dynamics diverged. Due to the crisis, the public debt ratio grew to around 133 % of GDP in 2016 from the trough of around 100 % in 2007. Traditional regional divides strengthened while long-term and youth unemployment increased sharply, with possible permanent effects on growth. The at-risk-of-poverty-or-social-exclusion rate rose, with children and people with a migrant background particularly affected. Increasing income inequality is above the EU average.
Overall, Italy made some progress in addressing the 2016 country-specific recommendations. Substantial progress was made in reforming the budgetary process and ensuring that the spending review becomes an integral part of it. The reform remains to be fully implemented. Some progress was made to shift taxation away from productive factors and to implement civil justice reforms. In the banking sector, some progress was made with regard to improving corporate governance and the reform of the insolvency and debt collection framework. In the labour market, some progress was achieved regarding the implementation of the reform of active labour market policies and a reform to enhance anti-poverty measures and rationalise social spending. The full impact of these reforms may materialise only over time but early signs are positive. Despite this progress, the reform momentum has slowed down since mid-2016 and, in some key areas, reforms are still pending. In particular, limited progress was made in implementing the privatisation programme, reducing tax expenditures in number and scope, reforming the cadastral system and improving tax compliance. Similarly, limited progress was achieved in implementing the public administration reform, addressing non-performing loans in the banking sector, facilitating the take-up of work by second earners and addressing restrictions on competition. No progress was made regarding the reform of the statute of limitations and the adoption of the 2015 annual competition law.
Regarding progress in reaching the national targets under the Europe 2020 Strategy, Italy has already achieved its targets related to renewable energy, energy efficiency and early school leaving, and appears on track to meet those on greenhouse gas emissions. Some progress was also made towards achieving the tertiary education target. Conversely, progress is less visible on the employment rate, R&D investment and poverty and social exclusion targets.
The main findings of the in-depth review contained in this country report, and the related policy challenges, are as follows:
Productivity growth remains weak, slowing the correction of Italy’s macroeconomic imbalances. Some steps were taken to improve the efficient allocation of resources in the economy. However, productivity developments remain sluggish, as total factor productivity is stagnant and investment has not yet recovered after the sharp fall recorded during the crisis.
High public debt remains a major source of vulnerability for Italy. Public debt is forecast to broadly stabilise at around 133 % of GDP in 2016-2018. Despite a deteriorating structural primary surplus, refinancing risks seem limited in the short term thanks to the ECB’s liquidity injection and Italy’s improved external position. Medium-term sustainability risks are high as the structural primary surplus is forecast at only 1.3 % of GDP in 2018, based on a no-policy-change assumption. As a result, risks may emerge when the current accommodative monetary policy is phased out and interest rates start increasing, unless growth-friendly fiscal consolidation measures are adopted and bold structural reforms are implemented.
Despite recent gains, the competitiveness gap remains. The depreciation of the euro supported the stabilisation of Italy’s export performance in recent years, together with contained increases in producer prices and unit labour costs. However, sluggish labour productivity and the low-inflation environment make it more difficult to close the cost/price competitiveness gap vis-à-vis trade partners, in spite of continued wage moderation.
Non-performing loans hamper banks’ ability to support investment. Confidence in the Italian banking sector as a whole declined considerably, in spite of significant bank-by-bank differences. Following rapid growth during the crisis, the sector’s gross stock of non-performing loans stabilised only recently, at around EUR 329 billion (16.5 % of customer loans). The need for further loan-loss provisions, low interest rate margins and rather high operation costs put strain on banks’ profitability and ability to raise fresh capital. Therefore, the Italian banking sector may face difficulties in meeting any future increase in credit demand. Financing conditions remain tight, particularly for small and mediumsized enterprises and the construction sector.
Despite the gradual improvement of the labour market, long-term and youth unemployment remain high. The long-term unemployment rate was around 7 % in 2016. The youth unemployment rate is around 40 % and more than 1.2 million young people are not in education, employment or training. The implementation of the active labour market policies reform, including the reinforcement of public employment services, is still at an early stage. Firm-level bargaining is not broadly used, hampering the efficient allocation of resources and the responsiveness of wages to economic conditions.
Given its systemic importance, the Italian economy is a source of potential spillovers to the rest of the euro area. At the same time, strong external demand from euro-area trade partners and a more supportive inflation environment are paramount to Italy’s recovery, debt-to-GDP reduction efforts and recovering competitiveness.
Other key economic issues analysed in this report that point to particular challenges are as follows:
The crisis hit investment dynamics. Investment in Italy suffered a sharper fall than in most Member States. The decline was broad-based, but particularly strong in non-residential investment and services. The recovery of investment is limited by the current weak demand, the general uncertainty surrounding the economy, reduced profit margins and still-tight financing conditions in particular for SMEs and some sectors. A stronger recovery, including in foreign direct investment, is hampered by structural weaknesses, including inefficiencies in the public administration, justice system and business environment and the limited development of capital markets. Most of these barriers are targeted by ongoing reforms.
The potential of female labour market participation remains largely underutilised. The employment rate of women is still 13.7 percentage points below the EU average. Access to affordable childcare remains limited with wide regional disparities, paternity leave is among the lowest in EU and the effectiveness of cash allowances for childcare has not been assessed. The tax system continues to discourage second earners from participating in the labour force.
Economic growth and efficiency are hindered by the tax system. Despite a recent modest reduction, the tax burden on production factors remains among the highest in the EU. Low tax compliance and the complex tax code increase the burden on compliant firms and households, although measures were taken recently to tackle these problems. The long-awaited revisions of tax expenditures and cadastral values were further postponed.
Education reform is ongoing but tertiary education remains largely underfunded and participation in adult learning and apprenticeships is low. The 2015 reform, if properly and swiftly implemented, is expected to improve school outcomes. In particular, strengthened apprenticeships and work-based learning aim to raise the labour-market relevance of education. However, participation in adult learning remains a persistent concern, in particular for those needing it most. In spite of recent partial measures, the higher education system suffers from significant underinvestment.
Italy’s R&D and innovation performance is below EU average. R&D investment in Italy, in particular by the private sector, continues to be considerably lower than the EU average. It is held back by a range of structural factors like the lack of high-skilled people, limited cooperation between academia and business and unfavourable framework conditions. Some new measures were introduced to strengthen Italy’s innovation track record, notably the ‘Industry 4.0’ strategy.
New social policies have been put forward to respond to the rising poverty rate. The rate of people at risk of poverty or social exclusion is well above the EU average, and is particularly high for children, temporary workers and individuals with a migrant background. To address povertyrelated risks, the 2016 ‘Support for Active Inclusion’ was extended to the whole territory and a draft law for the ‘Inclusion Income’ scheme was presented to Parliament and is to be adopted and implemented. It is unclear whether the financial resources will be sufficient to address Italy’s poverty challenge. The 2016 peak inflow of asylum seekers is one of the highest in Europe and creates considerable social and budgetary challenges for the reception and integration of those receiving protection and for the reception and return of those not receiving protection, a comparatively large share.
Barriers to competition remain significant, and the business environment remains challenging. Significant barriers to competition remain in important sectors, including professional services, local public services, concessions and the transport sector. Despite progress achieved in recent years, the conditions for doing business remain more difficult than in peer economies.
The public sector is being reformed to tackle longstanding inefficiencies. The remaining inefficiencies continue to slow down the implementation of reforms, deter investment, and create opportunities for rent-seeking. An important reform of the public administration is being implemented. However, the Constitutional Court has recently declared unconstitutional the procedure envisaged for important implementing acts (including those on human resources management, state-owned enterprises and local public services). Improvements are expected in the field of public procurement thanks to the adoption of a new code. Despite recent reforms of the civil justice system, the length of proceedings and the very high case backlog remain sizeable challenges. Corruption is still a major problem, and the statute of limitations and the fragmented prevention framework continue to hinder its reduction.
1.
Economic situation and outlook
Real GDP growth, drivers and risks
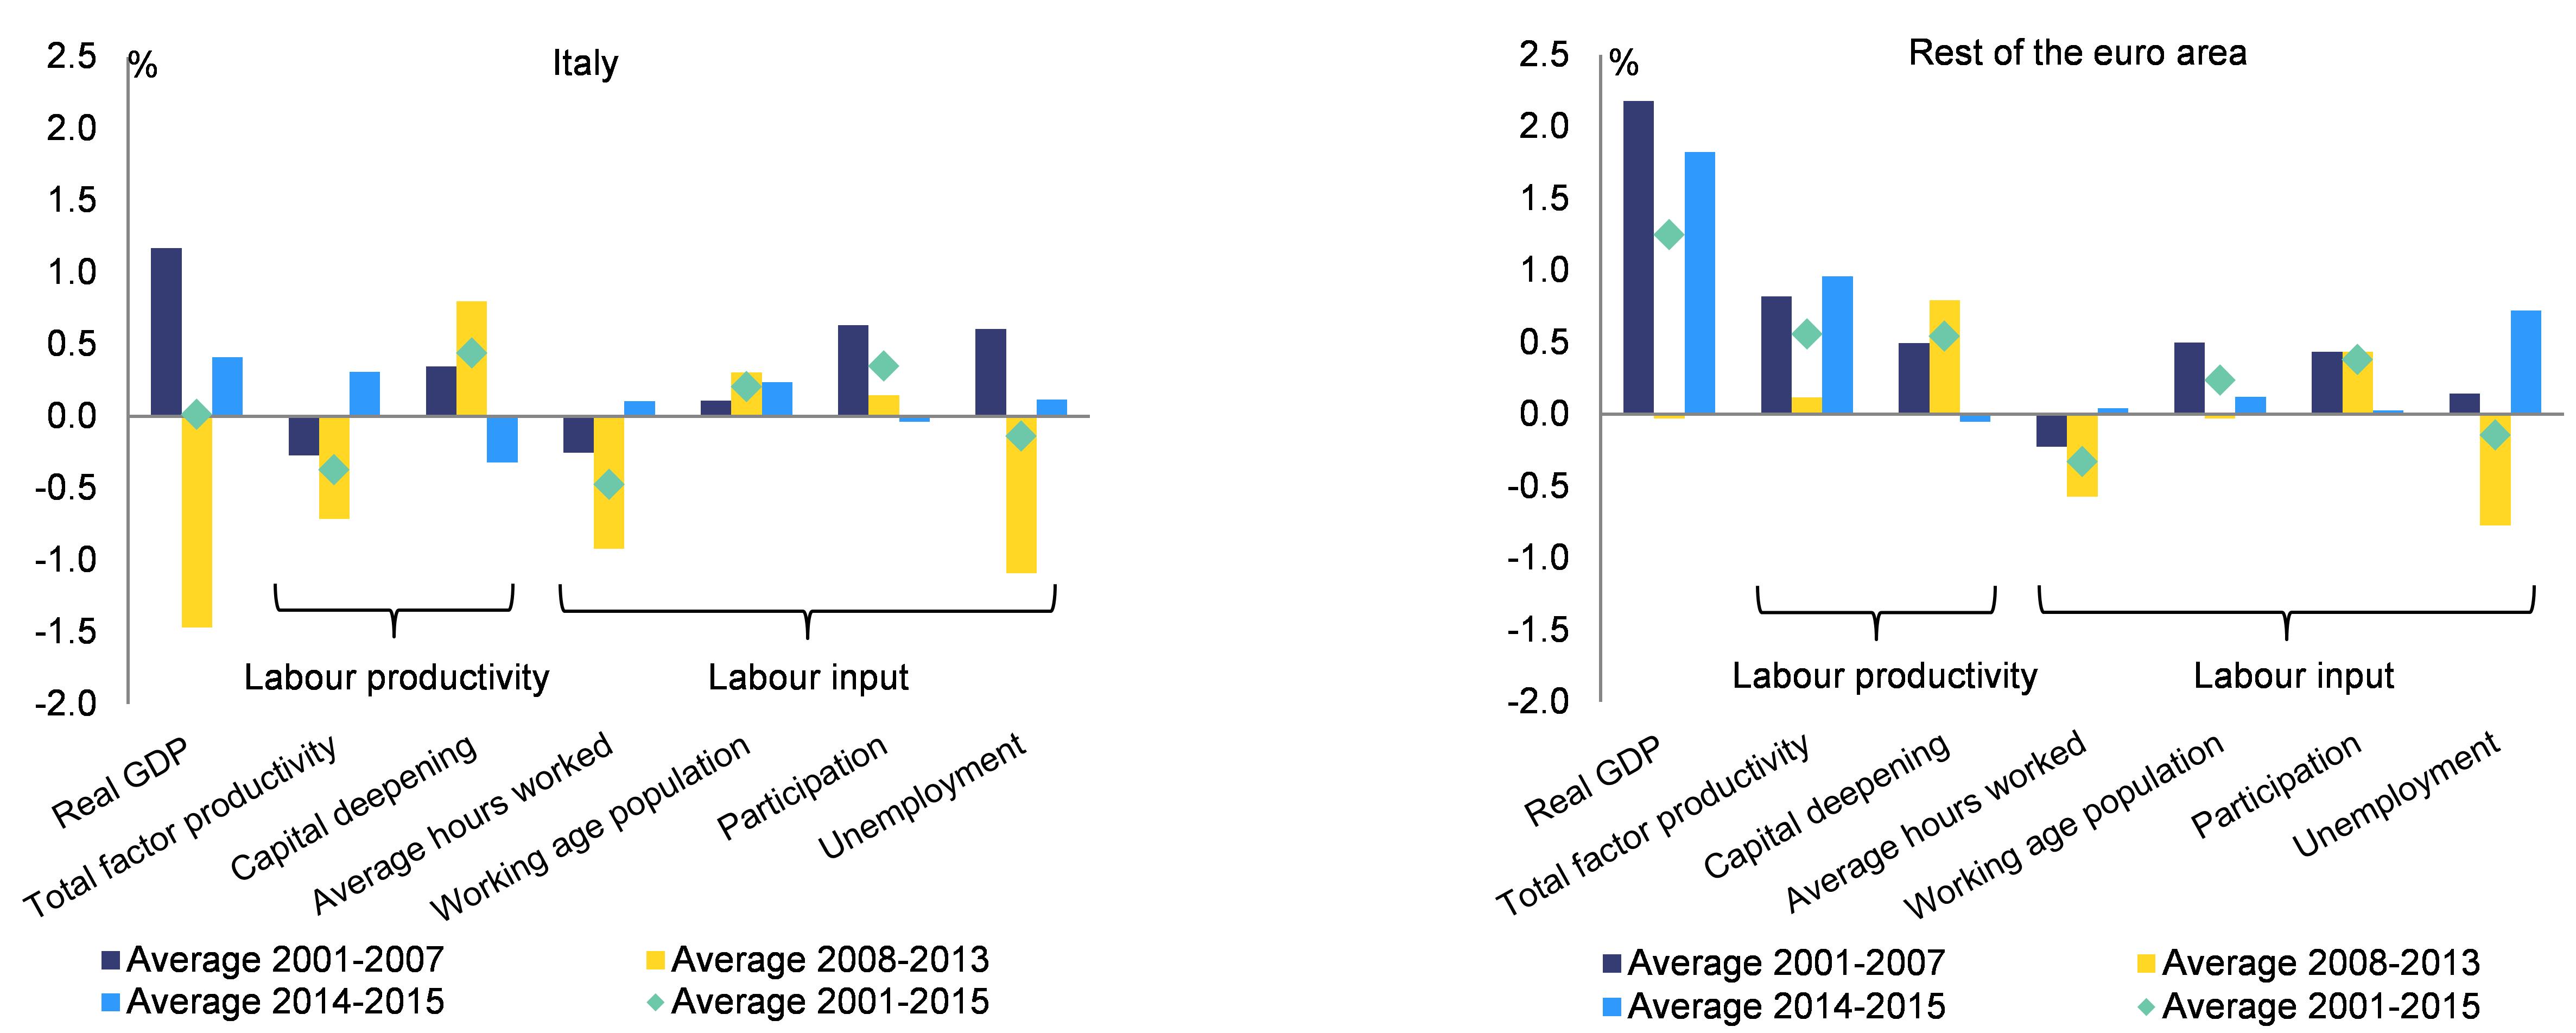
Weak productivity dynamics largely explain slower GDP growth in Italy compared with the rest of the euro area. Over the period 2001-2015, Italy’s average real GDP growth was zero, 1.2 percentage points below the average of the rest of the euro area. Low growth in total factor productivity (TFP) compared with euro area peers is the main factor explaining the observed lower growth rates (Graph 1.1). Italy’s real GDP growth recovered only modestly in 2014 and 2015 (0.1 % and 0.7 % respectively), while growth in the rest of the euro area was significantly more dynamic (1.4 % and 2.3 % respectively). Total factor productivity growth turned slightly positive in Italy, possibly indicating a somewhat better allocation of factors of production, though still outpaced by the rest of the euro area. In addition, capital deepening developments were more negative in Italy as the net capital stock contracted due to the very low levels of investment.
Potential output growth turned negative after 2008. The significantly lower capital accumulation, higher unemployment rates and negative TFP trends contributed to the decline in potential growth (0.4 % on average in 2009-2016 from 1.1 % in 1999-2008; based on the Commission forecast and the commonly agreed methodology). Potential growth is estimated to turn slightly positive in 2017-2018.
A tepid recovery started in 2014. The gradual recovery of real GDP is supported by the ECB’s accommodative monetary policy and a more accommodative fiscal stance. The Commission forecast expects the Italian economy to have expanded by 0.9 % in 2016 (European Commission, 2017a). Exports, which drove the recovery in 2014-2015, slowed substantially in recent quarters, mainly due to the marked slowdown in extra-EU trade. Their contribution to the current recovery is thus more limited than in previous upswings and economic growth became more reliant on domestic demand developments. In particular, low energy prices and sustained employment growth underpin the increase in private consumption.
|
Graph 1.1:Growth accounting for Italy, by period
|
|
|
|
Source: European Commission
|
Looking ahead, the recovery is expected to remain modest. The Commission forecast projects the recovery to continue at a modest pace in 2017 and 2018, underpinned by an accommodative monetary policy and a still-supportive fiscal stance. However, following the rejection of the constitutional reform in a referendum on 4 December 2016, political uncertainty remains high. Moreover, in a challenging context of low nominal growth, low interest margins, regulatory changes, high non-performing loan (NPL) stocks and structurally low profitability (see Sections 3 and 4.2), Italian banks’ credit supply could be held back, while credit demand is also still weak. Small and medium-sized enterprises (SMEs), which tend to be more reliant on bank credit, might thus be constrained in expanding their production capacity when demand prospects improve. All these aspects could thus hold back a stronger recovery in investment. Nevertheless, larger and healthier firms have better access to credit (see ‘Financing conditions’ in this section).
|
Graph 1.2:Real GDP and components
|
|
|
|
Source: European Commission
|
|
Graph 1.3:Net capital stock
|
|
|
|
Source: Istat
|
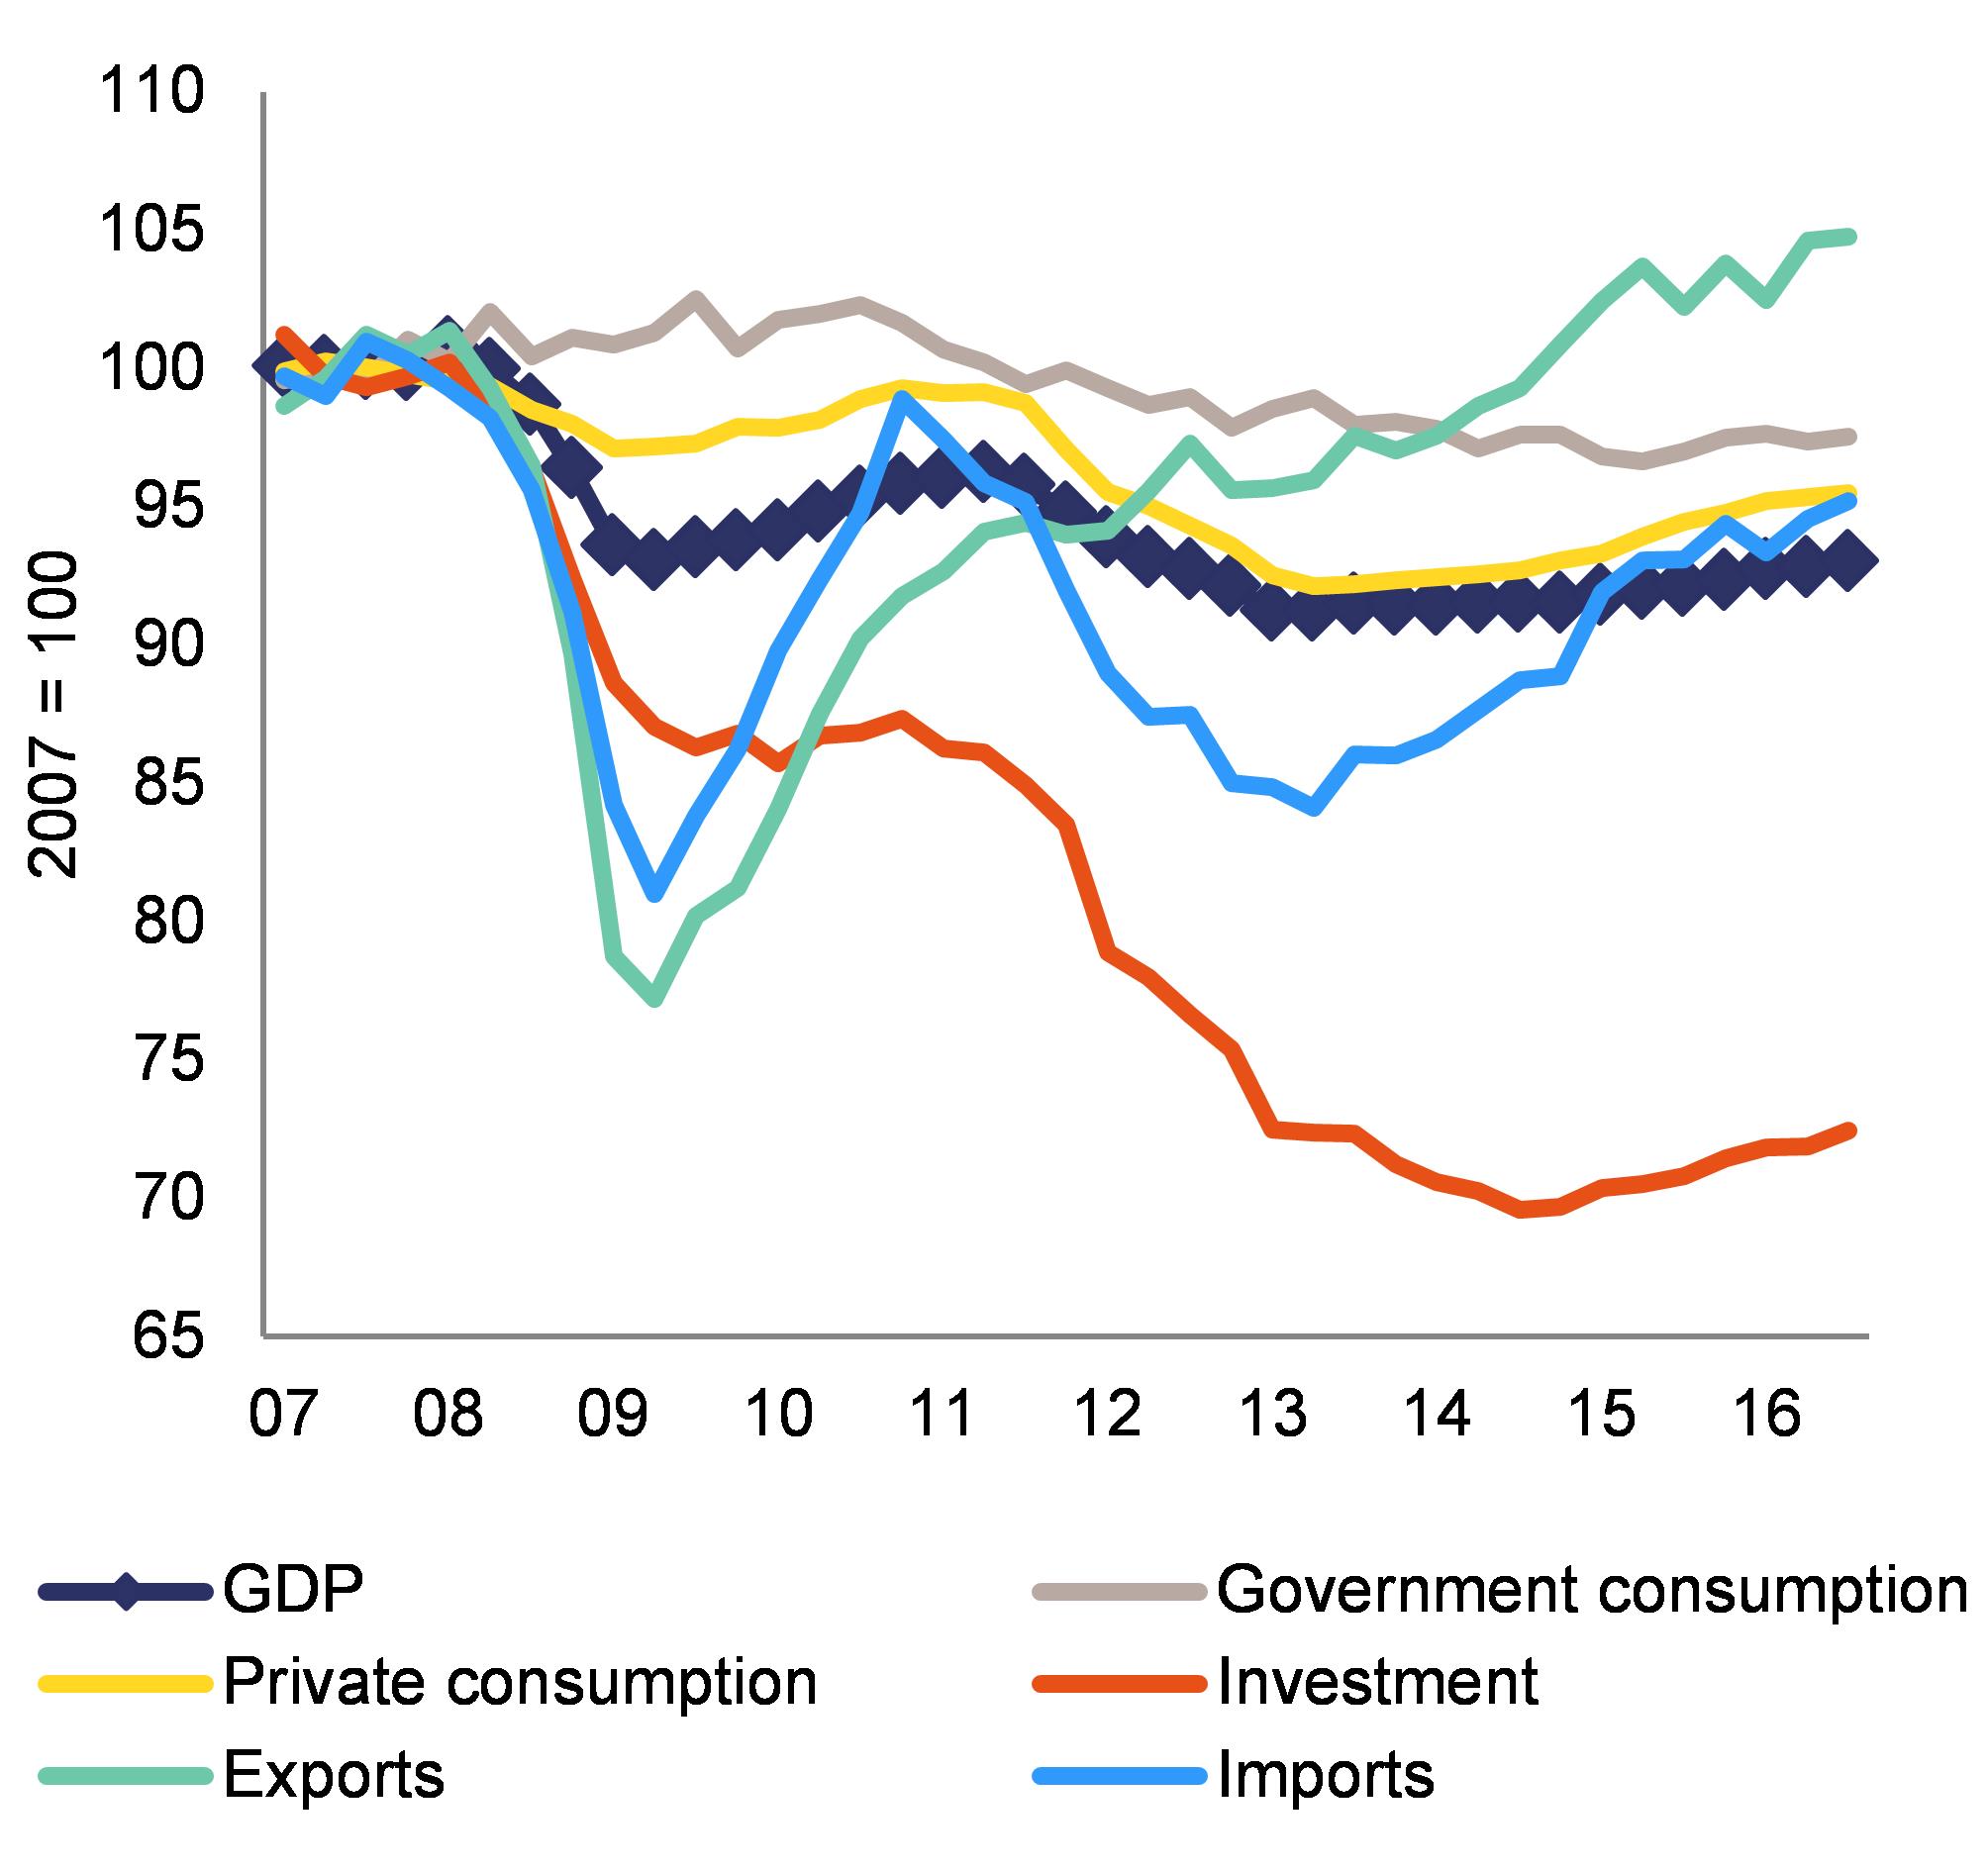
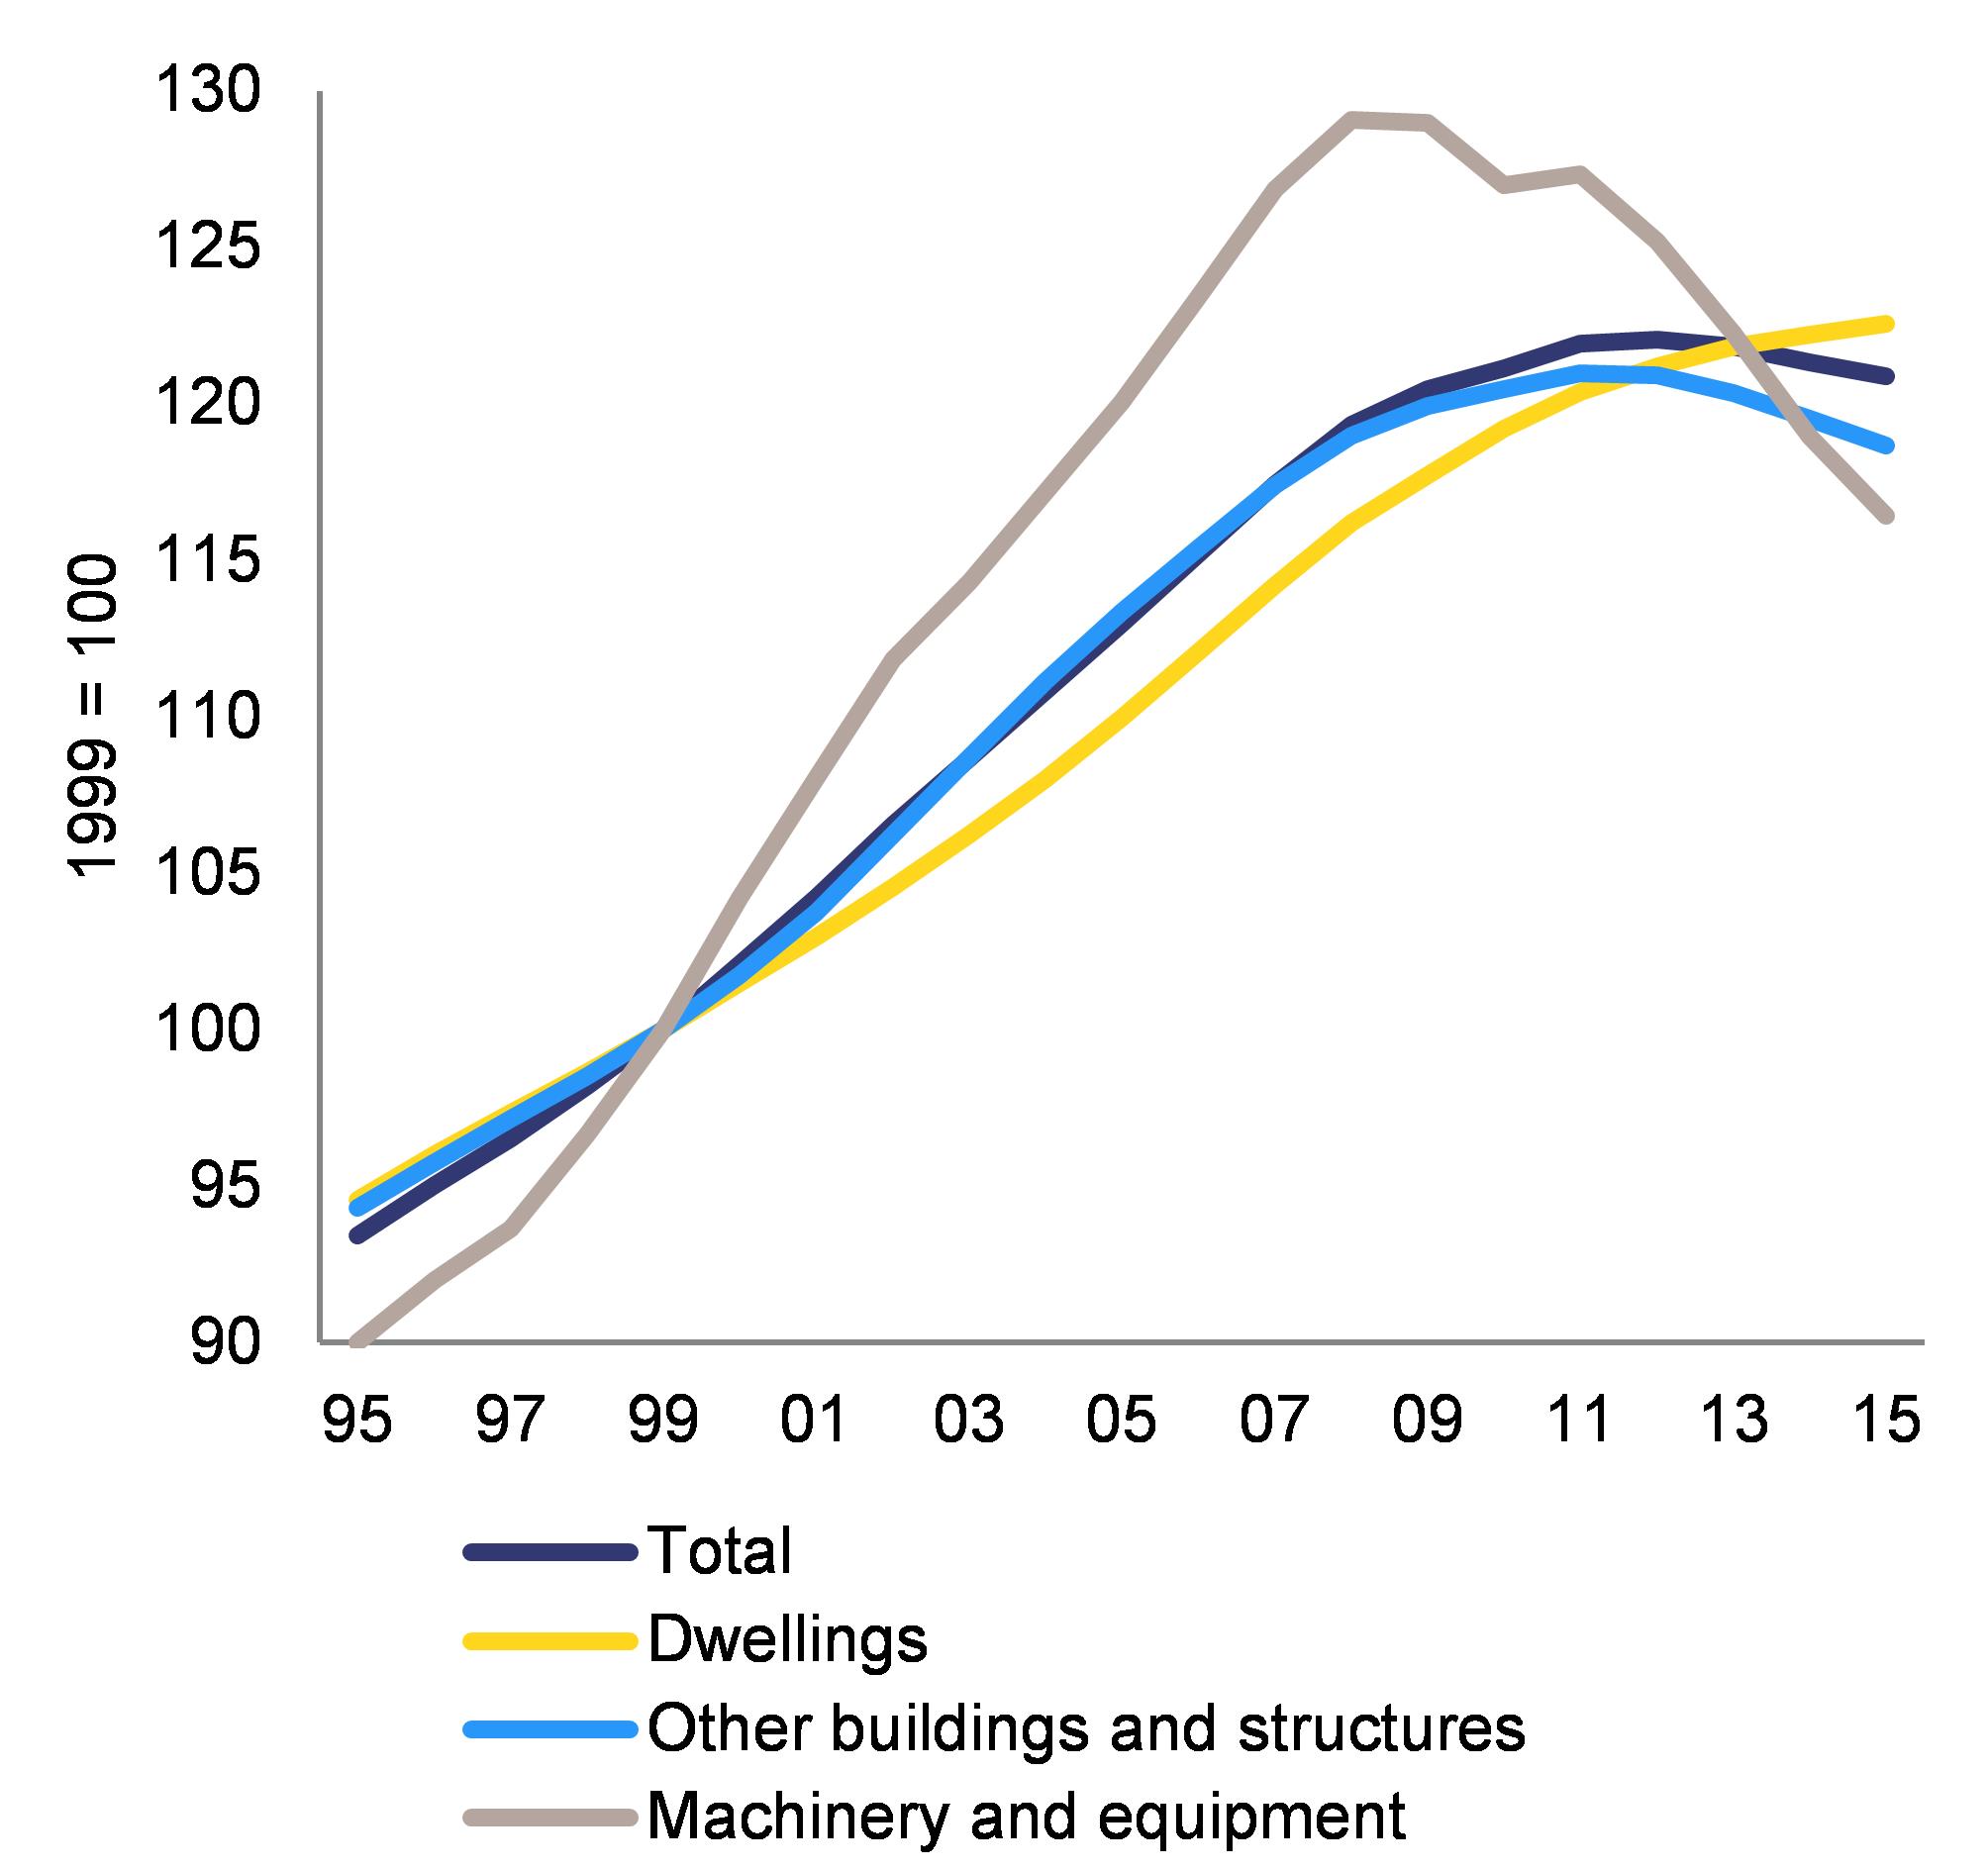
Investment dynamics remain subdued. Overall sluggish demand, still tight financial conditions, in particular for small firms, and firms' reduced profitability hamper a faster recovery in investment (see Section 4.4). The current improvement in investment is driven mainly by equipment. However, investment remains nearly 30 percentage points below its pre-crisis level (Graph 1.2) and its growth is still too moderate to halt the ongoing depletion of the capital stock, especially for machinery and equipment that undergo quicker amortisation and obsolescence (Graph 1.3).
|
Graph 1.4:Real GDP and domestic demand components at macro-regional level
|
|
|
|
Source: Istat
|
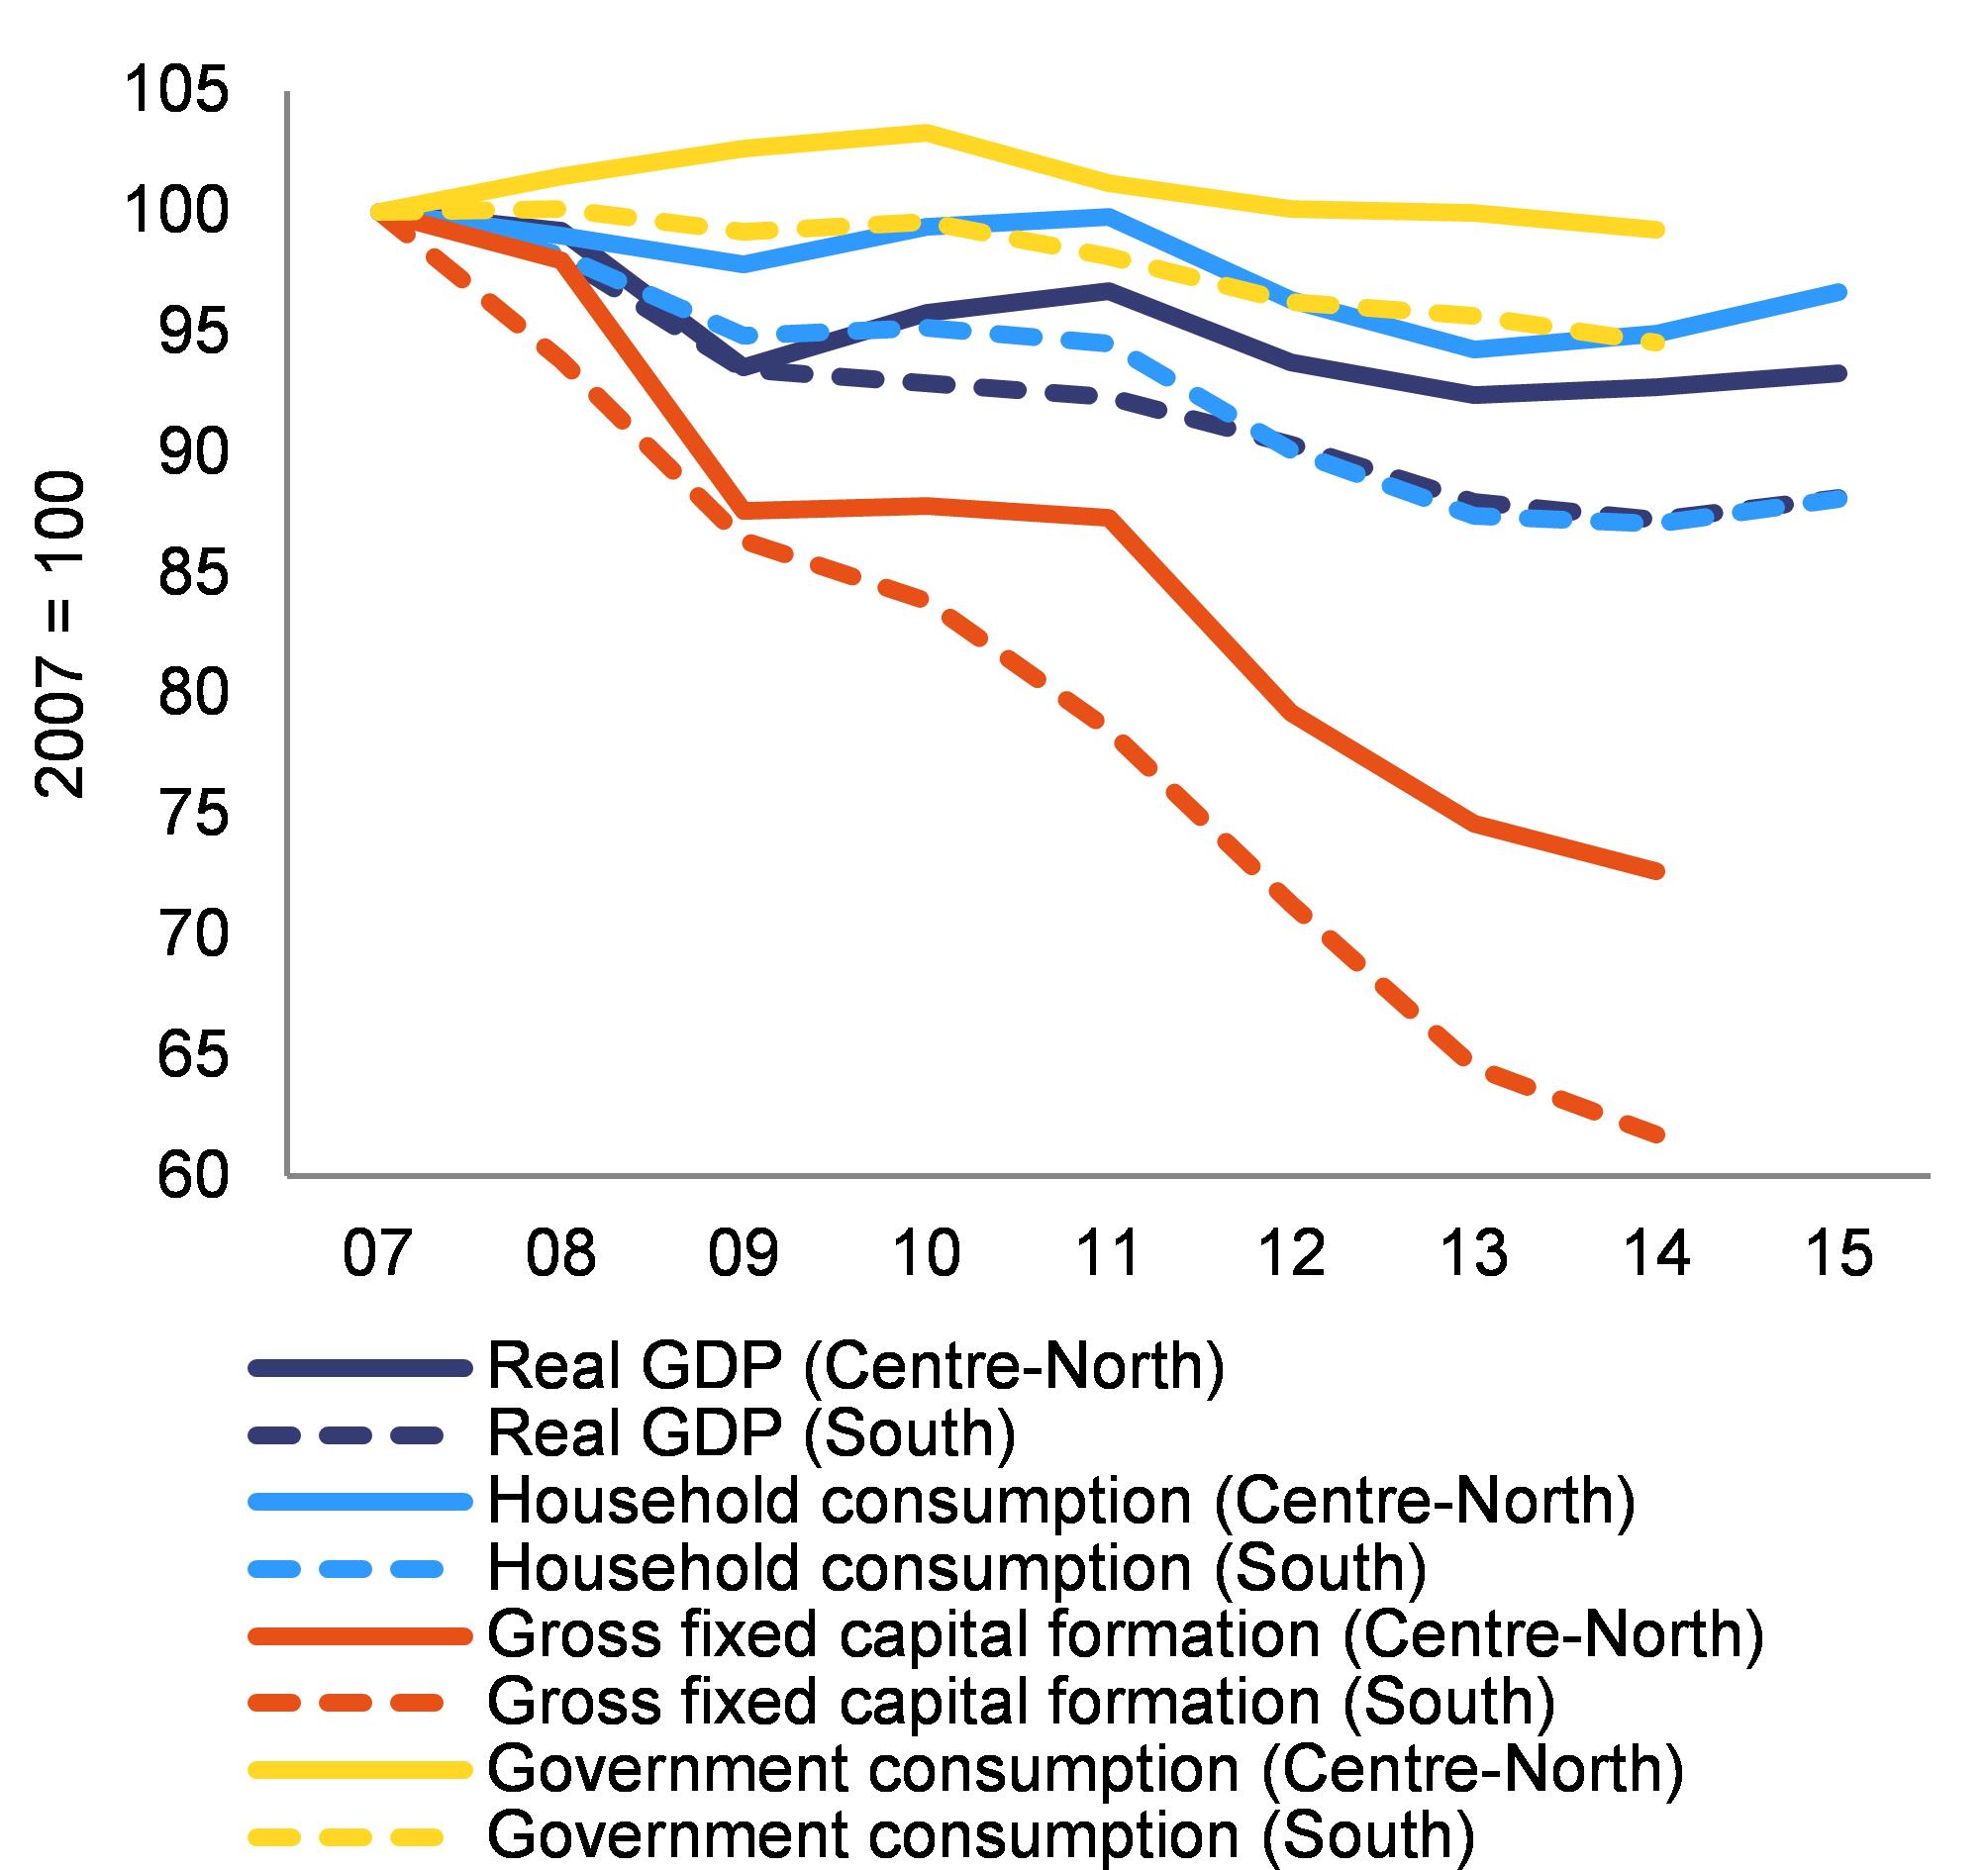
The crisis hit southern regions particularly hard and regional disparities persist on many fronts. Between 2007 and 2014, real GDP in southern regions fell by 1.9 % on average per year, whereas the decline in the centre-north was 1.1 % (Graph 1.4). (
) Investment in southern regions dropped by more than 6.5 % per year and in 2014 its level was around 38 % lower than in 2007 (as compared with 27 % in the centre-north). In 2015, the recovery in real GDP was slightly more dynamic in southern regions than in the centre-north (+1.1 % as against +0.6 %), despite household consumption increasing less. The tightening of financing conditions particularly affected firms in the south, leading to a more significant deterioration of loan quality. In Q2 2016, around 40 % of loans to firms in the south were non-performing, compared to less than 30 % in the centre-north. In 2015, compensation per employee in the south was 18 percentage points lower than in the centre-north, but the gap in labour productivity is even larger (23 percentage points). This reflects a long-term misalignment between wage and productivity dynamics in the south compared to the centre-north (European Commission, 2015a, p. 75). GDP-per-capita divergences are substantial due to lower labour market participation and the higher unemployment rate in the south (see ‘Labour market situation’ in this section). These developments point to a lack of resilience and adjustment capacity, particularly in southern regions.
Price and wage developments* (
)
Wage dynamics remain moderate. After slightly exceeding 1 % per year in 2014 and 2015, contractual wage growth slowed in 2016 (to around 0.5 %). Wages in the public sector have been frozen since 2011, but will increase slightly in 2017 following an agreement between the government and the unions. In the private sector, wage developments are expected to remain moderate in 2017 and 2018 following recent agreements in the metal and other sectors. These agreements provide for minor wage increases, de facto discounting the previous bargaining rounds which were based on excessively high inflation benchmarks. Actual wage developments continue to display a negative drift compared with contractual wage agreements, as the use of overtime and bonuses continue to be rather limited. (
) Furthermore, the tax incentives for new permanent hires in 2015 and 2016 curbed social contributions and thus overall compensation per hour worked (-0.4 % year-on-year in the first three quarters of 2016).
Unit labour cost dynamics slowed significantly in recent years despite negative labour productivity growth. Since 2010, nominal unit labour costs have slowed down in Italy and in 2014-2016 they increased by less than 0.4 % per year on average (as compared to 2.3 % in 1999-2013). These developments helped to reduce slightly the cost competitiveness problem of the Italian economy in recent years. In particular, the increase in compensation per hour worked is estimated to have fallen to only 0.2 % per year (from 2.6 % in 1999-2013) thanks to moderate wage developments after the double-dip recession and 3-year tax incentives for new permanent hires in 2015 and 2016. However, labour productivity was negative also due to historically low investment levels, which turned capital deepening negative (see Section 4.4). On top of persistently sluggish productivity, the adjustment process of the Italian economy is hindered by the low inflation environment, which makes it more difficult to recover cost and price competitiveness vis-à-vis trade partners. In the euro area in particular, nominal unit labour costs rose by only 0.6 % per year in 2014-2016 (as against 1.6 % in 1999-2013), as after the crisis the slowdown in labour productivity was more than offset by the marked slowdown in compensation per hour worked (to around 1 % per year, from 2.7 % in 1999-2013).
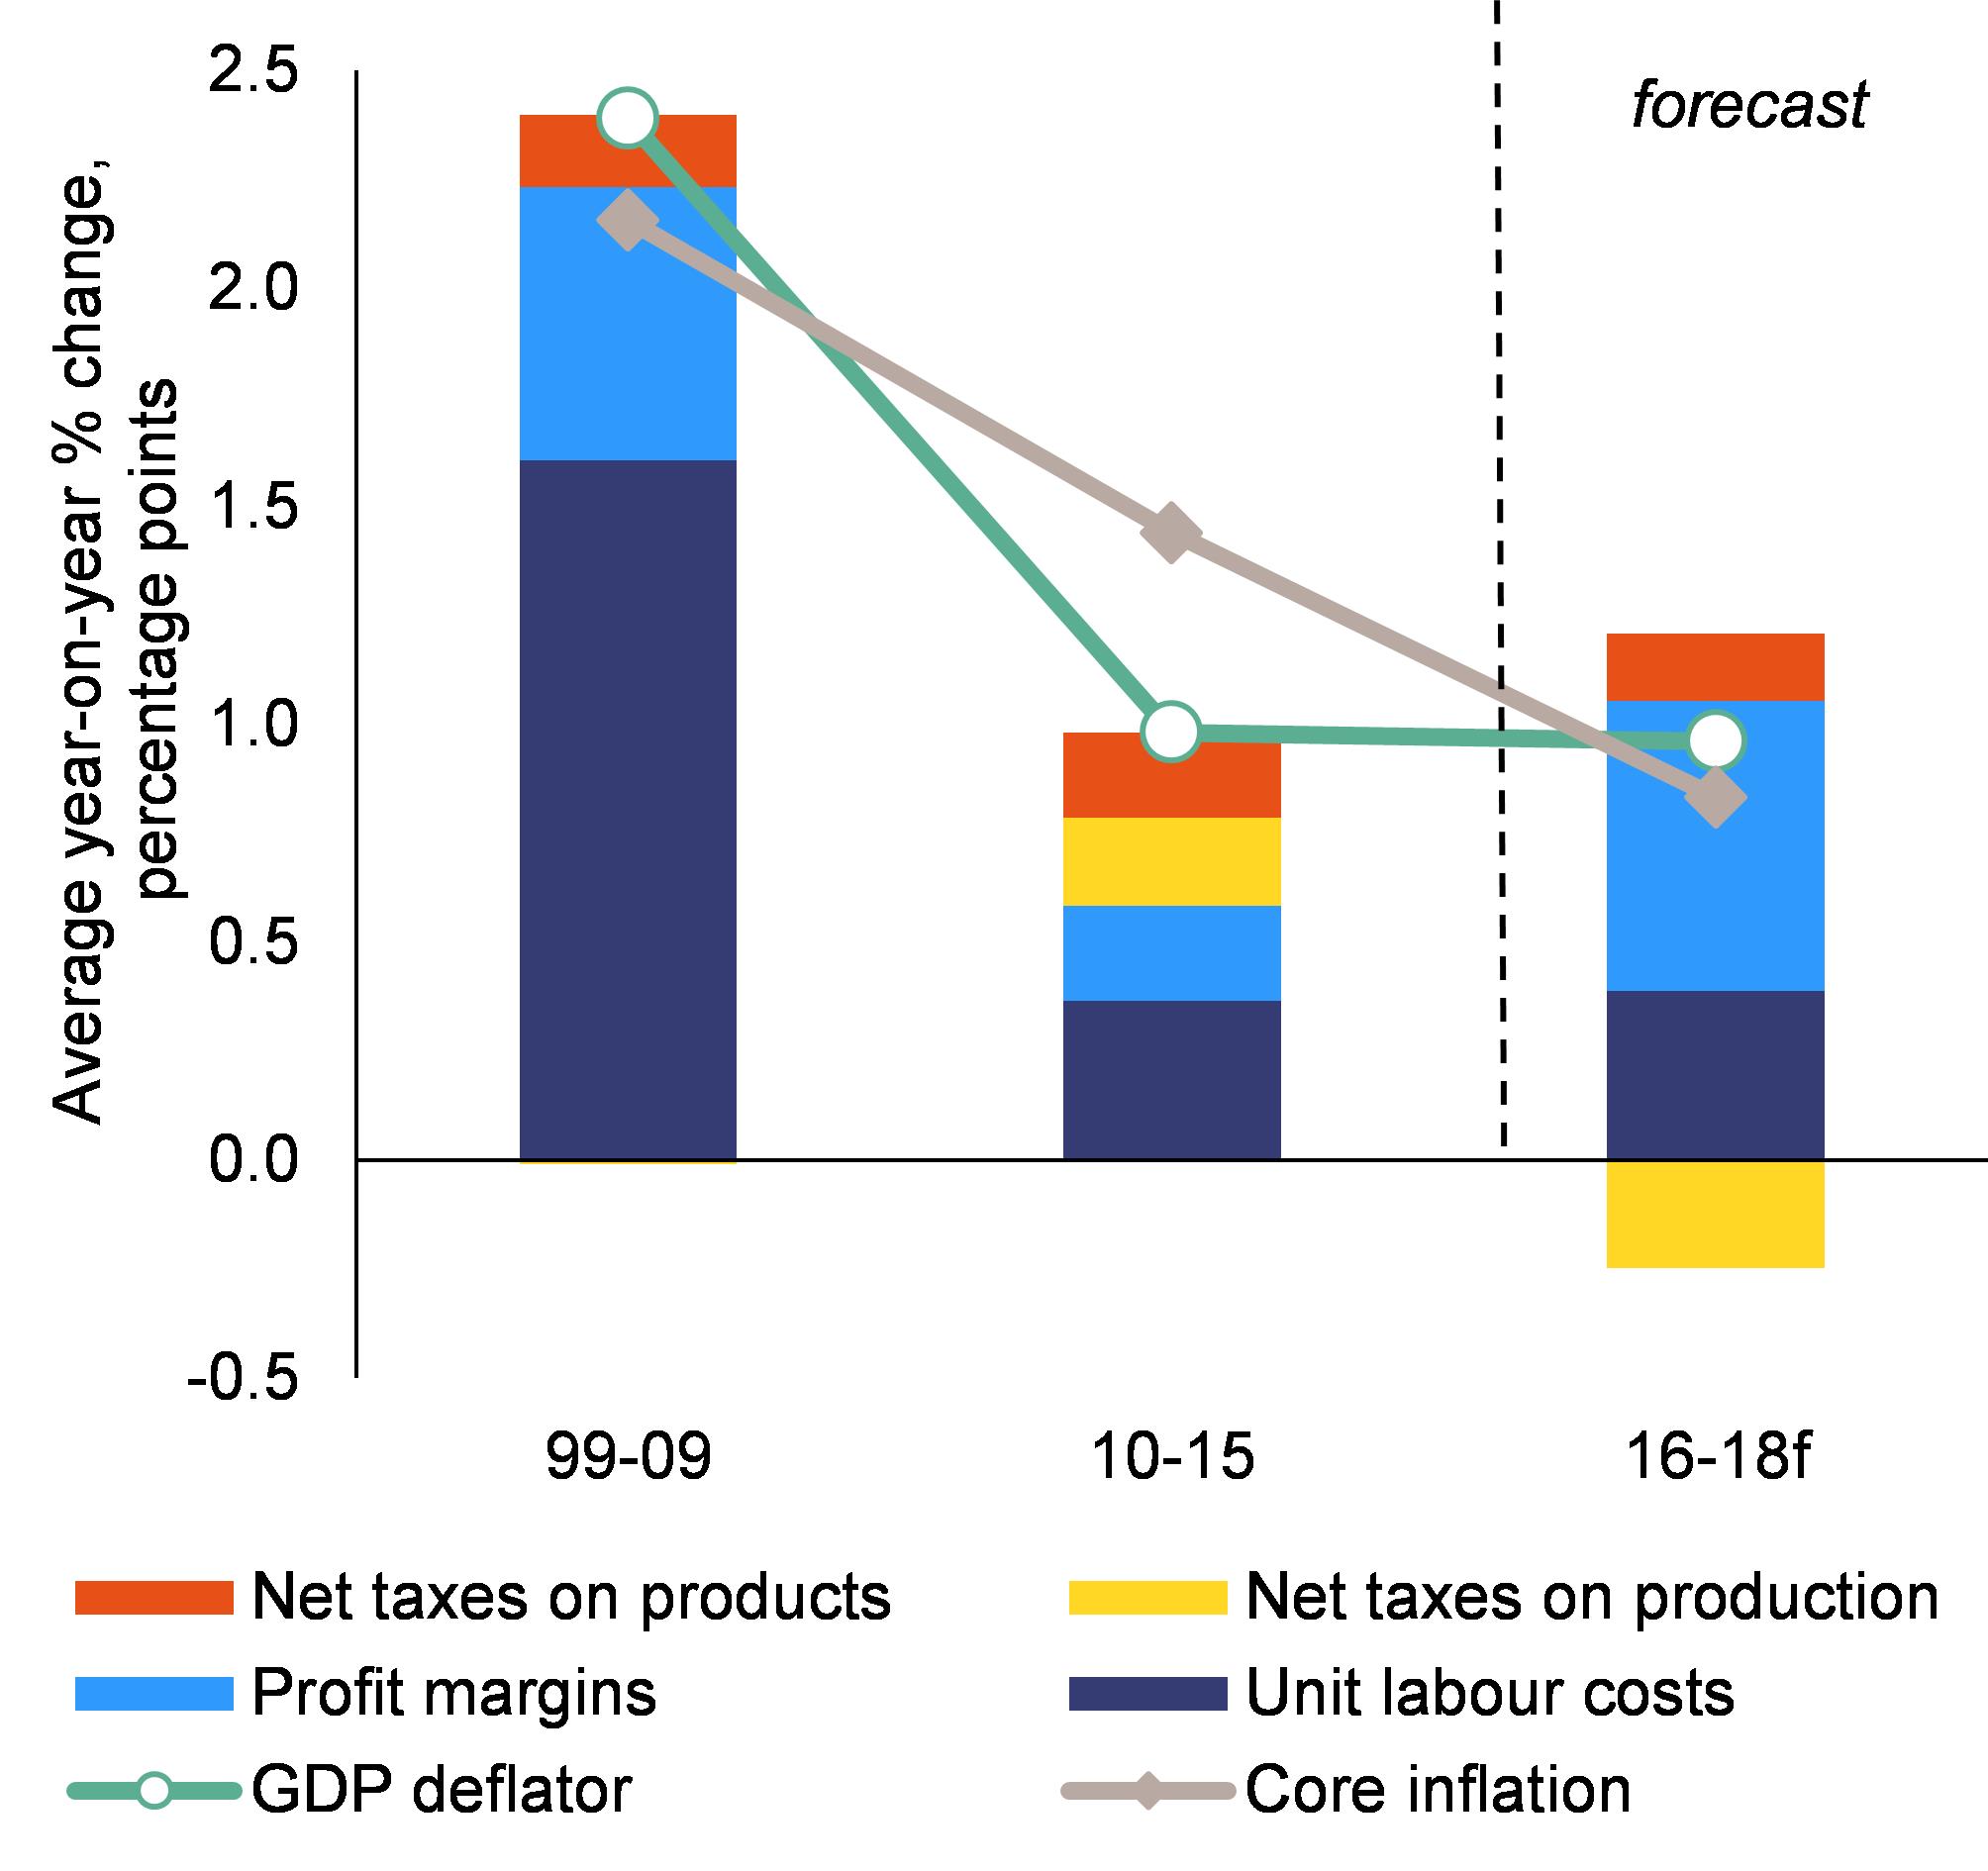
Moderate unit labour costs developments and sluggish demand point to subdued core inflation and GDP deflator growth. In 2016, headline HICP (
) inflation was close to zero for the third year in a row (i.e. -0.1 % in 2016, following +0.1 % and +0.2 % in 2015 and 2014 respectively). HICP core inflation (i.e. excluding energy and unprocessed food) remained slightly positive (+0.5 % in 2016, following +0.7 % in both 2014 and 2015). Higher energy prices are expected to lead to higher HICP inflation in 2017 and 2018 1.4 % and 1.3 % respectively in the Commission forecast, whereas core inflation is set to stay at around 1 % on average). The GDP deflator (
) showed a marked slowdown since 2010, driven by moderate increases in nominal unit labour costs (0.5 % on average in 2010-2015) and lower firm profit margins following the crisis (Graph 1.5) due to the overall sluggish demand. In 2016-2018, the Commission forecast projects the GDP deflator to average around 1 % thanks to still-slow unit labour costs developments (0.7 % on average) and lower taxes on production, while firms restore profit margins. (
)
|
Graph 1.5:GDP deflator growth and contributions
|
|
|
|
Source: European Commission
|
Labour market situation*
Labour market conditions are improving, supported by reforms and the reduction in the labour tax wedge. Employment growth started to recover in 2014 when the economy was still stagnating, and this trend continued in 2015 and 2016. The number of employed people in the fourth quarter of 2016 was over 620 000 higher than the trough in the third quarter of 2013. The number of employees increased even more, by around 680 000, of which 405 000 had permanent contracts. In addition, the use of Cassa Integrazione Guadagni schemes notably fell by around 64.5 % in three years. The number of worked hours peaked at more than 10.7 million in the third quarter of 2016, the highest value since the second quarter of 2012.
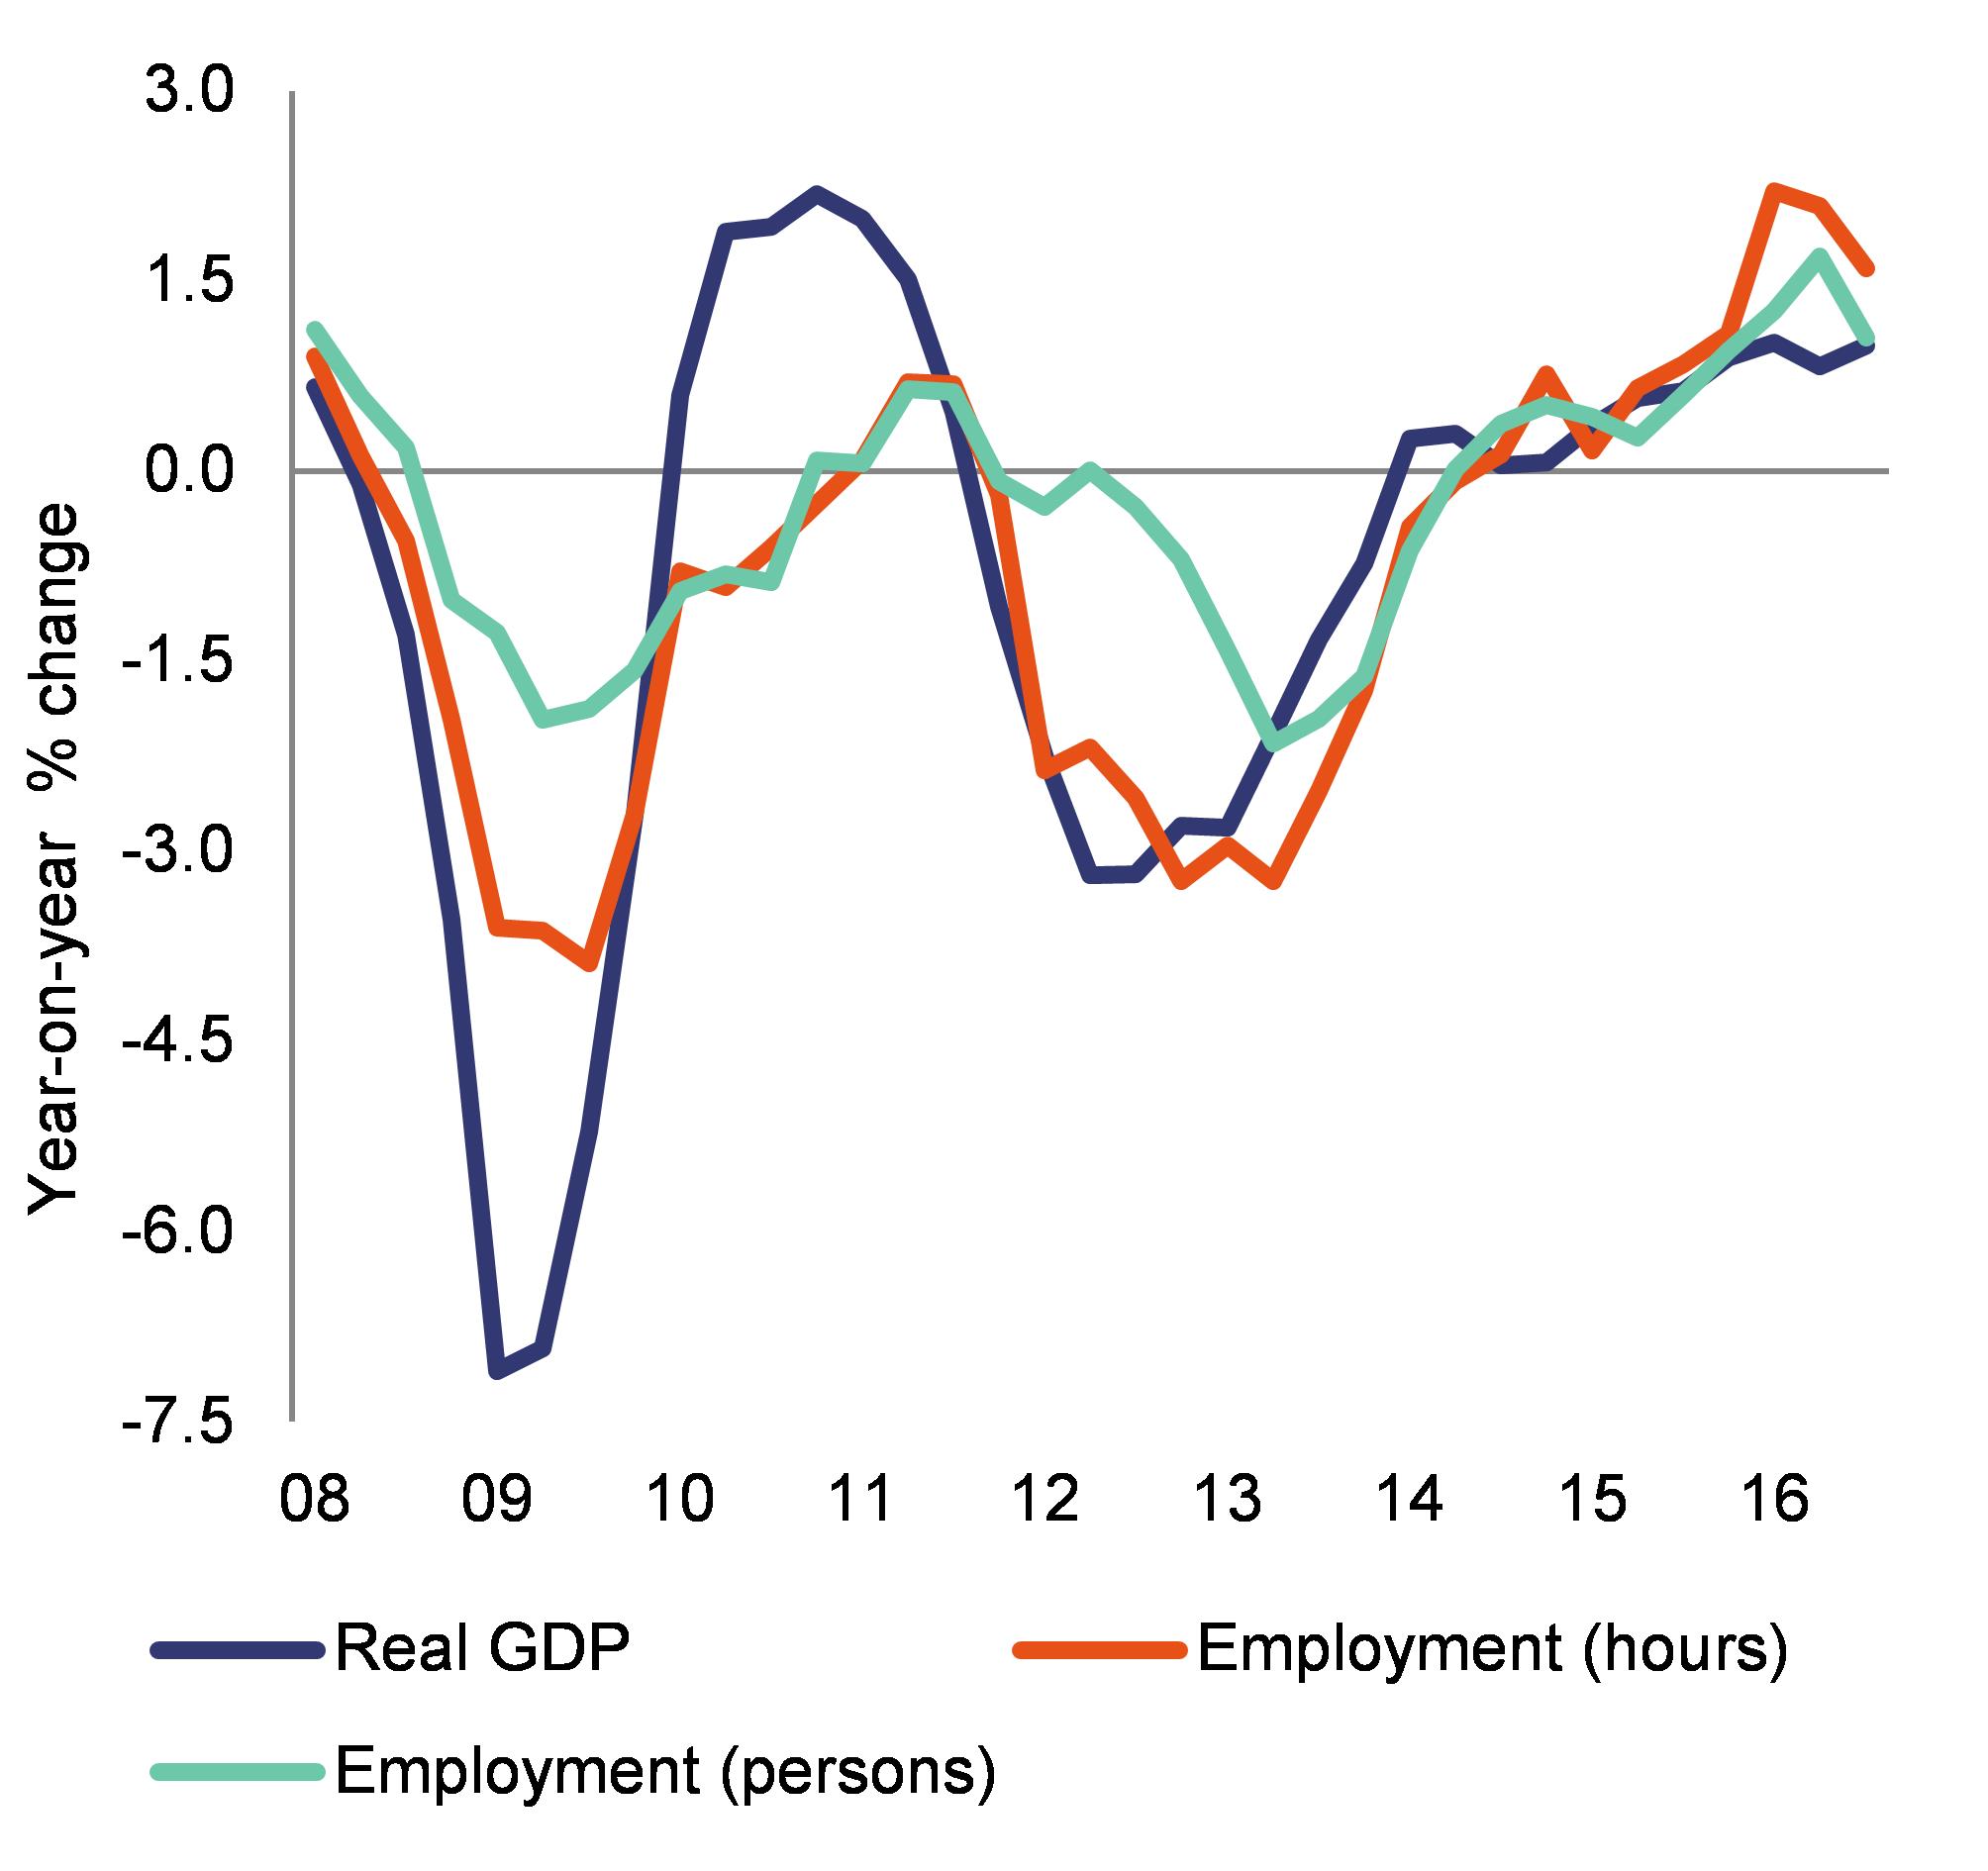
Employment growth has slightly outpaced real GDP growth in recent years. The higher elasticity of employment to GDP could be explained by tax incentives and other factors. In particular, following the crisis, when hours worked fell more than headcount employment (Graph 1.6), the share of part-time employment (including involuntary) has increased. These developments have yet to be reversed, so hours worked per employed person, while recovering, are still below the pre-crisis level. Furthermore, there might have been some substitution between labour and capital as factors of production. On the one hand, recent labour market reforms, wage moderation and the reduced tax wedge facilitated the use of labour, while on the other hand, tight financing conditions may have delayed gross fixed capital formation.
|
Graph 1.6:Real GDP and employment growth
|
|
|
|
Source: European Commission
|
Employment is increasing in private services, manufacturing and agriculture. Since mid-2014, employment has increased in private services and agriculture, while the recovery in manufacturing started mid-2015. In contrast, the construction sector still experiences large negative employment readings as the adjustment to lower production levels is still ongoing. Finally, after declining by almost 9 % over 2007-2015, public sector employment has broadly stabilised. In the first three quarters of 2016, overall employment (in persons, according to the national accounts definition) rose by 1.3 % year-on-year, with the positive contributions coming from private services (+2.4 %), manufacturing (+1.3 %) and agriculture (+4.2 %). In the same period, employment in construction continued to fall significantly (-4.5 %), while it declined marginally in public services (-0.1 %). Furthermore, also linked to the labour market reforms, employment increased only for employees (+2.0 %), while self-employment continued to shrink (-0.5 %).
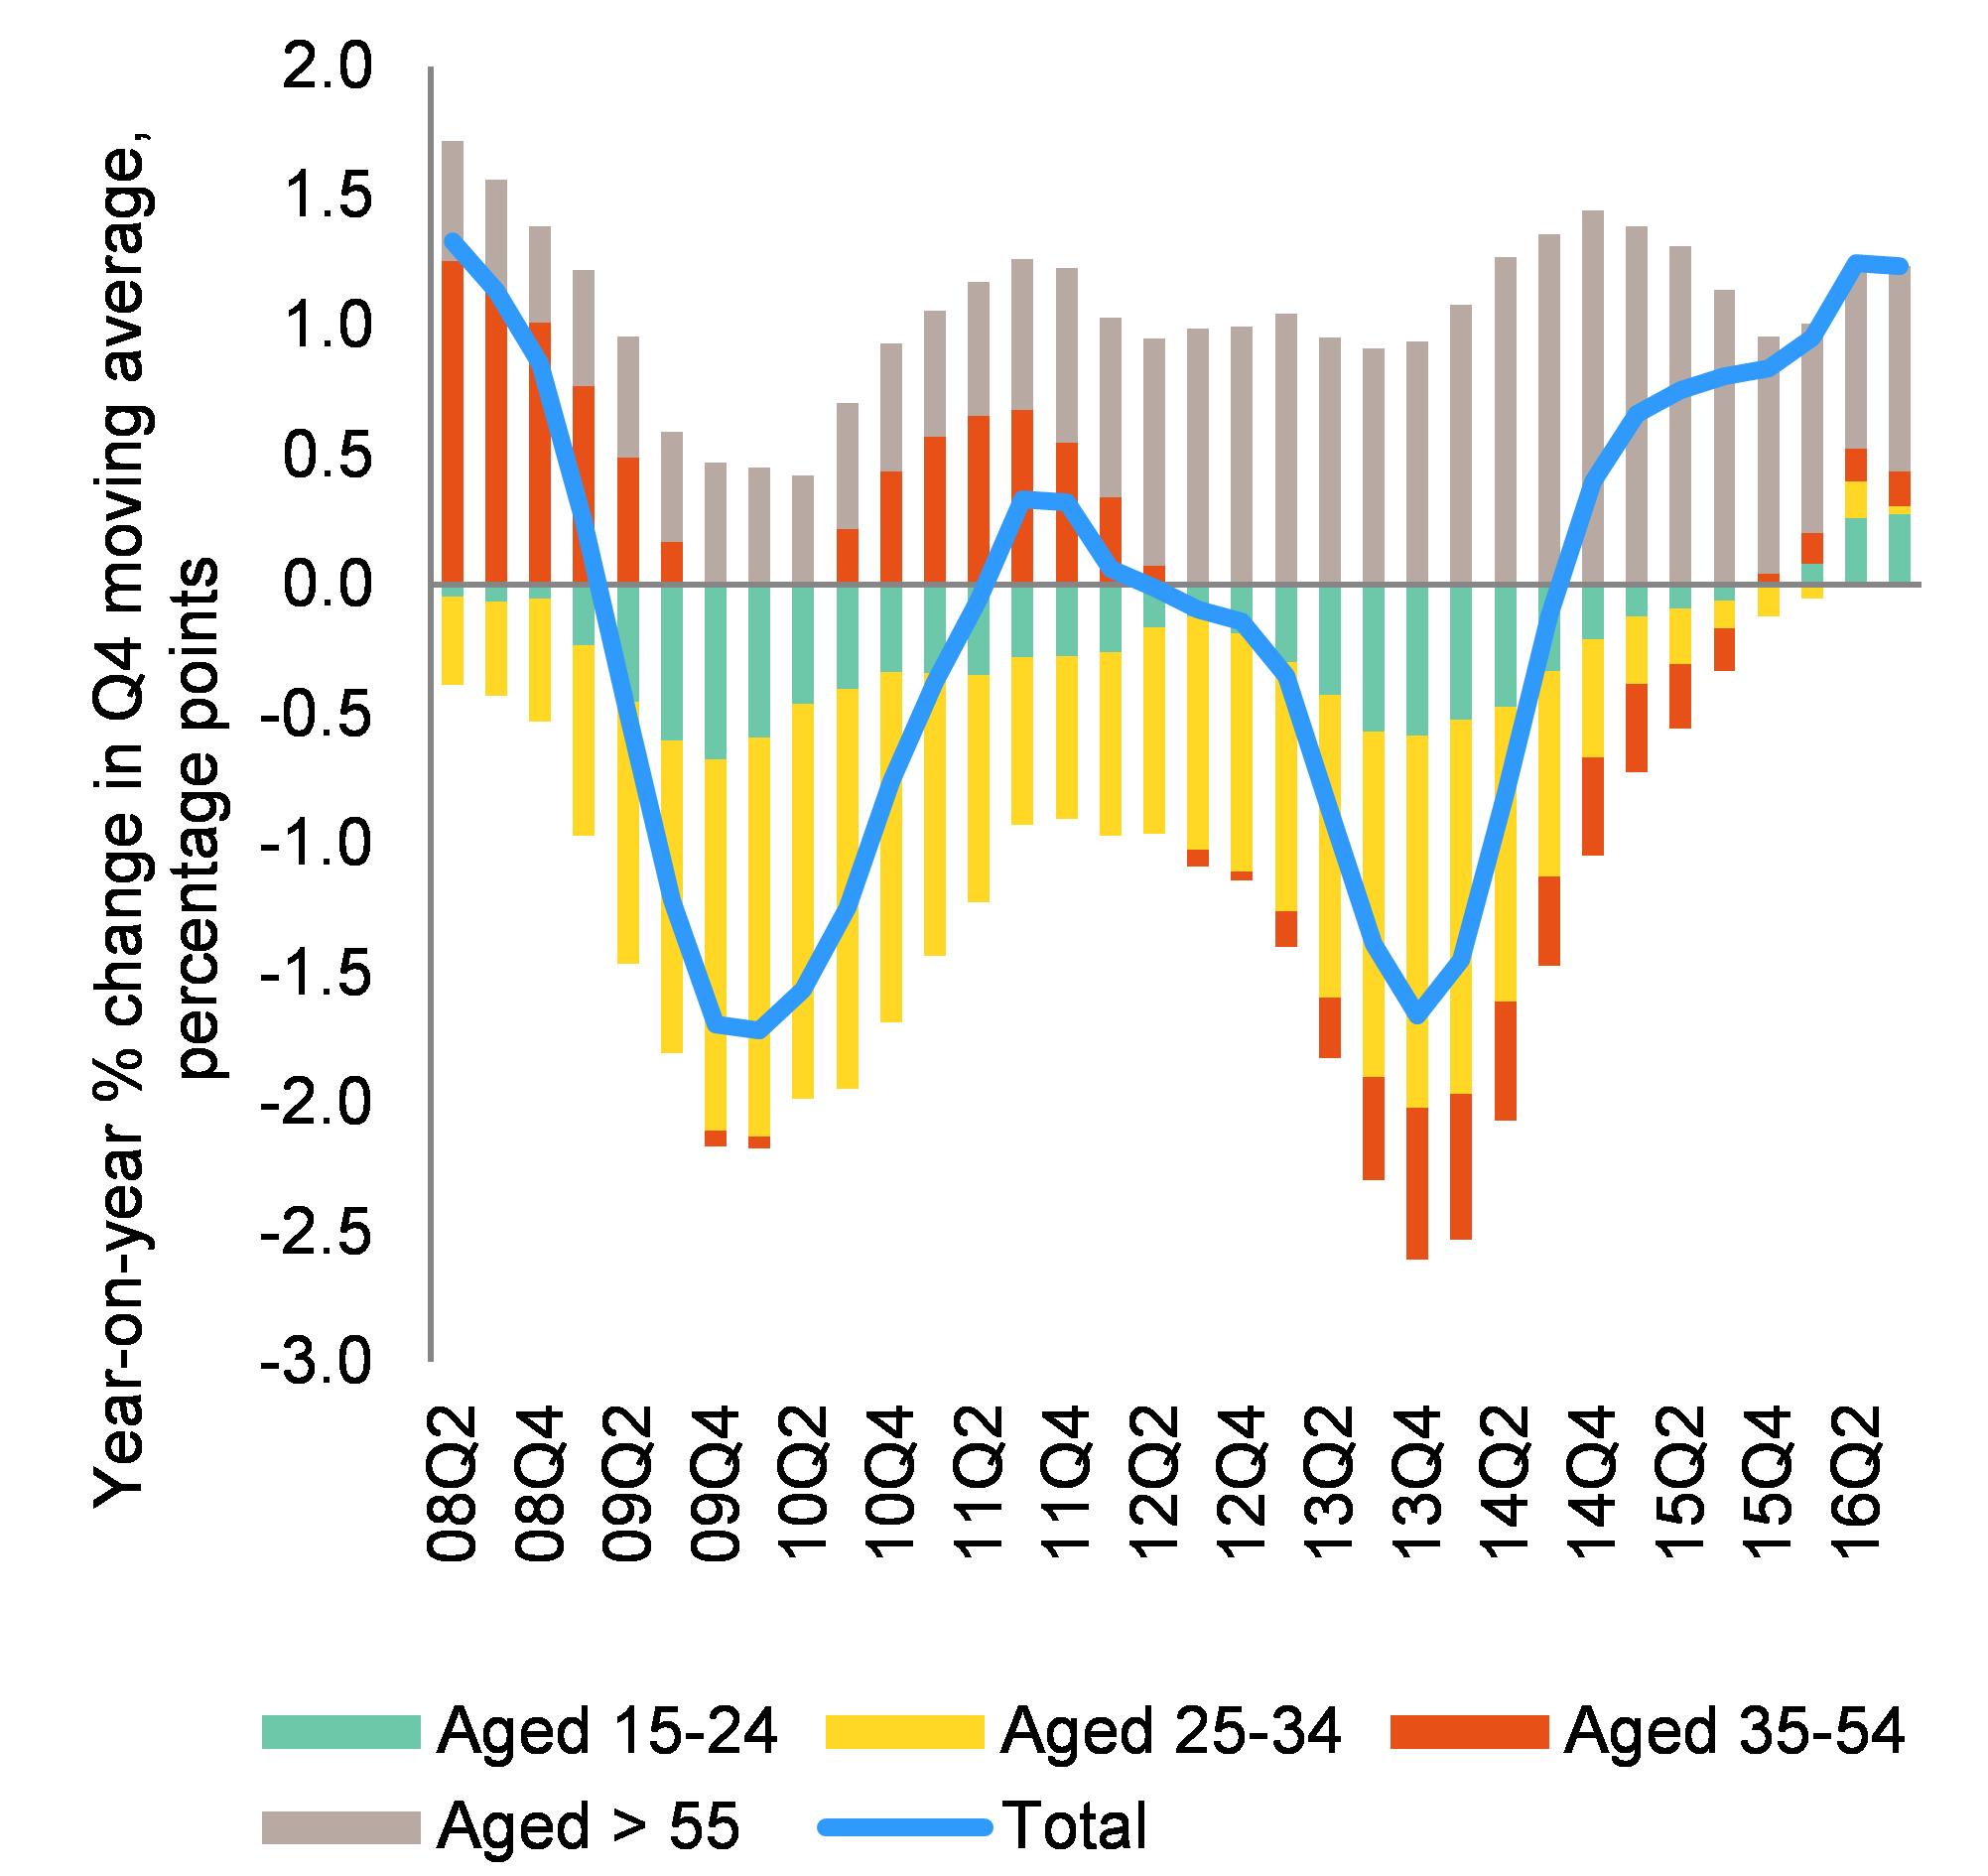
Employment is improving in all age groups. The large fall in employment observed during the double-dip recession was particularly marked for the younger cohorts (Graph 1.7). In contrast, the long-term trend of rising employment for people aged over 55 continued during the crisis, also thanks to reforms needed to keep the public pension system sustainable (see Section 4.1). Total employment growth turned positive in the second half of 2014, and since mid-2015 employment has grown in all age groups. However, the current economic recovery is not strong enough to allow a swift absorption of the sizeable unemployment of young people. This might have permanent negative effects on Italy's growth prospects (see Section 3).
|
Graph 1.7:Employment developments and contributions by age group
|
|
|
|
Source: European Commission
|
The unemployment rate remains high, in particular in southern regions. After peaking at more than 12.5 % in 2014, the Italian unemployment rate averaged 11.7 % in 2016, as higher employment is matched by higher labour market participation (i.e. the activity rate increased). The unemployment rate remains particularly high in the south, where it stood at around 19 % in Q3 2016 (as against just above 7.5 % and 10.5 % in northern and central regions respectively). (
) The Commission forecast projects a mild decline in the unemployment rate in 2017 and 2018 due to a slowdown in employment growth as the impact of tax incentives fades out, while labour market participation (i.e. the activity rate) is expected to increase further.
Social situation: poverty and inequality
The share of the population at-risk-of-poverty-or-social-exclusion (AROPE) stabilised close to 29 % in 2015, one of the highest rates in the EU. Children are particularly affected, with an AROPE rate of around 33.5 %, as against 26.5 % in the EU as a whole. Poverty rates are also much higher among people with a migrant background than among the native-born (around 48 % as against 26 %). In addition, there are substantial regional disparities, with very large differences in AROPE rates between northern and southern regions. In-work poverty is also high, exacerbated by a still highly segmented labour market (see Section 4.3).
Income inequality had been growing since 2008 and stabilised slightly above the EU average. Based on 2015 data, the ratio of total income received by the richest 20 % to total income received by the poorest 20 % was 5.8 (EU average: 5.2). The ratio grew by 12 % from 2008 to 2015. This negative development is more related to slow income growth among poorer households than to fast growth among wealthier ones. (
) The large share of pension expenditure hampers the effectiveness of social transfers in reducing inequalities. However, when including taxation, the overall impact of public intervention to curb inequalities remains close to the EU average. Moreover, the fragmentation of the system makes it more difficult to arrive at a comprehensive assessment of the impact of taxes and benefits (European Commission, 2016a; Figari and Fiorio, 2015).
Inequality based on the distribution of net wealth (
) is within the range observed in other EU countries for which data were collected in 2013-2014 (ECB 2016). Nevertheless average net wealth per household fell in Italy between 2010 and 2014 (to EUR 226 000 from EUR 275 000), mainly due to the fall in house prices.
The inflow of people entering the country as irregular migrants, including people seeking asylum, accelerated. In 2016, around 181 000 irregular migrants were detected on the Central Mediterranean route, an all-time high and nearly a fifth more than in the same period of 2015. In 2016, about 123 000 asylum applications were recorded in Italy, an increase by 47% compared to 2015. According to available estimates, a relatively large share of the inflow is from countries with relatively low asylum recognition rates. The inflow is among the highest in the EU in absolute terms and creates marked budgetary and social challenges for the reception and integration of those receiving international protection.
Financing conditions*
The significant decrease in the nominal cost of lending is not accompanied by a recovery of bank credit. Driven by the ECB’s expansionary monetary policy, which led to a strong decrease in nominal interest rates, rates for new loans to households for house purchase and to firms reached historically low levels in November 2016 (2.05 % and 1.56 % respectively). However, so far there is no broad-based recovery of the stock of bank credit. While lending to households has increased by around 1.5 % year-on-year in recent months, corporate lending is not recovering yet.
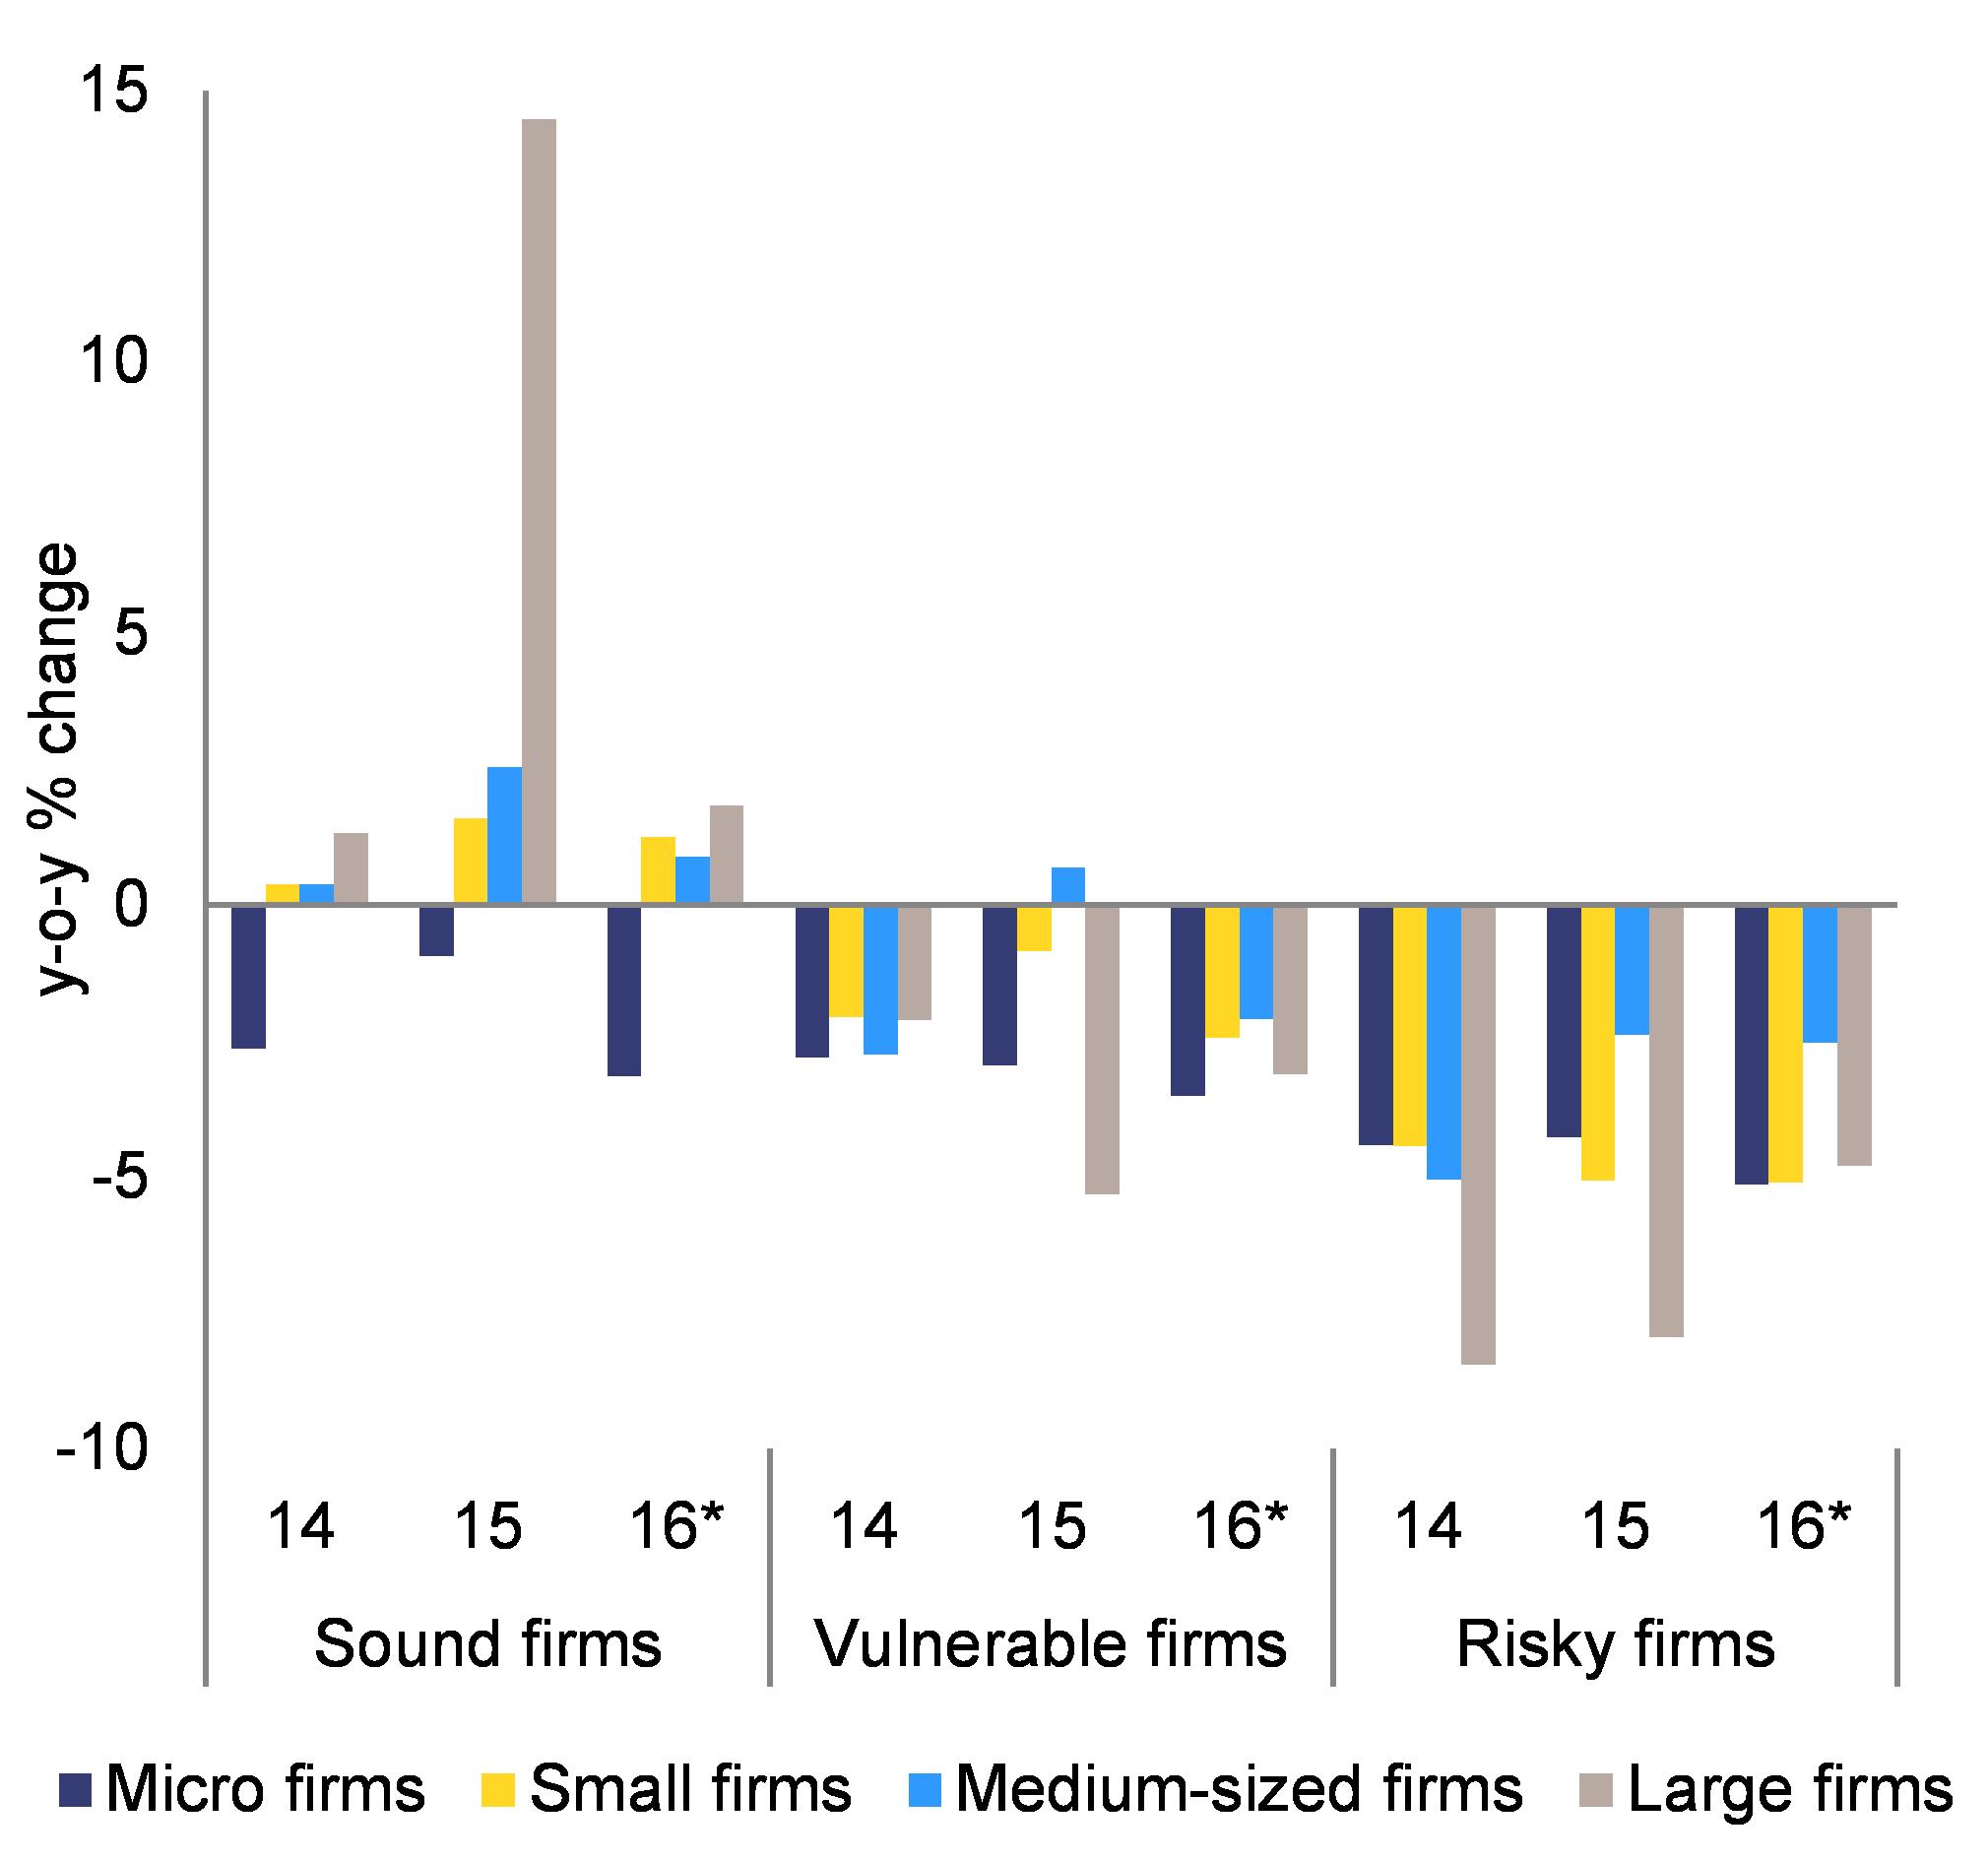
The deterioration in asset quality has led to more conservative stance towards new lending, especially for small firms. The weak lending to firms appears to be driven by both demand and supply factors. Survey data suggest that low credit demand is mainly explained by the tepid and uncertain economic outlook. However, other factors contribute to this trend, i.e. large firms’ increased self-financing capacity, higher profit margins and higher reliance on capital market funding (supported by regulatory incentives and the ECB’s Corporate Sector Purchase Programme as of June 2016), as well as remaining deleveraging needs in the corporate sector. On the credit supply side, banks’ large stock of non-performing loans (see Sections 3 and 4.2) may inter alia have led to more conservative lending standards for corporates. This has mainly weighed on the growth of bank credit to vulnerable and risky firms – especially when they are small – but also to micro-firms, including low-risk ones (Graph 1.8). Creditworthy medium-sized and large firms however – often active internationally – are able to benefit from increased price competition between banks, contributing to the compression of banks’ net interest margins. While prudent lending policies may limit the emergence of new problem loans in the future, they could become a drag on Italy’s economic recovery, especially when credit demand picks up. Meanwhile, alternative non-bank funding options remain relatively underdeveloped in Italy (European Commission, 2016b).
|
Graph 1.8:Bank credit to firms by firm size and risk profile
|
|
|
|
Source: Bank of Italy
|
External position*
Italy's current account surplus is approaching 3 % of GDP. An improved export performance coupled with slow nominal import dynamics led to a steady increase in the current account balance. Starting from a deficit position of -3.4 % of GDP in 2010, the current account turned positive in 2013 and reached a surplus position of 2.7 % of GDP in the 12-month period up to November, i.e. an increase of more than 6 percentage points of GDP. The trade balance surplus rose to 3.5 % of GDP (from -1.9 % in 2010), owing to lower oil prices but also the sharp fall in domestic demand, especially investment (see Section 4.4). Increases were also recorded in the primary income balance, which recently turned marginally positive, inter alia thanks to lower interest rates paid on domestic debt held by foreign investors.
From a savings-investment perspective, the current account surplus reflects a deleveraging process. Between 2010 and 2016, gross capital formation as a share of GDP fell by 3.8 percentage points, while savings increased by 2.4 percentage points. The position of the corporate sector turned from net borrower of into net lender to the economy, as firms’ savings have increased by around 1.5 percentage points of GDP since 2010, while their investment fell by 1.4 percentage points. Furthermore, the share of investment accounted for by the government and the household sectors fell (by -0.7 and -1.7 percentage points of GDP respectively), while the government sector also increased its savings (by 1.2 percentage points of GDP).
Estimates of the cyclically adjusted current account balance show a surplus in the order of 2.5 % of GDP in 2016. (
) By contrast, a current-account deficit of around 0.5 % of GDP might be sufficient to stabilise Italy's net international investment position over the next 10 years (assuming zero valuation effects).
Italy's net international investment position remains slightly negative. Over the last two years, Italy’s negative net financial position vis-à-vis the rest of the world oscillated around 20 % of GDP (European Commission 2015a; European Commission, 2016b). Direct investment and equity portfolio investment both display a positive net position (around +7 % and +28 % of GDP respectively at the end of Q2 2016). In contrast, the net position in debt securities is significantly negative (around 37.5 % of GDP), mainly due to foreign investors' exposure to Italian sovereign debt. Finally, the Bank of Italy has a net negative financial position towards the Eurosystem (see Section 3).
Public finances: public deficit and debt*
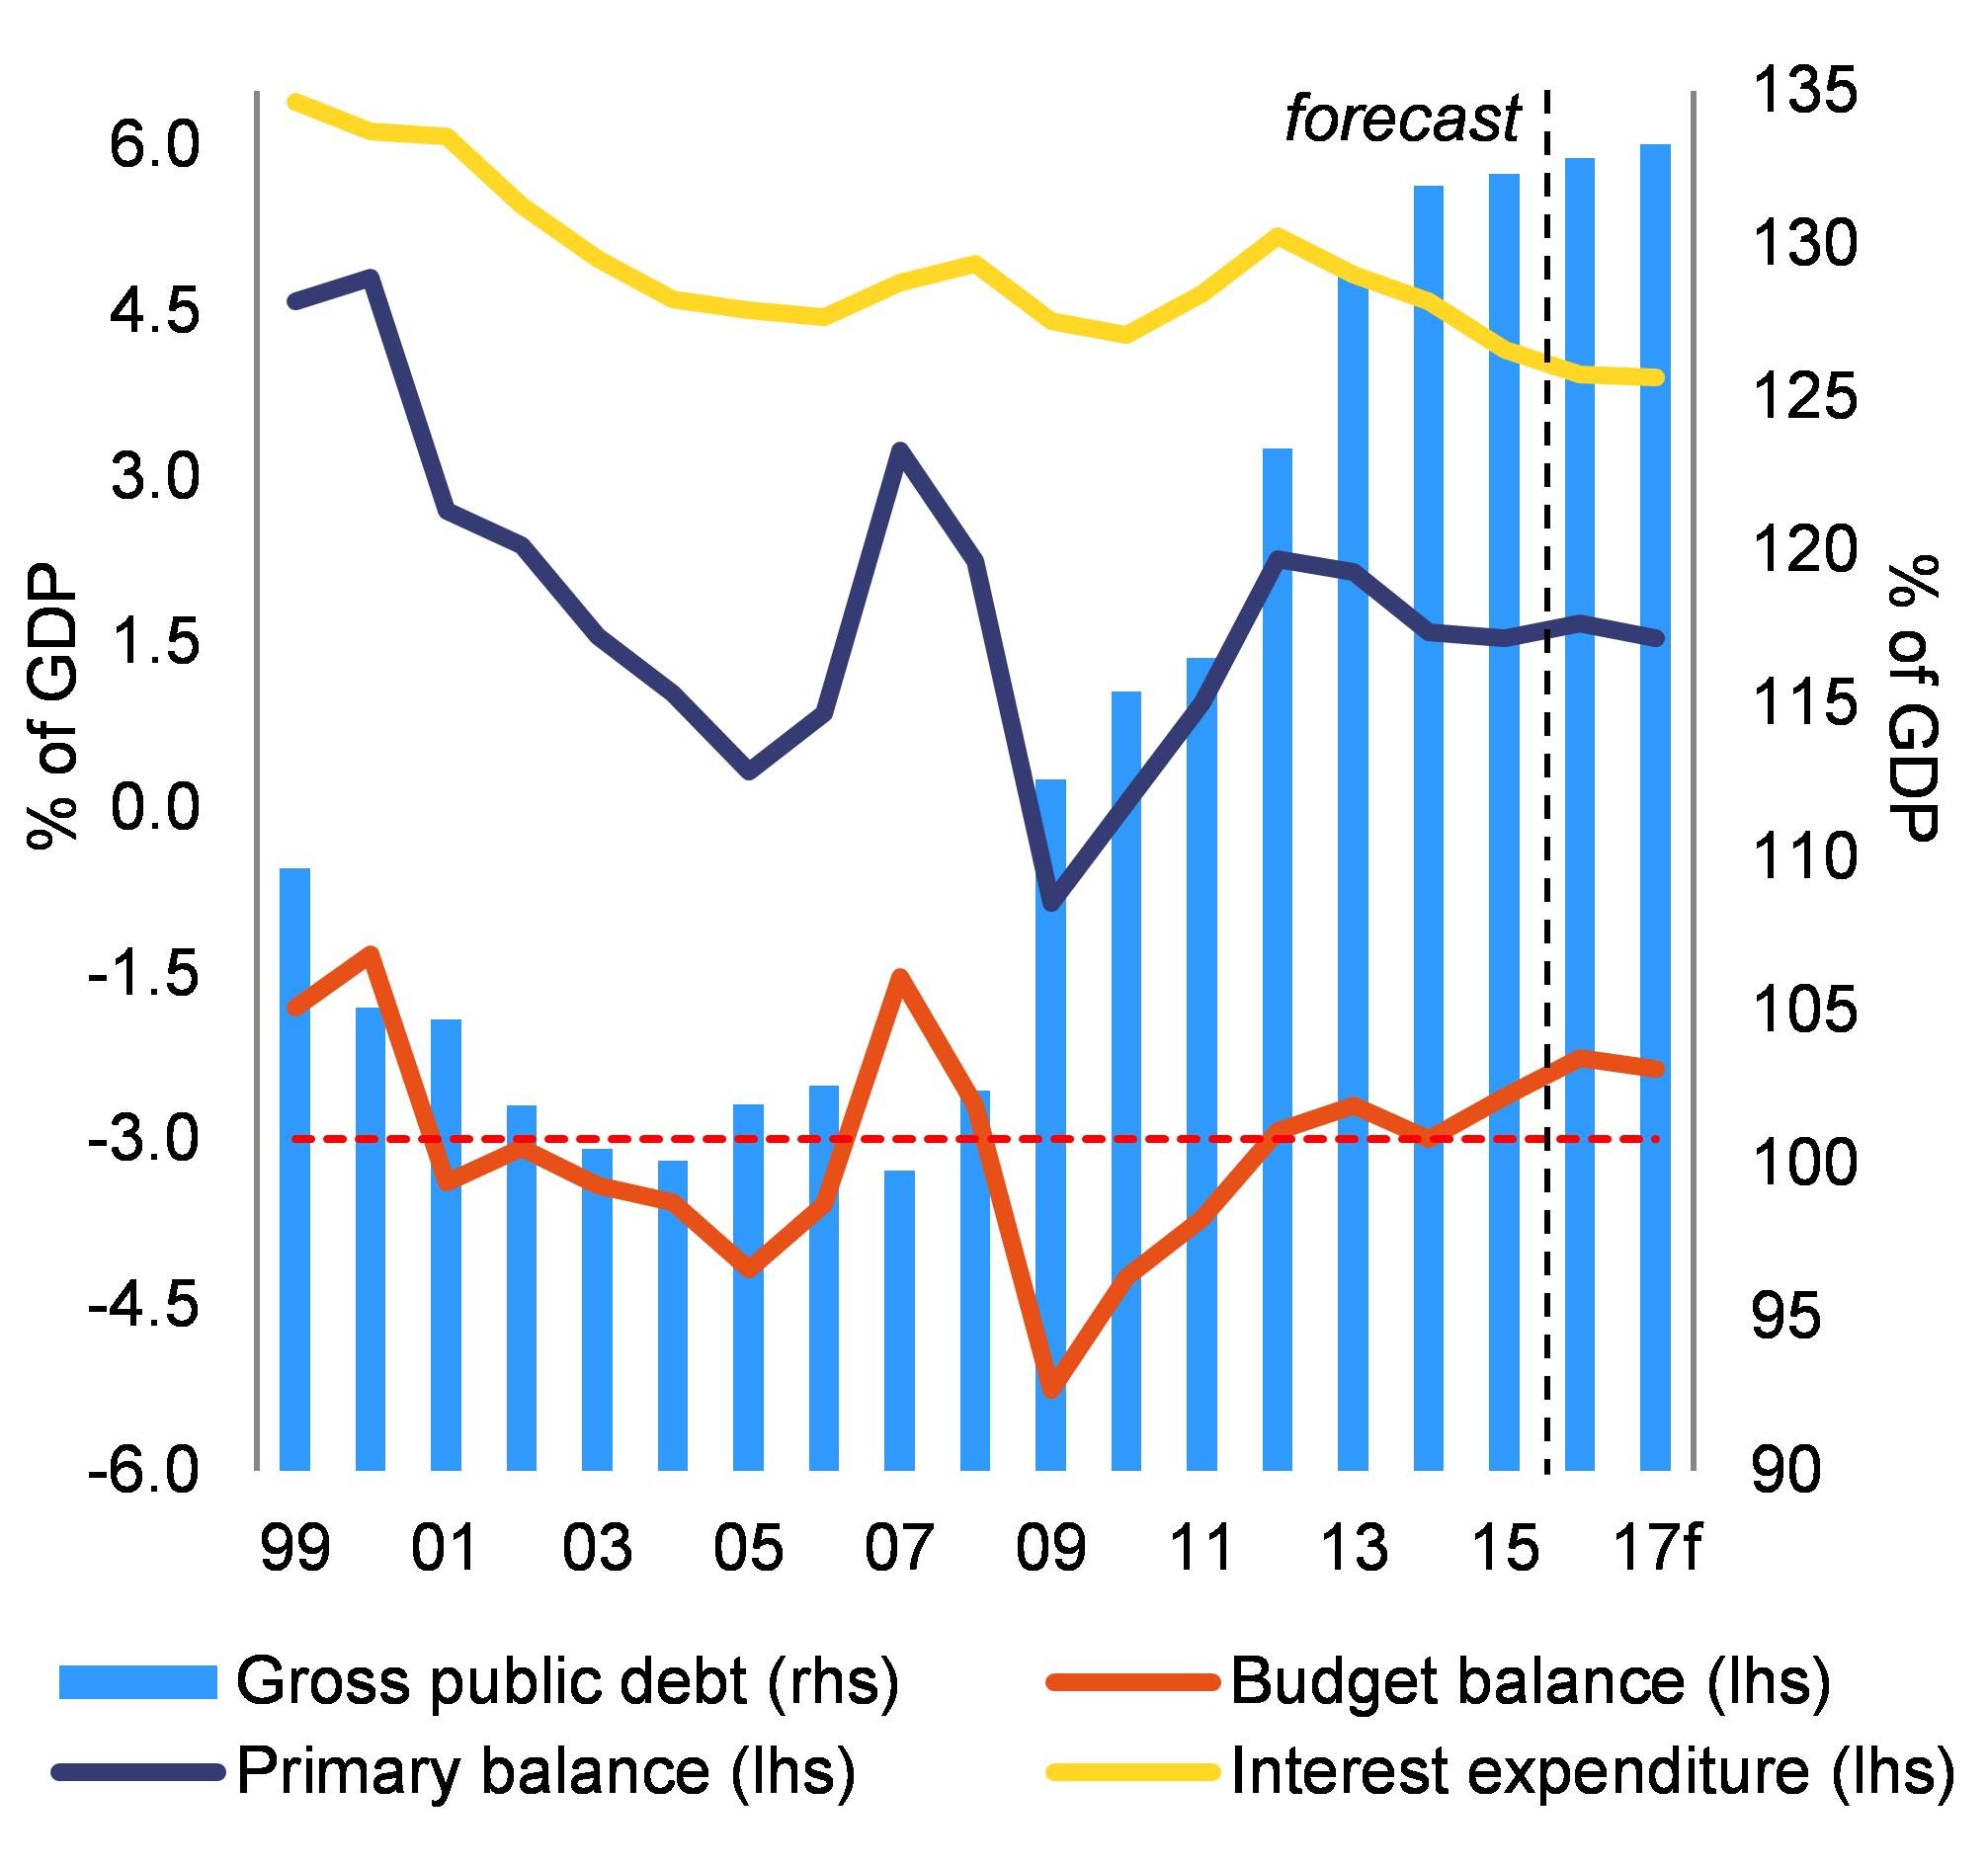
The headline government deficit broadly stabilised thanks to lower interest expenditure and improving cyclical conditions. Since 2012 the government deficit has been slightly below 3 % of GDP and is estimated to have declined to 2.3 % in 2016 after 2.6 % in 2015 (Graph 1.9). Thanks to the ECB's accommodative monetary policy stance, interest expenditure declined steadily (from the recent peak of 5.2 % of GDP in 2012 to 3.9 % in 2016). At the same time, the primary surplus fell from 2.3 % of GDP in 2012 to 1.6 % in 2014 and has broadly stabilised since then, despite better cyclical conditions. As a result, the structural primary balance is estimated to have worsened significantly (from 3.9 % of GDP in 2013 to 2.3 % in 2016), while the structural balance is estimated to have deteriorated by 0.7 percentage points of GDP in 2016 compared to 2015. The Commission forecast projects that the fiscal stance would be relaxed further in 2017 as the primary balance and the headline deficit are set to worsen slightly in spite of real GDP growth of 0.9 % (as against potential growth estimated at 0.1 %). In 2017, the deficit will be affected by the impact of recent earthquakes. One-off emergency and reconstruction measures for new earthquakes will add up to those already earmarked for previous earthquakes in Abruzzi (2009) and Emilia Romagna (2012). Moreover, in 2017 the Commission will consider eligible for the ‘unusual event clause’ the 0.18 % of GDP earmarked by the government for its ‘preventive investment plan for the protection of the national territory against seismic risks’.
Gross public debt as a share of GDP is stabilising at a very high level. The public debt-to-GDP ratio is expected to have increased to 132.8 % in 2016. Privatisation proceeds, at less than 0.1% of GDP, fell short of the 0.5 % planned by the government a year before and the Treasury increased its liquidity buffer. In 2017, the debt is expected to be slightly higher than in 2016, partly due to support to the banking sector for which EUR 20 billion (or 1.2 % of GDP) has been earmarked (see Section 4.2).
|
Graph 1.9:Italian public finance indicators
|
|
|
|
Source: European Commission
|
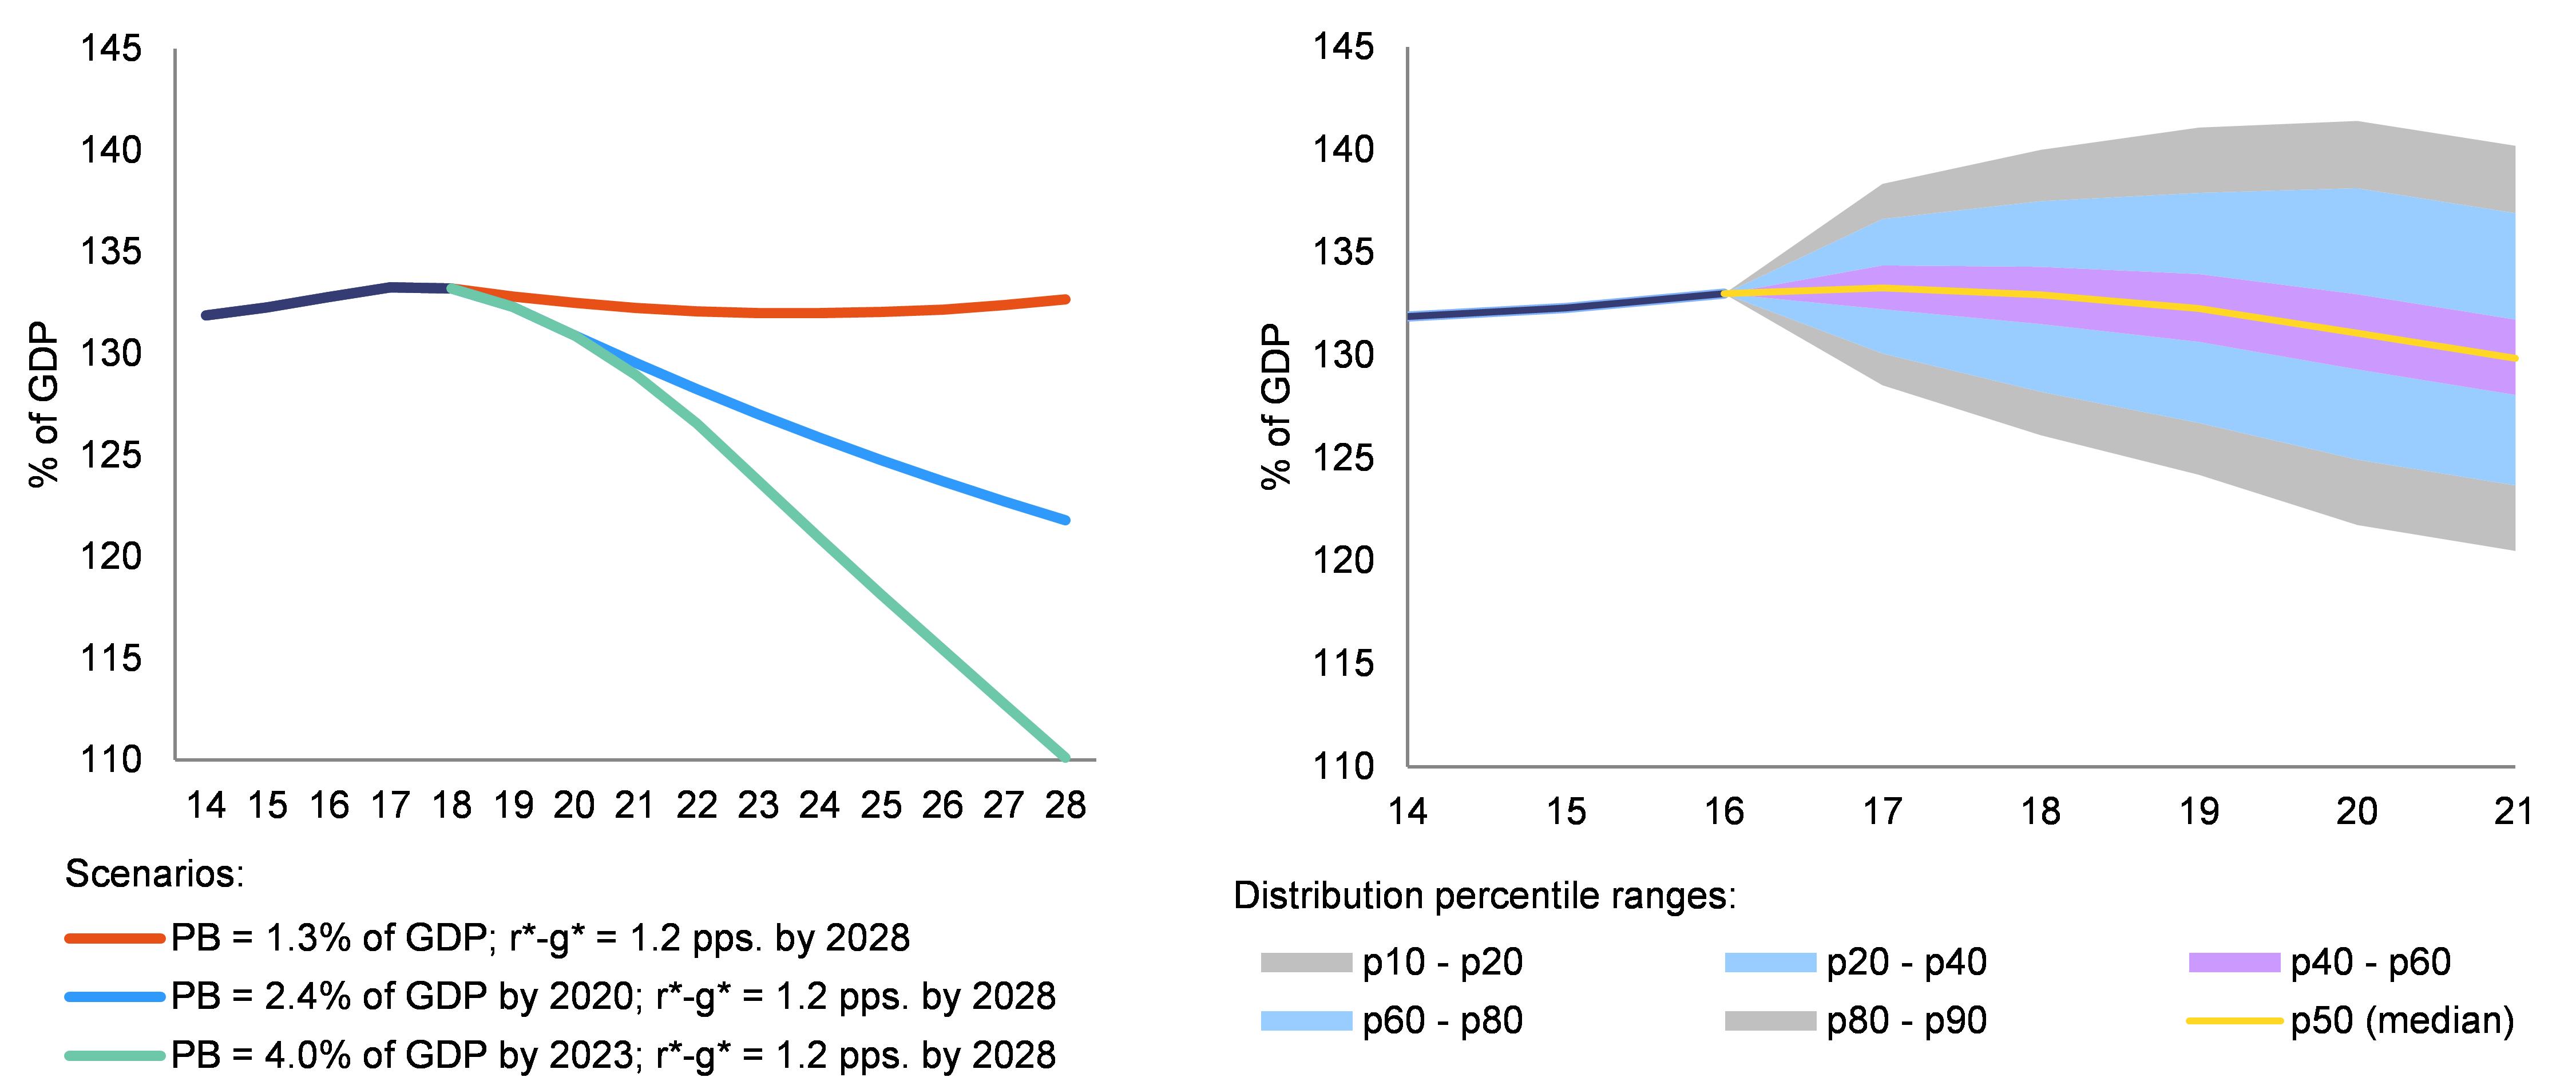
Debt sustainability analyses (DSAs) point to the risk of still very high debt in the medium term. A simple (deterministic) DSA exercise run over 10 years (Graph 1.10, left-hand side) shows that if the 1.3 % of GDP structural primary surplus forecast for 2018 were kept constant and the interest-rate-growth-rate differential gradually converged towards the pre-crisis (1999-2007) average of 1.2 percentage points (from the 0.6 percentage point trough forecast in 2018), the debt-to-GDP ratio would remain above 130 % of GDP in the medium term. Under the same interest-rate-growth-rate differential assumption, the DSA shows that a primary surplus gradually increasing to 2.4 % of GDP (i.e. the average recorded in the pre-crisis period) would lead to an only moderately declining debt-to-GDP ratio over 10 years. (
) By contrast, gradually going back to a primary surplus in the order of 4 % of GDP would allow putting the debt ratio on a more ambitious declining path. A reinforced sensitivity analysis, based on a stochastic DSA exercise (Berti, 2013) where over a period of five years (2017-2021) (random) shocks are applied to the primary balance, interest rates and GDP growth based on historical behaviour, shows that Italy's public debt ratio could increase further in the medium term if the fiscal position (i.e. the projected structural primary surplus) is not strengthened (Graph 1.10, right-hand side).
|
Graph 1.10:Evolution of Italy’s public debt-to-GDP ratio under different debt sustainability analyses
|
|
|
|
Source: European Commission
|
|
|
|
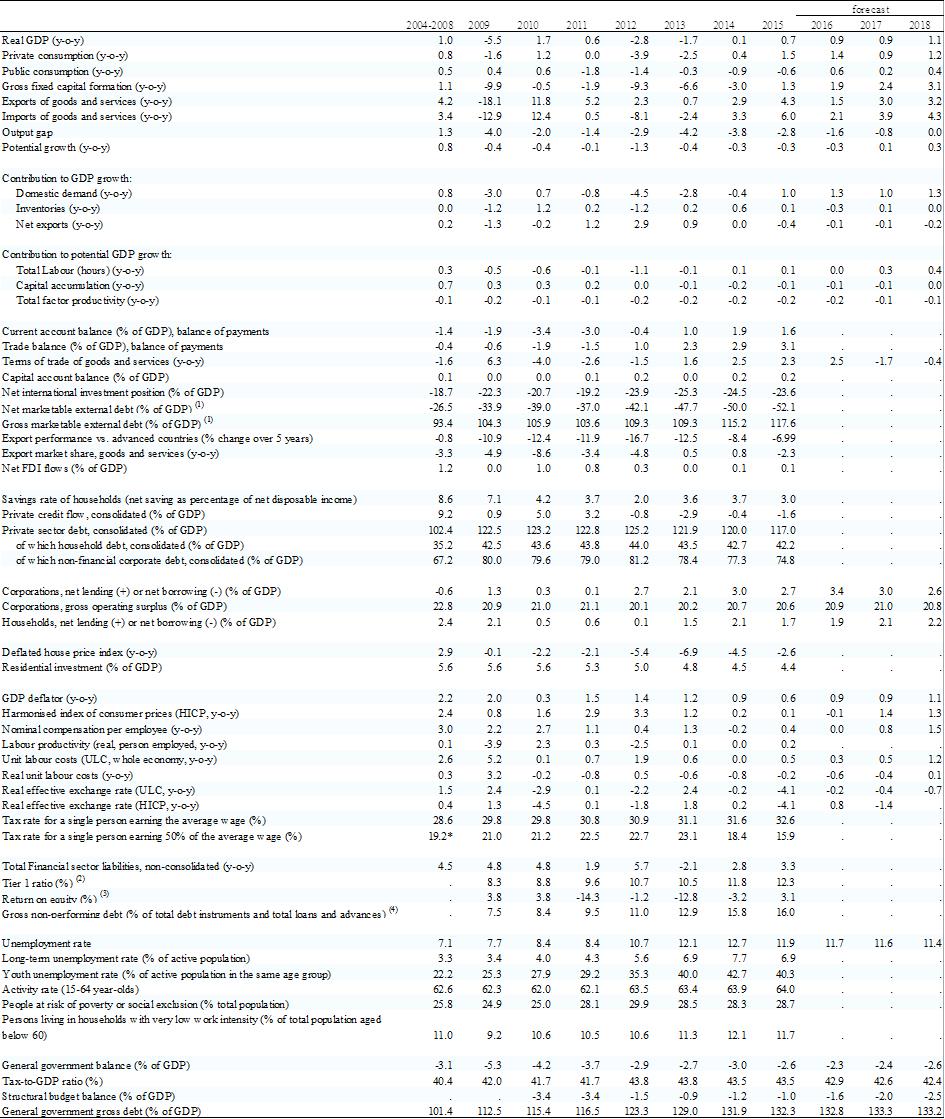
Table 1.1:Key economic, financial and social indicators for Italy
|
|
|
|
Source: European Commission, ECB
|
|
|
2.
Progress with country-specific recommendations
Progress with the implementation of the recommendations addressed to Italy in 2016 (
) has to be seen in a longer term perspective, since the introduction of the European Semester in 2011.
In the area of public finances, restraints on healthcare spending and the public wage bill introduced since 2011 have helped to contain public expenditure over time. In 2012, a pension reform, now partly reverted (see Section 4.1), helped to improve long-term debt sustainability, while maintaining the adequacy of pensions. Some privatisations contributed to a slight reduction of public debt. Important taxation reforms have been taken since 2011, albeit sometimes inconsistently. For instance, the tax on immovable property was increased in 2011, but partly repealed in 2015. Measures to reduce the tax burden on labour were taken in 2014 and 2015, partly financed by shifting taxation to consumption. In 2014, important tax simplification measures were undertaken.
In civil justice, a major reorganisation of civil courts was completed in 2013, and several measures were introduced to reform civil procedures, strengthen out-of-court settlement and reduce abusive litigation. A comprehensive anti-corruption law was adopted in 2012 to step up the fight against corruption. The law established an anticorruption agency, which was reinforced in 2014, but still lacks adequate resources. A crucial reform of the statute of limitations has been repeatedly delayed. In public administration, measures to improve staff mobility and promote digital technology were introduced in 2014.
In the banking sector, several corporate governance reforms have been adopted since early 2015 and are now implemented. Measures were also taken to help banks dispose of their impaired loans. These measures (e.g. a more favourable tax treatment of loan loss provisioning, insolvency and collateral enforcement reforms and an impaired loan securitisation mechanism benefitting from state guarantees) are aimed mainly at supporting
the development of a private secondary market for distressed assets in Italy. Finally, since 2012, the authorities have passed several measures to support and diversify firms’ access to finance, notably through an allowance for corporate equity (now partially reversed), mini-bonds and the central guarantee fund for small- and medium-sized enterprises.
A wide-ranging reform of the labour market (‘Jobs Act’) was initiated at the end of 2014. Inter alia, the reform reduced the cost and the uncertainty related to individual dismissals and rationalised contractual forms and passive policies. It also foresaw a reform of active labour market policies, which is now being implemented. The 2014 reform built on and followed the lines of a previous labour market reform undertaken in 2012. A reform of the collective bargaining framework has long been discussed, and social partners signed important agreements on the representativeness of trade unions in 2014. However, progress has been limited to date, while new sector-by-sector agreements are being reached. The 2012 pension reform increased the labour market participation of the elderly. However, the recent backtracking on it reinforces the unbalanced composition of social expenditure in favour of pensions (see Section 4.3.2). An important education reform was undertaken in 2015 (‘La Buona Scuola’) and is now being implemented. To alleviate poverty risks, several experimental measures have been introduced since 2012.
In-depth market opening measures for regulated professions and some measures for the retail sector were introduced in 2012. Since 2011, several packages have been adopted to reduce the administrative burden for companies and citizens.
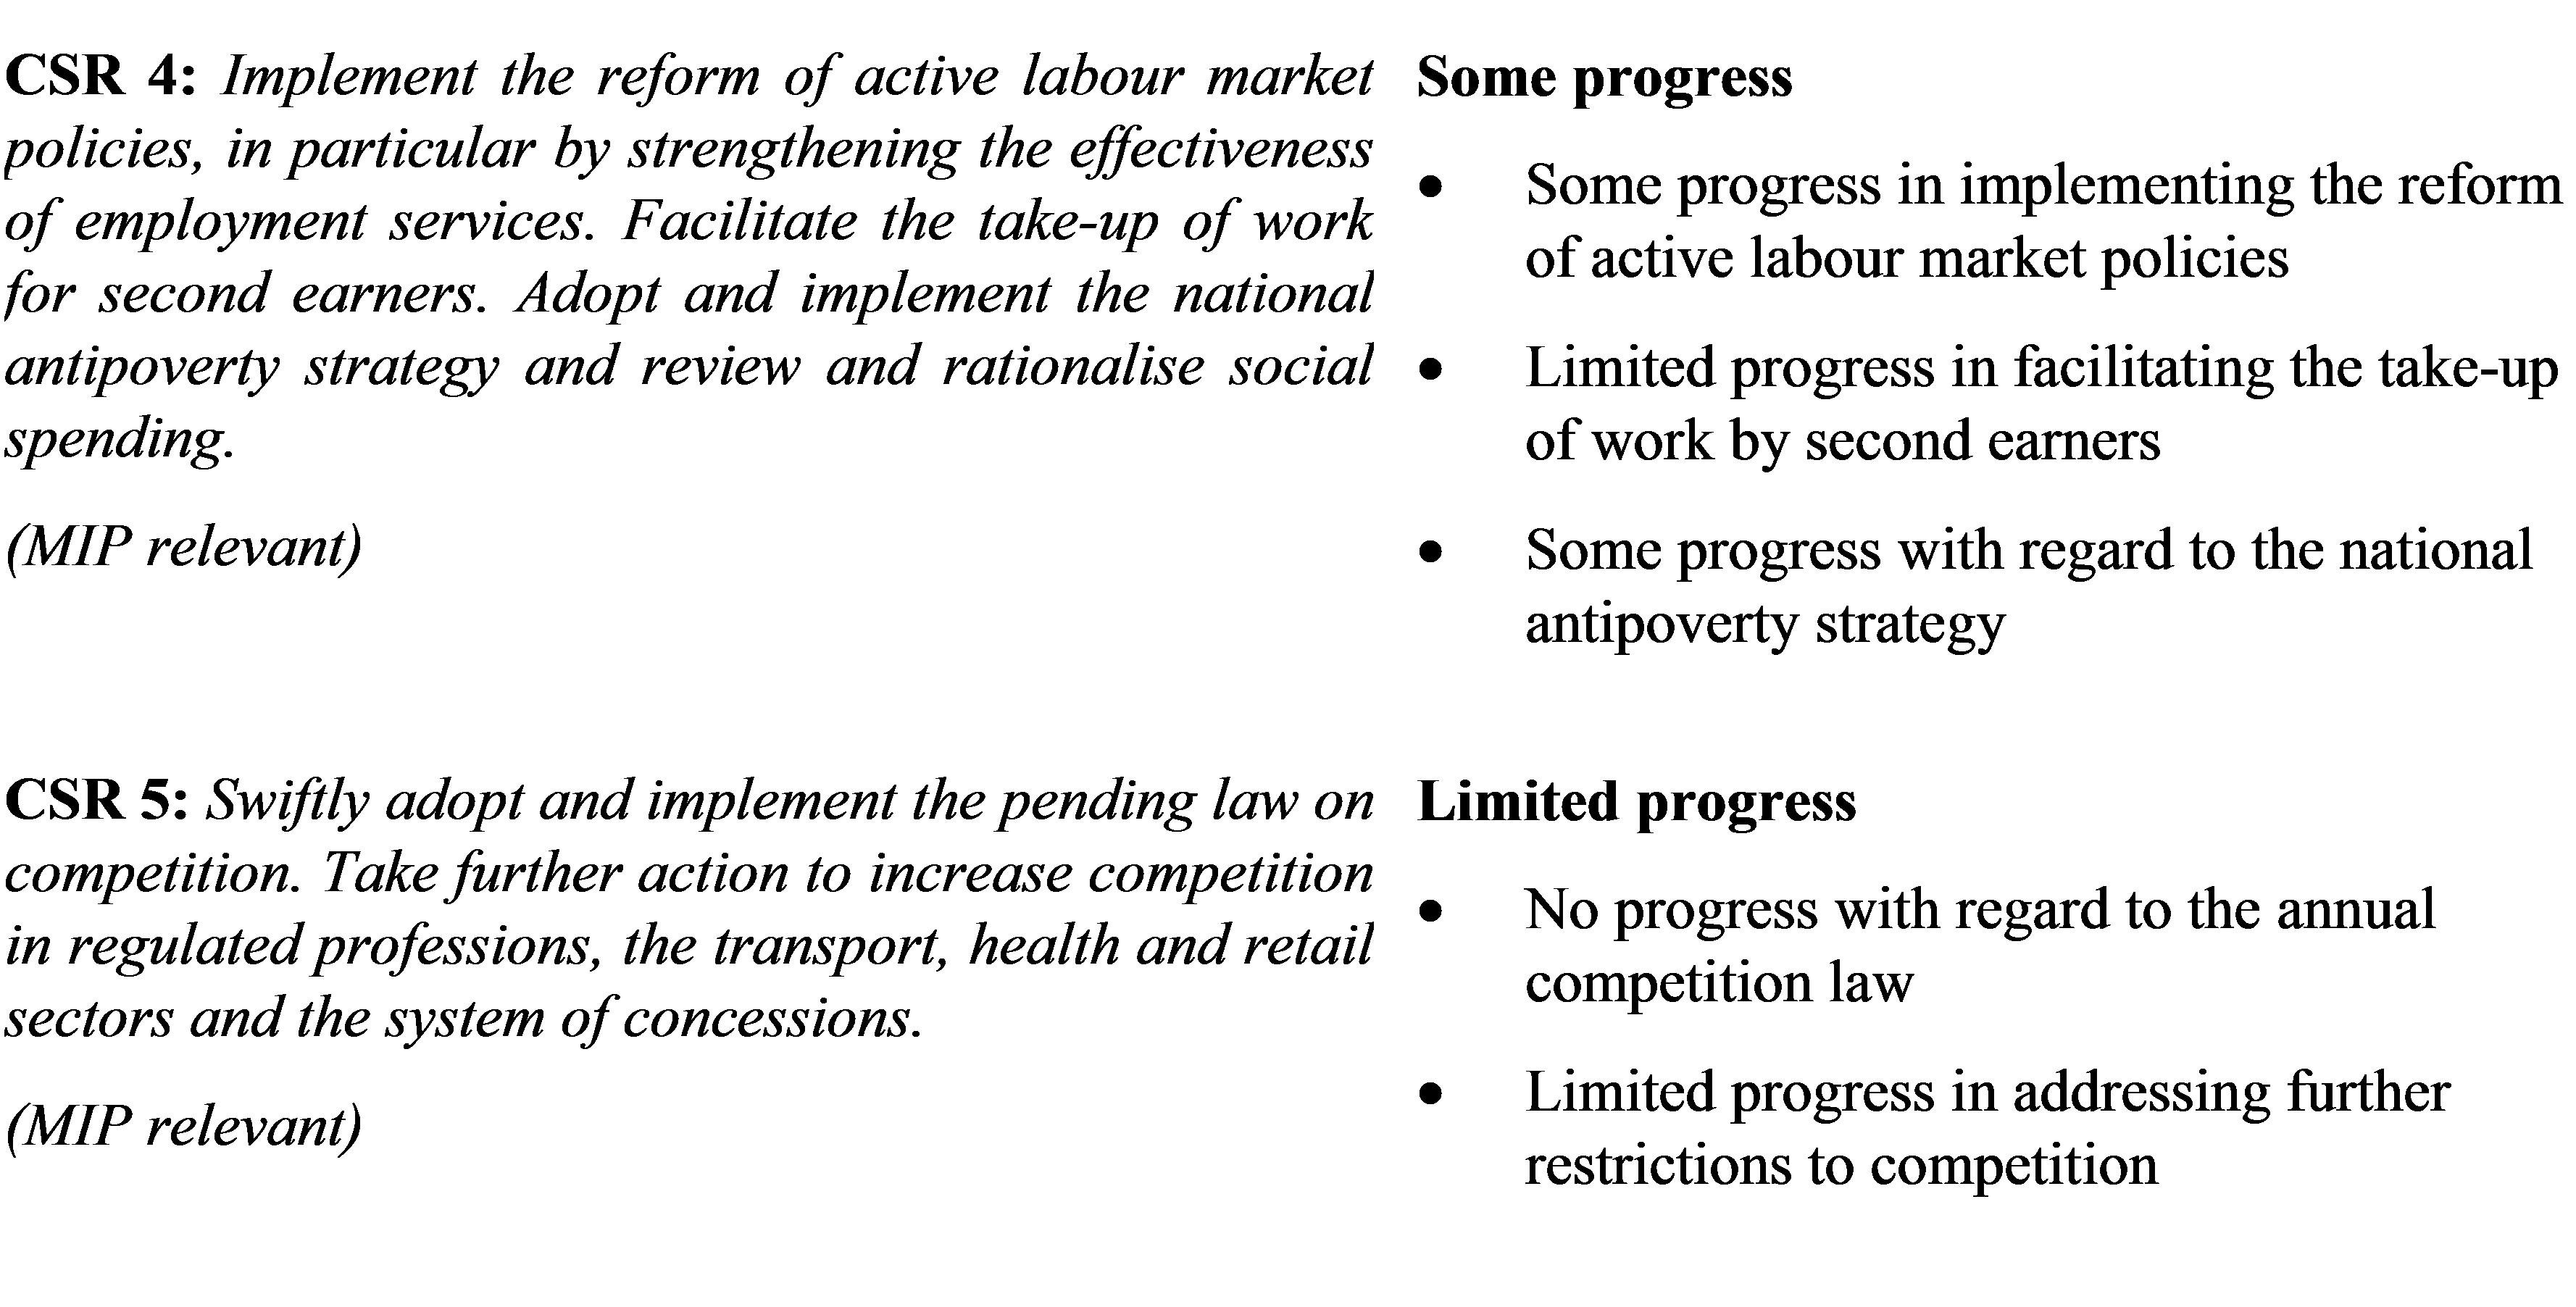
Overall, Italy made some progress in addressing the 2016 country-specific recommendations. (
) Substantial progress was made in reforming the budgetary process. Some progress was made with regard to civil justice, labour market and the banking sector. Conversely, progress was limited on taxation, competition and public administration, and no progress was made in reforming the statute of limitations.
|
|
|
Table 2.1:Summary table on 2016 CSR assessment
|
|

|
|
|
|
(Continued on the next page)
|
|
Table (continued)
|
|
|
|
|
|
Source: European Commission
|
|
|
3.
Summary of the main findings from the MIP in-depth review
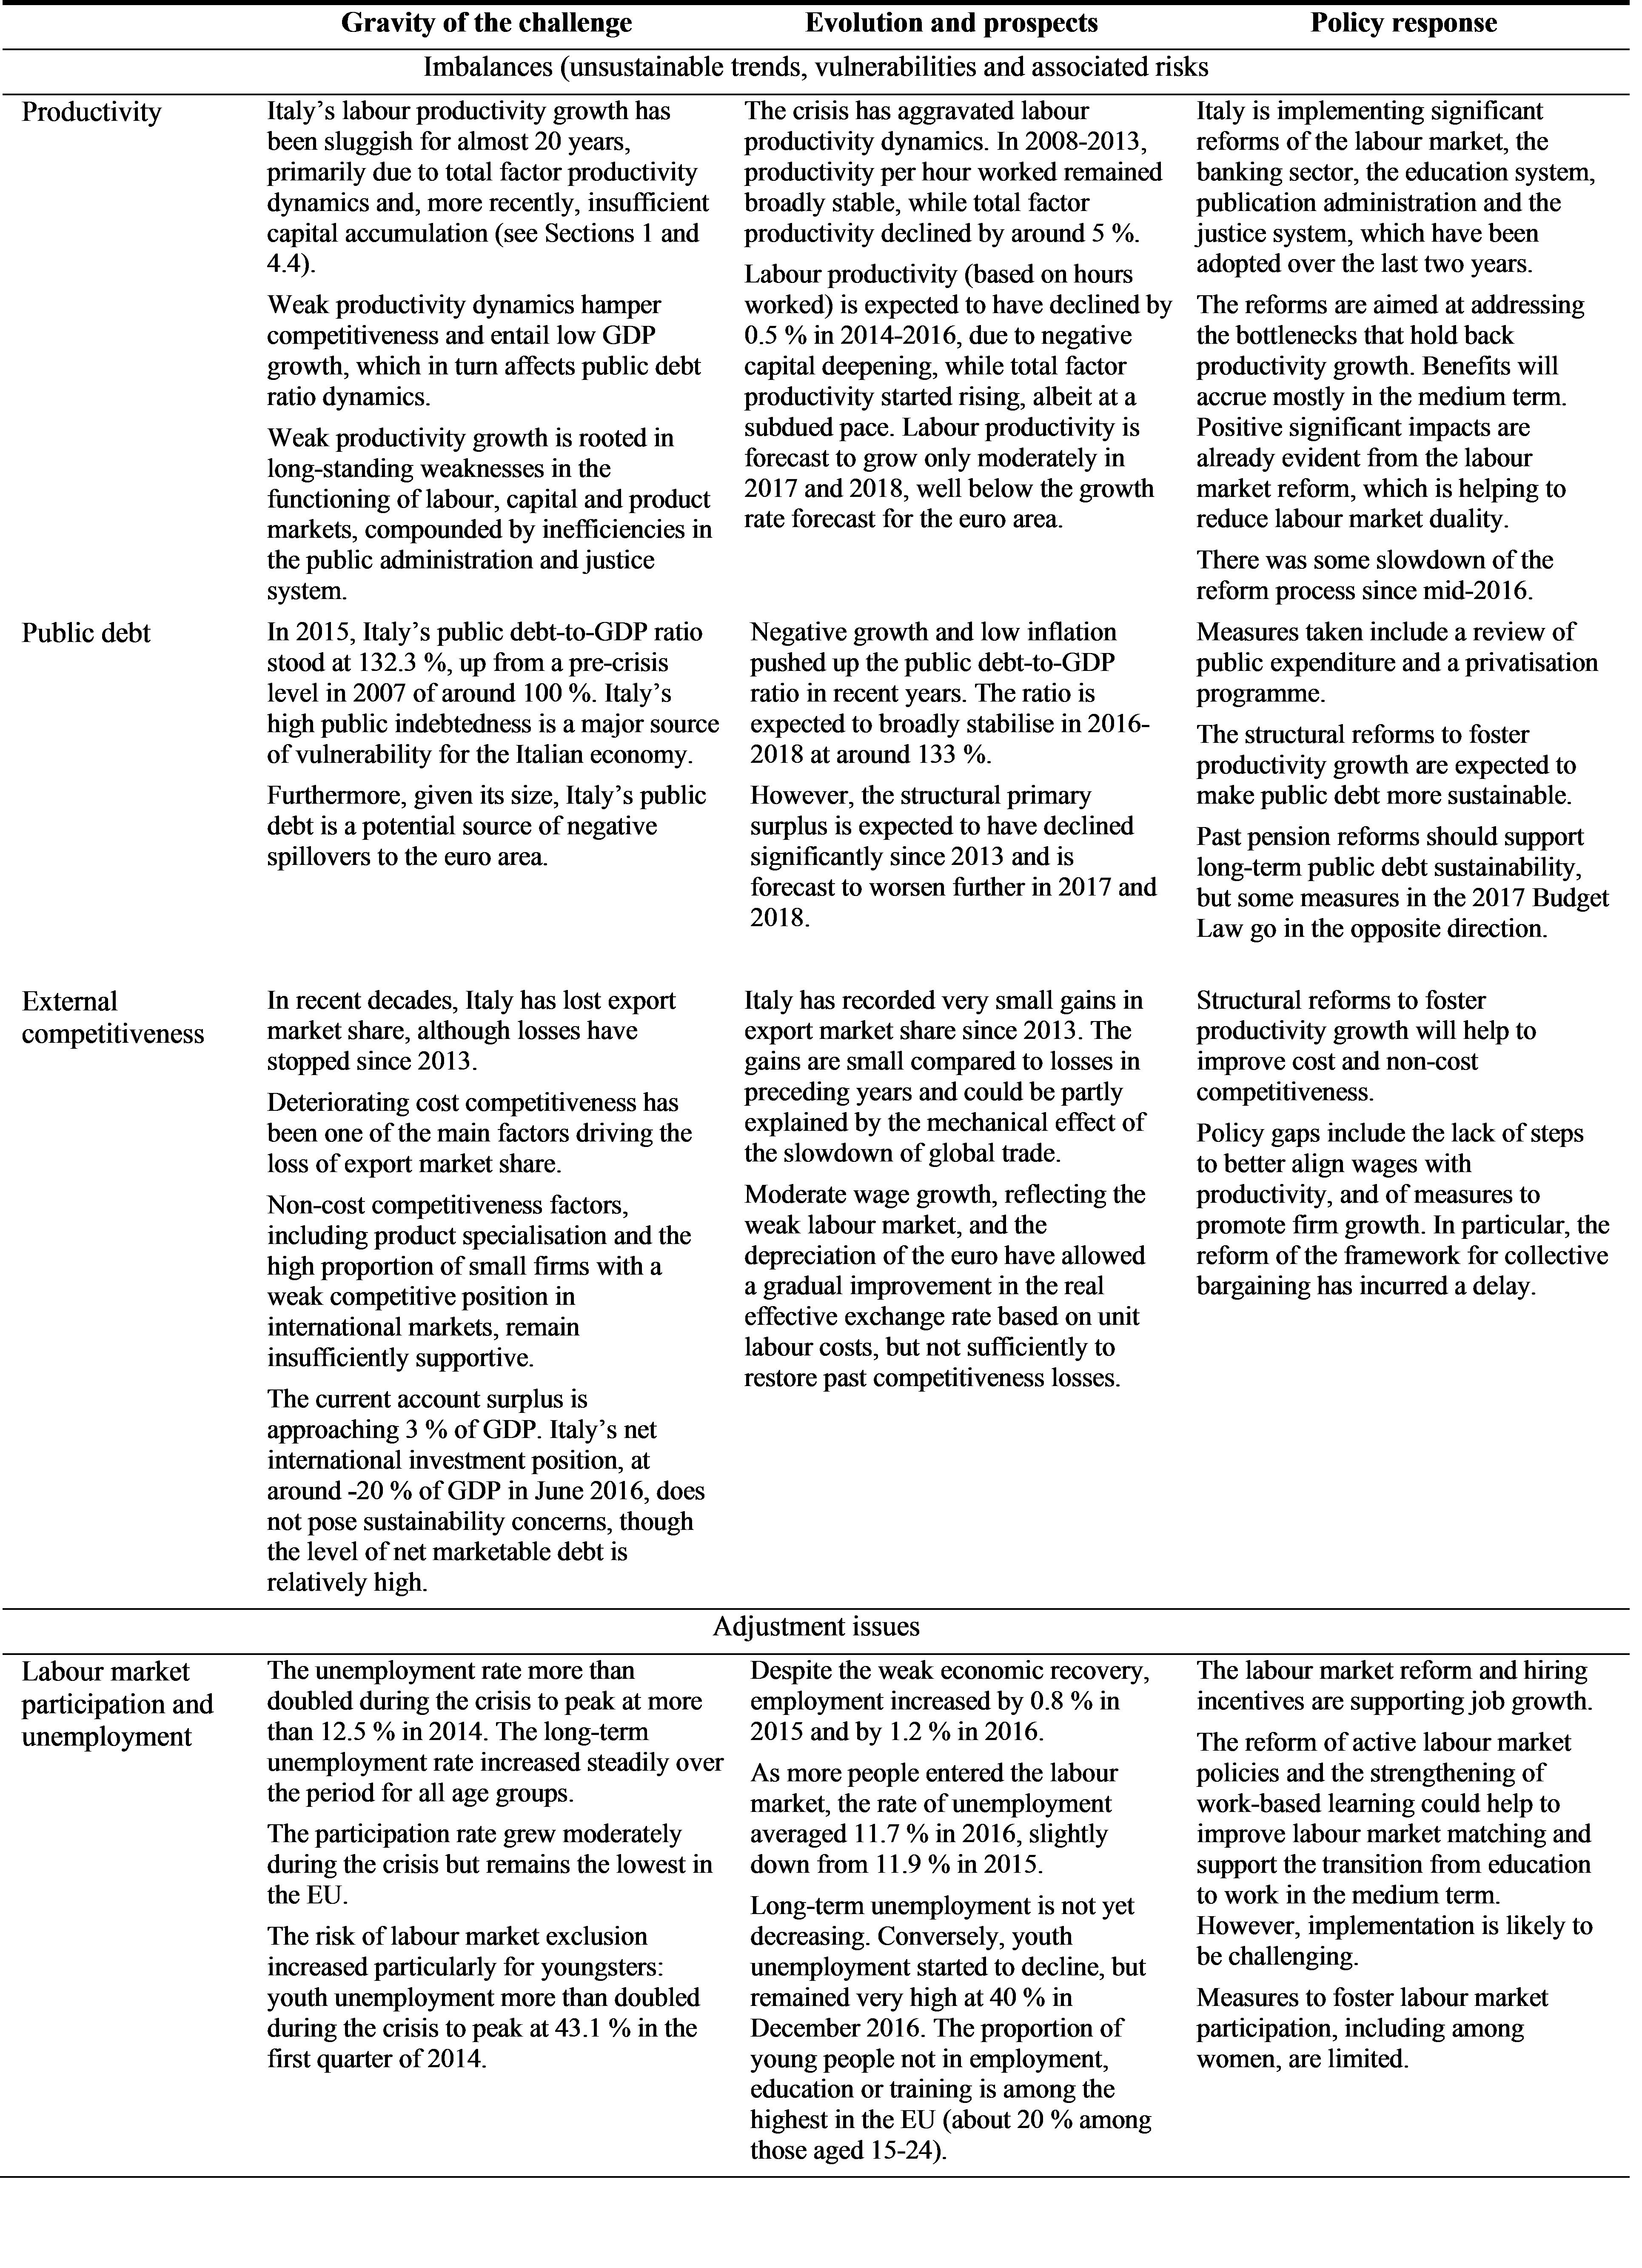
The in-depth review, which the 2017 AMR concluded should be undertaken for the Italian economy, is presented in this report (European Commission, 2016d). In spring 2016, Italy was identified as having excessive macroeconomic imbalances relating to its high public debt and weak external competitiveness in a context of weak productivity growth, as well as adjustment issues linked to the high level of non-performing loans on banks' balance sheets, the still high level of unemployment and significant increases in the long-term and youth unemployment rates. For these reasons, a new in-depth review is needed to assess how these imbalances evolved.
Analyses integrated in this country report provide an in-depth review of how the imbalances identified have developed. In particular, analyses relevant for the in-depth review can be found in this section, Section 1 and the entire Section 4. (
)
Imbalances and their gravity
Structural shortcomings are at the root of Italy's macroeconomic imbalances. The more negative performance of the Italian economy relative to the rest of the euro area, in particular in terms of productivity, is largely explained by its structural weaknesses. The production structure has not evolved and adapted sufficiently to the heightened global competition and technological innovation characterising the last two decades (Pinelli et al., 2016; Calligaris et al., 2016). Furthermore, banks are currently burdened by a large stock of non-performing loans (NPLs) following the protracted crisis and might not be able to support fully an efficient allocation of resources. Finally, the high levels of long-term and youth unemployment also weigh on future economic growth prospects.
The high public debt-to-GDP ratio remains a major macroeconomic imbalance for the Italian economy. The level of public debt, at more than 130 % of GDP, means that significant resources are earmarked to cover debt servicing costs, to the detriment of more growth-enhancing items including education, innovation, infrastructure and a lower tax burden on factors of production. Moreover, the high public debt is coupled with low productivity growth, suggesting a weak capacity to equip the country with productivity-enhancing physical and digital infrastructure, up-to-date skills in the labour force and effective institutions. High public debt and low growth prospects limit the possibility of using fiscal automatic stabilisers in the event of negative economic shocks. The high public debt also makes the country vulnerable to financial market volatility in periods of increased risk aversion, with higher interest rates for the government that could in turn tighten financing conditions for the real economy. Italy experienced this vicious circle during the 2011-2012 sovereign debt crisis, when private investment collapsed.
Non-cost competitiveness factors continue to weigh on Italy's external competitiveness. Italy's production structure remains biased towards medium- and low-tech industries. The share of high-tech exports has increased only slightly (from the recent trough of around 8 % in 2008 to around 10 % in 2015). Consistently, Italy's revealed competitive advantage continues to be concentrated in traditional sectors such as textiles, footwear, leather and metal products (for goods) and tourism (for services).
The high level of non-performing loans (NPLs) hampers banks' support for investment growth. The protracted recession has burdened Italian banks with a systemic and historically high level of non-performing loans that stabilised only recently. In the third quarter of 2016, gross NPLs amounted to EUR 329 billion (or 16.5 % of total customer loans). Gross bad loans – NPLs with the worst recovery prospects – amounted to EUR 198 billion (net of loan-loss provisions, bad loans stood at EUR 85 billion). The NPL problem weighs on banks’ profitability and on the recovery of credit, thereby constituting a drag on investment (see Sections 1 and 4.2). Under these conditions, banks may find it challenging to support any future increase in (the still-depressed) credit demand. Meanwhile, credit conditions remain particularly tight for small and medium enterprises and the construction sector.
The protracted recession and the subsequent slow recovery have resulted in high unemployment – particularly for young people – affecting social cohesion and possibly entailing permanent effects on growth. The unemployment rate was still 12 % in December 2016 (broadly unchanged compared to 2015, and against 9.6 % in the euro area), of which around 7 percentage points were unemployed for at least 12 months. Moreover, after averaging around 40 % in 2015, the youth unemployment rate (aged 15-24) was still above 40 % in December 2016 (around 21 % in the euro area). Finally, in Q3 2016 young people aged 15-24 who were not in education, employment or training still numbered over 1.2 million (or 20.9 %, i.e. one of the highest shares in the EU), albeit around 100 000 fewer than a year before (see Sections 1 and 4.3).
Evolution, prospects, and policy responses
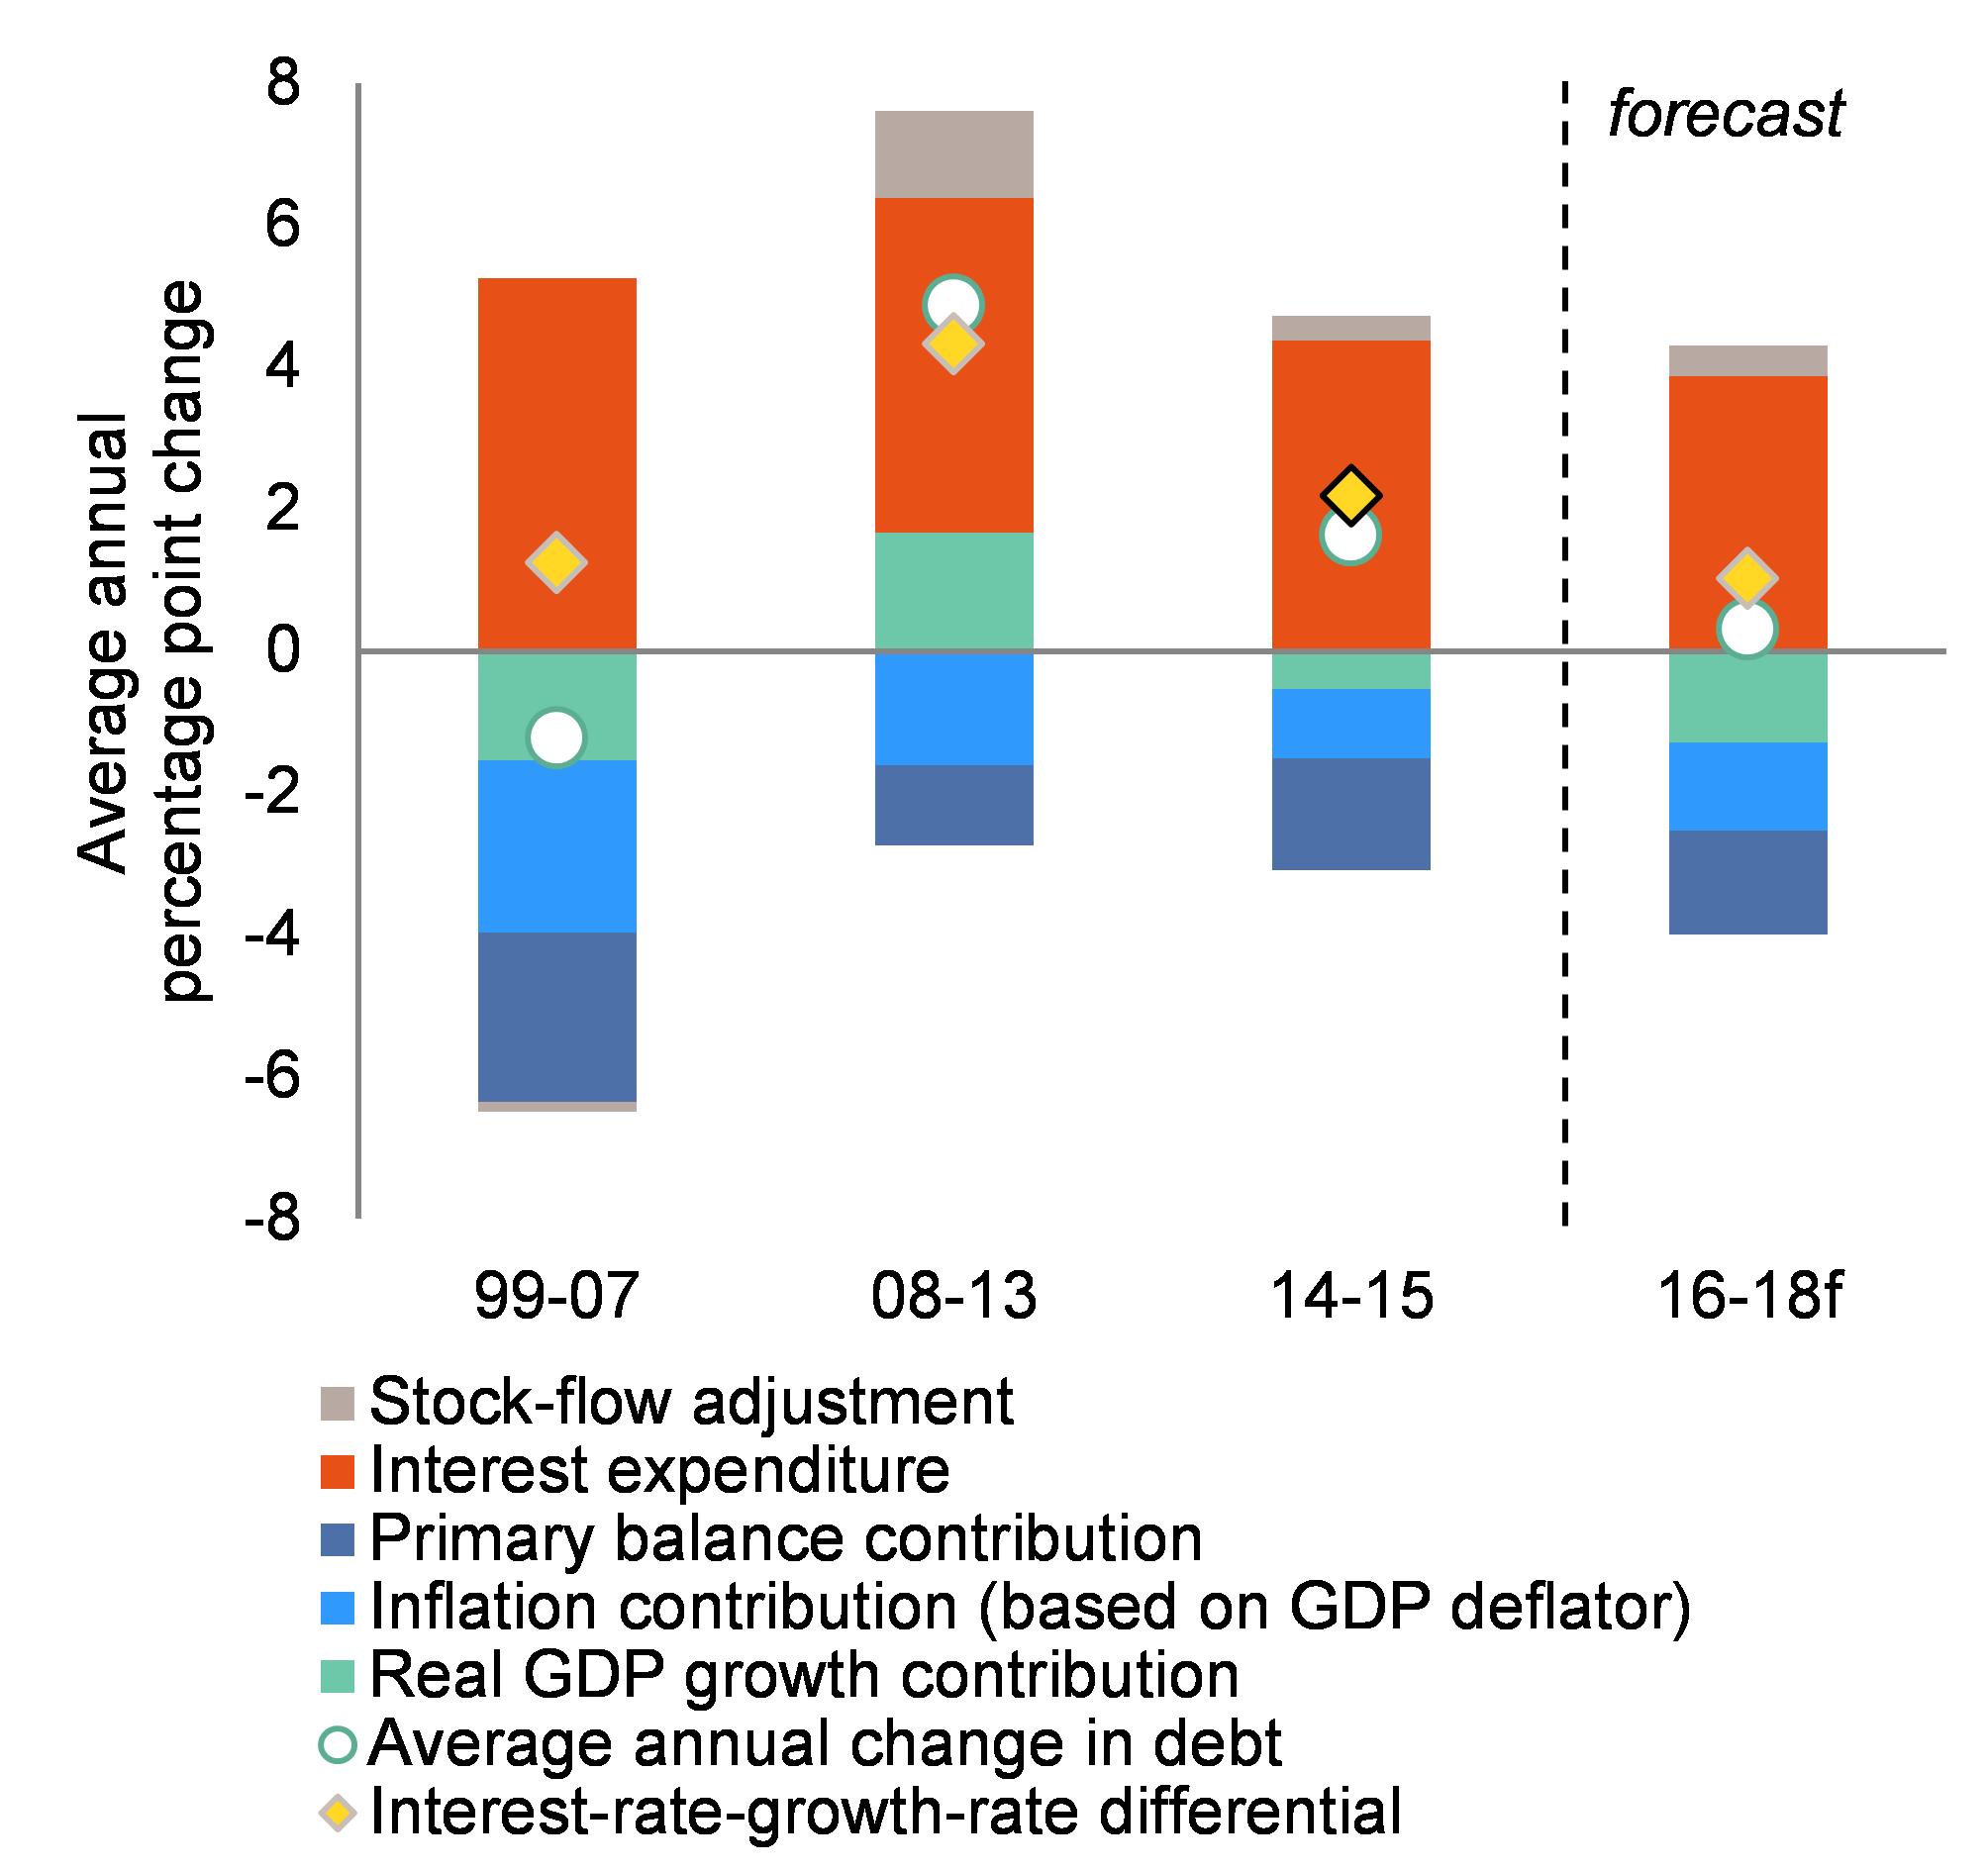
The public debt is forecast to stabilise at around 133 % of GDP in 2016-2018. After rising by around five percentage points per year on average during the double-dip recession of 2008-2013, Italy's government debt-to-GDP ratio continued to increase, but at a significantly slower pace (1.6 percentage points on average) in 2014-2015 (Graph 3.1). In 2016-2018, a broad stabilisation of the debt ratio is forecast, mainly thanks to the ECB's accommodative monetary policy which decisively contributes to reducing the differential between the average interest rate paid on debt and the GDP growth rate. The ECB’s action, and in particular its Public Sector Purchase Programme, helped to curb the average interest rate paid on the debt as new issuances of Italian government securities benefited from historically low nominal interest rates in 2016 (0.55 % on average, from 0.7 % in 2015 and 1.35 % in 2014). Low interest rates have in turn supported the GDP growth rate by underpinning a gradual economic recovery, while limiting the risk of outright deflation. As a result, the interest-rate-growth-rate differential is expected to go below the levels recorded before the crisis, and the Commission forecast projects a stabilisation of the debt-to-GDP ratio.
|
Graph 3.1:Drivers of change in Italy's public debt-to-GDP ratio
|
|
|
|
Source: European Commission
|
A weak fiscal position, together with modest growth prospects, makes Italy vulnerable to increases in risk aversion on financial markets. Italy carried out a sizeable fiscal adjustment between 2010 and 2013, with the headline deficit below 3 % of GDP as of 2012 (from more than 5 % in 2009) (see Section 1) and the primary surplus increasing to over 2 % of GDP. The Italian government eased its fiscal stance in recent years to support economic growth mainly by cutting the tax burden (see Sections 1 and 4.1) and by taking advantage of the fiscal space created by lower interest expenditure (-1.2 percentage points of GDP between 2012 and 2016). The headline deficit is set to decline to just below 2.5 % of GDP in 2016-2017, while the primary surplus is forecast to stabilise at around 1.5 % of GDP. In structural terms, the primary surplus is estimated to have declined from 3.9 % of GDP in 2013 to 2.3 % in 2016, and is expected to shrink further to 1.9 % in 2017. This relaxation in the fiscal stance was partially used to support investment and facilitate the adoption and implementation of structural reforms (for instance through tax incentives), while reducing the risk of entering a low-inflation-low-growth trap. Despite the rather low primary surplus, debt refinancing risks are mitigated in the short term by the ample liquidity provided by the ECB and the country's improved external position which makes it less reliant on external capital flows. Looking forward, a structural primary surplus of 1.3 % of GDP, as projected in the Commission forecast in 2018 (based on a no-policy-change assumption), would increase sustainability risks in the medium term (European Commission, 2016c). In particular, a weak fiscal position when the accommodative monetary policy is eventually phased out might raise risk premia. By contrast, a progressively improving fiscal position would help to maintain financial markets' confidence and low interest rates, which would in turn support private investment and growth prospects.
The share of government securities held by Italian banks has decreased only slightly. Since the start of the ECB’s Public Sector Purchase Programme (PSPP) at the beginning of 2015, the share of public debt held by the Bank of Italy increased substantially. However, only a minor reduction was recorded in Italian banks' exposure to the sovereign (from EUR 398 billion at the end of 2015 to EUR 383 billion, or 23 % of GDP, at the end of 2016). At the same time, foreign private investors remain rather reluctant to invest in Italy and their share of public debt declined slightly (from 30 % in June 2015 to 28.4 % in June 2016) (
) (Bank of Italy, 2016a). Furthermore, due to low or negative interest rates, Italian households cut their direct holdings of government bonds and further diversified their financial investment, increasing their exposure to foreign markets. The Public Sector Purchase Programme and favourable long-term refinancing conditions for banks, together with the lack of appetite for financial investment in Italy and the continued diversification of residents’ portfolios into foreign assets entail increasing TARGET2 liabilities of the Bank of Italy towards the Eurosystem (EUR 357 billion or more than 20 % of GDP at the end of 2016, from EUR 249 billion at the end of 2015).
The average debt maturity increased slightly but spreads vis-à-vis German sovereign bond yields have widened. Regarding debt structure, Italy’s debt management office took advantage of historically low interest rates through the increase in long-term fixed-rate bonds issuances. As a result, the average maturity of government bonds rose to 6.76 years in December 2016 (from 6.52 and 6.38 years at the end of 2015 and 2014 respectively), while the share of long-term fixed-rate bonds rose to around 70 % (from 68 % at end-2015). However, after averaging around 130 basis points in the first ten months of 2016, spreads between Italian and German 10-year bond yields widened and stood at more than 170 basis points in January 2017, possibly due to political uncertainty.
|
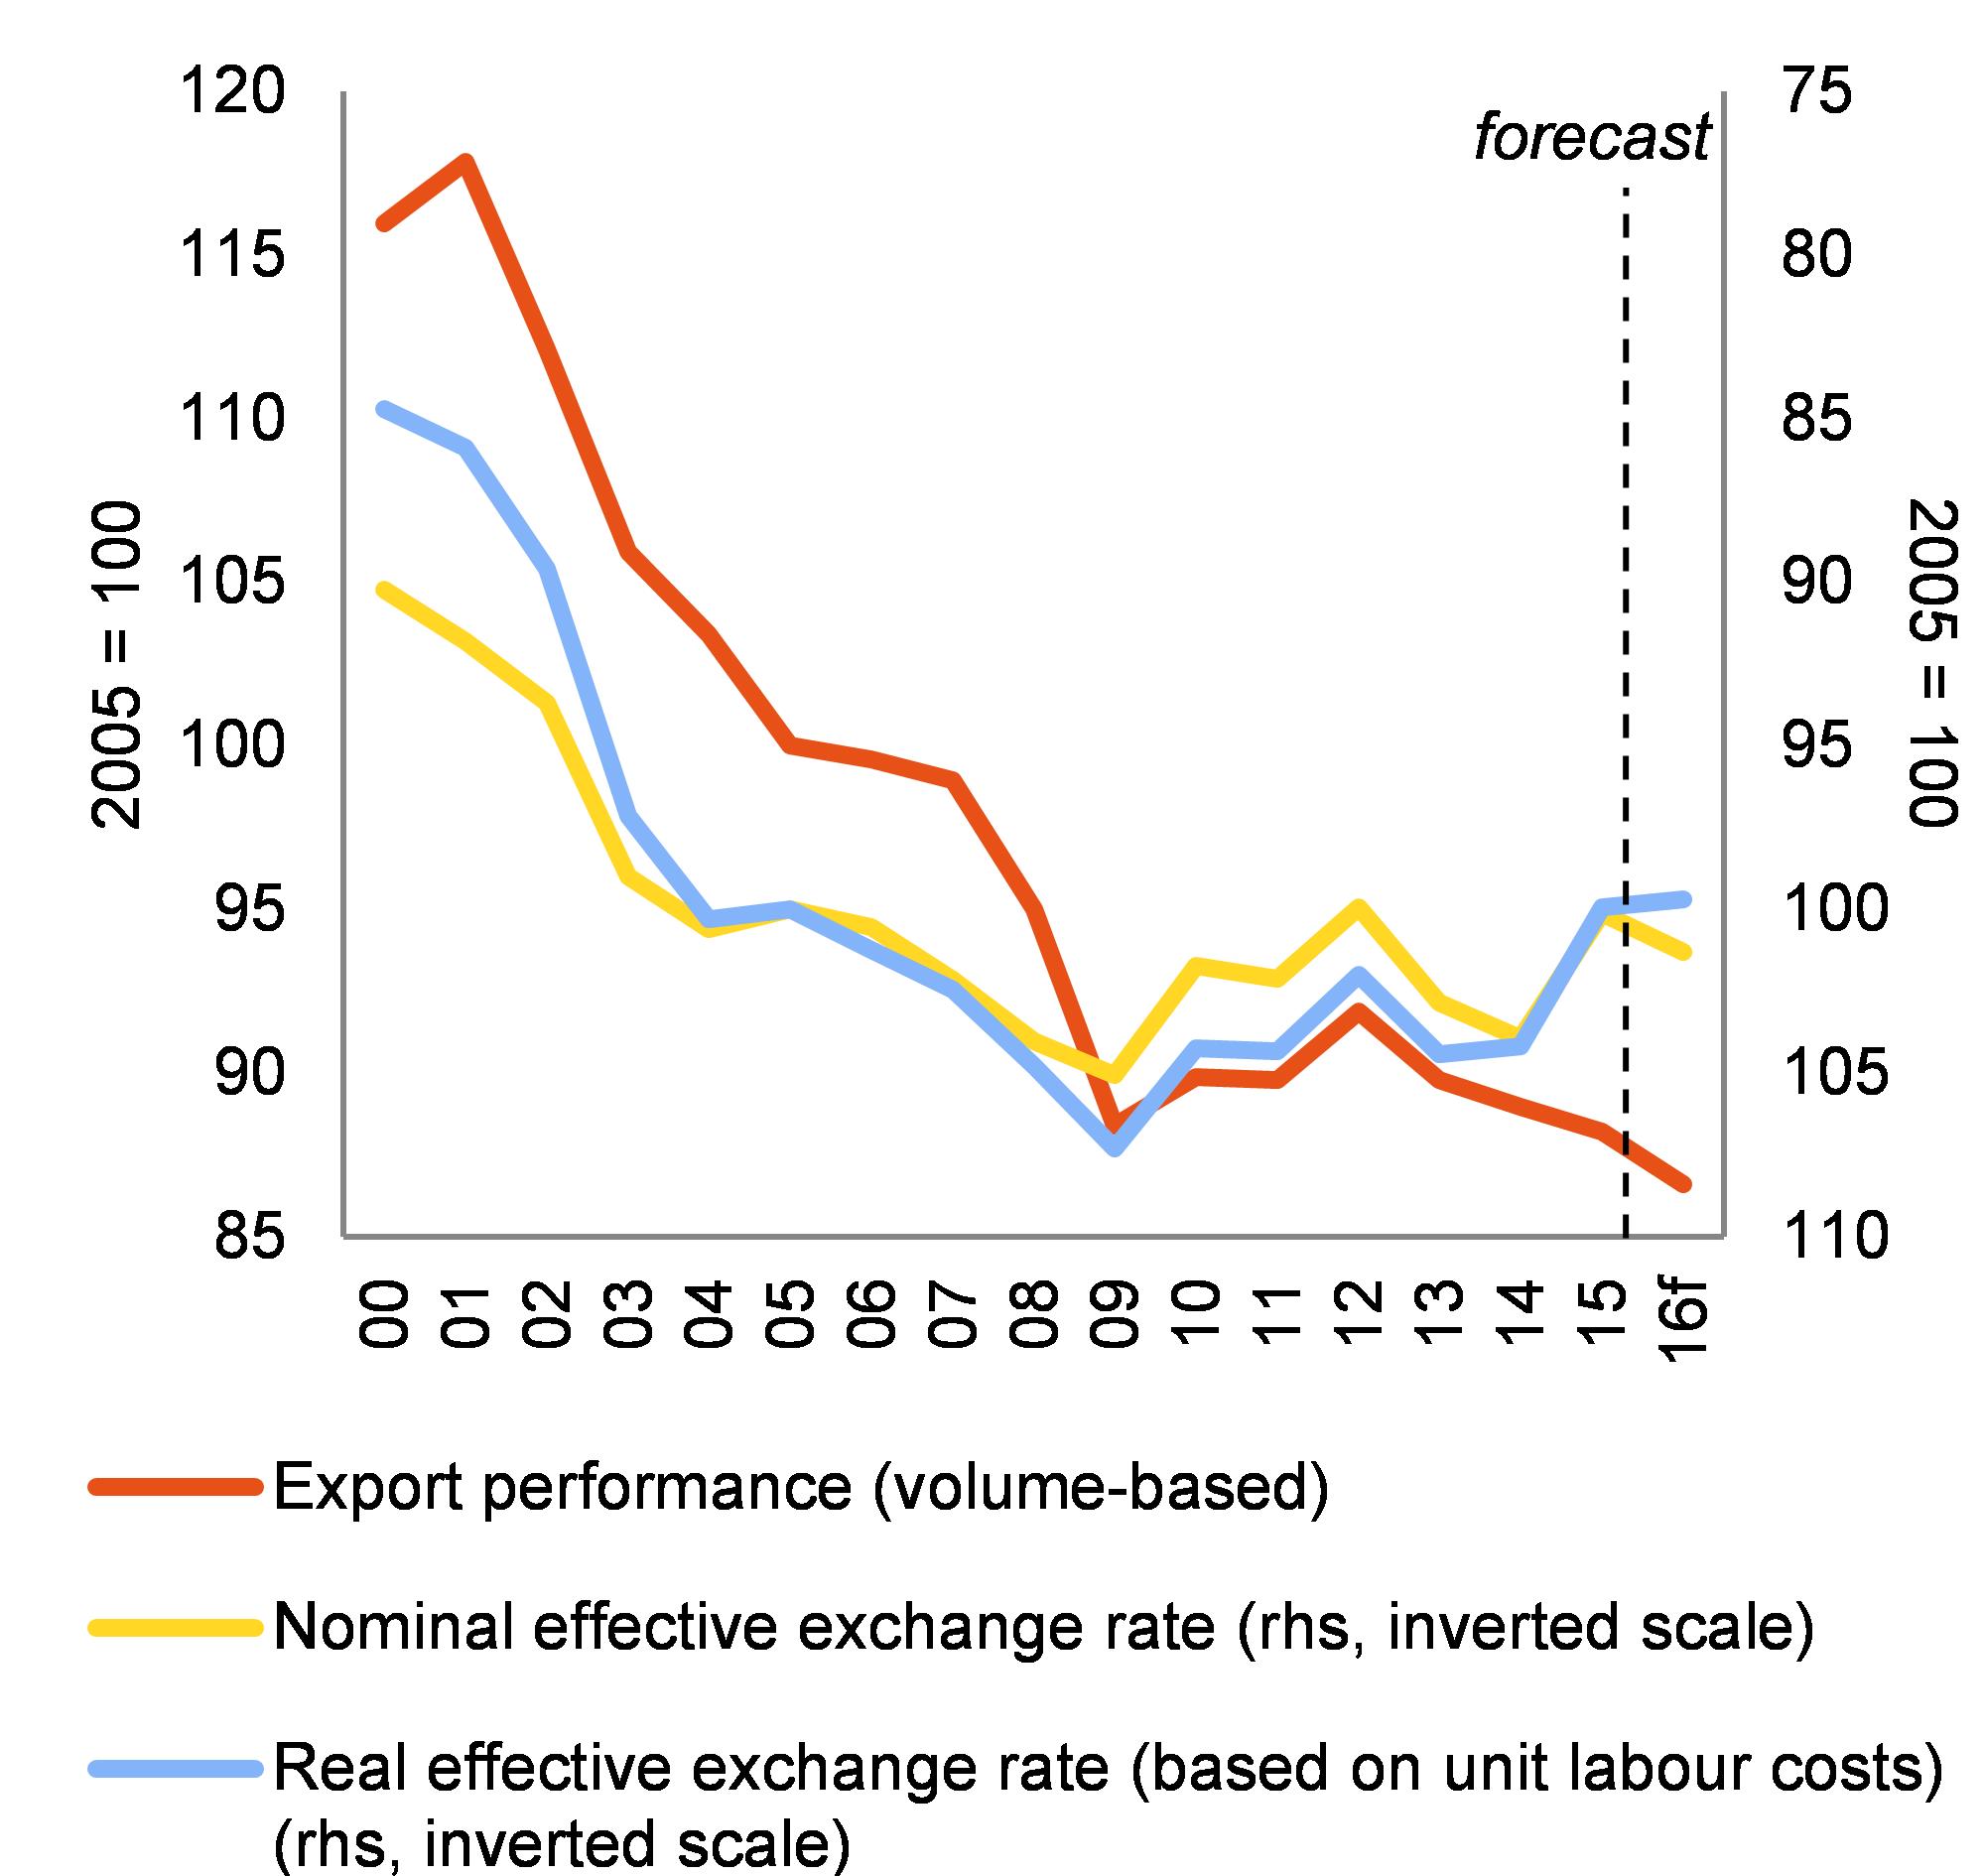
Graph 3.2:Italy’s export performance, exchange rate and cost competitiveness indicators
|
|
|
|
Source: European Commission
|
Italy's export performance broadly stabilised, also supported by the depreciation of the euro. After sizeable export market share losses in the first decade of the century, Italian exports (in volumes) have been growing at a pace more in line with external demand since 2010 (Graph 3.2). The improved export performance has been supported by the depreciation of the euro, which entailed some decline in Italy's nominal effective exchange rate vis-à-vis its trade partners. These developments, together with moderate increases in unit labour costs, led to a moderate recovery in the country's cost competitiveness in recent years. Still, despite the more favourable exchange rate, slight market share losses are expected for 2016.
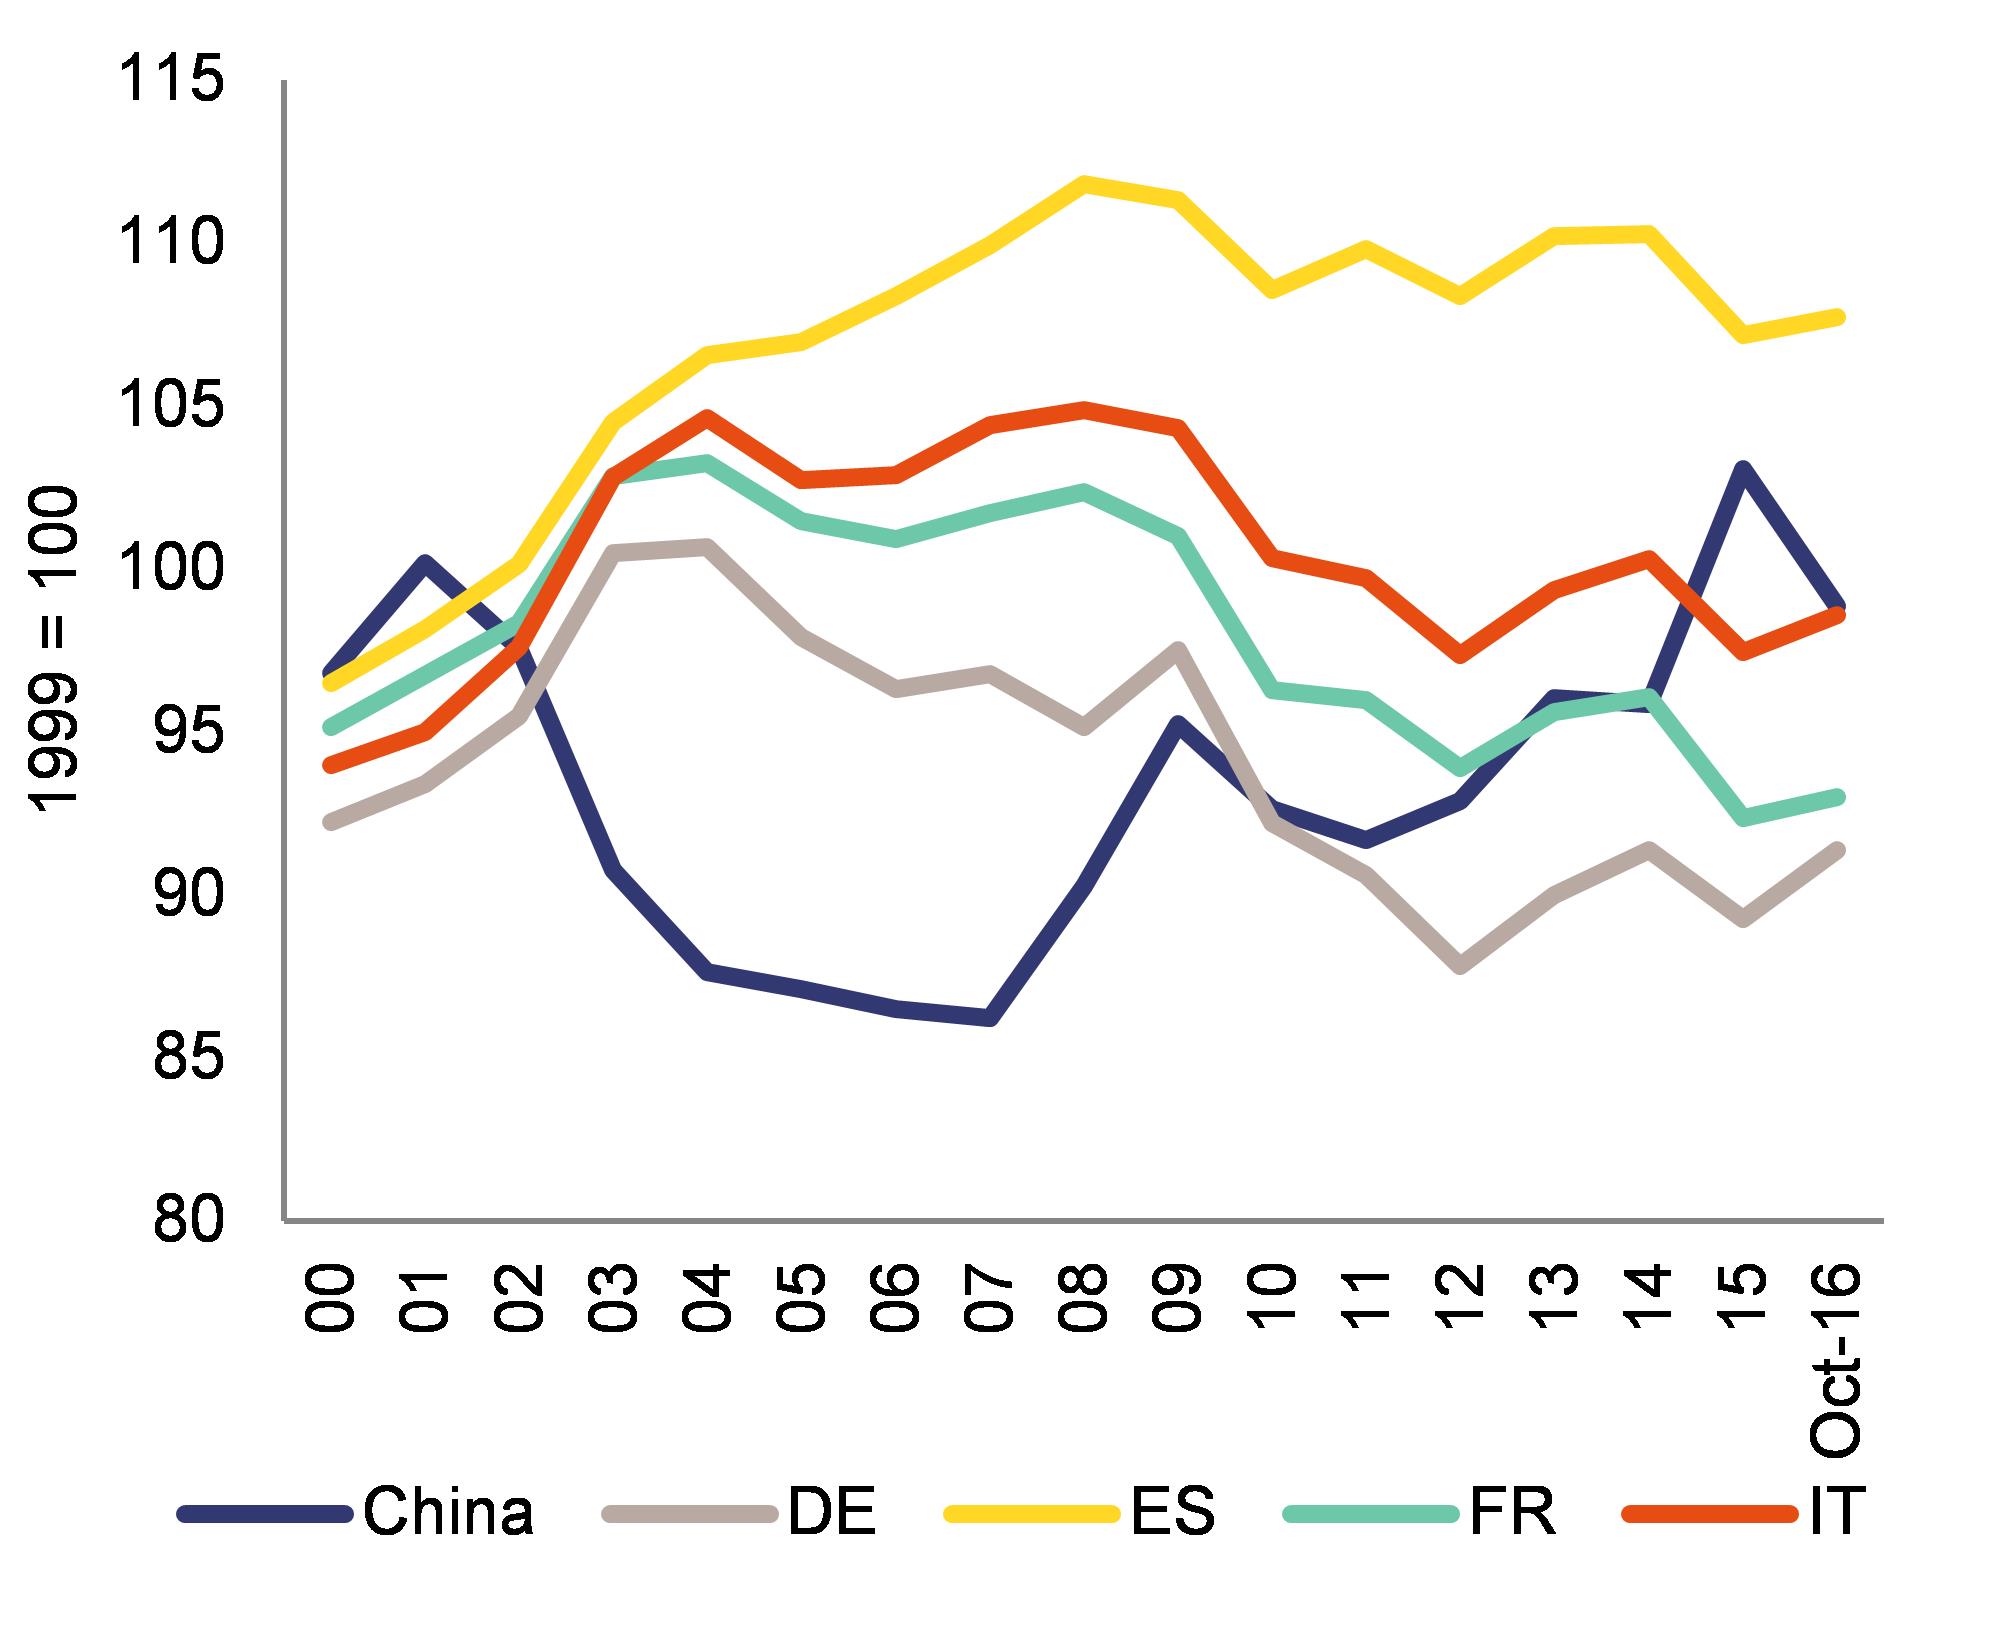
Italy's price competitiveness based on producer prices has somewhat improved. The producer price gap accumulated vis-à-vis France and Germany since euro adoption has stabilised. However, the rather positive price competitiveness performance of Italian manufacturing firms implied a steady reduction in their profit margins up to 2013 mainly due to more dynamic developments in nominal unit labour costs. In recent years, manufacturing firms' profit margins have recovered somewhat thanks to the moderation in nominal unit labour costs and lower energy costs (Centro Studi Confindustria, 2016). Furthermore, the growth of Italy's manufacturing producer prices has been significantly more moderate than the one of China's since 2007, possibly due to the upgrade of the global supply chain production of China (Graph 3.3).
|
Graph 3.3:Price competitiveness based on producer prices in manufacturing, 12-month averages
|
|
|
|
Source: Bank of Italy (based on ECB, CEPII, Eurostat, IMF, OECD and UN data and national statistics)
|
Progress in reducing the large stock of non-performing loans (NPLs) is limited. Compared to the end of 2015, the gross stock of NPLs has come down only marginally. The inflow of new NPLs has decreased since early 2015, but unlikely-to-pay and to a lesser extent past-due loans are still migrating to the bad loan category. Meanwhile, several factors still hold back the pace at which banks are working out or selling NPLs. These include in particular the considerable gap between the valuation of NPLs by banks and investors which hinders the development of a secondary market for impaired assets in Italy, as well as banks’ low internal capital generation and impaired capacity to raise fresh capital so further loan losses could be absorbed. Several measures have been taken by the authorities to help banks address their NPL problem and to increase the efficiency of the banking sector (see Section 4.2).
The labour market is improving gradually. Employment developments since 2014 have been rather positive in Italy, despite the weak economic recovery. After increasing by 0.4 % in 2014 and 0.8 % in 2015, employment rose by 1.2 % in 2016. The abolition of the regional tax on economic activities (IRAP) on permanent employment, the labour market reform and tax incentives for new permanent hires contributed to this improvement. However, slow economic growth has not been conducive to a swift absorption of long-term unemployment and of youngsters entering the labour market.
Overall assessment
In spite of a few positive developments, macroeconomic imbalances are not unwinding yet. The public debt-to-GDP ratio is expected to have risen further to around 133 % in 2016 and to remain at that level in the coming years. The high public debt thus remains a major source of vulnerability for the Italian economy and a source of negative spillovers for the euro area. Moreover, structural shortcomings continue to hamper investment, innovation and a faster upgrade of Italy's production structure. The resulting low productivity growth suggests that further progress with reforms is needed to enhance Italy's growth prospects and facilitate public sector deleveraging. External cost and price competitiveness stabilised thanks to the depreciation of the euro and overall wage moderation. The adjustment process in the labour market is proceeding gradually with labour market participation and employment on the rise, resulting in a gradual decline in the unemployment rate. Still, long-term and youth unemployment remain high and weigh on growth prospects. The adjustment in the banking sector in response to the crisis-driven deterioration in asset quality and long-standing structural weaknesses continues to face significant challenges. Several reforms were implemented to address the 2016 country-specific recommendations, which in the case of Italy are all related to its macroeconomic imbalances (see Section 2). However, most of these reforms, if consistently implemented, will impact on significant stock imbalances (e.g. the high public debt ratio) only in the medium term.
|
|
|
|
|
|
|
|
|
|
|
|
|
Table 3.1:MIP Assessment Matrix (*) - Italy
|
|
|
|
|
|
(Continued on the next page)
|
|
Table (continued)
|
|
|
|

|
|
Source: European Commission
|
|
|
4.
Reform priorities
4.1.
Public finances and taxation
4.1.1.fiscal framework*
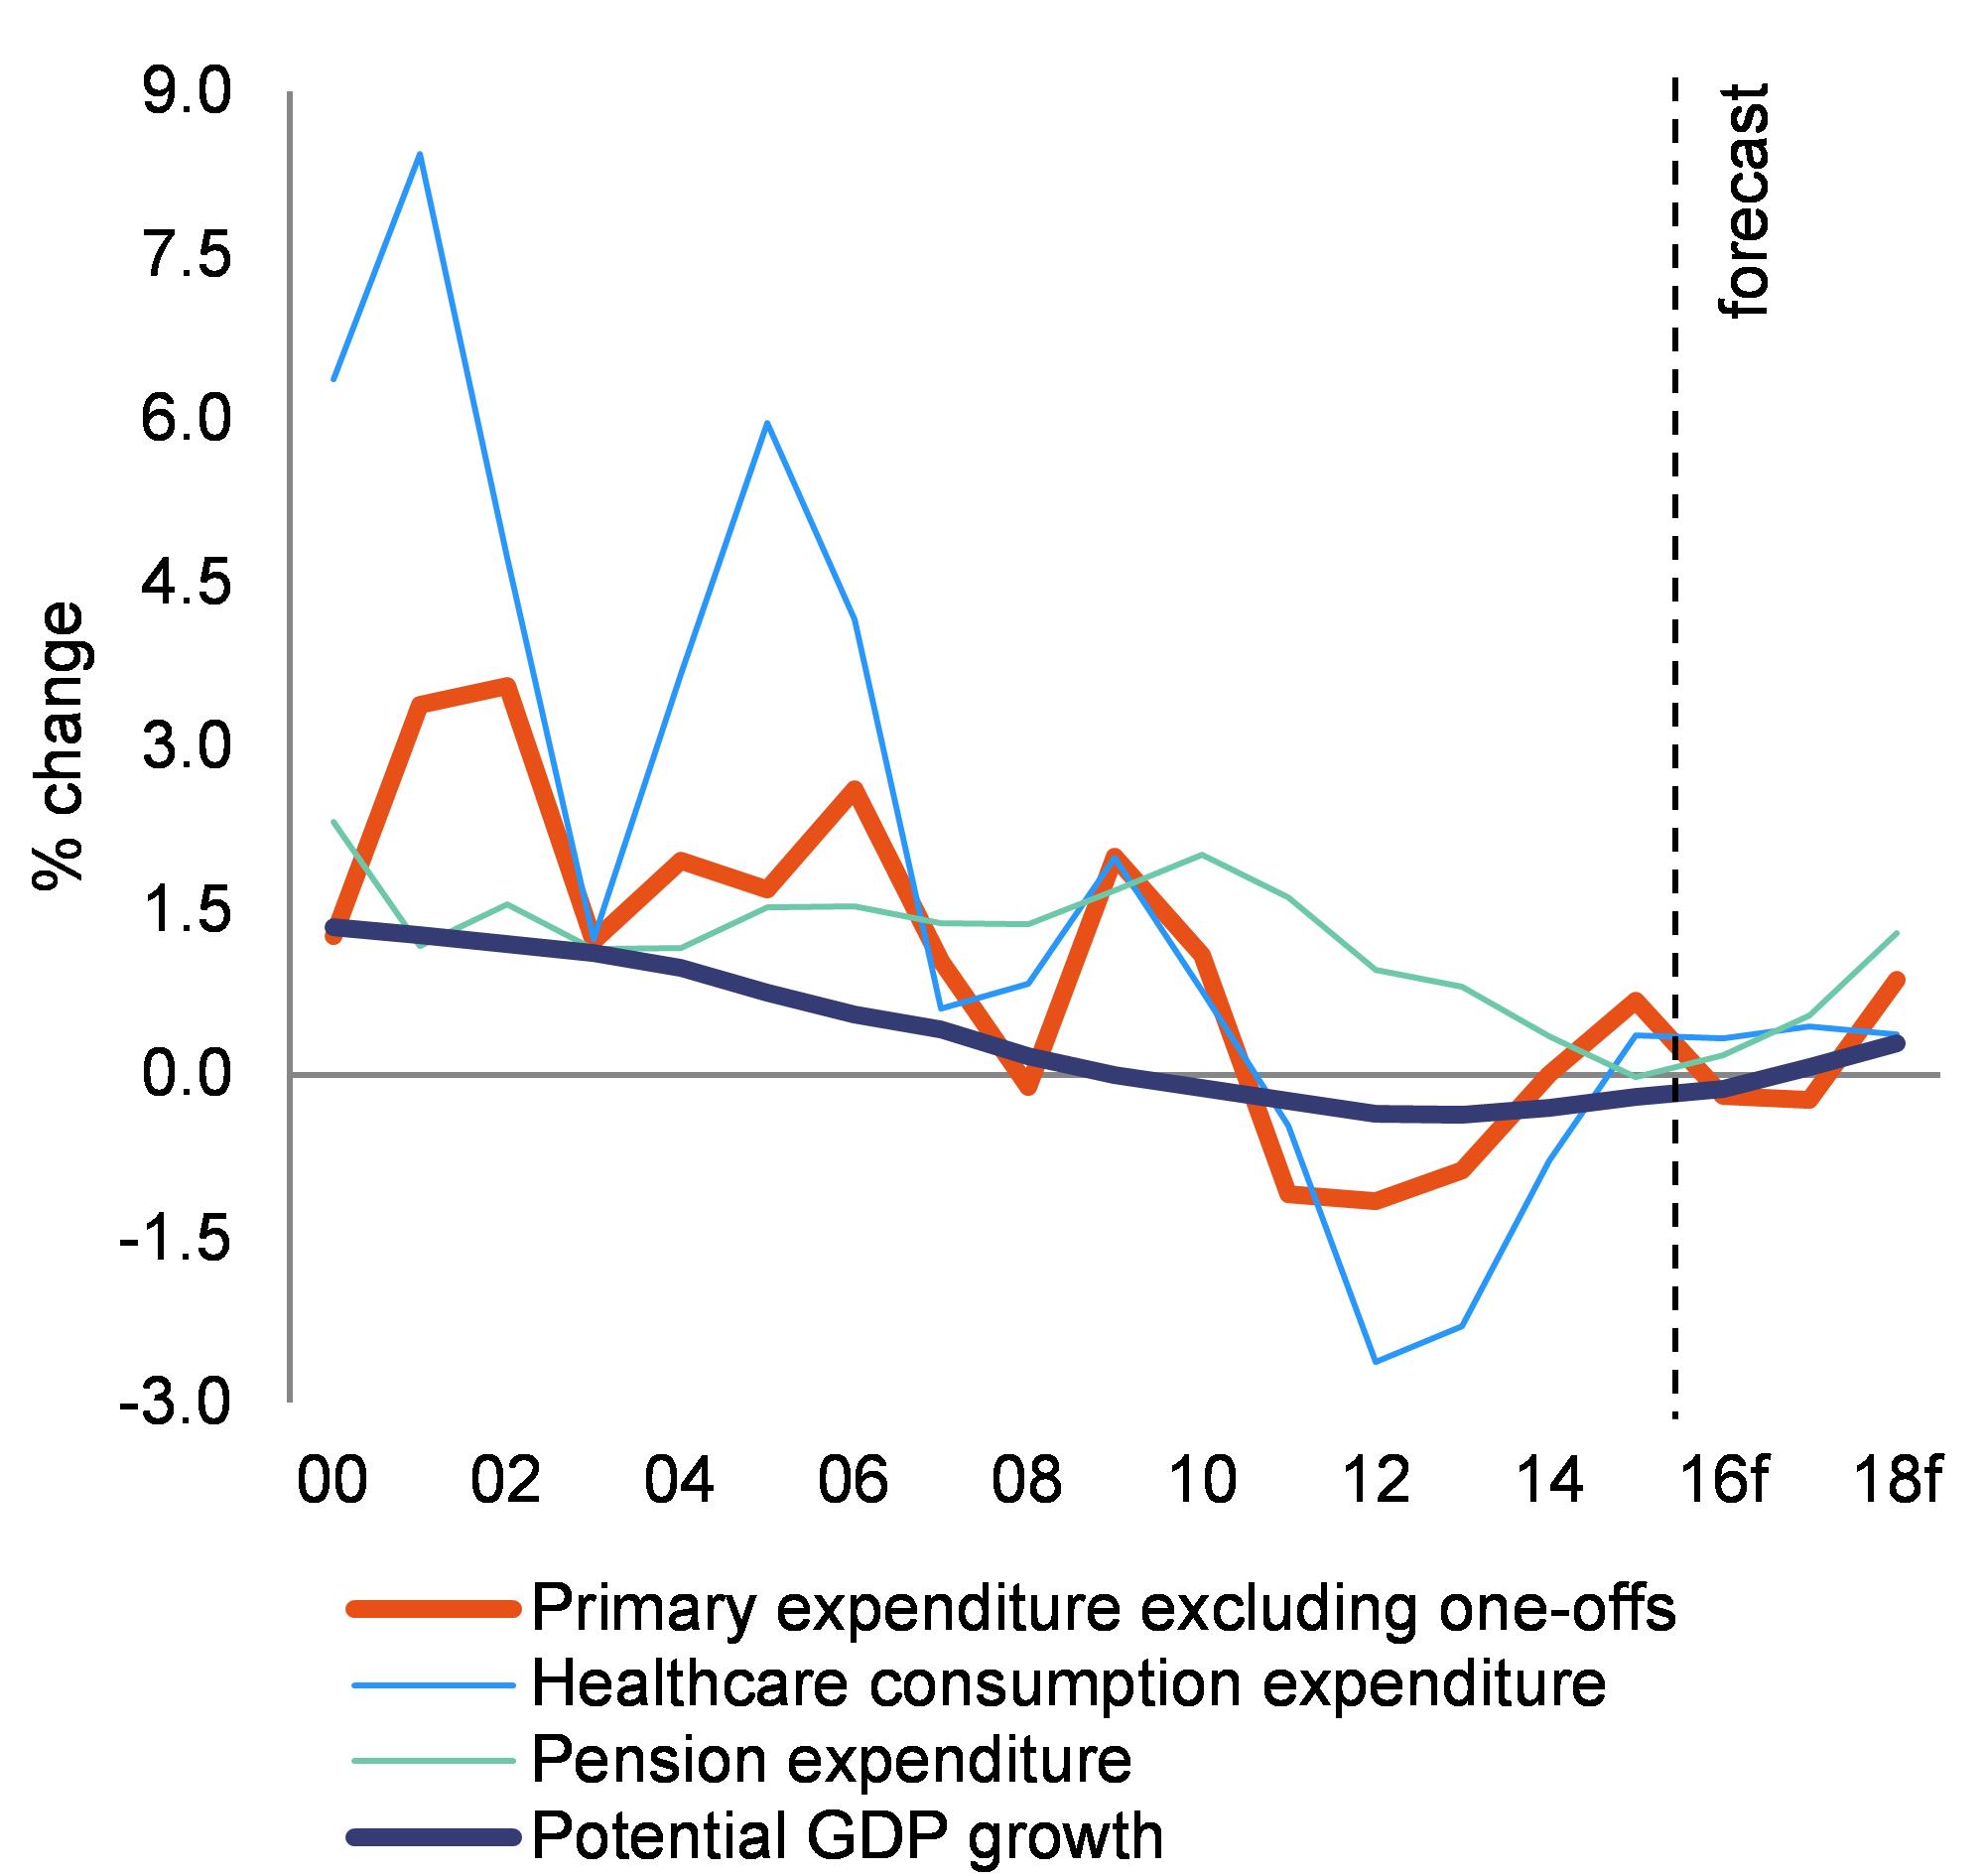
A major challenge for Italy is to align public expenditure dynamics with sluggish potential growth. Real general government primary expenditure has been increasing above potential growth since the end of the 1990s (Graph 4.1.1). This reflects both insufficient containment of specific spending items such as pensions and healthcare, and low potential growth. The dynamics of real healthcare expenditure were contained significantly after the excessive deficit procedure in 2005-2008 and entered negative territory when the sovereign debt crisis required swift action to restore fiscal sustainability. Moreover, the ‘Fornero’ reform started restraining real pension spending in 2012. All this contributed to primary expenditure growing below (negative) potential growth in 2010-2013 and broadly coming into line thereafter. However, expenditure control was also pursued through cuts in investment spending in infrastructure, education and innovation, which may have further weighed on the already low potential economic growth. As a result, unless the scope of government action is reduced or potential growth is restored, it may be difficult to compress further real primary spending in line with the expenditure benchmark of the Stability and Growth Pact to fund a cut in the tax burden on the factors of production (Lorenzani and Reitano, 2015).
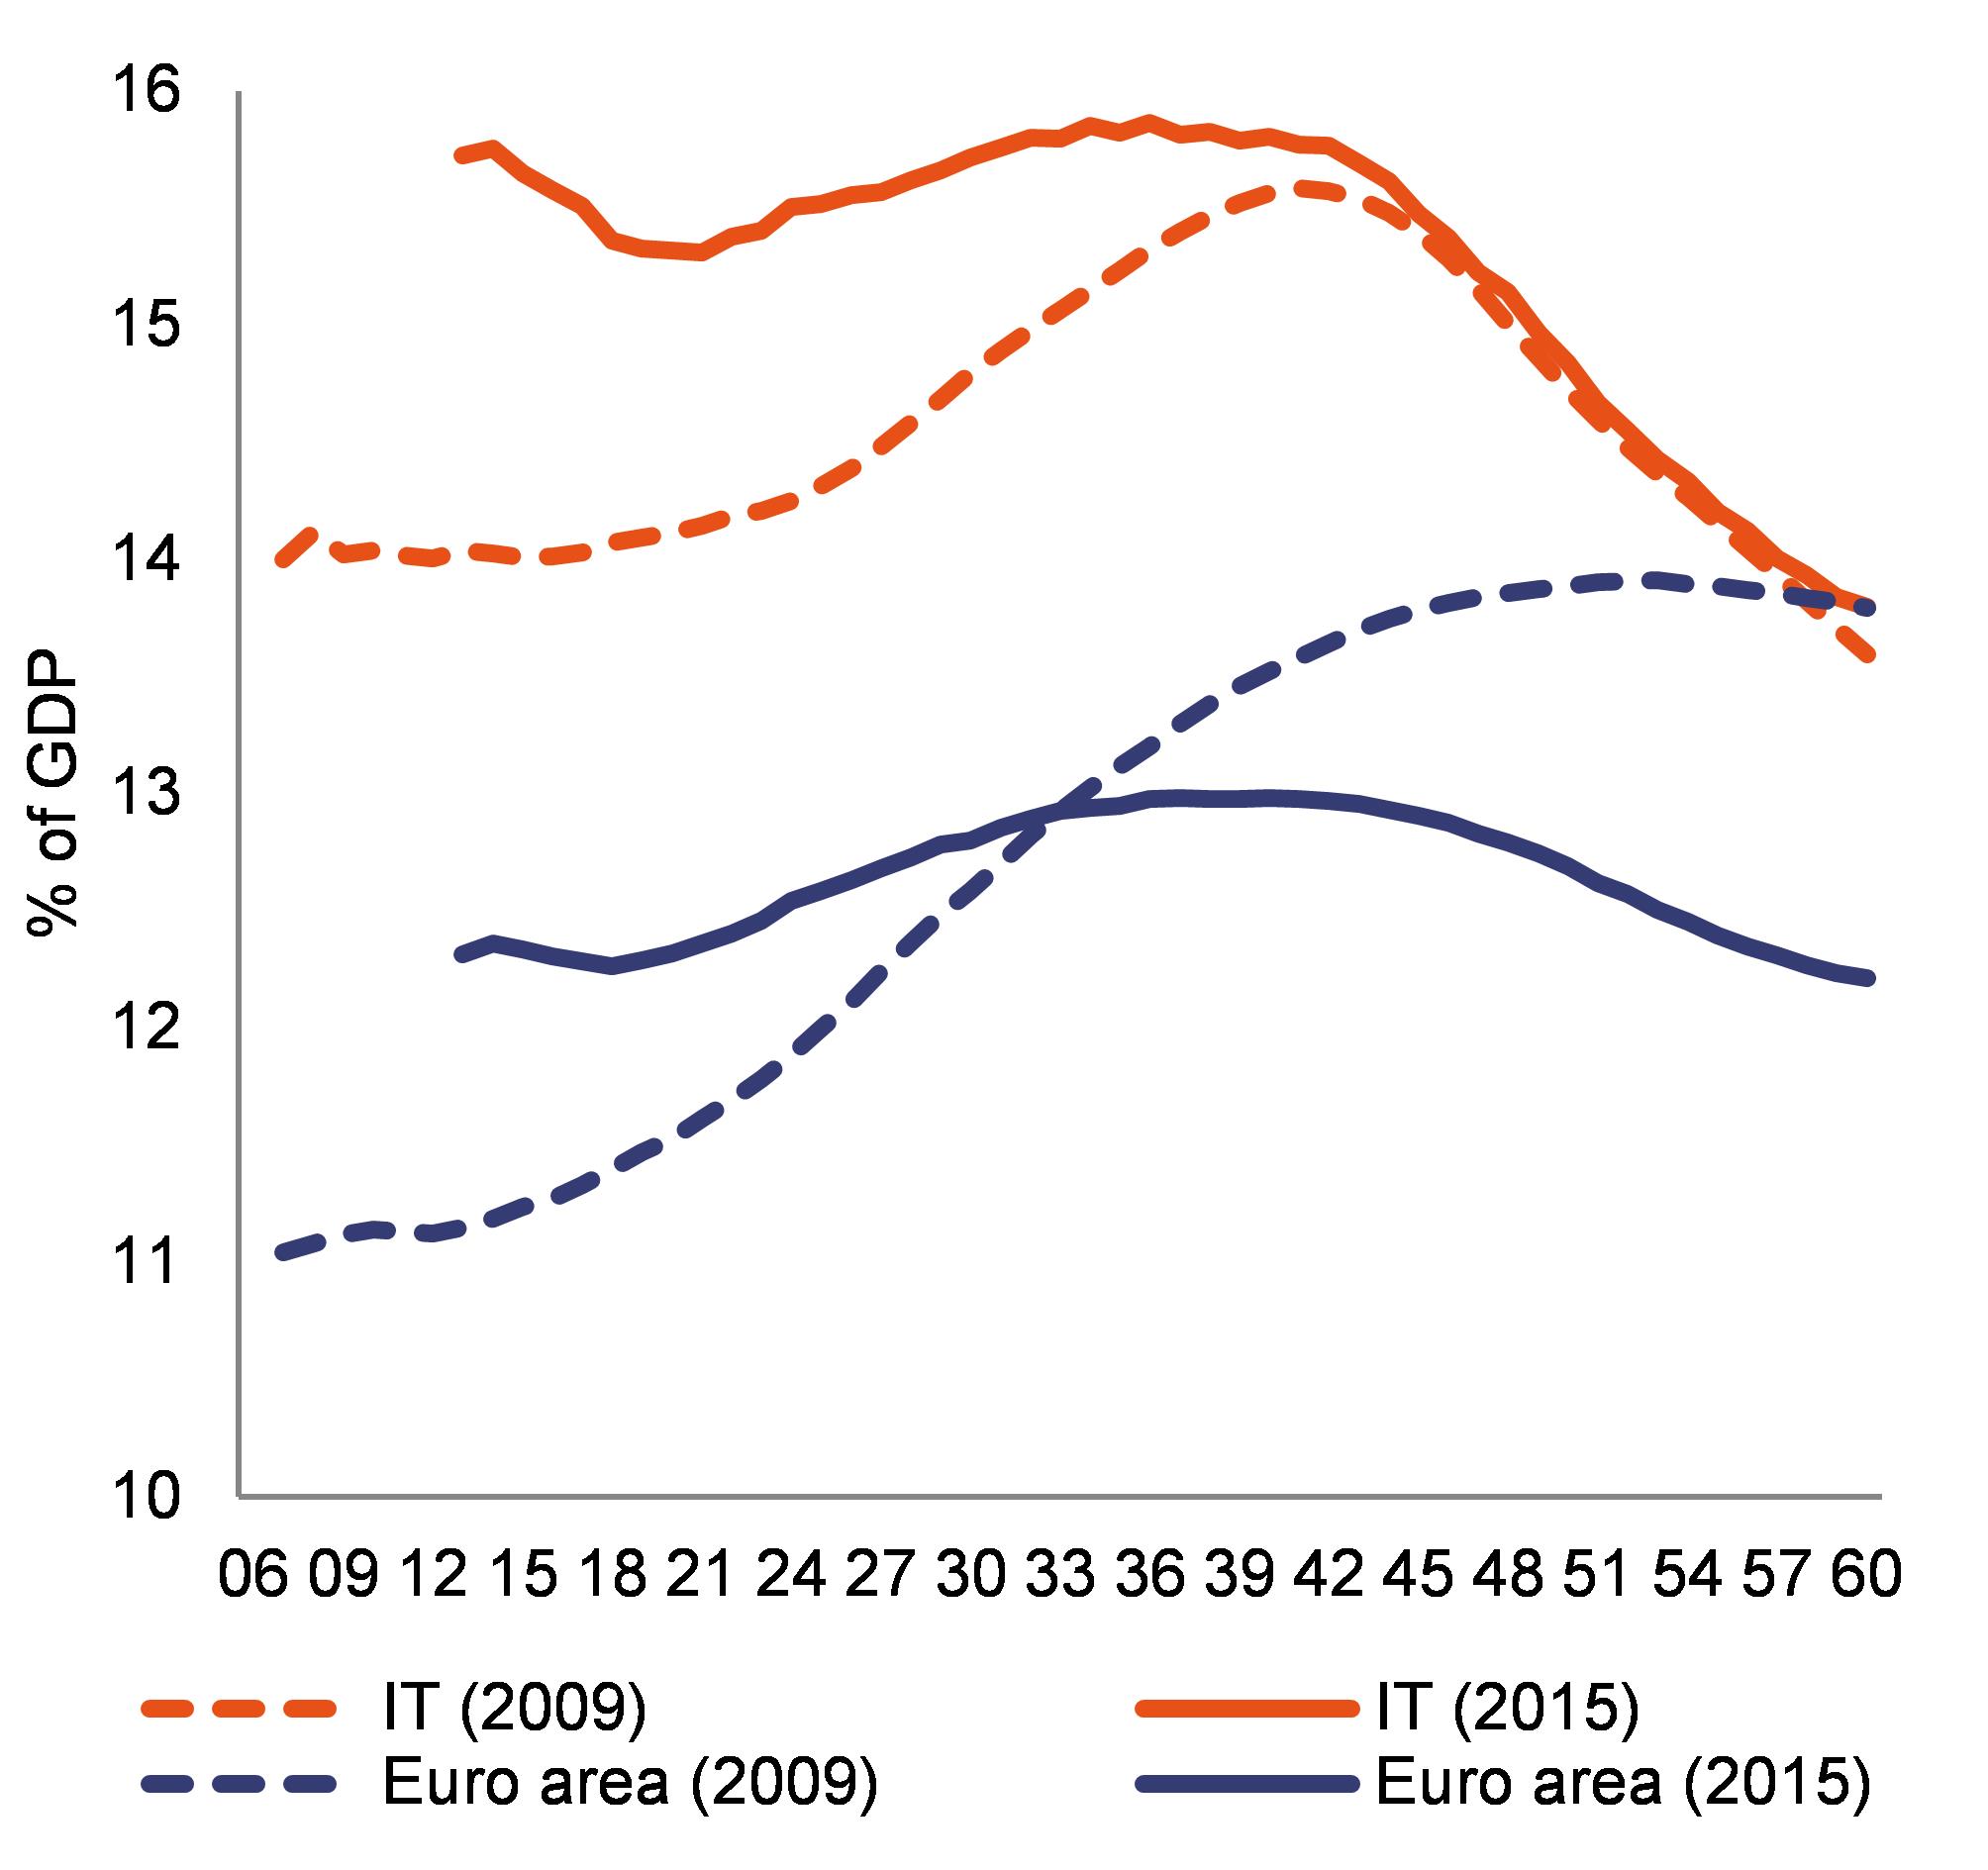
Recent measures on pensions go in the wrong direction. In 2007-2011, the level of pension spending as share of GDP increased markedly, before the Fornero reform contributed to its slowdown (Graph 4.1.2). As a result of the pension reforms enacted as of 2004, and in particular the Fornero reform, the average retirement age will increase from 60 to 68 years by 2050, thus resulting in lower cumulative pension expenditure by 60 % of GDP in the long term (Ministry of Economy and Finance, 2016a). However, the 2017 budget involves measures that partially reverse the Fornero reform: minimum pensions are raised, earlier retirement is allowed for specific categories of employees (either on a voluntary basis through a bank loan supported by a tax credit or as social care measures introduced on an experimental basis for workers in need), and some penalties previously introduced to offset incentives for early retirement under the old generous defined-benefit system will be repealed as of 2018. Such measures (not reflected in Graph 4.1.2) are set to raise the already-high pension expenditure in Italy (at 15.4 % in 2015, one of the highest in the OECD as a share of GDP, and over a third of total primary expenditure in Italy), causing it to grow above potential growth (Graph 4.1.1). As a result, resources may be taken away from more growth-enhancing measures to the detriment of younger generations. This has been highlighted also by the now fully operational Parliamentary Budget Office, Italy’s independent fiscal monitoring institution. Besides, the emphasis on the need to work longer and achieve higher labour market participation could be further weakened, with negative impact on growth prospects.
|
Graph 4.1.1:Evolution of government real primary expenditure and potential GDP growth
|
|
|
|
Source: European Commission
|
|
Graph 4.1.2:Long-term projections of gross public pensions expenditure
|
|
|
|
Source: European Commission, 2009; European Commission, 2015b.
|
The ongoing spending review also involves revising the budgetary process and centralising public procurement. Savings targets have been gradually reduced, partly because they turned out to be ambitious without addressing large spending items such as pensions or public transport and given the limited state leverage on regional and local spending. However, further measures to rationalise public spending were taken in 2016 and the reform of the budgetary process (started in 2009) was finalised. More specifically: (i) the content and function of programmes in the budget are specified by emphasising the targets to be achieved; (ii) a reinforced cash principle is set to improve management and monitoring; (iii) planned revenues and expenditure allocations are integrated in one act, together with the legislative acts needed to reach the target. If consistently implemented, these measures may in the future make the spending review a more structural feature of the budgetary process and better align the latter with a performance-budgeting approach. The systematic implementation of each ministry’s spending review targets has been de facto postponed to 2017, however. Frequent updates of the budgetary targets weaken the medium-term budgetary framework, and the recent practice of including large tax increases (ʽsafeguard clauses’) in the three-year budget to fill the gap between trends and targets and repealing them later made the budget unreliable for medium-term planning. On the positive side, ministers were directly involved in selecting areas of their own budgets contributing to targeted savings; centralised public procurement is being gradually extended to the regional level and 36 000 purchasing bodies have been reduced to 33 aggregator centres, with around EUR 16 billion (0.9 % of GDP) of annual public spending under their remit. The government has recently identified spending thresholds and 34 product categories for which administrations should opt for centralised procurement, and a technical working group is proposing further categories. The national anti-corruption authority has a role in assessing these categories and supervising centralised procurement.
4.1.2.taxation*
The tax burden on production factors, one of the highest in the EU, has been gradually reduced. In 2015, Italy’s tax wedges on low-wage and average-wage single workers were among the highest in the EU, at 41 % and 48 % respectively (European Commission, 2016e). In 2014, the implicit tax rate on labour was the highest in the EU (44 %, as against the EU average of 36 %) and the tax burden on capital stood well above the EU average (10.6 % of GDP, as against 8.2 %). Moreover, features of Italy’s tax collection system might further deter investment, as it takes much longer than in the rest of the EU for a small business to file tax returns (240 hours per year, as against the EU average of 176) (World Bank, 2016). Therefore, the 2015 and 2016 budgets reduced the labour tax wedge and corporate income taxes (
), and the 2017 budget included a new flat-tax regime for small businesses (IRI) and incentives for private investment (see Sections 4.4 and 4.5). The ‘Committee on Environmental Taxation’ has yet to be established.
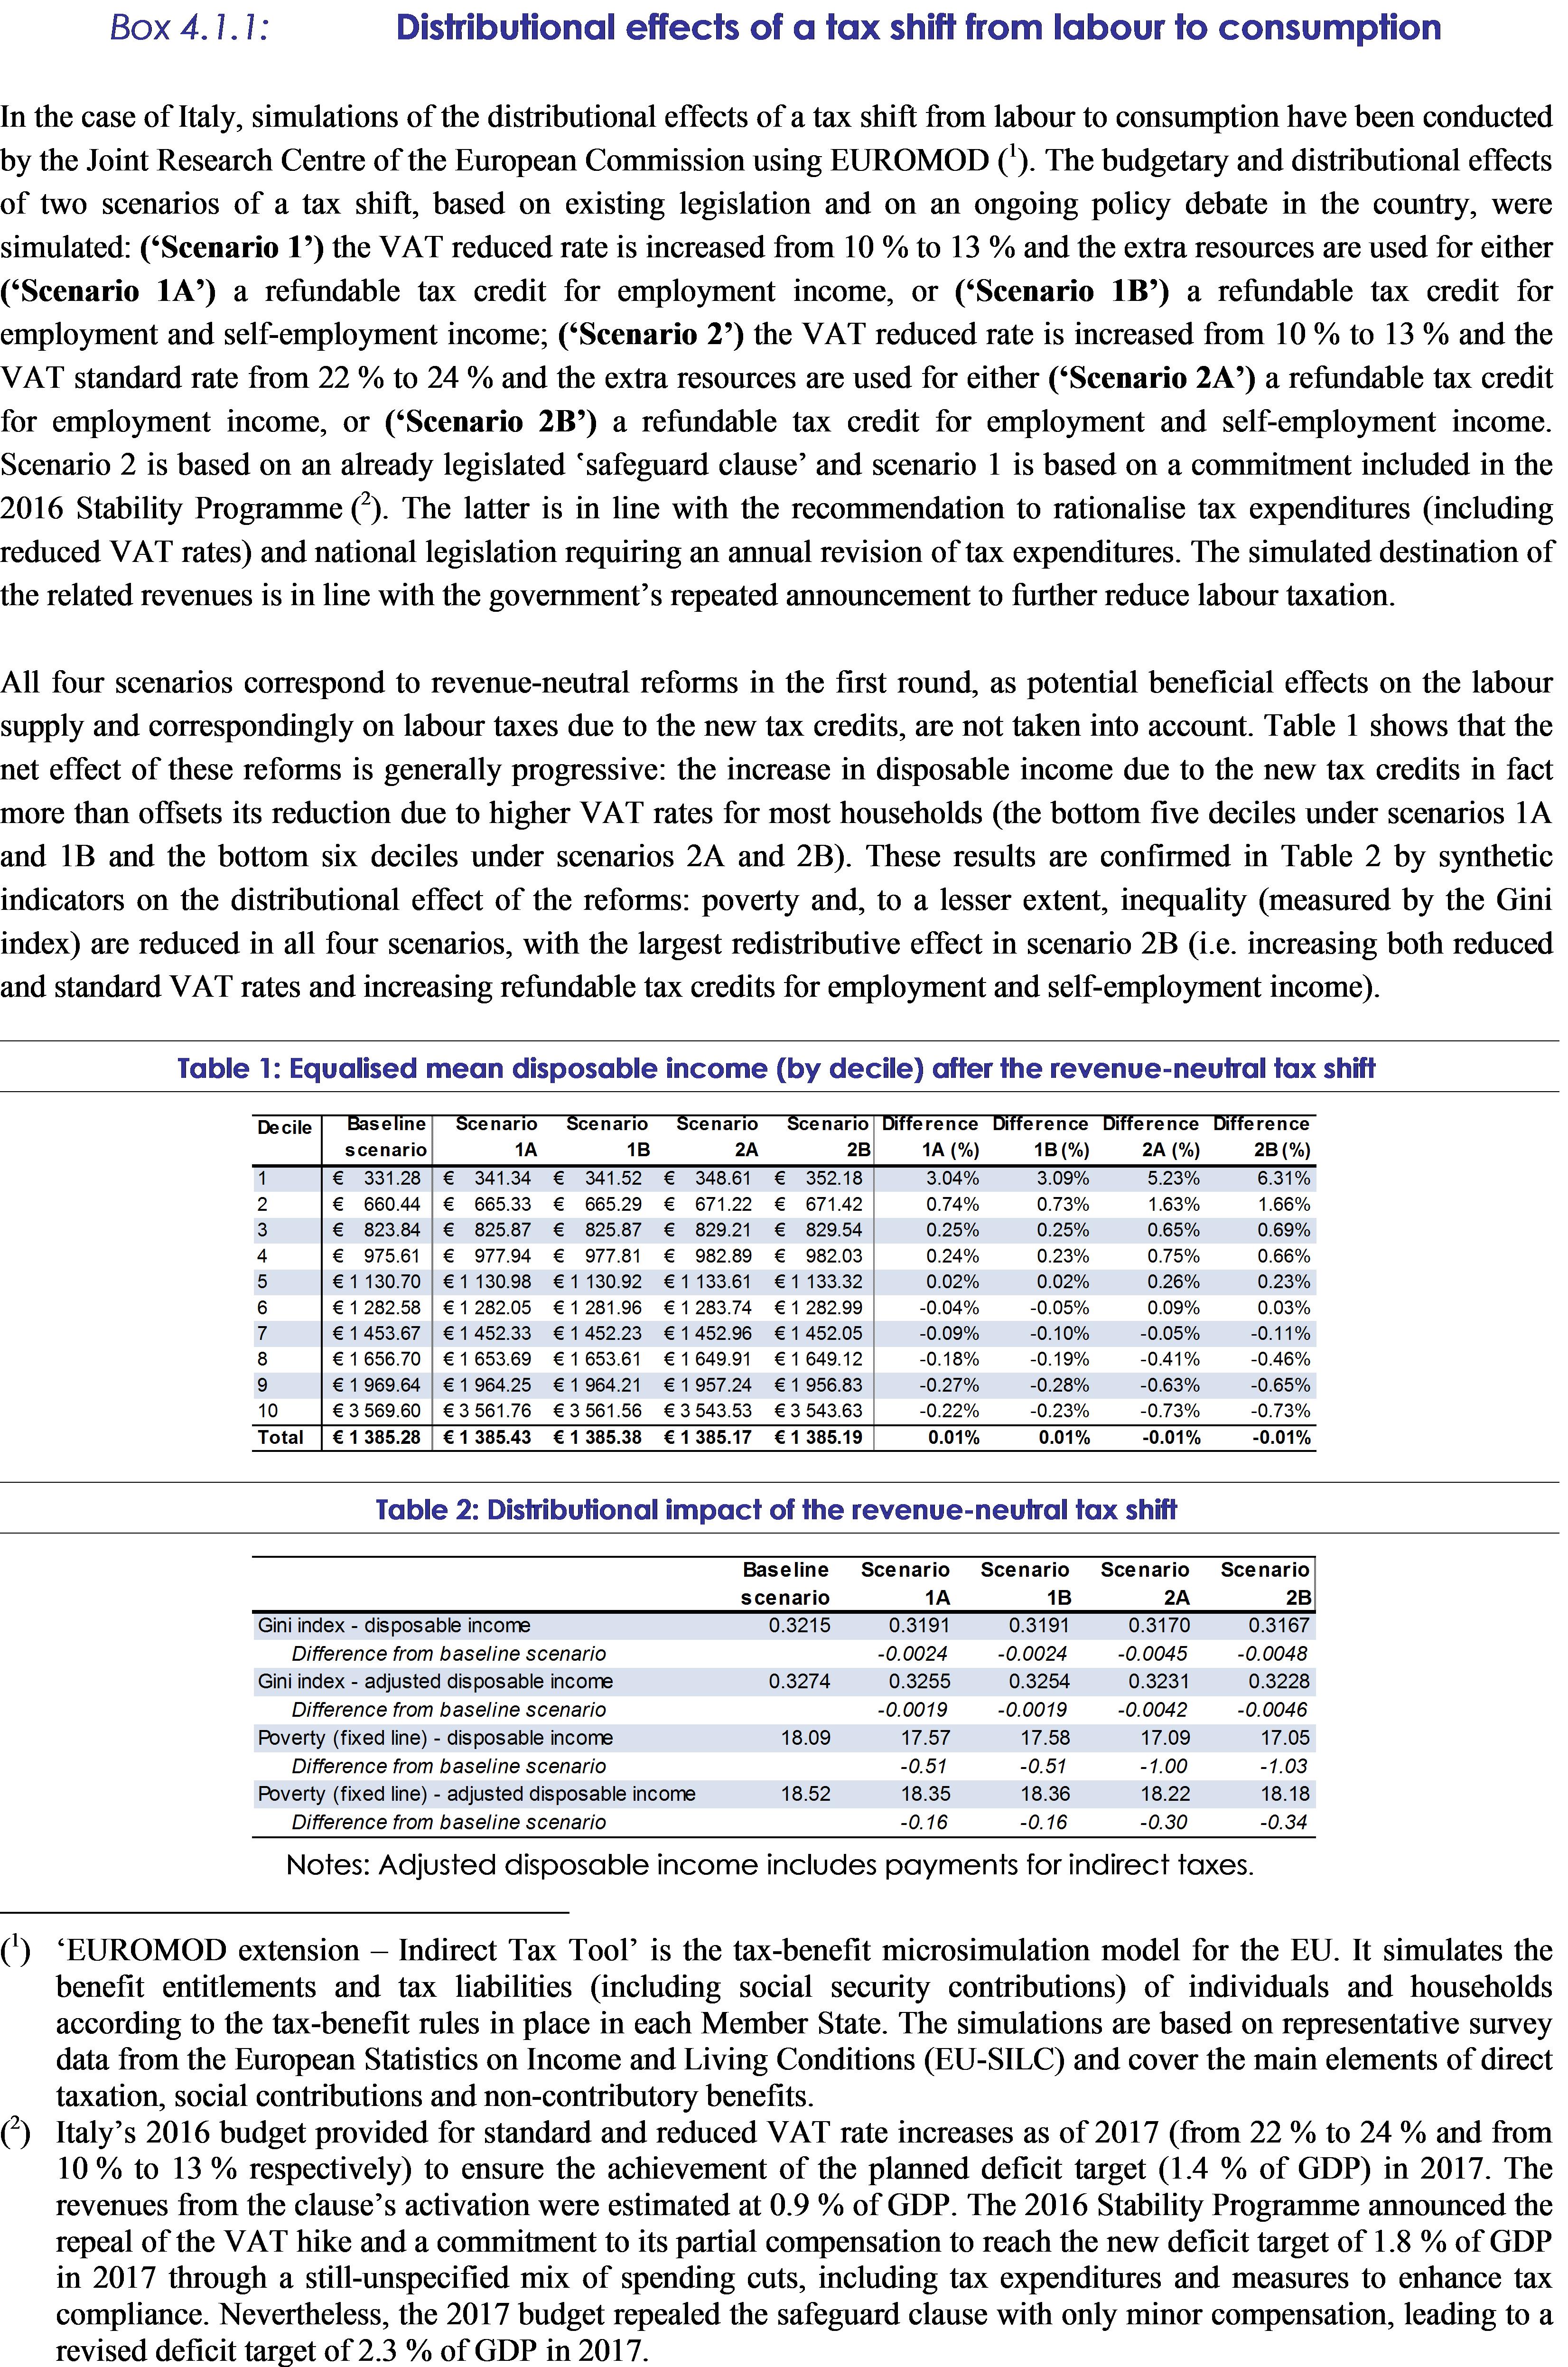
A well-designed tax shift to consumption has the potential to further reduce the tax burden on labour and tackle poverty and inequality. Limited progress has been made in reforming cadastral values and revising tax expenditures, in line with the objective to shift the tax burden from labour to consumption and property. Simulations carried out with EUROMOD (Box 4.1.1) show that increasing the reduced VAT rate from 10 % to 13 % and fully using these revenues for a refundable tax credit on employment income for low-income workers would be progressive. It would raise net disposable income for the lowest income deciles and result in lower poverty and inequality (measured by the Gini index). Moreover, the larger the tax shift, the higher the probability for the unemployed to enter the labour market. At the same time, the generosity of the new tax credit would increase the incentive to work part-time instead of full-time. However, this offsetting effect, resulting in an overall negligible impact on labour supply, could be avoided by the adequate design of the tax credit.
Despite some progress in this area, the rather limited use of electronic invoicing and payments affects the fight against tax evasion In 2014, Italy’s VAT gap (
) was among the highest in the EU, at EUR 36.9 billion (or 2.3 % of GDP), i.e. 28 % of the whole EU gap. The total tax gap is estimated at around 6 % of GDP (or some EUR 99 billion) (Ministry of Economy, 2016b). Recent measures to increase tax compliance, such as mandatory electronic invoicing together with the ʽsplit payment’ for government bodies’ purchases (
), and the reverse charge in specific sectors seem to have been effective, with a yearly increase in gross VAT on internal transactions of more than 6 % between January and November 2016. However, electronic invoicing is not compulsory among privates, the use of electronic payments remains well below the EU average and limits to the use of cash have recently been raised. (
) On the other hand, tax collection was streamlined in order to improve compliance, with the introduction of pre-filled declarations, incentives for firms to opt for electronic invoicing in return for milder tax controls as of 2017, and simplified arrangements (regime forfettario) for small firms, taken up by many newly registered VAT taxpayers. (
) Moreover, the 2017 budget introduced transparency provisions on the communication of invoices and VAT data, which are expected to improve compliance, and a tax administration reform, merging the tax-recovery agency Equitalia with the revenue agency to improve tax collection and foregoing sanctions on taxpayers who voluntarily regularise themselves for unpaid taxes in 2000-2016. The budgetary impact of the latter reform depends on taxpayers’ behaviour and will be mostly one-off. The same applies to the extension until July 2017 of the voluntary disclosure of assets held abroad or not declared.
The government aims to increase tax compliance and reduce the ground for tax litigation. New ʽcooperative compliance’ arrangements, whereby the tax authorities proactively help firms to fulfil their more complex tax obligations, and pre-filled tax declarations addressed to specific taxpayers categories might help to increase tax compliance and reduce the ground for tax litigation in Italy. Namely, in 2015, the total inflow of cases to the provincial (first-instance) and regional (second-instance) committees where tax cases are dealt with by part-time non-professional judges (magistrati tributari) was significant and broadly stable compared to 2012, despite the introduction of tax mediation in that year. Moreover, a tenth of the backlog had been pending for over five years (Ministry of Economy, 2016c). The tax section of the Supreme Court of Cassation was the one that contributed most to its inflow (i.e. 38.4 %) and its backlog (i.e. 32.7 %) of civil cases, both among the highest in the EU (
) (European Commission, 2017b). It also had the lowest clearance rate (
) and a 50 % rate of appeals granted (Corte di Cassazione, 2015). While organisational measures to improve the functioning of the tax section and to speed up tax proceedings have been introduced, such as the ‘digital tax trial’, there remains room for improving the effectiveness of the justice system in tax cases (Corte di Cassazione, 2017, p. 80). To this aim, the government set up a high-level Technical Committee to develop a proposal inspired by the best international practices. Consistently, a draft enabling law under discussion in Parliament aims to empower the government to present a proposal to bring all tax cases within the competence of civil tribunals, while increasing the number of judges by 750.
|
|
|
|
|
|
|
|
|
|
|
4.2.
Financial sector
|
|
Table 4.2.1:Italian banking sector key indicators
|
|
|
|
Source: Bank of Italy
|
|
|
General banking sector developments*
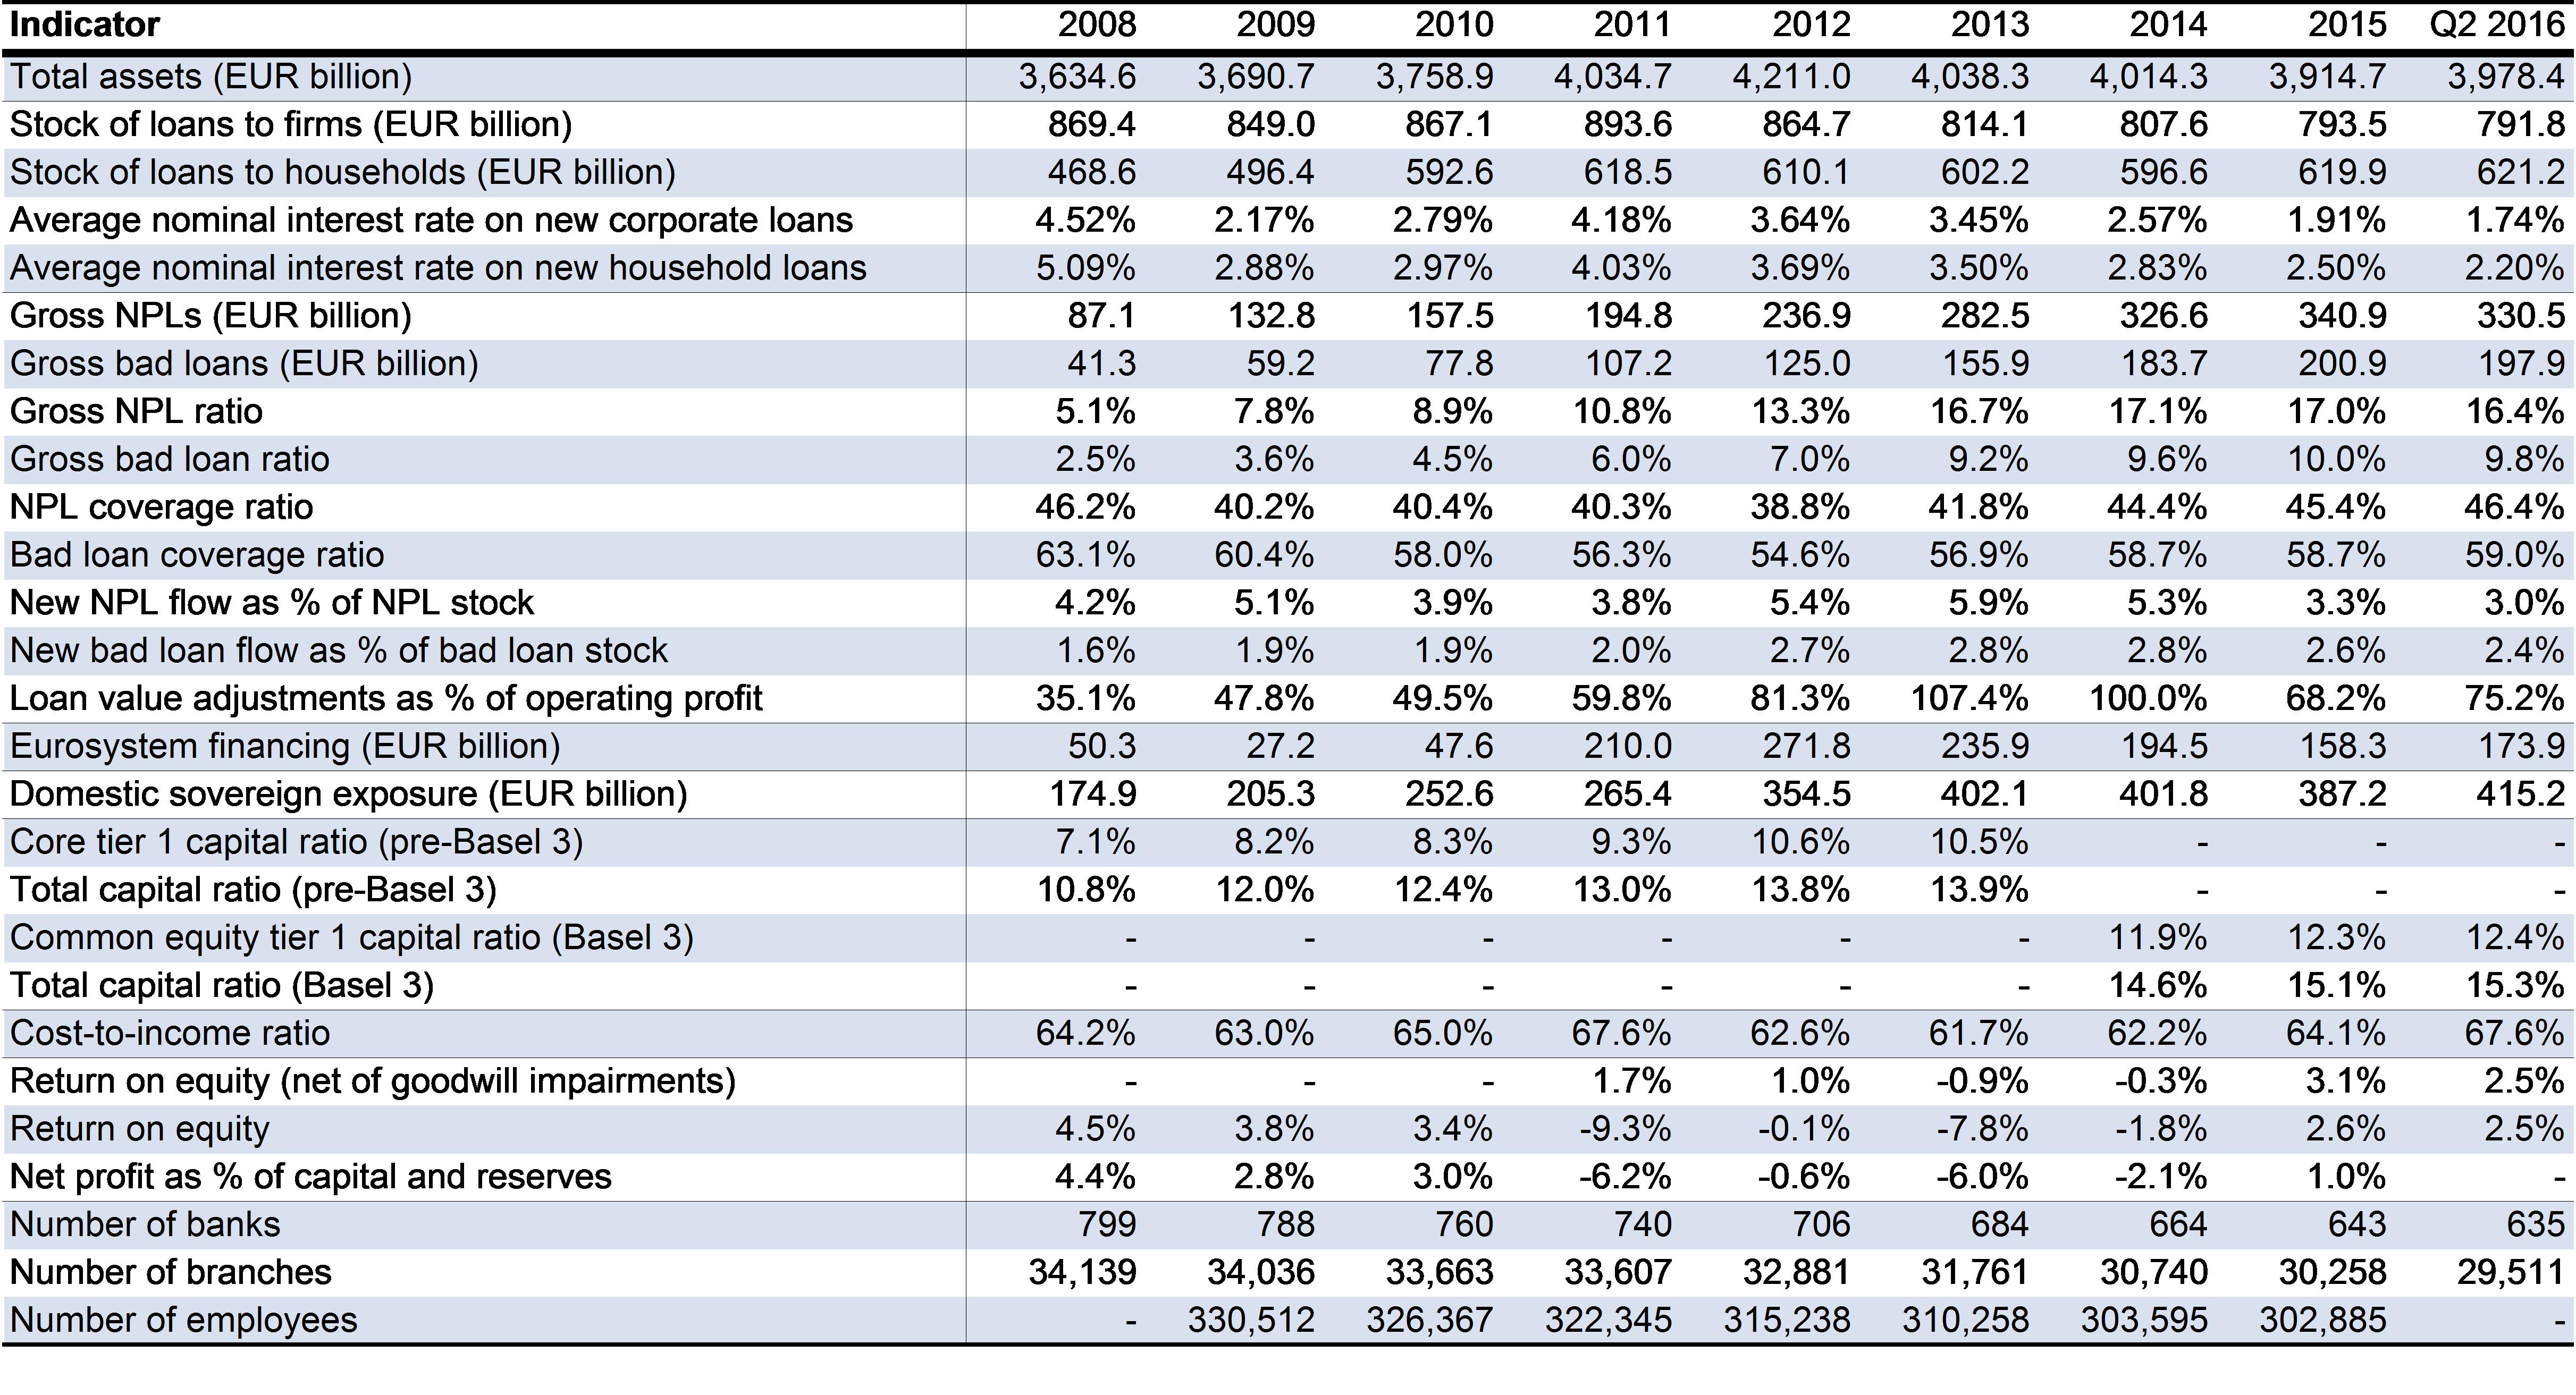
Confidence in the Italian banking sector has fallen in spite of the several measures taken by the government. The loss of market confidence is reflected in the large drop of Italian banks' share prices in 2016, despite significant bank-by-bank differences. There are two main reasons behind this development: (i) the persistent uncertainty related to the adequacy of loan loss provisions and capital buffers, given the existing high stock of non-performing loans and banks’ limited ability to absorb losses in a context of subdued profitability; (ii) the weak growth outlook, depressing banks’ profitability, coupled with longstanding structural weaknesses, including high operational costs and corporate governance flaws. The difficulty to find a market solution to address capital shortfalls for some banks, and the widespread mis-selling of bank bonds to retail customers, who can claim compensation from banks, have further added to this complex picture. As a result, and despite policy measures already taken, the Italian banking sector continues to be vulnerable to shocks. Furthermore, the support it can give to a gradual economic recovery appears limited and it might therefore become a potential source of economic spillovers for other euro area countries.
Banking sector capitalisation has improved marginally, but continues to lag behind that of other European peers. Due to retained earnings and private capital increases, the average common equity tier 1 and total capital ratio rose to 12.4 % and 15.3 % respectively in Q2 2016. However, there are significant bank-by-bank differences. The Italian banking sector still lags behind other euro area banking systems and ranks close to the bottom with regard to the main solvency indicators (EBA, 2016). Low profitability and unfavourable market conditions hold back the further strengthening of capital buffers, especially for more vulnerable banks.
Progress in reducing the large stock of problem loans is limited. From the end of 2015, the stock of non-performing loans – gross of loan-loss provisions – declined only marginally to EUR 329 billion in Q3 2016 (16.5% in customer loans, triple the pre-crisis level). Bad loans stood at EUR 198 billion (and EUR 85 billion net of provisions). Although the ongoing recovery has significantly reduced the inflow of new problem loans, the work-out or disposal of such loans has proceeded very slowly so far (see ‘Impaired asset developments’ in this section). The sector has continued to raise coverage ratios, which are now above the EU average, although there are significant bank-by-bank differences.
Banking sector profitability continues to remain low. In the first half of 2016, the average return on equity stood at 2.5 %, at the bottom of the ranking of euro area banking systems. The low profitability is driven by several factors: (i) the low-interest-rate environment and price competition for the most creditworthy borrowers, which reduce net interest margins that are key to Italian banks’ traditional business models; (ii) the subdued credit recovery (see Section 1); (iii) the reduction in non-interest income due to unfavourable market developments; (iv) the increase in non-recurring expenses (e.g. early-retirement measures, resolution fund contributions); (v) significant loan-loss provisioning, albeit at a decreasing pace compared to the recent past. The sector’s cost-to-income ratio increased as modest cost-cutting efforts may only become visible over time and were more than offset by declining revenues.
The consolidation of the Italian banking system is proceeding very slowly. Consolidation could help to improve cost-efficiency and profitability and to increase capacity to manage problem loans and invest in digital technologies. Despite a decline in the number of banks in Italy since 2008, the sector remains highly fragmented. Since the start of the crisis, numbers of bank branches and employees have declined by around 10 %. However, recent corporate governance reforms (see ‘Corporate governance reforms’ in this section) are supposed to foster consolidation in some segments. Furthermore, some vulnerable medium-sized and small banks may be taken over by stronger entities or merge after their balance sheets have been cleaned up. Finally, the 2017 Budget Law extends the financing and scope of the sector’s solidarity fund for the retraining and requalification of bank employees and establishes fiscal incentives for staff reorganisations in the context of restructuring or mergers.
Medium-sized and small Italian banks appear more vulnerable than large credit institutions. ‘Less significant institutions’ (LSIs, i.e. smaller Italian banks under the Bank of Italy’s supervision) are on average as profitable and marginally less cost efficient than ‘significant institutions’ (SIs, i.e. the 14 largest banks under ECB supervision), while their average capitalisation is higher (Table 4.2.2). However, LSIs overall seem to exhibit larger asset-quality issues (i.e. higher impaired-loan ratios and lower coverage ratios). This might be explained by LSIs’ higher exposure to (riskier) small firms and geographical risk concentration, a lower ability to work out impaired loans due to the lack of critical mass and of specific expertise, but also by their higher degree of loan collateralisation on average. While SIs have been subject to several stress tests and asset-quality reviews, LSIs have so far not been covered to the same extent by such exercises.
|
|
|
Table 4.2.2:Key indicators on the Italian banking sector by segment, Q2 2016
|
|
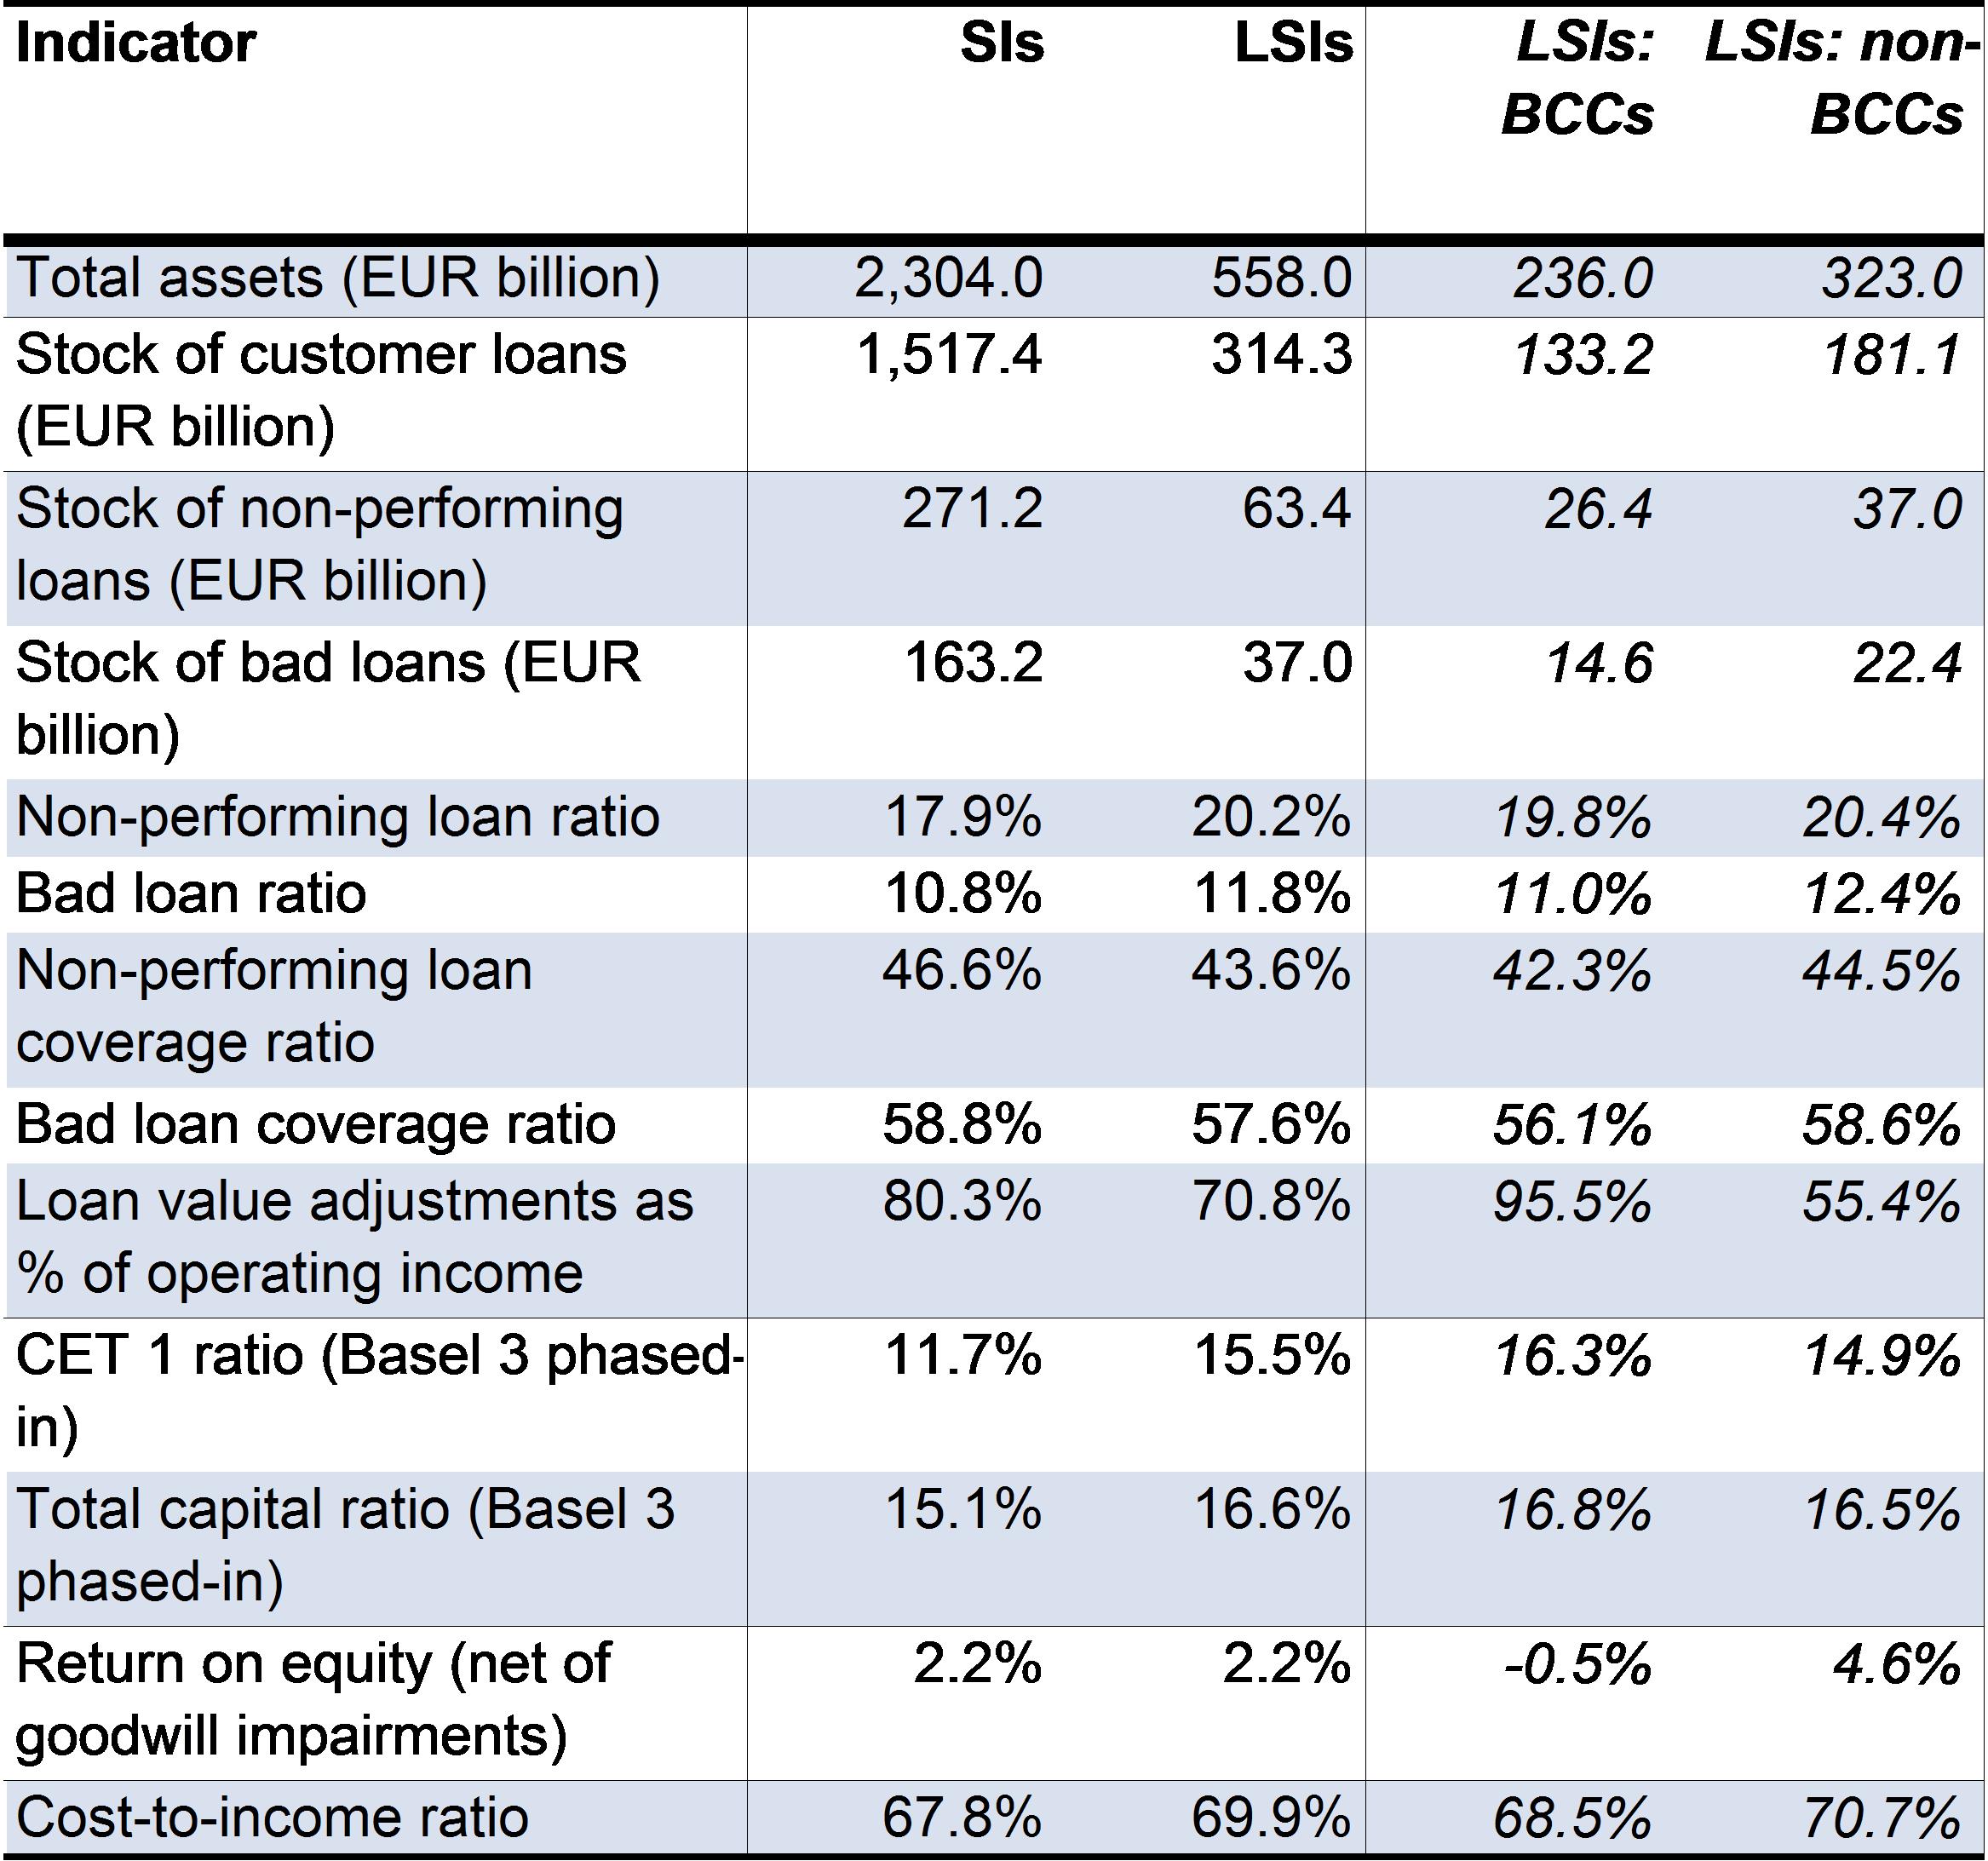
|
|
Source: Bank of Italy
|
|
|
There are some marked differences between the segment of small cooperative banks and medium-sized cooperative banks. One the one hand, compared to the small cooperative banks (banche di credito cooperativo (BCCs)), the medium-sized cooperative banks (banche popolari) have on average lower capital ratios and a higher proportion of impaired loans. On the other hand, BCCs’ revenues have been relatively more affected by the low-interest-rate environment, resulting in negative profitability on average (Table 4.2.2). BCCs’ ability to raise new equity from external investors is inter alia constrained by their specific cooperative features, which however are supposed to be at least partially addressed by their ongoing corporate governance reform (see ‘Corporate governance reforms’ in this section).
Several private and public crisis management interventions have taken place in the Italian banking sector since the end of 2015. First, four small banks were resolved in November 2015 (
) and split into a common ‘bad’ bank and four good bridge banks owned by the national resolution authority. In January 2017, the Bank of Italy approved the sale of three of the bridge banks to UBI Banca, whereas the negotiations on the sale of the fourth bank to Banca Popolare dell’Emilia Romagna are still ongoing. Before being sold, the bridge banks are likely to be recapitalised and undergo a robust balance sheet clean-up. Second, spring 2016 saw the failure of the initial public offering of two medium-sized popolari banks (Banca Popolare di Vicenza and Veneto Banca). As a result, the ‘Atlante I’ fund (a private backstop facility of EUR 4.25 billion funded by contributions from other Italian banks, insurers, bank foundations and Cassa Depositi e Prestiti) underwrote both banks’ equity issuance for a total of EUR 2.5 billion and thereby ended up owning the entities almost completely. In January 2017, Atlante I injected another EUR 0.9 billion in these banks as part of a further recapitalisation. The two banks were also granted access to a new public liquidity guarantee scheme adopted in December 2016 (following individual Commission decisions). Both banks face at the moment significant legal claims for past malpractices and have gross non-performing loan ratios of just above 30 %.
Banca Monte dei Paschi di Siena (BMPS) announced in December 2016 that its private recapitalisation plan had failed. The EUR 5 billion private recapitalisation coupled with a EUR 28 billion impaired-loan securitisation was triggered by the bank’s capital shortfall under the hypothetical adverse scenario of the 2016 EU-wide stress test (
) and the non-performing loan reduction targets set by the ECB. Given the impossibility to raise capital on the market, the bank applied for a precautionary recapitalisation by the Italian state. In anticipation of this, in December 2016, the government adopted the framework for setting up a EUR 20 billion fund to be used for precautionary recapitalisations. Solvent banks with a capital shortfall under the adverse scenario of a stress test or equivalent exercise are eligible for this capital strengthening tool, provided all relevant conditions of the Bank Recovery and Resolution Directive are complied with. Precautionary recapitalisations constitute State aid and are available only under specific conditions. (
) Furthermore, BMPS was granted access to a new public liquidity guarantee scheme adopted in December 2016 (following an individual Commission decision).
Overall, the liquidity situation of the banking sector has remained comfortable. Banks’ funding costs have declined further. Resident deposits have continued to grow – offsetting the gradual reduction in non-resident deposits – while funding through wholesale and retail bond issuance has decreased further. From mid-2016, Italian banks’ reliance on ECB refinancing rose again to EUR 204 billion (6.5 % of liabilities) in December 2016, mainly replacing more expensive wholesale funding or due to switching from the first to the second round of the ECB’s targeted longer-term refinancing operations. In January 2017, the Canadian rating agency ‘DBRS’ lowered the Italian sovereign’s long-term credit rating, which led to an increase in the haircuts applied to Italian marketable securities posted as collateral with the ECB. Consequently, it has become more costly for Italian banks to obtain ECB funding secured by domestic marketable securities.
Despite the generally comfortable funding environment, some vulnerable banks have experienced liquidity pressures. These pressures led to deposit outflows from those banks, while residents’ deposits overall continued to grow. To mitigate unwarranted developments in the case of pressure on the liquidity position of banks, in December 2016 the Italian government adopted a scheme to guarantee new bank debt and emergency liquidity assistance by the central bank against a fee. The liquidity scheme was approved by the Commission and is valid until mid-2017.
|
|
|
Table 4.2.3:Bank bonds by seniority, holding sector and size of issuing bank, Q2 2016
|
|
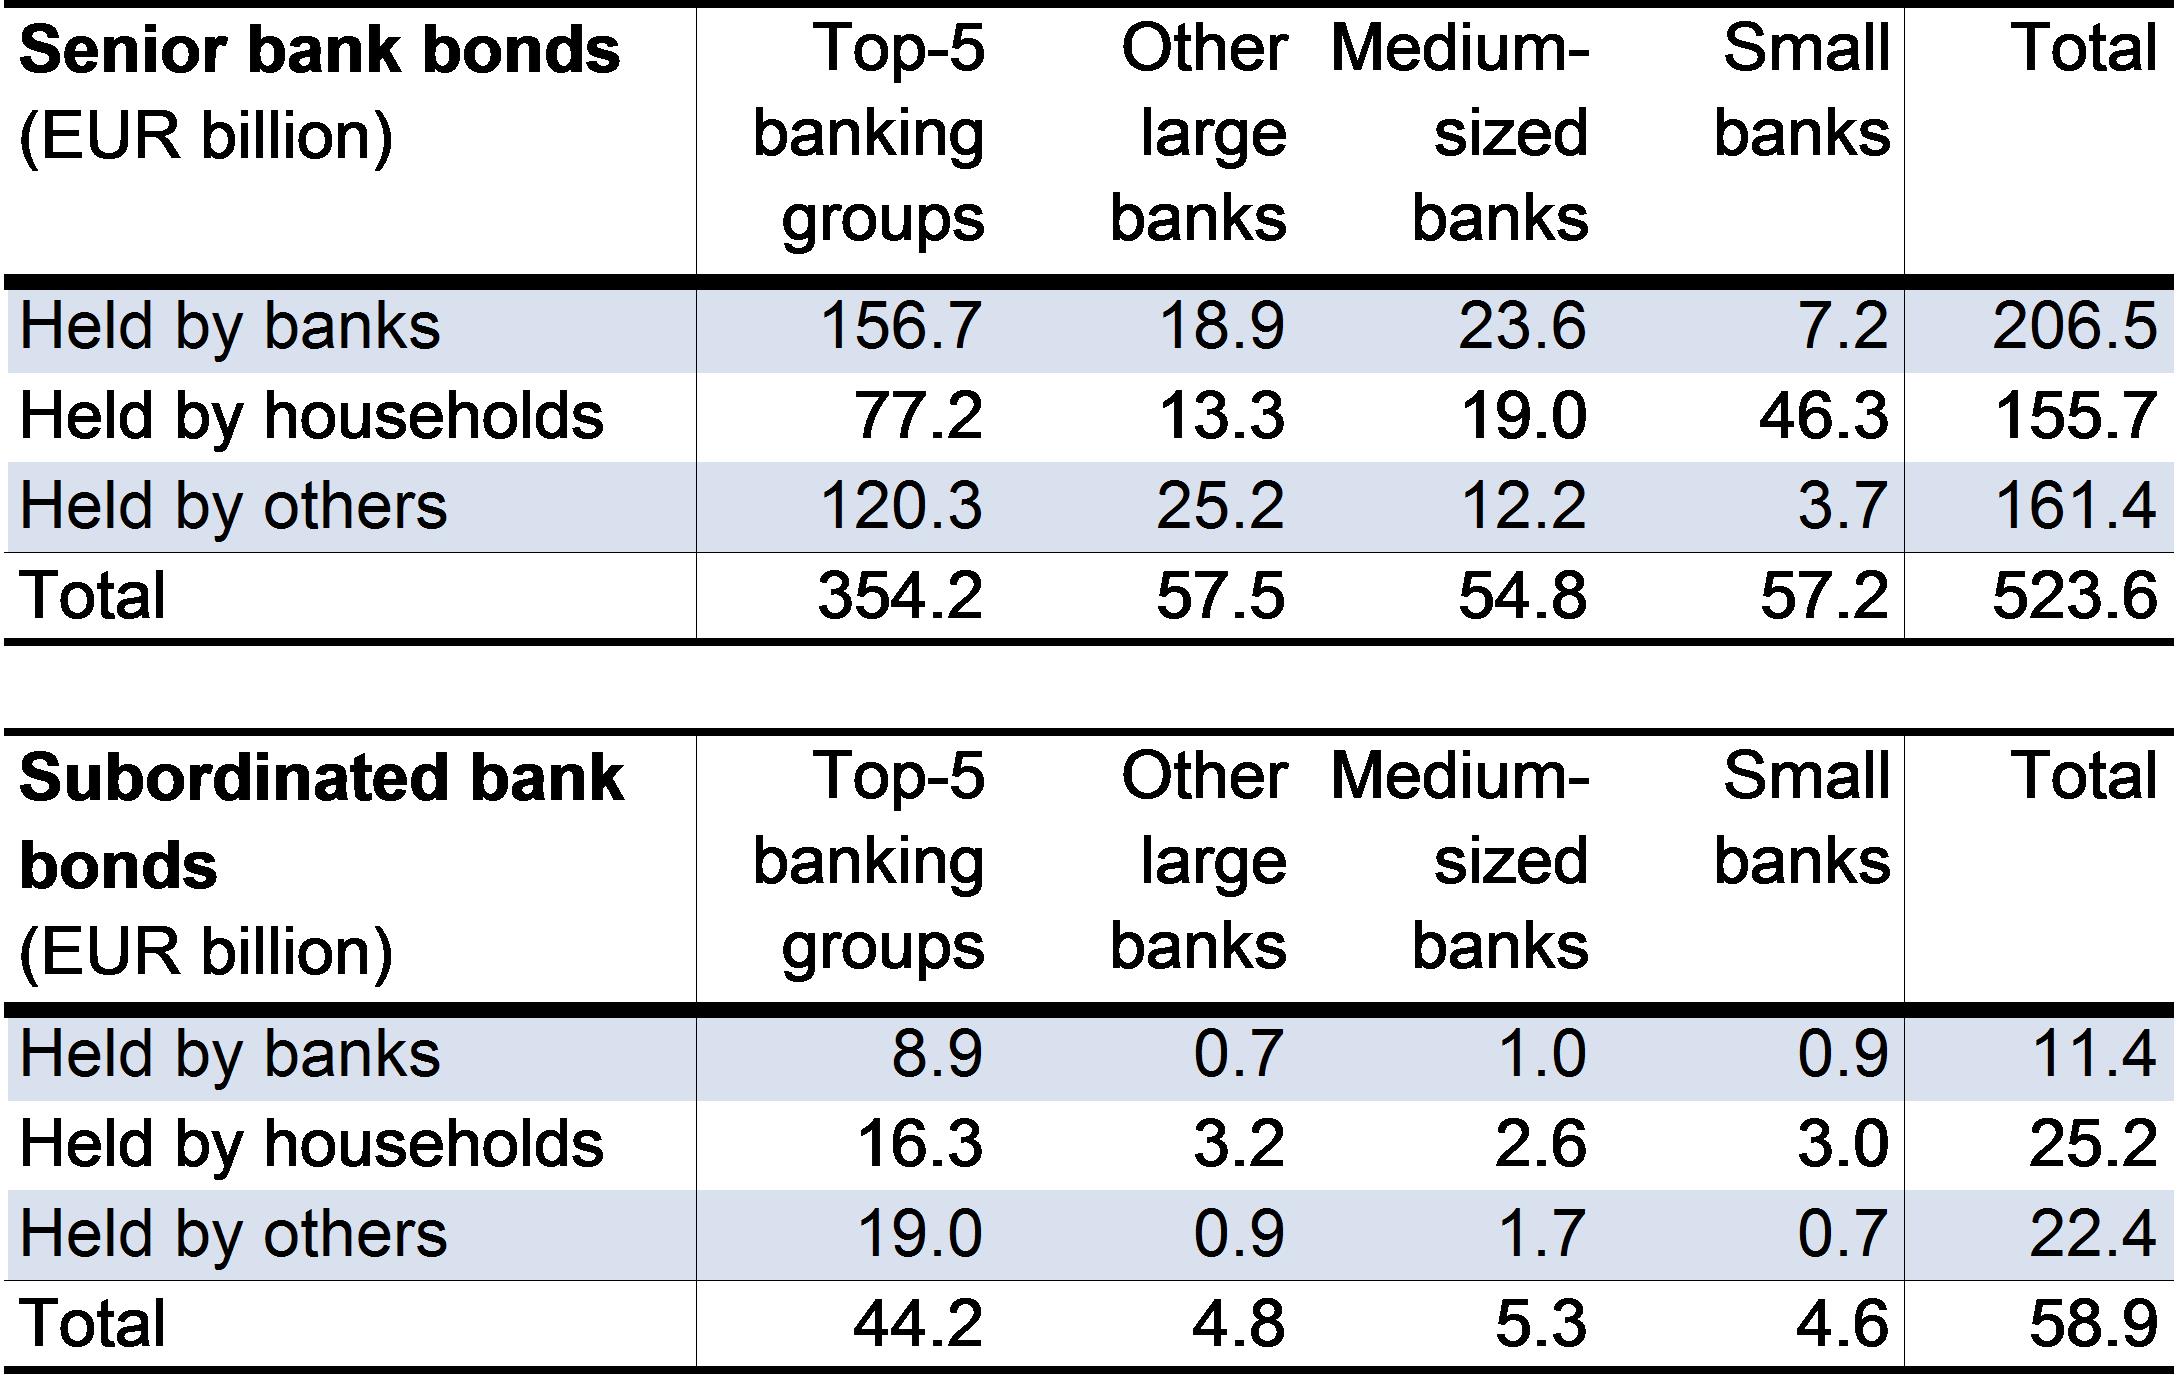
|
|
Source: Bank of Italy
|
|
|
The stock of bank bonds held by retail investors which could be subject to burden-sharing or bail-in is expected to decline further. The majority of banks have stopped selling subordinated bonds to retail investors. Furthermore, targeted information campaigns have increased investors’ awareness of the risks associated with these instruments. In Q3 2016, households’ holdings of bank bonds had declined to EUR 154 billion from their peak of EUR 393 billion in Q1 2012. In most cases, retail investors have switched to deposits or investment funds, partly encouraged by the increase in the tax rate applied to bank bond returns compared to the more favourable treatment until 2012. In Q2 2016, households still held EUR 25 billion in (the more risky) subordinated bonds (43 % of the total) and EUR 156 billion in senior bonds (30 % of the total) (Table 4.2.3). The five largest banks accounted for just over half of the total amount outstanding. On average, bank bonds account for around 5 % of households’ total wealth and are held by only around 5 % of Italian households, which mostly belong to the highest decile of the distribution of financial wealth (Bank of Italy, 2016b).
Retail investors impacted by the mis-selling of bank bonds can claim damages. Following the resolution of four small banks in November 2015, which involved burden-sharing for retail investors holding subordinated bonds, a solidarity fund for granting retail investors compensation was set up and is managed by the deposit guarantee fund for credit institutions (FITD). The decree law in question established a compensation procedure for the mis-selling of subordinated bonds issued by the resolved banks. Financially vulnerable retail investors who had acquired their subordinated bonds before 12 June 2014 (the publication date of the EU’s Bank Recovery and Resolution Directive) were given access to an accelerated procedure. An alternative arbitration procedure is also envisaged but is not yet operational. Under the accelerated mechanism, by the end of January 2017, 23 % of the some 14 400 claims received by then had been settled, corresponding to payments of EUR 44 million. A compensation mechanism for retail bondholders that were victims of mis-selling is also planned as part of the envisaged precautionary recapitalisation of Banca Monte dei Paschi di Siena.
Impaired asset developments*
The banking sector’s non-performing loan problem is systemic and weighs on Italy’s economic recovery. The gradual deterioration of loan quality in recent years has affected all parts of the Italian banking sector. The largest banks account for around three quarters of total non-performing loans (NPLs). (
) Net of loan-loss provisions, NPLs accounted for 86 % of the banking sector’s own funds (Graph 4.2.1). A high NPL stock is a drag on a bank’s profit as it generates less interest income, requires loan-loss recognition and increases operating costs related to NPLs’ management and work-out. NPLs also hold back the recovery of credit and thereby weigh on investment as they lock in a bank’s capital otherwise available for new lending, lead to more conservative lending and raise a bank’s cost of funding (IMF, 2015b; Balgova and Plekhanov, 2016). Regarding individual banks, Graph 4.2.2 suggests that low average asset quality appears to be associated with subdued growth in gross customer loans. This weak credit recovery hampers the full transmission of expansionary monetary policy measures to the economy. Finally, problem loans tend to create uncertainty and weigh on investors’ and depositors’ confidence in the banking sector.
|
Graph 4.2.1:Net non-performing debt instruments as % of total own funds for solvency purposes, Q2 2016
|
|
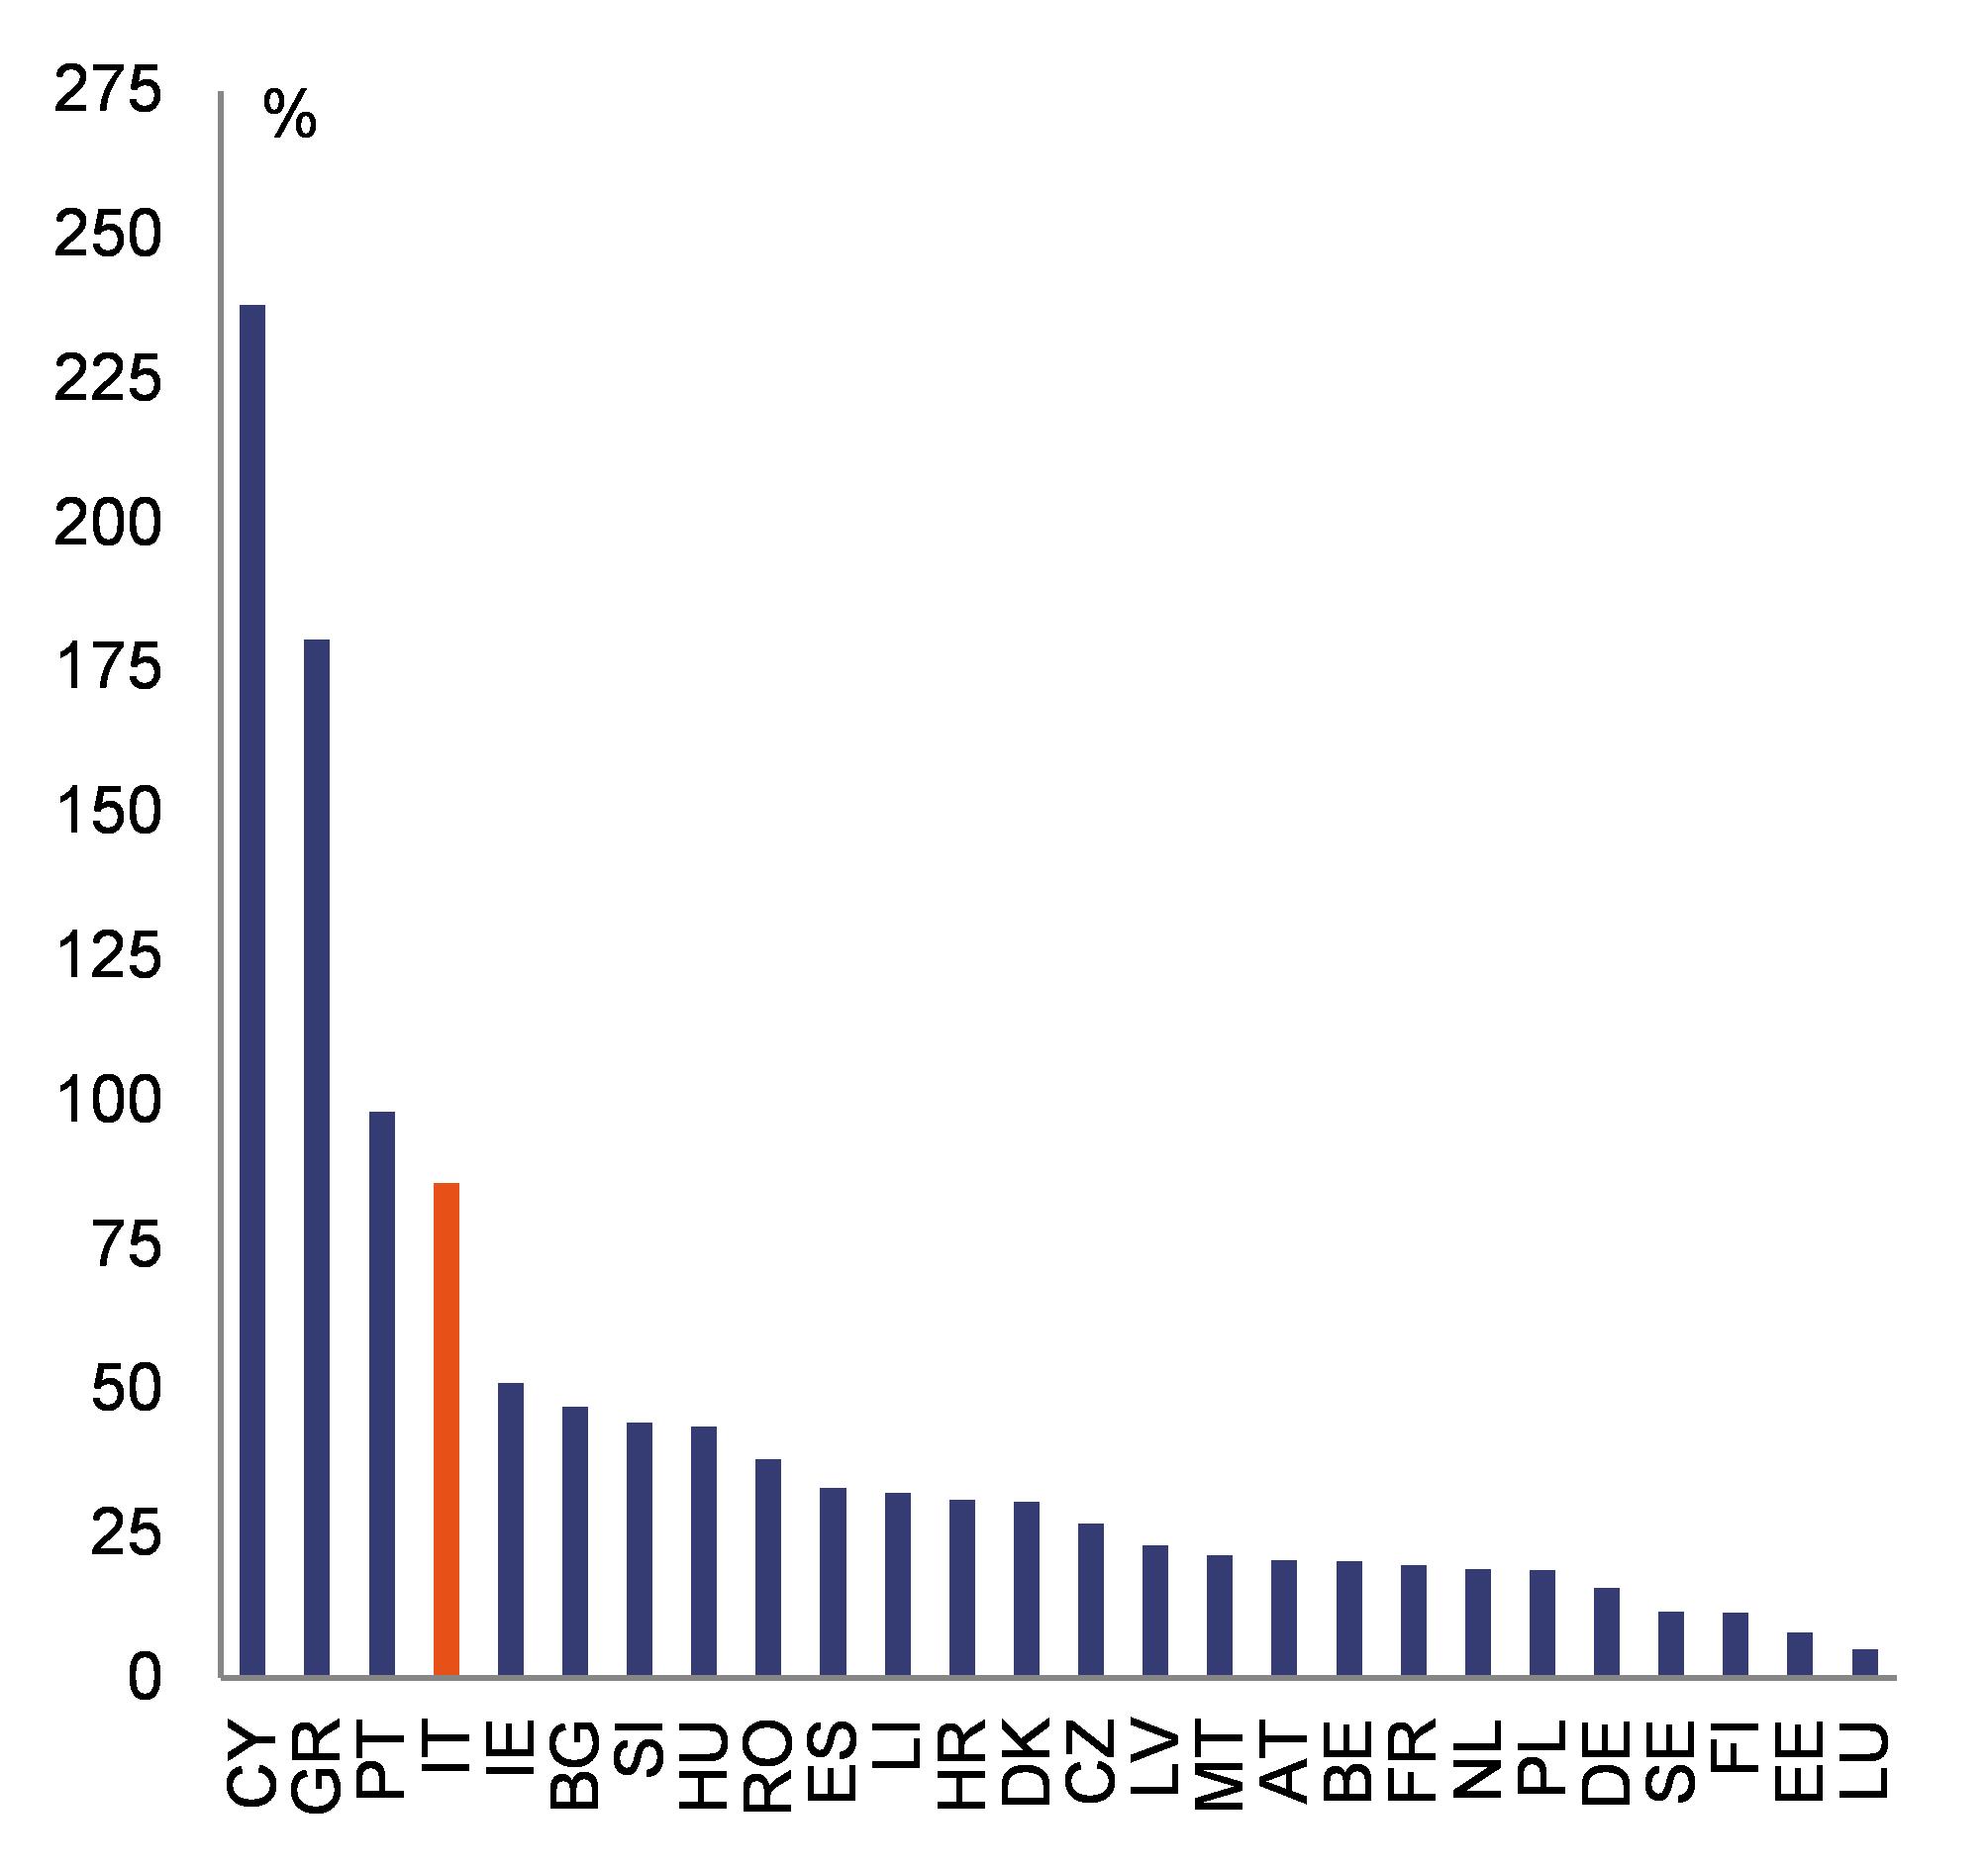
|
|
Source: ECB
|
Some specific features of Italy’s NPL stock may reduce recovery prospects. First of all, bad loans – impaired loans with the lowest recovery prospects – represent the bulk of NPLs, i.e. around 60 % of the gross total in Q3 2016 (EUR 197 billion). Unlikely-to-pay loans and past-due loans account for 37 % (EUR 120 billion) and 3 % (EUR 10 billion) respectively. Second, on the sectoral distribution of impaired loans, the non-financial corporate sector accounts for just over 70 % of total gross NPLs (in value terms) and also displays a much higher gross incidence of NPLs (30.2 %) than households (8.6 %) and other sectors (9.1 %). Third, regarding their geographical distribution, gross corporate NPL ratios in the southern and economically more fragile parts of the country are a lot higher (around 40 %) than in northern and central parts (25 % to 35 %). Moreover, the geographical dispersion of NPLs implies that recovery prospects may vary widely. Fourth, the stock of Italian bad loans appears rather fragmented: small bad loans of up to EUR 75 000 account for 74 % of the total number of borrowers for the entire bad loan stock, while representing only 6.7 % of the total value of the entire bad loan stock (Graph 4.2.3). The recovery prospects of such small corporate non-performing exposures – in most cases linked to micro- and small firms – may be constrained by economic and social considerations. Finally, although corporate NPLs exist in all industries and geographical areas, construction features a much higher gross bad-loan ratio (30.3 %) than industry (13.2 %) or services (16.2 %).
|
Graph 4.2.2:Relationship between banks’ loan growth and asset quality
|
|
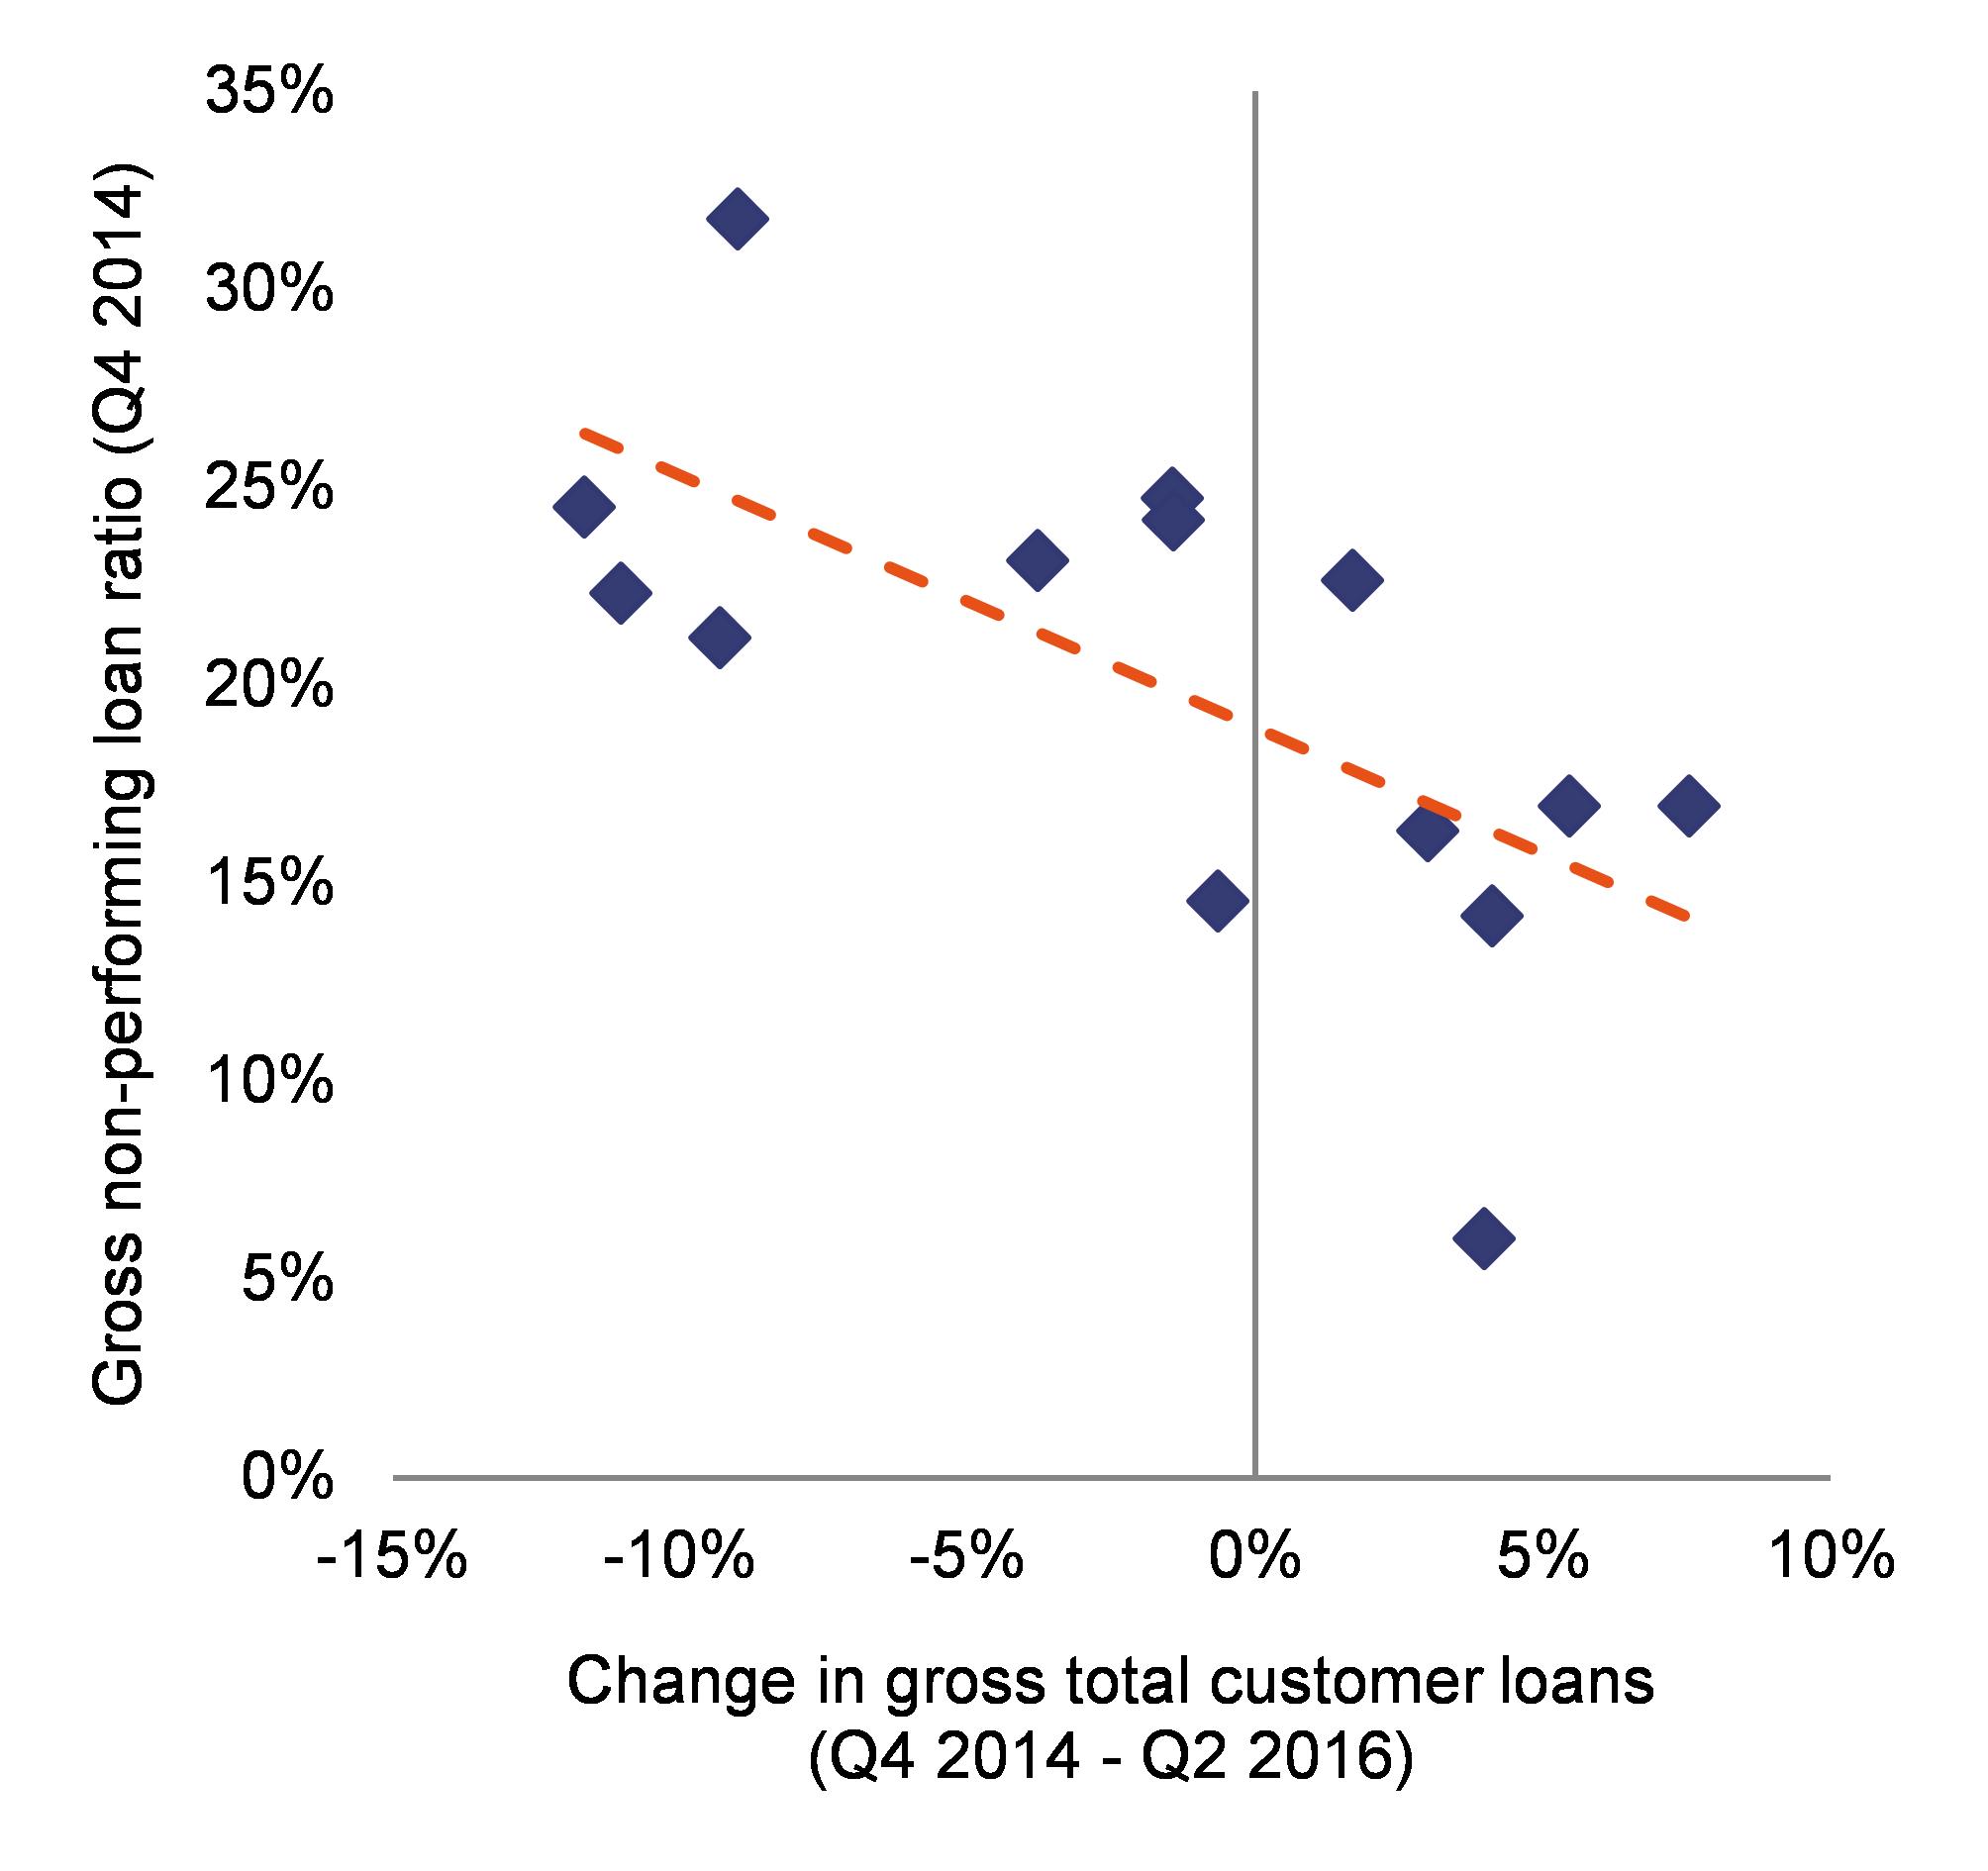
|
|
Source: European Commission, banks' financial reports
|
The inflow of new NPLs has slowed down since the beginning of 2015. Italy’s gradual economic recovery contributes to the improvement of borrowers’ financial situation. For firms, the number of bankruptcies and other insolvency procedures continued to fall in 2016. Together with banks’ more conservative lending practices, this has reduced the new NPL rate to 2.6 % in Q3 2016 (from the end-2013 peak of 5.9 %). The new bad-loan rate fell to a lesser extent (to 2.3 % in Q3 2016 from the mid-2013 peak of 3.2 %). This is because loans that are already impaired (i.e. unlikely-to-pay loans and to a lesser extent past-due loans) still migrate to the bad loans category. As bad loans are characterised by a much higher coverage rate (59 % on average in Q2 2016) than unlikely-to-pay loans (28.3 %) and past-due loans (17.7 %), this migration is a continuous source of further provisioning needs. (
)
|
Graph 4.2.3:Cumulative distribution of the Italian bad-loan stock by loan value and number of borrowers, Q3 2016
|
|
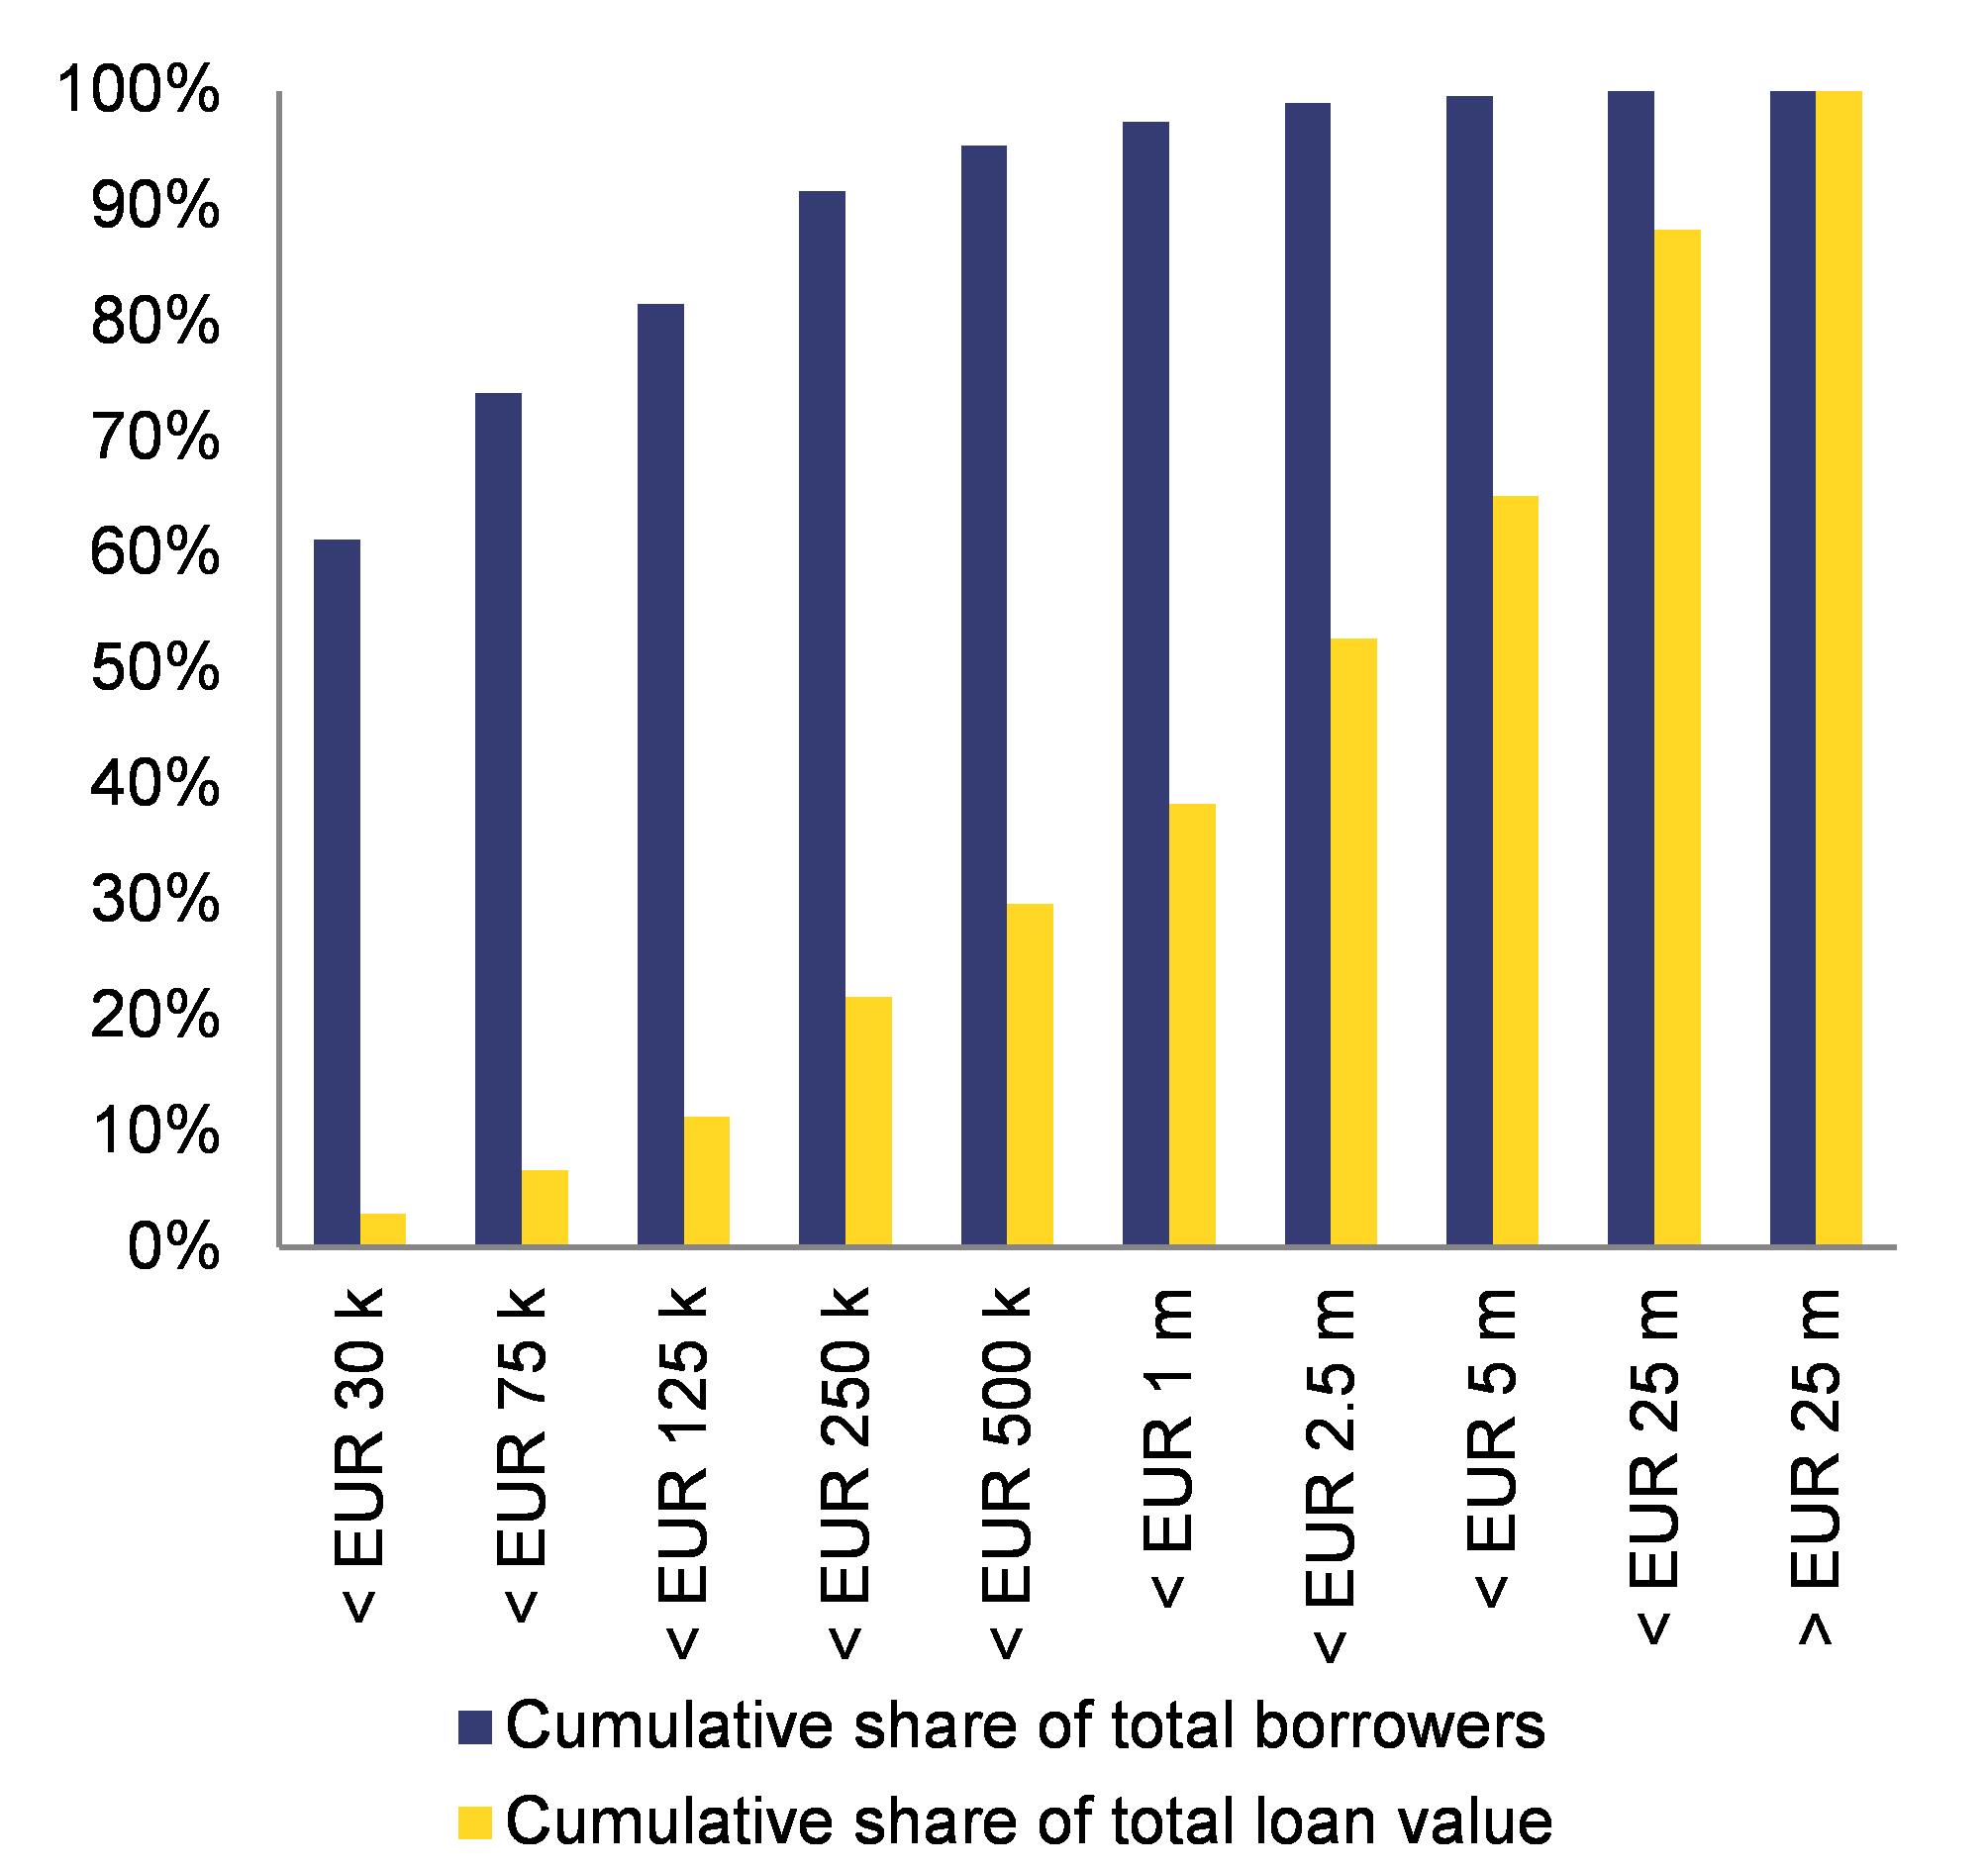
|
|
Source: Bank of Italy
|
Several factors still prevent the development of a secondary market for impaired assets in Italy. The pricing gap – defined as the difference between NPLs' net book value on banks' balance sheets and specialised investors' bid prices – is currently estimated at around 20 percentage points. This means that banks would have to book considerable losses when selling NPLs under current market conditions. The pricing gap is driven by several factors: (i) the difficulties which some bank experience in adequately raising NPL coverage ratios given their low profitability; (ii) lengthy and cumbersome insolvency and collateral enforcement procedures, which lower recovery rates and raise recovery costs; (iii) banks’ and specialised investors’ use of different valuation criteria (e.g. the factor used to discount expected cashflows, the accounting method for indirect costs of problem loan management); (iv) information asymmetries between sellers and buyers of impaired loans, often linked to a lack of granular data on loan portfolios due to inadequate loan management and record-keeping; (v) the underdevelopment of Italy's NPL market itself, resulting in higher liquidity premia and lack of competition which in turn drives up investors' required return rates.
Other factors may also help to explain the modest activity in the Italian secondary market for impaired loans. Some banks may prefer to wait with the disposal of their impaired loans until the economic recovery and structural reforms improve the recovery prospects of such loans. Some banks might be reluctant to terminate client relationships (‘loan evergreening’). Furthermore, the sale of large impaired loan portfolios may have an adverse effect on some parameters of banks' internal ratings models (e.g. the loss-given-default parameter) which determine banks' capital requirements. Moreover, the sale of highly-provisioned NPLs tends to cause a fall in the average coverage ratio which is an element that banks may be reluctant to report, even though average asset quality has improved. Finally, small banks' NPL portfolios may tend to lack critical mass and be insufficiently diversified to attract investors.
NPL market activity in Italy has remained modest. So far, banks have preferred or have been compelled to work out impaired loans internally. Although some banks have taken steps to improve their arrears management capacity, considerable scope remains to further upgrade internal NPL strategies and practices. In the meantime, NPL market activity in Italy continued to be modest. The sale of impaired assets is expected to have reached almost EUR 14 billion in 2016, which means a considerable reduction from the EUR 19 billion of 2015 (PwC, 2016). However, market activity may pick up in 2017 as several large and medium-sized banks are planning to dispose of significant NPL portfolios, including through securitisation. Until now, the sale of impaired loans has mainly been opportunistic and concerned highly provisioned unsecured exposures, which are relatively easy to work out.
Several initiatives were taken to address banks' NPL problem, but as a comprehensive strategy is still missing, short-term relief to the sector has been limited so far. Most of the adopted measures aim to foster the development of a secondary market for distressed assets in Italy. These include (European Commission, 2016f) the removal of tax disincentives to loan-loss provisioning, further reforms of insolvency and collateral enforcement rules and the setting-up of an NPL securitisation scheme backed by state guarantees, provided at ‘no-State-aid’ terms (GACS) (
). The scheme – for the time being available until October 2017 – allows a bank (or group of banks) to set up a securitisation vehicle that issues senior-, junior- and optionally also mezzanine-ranked notes to acquire bad loans from that bank. Some banks are expected to make use of the scheme in the future. Although this scheme may help to reduce the NPL pricing gap by lowering funding costs, its effectiveness may be challenged by several factors. Most importantly, the appetite of private investors for a vehicle's riskier non-senior tranches may be limited if banks are unwilling or unable to grant a sufficiently high haircut on their bad loan portfolios. However, this drawback may be partially mitigated by the ‘Atlante II’ fund (currently having EUR 1.8 billion in resources), which aims to support the disposal of impaired loans, including by investing in non-senior tranches of bad loan securitisation vehicles. (
) Nevertheless, Atlante II may not have the full capacity needed to play a systemic role in the cleaning up of the Italian banking sector. Moreover, similar to Atlante I, the financing structure of Atlante II is a source of interdependencies between stronger and weaker entities. This could lead to contagion if unexpected losses arise from investments. Atlante II has not yet made investments, but is expected to do so in the context of some vulnerable banks' bad loan securitisation operations. Finally, the public EUR 20 billion fund, created to support vulnerable banks and protect savers, may facilitate the cleaning up the Italian banking system.
Supervisors are becoming more assertive on the need for banks to address the NPL problem. Bank of Italy has issued a new reporting template requiring banks to provide detailed data on their bad loans, collateral and ongoing recovery procedures. This could help banks improve the management of impaired loans, reduce information asymmetries and better inform supervisory action. The ECB has issued guidance to banks on NPLs, which the Bank of Italy intends to also apply to less significant institutions under its own supervision. A stocktaking report accompanying the guidance suggests considerable scope to expand supervisory guidance at national level. Finally, the ECB is raising pressure on more vulnerable banks, e.g. with NPL reduction targets.
Inefficiencies in Italy’s insolvency and collateral enforcement frameworks have not been overcome yet. Well-designed (pre-)insolvency and foreclosure frameworks are of key importance to preventing the piling up and the working out of NPLs, raising impaired loans’ recovery value, developing a secondary market for NPLs, and fostering the reallocation of productive resources. In Italy, however, the multitude and complexity of procedures, and capacity constraints caused by the crisis-driven surge in cases are proving difficult to tackle. For instance, bankruptcy proceedings on average continue to be excessively long (7.4 years over July 2015June 2016, as against 7.9 years over the previous 12 months), with very large regional disparities. Furthermore, the average time needed to enforce real estate (3.3 years over July 2015June 2016, as against 3.7 years over the previous 12 months) as well as movable assets (0.5 years over July 2015June 2016, unchanged from the previous 12 months) remained very long. (
) Moreover, creditors’ role in insolvency proceedings was still minimal in 2015. At the end of 2014, only 15 % of restructuring procedures were concluded within four years (Bank of Italy, 2016b). These weaknesses are highly relevant given Italian NPLs’ significant collateralisation: in Q2 2016, they were secured by real and personal guarantees for 67 % of their total gross amount.
The Italian authorities took further action in 2016, but a systemic overhaul of the insolvency framework is still under debate. In addition to reforms enacted in 2015 (European Commission, 2016f), a new law inter alia authorises private enforcement clauses in loan contracts with firms allowing creditors, in the event of a debtor's default, to take ownership of collateral out of court (pactum marcianum). This could significantly reduce the time needed to enforce collateral, and lenders may also be able to make use of such a clause when renegotiating already existing loan agreements. The law also enables entrepreneurs to pledge movable assets while continuing to use them (a kind of non-possessory lien). In addition, an electronic register for insolvency cases is being set up, which should enable better monitoring and foster discipline. Although most of the measures taken so far may support a faster disposal of impaired assets, their effects may materialise only in the medium term and in some cases be dependent on improvements in the capacity of the judicial system. Meanwhile, the ‘Rordorf’ experts committee has prepared the overhaul of Italy’s insolvency framework, leading to a draft enabling law currently under discussion in Parliament. This root-and-branch reform is expected to streamline the insolvency tools and increase specialisation.
Corporate governance reforms*
The implementation of the reforms of banche popolari and bank foundations is broadly on track. The implementation of the 2015 reform of large cooperative banks (banche popolari) is almost complete: all but two large popolari became joint-stock companies. However, Banca Popolare di Sondrio and Banca Popolare di Bari have postponed their conversion in anticipation of a Constitutional Court ruling following legal challenges against the reform’s restriction on shareholders’ withdrawal rights. Furthermore, a first merger (between Banco Popolare and Banca Popolare di Milano) became effective at the beginning of 2017, after the former raised an additional EUR 1 billion capital upon supervisory request. On bank foundations, the implementation of the Memorandum of Understanding with the Ministry of Economy and Finance is ongoing: almost all foundations have complied with the April 2016 deadline to align their statutes with the memorandum, but divestments from reference banks have incurred a delay due to unfavourable market conditions. In October 2016, one third of foundations had divested in line with the requirements of the memorandum. Half of the remaining foundations were still above the requested thresholds, albeit by small amounts.
The implementation of the self-reform of small cooperative banks has started. With the adoption of the primary law in April 2016 and the Bank of Italy’s secondary provisions in November 2016, the 18-month implementation period for the reform of Italy’s banche di credito cooperativo (BCCs) has started. The reform obliges BCCs to join a cooperative banking group (which can be either national or provincial) in order to retain their cooperative status. The holding of a group should be a joint-stock company and will have the power to direct and coordinate member BCCs on the basis of risk-based ‘cohesion contracts’. Holding groups must meet certain minimum capital requirements and have an internal safety net provided by a cross-guarantee between cooperative banks inside the same group. The Bank of Italy has asked entities envisaging to become the holding of a group to announce their intention by the end of January 2017. The BCCs’ shareholders have to decide which group they would like to join when they adopt their banks’ 2016 financial statements. It is currently expected that up to two national and one provincial cooperative banking groups may be set up. Cooperative groups reaching ‘significant institution’ status will be directly supervised by the ECB and will therefore be subject to a prior stress test and asset-quality review. If successfully implemented, the reform should make the BCC segment more resilient due to easier access to capital markets, cross-guarantees, benefits of scale and cost synergies. It would also be a big step forward in reducing banking sector fragmentation.
Reductions in the size of banks’ management boards have been made at a slow pace. As part of a broad corporate governance reform in 2014, the Bank of Italy set stricter requirements on the composition and size of bank boards and the role of a board’s chairperson as non-executive director, as well as guidance for boards’ self-assessment to strengthen risk management and internal controls. While banks have implemented most of these changes, the reduction in the number of board members is proceeding slowly. According to Bank of Italy, the average size of managing boards for listed banks is currently 12.9 (compared to 14.1 two years ago). However, Italian banks – including those under ECB supervision – still have larger boards of directors as compared with European peers. Furthermore, some credit institutions have a dual board system and the move towards a single board system appears to be limited.
4.3.
Labour market, education and social policies
4.3.1.Labour market*
The Jobs Act and its impact
Italian labour market institutions have been deeply reformed over the last two years. The enabling law for the reform of the labour market (‘Jobs Act’) was adopted at the end of 2014. All implementing legislative decrees were adopted in 2015. The Jobs Act reduced the cost and the uncertainty of individual dismissals, rationalised contractual forms and passive policies (including wage supplementation schemes) and initiated a broad reform of active labour market policies, bringing the Italian labour market closer to the labour flexicurity model. It also reduced administrative costs for firms, streamlined inspection activities and included measures to promote the balance between work and family life. The objective was to improve the entry and exit flexibility, enhance labour reallocation, reduce duality and promote stable open-ended employment. To support the reform, the government enacted generous fiscal incentives for permanent new hires in 2015 and 2016. For 2017, incentives are targeted to young people and workers in the south (European Commission, 2015a; European Commission, 2016b).
Positive effects are already emerging, as employment is growing and dualism is reducing. (
) Employment started to pick up in the second half of 2014 and accelerated in 2015, but remains far from the 6769 % Europe 2020 national target. While in 2014 temporary employment was the main contributor to employment growth, since Q2 2015, permanent employment has become the main driver (Graph 4.3.1). In 2016, in spite of a substantial reduction in hiring subsidies (from 100 % of social security contributions to 40 %), dependent employment continued to expand. Administrative data from INPS and the Ministry of Labour confirm that the number of new hires on open-ended contracts increased significantly in 2015 relative to 2014. However, as fiscal incentives were scaled down, in between January and August 2016, the number of new hires with open-ended contracts was lower than the number of new hires on fixed-term contracts. At the same time, the rate of conversion from fixed-term to open-ended contracts remained higher in 2016 than in 2013-2014, suggesting that the reform is having a lasting impact.
|
Graph 4.3.1:Contribution to annual employment growth by contractual status
|
|
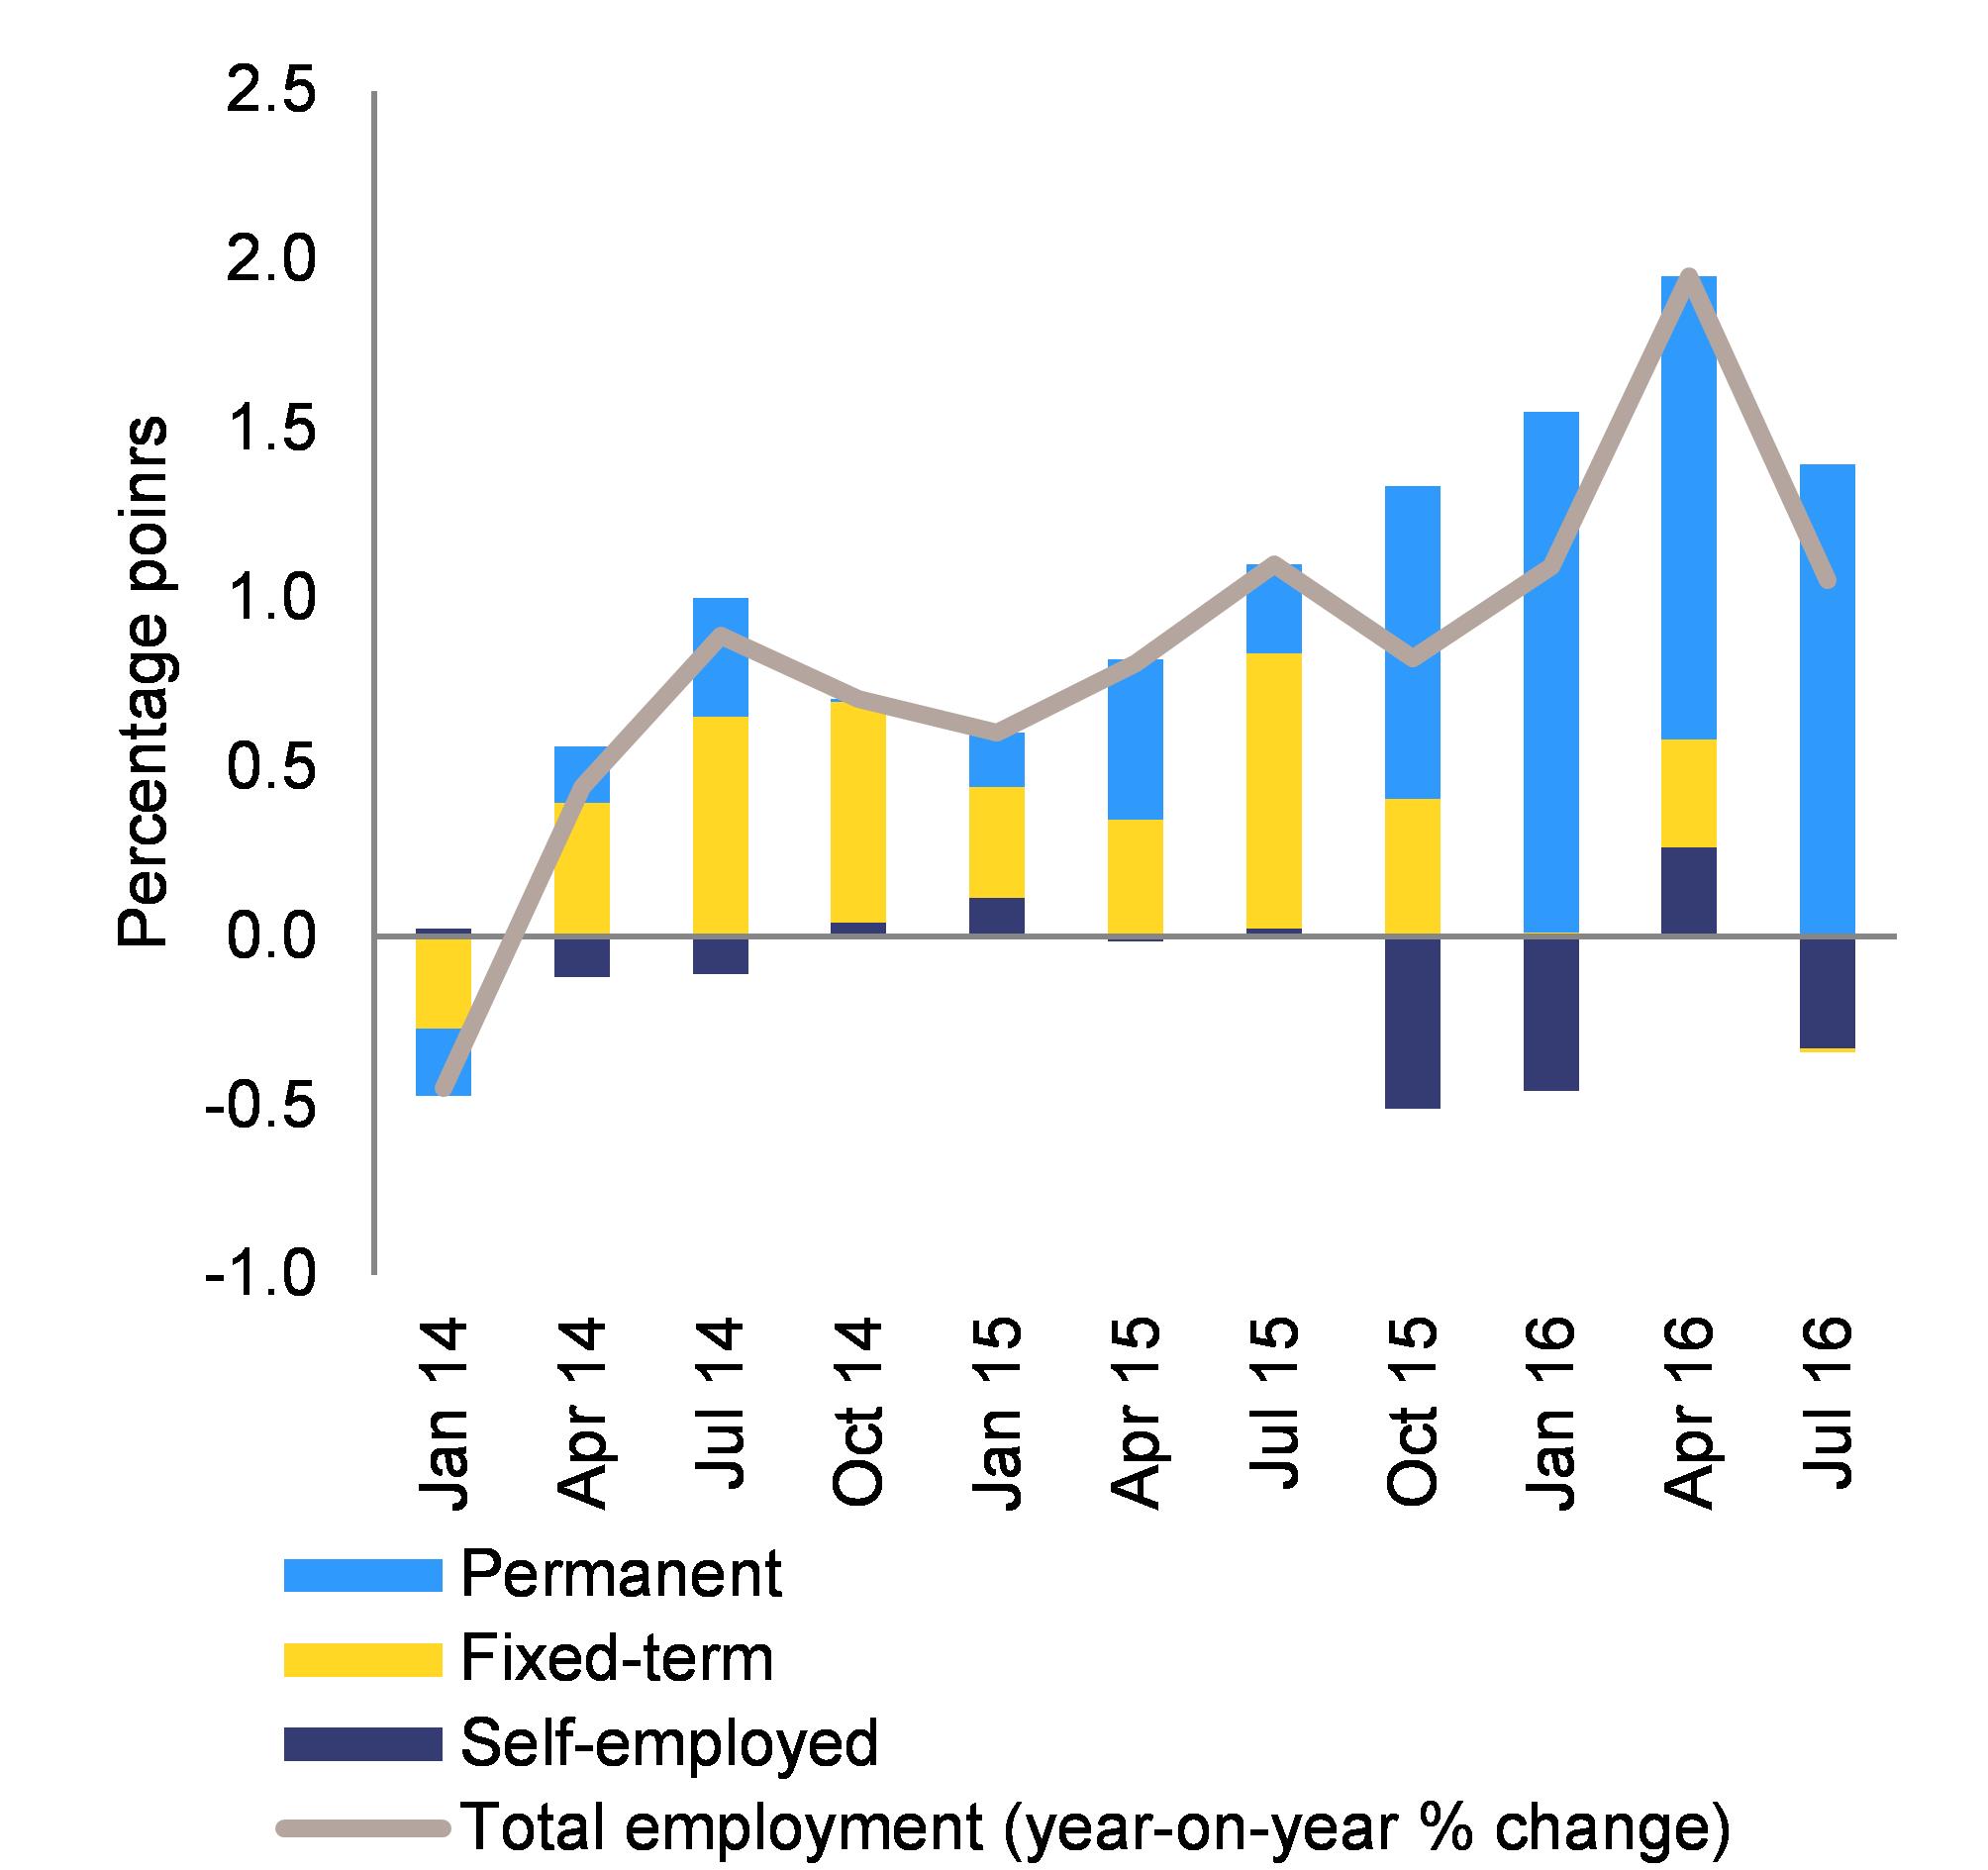
|
|
Source: Istat, Labour Force Survey
|
Remaining challenges
Collective bargaining
Italy’s collective bargaining suffers from several shortcomings. Firm-level contracts concern a minority of firms. This limited use of firm-level bargaining hampers the response of wages to economic conditions, the efficient allocation of resources and the development of innovative solutions at firm level that could improve productivity. This is also due to some specific features of the collective bargaining framework, which entail uncertainty in industrial relations and reduce the scope for firm-level negotiations. These features were described in European Commission, 2016b, Box 2.4.1.
Contracts are renewed sector-by-sector, but no progress is made in reforming the collective bargaining framework. The rules currently regulating collective bargaining were agreed in 2009 and formally expired in 2013, but social partners repeatedly postponed an agreement on a new framework. In December 2016, the largest employer association and trade unions started preliminary discussion on the bargaining framework. Negotiations are now taking place on a sector-by-sector basis. Current negotiations between trade unions and employers’ organisations focus mainly on how to adjust salaries to price inflation. Another aspect is the possibility to include welfare provisions (e.g. childcare, additional social security) in second-level bargaining, possibly instead of wage increases. The metal sector agreement for 20162019, signed by the social partners in November 2016 after long negotiations, includes these elements.
The agreement on trade union representativeness, a prerequisite for the decentralisation of collective bargaining, has not yet been implemented. In 2014, the three main trade unions and Confindustria agreed on the criteria for measuring trade union representativeness, a prerequisite for having legal certainty about the validity and enforceability of contracts at firm, local and national level. Although similar agreements have been signed with other employers’ associations, none of them is operational yet but negotiations are progressing. The application of the agreed criteria will resolve the uncertainty linked to workers’ representation and the relationship between different bargaining levels, which is a major obstacle to establishing binding agreements at firm and local level.
The impact of tax incentives on productivityrelated wages to foster secondlevel bargaining has not yet been assessed. To foster the decentralisation of wage bargaining, the 2017 Budget Law strengthened the tax rebates on productivity-related wage increases introduced in 2016. Waived fiscal revenues are estimated to increase gradually to nearly EUR 1 billion per year in 2019. Effective monitoring of the actual impact on firms’ internal organisation and salary policies will be crucial to avoid that the scheme is used only to benefit from lower contributions and higher net salaries.
Labour participation of second earners
The potential of female labour market participation remains largely underutilised. The employment rate of women remains very low (50.6 % for those aged 20-64 years, 20 percentage points less than for men), as does the female activity rate (54.1 % in 2015, as against an EU average of 66.8 %). This results in a large economic cost, also when considering that women have relatively higher educational attainment rates than men. Available estimates suggest that increasing women’s labour market participation to the level of men would increase Italy’s GDP by 15 % (IMF, 2016; Eurofound, 2016).
The tax system continues to discourage second earners from participating in the labour force. In Italy, the financial disincentives to move from inactivity and social assistance to employment (‘inactivity trap’) are above the EU average and growing. A second earner taking up a job with a wage equivalent to 67 % of the average wage would find nearly 31 % of this wage taxed away through the combination of taxes, social security contributions and reduced social transfers. This compares with 30.5 % in 2014 and 30 % on average in the EU. The high inactivity trap can be explained by the steep progressivity of income taxes, the tax credits for the not-employed spouse and tax credits and/or cash transfers for dependent children (Colonna and Marcassa, 2015).
Access to affordable childcare remains limited, with wide regional disparities. The employment gender gap (
) widens very significantly when households include children and elderly persons. (
) Besides, female labour force participation is highly sensitive to childcare costs and the effects are particularly pronounced for married and lesseducated women, who are also those more likely to face higher inactivity traps. This suggests that access to affordable care for children and the elderly is essential to raise female participation. Yet, around 25 % of children are covered by public childcare in the north, where there is nevertheless unmet demand, and only 5 % in the south.
Cash allowances may have negative consequences for labour participation. Given the shortage in the supply of childcare, childcare subsidies in cash may create disincentives for women to work. However, policy action has been centred on cash allowances. An allowance of EUR 80 per month for three years was introduced in 2015 for children born or adopted in 2015-2017. The budgetary impact is over EUR 1 billion per year in 2017 and 2018 but the effectiveness of the measure is unclear. Law 92/2012 introduced the possibility of exchanging the parental leave with babysitting vouchers, to be re-financed every year. Take-up was limited at first, but in 2016 the measure was very successful and the budgetary allocation was entirely spent by August. The 2017 Budget Law extends this possibility to 2017 and 2018. The law also introduces from 2017 a nonmeanstested voucher of EUR 1 000 per year to be spent in public or private nurseries.
Paternity leave is among the shortest in Europe. Paternity leave in Italy is two days, one of which is paid in full. The 2017 Budget Law extends the paternity leave to four days from 2018. This limited paternity leave has effects on women’s employment and on gender equality, both on the supply side (in terms of the number of women looking for a job) and the demand side (the perception that the costs of child-caring are associated only with mothers).
Active labour market policies
The implementation of the active labour market policy (ALMP) reform is still in an early stage. The placement capacity of Italian employment services and the expenditure on activation measures are well below the OECD average (Graph 4.3.2). The Jobs Act aims to strengthen the capacity and effectiveness of employment services while tackling the longstanding weaknesses of the system (e.g. understaffed public employment services, the lack of an information infrastructure, fragmented monitoring, regional disparities) (European Commission, 2016b). However, so far only the initial steps have been taken. The nonadoption of the envisaged constitutional reform, which sought to give central government exclusive competence for ALMPs, may represent an additional implementation challenge.
The reorganisation of ALMP governance has started. The new Agency for Active Labour Market Policies (ANPAL) has been operational since January 2017. (
) It is in charge of coordinating and monitoring a wide network of institutions and agencies involved in labour policies. (
) The objective is to enhance policy consistency and improve the effectiveness of ALMPs throughout the country. The agency is preparing a strategic plan on ALMP (Piano per le Politiche Attive), which includes support from the 2014-2020 European Social Fund (EUR 6.7 billion). The plan aims to strengthen public employment services, also through staff hiring and training. A unified information platform and a national accreditation system of employment services and agencies will be created. This would replace regional systems, which are not yet functioning properly everywhere. The agency will determine standard measures and costs for all regions, and indicators are envisaged for evaluating the performance of employment agencies. The Conference of the State and the Regions has reached an agreement for the finalisation of the plan.
Support for jobseekers is being modernised and an outplacement voucher has been launched on an experimental basis. A customised service agreement (patto di servizio personalizzato) is envisaged, to be agreed between the employment agency and the jobseeker. The agreement will commit the former to provide a range of opportunities tailored to her/his specific needs and the latter to accept them, if appropriate. The takeup of activation measures is needed for receiving the benefits and penalties are applied if the jobseeker does not comply. An outplacement voucher (assegno di ricollocazione) pilot was launched in November 2016. The voucher can be used to pay for public or (authorised) private employment services. Its value is proportionate to the person’s employability, based on observable factors (e.g. employment history, gender, age). It is paid only upon job placement.
|
Graph 4.3.2:Public expenditure on labour market policies, 2014
|
|
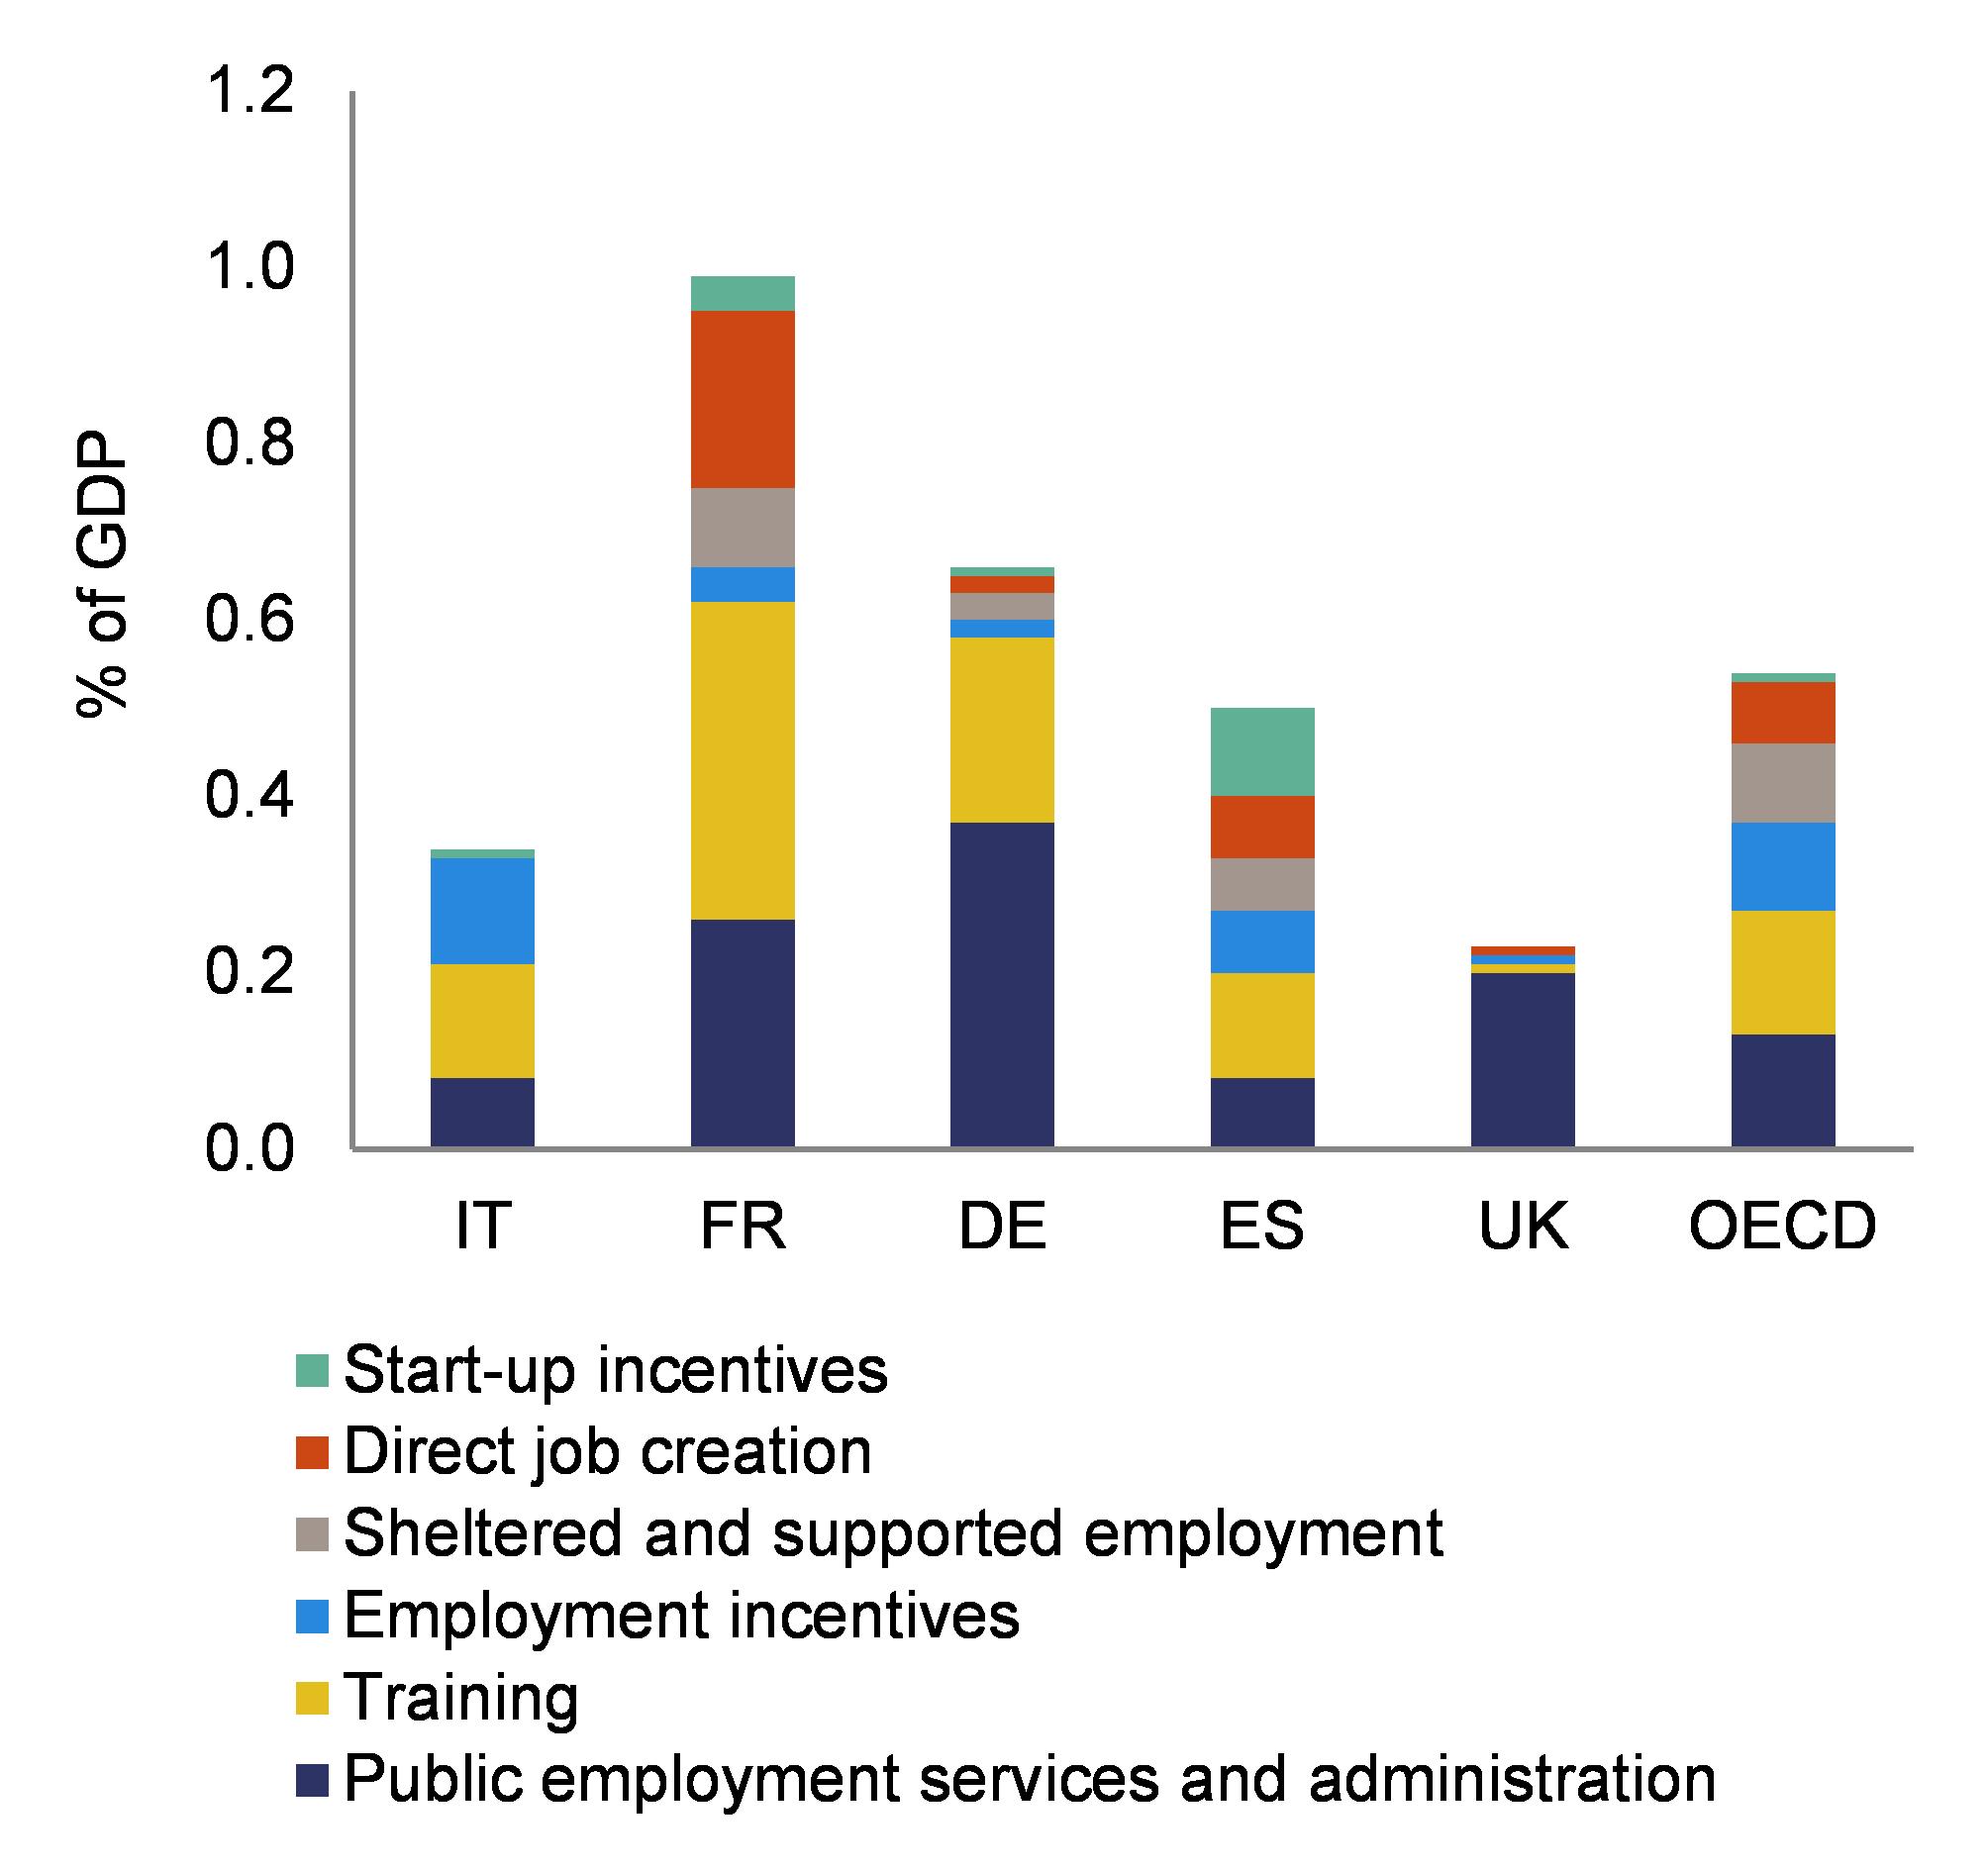
|
|
Source: OECD
|
After a slow start in 2014, the implementation of the Youth Guarantee has progressed significantly since 2015. In Italy, the Youth Guarantee is funded mainly through the national Iniziativa Occupazione Giovani operational programme (EUR 1.5 billion). In December 2016, more than 1.1 million young people were registered and almost 800 000 signed an ‘activation pact’. Over 400 000 measures have been delivered to the participants, almost half consisting of traineeships (Ministry of Labour, 2017). (
) Nearly 35 % of those who completed a Youth Employment Initiative operation were employed four weeks later and the percentage increases to nearly 43 % after six months (INAPP, 2016). In 2015, two new measures were introduced: the ‘Superbonus’ (for employers hiring young people who participated in a relevant traineeship) and the ‘Selfiemployment’ (micro-credit and subsidised loans to support self-employment). In the first four months of the former, 5 412 job contracts were signed (2 020 permanent contracts and 3 392 apprenticeship contracts) (Ministry of Labour, 2016a). Further improvements are the outreach to non-registered young people neither in employment nor in education or training, the use of standardised profiling, individual support for young people and the takeup of key measures such as traineeships and specialised training courses.
Some challenges remain to ensure the full implementation of the Youth Guarantee scheme. The number and quality of offers remain low and regional differences in the delivery of the guarantee remain high. The quality of vocational education, including apprenticeships, is still limited (see Section 4.3.3). Regional and national monitoring systems on the implementation of the scheme are still to be further integrated and harmonised. Engaging the most vulnerable and disengaged young people not registered for the programme remains a challenge.
Refugees show relatively high employment rates, but current high inflows are a challenge. In 2014, the employment rate of refugees (aged 20-64) was 61.3 %, exceeding the employment rate of native born in general (59.7%), but below the employment rate of native born men (69.3%), a more valid point of comparison considering the high share of men among refugees. Asylum seekers are entitled to personalised integration support (e.g. language training, ten hours of adult education per week and civic integration classes). However, only about a fourth of asylum seekers took up integration support in 2014 (OECD, 2016b). Addressing the challenge will require further social and labour market integration efforts.
Undeclared work
Inspection activity is strengthened but the incidence of undeclared work remains high. In 2014, the irregularity rate (the ratio of irregular employment in fulltime equivalents to total employment in fulltime equivalents) grew by 0.7 percentage points compared to 2013, reaching 15.7 % (Istat, 2016a). Undeclared work continues to show strong regional and sectoral differences (European Commission, 2016b). The Jobs Act established a new national labour inspection agency (Ispettorato Nazionale del Lavoro (INL)), simplified inspection activities and strengthened monitoring activities, including by rationalising the use of technical and financial resources.
Voucher-based work was introduced in 2003 and has been growing steadily, but the impact on undeclared work seems uneven across sectors. The aim was to promote the regularisation of occasional activities and to foster employment opportunities for students, inactive people and older people interested in short-term and casual jobs. Limits to their use were relaxed in 2012, 2013 and finally in 2015. The take-up of vouchers has been increasing steadily since 2012. In 2015, voucher-based work involved more than 1.3 million workers, 136 % more than in 2014 (Graph 4.3.3), although it still represents only 0.23 % of the total cost of labour (INPS, 2016). Vouchers are increasingly used by younger workers (the average age declined from 59.8 to 35.9 years over 2008-2015) and women (the proportion of whom increased from 21.5 % in 2008 to 51.5 % in 2015). Figures for 2015 show a predominant use in northern regions and in certain service sectors (Ministry of Labour, 2016b). Vouchers are used less in agricultural and domestic services, which are often characterised by a high prevalence of undeclared work. To address the issue of undeclared work and labour exploitation in the agricultural sector, a law adopted in October 2016 strengthens civil and criminal procedures and monitoring activities.
|
Graph 4.3.3:Voucher-based workers and average number of paid vouchers per worker, 2008-2015
|
|
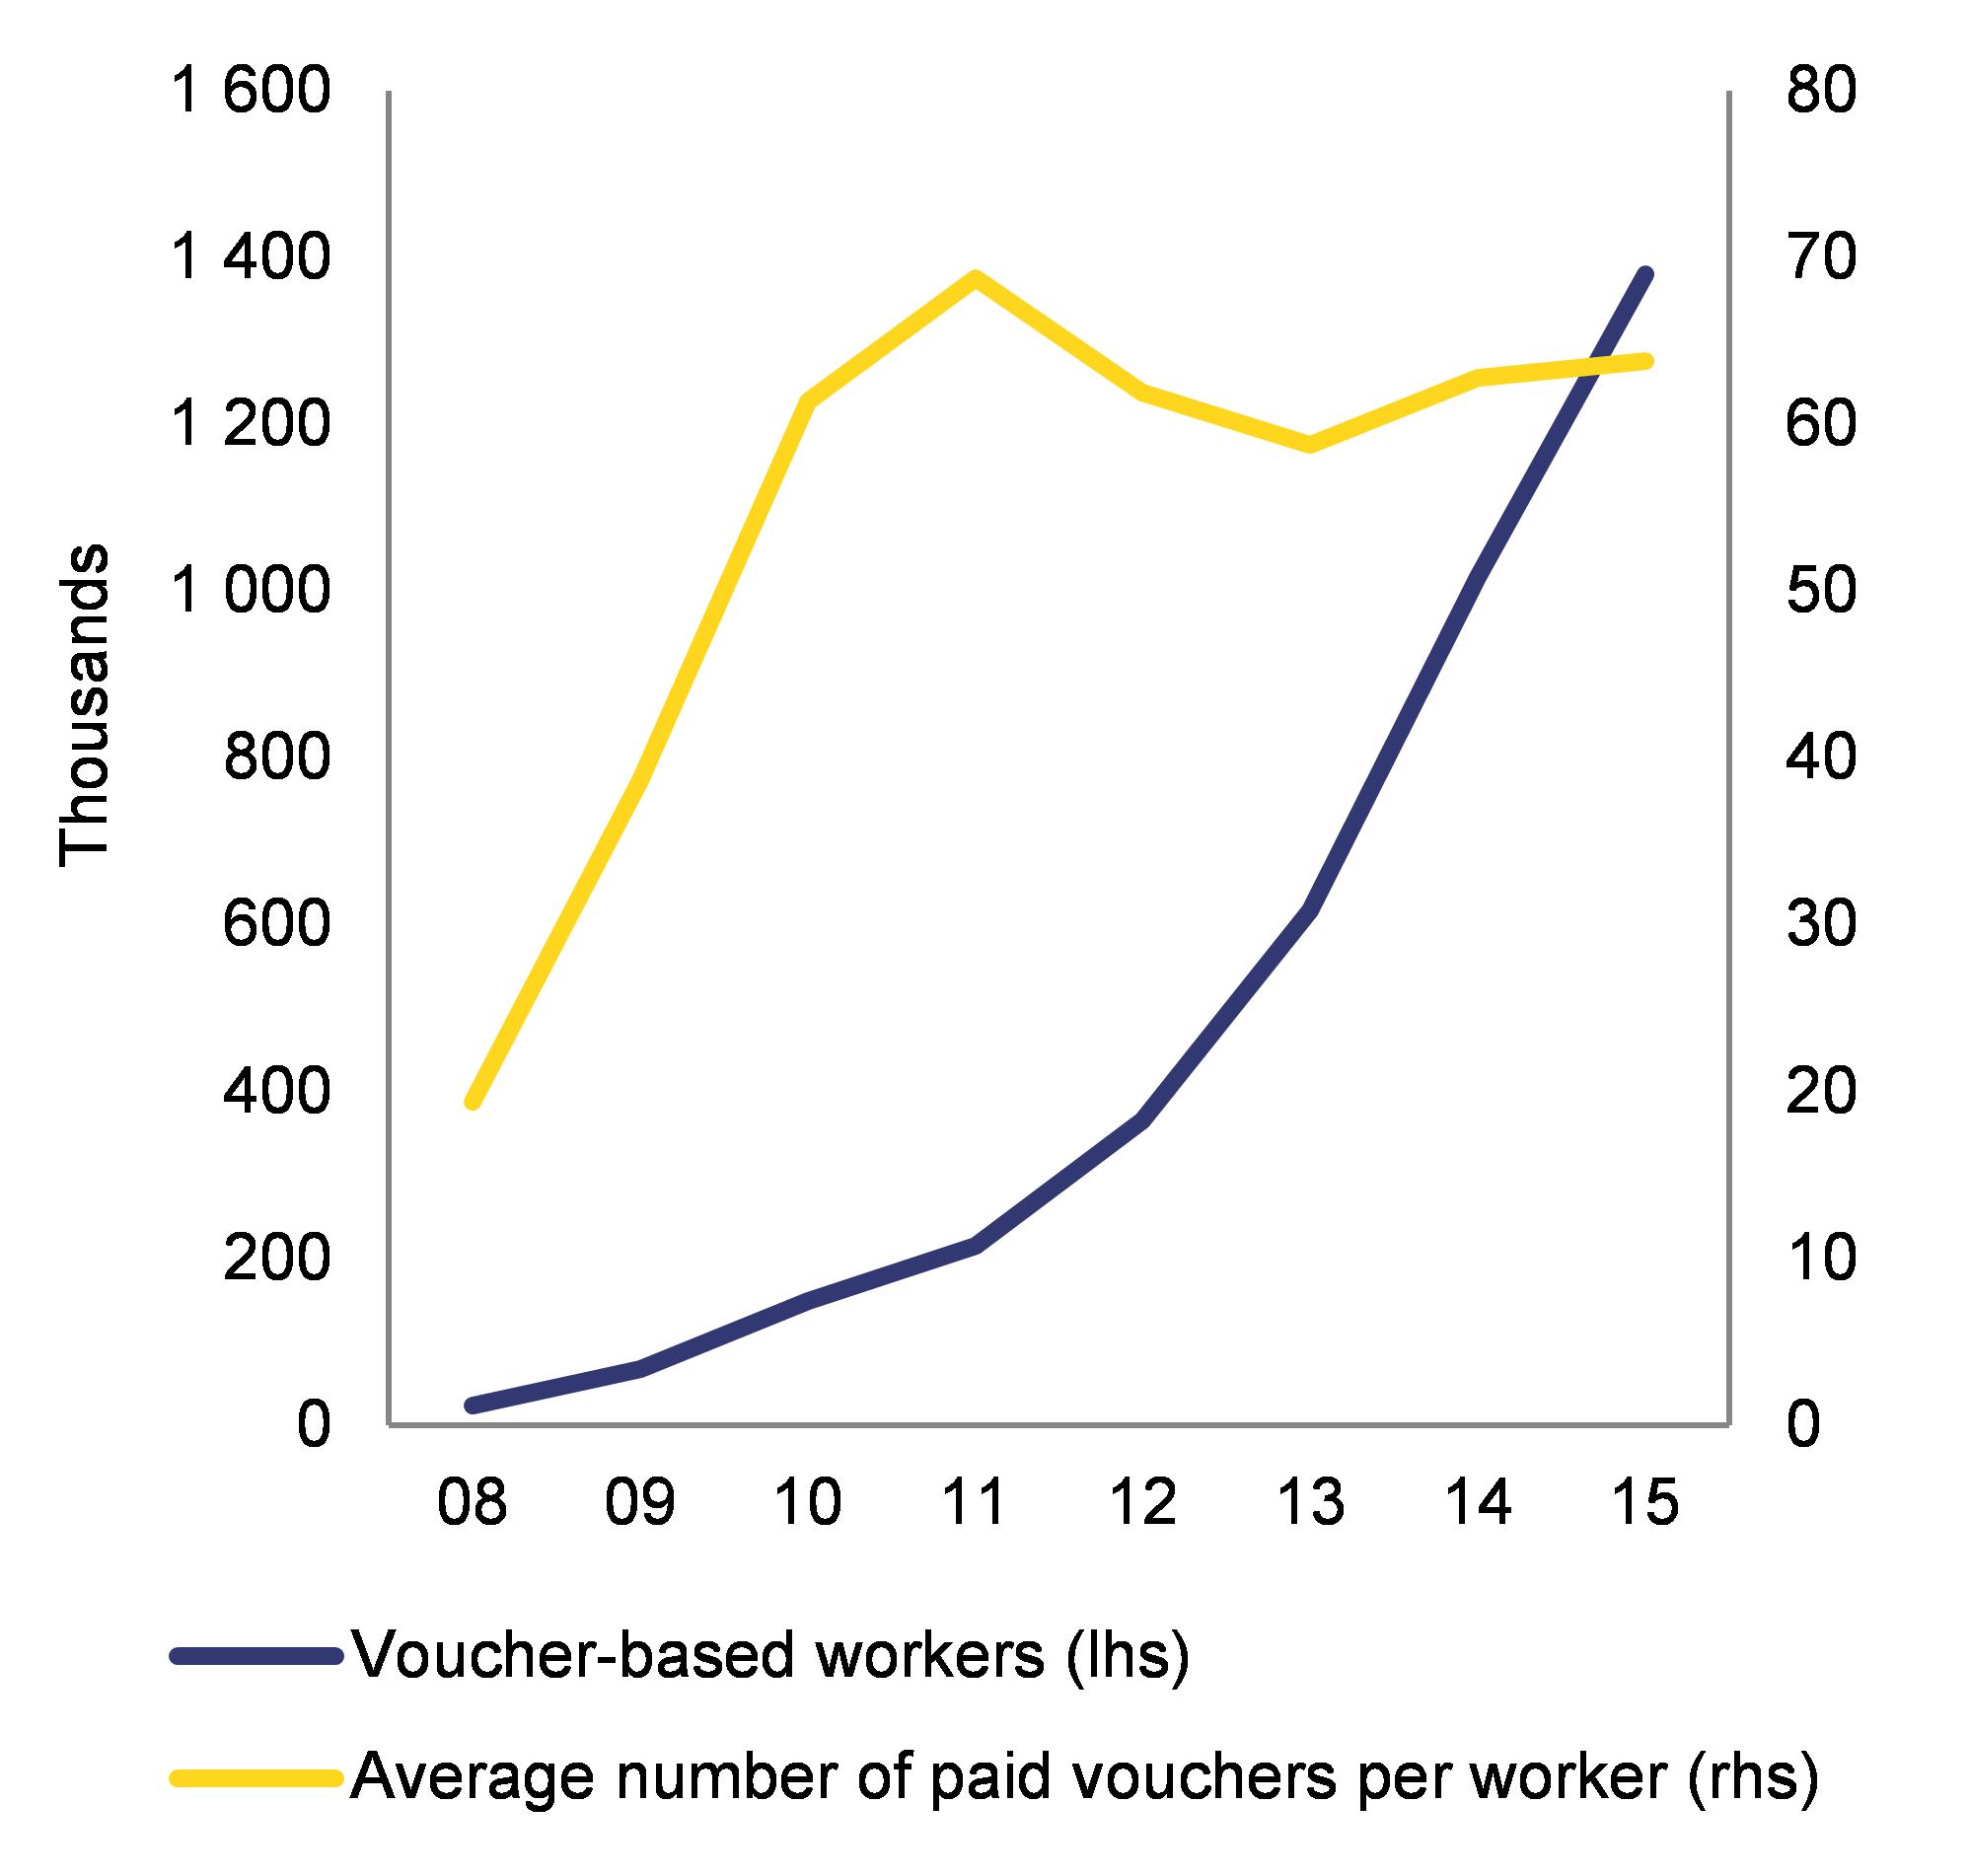
|
|
Source: INPS
|
Labour market traps are starting to appear as a sideeffect of vouchers. Some 49 % of voucherbased workers employed in 2015 were employed under the same status in the previous year and 25-30 % of those employed in 2012-2013 were still employed under the same arrangements in 2015 (INPS, 2016). Some 10 % of voucher-based workers employed in 2015 (about 140 000 workers) had previously had a regular or atypical employment contract with the same employer (Ministry of Labour, 2016b). Overall, while the use of vouchers can bring more people into the labour market, the impact of vouchers on actual working conditions and social security protection is yet to be assessed. A comprehensive strategy to address the causes of undeclared work is missing.
4.3.2.Social policies
Poverty rates in Italy are high and rising, especially for children. In 2015, the at-risk-of-poverty-or-social-exclusion rate rose slightly to 28.7 % (17.5 million people) and remains well above the EU average (23.7 %). The risk of poverty for children has been growing faster than for the population in general, while it is declining in the EU as a whole. A third of Italian children are now at risk of poverty or social exclusion, which is among the highest rates in the EU. The recent influx of migrants, including many vulnerable women and minors, is likely to exacerbate this problem. As poverty is rising, people with lower incomes face difficulties in accessing affordable houses, in particular in big cities. There were some 650 000 families on waiting lists for social housing and over 50 000 homeless people were recorded (HE, 2015; ISTAT, 2014).
In-work poverty is higher for temporary workers. In 2015, 16.7 % of population in employment was at risk of poverty or social exclusion (EU average: 12.5 %). Being employed reduces poverty risk by 39 % in Italy (45 % in the EU as a whole). Italian workers on temporary contracts faced one of the highest poverty risks in the EU. This raises the importance of improving labour market functioning and reducing duality, the key Jobs Act aims. The skills distribution may also play a role. Italy has one of the highest shares of low-skilled workers in the EU.
The risk of poverty or social exclusion is higher for people from a migrant background. In 2015, 47.7 % of non-EUborn people over 18 were assessed to be at risk of poverty or social exclusion (25.7 % of nativeborn people). The share of non-EUborn people over 18 facing severe material deprivation was more than double that of nativeborn people (23.9 %, as against 10 %). This represents one of the highest gaps in the EU. The ‘in-work at-risk-of-poverty’ rate among non-EUborn people (over 18 years old) was 26.7 %, (9.1 % for nativeborn people). As the employment rate of non-EUborn people is quite high (60.6 %), the high in-work poverty rate may be explained by the high concentration of non-EUborn people in low-skilled jobs and their overrepresentation in temporary or informal employment.
The increase of migrants entering the country irregularly poses challenges to reception and integration. The number of irregular migrants has increased, and those coming from countries with lower asylum recognition rates are overrepresented (see Section 1). This implies a need to ensure the return for those who did not receive protection and to provide for integration measures for those who received protection. There are challenges in ensuring cooperation between the different administrative levels involved in the management of reception, embodied in the ‘System for Protection of Asylum Seekers and Refugees’ (SPRAR). The distribution of asylum seekers and refugees is a source of discussion between the National Association of Italian Municipalities (ANCI) and the Interior Ministry. Italian authorities estimate the budgetary costs due to the migration influx at around 0.2 % of GDP in 2016. A new national ‘reception plan’ was introduced. To accompany the scheme, additional EUR 100 million were allocated to grant municipalities up to EUR 500 for each refugee they agree to accommodate.
The national poverty figures mask a wide north-south divide. Some of the regions in the north (Graph 4.3.4) have among the lowest poverty rates in the EU (e.g. Provincia Autonoma di Bolzano/Bozen). Conversely, poverty is high and widespread in the south (e.g. Sicily). The varying quality and adequacy of social services across the regions partly explain these differences. Italy is one of two Member States which does not have a national minimum income system and the social policy framework is very fragmented. Excluding pensions, social transfers reduce the number of people at risk of poverty and social exclusion by 21.7 % (33.2 % in the EU as a whole).
Experimental measures to address poverty were reinforced in 2016. The ‘Support for Active Inclusion’ (SIA) was extended to the whole national territory. This means-tested benefit is targeted at low-income households that meet certain criteria. The economic support is also conditional on participation in multidimensional activation programmes tailored to the specific needs of the beneficiaries. The scheme benefits from the support of the European Structural and Investment Funds, particularly to increase the availability and efficiency of social services involved in care projects. The implementation started in September 2016 with an initial budget of EUR 750 million.
|
Graph 4.3.4:People at risk of poverty or social exclusion by NUTS 2 region, 2015
|
|
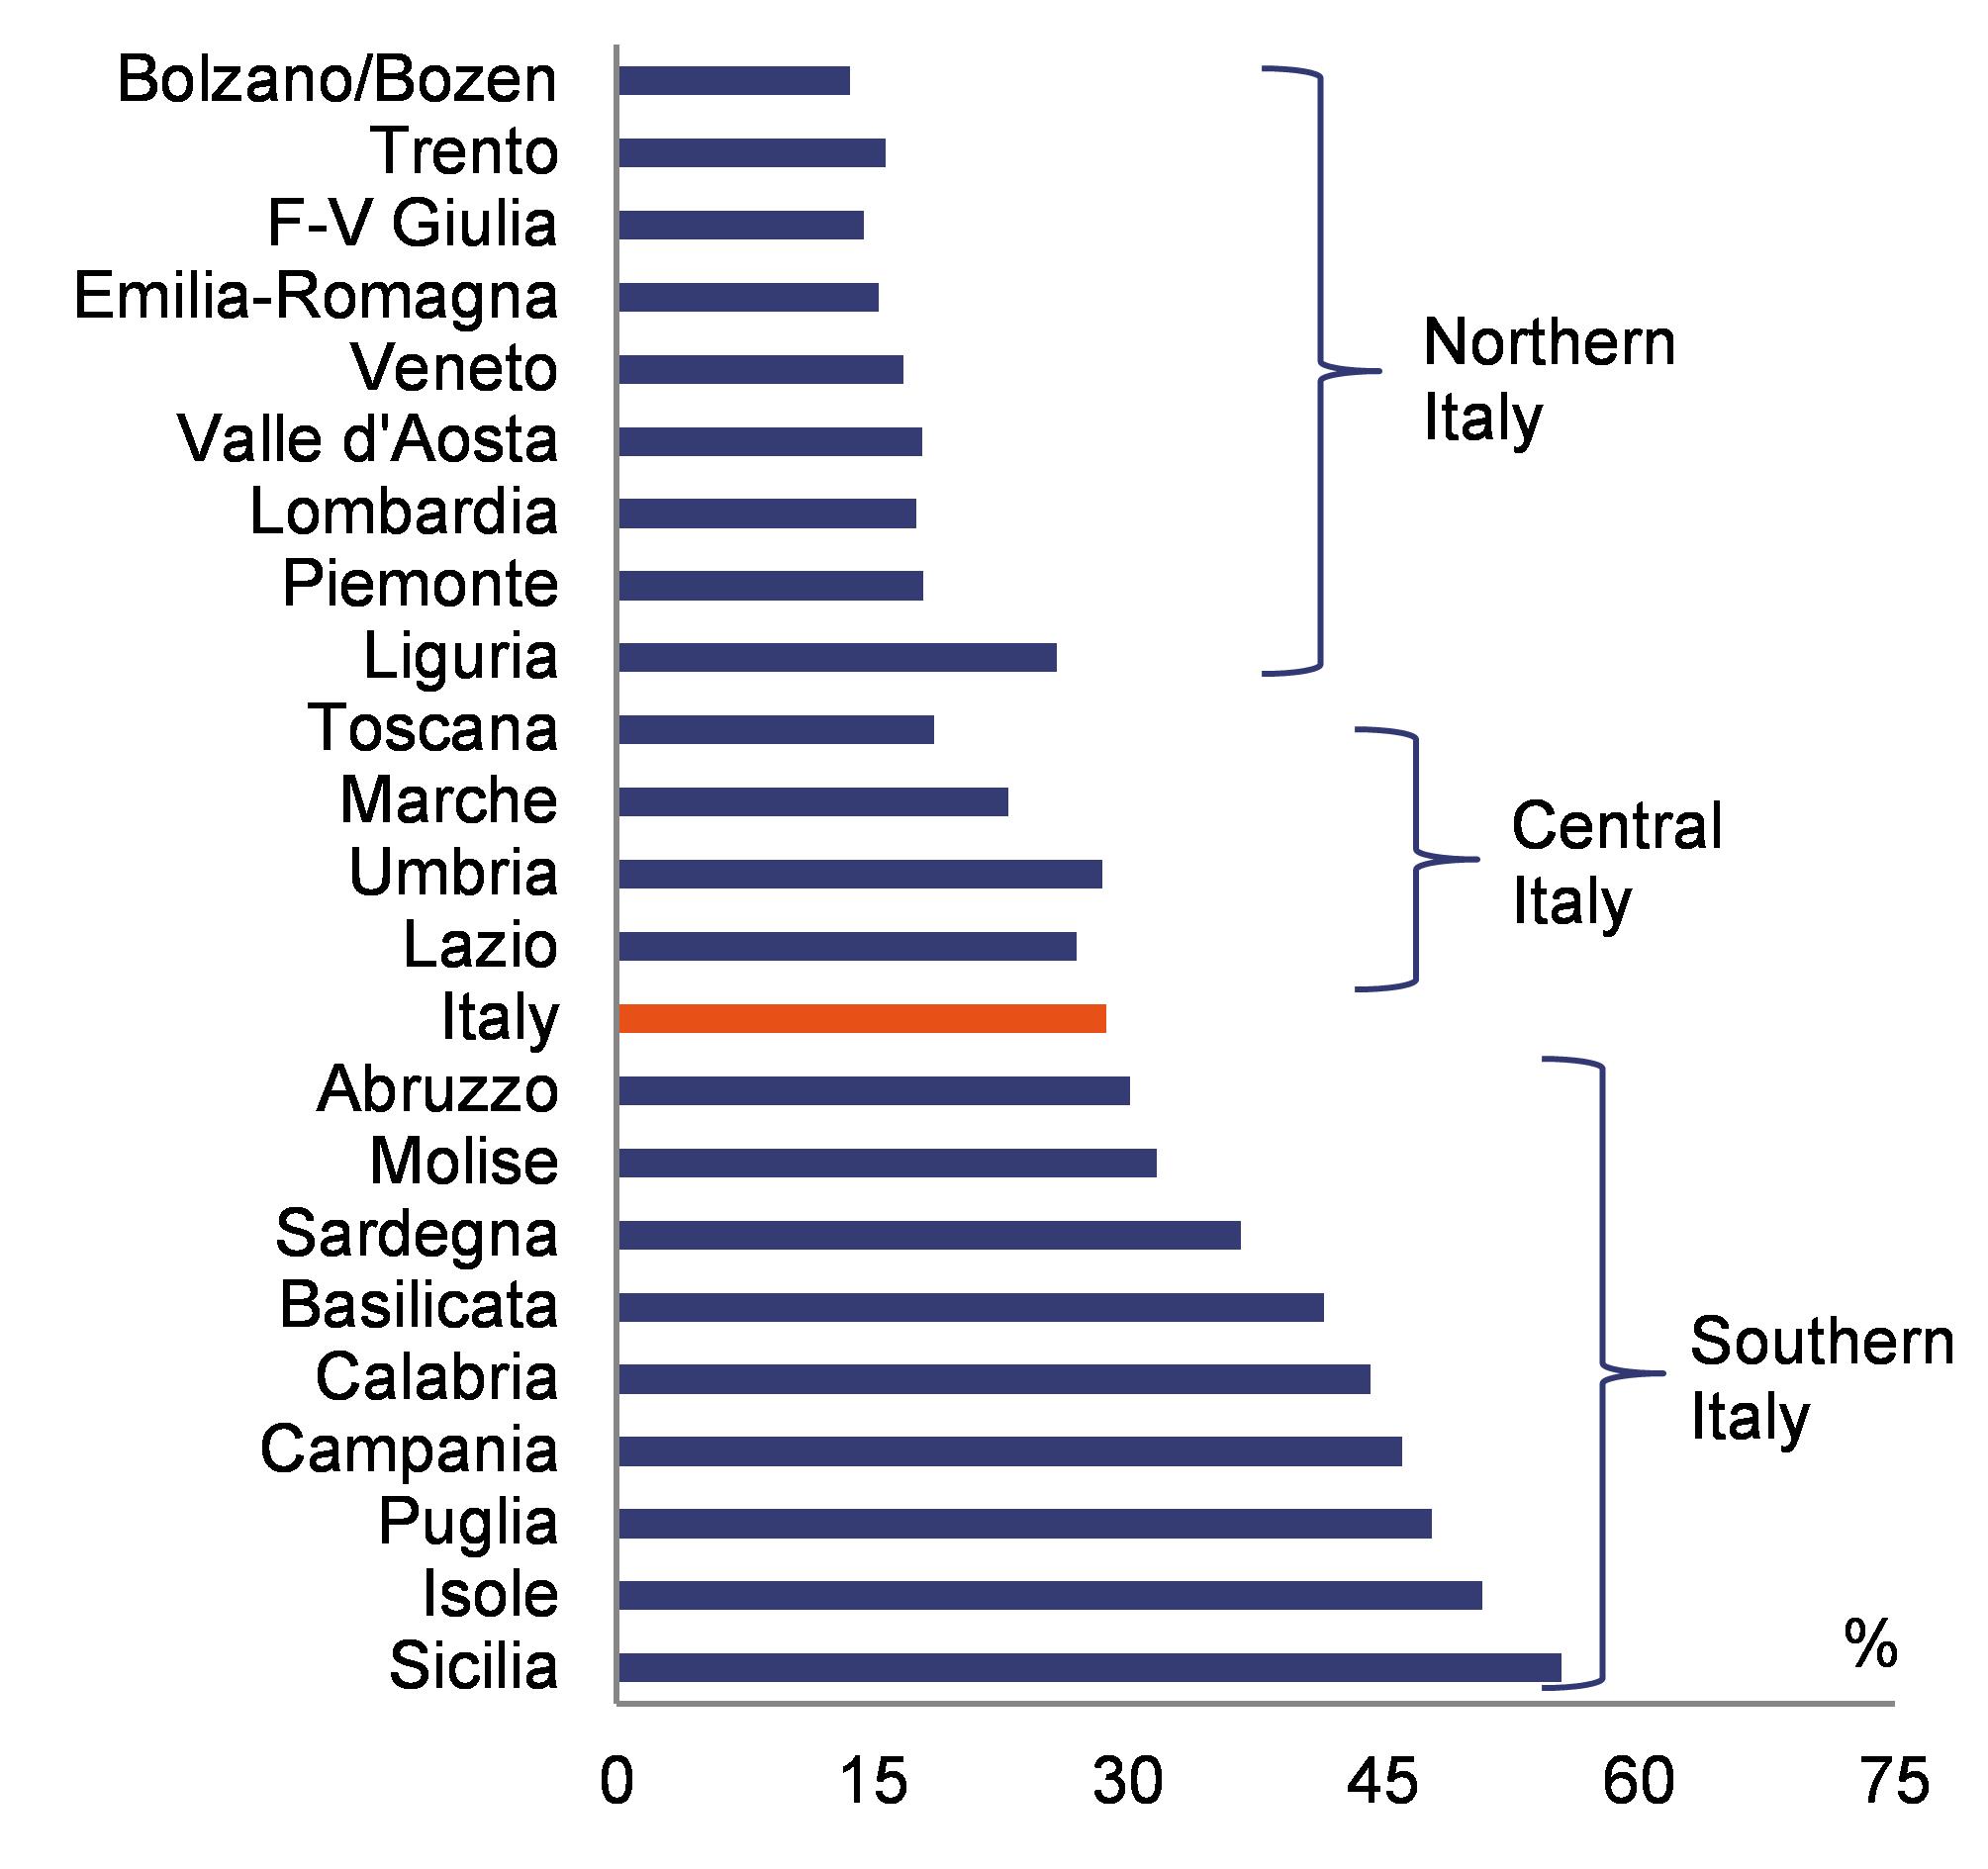
|
|
Source: Eurostat
|
The new ‘Inclusion Income’ scheme is a start to tackle the rise in poverty. Building on the SIA, the new ‘Inclusion Income’ scheme (reddito di inclusione) will define a basic level of social benefits guaranteed nationwide. The draft legislation is currently discussed in Senate. Once adopted, it will need further legislative implementing decrees. It is unclear whether the financial resources (around EUR 1.7 billion, after the recent increase) will be sufficient to address Italy’s poverty challenge. The measures on pensions introduced in the 2017 Budget Law (see Section 4.1) confirm the persistent bias of social expenditure towards pensions.
The streamlining of social spending does not go as far as initially envisaged. Two social assistance schemes (carta sociale and assegno di disoccupazione (ASDI)) will be absorbed into the ‘Inclusion Income’. However, some schemes will remain, notably those for the elderly population, those in support of parenthood and those linked to disability and invalidity. This fragmentation may make the system unclear and harder to access.
Health outcomes and quality of care are generally good. Health outcome indicators such as life expectancy and healthy life years have been consistently above the EU average in recent years. Overall, public health expenditure, though rising, is below the EU average, which suggests that the Italian healthcare system is costeffective. Expenditure on pharmaceuticals has risen recently in line with the cost of medical innovations, though it may be moderated by payback schemes in place. E-health systems are being developed, as are information and monitoring systems in support of performance assessment.
However, interregional inequities persist and income-related disparities in access to care seem to be rising. The proportion of people reporting that they could not afford a necessary medical examination increased from 5.1 % in 2011 to 6.2 % in 2014 and the proportion reporting that they did not take a necessary medical examination because of excessive waiting lists is above the EU average. Incomerelated disparities in self-reported health status are also on the rise. Out-of-pocket payments on health as a proportion of total health expenditure have increased slightly. The number of hospital beds per 100 000 inhabitants is below the EU average. While the number of physicians per 100 000 inhabitants is above the EU average, the ratio of nurses to physicians is among the lowest in the EU. Disparities persist in the extent and quality of healthcare provision across regions.
4.3.3.Education and skills*
School education in Italy produces mixed outcomes in terms of basic skills attainment. In 2015, Italy again recorded diverging results in the OECD Programme for International Student Assessment (PISA). Overall, the proportion of low achievers is close to the EU average in reading (21 %) and maths (23 %), and somewhat higher in science (23 %). However, performance is above the EU average in the north and significantly worse in the south. Compared with 2012, performance remained broadly stable in maths and reading, but worsened in science (OECD, 2016c; European Commission, 2016g).
Non-EU born students are at high risk of leaving school early. The early school leaving rate for non-EU born was 33 % in 2015, considerably above that of native born (12.7 %), among the highest gap in the EU. The 2015 school reform included some new measures to promote the integration of migrant pupils. They are not tailored to asylum-seekers, but cover non-Italian students in general. The Ministry has provided schools with proposals and guidelines on how to deal with the 10 most common critical issues they face as regards the inclusion of migrant students. Teachers specialised in teaching Italian to migrant students are being recruited for the first time in the 2016 open competition for permanent posts. This is expected to be the practice in future open competitions as well. Although the performance gap between the native population and first-generation immigrants is quite large, second-generation immigrants are catching up (OECD, 2016b; European Commission, 2016g).
Italy is implementing the 2015 school reform, which is expected to improve school outcomes (European Commission, 2015c). School heads have greater autonomy in managing human, technological and financial resources and will be subject to external evaluation every year from 2016-2017. The success of this measure will depend on the proper implementation of this evaluation system. Approximately 90 000 teachers who had been employed on short-term contracts were recruited on a permanent basis in 2015-2016. While around 45 % filled existing positions, the others took up new posts. The recruitment plan was intended to address the longstanding problem of qualified teachers on ‘waiting lists’ being recurrently recruited on a temporary basis and to strengthen schools’ educational provision. Overall it is a positive measure. However, in the initial implementation phase, the competences of the additional teachers have not always matched individual schools’ needs (European Commission, 2016h). A new open competition to recruit up to around 64 000 teachers on a permanent basis was held and a national plan for teacher training and professional development was launched in 2016. This could lead to a better matching of teacher supply and demand.
The higher education system is underfunded. Despite being close to the national Europe 2020 target (26-27 %), Italy’s tertiary educational attainment rate is still the lowest in the EU, at 25.3 % in 2015 for 30-34 year-olds (the rate is 38.7 % for the EU as a whole). At only 0.3 % of GDP, general government expenditure on higher education was the lowest in the EU in 2014, partly due to large funding cuts during the economic crisis (Graph 4.3.5), which coincided with a partial freeze on recruitment. This resulted in an increase in the average age of academics (ANVUR, 2016). Student support is low. Only 9 % of first-cycle students receive a public grant, one of the lowest proportions in the EU (European Commission, 2016i). A fifth of eligible students do not receive a grant due to a lack of funding (Ministry of Education, 2016).
|
Graph 4.3.5:General government nominal expenditure by function, 2007-2014
|
|
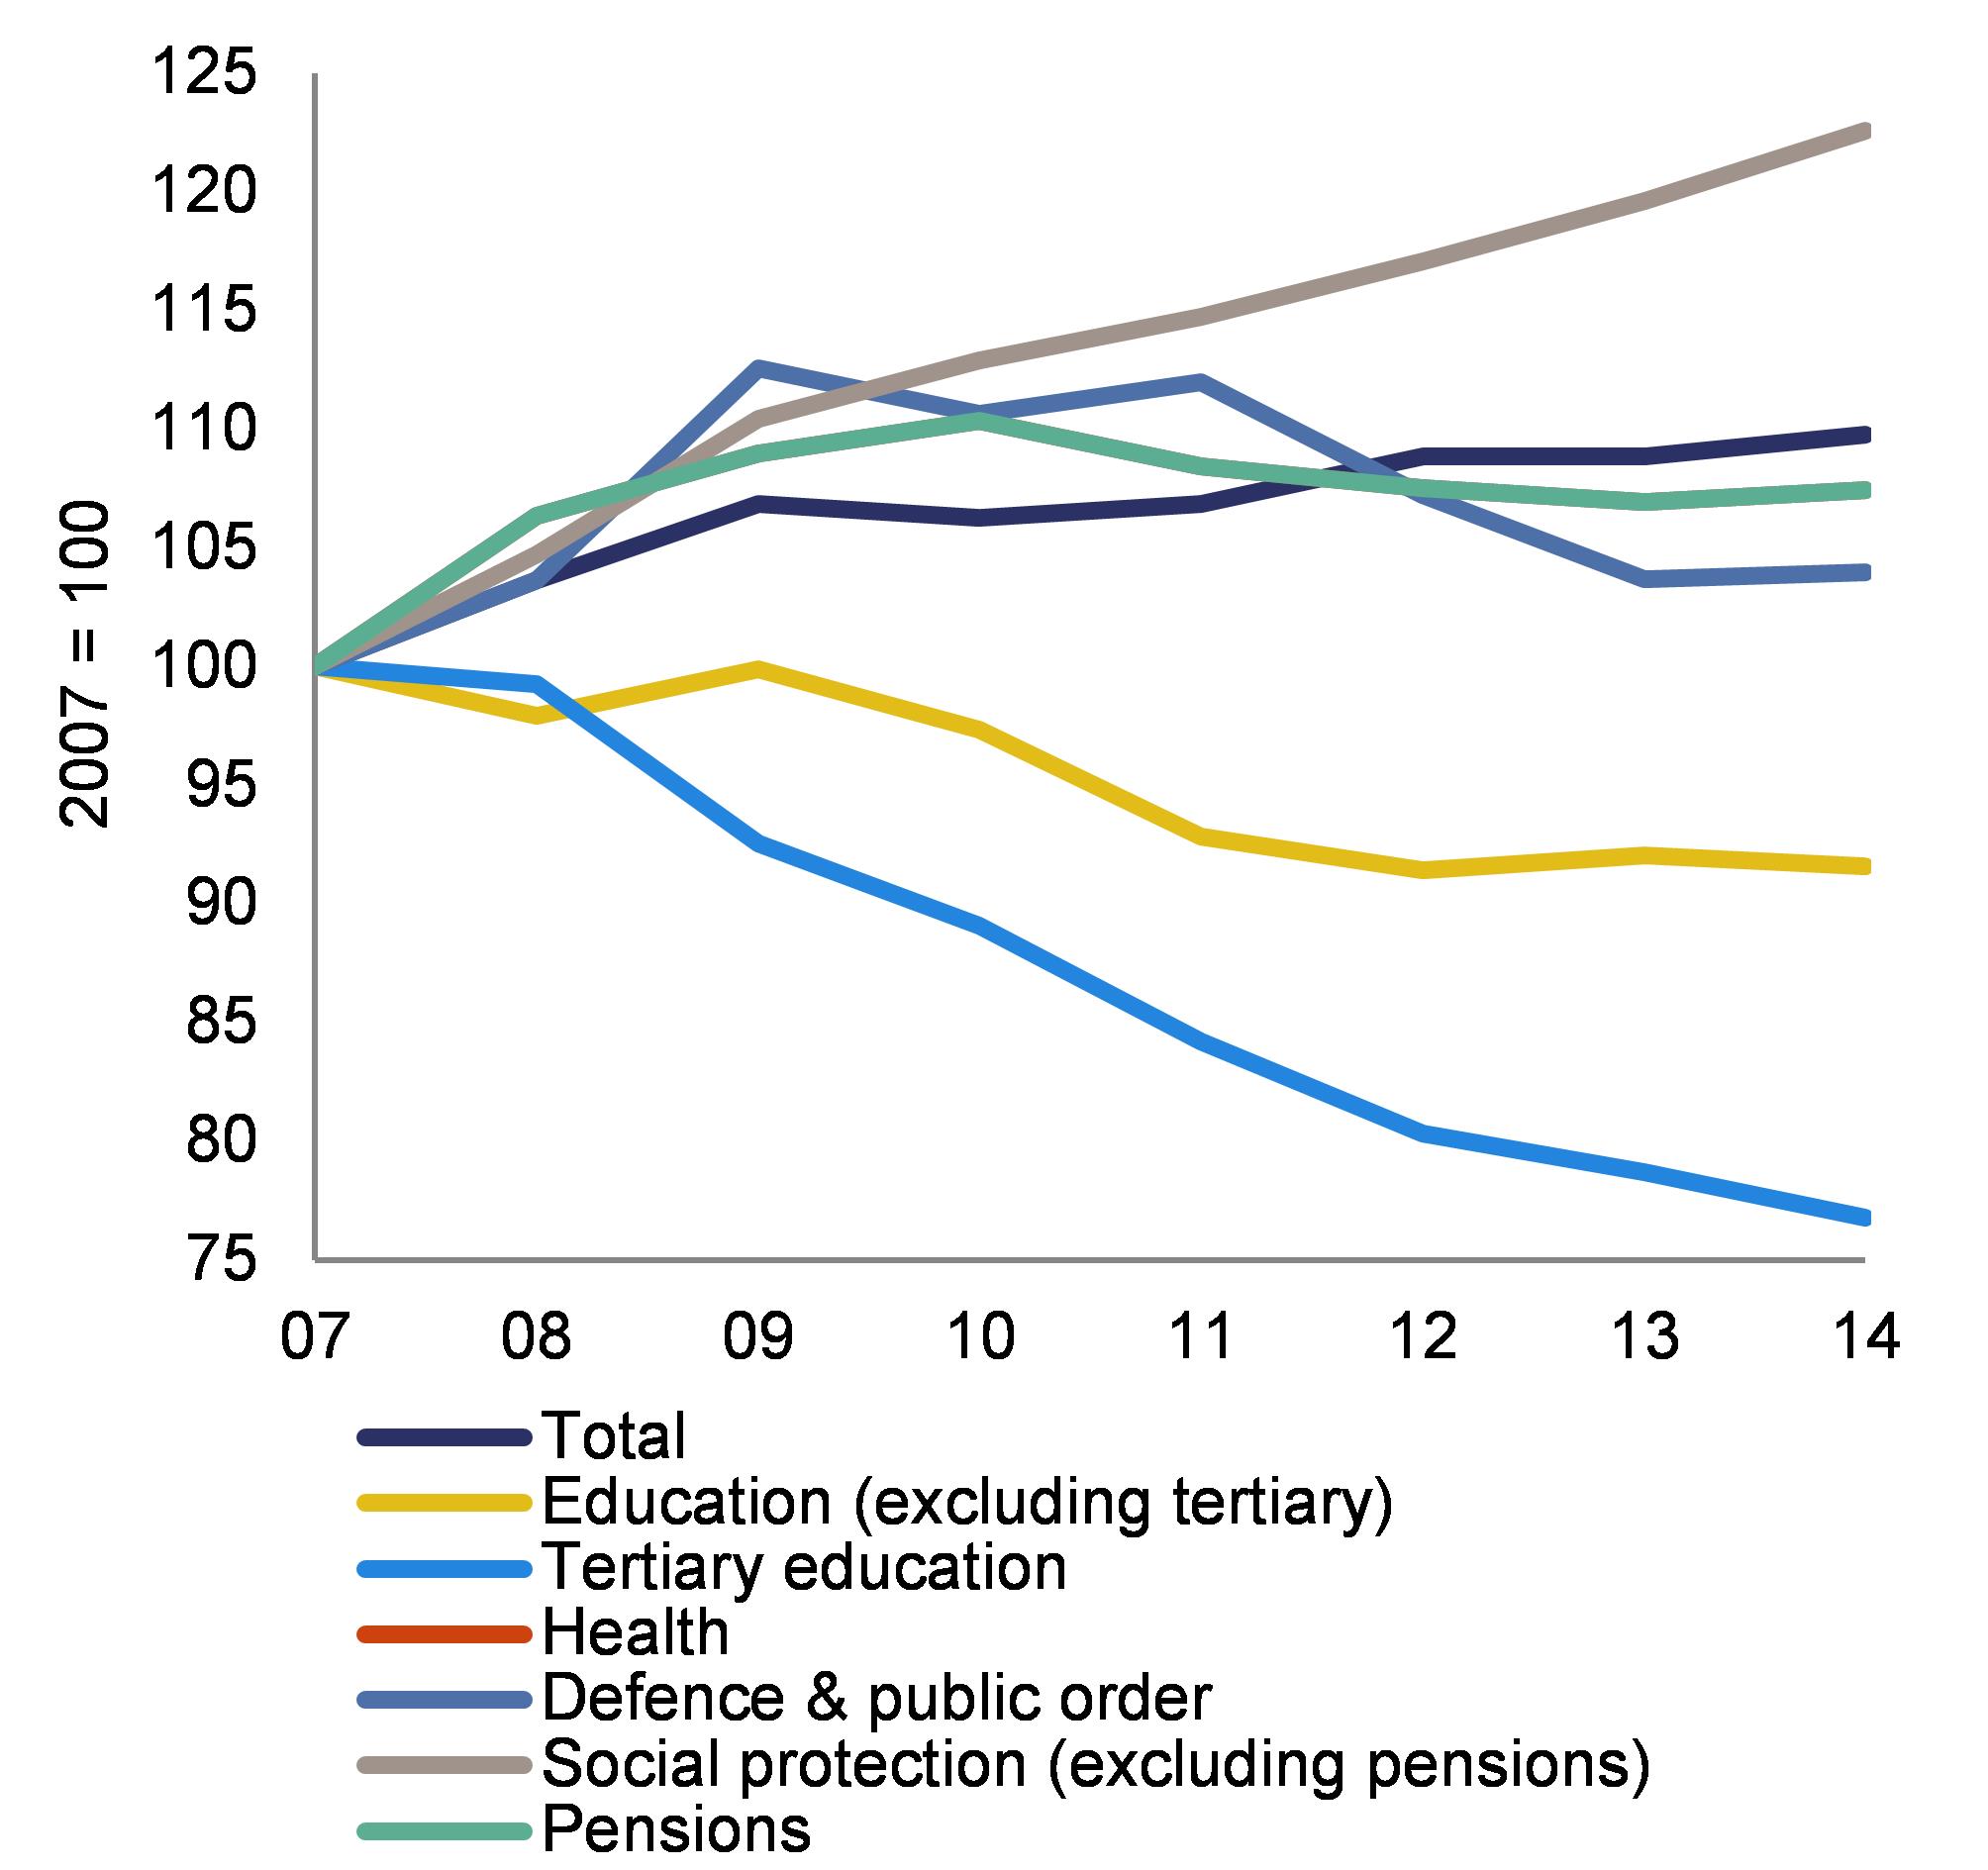
|
|
Source: Eurostat, COFOG
|
Recent measures on higher education, albeit partial, are aimed at addressing staff and student support issues, and rewarding research performance. The 2016 Stability Law provided funding for hiring new full and associate professors (Giulio Natta chairs), albeit through an ad-hoc procedure, and for 861 young researchers on ‘tenure-track’ positions (1.6 % of Universities' teaching staff in 2015). The 2017 Budget Law increases public financial support for tertiary students. Public funding for universities has increased significantly and better linked to performance. All these measures are positive partial steps, as they signal an attempt to reverse previous staff and funding policies. However, they are not sufficient to solve the issues of ageing teaching staff and inadequate spending.
Apprenticeships and work-based learning are being strengthened to improve the labourmarket relevance of education. Measures are being taken to increase the learning and qualifications component of apprenticeships, and to attract more youngsters to these paths. An ongoing national pilot initiative for 15-25 yearold students involves 300 vocational training centres throughout Italy. Learning standards have been agreed at national level and funding has been set aside. To strengthen work-based learning, all students in the last three years of upper secondary education are now required to do a traineeship or apprenticeship. This is an ambitious measure to help to equip a new generation with relevant skills. The quality of work-based learning, the engagement of private enterprises and the monitoring of progress and effects are crucial.
Adult learning is not sufficiently developed. The unemployment rate for low-skilled workers was 15.3 % in 2015, more than double the unemployment rate for the high-skilled (7.2 %). Educational attainment levels among 2564 yearolds are low compared to the European average. They improved between 2010 and 2015, but at a slightly slower rate than in the rest of Europe. The proportion of low-qualified adults in Italy is nearly double that in the rest of Europe. The rate of participation in adult learning is one of the lowest in Europe (2 % in 2015).
The policy framework for adult learning is not yet complete. The fragmentation of the Italian system of adult learning makes it difficult to identify a comprehensive lifelong-learning strategy. A decree laying down general rules on the national system for competence certification was adopted in 2013, but implementation proceeds only slowly. The national qualification system, including the repertoire of apprenticeship professional profiles, is not yet finalised. This should create the basis for the uniform recognition and validation of prior learning across the country, thus offering flexible solutions for further training. The systems for monitoring and evaluating adult learning programmes are underdeveloped and rely mainly on ex ante accreditation measures.
4.4. Investment
Recent trends*
During the crisis, investment in Italy fell more rapidly than in most other Member States. Until 2007, Italy’s total investment as a share of GDP was broadly in line with the euro area average (21.6 % as against 23.2 % in 2007). However, its contribution to total factor productivity growth was impaired by inefficient allocation in the economy (European Commission, 2016b). With the crisis, investment as a share of GDP fell to 16.6 % of GDP in 2015, around 3 percentage points below the euro area average (Graph 4.4.1). In real terms, this means that total investment is around 30 % lower than in 2007, at its lowest level since the mid-1990s. While allocation has started to improve somewhat, the low level of investment is now holding back potential growth (see Section 1).
The subdued investment dynamics concern both the private and public sector. Private investment declined from 18.7 % of GDP in 2007 to 14.4 % in 2015, while public investment fell from 3.2 % of GDP on average in 2005-2009 to 2.2 % in 2015. In the private sector, investment by non-financial corporations as a share of GDP dropped from 10.7 % in 2007 to 8.6 % in 2015. In the same period, investment by households declined to 5.5 % of GDP (from 7.7 %). Foreign direct investment in Italy – historically low compared to peer countries – has fallen further after the crisis. Foreign direct investment inflows in 2015 were 52% lower than in 2007, while for the EU as a whole they dropped by 42%.
All investment assets were affected, but productive investment fell to a greater extent in Italy than in the rest of the euro area. The drop in residential construction as a share of GDP between 2008 and 2015 was broadly in line with the euro area average (Graph 4.4.2). However, in the same period, non-residential construction investment in Italy fell by 1.9 percentage points of GDP (as against 1.2 percentage points in the rest of the euro area) and investment in machinery and equipment by 1.4 percentage points of GDP (as against 1 percentage point in the rest of the euro area).
Investment in intangible assets (
) showed greater resilience, but Italy still lags behind peer countries. Investment in intellectual property products has increased by 0.1 percentage points since 2008, much less than in the rest of the euro area, where it increased by 0.6 percentage points. (Graph 4.4.2). Furthermore, this type of investment represented only 2.7 % of GDP in 2015 in Italy, around 1.5 percentage points less than in the rest of the euro area.
|
Graph 4.4.1:Investment, current prices
|
|
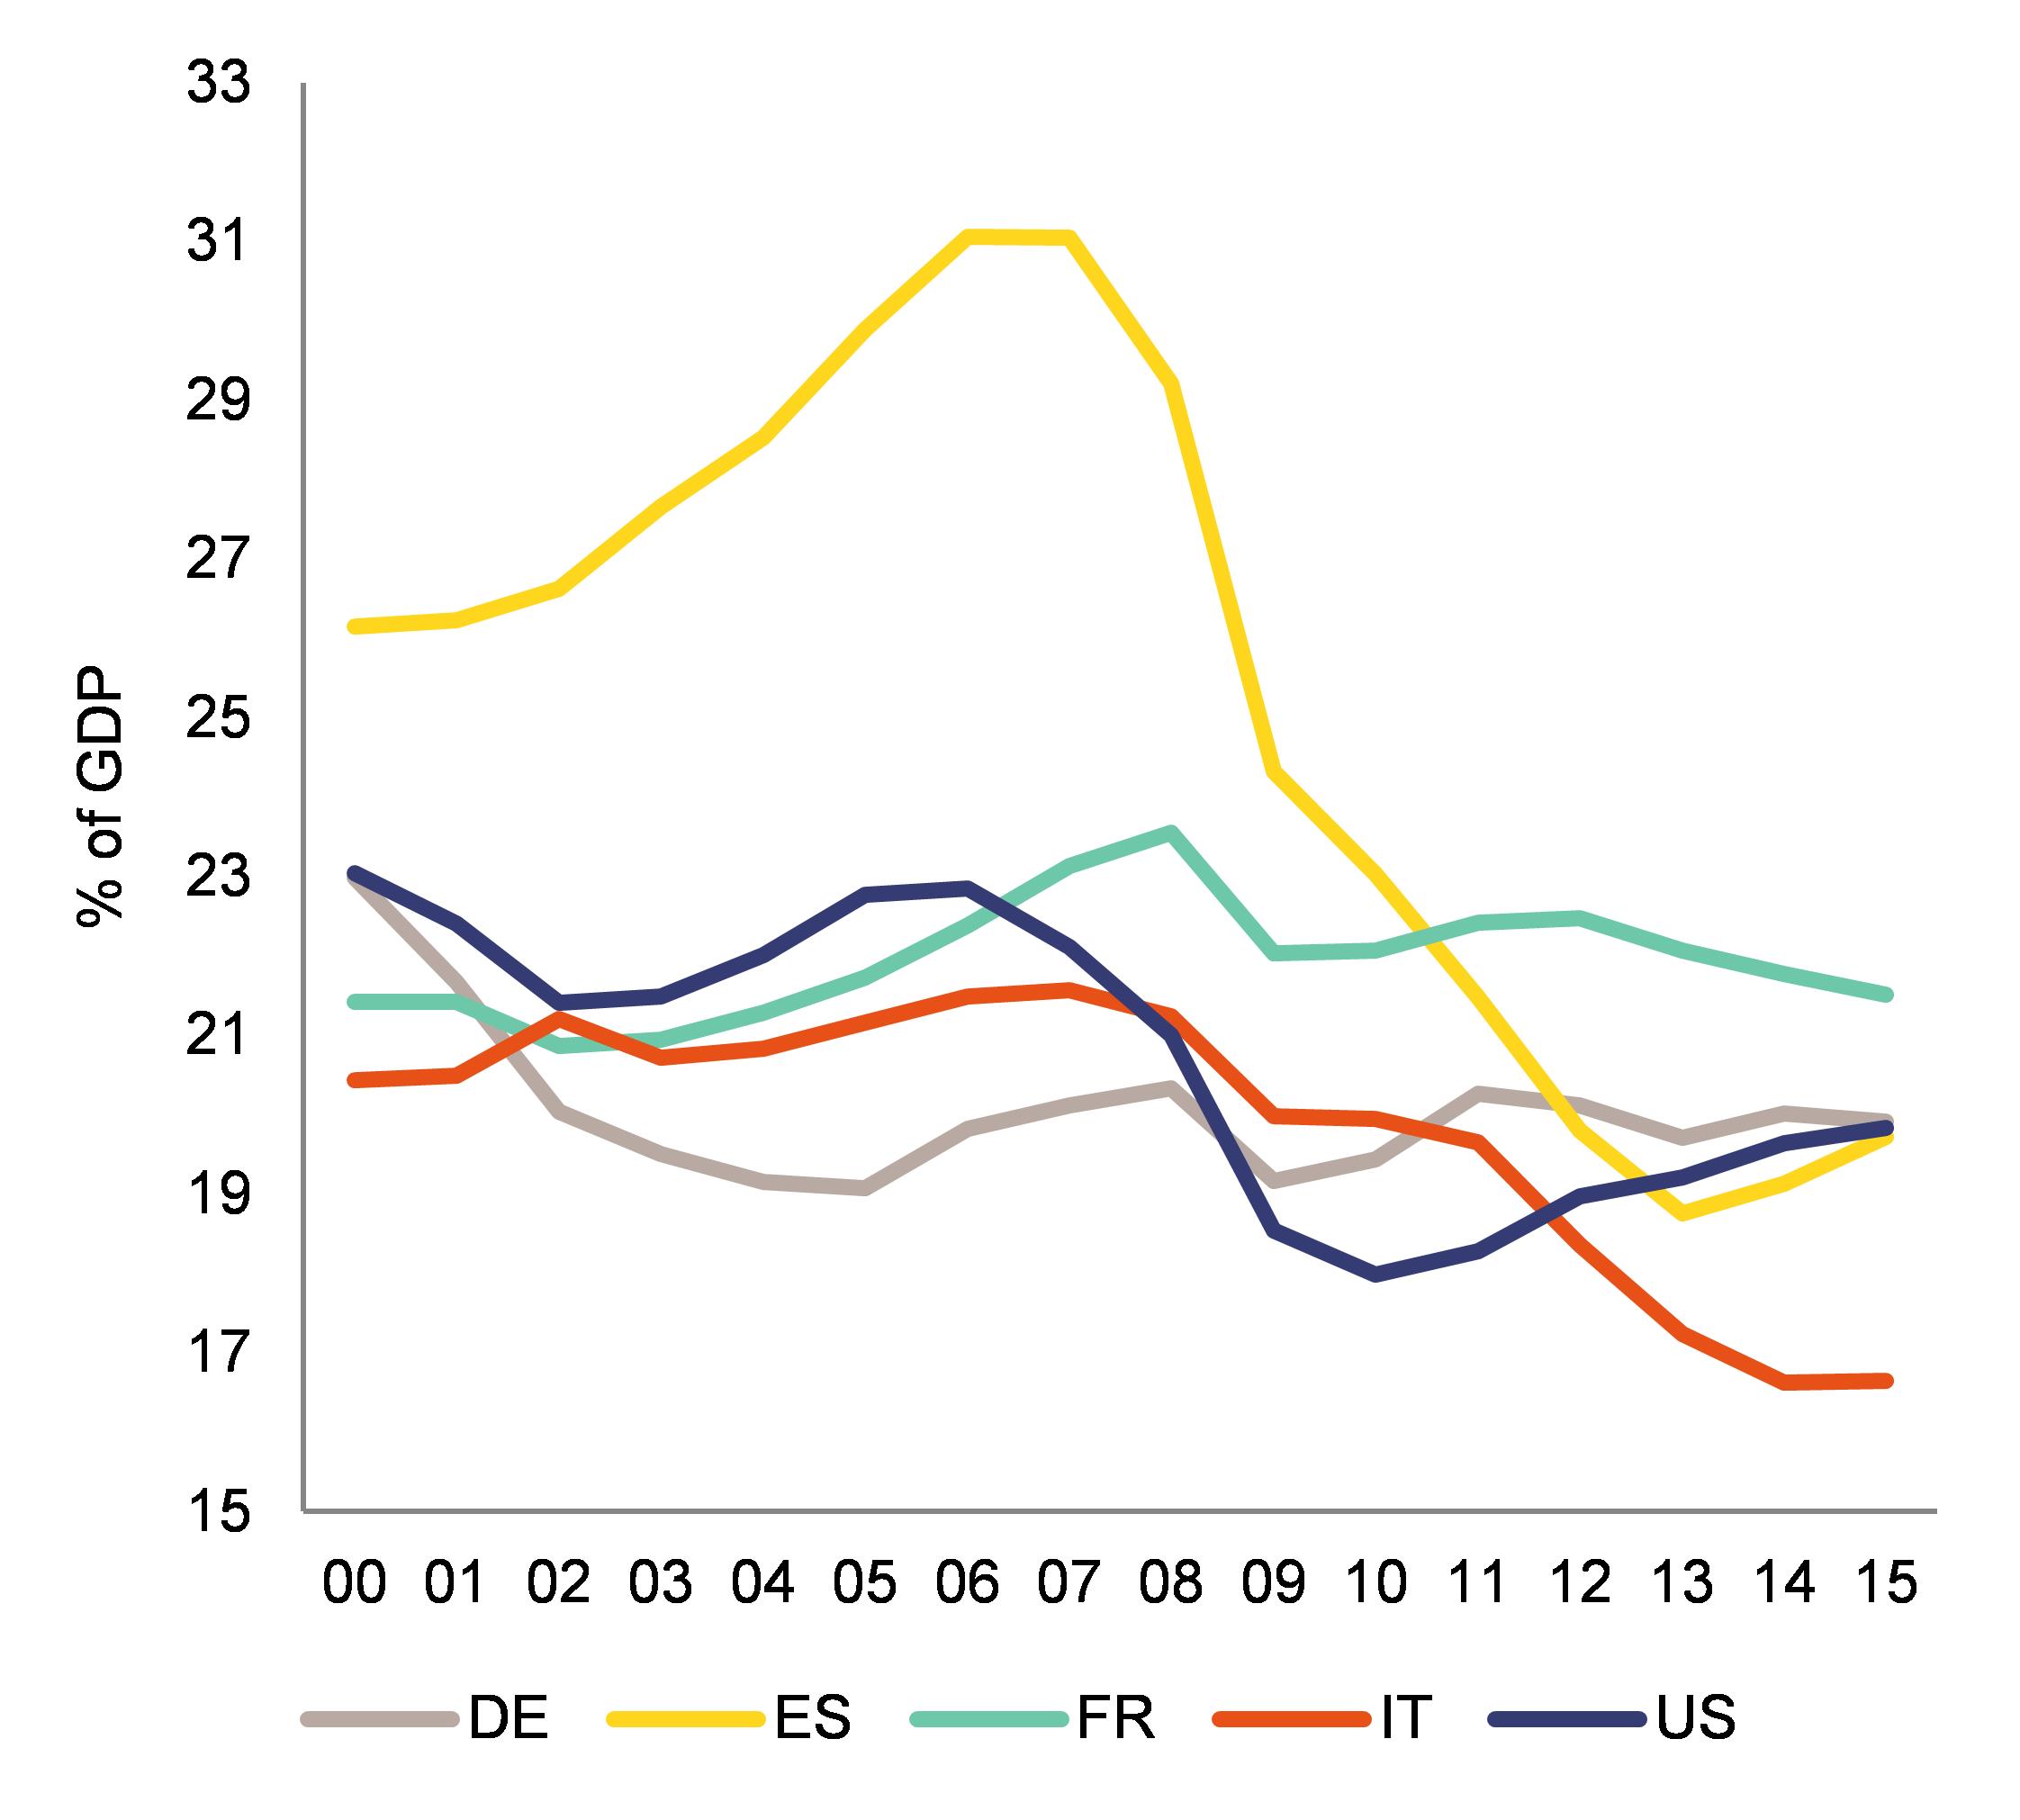
|
|
Source: European Commission
|
|
Graph 4.4.2:Change in investment by type of asset, current prices
|
|
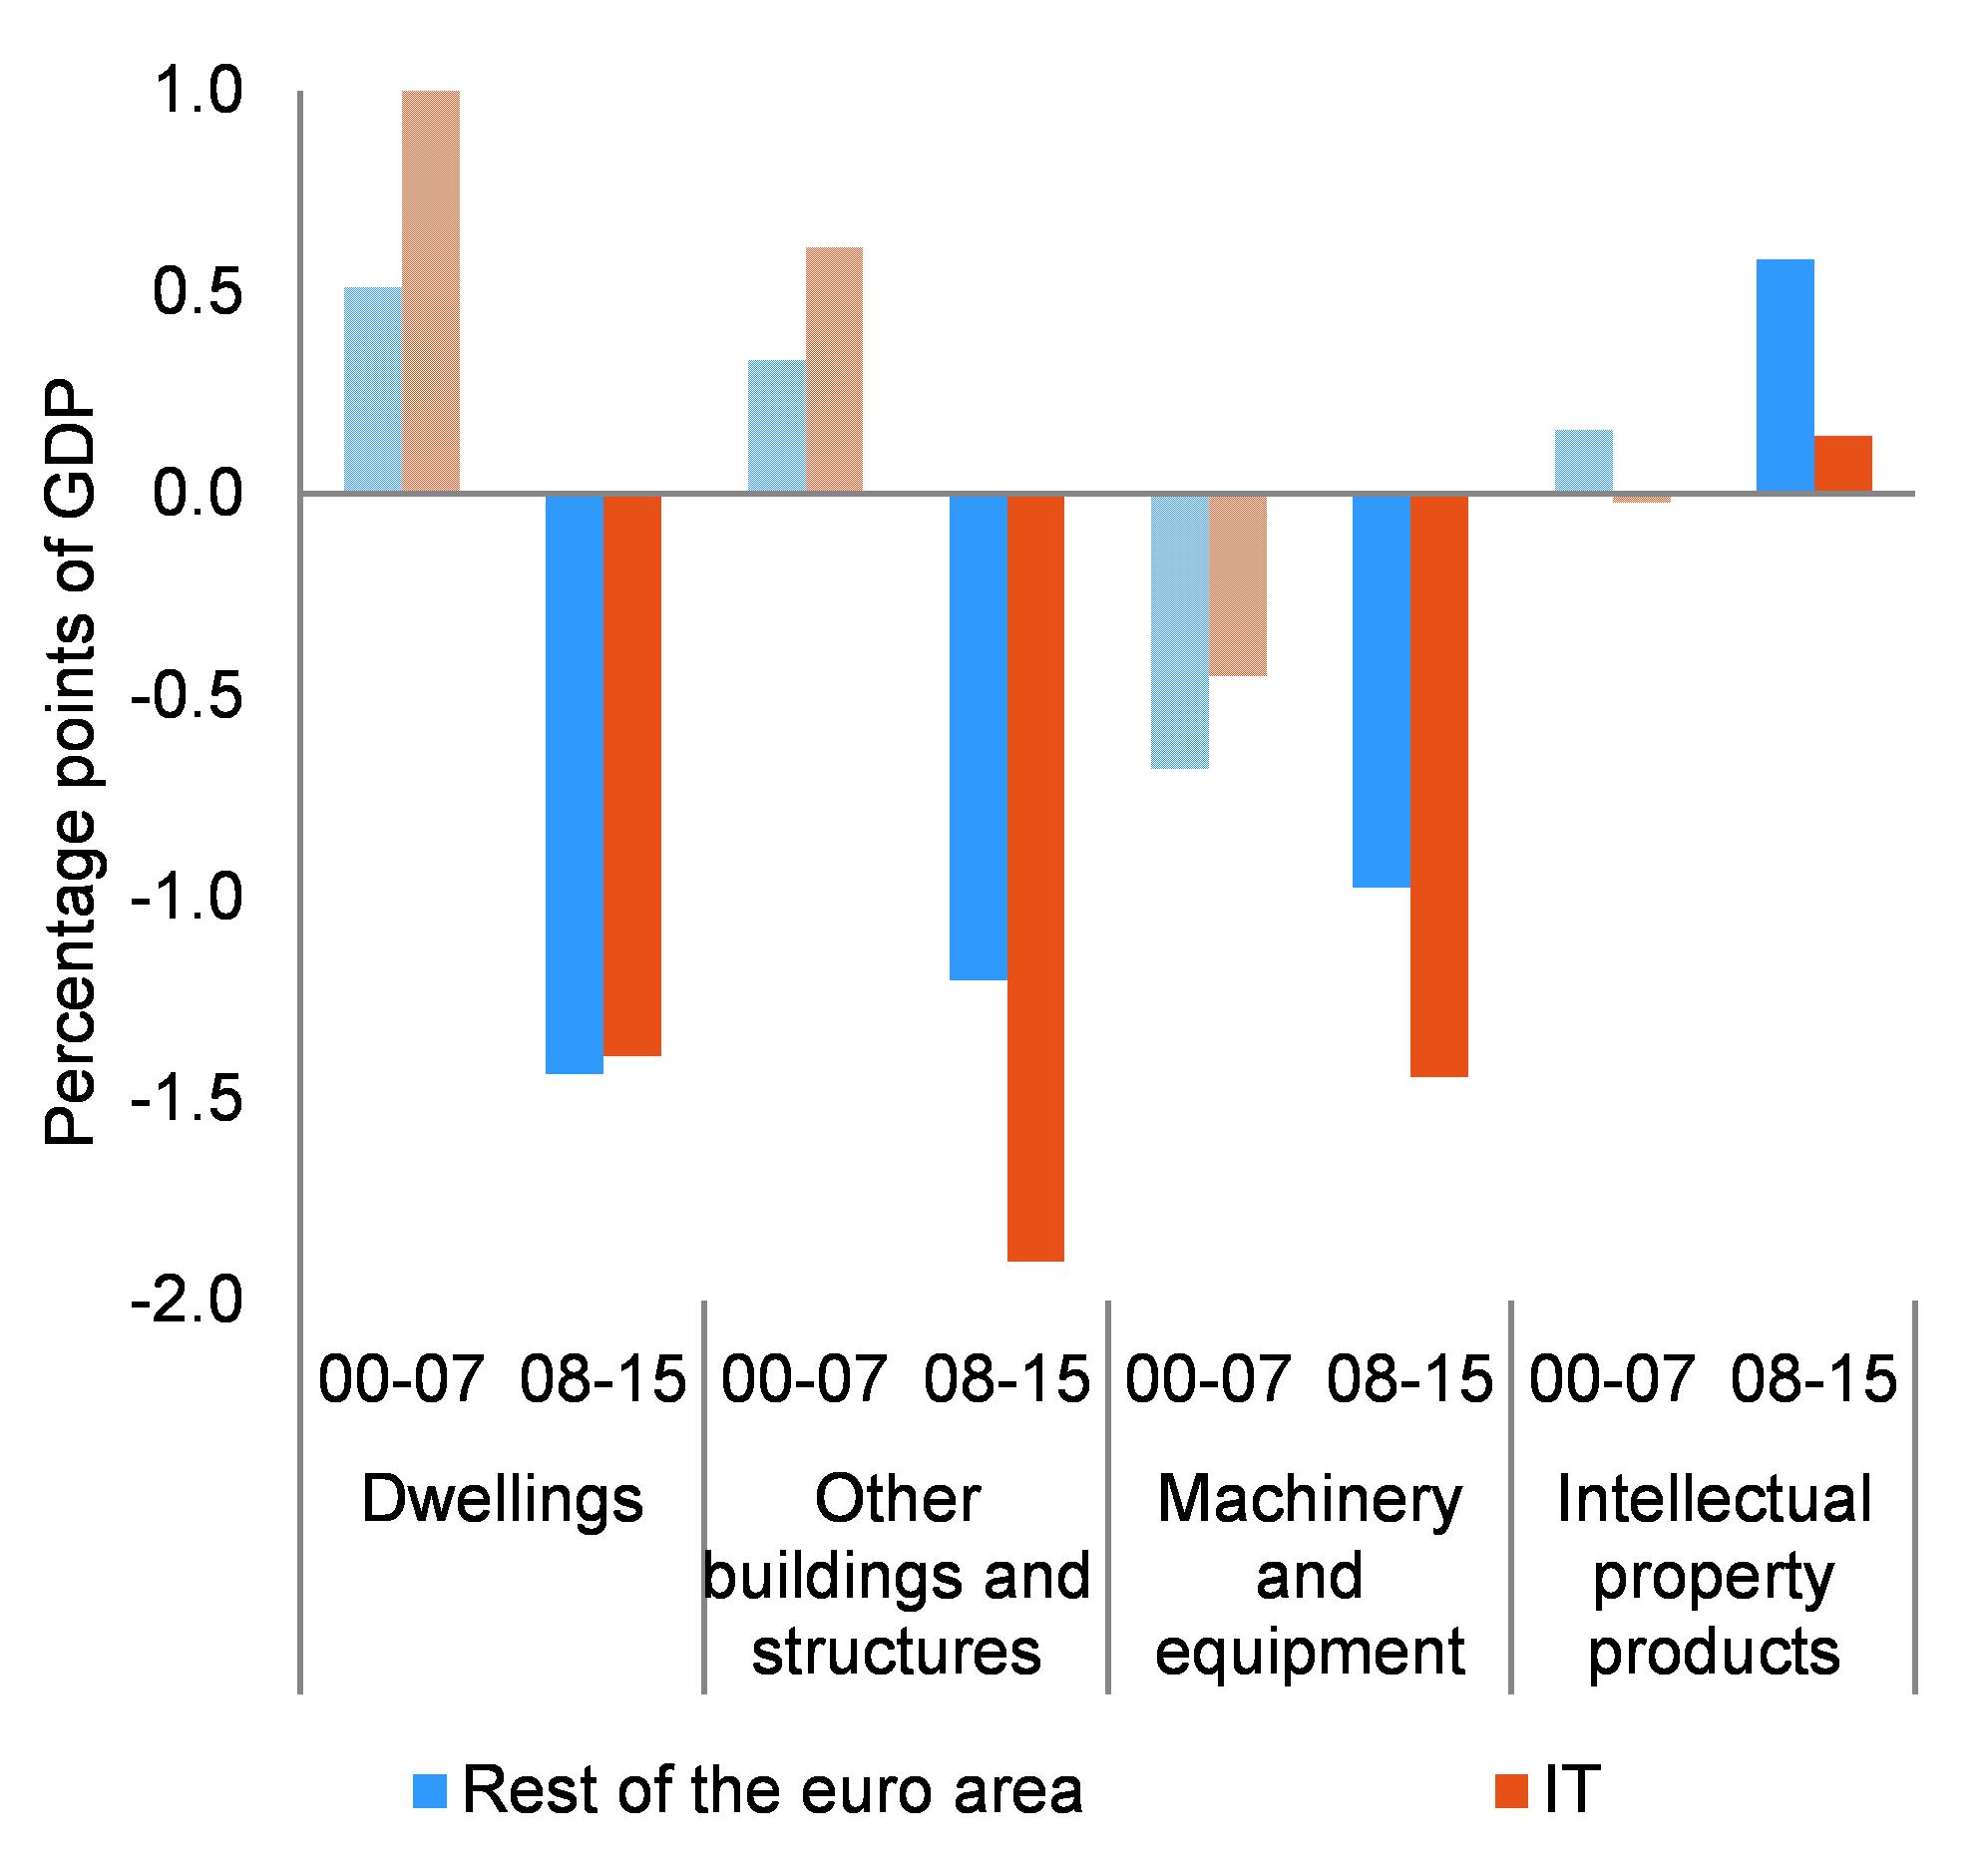
|
|
Source: European Commission
|
Italy's decline in investment is broad-based across industries, but particularly strong in services. Compared with 2008, investment in services in 2015 declined by 2.5 percentage points of GDP, i.e. more than in France, while in Germany it was broadly stable. Investment in manufacturing and construction fell to a greater extent than in Germany and France (Graph 4.4.3).
|
Graph 4.4.3:Investment by macro-sector, current prices
|
|
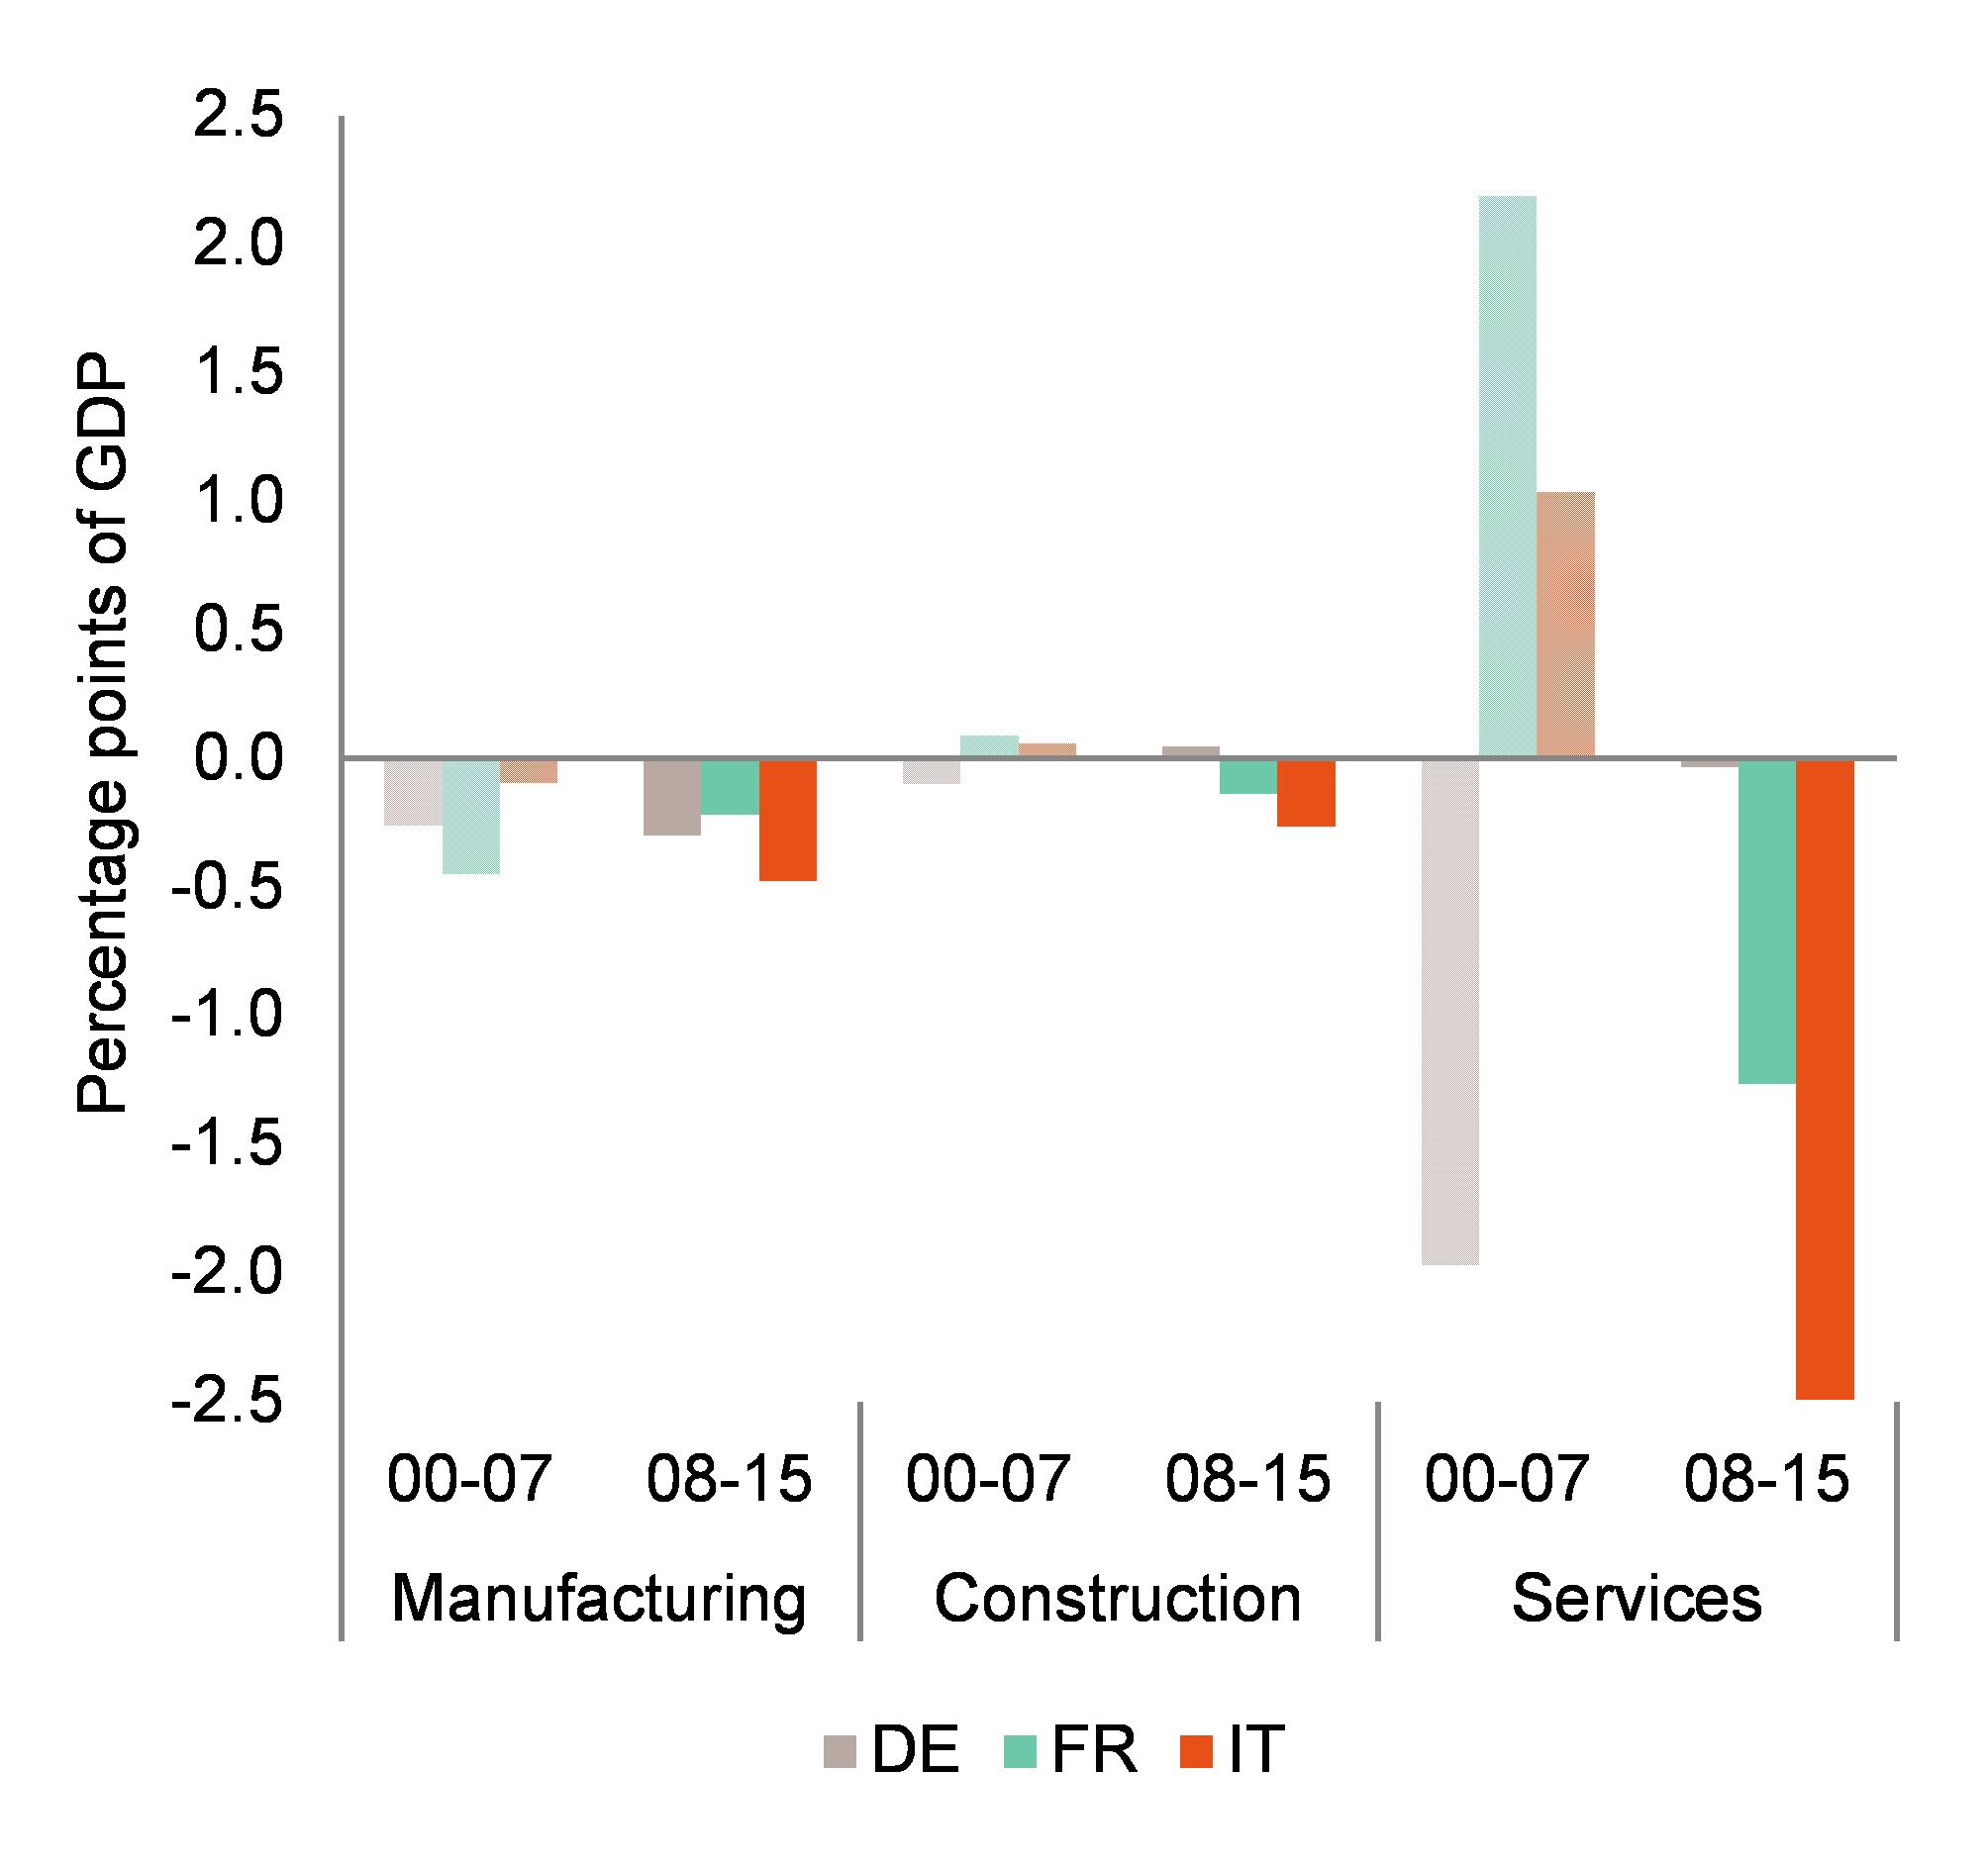
|
|
Source: European Commission, Istat
|
Barriers to investment*
Weak demand, uncertainty, still-tight financing conditions and squeezed profit margins are among the factors holding back a broad-based recovery of investment. As in other countries, demand conditions and uncertainty appear to be the main drivers of Italy's large decline in private-sector non-residential investment (Busetti et al., 2015; IMF, 2015a). Financing conditions seem to have played a larger role in Italy than in other countries (IMF, 2015a). Some research shows that while in Spain the restoration of healthy profit margins underpinned a solid recovery of investment from 2013, this was not the case in Italy (Fortin et al., 2015). Looking forward, uncertainty may continue to hold back investment. At the same time, the banking sector's weak profit-generating capacity and high stock of non-performing loans constrain banks’ capacity to provide loans, especially towards small firms and specific sectors (see Section 4.2). Such barriers also hinder foreign direct investment.
Structural weaknesses, while gradually being addressed, continue to hinder investment. An inefficient public administration (see Section 4.6.1), lengthy judicial proceedings (see Section 4.6.2) and a difficult business environment (see Section 4.5.2) are among Italy's long-standing structural weaknesses. In addition, the limited development of capital markets in comparison with other advanced economies makes financing, particularly for smaller firms, largely dependent on bank lending (European Commission, 2016b). These enduring weaknesses, of which the impact on businesses is difficult to assess, may have contributed to the inefficient allocation of investment before the crisis and may deter its recovery now. Moreover, much-needed investments from the European Structural and Investment Funds for 2014-2020 are being carried out only slowly, in particular in many southern regions, with project selection rates reported at 14 % overall at end-October 2016. Certain regions could benefit significantly from structural funds. For example, Sicily is planned to receive EUR 3.4 billion from the European Regional Development Fund for the period 2014-2020.
The government announced several measures to support investment. The 2017 Budget Law confirmed the possibility for companies to deduct 140 % of the amount spent on investment and introduced a new iperammortamento rate of 250 % for digital investments as part of the new ‘Industry 4.0’ strategy (see Section 4.5.3). These measures may have a positive but temporary impact on investment. At the same time, the notional return on new equity or reinvested earnings exempted from the payment of the corporate income tax (‘allowance for corporate equity’ (ACE)), which strengthened firms’ financial position (Bank of Italy, 2016a, p. 18-19), was reduced from 4.75 % to 2.3 %. Despite the low interest rates, this decision could be premature, considering that banks’ financing conditions remain difficult, in particular for SMEs, and that additional equity is needed to support investment in innovation. The reduction of the corporate income tax rate (from 27.5 % to 24 % as of 2017) could help support investment in a more structural manner. Initiatives to support investment in SMEs were also initiated. In September 2016 a multi-pronged ‘Industry 4.0’ strategy was presented to modernise the industrial sector, mostly through investment in innovation and digital technologies. (
) The plan might be constrained by the current lack of digital skills: only 67 % of the population were regular Internet users in 2016, well below the EU average of 79 %. ‘Industry 4.0’ seeks to address this problem among young people, including through new curricula in post-secondary and tertiary education, but the digital skills gaps among the middle-aged workforce and the elderly remains.
Infrastructure gaps*
Access to next-generation communication networks is improving but mostly in densely populated regions. Driven by private operators’ investments, the coverage of the fast broadband network progressed rapidly last year, from 44 % to 72 % of Italian households. However, it is still slightly below the EU average (76 %). In summer 2016, the Italian government launched two calls for tender for a total of EUR 2.6 billion for providing fast broadband access in white areas (
). However, the first call for tender is subject to lawsuits by some telecom operators. If the lawsuits are successful, Italy will find it difficult to close the digital infrastructure divide in these areas (accounting for 25 % of the total population).
Transport infrastructure quality is below the EU average, with significant regional variation. The 2016 EU Transport Scoreboard ranks Italy’s performance below the EU average in all main infrastructure quality indicators, and investment is lacking (European Commission, 2016j). In railways, there is a persistent infrastructure gap between northern and southern regions in terms of both infrastructure endowment and traffic management technology. Besides, recent accidents raised interoperability and safety issues in relation to certain local and regional railway lines (ferrovie ex-concesse) totalling about 3 000 km. In 2015, Italy presented a national strategic plan for ports and logistics to increase efficiency and rationalise the port sector, but its full implementation is still ongoing. Italy also lags behind (European Commission, forthcoming) in streamlining administrative procedures, the deployment of electronic solutions, launching key trans-European transport projects and ensuring smooth permit procedures, causing delays in project delivery.
Investment in energy efficiency and renewable energy underpins Italy’s positive performance in these areas and in reducing greenhouse gas emissions. Italy is on track to achieve its target to reduce greenhouse gas emissions in sectors not covered by the EU Emissions Trading System (ETS) and to meet the 2020 targets for energy efficiency and renewable energy. The 2017 Budget Law confirmed the tax incentives for improving the energy efficiency of buildings. In 2015, Italy launched a strategy for the energetic requalification of the national housing stock and a plan for the promotion of ‘nearly-zero energy’ buildings. New guidelines on the white-certificate scheme are expected to be adopted in 2017. Italy also has one of the highest installed capacities for electricity production with renewables in the EU. However, the complex legislative framework and tax structure create some barriers to the full deployment of Italy’s renewable potential.
Investment in waste and water treatment could spur a circular economy. A ‘Green Act’ is planned to facilitate this transition. Waste management and water infrastructure, including waste water treatment, are persistent concerns, particularly in southern Italy. Non-compliance with the EU’s Urban Waste Water Treatment Directive is extensive. Investment needs for waste water treatment are estimated at EUR 4.6 billion (European Commission, 2017d). Improving land-use management and reducing air pollution are challenges faced by centre and northern regions as well. Measures were taken to speed up investment in water and flood protection and prevention. In 2015, only around 41 % of Italian small and medium-sized enterprises (SMEs) invested up to 5 % of their annual turnover in resource efficiency actions (EU average: 50 %), and 25 % of SMEs took measures to recycle by reusing material or waste within a company (EU average: 40 %).
4.5. Sectoral policies
4.5.1.Competition*
Barriers to competition remain significant in Italy. According to the OECD index for product market regulation, Italy’s competition framework was substantially converging to the OECD average thanks to a wave of reforms up to 2012. However, in recent years, no major measures have been adopted to open up the Italian economy further. The Global Competitiveness Report 2016-2017 confirms Italy’s competition weaknesses (WEF, 2016). The goods market efficiency index includes measures of the level of competition in local markets, the extent of market dominance and the effectiveness of anti-monopoly policy. Italy ranks below all major European peers and 67th in the world (Graph 4.5.1).
|
Graph 4.5.1:Goods market efficiency, 2016
|
|
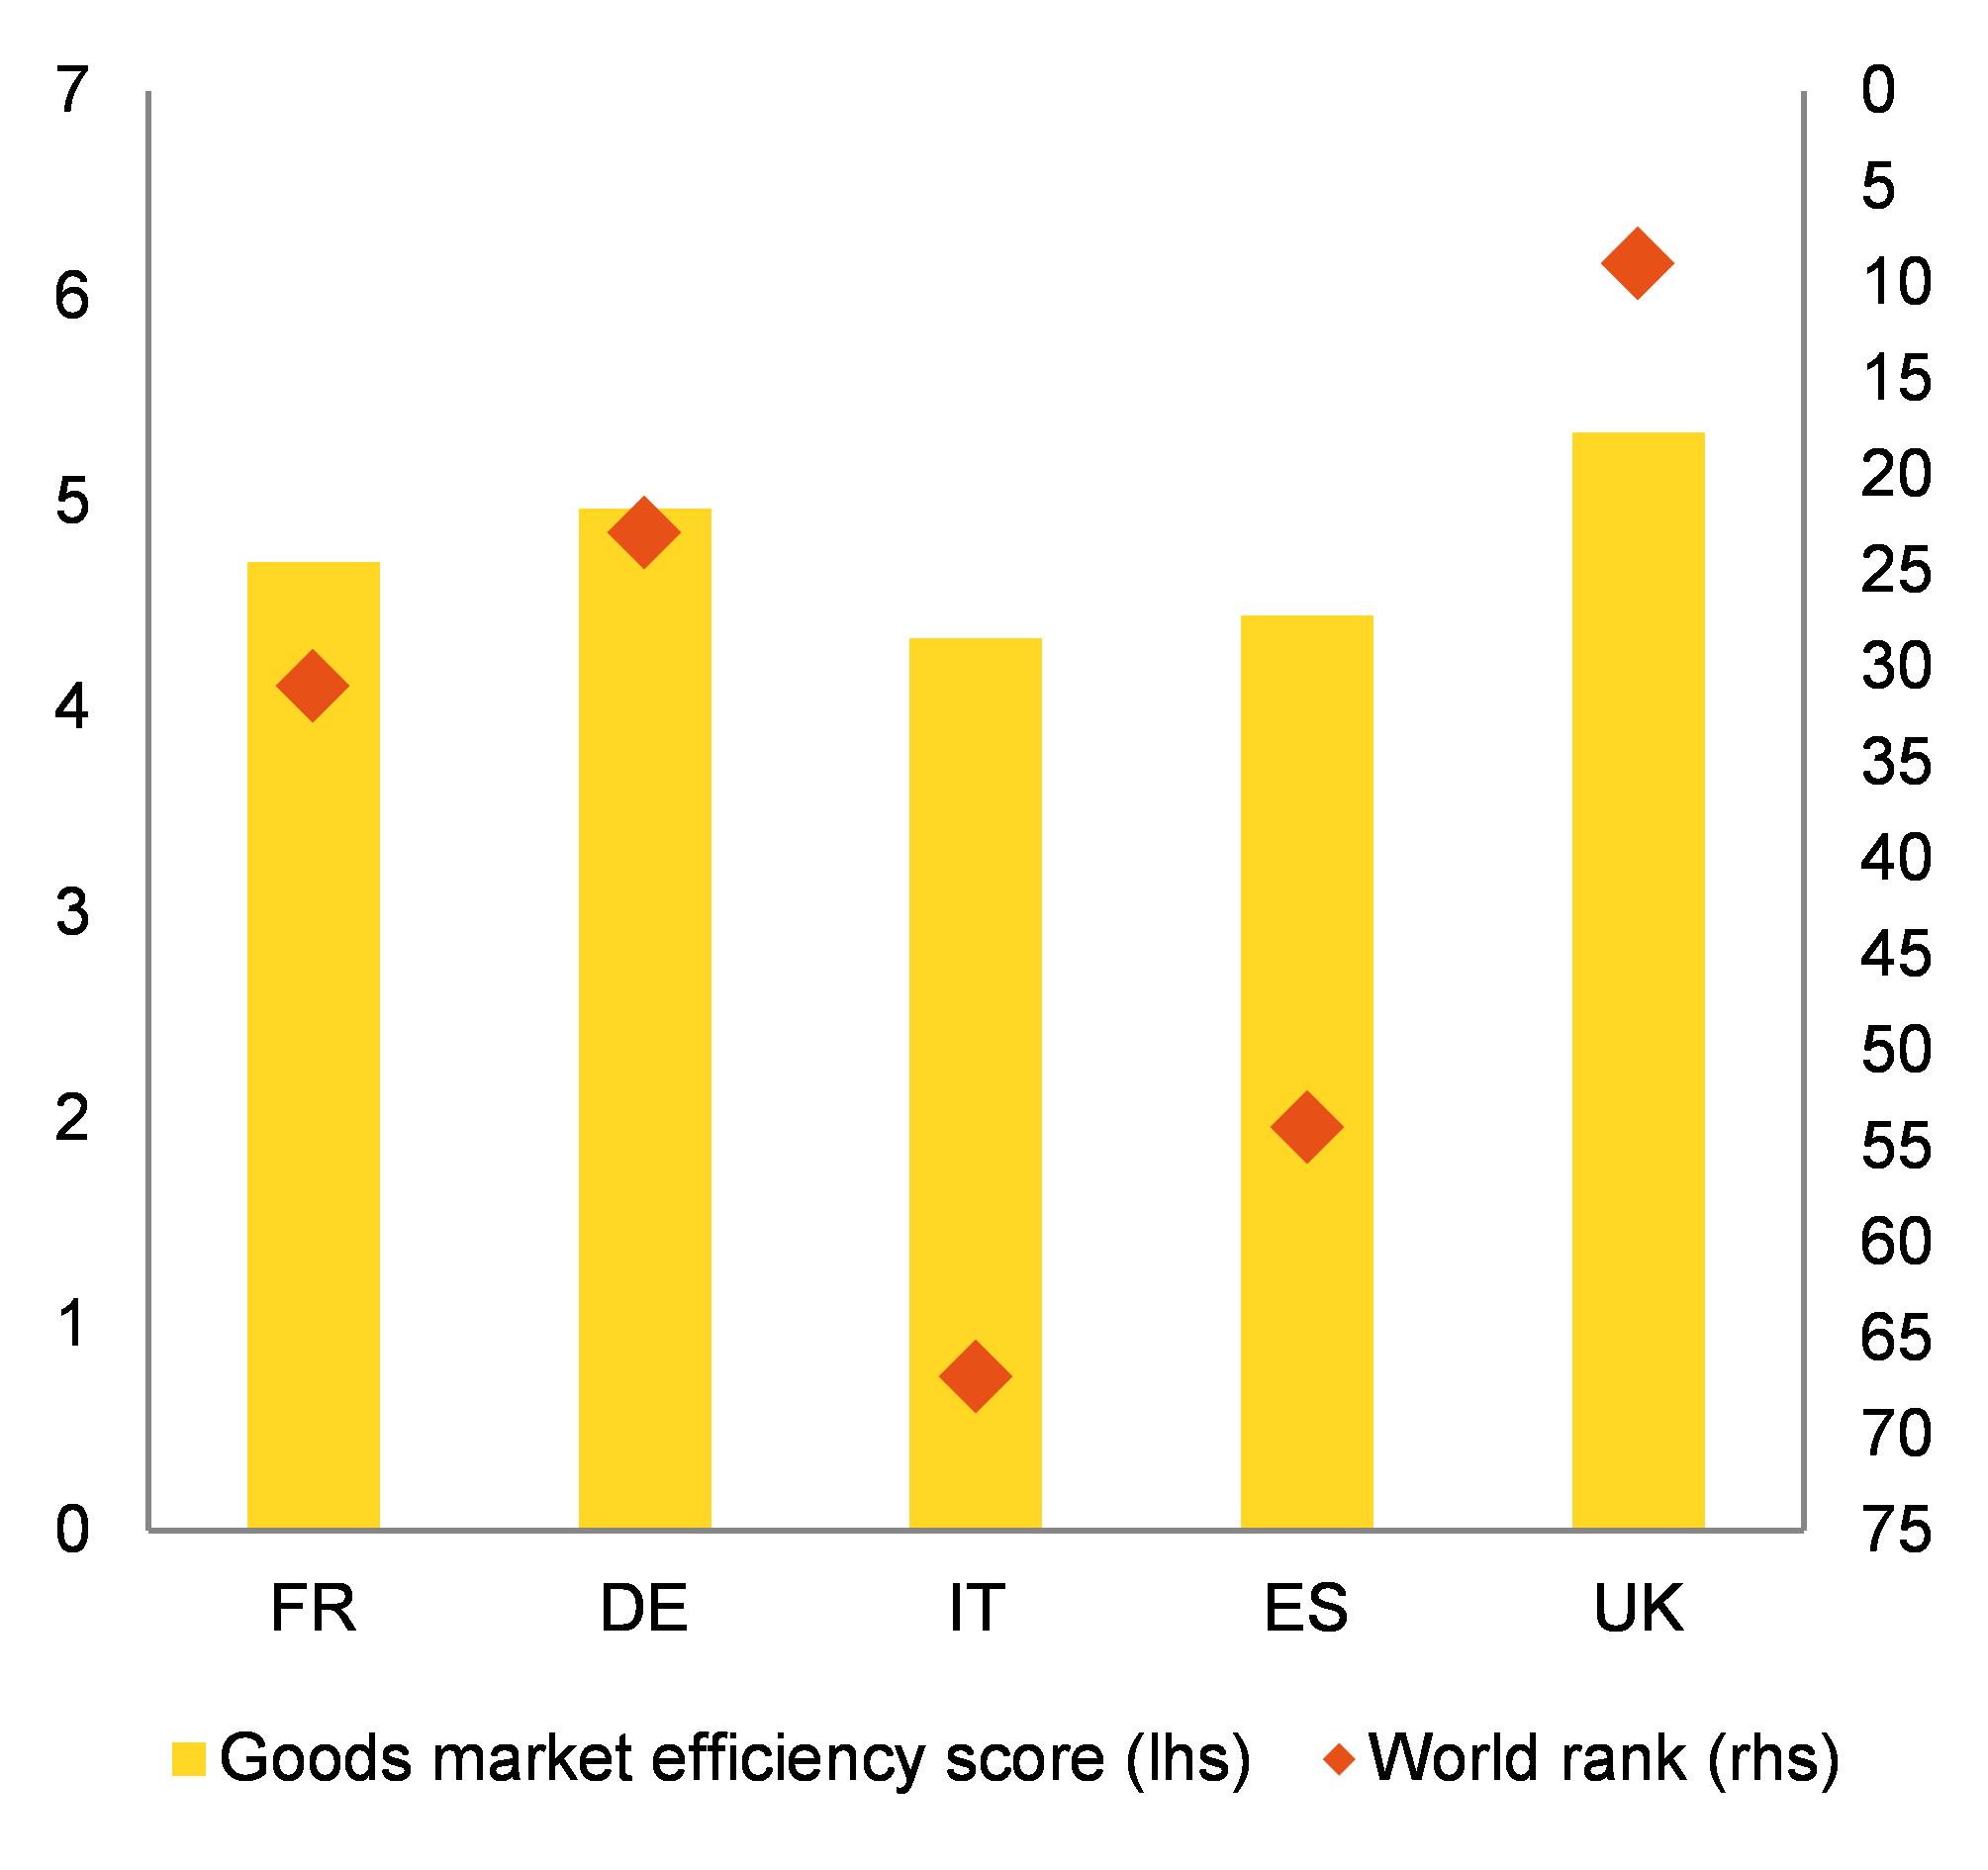
|
|
Source: World Economic Forum (WEF), 2016
|
The 2015 annual competition is not yet adopted. In February 2015, the government presented a draft law on competition, complying for the first time with the 2009 legislation that requires it to present such a draft law every year based on a proposal from the national competition authority. The draft law for 2015 is still under discussion in the Senate, but final adoption is envisaged for Q1 2017. The draft law covers, among others, regulated professions, the insurance sector, the telecommunications industry, and the electricity and gas sectors. Other minor measures concern the banking and fuel distribution sectors. Parliamentary discussions watered down several provisions, particularly those concerning regulated professions and pharmacies, while new restrictive provisions for the touristic sector were introduced. Reforms are also overdue in other important sectors, with considerable potential economic impact and representing a sizable share of GDP, such as the retail sector, the system of concessions, and the maritime and hydroelectric sectors (European Commission, 2016b). Competition in the last two sectors is still subject to authorisation schemes granted for a long period and without competitive procedures.
Regulated professions still face important restrictions. The level of regulatory restrictiveness in Italy is higher than the EU weighted average for all professions, except the legal profession (Graph 4.5.2) (European Commission, 2016k) (
). In this context, Italy has one of the highest numbers of lawyers in the EU (European Commission, 2017b). Since 2014, Italy reviewed the need for and proportionality of restrictions on access to and the conduct of regulated professions. As a result of this work, a national action plan was submitted in February 2016, defining three cross-cutting lines of action: (i) review of training courses for certain technical professions; (ii) adaptation of state exams for qualifications; (iii) establishment of a technical working group to identify minimum national standards (for regionally regulated professions). The literature suggests that a decrease in regulation has a number of direct and indirect beneficial effects. Reducing the OECD’s product market regulation indicator on regulated professions by 1 point is found to increase allocative efficiency by 5.7 percentage points and decrease the concerned sectors’ profitability by 5.4 percentage points (Canton et al., 2014). The 2006 reform easing entry into the pharmacy sector is estimated to have contributed to higher employment and higher earnings for young professionals (Pagliero, 2015). The positive effects of deregulation spill over to the whole economy. Professional services represent 10 % of EU market services’ value added, account for 4.7 % of total employment and are mostly intermediate factors (Canton et al, 2014). Their level of regulation and efficiency have a large impact on the productivity and competitiveness of downstream industries and thus of the whole economy.
|
Graph 4.5.2:Restrictiveness indicator by profession, 2016
|
|

|
|
Source: European Commission, 2016k
|
The competition framework in the energy sectors is sound, but prices remain high. Italy fully unbundled the electricity and gas transmission system operators. In 2015, the market concentration index for power generation (815) was significantly lower than the EU average (3 726). It also remains significantly lower than the EU average for wholesale gas (2 924, as against 4 771 for the EU). Annual switching rates among household consumers have risen for electricity (from 5.8 % in 2011 to 8 % in 2015) and gas (from 5.2 % in 2011 to 6.1 % in 2015) and are already well above the EU average (6 % and 5.3 % respectively). Finally, the planned phasing-out of the protected electric energy and gas market by 2018 is expected further to increase competition and consumer choice. Nevertheless, wholesale prices remain relatively high despite large reductions (-17 % for electricity prices and -21 % for gas prices over 2013-2015, respectively slightly more and slightly less compared to price reductions in other EU countries). Italian retail electricity prices for industry and residential use remain among the highest in Europe.
The Italian Parliament is working on a new framework for the collaborative economy. A survey from the Commissionʼs Eurobarometer finds that 17 % of Italian respondents make use of collaborative platforms, which is roughly in line with the EU average (European Commission, 2016m). The Italian Parliament is currently discussing a draft legislative initiative (‘Sharing Economy Act’) to set up a cross-sector framework for collaborative tools. The draft bill proposes an income threshold (EUR 10 000) to differentiate between professionals and peer activities, with the latter subject to a special 10 % tax rate. The draft law also contains requirements for platforms, including registration in a national registry and increased transparency towards platform users.
Transport sectors show significant inefficiencies. Italy’s Transport Regulation Authority started to pursue its mandate fully in 2015 by adopting important regulatory measures, including on rail access charges, while staff recruitment is still ongoing. However, weaknesses in the regulatory framework and widespread inefficiencies remain. Local transport services still face a number of weaknesses in terms of quality: 31 % of the users are dissatisfied with the service, while only 9 % register a high level of satisfaction. The EU average figures are 17 % and 19 % respectively (Steer Davies Gleave, 2016). Among the five largest economies in the EU, Italy shows the lowest ratio of operational costs to operational revenues both in rural and metropolitan areas: 33 % and 41 % respectively, as against 55 % and 65 % on average in France, Germany, Spain and the United Kingdom. In-house awards are prevailing (European Commission, 2016b), although local public transport firms selected through competitive tenders show a higher level of productivity (Boitani et al, 2014). This holds regardless of the specific features of the city or territory where the company is operating (Associazione Trasporti, 2015). Motorway concessions are also a chronic issue in Italy, as they are often prolonged without a call for tenders. This generates overcompensation of the concessionaire and hinders competition. Italian authorities announced a pro-market privatisation of the railway incumbent company (Ferrovie dello Stato), which has been postponed several times. No specific timeline was provided in the 2016 national reform programme. Similarly, other initiatives, such as the direct re-award of the public service contract for medium- and long-distance rail services to the incumbent operator (Trenitalia) until 2026, do little to open markets.
The public procurement system is affected by a number of structural weaknesses. The fragmentation of the legal framework, the low level of administrative capacity and the lack of coordination among institutions make Italian public procurement inefficient. According to European Commission (2016o), many procedures are finalised with only one offer (31 % as against the EU median of 17 %) and decision periods are long (192 days as against the EU median of 79). Furthermore, the value of tender calls published in the Official Journal of the European Union as a share of GDP was just above 2 % in 2009-2014 (as against the EU average of 4.4 %).
A new public procurement and concessions code was adopted. The new code (transposing the 2014 EU Directives), entered into force in April 2016, is expected to make arrangements less burdensome and more flexible for businesses. The guidelines on its implementation are being released. This may have generated some uncertainty and significantly slowed down procurement procedures and expenditure. In the three months following the code’s adoption, supplies and service contracts dropped respectively by about 30 % and over 40 % in value and volume, while the decrease for public works contracts was about 52 % in value and 62 % in volume (ANAC, 2016). This temporary effect is expected to gradually fade away when the code is fully implemented and the local authorities are more familiar with it (ANAC, 2016).
4.5.2.Business environment*
Doing business in Italy is still more cumbersome than in peer economies and the quality of regulation is worse. Italy ranks 50th out of 190 economies on the World Bank’s ‘Doing Business’ indicators (World Bank, 2016a). Italyʼs distance to the best performers is the fourth largest among EU countries, and it made less progress over 2010-2015 than several countries performing similarly (Graph 4.5.4). This is confirmed by the 2016-2017 World Economic Forum Global Competitiveness Report. Despite a slight improvement in the value of the indicator, Italy’s competitiveness ranking worsened compared with the previous year, from 43rd to 44th out of 138 countries (WEF, 2016). In particular, Italy only ranks 126th in tax payment, 108th in contract enforcement and 101st in access to credit. The average time needed to pay taxes is 269 hours per year, as compared with the EU average of 186. Also, 86 % of respondents in Italy cited the complexity of administrative procedures as a problem for doing business (EU average: 62 %). Also, government regulations are considered more burdensome than in the EU on average (1.9 as against 3.24, on a scale from 1 (‘most burdensome’) to 7 (‘least burdensome’)). Finally, although the time needed to start a company in Italy is shorter than the EU average, the related cost remains the highest in the EU (Graph 4.5.3) (European Commission, 2016l).
The difficult business environment hampers Italian firms’ growth. Italian firms are on average smaller than those in EU peer countries and grow more slowly. SMEs play an important role in the ‘non-financial business economy’, as they generate 68 % of value added (EU average 57 %) and 79 % of all jobs (EU average: 67 %) (European Commission, 2016b). Italy also differs from the EU average on the importance of micro-firms, which account for 47 % of employment, but with value-added per capita 10 % lower than the EU average. The productivity of micro-firms is only 80 % of the corresponding EU average. As in other countries, it is lower than that of large enterprises (European Commission, 2016b).
|
Graph 4.5.3:Responsiveness of public administration to the needs of SMEs
|
|
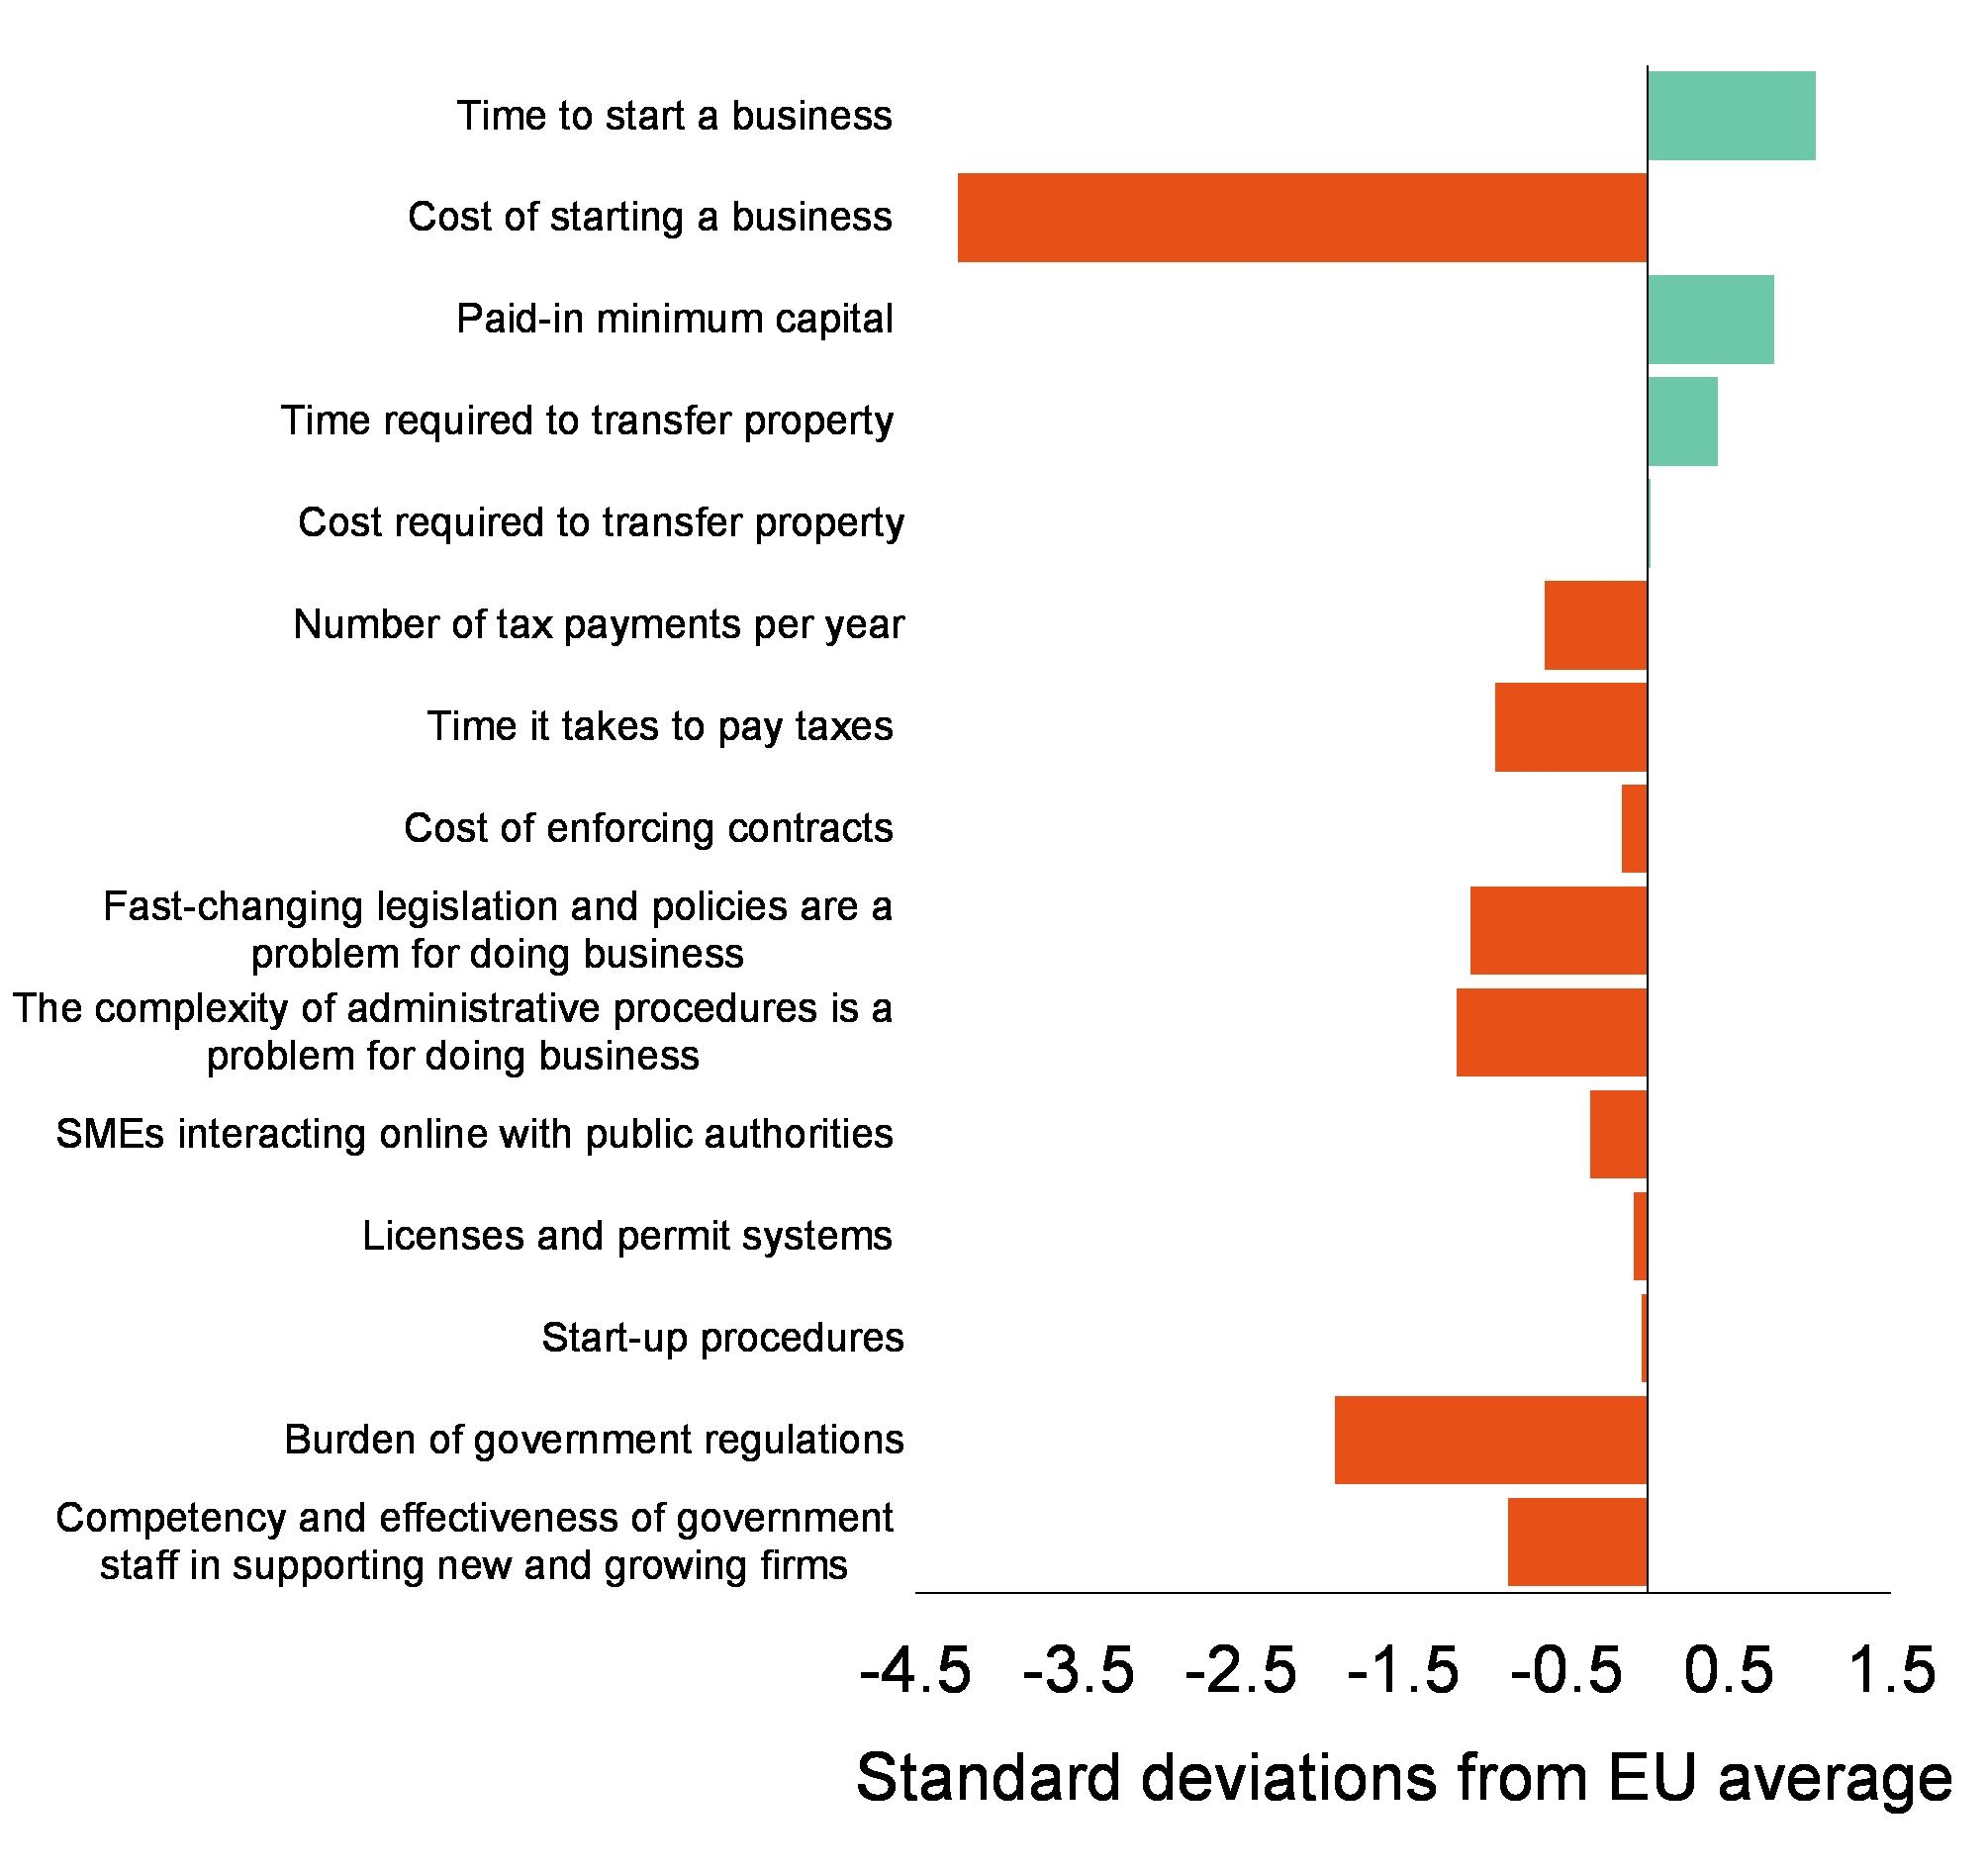
|
|
Source: European Commission, 2016l
|
|
Graph 4.5.4:Ease of doing business in 2017 and the number of reforms done in 2010-2016
|
|
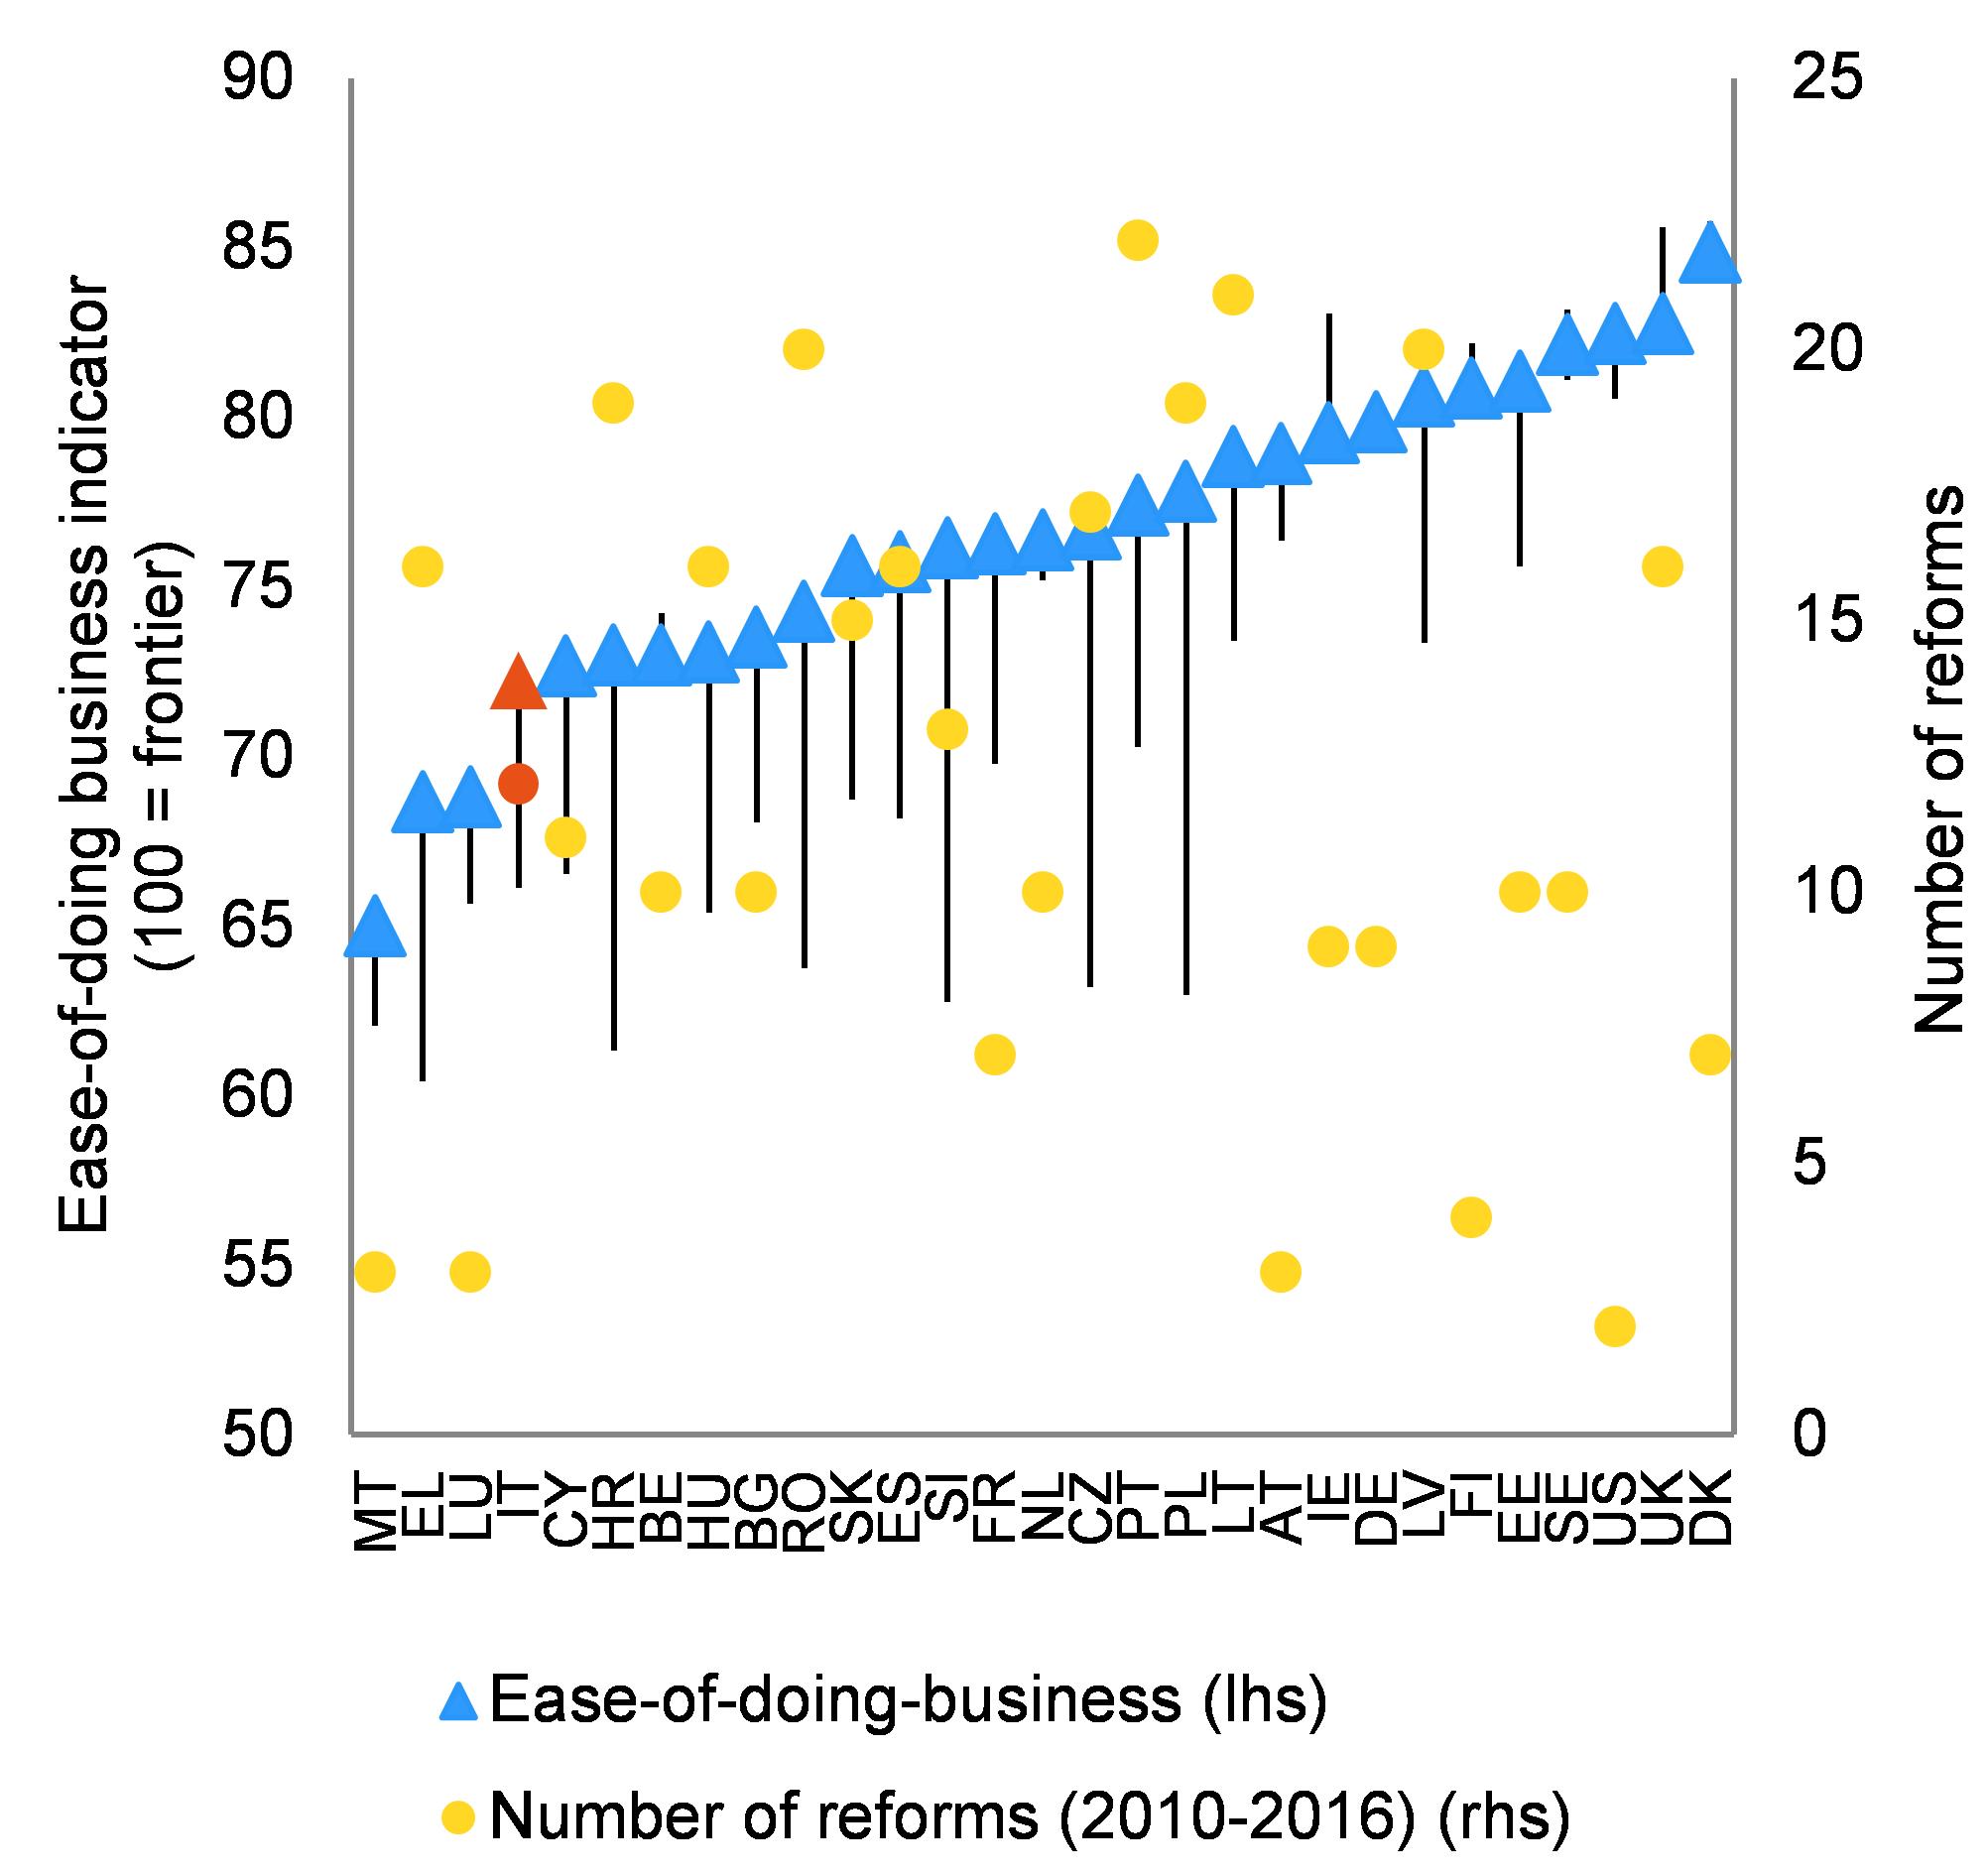
|
|
Source: World Bank, 2016a
|
Efforts to improve the business environment of firms are continuing. In line with the previous year, progress was made in implementing the 2015-2017 Simplification Agenda. A new public procurement code was introduced to make arrangements less burdensome and more flexible. Measures were taken to support e-invoicing, to simplify the procedures for starting a business and to streamline decision-making when several public administrations are involved (see Sections 4.1 and 4.6.1). Efforts were also made to reduce the average payment period, but late payments in some public bodies remain a critical issue. Besides, some e-government measures (Sistema di Identità Digitale (SPID)) are being implemented, making online public services more accessible and facilitating the use of electronic payments for the public administration (PagoPA). Other measures to boost investment and firms’ growth are described in Section 4.4.
4.5.3.Research and innovation*
Italy’s R&D investment still lags behind that of other EU countries. In 2015, Italy’s overall R&D intensity (i.e. total R&D expenditure as a proportion of GDP) was 1.33 %, slightly lower than in 2014 and still significantly below the EU average of 2.03 %. The gap with the EU average for R&D expenditure by the private sector (0.74 % of GDP in Italy – 14th in the EU – as against the EU average of 1.30 %) remained significantly larger than for public R&D expenditure (0.56 % of GDP in Italy – 17th in the EU – as against the EU average of 0.71 %). Between 2007 and 2015, the Italian government’s budget allocated to R&D activities fell from EUR 9.9 billion to EUR 8.3 billion.
The lack of highly-skilled people holds back Italy’s innovation performance. Italy still has an insufficient number of highly-skilled people, in particular in science, engineering and computing. This is driven by the country’s low tertiary education attainment rate (see Section 4.3.3) and the low number of new graduates in relevant study domains: in 2014, Italy counted 12.5 new graduates in science and engineering and 0.5 new graduates in computing per thousand inhabitants aged 25-34 (as against the EU average of 17.6 and 2.3, respectively). In addition, a significant number of Italian researchers left the country owing to lack of career prospects or more attractive salaries, and this brain drain has so far not been offset by the arrival of foreign researchers.
Other factors also explain Italy’s innovation performance lag. Cooperation between academia and business in Italy remains limited, thereby hampering an efficient transfer of knowledge or leverage effect on firms’ R&D investment. In 2014, public-private scientific co-publications per million inhabitants in Italy numbered 18 (as against the EU average of 34). Furthermore, in 2014, the volume of research performed by the public research and innovation system funded by businesses amounted to just 0.013 % of GDP (well below the EU average of 0.052 % of GDP), although Italy performs relatively well in terms of the quality of its scientific publications base. In addition, framework conditions for innovation in Italy are unfavourable to the creation and growth of R&D intensive firms. Italy ranks 21st in the EU on the proportion of employment in high-growth enterprises (9.5 % as against the EU average of 13 %), and most of those firms do not operate in knowledge-intensive innovative sectors. Moreover, conservative bank lending policies and the underdevelopment of capital markets hampers innovative start-ups’ access to external funding. For instance, in 2015, private venture capitalists’ investments in Italy represented only 0.003 % of GDP (as against the EU average of 0.024 %).
In addition to the several incentives introduced in previous years, Italy adopted new measures to improve its innovation performance. First, in May 2016, the country launched (with a two-year delay) its new 2015-2020 national research programme, which is fully operational since July 2016. The programme has a budget of EUR 2.5 billion for the 2015-2017 period and is structured around six priorities (i.e. human capital, internationalisation, research infrastructures, public-private cooperation, southern Italy, and efficiency and quality of public spending). Second, in September 2016, the government presented its new ‘Industry 4.0’ strategy (see Section 4.4 and Box 4.5.1.).
4.6. Public administration
4.6.1.PUBLIC ADMINISTRATION*
Italy’s public administration is perceived to be less efficient and effective than those of its EU peers. Italy scores worse than its EU peers on most of the World Bank’s 2016 worldwide governance indicators. On the government effectiveness indicator, reflecting perceptions of the quality of public services and the capacity of the civil service, Italy scores 0.45, while other major European countries score above 1 (Graph 4.6.1). Unlike most other countries, Italy keeps displaying a negative trend in performance. The trend is confirmed also after taking into account the regulatory quality index, reflecting perceptions of the government’s ability to formulate and implement sound policies and regulations. The Commission’s Eurobarometer 2016 also ranks Italy as a Member State with one of the highest proportions of citizens judging the public service as ‘bad’ or ‘very bad’ (European Commission, 2016p).
The management and quality of civil servants are key to improving Italy’s public administration performance. The average age of civil servants is high in Italy (47 years, 4.4 years more than in the private sector). Educational mismatches are also high, with 49 % of jobs that require a university degree occupied by non-graduates (European Commission, 2016b). Selection procedures are still based mainly on textbook knowledge instead of applied problem-solving skills. Moreover, the system of monetary incentives to raise productivity is negligible, and incentives are not clearly related to an effective evaluation system and do not reward merit. Graph 4.6.2 shows the breakdown of a civil servant's average salary (ARAN, 2015). The fixed portion represents more than 80 % of the total wage in most sectors. The portion linked to productivity is relevant only for agencies, which account for some 4 % of all public employment. Thus, improving performance does not lead to substantial benefits for the employees. Lack of monetary incentives is not counterbalanced by career progression. Career and salary progressions seem equally distributed among employees. Managerial and non-managerial careers are on separate paths. The attractiveness of the public administration is thus very weak among highly skilled workers, generating negative self-selection (Bank of Italy, 2016c).
|
Graph 4.6.1:Government effectiveness indicator, 2016
|
|
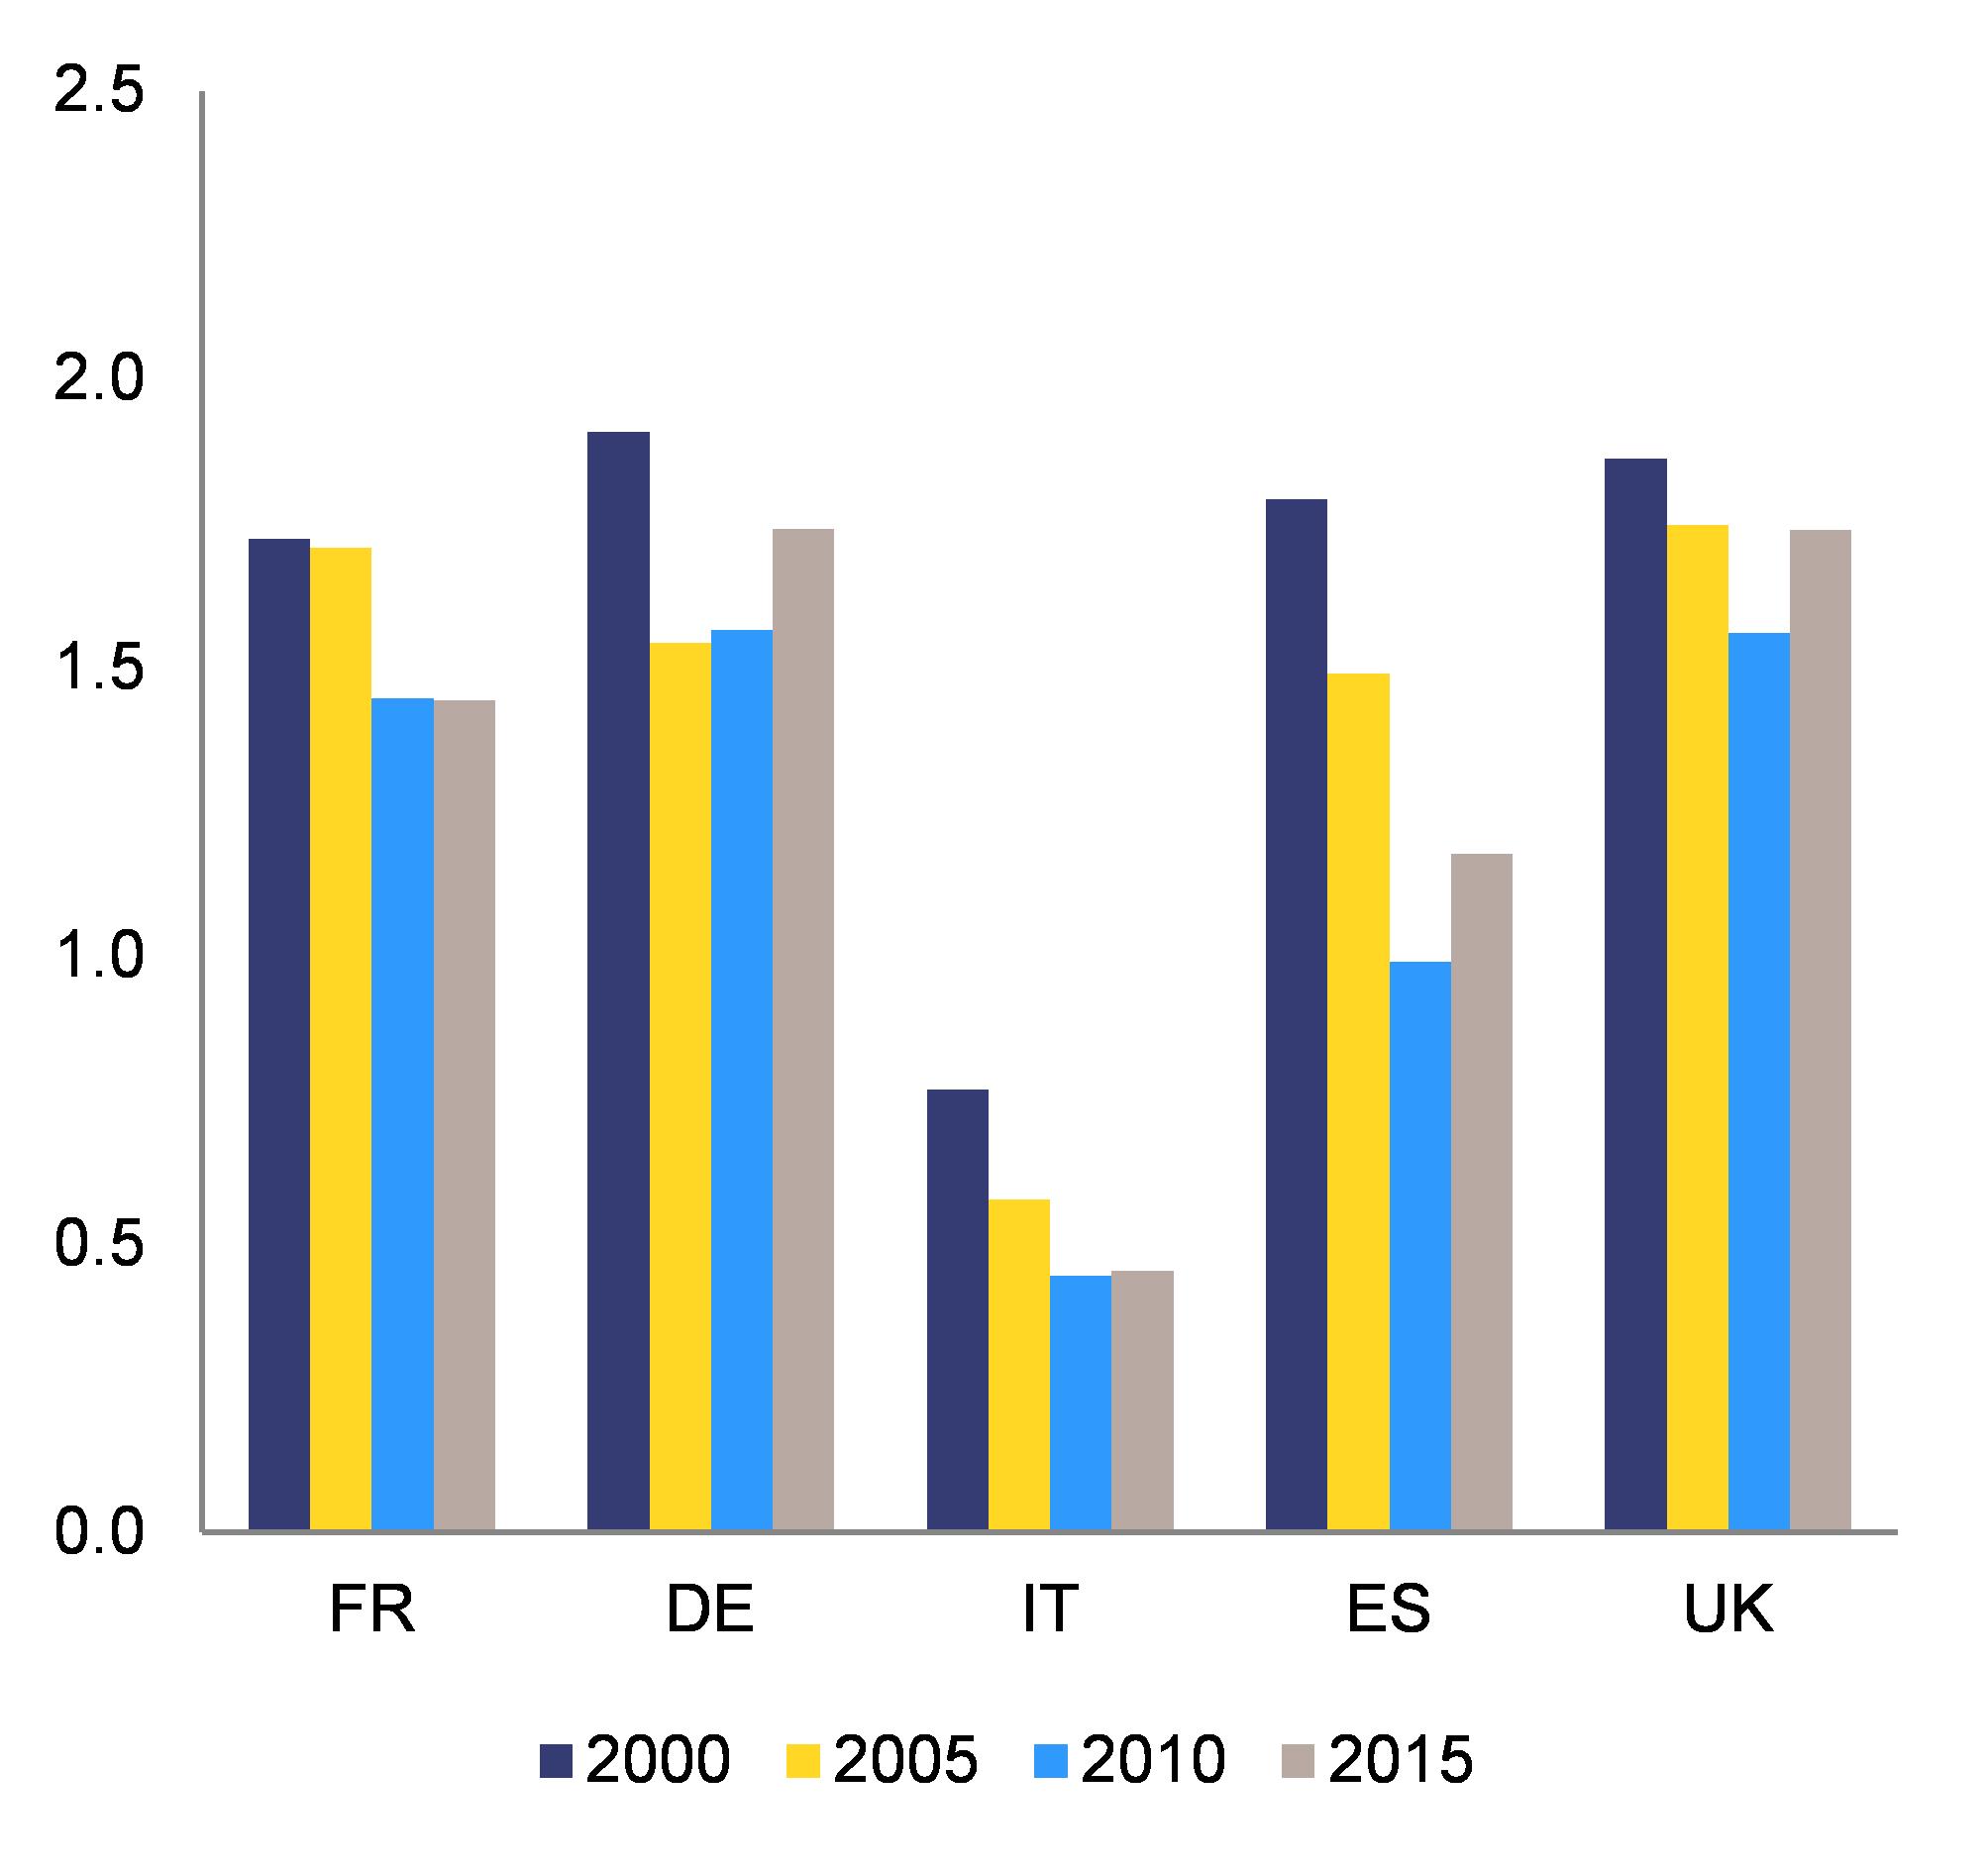
|
|
Source: World Bank, 2016b
|
|
Graph 4.6.2:Percentage breakdown of the average salary of non-managerial civil servants, 2014
|
|
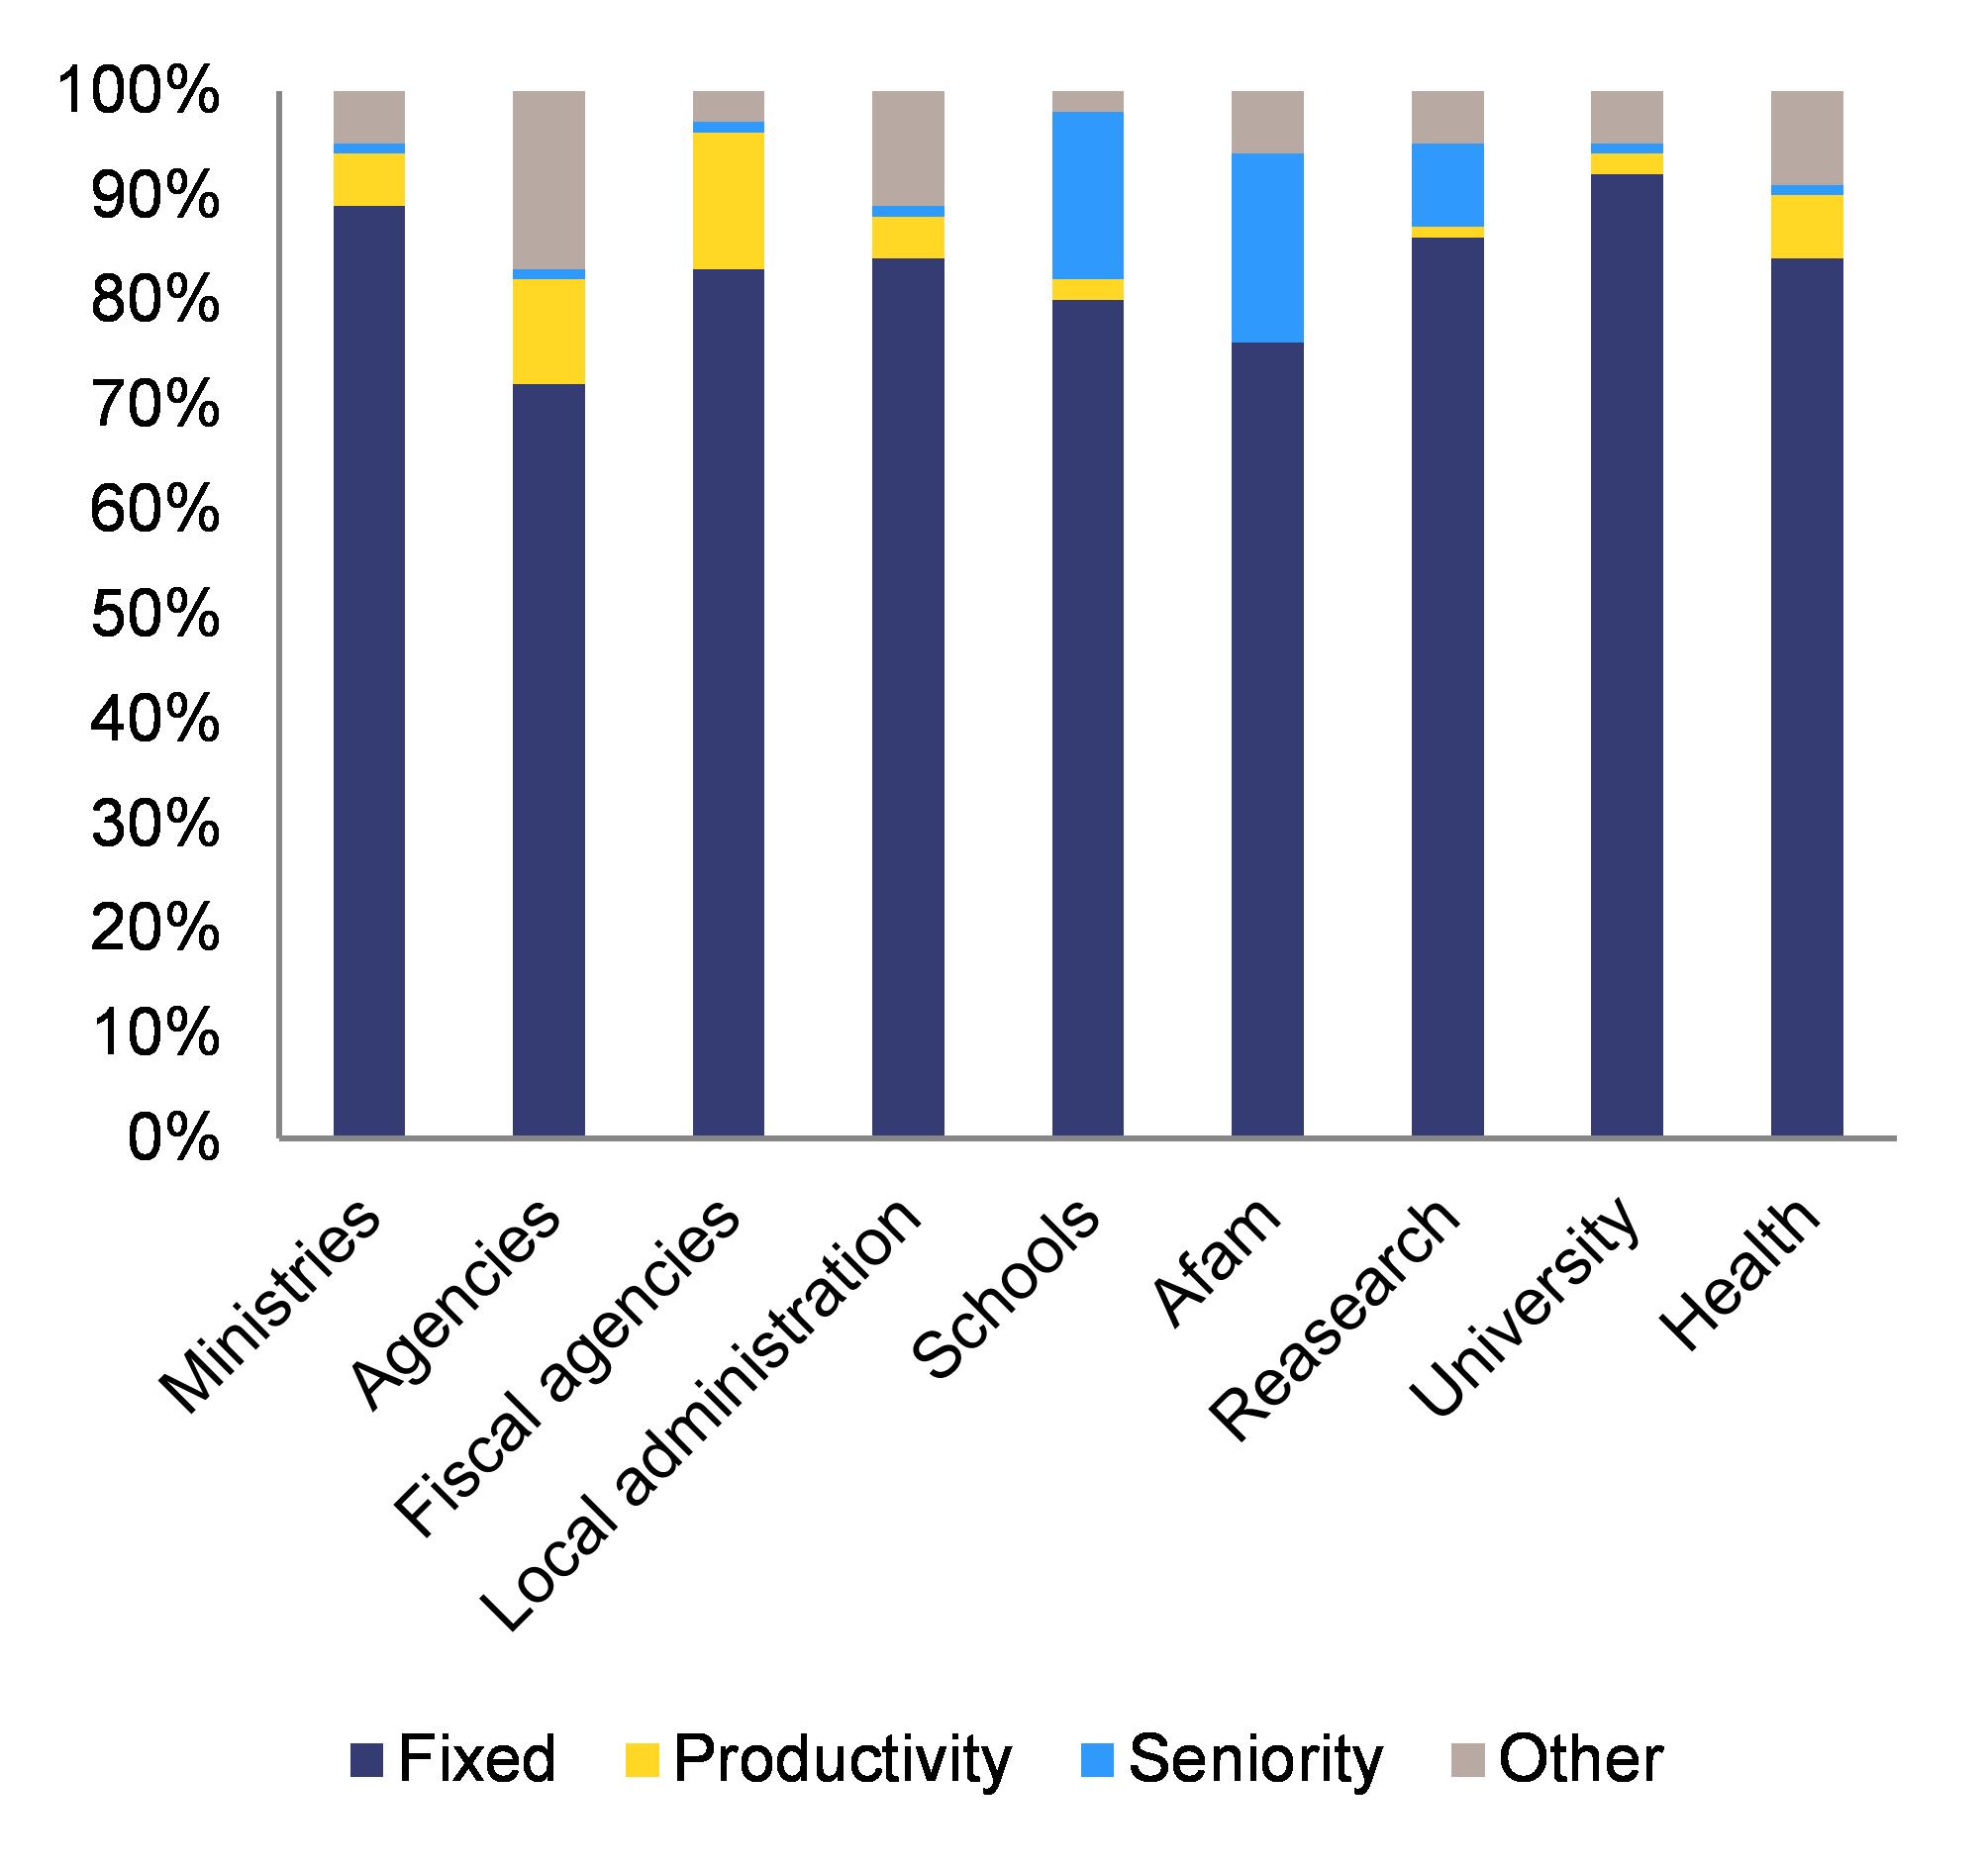
|
|
Source: European Commission; ARAN, 2015
|
A reform of the public administration is being implemented. In 2015, a comprehensive enabling law was adopted. The law delegates to the government inter alia the reform of the legal framework for public employment at both managerial and non-managerial level. Under the enabling law, the government has adopted several implementing decrees, including on: i) the simplification of the decision-making process and of citizens’ access to public administrations; ii) state-owned enterprises; iii) human resources (management level in the health sector and disciplinary dismissal). In 2016, a draft implementing decree on middle and senior managers was presented. It introduces fixed-term managerial positions, allowing for more flexibility in the administrations. It also increases managers’ mobility and strengthens the link between careers and performance. Yet, it keeps the managerial career on a different path than the non-managerial one. The decree on the non-managerial level has not yet been presented. The enabling law envisages the possibility of intervening in civil servants’ selection and recruitment, evaluation processes and promotion and salary progression.
The consequences of the Constitutional Court ruling on the content and effectiveness of the reform of the public administration are still to be seen. In November 2016, the Constitutional Court ruled that the procedure followed for three adopted legislative decrees (regulating the management in the health sector, disciplinary dismissals and state-owned enterprises) and for three not yet adopted ones (on local public services and public employment at managerial and non-managerial level) was unconstitutional. (
) While the first three can be amended by a corrective decree (within 12 months given the adoption deadline), the deadlines for the adoption of the decrees on local public services and public managers have expired and the government has not yet clarified how it will address the Constitutional Court ruling for those two decrees. The legislative decree on non-managerial staff has not been published yet and is expected to follow the correct procedure.
Improved public administration will also support a more efficient use of EU funds. Italy agreed to adopt regional (and national) administrative reinforcement plans (
) to improve the implementation of European Structural and Investment Funds, in line with a 2015 country-specific recommendation. The plans cover also non-European structural and investment funds and administrative capacity-building, and are expected to contribute to the public administration reform.
4.6.2.JUSTICE SYSTEM*
Despite some improvement in the effectiveness of the justice system, the length of proceedings remains a serious challenge. In 2015, Italy's backlog and disposition time for civil litigious cases remained one of the highest in the EU at all instances (European Commission, 2017b). (
) In the past five years, some reforms helped to reduce the pending cases at first and second instance (
) but the backlog still increased at the Supreme Court of Cassation (by 4 % since 2014) (Corte di Cassazione, 2016). In 2016, the Parliament passed a reform of the rules on career, training and discipline of the honorary magistracy and a law to help the Supreme Court reduce its backlog, also by creating ʽsupport offices’ to assist cassation judges and allowing the assignment of judges from other departments to work on civil cases. Resources were allocated to digital administrative trials as of 2017. However, the observed downward trend in pending cases started only slowly to translate also into lower disposition time at first instance (
). Moreover, this seems to relate mostly to recently introduced out-of-court procedures in non-litigious cases (
), for which the disposition time decreased by 16.5 % between 2010 and 2015, whereas it increased for litigious cases by 6.8 % over the same period. Trial length for civil and commercial proceedings remains a source of concern at higher instances and even shows an upward trend. (
) As for administrative justice, the backlog continued to decrease but the disposition time remains high. (
)
Effective case-management, adequate staff and simpler procedures at all instances could support court efficiency. The share of civil cases pending for more than three years remains a major problem of Italy’s justice system, although the backlog has decreased since 2013 at all instances except the Supreme Court (Ministry of Justice, 2016). There is ample scope to tackle this issue through effective case-management. The ‘Strasbourg 2’ project adopted at the end of 2014 aims to monitor long-pending cases and encouraging judges to adopt a ʽfirst-in, first-outʼ strategy in handling them. The High Council for the Judiciary also developed a handbook of best practices as regards in-court workflow, digitalisation and support offices. Where applied, these practices showed promising results in reducing the backlog and length of proceedings. Wider and more homogeneous application of case-management could extend the efficiency gains to all instances. The current lack of 1 439 out of around 9 921 judges and of administrative staff (up to 30 % in some courts) weighs on the capacity of the judiciary to timely resolve a large number of incoming cases (Corte di Cassazione, 2016). Addressing this shortage, while improving training and equipment and further extending the digitalisation of proceedings, could contribute to support efficiency gains.
The effectiveness of reforms to avoid abuses of the trial remains to be seen. In the past years, Italy passed measures to contain litigation and avoid abuses of the trial (
), which reportedly weigh on the efficiency of civil justice (Corte di Cassazione, 2012; Davigo and Sisti, 2012; Corte di Cassazione, 2013; Corte di Cassazione, 2015a; Ambrosetti Club, 2016). For instance, the legal interest rate paid by the debtor in a monetary dispute was raised as a deterrence to uncooperative debtorsʼ delaying tactics, admissibility rules for appeals were made stricter by including a reasonable likelihood of success, the principle that the losing party bears the cost of the trial was strengthened, and judges' option to fine vexatious litigation ex officio was extended to bad faith in out-of-court procedures (
). Yet, the still very long average trial length (
) suggests that these measures have not fully delivered, including in effectively increasing procedural discipline. Moreover, doubts may arise on the consistent application of the new admissibility rules at second instance, since only 1.9 % of incoming cases in appeal courts were declared inadmissible. (
) It is thus important for the authorities to understand the reasons for this and monitor the impact of these reforms on abuses of the trial. (
) The current compulsory legal assistance in mediation appears unnecessary when the parties do not aim to conclude an agreement liable of immediate enforcement without a judgeʼs approval. A comprehensive reform of civil procedural rules now under discussion in the Senate would provide for a further tightening of admissibility criteria for appeals, streamlined civil procedures at all instances and stronger deterrence against vexatious litigation, which may have a positive impact on procedural discipline and trial length.
4.6.3.anti-corruption*
The statute of limitations hinders the fight against corruption. Italyʼs challenges related to high-level corruption, conflicts of interest, links with organised crime and corruption in the private sector (as highlighted by the 2014 EU Anti-Corruption Report) are still confirmed by several indicators. Italy ranks 26th in the EU for control of corruption, Transparency International gave Italy one of the lowest scores in the EU, and the country was ranked 120th out of 138 countries on favouritism in public officialsʼ decisions and 87th on diversion of public funds (World Bank 2016b; WEF, 2016). Public procurement is a sector at risk, with 29 % of all procedures having only one bidder and with 9 % having no call for tenders at all in 2015 (European Commission, 2016o). Reforms were adopted to improve the repression of corruption, but the long-overdue revision of the statute of limitations is still on hold. The current system is a major hindrance to repress corruption, not least as it incentivises lawyersʼ delaying tactics (European Commission, 2015b). (
) The ratio of time-barred to resolved criminal cases (Graph 4.6.3) shows that prescriptions at first instance have risen since 2013 to 9.5 % in 2015. Those in appeal courts also increased from 12.3 % to 22.6 % over 2006-2015. The rate of prescription in the Supreme Court is lower but it has been rising in recent years. Overall, a high proportion of cases gets time-barred after first-instance conviction. A draft law introducing a suspension of prescription terms for all criminal trials and a special extension for corruption offences has been in Parliament for two years. While the proposal does not stop prescription terms after a first-instance conviction, (as suggested by the Council of Europeʼs Group of States against Corruption) it appears to be a step in the right direction. Extending prescription terms could increase incentives to resort to expedited procedures (
) and reduce abuses of the trial (GRECO, 2016, paragraph 126), thereby contributing to more effective criminal justice. Failure to address this issue in line with EU best practices could undermine public and investor confidence in the rule of law.
The national anti-corruption authority has limited means to exercise its powers, and the prevention framework remains fragmented. The monitoring powers of the national anticorruption authority (ANAC) were extended, in particular to cover larger procurement contracts where monitors chosen at random from the authoritiesʼ pool sit on tender boards. However, this is not the case for contracts below EU thresholds and those defined (ambiguously) as ʽnot particularly complexʼ. Acting through the local prefect, ANAC may also remove contractors involved in corruption or mafia cases, while others may continue to work to minimise procurement delays. The authorityʼs tasks include analysing the corruptionprevention plans of all administrative bodies and stateowned companies and providing training to the administrations lacking the capacity to develop such plans. However, these powers are not matched by sufficient additional human and financial resources (ANAC, 2016). This shortage compounds Italy’s lack of uniform and systematic verification of public officials’ assets and conflicts of interest, and a stillfragmented whistle-blower protection framework.
|
Graph 4.6.3:Ratio of time-barred criminal cases to total resolved criminal cases per instance
|
|
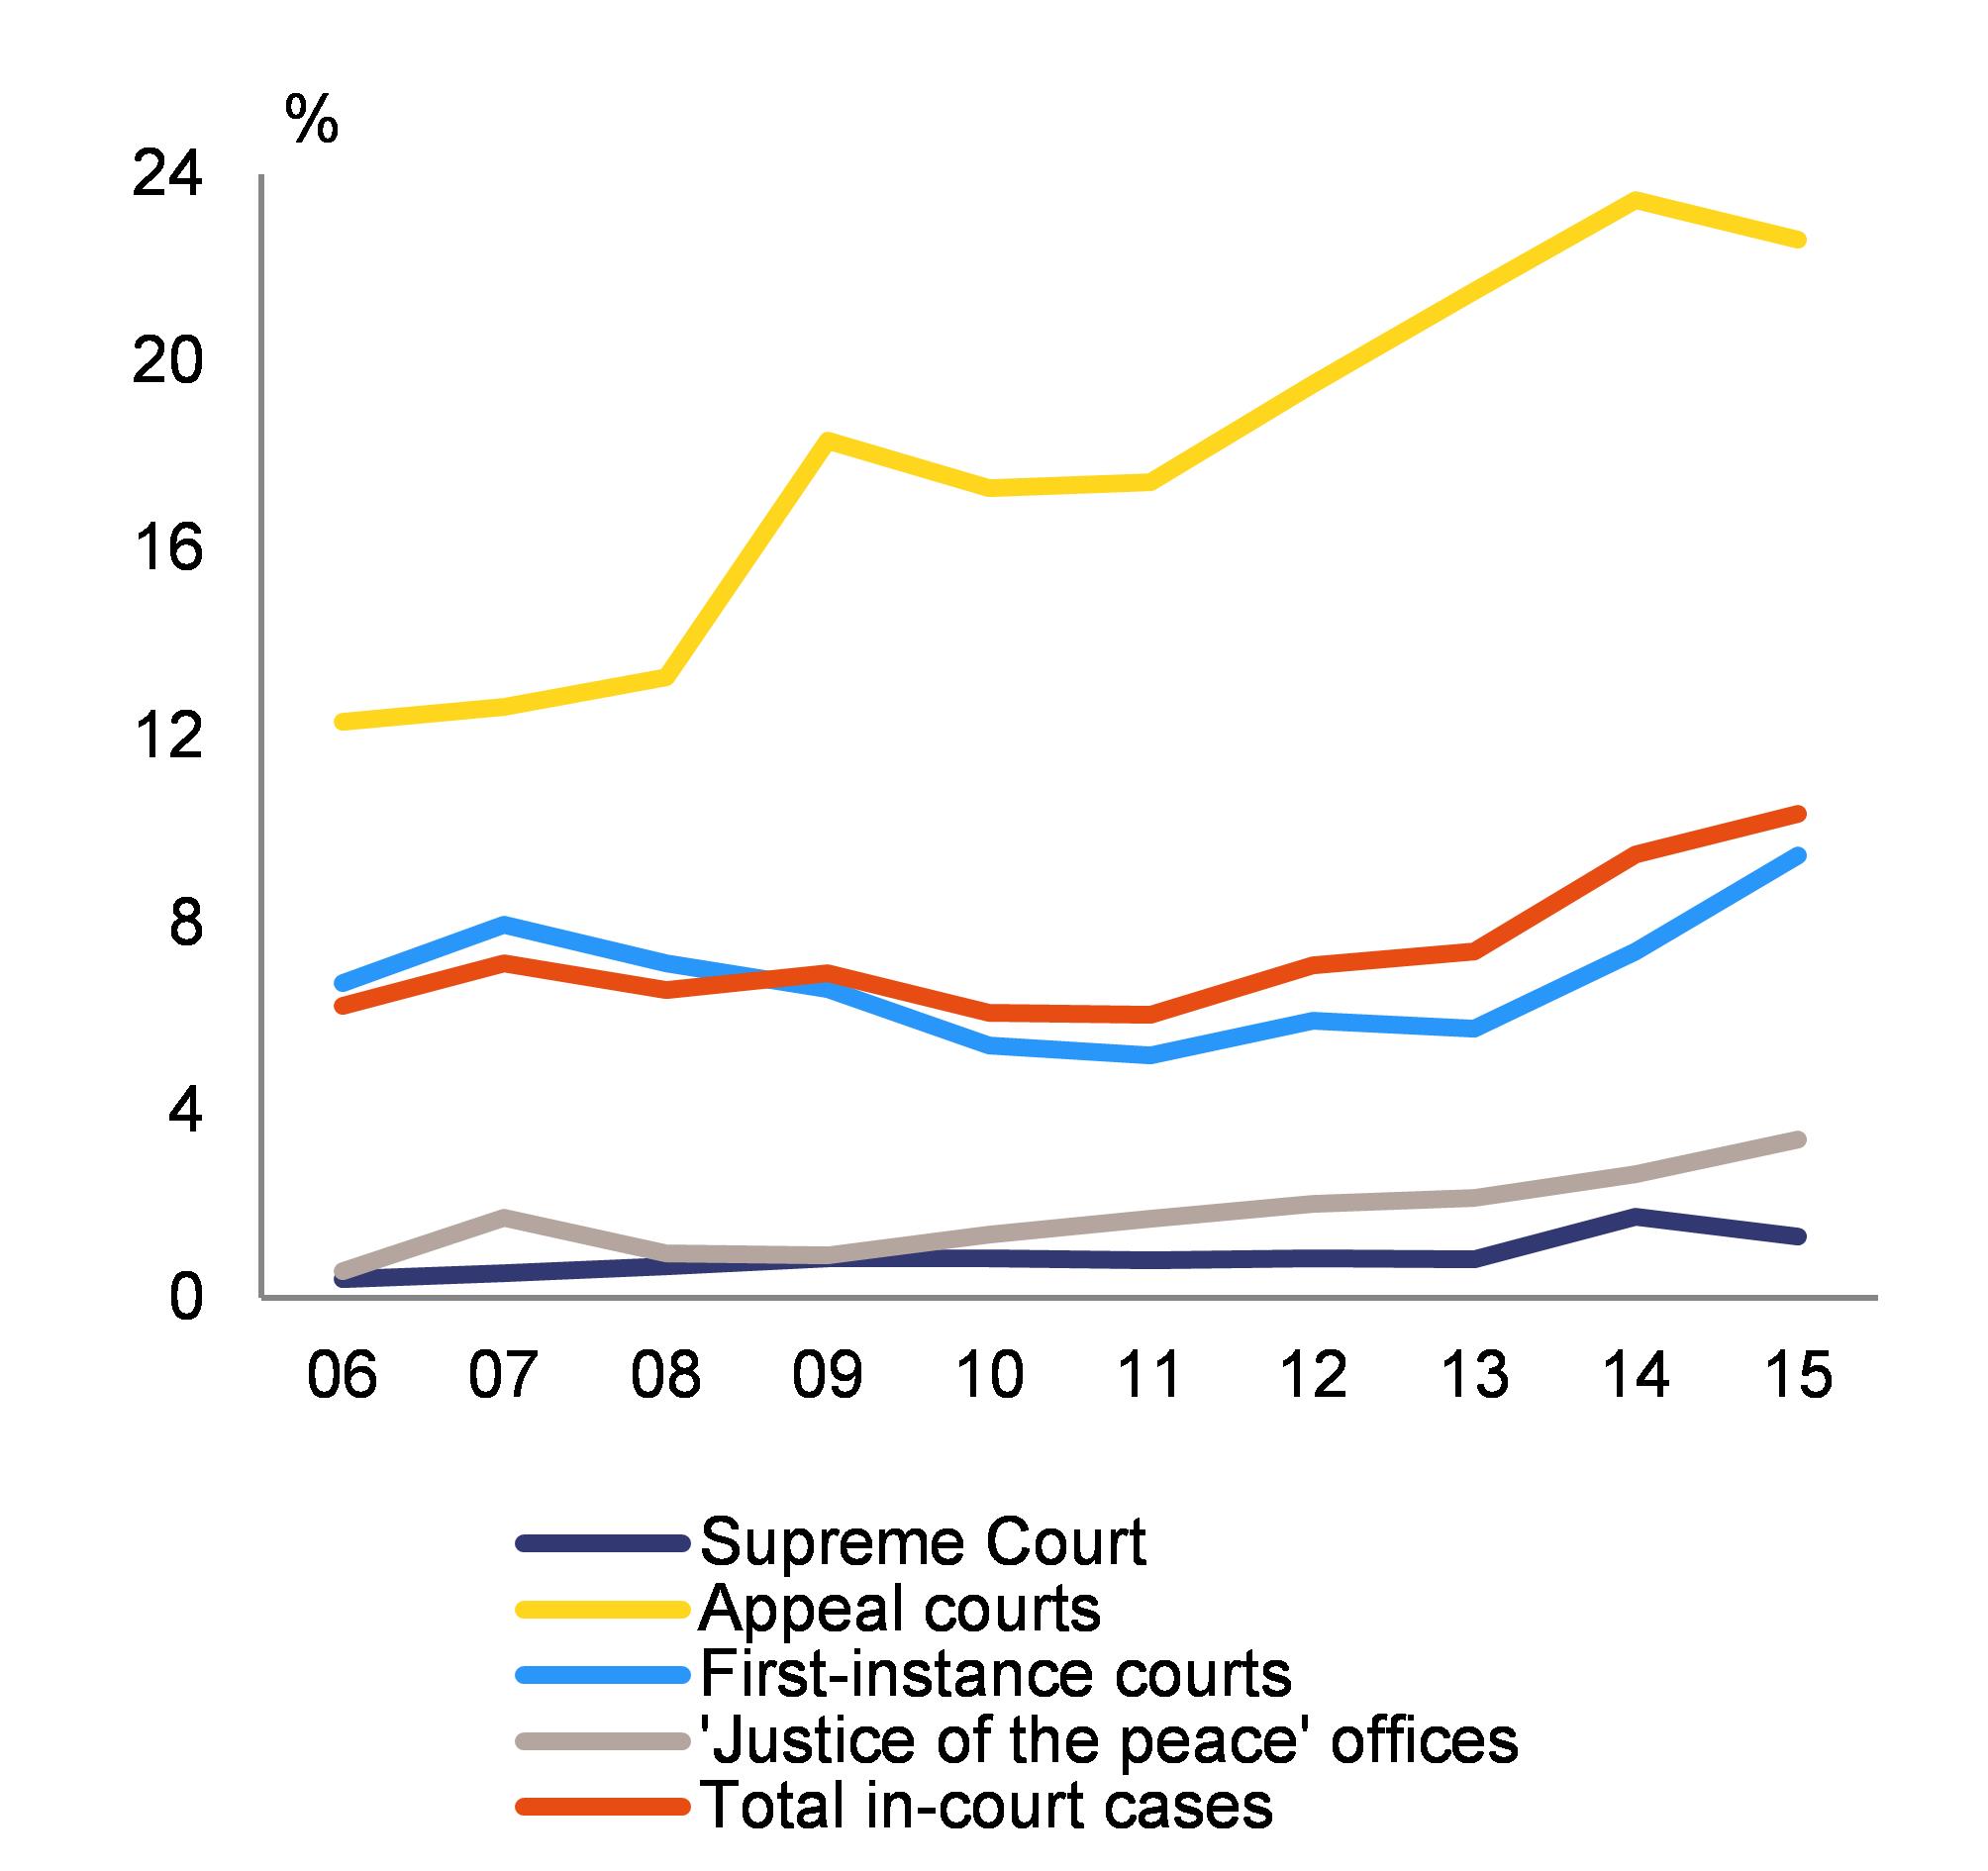
|
|
Source: Ministry of Justice
|
|
Annex A
Overview table
Commitments
|
Summary assessment (
)
|
|
2016 country-specific recommendations (CSRs)
|
|
CSR 1: In 2016, limit the temporary deviation from the required 0.5 % of GDP adjustment towards the medium-term budgetary objective to the amount of 0.75 % of GDP allowed for investments and the implementation of structural reforms, subject to the condition of resuming the adjustment path towards the medium-term budgetary objective in 2017. Achieve an annual fiscal adjustment of 0.6 % or more of GDP towards the medium-term budgetary objective in 2017. Finalise the reform of the budgetary process in the course of 2016 and ensure that the spending review is an integral part of it. Ensure the timely implementation of the privatisation programme and use the windfall gains to accelerate the reduction of the general government debt ratio. Shift the tax burden from productive factors onto consumption and property. Reduce the number and scope of tax expenditures and complete the reform of the cadastral system by mid-2017. Take measures to improve tax compliance, including through electronic invoicing and payments
|
Italy has made some progress in addressing CSR 1 (this overall assessment of CSR 1 does not include an assessment of compliance with the Stability and Growth Pact):
|
|
In 2016, limit the temporary deviation from the required 0.5 % of GDP adjustment towards the medium-term budgetary objective to the amount of 0.75 % of GDP allowed for investments and the implementation of structural reforms, subject to the condition of resuming the adjustment path towards the medium-term budgetary objective in 2017. Achieve an annual fiscal adjustment of 0.6 % or more of GDP towards the medium-term budgetary objective in 2017.
|
The assessment of compliance with the Stability and Growth Pact will be made in Spring.
|
|
Finalise the reform of the budgetary process in the course of 2016 and ensure that the spending review is an integral part of it.
|
Substantial progress has been made in reforming the budgetary process. A comprehensive reform of the process was passed in 2016. Its full implementation is expected in the 2018 Budget Law, which would make the spending review a more integral part of the budgeting process.
|
|
Ensure the timely implementation of the privatisation programme and use the windfall gains to accelerate the reduction of the general government debt ratio.
|
Limited progress has been made in implementing the privatisation programme and in using the windfall gains to reduce public debt. In 2016, Italy has underachieved its privatisation targets (at 0.1 % of GDP in 2016 versus the planned 0.5 %) and the lower interest rate expenditure was counterbalanced by increased primary expenditure.
|
|
Shift the tax burden from productive factors onto consumption and property.
|
Some progress has been made in shifting the tax burden from productive factors onto consumption and property. Italy’s 2017 Budget Law contains several measures affecting the tax wedge on labour, including lower tax rates on productivity premia agreed in decentralised bargaining, an exemption from the payment of social security contributions for certain new hires, and the reduction of the social security contributions rate for the self-employed. These measures compound more sizeable measures taken in 2014 and 2015 to reduce the labour tax wedge.
|
|
Reduce the number and scope of tax expenditures and complete the reform of the cadastral system by mid-2017.
|
Limited progress has been made in reducing the number and scope of tax expenditures and in completing the reform of the cadastral system.
|
|
Take measures to improve tax compliance, including through electronic invoicing and payments.
|
Limited progress has been made in improving tax compliance. The 2017 Budget Law introduces a new tax on business income (IRI) to harmonise the tax system of small firms and corporations. It also introduces transparency provisions on the communication of invoices and VAT data, and a reform of tax administration, merging the tax-recovery agency (Equitalia) with the revenue agency. Sanctions and fines related to unpaid taxes in 2000-2015 are waived for taxpayers spontaneously regularising their tax position.
|
|
CSR 2: Implement the reform of the public administration by adopting and implementing all necessary legislative decrees, in particular those reforming publicly owned enterprises, local public services and the management of human resources. Step up the fight against corruption including by revising the statute of limitations by the end of 2016. Reduce the length of civil justice proceedings by enforcing reforms and through effective case-management.
|
Italy has made limited progress in addressing CSR 2:
|
|
Implement the reform of the public administration by adopting and implementing all necessary legislative decrees, in particular those reforming publicly owned enterprises, local public services and the management of human resources.
|
Limited progress has been made in implementing the public administration reform. Several implementing decrees have been adopted. However, on 25 November 2016, the Constitutional Court ruled that the procedure envisaged was unconstitutional for the decrees pointed out in the recommendations, notably those concerning human resource management, local public services and publicly-owned enterprises. Some of them had been already adopted (those regulating the management level in the health sector, disciplinary dismissals and state-owned enterprises) and have therefore to be amended. For two decrees, (on local public services and public managers), the delegation had already expired. The decree on non-managerial staff was also concerned, but it can still be adopted under the enabling law with the correct procedure.
|
|
Step up the fight against corruption including by revising the statute of limitations by the end of 2016.
|
No progress has been made in revising the statute of limitations.
|
|
Reduce the length of civil justice proceedings by enforcing reforms and through effective case-management.
|
Some progress has been made in enforcing civil justice reform and improving case-management but the length of proceedings is not decreasing.
|
|
CSR 3: Accelerate the reduction in the stock of non-performing loans, including by further improving the framework for insolvency and debt collection. Swiftly complete the implementation of ongoing corporate governance reforms in the banking sector.
|
Italy has made some progress in addressing CSR 3:
|
|
Accelerate the reduction in the stock of non-performing loans,
|
Limited progress has been made in reducing non-performing loans (NPLs). In April 2016, a law was passed creating an NPL securitisation scheme supported by state guarantees (GACS), which became operational in August 2016 with the adoption of an implementing decree. Since April 2016, two private-sector backstop funds (Atlante I and II) have been set up to support the recapitalisation and the impaired asset disposal of vulnerable banks. Furthermore, the Bank of Italy has issued a new reporting template requiring banks to provide detailed data on their bad loans, collateral and ongoing recovery procedures. Although all these measures — including several reforms of insolvency and collateral enforcement rules — are in principle helpful in fostering the development of a secondary market for distressed assets in Italy, they have not yet resulted in significant short-term relief for the banking sector. In December 2016, the government approved the setup of a EUR 20 billion fund for the precautionary recapitalisation of and liquidity support for vulnerable banks, but it is not yet clear whether this will be a turning-point in the clean-up of the Italian banking sector.
|
|
including by further improving the framework for insolvency and debt collection.
|
Some progress has been made in improving the framework for insolvency and debt collection. In June 2016, further changes to Italy’s insolvency and collateral enforcement rules were made. Inter alia, provisions authorise private enforcement clauses in loan contracts allowing creditors to take ownership of collateral out-of-court in the event of a debtor’s default (patto marciano), and enable entrepreneurs to pledge movable assets while continuing to use them (a kind of non-possessory lien). Furthermore, an electronic register for insolvency cases will be set up, and hearings can now be held electronically. The reforms complement those of 2015, but it may take some time before their results in terms of shorter proceedings and higher recovery values — essential for NPL market activity — materialise. In the meantime, a draft enabling law aiming to fundamentally overhaul the insolvency and enforcement framework is currently under parliamentary discussion.
|
|
Swiftly complete the implementation of ongoing corporate governance reforms in the banking sector.
|
Some progress has been made in implementing corporate governance reform. With the adoption of a law in April 2016 and implementing provisions by the Bank of Italy in November 2016, the 18-month implementation period started for the self-reform of the segment of small mutual banks (banche di credito cooperativo (BCCs)). BCCs wishing to retain their cooperative status will have to join one of the cooperative banking groups that will be set up, and their relationship with the group’s holding company will be determined by risk-based ‘cohesion contracts’. The implementation of the 2015 reforms of large cooperative banks (banche popolari) and bank foundations has continued, although legal challenges and unfavourable market conditions have led to some delays.
|
|
CSR 4: Implement the reform of active labour market policies, in particular by strengthening the effectiveness of employment services. Facilitate the take-up of work for second earners. Adopt and implement the national antipoverty strategy and review and rationalise social spending.
|
Italy has made some progress in addressing CSR 4:
|
|
Implement the reform of active labour market policies, in particular by strengthening the effectiveness of employment services.
|
Some progress has been made in implementing the reform of ALMPs. The new Agency in charge of active labour market policies (ANPAL) is operational as of January 2017. A pilot outplacement voucher (assegno di ricollocazione) scheme was launched in November 2016 covering a sample of 30 000 beneficiaries.
|
|
Facilitate the take-up of work for second earners.
|
Limited progress has been made in facilitating the take-up of work by second earners. The 2017 Budget Law extends paternity leave from two to four days as of 2018. It also extends to 2017 and 2018 the possibility, first introduced in 2012, to exchange parental leave with babysitting vouchers and introduces a non-means-tested voucher for EUR 1 000 per year to be spent in public or private nurseries.
|
|
Adopt and implement the national antipoverty strategy and review and rationalise social spending.
|
Some progress has been made with regard to the national antipoverty strategy. The active inclusion measure (SIA), which provides economic and social care to disadvantaged households, was rolled out at national level. An enabling law aimed at establishing a single comprehensive scheme against poverty, replacing SIA and the unemployment assistance scheme (ASDI), has been approved by the Chamber of Deputies.
|
|
CSR 5: Swiftly adopt and implement the pending law on competition. Take further action to increase competition in regulated professions, the transport, health and retail sectors and the system of concessions.
|
Italy has made limited progress in addressing CSR 5:
|
|
Swiftly adopt and implement the pending law on competition.
|
No progress has been made with regard to the pending law on competition. The draft law was presented to Parliament in April 2015 and has not yet been approved by the Senate.
|
|
Take further action to increase competition in regulated professions, the transport, health and retail sectors and the system of concessions.
|
Limited progress has been made in addressing remaining barriers to competition in regulated professions, the transport, health and retail sectors and the system of concessions. The code for public procurement and concessions was revised in 2016. No further measures were taken to remove remaining barriers to competition in the other sectors.
|
|
Europe 2020 (national targets and progress)
|
|
Employment rate target: 67 %-69 %
|
The employment rate has shown some signs of recovery, increasing to 60.5 % in 2015 (compared with 59.9 % in 2014). However, it is still far from the target.
|
|
R&D target: 1.53 % of GDP
|
Italy’s R&D investment stood at 1.33 % of GDP in 2015. Therefore, there is only limited progress towards the target. In recent years, Italy has been cutting its public research and innovation budget at a higher rate than the overall public budget. This trend keeps Italy’s public sector R&D intensity — 0.56 % of GDP in 2015 — at a significantly lower level than the EU average (0.71 %), while business R&D intensity stood at 0.74 % of GDP in 2015, also much lower than the EU average (1.3 % of GDP).
|
|
Greenhouse gas emissions target: -13 % in non-ETS sectors (compared with emissions in 2005)
|
According to the latest national projections submitted to the European Commission in 2015 and taking into account existing measures, emissions are projected to decrease by 18 % by 2020 as compared with 2005. Therefore, Italy is on track to reach its 2020 greenhouse gas emission reduction target, with a 5 % margin.
According to approximated data for 2015, emissions decreased by 19 % between 2005 and 2015.
|
|
Renewable energy target: 17 %
|
With a renewable energy share of 17.1 % in 2015, Italy has already reached the 2020 target. The share of renewable electricity generation in final electricity consumption and in heating and cooling more than doubled between 2005 and 2014, increasing from 16.3 % to 33.4 % and from 8.2 % to 18.9 % respectively. However, past changes in support schemes for renewables (e.g. retroactive cuts in feed-in tariffs for existing projects), the uncertainty about the post-2016 regulatory framework for renewables, and persistent burdensome administrative procedures limited market growth during in the last couple of years. (
)
|
|
Energy efficiency target: 158 Mtoe (absolute level of primary energy consumption) / 124 Mtoe (absolute level of final energy consumption)
|
Italy increased its primary energy consumption by 4 % from 143.84 Mtoe in 2014 to 149.56 Mtoe in 2015. Final energy consumption increased by 3 % from 113.35 Mtoe in 2014 to 116.44 Mtoe in 2015. Even if Italy has already achieved levels of primary and final energy consumption which are below the indicative national 2020 targets, it would need to make an effort to maintain these levels until 2020.
|
|
Early school leaving target: 16 %
|
Italy has met this target. The early school leaving rate (the percentage of the population aged 18-24 with at most lower secondary education and not in further education or training) fell from 16.8 % in 2013 to 15 % in 2014 and 14.7 % in 2015.
|
|
Tertiary education target: 26 %-27 %
|
Italy has made some progress towards achieving this target. The tertiary educational attainment rate rose to 25.3 % in 2015 from 23.9 % in 2014 and 22.5 % in 2013.
|
|
Risk of poverty or social exclusion target: -2.2 million people at risk of poverty or social exclusion (compared with the number of people in 2008, thus corresponding to a target of 12.9 million people at risk of poverty or social exclusion in 2020)
|
Not only is there no progress towards achieving this target, but the situation has further deteriorated. The proportion of people at risk of poverty of social exclusion was 28.7 % in 2015 (slightly higher than in 2014, when it was 28.3 %, and still much higher than in 2008, when it was 25.5 %).
|
Annex B
MIP Scoreboard
|
|
|
Table B.1:MIP scoreboard - Italy
|
|
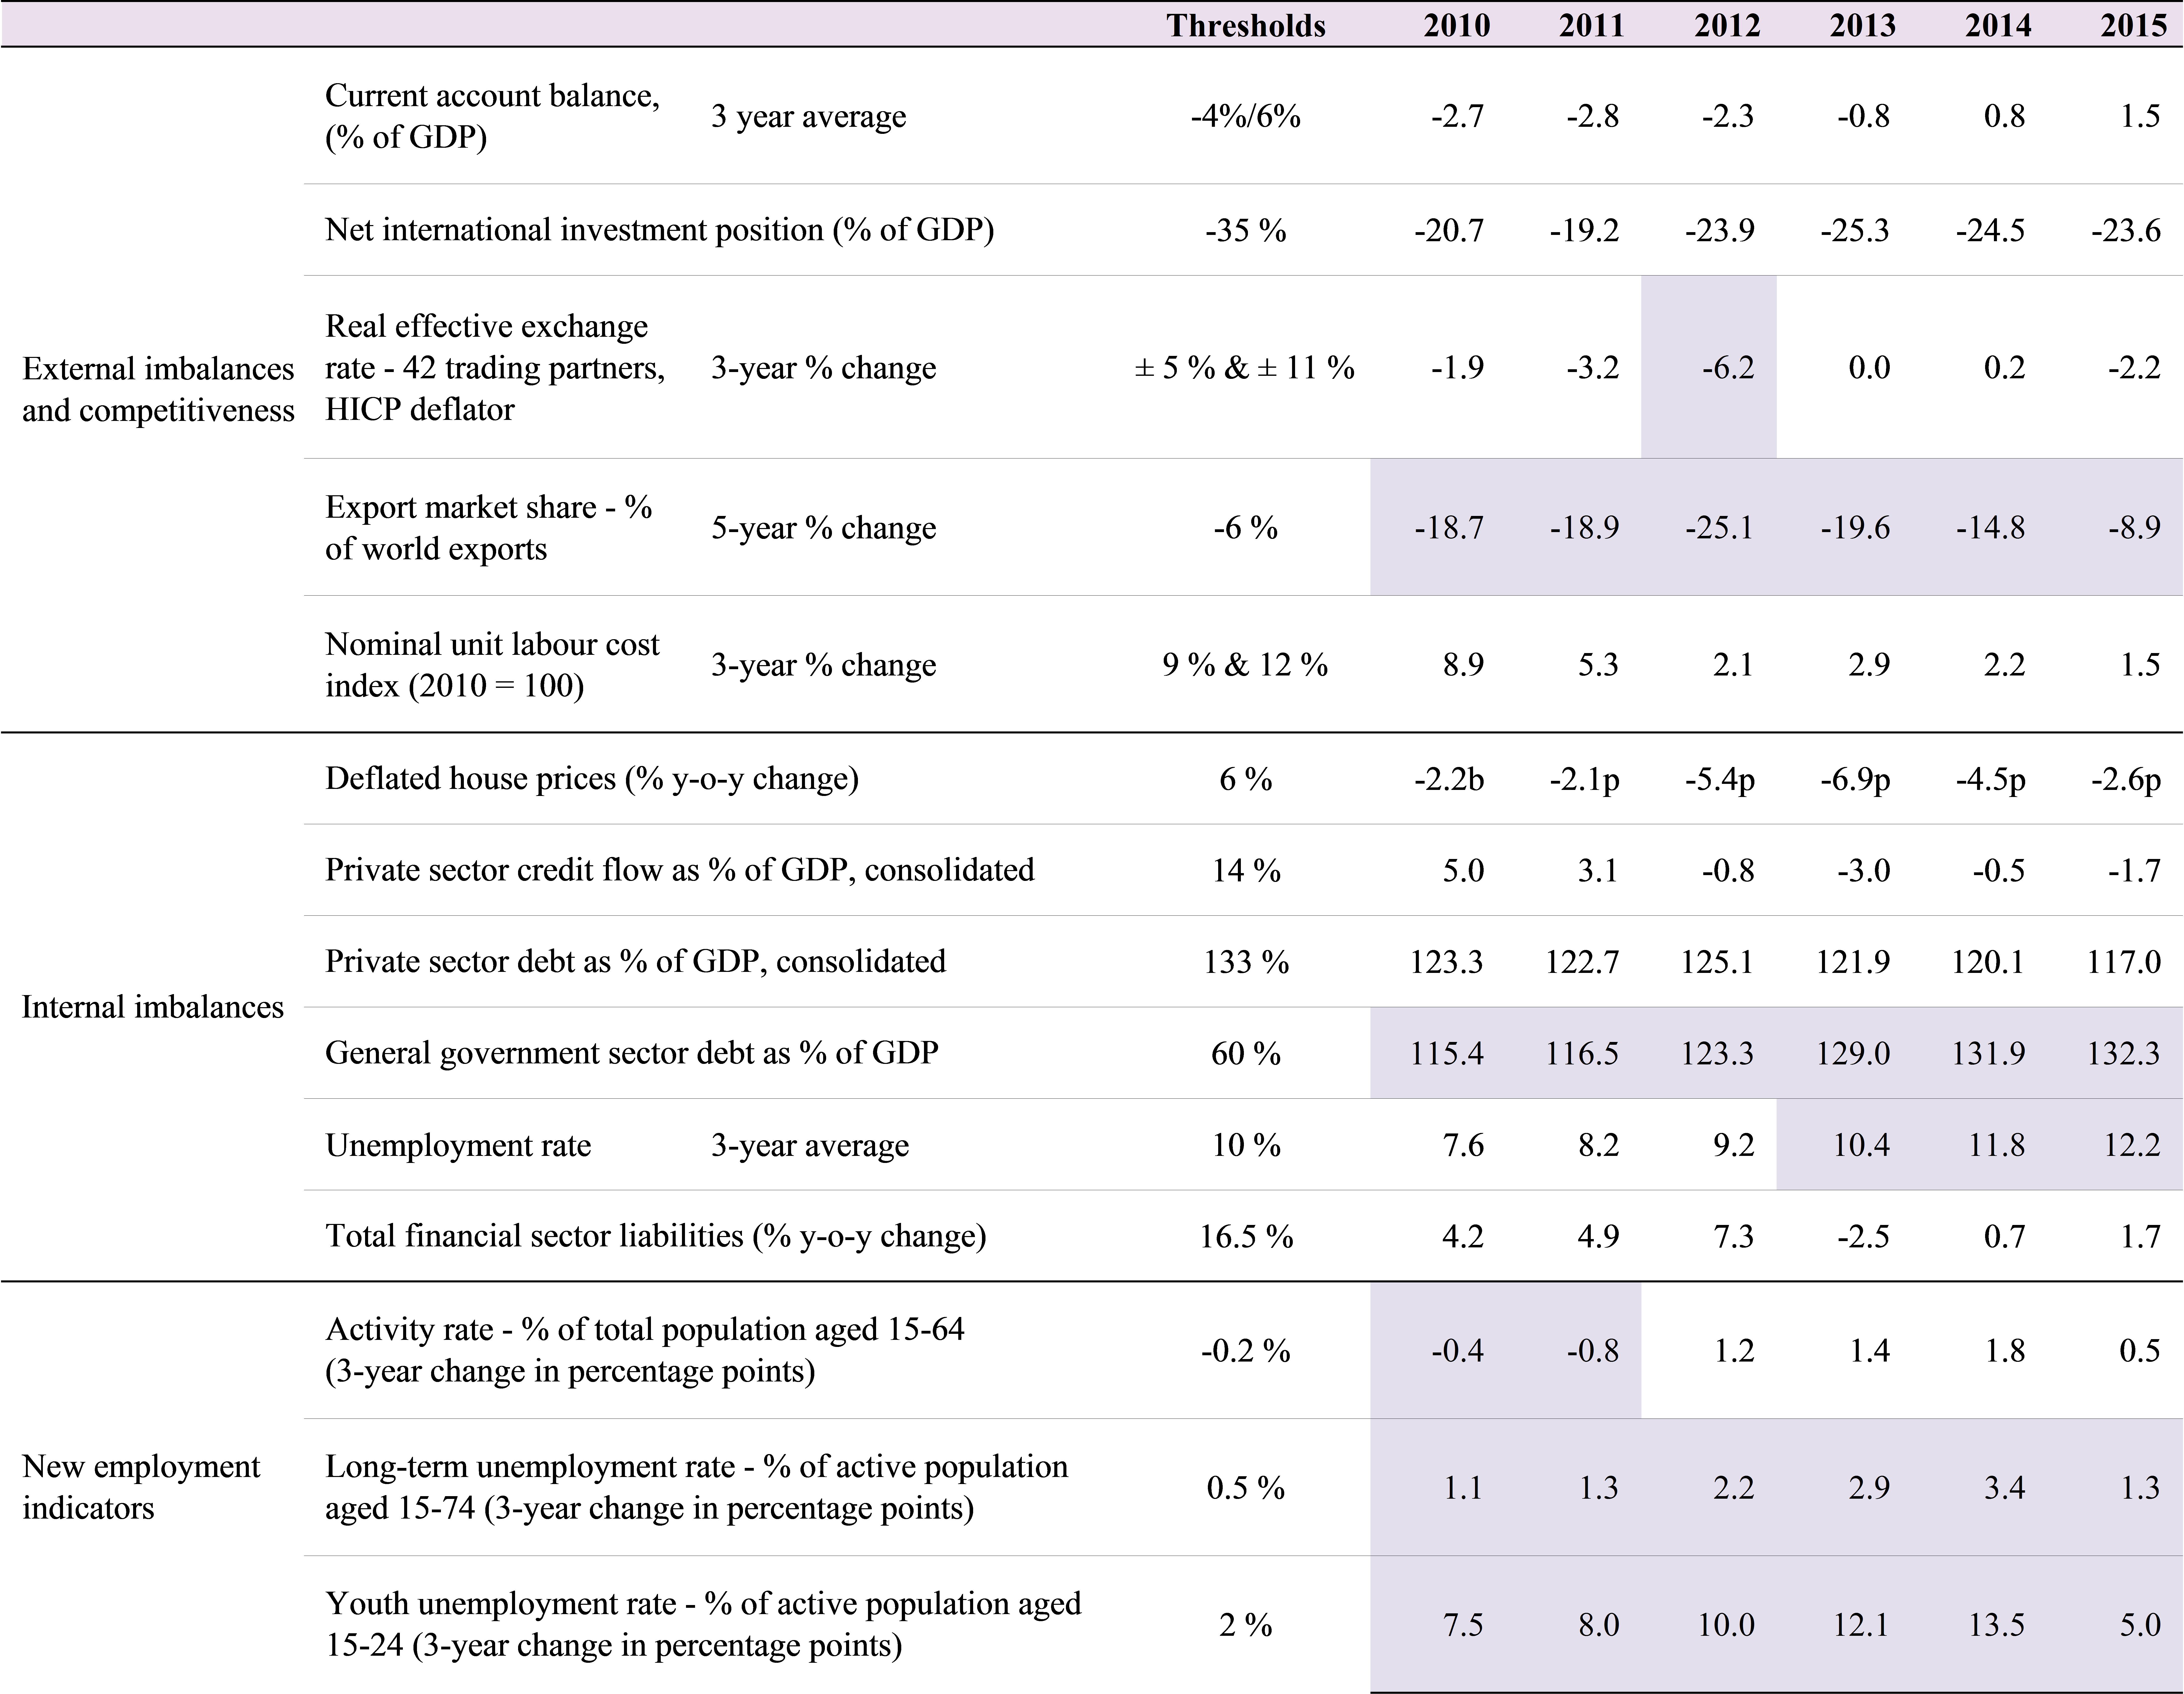
|
|
Source: European Commission, Eurostat and Directorate-General for Economic and Financial Affairs (for real effective exchange rate), and International Monetary Fund
|
|
|
|
Annex C
Standard tables
|
|
Table C.1:Financial market indicators
|
|
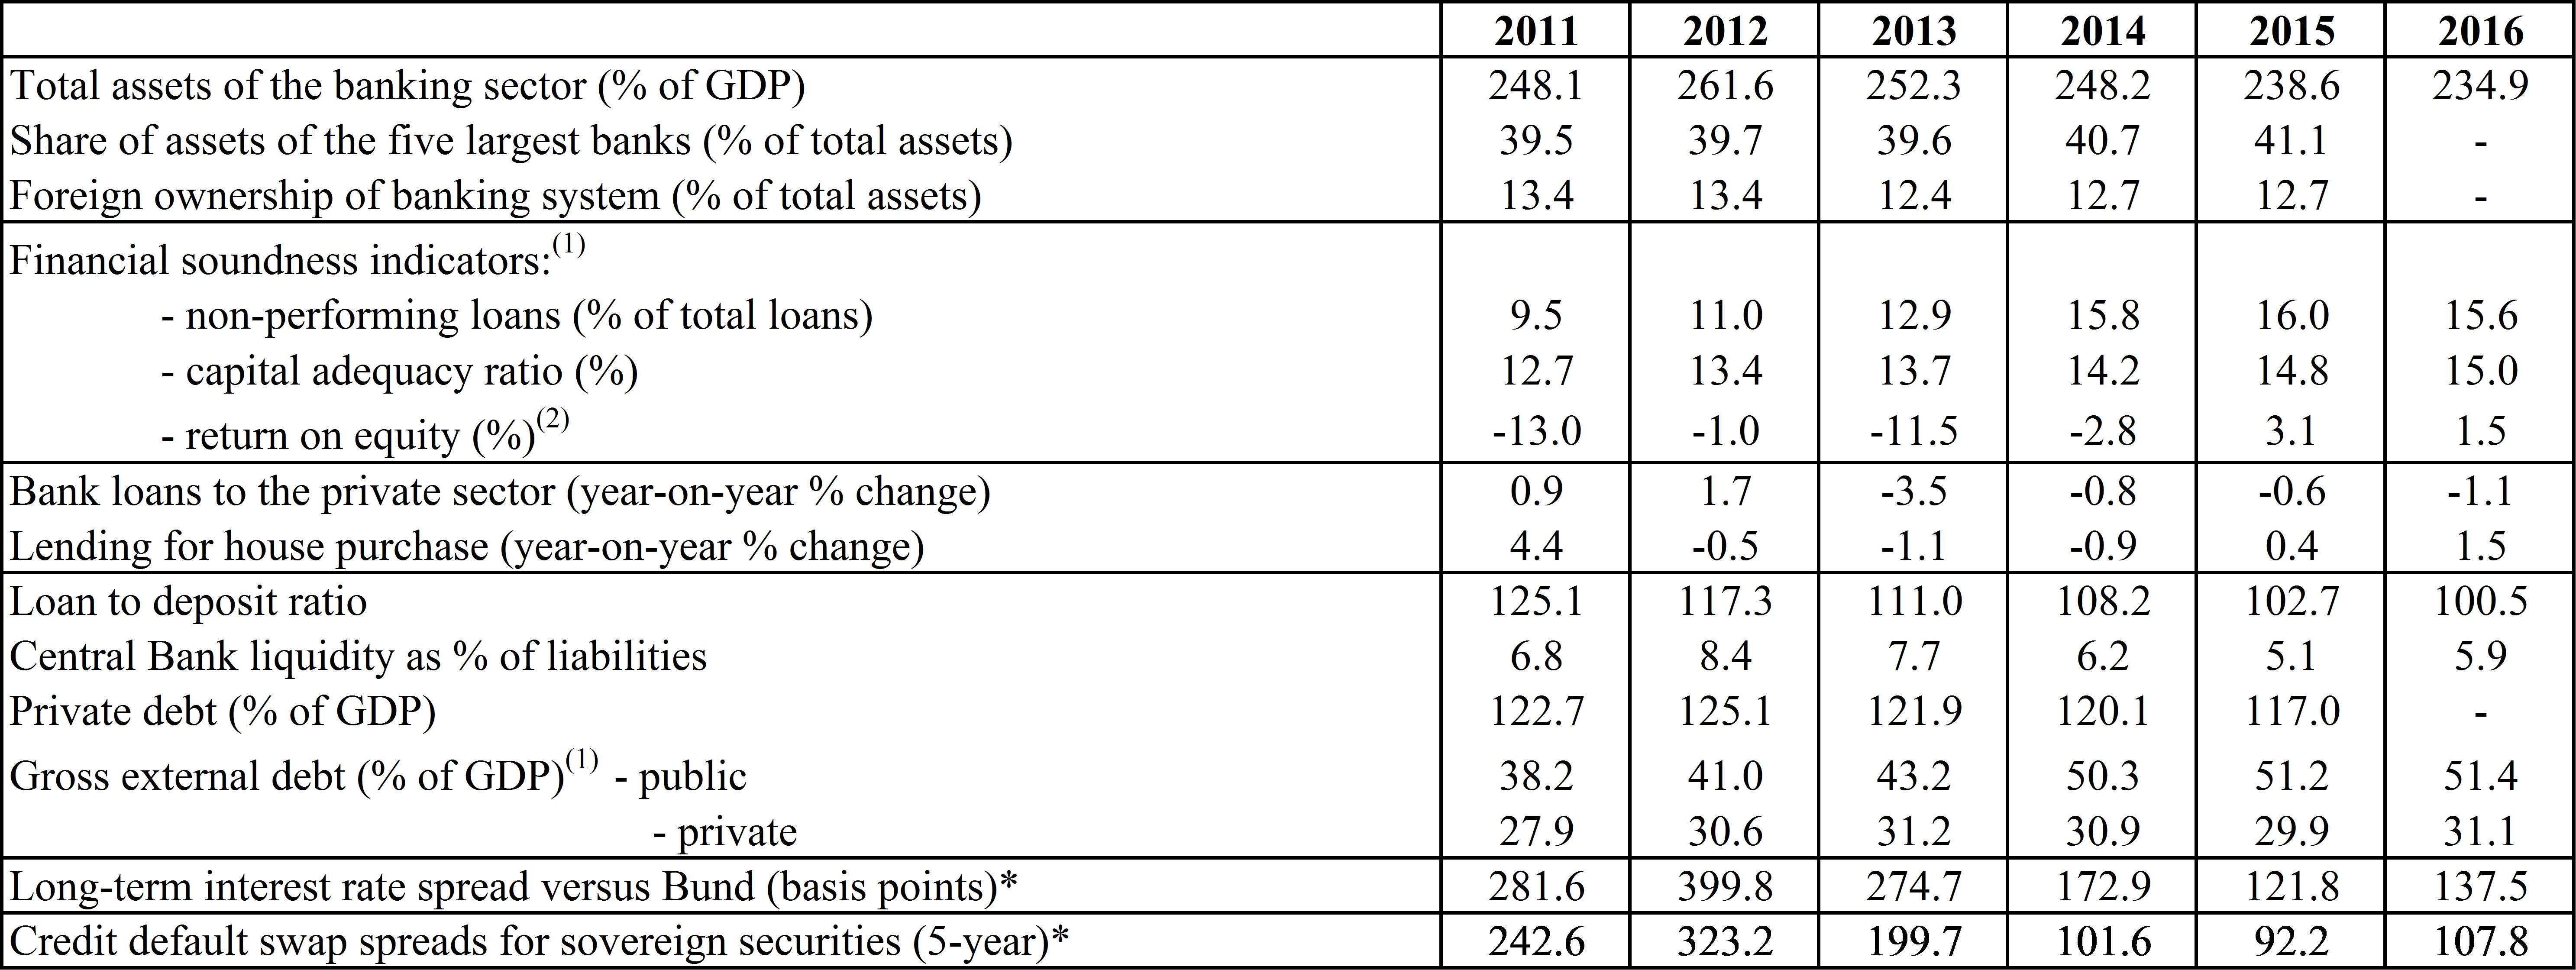
|
|
Source: European Commission (long-term interest rates); World Bank (gross external debt); Eurostat (private debt); ECB (all other indicators)
|
|
|
|
|
|
Table C.2:Labour market and social indicators
|
|
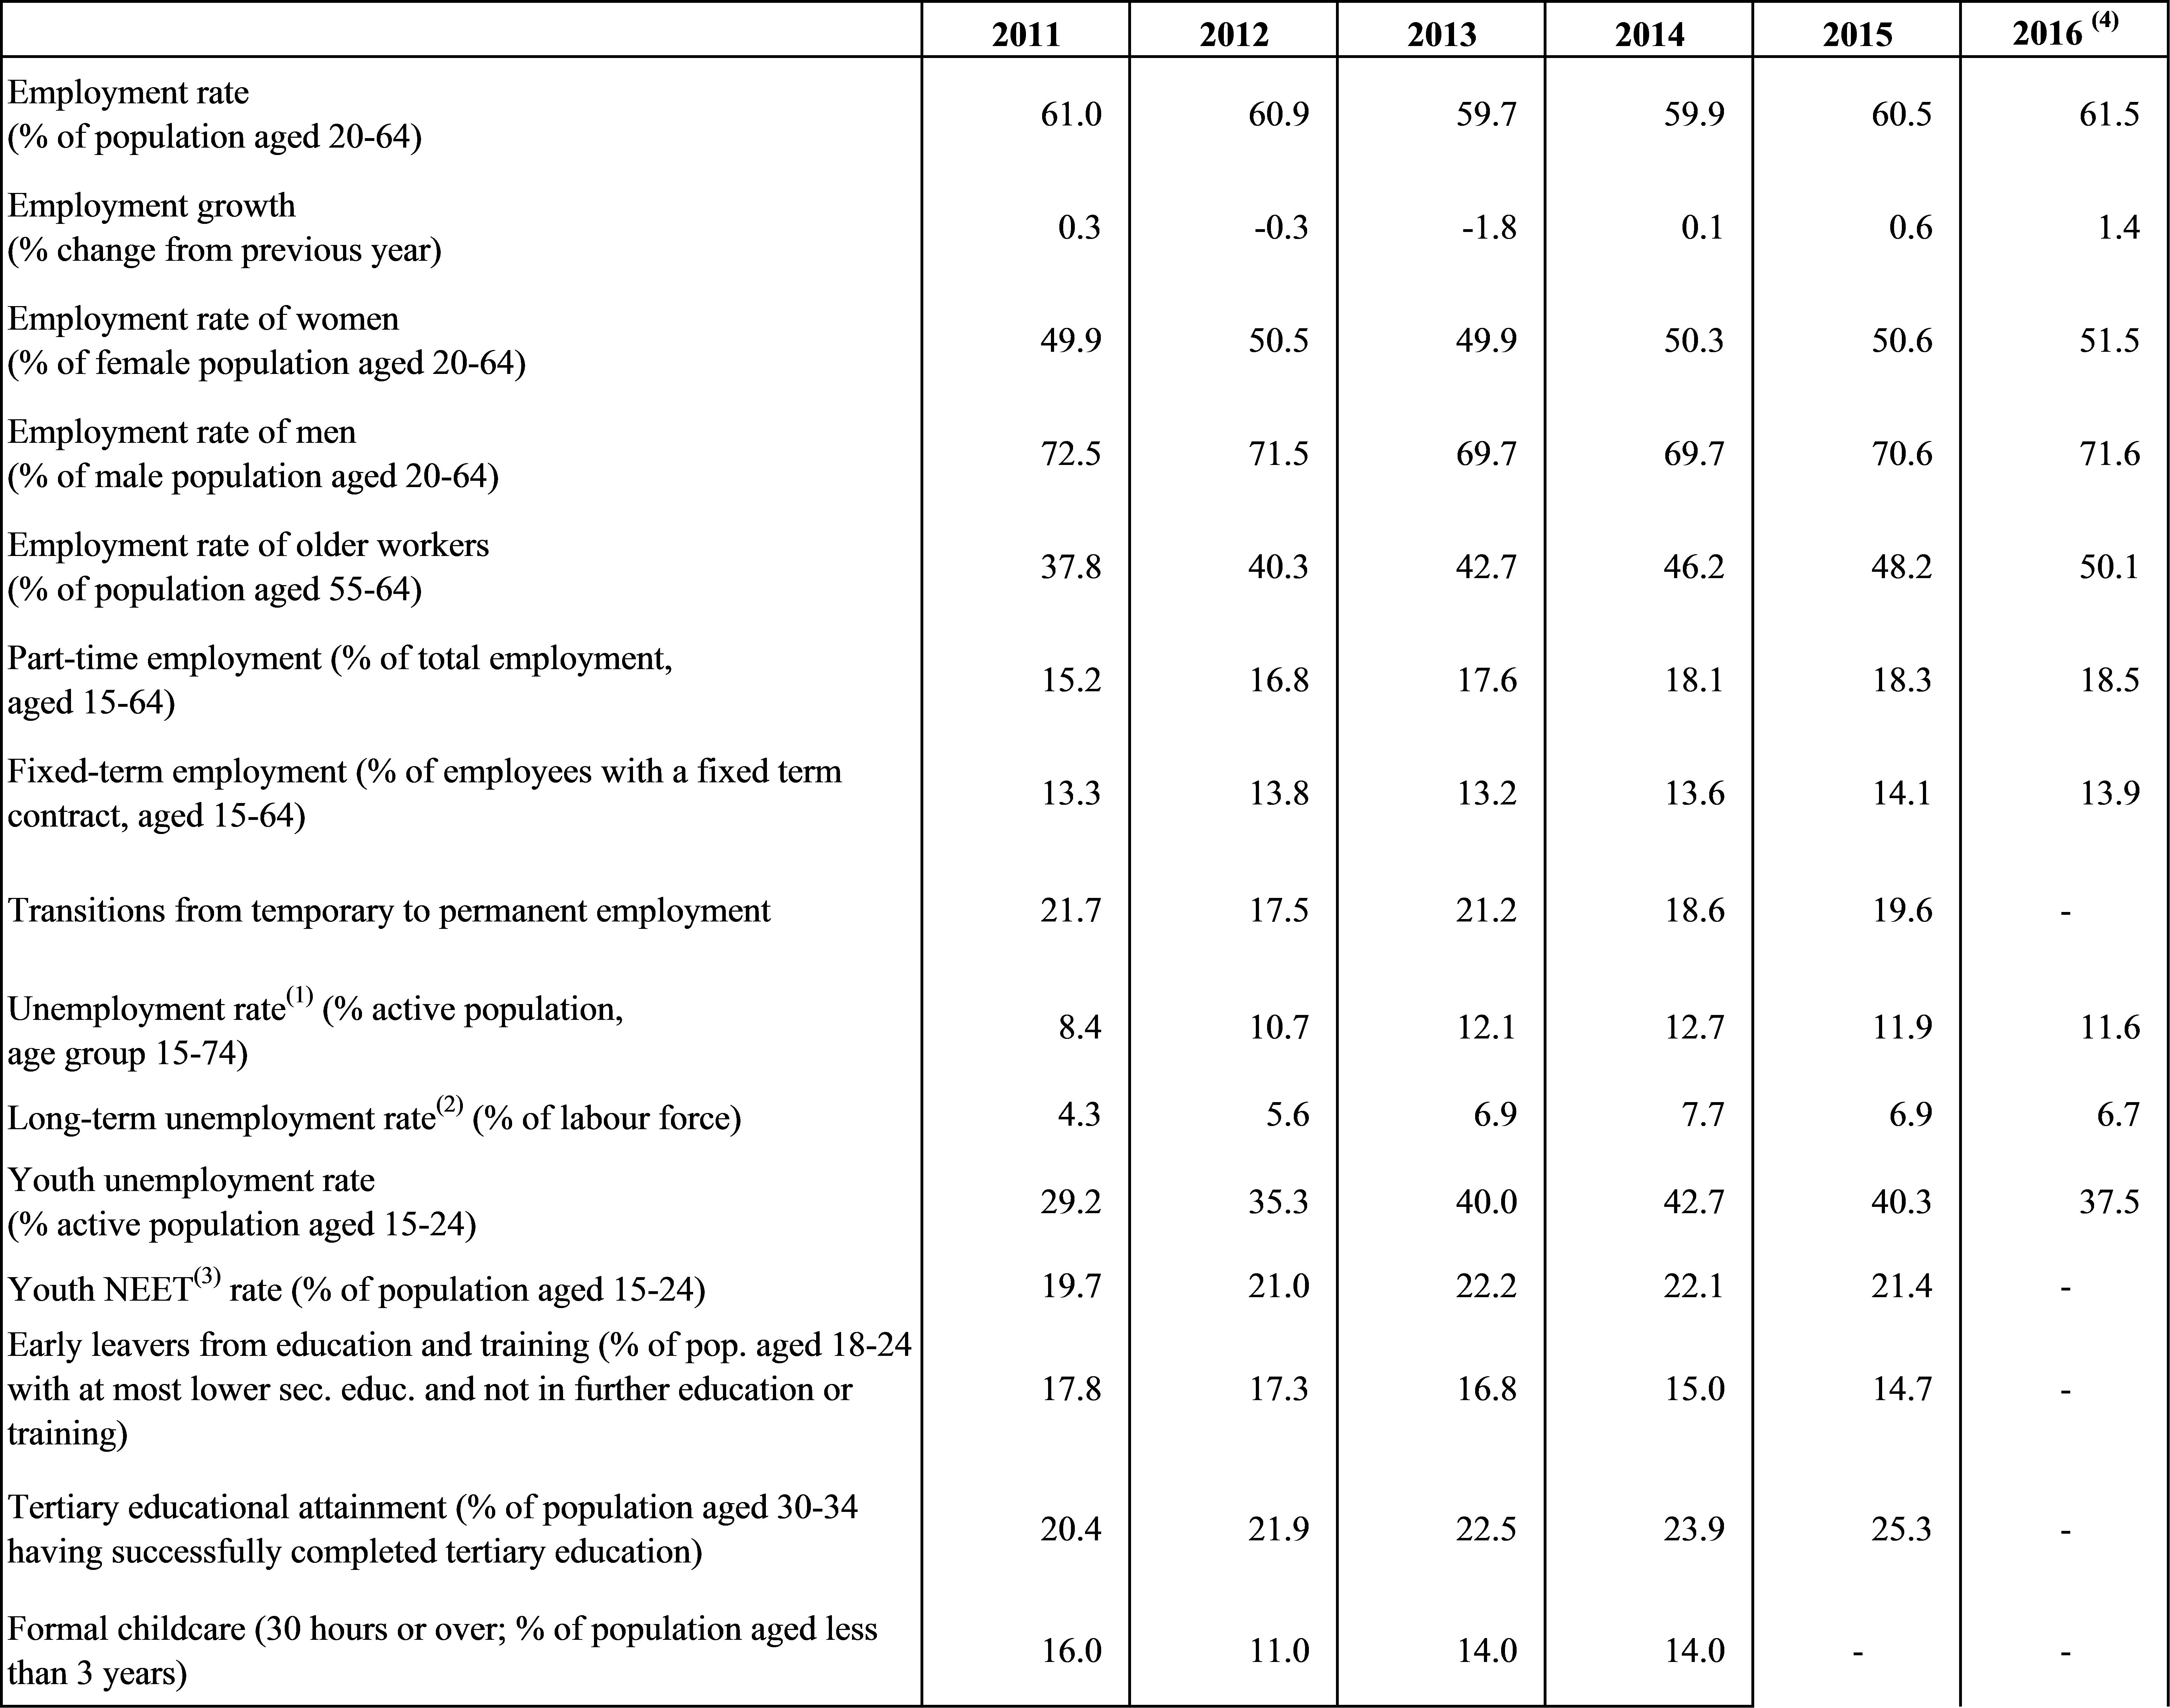
|
|
Source: European Commission (EU Labour Force Survey).
|
|
|
|
|
|
Table C.3:Labour market and social indicators (continued)
|
|
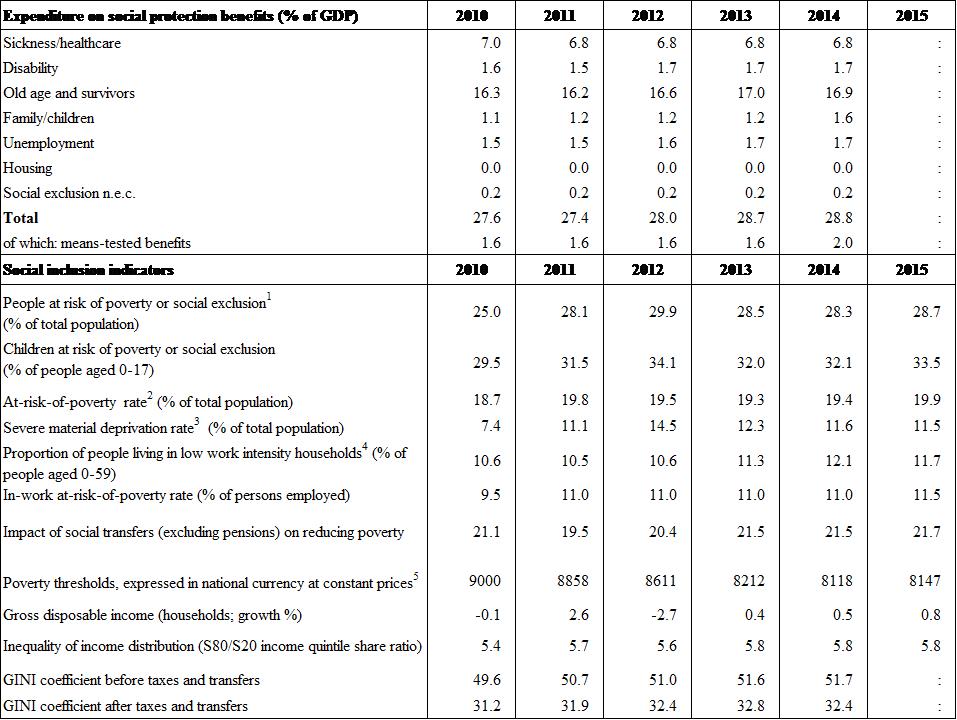
|
|
Source: ESSPROS (for expenditure for social protection benefits), EU-SILC (for social inclusion)
|
|
|
|
|
|
Table C.4:Product market performance and policy indicators
|
|
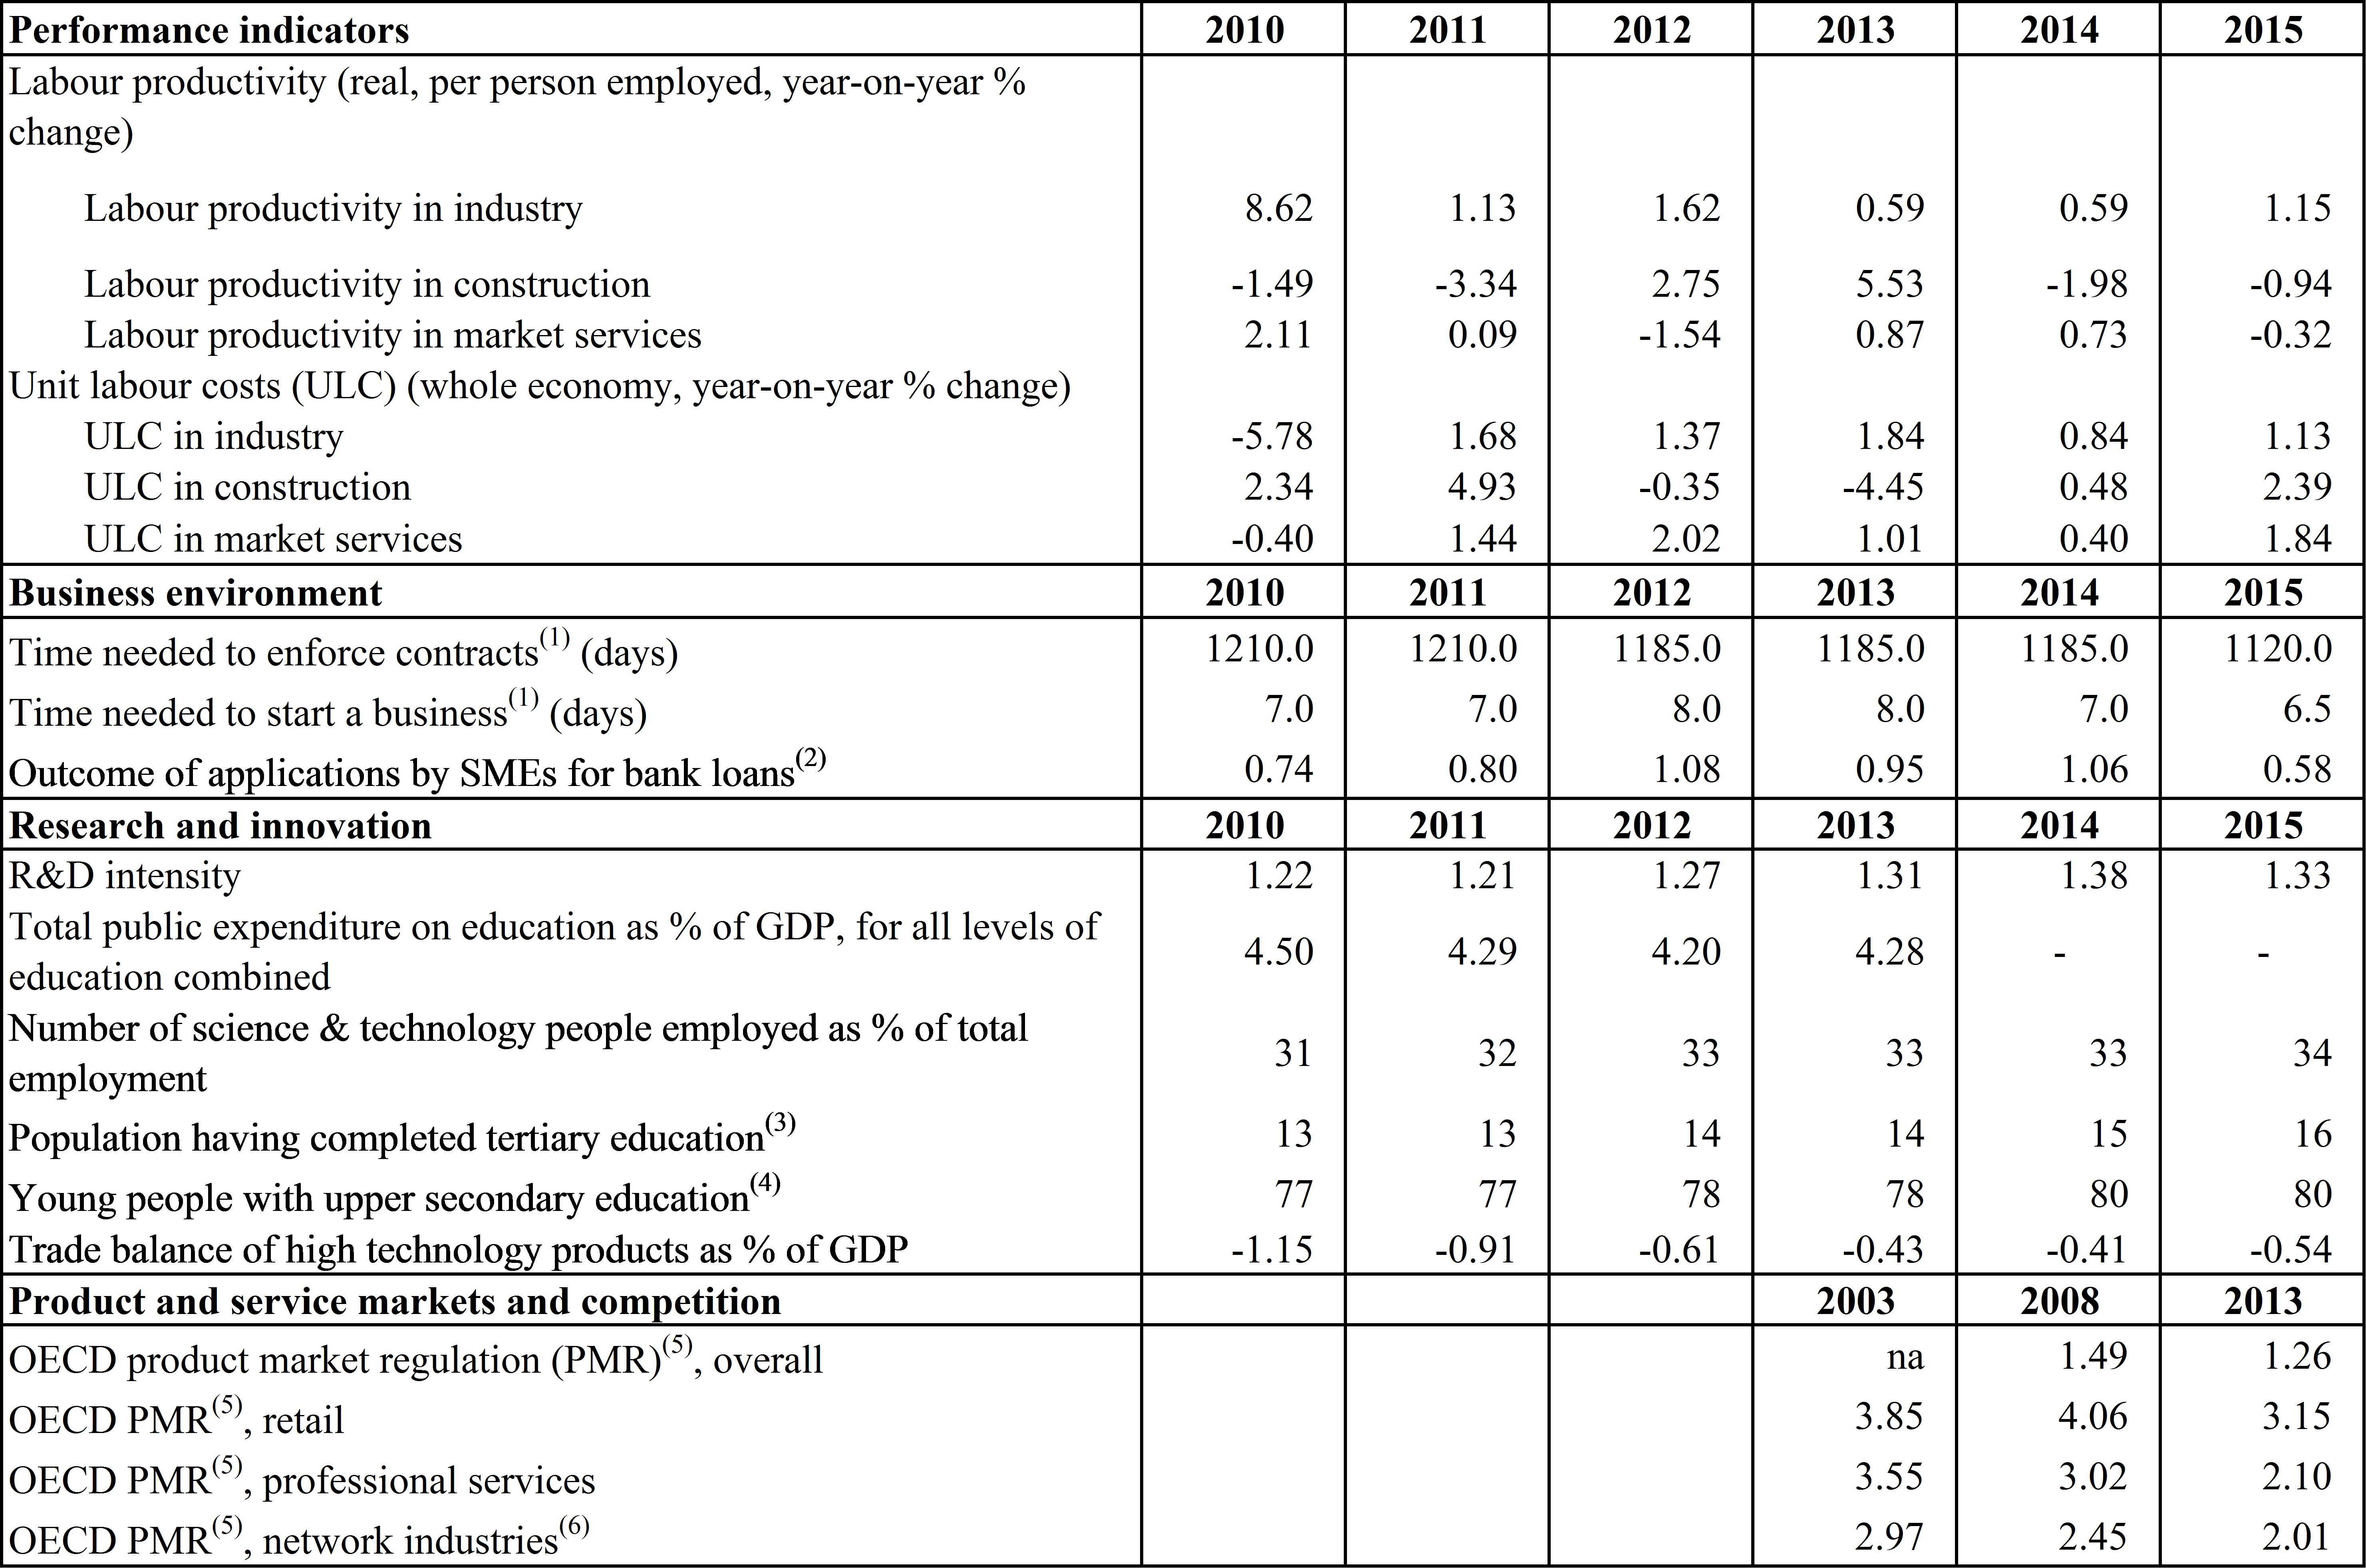
|
|
Source: European Commission; World Bank — Doing Business (for enforcing contracts and time to start a business); OECD (for the product market regulation indicators); SAFE (for outcome of SMEs' applications for bank loans).
|
|
|
|
|
|
Table C.5:Green growth
|
|
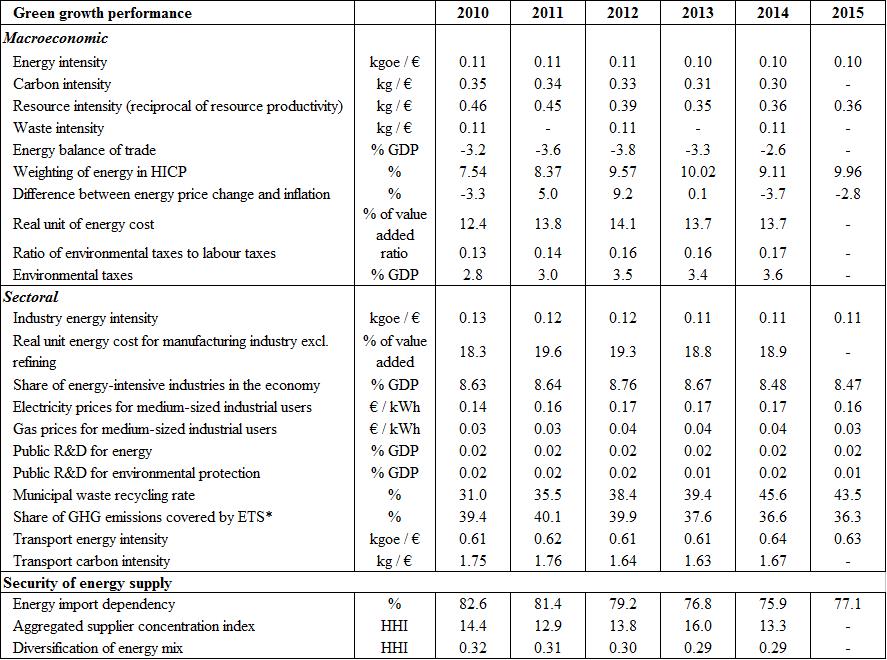
|
|
Source: European Commission (Eurostat) unless indicated otherwise
|
|
|
References
Ambrosetti Club (2016), Come Cambiare il Sistema Giudiziario e Come Contrastare la Corruzione per migliorare la Competitività dell'Italia, The European House Ambrosetti S.p.A., Milan.
ANAC, (2016a), Comunicato del Presidente del 13 luglio 2016 - La domanda degli appalti di lavori, servizi e forniture nel primo semestre 2016, Autorità Nazionale Anticorruzione, Rome.
ANAC (2016b), Nota di Aggiornamento al Piano di Riordino dell’Autorità Nazionale Anticorruzione, Autorità Nazionale Anticorruzione, Rome.
ANVUR (2016), Rapporto biennale sullo stato del sistema universitario e della ricerca 2016, Agenzia Nazionale di Valutazione del Sistema Universitario e della Ricerca, Rome.
ARAN (2015), Rapporto sui salari Dicembre 2015, Agenzia per la Rappresentanza Negoziale delle Pubbliche Amministrazioni, Rome.
Associazione Trasporti (2015), Il trasporto pubblico nelle capitali europee: un’analisi di benchmark, Associazione Trasporti, Rome.
Balgova, M. and Plekhanov A. (2016), The economic impact of reducing non-performing loans, available at
http://voxeu.org/article/economic-impact-reducing-non-performing-loans
Bank of Italy (2016a), Financial Stability Report 2/2016, Bank of Italy, Rome.
Bank of Italy (2016b), Financial Stability Report 1/2016, Bank of Italy, Rome.
Bank of Italy (2016c), ‘Incentivi e selezione nel pubblico impiego’, Questioni di Economia e Finanza, Occasional Papers 342, Bank of Italy, Rome.
Berti, K. (2013), ‘Stochastic public debt projections using the historical variance-covariance matrix approach for EU countries’, European Economy, Economic Papers 480, Publications Office of the European Union, Luxembourg.
Boitani, A., M. Nicolini and C. Scarpa (2009),
Do Competition and Ownership Matter? Evidence from Local Public Transport in Europe
, No 0911, Working Papers, SIET Società Italiana di Economia dei Trasporti e della Logistica.
Busetti, F., C. Giordano and G. Zevi (2015), Main Drivers of the Recent Decline in Italy's Non-Construction Investment, Occasional Paper 276, Bank of Italy, Rome.
Calligaris S., M. Del Gatto, F. Hassan, G.I.P. Ottaviano and F. Schivardi (2016), ‘Italy’s Productivity Conundrum. A Study on Resource Misallocation in Italy’, European Economy, Discussion Paper 030, Publications Office of the European Union, Luxembourg.
Canton, E., D. Ciriaci and I. Solera (2014), The economic impact of professional services liberalisation, European Economy, Economic Papers 533.
Centro Studi Confindustria (2016), Scenari Economici 28/2016, Confindustria, Rome.
Colonna F. and S. Marcassa (2015), Taxation and female labor supply in Italy, IZA Journal of Labour Policy.
Corte di Cassazione (2017), Relazione sull’Amministrazione della Giustizia nell’Anno 2016, Corte Suprema di Cassazione, Rome.
Corte di Cassazione (2016), Relazione sull'amministrazione della Giustizia nell'anno 2015 del Primo Presidente Giovanni Canzio, Corte Suprema di Cassazione, Rome.
Corte di Cassazione (2015a), La Cassazione Civile, Anno 2015, Corte Suprema di Cassazione, Ufficio di Statistica, Rome.
Corte di Cassazione (2015b), Relazione sull'amministrazione della Giustizia nell'anno 2014 del Primo Presidente Giorgio Santacroce, Corte Suprema di Cassazione, Rome.
Corte di Cassazione (2013), Relazione sull'amministrazione della Giustizia nell'anno 2012 del Primo Presidente Ernesto Lupo, Corte Suprema di Cassazione, Rome.
Corte di Cassazione (2012), Relazione sull'amministrazione della Giustizia nell'anno 2011 del Primo Presidente Ernesto Lupo, Corte Suprema di Cassazione, Rome.
Corte di Cassazione (2011), Relazione sull'amministrazione della Giustizia nell'anno 2010 del Primo Presidente Ernesto Lupo, Corte Suprema di Cassazione, Rome.
Davigo P. and L. Sisti (2012), Processo all'Italiana, Editori Laterza, Bari.
Eurofound (2016), The gender employment gap: Challenges and solutions, Publications Office of the European Union, Luxembourg.
European Banking Authority (2016), EBA Risk Dashboard – Data as of Q2 2016, European Banking Authority, London.
European Central Bank (2016), The Household Finance and Consumption Survey: results from the second wave, Statistics Paper Series No 18, European Central Bank, Frankfurt am Main.
European Commission (2017a), Winter Forecast 2017, Institutional Paper 048, Publications Office of the European Union, Luxembourg.
European Commission (2017b, forthcoming), EU Justice Scoreboard 2017, Publications Office of the European Union, Luxembourg.
European Commission (2017c), Digital Scoreboard 2017, available at:
https://ec.europa.eu/digital-single-market/en/digital-scoreboard
.
European Commission (2017d),
Facts and Figures about Urban Waste Water Treatment
, available at:
http://ec.europa.eu/environment/water/water-urbanwaste/implementation/factsfigures_en.htm
.
European Commission (forthcoming), Study on permitting and facilitating the preparation of TEN-T core network projects, study contracted by DG MOVE, European Commission, Brussels.
European Commission (2016a), ‘The effect of changes in tax-benefit policies on the income distribution in 2008-2015’, Social Situation Monitor, Research note 02/2015, European Commission, Brussels.
European Commission (2016b), Country Report Italy 2016 – Including an In-Depth Review on the prevention and correction of macroeconomic imbalances, SWD(2016) 81 final, European Commission, Brussels.
European Commission (2016c), Fiscal Sustainability Report 2015, Institutional Papers 18, Publications Office of the European Union, Luxembourg.
European Commission (2016d), Alert Mechanism Report 2017, SWD(2016) 354 final, European Commission, Brussels.
European Commission (2016e), European Commission tax and benefits indicator database, available at:
https://ec.europa.eu/info/business-economy-euro/indicators-statistics/economic-databases/tax-and-benefits-indicators-database_en
.
European Commission (2016f), Italy – Review of progress on policy measures relevant for the correction of macroeconomic imbalances, European Commission, Brussels.
European Commission (2016g), PISA 2015: EU performance and initial conclusions regarding education policies in Europe, European Commission, Brussels
European Commission (2016h), Education and Training Monitor 2016 — Country Analysis, Italy, Publications Office of the European Union, Luxembourg.
European Commission (2016i), National Student Fee and Support Systems in European Higher Education 2016/17, Publications Office of the European Union, Luxembourg
European Commission (2016j), EU Transport Scoreboard 2016, available at:
https://ec.europa.eu/transport/facts-fundings/scoreboard/countries/italy/investments-infrastructure_en
.
European Commission (2016k), Communication on reform recommendations for regulation in professional services, SWD(2016) 436/2 final, European Commission, Brussels.
European Commission, (2016l), 2016 Small Business Act Fact Sheet: Italy, European Commission, Brussels.
European Commission, (2016m), ‘The use of collaborative platforms’, Flash Eurobarometer, Report 438, European Commission, Brussels
European Commission (2016o), Single Market Scoreboard, available at:
http://ec.europa.eu/internal_market/scoreboard/performance_per_policy_area/public_procurement/index_en.htm
European Commission (2016p), ‘Public opinion in the European Union, First results’, Standard Eurobarometer 86 – Autumn 2016, European Commission, Brussels.
European Commission (2015a), Country Report Italy 2015 – Including an In-Depth Review on the prevention and correction of macroeconomic imbalances, SWD(2015) 31 final/2, European Commission, Brussels.
European Commission (2015b), ‘The 2015 Ageing Report: Economic and budgetary projections for the 28 EU Member States (2013-2060)’, European Economy 3/2015, Publications Office of the European Union, Luxembourg.
European Commission (2015c), Education and Training Monitor 2015 — Country Analysis, Italy, Publications Office of the European Union, Luxembourg.
European Commission (2015d), National Student Fee and Support Systems in European Higher Education 2015/16, Publications Office of the European Union, Luxembourg.
European Commission (2009), ‘The 2009 Ageing Report: Economic and budgetary projections for the EU-27 Member States (2008-2060)’, European Economy 2/2009, Office for Official Publications of the European Communities, Luxembourg.
Figari, F. and C. Fiorio (2015), Fiscal consolidation policies in the context of Italy’s two recessions, EUROMOD Working Paper Series EM7/15. Colchester: University of Essex.
Fortin A., C.-J. Giraud and E. Lalande (2015), ‘Le financement des entreprises, clé des divergences d’investissement entre Italie et Espagne’, Note de conjoncture, Insee, Paris.
GRECO (2016), Evaluation Report for Italy – fourth Evaluation Round. Corruption Prevention in Respect of Members of Parliament, Judges and Prosecutors, Group of States against Corruption, Strasbourg (
https://rm.coe.int/CoERMPublicCommonSearchServices/DisplayDCTMContent?documentId=09000016806dce15
).
HE (2015), The State of Housing in the EU 2015, Housing Europe, Brussels.
IMF (2016), Italy Art. IV Report, Selected issues, International Monetary Fund Publication Services, Washington, DC.
IMF (2015a), World Economic Outlook: Uneven Growth — Short- and Long-Term Factors, International Monetary Fund Publication Services, Washington DC.
IMF (2015b), A strategy for resolving Europe’s problem loans, International Monetary Fund Publication Services, Washington, DC.
INAPP (2016), Rapporto sulla Garanzia Giovani in Italia, Istituto Nazionale per l'Analisi delle Politiche Pubbliche, Rome.
INPS (2016), ‘Anno 2015. Lavoro accessorio’, Statistiche in breve, Istituto Nazionale per la Previdenza Sociale, Rome.
ISTAT (2014), Le Persone senza Dimora, Istituto Nazionale di Statistica, Rome.
ISTAT (2016a), Anni 2011-2014 L’economia non osservata nei conti nazionali, Istituto Nazionale di Statistica, Rome.
ISTAT (2016b), Nota trimestrale sulle tendenze dell’occupazione, III trimestre 2016, Istituto Nazionale di Statistica, Rome.
Kollmann R., B. Pataracchia , R. Raciborski., M. Ratto, W. Roeger and L. Vogel (2016), ‘The post-crisis slump in the Euro Area and the US: Evidence from an estimated three-region DSGE model’, European Economic Review, Elsevier, vol. 88(C), pages 21-41.
Lorenzani, D. and E. Reitano (2015), ‘Italy’s Spending Maze Runner: An analysis of the structure and evolution of public expenditure in Italy’, European Economy, Discussion Paper 23, Publications Office of the European Union, Luxembourg.
Ministry of Economy and Finance (2016a), Nota di Aggiornamento del Documento di Economia e Finanza 2016, Rome.
Ministry of Economy and Finance (2016b), Relazione sull'economia non osservata e sull'evasione fiscale e contributiva, Rome.
Ministry of Economy and Finance (2016c), Relazione sul Monitoraggio dello Stato del Contenzioso Tributario e sull'Attività delle Commissioni Tributarie, Anno 2015, Rome.
Ministry of Education, University and Research (2016), Diritto allo studio: Banche dati ed Analisi Statistiche, Ufficio di Statistica, available at:
http://statistica.miur.it/ustat/Statistiche/BD_DSU.asp
.
Ministry of Justice (2016), Monitoraggio della Giustizia Civile – terzo trimestre 2016, available at:
www.giustizia.it/giustizia/it/mg_1_14_1.page;jsessionid=tvpH-lXdcRXGC84KMp1T1zfN?contentId=SST1287132&previsiousPage=mg_2_9_13
Ministry of Labour (2017), Garanzia Giovani. Monitoraggio e Valutazione, available at:
http://www.garanziagiovani.gov.it/Monitoraggio/Pagine/default.aspx
.
Ministry of Labour (2016a), Super bonus occupazione, available at:
http://www.lavoro.gov.it/stampa-e-media/Comunicati/Pagine/Garanzia-Giovani-Super-Bonus-Occupazionale-trasformazione-tirocini.aspx
.
Ministry of Labour (2016b), L’utilizzo dei voucher per le prestazioni di lavoro accessorio, Ministry of Labour, Rome.
OECD (2016a), Taxing wages, OECD Publishing, Paris.
OECD (2016b), Making Integration Work: Refugees and others in need of protection, OECD Publishing, Paris.
OECD (2016c), PISA 2015 Results. Excellence and Equity in Education, OECD Publishing, Paris.
Pagliero, M. (2015), The effects of recent reforms liberalizing regulated professions in Italy, University of Turin and Carlo Alberto College, study contracted by DG GROW, European Commission, Brussels.
Pinelli D., I.P. Székely and J. Varga, ‘Exploring Italy's Growth Challenge. A Model-Based Exercise’, European Economy, Discussion Paper 041, Publications Office of the European Union, Luxembourg.
PwC (2016), The Italian NPL market – Positive vibes, available at:
www.pwc.com/it/npl
.
Salto, M. and A. Turrini (2010), ‘Comparing alternative methodologies for real exchange rate assessment’, European Economy, Economic Papers 427, Publications Office of the European Union, Luxembourg.
Steer Davies Gleave (2016), Study on economic and financial effects of the implementation of Regulation 1370/2007 on public passenger transport services, Final Report, study contracted by DG MOVE, European Commission, Brussels.
World Bank (2016a), Doing Business 2017: Equal Opportunities for All, World Bank, Washington, DC.
World Bank (2016b), Worldwide Governance Indicators, available at:
http://data.worldbank.org/data-catalog/worldwide-governance-indicators
WEF (2016), The Global Competitiveness Report 2016-2017, World Economic Forum, Geneva.