Contents
1.Introduction
1.1.Rationale
1.2.Phase 3 rules
2.Need for legislative action
2.1.Legal basis
3.Evaluation criteria
4.Measures to prevent manipulation
5.Methodology
5.1.Calculation hypothesis
6.Process for adopting allocation changes
7.Monitoring and reporting
7.1.Alternatives
7.1.1.
Reporting of all data in annex IV of the FAR
7.1.2.
Reporting of all data in annex IV of the FAR except section 3
7.1.3.
Reporting of all activity levels only
7.2.Evaluation
7.3.Preferred alternative
8.Linear vs Staged adjustments
8.1.Alternatives
8.1.1.
Alternative A. Linear approach, initial 15%
8.1.2.
Alternative B. Staged approach, initial 15%, then 10% intervals
8.1.3.
Alternative C. Staged approach, initial 15%, then 15% intervals
8.1.4.
Alternative D. Staged approach, initial 15%, then 30% intervals
8.1.5.
Alternative E. Mixed approach
8.2.Evaluation
8.2.1.
Analysis of results
8.2.2.
Conclusions
8.2.3.
Preferred alternative
8.3.Sensitivity analysis
8.3.1.
Top-Down
8.3.2.
Bottom-Up
8.3.3.
Results
8.4.Conclusions
9.Minimum threshold
9.1.Alternatives
9.1.1.
Alternative A. No minimum threshold
9.1.2.
Alternative B. Minimum threshold, 100 allowances
9.1.3.
Alternative C. Minimum threshold, 500 allowances
9.2.Evaluation
9.2.1.
Preferred alternative
10.Year of start of allocation changes
10.1.Alternatives
10.1.1.
Alternative A. Allocation changes to start in 2021
10.1.2.
Alternative B. Allocation changes to start in 2022
10.1.3.
Alternative C. Allocation changes to start in 2023
10.2.Evaluation
10.3.Preferred alternative
11.Changes in the operation of the installation
11.1.Alternatives
11.1.1.
Alternative A. No action
11.1.2.
Alternative B. General framework in the implementing act
11.1.3.
Alternative C. Detailed approach in the implementing act
11.2.Additional discussions
11.2.1.
Changes in the operation of the installation
11.2.2.
Minimum threshold
11.3.Evaluation
11.3.1.
Main alternatives
11.3.2.
Changes in the operation of the installation
11.3.1.
Minimum threshold
11.4.Preferred alternative
12.Reporting date
12.1.Alternatives
12.1.1.
Alternative A. No action
12.1.2.
Alternative B. Reporting activity levels together with emissions
12.2.Evaluation
12.3.Preferred alternative
13.New sub-installations and cessation of operation of sub-installations
14.Public consultation
14.1.Expert consultation in the CCEG
14.2.12-weeks public consultation
14.3.Feed-back Period
15.Monitoring and evaluation
Annex I – Public consultation questionnaire
Annex II – Shifting of production between installations
1.Introduction
1.1.Rationale
The EU Emissions Trading System (EU ETS) is the cornerstone of European Union's climate policy and the key tool for achieving the EU's objective of reducing greenhouse gas (GHG) emissions cost-effectively. Under the EU ETS, installations have to surrender an amount of emission allowances equal to their emissions every year. Installations active in industry sectors can receive free allocations to address the risk of carbon leakage. Carbon leakage refers to the possible increase in global greenhouse gas emissions if, because of costs related to climate policies, businesses were to transfer production to other countries where industry is not subject to comparable carbon constraints, with associated risk of increasing global emissions and negative impacts on economic growth and employment.
The EU ETS Directive has been revised
and brought in line with the 2030 climate and energy targets. The Directive establishes that free allocation will continue for the period 2021-2030 to safeguard the competitiveness of industrial installations deemed to be exposed to a significant risk of carbon leakage.
Article 10a paragraph 20 of the revised ETS Directive establishes that the level of free allocation given to installations whose operations have increased or decreased, as assessed on the basis of a rolling average of two years, by more than 15% compared to the level initially used to determine the free allocation for the relevant period shall be adjusted. The value initially used to determine the free allocation is the historical activity level (HAL) as determined using data collected in the National Implementation Measures (NIMs). The HAL level is defined as the average of the production during the years 2014 to 2018 for the NIMs to be submitted in 2019 and for the years 2019 to 2023 for the NIMs to be submitted in 2024.
The revised ETS Directive sets the main requirements and criteria for changing the free allocation to installations when the production level changes during phase 4 of the ETS from 2021 until 2030. The Directive also mentions that further provisions may be needed and allows the Commission to adopt an implementing act setting these further rules.
Paragraph 21 of Article 10a establishes that, in order to implement this provision the Commission may adopt implementing acts defining further provisions for the adjustments of the level of free allocations given to installations whose operations have increased or decreased. The implementing acts to be adopted shall ensure the effective, non-discriminatory and uniform application of the adjustments and threshold set, to avoid undue administrative burden and to prevent manipulation or abuse. Section 3 of this document presents these criteria in more detail.
In addition, recital (12) of Directive (EU) 2018/410 establishes that the Commission should be able to consider further measures to be put in place, such as the use of absolute thresholds to reduce undue administrative burden. Measures to prevent the possible manipulation of the system can also be evaluated. Procedural issues can also be analysed. Recital (12) also establishes that the adjustment of allocations should be done in a symmetrical manner to take account of relevant increases and decreases in production.
The requirements and criteria set in the ETS Directive have an impact on the technical parameters to be set in the implementing act. This document analyses different alternatives regarding a series of aspects necessary to implement the ETS Directive and evaluates them taking into consideration the parameters set in the Directive itself. The aspects evaluated include:
·Monitoring and reporting. The Free Allocation Rules (FAR) Regulation establishes requirements regarding the monitoring of activity levels. Reporting obligations on activity levels from operators to the competent authorities need to be set as this has not been set in the FAR Regulation. In addition, the reporting of additional data needed for checking the validity of the activity levels reported or data which could facilitate the submission of future national implementing measures is also discussed.
·Linear vs staged adjustments. The ETS Directive states that if the level of operations have increased or decreased by more than 15% compared to the level initially used to determine free allocation, the level of free allocation given to the installation shall be adjusted. The Directive does not give details on how the level of free allocation shall be adjusted once the 15% threshold is reached. Allocation changes can be equivalent to the change in the level of activity. Alternatively, steps can be applied which, only if reached lead to a change in the level of allocation.
·Minimum threshold. A minimum threshold below which no allocation changes would be processed can be set. Setting such a threshold could be justified for reducing the administrative burden related to the implementation of the allocation level changes rules. For installations receiving a small amount of allowances, it can be the case that an allocation change representing more than 15% of their allocation still has a low monetary value (e.g. for an installation receiving 300 allowances per year, a 15% change represents 45 allowances).
·Year of start of allocation changes. It needs to be decided in which year allocation level changes will start to apply. Changes can start to apply from the first year of phase 4 of the ETS (2021) based on activity level data from the previous two years. Alternatively, changes could start to apply from later on. The impact of the starting date for processing allocation changes is discussed.
·Changes in the operation of the installation. Most of the allocation level changes expected are related to changes on activity levels of the installation. Nevertheless, the ETS Directive refers to changes in the operation of the installation. This concept, in addition to activity level changes includes other changes, such as the energy efficiency of sub-installations using the heat or fuel benchmarks, changes in the amount of waste gases flared for non-safety reasons, changes in the heat supply, changes in the exchangeability of fuel and electricity, changes in the production of high value chemicals or changes in the production of vinyl chloride monomer can also have an impact on the level of allocation received. How to address these changes is evaluated in the document.
·Reporting date. Deadlines for the submission of activity level data need to be established. There is a need to establish how to proceed in cases where the relevant data has not been received by the competent authority until the deadline.
·New sub-installations and cessation of operation of sub-installations. In most cases, new investments are going to be treated as new installations under the ETS (greenfields). Nevertheless, there can be cases in which investments in new production lines are made in installations which are already covered by the ETS Directive, this investments correspond to new sub-installations. On the other hand, there can be cases in which one or several production lines in an installations cease operations, while others remain in the system, this corresponds to the cessation of operations of a sub-installation. The introduction of new sub-installations and the cessation of operations of sub-installations is discussed. These changes represent special cases of activity level changes which need to be addressed separately.
1.2.Phase 3 rules
In 2013-20 (‘phase 3’), changes on the level of free allocation could be triggered by the following reasons:
·The level of production of a sub-installation reduced below an initial level (“partial cessation”, reduction by 50%, 75% or 90%). If the level of production recovered afterwards, the free allocation would also be recovered;
·The capacity of the installation was significantly reduced or increased. This concept was linked to the identification of at least one physical change relating to the technical configuration or functioning of the installation.
In phase 3, allocation changes apply from the year after they have occurred, in consequence if a change in the level of allocation is triggered in year n-1 it leads to an allocation change in year n.
The system provides economic operators with long term predictability about the level of free allocation to be received in the future, as changes are only triggered when important reductions in the level of activity took place or when “physical changes” took place. On the other hand, the system has proved to be relatively rigid and not symmetric.
In the revision of the ETS Directive it was decided to adjust the level of free allocation, in a symmetrical manner, when the level of operations of an installation was increased or decreased by more than 15% from the HAL. Additional details on how to carry out these changes were left for a future implementing act.
The table below presents the main differences between phase 3 and phase 4 of the ETS regarding the adjustments to free allocation:
|
Phase 3 (2013 – 2020)
|
Phase 4 (2021 – 2030)
|
|
New entrants are defined as “greenfields” (i.e. totally new installations) and significant capacity extensions in existing installations (linked to physical changes in the installation).
|
New entrants are defined as “greenfields” only.
|
|
Allocation changes are defined based on capacity extensions or reductions or partial cessations. Partial cessations are triggered by reduction in the level of activity of 50%, 75% or 90%.
|
Allocation changes can be triggered by activity level changes of more than 15%. Other changes in the operation of the installation can also be considered.
|
|
The system is not symmetrical, it does not apply equally to increases or reductions in production (as allocation increases require physical changes).
|
The system will be symmetrical.
|
|
Changes applied in year n based on data from year n-1.
|
Changes applied in year n based on data from years n-1 and n-2 (rolling average of two years).
|
The implementing act that this analysis supports sets these additional details on how allocation changes will be processed in phase 4.
Any of the alternatives analysed will greatly increase the responsiveness of the system compared with phase 3 where only reduction in the level of free allocation where possible.
Because of the differences between the current phase 3 arrangements and the new phase 4 rules, the IT tool used by Member States to submit data to the Commission regarding changes in the activity level or in the level of operation of installations under the ETS (called Declare) will need to be updated. This process is to be led by the Commission and is expected to be resource intensive. The updated IT tools shall be ready and tested by the start of phase 4 of the ETS.
2.Need for legislative action
Article 10a of the revised ETS Directive empowers the Commission to adopt implementing acts defining further arrangements for the adjustments to free allocation due to activity level changes. It is necessary to adopt this act to prepare for phase 4 of the ETS as activity levels will vary and adjustments will need to be carried out.
In addition, more detailed rules are needed as the Directive establishes the basic principles for the adjustments but does not provide a complete set of rules providing legal certainty for operators and competent authorities on how the adjustments are to be processed.
2.1.Legal basis
The legal basis for acting at the EU level is the environmental legal basis in Article 192 of the Treaty on the Functioning of the European Union, as the principal objective of the measure is the protection of the environment through the reduction of GHGs, which is the legal basis for the ETS Directive.
Paragraph 21 of Article 10a of the revised ETS Directive empowers the Commission to adopt implementing acts defining further arrangements for the adjustments.
3.Evaluation criteria
This Staff Working Document (SWD) analyses different alternatives for further detailing the basic provisions established in the revised EU ETS Directive regarding changes in free allocation due to changes in activity level. These alternatives are analysed and are compared against the criteria set out in the ETS Directive, these criteria include:
·Effectiveness. The degree to which the different alternatives contribute to adjusting the level of free allocation when activity levels change;
·Non-discriminatory and uniform application (i.e. treating installations with the same conditions in the same way);
·Avoidance of undue administrative burden. The administrative costs for operators, competent authorities and the Commission of the different alternatives will be compared. For operators this cost consists of the cost of monitoring, reporting and verifying all parameters needed to determine the levels of activity or other operations. For competent authorities and the Commission the costs refer to the costs of processing the changes.
·Prevention of manipulation or abuse. This document analyses the possibilities which operators would have of abusing the different alternatives, when relevant, leading to an undue level of free allocation which would not reflect the real operation conditions of the installation. This can include the maintenance of artificial activity levels just for maximising the level of free allocation received or the artificial shifting of production between installations also for maximising this level of free allocation;
·Symmetry. It will be evaluated whether the different alternatives analysed are symmetrical, i.e. whether they apply in an equivalent manner to increases and decreases in activity levels or other changes in the operation of the installation.
In addition, other operational aspects should be taken into consideration when comparing the different alternatives. These aspects are not included in the criteria listed in the ETS Directive, but they are nonetheless relevant when defining how allocation level changes will take place during phase 4 of the ETS.
·Responsiveness: The different alternatives evaluated can have an impact on how fast changes in the level of activity of an installation are reflected in the level of free allocation. This document evaluates how fast the activity level changes are reflected in the level of allocation for the different alternatives discussed.
·Predictability: The predictability of the system is relevant for operators and public authorities, and it is therefore assessed.
The different alternatives for the technical parameters presented in section 1.1 will be evaluated against the criteria presented above. Not all criteria are relevant for all alternatives. The table below presents an overview of the different parameters and what criteria are relevant for their evaluation.
|
Criteria
|
Effectiveness
|
Non-discriminatory and uniform application
|
Avoidance of undue administrative burden
|
Prevention of manipulation or abuse
|
Symmetry
|
Responsiveness
|
Predictability
|
|
Monitoring and reporting
|
X
|
X
|
X
|
X
|
|
|
|
|
Linear vs staged adjustments
|
X
|
X
|
X
|
X
|
X
|
X
|
X
|
|
Minimum threshold
|
X
|
X
|
X
|
|
X
|
|
|
|
Year of start of allocation changes
|
X
|
|
X
|
|
|
X
|
X
|
|
Changes in the operation of the installation
|
X
|
X
|
X
|
X
|
X
|
|
|
|
Reporting date
|
X
|
|
X
|
|
|
|
|
|
New sub-installations and cessation of operation of sub-installations
|
X
|
X
|
|
|
|
|
|
4.Measures to prevent manipulation
The revised ETS Directive establishes that to prevent manipulation or abuse of the adjustments to the allocation, the Commission may adopt implementing acts which define further arrangements to the adjustments.
The implementing Regulation will foresee the mandatory reporting of activity levels. Additional data could be requested by competent authorities (for instance data which would need to be submitted in future National Implementation Measures). In order to ensure high quality and reliability of data reported, third party verification of activity levels in accordance with harmonised verification rules needs to be required. In addition, in cases where these activity levels might lead to changes in the level of allocation they might be reviewed by the Competent Authorities and the Commission.
In this respect the verification system put in place for the purposes of emissions reporting (for compliance) and baseline data reporting (for free allocation) as established by Commission Implementing Regulation (EU) 2018/2067 would be appropriate to apply to the verification of annual activity level reports also.
This measure ensures that operators cannot manipulate their production levels or abuse the adjustments to the allocation by reporting values which are not in line with reality.
In addition, the possible impact of the different alternatives evaluated regarding the potential incentives which operators would have to manipulate the system is also analysed in each specific chapter.
5.Methodology
5.1.Calculation hypothesis
To compare the different alternatives regarding the use of linear or staged adjustments and the use of a minimum threshold, it is necessary to simulate different scenarios. The impact can be evaluated in terms of the number of changes to be processed per year and in terms of the total level of free allocation granted to installations.
Ideally, the data used for making this simulations should be activity level data as recent as possible. Nevertheless, in phase 3, annual activity level data was not reported by installations in all Member States, so this data is not available. The best data available which can be used for carrying out this simulations is emissions data from phase 3.
In this SWD, numerical results regarding the expected impact in terms of number of changes to be processed per year and allocation levels are presented for the decisions for which this data is relevant (use of a linear or staged approach and establishment of a minimum threshold). In order to make these calculations, several assumptions are made, as presented below.
In some cases, Member States have requested operators to include a procedure in accordance with Article 12(3) of the Monitoring and Reporting Regulation to report annual activity data together with their annual emissions report. These data reside at MS level and are not available for this analysis. One Member State has carried out calculations based on activity levels at sub-installation level. According to our analysis, the comparison of the data provided by that Member State with the data analysed by the Commission leads to similar overall conclusions.
Emissions data is available at installation level and can function as a proxy for activity data: if an installation’s activity goes up or down by X% compared to Historical Activity Level (‘HAL’), it is assumed that the emissions will go up or down by about X% as well.
The basic methodology used takes 2013 emissions as a proxy for the HAL. 2014, 2015, 2016 and 2017 emissions are used to calculate a rolling average, and are compared to the HAL.
The objective of this assessment is to simulate what would have happened for each of the alternatives considered in this paper if they had been applied in phase 3.
This methodology is only applicable for installations that satisfy all of the following three criteria:
·The installation received free allocation in 2013;
·The installation had more than 0 emissions in 2013;
·Emission data (even if 0 in any of the other years) are available for all years (2013 to 2017).
Installations failing at least one of these criteria were excluded from the calculations. Additionally, 135 installations that were closed were excluded, in order to prevent an over-estimation of the number of installations with strong emissions reductions. 8,512 installations remained after these exclusions and have been analysed. For comparison, currently there are 8,916 installations with free allocation, 319 of which are phase 3 greenfields. The coverage of the analysis is therefore around 95% of the installations that have an allocation under Article 10a of the EU ETS.
It shall be noted that the activity level changes will be addressed at sub-installation level, though at present no emission data nor activity data is available at sub-installation level, and the installation is used as a proxy for the sub-installation changes.
Using emissions as a proxy for the evolution in production is considered more reliable for industrial installations than for installations generating electricity receiving free allocation due to their heat production. In this type of installations, free allocation represents a lower percentage of their total emissions so they might be less representative. On the other hand, emission data is the only proxy available. Furthermore, the heat generated has initially originated from the combustion of fuels. A relationship between the heat generated and the emissions exist via the heat generation efficiency of the plant.
There are operation changes other than activity level changes which can have an impact on emissions, for instance changes in the share of heat import or export, type of fuels used, biomass use, electricity consumption replacing fuels and efficiency improvements. The impact of these actions cannot be quantified with the available data. While changes in emissions are not in all cases fully correlated to activity level changes, emission data is still considered a reasonable (and best available) proxy for activity level data.
6.Process for adopting allocation changes
The Member States will submit the necessary data of all installations that apply for free allocation to the Commission for the calculation of the benchmark values and the initial allocation. A Decision with the free allocation per installation under the ETS for the relevant 5-year allocation period will be adopted for setting the initial level of free allocation per installation. This Decision will be adopted once the benchmark values used for determining the level of free allocation are determined based on the data received from Member States and before the start of phase 4 of the ETS.
Installations will need to monitor their activity levels and report them annually to the Competent Authorities. Each year, the annual activity levels will be compared to the initial ones and it will be determined if an allocation change needs to be made based on the rules set out in the EU ETS Directive and further specified in the implementing act. If no change is needed, the installation will receive allocation in accordance with the National Allocation Table adopted for the relevant allocation period (2021-2025 or 2026-2030). In cases where, after an evaluation of the activity levels reported, the Competent Authority considers that a change is needed, they will notify it to the European Commission which would in turn evaluate the proposed change. If the proposed change is confirmed by the Commission, a Decision will be adopted modifying the National Allocation Table with regard to the level of free allocation for the installation in question.
The process does not differ substantially from the process followed in phase 3 for partial cessations and for recoveries after partial cessation, the main difference for operators is the need to monitor and report activity levels annually.
7.Monitoring and reporting
The revised ETS Directive has established that allocation changes will depend on changes in operations. Harmonised rules are needed to ensure equal treatment of all installations, so in consequence, to operationalise ‘changes in operations’, activity levels at sub-installation level will need to be monitored, verified and reported. Allocation is calculated at sub-installation level, which then is summed up for determining the allocation for an installation. Activity level data at sub-installation level is therefore necessary.
Concerning monitoring, the Free Allocation Rules Regulation already requires the monitoring of activity levels, based on a Monitoring Methodology Plan (MMP) to be approved by Competent Authorities at latest by end of 2020. These provisions are sufficient for the purpose of monitoring activity levels and their changes.
However, the Free Allocation Rule Regulation requires reporting of data only every five years. Therefore, additional mandatory reporting obligations, based on the required monitoring of activity levels, need to be put in place and should be introduced by the implementing act on allocation adjustments under discussion. This is necessary because the revision of the level of allocation needs to be done on an annual basis.
The issue at hand is the scope of data to be annually reported. In order to process changes in the level of free allocation due to activity level changes, in principle only data on activity levels is necessary. Nevertheless, it might be necessary to request additional data for checking the correctness of the activity level data reported. In this respect it should be noted that the reporting of all data in annex IV of the FAR for the years 2019-2023 is required for the following baseline data report, i.e. by 30 May 2024. Data in Annex IV of the FAR is requested once in 5 years and is used for determining the initial levels of free allocation per installation and for revising the benchmark values used for this determination.
The provisions on verification and accreditation have to be included in the 2019 Accreditation and Verification Regulation (AVR) revision. The activity levels and other parameters to be submitted to the competent authorities will need to be verified by a third party in order to ensure the quality of the data received. The AVR deals with the relevant provisions on verification of emissions data. It does seem logical not to duplicate the provisions of this Regulation and include the necessary requirements on verification of activity level data in it. In addition, the AVR is currently being reviewed and the modifications to be made could be included in such a review.
7.1.Alternatives
7.1.1.Reporting of all data in annex IV of the FAR
It could be requested that all installations annually report verified data for all data items listed in Annex IV of the Free Allocation Rules.
7.1.2.Reporting of all data in annex IV of the FAR except section 3
It could be requested that all installations annually report verified data for all data items listed in Annex IV of the Free Allocation Rules, except section 3, which is only used for the update of benchmark values.
7.1.3.Reporting of all activity levels only
It could be requested that all installations annually report only verified activity levels at sub-installation level. For specific sub-installation types this would involve reporting of some additional data, e.g. a heat balance for sub-installations associated with the heat benchmark, or production data aggregated by PRODCOM code which would be needed to evaluate possible changes in the operation of the installation or to carry out plausibility checks.
The alternatives can be summarised as follows:
|
Data to be submitted
|
Alternative 1
|
Alternative 2
|
Alternative 3
|
|
General installation data (Annex IV, section 1)
|
Included
|
Included
|
Not included
|
|
Data on emissions and energy balance (Annex IV, section 2)
|
Included
|
Included
|
Not included
|
|
Data on activity levels (Annex IV, section 2)
|
Included
|
Included
|
Included
|
|
Data for benchmark updates (Annex IV, section 3)
|
Included
|
Not included
|
Not included
|
Additionally to the alternatives above, installations could be required to report the group to which they belong (i.e. information on the ownership of the installation). This reporting could be used for reducing the risk of manipulation or abuse of the system. It the past, it has been mentioned that production could be shifted between installations belonging to the same group in order to maximise their level of allocation. Nevertheless, with the current set of data available it is very difficult to evaluate whether such behaviour has taken place. Having data on the “group” to which the installation belongs could ease this analysis. This possible behaviour is analysed in Annex 2. Nevertheless, having data regarding the group of each installations could facilitate the analysis in the future.
Additionally, installations could be requested to report whether any sub-installation has ceased to operate.
Finally, specific information requirements under sections 1 and 2 of Annex IV of the FAR could be excluded from the mandatory reporting requirements in order to limit the administrative burden for operators while maintaining the advantages of extensive reporting on the parameters which need to be evaluated every year.
7.2.Evaluation
A reliable monitoring and reporting system for activity level data is necessary for ensuring an effective implementation of the system.
The mandatory reporting of data for activity level changes is expected to increase the administrative burden for installations, the more data is to be reported annually, the higher the burden. On the other hand, in 2024 new national implementing measures (NIMs) will need to be reported to the Commission, covering baseline data for the years 2019 to 2023. Since all data listed in Annex IV of the FAR is needed during the NIMs exercise, a mandatory reporting of all data in Annex IV of the FAR would make the subsequent NIM exercises lighter. During the allocation period itself, the least administrative effort would follow from requiring the reporting of only activity levels per sub-installation and minimum underlying information.
Reliable data is needed in order to avoid manipulation or abuse of the system. Additional data on top of activity levels is needed in order to perform plausibility checks on these activity levels.
In cases where energy efficiency changes are claimed, installations would need to report further necessary data in any case, so the Competent Authority would be able to evaluate the claims made by operators.
In addition, to prevent manipulation or abuse of the system, in cases where installations do not report their activity the competent authorities would not calculate the activity level changes. Alternatively, competent authorities could make a conservative estimate of the value of any parameter and issue allowances even if activity levels have not been reported, but in such case they should have the possibility to recover allowances granted in excess once possible allocation reductions have been processed. Otherwise, installations with reduced activity might not report their activity in order to keep the initial, higher allocation. This reasoning applies also to the reporting on the cessation of operations of sub-installations, which needs to be mandatory in order to ensure that the rules on allocation for these sub-installations are properly implemented.
7.3.Preferred alternative
In the case where only activity level changes would trigger allocation changes, i.e. the implementing act does not contain provisions on changes in operations related to energy efficiency improvements, or it maintained at a voluntary basis, alternative 3 would be the alternative that provides the necessary information to adjust the allocation annually.
However, given that all data will need to be verified and reported for the next baseline data collection in 2024, alternative 2 is preferred as it offers flexibility to initiate and assess allocation adjustments. Alternative 1 goes beyond the needs for allocation adjustments and assessment of energy efficiency measures. It could be left as optional for Member States to decide to ask for the full data sets on an annual basis. Requesting this additional data, which will be needed in any case in 2024 during the next NIMs exercise, therefore reduces the complexity of this next exercise.
Alternative 2 would be beneficial in terms of avoiding mismatches of data between annual activity level reports and the reports of NIMs baseline data every 5 years. This is because the additional data required by Annex IV of the FAR Regulation helps the verifier and the competent authority to corroborate the activity levels. In case the CA does not receive the full data every year, there is a risk that the detailed checks carried out on the NIMs baseline data reveal mistakes in the earlier reported annual data. This means that retrospective allocation corrections might become necessary which could have been avoided if the CA had received more complete data annually. Thereby such cases would add to the total administrative burden observed. Some information requirements under sections 1 and 2 of Annex IV of the FAR could be excluded from the mandatory reporting, as they are only relevant during the NIMs exercise. This includes, for instance information on exclusions under Articles 27 and 27a of the ETS Directive or information on emissions at installation and sub-installation level.
All alternatives are effective, non-discriminatory as they would be applied uniformly to all installations receiving free allocation under the ETS. In addition, alternative 2 avoids undue administrative burden, as it strikes the right balance between the data to be collected and reported and the cost of doing this. Alternatives 1 and 2 also prevent the manipulation or abuse of the system as the data reported on top of activity levels will help competent authorities to check the plausibility of the activity levels changes claimed.
Asking for data on the group to which the installation belongs could allow to carry out analysis regarding the possible shift of production between installations with the aim to optimise the level of free allocation. It is proposed to define the concept of “group” by making a reference to Directive 2013/34/EU. It is proposed to ask also for this information in the activity level reports.
Asking for information on cessation of operations at sub-installation level is also preferred for ensuring that the rules for these changes can be implemented.
8.Linear vs Staged adjustments
The provisions of the Directive (EU) 2018/410 specify when adjustments to free allocation should be triggered (changes by more than 15% in activity level compared to HAL). It does not state how to adjust free allocation in return. Therefore, similar to phase 3, where the Benchmarking Decision laid down rules for capacity changes and partial cessations, the implementing act needs to set a methodology for this purpose. There are two main approaches:
·A “linear” approach in which any activity level change above 15% triggers a change in the level of free allocation exactly equal to the change in activity level. For example, an activity level change of 17% would lead to an allocation change of 17%.
·A “staged” approach in which activity level changes above a certain threshold trigger changes of X% on the level of free allocation, where X% equals for all changes within an interval. For example, an interval size of 10% would mean thresholds at ±15%, ±25%, ±35%, etc. If the rolling average is 17% or 24% of the HAL (upwards or downwards), the allocation would be adjusted by 15%, a rolling average of 36% would lead to a 35% adjustment, etc. Graphically this could be represented by different "steps", as shown in the graph below. The size of the possible steps is discussed in different sub-alternatives.
The revised ETS Directive is clear regarding the baseline data to be used for determining when activity level changes shall lead to allocation level changes. Article 10a, paragraph 20 states:
The level of free allocations given to installations whose operations have increased or decreased, as assessed on the basis of a rolling average of two years, by more than 15 % compared to the level initially used to determine the free allocation for the relevant period referred to in Article 11(1) shall, as appropriate, be adjusted. Such adjustments shall be carried out with allowances from, or by adding allowances to, the amount of allowances set aside in accordance with paragraph 7 of this Article.
It follows that the level initially used to determine the free allocation for the relevant period is not modified and is maintained during the 5 years of each allocation period.
In addition, all alternatives evaluated are symmetrical, as foreseen in Directive 2018/410, which in recital (12) emphasises that:
The level of free allocation for installations should be better aligned with their actual production levels. To that end, allocations should be periodically adjusted in a symmetrical manner to take account of relevant increases and decreases in production. Data used in this context should be complete, consistent, independently verified and should present the same high level of accuracy and quality as the data used to determine the free allocation. In order to prevent manipulation or abuse of the system for adjustments to allocation and to avoid any undue administrative burden, considering the deadline that applies to the notification of changes in production, and bearing in mind the need to ensure that the changes to the allocations are carried out in an effective, non-discriminatory and uniform manner, the relevant threshold should be set at 15 % and be assessed on the basis of a rolling average of two years. The Commission should be able to consider further measures to be put in place, such as the use of absolute thresholds regarding the changes to allocations, or with respect to the deadline that applies to the notification of changes in production.
This defines that if there is a threshold of a percentage reduction compared to the HAL, there needs to also be a similar percentage threshold for increase compared to the HAL, and vice versa.
All threshold alternatives have been “translated” into calculation rules: intervals of activity level changes based on the rolling average (Activity Level Rolling Average – ALRA) are compared with the historical activity level (HAL). Depending on the value of the quotient between ALRA and HAL, the corresponding Adjustment Factor (AF) is assigned. This AF is then multiplied with the uncorrected allocation to calculate the corrected allocation. In all cases, the resulting allocation will be rounded to the nearest emission allowance.
8.1.Alternatives
8.1.1.Alternative A. Linear approach, initial 15%
For changes in activity level (ALRA/HAL) of more than 15%, the allocation should be adjusted proportionally to the actual change, i.e. an increase/decrease of activity by 19% compared to the HAL would lead to an adjustment of 19% of allocation.
8.1.2.Alternative B. Staged approach, initial 15%, then 10% intervals
An allocation adjustment should be applied for a 15% increase or decrease in activity level (ALRA/HAL). Larger allocation adjustments will be made within intervals of an amplitude of 10%, i.e. an increase/decrease of activity by 19% compared to the HAL would lead to an adjustment of 15% of allocation; an increase/decrease in activity of 38% would lead to an adjustment of 35% of allocation; an increase of activity of 98% would lead to a 95% adjustment in allocation. A decrease of activity above 95% would lead to no free allocation.
8.1.3.Alternative C. Staged approach, initial 15%, then 15% intervals
An allocation adjustment should be applied for a 15% increase or decrease in activity level (ALRA/HAL). Larger allocation adjustments will be made within intervals of an amplitude of 15%; i.e. an increase/decrease of activity by 19% compared to the HAL would lead to an adjustment of 15% of allocation, an increase/decrease of activity of 38% would lead to an adjustment of 30% of allocation; an increase of activity of 98% would lead to a 90% adjustment in allocation. A decrease of activity above 90% would lead to no free allocation.
8.1.4.Alternative D. Staged approach, initial 15%, then 30% intervals
An allocation adjustment should be applied for a 15% increase or decrease in activity level (ALRA/HAL). Larger allocation adjustments will be made within intervals of an amplitude of 30%; i.e. an increase/decrease of activity by 19% compared to the HAL would lead to an adjustment of 15% of allocation, an increase/decrease of activity of 38% would lead to an adjustment of 15% of allocation; an increase of activity of 98% would lead to a 75% adjustment in allocation. A decrease of activity above 75% would lead to no free allocation.
This alternative would lead to processing changes when activity levels increases or decreases reaches the thresholds of 15%, 45% and 75%. In that respect the alternative is the most rigid alternative presented. It has similarities with the one used in phase 3 for decreased activity levels with the necessary adaptations to comply with the requirements set in the revised ETS Directive.
8.1.5.Alternative E. Mixed approach
A mixed approach would combine elements of the staged approach with elements of the linear approach. The staged approach would be used for taking the decision of processing an allocation change after the initial 15% change established in the Directive is reached but using a linear approach when processing the change.
This means that when a change is made, it will be done in a way equivalent to the linear scenario (i.e. a change in activity of 17% will lead to a change in allocation of 17%). If a subsequent change of activity level occurs in the same interval the allocation remains the same. If a subsequent change exceeds the interval within which the first adjustment fell the adjustment in this case shall be again as the exact percentage change in the average activity level.
Different interval sizes can be combined with this mixed approach, in the subsequent analysis the intervals combined with this mixed approach have been 5% and 10%.
Graphically, alternatives A to D can be summarised as:
Graphical representation of the different alternatives analysed
Alternatives B, C and D are a continuation of the approach followed in phase 3, where partial cessations were triggered by reductions of 50%, 75% or 90% in the level of activity, while introducing symmetry of upwards and downwards adjustments and introducing more flexibility.
These alternatives for phase 4 include seven to nine steps each and therefore result in a much closer alignment of production and allocation levels, than is the case in phase 3 that includes only (three big) steps for downwards adjustments.
8.2.Evaluation
8.2.1.Analysis of results
8.2.1.1.Number of installations with allocation changes
If an installations ALRA/HAL remains within the [0.85, 1.15] interval of the HAL every year, it does not undergo any allocation change.
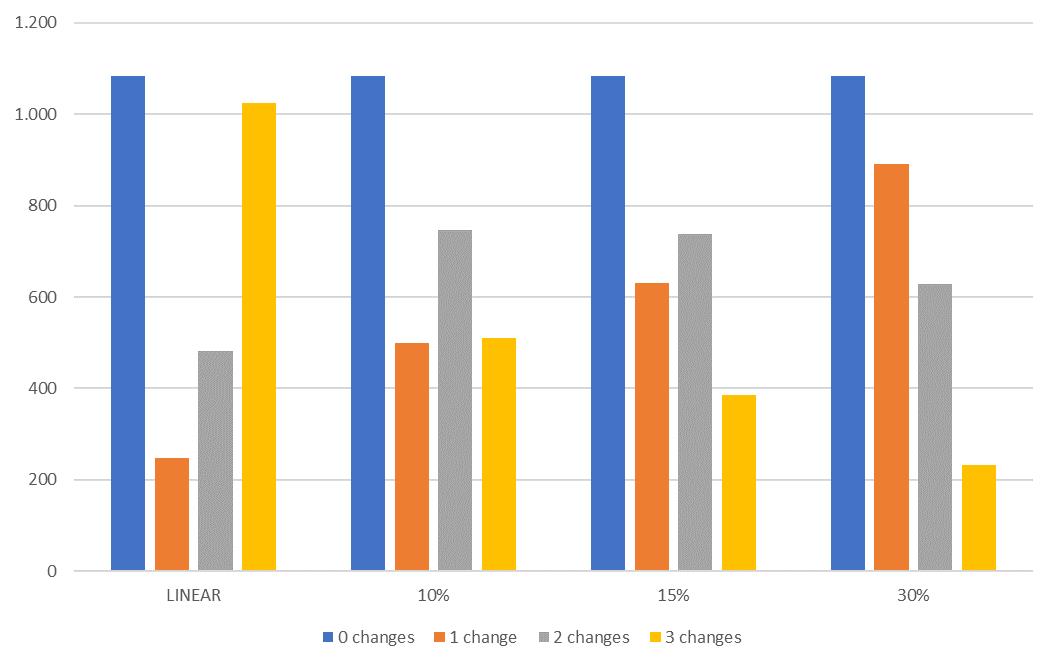
If either of these thresholds is surpassed, the installation can have one or several allocation changes during an allocation period, represented by the analysed years in this analysis. The figure below presents the number of installations and the number of changes per installation during the allocation period. Per year there can be either no change or one change.
Number of installations with no changes, 1 change, 2 changes and 3 changes for the different alternatives analysed
The number of installations with no changes is equal for all alternatives because all alternatives require a minimum change in activity level of at least 15%. 3,250 installations would have not undergone any change during the three years used for this analysis, this represents around 38% of the installations analysed.
The number of installations with one or more changes during the analysed years is also equal across alternatives, but what differs is the frequency that installations have one, two or three changes. The smaller the threshold intervals used, the more frequent multiple changes are needed, increasing the total number of allocation changes needed.
8.2.1.2.Number of allocation changes
It is clear that the larger the interval between thresholds, the more likely it is that an installation’s ALRA/HAL remains in the same interval, thus fewer allocation changes after an initial change. The table below presents the average number of installations which will have an allocation change per year and its percentage of the total number of installations.
All analysed scenarios result in a significant increase on the number of annual changes compared with phase 3.
|
Scenario
|
LINEAR
|
10%
|
15%
|
30%
|
|
Average annual changes
|
4,300
|
3,500
|
3,300
|
2,900
|
|
% of installations with a change per year
|
50%
|
41%
|
38%
|
33%
|
Regarding alternative E, the mixed approach, the number of changes to be processed using a normal staged scenario and a staged scenario combined with a change in the level of allocation equivalent to the level of activity is equivalent. Two scenarios are presented below, one in which the amplitude of the intervals is 5% (5% MIX) and one with an interval amplitude of 10% (10% MIX). For the newly analysed scenarios the average number of changes to be processed per year would be:
|
Scenario
|
5% MIX
|
10% MIX
|
|
Number of changes
|
3,800
|
3,500
|
|
% of installations with a change per year
|
45%
|
41%
|
In phase 3, the total number of yearly changes processed is between 1,400 and 1,600. In phase 3, increases in production only lead to increases in the level of allocation if physical changes in the installation take place. Decreases in production without physical change only led to a change if the level of activity was reduced by more than 50%. This number includes also carbon leakage status changes which are only relevant in phase 3. The number of carbon leakage status changes is relatively small; around 600 of these changes have been made in phase 3, the vast majority of them between 2014 and 2015.
The analysis shows that a significant increase in the number of yearly changes to be processed during phase 4 compared with the current situation can be expected. Depending on the interval size chosen for the thresholds, the simulation suggests roughly a doubling (largest interval) to tripling (smallest interval) of the annual number of allocation changes.
Depending on the approach chosen, the annual number of changes compared with the total number of installations varies from around 30% of the total installations (for 30% steps) to around 50% of the total installations (for the linear method).
For theoretical comparison, a system with no thresholds at all would be purely linear and if it would have been included in the ETS Directive, then all installations in analysed (8,512) would have allocation changes every year.
8.2.1.3.Number of allowances involved in allocation changes
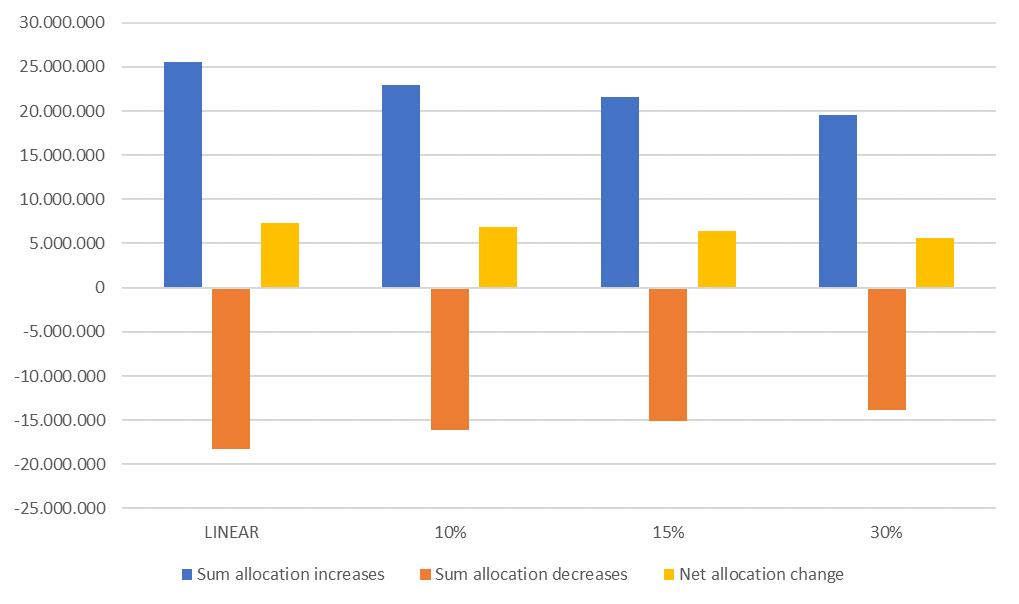
The number of allowances involved in allocation increases and reductions varies between scenarios. The sum of these changes per year is shown below.
Sum of allowances involved in allocation increases and reductions per scenario (average per year)
Both the sum of allocation increases and the sum of allocation decreases involves multiple tens of millions of allowances for all alternatives. Each year, between 15 and 25 million allowances would be added and removed following changes in activity levels. The bigger the interval size, the lower the sum of allowances added in allocation increases and the lower the sum of allowances reduced in allocation decreases.
In all alternatives analysed and for the years considered, the net change (sum allowances increased minus sum of allowances decreased) is positive: there is a system-wide increase in allowances over time due to allocation changes. This might be derived from the economic situation in the years analysed, 2014 to 2017, i.e. years of economic growth. The net and absolute difference in net change in allowances between the interval approaches are significant, but relatively modest compared to the sum of changes. The bigger the interval size, the lower the net allocation change, and the smaller the interval size, the more dynamic the allocation changes are over time.
|
Scenario
|
LINEAR
|
10%
|
15%
|
30%
|
|
Net allocation difference (vs linear)
|
0
|
450,000
|
880,000
|
1,600,000
|
|
Absolute allocation difference (vs linear)
|
0
|
4,800,000
|
7,000,000
|
10,000,000
|
In terms of allocation differences with the linear approach, the new mixed scenarios reduce these differences, as the methodology used for calculating the amount of allowances to be granted is equivalent to the linear approach once an allocation change has been triggered. For the new scenarios the differences would be:
|
Scenario
|
5% MIX
|
10% MIX
|
|
Net allocation difference (vs linear)
|
30,000
|
-50,000
|
|
Absolute allocation difference (vs linear)
|
-440,000
|
-1,100,000
|
*
A negative value indicates that the linear approach leads to a higher level of free allocation than the compared approach.
For comparison, the level of allocation between the linear approach and a theoretical approach in which no initial 15% threshold would have been set has been calculated. This comparison leads to an average net difference in free allocation of around 1,000,000 allowances and an absolute difference of around 30,000,000 allowances. In this theoretical scenario almost all installations would be subject to changes every year, as small variations in production are to be expected.
8.2.2.Conclusions
Smaller threshold intervals result in more allocation changes as they are more reactive to activity level changes. Logically, the linear scenario leads to the highest number of changes.
1.Smaller threshold intervals seem to lead to a higher level of total free allocation during an economic expansion when activity levels increase. In case of a recession, smaller intervals reflect activity reductions in stronger allocation reductions.
2.Larger threshold intervals make it more difficult to reach the threshold for a higher allocation. In case of activity level increases, this is undesirable for operators, while it is in their advantage when activity decreases. The only exception to the rule occurs in cases with very large reductions in activity levels. The 30% threshold interval leads to no allocation for activity level reductions of more than 75%, while in phase 3 the necessary reduction was 90%. The 15% scenario leads to no allocation when the activity reduces by 90%, as in phase 3, while the 10% scenario would result in no allocation when the reduction in activity level would reach 95%. For the proportional scenario zero allocation is only reached when the operation ceases.
3.Larger threshold intervals reduce the administrative work for the Competent Authority and the Commission for processing allocation changes as the number of allocation level changes to be processed each year is increased to a lesser degree. The larger the intervals, the larger the reduction. Activity level data is to be submitted by industry in any case. The EC is planning to update the IT tools used for processing allocation changes.
4.The impact in terms of allocation above or below emission levels depends on the direction of the changes on activity levels. It is noted that other allocation rules such as the benchmark values, the carbon leakage status and the application of the CSCF (Cross Sectorial Correction Factor) or the LRF (Linear Reduction Factor) will have a bigger impact in terms of total allocation granted.
5.When an installation has reached the 15% threshold it is very likely that changes to its allocation will apply in all remaining years of the allocation period if a linear approach is used, while if the 15% threshold is never reached no changes will apply. A staged approach ensures that installations reaching the initial threshold for change or not are treated in a similar way and it ensures that small activity changes shall not be reflected in allocation changes, considered to lead to a more predictable allocation system.
6.For activity level reductions, a staged approach, using large intervals (30% or more) is similar to the allocation change rules for partial cessation during phase 3 of the ETS, with the necessary adaptations to comply with the revised ETS Directive.
7.The risk of manipulation and abuse increases with the size of stages, this is because the possible gain for an installation for artificially increasing its production in order to be in a higher step increases with the size of the steps.
Regarding the mixed approaches, the main conclusions which can be drawn are:
1.Under the mixed approaches, the expected number of changes per year is equal to those expected under the staged approach for the same interval size.
2.As the allocation change will reflect the exact activity level change, the differences in terms of net and absolute allocation difference when compared with the linear approach are considerably reduced.
3.The mixed scenarios will provide for exact allocation changes (compared with the activity level) as in the linear approach, but will avoid smaller allocation changes once the 15% threshold has been reached, because the steps are maintained. The administrative burden for the CA and the Commission is therefore reduced compared to the “pure” linear approach.
Regarding the effectiveness criterion, all alternatives ensure that activity level changes are reflected in allocation changes. Furthermore, all of them are also non-discriminatory and uniform, as they are applied to all installations receiving free allocation under the ETS. All alternatives evaluated are symmetric.
From an administrative burden perspective, the alternatives leading to a lower number of allocation level changes per year are preferred, as the cost and effort for competent authorities to process these changes would be reduced.
As mentioned above, the risk of manipulation or abuse increases with the size of the steps, as the possible gains also increase with them.
From the point of view of the responsiveness of the system, a linear approach is the fastest in reflecting allocation changes once the 15% threshold has been reached. The responsiveness decreases with the size of the steps. The opposite reasoning can be applied to the predictability of the system, once the 15% threshold has been reached, under the linear approach, changes are to be expected every year for most installations. In consequence, operators, competent authorities and the Commission would have less foresight about the global level of free allocation in the future.
8.2.3.Preferred alternative
The linear approach leads to the highest number of changes over the years and once an installation has reached the 15% threshold, it is very likely that it will continue to have allocation changes every year reflecting the installation’s actual activity changes.
Using either the linear or the staged approach with 10% intervals beyond the 15% initial threshold established in the EU ETS Directive (Alternatives A and B) would be acceptable. These alternatives ensure that allocation sufficiently reflects actual activity levels. The 10% steps alternative is considered to reduce the administrative burden compared with the linear approach.
These alternatives provide a system which will be much more reactive to change in the level of activity compared with the system in place during phase 3 of the ETS while at the same time, ensuring some predictability on free allocation. A linear approach would to the highest extent align allocation to the levels of production, but at the cost of having a higher number of installations experiencing a change each year.
The mixed proposal provides a higher level of accuracy compared with the staged approaches while reducing the administrative burden when compared with the linear approach, it is also an acceptable alternative.
All analysed alternatives would ensure that changes in the level of activity are to some extent reflected in changes in the level of allocation, in this respect they are considered effective. All alternatives would be equally applied to all sub-installations, so they are non-discriminatory.
The staged or mixed approaches reduce the administrative burden compared with the linear approach. In addition, the mixed approach reduces the risk of manipulation compared with the staged approach, as it reflects the exact change on activity in the level of free allocation within a stage.
From the point of view of the responsiveness and predictability of the system, the mixed approach represents a compromise between the alternatives using steps and the linear approach.
The impact of the different alternatives in terms of depletion of the NER and in providing possible incentives to operators to modify their level of production in order to optimise their level of free allocation is very limited.
8.3.Sensitivity analysis
The use of the linear or the different threshold approaches beyond the first 15% threshold can impact the incentives operators have to determine their level of activity. In theory, installations choosing a production levels close to a threshold which would trigger a change in allocation could have an economic interest in increasing their production for triggering an allocation increase or for avoiding an allocation decrease. This chapter analyses the impact of this possible behaviour in the levels of free allocation and the allocation level changes to be processed. A case study is presented in the Annex.
In addition, during phase 4 of the ETS, allowances granted for allocation level increases as a result of increases in the level of activity will be sourced from the New Entrants Reserve (NER). This chapter also analyses the impact of the choice of a linear or a staged approach on this reserve.
Two analysis have been carried out, a top-down approach that takes into consideration the size of the NER and the expected number of allocation granted to greenfields during phase 4, and calculates the level allocation changes due to activity level changes which would deplete the NER.
This analysis has been complemented with a bottom-up approach. The number of allowances expected to be granted per year has been calculated based on the linear and staged approaches for allocation changes. In this analysis, we have also looked at the incentives that installations would have for increasing their production to maximise their free allocation.
As explained in the “methodology” chapter, the analysis carried out is based on emissions data from 2013 to 2017. Trends and differences between scenarios are identified taking into consideration the uncertainties and limitations of the data available. The calculation hypothesis used is also presented.
8.3.1.Top-Down
8.3.1.1.Hypothesis
·The net annual system wide increase in allocation due to the net increase in activity level is calculated. This considers that allowances from allocation reductions and cessations of operations go back to the NER.
·The initial level of free allocation in 2021 is calculated based on the level of free allocation during phase 3 (discounting the CSCF) and applying the rules in the FAR (Free Allocation Rules Regulation, average over the baseline period 2014-2018). It also takes into account differences in the treatment of installations exposed and non-exposed to carbon leakage. For 2026, the same process is done.
·Allocation given to phase 3 “greenfields” and “significant capacity extensions” will be included in the “NIM” allocation during phase 4.
·The scenarios do not correct for the possible higher activity levels in the years used as reference for phase 3 compared with the reference years for phase 4. In this sense they are conservative.
·2 scenarios reflecting the spectrum from the lowest to the highest updates possible for the benchmarks (BMs) (minimum BM value update 3%, maximum BM value update 24%) have been included. The minimum update is reflected in all BMs while in the maximum update rate the 24% value is applied to all BMs except to the “hot metal” BM.
·3 scenarios have been used regarding greenfields: no greenfields at all, 1M allowances to greenfields per year (similar to phase 3), 2M allowances to greenfields per year and 5M allowances to greenfields per year (extreme).
8.3.1.2.Results
The increase rates in the level of allocation due to activity level changes which would deplete the NER by 2030 have been calculated. This is done to estimate the level of activity level increases which would lead to a lack of allowances for new entrants and for further activity level increases. The results are in the table below. For each scenario, the total allocation given to Greenfields (‘GF’) is presented. The last row represents the average allocation increase per year due to activity level changes that would deplete the NER reserve.
|
|
1M "GF"
|
2M "GF"
|
5M "GF"
|
|
Annual free allocation increase (min BM update)
|
3,60%
|
3,27%
|
2,28%
|
|
Annual free allocation increase (max BM update)
|
4,27%
|
3,87%
|
2,66%
|
|
Total "GF"
|
31,000,000
|
63,000,000
|
155,000,000
|
|
Average yearly FA increase
|
29,000,000
|
26,000,000
|
17,000,000
|
We estimate that an annual increase of activity levels between 3% and 4% on allocation would be needed to deplete the NER. The analysis is sensitive to the level of greenfields per year, if the levels remain similar to what was experienced in phase 3, an allocation increase due to activity level changes of around 30,000,000 allowances per year would be needed to deplete the NER.
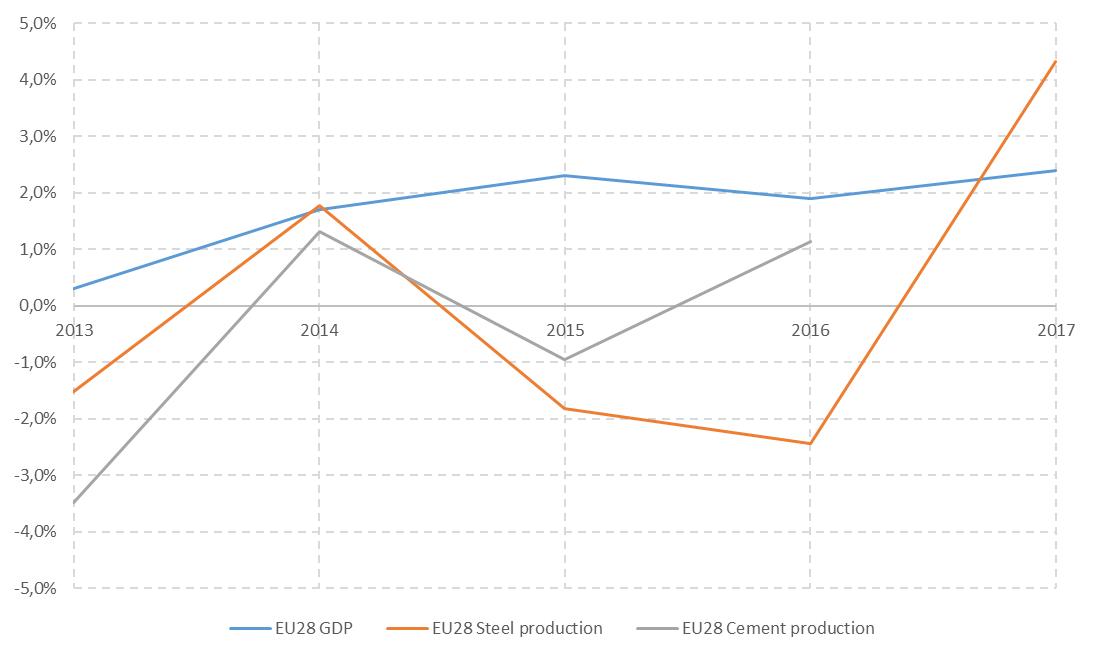
This annual increase on allocation levels due to activity level changes necessary to deplete the NER can be compared with the Gross Domestic Product (GDP) evolution for the EU28 during the years analysed (2013 to 2017). For comparison, the change in production in the EU28 for the two sectors receiving most free allowances (steel and cement) is also presented.
It is noted that the production increase of these two sectors in general has been below the overall growth of the economy. In addition, in 2015 and 2016 the European production in the sectors contracted while the EU28 economy grew by 1.9%.
Sustained growth rates between 3% and 4% have not been experienced by the European economy as a whole for a long time and the medium term projections identified are well below these numbers. If trends are maintained it is very unlikely that the sectors contributing to most emissions under the ETS would grow at the rates leading to a depletion of the NER.
8.3.2.Bottom-Up
As discussed before, the analysis above has been combined with an approach in which, by analysing the increase in emissions during phase 3 (only data available), the potential increase in free allocation due to activity level changes under the scenarios proposed in the public consultation is estimated.
This sensitivity analysis presents the possible impacts on free allocation of possible production increases linked to the possible incentive provided by the scenarios analysed to increase production in order to reach a certain threshold.
The level of production of an installation depends on many factors of which carbon costs are one. Proximity to markets, linked to distribution costs, actual demand, storing costs, energy costs, labour costs etc. are basic considerations made by companies when deciding where and how much to produce.
In addition, the cost structure of different companies and different sectors is variable. It goes beyond the objectives of this analysis to perform sector specific simulations. Sectors are considered to have similar incentives and technical capacity to increase production in order to reach any threshold.
8.3.2.1. Hypothesis
·Calculations are made using a 2 year rolling averages and are presented for the average changes which would have occurred in years 2016, 2017 and 2018.
·2 scenarios regarding the distance from the threshold from which installations could have an incentive to optimise their production (5% and 2%) have been analysed.
2 possible scenarios are added in which: 25% of the installations would increase their production to maximise their free allocation and 10% of the installations would do it.
8.3.3.Results
|
|
|
Increase from ±5%
|
Increase from ±2%
|
|
|
Concept
|
Linear
|
10%
|
15%
|
30%
|
Linear
|
10%
|
15%
|
30%
|
|
Common factors
|
Number of installations that could increase production
|
865
|
2.395
|
1.778
|
1.179
|
263
|
960
|
709
|
467
|
|
|
Yearly allocation changes
|
4.286
|
3.519
|
3.263
|
2.850
|
4.286
|
3.519
|
3.263
|
2.850
|
|
|
Changes difference with linear
|
0
|
-767
|
-1.023
|
-1.436
|
0
|
-767
|
-1.023
|
-1.436
|
|
|
[%] compared with total installations
|
10,16%
|
28,14%
|
20,89%
|
13,85%
|
3,09%
|
11,28%
|
8,33%
|
5,49%
|
|
|
Normal free allocation increases
|
25.696.339
|
22.949.141
|
21.562.944
|
19.508.768
|
25.696.339
|
22.949.141
|
21.562.944
|
19.508.768
|
|
|
Normal free allocation decreases
|
-18.406.051
|
-16.107.723
|
-15.154.841
|
-13.887.314
|
-18.406.051
|
-16.107.723
|
-15.154.841
|
-13.887.314
|
|
|
Absolute normal free allocation change
|
44.102.390
|
39.056.864
|
36.717.785
|
33.396.082
|
44.102.390
|
39.056.864
|
36.717.785
|
33.396.082
|
|
|
Net normal free allocation change
|
7.290.288
|
6.841.418
|
6.408.102
|
5.621.454
|
7.290.288
|
6.841.418
|
6.408.102
|
5.621.454
|
|
|
Potential maximum production increase
|
7.953.455
|
11.471.940
|
11.535.338
|
9.757.836
|
2.793.282
|
4.074.665
|
3.783.065
|
3.361.373
|
|
Increase 25%
|
Additional free allocation changes due to production increases
|
216
|
599
|
445
|
295
|
66
|
240
|
177
|
117
|
|
|
Changes difference with linear
|
0
|
-384
|
-795
|
-1357
|
0
|
-593
|
-911
|
-1385
|
|
|
Free allocation change due to production increase
|
1.988.364
|
2.867.985
|
2.883.834
|
2.439.459
|
698.321
|
1.018.666
|
945.766
|
840.343
|
|
|
Extra production increase over linear
|
0
|
879.621
|
895.471
|
451.095
|
0
|
320.346
|
247.446
|
142.023
|
|
|
Total allocation change absolute + production increases
|
46.090.753
|
41.924.849
|
39.601.619
|
35.835.541
|
44.800.710
|
40.075.530
|
37.663.551
|
34.236.425
|
|
|
Total allocation change net + production increase
|
9.278.651
|
9.709.403
|
9.291.937
|
8.060.913
|
7.988.608
|
7.860.084
|
7.353.869
|
6.461.798
|
|
|
[%] "manipulation" allocation change / total free allocation
|
0,27%
|
0,40%
|
0,40%
|
0,34%
|
0,10%
|
0,14%
|
0,13%
|
0,12%
|
|
|
[%] production increases change / absolute normal allocation change
|
4,51%
|
7,34%
|
7,85%
|
7,30%
|
1,58%
|
2,61%
|
2,58%
|
2,52%
|
|
|
[%] net + production increase allocation change / total free allocation
|
1,28%
|
1,34%
|
1,28%
|
1,11%
|
1,10%
|
1,09%
|
1,02%
|
0,89%
|
|
Increase 10%
|
Additional free allocation changes due to production increases
|
86
|
240
|
178
|
118
|
26
|
96
|
71
|
47
|
|
|
Changes difference with linear
|
0
|
-614
|
-932
|
-1405
|
0
|
-697
|
-978
|
-1416
|
|
|
Free allocation change due to production increase
|
795.346
|
1.147.194
|
1.153.534
|
975.784
|
279.328
|
407.466
|
378.307
|
336.137
|
|
|
Extra production increase over linear
|
0
|
351.849
|
358.188
|
180.438
|
0
|
128.138
|
98.978
|
56.809
|
|
|
Total allocation change absolute + production increases
|
44.897.735
|
40.204.058
|
37.871.319
|
34.371.865
|
44.381.718
|
39.464.330
|
37.096.092
|
33.732.219
|
|
|
Total allocation change net + production increase
|
8.085.633
|
7.988.612
|
7.561.636
|
6.597.238
|
7.569.616
|
7.248.884
|
6.786.409
|
5.957.592
|
|
|
[%] "manipulation" allocation change / total free allocation
|
0,11%
|
0,16%
|
0,16%
|
0,13%
|
0,04%
|
0,06%
|
0,05%
|
0,05%
|
|
|
[%] production increases change / absolute normal allocation change
|
1,80%
|
2,94%
|
3,14%
|
2,92%
|
0,63%
|
1,04%
|
1,03%
|
1,01%
|
|
|
[%] net + production increase allocation change / total free allocation
|
1,12%
|
1,10%
|
1,04%
|
0,91%
|
1,05%
|
1,00%
|
0,94%
|
0,82%
|
As shown in the table above, the forecasted change on the level of free allocation due to activity level changes is between 1% and less than 2,5% compared with the total level of free allocation.
The impact of the possible increase of the production by installations in the level of free allocation is marginal, below 0,5% in all realistic scenarios. This possible production increase is below 3,000,000 allowances per year in the scenarios presented. In addition, most of this possible optimisation occurs in the 15% threshold and applies to all scenarios analysed. When compared to the linear approach, the additional possible production increase is well below 1,000,000 allowances for all scenarios. The relative weight of the production increases compared with the absolute value of allocation changes is below 5% in the scenarios evaluated.
Even in scenarios in which possible additional allocation changes due to incentives for increasing allocation are taking into consideration the staged approaches lead to lower global number of changes to be processed.
The mixed alternatives do not change this analysis. In terms of normal free allocation increases and decreases the scenarios provide numbers which are very similar to those forecasted under the linear approach. The incentives to increase production in order to trigger an allocation change are reduced when compared with the alternatives using different steps as the level of free allocation following a change reflects the real change in activity so the additional allowances gained by increasing production are lower than in the scenarios using steps.
It is important to note that the incentive for increasing production in order to maximise allocation is only one out of many factors faced by installations and usually not the most important one. Usually, production decisions are taken by analysing a series of factors, such as proximity to raw materials and markets, labour costs, energy costs, stability and governance, fiscal systems, etc. Depending on the sector, the weight of the different parameters differ. It is understood that it is not likely that an operator will change their production decisions based only on considerations linked to the level of free allocation received after a potential activity level change.
8.4.Conclusions
The impact of choosing a “linear” approach following the first 15% threshold or continue with thresholds after the initial 15% threshold for allocation change is overall limited in terms of the possible depletion of the NER. However, the analysis shows that even if differences are minimal, it is more prudent to continue with thresholds for allocation changes in times of economic growth. On the other hand the alternatives with continued thresholds provide more incentives to installations which can increase their production to increase their allocation as more threshold exist.
Based on the available data, it seems unlikely that the NER will be depleted by 2030. Net changes in the level of free allocation of around 10,000,000 allowances per year are expected if the economy continues to grow as during the period 2014 – 2018 while around 30,000,000 extra allowances per year would be available in the NER if the number of greenfields entering the EU ETS remains similar to phase 3. Up to 200 million unused allowances in the NER may be returned to the Market Stability Reserve by the end of phase 4, ensuring that the allocation level changes rules avoid artificial incentives for using this reserve contributes to the environmental integrity of the ETS.
9.Minimum threshold
The revised EU ETS Directive states that the Commission should be able to consider further measures to be put in place, such as the use of absolute thresholds regarding the changes to allocations. These thresholds can be set to avoid any undue administrative burden.
A minimum threshold below which no allocation changes would take place could be envisaged, this would be justified in order to reduce administrative burden for competent authorities and the Commission in the evaluation and processing of changes that do not have an important impact in the total number of allocation. Such minimum threshold could be set at installation or at sub-installation level.
Article 27 and 27a of the ETS Directive foresee the possibility of excluding small and very small installations from its scope. If these provisions were implemented by all Member States, the discussions on minimum thresholds would be less relevant. Nevertheless, it is the prerogative of the Member States to decide whether these provisions will be implemented. Additionally, minimum thresholds can also apply to small sub-installations that are part of much bigger installations.
9.1.Alternatives
9.1.1.Alternative A. No minimum threshold
All changes to production levels which according to the alternative chosen trigger allocation changes would be processed. No minimum threshold for triggering allocation changes is established.
9.1.2.Alternative B. Minimum threshold, 100 allowances
Only changes to production levels which according to the alternative chosen trigger allocation change and which represent a change in allocation of at least 100 allowances for the subsequent years will trigger an allocation change.
9.1.3.Alternative C. Minimum threshold, 500 allowances
Only changes to production levels which according to the alternative chosen trigger allocation change and which represent a change in allocation of at least 500 allowances for the subsequent years will trigger an allocation change.
9.2.Evaluation
The quantitative analysis has been performed assuming that the minimum threshold alternatives apply at the installation level. Since the HAL, AL and allocation are determined at the sub-installation level, minimum thresholds could be applied at that level. Many installations only have one sub-installation and for the remainder, in many cases one sub-installation typically represents the majority of the allocation within the installation, performing the quantitative analysis at the installation level appears to be a reasonable approximation for either level to apply a minimum threshold.
Number of yearly allocation changes. The impact of the minimum threshold is shown in different colours above the blue bar.


The figure above shows the number of allocation changes, and which part of those are affected by the different minimum threshold alternatives. For alternative C, only the blue changes would take place, for alternative B the blue plus grey changes, and for alternative A (no threshold) all three colours would take place.
Numerical results are presented in the table below, both in absolute and relative terms. The table shows the reduction in the number of yearly changes for different minimum thresholds compared to no minimum. It also shows the number of allowances involved and compares them to the total number of allowances subject to changes under each alternative per year.
|
MIN Threshold
|
10%
|
15%
|
30%
|
LINEAR
|
|
Chang
|
500
|
-687
|
-604
|
-516
|
-1,189
|
|
|
|
-19.53%
|
-18.52%
|
-18.12%
|
-28.36%
|
|
|
100
|
-221
|
-195
|
-167
|
-478
|
|
|
|
-6.29%
|
-5.97%
|
-5.85%
|
-11.40%
|
|
Allow
|
500
|
144,270
|
126,123
|
106,983
|
211,054
|
|
|
|
0.37%
|
0.34%
|
0.32%
|
0.48%
|
|
|
100
|
8,490
|
7,699
|
6,543
|
18,461
|
|
|
|
0.02%
|
0.02%
|
0.02%
|
0.04%
|
When the situation without any minimum thresholds is compared with the different minimum thresholds, it is clear that a substantial reduction in the number of allocation change cases can be obtained, with only marginal differences in overall allocation.
At current average price of 20 EUR/tonne of CO2, a 100 allowance threshold would reflect around 2,000 EUR gained or lost at installation level and around 150,000 EUR per year for the entire industry in affected allowances. A 500 threshold would be reflected in around 10,000 EUR gained or lost at installation level and around 2,500,000 EUR per year for the entire industry. It is to be noted that the number of allowances increased and reduced will cancel each other out.
The establishment of a minimum threshold would ease the administrative burden for the competent authorities that process the changes.
Regarding the cost for the administration for processing allocation changes, the Impact Assessment accompanying the Commission proposal for the revised EU ETS directive has estimated that the cost of processing activity level changes to be around 3,000 EUR per change. In this respect, the administrative costs of processing an allocation change of 100 allowances is higher than the expected gain or loss.
Cost per installation of data collection, reporting verification and approval by the administration per type of allocation change.
Taking this into consideration, a 100 allowances minimum threshold could reduce the costs for the administration of around 600,000 EUR per year while a minimum threshold of 500 allowances would reduce these costs by 1,800,000 EUR per year.
9.2.1.Preferred alternative
A minimum threshold of at least 100 EUA would achieve a reduction in effort (a reduction of around 6% in the number of cases) with a minimum difference in the total level of free allocation (around 0.02%). In addition, this leads to total savings for the system, as the administrative costs are reduced to a greater extent than the value of the allocation decreases plus increases which would not be processed (at current price).
The effectiveness of the system is maintained even if a minimum threshold is established, as the impact on the total level of free allocation of this measure is very limited.
A minimum threshold will affect small installations and small sub-installations within bigger installations. The threshold will be applied in a uniform manner to all sectors receiving free allocation. The economic impact of this threshold is limited if its value is kept low. The non-discriminatory and uniform application of measures is higher if a 100 allowances threshold is applied.
The application of the minimum threshold reduces the administrative burden for competent authorities and the Commission for processing allocation level changes while having a small impact on the total level of free allocation.
The threshold will be applied in a symmetrical way.
In case a linear approach for allocation changes (see section 4) was to be chosen, the total number of changes per year would increase considerably, and as a result a minimum threshold would become much more relevant. In such a case, a minimum threshold for allocation change of 500 allowances should be used.
Establishing a minimum threshold is considered effective for reducing the administrative burden linked to the proposed Regulation. It can be argued that an administrative threshold has a higher impact on smaller installations which receive a lower level a free allocation. Nevertheless, the threshold is proposed to be set at a low level of allowances, so the economic impact of it is very limited and the value of the allowances is below the administrative costs needed for processing such change. In addition, the threshold would be applied both to increases and decreases in the level of free allocation, ensuring an equal treatment both for installations increasing or decreasing their activity.
10.Year of start of allocation changes
The revised ETS Directive does not establish the start of processing allocation level changes due to activity level changes. Different alternatives exist, as data is reported already for years 2019 and 2020, allocation level changes could start from 2021. Nevertheless, it could be decided to wait until data regarding the rolling average of two years is available, thus changes would only start in 2023.
10.1.Alternatives
10.1.1.Alternative A. Allocation changes to start in 2021
The first allocation level changes will happen in 2021 based on the rolling average of 2019 and 2020.
10.1.2.Alternative B. Allocation changes to start in 2022
The first allocation level changes will happen in 2022 based on the rolling average of 2020 and 2021.
10.1.3.Alternative C. Allocation changes to start in 2023
The first allocation level changes will happen in 2023 based on the rolling average of 2021 and 2022.
10.2.Evaluation
In terms of the number of changes per year, administrative burden and economic impact of these changes, once a steady state is reached, the three alternatives are almost identical but the earlier the start, the more years in which the administrative burden applies. Depending on the decision taken, between around 3,000 and 4,000 allocation changes would be avoided per year of postponement of allocation level changes.
2019 and 2020 data will need to be reported as part of the NIMs to be submitted in 2024 for the second allocation period of phase 4. Additional effort made during the first years will reduce the reporting and verification costs during the second NIMs exercise in 2024.
Reporting activity data for 2019 and 2020 will also increase the data quality for consecutive years, as verifiers have to provide suggestions for improvement. In consequence, operators would improve their Monitoring Methodology Plans (MMP) earlier.
Starting changes in 2021 would avoid a gap between the period used for the NIMs exercise (2014 – 2018) and the start of processing allocation changes based on two years rolling averages, which would be based on data from 2019 and 2020.
On the other hand, starting activity level changes in 2021 based on data from 2019 and 2020 would put more pressure on the finalisation of the updated IT tools to be used for addressing activity level changes during phase 4.
Furthermore, from a practical point of view, operators have the obligation to (actively) monitor their FAR data from the date the new FAR enters into force in 2019, so by then they are expected to have only a first draft MMP, while the final approval of the MMP is only mandatory by the end of 2020. Earlier reporting of activity levels (i.e. before the MMP has been approved) could potentially lead to inconsistencies in this reporting, which could be an argument for waiting one (or two) year(s) until 2022 (2023) for starting allocation changes.
10.3.Preferred alternative
It is preferable to start processing allocation level changes in 2021 or 2022 while noting the additional administrative burden for operators, Member States and the Commission related to each year of earlier start of allocation changes.
The effectiveness of the system is increased by starting changes early in phase 4. The impact of starting changes only in 2023 is that the production levels of 2019 and 2020 are not reflected in the level of free allocation of the installation, as the baseline period defined in the ETS Directive covers the years 2014 to 2018 while the first rolling average would be calculated using data for years 2021 and 2022.
The administrative burden increases with each year of starting changes earlier, in particular for the competent authorities and the Commission that will have to process the changes. For the operators this burden is limited as the data used for calculating allocation level changes in 2021 will be requested in any case in 2024 during the second NIMs exercise as part of the baseline period.
The non-discriminatory and uniform application, prevention of manipulation or abuse and symmetry are not affected by the choice of the starting year.
Finally the responsiveness of the system is increased by processing changes in 2021. Obviously, processing changes only as of 2023 would increase the predictability of the system, but at the cost of not taking into consideration the activity during several years.
11.Changes in the operation of the installation
The ETS Directive establishes that free allocation rules shall ensure that allocation takes place in a manner that provides incentives for reductions in greenhouse gas emissions and energy efficient techniques.
Different types of changes in the operation of the installation can have an impact on the level of emissions of the installation but might not be reflected in the level of free allocation, these changes can include:
·Energy efficiency improvements in sub-installations using the heat or fuel benchmarks;
·Switches from non-ETS heat to ETS heat, and vice versa;
·Switches from electricity to fuel, and vice versa;
·Change in the amount of waste gas flared (in case of product benchmarks);
·Changes in the production of high value chemicals;
·Changes in the production of vinyl chloride monomer.
Regarding energy efficiency improvements, it can be argued that not considering the specificities of energy efficiency measures constitutes a barrier for their implementation. The Energy Efficiency Directive does not set mandatory targets on energy efficiency improvements for energy intensive industry because it recognises that the ETS is a main driver for improvements in the sector.
In phase 3, rules for partial cessations and significant capacity reductions were applied without exception. In the case of the heat and fuel benchmark sub-installations, the level of allocation is calculated based on the energy input to the sub-installation. Therefore an increase on energy efficiency can lead to a decrease in the level of allocation as the amount of heat or fuel to product the same amount of product is reduced after an increase in energy efficiency. Where this happens, the costs for the operator for implementing this measure are higher than if the level allocation remained unchanged. This reduces the incentive for such measures.
As no harmonised approach towards energy efficiency measures was included in Decision 2011/27/8EU on transitional rules for harmonised free allocation, it was not always clear how to treat these measures and what evidence the competent authority should request from the operator to support its assertion that measures taken for energy efficiency.
A dedicated framework on this topic was provided by the FAQ 2.7. It advised to establish production level – activity level relationships to base the assessment on. This provision indicated that in case of energy efficiency improvements the possible significant capacity reduction would not be considered as such and therefore was did not need to be notified to the Commission in cases in which the physical changes were aimed exclusively at increasing energy efficiency.
The application of the FAQ document in the absence of legal basis was not aligned between Member States. It is the objective in phase 4 to harmonise how these type of measures are treated in different Member States.
With a shift from capacity-based allocation changes to activity level based allocation changes this issue can be expected to be more relevant in phase 4.
In phase 4 of the ETS, allocation changes will be more frequent (as shown in section 4) and they will be based on changes in operations, and not limited to a physical change to the installation. In addition, the thresholds for triggering an allocation change when production changes will be much lower than in the past (15% in phase 4 vs 50% in phase 3).
It is also to be noted that the changes in the operation of the installations only concern the relevant allocation period. For phase 4 of the ETS, two allocation periods of 5 years each have been defined in the revised EU ETS Directive, which is shorter than the current allocation period of 8 years. For each NIMs exercise, heat and fuel consumption are to be reported without considering previous energy efficiency measures.
In phase 3, the allocation based in the heat and fuel benchmarks represented around 25% of the total free allocation. The approach shall only apply to changes in allocation within one allocation period. For subsequent allocation periods, a new HAL will be determined taking into consideration only the consumption of heat and electricity during the baseline years.
In addition, it can be argued that other changes in the operation of installations should be considered before modifying the level of free allocation of an installation. Switches in the heat source can have an impact on the entity receiving free allocation for that heat or in such heat being eligible for free allocation. Changes in the amount of waste gas flared for non-safety reasons can have an impact on the level of free allocation received by the installations flaring these gases.
11.1.Alternatives
11.1.1.Alternative A. No action
No specific provisions regarding energy efficiency or other changes in the operation of the installation would be made.
11.1.2.Alternative B. General framework in the implementing act
A general framework on how to address the changes in the operation of the installation could be established in the implementing act. These would provide a legal basis for operators, competent authorities and the Commission about how to treat these changes.
A general framework could be provided regarding the preferred approach for evaluating the improvements in the installation, for instance, for energy efficiency improvements in sub-installations producing only one product it could be established that the preferred criteria for evaluation would be comparing the energy intensity of the production before and after the measures are taken.
In addition, simplified provisions, for instance “provide evidence to the competent authority that any change in production volume of tangible products has been reduced significantly less than the consumption of heat”. Verification of the submitted would need to be required.
Given the possible variability of the measures taken in different installations not all the possible measures could be captured in the implementing act. The act would nevertheless provide instructions on how the measures are to be evaluated by Member States, so a harmonised approach is ensured.
11.1.3.Alternative C. Detailed approach in the implementing act
Energy efficiency improvements and other changes in the operation of installations would be included in the rules on allocation level changes. Detailed provisions regarding how to evaluate the changes would be included.
11.2.Additional discussions
If energy efficiency and other changes in the operation of the installation are to be addressed, several aspects need to be discussed, these aspects include:
·Evaluation of the changes in the operation of the installation;
·Minimum threshold established below which the changes in the operation of the installation would not be considered.
11.2.1.Changes in the operation of the installation
Regarding energy efficiency improvements, a relationship between production levels of the products produced, which are not covered by product benchmarks, and the activity level of the heat or fuel benchmark sub-installations could be established.
During the data collection exercise, production data at Prodcom level is going to be collected. For fall-back sub-installations producing only one product, a direct relationship between heat or fuel consumption and production could be set. In case when more than one product is produced by the fall-back sub-installation, it would be very difficult to establish a meaningful relationship between heat or fuel consumption and the production of each product, proxies such as the total tonnes of product produced could be used, nevertheless it is likely that a case by case analysis would be needed.
For other changes in the operation of the installation, verified data regarding the situation before and after the changes would be needed.
11.2.2.Minimum threshold
The revised ETS Directive establishes that only changes in the operation of the installation leading to a change in allocation above 15% shall lead to changes in allocation.
Regarding the type of changes under discussion, there might be cases in which the energy efficiency of the sub-installation changes by more than 15% but the level of allocation changes by a lower level. The same applies to the amount of waste gases flared.
If no minimum threshold was applied, there is a risk of imposing an excessive administrative burden on competent authorities as it is expected that the evaluation of these type of changes will require a deeper analysis than simple changes in production.
11.3.Evaluation
11.3.1.Main alternatives
Alternative A would simplify the implementing act.
It would be up to the competent authority to evaluate the information provided and therefore establish if the reduction in activity levels is due to improvements in energy efficiency and should therefore not lead to allocation changes. This is particularly demanding for borderline cases (e.g. heat consumption reduced by 16%).
Providing a legal basis for evaluating energy efficiency improvements will lead to a more harmonised application of the exemptions provisions but the inclusion of such a provision in the implementing act could still lead to differences of treatment of energy efficiency measures by different Member States. It is not clear what kind of evidence the competent authority would request and it is very difficult to establish which evidence should be requested. This alternative could lead to a significant increase on the administrative burden both for operators and competent authorities as well as for the Commission as each case claimed to be an energy efficiency measure would need to be evaluated individually.
Alternatives B and C both present advantages and disadvantages, alternative B provides more flexibility to the system.
Alternative C ensures a better harmonisation in the evaluations to be made by Competent Authorities. On the other hand, there is a risk of alternative C not being able to capture all the different cases which could arise in the future. The main disadvantage of this alternative is that it is not possible to foresee the different cases which will arise during the 10 years duration of phase 4. Some Member States have shared their experiences during phase 3 and seem to agree on the big variation of possible cases.
11.3.2.Changes in the operation of the installation
For energy efficiency cases, the evaluation should be based on a comparison between the energy efficiency before and after the measures are taken. For sub-installations producing only one product the NIMs data can be compared with the data after the measure. Verified data would need to be submitted by the operator.
For other changes in the operation of the installation the comparison shall be made between the data received as part of the NIMs exercise and the rolling average of the relevant parameters during two years.
11.3.1.Minimum threshold
In order to reduce the possible administrative burden linked to these measures, which are expected to be resource demanding from an evaluation point of view, it is proposed to process changes exceeding 15% of the allocation.
11.4.Preferred alternative
Alternative B is preferred because it would be in line with the objective of the EU ETS Directive to incentivise energy efficiency investments also through the free allocation. Furthermore, a vast majority of Member States and stakeholders have indicated that changes in the operation of the installation should not lead to lower levels of allocation when increasing the energy efficiency of the installation. The same applies to reductions on the level of waste gases flared for non-safety reasons.
Establishing a very detailed methodology in the Regulation is not preferred, as most likely a case-by-case analysis to be done by the Competent Authority would be needed for more complex cases. For simpler cases, as for instance, heat or fuel benchmark sub-installations producing only one product, a relationship between heat or fuel consumption and production at Prodcom level can be established, and is therefore the most transparent and harmonised way of verifying energy efficiency measures.
Alternative B ensures that the system is effective, as it sets rules for ensuring that the ETS does not become a barrier to gains from reduced greenhouse gas emissions or energy. At the same time, all alternatives evaluated are applied to all installations, thus they are not discriminatory.
Avoiding undue administrative burden while preventing any possible abuse of the system is important. Therefore, competent authorities must have the possibility of requesting additional data to operators for ensuring that the claimed improvements in energy efficiency or other changes in the operation of the installation have taken place.
The rules are to be applied in a symmetrical way in all cases.
In order to reduce the number of cases, being in line with the approach taken for other modifications in the operation and reducing the possible optimisation of operations done by installations a minimum threshold of 15% increase in the efficiency shall be used.
12.Reporting date
According to the EU ETS Directive, allocations to installations are to be issued by 28 February each year. Because of the amount and complexity of the information needed, it is very difficult to have verified activity level reports early enough in order to calculate if allocation changes are needed and to process the change and transfer the allowances by this date.
In addition, it has been proposed by several Member States and stakeholders to combine the reporting of emissions with the reporting of activity levels as it would likely decrease the number of verification visits needed in an installation. While this is possible, it is to be noted that in this case, activity level reporting could be delayed until 31 March when the emissions report are due, and changes in the level of allocation would therefore only occur after 31 March with the risk of not finalising the administrative task by the end of the compliance period on 30 April.
12.1.Alternatives
12.1.1.Alternative A. No action
No specific provisions would be introduced in the implementing act.
12.1.2.Alternative B. Reporting activity levels together with emissions
A deadline of 31 March would be set in the implementing act for reporting activity levels with the possibility for Member States to set earlier deadlines, the reporting could be made together with emissions reporting.
12.2.Evaluation
No action is not considered a realistic possibility, as it would create a legal vacuum regarding how to recover any excess of issued allowances. Competent authorities could introduce it in their national law, but these would not be a harmonised approach across the EU.
Reporting activity levels together with emissions has as advantage an important reduction of the administrative burden, but at the cost of a later calculation of the level of free allocation.
It is not considered realistic to set a mandatory reporting date for activity levels early enough for allowing all actors in the process to review the level of free allocation of the installation before the compliance deadline of 30 April. In addition allowances surrendered by 30 April in year n correspond to emissions levels in year n-1. As a modified level of free allocation would concern year n (based on data from years n-2 and n-1) there is no direct link with the compliance in year n. It has to be noted though, that in practice many installations make use of the allocation of year n to surrender allowances in April of the same year during an ETS period (e.g. 2013-20).
Setting a later deadline for reporting would be possible, but possible gains in terms of time should be evaluated against the increase in the administrative burden derived of the need of reporting at different times for emissions and for activity levels.
12.3.Preferred alternative
Flexibility can be provided to Member States regarding the specific deadline to be set for reporting activity level changes. At the same time, in order to ensure that activity level changes will be reported a maximum deadline should be set. This would ensure the effectiveness of the system by avoiding the legal vacuum that would be created if no absolute deadline would be set. It is proposed to set an absolute deadline by the 31 March, thus allowing Member States to implement the reporting of activity levels together with the reporting of emissions.
It is to be noted that if Member States would decide to combine the reporting of activity and the reporting of emissions, free allocation would in most cases only be granted after 30 April of the year in question, the compliance deadline for the previous calendar year.
Member States would have two possibilities in cases where activity level reports have not been received by 28 February. They could decide not to issue allowances until the report is received, or they could issue the allowances if they are able to claim excess allowances back if it is determined afterwards that the level of allowances issued was excessive or to issue more if the level of allowances was too low.
13.New sub-installations and cessation of operation of sub-installations
The implementing act should address the issues of processing cessations of operations at sub-installation level and the temporary cessation of operations as they constitute special cases of activity level changes.
In addition, new sub-installations also need to be considered (which started after 1/1/2018), another special case of activity level changes. According to Art 16 (2) of the FAR, they should receive allocation based on the first full calendar year of operation, which needs to be handled outside the 2019 NIMs exercise. This case needs to be integrated into the reporting and adjustment procedures.
The FAR provides rules for the cessation and suspension of operations of installations in its Article 26.
Regarding the cessation of operations, according to this Article, an installation is deemed to have ceased operations where any of the following conditions is met:
·The relevant greenhouse gas emissions permit has been withdrawn;
·The installation is no longer operating and it is technically impossible to resume operation.
Out of these two criteria, only the second one would apply to a sub-installation. If a sub-installation is no longer operating and it is technically impossible to resume operation, the sub-installation shall be considered to have ceased operations. In this case, no allowances shall be issued for the year following the cessation of operations.
In addition, the rules to be set should be equivalent for new sub-installations in incumbent installations and for new entrants, in order to avoid different treatments based solely on where the investment has taken place.
14.Public consultation
Input on the different alternatives discussed in these document has been gathered via the Climate Change Expert Group (CCEG) and via a public consultation.
14.1.Expert consultation in the CCEG
The CCEG, composed by representatives from Member States and stakeholders discussed in several occasions the different aspects of the act of modifications to free allocation due to activity level changes. In particular the issue was discussed during the meetings of 11 December 2018, 24 January 2019 and 19 March 2019. The results of the consultation are as follows:
·For the linear vs the staged approach for allocation changes beyond the 15% threshold, the opinions were evenly distributed. Around half of Member States and a majority of industry would prefer a linear approach while the other half of Member States and environmental NGOs would prefer a staged approach. The preferred size of the steps for those opting for a staged approach seemed to be between 5% and 15%.
·A Member State, proposed to use a mixed approach, in which intervals are used for deciding whether a change needs to take place but changes are processed in a linter manner when done. This proposal was supported by a relevant number of Member States.
·A majority of members of the CCEG would like to establish a minimum threshold below which no changes would be processed. Regarding the value of the threshold, 100 allowances and 500 allowances were the values more repeated.
·All members of the CCEG expressing an opinion for starting allocation level changes due to activity level changes already in 2021.
·A majority of the Member States and stakeholders present in the CCEG asked the Commission to clarify the rules regarding energy efficiency measures and other modifications in sub-installations using the heat or fuel benchmark. They consider that the ETS should not jeopardise investment aimed at improving energy efficiency.
·A relevant number of members of the CCEG, mostly coming from industry, but also several Member States asked for the establishment of a threshold in absolute terms above which allocation changes would be processed independently of the 15% threshold being reached.
14.2.12-weeks public consultation
The Commission published a public consultation which was available for 12 weeks regarding the different possibilities discussed. In total 105 replies were received.
Almost one quarter of the participants in the public consultation represented groups at European level, mostly industry. Regarding participants steaming from a single Member State, Germany was the Member State from which more opinions were submitted (21), followed by Spain (10), Poland (8), France (7) and Italy (6). In total contributions from 19 countries under the ETS were received.
Industry associations were the more active in the public consultation. Industry associations with a national scope submitted 32 submissions while 24 European industry associations contributed to the public consultation. In addition 29 large companies, 3 SMEs, 7 citizens, 3 representatives of academia, 4 national administrations, 1 regional administration and 2 environmental NGOs contributed to the public consultation. In total, industry represented 84% of the contributions.
Regarding the preference of the linear of a stage approach, a majority of members of the participants in the public consultation preferred the linear approach (85). Regarding the stage approach the 10% interval size was the preferred one (7).
The alternative of not setting a minimum threshold was supported by 39 participants, while 14 had no preference. 49 participants advocated for setting a minimum threshold below which no changes would be processed, the most repeated value was 100 allowances (20) but a minimum threshold of 500 allowances or more was preferred by 26 participants.
A relevant majority of participants indicated that they would like to start allocation changes based on production level changes by 2021 (80), compared to the 15 participants who said that allocation changes should start in 2023 and the 6 which indicated that they should start in 2022.
Other aspect were mentioned as relevant by an important number of participants:
·Reporting activity level data together with emissions data (44);
·Establishing a quantitative maximum threshold above which allocation changes would take place independently of the 15% relative threshold being reached or not (22);
·Providing guidance on how to address energy efficiency (17);
·Providing a simplified process for making allocation level changes for installations with low emissions (13).
A specific question on possible measures to be taken in order to prevent manipulation or abuse of the system was included in the public consultation. A majority of respondents did not reply to this question (55) while a sizeable number of them replied that such measures were not needed (15).
Several industry representatives (13) consider that the linear approach regarding allocation level changes is the one less vulnerable to any manipulation of production levels. Several industry representatives (6) claim that the establishment of a maximum threshold would reduce the risk for manipulation, but no further reasoning is provided.
A NGO encouraged the Commission to include a specific chapter in the annual Report on the Functioning of the European carbon market (as foreseen in Art. 10(5) of the ETS Directive) on the implementation of this act on free allocation adjustments due to activity level changes. According to them this chapter should provide aggregated information on the application of the allocation adjustments per sector. According to them, the act should also clarify how activity level changes compare to the threshold levels in order to monitor any manipulation of the rules by adjusting production levels to maximise the amount of free emission allowances to installations.
14.3.Feed-back Period
The draft Regulation was published for feedback between the 11 June and 9 July 2019. 48 replies were received, mostly from industry (companies, national associations and European associations), in addition one Member State provided comments.
In line with the comments received during the 12-weeks public consultation, industry representatives had a preference for the “linear approach” to be used for processing allocation level changes. In addition, several participants consider that physical changes to a sub-installation should be treated as a new sub-installation.
18 respondents repeated the idea of establishing a maximum threshold, independent of the 15% value established in the ETS Directive, which would trigger allocation level changes.
Lighter verification requirements for small installations and installations with no changes were also mentioned.
Regarding the specific provisions on energy efficiency, 8 respondents said that no minimum threshold regarding the energy efficiency increase should be established.
15.Monitoring and evaluation
The Commission will have information regarding the number of allocation changes processed every year and its impact in terms of free allocation. In consequence the impact of the implementing act will be monitored closely.
The changes processed, if they lead to a higher level of free allocation, will have an impact on the number of allowances available in the New Entrants Reserve (NER). DG CLIMA regularly provides updates on the number of allowances available in the NER and this is expected to continue throughout phase 4 of the ETS.
Data on allocation changes would be the basis for any evaluation of the implementing act to be made in the future. This evaluation should take place by the end of phase 4 and before the preparation of any change in the EU ETS Directive in what concerns free allocation for installations.
Annex I – Public consultation questionnaire
Introduction
The revised EU ETS Directive establishes that free allocation to industry will continue after 2020 as long as no comparable efforts are undertaken in other major economies.
Free allocation is thus a transitional measure foreseen to address the risk of carbon leakage which is defined as the risk of an increase in global emissions following relocation of industry due to climate policies to third countries with no or limited carbon constraints.
In order to implement free allocation for the 4th trading period of the EU ETS from 2021 to 2030, the Commission needs to develop a series of regulatory acts. One of these acts will focus on the rules for adjusting free allocation due to activity level changes.
While the revised EU ETS Directive establishes the main rules for adjusting free allocation to activity level changes, more detailed implementation requirements need to be determined. The Directive establishes that the level of free allocation will be adjusted, as appropriate, if activity levels change by more than 15% evaluated on a rolling average of two years.
The Directive adds, that in order to implement this provision, the Commission may adopt implementing acts defining further provisions for the adjustments of the level of free allocations given to installations whose operations have increased or decreased. In particular, the Commission should be able to consider further measures to be put in place, such as the use of absolute thresholds regarding the changes to allocations, or with respect to the deadline that applies to the notification of changes in production. Furthermore, manipulation or abuse of the system should be prevented and any undue administrative burden should be avoided.
In this context, this consultation seeks the views of the stakeholders on the issues that remain to be decided before the Commission can determine the rules to be applied to adjustments to free allocation due to activity level changes for the period 2021 to 2030. The results of this consultation will be analysed, published and incorporated in the Staff Working Document that will accompany the implementing act on allocation changes due to activity level changes.
Wherever possible, it would be useful if stakeholders provide references to concrete evidence and facts in support of their answers.
Questions
Article 10a of the revised ETS Directive establishes that the level of free allocations given to installations shall be adjusted in case the operations have increased or decreased by more than 15 % compared to the level initially used to determine the free allocation assessed on the basis of a rolling average of two years. In addition, other elements of the allocation adjustments need to be determined.
Question 1
Which of the following options do you consider preferable for an adjustment of allocation to activity level changes per sub-installation:
a.For changes in activity level of more than 15%, the allocation should be adjusted proportionally to the actual change, i.e. an increase/decrease of activity by 19% would lead to an adjustment of 19% of allocation;
b.A first allocation adjustment should be applied for a 15% increase or decrease in activity level. Subsequent allocation adjustments will be made within intervals of an amplitude of 10%, i.e. an increase/decrease of activity by 19% would lead to an adjustment of 15% of allocation; an increase/decrease in activity of 38% would lead to an adjustment of 35% of allocation; an increase of activity of 98% would lead to a 95% adjustment in allocation;
c.A first allocation adjustment should be applied for a 15% increase or decrease in activity level. Subsequent allocation adjustments will be made within intervals of an amplitude of 15%; i.e. an increase/decrease of activity by 19% would lead to an adjustment of 15% of allocation, an increase/decrease of activity of 38% would lead to an adjustment of 30% of allocation; an increase of activity of 98% would lead to a 90% adjustment in allocation;
d.A first allocation adjustment should be applied for a 15% increase or decrease in activity level. Subsequent allocation adjustments will be made within intervals of an amplitude of 30%; i.e. an increase/decrease of activity by 19% would lead to an adjustment of 15% of allocation, an increase/decrease of activity of 38% would lead to an adjustment of 15% of allocation; an increase of activity of 98% would lead to a 75% adjustment in allocation;
e.No preference / Don’t know.
Question 2
With the aim to reduce the administrative burden, do you consider that a minimum quantitative threshold should be introduced to determine whether the level of free allocation shall be adjusted? An adjustment would then take place only if the change would lead to an increase/decrease by a minimum of X EUAs.
a.Yes, a minimum threshold of 100 allowances;
b.Yes, a minimum threshold of 500 allowances
c.No quantitative minimum threshold shall be established;
d.No preference / Don’t know;
e.Yes, a minimum threshold shall be established but another value shall be used.
If your answer to question 2 is e, please specify the value preferred below and give a justification:
[Answer: free text, maximum 1000 characters]
Question 3
In your opinion, when should activity level data start to be collected and when do you consider that allocation adjustments shall begin in the first allocation period 2021-2025:
a.Allocation changes shall start in 2023 based on the activity level data collected from the years 2022 and 2021;
b.Allocation changes shall start in 2022 based on the activity level data collected from the years 2021 and 2020;
c.Allocation changes shall start in 2021 based on the activity level data collected from the years 2020 and 2019;
d.No preference / Don’t know.
Question 4
In phase 4 of the EU ETS, activity level data will be collected for each installation at sub-installation level on an annual basis. This data will need to be verified and reported. In your opinion, how can the administrative burden be minimised while the robustness of collected data is ensured:
[Answer: free text, maximum 3000 characters]
Question 5
If, in your opinion, there are other aspects which should be considered when developing detailed rules on free allocation adjustments due to production level changes, please describe them:
[Answer: free text, maximum 3000 characters]
Question 6
Do you see a need for further safeguards to prevent manipulation or abuse of the system?
[Answer: free text, maximum 3000 characters]
Annex II – Shifting of production between installations
It has been mentioned that operators with several installations in the ETS producing the same product could have the incentive to shift production between them in order to maximise their allocation. By reducing the production in several installations without triggering the thresholds for the level of allocation being reviewed while increasing production in other installations above the 15% threshold, the total allocation to all installations would increase without having a global increase in activity.
It is generally considered that production decisions depend on a series of factors of which free allocation is one. Proximity to markets, energy prices, labour costs etc. are not impacted by the level of free allocation. Furthermore, it is often technically not possible to increase or reduce production by a given percentage, due to capacity restrictions or the need for continuous operations.
The possible incentives for this manipulation have been analysed for an ETS sector which is considered representative for doing this analysis for a series of reasons:
·The product is relatively uniform, the production is interchangeable, so theoretically production could be shifted between plants;
·The level of emissions and free allocation of the sector are high so economic incentives linked to carbon costs are also relevant.
·Data for more than 200 plants in the EUTL is available (emissions and free allocation);
·Several companies exist with several plants in different MS.
Emissions data for the years 2013 to 2016 has been analysed for 3 companies. One company with 25 plants distributed in 8 MS, a second company with 17 plants distributed in 10 MS, and a third company with 11 plants distributed in 6 MS.
As discussed in previous sections, emission data is considered the only proxy available for estimating production during phase 3.
2013 has been considered as the baseline for the emissions of the plants. The relative increase or decrease of emissions compared with 2013 has been calculated for the subsequent years [in %]. The results of the analysis are presented below.
The variation of emissions at aggregate company level has also been calculated:
|
Company
|
2013
|
2014
|
2015
|
2016
|
2017
|
|
A
|
0.00%
|
2.59%
|
-1.21%
|
2.03%
|
-0.63%
|
|
B
|
0.00%
|
3.89%
|
11.05%
|
6.59%
|
9.74%
|
|
C
|
0.00%
|
4.03%
|
5.72%
|
4.39%
|
1.86%
|
The data analysed is limited to phase 3 of the ETS, as mentioned previously in the document, the allocation level changes rules will be different in phase 4. Nevertheless, no correlation patterns have been identified. The variability in the emissions of different plants is above the variability of emissions at company level.
4 plants in total ceases operations during the period.
No trend has been identified by which it could be claimed that production was shifted between installations, even considering that for the installations ceasing operations no allocation would have been granted so an economic incentive to shifting some production to them was present.
For the example analysed there is no evidence of companies shifting production between installations in the past in order to avoid possible reductions in the level of free allocation. This confirms the above analysis that the incentives and the possibility to shift production are in reality very limited.