 EUROPEAN COMMISSION
Brussels,7.3.2018
SWD(2018) 217 final
COMMISSION STAFF WORKING DOCUMENT
Country Report The Netherlands 2018
Including an In-Depth Review on the prevention and correction of macroeconomic imbalances
Accompanying the document
COMMUNICATION FROM THE COMMISSION TO THE EUROPEAN PARLIAMENT, THE COUNCIL, THE EUROPEAN CENTRAL BANK AND THE EUROGROUP
2018 European Semester: Assessment of progress on structural reforms, prevention and correction of macroeconomic imbalances, and results of in-depth reviews under Regulation (EU) No 1176/2011
{COM(2018) 120 final}
Contents
Executive summary
1.Economic situation and outlook
2.Progress with country-specific recommendations
3.Summary of the main findings from the Macroeconomic Imbalance Procedure in-depth review
3.1.Imbalances and their gravity
3.2.Evolution, prospects and policy responses
3.3.Overall assessment
4.Reform priorities
4.1.Public finances and taxation
4.2.Financial sector
4.3.Labour market, education and social policies
4.4.Investment*
4.5. Sectoral policies
Annex A: Overview table
Annex B: Macroeconomic Imbalance Procedure Scoreboard
Annex C: Standard tables
References
LIST OF Tables
Table 1.1:Key economic and financial indicators
Table 2.1:CSR progress
Table 3.1:MIP assessment matrix (*) – the Netherlands
Table 4.1.1:Total public funding for R&D and innovation, 2015-201722
Table 4.2.1:Financial soundness indicators
Table 4.4.1:Investment by sector NL and euro area (% of GDP)
Table 4.4.2:Non-financial corporate sector income sheet
Table 4.5.1:Total productivity growth, 1995-2015 (%)
Table B.1:The MIP scoreboard for the Netherlands (AMR 2018)
Table C.1:Financial market indicators
Table C.2:Headline Social Scoreboard indicators58
Table C.3:Labour market and education indicators59
Table C.4:Social inclusion and health indicators60
Table C.5:Product market performance and policy indicators61
Table C.6:Green growth62
LIST OF Graphs
Graph 1.1:
GDP per capita (volume, index 2010=100)
Graph 1.2:
GDP volume and pre-crisis trend
Graph 1.3:
GDP Growth and contributions
Graph 1.4:
Labour market developments
Graph 1.5:
Wage growth: actual and predicted based on economic fundamentals
6
Source: European Commission (see Kiss and Arpaia, 2011)
6
Graph 1.6:
Trends in labour costs and its components
7
Graph 1.7:
Average annual real income gain/loss compared to previous generation*
7
Graph 1.8:
Net wealth by age
8
Graph 2.1:
Overall multiannual implementation of 2011-2017 CSRs to date
10
Graph 4.1.1:
Average headline budget balance in different states of the economy
21
Graph 4.2.1:
Size of the financial intermediaries and of the debt securities market
23
Graph 4.2.2:
House price developments
24
Graph 4.2.3:
House price valuation
25
Graph 4.2.4:
Private debt
27
Graph 4.2.5:
Debt of large non-financial corporations
27
Graph 4.2.6:
Intra-group-to-total debt
28
Graph 4.2.7:
Interest paid and received by multinationals
28
Graph 4.2.8:
Compulsory payment wedge (2016)
29
Graph 4.3.1:
Main labour market developments
31
Graph 4.3.2:
Relationship between unemployment and nominal wage growth (2001-2016)
31
Graph 4.3.3:
Share of part-time work with and without children (2016)
33
Graph 4.3.4:
Female labour market participation (with child)
33
Graph 4.3.5:
Employment (20-64 year) by type (y-o-y changes)
35
Graph 4.3.6:
Self-employed by sector ( % of total employment in the sector)
35
Graph 4.3.7:
Transition rate from temporary to permanent employment by quarter
36
Graph 4.4.1:
Investment by asset
40
Graph 4.4.2:
Domestic and foreign investment
40
Graph 4.4.3:
Net lending/borrowing by sector
41
Graph 4.4.4:
Non-financial corporate sector saving and investment
41
Graph 4.4.5:
Gross savings by non-financial corporations
41
Graph 4.4.6:
Gross operating surplus and components
42
Graph 4.4.7:
Net operating surplus by sector
42
Graph 4.4.8:
Net distributed income ratios
43
Graph 4.4.9:
Corporate savings by firm size
43
Graph 4.4.10:
Current account
44
Graph 4.4.11:
Trade balance goods by product group (2016)
44
Graph 4.4.12:
Trade balance services by product group (2016)
44
Graph 4.4.13:
NIIP and cumulative current account surplus
45
Graph 4.4.14:
Euro area output and aggregate demand
45
Graph 4.5.1:
Contributions to changes in growth of real value added
47
Graph 4.5.2:
Productivity development by sector
47
Graph 4.5.3:
Productivity growth by firm productivity level (leaders/laggards)
48
Graph 4.5.4:
R&D intensity in manufacturing
49
LIST OF Boxes
Box 2.1: Tangible results delivered through EU support to structural change in the Netherlands
Box 3.1: Euro area spillovers
Box 4.3.1: Monitoring performance in light of the European Pillar of Social Rights
Box 4.3.1: Implications of temporary employment on income
Box 4.4.1: Investment challenges and reforms in the Netherlands
Box 4.5.1: Policy highlight: Public procurement expertise centre in the Netherlands
Executive summary
The Netherlands’ economic expansion remains strong and offers a window of opportunity to boost the reform momentum. In its coalition agreement 2018-2021, the new government announced a number of measures in the field of fiscal policy, housing market, labour market and pensions. Ensuring that these measures are swiftly implemented would improve domestic demand and support potential growth. While measures have been announced to reduce the debt bias for households, incentives to incur debt remain. The labour market continued its recovery in 2017 and performed well across the board, although the challenges in the field of pensions and labour market segmentation remain.(
)
Economic growth accelerated to 3.1 % in 2017, the fastest in a decade. The solid economic performance in 2017 was broad based, with both domestic demand and net exports making a positive contribution to growth. The European Commission’s Interim Winter 2018 forecast projects economic growth of 2.9 % for 2018 and 2.5 % for 2019, with the domestic economy’s strong performance expected to continue. The growth contribution from net exports is expected to be fairly limited given strong domestic demand, which drives up imports.
The investment rate has returned to its long-term average. Residential investment volumes in particular have been highly cyclical, dropping sharply after the crisis and experiencing double-digit growth in recent years. Corporate investment in equipment grew in line with GDP and is expected to accelerate on the back of rising capacity utilisation rates. Public and private investment in R&D increased to 2.0 % in 2016, falling short of the Europe 2020 target of 2.5 % of GDP. While barriers to private investment appear to be minor, procedures for obtaining building permits are lengthy compared to other Member States.
A buoyant housing market boosts household assets, but may also lead to further imbalances. Driven by low interest rates, house prices and transaction volumes have increased sharply in recent years. Rising house prices have positive wealth effects and gradually lift affected households out of negative housing equity. At national level, house price valuation indicators do not point to overvaluation. However, there are signs that house price increases in some regions cannot be explained by fundamental factors alone. Nominal debt levels have started to rise again, albeit much slower than house price growth, which limits financial vulnerabilities.
Wage growth remained moderate despite a tightening labour market. In 2016, wage growth outpaced productivity gains, resulting in a small increase in the nominal unit labour cost. However, taken over a longer period wage growth has been below the level that could be expected based on fundamental drivers such as unemployment, productivity and inflation. In the next years, wage growth is expected to increase in line with further labour market tightening.
The new government announced a large discretionary fiscal stimulus package for 2018-2021. The budget surplus is expected to have increased to 0.7 % in 2017, while the general government debt-to-GDP ratio fell below the 60 % threshold. The government announced increased spending on social affairs (in particular child-related benefits), defence, education and innovation. The budgetary framework has been amended to exclude a number of cyclical expenditures from its fixed budgetary ceilings. This improves its stabilisation function on the expenditure side, while increasing the cyclicality of the budget. Fiscal sustainability has improved thanks to headline budget surpluses, higher GDP growth and a favourable public debt trajectory. This has led to the Netherlands being designated as ‘low risk’ based on the Commission’s baseline medium-term projections.
Some indicators suggest that the Netherlands' tax rules are used by multinationals engaged in aggressive tax planning structures. The Netherlands has taken steps to amend certain aspects of its tax system that may facilitate aggressive tax planning, and the government has announced a reform agenda to further amend certain aspects of the tax system. For the time being, the absence of withholding taxes on dividend payments by co-operatives, the possibility for hybrid mismatches using the limited partnership (CV) and the absence of withholding taxes on royalties and interest payments, combined with the lack of some anti-abuse rules, may facilitate aggressive tax planning.
The Netherlands has made some progress in addressing the 2017 country-specific recommendations (CSRs). Substantial progress has been made in supporting potential growth and domestic demand; some progress has been made in R&D investment. The government announced that it will speed up the cut in tax relief on mortgage interest payments, and included it in the coalition agreement. However, only some steps were taken to reduce remaining distortions in the housing market, leading to some progress overall on CSR 1. The Netherlands has made limited progress in tackling remaining barriers to hiring staff on permanent contracts. No concrete measures have been taken yet to reduce distortive tax incentives that favour self-employment or to increase the social protection coverage for the self-employed. The government reaffirmed its intention to reform the second pension pillar, although no new measures have been taken since the CSRs were adopted.. Limited progress has been made in creating conditions to promote higher real wage growth while respecting the role of social partners, leading to limited progress overall on CSR 2.
On progress in reaching the national targets under the Europe 2020 Strategy (see also Annex A), the Netherlands is doing well on employment, greenhouse gas emissions, energy efficiency, early school leaving and tertiary education attainment. However, more effort is needed on R&D investment, renewable energy and poverty reduction.
The Netherlands performs relatively well on the indicators of the Social Scoreboard supporting the European Pillar of Social Rights. The labour market performance and social outcomes are good and inequality is low. Few young people are not in employment, education or training. The share of people at risk of poverty or social exclusion is low. However, certain issues merit attention such as low but slightly increasing income inequality and good but weakening impact of social transfers in reducing poverty.
The main findings of the in-depth review contained in this report, and the related policy challenges, are as follows:
·Housing market institutions have contributed to high household debt levels, and inefficiencies remain. Owner-occupancy rates are high and have been strengthened by the generous tax relief on mortgage interest payments. Before the crisis, interest-only mortgages and very high loan-to-value ratios drove up household indebtedness to around 120 % of GDP in 2009. Although it is falling gradually, the household debt-to-GDP ratio is still twice the euro area average. While mortgage tax relief is being cut gradually, the effective subsidy to debt-financed homeownership remains substantial.
·The financial attractiveness of owner-occupancy and social housing partly accounts for the underdeveloped private rental market. The social housing and rent-controlled sector is large compared to other Member States. The private rental market is the only non-subsidised housing sector and remains underdeveloped. The lack of a well-functioning middle segment on the rental market encourages households to buy rather than rent, leading to high debt-to-income ratios and financial vulnerability at a young age.
·The current account continues to show a marked surplus. The Netherlands has had a current account surplus of 6 % of GDP on average for the last 30 years. This high level is mostly accounted for by the non-financial corporate (NFC) sector. A comparatively large corporate savings surplus is rooted in a relatively high operating surplus, together with high foreign investment income and low levels of profit distribution by multinationals. After the crisis, household debt reduction together with fiscal consolidation saw the current account surplus peak at 10.3 % of GDP in 2012, after which it declined to 9 % in 2016. The European Commission’s Autumn 2017 forecast projects a gradual decline in the current account balance following buoyant domestic demand. Simulations in this report show that an increase in public investment would reduce the trade surplus and would also be passed on to the euro area through potential spillover effects, leading to higher economic growth of the other euro area countries.
·The second pillar pension system plays a key role in shaping household finances, especially in combination with high mortgage debt. While the pension system performs well on pension adequacy and fiscal sustainability, it holds drawbacks in terms of intergenerational fairness, transparency and flexibility. Moreover, second pillar pension contributions are high and fluctuate depending on the financial performance of pension funds. As such, it may affect household spending in a pro-cyclical way, with risks seemingly to weigh on young age groups as lower indexation and higher pension contributions have been the primary means of adjustment. Importantly, households combine substantial housing and pension wealth with high mortgage debt. However, the former are highly illiquid and unevenly distributed across generations. This makes households vulnerable to economic shocks and accentuates the pro-cyclical dynamics of household finances.
Other key structural issues analysed in this report which point to particular challenges facing the Dutch economy, are as follows:
·Despite a reduction in the tax burden, non-tax compulsory payments are expected to remain high. The Dutch government announced a tax reform for 2019 that will reduce the number of tax brackets from four to two and lower the top tax rate from 52 % to 49 %. The overall income tax burden is expected to decline. However, non-tax compulsory payments such as pension contributions and healthcare premiums drive up the total compulsory payment wedge on labour. While this may be equitable, it could also give rise to other inefficiencies, especially in terms of the above-mentioned link between compulsory pension contributions and household finances.
·The labour market continued its recovery in 2017 and performed well in terms of job creation, although the challenges of labour market segmentation and integration of people with a migrant background remain. Total employment rose steadily, while the unemployment rate continued to fall in 2017. Flexible employment constitutes a relatively large and increasing share of the labour market. The self-employed are not obliged to be insured against labour-related risks such as accidents at work, unemployment and old age (second pillar); which could affect the sustainability of the social security system in the long run. The new government announced several measures potentially addressing segmentation, but the specifics, timeframe and possible impact remain unclear. Finally, there is still untapped labour potential in the high number of women working part-time and also people born outside the EU given that their employment rate lags behind that of those born in the Netherlands.
·School education outcomes are above the EU average, but have worsened since 2012. In the 2015 Programme for International Student Assessment (PISA), the proportion of low achievers increased in all three core fields. Differences between schools have one of the biggest impact on pupils’ performance, and are strongly linked to the different educational tracks they offer.
·According to worldwide rankings, the Netherlands has an efficient and productive R&D sector, but growth-friendly public expenditure is lower than that of top performers. The country’s high-performing education system and scientific base provide a sound basis for boosting innovation and growth capacity through education and R&D activities. Although substantial additional investment has been announced, public R&D intensity is set to decline.
·The reduction of CO2 emissions is on track, but the share of renewable energy production is low. The Netherlands is expected to miss its national target of 14 % renewable energy production by 2020, with the National Energy Outlook 2017 estimating a renewable energy share of 12.5 % by 2020.
1.
Economic situation and outlook
GDP growth
Economic growth has accelerated to 3.1 % in 2017, the highest rate in 10 years. This expansion follows on the back of a relatively strong recovery in recent years, but it should be seen in the context of a prolonged double dip in 2012-2013. While the acceleration of economic growth in 2016 was mostly driven by labour utilisation (the number of hours worked), both labour utilisation and productivity growth contributed to GDP per capita growth in 2017 (by 2 percentage points and 1 percentage point respectively). In per capita terms, GDP is 3 % above pre-crisis peaks and is growing rapidly (see Graph 1.1). That said, under the assumption that economic growth returns to potential growth rates after 2019, the permanent impact of the crisis is estimated at roughly 4 % of GDP (see Graph 1.2) (
).
|
Graph 1.1:GDP per capita (volume, index 2010=100)
|
|

|
|
Source: European Commission (Eurostat)
|
As the business cycle matures, private consumption is expected to be the main growth driver. According to the European Commission’s Winter 2018 Interim Economic Forecast, real GDP is projected to increase by 2.9 % in 2018 and 2.5 % in 2019. Private consumption is set to pick up as wage and employment growth improve household disposable income, while rising house prices lead to positive wealth effects. As a result of the new government’s fiscal plans, public consumption is set to increase by almost 3 % in real terms in 2018 and 2019. Corporate investment in equipment is expected to grow as capacity utilisation rates have reached pre-crisis levels. However, this is partly offset by a slowdown in residential investment, which has recorded double-digit growth in recent years. The growth contribution from net exports is expected to be fairly limited given strong domestic demand, which drives up imports (see Graph 1.3).
|
Graph 1.2:GDP volume and pre-crisis trend
|
|

|
|
Source: European Commission. The pre-crisis trend is approximated by a linear estimate on Q1-2001 to Q4-2007.
|
Inflation
Inflation is picking up. Driven mainly by energy prices, consumer price inflation is expected to reach 1.3 % in 2017 after remaining muted in 2015 and 2016. Looking ahead, inflation is expected to pick up further based on higher wage growth, which drives up prices in particular in the service sector. In 2019, inflation is expected to increase to 2.3 % as the planned increases in indirect taxes (VAT and energy taxes) kick in.
|
Graph 1.3:GDP Growth and contributions
|
|

|
|
Source: European Commission (Winter 2018 Interi,m Economic forecast)
|
Labour market
Employment growth accelerated further in 2017. Employment growth increased from 1 % year-on-year in 2015 and early 2016, to 2.1 % in 2017. The increase in the number of employed persons is mainly due to an increase in temporary and self-employment, although the number of permanent contracts has also increased in the final quarters of 2017 after a period of negative growth. The unemployment rate fell to 4.9 % of the labour force in 2017, down from 6.0 % in 2016 and well below the EU average. Long-term unemployment, which increased substantially since 2009, declined for all age groups. In Q3-2017 it reached 1.9 % of the labour force, down from 2.4 % in Q3-2016 (see Section 4.3). While overall labour market participation remains high, an untapped potential remains, especially related to part-time employment of women and for people with a migrant background.
Wage growth has been moderate in the recent years, but is expected to pick up as a result of a tightening labour market. In 2017, nominal compensation per employee is expected to have increased moderately by 1.7 %. This is below the level that could be expected based on the level of the economic fundamentals. For 2018, trade unions have formulated substantially higher wage demands compared to previous years. In combination with a tightening of the labour market, this is expected to result in an acceleration of nominal wage growth over the coming years. Nevertheless, wage growth remains low in comparison with fundamental drivers (see Graph 1.5).
|
Graph 1.4:Labour market developments
|
|

|
|
Source: European Commission (Statistics Netherlands; seasonally adjusted data)
|
|
Graph 1.5:Wage growth: actual and predicted based on economic fundamentals
|

|
Source: European Commission (see Kiss and Arpaia, 2011)
|
Unit labour costs are expected to increase in the coming years. In 2016, real compensation per employee increased by 0.6 %, which resulted in a slight increase in unit labour costs (0.3 %). However, in 2017 and 2018, a tightening of the labour market is expected to push up real wage growth. In combination with low productivity growth, this is expected to result in a stronger increase in unit labour costs (1.8 % in 2018). This level is above the average in the euro area, indicating the risk of a slight loss in competitiveness. However, from a long run perspective cost competiveness in the Netherlands evolved broadly in line with the euro area as the accumulated increase in unit labour cost in the period 2002-2016 was very similar in the Netherlands (24.5 %) as compared to the euro area (25.4 %) (see Graph 1.6).
|
|
|
Graph 1.6:Trends in labour costs and its components
|
|

|
|
Source: European Commission (Eurostat)
|
Social developments
Income inequality is relatively low compared to the EU average. The Netherlands displays comparatively good outcomes with respect to social protection and inclusion. By international standards poverty is low, and taxes and transfers are effective in reducing income inequality and poverty. However, the capacity of the social system to reduce poverty shows signs of weakening (see Section 4.3).
There are signs that intergenerational income inequality is increasing. In theory, young cohorts typically earn more than older generations at the same age as economic growth translates into real income gains over time. This is also largely supported by income data for Dutch households: for any given age, younger birth cohorts earn more than previous birth cohorts (see Graph 1.7 which shows the average income difference with the previous birth cohort). For most birth cohorts, this income gain is roughly EUR 3 000 per year. Although there are increasingly few data points, it is striking that very young income earners on average earn less than previous generations. This could be a consequence of the economic downturn during the years after 2008.
|
Graph 1.7:Average annual real income gain/loss compared to previous generation*
|
|

|
|
Source: European Commission (Statistics Netherlands, household income data). *) 5 year birth cohort.
|
Inequality in net wealth is partly explained by household debt and life cycle patterns. The relatively high inequality in net wealth is to a large extent driven by high mortgage debt and negative net housing equity ('underwater mortgages', see Section 4.2.4). Excluding households with negative wealth, inequality in net wealth is much lower and more in line with other EU countries. Life cycle patterns are also important. As wealth represents cumulated savings over the years, a large proportion of total net wealth is concentrated among relatively old households. Median net wealth grows until the age of 65 where it peaks around EUR 100 000, after which it starts to decline (see Graph 1.8). Net wealth inequality tends to be smaller within age groups than between, which implies that the distribution is less skewed from a life cycle perspective.
|
Graph 1.8:Net wealth by age
|
|

|
|
Source: European Commission (based on Statistics Netherlands wealth data for 2014)
|
External position
The large current account surplus is expected to have increased in 2017, and to decline only slowly in the next years. Following muted domestic demand (see European Commission 2017b, Section 1.2) and a sharp recovery in international trade after the crisis, the current account surplus peaked at more than 10 % of GDP in 2012. Largely as a result of declining net primary incomes, in particular lower income from foreign direct investment, the current account surplus fell to 9 % of GDP in 2016. However, increased profitability of the foreign activities of Dutch multinationals led to an increase in the balance of primary incomes in early 2017, which improved the overall current account balance. Looking ahead, the trade surplus is projected to continue to decline, albeit slowly as buoyant domestic demand coincides with growth in world trade, which is set to continue to fuel Dutch export growth.
Public finances
Despite the new government announcing a substantial fiscal stimulus package, the budget is expected to remain in surplus over the coming years. The headline government surplus is set to fall from 0.7 % of GDP in 2017 to 0.5 % in 2018, and to rebound to 0.9 % in 2019 based on robust revenue growth and government expenditure growth below the level of nominal GDP growth. The structural budget balance, which is the nominal budget balance corrected for the impact of the economic cycle and one-off measures, is expected to have reached 0.3 % of GDP in 2017, and set to decline to -0.2 % in 2018 and -0.1 % in 2019. The debt-to-GDP ratio fell below 60 % during the course of 2017. This was mainly due to sizable stock-flow adjustments resulting from the reprivatisation of financial institutions, and strong nominal GDP growth. Debt is expected to continue to decline to 51.5 % of GDP in 2019.
|
|
|
Table 1.1:Key economic and financial indicators
|
|

|
|
Source: Eurostat and ECB as of 30 Jan 2018, where available; European Commission for forecast figures (Winter 2018 Interim forecast for real GDP and HICP, Autumn forecast 2017 otherwise)
|
|
|
2.
Progress with country-specific recommendations
Progress with the implementation of the recommendations addressed to the Netherlands in 2017(
) has to be seen in a longer-term perspective since the introduction of the European Semester in 2011. Looking at the multi-annual assessment of the implementation of the CSRs since these were first adopted, 78 % of all the CSRs addressed to Netherlands have recorded at least 'some progress'. 22 % of these CSRs recorded 'limited' or 'no progress' (see Graph 2.1). Substantial progress and full implementation have been achieved in several areas of the labour market, for instance increasing the statutory retirement age and enhancing the participation of older workers, people with disabilities and migrants. Other areas with substantial progress have been the reform of the long-term care as well as the protection of expenditure directly relevant for growth such as education, innovation and research.
|
Graph 2.1:Overall multiannual implementation of 2011-2017 CSRs to date
|
|

|
|
Source: European Commission
|
The Netherlands has secured a timely and durable correction of its excessive deficit. Following the house price correction and the financial crisis, the Netherlands went through a period marked by an increasing debt-to-GDP ratio and a worsening budget balance, leading to an excessive deficit. From 2009-2013, a significant consolidation effort led to the abrogation of the excessive deficit procedure in 2013 and has ensured continuous improvement in the budgetary situation ever since. In 2017, the Netherlands are expected to have reached a government budget surplus of 0.7 % of GDP and a debt-to-GDP ratio below the 60 % threshold for the first time since 2011. During the fiscal consolidation period, public funding to research and innovation has stabilised at around 0.9 % of GDP. This fully meets the recommendation to protect such investments. Nevertheless, at 2.0 % of GDP, the total R&D intensity has stagnated below the target of 2.5 %. This underachievement is mostly the result of low private R&D spending (1.2 % of GDP in 2016). While the figure is only slightly below the euro area average (1.4 % of GDP) it is considerably lower than in other Member States with similar levels of educational attainment and economic development (e.g. Sweden 2.3 % of GDP, and Germany 2 % of GDP).
In recent years, the Netherlands has taken substantial measures reforming the long-term care and retirement age, and announced plans to reform the second pillar of the pension system. A major reform has been implemented to decentralise long-term care, aimed at achieving efficiency gains and providing tailor-made support. Nevertheless, expenditure in this sector is still projected to increase relatively fast compared to the EU average, among others due to the implementation of a framework to improve the quality of long-term care (‘Kwaliteitskader Verpleeghuiszorg’). The statutory retirement age in the first pillar is being increased in steps to 67 by 2021 and is linked to life expectancy thereafter. The government announced that it plans to reform the second pillar of the pension system based on the previously started dialogue with social partners. Specific measures and the exact timeline have not yet been specified.
Important reforms in the housing market have been taken, but distortions remain. In line with 2017 CSR 1, the government has decided to accelerate the reduction of the generous mortgage interest tax deductibility (MID) from currently 0.5 pp to 3 pps per year from 2020 onwards until the MID reaches 37 % in 2023. A requirement to repay the mortgage principal in order to qualify for tax relief had previously been introduced as well. On the rental sector, some progress has been made by implementing a point system that allows for more market-oriented rents and higher rent increases in the regulated sector for tenants with an income above a certain threshold. By introducing short-term rental contracts, the government provides scope for a more flexible rental market, but it is too early to assess the impact of these reforms. Despite the reforms, distortions remain in the housing market, creating a debt bias and influencing the decision to buy or rent.
Substantial progress has been made on improving participation in the labour market, although important challenges remain on labour market segmentation. In recent years, the Dutch government has taken several measures such as the Participation Act (‘Participatiewet’) or the Action Plan 50+ (‘Actieplan 50+’) to improve the employability of people at the margin of the labour market, including disabled and older workers. Reforms were also carried out on employment protection and unemployment benefits to increase labour force mobility. Nevertheless, labour market segmentation remains a concern, as reflected by the absolute and relative increase in flexible employment contracts.
The Netherlands has made some progress (
) in addressing the 2017 country-specific recommendations. Substantial progress has been made on the fiscal-structural part of CSR 1, with the government set to implement additional fiscal measures in 2018 that support domestic demand, in particular increasing expenditure on security and on teachers’ salaries. From 2018 onwards, R&D investment will be increased. On the housing market, some progress has been made. The government has taken some measures to support the development of the middle segment rental market. For the owner-occupied market, the government announced that it will speed up the MID reduction from 2020 onwards until it reaches 37 % in 2023, which is still relatively high. For CSR 2, limited progress has been made as the government has only announced its intention to address the problem of labour market segmentation. Concrete measures have not yet been revealed. Wage growth is slowly increasing, with limited progress made on promoting higher real wage growth. No progress has been made on reforming the second pillar of the pension system; while the government announced its intention, no details have been communicated.
ESI Funds address key challenges to inclusive growth and convergence. In the Netherlands, this is done notably by stimulating investments in R&D in the private sector for experimental development of new products, the set-up of living labs and the stimulation of cooperation between SMEs and research institutions. ESI Funds also invest in coaching people who are at a distance from the labour market and in measures that help improve the job prospects of older workers.
|
|
|
Table 2.1:CSR progress
|
|

|
|
Source: European Commission
|
|
|
|
Box 2.1: Tangible results delivered through EU support to structural change in the Netherlands
The Netherlands is a beneficiary of European Structural and Investment Funds (ESI Funds) support and can receive up to EUR 1.9 billion until 2020. This represents around 1 % of public investment(
I
) annually over the period 2014-2018. By 31 December 2017, an estimated EUR 1.2 billion (62 % of the total) was allocated to projects on the ground. These investments helped 309 enterprises to cooperate with research institutions and 1 100 SMEs to introduce new products to the market. Furthermore, 212 000 people had benefited from actions fostering social inclusion and 5 200 enterprises received support to adapt the working environment to prolonged working lives. Out of the EU financing, EUR 97 million will be invested through financial instruments.
ESI Funds help address structural policy challenges and implement country-specific recommendations. Investments in research and development in the private sector are stimulated, among others, by providing loans, grants or guarantees for experimental development of new products, by setting-up living labs or by facilitating and stimulating cooperation between SMEs and research institutions. The Funds also invest in coaching for people with a distance to the labour market which in turn helps enhance the overall labour market participation. Furthermore, specific measures are supported which improve the job prospects of older workers.
In addition, as a precondition for ESI Funds support(
II
), the Dutch regions developed Smart Specialisation Strategies for research and innovation which help focus the resources and efforts on product specialisation with a strong market potential.
The Netherlands is also advancing the take up of the European Fund for Strategic Investments (EFSI). As of December 2017, overall financing volume of operations approved under the EFSI amounted to EUR 2.2 billion, which is expected to trigger total private and public investment of EUR 8 billion. More specifically, 17 projects involving the Netherlands have been approved so far under the Infrastructure and Innovation Window (including 4 multi-country projects), amounting to EUR 2.1 billion in EIB financing under the EFSI. This is expected to trigger about EUR 7.5 billion in investments. Under the SME Window, 7 agreements with financial intermediaries have been approved so far. European Investment Fund financing enabled by the EFSI amounts to EUR 135 million, which is expected to mobilise approximatively EUR 515 million in total investment. Over 1 100 smaller companies or start-ups will benefit from this support. Transport ranks first in terms of operations and volume approved, followed by energy and SMEs.
Funding under Horizon 2020, the Connecting Europe Facility and other directly managed EU funds is additional to the ESI Funds. By the end of 2017, the Netherlands has signed agreements for EUR 357 million for projects under the Connecting Europe Facility. For more information, see https://cohesiondata.ec.europa.eu/countries/NL
|
3.
Summary of the main findings from the Macroeconomic Imbalance Procedure in-depth review
The in-depth review for the Dutch economy is presented in this report. In spring 2017, the Netherlands were identified as having macroeconomic imbalances, in particular relating to a high current account surplus (reflecting a saving and investment balance) and a high private debt level, in particular household mortgages and non-financial corporation (NFC) debt. The Commission's 2018 Alert Mechanism Report concluded that a new in-depth review should be undertaken for the Netherlands to assess developments relating to identified imbalances. Analyses relevant for the in-depth review can be found in the following sections: the tax and regulatory framework in Section 4.1; private indebtedness in Section 4.2; wage developments in 4.3; and saving and investment imbalances in Section 4.4. Potential effects of a public investment shock on the trade balance are discussed in Box 3.1.
3.1.
Imbalances and their gravity
The Netherlands has recorded persistent current account surpluses for more than three decades. In 2016, the three-year average for the current account surplus was 8.8 % of GDP, higher than any other EU country (see Section 4.4). As such, the Dutch surplus contributed 0.6 pp to the euro area surplus in 2016 (by comparison, the German contribution was 2.4 pps). From a real trade perspective, the main driver of the current account remains the strong trade surplus in goods.
A savings-investment approach points to the non-financial corporate (NFC) sector as main driver of the surplus. The net lending is mostly explained by the strong net lending position of NFCs, which have increased their excess savings since 2 000. The high savings are also due to a sharp increase in savings by multinationals, which distribute only a low share of their profits, thereby generating a statistical upward effect on the external net lending position. In recent years, the household sector reduced its saving surplus, while the government recorded a small surplus in 2016 for the first time in eight years (see Section 4.4). Pension funds hold the largest share of household savings and invest mainly in securities and mostly abroad, which further increases the surplus. Total assets held by pension funds have reached almost 200 % of GDP in 2016, of which 17 % is invested in the Netherlands (see Section 4.2.5). The saving-investment imbalance peaked in 2012, at the midst of the prolonged second dip in the Dutch economy, partly driven by pro-cyclical pension institutions. This may point to a suboptimal allocation of resources, leaving room for increased growth and welfare.
Private sector debt remains high. In 2016, it stood at 222 % of GDP, with NFCs contributing slightly more (114 % of GDP) than households (108 % of GDP). While NFC debt has roughly remained constant in terms of GDP, household debt has increased considerably over the past 20 years. The build-up of household debt was driven by the regulatory framework, tax incentives and large increases in both house prices and associated mortgage lending. While household liabilities are high, in particular mortgage debt, they coexist with large illiquid assets in the form of housing wealth and pension wealth.
NFC debt can largely be linked to multinationals, which hold more than two thirds of total NFC debt. Foreign large NFCs hold mostly intra-group debt, on which interest is being charged by one group company to another. This suggests that debt is being used for tax reasons, as MNEs can use debt shifting to lower their tax burden via increased interest payments to other group companies.
The medium-to-large size of the Dutch economy allows for moderate outward spillovers for other Member States via the trade channel, with the exception of Belgium, where they can be relatively large. As a result of close financial interlinkages with neighbouring countries, outward financial spillovers are potentially more relevant for a wider set of countries, including France and the UK. Conversely, the high degree of economic and financial openness of the Dutch economy expose it to potentially significant inward spillovers, in particular from neighbouring Member States and from the US, along trade, financial and banking channels. Box 3.1 illustrates how a boost to government investment in the Netherlands can produce both positive domestic and cross-border effects. The simulation presented therein follows the spirit of the euro area recommendation 1(
), in particular as regards improving growth potential and fostering investment in Member States with large external surpluses.
3.2.
Evolution, prospects and policy responses
The surplus position is projected to continue. It is expected to reach 9 % in 2017, before slowing to 8.7 % in 2018 and 8.4 % in 2019, according to the European Commission Autumn 2017 forecast. The expected decline is mostly due to buoyant domestic demand (see Section 1). In the coming years, wage growth is expected to increase on the back of significantly higher wage demands by trade unions and a further tightening of the labour market. In addition, the government has announced a fiscal stimulus package, which is expected to have a dampening effect on the current account balance. Key measures include an increase in defence and security spending (EUR 1.3 billion), social transfers (EUR 0.6 billion) and salaries of primary school teachers (EUR 0.3 billion).
Private sector debt is expected to remain high. Household debt (mainly mortgages) has increased again, which can partly be attributed to rising house prices, even though credit growth remains well below house price increases. At the same time, rising house prices have positive wealth effects and will gradually lift affected households out of negative housing equity. In relative terms, the private debt-to-GDP ratio is expected to decrease, due to positive GDP growth (passive deleveraging).
The tax system currently treats mortgage and NFC debt favourably. Though the government has announced to accelerate the reduction in mortgage interest deductibility, large tax incentives to buy houses remain. The underdeveloped private rental market does not offer sufficient alternatives to buying. NFC debt is expected to remain high. In 2019, the government will implement the EU Anti-Tax Avoidance Directive (ATAD), which aims among others to discourage companies from creating artificial debt arrangements designed to minimise taxes.
3.3.
Overall assessment
The Netherlands is experiencing imbalances due to its large current account surplus and the high private debt level. The current account surplus is driven by comparatively low household disposable income(
), large foreign investments by domestic pension funds and capital flows of multinationals. The high level of private debt mainly consists of household mortgage debt and (intra-group) NFC debt; both are influenced by tax incentives. While high mortgage debt makes households vulnerable to financial shocks, this risk is limited in the case of intra-group debt of NFC debt, as this is most likely being used for tax optimisation purposes.
Both the private debt and the external surplus are expected to remain at very high levels, with a small reduction in the current account surplus in the coming years. The positive economic outlook, the government’s fiscal stimulus package and expected higher wage growth are likely to boost domestic demand and have a dampening effect on the current account balance. The budgetary stance will be less restrictive in 2018 and therefore less of a drag on domestic demand than in the immediate aftermath of the crisis, with positive effects on domestic demand and thus on the rebalancing of the current account. Private debt levels are expected to remain high as nominal debt is increasing again. The observed deleveraging has been passive, due to buoyant nominal GDP growth.
|
|
|
Table 3.1:MIP assessment matrix (*) – the Netherlands
|
|

|
|
|
|
(Continued on the next page)
|
|
Table (continued)
|
|
|
|

|
|
Source: European Commission
|
|
|
|
Box 3.1: Euro area spillovers
The new government's fiscal plans include a discretionary public spending impulse of almost 1 % of GDP in 2019 compared to a zero policy baseline. These measures are likely to yield a positive impact on economic growth in the Netherlands. High trade openness of the Dutch economy suggests potentially important spillovers to the rest of the euro area (REA), which is balanced, however, by the limited economic size of the Netherlands compared to the EA aggregate (see also European Commission, 2016a). To illustrate the size of potential GDP spillovers, this box describes the impact of a permanent debt-financed increase in productive public investment by 1 % of GDP on the Dutch GDP level, the REA GDP level and the Dutch trade balance. A public investment impulse could be motivated by a favourable debt trajectory, low borrowing costs and monetary policy constrained by a zero lower bound for interest rates. In essence, such a scenario would undo the fall in public investment since 2009.
Simulations with the European Commission's QUEST model(
III
) show a positive impact on the level of Dutch real GDP of around 0.5 % in the first year, increasing to 0.9 % after five years. The trade surplus is reduced by around 0.1 % of GDP from the first year onwards. The spillover of the domestic investment impulse via the trade channel is positive. In particular, a 1 % of GDP fiscal expansion via public investment in the Netherlands raises real GDP in the REA by circa 0.1 %.
|
4.
Reform priorities
4.1.
Public finances and taxation
4.1.1. TAXATION* (
)
New fiscal measures will reduce the tax burden on labour. The new government has announced a package to reduce income taxes by EUR 0.5 billion (0.1 % of GDP) in 2018, which will increase gradually to EUR 6.2 billion (0.9 % of GDP) in 2021. The measures are targeted at all income groups. The tax burden on labour will be reduced by lowering the income tax, which is primarily achieved by reducing the number of tax brackets from four to two, with a base rate of 36.95 % in the lower bracket and a top rate of 49.5 % (for income above EUR 68 600). Another important measure is the increase in the general tax credit and labour tax credit, which will be increased in total by EUR 1.5 billion (0.2 % of GDP) in 2019, EUR 3.3 billion (0.5 % of GDP) in 2020 and permanently to EUR 4.7 billion (0.7 % of GDP) from 2021 onwards. Child benefits and childcare allowances will be increased by EUR 0.5 billion (0.1 % of GDP) in 2019 and by around EUR 1 billion from 2020 onwards.
At the same time, some tax measures will be introduced to mitigate the drop in tax revenue. The energy tax for households will be increased, generating EUR 0.5 billion in 2018 and an extra EUR 1 billion from 2021 onwards. The reduced VAT rate will rise from 6 % to 9 %, which is expected to generate an extra EUR 2.6 billion per year from 2019 onwards. In general, the income tax package implies a tax shift away from labour to sources of revenue less detrimental to growth.
To strengthen the fiscal investment climate for companies, the corporate tax rate will be gradually reduced from 25 % to ultimately 21 % (24 % in 2019, 22.5 % in 2020 and 21 % in 2021). The low rate (in 2017 for taxable profit up to EUR 200 000) will be reduced in the same way from 20 % to 16 %.
Some indicators continue to suggest that the country’s corporate tax rules are used by companies engaged in aggressive tax planning (ATP). As shown in a study (IHS, 2018), the Netherlands' high inward and outward foreign direct investment (FDI) stocks(
) can only be explained in part by real economic activities taking place in the Netherlands. The high level of dividend, royalty and interest payments made via the Netherlands(
) (see Section 4.4) continue to suggest that the country’s tax rules are used by companies that engage in ATP. A large share of these FDI stocks is held by so-called ‘special purpose entities’ (SPE)(
). The absence of broad withholding taxes on dividend payments by co-operatives, the possibility for hybrid mismatches by using the limited partnership (CV) and the absence of withholding taxes on royalties and interest payments (which may lead to those payments escaping tax altogether, if they are also not subject to tax in the recipient jurisdiction),, combined with the lack of some anti-abuse rules, may facilitate ATP. The possibility for hybrid mismatches, using the CV will cease to exist with the implementation of the EU directive on hybrid mismatches, on the first of January 2020 at the latest.
A reform agenda has been announced to tackle certain aspects of the Dutch tax system that may facilitate ATP. Withholding taxes on interest and royalty payments will be introduced for payments to low tax jurisdictions and in cases of abuse. While the withholding tax on dividends, which is currently 15 %, will be abolished in principle, it will remain in abuse situations and for payments to low tax jurisdictions. The timeframe for these reforms as well as for introducing withholding taxes on royalties and interests is not yet clear. These plans will not affect the proposed introduction of a dividend withholding tax on payments by cooperatives that largely operate as holding/financing companies, which will enter into force on 1 January 2018. The definitions of "abuse" and "low-tax jurisdiction" in the context of the partial abolition of dividend withholding taxes and the introduction of withholding taxes on interest and royalties will be important. The interest deduction restriction of the Anti-Tax Avoidance Directive (ATAD) will be introduced in the shape of an earnings stripping measure. At the same time several existing interest deduction restrictions will be abolished, but it is not yet clear which. Section 10a of the Corporation Tax Act, which provides for a base erosion rule, will be retained. A generic minimum capital requirement will be introduced (thin cap rule) that limits interest deduction on loan capital in excess of 92 % of the commercial balance sheet total. (Foreign) investors investing via fiscal investment institutions (‘fiscale beleggingsinstellingen’) exempt from corporate tax were taxed on their property by means of the dividend withholding tax. Now that the dividend withholding tax is set to be abolished in principle, fiscal investment institutions will no longer be able to invest directly in property. This is intended to prevent such investments from avoiding both corporate tax and dividend withholding tax.
The Netherlands has taken measures to amend aspects of its tax system that facilitate ATP. The Code of Conduct Group (Business Taxation)(
) has approved the amended Dutch patent box. The old system is subject to a grandfathering clause that runs until June 2021. Under the new system(
) there will be a stronger link between the intellectual property (IP) that can benefit from the system and the R&D that created this IP. The effective tax rate of the patent box has been increased from 5 % to 7 % in 2018. While economic evidence on the effectiveness of patent boxes as a means to encourage R&D remains limited, they may be used as tax competition tools. The rules for the trust sector will be tightened. The powers of the supervisory authority for the trust sector (De Nederlandsche Bank) will be extended. In response to the Panama Papers the information position and the abuse detection capability of the tax authorities will be strengthened. In addition, the provisions of the Anti-Tax Avoidance Directives must be transposed into national law by the end of 2018 and 2019. It will be important to assess to what extent new measures, whether announced or legislated, in conjunction with the effect of the transposition of the directive, limit the scope for ATP in the Netherlands.
The tax rate on income from substantial shareholdings will increase. It will gradually rise from 25 % to 28.5 % by 2021 to maintain the balance between self-employed persons subject to income tax and self-employed persons who operate via a company subject to corporate tax. The exemption per person from the investment yield tax will increase from EUR 25 000 to EUR 30 000. The expected yield will follow real interest rates on savings more closely.
4.1.2 LONG-TERM SUSTAINABILITY OF PUBLIC FINANCE
The government debt-to-GDP ratio is declining faster than expected. In 2017, the debt ratio is expected to have reached 57.7 % of GDP, having fallen below the 60 % threshold for the first time since 2011. The debt trajectory is more favourable than expected due to higher GDP growth as well as stock-flow adjustments, which include the sale of shares of state-owned financial institutions. The Commission’s debt sustainability analysis(
) projects a further decrease to 38.6 % of GDP in 2028 (final projection year) assuming no policy change, driven mainly by primary surpluses, but also nominal GDP growth and low interest rate expenditure. With its favourable government debt trend the Netherlands remains 'low risk', based on the Commission's baseline medium-term projections.
The retirement age is linked to life expectancy in 2022. Following reforms in 2012, the retirement age will gradually rise to 67 years in 2021. From 2022 onwards, the retirement age is linked to life expectancy and is currently set at 67 years and 3 months. Due to stagnating life expectancies in the latest projections, the retirement age will not increase in 2023, which will be the first time since 2013.
4.1.3 FISCAL FRAMEWORK
The Netherlands has a well-established fiscal framework, which has been in place since 1994. The main principles are embodied in a specific law and the new government has reiterated the main principles of the framework. The main characteristics of this multi-annual trend-based fiscal framework include: (i) the use of independently derived macroeconomic assumptions; (ii) the use of inflation-adjusted(
) expenditure ceilings, which are predetermined and cover the government’s entire term of office; (iii) the use of automatic stabilisers on the revenue side, and (iv) a well-defined budgetary process for decision-making and the clear distribution of responsibilities, including the tasks of the Bureau for Economic Policy Analysis (CPB) and the Council of State (Advisory Division). The CPB carries out the independent fiscal forecast while the Council of State is tasked with monitoring compliance with numerical fiscal rules. Moreover, the commitment to comply with EU fiscal rules is embedded in the legal framework of the Netherlands.
The government aims at increasing the stabilising effect of its budget. Dutch public finances have a suboptimal track record in terms of their stabilisation function. During booms, very small budget surpluses are generated in general, which often leads to pro-cyclical measures in subsequent recessions. Although this applies to more euro area countries, it contrasts with the experience of other countries, such as Sweden and Denmark (see Graph 4.1.1) (Afman and Deroose, 2016). Last year’s report by the advisory group on budgetary issues(
), which gives general advice on the budgetary guidelines before a new government term, recommended increasing the stabilising effect of the budget. In the report, the group recommended excluding cyclical expenditure items such as unemployment benefit expenditure from the ceilings, but including interest expenditure and natural gas production. The government has followed this advice and removed some cyclical components from the expenditure ceiling, namely the non-discretionary, cyclical changes in expenditure on unemployment and social assistance. At the same time, interest expenditure and the impact of discretionary decisions on natural gas production are included. While this would further improve the macroeconomic stabilisation function of the budgetary framework, this would also make the budget more sensitive to the economic cycle, further stressing the need for fiscal prudence in economic good times.
|
Graph 4.1.1:Average headline budget balance in different states of the economy
|
|

|
|
Source: Afman and Deroose (2016); 1996-2015 average.
|
While the Dutch fiscal framework recognises the EU fiscal rules as the anchor to fiscal policy, further efficiency gains could be made. This could be achieved through further alignment, for instance when assessing fiscal sustainability or operationalising the medium-term budgetary objective within the national context (Vierke and Masselink, 2017). There are also some options available to improve flexibility in the framework while being careful not to hinder responsible budgeting; for example, the application of ‘rolling mechanisms’ with multi-annual expenditure ceilings updated on an annual basis according to predefined drivers (e.g. an update of macro conditions).
4.1.4 QUALITY OF PUBLIC FINANCE
Growth-friendly public expenditure increased slightly in 2015-2016, but remains lower than that of other ‘innovation leaders’(
). Public spending in growth-enhancing areas is of particular importance to unlock investment in knowledge-based capital and sustain long-term growth and employment. Public R&D intensity in the Netherlands gradually increased to 0.9 % of GDP in 2013, close to the average of the most advanced EU peers (1 %). Total budget appropriations for R&D amounted to 0.72 % of GDP in 2015, below those of the most advanced EU peers. Direct public funding for R&D is projected to decline until 2020 (see Section 4.5.1).
|
|
|
Table 4.1.1:Total public funding for R&D and innovation, 2015-2017
|
|

|
|
Source: Vennekens and Van Steen, 2017
|
|
|
Public investment remains strong, but spending on education is increasing rather slowly. Public gross fixed capital formation accounted for 3.5 % of GDP in 2016, above the EU average of 2.9 % (EA 2.7 %), but below that of other ‘innovation leaders’, notably Sweden (4.4 %), Finland (4 %) and Denmark (3.7 %). While the Dutch education system provides a sound basis for upgrading human capital, innovation and growth, spending on education is still below that of top performers such as the Nordic countries. In 2015, the Netherlands spent 5.4 % of GDP on education, above the EU and euro area averages but less than the top-performing peer countries such as Denmark (7.0 %), Sweden (6.5 %), Belgium (6.4 %), Finland (6.2 %) and the Baltic countries. The efficiency of public spending on education in the Netherlands is relatively high, which is also illustrated by the comparatively good educational attainment (EC, 2017f). According to the coalition agreement, the government plans to increase its expenditure on growth-enhancing areas such as R&D by EUR 600 million in 2018-2019.
4.2.
Financial sector
4.2.1. BANKING SECTOR
The Dutch banking sector remains one of the largest in the EU in terms of GDP and is highly concentrated. Its assets accounted for around 370 % of the country’s GDP in 2017 (compared to 530 % in 2007) (DNB, 2017b). Assets in the total financial system are close to eight times the GDP at the end of 2016. As for the assets of the insurance and pension sectors, they amount to 70 % and 184 % of GDP respectively whereas investment funds hold assets equivalent to 113 % of GDP (Graph 4.2.1). The Dutch banking market has one of the highest concentration levels in the EU, with the five largest banks holding 85 % of assets in 2017, compared to a euro area average of 48 % (ECB, 2017). Given the systemic relevance of those five banks, the Dutch Central Bank has ordered them to gradually build up extra capital buffers in 2016-2019. The government plans to continue the reprivatisation of ABN AMRO.
|
Graph 4.2.1:Size of the financial intermediaries and of the debt securities market
|
|

|
|
Source: ECB, European Commission
|
Financial soundness indicators of Dutch credit institutions do not give rise to stability concerns. The banks did not suffer major losses on their loan portfolios during the crisis, and the ratio of non-performing loans did not exceed 3 % in the last few years amounting to just 2.2 % in 2016. The banks maintain adequate financial resilience and sound solvency positions with capital standards well above the regulatory requirements. At sector level, the capital adequacy ratio stood at a solid 23.1 % and the Tier 1 capital ratio at 18.3 % compared to the euro area average of 17.6 % and 15 % respectively in Q2-2017 (see Table 4.2.1). The leverage of Dutch lenders – although lower than during the crisis – stands at a modest 4.7 % at sector level (DNB, 2017b), compared to the euro area average of 5.1 % (ECB).
|
|
|
Table 4.2.1:Financial soundness indicators
|
|

|
|
Source: ECB, CBD
|
|
|
The share of wholesale funding in the banking sector remains high. Deposits account for only 47 % of total funding which is well below the euro area average of 56 % (August 2017). In a stress scenario, funding costs could rise sharply impacting profitability and the net interest income of Dutch banks. On a positive note, since the crisis the maturity of market funding has been lengthened to prevent imminent liquidity risk. The deposit share has also been growing over time, which has a positive effect on the loan-to-deposit ratio which further decreased to 110.6 % in September 2016. This ratio and the banks' reliance on wholesale funding are likely to be further reduced following the increasing role of pension funds and insurance companies in the mortgage credit market. Their market share in mortgages increased from 8 % (2010) to 11 % (2016) (DNB, 2016).
The profitability of the banking sector – while remaining solid – might still be affected by prolonged low interest rates, non-bank competitors and upcoming regulatory changes. Past loans priced at high fixed interest rates – mostly mortgages – will gradually mature over the next two decades, and new loans are likely to be repriced at less profitable rates. Banks' margins and credit volumes on the mortgage credit market are coming under pressure due to increasing competition from pension funds and insurance companies – these were responsible for 20 % of new mortgages in 2016 (DNB, 2016). In other traditional banking domains – for instance payments – banks face growing competition from fintech companies following further opening of the market as a result of the adoption of the Payment Services Directive 2. The package on prudential rules recently endorsed by the Basel Committee on Banking Supervision – applicable over the next few years – will also have implications for the Dutch banks’ profitability. Given their considerable exposure to mortgages, the new rules mean that they would have to set aside additional capital, which is likely to reduce the sector's return on equity. Dutch banks are making additional efforts to improve their efficiency by further switching from branch offices to digital services. Since 2007, they have already reduced the number of offices across the country by more than 50 % to 1 764 offices in 2015.
4.2.2. ACCESS TO FINANCE *
The perception of bank loan availability has further improved, and a majority of policy measures have been implemented under the Additional SME Finance Action Plan (Aanvullend Actieplan Mkb-financiering). Equity funding and business angel funding for new and growing firms is satisfactory (EC, 2017j). Companies valued access to finance more positively while increasingly using channels other than traditional bank lending. These improvements reflect in part the decrease in loan requests by SMEs and the net decline of 13 % in bank lending rates. Among the main reasons for this decline are: increased financial buffers of SMEs due to a return to sustained profits; increased solvency ratios and liquidity and an increase in leasing as a financial instrument (DNB, 2016). The Netherlands Investment Agency (NIA) and the Netherlands Investment Institution (NLII) contribute to the improved access to finance(
).
New forms of finance have emerged, backed by new regulations and alternative providers for SME finance. The scheme ‘New providers of SME-finance’ (Nieuwe aanbieders van MKB-financiering) marked the start of several funds which offer alternative SME finance (e.g. FundIQ and DBS2 Factoring) backed by a guarantee from the Ministry of Economic Affairs. A new scheme ‘Co-Investment Facility for Business Angels’ (Co-Investeringsfaciliteit voor Business Angels) was launched in 2017 under the existing SEED capital scheme.
4.2.3. HOUSING MARKET * (
)
The housing market continues to recover with increasing regional differences. At the national level, house prices are gradually moving towards the pre-crisis peak in 2008 (see Graph 4.2.2). At the end of 2017, the national house price index is expected to have reached 94 % of the 2008 level. While annual house price growth nationally was around 6 % in 2017, it was much higher in the four largest cities: Amsterdam recorded house price growth of 13 % in 2017, Rotterdam and Utrecht 11 % and The Hague 9 %. The rise in house prices in the four largest cities is not accompanied by increasing credit to households. Since 2016, credit growth in these cities has been decoupled from house price growth, falling to roughly 0 % year-on-year by the end of 2016, suggesting that house purchases are financed by savings rather than credit (DNB, 2017a).
House price valuation indicators nationally do not point to overvaluation. Long-term values of price-to-income and price-to-rent ratios are below their long-term averages (see Graph 4.2.3). Estimates suggest that house prices are broadly in line with fundamental values. Yet, for Amsterdam, recent research reveals that the upsurge in house prices cannot be explained by fundamental factors such as the (improved) quality of dwellings, the interest rate, income growth or rental prices (Houben, Dröes and Lamoen, 2017).
|
Graph 4.2.2:House price developments
|
|

|
|
Source: Statistics Netherlands
|
The housing market recovery is also reflected in increasing transaction volumes. In Q3-2017, the number of transactions involving existing dwellings increased to the highest level recorded since 1995. In the same quarter, the total value of transactions involving existing dwellings reached a record high of EUR 16 billion, which is almost EUR 3 billion above the previous peak in Q4-2007.
The housing market recovery is likely to continue in the near future. The value of building permits issued for new dwellings increased from EUR 3.4 billion in 2013 (26 000 dwellings) to EUR 6.5 billion in 2016 (51 000 dwellings), which is still some way below the EUR 12 bn recorded in 2007 (for 88 000 dwellings). As in the past, the majority of dwellings (around 60 %) are being built by construction companies and investors. However, the absolute number of permits issued fell from 7 000 to 4 000. Housing corporations and the state greatly reduced their share in new permits, from 23 % in 2007 (3 000 permits) to 8 % in 2016 (500 permits). Individuals have considerably increased their share over time from around 19 % in 2007 to 31 % in 2016. This is mostly due to the decreasing number of permits of other builders, as their total share was around 2 000 permits in both years.
|
Graph 4.2.3:House price valuation
|
|

|
|
Source: European Commission
|
The strong presence of the social housing sector may increase the pressure on house prices. The social housing sector is one of the largest in the EU with a 29 % share of total dwellings nationally in 2017. This share has decreased by only 0.8 % over the past 5 years and is expected to slowly decrease given that fewer construction permits have been issued for the social housing sector than for the private rental and owner-occupied sectors. In Amsterdam and Rotterdam, social housing corporations dominate the housing market with shares of 42 % and 44 % respectively. An important share of the social dwellings in the Netherlands is occupied by 'scheefhuurders'(
). Over the past years, the share of scheefhuurders (18 % of total social housing tenants) has slightly decreased but is still above 400 000 nationally (WoON 2015). Because the social housing sector is so large, its inefficiencies prevent a more efficient functioning of the whole housing market putting price pressure on the remaining market segments.
The private rental market is the only non-subsidised housing sector and remains underdeveloped. Its share in total dwellings is advancing very slowly: only 13 % of housing units were rented out privately in 2016. Looking at the number of construction permits issued, this situation is unlikely to change, as most permits are not issued for rental dwellings. The government has not announced new measures to support the provision of rental dwellings. In 2016, only 16 000 permits were issued to build rental dwellings, compared to 35 000 permits issued to future homeowners. Part of the problem is that municipalities can receive a higher price for land used for building owner-occupied dwellings instead of rental flats, which is due to the subsidies in the owner-occupied market (DNB, 2017a). To increase land availability for the private rental market, the Law on Spatial Planning(
) was amended in 2017, allowing municipalities to set aside zones specifically for building middle segment rental dwellings. While the government announced its intention to support the supply of affordable housing on the private rental market, more details on such support have not been communicated yet.
Social housing corporations increase rents hesitantly. While rents in the private rental sector increased by 2.3 %, rents in the social sector increased by only 1.1 % in 2017. This is less than what corporations are legally allowed to increase rents by. According to the 'rental price method'(
), housing corporations could have increased rents by 1.3 % in total in 2017, with maximum increases of 2.8 % for lower-income tenants (with a yearly income of up to EUR 40 349) and 4.3 % for higher-income tenants. Data from 2016 shows that only 24 % of high-income households received the maximum rent increase. Excluding rent increases due to new rental agreements, existing rents in the social housing sector actually increased by only 0.6 % in total in 2017 (CBS, 2016). This implies that half of the rent increase was borne by new tenants, which are typically low-income households because housing corporations have to allocate at least 80 % of dwellings to this target group.
High-income households stay in social housing. Recent survey data shows that high-income households have little financial incentives to move out of their social housing: 84 % of tenants with an income above EUR 40 349 state that rent increases did not influence their decision to move out of social housing (ING, 2017). Most scheefhuurders are more than 65 years old (ING, 2017) and their potential rent increase is limited by law (BZK, 2017).
Social housing corporations face a trade-off when increasing rents. On the one hand, it is profitable for them to increase rents and with it their revenue. On the other hand, if they increase rents too much, they run the risk of seeing their most profitable tenants (those with high incomes) leave. Once those dwellings are vacant, the majority of those must be allocated to low-income households again. Swapping a high-income tenant for a low-income one implies that the corporation will get less revenue for the same dwelling. A recent survey showed that one third of corporations do not plan on carrying out income-dependent rent increases (RIGO, 2016).
4.2.4. PRIVATE DEBT *
Private debt continues to remain high in the Netherlands. It stood at 221.5 % of GPD in 2016, evenly split between households (mainly mortgages) and non-financial corporations (NFC). Over the past 20 years, the NFC debt-to-GDP has roughly stayed stable, whereas household debt has increased considerably from 63 % of GDP in 1995 to 118 % of GDP in 2009 during the house price peak, before falling to 108 % of GDP again (see Graph 4.2.4). Both household and NFC debt considerably exceed the level suggested by prudential considerations, as suggested by Commission calculations(
). Note, however, that corporate debt is mostly driven by multinational operations and the prevalence of cross-border intra-company loans, whereas the indebtedness of the remaining resident NFCs is in line with prudential levels.
Household debt consists mainly of mortgage loans and has been identified as an important vulnerability by the European Systemic Risk Board (ESRB, 2016). The high level of mortgage debt is driven by strong distortions in the housing market: the generous tax treatment of owner-occupied housing, the legacy of regulation favouring high LTV ratios and interest-only loans, the inefficient and subsidised social housing sector and underdeveloped private rental market. While tax relief on mortgage interest payments is gradually being reduced (see discussion below), it will still be the highest in the EU.
Nominal household debt is rising. Following the burst of the housing bubble, nominal household debt peaked at EUR 758 billion in 2012. After a small dip in the following two years, nominal debt stood at the previous peak level again in 2016. However, the household debt-to-GDP ratio has been decreasing since the 2012 peak, due to rising nominal GDP. While the government has implemented measures in the past – in particular the MID reduction, compulsory repayment in order to be eligible for the MID and loan-to-value and loan-to-income limits – these do not tackle the high level of debt directly and may only impact the debt level in the long run.
|
Graph 4.2.4:Private debt
|
|

|
|
Source: Statistics Netherlands
|
The number of underwater mortgages has decreased(
). The most recent loan level data from the Dutch central bank shows that the number of underwater mortgages has decreased from 36 % of total loans in Q1-2013 to 14 % in the Q2-2017. Much of this is due to the recovering housing market. Those most affected are aged 30 to 40. This group consists mainly of first-time buyers who bought their homes in the years immediately before the housing market crisis. It is also the group most exposed to changes in market prices given the high loan-to-value ratio.
The loan-to-value (LTV) and loan-to-income (LTI) ratios remain high. The maximum LTV ratio for new mortgages has gradually been lowered to reach 100 % by 2018. While the total LTV ratio for outstanding debt was at 78 % in 2015, the 30- to 40-year-old homeowners most affected by underwater mortgages had an average LTV ratio of 110 % in 2015. The LTI ratio(
) of that group was at 5.3, whereas the total LTI ratio stood at 4.2 in 2015.
The government announced a faster reduction of mortgage interest tax deductibility. Instead of reducing the MID by 0.5 pp per year until it reaches 38 % in 2041, it will be reduced by 3 pps from 2020 onwards, reaching 37 % in 2023. While this is a considerable increase in MID reduction, a rate of 37 % would still be the highest in the EU. In addition, this reduction will only affect taxpayers in the top tax bracket; the measure will not affect those in the lowest tax brackets(
). A strong subsidy on debt creation therefore remains. Recent quasi-experimental research has questioned the justification of mortgage interest deduction and has shown that MID induces households to become more indebted with higher MID regimes (Gruber, Jensen and Kleven, 2017). The government has also decided to phase out – over a period of 30 years starting in 2019 – the so-called Hillen Act and gradually lower the imputed rent by 0.15 pp per year from the current 0.75 % to 0.6 % from 2020 onwards. Based on new rules, the tax on the notional rental value will have to be paid on the owner-occupied property for which the mortgage has been almost or fully repaid. So far, the Hillen Act allowed in such cases that the tax liability of the notional rental value be reduced to zero.
|
Graph 4.2.5:Debt of large non-financial corporations
|
|

|
|
Source: Statistics Netherlands
|
The debt of non-financial corporations can largely be attributed to multinational enterprises (MNEs). The MNE share of total NFC debt increased considerably over the years from 52 % of GDP in 2007 to 90 % in 2015, which equals 69 % of the total NFC debt stock(
). Part of the reason for this high MNE debt is the taxation and regulatory framework, which provides incentives for large companies to settle in the Netherlands and exploit regulatory differences across borders. Several regulatory features attract MNEs to the Netherlands (e.g. the patent box regime, the absence of withholding taxes on royalties and interest or the common practice of granting advance tax rulings), although not all of them are directly linked to debt.
|
Graph 4.2.6:Intra-group-to-total debt
|
|
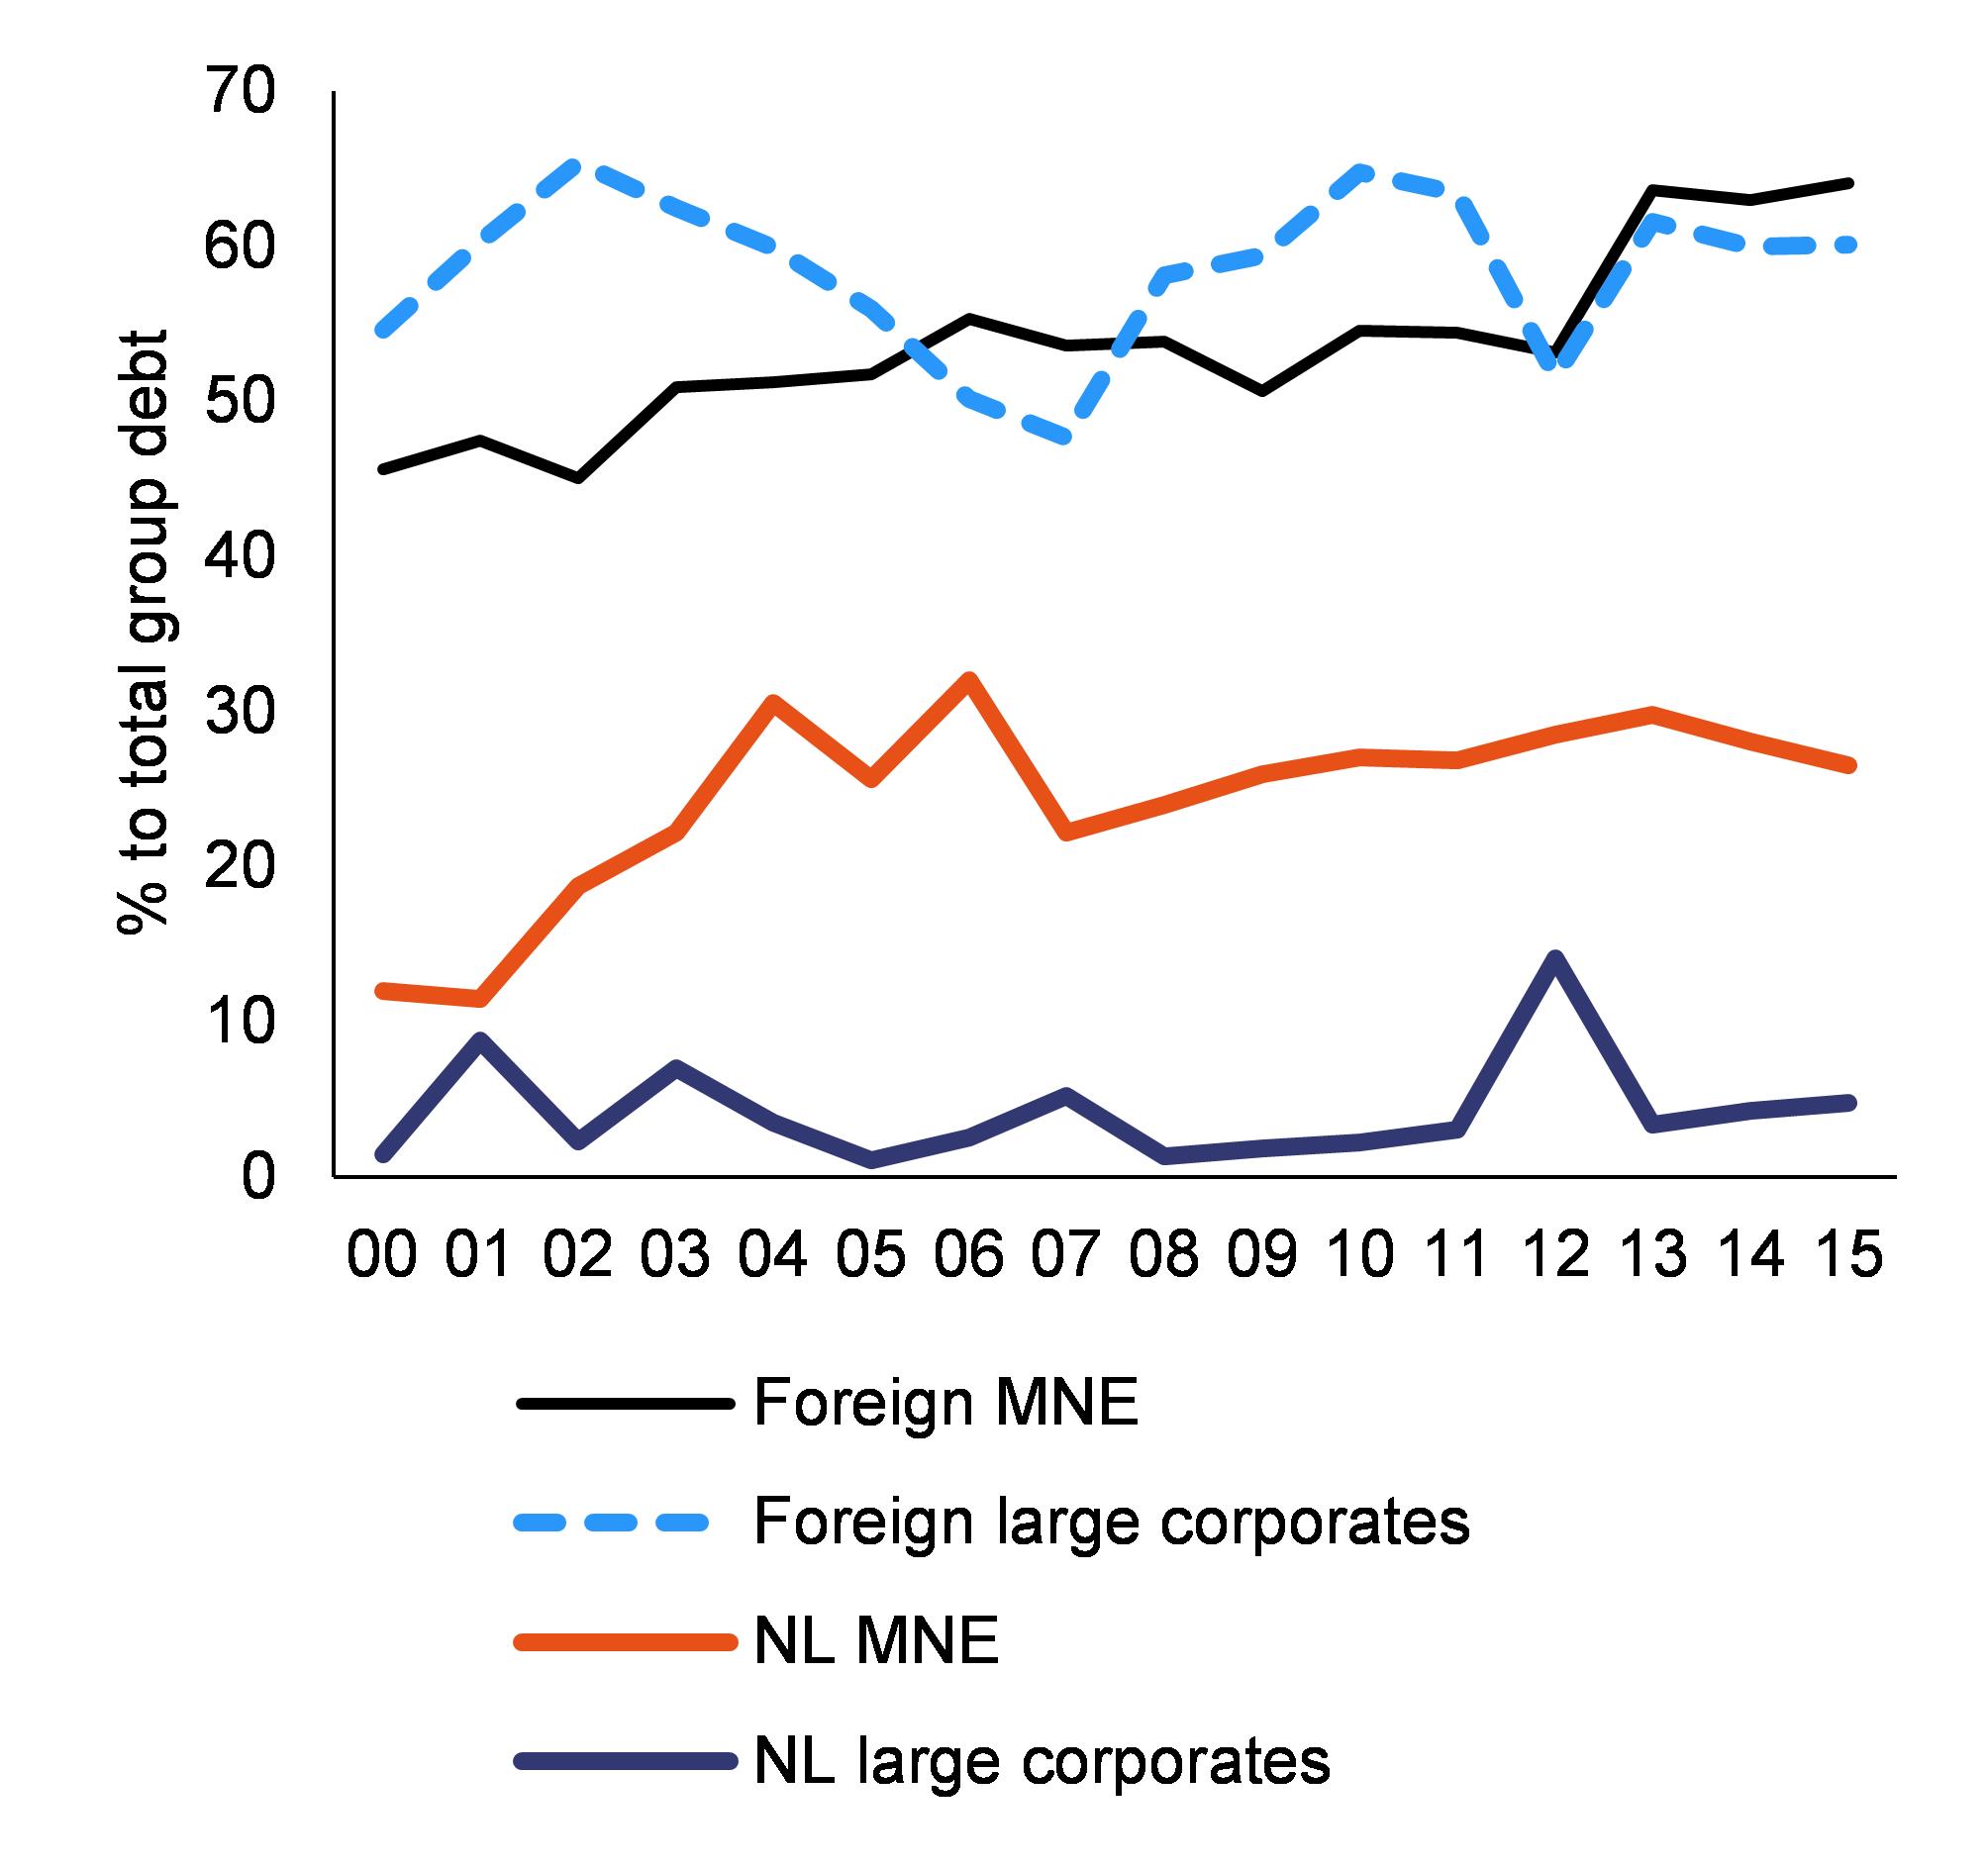
|
|
Source: Statistics Netherlands
|
Foreign NFCs account for at least 43 % of total NFC debt, which is mostly intra-group. The large share of foreign NFC debt could imply the use of debt for fiscal reasons. This seems to be even more plausible given that 60 % of foreign large NFC debt was intra-group, so loans are provided across the group, mostly with interest charged (see Graph 4.2.6). The intra-group debt of domestic NFCs without international subsidiaries is indeed much lower (below 5 % in 2015). Intra-group debt shifting is typically used by MNEs to lower their tax burden via increased interest payments to other group companies outside the Netherlands. The data on interest paid by MNEs confirm this finding, as the gap between the interest paid and received by MNEs has widened substantially with the large increase in MNE debt (see Graph 4.2.7). This can also be linked to a Court of Justice of the European Union (CJEU) ruling from 2003 on the deductibility of interest on loans for foreign participations (Jansen and Ligthart, 2014). The CJEU(
) decided that, similar to domestic participations, interest on loans for the acquisition of foreign participations should also be tax deductible in the Netherlands. As NFC intra-group debt is most likely used for tax optimisation purposes, it does not point to an immediate macroeconomic risk.
|
Graph 4.2.7:Interest paid and received by multinationals
|
|

|
|
Source: Statistics Netherlands
|
4.2.5. PENSIONS *
The three-pillar pension system scores well on pension adequacy and fiscal sustainability. The first pillar is the pay-as-you-go public pension, funded by a specific premium and general income taxes. To ensure its fiscal sustainability, the statutory retirement age has been linked to life expectancy (see Section 4.1)(
). The second pillar is organised at the industry level and capital funded. At the request of the representative social partners in the industry participation can be made compulsory, and pension contributions and revenues depend on work experience. Although there is a shift towards defined contribution schemes(
), some 90 % of workers still fall under a defined benefit schemes. The third pillar is formed by individual pension products, and basically only consists of a tax exemption for premiums paid on such products. The first and second pillar aim to provide a replacement rate at 75 % of the average salary at the age of retirement.
The second pillar has drawbacks in terms of coverage, transparency and flexibility over the life cycle. It was developed in the mid-twentieth century and is not well equipped to deal with the current structural labour market trends (individualisation, flexibility, job mobility between sectors, ageing). The government aims to modernise the pension system following the contours outlined by the Social and Economic Council (SER). The government wishes to move, together with the social partners, towards a system that addresses the vulnerabilities while maintaining its strengths: compulsory participation, collective implementation, risk sharing and supportive tax rules(
).
The second pension pillar is pro-cyclical and expensive when interest rates are low. The past few years have exposed the vulnerabilities of the second pension pillar. Low interest rates but also population ageing and the sharp increase in life expectancy have created a situation of ‘under-coverage’ in many pension funds. To keep the system sustainable, indexation has been foregone in recent years, and pension contributions have been increased to around EUR 30 billion, almost 5 % of GDP. Nowadays, salaried employees work roughly one day a week for their pension. This is an important contributor to the compulsory payment wedge, which is comparatively high in the Netherlands (see Graph 4.2.8; pension contributions explain roughly 70 % of the non-tax compulsory payment wedge). Total pension fund assets increased from EUR 778.5 billion in 2009 (127 % of GDP) to EUR 1 378 billion in 2016 (almost 200 % of GDP). However, overall this is still insufficient to cover the increase in liabilities. The increase in pension savings has weakened private consumption growth and increased the domestic savings surplus. As lower pension payouts are a last resort, the balance of risks is geared towards the active and young generations. In other words, ad hoc adjustments to indexation and pension contributions have led to pro-cyclical macroeconomic shocks and could give rise to intergenerational transfers at the expense of current younger generations, i.e. they pay higher premiums for a relatively lower guaranteed pension.
|
Graph 4.2.8:Compulsory payment wedge (2016)
|
|

|
|
Source: OECD (2017). Non-tax compulsory payments (NTCPs) as an additional burden on labour income in 2016. http://www.oecd.org/tax/tax-policy/Non-tax-compuslory-payments.pdf. The chart gives the average compulsory payment wedge and average tax wedge for single taxpayers without children at average earnings, 2016.
|
Pension funds shape the country’s financial architecture. Pension funds draw on domestic household savings and invest them largely overseas to benefit from global diversification and respect the fiduciary objective of its participants(
). While this is beneficial for portfolio efficiency, questions could be asked about the impact on the domestic finance base as it may influence the relatively low deposit-to-total-funding ratio of banks (see Section 4.2.1). With a high compulsory payment wedge, households have difficulties putting money aside to buy a house, and by consequence, need to take up mortgage debt. Banks on the other hand are financing mortgages on a large scale with money lent on international capital markets. This creates a dependence on wholesale finance and increases the vulnerability to financial turmoil. Pension funds have only recently started to invest more in the long side of the Dutch mortgage market.
While there is general consensus on the need to reform the pension system, concrete steps are yet to be taken. In recent years, a number of incremental policy measures were taken such as an increase in the retirement age, a change in the tax system accompanying this increase and measures in the field of financial supervision, allowing for a longer recovery period for pension funds with under-coverage. There are also initiatives to increase pension fund financing in the domestic economy, which would benefit economic growth in the Netherlands. However, few concrete steps have been taken to address the pro-cyclicality of the pension system. The strict promise in particular to deliver a predefined nominal benefit level carries a high cost; this is ultimately paid by the pension fund participants themselves and increases the amplitude of the economic cycle. The reform directions currently being discussed by the social partners have promising potential: they could lead to lower and more stable pension contributions, while respecting pension adequacy.
4.3.
Labour market, education and social policies
4.3.1.Labour Market*
Labour market recovery gained further momentum in 2017. In the first half of the year, more than 9 million people were employed in the Netherlands, which is above the pre-crisis level. With 77.9 % in 2017 the Netherlands has one of the highest employment rates in Europe. However, the employment rate was still slightly below the pre-crisis level due to an increase in the working age population. The positive labour market developments also include a sustained decline in the unemployment rate, which fell to 4.9 % in 2017. This decline was also reflected in the youth and long-term unemployment rates.
|
Graph 4.3.1:Main labour market developments
|
|

|
|
Source: European Commission (Eurostat)
|
Despite low unemployment and high job vacancy rates, wage growth remains relatively moderate. Growth of nominal compensation per employee remained subdued at 1.2 % in 2016. While accelerating to 1.7 % in 2017, it remains below the level which could be expected based on the low level of unemployment (See Graph 4.3.2) and based on other fundamental drivers such as inflation and productivity (see Graph 1.5 in Section 1). Low wage growth may be further explained by the remaining labour market slack, i.e. a measure of underutilisation of labour resources(
), estimated at 8.6% in Q3-2017.
|
Graph 4.3.2:Relationship between unemployment and nominal wage growth (2001-2016)
|
|

|
|
Source: European Commission (Eurostat)
|
In addition to macro-economic developments and labour market slack, increased labour market segmentation may also partly explain the low wage growth. The proportion of temporary employees rose between 2006 and 2014 from 16 % to 17.3 %. The estimated aggregate wage growth was 11 % lower due to this increase in temporary employment, since temporary employees in general receive a lower wage than permanent employees, (
).
|
Box 4.3.1: Monitoring performance in light of the European Pillar of Social Rights
The European Pillar of Social Rights, proclaimed on 17 November 2017 by the European Parliament, the Council and the European Commission, sets out 20 key principles and rights to benefit citizens in the EU. In light of the legacy of the crisis and changes in our societies driven by population ageing, technological change and new ways of working, the Pillar serves as a compass for a renewed process of convergence towards better working and living conditions.
The Netherlands performs relatively well on the indicators of the Social Scoreboard (
) supporting the European Pillar of Social Rights. The country displays an overall good labour market and social situation. Per capita real gross disposable income of households increased in 2016 and is almost at pre-crisis levels. Income inequality is relatively low, although it increased slightly in 2016. Regarding equal opportunities in the labour market and fair working conditions, the issue of labour market segmentation deserves continuing attention.
 The gender imbalance in labour market participation has been very slow to adjust under the current incentives of the work-life balance policies. The gender gap in employment leads to an important gender gap in old-age pensions that raises a point of concern with respect to equal opportunities in the labour market. The high part-time employment rate of women is a result of a combination of factors. One of them is the system of family-related leaves (paternity and parental leave), which does not support a gender balanced take-up of leaves, leading to an unequal sharing of caring responsibilities between mothers and fathers and discourages first earners, often men, from using them.
The rate of youth not in employment, education or training is comparatively low. In 2016 the Netherlands continued policy initiatives to address youth unemployment. The government implements the so called 'City Deal Aanpak Jeugdwerkloosheid', a policy programme and partnership between 7 cities and schools (secondary and tertiary), researchers, employers and intermediaries. The focus is to identify solutions for (migrant) youth in disadvantaged neighbourhoods to improve their preparation for a better transition to work by focusing on career guidance at their school. Within the programme 'Matchen op Werk' the Dutch government invests together with municipalities, Public Employment Services (UWV) and their partners in sustainable work opportunities for youth. Together they aim at improving services for employers - the key partners in tackling youth unemployment - and improving access to job openings.
|
While in the past years trade unions have foregone wage demands in exchange for employment protection, wage demands are far higher for 2018. The Netherlands Trade Union Confederation (FNV), the Dutch largest trade union, has called for a minimum wage increase of 3.5 % in nominal terms in 2018, with up to 5 % for low earners. This contrasts with the wage demands in the past years which were more moderate and when the main objective was to preserve employment and reduce the share of temporary employment. The actual outcome remains to be seen.
Female labour market participation
Despite the labour market performing well, there is still untapped labour potential. While the employment rate of women is high (71.6 % in 2016), almost three out of four women (74.8 %) work in part-time. As a result, the full-time equivalent employment rate of women is much lower (48.9 %) and the gender gap in full-time equivalents is one of the highest in the EU (27.2 pps). The share of part-time employment rate is particularly high among women with caring responsibilities (see Graph 4.3.3): in 2016, 86 % of the women with at least one child under 14 years worked part-time, while 51 % of women without children did. However, in recent years the part-time employment rate for women with children has fallen and the hours worked part-time have increased, while there is no similar trend visible for women without children (see Graph 4.3.4). Having children did not have a major effect on the proportion of men working on a part-time basis. However, it is worth noting that the part-time employment rate for men is well above the EU average and that of neighbouring countries. Differences in work intensity result in a large earnings gap (47.5 % in 2014) and later in life in a large gender pension gap later in life (42.5 % in 2016)
Historically speaking, part-time employment of women has always been high in the Netherlands and may therefore be slow to adjust. The high share of part-time employment rate is a result of a combination of multiple factors and institutional drivers, such as the design of family-related leaves, as well as intermediate cost and availability of full-time childcare and after school care (Portegijs et al., 2008; Task Force Part-time Plus, 2010).
|
Graph 4.3.3:Share of part-time work with and without children (2016)
|
|

|
|
Source: European Commission (Eurostat, Labour Force Survey)
|
|
Graph 4.3.4:Female labour market participation (with child)
|
|

|
|
Source: European Commission (Eurostat)
|
These may affect the (unequal) sharing of caring responsibilities between men and women. At the same time, research suggests that the way in which work-life balance policies are designed and the incentives that they induce could have an impact on the choices made and therefore on the employment outcomes of women (OECD, 2017d; Eurofound, 2017b). In particular, the fact that parental leave is often unpaid discourages main earners (often men) from using it; it therefore strengthens the role of women as primary carers for their children. The fact that only 2 days of paid paternity leave are offered to men may also be acting as a brake on the equal sharing of childcare responsibilities. In this respect, the new government agreement proposes increasing paternity leave from 2 to 5 days in 2019. This is to be extended as of 1 July 2020 by 5 weeks of additional leave, to be taken within the first 6 months of the birth.
Labour market integration of migrants
While the overall participation rate is very high, people with a migrant background are lagging behind in employment. The situation of those born outside the EU remains a key issue in particular. The employment rate of non-EU-born migrants stood at 58.9 % in 2016 and is 20.6 percentage points (pps) lower than for natives, a slight increase compared to 2015 (20.2 pps). The gap is larger for non-EU-born women (23.4 pps lower than native-born women) due to very high inactivity rates among them. Non-EU-born migrants also face a higher unemployment rate (12.1 %) than those born in the Netherlands (5.4 %), in particular those aged 15-24. Differences in labour market outcomes for non-EU-born migrants can be explained only partially by differences in age and educational achievement. This suggests that other factors such as lack of recognition of qualifications, language skills, limited professional networks or discrimination may play a role (EC, 2017b).
The labour market outcomes of the ‘second-generation’ (i.e. native-born residents with a migrant background) are also unfavourable, even though they were born and educated in the Netherlands. Looking at data recently published by Statistics Netherlands(
), the employment rate of native-born residents with a migrant background from ‘non-Western’ countries(
) aged 15-74 was around 60.1 % in 2016, well below the average for those without a migrant background (67.4 %) (CBS, 2017a, Table Arbeidsparticipatie). However, it was higher than for first-generation immigrants from ‘non-Western countries’ (54.2 %) largely because of much higher unemployment. Moreover, even after adjusting for skills (literacy score), age, gender and education level (OECD, 2014, Table A.7), native-born children of two immigrant parents had a lower probability of being employed (19.4 pps) in 2012 than native-born children of two native-born parents.
There is scope to strengthen integration programmes. The efficiency of the (2012-2014) reform of the integration policy for immigrants can be questioned. It obliges them to learn Dutch and take a civic integration test, while putting most of the responsibilities of integration — in particular language learning (including the financial burden) — on immigrants (see Algemene Rekenkamer, 2017). The low success rate in language tests and the quality of integration courses are also issues of concern. The new coalition plans to increase public funding on language courses (‘from day 1’) while increasing the level of language proficiency required. While the current re-evaluation of the integration policy seems necessary, it is unclear whether it will sufficiently address the integration needs of newcomers on the labour market.
Segmentation*
Flexible employment constitutes a relatively large and growing share of the labour market. Both temporary employment as well as self-employment without employees increased considerably in the last 10 years in the Netherlands (see Graph 4.3.5). Changes in industrial production — with employment shifting towards sectors that are more prone to self-employment or temporary employment — only partly explain the recent shift towards more flexible employment. This situation is also affected by distinct institutional factors, including favourable tax treatment (for the self-employed without employees) and differences in social security legislation as well as large differences in applicable labour regulations and labour protection rules for permanent and temporary contracts (EC, 2017b, p. 30; EC, 2016a, pp. 46-49).
The recent upsurge in job creation is mainly down to temporary employment and self-employment. This trend suggests a further increase in the flexibility of the Dutch labour market. Despite the 2015 reforms (see below), the proportion of temporary employees (aged 20-64) continued to increase, reaching 18.4 % in Q3-2017 (EU average: 13.7 %). The proportion of self-employed without employees in total employment was 12.1 % in Q3-2017 (EU average: 9.9 %). The group of self-employed without employees is highly diverse, and self-employment without employees has increased across all sectors (see Graph 4.3.6) and age groups.
|
Graph 4.3.5:Employment (20-64 year) by type (y-o-y changes)
|
|

|
|
Source: European Commission (Eurostat, non-seasonally adjusted data)
|
The self-employed are not obliged to be insured against labour-related risks such as accidents at work, unemployment and old age (second pillar). They are only entitled to healthcare, long-term care, family benefits, a state pension (first pillar) and survivors’ benefits. There are no sickness benefits (sick pay) for them during the first 2 years of long-term sickness. Everyone in the Netherlands, including the self-employed, has compulsory basic private health insurance. However, the majority of the self-employed (57 %) indicate that they would feel financially insecure if they were faced with a serious long-term illness (EU average: 48 %) (Eurofound, 2017a)(
).
Around one in five employees in the Netherlands was employed on a temporary contract in 2016. New entrants in particular are exposed to temporary contracts: 44.1 % of employees under 30 are on temporary contracts (EU average: 32.2 %). This is a significant increase compared to 2005, when only 33.0 % of employees under 30 worked on temporary contracts. The high prevalence of temporary employment negatively affects the job duration and career prospects of young people. The average job tenure of workers under 30 decreased from 27 months in 2005 to 21 months in 2015. Estimates show that around half of this decline can be attributed to the increase in temporary contracts for young workers (EC, 2017f). There are also negative implications for their incomes given the significant wage gap between temporary and permanent workers (see Box 4.3.2).
|
Graph 4.3.6:Self-employed by sector ( % of total employment in the sector)
|
|

|
|
Source: European Commission (Eurostat)
|
In 2015, the government implemented a major reform to reduce the differences between temporary and permanent contracts. This reform was discussed in detail in European Commission 2016a and European Commission 2017a. Given that the measures are being introduced gradually, a formal evaluation of the reform is only expected in 2020. Preliminary evidence on the impact of the changes introduced under the Dutch dismissal and unemployment law (Wet werk and zekerheid) indicates that the changes, including the decline in severance pay, did not influence the decision of employers to dismiss or recruit permanent employees (Heyma et al., 2017). The transition rates from temporary to permanent contracts have remained fairly constant in the last 3 years, ranging from 11 % to 12 % per quarter (see Graph 4.3.7). The enforcement of a mechanism adopted to reduce incentives for employers to replace employees with bogus self-employment has been suspended until at least the beginning of 2018.
In order to modernise the labour market and address segmentation, the new government announced several additional measures, but specifics and time frame for adoption remains unclear. The most important are (1) shortening of employer-paid sick leave from 2 years to 1 year for small enterprises (under 25 employees); (2) the introduction of an additional ground for dismissal in case of an open-ended contract; (3) the introduction of a minimum hourly rate for self-employed without employees to reduce bogus self-employment. At the same time (4) the total duration that a person can be employed on a temporary contract will be extended from two to three years (in line with legislation prior to 2015) but he/she will be eligible for the transition allowance as of the beginning of their employment contract (instead of after 2 years only as previously). In addition, the government suggested reflecting further on possible differentiation in contributions for unemployment insurance per type of contract and the qualification of self-employed. At this point, the time frame for adoption as well as the possible impact of these new measures on the labour market segmentation remains unclear.
Social dialogue is an essential feature of the so-called Poldermodel in the Netherlands and functions overall rather well. Social partners were consulted on the intention and possible policy options to reform of the second pillar pension system. The new government equally intends to involve them extensively in the context of the ambitious agenda to reform the labour market.
|
Graph 4.3.7:Transition rate from temporary to permanent employment by quarter
|
|

|
|
Source: European Commission (based on Statistics Netherlands)
|
Poverty and social exclusion in the Netherlands
Even though the Netherlands has one of the lowest rates of at risk of poverty or social exclusion in the EU, this indicator increased by 364 000 persons from 2008 to 2016. The poverty-reducing impact of social transfers (excluding pensions) has slowed considerably in the last year — although it remains at a decent level, above the EU average. Netherlands shows good results in adequacy of the minimum income support (as a share of the poverty threshold) and the relative poverty risk gap. As concerns unemployment benefits, Netherlands performs close to the EU average in terms of adequacy, although duration (for a 1-year work record) is comparatively low(
). The income benefits are combined with incentives to (re)integrate into the labour market, as people who receive social assistance are required to accept reasonable offers of work. The in-work at risk of poverty rate in the Netherlands has increased in 2016 by 6 pps (although the data indicates a break in series) and reached 5.6 % which is well below the EU average (9.5 % in 2015).
The number of people living in low work intensity households has decreased. When setting its Europe 2020 objectives, the Netherlands committed itself to reducing the number of people living in a household with very low work intensity (working less than 20 % of their total potential) by 100 000 by 2020 compared to 2008. This reduction is aimed at the age groups up to 64 years, rather than 59 years as envisaged in the Eurostat indicator. However, since 2008 figures have been shifting. As of 2016, 51 000 people were lifted out of low work intensity households. Thus the EU-2020 objective is reached by half.
Non-EU-born people face a higher risk of poverty or social exclusion. Among the population aged 18 and over born in the Netherlands, the proportion of people at risk of poverty or social exclusion has remained stable from 2008 to 2016 at 13.7 %. Among non-EU-born residents, it increased from 31.7 % in 2009 to 39.6 % in 2016. This is directly related to the vulnerable labour market position of many non-EU-born migrants as described above.
4.3.2.Education and skills
Despite performing well in general, there has been some decline in basic skills and an increase in performance differences between schools. While the proportion of low achievers in the 2015 OECD Programme for International Student Assessment (PISA) was still below the EU average, it did increase in all three areas (reading, mathematics and science). Differences between schools have the largest impact on pupils’ performance of all OECD countries (OECD, 2016a), and are strongly linked to the different tracks offered. Differences also exist between schools with similar student populations (Ministry of Education, Culture and Science, 2017a).
Several new measures aim to close performance gaps between students from disadvantaged and more favourable backgrounds. The number of pupils in primary special education has decreased by more than 6 % since the introduction of the ‘Education that fits’ policy (passend onderwijs) in 2014-2015. All schools are now responsible for placing each child, including those with special educational needs, in a suitable educational setting, preferably in mainstream education. The school performance of students from an immigrant background remains a major challenge as it then translates into lower labour market performance. Non-immigrant children perform significantly better than immigrant children in all three PISA areas. This difference also holds for second-generation pupils. Even after taking into account socioeconomic differences, pupils with a migrant background (both first- and second-generation) score far worse than those without a migrant background, with a 41-point difference in reading and 31 in mathematics (Meelissen et al., 2012).
The adult participation in learning is high in general and well above the EU average. The participation rate in learning for low-skilled adults (9.1 % in 2016) is also considerably higher than the EU average (4.2 %). A special commission (Commissie vraagfinanciering MBO, 2017) was set up in September 2016 to provide the government with advice on ‘vouchers’ in upper secondary vocational education and training (VET). As a follow-up to the ‘Technology pact’ (Nationaal Techniekpact) and the 2011-2015 ‘Focus on Craftsmanship’ action plan, experiments are taking place between May 2015 and July 2021 in upper secondary VET schools to integrate the school-based track and dual/apprenticeship track. Students will start in the school-based track and can switch to the other track after acquiring the relevant theoretical and practical skills. The experiment addresses the need of VET schools and companies for more flexibility between both tracks and to stimulate cooperation between them. The new measures are consistent with the Upskilling Pathways Recommendation(
) on addressing the low-skilled adults in their ability to acquire and maintain skills and manage successfully the transitions in the labour market.
The Netherlands faces an increasing shortage of teachers. In primary education, a shortfall of 4 000 full-time equivalents is expected in 2020, with 10 000 full-time equivalents needed in 2025 (Fontein et al., 2015). In secondary education, a shortage is expected for certain subjects such as mathematics, science and foreign languages. After several years of a drop in applications, initial teacher training programmes saw a small increase of 5 % in enrolments in 2016 (Ministry of Education, Culture and Science, 2017b). On average, 5.1 % of all classes in secondary education were given by staff without professional teaching qualifications in 2015. In line with the 2013-2020 Teachers’ Agenda, measures have been implemented to improve the quality of teaching, continuing professional development and career prospects.
Although the Netherlands has a large pool of educated and skilled workers, the low number of STEM (science, technology, engineering and mathematics) graduates limits its innovation capacity. In 2015, only 17 % of masters students graduated in STEM fields, and only a third of these were women. Despite the very open labour market, it remains a concern given the pronounced role that STEM profiles play in industry and technological innovation. The proportion of STEM graduates in the population is still one of the lowest in the EU, although the number is increasing. An apparent lack of suitable ICT professionals(
) and skills mismatches due to the low use of ICT skills on the job (OECD, 2015) is a major issue for the development of the digital economy and digital society. Shortages are expected to continue; according to the Dutch employee insurance agency (Van der Aalst and Van den Beukel, 2017), shortages are greatest in technical and ICT jobs. The Human Capital Agenda ICT has been set up to meet the demand for more ICT specialists. The initial results of the Technology Pact 2020 show that more students are signing up for technical studies, with an increase in the number of female students (monitor Techniekpact, 2017).
|
Box 4.3.1: Implications of temporary employment on income
This box analyses the implications of temporary employment on income, in particular on hourly wages and poverty. It draws upon the analysis of segmentation in the 2018 Labour Market and Wage Developments report.
In almost all EU countries, the wages of permanent employees are higher than the wages of temporary employees. In 2014 the gap in the Netherlands was one of the highest in the EU. Compared to other Member States, the share of temporary workers with a low income represent a relatively high share (36.5 % of temporary employees had an hourly wage among the lowest 20 % of all wages) (see Graph 1).
The large difference between wages of temporary and permanent employees can partly be attributed to differences in productivity, which can partly be explained by observable individual and job characteristics. For example, in Netherlands 62 % of all temporary workers (15-64) in 2016 are younger than 30, which may explain why their wages are lower as compared to permanent employees who are on average older.
 Therefore, in a next step the wage is adjusted by taking into account differences in individual charasteristics (age, gender and educational attainment) as well as differences in job characteristics (working time arrangement, occupation and sector of employment). The results indicate that even after controlling for differences in individual and job characteristics, permenant workers earn on average more than 11 % more than temporary employees (see Graph 2). The adjusted wage gap is found to be increasing with age, reaching the highest level for individual between 40 and 50 years old (12 %). Nevertheless also for young individuals (20 to 29 years old) the wage gap is found to be highly significant (7 %). Further, the adjusted wage gap is found to increase with educational attainment, ranging between 7 % for those with low-education (ISCED 0-2) and 19 % for those with a master degree or above (ISCED 7-8). The precarious income situation is of temporary employees is also reflected in a higher at-risk of poverty rate of temporary employees (7.9 % in 2016) as compared to permanent employees (3.7 % in 2016).
|
4.4. Investment*
With a sharp pick-up in residential construction, total investment returned to its long-term average of 20 % of GDP in 2016. Residential investment increased to 4 % of GDP in 2016. This is up from 3 % at the end of the crisis, but still well below the 6 % of GDP average in the decade before the crisis. Public investment remained stable at around 3.5 % of GDP, which is around 1 pp. higher than the euro area average. Private investment on the other hand was 1.3 pps lower than the euro area average.
|
Graph 4.4.1:Investment by asset
|
|

|
|
Source: European Commission (Eurostat)
|
|
|
|
Table 4.4.1:Investment by sector NL and euro area (% of GDP)
|
|

|
|
Source: European Commission (Eurostat); pre-crisis average covers 2000-2008.
|
|
|
Domestic investment is low compared with total savings, making the Dutch economy a net lender to the world. The Dutch economy has been running a savings surplus since the early 1980s. Total domestic savings are relatively stable in terms of GDP, but are increasingly channelled towards foreign investment, as domestic investment has declined (see Graph 4.4.2).
|
Graph 4.4.2:Domestic and foreign investment
|
|

|
|
Source: European Commission (Eurostat)
|
The high savings surplus is driven by non-financial corporations, but recent changes were driven by other domestic sectors. A breakdown by institutional sector shows that the savings surplus of the non-financial corporation sector increased over time, from 2-3 % of GDP on average in 1995-2000 to 5-6 % in 2001-2005 and 8 % of GDP on average over the last decade. With a relatively stable and large NFC surplus, changes in the net lending position were driven by households and the general government sector. Households were net borrowers in the run-up to the crisis. However, they turned into net savers after that, following a decline in household investment and increasing pension savings(
), together with deleveraging needs (see Section 4.2). The government also turned from a net borrower into a net lender in 2016, which further increased the total economy's net saving position between 2009 and 2016.
|
Graph 4.4.3:Net lending/borrowing by sector
|
|

|
|
Source: European Commission (Eurostat)
|
Non-financial corporation (NFC) savings are exceptionally high. NFC net lending amounted to 7 % in 2016, which is five times the euro area average and two times higher than in Germany. Gross NFC sector savings stood at 17.5 % of GDP in 2016, compared with a euro area average of 13.6 % of GDP. However, NFC sector investments equalled 10.3 % of GDP compared with the euro area average of 12.2 %. This implies that around two thirds of the NL-EA difference in NFC sector net lending/borrowing is explained on the savings side of the income sheet, and one third via lower investments.
Gross NFC savings are primarily driven by high earnings. The operating surplus explains the bulk of gross saving (see Graph 4.4.5)(
). Dividends received and dividends paid both greatly increased in 2005, which illustrates the importance of multinationals' headquarter location decisions on balance of payments statistics(
). The global decline in interest rates has led to lower interest expenditures by non-financial corporations, further increasing gross savings.
|
Graph 4.4.4:Non-financial corporate sector saving and investment
|
|

|
|
Source: European Commission (Eurostat)
|
|
Graph 4.4.5:Gross savings by non-financial corporations
|
|

|
|
Source: European Commission (Eurostat)
|
In comparison with other EU countries, the relatively high profit share and low distributed income accounts for the NFC savings surplus. Dutch NFC savings are almost 6 pps higher than the euro area average. Roughly half of this can be explained by a relatively large gross operating surplus. The other half is explained by low net distributed incomes. Table 4.4.2 compares the savings of the Dutch non-financial corporation sector with the euro area average as well as with peer countries such as France and Germany. The difference with Germany comes solely from net distributed income (mainly dividends), while the differences in NFC savings with France are entirely accounted for by a lower NFC gross operating surplus. Differences in secondary incomes such as corporate income taxes do not play an important role.
|
|
|
Table 4.4.2:Non-financial corporate sector income sheet
|
|

|
|
Source: European Commission (Eurostat); average 2012-2016
|
|
|
Profitability is particularly high in the trade and manufacturing sectors. The three year average NFC operating surplus in the Netherlands is roughly 24.5 % of GDP, compared to a euro area average just above 21 % (see Graph 4.4.6). This difference already exists in NFC value added, which is relatively high in terms of GDP. This is only partially transferred into compensation of employees, where the difference with other countries is less marked. An assessment by industry shows that in particular the trade and manufacturing sectors play a significant role (See Graph 4.4.7).
The net payout ratio of dividends is very low, and points to high retained earnings, being used to finance foreign investment. Compared with other Member States, Dutch NFCs receive relatively large amounts of distributed income from abroad (mainly dividends), while on the other hand the payout ratio is relatively low, resulting in very low net distributed income (see Graph 4.4.8). An assessment of the balance sheets of multinational enterprises suggests that retained earnings were used to finance foreign investment. Between 2005 and 2015, multinationals increased their equity holdings abroad by around 50 pps of GDP, which is equivalent to an increase from 26 % to 43 % of total assets (see EC, 2017b). In short, high retained earnings seem to be used to finance foreign investment by multinationals.
|
Graph 4.4.6:Gross operating surplus and components
|
|

|
|
Source: European Commission (Eurostat)
|
|
Graph 4.4.7:Net operating surplus by sector
|
|

|
|
Source: European Commission and Statistics Netherlands (production statistics)
|
|
Graph 4.4.8:Net distributed income ratios
|
|
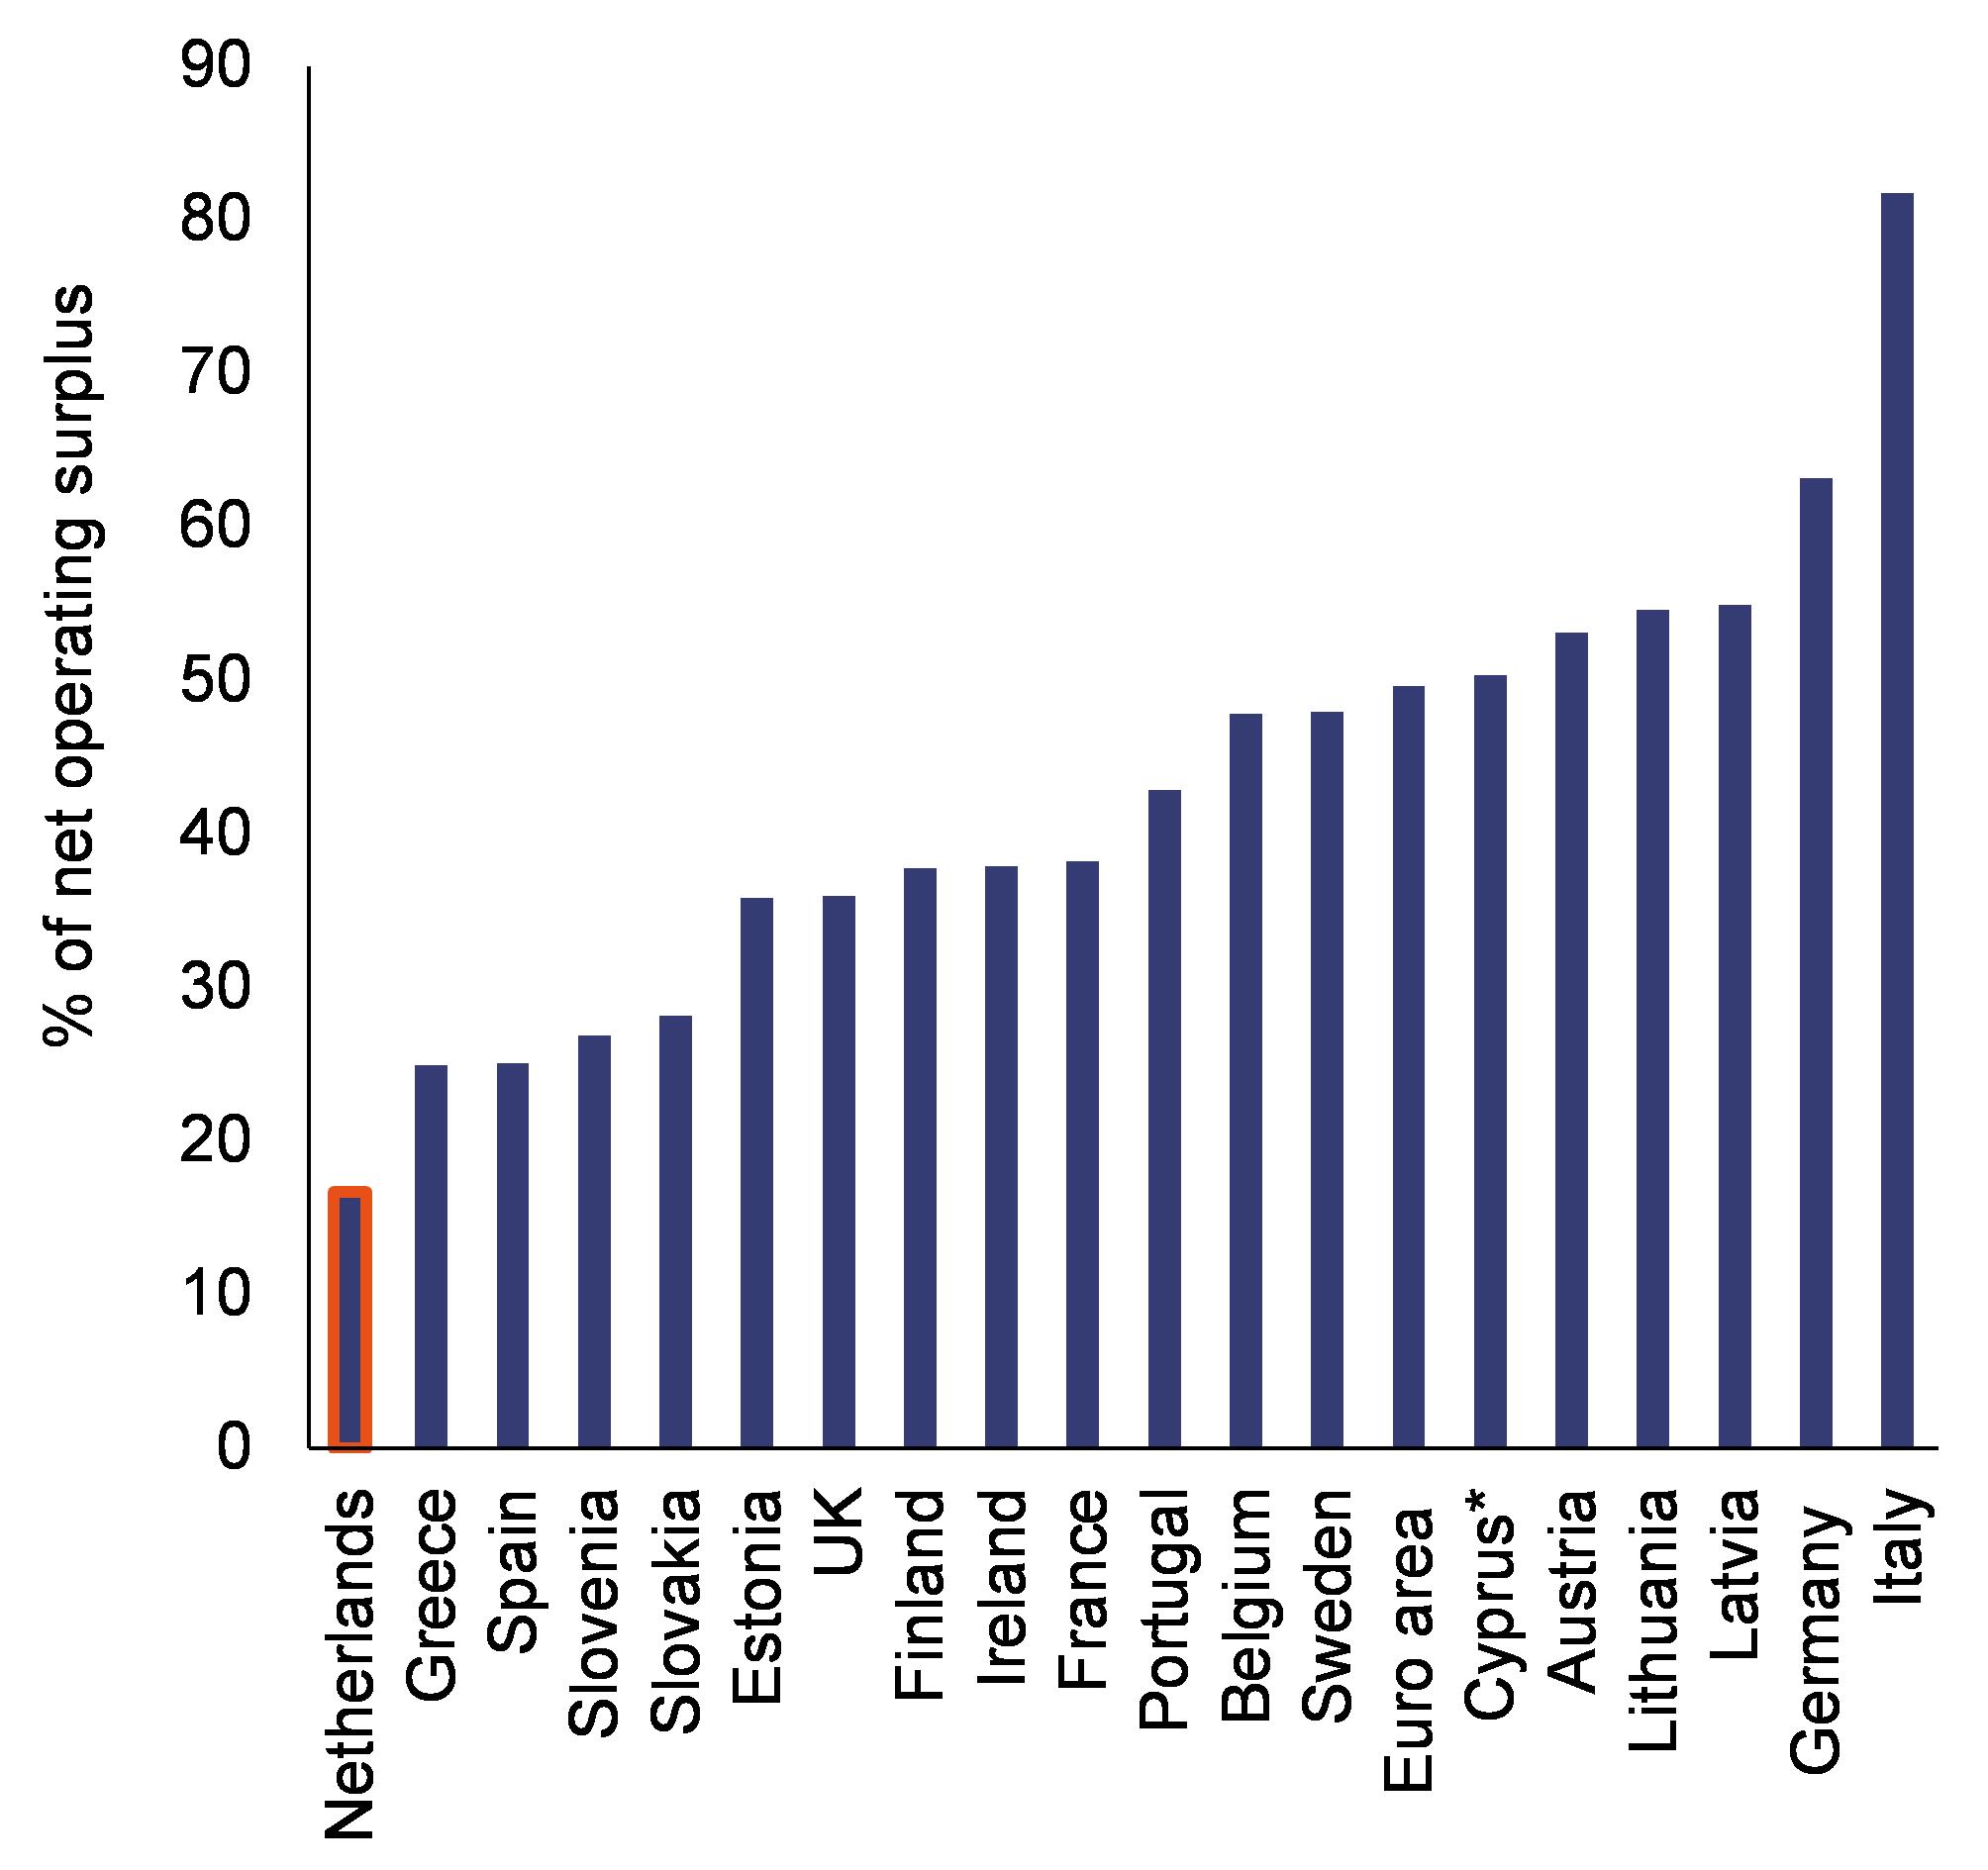
|
|
Source: European Commission (Eurostat); average 2014-2016.
|
MNEs drive corporate sector savings. While only around 2 % of all companies active in the Netherlands are classified as multinationals, they account for 40 % of private sector employment and around two thirds of private sector turnover (CBS, 2015). In particular MNE saving is volatile (See Graph 4.4.9). Although the production process and definitions are not comparable with national accounts, net savings by large firms account for roughly two thirds of total NFC savings. This suggests that in particular these firms are net lenders to the economy (see also EC, 2017b).
|
Graph 4.4.9:Corporate savings by firm size
|
|
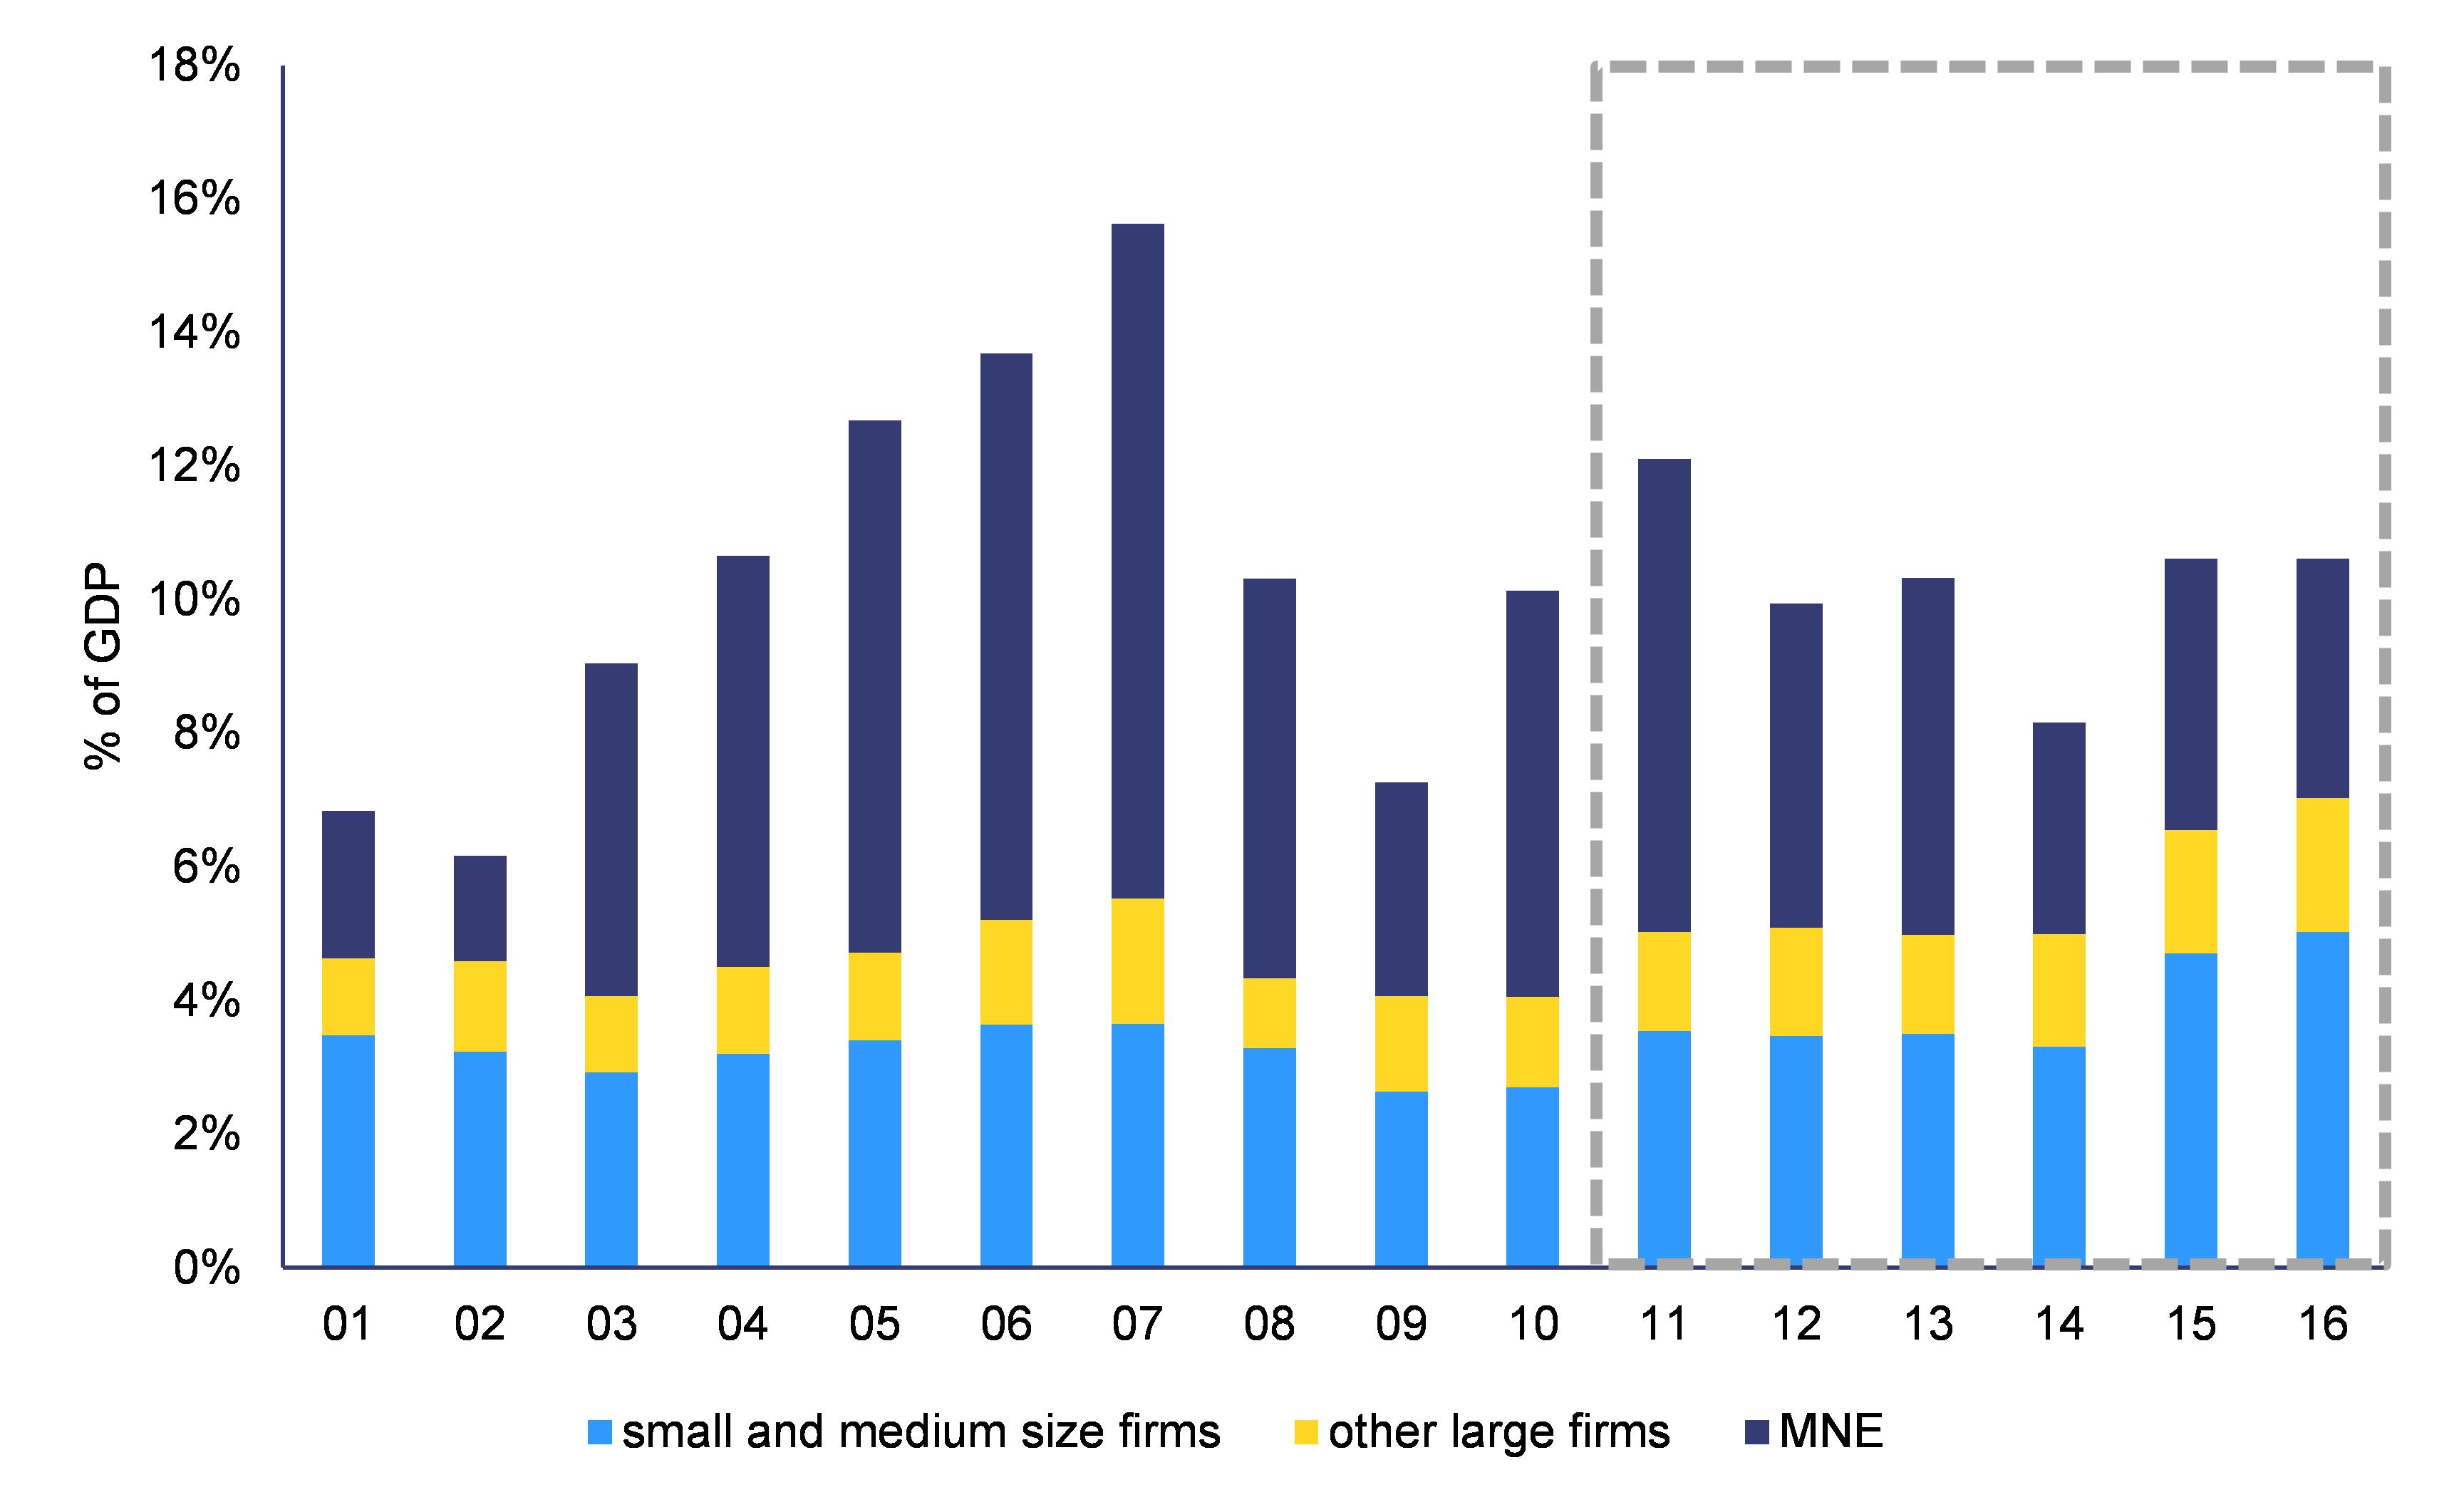
|
|
Source: European Commission (Statistics Netherlands/Statistiek Financiën Grote Ondernemingen and Statistiek Financiën Alle Ondernemingen;).
|
Real perspective on the current account
The current account surplus of the Netherlands averaged 6 % of GDP over the past three decades. In 2012, the current account balance reached a peak of 10.3 % of GDP, before declining slightly to 9 % of GDP in 2016 (see Graph 4.4.10). In the last decade, the current account surplus remained significantly above both the long-term average and the current account benchmarks. Fundamental drivers explain 3.8 pps of the current account surplus, according to Commission current account 'norm' estimations for 2016.(
) This figure is mainly due to the high income per capita, and expected ageing relative to the rest of the world that imply implying net capital exports, as well as the Netherland's status as corporate financial centre for multinationals.
The balance on primary incomes declined sharply between 2012 and 2016. With a stable overall trade surplus, the recent decline in the current account surplus was mainly driven by a considerable decrease in net primary incomes, from a surplus of 2.4 % of GDP in 2012 to a deficit of -1.2 % of GDP in 2016. This decline was mostly visible in revenues from direct investment, but partly offset by increasing portfolio revenues. In 2016, the balance of secondary incomes was affected by a one-off payment of EUR 2.7 billion from the EU budgetary contributions to the Dutch state.
|
Graph 4.4.10:Current account
|
|

|
|
Source: European Commission (Eurostat)
|
The strong trade in goods continues to be the main driver of the current account surplus. While the trade balance in goods achieved a surplus of 11.9 % of GDP in 2016, the trade balance in services recorded a deficit of 0.9 % of GDP. The trade surplus in goods is mostly driven by chemical products as well as food and live animals. The economy shows a stable export specialisation in agricultural products such as cut flowers, bulbs and other plants compared to the EU-15. According to an analysis by Statistics Netherlands, the trade balance is inflated to a large extent by re-exports, which account for roughly 45 % of total exports (CBS, 2017c). Although re-exported goods are not processed or changed much while in the Netherlands, Statistics Netherlands estimates that the domestic value added of re-exports is around 11 cents per exported euro, leading to a total value added of just below 3 % of GDP in 2016.(
) The trade deficit in services is largely driven by trade in royalties, tourism and transport services.
|
Graph 4.4.11:Trade balance goods by product group (2016)
|
|

|
|
Source: European Commission (Statistics Netherlands)
|
|
Graph 4.4.12:Trade balance services by product group (2016)
|
|

|
|
Source: European Commission (Statistics Netherlands)
|
Economic consequences
Large persistent surpluses could point to a suboptimal allocation of economic resources over time and/or between certain sectors. The large and persistent national savings surplus has been questioned as a sign of inefficiencies.(
). Large second pillar pension savings, for instance, drive up the compulsory tax and non-tax payment burden on labour (the combination of taxes, health care and pension contributions, see Section 4.2). In the midst of the crisis, pension reserves kept growing, among others due to higher premiums driving up the household saving rate, and driving down net take-home pay. Pro-cyclical income and consumption dynamics are further fuelled by household balance sheet issues. Dutch households typically have long balance sheets, with large illiquid pension entitlements and housing equity on the asset side and high household debt on the liability side. Relatively low liquidity of households increases the volatility of consumer demand over the cycle. This led to a relatively large reduction in private consumption compared with other EU countries. Addressing household balance sheet issues, amongst others via an overhaul of the second pension pillar (as currently being discussed by the social partners, see Section 4.2.4), has the potential to reduce the volatility of the household savings-investment balance and make the domestic economy more resilient to financial shocks
The persistent net lending position did not develop into an equivalent net international investment position. By running current account surpluses, a country builds up a positive net international investment position (NIIP). While this makes the surplus country a creditor, it harbours a risk of valuation gains/losses due to changes in exchange rates and market prices. Although NIIP increased in line with the current account surpluses in recent years, the NIIP remains far below the level of cumulated annual current account surpluses over a longer period (see Graph 4.4.13).
Symmetric rebalancing would be beneficial for the euro area economy. Although the euro area economy has experienced relatively strong expansion in recent years, Commission analysis points to a shortfall in domestic demand (see Graph 4.4.14). A saving surplus in the Netherlands increases the supply of capital to other countries (in the EU, but also to the rest of the world) and lowers interest rates. In normal economic conditions, this would stimulate domestic demand. However, given the current low interest rate environment, an increase in savings has little impact on interest rates and is ineffective in stimulating demand. More direct spending would then be more effective in increasing euro area production and job creation. It should be emphasised that this is a time-variant conclusion and depends on the state of the economy.
|
Graph 4.4.13:NIIP and cumulative current account surplus
|
|

|
|
Source: European Commission (Eurostat)
|
In sum, more domestic spending has positive benefits for the Netherlands and the EU. The persistent and large national savings surplus may be to some extent a symptom of pro-cyclical institutions shaping household saving and investment behaviour. Over a longer period of time, it may be of little benefit (shown by the differences between the cumulated annual surpluses and the NIIP). More domestic investment may lead to positive spillovers to other euro area countries and, endogenously, to more economic growth in the euro area and the Netherlands.
|
Graph 4.4.14:Euro area output and aggregate demand
|
|

|
|
Source: European Commission (Eurostat)
|
|
Box 4.4.1: Investment challenges and reforms in the Netherlands
Section 1. Macroeconomic perspective
In 2016, the investment rate returned to the long-term average level of 20 % of GDP. In particular residential investment experienced boom-bust episodes during the crisis, with a sharp drop related to the housing market slump and an equally sharp recovery from 2014 onwards. Looking ahead, private investment is expected to continue to grow, albeit at more sustainable lower rates. Investment in intangible assets accounts for some 10 % of total business gross fixed capital formation, which is in line with the EU average but below levels in the US, the UK and the Nordic countries. Public investment peaked at 4.3 % of GDP in 2009, declined to 3.5 % in 2016 and is expected to remain roughly stable over the coming years, according to the European Commission Autumn 2017 Economic Forecast. Public and private expenditure on R&D remains well below the overall 2.5 % of GDP target and it is low compared to the top performers, despite increased public R&D funding in the new Coalition Agreement.
Section 2. Assessment of barriers to investment and ongoing reforms

Main barriers to investment and priority actions underway
Overall, the Netherlands faces relatively few regulatory barriers to investment, as confirmed by the European Commission assessment (see EC, 2015). The new government's fiscal plans contain a substantial investment in R&D (see Section 4.5.2). Certain sectoral regulations may create obstacles to investment, e.g. procedures to obtain building permits are lengthy, although World Bank Doing Business indicators point to a slight improvement compared to last year (in relative terms). Nevertheless, the Netherlands still ranks relatively low (76th compared to 87th in 2016), which is largely explained by the time it takes to obtain the building permit. The Netherlands has introduced all administrative procedures to support investment in renewable energy (see EC, 2017i), lowering barriers to investment in this sector. However, despite additional measures as well as a new 'energy transition finance facility' that opened in July 2017, the Netherlands is expected to miss its renewable energy target for 2020.
|
4.5. Sectoral policies
4.5.1.Productivity developments, innovation and competition
The post-crisis recovery in productivity growth is mostly driven by total factor productivity (TFP) growth. The Dutch economy is one of the most productive of the world with an income per capita 20 % above the EU average. Since the 1970s, productivity growth has slowed down considerably from an average 5 % per year to barely 1 % over the last years. The recent modest recovery in GDP growth is mostly down to TFP growth, which has been the only sustained source of productivity growth in recent years (see Graph 4.5.1).
|
Graph 4.5.1:Contributions to changes in growth of real value added
|
|

|
|
Source: European Commission, EU KLEMS database
|
The main contributions to aggregate productivity growth come from developments within sectors. A shift-share analysis of productivity growth shows that changes in the sectoral structure had a negative - albeit minor - effect on aggregate productivity growth while the bulk of the productivity growth was due to productivity developments within sectors (see Table 4.5.1).
Whereas ICT, energy and the financial sector experienced the fastest productivity growth before the crisis; productivity growth has been driven mostly by the real estate, construction and trade-related sectors after the crisis. Productivity levels are traditionally high in manufacturing and low in services. Post-crisis productivity growth was also relatively high in manufacturing, trade and transport sectors (see Graph 4.5.2).
|
|
|
Table 4.5.1:Total productivity growth, 1995-2015 (%)
|
|
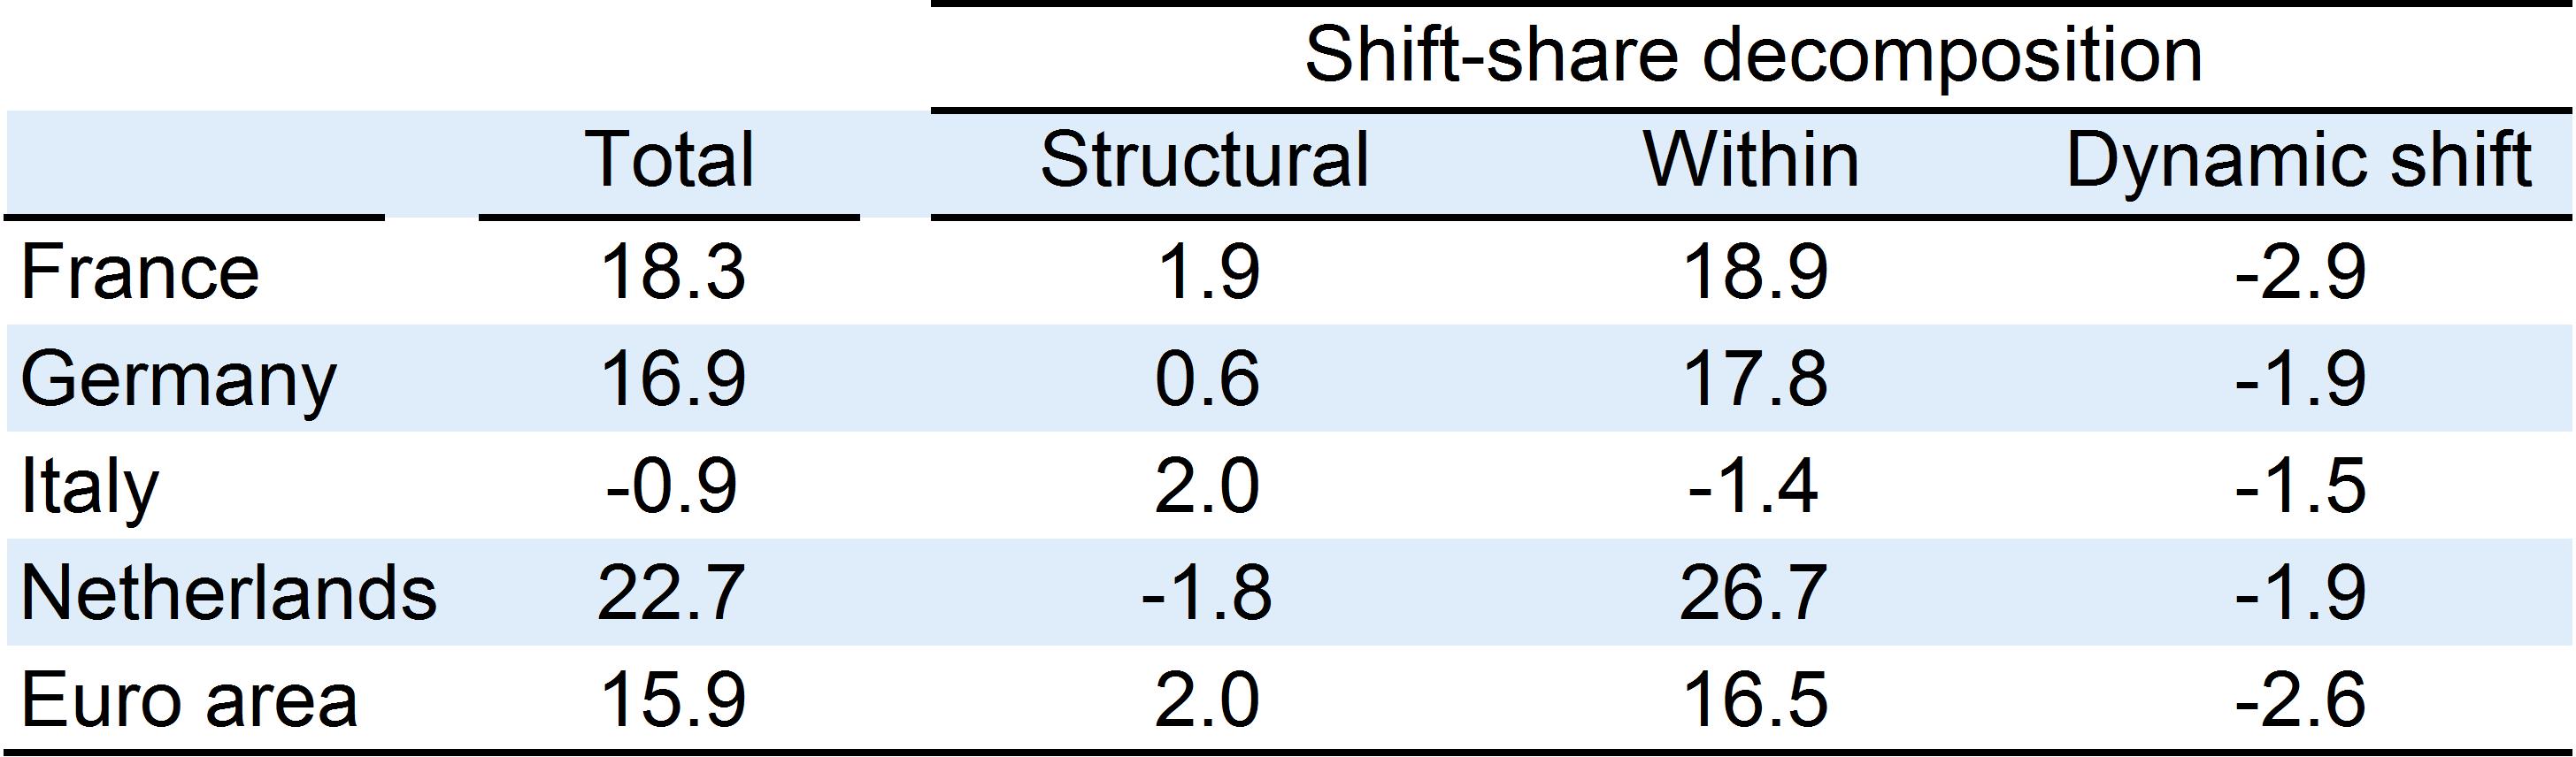
|
|
Source: European Commission, AMECO database and own calculations
|
|
|
|
Graph 4.5.2:Productivity development by sector
|
|

|
|
Source: European Commission (EU KLEMS)
|
A recent study, focussing on Dutch firm level data shows relatively small differences between sectors and finds no evidence for a lack of technology diffusion. The detailed analysis of firm-level productivity growth before, during and after the crisis in a recent CPB study - based on register data and other administrative data sources for 53 sectors for the period 2006-2015 - shows strikingly similar patterns in all sectors between so-called leading firms at the 'productivity frontier' and lagging firms (see Van Heuvelen, Bettendorf and Meijerink, 2018, forthcoming). Leading firms and lagging firms are found to be subject to a decline of productivity growth during the crisis, with the strongest decline for frontier firms in the services sector, while revealing increasing differences in the productivity increase during the recovery (see Graph 4.5.3). These findings allow the authors to conclude that the observed productivity slowdown is not due to changes in transmission mechanisms (technology diffusion from leading frontier firms to other firms in the sector such that successful technologies employed by the frontier firms are transmitted to the other firms in the economy). The study also shows that there is substantial mobility of firms with regard to their relative position to the national productivity frontier (only some 10 % of the firms remain at the national productivity frontier over a period of 5 years). A significant share of firms is found to change positions over time, including among those classified as either leading or lagging firms.
|
Graph 4.5.3:Productivity growth by firm productivity level (leaders/laggards)
|
|

|
|
Source: European Commission based on Van Heuvelen et al (2018, forthcoming)
|
Further reducing on-the-job skill mismatches and putting skills to better use can increase productivity. Based on data from the Programme for the International Assessment of Adult Competencies (PIAAC) survey, the actual use of numeracy and IT skills on the job is much lower than the proficiency of the workforce; there are also significant numbers of over-skilled workers in the lower wage quintiles in particular. Reducing the skills mismatch to OECD best practice could increase productivity by up to 3 % (OECD, 2015, 2017b). Addressing shortages and restrictions in housing would reduce skill shortages at regional level and further increase labour productivity (OECD, 2017a,c).
Construction sector
The level of labour productivity in the Dutch construction sector is low, reflecting fragmentation, slow digitisation and skill shortages. Contrary to developments in neighbouring countries, the contribution of both ICT capital and TFP to labour productivity growth in the Dutch construction sector has been negative since the crisis. This may, amongst others, be linked to subdued investment in technologies, slow digitisation of the construction value chain, under-use of ICT skills, an ageing workforce and shortages of skilled labour. Supporting innovation and the scaling up in particular of micro-companies and the self-employed without employees, who account for more than 85 % of firms in the Dutch construction sector (EU average: 57 %), could reduce fragmentation of the sector, speed up digitisation, improve its attractiveness for younger workers(
) in particular and promote participation in larger, cross-border construction value chains (EC, 2017a).
Specific sectoral regulations and payment delays may hamper productivity in the construction sector. Although the Netherlands faces relatively few regulatory barriers to investment and business development in general (see Box 4.4.1), barriers do remain e.g. linked to planning and permit procedures for construction investment. Apart from a horizontal authorisation scheme on hoisting, the Netherlands imposes fully-fledged building permits without simpler procedural alternatives. Moreover, while the Netherlands has good public administration-to-business payment relations, payment delays in B2B relations increased significantly in 2016: 41 % of construction companies experience late payments, and over a fifth of construction SMEs working as sub-contractors are not paid at all by the main contractor (EC, 2016b).
4.5.2.Research and innovation
According to worldwide rankings, the Netherlands has a strong innovation capacity thanks to a productive R&D sector, competitive business environment and solid framework conditions in general. The country ranks highly in all main composite indexes: World Economic Forum Global Competitiveness Index (4th); European Innovation Scoreboard (4th); Global Innovation Index (3rd); Digital Economy and Society Index (4th).
Fostering higher business sector investment in R&D has the potential to increase productivity growth, in particular in the manufacturing sector. Productivity growth is driven by many factors — from investment in ICT and non-ICT capital, integration and diffusion of new technology, complementary investment in other intangibles and training the workforce to maximise their positive contribution, through to well-functioning institutions and markets (Grabska et al., 2017). Advanced economies like the Netherlands have limited potential to increase productivity by catching up with leaders’ processes. Instead, fully exploiting the benefits of digitisation and innovation by making investments in R&D and other intangible assets is essential for increased productivity. Business R&D intensity (1.16 %) remains low compared to peers and grew slowly in recent years (2011-2016), while nominal R&D investment (in EUR) grew by 17 % in the same period. Although relatively low investments in R&D in part reflect the economic structure of the Netherlands, which has a strong specialisation in services and other sectors with a low formal R&D component, R&D in manufacturing is also relatively low (see Graph 4.5.4). Nevertheless, this low level may be partly explained by R&D activities in other countries by large Dutch firms. The Netherlands has a high number of large multinationals whose R&D activities are located in other countries. For instance, the 2017 EU Industrial R&D Investment Scoreboard places 38 Dutch companies among the top 2 500 R&D investors in the world(
). These companies alone make up 1.3 % of GDP in R&D investments, which is more than intramural R&D intensity of 1.16 %(
).
|
Graph 4.5.4:R&D intensity in manufacturing
|
|

|
|
Source: European Commission, EU KLEMS database
|
The dynamics of entrepreneurial activities and innovative business growth appear relatively good. Both the share of employment in knowledge-intensive activities (17.5 %), and the share of employment in fast growing SMEs in innovative sectors (5.5 %) are relatively high. Also the share of the population engaged in early-stage entrepreneurial activity is relatively high (11% of total population aged 25-64, GEM, 2017).
Public support to research and innovation is well established. Total public support to research and innovation reaches EUR 6.5 billion, which include EUR 1.2 billion of indirect fiscal support through the WBSO scheme. The clarity of the R&I support system coupled with regular monitoring and evaluations is a strong point. In the coalition agreement, the government announced that by 2020, an extra EUR 400 million will be structurally spent on research, of which EUR 200 million for applied research and innovation. In 2018 and 2019 an incidental investment of EUR 50 million will be made in research infrastructure. Moreover, the government announced to invest EUR 2.5 billion in a new finance and development organisation called Invest-NL. This should lead to more venture capital for innovative start-ups and scale-ups. Invest-NL will also try to attract public and private capital from other funds, such as the EFSI-fund and the EIB. Most existing risk financing and venture capital funding, such as the SEED capital scheme, will be grouped together within this facility.
The public R&D intensity has gradually risen to 0.88 % of GDP in 2016, which approaches the average level of most advanced EU peers (1 %). In 2015, total budget for R&D amounted to 0.73 % of GDP, a relatively high level in the EU, but lower compared to most advanced EU peers. For the period 2018-2021, total government budget outlays for R&D is forecast to decline from 0.67 % to 0.63 % of GDP (not counting the extra expenditure on research and innovation announced in the coalition agreement), mostly due to nominal GDP growth, the denominator (see Vennekens and Van Steen, 2017). Dutch stakeholders and advising bodies suggest, in several issued opinions and analyses, that extra investments would be necessary in the coming years. Particular concerns remain regarding maintaining the knowledge capacity of the technological institutes over the long term. Over the period 2010-2021, public funding for institutions that are focused on applied research, essentially the TO2 institutes, would decrease by 21 %. Upon request of the government, the Dutch research council issued an opinion on how to orient the policy for applied research (AWTI, 2017). The council notably advised to increase investment by EUR 330 million per year to support the research capacity of public research organisations. Research infrastructures would also require public investments in the coming years (Strategic Agenda TO2, 2017).
Collaboration between business and knowledge institutions may prove to be an effective way to increase innovation. The Netherlands innovation ecosystem can build on its higher education and public research systems. The science base is very good with 14.3 % of scientific publications among the 10 % most cited worldwide, amongst the highest performers in the EU. The openness and quality of public research is also reflected in the high proportion of international scientific publications and the internationalisation of research staff (a third of the scientific personnel is foreign; 45 % of PhDs). A recent evaluation of the top sector policy, the Government's industry policy, concluded that the approach has successfully strengthened collaborations between public and private actors through now well-established governance (Bongers et al., 2017). It however highlighted that public authorities may need to adopt a clearer and stronger role, in particular taking up more responsibility in defining innovation objectives, as this would give more directions to the potential collaboration, especially for solving societal challenges.
4.5.3.Public procurement
The Netherlands has performed satisfactorily on public procurement. Its performance is excellent on the use of e-procurement, favouring competition among bidders, decision speed and the use of strategic procurement. The Netherlands is also one of the most experienced Member States in terms of using pre-commercial procurement. The public procurement expertise centre PIANOo is key to the capacity building of public procurers and fostering innovation procurement (see Box 4.5.1).
The amendment of the 2012 Public Procurement Act also provided greater legal certainty and opportunities for SMEs. The amendment includes: the prohibition on minimum turnover requirements, the requirement to justify bundling of contracts, the promotion of splitting contracts into lots and a lower administrative burden to take part in the tender. Since January 2017, there is further an obligation for all national government suppliers to use e-invoicing. Nevertheless, a number of practical obstacles make it difficult for SMEs to participate in public procurement, such as large contracts, disproportionate or unclear eligibility requirements, high administrative costs, long-term framework contracts and a lack of procurement expertise. The number of tenders published according to EU rules is below the EU average (representing 2.2 % of GDP compared to 4.4 % of GDP in the EU), and reporting quality is generally poor, with 75 % of bids published EU-wide without tender value (EC, 2017k).
|
Box 4.5.1: Policy highlight: Public procurement expertise centre in the Netherlands
PIANOo (Professioneel en Innovatief Aanbesteden, Netwerk voor Overheidsopdrachtgevers)(
IV
) is the public procurement expertise centre of the Netherlands, linked to the Ministry of Economic Affairs. PIANOo's aim is to improve the government's procurement processes and compliance with (EU) procurement rules in the Netherlands. It further aims at increasing the procurement of innovative solutions in the Netherlands. The main task of the centre is to provide information and give advice to government organisations on purchasing and tendering services and equipment. PIANOo offers access to tools and model documents on their website, organises meetings, provides for an online forum, publishes topical documents and organises tendering law courses. PIANOo's expertise is built up through a large network of around 3 500 public procurement professionals and contracting authorities. The centre brings together experts in specific areas and fosters dialogue between government contracting authorities and private sector companies.
One information tool provided by PIANOo is a web-based 'Innovatiekoffer'(
V
) ("innovation suitcase") to help contracting authorities with innovation-focused procurement. The tool describes various instruments, e.g. demand analysis, risk management, market consultation and innovation partnership. The tool also encompasses trajectories, which describe how to combine different instruments, and specific cases of innovative projects.
|
In 2005, the Netherlands introduced the Small Business Innovation Research Programme (SBIR) to encourage companies to develop new innovative products and services to meet the demand of public authorities. It consists of a two-stage competition in which companies with the best proposals carry out a feasibility study. The programme then finances the development of their innovative solutions, so that public entities may be able to buy these new products in the future. An evaluation of the SBIR instrument has been carried out at the request of the Ministry of Economic Affairs which showed that the SBIR instrument has social added value (Bongers et al., 2017).
The new government programme specifically indicates that public procurement should be used more strategically, with particular emphasis on innovation procurement and wider use of the SBIR instrument. The Netherlands continues to pursue ambitious quantitative and qualitative innovation procurement targets, including a target of 2.5 % of total procurement for central public administration to spend on innovation. Moreover, the Ministry of the Interior manages the ‘Smarter Network’ (Slimmer netwerk), which involves around 4 000 innovation officials and advisers within the government, provinces, municipalities, water authorities and police (OECD, 2017e). Examples such as the Erasmus University Medical Centre highlight the potential positive impacts of innovation procurement (OECD, 2016).
The Netherlands is a global front runner in circular procurement, with pilot projects developed to promote the uptake of the ‘circular economy’ (where products are designed to be energy-efficient, long-lasting and recycled as much as possible) in public procurement. Most circular procurement projects are carried out as part of either the ‘Green Deal: Circular Procurement’ agreement or the REBUS (Resource Efficient Business Models) project. Both of these initiatives aim to develop tools and practical examples for circular procurement. However, there are still a number of barriers to promoting innovation in the circular economy; these require better awareness of the fact that transitioning to a circular economy needs different forms of innovation: technological, financial (business cases), organisational (working methods) and social (focused on cooperation and teamwork) (SER, 2017).
4.5.4.Energy and sustainability
The government plans to draft a national climate and energy agreement outlining the national strategy to meet its 2030 objectives. The agreement is to be drawn up in cooperation with local and regional authorities as well as stakeholders. Measures from this agreement will be incorporated into national climate law. The government's ambitions include closing of all coal-fired power plants by 2030, selling only zero emission cars by 2030, reducing emissions from housing and buildings through a combination of energy efficiency and sustainable power and heating, and allotting additional areas for off-shore wind farms. Compensating measures for closing coal-fired power plants have not been announced.
Natural gas production will be further decreased. As a result of production ceilings set for the Groningen field (due to earthquakes) and lower production levels at other small gas fields following natural depletion, gas production will be further reduced in the coming years. According to the International Energy Agency, the Netherlands is expected to become a net importer of gas by 2025.
The Netherlands is the only Member State that did not reach its 2013/2014 indicative renewable energy sources (RES) trajectory of 5.9 % of gross final energy consumption. With a 5.84 % renewable energy share in gross final energy consumption in 2015, the Netherlands is also expected to miss its 2015-2016 indicative RES trajectory of 7.6 %. While the National Energy Outlook 2017 projects acceleration in the increase of the renewable energy share towards 2020, it is unlikely that the Netherlands will be able to fully deliver by 2020. The government has announced some additional measures as it plans to increase funds in the support scheme for renewable energies (Stimulering Duurzame Energieproductie) towards EUR 3.2.billion per year. The national target of 16 % renewable energy in 2023 agreed upon in the National Energy Agreement is expected to be met. Although the Dutch government adopted an 'Energy Agenda' providing strategic guidance for a low-carbon energy system for 2050, it has not adopted an explicit RES target for 2030. Given the slight increases in energy consumption, energy efficiency efforts need to be kept up to ensure the 2020 targets will be met.
The coalition agreement includes the further development of a national circular economy programme aimed at supporting the national climate policy and the natural resources agreement. Although among the highest of the EU, the waste recovery rate is rather low vis-à-vis neighbouring countries, while the physical waste intensity (i.e. the waste intensity in terms of Domestic Materials Consumption) is relatively high and increasing faster than EU average. The Netherlands scores relatively low (16th) in the 2016 Eco-Innovation Index(
), which points to the need to improve the circular economy programme. Nevertheless, the performance as regards the development of environmental technologies and the diffusion of these technologies seems to be not too far from the EU average in 2016. The agendas sent to parliament in January 2018 include a focus on monitoring progress in the transition to a circular economy and the scale up of successful pilot projects and other initiatives.
The Dutch government will use a “modernisation of the tax system” to deliver on its pledge to green and decarbonise the country’s economy. A fiscal annex to the new Dutch government programme, which includes a pledge to cut carbon emissions by 49 % from 1990 levels by 2030, outlines initiatives to offset reductions in income tax with increased taxation in the fields of energy, environment and consumption. The government also aims to introduce a minimum price for CO2 from electricity generation — a carbon price floor — starting at EUR 18 in 2020 and rising to EUR 43 by 2030 to supplement the price signal from the EU ETS. Companies in the sector would be charged an additional levy based on the price difference between the EU allowances and the price floor. In order to better reflect CO2 emissions, a rebalancing of the energy tax for consumers will see gas costs increase by EUR 0.03 per cubic metre, while tax on electricity will decrease by EUR 0.0072 per kilowatt hour. The Netherlands is among the Member States, which give an incentive for the use of electric vehicles in order to improve local air quality by applying lower excise duties for electricity supplied to charging stations. For the time being, air pollution continues to give rise to serious human health concerns (European Environment Agency, 2017, pp.57-58).
Annex A: Overview table
|
Commitments
|
Summary assessment (
)
|
|
2017 country-specific recommendations (CSRs)
|
|
CSR 1: While respecting the medium-term objective, use fiscal and structural policies to support potential growth and domestic demand, including investment in research and development. Take measures to reduce the remaining distortions in the housing market and the debt bias for households, in particular by decreasing mortgage interest tax deductibility.
|
The Netherlands has made some progress in addressing CSR 1(
):
|
|
While respecting the medium-term objective, use fiscal and structural policies to support potential growth and domestic demand,
|
Substantial progress. The government has taken fiscal measures that support domestic demand, in particular increasing expenditure on security and on teachers' salaries.
|
|
including investment in research and development.
|
Some progress. From 2018 onwards, the government increases expenditure on research and development.
|
|
Take measures to reduce the remaining distortions in the housing market and the debt bias for households, in particular by decreasing mortgage interest tax deductibility.
|
Some progress. The government has announced to accelerate the reduction of mortgage interest tax deductibility from 2020 onwards until it reaches 37 % in 2023, which is still relatively high. For the rental market, the government has created a roundtable on the middle segment rental market (Samenwerkingstafel Middenhuur) to bring stakeholders together to discuss challenges and solutions in the rental market. The roundtable will issue recommendations on how to stimulate the middle segment of the rental market. Furthermore, the Law on Spatial Planning was amended in 2017, allowing municipalities to set aside zones specifically for building middle segment rental dwellings. Other remaining distortions in the social housing sector have not been addressed.
|
|
CSR 2: Tackle remaining barriers to hiring staff on permanent contracts. Address the high increase in the self-employed without employees, including by reducing tax distortions favouring self-employment, without compromising entrepreneurship, and by promoting access of the self-employed to affordable social protection. Based on the broad preparatory process already launched, make the second pillar of the pension system more transparent, inter-generationally fairer and more resilient to shocks. Create conditions to promote higher real wage growth, respecting the role of the social partners.
|
The Netherlands has made limited progress in addressing CSR 2:
|
|
Tackle remaining barriers to hiring staff on permanent contracts.
|
Limited progress. The government has announced several additional measures and ideas/intentions for further reflection on segmentation, but no legislative measures have been presented yet.
|
|
Address the high increase in the self-employed without employees, including by reducing tax distortions favouring self-employment, without compromising entrepreneurship, and by promoting access of the self-employed to affordable social protection.
|
Limited progress. The government has announced the introduction of a minimum hourly rate for the self-employed and ideas for further reflection, but no legislative measures have yet been presented. The announced reduction of tax brackets from four to two may reduce the maximum rate of specific tax deductions for some self-employed not operating at the margin of the labour market in a phased manner. No specific measures have been announced on the social security coverage of the self-employed.
|
|
Based on the broad preparatory process already launched, make the second pillar of the pension system more transparent, inter-generationally fairer and more resilient to shocks.
|
No progress. The government has confirmed its intention to reform the second pillar of the pension system, but no measures have been announced so far.
|
|
Create conditions to promote higher real wage growth, respecting the role of the social partners.
|
Limited progress. The government has acknowledged the need for higher real wage growth. The announced new fiscal measures will reduce the tax burden on labour income. In addition, the coalition agreement includes an increase in expenditure on teachers' salaries. In general, wage setting is the competence of the social partners and recent wage demands (and those already agreed for certain sectors) are substantially higher for 2017 and 2018. A tightening of the labour market is expected to push up real wage growth.
|
|
Europe 2020 (national targets and progress)
|
|
Employment rate target set in the 2016 NRP: 80 %.
|
Labour market participation stood at 81.6 % in Q2-2017 and employment at 77.1 % in 2017Q2. The Netherlands is on target to reach this goal.
|
|
R&D target: 2.5 % of GDP.
|
In 2016, total R&D expenditure amounted to 2.03% of GDP. The average yearly growth rate of 1.0% since 2012 would need to increase substantially to over 5 % to reach the target by 2020.
|
|
·National greenhouse gas (GHG) emissions target:
·-16 % in 2020 compared to 2005 (in sectors not covered by the EU emission trading scheme).
·Non-ETS 2016 target: -9 %.
|
According to national projections, the Netherlands is expected to overachieve its greenhouse gas reduction target 2020 target under the Effort Sharing Regulation of -16 % by 10 pp compared to 2005.
The intermediate -9 % target for 2016 has been overachieved by 11 %.
|
|
2020 renewable energy target:
·Energy from renewable sources is 14 % of gross final energy consumption by 2020.
·The 2015-2016 interim target is 7.6 %.
|
With a 5.84 % renewable energy share in gross final energy consumption in 2015, the Netherlands is expected to miss its 2015-2016 indicative RES trajectory of 7.6 %. It is unlikely that the Netherlands will fully deliver on the 2020 target without additional effort.
|
|
Energy efficiency target: 11.5 Mtoe of cumulative savings in final energy consumption in 2014-2020. This translates into:
·60.7 Mtoe in primary energy consumption, and
·52.2 Mtoe in final energy consumption.
|
Primary energy consumption increased from 64.59 Mtoe in 2015 to 64.8 Mtoe in 2016. Final energy consumption remained stable at 49.5 Mtoe during 2015 and 2016.
Given the slight increases in energy consumption, efforts need to be kept up to ensure the 2020 targets will be met.
|
|
Early school leaving (ESL) target: <8.0 %.
|
The ESL rate has been falling for years, and the national target has already been achieved in 2016 with an 8 % rate.
|
|
Tertiary education target: >40 %.
|
The rate was 45.7 % in 2016, which is well above the national target and the EU average of 39.1 %.
|
|
Target for reducing the number of people living in households with very low work intensity in number of people: - 100 000 (aged 0-64).
|
Starting in 2010 with 1 595 000 people belonging to this group the number has increased to 1 653 000 in 2015, and remained stable in 2016. Thus, the target is not in reach.
|
Annex B: Macroeconomic Imbalance Procedure Scoreboard
|
|
|
Table B.1:The MIP scoreboard for the Netherlands (AMR 2018)
|
|

|
|
Source: European Commission 2017, Statistical Annex to the Alert Mechanism Report 2018, SWD(2017) 661.
|
|
|
Annex C: Standard tables
|
|
|
Table C.1:Financial market indicators
|
|

|
|
Source: European Commission (long-term interest rates); World Bank (gross external debt); Eurostat (private debt); ECB (all other indicators)
|
|
|
|
|
|
Table C.2:Headline Social Scoreboard indicators
|
|

|
|
Source: Eurostat
|
|
|
|
|
|
Table C.3:Labour market and education indicators
|
|

|
|
Source: Eurostat, OECD
|
|
|
|
|
|
Table C.4:Social inclusion and health indicators
|
|

|
|
Source: Eurostat, OECD
|
|
|
|
|
|
Table C.5:Product market performance and policy indicators
|
|

|
|
Source: European Commission; World Bank — Doing Business (for enforcing contracts and time to start a business); OECD (for the product market regulation
indicators); SAFE (for outcome of SMEs' applications for bank loans)
|
|
|
|
|
|
Table C.6:Green growth
|
|

|
|
Source: European Commission and European Environment Agency (Share of GHG emissions covered by ETS); European Commission (Environmental taxes over labour taxes and GDP); Eurostat (all other indicators)
|
|
|
References
Adriaens, H., P. Fontein, M. den Uijl and K. de Vos (2016), De toekomstige arbeidsmarkt voor onderwijspersoneel po, vo en mbo 2015-2025, CentERdata, Tilburg.
Afman, E. and S. Deroose (2016), De Raad van State als Begrotingsraad: effectiviteit en uitdagingen. Economisch Statistische Berichten Vol. 101, pp.750-754.
Algemene Rekenkamer (2017), Inburgering: Eerste resultaten van de Wet inburgering 2013, Netherlands Court of Audit, the Hague.
Arpaia, A. and A. Kiss (2015), Benchmarks for the assessment of wage developments, Short Analytical Webnote 2/2015, European Commission, Publications Office of the European Union, Luxembourg, 2015. http://publications.europa.eu/s/b4YC.
Andrews, D., C. Criscuolo and P. Gal (2015), Frontier Firms, Technology Diffusion and Public Policy: Micro evidence from OECD countries, OECD Productivity Working Papers, Paris.
AWTI (2017), Onmisbare schakels: De toekomst van het toepassingsgericht onderzoek, Adviesraad voor wetenschap, technologie en innovatie, The Hague.
Bovenberg, A. (1991), Overvloed en onbehagen: Sparen en investeren in Nederland. Economische Statistische Berichten, 76(3794), pp. 144-148, Amsterdam.
Bongers, F., P. de Boer, M. Janssen, J. Steur, J. Veldman and B. Verspagen (2017), Evaluatie Small Business Innovation Research (SBIR), on request by the Ministry of Economic Affairs, Dialogic, Utrecht.
Carroll, C., J. Slacalek and K. Tokuoka (2014), The Distribution of Wealth and the MPC: Implications of New European Data. The American Economic Review, 104(5), 107-111.
Centraal Bureau voor de Statistiek (CBS) (2015), Internationaliseringsmonitor 2015, derde kwartaal, Statistics Netherlands, The Hague.
Centraal Bureau voor de Statistiek (CBS) (2016), Laagste huurstijging in vijf jaar, available at: https://www.cbs.nl/nl-nl/nieuws/2016/36/laagste-huurstijging-in-vijf-jaar
Centraal Bureau voor de Statistiek (CBS) (2017a), Kernindicatoren integratie 2017, available at: https://www.cbs.nl/nl-nl/maatwerk/2017/31/kernindicatoren-integratie-2017
Centraal Bureau voor de Statistiek (CBS) (2017b), Kwart ICT-bedrijven heeft personeelstekort, available at: https://www.cbs.nl/nl-nl/nieuws/2017/26/kwart-ict-bedrijven-heeft-personeelstekort
Centraal Bureau voor de Statistiek (CBS) (2017c), Trade surplus excluding re-exports €20 billion lower, available at: https://www.cbs.nl/en-gb/news/2017/18/trade-surplus-excluding-re-exports-20-billion-lower
Commissie vraagfinanciering MBO (2017), Doorleren werkt: Samen investeren in nieuwe zekerheid, Rijksoverheid, The Hague.
De Beer, J., H. van Dalen and K. Henkens (2017), Stijgt de AOW-leeftijd niet te hard? Available at: http://www.mejudice.nl/artikelen/detail/stijgt-de-aowleeftijd-niet-te-hard
De Nederlandsche Bank (DNB) (2016), Loan markets in motion: Larger role of pension funds and insurers boosts financial stability, Central Bank of the Netherlands, Amsterdam.
De Nederlandsche Bank (DNB) (2017a), 'De woningmarkt in de grote steden', Occasional Studies Volume 15-1, Central Bank of the Netherlands, Amsterdam.
De Nederlandsche Bank (DNB) (2017b), Financial Stability Report - Autumn 2017, Central Bank of the Netherlands, Amsterdam.
Eggelte, J., R. Hillebrand, T. Kooiman and G. Schotten (2014), ‘Getting to the bottom of the Dutch savings surplus’, DNB Occasional Studies, Vol.12, No 6. Central Bank of the Netherlands, Amsterdam.
Eurofound (2017a), Exploring self-employment in the European Union, Eurofound report, Dublin.
Eurofound (2017b), Working time patterns for sustainable work, Eurofound report, Dublin.
European Central Bank (ECB) (2017), Report on Financial Structures, Frankfurt.
European Commission (EC) (2015), ‘Challenges to Member States’ Investment Environments’, Commission Staff Working Document COM(2015) 400 final, Publications Office of the European Union, Luxembourg.
European Commission (EC) (2016a), ‘Country Report Netherlands’, Commission Staff Working Document SWD(2016) 87 final, Publications Office of the European Union, Luxembourg.
European Commission (EC) (2016b), European Construction Sector Observatory: Country profile Netherlands, Publications Office of the European Union, Luxembourg.
European Commission (EC) (2017a), Background documents for the European Semester: Construction, Publications Office of the European Union, Luxembourg.
European Commission (EC) (2017b), ‘Country Report Netherlands’, Commission Staff Working Document SWD(2017) final, Publications Office of the European Union, Luxembourg.
European Commission (EC) (2017c), Eco-Innovation Scoreboard and Eco-Innovation Index, available at: https://ec.europa.eu/environment/ecoap/indicators/index_en
European Commission (EC) (2017d), ‘European Economic Forecast - Autumn 2017’, Institutional Paper 063, Publications Office of the European Union, Luxembourg.
European Commission (EC) (2017e), Impact Assessment accompanying the document Proposal for a Directive of the European Parliament and of the Council on work-life balance for parents and carers and repealing Council Directive 2010/18/EU, SWD/2017/0202 final - 2017/085 (COD), Publications Office of the European Union, Luxembourg.
European Commission (EC) (2017f), ‘Investment in Human Capital: Assessing the efficiency of public spending on education’, Note for the Eurogroup, 6 November 2017, available at: http://consilium.europa.eu/media/31409/investment-in-human-capital_eurogroup_31102017_ares.pdf
European Commission (EC) (2017g), Labour market and wage developments report in Europe, Publications Office of the European Union, Luxembourg.
European Commission (EC) (2017h), Prudential thresholds for private sector debt: households vs. non-financial corporations, Note for the Economic Policy Committee, 13 June 2017.
European Commission (EC) (2017i), Renewable Energy Progress Report, COM(2017) 57 final, Publications Office of the European Union, Luxembourg.
European Commission (EC) (2017j), SBA fact sheets for the Netherlands 2017, available at: https://ec.europa.eu/growth/smes/business-friendly-environment/performance-review_en#sba-fact-sheets
European Commission (EC) (2017k), Single Market Scoreboard, Performance per Policy Area: Public Procurement (Reporting period: 01/2016 - 12/2016), Available at: http://ec.europa.eu/single-market-scoreboard
European Commission (EC) (2017l), Tax Policies in the European Union 2017 Survey, Publications Office of the European Union, Luxembourg.
European Commission (EC) (2017m), 'Empirical current account benchmarks: modelling the impact of demographic variables', LIME Working Group, 24 April 2017.
European Commission (EC) (2018), 'Debt Sustainability Monitor 2017', Institutional Paper 071, Publications Office of the European Union, Luxembourg.
European Environment Agency (2017), 'Air quality in Europe', EEA Report No 13/2017, Publications Office of the European Union, Luxembourg.
European Systemic Risk Board (2016), Vulnerabilities in the EU residential real estate sector / November 2016, ESRB Frankfurt.
Fontein, P., Adriaens, H., Den Uijl, M., & De Vos, K. (2015), De toekomstige arbeidsmarkt voor onderwijspersoneel po, vo en mbo 2015-2025: Update October 2015, available at http://www.voion.nl/publicaties/de-toekomstige-arbeidsmarkt-voor-onderwijspersoneel-po-vo-en-mbo-2015-2025.
Fransman, R. (2014), Sparen is geen deugd. Amsterdam University Press.
Grabska, K., L. Bettendorf, R. Luginbuhl, G. Meijerink and A. Elbourne (2017), 'Productivity Slowdown - Evidence for the Netherlands', CPB Communication on request by the Ministry of Economic Affairs, CPB Netherlands Bureau for Economic Policy Analysis, The Hague.
Gruber, J., A. Jensen and H. Kleven (2017), 'Do People Respond to the Mortgage Interest Deduction? Quasi-experimental evidence from Denmark', NBER Working Paper No. 23600.
Heyma, A., S. van der Werff, L. Megens, H. Bennaars and M. Engelen (2017), De kosten van ontslag met wederzijds goedvinden voor werkgevers, SEO Economisch Onderzoek, on request by the Ministry of Economic Affairs, The Hague.
Houben, A., M. Dröes and R. van Lamoen (2017), De prijsstijgingen op de Amsterdamse woningmarkt onder de loep, Economisch Statistische Berichten, 12 October 2017, available at: https://esb.nu/incoming/20032497/de-prijsstijgingen-op-de-amsterdamse-woningmarkt-onder-de-loep
IHS (2018, forthcoming), Aggressive Tax Planning Indicators in European Commission Taxation Papers
International Monetary Fund (IMF) 2017. External Sector Report, Washington D.C.
ING (2017), EBZ doorstroming huurmarkt onder druk, available at: https://www.ing.nl/zakelijk/kennis-over-de-economie/onze-economie/de-nederlandse-economie/publicaties/inkomensafhankelijke-huurverhoging-heeft-weinig-effect.html
Jansen, C. and M. Ligthart (2014), 'Spaaroverschot niet-financiële bedrijven: ontwikkeling, oorzaken en gevolgen', CPB Achtergronddocument, CPB Netherlands Bureau for Economic Policy Analysis, The Hague.
Koninkrijk der Nederlanden (2017), 'Besluit van 18 april 2017 tot wijziging van het Besluit ruimtelijke ordening in verband met het aanwijzen van geliberaliseerde woningen voor middenhuur', Staatsblad van het Koninkrijk der Nederlanden, Jaargang 2017, Nr. 172, available at: https://zoek.officielebekendmakingen.nl/stb-2017-172.html
Meelissen, M., A. Netten, M. Drent, R. Punter, M. Droop and L. Verhoeven (2012) . PIRLS- en TIMSS-2011: Trends in leerprestaties in Lezen, Rekenen en Natuuronderwijs. Nijmegen/Enschede: Radboud Universiteit / Universiteit Twente, available at: https://doi.org/10.3990/1.9789036534758
Ministry of Education, Culture and Science (2017a). Onderwijs in Cijfers, the Hague. http://www.onderwijsincijfers.nl/kengetallen/sectoroverstijgend/personeel/lerarenopleiding.
Ministry of Education, Culture and Science (2017b), Staat van het Onderwijs: onderwijsverslag 2015/2016, Rijksoverheid, The Hague.
Ministry of the Interior and Kingdom Relations (2016), Wonen in beweging-De resultaten van het WoonOnderzoek Nederland 2015, Rijksoverheid, The Hague.
Ministry of the Interior and Kingdom Relations (BZK) (2017), Staat van de Woningmarkt 2017, Rijksoverheid, The Hague.
Organisation for Economic Co-operation and Development (OECD) (2014), International Migration Outlook 2014, Organisation for Economic Co-operation and Development, OECD Paris.
Organisation for Economic Co-operation and Development (OECD) (2015), OECD Employment Outlook, Organisation for Economic Co-operation and Development, OECD Paris.
Organisation for Economic Co-operation and Development (OECD) (2016a). ‘PISA 2015 Results (Volume I)’, Excellence and Equity in Education, PISA, OECD Paris.
Organisation for Economic Co-operation and Development (OECD) (2016b), Public procurement for innovation: Good Practices and Strategies, OECD Public Governance Reviews, Organisation for Economic Co-operation and Development, OECD Paris.
Organisation for Economic Co-operation and Development (OECD) (2017a), Getting Skills Right: Skills for Jobs Indicators, Organisation for Economic Co-operation and Development, OECD Paris.
Organisation for Economic Co-operation and Development (OECD) (2017b), OECD Skills Outlook 2017: Skills and global value chains, Organisation for Economic Co-operation and Development, OECD Paris.
Organisation for Economic Co-operation and Development (OECD) (2017c), Skill for jobs indicators: Data overview and analysis, Organisation for Economic Co-operation and Development, Paris.
Organisation for Economic Co-operation and Development (OECD) (2017d), The Pursuit of Gender Equality: An uphill battle. OECD, Paris,
Organisation for Economic Co-operation and Development (OECD) (2017e), Non-tax compulsory payments (NTCPs) as an additional burden on labour income in 2016. OECD, Paris
Portegijs, W., M. Cloïn, S. Keuzenkamp, A. Merens and E. Steenvoorden (2008), Verdeelde tijd: Waarom vrouwen in deeltijd werken, Sociaal en Cultureel Planbureau, The Hague.
RIGO Research en Advies (2016), Huurprijs als verhuisprikkel: Evaluatie van de inkomensafhankelijke huurverhoging, Amsterdam.
Sociaal Economische Raad (SER) (1992), Het nationale spaaroverschot, Rapport van de Commissie Economische Deskundigen, Publicatie 92/11, The Hague.
Sociaal Economische Raad (SER) (2017), The transition to a circular economy, Social and Economic Council advisory report, The Hague.
Sociaal en Cultureel Planbureau and Centraal Bureau voor de Statistiek (2016), Emancipatiemonitor 2016, Sociaal en Cultureel Planbureau, The Hague.
Task Force Part-time Plus (2010), Beyond discussion: Final report from the Task Force Part-time Plus, Ministry of Social Affairs and Employment, Rijksoverheid, the Hague.
Van den Broek, A., F. Wartenbergh, J. Bendig-Jacobs, R. Tholen, S. Duysak and J. Nooij (2017), Monitor Beleidsmaatregelen 2016-2017: Studiekeuze, studiegedrag en leengedrag in relatie tot beleidsmaatregelen in het hoger onderwijs, 2006-2016, ResearchNed, on request by Ministry of Education, Culture and Science, Nijmegen.
Van der Aalst, M. and L. van den Beukel (2017), Kansrijke beroepen: Waar is de arbeidsmarkt krap? Landelijk overzicht, Uitvoeringsinstituut Werknemersverzekeringen, Amsterdam.
Van Heuvelen, G., L. Bettendorf, G. Meijerink (2018), Frontier firms and followers in The Netherlands. CPB Background Document. CPB, The Hague (forthcoming)
Vennekens, A.& Van Steen, J. al, 2017, ‘Totale Investeringen in Wetenschap en Innovatie, 2015-2021’, Rathenau Institute, Den Haag, April 2017
Vierke, H. and M. Masselink (2017), The Dutch Budgetary Framework and the European Fiscal Rules. European Commission. Economic Brief 027. Publications Office of the European Union, Luxembourg
-
(I)
()Public investment is defined as gross fixed capital formation + investment grants + national expenditure on agriculture and fisheries.
-
(II)
()Before programmes are adopted, Member States are required to comply with a number of so-called ex-ante conditionalities, which aim at improving conditions for the majority of public investments areas.
-
(III)
-
(IV)
()www.pianoo.nl/
-
(V)
()www.innovatiekoffer.nl/

