Table of Contents
1.
Introduction: Political and legal context
1.1.
Implications of the ecodesign framework
1.2.
EU energy and climate objectives
1.3.
The contribution of Ecodesign
1.4.
Importance of the regulation under review
1.5.
Sustainable development goals
1.6.
Legal context of the impact assessment
1.7.
Impact of the revision of the Radio Equipment Directive
2.
Problem definition
2.1.
What are the problems?
2.2.
What are the problem drivers?
2.3.
Who is affected by the problems, in what ways and to what extent?
2.4.
How likely is the problem to persist without intervention?
3.
Why should the EU act?
3.1.
Legal basis
3.2.
Subsidiarity: Necessity of EU action
3.3.
Subsidiarity: Added value of EU action
4.
Objectives: What is to be achieved?
4.1.
General objective
4.2.
Specific objectives
4.3.
Consideration of alternative objectives
5.
What are the available policy options?
5.1.
The intervention logic
5.2.
What is the baseline from which options are assessed?
5.3.
The interactions between EPS efficiency, durability and interoperability
5.4.
Description of the policy options (POs)
5.5.
Policy Options matrix
6.
What are the impacts of the policy options?
6.1.
Business-as-Usual (BAU)
6.2.
Economic impacts of the POs
6.3.
Environmental impacts of the options
6.4.
Social impacts
6.5.
Impact on societal costs
6.6.
Overview of the PO impacts
7.
How do the options compare?
7.1.
How the options are compared
7.2.
Determining the end-user lifecycle cost minimum level of EPS efficiency
7.3.
Effectiveness and efficiency of options
7.4.
Scoring the options
7.5.
Ranking the options
8.
Preferred option
8.1.
Legal requirements
8.2.
Main impacts
8.3.
Verifying the missed environmental benefits of other options
8.4.
Impact of consumer rate of reuse of EPS on the Preferred Option
8.5.
REFIT
8.6.
One-In One-Out
8.7.
Concluding remarks
9.
How will actual impacts be monitored and evaluated?
Annex 1: Procedural information
Annex 2: Stakeholder consultation (Synopsis report)
Annex 3: Who is affected and how?
Annex 4: Analytical methods
Annex 5: The Ecodesign and Energy Labelling Framework
Annex 6: Products in scope of the current EPS regulation
Annex 7: Evaluation of Regulation (EU) 2019/1782 on Ecodesign requirements for External Power Supplies
Annex 8: The SME test
Annex 9: Competitiveness Check
Annex 10: List of measures and preliminary assessment
Annex 11: Discarded measures
Annex 12: Selection of pollutants for analysis
Annex 13: Sensitivity tests
Annex 14: Additional impacts of the Policy Options
Annex 15: Valuing consumer (In)Convenience
Annex 16: Evidence underlying assumptions of extended interoperable EPS lifetimes
Annex 17: Detailed complementary and supporting information
Annex 18: References
|
ACRONYMS
|
AD
|
Acidification
|
IC
|
Integrated Circuit
|
|
ANEC
|
European consumer voice in standardisation
|
IEC
|
International Electrotechnical Commission
|
|
APPLiA
|
Home Appliance Europe
|
IPx
|
Ingress Protection
|
|
AVS
|
Adjustable Voltage Supply
|
IT
|
Information Technology
|
|
BAU
|
Business-as-usual
|
ITI
|
Information Technology Industry Council
|
|
BEUC
|
Bureau Européen des Unions de Consommateurs
|
ITU-T
|
International Telecommunication Union Telecommunication Standardization Sector
|
|
bn
|
billion
|
LCA
|
Life-Cycle Assessment
|
|
CAGR
|
Compound Annual Growth Rate
|
LCC
|
Life-Cycle Consumer Cost
|
|
CECAPI
|
European Committee of Electrical Installation Equipment Manufacturers
|
LVD
|
Low-Voltage Directive
|
|
CSL
|
Candidate Stringency Level
|
MEErP
|
Methodology for Ecodesign of Energy-related Products
|
|
CO2
|
Carbon Dioxide
|
mln
|
million
|
|
CO2eq
|
Carbon Dioxide equivalent
|
MTBF
|
Mean Time Between Failures
|
|
CONEBI
|
Confederation of the European Bicycle Industry
|
MoU
|
Memorandum of Understanding
|
|
CTP
|
Climate Target Plan
|
MSA
|
Market Surveillance Authority
|
|
DIY
|
Do-it-yourself
|
NACE
|
Nomenclature statistique des activités économiques dans la Communauté européenne
|
|
DoE
|
US Department of Energy
|
NECP
|
National energy and climate plans
|
|
ECOS
|
Environmental Coalition on Standards
|
NOX
|
Nitrogen Oxides
|
|
EED
|
Energy Efficiency Directive
|
PAH
|
Polycyclic Aromatic Hydrocarbons
|
|
EGMF
|
European Garden Machinery industry Federation
|
PM
|
Particulate Matter
|
|
EIA
|
Ecodesign Impact Accounting
|
PO
|
Policy Option
|
|
EMC
|
Electromagnetic Compatibility
|
PoE
|
Power-over-Ethernet
|
|
EN
|
European Norm
|
POP
|
Persistent organic pollutant
|
|
EPBA
|
European Portable Battery Association
|
PPS
|
Programable Power Supply
|
|
EPS
|
External Power Supply
|
RED
|
Radio Equipment Directive
|
|
EPSMA
|
European Power Supply Manufacturers Association
|
REF2020
|
EU Reference Scenario 2020
|
|
EPTA
|
European Power Tool Association
|
REFIT
|
Regulatory Fitness
|
|
ESD
|
Electrostatic Discharge
|
SDG
|
Sustainable Development Goals
|
|
ESPR
|
Ecodesign for Sustainable Products Regulation
|
SME
|
Small and Medium Enterprises
|
|
ETSI
|
European Telecommunications Standards Institute
|
SO
|
Specific Objective
|
|
EUP
|
Eutrophication Potential
|
SOx
|
Sulphur Oxides
|
|
GER
|
Gross Energy Requirement
|
TFEU
|
Treaty on the Functioning of the European Union
|
|
GHG
|
Greenhouse Gas
|
TS
|
Technical Study
|
|
GWP
|
Global Warming Potential
|
USB
|
Universal Serial Bus
|
|
HM
|
Heavy Metal
|
USB-IF
|
USB Implementers Forum
|
|
IA
|
Impact Assessment
|
USB-PD
|
USB Power Delivery
|
|
IC
|
Integrated Circuit
|
VOC
|
Volatile Organic Compound
|
|
IEC
|
International Electrotechnical Commission
|
WTO
|
World Trade Organisation
|
|
IPx
|
Ingress Protection
|
ZVEI
|
Zentralverband Elektrotechnik und Elektroindustrie e.V.
|
|
1.Introduction: Political and legal context
This Impact Assessment concerns the review of an implementing regulation adopted under the Ecodesign Directive concerning external power supplies (EPS). Through setting harmonised minimum requirements and providing information, the regulation aimed to ensure an appropriate contribution from EPS to the EU’s energy, climate and environmental goals, while avoiding fragmentation of the internal market.
1.1.Implications of the ecodesign framework
The regulation under review is one of over thirty that has been adopted under the Ecodesign Directive. This creates the framework within which the intervention can be elaborated and therefore for this Impact Assessment. These factors lead to certain constraints that are outlined below.
The review of the regulation is a legal obligation created by the existing implementing regulation and EU action is therefore essential. Underlying this obligation to carry out a review is the hypothesis that continuing innovation and technical progress will have led to greater potential for energy savings and enhanced environmental protection. In view of this, it cannot be considered that there is a regulatory gap, but rather there is a need to explore whether revising the regulation can achieve greater benefit.
By its nature, ecodesign unavoidably involves setting detailed technical requirements. Ecodesign reviews follow a bottom-up approach exploring all technically feasible measures contributing to the specific objectives. These are discussed and elaborated with relevant stakeholders over a period of time and this is documented in the Impact Assessment.
A specific constraint from the Ecodesign Directive is that the energy efficiency requirements must in principle be set at the level corresponding to the least life cycle consumer cost. This means that unlike many EU interventions, it is not primarily based on overall societal welfare but consumer welfare. However, account must also be taken of the environmental impacts, suggesting that slightly lower or higher energy efficiency ambition may be justified for environmental reasons. While lowest lifecycle consumer cost is the broad constraint, account must also be taken of affordability and therefore any increase in consumer purchase costs must be reasonable.
Since ecodesign measures are intended to support the single market, it is largely considered to be inherent that they are necessary and have EU added value.
Because the intervention concerns the review of an implementing measure adopted under a directive, in line with the Better Regulation Guidelines the specific objectives of the intervention are determined by the directive. In the case of ecodesign this means that they are to achieve 1) energy savings and 2) environmental protection within the least lifecycle consumer cost constraint.
1.2.EU energy and climate objectives
The EU has longstanding objectives to increase energy efficiency and to reduce its greenhouse gas (GHG) emissions. These go along with other objectives to reduce its environmental impacts. In December 2019, the Commission presented the European Green Deal
to strengthen these objectives and as the cornerstone of its strategy to fulfil the United Nation’s 2030 Agenda for Sustainable Development
. In September 2020, it presented a Climate Target Plan (CTP) for 2030, showing the need for a higher contribution of energy efficiency and renewable energy to achieve a net 55% GHG emission reduction most cost-effectively, in line with the Paris Agreement. The European Parliament and Council subsequently agreed to achieve this level of reduction in GHG emissions. The Commission followed this by proposing the “Fit for 55” package
of legislative proposals aiming to achieve the necessary cut in GHG emissions.
One pillar of the CTP and subsequently the ‘Fit for 55’ package is energy efficiency. A revision of the Energy Efficiency Directive (EED)
to increase the overall ambition has been agreed. This requires Member States to enhance their National Energy and Climate Plans (NECPs) to achieve at least an overall 11.7% reduction in EU energy consumption in 2030 compared to the reference
. The EED itself contains limited energy saving measures and in addition to Member State actions, additional measures at EU level are needed. In this context, the ecodesign rules for products are important instruments to realise the EU’s energy and decarbonisation objectives. The nature of the market failures leading to unexploited energy efficiency potential mean that it is essential to address the specific barriers in many different areas and products. Each area may on its own lead to modest energy savings but taken together they are essential to meet the overall reduction goal.
Another pillar of the European Green Deal is a more circular economy. The new Circular Economy Action Plan
sets out steps to work towards this. It aims to reduce product environmental impacts for example through promoting longer product lives, greater resource efficiency and enhancing recycling and recycled content.
Reducing energy use and promoting the circular economy are also important for many other reasons. Lower energy use reduces the EU’s energy import dependence and improves energy security. Recent geopolitical events have increased the focus on energy security and the contribution energy efficiency can make to this. The Commission “REPowerEU Plan” Communication aimed at rapidly reducing EU dependence on Russian fossil fuels. In-use energy savings from EPS will contribute to these goals.
1.3.The contribution of Ecodesign
There are market barriers that hamper the introduction and uptake of more energy efficient and more long-lasting products. It is desirable for policies to address these barriers since they lead to unrealised, economically viable, energy and material savings. Behavioural failures refer to the cognitive limitations and biases that prevent consumers and investors to appreciate rationally the benefits of energy efficiency. Market failures arise from the fact that many impacts and aspects of energy supply or resource use are not brought into market prices. Market barriers such as lack of information and awareness, split incentives or financing challenges result in economically rational energy savings not being realised or more sustainable choices not being made.
The Ecodesign Directive aims to address these barriers by setting performance requirements to remove the worst performing products from the EU’s internal market. These harmonised requirements have where appropriate specifically addressed energy efficiency and have led to significant reductions in energy use of household and industrial products. Other minimum requirements can also be set e.g. pollutant emission limits. Being set at EU level, they have mitigated the risk of industry facing multiple, different national rules. The energy assessments aim to ensure that the minimum requirements are set at the level of Least Lifecycle Consumer Cost.
The impacts of ecodesign coupled with energy labelling are estimated through the Ecodesign Impact Accounting (EIA). According to this, in 2022 ecodesign and energy labelling measures combined are estimated to have cut EU primary energy use (and related GHG emissions) by about 12%, saving around €90bn unnecessary EU consumer expenditure per year (€290 for an average EU household) and brought numerous other environmental and consumer benefits. An overview of the processes followed to adopt product measures under ecodesign is shown in Annex 5.
Certain circular economy aspects can be addressed through measures under the Ecodesign Directive since decisions made at design can influence the product’s life span and ease of maintenance, repair, reuse, upgrade, recyclability and waste handling. The Ecodesign and Energy Labelling Working Plan 2022-2024, as in the previous plan, identified ecodesign measures’ potential to contribute to circular economy objectives and subsequent supporting studies have systematically considered resource efficiency aspects.
Ecodesign also contributes directly or indirectly to other important policy objectives, such as improved air quality, energy system integration and the alleviation of energy poverty. It is also expected to lead to the creation of jobs, encourage innovation and support and facilitate economic growth. Both energy savings and promoting the circular economy lead to reduced environmental damage from materials extraction and resource efficiency. Most of these co-benefits are difficult to quantify, but are well known and perceived by society.
In March 2022, as flagged in the Circular Economy Action Plan, the Commission adopted, a proposal to replace the Ecodesign Directive with an Ecodesign for Sustainable Products Regulation (the ESPR). The co-legislators reached agreement on the legal text at the end of 2023. The ESPR will expand the scope of ecodesign from energy-related products to any kind of physical good placed on the market, with some exceptions. It would also slightly expand the range and nature of requirements that could be set in regulations adopted under it. The most significant impact that the ESPR might have for the current review is the expansion of the scope to some means of transport. This could enable EPS for transport applications currently out of scope to be addressed in future and thus merits inclusion in a review clause.
In view of the continuous need to review ecodesign regulations and to avoid delaying the benefits that can be delivered from those reviews, transitional arrangements for ongoing reviews are included in the ESPR. The EPS regulation review is listed in the ESPR as one of the measures for which the review and adoption of revised measures should be completed under the Ecodesign Directive.
1.4.Importance of the regulation under review
EPS are devices used to supply electricity to, and to charge built-in batteries of electronic and electric devices (“end devices” or "primary load products") such as laptops, mobile phones, tablets and electric shavers. For other products without built-in batteries, they serve as the main continuous source of power – for example standalone loudspeakers or computer network equipment such as modems and routers. The use of such products spans both domestic and office settings. EPS are often sold bundled with these products and in view of the large number of product sales, there are estimated to be around 400mln EPS sales per year in the EU.
The energy consumption of EPS are essentially the losses in the EPS, whether at load or unloaded. The EIA estimates these losses in 2020 at about 11.6TWh or about 0.5% of EU final electricity consumption. Their GHG emissions due to losses in no-load and active mode amounted to 4.4Mt CO2eq, about 0.2% of EU CO2 emissions. The electricity use is associated with about 1.4kt of NOx and 1kt of SOx emissions in the EU in 2020 based on EEA figures on electricity sector pollutant emissions.
EPS are mass-produced with production largely in Asia. The 2021 EIA report shows an estimated 430mln EPS sold in the EU27 in 2020 and consumer expenditure for these products amounted to €6.5bn, split between €4.3bn acquisition and €2.3bn energy costs.
1.5.Sustainable development goals
In addition to contributing to the EU’s energy and environmental goals, ecodesign also contributes to some of the UN’s 17 Sustainable Development Goals (SDGs). Increased energy efficiency and product circularity contribute to SDG 7 (affordable and sustainable energy), SDG 8 (sustainable economic growth), SDG 12 (responsible consumption and production) and SDG 13 (climate action). In particular they contribute to achieving the following targets:
·target 7.3 (double the energy efficiency improvement rate);
·target 8.4 (improve resource efficiency in consumption and production);
·target 12.2 (sustainable management and use of natural resources);
·target 12.5 (substantially reduce waste generation);
·target 13.2 (integrate climate change measures).
Annex 3 includes a discussion on whether and in how much these goals are being served.
1.6.Legal context of the impact assessment
This impact assessment relates to the review of Commission Regulation (EU) 2019/1782 on ecodesign requirements for external power supplies, (hereafter ‘the Regulation’). Further information on the products covered by the regulation and the energy they use is provided in
Annex 6: Products in scope of the current EPS regulation
.
The fact that there is continual innovation improving the potential technical performance of these products and that learning leads to lower production costs lead to the hypothesis that over time additional potential will arise for cost effective strengthening of the requirements. In view of this, Article 7 of the regulation requires it to be reviewed in the light of technological progress by 14 November 2022. The review should in particular assess the following aspects (the ‘R’ numbers enable identification of how these specific aspects of the review are addressed later in the IA):
·the feasibility of setting a requirement regarding minimum energy efficiency at 10% load (R1);
·options for including within the scope of the Regulation:
owireless chargers (R2),
oactive power over Ethernet injectors (R3), and
oexternal power supplies used with electrical and electronic household and office equipment that is not included in Annex I (R4);
·options for including requirements in support of circular economy objectives, including interoperability (R5).
The review of the regulation was announced in the Ecodesign and Energy Labelling Working Plan 2022-2024. This indicated that the review would also examine how circular economy aspects such as resource efficiency, reparability, recyclability, and durability could be assessed and addressed if appropriate.
1.7.Impact of the revision of the Radio Equipment Directive
A large share of the EPS regulated by the regulation are used to power products that are regulated by the Radio Equipment Directive (RED). Two recent amendments to the RED introduce a ‘common charging’ solution for those products.
·Directive (EU) 2022/2380 defines the ‘common charging’ requirements;
·Commission Delegated Regulation (EU) 2023/1717 updates the wired charging technical specification references.
The RED requirements apply to the powered products, but do not regulate directly the EPS. The products covered are handheld mobile phones, laptops, tablets, digital cameras, headphones, headsets, portable speakers, handheld videogame consoles, e-readers, earbuds, keyboards, mice, and portable navigation systems. The requirements apply to all except laptops from 2024 and to laptops from 2026.
A key requirement relevant to the review of the EPS regulation is the requirement for RED products to be charged via a USB-C port on the device. This requirement ensures that consumers can charge their devices with any USB-C charger and that the vast majority of EPS of RED devices are USB compatible. A second key requirement is that producers must offer the option of buying the RED product without an EPS. A third key requirement is the need for harmonised information on the EPS needed to power the product. In view of the relevance of these factors for the EPS regulation, the Commission committed to promote interoperability by introducing corresponding requirements on the EPS side and provide consumers with information related to the EPS.
2.Problem definition
An evaluation of the Regulation has been carried out as set out in Annex 7. During the evaluation, stakeholder views were sought on aspects that merit review. This work led to conclusions on the desirability of considering further development of the regulation. These considerations also take into account wider political priorities and policy initiatives. The problems relevant to this Impact Assessment have been identified following these reflections.
2.1.What are the problems?
2.1.1.The first problem: unexploited potential for the EPS regulation to contribute to more rapid reduction in energy use and GHG emissions.
The CTP demonstrates how EU energy use and GHG emissions need to reduce on a route to zero net GHG emissions by 2050. The CTP impact assessment explored various scenarios, the main ones of which were REG, MIX and CPRICE. The ‘Fit-for-55’ legal proposals were subsequently based upon the CTP MIX scenario.
The revised EED adopted as part of the Fit for 55 package set a headline objective for reducing energy consumption. While the EED itself contains some measures to increase energy efficiency, a large share of the reductions need to come from other measures such as ecodesign.
The IA supporting the EED proposal shows that by 2030 energy consumption per household is projected to be 31% lower than in 2020, and projects a 54% reduction in GHG emissions for the residential sector compared to 2015, far higher than for industry and transport.
Achieving the 2050 Zero Net GHG emission target already requires substantial steps to achieve the 2030 reduction targets, i.e. sharp reductions of energy consumption and related GHG emissions. It is desirable for cost-effective energy efficiency measures to be implemented to enable these overall targets to be achieved in the cheapest way for society.
The life cycle energy consumption of EPS contributes to overall energy consumption and GHG emissions both in and outside the EU. It should therefore be explored whether they can be further reduced as a contribution to the overall reductions needed.
2.1.2.The second problem: unexploited potential to reduce other environmental impacts of EPS
Apart from energy use and GHG emissions, EPS also contribute to other environmental impacts such as pollutant emissions from electricity generation due to material consumption as fuel and the consumption of materials and the accompanying environmental impacts for manufacture.
Annual EPS sales represent about 22kt of materials, around 0.1% of material consumption in sales of all Ecodesign regulated products. The electricity used to power them results in over 2Mt of fuel combusted annually. Pollutant emissions from this electricity generation amount to about 1.4kt of NOX and 1kt of SOX in 2020. The pollutant emissions from the manufacturing stage are likely to be considerably higher due to them being carried out in less well regulated conditions outside the EU.
There may be opportunities to reduce these other environmental impacts arising from EPS manufacture and use. The amount of materials used for manufacture is determined both by the design of EPS and how they are used, including their lifetime. If ways can be identified to enable the same needs to be met with less EPS this will reduce the environmental impacts of the raw material supply and manufacturing processes as well as need for end of life treatment. The combustion of materials as fuel and the pollutant emissions from it are consequences of the electricity used by EPS. Reductions in EPS electricity use will lead to reductions in these problems.
Overall actions that can reduce these environmental impacts will contribute to the EU’s Circular Economy objectives and its Zero Pollution action plan.
2.2.What are the problem drivers?
2.2.1.Scope unclear and too narrow (D1)
The current scope of the regulation does not cover EPS for a number of devices with growing markets. These will be of increasing relevance for energy efficient charging and power supply to minimize energy consumption and potentially allow interoperability. Some examples of these are battery charging devices, battery powered devices and gadgets, gardening and power tools, and e-bikes.
In addition, questions received by the Commission in the past years reveal a number of uncertainties over the scope of the Regulation. Some examples are whether unbundled (stand-alone) EPS are in scope, or whether EPS (e.g. USB sockets) contained in another product like a wall socket, socket cube, or table top lamp are addressed by it.
An unclear scope hampers market surveillance and creates uncertainties among producers as to their legal obligations and opens potential loopholes that undermine the objectives of the regulation.
2.2.2.No transparency on efficiency and potential for higher efficiency (D2)
The energy efficiency differences between compliant EPS are considerable, reaching around five percentage points as illustrated in
Figure
1
. Additional evidence on this is presented in Annex 7.
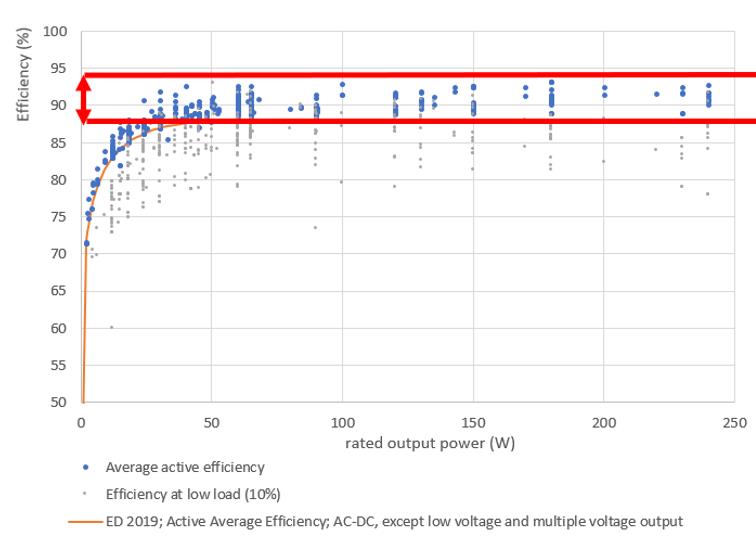
Figure 1 - Average Active Efficiency External Power Supplies, AC-DC, except low voltage and multiple voltage output (Fraunhofer IZM)
The spread of efficiency shows there is potential for greater energy savings. Further technical evolution, including for example different types of semiconductors should enable higher energy efficiency and thus potentially a wider spread in efficiency.
The resistance of the cable supplying power from an EPS to the end device plays a non-negligible role in the overall efficiency of the supply of power due to the higher currents that are used than at mains voltage. The losses in the cable are linearly related to the current drawn by the end device and the duration of time during which power is drawn from the EPS.
The differences in efficiency are not visible to users who could otherwise purchase more efficient ones thus spurring competition on efficiency as is observed as a result of energy labels. Because most EPS are sold bundled with an appliance and due to the split incentive, there is little motivation for the product supply chain to provide more efficient bundled EPS.
2.2.3.EPS less efficient under low load (D3)
EPS efficiency decreases at low load, i.e. if the EPS provides power or charges a device with less than 50% of its maximum performance, and steeply declines when approaching the 10% load level and lower.
The average active efficiency of EPS is assessed at 25%, 50 %, 75% and 100% load, referred to as the four-point efficiency.
Figure
2
illustrates that two EPS with similar overall measured four-point efficiency can exhibit large efficiency differences in the low load area starting with around 3.6% difference at 25% load and increasing to around 8% at 10% load. The average efficiency thus may not reflect well the actual efficiency in daily operation.

Figure 2 - Low load performance and average efficiency (Source: Flavio Cucchietti)
Figure
3
shows the very limited correlation between active average efficiency and the efficiency at low load for around 100 commercial EPS. This confirms that a high active average efficiency cannot be taken as a proxy for a high efficiency at low load for the same device.

Figure 3 - Low load performance and average efficiency
Lower load operations of EPS are common because EPS are dimensioned to accommodate the full power need of the powered device.
Figure
4
illustrates that an EPS powering a notebook operates below 25% of its maximum load capacity for around 50% of its total operation time, and even more than 90% of the time at a load level below 50%. The efficiency of the low load area, and the efficiency at 10% are therefore pertinent to the overall energy losses of the EPS.

Figure 4 - Distribution of loads over the operation time of a notebook (Source: Flavio Cucchietti)
However, because there is a lower power throughput at 10% load, the loss due to a 1%pt lower efficiency at 10% load will be proportionately less than due to a 1%pt lower efficiency at higher load. In view of this the actual loss and therefore benefit from increasing 10% load efficiency will depend on the expected load profile and be within the area bounded by the two lines as shown in
Figure
5
.
Taken together, these factors reveal potential for efficiency improvements for the low load range of EPS. If interoperable EPS are used for charging a range of different products, the operation time of such EPS in the low load area may even increase further leading to lower average conversion efficiencies and higher energy losses.

Figure 5 - Impact of load and load profiles on EPS losses
2.2.4.Lacking interoperability of EPS (D4)
EPS are generally not interchangeable because they have different operating voltages, power ratings and connectors. The result can confuse and inconvenience consumers and leads to higher expenditure due to the need to purchase a new EPS with almost every device.
This has been illustrated by a consumer survey (IA Common Charger 2019) that showed a certain confusion over which EPS to use for different mobile phones and other electronic devices, and a degree of inconvenience for having too many EPS taking up space at home or at the workplace.
Most of the detailed consumer issues documented have been addressed by the revision of the Radio Equipment Directive (RED), which requires the equipment in its scope to bear a USB-C receptacle and be chargeable using the USB-C or USB-PD protocol. However, it should be noted that there are mobile phone models on the market which are assumed to be chargeable with USB-PD EPS, but are sold, bundled or not, with a high power / high speed charger which is not USB-PD compliant and is therefore not usable with other end products..
The recently revised Batteries Regulation requires through its review article the assessment of the introduction of harmonised standards for a common charger for rechargeable batteries incorporated into equipment other than those in the RED scope. Since battery chargers consist of a power supply section and a charging section, this aspect is also relevant to regulatory requirements concerning the interoperability and efficiency of EPS in general.
In the absence of interoperability, EPS cannot generally be reused and therefore there is a higher level of EPS purchases than if they were interoperable. As a result there is in aggregate a greater use of materials in their manufacture. The increased processing of the necessary additional raw materials, manufacture, distribution, sales and end of life disposal of the greater number of EPS lead proportionately to higher environmental impacts.
2.2.5.Lack of information on compatibility with load (D5)
Consumers have difficulty to decide whether an EPS is compatible with the load of a specific device since the information, if provided, is often hardly readable due to small fonts used and due to the broad range of information placed on EPS nameplates. Such technically complex information may also ask too much from consumers. As a result, consumers are confused and possible damage may arise if inappropriate EPS are used to power devices. This situation is a barrier to consumers reusing existing EPS for other products, even if they are interoperable, and creates uncertainty for them.
Consumer NGOs have raised the issue that consumers may have difficulty knowing which cables are suitable for use with different loads.
2.2.6.Bundling of EPS with products (D6)
Consumers have become used to receiving an EPS with each device. This experience creates an expectation that products should be delivered with an EPS rather than that an additional EPS should only be purchased if it is actually needed by the consumer.
A majority of consumers on the one hand support at least the option of unbundling, but at the same time an even larger majority expects an EPS and/or cable to be supplied with each product for performance and convenience reasons. Manufacturers are therefore concerned about consumers’ reactions if they stop selling EPS with their devices. Moreover, producers selling unbundled products are afraid of losing control over the quality of the EPS used with their products due to potentially counterfeit, substandard and unsafe EPS placed on the EU market (IA Unbundling 2021).
There is however evidence from the same analytical work that unbundling of the EPS is becoming common in certain categories of products. This is for example the case for hearables, e-readers, and portable speakers, whilst it is rare for portable videogame consoles and tablets. As regards the cable, this is almost always provided in the box with all types of devices.
In addition to consumer expectations, another factor at play is that some harmonized standards also require manufacturers to sell specific EPS with certain products. More information is provided on this matter in Section
2.2.8
.
Bundling of EPS prevents the environmental benefits from interoperable, harmonized common chargers being realised and may reduce the environmental benefits from more energy efficient EPS that could be used for longer. Such EPS may require more and/or better electronics so that the individual higher efficiency EPS may have higher manufacturing impacts compared to lower efficiency ones. These aggregated impacts will be reduced if less EPS are purchased.
2.2.7.Scope and testing of adaptive EPS (D7)
The testing requirements for adaptive EPS are not fully clear and the Commission has provided clarifications through an FAQ to address the uncertainties raised. Particular problems are the application of the different limit values, the testing of multiple voltage output devices, and the USB cable used in the test.
Such uncertainties and incongruencies adversely affect the energy savings achievable, complicate market surveillance, hamper competition and limit the effectiveness and proper enforcement of the regulation.
2.2.8.Requirements arising from legislation and standards (D8)
Bundling requirements for certain types of EEE
According to APPLiA the EN 60335-1 standard requires class III construction parts of household appliances such as tooth brushes, shavers, epilators, etc., to be sold with a power supply for safety reasons to prevent consumers using power supplies that are not safe with wet use appliances. The producers state that unbundling requirements for household appliances would therefore conflict with this normative requirement.
In its current status, the harmonized standard EN 60335-1 does not allow unbundling of such wet use devices so that standardized EPS, even if they were specified for use only for class III construction devices, would not result in sales of less EPS. The bundling requirement is not directly stipulated by the Low Voltage Directive (LVD), but it is the EN 60335-1 standard which transposes safety and other requirements into provisions for manufacturers to follow in their product specifications and designs.
Safety requirements for wet-use applications
EN60335-2-8 and EN60335-2-52 require the use of IPX4 transformers with pins for insertion into sockets outlets “for washable/wet shavers, washable/wet clippers, washable/wet epilators, wireless toothbrush chargers”. Unbundling would force consumers to purchase more expensive IPX4 chargers, or consumers may otherwise use chargers that are unsafe to use in wet environments unless all USB-PD EPS would have to meet these safety requirements. According to (APPLiA 2022), IPX4 chargers with USB-C connectors are not commonly available and expensive. Industry experts estimate an additional €2-3 cost for an EPS to be made wet-use compliant.
Improved surge protection for IT and other electronic equipment
Similarly, electronic products which are not so called end-of-line equipment like for example a mobile phone, but are connected to other devices via a network or other type of shielded cable, like for example a wireless router, require sometimes a higher level of electromagnetic protection from their EPS. This is needed for example because the common earth/shield can be an entry point for disturbances or surge which may damage the EPS. For this reason, such EPS are required by product manufacturers to be subject to higher electromagnetic immunity standards according to specific sections of EN 55035. In addition, the practice of certain telecom operators is to require from their equipment higher protection levels, for example according to the ITU-T K.21 recommendations. This is to prevent large scale failures of their routers due to poor earth connections in many residential buildings. Industry experts estimated an additional cost of around €0.3 for a conventional EPS to become compliant with such higher levels of EMC protection.
Electrostatic discharge protection for vacuum cleaners
A considerable amount of electrostatic charge can accumulate on a vacuum cleaner during use. This charge can be released when connecting a handheld vacuum cleaner to its EPS. In order not to damage the EPS, it has to be designed to withstand a very high level of electrostatic discharge, for example in accordance with the standard IEC 61000-4-2.
Toys
Toys are by definition intended for use by children and must fulfil special safety precautions, which apply also to their power supply. These are, for example, given by the IEC 61558 standard. If a toy is expected to be operated outdoors, its power supply must also be IP65/IP67 protected.
Audio equipment
There are no specific rules or standards known to apply only to the EPS of audio products. Nevertheless it appears that very often the quality, in particular the noise of the EPS of an audio product can impact the performance of the product itself. For this reason it appears that linear power supplies are often preferred for high-end audio applications instead of the more common switch mode power supplies. This would normally not be a concern for other product groups.
In addition, industry claims that audio products have a more pronounced peak power demand to their power supply than other product groups. This is illustrated Annex 16. If such occasional peaks are higher than the maximum USB-PD power of 240W they cannot be supplied by this power supply.
2.2.9.Wireless charging and power over ethernet (D9)
Wireless charging
The wireless supply of power to devices is currently not within the scope of the regulation. However, its prevalence in the market is increasing and a technical support study estimates worldwide shipments will reach 2bn integrated receivers (i.e. devices with wireless charging functionality) by 2025. Most high-end smartphones already include this feature. The market for wireless charging was estimated to be worth around $5.3bn in 2021 and is expected to grow at an annual average rate of 23% to around $35bn by 2030. The driver for this development is user convenience.
The emergence of wireless charging challenges the current definition of a power supply, as this feature includes a wireless charging pad connected to the EPS via a cable. The overall efficiency of the supply of power to the device is thus dependent on system performance, not only on the efficiency of the EPS.
Table
1
shows that wireless charging technologies have differing levels of efficiency. These are inherent to the technology and far lower than the efficiency of regular EPS. Within the same wireless charging technology, for example Qi chargers, the efficiency can differ considerably. The Qi charging technology dominates the current market, but new and proprietary technologies are under development. The various technologies are not interoperable.
|
Qi (inductive)
|
~ 50%
|
|
AirFuel (resonant)
|
40%
|
Table 1 - Energy efficiency of wireless charging technologies (TS Wireless Charging 2021)
The power requirements of different wireless charging standards may cause further interoperability issues for EPS. The most common standard Qi, in both its Baseline Power Profile (up to 5W of power delivery) and its Extended Power Profile (up to 15W) can work with both USB-PD and standard EPS. Some proprietary wireless charging solutions, however, already exceed USB-PD base power profile and could therefore offer slower charging if used with a non-proprietary EPS.
Active Power-over-Ethernet injectors
Power-over-ethernet (PoE) avoids the need for a power source or an additional cable attached to a device with ethernet connection, by using the spare wires from the ethernet cable to carry the power as shown in Annex 16. A distinction is made between passive PoE injectors that provide a fixed voltage supply without a compatibility check, and active PoE injectors that verify and control the voltage to be supplied to the powered device, also ensuring its protection. Passive PoE injectors are in the scope of the current regulation, while active PoE injectors are explicitly excluded. shows an outline of a PoE setting.
PoE injectors are increasingly used in offices and housing
. The global market for PoE injectors is expected to grow from around $724mln in 2020 to around $1.37bn in 2029 (CAGR of 9.5% from 2023 to 2029). This roughly translates into around 6.8mln PoE injectors sold in the EU in 2029 assuming a market share of 25% and an average price of $50 per device.
In terms of energy efficiency, one and two port active PoE injectors (midspans) can be found in specialised internet shops with between 65% to more than 90% efficiency, some are declared to comply with US Department of Energy (DoE) level VI. For four and more port injectors, normally no efficiency information is provided, but for a few 75% efficiency is declared or compliance with DoE level V. For many PoE injectors, no efficiency is indicated. Common internet shopping platforms for consumers were found not to provide any efficiency information at all.
The large efficiency differences between active PoE injectors, and the lack of information about efficiencies can be expected to result in unnecessarily high energy consumption in this growing market. From the declared high efficiencies and DoE level VI compliance for some active PoE injectors it could be understood that compliance with efficiency requirements at the current level in the Regulation is feasible at least for a part of the product spectrum (with lower numbers of ports). The broad range of indicated efficiencies point to a large improvement potential which could remain untapped as long as active PoE injector are outside the scope of the future regulation.
2.3.Who is affected by the problems, in what ways and to what extent?
The problems described above are understood to mostly affect consumers, the environment and economic operators. A brief summary of impacts per group is presented below.
2.3.1.Consumers
The minimum efficiency requirements in the regulation are estimated in the EIA to reduce consumers’ energy cost by around €1.2bn in 2030. However, the further technical potential for saving energy and reducing consumers costs will not be fully exploited if the current situation persists. Since consumers have no information on the efficiency of EPS on the market, they cannot choose more efficient ones to reduce their energy costs even if they are inclined to do so.
Consumers will also be exposed to additional expenditure as they end up purchasing more EPS than needed. Consumers lack clear guidance on which EPS to use with which device as well as a multiplicity of connectors so that they are not in a position to decide whether they need to purchase an EPS with a new device or whether they can use one they already have. To end this situation, consumers need clear information on interoperability and interoperable EPS.
Growing numbers of products use EPS outside the scope of the regulation such as gardening tools and active PoE injectors. These EPS are not subject to energy efficiency requirements and any harmonization. For these products consumers can thus not benefit from cost savings due to reduced energy use or the possibility of purchasing less EPS.
Finally, consumers suffer inconvenience due to the current situation regarding chargers for phones and other portable devices, Among the reasons put forward were the inability to charge certain devices with certain chargers, the lack of clear information on interoperability, and the abundance of chargers at home.
The Common Charger IA did not gather solid data on the user experience related to other kind of products, e.g. household appliances. However, considering that the fragmentation situation is at least comparable, a similar situation can be expected.
2.3.2.Environment
The current regulation is forecast to save around 5.4TWh electricity consumption and 0.8Mt CO2eq. per year in 2030. However, there are technical efficiency potentials which the current minimum active energy efficiency and no-load energy consumption requirements do not exploit to further reduce energy consumption and GHG emissions. There is also potential for extending the requirements to products that are currently out of the scope of the Regulation. If these potentials remain untapped the potential to achieve the associated GHG and pollutant emissions savings will not be exploited.
Related emissions are connected to all life cycle stages of the EPS.
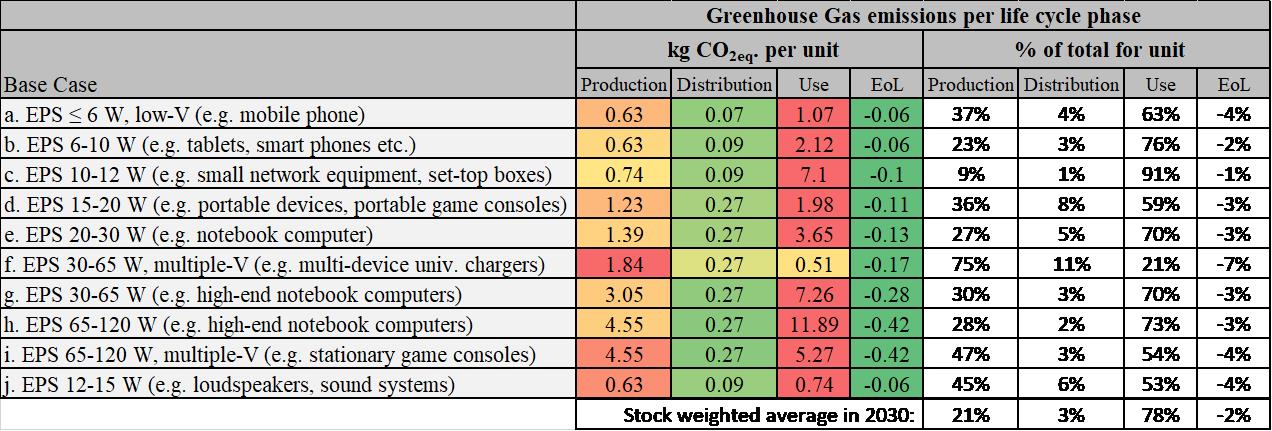
Table
2
Table 2
below shows GHG emissions per life cycle phase for various representative EPS types, calculated with the EcoReport LCA tool. From this it is clear that the use phase emissions are dominant in all but one use case. The production phase is the next largest contributor. Distribution and end of life have a minor role in overall emissions.
Table 2 - Estimated GHG emissions for specific EPS units in kg CO2 and % per life cycle phase (reference year for carbon intensity of the electricity grid: 2020)
The projected overall emissions will change largely as a result of changes in the stock and in the GHG intensity of electricity supply. Due to the decreasing GHG intensity, they are estimated to decrease to 1.2Mt of CO2eq in 2030 in the EU.
As a result of the electricity consumed during use, there are also substantial amounts of material consumed as fuel in its generation. In 2020 there were around 0.3t of fuel combustion avoided per MWh of electricity use avoided. This would mean that the energy losses in EPS currently lead to around 2.3Mt of fuel combustion annually.
Life Cycle Assessments (LCA) such as conducted by SustainablySMART and more recently the LCA of the Fairphone 4, which includes the charger, indicate that, among the charging components, the EPS is dominant in most impact categories. The Common Charger IA using a stock model, estimated that the raw material use in EPS for mobile phones and similar devices could reach a peak of 15kt by 2022 and remain steady until 2028.
Similarly, an upward trend is expected in e-waste generation due to growing purchases of EPS. The Common Charger IA model estimated an increase from 11kt in 2022 to 13kt in 2028. Clearly, since the Common Charger IA had a limited product scope, the level of material use and e-waste generated is greater if a wider end product scope is considered.
More efficient EPS would reduce the energy use and GHG and other emissions in use and the associated material combustion. Interoperable, harmonized EPS in combination with a degree of unbundling would avoid a proportion of the environmental impacts by leading to a lower demand for new EPS which would reduce the energy and material use and emissions from production.
It can be concluded that continuation of the current situation will mean that energy consumption, use of material resources, e-waste and the associated GHG and pollutant emissions will all continue at a higher rate than could be achieved.
2.3.3.Economic operators
Manufacturers and suppliers of EPS have an interest in cost-effectively minimising material use in the EPS. However, they lack any interest in the energy efficiency of the EPS and there is no competition on efficiency. It is likely that interoperability of EPS will be contrary to their interest since it can be expected to lead to a reduction of EPS sales. Such a reduction of sales would lead to lower turnover and potentially to lower profits and employment.
In view of this economic operators, including producers of equipment within and outside the scope of the current directive, benefit from the current situation with commercial and competitive advantages due to proprietary solutions for connectors, charging protocols, and economic benefits from selling EPS with the products. The revision of the RED can be considered to largely address the issue of interoperability for devices within its scope.
It is likely that individual producers would fear being at a competitive disadvantage if they do not meet the expectations of those consumers’ expecting to be provided with an EPS with each product. For some types of devices, in particular for wet-use household appliances, producers experience barriers arising from current standards and specifications which they cannot overcome as individual producers.
Manufacturers claimed in the context of the Common Charger IA that further harmonisation may reduce incentives for research and innovation, thus blocking or delaying the emergence of newer and better charging technologies. The IA references the example of the relevance of Lighting connectors for the creation of USB Type C.
Due to similarities in the current situation, the same concerns and potential effects are to be expected in manufacturers of EPS units for other product groups like vacuum cleaners and for other household appliances like devices used in wet conditions.
Changes to the ecodesign requirements are not expected to have any significant impact on competitiveness of economic actors as assessed in Annex 9, nor in consequence to the attractiveness of manufacturing EPS in the EU. However, it is to be noted that if there is greater interoperability of EPS it may remove opportunities for individual manufacturers to distinguish their products through proprietary solutions and thus reap higher profit.
2.4.How likely is the problem to persist without intervention?
EPS for energy-related products that are out of the scope of the current Regulation are not subject to energy efficiency requirements. In combination with the lack of transparency as to the efficiency of these EPS, it is not likely that a significant share of this part of the market will move towards higher efficiency EPS.
High EPS efficiency across the entire load range reflecting technical progress, and transparency on actual average EPS efficiency cannot be expected to be achieved for a sufficiently large portion of the market without intervention increasing the minimum efficiency requirements and/or creating transparency on average EPS efficiency.
In view of the fact that EPS tend to be supplied with products but are expected to have a longer life than the product, there has been little interest in EPS durability. The current Regulation therefore does not contain any durability requirements. Without a generalised reuse of EPS there would be no interest for industry to produce more durable EPS.
Problems arising from the current Regulation like the unclear scope and uncertainties as to the testing of adaptive EPS, cannot be solved without amending it. Similarly, legal and other normative barriers (standards) addressed as problem drivers cannot be overcome by individual producers but need to be addressed by policy interventions to initiate adaptations of normative requirements.
The conditions and factors driving the lacking interoperability of EPS in the absence of a clear standard for interoperability – e.g. producers seeking competitive and commercial advantages with proprietary charging protocols, consumers’ experiences and uncertainties as to the interoperability of EPS – foreseeably are not likely to change without intervention. Without extension of the regulation’s scope these fragmentation tendencies for products currently out of scope are expected to continue.
It has been reported (IA Unbundling 2021) that voluntary unbundling initiatives by certain mobile phone manufacturers could result in an estimated 25% of phones being sold without an EPS and that could increase further. However, experience with the implementation of the MoU
, shows not all manufacturers will follow, especially those with proprietary solutions. The IA found no unbundling initiatives for household appliance EPS and identified market fragmentation due to proprietary connectors and charging protocols.
It is therefore not likely that the market will move towards a harmonised, common charger which can be used for a broad range of different types of energy-related products in the scope of the Regulation such as information technology devices, household appliances, consumer equipment, without intervention.
Without intervention, the other identified problem drivers are also likely to persist or will not change to the degree that enables the full potential which EPS can contribute to reduce energy consumption, material use and GHG and pollutant emissions to be realised.
3.Why should the EU act?
3.1.Legal basis
Article 114 of the Treaty on the Functioning of the European Union (TFEU) is the legal base for measures related to the functioning of the internal market and therefore constitutes the legal base for the Ecodesign Directive and its derived legislation.
The Ecodesign Directive lays down in its Article 15(2) a set of criteria to identify energy-related products that may be subject to ecodesign measures. EPS are eligible since they satisfy the requirements on annual sales, have a significant environmental impact in the EU and present significant potential for improvement of their environmental impact on the basis of the potential energy and material savings that can be achieved through the introduction of cost-effective measures.
3.2.Subsidiarity: Necessity of EU action
The intervention is a review of an existing regulation. In preparing that regulation it’s necessity was assessed by verifying that the EU market for EPS had sufficient size to justify the development of specific products and that the other requirements justifying action were met. This existing regulation contains a review clause that obliges the EU to act.
In view of the urgency of cutting energy use and GHG emissions in line with EU targets, all significant opportunities for increasing energy efficiency need to be exploited. Since market failures mean that regulatory action is essential to exploit those opportunities, achieving the overall EU goals requires it to identify and exploit them to achieve this. In the absence of EU action on EPS, Member States might implement restrictions on certain types of products.
The scale of the change means that the evolution towards lower energy use and GHG emissions needs to be carried out in the least cost manner for society. To achieve cost effective action, it is essential to avoid national restrictions and that requirements for products are set at EU level to preserve the single market.
The mobilisation of EU industry for a clean and circular economy requires uniform requirements to be set for a sufficiently large market. This requires that action to increase the efficiency of energy-related products such as EPS and reduce their environmental impacts needs to be carried out at EU rather than national level.
These factors point to the need to set stricter minimum requirements determining access to the market for EPS to ensure they make an appropriate contribution to EU goals. Ecodesign measures need to be taken at EU level since they act directly on the product, which means that uniformity must be assured to avoid different national rules that would undermine the EU internal market for that product.
3.3.Subsidiarity: Added value of EU action
Ecodesign measures contribute to the global EU energy and climate objectives by setting requirements that influence the technical characteristics of energy related products. The ecodesign framework has the added value of requiring those requirements to be set at least lifecycle consumer cost which therefore ensures that they contribute to achieving the overall objectives at least cost.
These requirements differ from many other energy and climate legislation, that effectively require Member States to implement or promote solutions based on existing technologies, in that they require or promote the deployment or development of better technologies. In view of this they will have the added value of more effectively promoting innovation.
Direct EU action through ecodesign rules reinforces other actions that may be taken at Member State level. The added value of EU action on EPS was determined in preparing and adopting the existing regulation.
4.Objectives: What is to be achieved?
It is important to identify the general objective so that the proposed initiative can be understood in the overall context of the Union's policies. This also enables a future assessment of if, and how, the initiative has contributed to its achievement.
4.1.General objective
The general objective is to contribute to the EU’s energy and environmental objectives while ensuring the functioning of the internal market, as set in the Treaty on the Functioning of the European Union.
The TFEU states that the aim of EU energy policy includes ensuring security of energy supply and promoting energy efficiency and energy saving. Lower energy consumption is usually accompanied by a reduction in other environmental impacts including GHG and pollutant emissions as well as lower resource use and extraction.
4.2.Specific objectives
The specific objectives aim at correcting the problems identified in section
2
. They are:
1.Reduce the life cycle energy consumption of EPS at the lowest lifecycle consumer cost (SO1)
2.Reduce the GHG emissions and other environmental impacts of EPS (SO2)
There are synergies between SO1 and SO2. Reducing electricity consumption of EPS to achieve SO1 leads to lower combustion of fuel and reduced GHG and air pollutant emissions contributing to SO2. Similarly, EPS reuse contributing to SO2 through the use and production of less EPS also reduces the energy consumption for material production, processing, manufacturing, transport and packaging contributing to SO1.
In principle more efficient EPS generate less heat, allowing more compact designs that require less material, thus reducing manufacturing impacts. This is shown in response to Q2.5 of the evaluation. The lower heat generation itself should result in less stress on components, in particular electrolytic capacitors, thus helping to prolong EPS lives (when they are reusable) and thus reduce the need for replacement purchases.
There might be trade-offs if lower energy consumption to achieve SO1 were achieved though more complex EPS or require different materials if these lead to larger environmental impacts contrary to SO2.
4.3.Consideration of alternative objectives
It might be considered that there are other specific objectives for the intervention such as increasing the scope or enhancing interoperability. However, these are both possible measures that are implemented with the objective to reduce energy and environmental impacts and therefore should not be viewed as objectives in their own right. Since both can only be achieved in one specific way, they would appear to be contrary to the Better Regulation guidance to ensure that objectives “be broad enough to allow consideration of all relevant policy alternatives without prejudging a particular solution”. In view of this, the objectives are kept as those set in the framework legislation.
It might be considered that the objective of reducing environmental impacts should be better disaggregated into specific elements. Since reducing the amount of material used leads to a reduced environmental impact, this might be considered as an objective. However, material consumption in itself is not an environmental impact and therefore would appear to be open to legal challenge if used as a basis for determining the stringency of a regulation under the Ecodesign Directive. Even separating actual environmental impacts into different objectives, e.g. GHG and pollutant emissions, or emissions to air and water, raises the difficulty that the objective is to reduce environmental impact overall, not limited to one category. Any trade-offs between the impacts in different categories need to be clear in the overall contribution to the environmental objective. In view of this, environmental impacts are assessed together and aggregated on the basis of their estimated monetized values.
5.What are the available policy options?
The review of the regulation started in March 2022. This is a back-to-back Evaluation and Impact Assessment. Evidence gathering and analytical work has been done through a supporting contract and has involved meetings with stakeholders as well as interviews. A Call for Evidence was published, and feedback gathered from 6 April 2022 - 4 May 2022. Extensive desk research and other evidence gathering such as EPS testing has fed into the process. A consultation forum meeting was held in February 2023 to set out the work on the evaluation and Impact Assessment and discuss working documents and a further meeting was held in November 2023. A summary of stakeholders’ main inputs is provided in Annex 2.
This process has enabled a thorough exploration of weaknesses in the current legislation as well as reflection on the evolution needed in view of the overarching climate, energy and environmental policy goals. Through these discussions a wide range of possible measures have been identified and explored. Some of the possible measures that have eventually been discarded are:
1.Setting requirements for repairability
2.Harmonisation and active efficiency requirements for wireless charging
3.Introducing an EU Energy Label
4.Voluntary agreement by the industry
5.Extension of the scope to certain other products
6.Introduction of information requirements on efficiency
7.Interoperability requirements for certain product categories
8.Obligatory unbundling EPS from the products they power
A detailed description of these measures and the reasons for their discarding are provided in Annex 11.
After this analysis a set of measures remain including, where appropriate, different levels of stringency. These retained measures are:
M1
- Scope extension
M2 - Requiring compatibility with USB-PD specifications to increase interoperability
M3
- Minimum energy efficiency at 10% load
M4 - Raising the minimum requirement on active average efficiency and limiting standby losses for wireless chargers
M5 - Externalisation of power supply circuitries for battery charging devices and wireless chargers
M6
- Durability
The full description of these measures and their rationale are included in Annex 10. The main reasons for addressing them in the policy options are:
·Scope extension is relevant to expand the benefits of the EPS regulation to EPS that are not currently covered by it.
·Interoperability is important to increase consumer convenience and reduce expenditure as part of the common charger initiative and to reduce the environmental impacts of EPS production through longer EPS lives.
·Efficiency at 10% load is much lower than at higher output power levels. It is relevant since a significant share of time is spent at low load and this may increase with interoperable EPS.
·Market data shows that there is energy savings potential from improving the efficiency of the worst performing EPS on the market as well as addressing wireless charging standby losses.
·Externalisation of power supply circuitry for some battery and wireless chargers brings their power supply within the scope of the regulation and therefore extends its interoperability and efficiency benefits to these devices.
·Avoiding premature failure of EPS will reduce the environmental impacts of their production and also bring consumer benefits.
Table 3
illustrates how the set of retained measures are aimed at addressing all aspects of the review clause and the problem drivers. This annex also includes a preliminary assessment of the impact of their application individually that enables the construction of a logical set of policy options for analysis.
|
|
M1
|
M2
|
M3
|
M4
|
M5
|
M6
|
|
Requirements in the review clause
|
|
R1 Efficiency at 10% load
|
x
|
|
x
|
|
|
|
|
R2 Addressing wireless charging
|
x
|
|
|
|
x
|
|
|
R3 Addressing active power over ethernet
|
x
|
|
|
|
x
|
|
|
R4 Addressing equipment not in Annex I
|
x
|
|
|
|
|
|
|
R5 Circular economy and interoperability
|
|
x
|
|
|
|
x
|
|
Problem Drivers
|
|
D1 Limited scope
|
x
|
|
|
|
|
|
|
D2 Lack of transparency and untapped potential
|
x
|
|
|
x
|
x
|
|
|
D3 Lower efficiency at low load
|
|
|
x
|
|
|
|
|
D4 Lacking interoperability
|
x
|
x
|
|
|
x
|
x
|
|
D5 Lack of information on compatibility with load
|
x
|
x
|
|
|
|
|
|
D6 Bundling EPS with products
|
|
x
|
|
|
|
|
|
D7 Scope and testing adaptive EPS
|
|
|
|
x
|
|
|
|
D8 Requirements of standards and legislation
|
|
x
|
|
|
|
x
|
|
D9 Wireless chargers and PoE
|
x
|
x
|
|
x
|
x
|
|
Table 3 - Matrix showing how the different measures address the review clause aspects and problem drivers
The available policy options focus on the achievement of the general and specific objectives through the application of measures increasing EPS energy efficiency and reducing their environmental impacts without imposing significant burden to manufacturers or costs to end-users, as set out in Article 15(5) of the Ecodesign Framework Directive. These policy options are designed with increasing stringency in different dimensions to enable a comprehensive comparison.
5.1.The intervention logic
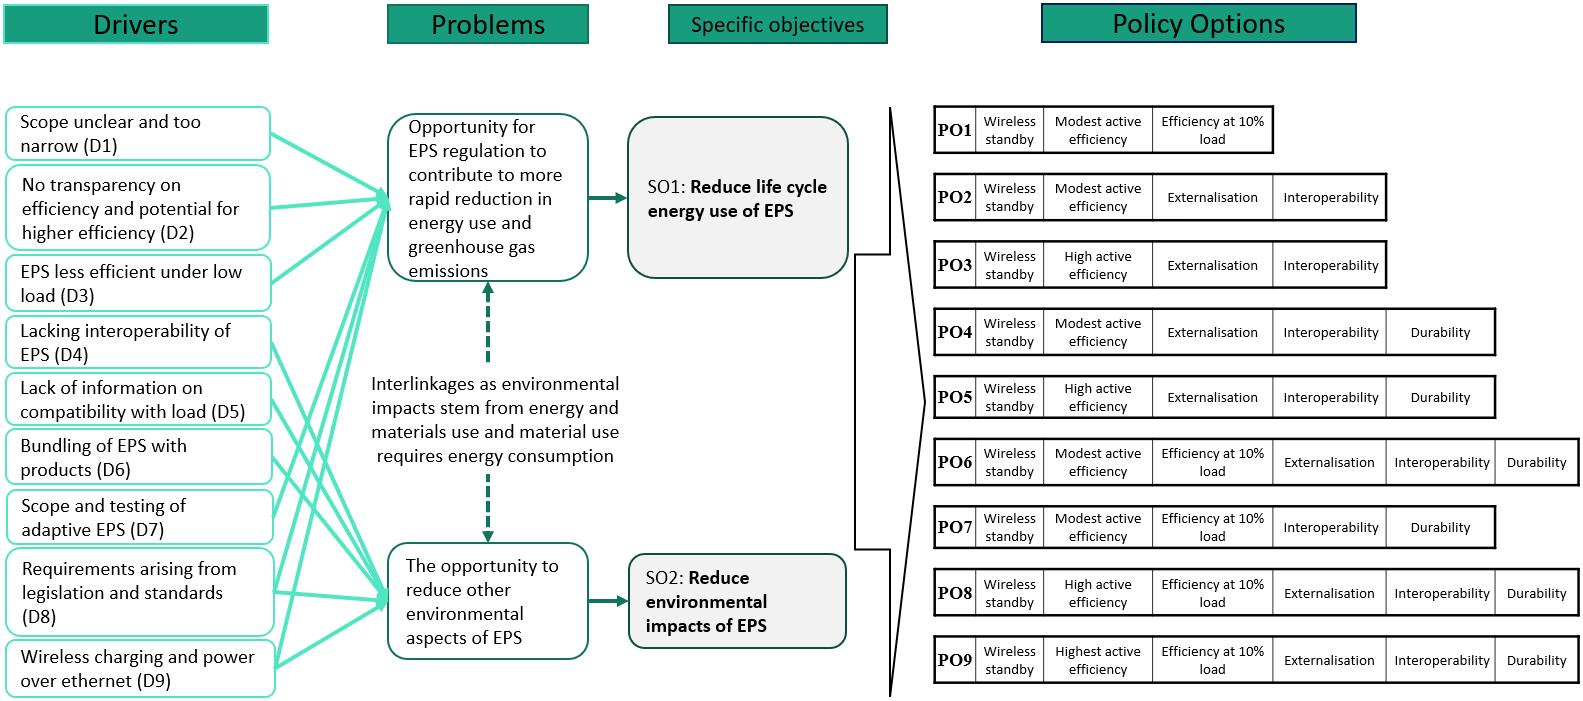
Figure 6 - Intervention logic
Figure
6
shows the overall intervention logic and the links between drivers (D), problems, specific objectives (SO), and policy options (POs).
5.2.What is the baseline from which options are assessed?
The updated EU Fit For 55 MIX scenario (FF55 MIX) provides the electricity prices and GHG intensity used in this impact assessment. More details about other input data and analytical models are provided in Annex 4. FF55 MIX projects EU and Member States energy developments up to 2050, based on global and EU market trends at the time and incorporating the effect of the Fit For 55 proposal.
Although the Commission has proposed to replace the Ecodesign Directive with the ESPR and this is now agreed by the co-legislators, the effect on the baseline is expected to be modest for a number of reasons. First, the new products in scope of the ESPR do not consume energy during their use, and therefore the increase in energy in its scope will primarily relate to embedded energy (manufacture, distribution and end-of-life of products). Second, the totality of the new products’ embedded energy is shared between EU and non-EU countries depending on the split of production. Third, EU producers are subject to ETS pricing and other regulatory measures that mean that they are likely to have less room for improvement compared to non-EU producers. Finally, the period to develop and adopt secondary legislation and for it to come in force will mean that substantial impacts could not be expected on the short run.
The amended RED requires making USB-PD a mandatory option for a broad range of battery powered radio equipment, and a mandatory unbundling option, i.e. that devices in scope have to be offered (also) without an EPS. These requirements are effective from December 2024 for most products and from April 2026 for laptops. This will have an effect on EPS design in terms of implementing the USB-PD specification and an expected reduction in new EPS sales due to unbundling. These consequences of the RED amendment are a core element of the baseline for the future EU EPS market.
While the EPS disaggregation and sales and performance figures in the EIA provide an important starting point, these have been expanded and amended in light of information on market and behavioural trends. Notable impacts arise due to roughly 10% lower losses based on market figures and significantly lower no-load values than assumed in EIA. The comprehensive DoE analysis of use patterns in relation to powered end-device use habits has also influenced the model assumptions about how many hours are operated at which load and these differ from those in the EIA. The new baseline assumptions are detailed in Annex 4.

 Figure 7 - Graphs showing evolution of EPS energy use (left) and GHG (right) under BAU
The two graphs in
Figure 7
illustrate how EPS energy use and the associated CO2 emissions are expected to evolve under BAU. The black solid line in the left graph shows that the energy used in EPS will progressively increase in absolute terms and the red dashed line shows that it will also increase as a share of total energy consumption. The black line in the right graph shows that EPS related CO2 emissions will progressively decrease under BAU. However, the red dashed line shows that CO2 emissions due to EPS will decrease less as a proportion over the period, driven by the increased share of energy used by them.
5.3.The interactions between EPS efficiency, durability and interoperability
Because this impact assessment explores a range of product parameters in addition to interoperability, the identification of their optimal combination is more complex. For example, to enable the interoperability that ensures the possible longer use of EPS requires standardised architecture, connectors and cables that may lead to some efficiency losses or require additional energy use for their production.
Figure 8
shows the main interactions.
|
|
On:
|
Interoperability
|
Durability
|
Energy used in production
|
Energy Efficiency
|
|
Impact of:
|
|
|
|
|
|
|
Interoperability
|
|
By enabling EPS to be reused and therefore have longer lives, the issue of their durability becomes relevant.
|
Interoperable EPS may be reused thus requiring less production and therefore less total energy use in production.
|
Interoperability leads to longer life that enables payback.
Interoperability may result in energy losses through PD system, connectors and cables.
|
|
Durability
|
Longer EPS lives lead to greater consumer benefit from interoperable EPS.
|
|
More durable EPS might require more energy to produce per EPS.
|
Better durability enables longer payback of energy efficiency benefits.
|
|
Energy used in production
|
No identified relation.
|
No identified relation.
|
|
No identified relation.
|
|
Energy Efficiency
|
Cost savings from more efficient EPS over their longer life help offset additional cost of interoperable EPS.
|
Higher energy efficiency leads to lower losses and therefore lower heat generation in EPS leading to longer life of components.
|
More efficient EPS may require more energy to produce per EPS.
|
|
Figure 8 - Interactions between interoperability, durability and energy
These parameters are included in the assumptions in the model used to assess the impacts of the Policy Options (POs).
5.4.Description of the policy options (POs)
The measures retained for further analysis as described in Annex 10 are grouped into a set of POs. The aim is to explore the full range of combinations and understand their impacts and trade-offs. The two main dimensions are differing degrees of energy efficiency requirements and differing requirements relating to circularity. The POs are briefly described below:
5.4.1.Energy efficiency only (PO1)
This PO focusses only on energy efficiency of EPS. It includes the introduction of an efficiency requirement at 10% load, increases no-load and active efficiency by a modest level of stringency and introduces a standby limit for wireless charging.
5.4.2.Interoperability, modest efficiency ambition (PO2)
This PO includes requirements for interoperability and relevant information. It increases no-load and active efficiency by a modest level of stringency, introduces wireless charging standby limits and requires externalisation of power supplies for single-cell battery charging applications.
5.4.3.Interoperability, high efficiency ambition (PO3)
This PO includes requirements for interoperability and relevant information. It increases active efficiency by a level of stringency met by 50% of current products, introduces wireless charging standby limits and requires externalisation of power supplies for single-cell battery charging applications.
5.4.4.Interoperability, modest efficiency ambition with durability (PO4)
This PO includes requirements for interoperability and relevant information. It increases active efficiency by a modest level of stringency, introduces wireless charging standby limits and requires externalisation of power supplies for single-cell battery charging applications. Durability requirements are introduced.
5.4.5.Interoperability, high efficiency ambition with durability (PO5)
This PO includes requirements for interoperability and relevant information. It increases active efficiency by a level of stringency met by 50% of current products, introduces wireless charging standby limits and requires externalisation of power supplies for single-cell battery charging applications. Durability requirements are introduced.
5.4.6.Interoperability, 10% load and modest active efficiency ambition, externalisation and durability (PO6)
This PO includes requirements for interoperability and relevant information. It introduces efficiency requirements at 10% load, increases active efficiency by a modest level of stringency, introduces wireless charging standby limits and requires externalisation of power supplies for single-cell battery charging applications. Durability requirements are introduced.
5.4.7.Interoperability, 10% load and modest efficiency ambition with durability no externalisation (PO7)
This PO is identical to PO6 but without requiring externalisation of power supplies for single-cell battery charging applications.
5.4.8.Interoperability, 10% load and high active efficiency ambition, externalisation and durability (PO8)
This PO includes requirements for interoperability and relevant information. It introduces efficiency requirements at 10% load. It increases active efficiency by a level of stringency met by 50% of current products, introduces wireless charging standby limits and requires externalisation of power supplies for single-cell battery charging applications. Durability requirements are introduced.
5.4.9.Interoperability, 10% load and highest active efficiency ambition, externalisation and durability (PO9)
This PO includes requirements for interoperability and relevant information. It introduces efficiency requirements at 10% load. It increases active efficiency by a ‘best in market’ level of stringency, introduces wireless charging standby limits and requires externalisation of power supplies for single-cell battery charging applications. Durability requirements are introduced.
5.5.Policy Options matrix
Table
4
below illustrates graphically the approach followed to compose the POs described above from the measures with an X showing that a measure is incorporated in the relevant PO.
|
Individual measures
|
Policy Options
|
|
|
PO1
|
PO2
|
PO3
|
PO4
|
PO5
|
PO6
|
PO7
|
PO8
|
PO9
|
|
Interoperability and information (M2b)
|
|
x
|
x
|
x
|
x
|
x
|
x
|
x
|
x
|
|
Efficiency requirement at 10% load for EPS > 10W (M3b)
|
x
|
|
|
|
|
x
|
x
|
x
|
x
|
|
Active efficiency modest stringency (M4a)
|
x
|
x
|
|
x
|
|
x
|
x
|
|
|
|
Active efficiency high stringency (M4b)
|
|
|
x
|
|
x
|
|
|
x
|
|
|
Active efficiency ‘best in market’ stringency (M4c)
|
|
|
|
|
|
|
|
|
x
|
|
Wireless charging standby limit (M4d)
|
x
|
x
|
x
|
x
|
x
|
x
|
x
|
x
|
x
|
|
Externalisation of power supply for wireless chargers and single cell battery chargers (M5)
|
|
x
|
x
|
x
|
x
|
x
|
|
x
|
x
|
|
EPS durability requirements (M6)
|
|
|
|
x
|
x
|
x
|
x
|
x
|
x
|
Table 4 - Matrix showing which measures are included in the Policy Options
6.What are the impacts of the policy options?
6.1.Business-as-Usual (BAU)
Under BAU there will be no new action and the current Regulation stays in place without any revision. A major change in the market is triggered by the amended RED, requiring USB and USB-PD compatibility for a range of types of battery-powered radio equipment from 2024 and 2026 for laptops respectively onwards. This also includes a mandatory requirement to offer an option of purchasing products without an EPS (mandatory unbundling option).
Compared to the BAU scenario estimated in the EIA there is a significant shift in the market from USB EPS in the 5-10W range to 20W and above to facilitate fast charging of batteries. This scenario provides the baseline against which the other options are assessed and the expected change in the main indicators are shown in
Table
5
.

Table 5 - BAU evolution of main indicators
Under BAU, the Gross Energy Requirement (GER) for EPS in scope in 2040 is projected to increase by 21%. GHG emissions are projected to decrease by 70% compared to 2020, mainly due to changes of the GHG intensity of the EU27 electricity grid. Acquisition costs (in constant Euros) are projected to increase by 8.7%, despite interoperability requirements under the RED while total electricity costs are projected to increase by 54%. Total user costs are expected to increase by 17%, mainly due to the growing market for wireless chargers. The manufacturing revenue from EPSs is projected to decrease due to increased competition, as shown by the purchase costs in 2030 compared to 2025, once EPS for RED equipment can be used interchangeably from various vendors.
6.2.Economic impacts of the POs
6.2.1.Annual economic impacts over 2020-40
Figure
9
shows the modelled changes in annual consumer expenditure over the period 2020 to 2040 for the range of POs. The main outlier is PO1 that fairly closely follows BAU, both with a reduced expenditure in 2030 as a consequence of the reduced EPS purchases flowing from the RED. For all the other POs, the additional requirements initially lead to higher consumer costs before they reduce to below BAU after 2030.
Figure
10
shows how the annual consumer expenditure changes compared to BAU for each PO over the period. As already seen, PO1 is the main outlier in 2030 while in 2035 and 2040 it is PO2 and PO3 that differ significantly from the other POs. The latter two POs differ from the others in not including requirements on durability or efficiency at 10% load.

Figure 9 - Change in annual consumer expenditure

Figure 10 - Change in annual consumer expenditure due to POs compared to BAU
As can be seen from the figures for 2035 and 2040, because of the relatively short life of non-interoperable EPS, once the replacement of the EPS stock has taken place the cost stabilises at a lower cost than BAU due to a lower rate of EPS purchases.
6.2.2.Annual economic impacts in 2035
Table
6
below shows the estimated economic impacts of the POs for 2035. All POs lead to a reduction of annual electricity use, although the reduction ranges from €16mln to €182mln.
The impacts on purchase cost are more varied, from a €117mln increase to an €86mln decrease. The PO with only energy efficiency requirements (PO1), as well as those with interoperability but without durability requirements (PO2&3), and that with the highest energy efficiency ambition (PO9), all show an increase in purchase costs. This is due to the additional cost of the changes to meet the higher energy efficiency requirements, while the reduction of EPS purchases to offset this increase through longer EPS lifetimes is too limited (PO2, 3, 9) or none (PO1).

Table 6 - Main annual economic impacts of the Policy Options in 2035
The impact on total annual consumer expenditure ranges from an overall increase of €10m (PO3) to a saving of €143m (PO1).
6.2.3.Cumulative cost impacts
Except for PO1, it has been shown that all POs lead to a significant increase in purchase costs in the first few years of implementation. While a small part of the price increase is due to more stringent energy efficiency requirements, the majority of the cost increase is due to the implementation of interoperability requirements.
To estimate the cumulative cost changes over time, the annual cost changes vs BAU are interpolated for both electricity and purchase costs and the results summed over 5-year periods. The only exception to this is the change in purchase costs for POs including interoperability where it is assumed that the increased purchase cost in 2030 already comes into effect from 2026 onwards to cover the assumed average life of existing non-interoperable EPS that are being replaced with interoperable ones. Once they are replaced, the assumed longer life leads to lower annual purchases and therefore lower annual purchase costs.
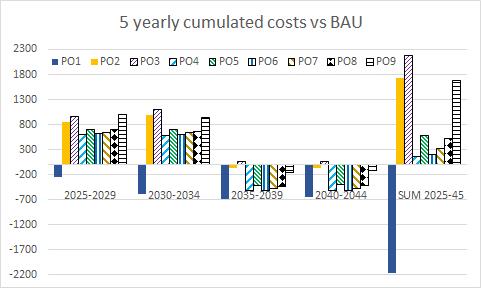
Figure 11 Five-yearly cumulated consumer cost change vs BAU and sum over 2025-45
The cumulated consumer cost change over the period 2025 to 2045 is shown at the right of
Figure
11
. This varies from a decrease of over €2bn for PO1 to an increase of over €2bn for PO3. Of the POs including interoperability, PO4 performs best with a cumulative cost increase of €156mln and PO6 is the next best with a cost increase of €196mln.
These cost figures only cover the purchase and electricity costs. They do not take account of the value of interoperability to consumers. The value of this interoperability is uncertain, although anecdotally it is considerable. The estimates in Annex 15 show that consumer convenience from interoperable EPS may have a value around €250mln per year with indicatively a low estimate of €123mln and a high of €370mln per year. The 20-year cumulative cost increase of POs including interoperability varies between an increase of €8mln and €109mln per year indicating that the benefits in terms of increased consumer convenience comfortably offset the additional costs over 20 years.
If a shorter time period is considered, the annualised cumulative cost increase rises to between €45mln and €141mln over 15 years or €118mln to €207mln for 10 years. Even in these cases the range for all the POs is comfortably less than the estimated increase in consumer convenience.
6.3.Environmental impacts of the options
Table
7
below shows the estimated environmental impacts of the options for 2035. All POs lead to a reduction of GER. The best performing achieve around an 8% reduction (PO9&1). The worst performers achieve around a 2% reduction (PO2&4) while the rest achieve around a 3 to 4% reduction.
The performance in terms of GHG emission reductions is quite different. The worst performer by far achieves only around 3% saving (PO1) while all the rest achieve between 7 and 10% saving because they include interoperability requirements and therefore lead to lower EPS purchases. For POs including interoperability, the GHG savings increase with energy efficiency stringency and so the best performer (PO9) is that with the highest energy efficiency ambition while pairs of options with equal requirements other than the efficiency level show the greater GHG savings with the higher ambition (PO8 compared to PO6, PO5 compared to PO4 and PO3 compared to PO2).
In terms of the changes to acidification and PM emissions the impacts of the various POs have a comparable pattern. Most of the POs (PO4, 5, 6, 8 & 9) have a largely comparable impact. For acidification PO8&9 deliver slightly higher benefits, PO7 has slightly lower benefits while PO2&3 are somewhat worse and PO1 has virtually no benefits for acidification and PM emissions since it mainly affects use of electricity in the EU which has a very low pollutant emission intensity.

Table 7 - Main environmental impacts of the Policy Options
The impacts of the various POs on absolute GHG emissions over time are shown in
Figure
12
.
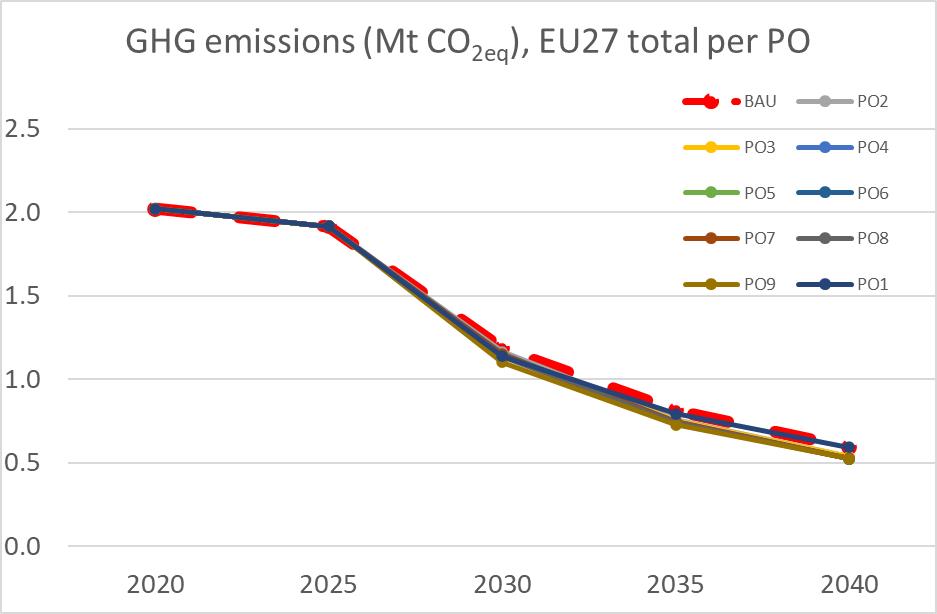
Figure 12 - Total annual EU27 GHG emissions of POs, 2020-2040
This illustrates that the differences between the POs are small and they all have a similar reduction profile. The main driver of GHG reduction is the decarbonisation of the electricity supply as shown by the reduction in BAU.
Figure
13
shows more clearly the differences between the GHG savings of the different POs compared to BAU. In general, these show increasing GHG savings moving from PO2 to PO9. In 2030 there is some divergence from this trend, probably due to the still ongoing replacement of less efficient non-interoperable EPS at that point which will be largely complete by 2035.

Figure 13 - Changes to total annual EU27 GHG emissions of POs vs BAU, 2030-2040
It can be noted that PO1 results in no GHG emission savings in 2040 since it only affects electricity consumption and not EPS sales. This is also true in relation to the electricity use for all other POs due to the assumed decarbonisation of EU electricity production by then. The GHG savings for the other POs in 2040 result exclusively from the reduced production emissions.
6.4.Social impacts
Two main types of social impact are considered. Firstly, it is assessed whether the POs lead to affordability issues as required in Article 15(5)c of the Ecodesign Directive that requires that “there shall be no significant negative impact on consumers in particular as regards the affordability and the life cycle cost of the product”. The assumptions detailed in Annex 4 show the cost of the interoperability and energy efficiency requirements costs for affected EPS. The modelling shows for the year 2030 that the cost per EPS will increase between 1 and 12% with a 7% overall price increase. The largest percentage increase is for the smallest, lowest cost EPS. These levels of cost increase for relatively low-cost products should not affect affordability.
Changes in employment in the EU are assessed in a simple manner based on the employment intensity of relevant sectors described in Annex 4. The main impacts result from the change in retail sector turnover (estimated at 0.3 times the change in purchase cost), the change in electricity sector employment (resulting from reduced electricity use) and the change in the general economy as a result of the net increase or decrease in expenditure on EPS. The results for the POs are shown in
Table
8
and can be seen to be overall positive but insignificant.

Table 8 - Estimated employment impacts of the POs
6.5.Impact on societal costs
Table
9
shows how the inclusion of certain monetised externalities affects the purely consumer view of costs shown in section 6.2. The overall societal benefits are greater in all cases and the overall ranking of the impacts of the POs doesn’t change significantly although some options appear slightly more attractive than from a purely consumer cost perspective. The societal costs include air pollution emissions which occur largely outside the EU and whose societal impact will then largely be experienced outside the EU. In contrast the GHG emissions have a global impact.

Table 9 - Impact of POs on societal lifecycle costs in 2035
The most substantial change compared to the ranking from a consumer expenditure perspective is that the ranking of PO4 and PO6 change places (they rank 2nd and 3rd highest savings) with PO6 having a better ranking from the societal viewpoint. The other significant change is that PO3 which ranks worst from both perspectives, leads to a net benefit from a societal point of view while it leads to a net increase in cost from the purely consumer expenditure point of view.
6.6.Overview of the PO impacts
All the key impacts of the POs in 2035 are illustrated by the radar-plot in
Figure
14
. This shows the contribution of each option to the assessed parameters within the range of 0 (smallest) and 1 (largest) saving. This helps to understand the difference in contribution of each PO for each parameter, although it exaggerates the difference between them and therefore has a limited value in comparing the overall performance of the POs for all the different parameters.

Figure 14 - Impacts of combined options
The most striking divergences are for PO1 and PO9. In contrast, PO2 to 7 have relatively similar profiles but vary in the scale of benefit achieved.
In the case of PO1, because it does not contain any interoperability measures it has no impact on e-waste and virtually no impact on PM and acidification emissions and the least impact on GHG emissions. It delivers high consumer cost and GER savings because it does not include the interoperability requirements that add cost and manufacturing effort.
PO9 differs from the bulk of the other POs because it contains the most stringent energy efficiency requirement. This leads also to high energy and GHG savings but with negative impacts on purchase price and therefore performs poorly on consumer cost savings.
7.How do the options compare?
7.1.How the options are compared
The intervention has two specific objectives. The first is to reduce lifecycle energy consumption of EPS to the level leading to the minimum lifecycle cost to consumers. The second is to reduce the other environmental impacts of EPS. To compare the options it is therefore necessary to determine how adequately each PO:
·Sets energy efficiency requirements at the level that achieve the lifecycle cost minimum for consumers;
·Is effective in achieving the specific objectives, i.e. the degree to which it leads to energy savings and reduced environmental impacts;
·Is efficient in achieving the specific objectives i.e. how cost efficiently the objectives are achieved;
·Is coherent with other EU policy objectives.
Based on a ranking of each PO against these four elements the comparison can be made and the best performing option selected.
7.2.Determining the end-user lifecycle cost minimum level of EPS efficiency
The Ecodesign Directive requires that “the level of energy efficiency or consumption must be set aiming at the life cycle cost minimum to end-users for representative product models, taking into account the consequences on other environmental aspects”.
Because of the complex interaction of the energy efficiency requirements and the interoperability requirements and the costs related to them it is important to distinguish the two effects to ensure that energy efficiency is set at the lifecycle cost minimum.

Figure 15 - EPS life cycle cost curve for energy efficiency measures
As a first step, the cost impacts of different energy efficiency measures and combinations are compared to enable a life cycle cost curve to be established. This requires including in a cost curve the different possible measures to address active, 10% load and no-load efficiency. This uses the impact of the efficiency measures on the EPS market as assessed in Annex 10.
Figure 15
shows two curves, the first dashed line is based on BAU assumptions about EPS lifetime and the second solid line where a 50% longer EPS lifetime is assumed in line with the expectations on the effect of interoperability. The horizontal axis of the graph shows incremental increases in the application of energy efficiency measures while the vertical axis shows the lifecycle consumer cost resulting from the additional purchase costs due to the efficiency measures and the discounted electricity costs savings.
The parts of the cost curves under the x-axis are those where the measures lead to a reduction in lifecycle consumer cost. The dashed line in the graph shows that without any lifetime extension the lowest lifecycle cost is achieved with measure M4a alone or coupled with M3a. There is uncertainty in the assumptions and the calculations and so it might be reasonable to think that any of the options from M4a only to M4a+M3b could also be acceptable as they show lower LCC.
The effect of a 50% longer EPS life is shown in the solid line where the consumer benefit is greater due to the longer period in which the energy savings materialise. The life cycle cost savings of the efficiency measures are greater and the range of possible combinations of measures that lead to a life cycle cost savings for consumers is slightly broader than in the BAU case including M4b+M3b. The lowest LCC appears to be M4a+M3b.
7.3.Effectiveness and efficiency of options
Figure 16
below on the left shows how effective the various POs are at achieving the Specific Objectives, with the most effective counting as 1 and all others shown as a proportion of that. The results are shown for the central scenario where the weight of the contribution to SO1 and SO2 is equal. A range of sensitivity tests (see Annex 13) with a 6:4 and 7:3 ratio and one with a 9:1 ratio do not significantly alter the overall effectiveness rankings. In all cases PO9 is shown as the most effective. In most cases the worst performers are PO1 and PO2. PO3 to PO8 are relatively closely ranked and generally PO8 and PO5 perform slightly better although the ranking changes with the sensitivity. Only if a very high emphasis is placed on SO1 (energy) does PO1 approach the ranking of PO9.


Figure 16 - Normalised ranking of effectiveness (left) and efficiency (right) of policy options
In contrast the right part of
Figure 16
shows the cost efficiency of the POs with a 3% discount rate. In this case PO1 is the highest scoring and remains so for almost all sensitivity tests other than with a 90% weighting for SO1. The second-best scoring are PO4 and PO6 and remain so for all the sensitivity tests. With an extreme weight on energy, PO4 becomes the best scoring.
7.4.Scoring the options
Based on the analysis presented the different options can be scored. The approach followed is described below:
·In relation to Life Cycle Consumer Cost, 1 point is given for POs containing combinations of measures that lead to consumer cost savings and 2 points to options including the combination of measures with the Lowest Life Cycle Consumer Cost.
·In relation to Effectiveness and Efficiency, 1 point is allocated for a score in the bottom third of the marks, 2 points if it is in the middle third and 3 points if it is the highest third as shown in
Figure 17
below.


Figure 17 - Scoring matrix for effectiveness (top) and efficiency (3%NPV) (bottom)
·For Coherence, all measures have been assessed to ensure they are coherent with policy objectives and therefore the POs combining them are also coherent. A distinction that can be made between them relates to the degree to which the POs contribute to the Circular Economy through enabling EPS reuse or prolonging their operating lives. The options are allocated 1 point each if they include interoperability requirements and 1 point if they include durability requirements.
7.5.Ranking the options
The scoring described in section 7.4 is applied to the POs as shown in
Table
10
.
|
PO
|
LCCC
|
Effectiveness
|
Efficiency
|
Coherence
|
Total
|
|
PO1
|
2
|
1
|
3
|
0
|
6
|
|
PO2
|
1
|
1
|
1
|
1
|
4
|
|
PO3
|
0
|
1
|
1
|
1
|
3
|
|
PO4
|
1
|
2
|
2
|
2
|
7
|
|
PO5
|
0
|
2
|
1
|
2
|
5
|
|
PO6
|
2
|
2
|
2
|
2
|
8
|
|
PO7
|
1
|
2
|
2
|
2
|
7
|
|
PO8
|
1
|
2
|
1
|
2
|
6
|
|
PO9
|
0
|
3
|
1
|
2
|
6
|
Table 10 - Ranking of the Policy Options
Based upon the scoring, PO6 (shown in grey) appears the most desirable as the only PO scoring 8 points. Next best are PO4 and PO7, with 7 points, that only differ from PO6 in not including M4.3 in the case of PO4 and a higher level of active efficiency (M4b) in PO7. Next, PO1, 8 and 9 all score 6 points.
A wide range of sensitivity tests have been performed, described in Annex 13, varying the share of SO1 and SO2 in assessing effectiveness, the importance of LLCC, the discount rate and to check results against societal costs. The results are robust with PO6 nearly always the preferred option.
8.Preferred option
8.1.Legal requirements
Annex II of the Ecodesign Directive states that “the level of energy efficiency must be set aiming at the lifecycle cost minimum to end-users”. It goes on to say “taking into account the consequences on other environmental aspects”. This has been assessed in section 8, and specifically 8.2 to identify the optimal PO taking account of the lowest lifecycle consumer cost. The consequences on other environmental aspects are addressed in section 9.3 below.
The Directive also sets a series of requirements in its Article 15(5) on functionality, health, safety and environment, affordability, competitiveness, proprietary technology and administrative burden. It is considered that all the POs satisfy these since measures that fail to satisfy these requirements have been discarded and affordability at the level of the POs has been assessed.
8.2.Main impacts
PO6 brings together requirements on interoperability, durability with energy efficiency requirements on active, 10% load and no load as well as requirements on wireless charging. Under the preferred option, a further 35-40 % of EPS placed on the EU market are anticipated to be required to become interoperable, in addition to those powering RED devices. The main expected impacts in 2035 of the preferred option are shown in
Table 11
below.

Table 11- Main energy and environmental impacts of the preferred option in 2035
Many of the environmental benefits are a result of reduced material use in the EPS or as fuel combusted to supply electricity. The impacts on these material uses are shown in
Table
12
.

Table 12 - Impacts of the preferred option on material use in 2035
8.3.Verifying the missed environmental benefits of other options
In determining the appropriate level of energy efficiency ambition, the Ecodesign Directive requires that account should be taken of “the consequences on other environmental aspects” of the choice of stringency. To assess these consequences, the approach followed has been to calculate the monetized value of the difference in environmental impacts between the preferred option and the other options based on standard valuations of these externalities.
All impacts on material or energy use are assumed to be internalised in prices. The extra value of the environmental impacts in €mln compared to those of the preferred option is shown in the left column of
Table 13
. Where the figure is negative the environmental benefit of the option is greater than those of the preferred option and its cost effectiveness is therefore assessed. The middle column of
Table 13
shows the additional consumer cost of that option in €m compared to the preferred option.
It should be noted that while GHG emissions have an impact at global level and therefore are relevant to the EU wherever they occur, the same is not true of the other pollutant emissions included in the assessment. In view of this, the net environmental value calculated will be larger than the impacts expected in the EU from the emissions, since a large part of the pollutant emissions are emitted in countries where EPS are manufactured, primarily in Asia.
|
PO
|
Net environmental value vs preferred option (€m)
|
Additional consumer cost vs preferred option (€m)
|
Multiple of consumer cost to extra environmental benefit
|
|
PO1
|
19.7
|
-35
|
N/A
|
|
PO2
|
3.5
|
90
|
N/A
|
|
PO3
|
3.1
|
111
|
N/A
|
|
PO4
|
0.3
|
0
|
N/A
|
|
PO5
|
-0.1
|
19
|
190
|
|
PO6
|
0.0
|
0
|
|
|
PO7
|
0.8
|
7
|
N/A
|
|
PO8
|
-0.5
|
14
|
28
|
|
PO9
|
-1.8
|
47
|
26
|
Table 13 - comparison of costs and environmental impacts of other POs compared to the preferred option.
This check is most relevant for the policy options that have an overall ranking close to that of the preferred option which are the rows shown in grey in the table. As can be seen, only three of these POs have a better environmental performance than the preferred option (PO5, 8, 9) and are therefore of relevance. These are all among the POs with a scoring close to that of the preferred option. The right-hand column shows that for these three POs, the additional consumer cost is between twenty-six and one hundred and ninety times the monetized value of the additional environmental benefits. Based on this assessment it can be concluded that there is not sufficient environmental benefit to deviate from the choice of the energy efficiency level corresponding to the lowest lifecycle consumer costs
8.4.Impact of consumer rate of reuse of EPS on the Preferred Option
A key uncertainty in the analysis is the degree to which consumers will take advantage of the opportunities offered by interoperable EPS to avoid purchasing new EPS with new devices. In the optimal case, consumers would be assumed to continue using an EPS until it reaches the end of its technical life. Provided the EPS is sufficiently powerful for the end device, this could reasonably be expected to lead to around a doubling of EPS lives.
The central assumption used in this Impact Assessment is that EPS lives will in fact be prolonged on average by 1.5 times. This is less than would happen in the optimal case because it is assumed that some manufacturers will continue to supply an EPS as standard with new end devices. In addition, some consumers will buy new EPS in any case, even if not needed.

Table 14 - Comparison of main impacts with impact of sensitivity tests for consumer behaviour
To test how crucial this assumed 50% average increase in product lives is, Annex 13 shows the effect of varying it and the results are summarised in
Table
14
above. As expected, greater reuse leads to bigger savings and vice versa. Even in the most pessimistic scenario the preferred option brings energy and environmental benefits, but at the level of direct consumer cost it no longer looks positive.
However, these figures take no account of the expected greater consumer convenience, discussed in Annex 15. The absolute value of this increased convenience is extremely uncertain, however from the assessment it appears to be of a similar magnitude to the increased cost in the worst case with only a 25% increase in EPS lives. This implies that even down to a relatively low assumed EPS reuse rate, the overall impacts including greater consumer convenience should remain positive.
8.5.REFIT
The proposed policy option is in line with the REFIT objectives of simplification and reduction of red tape. No net reporting or administrative requirements are created.
The requirements largely relate to compliance with existing voluntary industry standards (USB-C and USB-PD) and align with the requirements in the RED.
8.6.One-In One-Out
The administrative costs as compared to the baseline are evaluated in Annex 3. They consist of additional labelling costs for printing of the Common Charger logo on the nameplate and the product package, and marking of the Type-C ports on the enclosure of USB power supplies, and are estimated to be very limited, i.e. in the sub-cent range up to €0.001 per EPS sold, which amounts to around €400k per year for all EPS placed on the EU market.
8.7.Concluding remarks
The preferred option (PO6) entails the following measures:
·Extension of the scope of the regulation to wireless chargers, single-cell battery charging devices, active PoE injectors and stand-alone USB EPS.
·USB/USB-PD requirements for EPS with an output power below 240W. Exemptions apply.
·Information requirements on interoperability for USB EPS, including a Common Charger EU logo.
·Minimum efficiency requirement at 10% load operation for EPS > 10W.
·More stringent active average efficiency and no-load requirements.
·Stand-by power consumption limit for wireless charging pads.
·Externalisation of power supply circuitry for wireless chargers and single-cell battery chargers.
·Durability requirements.
The anticipated impacts of the preferred option in 2035 are shown in
Table
15
:

Table 15 - Impacts of the preferred option in 2035
The preferred option will lead to around an additional 35 to 40% of the EU EPS market becoming interoperable on top of the approximately 50% that are currently assumed to be as a result of the Radio Equipment Directive requirements.
Ecodesign requirements make an important contribution to the EU’s long-term energy and climate objectives. The preferred option contributes to achieving those objectives and to achieving the goals of the EU Climate Law.
Significant environmental impacts have been assessed and the analysis shows that the largest ones are associated with the consumption of energy in the use phase. These are reduced, while in line with the ‘do-no-significant-harm’ principle no other identifiable significant impacts are caused by the preferred option.
9.How will actual impacts be monitored and evaluated?
An analysis of the products on the market (sales figures derived from generally available market statistics, performance, etc.) can determine if the shift towards more resource efficient products has happened as intended. The requirement to publish information on energy efficiency and no-load losses, and standby power consumption in case of wireless chargers, allows to track performance in terms of energy related requirements over time. As this information however is not maintained centrally, this observation of market developments requires additional research on the manufacturers’ websites.
In particular monitoring and evaluation should be based on the following indicators, which reflect the general and specific objectives:
1.Market penetration (e.g. percentage of sales for improved products or elimination of worst performing products, products sold unbundled) (Source: Market data, WEEE registers);
2.Overall decline in sales as an indicator of longer product life cycles (Source: Market data);
3.Speed with which market penetration of improved products has occurred, i.e. x number of years for y% penetration (source: Market data, manufacturer data);
4.Reduction of the related GHG emissions (To be estimated, based on sales of EPS and declared energy efficiency and energy consumption values);
5.Savings (economic) for European consumers (To be estimated based on product, EPS and electricity price trends);
An evaluation of the initiative could usefully take place (indicatively) 5 years after entry into force of the measures, in particular as regards the level of voluntary unbundling. The evaluation would build on the information from the above indicators.
Annexes
Annex 1: Procedural information
1.Lead DG, Decide Planning/CWP references
DG ENER, PLAN/2021/11755, Commission Ecodesign and Energy Labelling Working Plan 2022-2024 (C/2022/2026).
2.Organisation and timing
The revision of the Ecodesign Regulation on external power supplies is included in the Ecodesign and Energy Labelling Working Plan 2022-2024.
According to Article 7 of the Ecodesign regulation it should be reviewed in the light of technological progress by 14 November 2022. A Call for Evidence was published on 4 April 2022.
A draft of the impact assessment report was submitted on 18 July 2023 to the members of the Ecodesign and Energy Labelling Interservice Steering Group, involving the following DGs: SG, AGRI, BUDG, CLIMA, CNECT, COMM, COMP, DEFIS, EAC, ECFIN, ECHO, EMPL, ENV, ESTAT, FISMA, GROW, JRC, JUST, IDEA, MOVE, REFORM, REGIO, RTD, SANTE, SJ, TAXUD. A meeting took place on 25 July. Questions were raised by JUST, EMPL and TAXUD, and were addressed by ENER. Written comments were received from DG ENV.
3.Consultation of the RSB
The draft Impact Assessment was submitted to the RSB on 27 September 2023. A meeting was held on 25 October 2023. Following the negative opinion of the RSB the IA has been amended and was resubmitted on 7 March 2024. An overview of the improvements made in response to the RSB comments is set out below:
|
(1) The report does not adequately define the problem the initiative intends to address, including in terms of scope, energy efficiency and interoperability. It is unclear on the magnitude of the problem and the regulatory and energy efficiency gaps to be covered. The relationship with the Radio Equipment Directive is not sufficiently elaborated.
|
|
Amendments made to the IA in response
|
|
A new section 1.1 has been added that explains the Ecodesign Directive and the need for regular reviews of measures to take account of progress. This framework requires an exploration of what is feasible in the light of the consumer cost constraint. It is not possible to say up-front what can be achieved.
A new section 1.7 has been included to explain the interaction with the RED and how EPS information requirements can support consumers in identifying EPS for their RED devices.
The description of the interoperability problem driver has been enhanced including in relation to the RED.
The description of the scope problem driver has been enhanced to explain that expanding scope enables setting energy efficiency and interoperability requirements that themselves can bring energy and environmental benefits.
|
|
(2) The logic of the intervention is not well established. The problems, problem drivers, objectives and options are not appropriately described, structured and linked, nor are policy trade-offs clearly presented. The policy objectives are not expressed in specific terms and do not reflect the legal constraint that measures need to be set at lowest life cycle consumer cost.
|
|
Amendments made to the IA in response
|
|
The Ecodesign Directive aims to increase energy efficiency and protection of the environment (while ensuring free movement of products) and also to increase security of energy supply. These provide the objectives for the implementing measures adopted under it. The specific objectives have been amended to separate the energy and the environmental aspects and include the lowest life cycle consumer cost aspect.
The description of the measures and discarded measures have been moved to annexes 10 and 11. This enables more detailed descriptions of the measures and explanations of the reasons behind them. More detail is provided on the reasons for discarding different measures.
A new part is introduced in section 5 to explain how the remaining measures have been put together to provide a comprehensive set of Policy Options.
The Policy Options have been reviewed and additional options without interoperability and also with a higher level of energy efficiency ambition have been included
|
|
(3) The robustness of the analysis of impacts of specific measures and options is not properly demonstrated due to unclear assumptions and inadequate acknowledgment of uncertainties.
|
|
Amendments made to the IA in response
|
|
Information has been included on the key assumptions on the reaction of consumers to interoperability and the uptake by manufacturers of voluntary unbundling that is mostly taken from the preceding Common Charger Impact Assessment. Since there is uncertainty about this, sensitivity tests on these factors have been carried out with the model and the results are reported in annex 13 as well as briefly in the main text.
Text has been added on the likely beneficial impact on competitiveness of EU manufacturers. However, as made clear in the IA, since manufacturing takes place in Asia the importance of this is limited. The discussion of the impacts on innovation has been enhanced, however, these are likely to be relatively small as ecodesign requirements use existing technology.
The report has been restructured to follow the amended design of the Policy Options.
The modelling and assumptions supporting the assessment have been thoroughly reviewed and where appropriate updated. A full final series of model runs has been carried out addressing the modified set of policy options. This includes the correction of minor errors that have been identified as well as adjustments based on information that came to light later in the analysis.
It has been verified that all costs in the policy assessment are shown as overall costs not unit costs. For OIOO the aggregate figure is included.
Due to the requirements of the Ecodesign Directive, it is clarified in section 1.1 that the IA analysis is primarily based on consumer welfare. Costs including external costs are provided for information and show these are relatively small and an assessment is included in section 8.3 of whether there are higher environmental benefits from other Policy Options that could justify choice of a different preferred option.
|
|
(4) The report does not provide an adequate comparison of options in terms of effectiveness, efficiency and coherence. The analysis lacks clarity on the applied scoring of different criteria and the overall methodology used in comparing the options. The choice of the preferred option is not adequately argued.
|
|
Amendments made to the IA in response
|
|
The comparison of the Policy Options has been thoroughly revised following the review of the objectives and the restructuring of the Policy Options. The assessment is carried out in relation to effectiveness, efficiency, coherence and least life cycle cost.
In terms of coherence, the process followed has ensured that incoherent measures have been ruled out. Detail on these is provided in annex 11 on discarded measures, where the descriptions explain whether they have been ruled out due to poor coherence with other EU policy objectives.
In view of this, in terms of assessing coherence of the Policy Options, the primary distinguishing factor is their contribution to Circular Economy goals in relation to material in the EPS and this has been explicitly scored.
No assessment of proportionality is included since as an implementing measure under the Ecodesign Directive there is no choice of instrument available. It is a Regulation that is being reviewed, and the only alternative would be to abolish it, however as shown in the Evaluation, its retention is justified.
The methodology used to compare the Policy Options is based on the assessment of their impacts in relation to the objectives in terms of their effective (contribution to SO1 and SO2) efficiency (the impact per unit cost) and whether they result in the lowest life cycle cost and how coherent they are.
The scoring system used to compare the Policy Options is clearly explained. For quantifiable aspects (energy, environmental impacts and costs) the actual figures from the modelling are used. To provide a score of 1 to 3, the results are divided into 3 equal bands between the worst and best performer and POs within each band are scored 1 to 3 respectively. For Life Cycle Cost a specific approach is used based on the location of the combinations of the efficiency measures in the life cycle cost curve. Zero marks are given to combinations leading to costs above BAU.
The performance with regard to lowest life cycle consumer cost is shown by the consumer cost figures. The addition of lowest life cycle consumer cost to the energy objective will slightly amend the assessment of effectiveness.
The trade-offs are illustrated in a radar diagram showing what each Policy Option delivers against the measured outcomes. This is supported by a written description of the trade-offs.
|
Following resubmission of the draft Impact Assessment the RSB gave a positive opinion with comments on 18 April 2024. The table below shows the specific RSB comments and the action that has been taken:
|
(1) The analysis of respective impacts on EU and third-country EPS manufacturers and operators is underdeveloped, and should include potential opportunities for EU industry to develop. The report should discuss to what extent the options will facilitate or not the transfer of EPS manufacturing from third countries to the EU. The report should also provide further analysis on the impacts of options on the potential to innovate, including potential trade-offs. It should, in particular, analyse any effects on how innovation, understood as product differentiation, could be affected if regulatory requirements would mean moving towards a more harmonised product population. For example, potential secondary impacts on innovation related to the lifetime of charged devices should be analysed.
|
|
Amendments made to the IA in response
|
|
The statement in section 2.3 that the intervention was ‘not expected to have any significant impact on competitiveness’ has been expanded to also state it is not expected to have any impact on EU manufacturing.
Text on the potential for innovation that refers to EU component manufacturers has been expanded in the competitiveness assessment with an example of a European company offering an innovative approach to reducing losses at 10% load has been added.
Text has been added in the competitiveness assessment explaining that no impact on innovation in end-use products is expected since alternatives are envisaged to be permitted in addition to the USB-C connector and protocol on EPS.
|
|
(2) The choice of the specific scoring system, including the choice of introducing scoring thresholds to compare alternative options, and the methodology behind the applied rankings should be clarified and justified, as the scoring system plays a crucial role in determining the comparison and prioritisation of options. The validity of setting thresholds when absolute (or normalised) values already exist should be better justified.
|
|
Amendments made to the IA in response
|
|
The details of the scoring system are explained in section 7.4. Since the conversion of estimated values for effectiveness and efficiency into scores based on thresholds could affect the final rankings a sensitivity test has been added in section 9 of Annex 13 showing that this has no material impact on the preferred option and limited impact on the other final rankings.
|
|
(3) While the revised report presents the assumptions and a comprehensive sensitivity analysis with respect to the two behavioral assumptions on the reaction of the consumers to improved interoperability and the uptake of manufacturers of the voluntary unbundling, the report could be quantitatively corroborated with available evidence and the likelihood of their realisations/deviations based on available studies and analyses not necessarily directly related to the EPS but to the wider ecodesign framework.
|
|
Amendments made to the IA in response
|
|
A completely new Annex 16 has been added to the IA that provides background information from a variety of sources on consumer interest in prolonging the use of products that provide a basis for the range of assumptions covered in the EPS reuse sensitivity tests.
|
|
(4) While the report provides ample description of the content of the options in the annexes, it would benefit from a summarised description in the main body of the report, as well as why the different measures were combined to form the options as presented. The report could also more clearly explain whether there are gaps in the coverage of products due to the legal framework and/or technical constraints, including whether other legal instruments to address such gaps may be available.
|
|
Amendments made to the IA in response
|
|
A summary of the measures has been included in the start of section 5 of the IA. Additional text has been included in the discussion of the scope extension in Annex 10 section 2, that explains how e-bike chargers are being addressed in other EU legislation.
|
|
(5) While the contribution to the EU energy efficiency target is not an objective of the initiative in itself, it could nevertheless be estimated for the options as part of the analysis of expected impacts.
|
|
Amendments made to the IA in response
|
|
Table
62
has been added to Annex 17 showing the 2035 electricity savings under all POs represented as a proportion of the final energy savings required by 2030 under the EED target.
|
|
(6) The revised report should include in its Annex 3 the obligatory table with costs and cost savings related to the One In, One Out approach, as total estimates (not in unit costs).
|
|
Amendments made to the IA in response
|
|
The obligatory table on total One-in One-out costs has been added in Annex 3.
|
4.Evidence, sources and quality
The main evidence gathering for this impact assessment has been carried out under a contract by BioIS and Fraunhofer IZM consultants. This has been supplemented by a public consultation and meeting of the Consultation Forum. Bilateral meetings with industry have provided valuable insights and helped to verify assumptions.
The impact of the different policy options were modelled as part of the support contract based on assumptions about sales, stock, consumer behaviour and product prices. Assumptions for electricity prices, GHG intensity and fuel use for electricity generation were taken from PRIMES scenarios to ensure coherence and consistency of the impact assessment baseline scenario with existing energy policies. Pollutant emissions from electricity generation are taken from EEA data.
Because most EPS are sold bundled with other products the assumptions on total sales and value cannot be considered robust. Sensitivity tests were used to verify that these factors do not have significant consequences for the choice of preferred option. Consumer behaviour with greater EPS interoperability is also uncertain. This is highly relevant to the overall results and sensitivity tests have been performed to illustrate the impacts.
Annex 2: Stakeholder consultation (Synopsis report)
Stakeholder information has been gathered in a variety of ways.
1.A
Call for Evidence
was published and feedback was sought from 6 April till 4 May 2022. A first Consultation Forum meeting was held in
February 2023
.
The main issues raised are outlined below:
General issues
Concern was raised by ECOS about limitations of the “Back-to-back evaluation” procedure. In particular the risk of insufficient opportunities for stakeholder comments to be provided and considered. Concern was also expressed that technical analysis could be neglected without multiple opportunities for stakeholder input.
ECOS strongly support work on circular economy and interoperability but wisht to ensure that the Article 7 review clause aspects are analysed during the review as intended.
Scope extension
Both ECOS and ANEC / BEUC requested that the scope of the regulation should be expanded. Specific aspects mentioned were: high power EPS (covered by US DOE); Active Power over Ethernet injectors and EPS used with products not included in Annex I.
Interoperability
A substantial number of views were expressed about interoperability.
Scepticism was expressed by APPLiA on the grounds of differing safety and electromagnetic compatibility requirements and standards and challenges relating to certification.
Digital Europe challenged USB-PD requirements, among other things claiming on technical grounds that these power supplies are not suitable for the products which are not battery powered.
EPTA-EGMF and EPBA in principle agreed to inter-operability requirements, provided that they do not apply to products intended to be charged outdoors.
While not opposing interoperability, ANEC / BEUC stated that it was important to look at minimum requirements to address these issues. They consider it important to fully assess how consumer use patterns might change with interoperability and the potential for purchase of refurbished products and used devices on the second hand market.
FRIWO indicated that requiring from an EPS to be IPX4 protected and designed to be operated in a wet environment would increase its cost by several Euro.
In favour were the European Anti-Poverty Network Nederland.
The IARU also welcomed regulations for a universal EPS and unbundling as set out in the Common Charger initiative.
One EU citizen stated that while products may more expensive, in the end, the costs for the economy will be lower. While in favour of fewer rules and a voluntary approach this citizen stated that rules would be needed for EPS to be standardised and flexible.
Another EU citizen stated that with the existence of USB Extended Power Range there is no barrier to interoperable EPS although with some exceptions needed. They claimed the main benefit would be lower CO2 footprint and there should be no loopholes for power supplies less than 240W. The same citizen stated that cables must not be fixed to the EPS but are consumables.
ITI argue for a voluntary approach to common charging. They note the voluntary approach to common charging through memoranda of understanding (MOUs) and industry collaboration. They claim this approach fosters innovation and convergence, while providing consumers with safe, increasingly interoperable options. They refer to the 2021 IA statement that most mobile phones and EPS are interoperable. ITI state the market has demonstrated commitment with broad adoption of the latest USB technologies enabling more interoperable, energy‐efficient and smart charging handling the power needs of different devices. ITI argue that regulation in multiple legal instruments risks fragmentation and inconsistencies. They favour a voluntary approach based on internationally-agreed standards such as the EN IEC 63002 standard for common charging interoperability.
Unbundling
APPLiA stated that safety standards often require the EPS to be sold bundled with the product.
ITI oppose a universal unbundling requirement arguing that it would be expensive as a result of requiring separate shipping of EPS and product and lead to excess packaging and transport CO2 emissions and more ICs in the EPS. They also argue that there are different technical requirements for different types of products including some permanently connected.
ANEC / BEUC argue that consumers should be given an informed choice whether or not to buy a new EPS when a device is purchased. They also argue that the potential impact of obligatory unbundling on resource savings should be analysed.
An EU citizen argued that devices must not be sold in the EU with EPS.
Minimum energy efficiency at 10% load
Views were split on the desirability of addressing 10% load efficiency.
APPLiA argue that there is no benefit as operation at this load is very limited and battery charging shuts off before that low output.
ITI argued that 10% load efficiency should be aligned with U.S. DoE requirements.
In contrast ECOS and ANEC/BEUC stated that it was important to look at the 10% load level. Further energy savings are possible and interoperability will mean that EPS are increasingly likely to be used at lower loads. It was also noted that in the previous review it was claimed there was insufficient evidence for setting 10% load efficiency requirements. The 10% load efficiency information requirement was included to provide that data.
Energy efficiency at other load points
ECOS consider it important to consider a metric setting minimum efficiency requirements at each loading points (10%, 25%, 50%, 75% and 100%) without averaging them.
APPLiA and Digital Europe require alignment with the measurement method of the US DoE which considers only the highest and the lowest voltage.
Energy efficiency requirements for wireless charging
There was general support for the intention to introduce active energy efficiency limits for wireless charging and the energy savings potential of this.
APPLiA stated it was necessary to differentiate active energy efficiency requirements with transmitted power. Absolute savings potentials are much higher for high-power applications. APPLiA also stated that the coupling factor is a relevant parameter for wireless charging. Active efficiency doesn’t only depend on circuitry. These factors are influenced by device size and geometry and can’t solely be optimised for energy efficiency. It proposed to differentiate efficiency requirements by the coupling factor, and set harmonised requirements for determining it. APPLiA also state that product-group specific safety requirements may impact active energy efficiency. Appliances that need to withstand environmental stresses require safety measures and these need to be taken in account.
ITI are concerned that regulation of wireless charging on the EPS side must be coordinated with regulation on the device side to avoid conflicting and counter-productive regulations. If pursued wireless charging regulation should be based on voluntary harmonised standards.
ANEC/BEUC and ECOS stated that wireless charging is becoming increasingly popular. The possibility of introducing energy efficiency and information requirements for wireless chargers needs to be assessed in light of the wide range of performance. US DoE is currently developing a rulemaking to address wireless charging.
Consumer information
ECOS believe that minimum information requirements for cables and EPS need to be set to provide consumers with the information they need and avoid confusion.
USB-PD limits
A number of responses refer to limits of USB-PD. The Hager Group noted that there are many uses requiring voltage or voltage/current combinations not provided by it. Also EPS located in electrical installations powering will not be able to comply with USB EPS since they transmit data on the same wires as the power.
ANEC/BEUC stated it was important to ensure consistency between the new ecodesign rules and the Radio Equipment Directive to ensure interoperability of fast charging technology across EPS.
ANEC/BEUC agree on the need to introduce information requirements and require compliance with USB-PD specifications for all or a subset of EPS under the revised scope.
An EU Citizen also stated their support for common EPS for low-power devices but not for higher power devices.
International aspects
ITI argue in favour of developing harmonised EU standards based on international standards such as IEC 63002 and IEC 62680-x USB standards. Any additional requirements not covered by these should be focused on the EPS rather than the device. ITI argue that manufacturers must be able to use the latest versions of international standards in products provided to the EU market to allow for innovation and improvement. They also argue for allowing the use of legacy USB-A connectors and USB Type-C(r) connectors during the transition.
ITI state that any pictogram or other information requirements for EPSs should be developed in coordination with equivalent device-side requirements. Such requirements should be developed in close cooperation with industry experts.
Voluntary adoption of the IEC/EN USB common charging interoperability standards is argued to be the best approach by ITI to best support market implementation across a wide product range while enabling innovation. There is no need for a unique EU EPS certification requirement. Any EU logo or certification requirements must be aligned with USB-IF charger certification and logo program.
ITI state that consideration is needed for information requirements to support consumer understanding for EPSs implementing proprietary charging protocols in addition to USB-PD.
Starkey Laboratories state that EPS efficiency and environmental regulations should be harmonised globally. This condition is achieved by current Level VI requirements. Higher efficiency should be harmonised with North American, Asian, and Australian requirements.
Spectrum pollution
The IARU noted the potential of switching EPS, to contribute to spectrum pollution as assessed in the evaluation of the EMC Directive. A report by EMC ADCOs showed only 56% of devices tested met the technical emissions compliance tests. They noted that lacking standards for cables can result in poor quality and testing requirements should therefore reflect typical EPS use cases with associated cabling. An EU citizen also raised the problem of harmonic interference.
Spare parts
Nintendo stated that the provision of spare parts should be excluded from the requirements.
Timing
The Hager Group noted that EPS requirements have recently been adapted to the requirements of the previous regulation adopted in 2019. Industry needs stability and they oppose any change.
Applia and Nintendo requested that an adequate period be allowed between publication of the regulation and the deadline for application of the requirements to allow manufacturers time to implement changes.
2.Additional bilateral contacts have taken place with industry and regulatory bodies. A second Consultation Forum meeting was held in
November 2023
.
The main issues raised are outlined below:
APPLiA stresses the need for sufficient transition periods (2 years for energy efficiency, 5 years for interoperability) in the EPS regulation. They oppose splitting battery chargers, citing efficiency concerns. APPLiA suggests clarifications to definitions and recommends different transition periods for compliance. They oppose a minimum efficiency requirement at 10% load and provide recommendations for clarifications and amendments to various points in the annexes, emphasizing the importance of clarity and addressing potential challenges with proposed requirements.
Austria advocates for prompt finalization of ecodesign regulations for external power supplies by Q1/24, prioritizing resources for higher-energy-saving product groups. They support exemptions for EPS for electric bikes and those with water ingress protection above IP0. Additionally, they endorse introducing energy efficiency requirements for the 10% load level and wireless chargers, emphasizing the need for clear packaging and nameplate information to aid product selection and proposing a durability requirement of at least 10 years of continual operation at maximum power, aiming to balance energy efficiency improvements with simplicity and consumer guidance.
CECAPI, the European Committee of Electrical Installation Equipment Manufacturers, suggests clarifications on scope, extension of transition periods, adjustments for active Power Over Ethernet injectors and fixed home/building power distribution systems, and refinement of definitions for low voltage and multiple voltage external power supplies. They also propose changes regarding containing products, markings, durability requirements, and precision of power and voltage. CECAPI urges alignment with existing regulations, practicality, and market competitiveness.
DIGITALEUROPE emphasises the importance of these supplies in various IT equipment, they express concerns about the proposed requirements, which could necessitate redesigning most existing products, leading to disruptions in availability and an increase in non-compliant products and waste. They stress the need for proper testing methods and standards to ensure enforceability, safety, energy efficiency, and minimal costs. Technical recommendations include durability/reliability, energy efficiency at 10% load, and marking requirements, although some are still under assessment due to the diverse applications and sectors involved. In the same context Apple explained potential issues related to the peak power demand of certain end-devices and outlined potential challenges for end devices due to the limited voltage/current combinations of the USB-PD standard.
Denmark highlights several issues that the Commission should consider, including lacking requirements on active efficiency of wireless charging, tighter active efficiency requirements due to new semiconductor technology, and information requirements related to wireless chargers and charging pads. They also emphasise the need for durability requirements, repairability, and clear marking of plastic parts to facilitate plastic sorting. Additionally, Denmark supports requirements on design for disassembly to allow for the separation of key components such as capacitors for proper waste treatment.
ECOS, EEB, Deutsche Umwelthilfe, and Coolproducts applaud the widened product scope and improved efficiency requirements proposed for external power supplies. It supports measures like EPS durability standards and limitations on non-compliant EPS sales. However, it raises concerns regarding scope exemptions for industrial supplies, unclear definitions of wireless chargers, and enforcement issues. The paper recommends clarifying definitions, aligning enforcement transition times, and strengthening efficiency standards while urging for clearer regulations to address ambiguity. Additionally, it calls for supplementary studies to bolster market surveillance and quantify energy consumption variations in wireless charging compared to wired alternatives.
EPSMA highlights uncertainties regarding the 10-year lifespan requirement, emphasizing differences in application areas and challenges in defining "end of life." They stress intrinsic and extrinsic factors influencing EPS lifespan and note the lack of standardized calculation methods. EPSMA opposes mandating a minimum EPS lifespan, advocating for market regulation and highlighting challenges in verifying MTBF (Mean Time Between Failures) figures. They underscore that MTBF alone does not reflect durability or quality, offering to discuss their position further and inviting Commission representatives to a meeting.
EPTA and EGMF argue against extending the regulation to include power tools and garden machinery due to environmental and economic concerns. They oppose mandating separate USB power supplies for battery chargers, citing efficiency, material, and EMC issues. They also highlight inconsistencies in exemptions and interoperability requirements, proposing revisions for clarity. Overall, they call for a balanced approach that considers industry-specific challenges and consumer needs.
FRIWO highlights challenges in transitioning to USB power supplies, especially for applications requiring >5A currents, noting efficiency loss and increased costs. They recommend extending spare parts availability to prevent premature scrapping of applications, and aligning transition periods with international standards. They raise concerns about efficiency requirements' stringency and advocate for a 48-month transition period for application redesigns to minimize resource waste. Additionally, they propose exclusions for certain products like DIN-rail power supplies and one-stage battery chargers from USB requirements, citing practicality and environmental concerns. FRIWO also raises issues with durability requirements, suggesting considerations for ambient temperature, verification methods, costs, load points, and MTBF calculations. They recommend removing surge requirements and support flexible testing methods based on manufacturer specifications.
Germany emphasises the importance of adequate transition periods and exemptions tailored to commercial and industrial power supplies. They stress the need for clarity in definitions such as "nameplate output power" and "peak power demand," proposing clearer criteria to avoid ambiguity. Moreover, Germany recommends reevaluating durability requirements, suggesting a more realistic approach that balances longevity with cost-effectiveness. They highlight the necessity for precise information requirements, instruction manuals, and technical documentation to ensure compliance and clarity for manufacturers and consumers alike. Additionally, they advocate for standardization in cable length and cross-sections, aligning with international standards for consistency and interoperability.
Gigaset expresses deep concern over safety and technical issues in the current draft of the working document supporting the revision of Commission Regulation (EU) 2019/1782. Highlighting critical problems with USB-EPS, including safety conflicts with EN 62368-1 standards, failure to meet resistibility requirements, audio distortion from ground loops, and unsuitability for devices requiring continuous 24/7 power supply, Gigaset proposes modifications to eliminate landline-connected devices from the scope, extend the transition period for charging cradles EPS to a minimum of four years, and make an exception for EPS as spare parts for devices under 2023/1670 regulations, aiming to mitigate adverse environmental and economic impacts.
JBCE and JP4EE raise concerns about durability and resistibility requirements, proposing nuanced criteria instead of uniform standards. They suggest modifications to the definition of 'audio equipment' and advocated for a longer grace period for service parts. Additionally, they raise issues with the scope expansion, call for a sufficient transition period for implementation, and recommend against displaying efficiency on nameplates.
Märklin suggests exempting electric trains from mandatory USB-PD supplies due to safety concerns. Electric trains, including both toy and model versions, historically use safety transformers without a protective earth connection for galvanic insulation. In contrast, USB-PD supplies often have a protective earth connection, which could pose safety risks, especially when powering insulated track sections. Therefore, exempting electric trains from USB-PD requirements is advisable to ensure safety in their operation.
The Netherlands emphasise stricter specifications for exemptions, aligning entry into force of requirements, seeking alignment with US DOE standards, advocating for efficient verification of durability requirements, proposing separation and alignment of circumvention and software update articles, and suggesting adjustments to information requirements regarding USB power delivery markings.
STIHL raises concerns regarding the proposed requirement for battery chargers with a rated input power < 240 W to be supplied by USB sources. They argue that this would reduce charging system efficiency, contravening energy efficiency goals and increasing lifecycle costs. They provide a case study comparing the efficiency of USB-powered and mains-powered battery chargers, showing a significant efficiency loss with USB charging due to voltage conversion and cable losses.
STMicroelectronics remind that PPS is an optional feature of USB-PD, initially intended for battery charging, that comes with significant additional complexity and cost, while AVS starts at 9V/27W to allow low cost EPS below that threshold. They also challenge the exceptions proposed for high voltage / low current demand, and the durability requirements.
Sweden welcomes the scope enlargement to include various products and supporting increased energy efficiency requirements. However, concerns are raised about overly stringent requirements for multiple voltage output and questions are posed regarding the exception for chargers of batteries in light mobility means and the differing energy efficiency requirements based on maximum current level. Additionally, Sweden suggests extending the timeframe for implementation to accommodate product redesign and production. It supports interoperability and information requirements but seeks clarification on the verifiability of durability requirements.
USB-IF explains in detail the USB-PD power curve and other relevant details from the USB standards, including the specific features PPS and AVS. In particular they stress the backwards compatibility of the standards and expressed concerns about referring to specific revisions in the regulatory text. The position is supported also by Granite River Labs.
ZVEI followed among others by Arburg, Beckhoff, Emerson, EPSMA, Inpotron, Phoenix, Puls, Siemens and TDK advocate for maintaining the exemption of commercial and industrial power supplies from EU Regulation 2019/1782. They argue that these power supplies are optimized for specific operating points and unlikely to achieve energy savings if considered independently. ZVEI emphasizes that factors like additional functions and energy-saving measures make the "no-load" state irrelevant for these power supplies. They warn against approving the proposal as is, stating it would disadvantage European producers and customers without providing additional benefits.
Annex 3: Who is affected and how?
Practical implications of the initiative
The initiative will concern all of EU population, manufacturers of electronic devices for consumer and office use as far as these are powered or potentially powered by external power supplies in a power range up to 250W, and manufacturers of external power supplies. Further, there will be a relevant impact on retailers.
Consumers: the initiative will directly affect all users of electronic devices with EPS in scope of virtually all EU citizens who, without this initiative, would continue using electronic devices with a proprietary or legacy types of connectors. In the short term, they may suffer inconvenience, if manufacturers increasingly offer unbundled devices, i.e. selling end-devices without EPS, as intended by this initiative. This would result in a transitional phase that consumers need to pay attention, whether a device is sold with or without an EPS and if an already owned EPS is compatible with the power requirement of the purchased device. Over time consumers will be equipped with a sufficient number of interoperable EPS to get used to the option to purchase a device without EPS. Consumers will also benefit from the fact, that EPS costs even with implementing USB compatibility at least remain stable, given that the significantly higher mark-ups seen in the market frequently for proprietary EPS would be obsolete, if an interoperable EPS could be sourced from various vendors. Further, as consumers occasionally face the situation, that an EPS is defect, but a replacement is not available, which then terminates also the use of the powered device, or that a device potentially could be reused, but the EPS got lost, this initiative would result also in some end devices being used for an extended period of time, saving consumers acquisition costs for new end-devices.
Manufacturers of electronic devices: Manufacturers of those devices covered already by the interoperability requirement of the amended Radio Equipment Directive will not face additional business impacts. Manufacturers of devices in scope of the interoperability requirements of this initiative would entail adaptation costs for the end devices to implement a USB Type-C receptacle and a circuitry for the negotiation process between EPS and powered device, and potentially to adapt internally the voltage level of the electronics circuitry to those supported by the USB-PD specification. The main impact is associated with necessity for such redesigns. Current product design and product development expenses could become stranded investments, if requirements stemming from the initiative are not considered by the manufacturers in due time. Mid- to long-term the manufacturers and suppliers would benefit from the cost reductions of unbundling, if the manufacturer decides to do this on a voluntary basis. This would reduce product costs significantly. Manufacturers would face additional logistics costs for shipping unbundled EPS (if they still continue to offer EPSs once these are interoperable), but it is expected that this would be more than compensated by the significant logistics advantage of product packages without EPS being significantly smaller in case of small devices (such as cordless phones, home network equipment, handheld devices, battery chargers etc.). This volume and weight savings effect is less relevant for larger end devices. Unbundling however is also related to business risks, given the uncertainty if consumers and other purchasers appreciate the option to purchase an unbundled device or if they just expect to get an EPS delivered with a product. Further risks arise from users potentially using non-compliant or low quality EPS with an end device, resulting potentially in liability and brand reputation issues. Manufacturers of external power supplies will need to readjust their product portfolio towards USB power supplies, which might result in further consolidation in the market. Actually, with less variety of EPS specifications, EPS design and production costs would as a tendency go down, given scaling effects. As the total number of sold EPS is expected to drop significantly, overall turnover of EPS manufacturers would be reduced.
SMEs: As there is a small share of European manufacturing SMEs in the market segment of consumer applications and office equipment, the effect on SMEs in particular will be very limited. Those SMEs being affected and supplying a comparingly smaller number of products to the market actually would benefit from this initiative and as a consequence a more widespread existence of USB and USB-PD EPSs in households, as they do not have to bear the costs of specifying and acquiring an EPS. This tendency is already seen for small gadgets, which are occasionally distributed without EPS already but with an USB receptacle. These product concepts definitely would benefit from this initiative. The standardisation of charging solutions would create a level playing field for companies. Refurbishers, which in their majority are SMEs, would benefit from this initiative, as lost EPS are frequently a problem for reselling used equipment. With this initiative in place, refurbishers easily could source replacement EPS or rely on the broad availability of interoperable EPSs. This initiative would stimulate the reuse and refurbishment market.
Retailers: Stationary and online retail would be challenged by the fact, that some products would be sold with, others without an EPS and consumers (see above) need to be clearly informed, what the package includes. Retailers, just as manufacturers, would face additional logistics costs for shipping unbundled EPS, but separate sales of stand-alone EPS would also yield additional revenue for retailers, although without the current significant mark-ups for proprietary EPS and cables. It is expected that there would be significant logistics advantage also for retailers as product packages without EPS can be significantly smaller in case of small devices. This volume and weight savings effect is less relevant for larger end devices. Overall, the impact on retailers and distributors is expected to be positive.
Public authorities: The impact would be associated with surveillance and enforcement of additional requirements. Given that control and surveillance systems are already in place, the marginal cost is expected to be negligible.
|
I. Overview of Benefits (total for all provisions) – Preferred Option PO6
|
|
Description
|
Amount
|
Comments
|
|
Direct benefits
|
|
Environmental benefits
|
GHG emissions reductions: 70kt CO2eq yearly
Energy consumption reductions: 2.45PJ yearly
e-waste reduction: 4.65 tonnes yearly
|
Incentivising the unbundling of EPS brings the biggest influence as regard to the reduction of the extraction of resources, manufacture, transport, use and disposal of the chargers.
Additional savings are due to the energy consumption related requirements.
Certain energy losses are due to the additional USB receptacles and USB cable resistances.
|
|
Consumer benefits
|
Purchase cost reductions: €101mln yearly
Electricity costs reductions: €33mln yearly
Consumer convenience of being able to use interchangeably an EPS for multiple applications, or when replacing a product.
Better quality of EPS due to durability requirements.
|
The interoperability and extended reliability of EPS will bring a reduction of the purchases of standalone EPS and cables.
Tightened (average active efficiency, no-load losses) and newly introduced (low-load) minimum requirements reduce electricity costs, but slightly increase EPS costs.
|
|
Economic benefits
|
End-device manufacturers: €19mln yearly saved EPS costs.
|
Additional turnover for refurbishment businesses (refurbishment of devices with lost EPS): No data
|
|
Indirect benefits
|
|
Extended lifetime of end-devices
|
Not quantifiable
|
Broad availability of compatible replacements EPS in case of EPS defects
|
Table 16 - Summary of costs and benefits
|
II. Overview of costs – Preferred option PO6
|
|
|
Citizens/Consumers
|
Businesses
|
Administrations
|
|
|
One-off
|
Recurrent
|
One-off
|
Recurrent
|
One-off
|
Recurrent
|
|
(a) Measure on interoperability – M2b
|
Direct costs for EPS
Direct cost for end-devices
|
With each new EPS and product purchase additional costs:
- €1.50 for EPS redesigned for USB
- €1 for USB cable
- €0.60 for surge protection of the USB EPS
- €0.60 - €2 for the USB compatibility of the end-device (for products re-designed for USB compatibility due to this regulation)
|
N/A
|
For manufacturers who already use USB Type C in the products in scope: N/A
For manufacturers who do not use USB Type C in the products in scope: Costs to redesign the charging circuitry of the equipment (mitigated by a transition period)
Savings on EPS costs in case device and EPS are unbundled (depending on output roughly €1–10 per device); initially additional EPS costs, if bundled, for USB vs. conventional EPS, cost increase expected to be absorbed by mass production synergies.
|
EPS redesigned, USB cable, surge protection.
Loss of turnover by worldwide industries and retail channels in EU of € 600mln yearly compared to the baseline.
Loss of revenue due to no further sales of over-priced proprietary replacement EPS.
|
Capacity for additional test requirements: negligible costs.
|
Not quantifiable
New test requirements to verify claimed USB compatibility, but less product models in the market to be expected.
|
|
|
Indirect costs
|
N/A
|
N/A
|
N/A
|
Losses in turnover due to slightly less end-device sales (those, which would otherwise been replaced due to a defect EPS): Not quantifiable
|
N/A
|
N/A
|
|
(b) Measure on reducing energy consumption – M4a
|
Direct costs
|
Increased EPS costs €0.04 - 0.18 per unit in average
|
N/A
|
N/A
|
Increased EPS costs per unit: €0.04-0.18
|
N/A
|
Additional tests costs for low-load: negligible
|
|
|
Indirect costs
|
N/A
|
N/A
|
N/A
|
N/A
|
N/A
|
N/A
|
|
(c) Action on durability of EPS – M6
|
Direct costs
|
Increased EPS costs €0.06 - 0.10 per unit in average due to higher lifetime electrolytic capacitors.
The costs for detachable cables, i.e. additional USB-C receptacle and cable plug are not singled out and are considered under the measure on interoperability (M2b)
|
N/A
|
N/A
|
Increased EPS costs per unit: €0.06-0.10
Loss of turnover by worldwide industries and retail channels in EU of € 100mln yearly compared to the baseline
|
Capacity for additional test requirements: negligible costs
|
New test requirements to verify claimed lifetime (time consuming test procedure), test costs roughly in the range of €100 per unit to be expected
|
|
|
Indirect costs
|
N/A
|
N/A
|
N/A
|
N/A
|
N/A
|
N/A
|
|
(d) Measure on externalisation of power circuitries of wireless chargers and single cell battery chargers
– M5
|
Direct costs
|
Additional EPS costs, if separate EPS is purchased with battery charger: €5.00 (for cylindrical cell chargers).
In the majority of cases use of an already existing EPS to be expected.
|
N/A
|
N/A
|
Additional costs on redesigning chargers for USB-compatibility, but also savings on bill-of-materials costs for chargers with (as of now) integrated AC-DC circuitry, might materialise as additional revenue.
|
N/A
|
New market surveillance actions on battery chargers
|
|
|
Indirect costs
|
No significant changes to actual charger costs expected
|
N/A
|
N/A
|
N/A
|
N/A
|
N/A
|
|
(e) Action on stand-by requirements for wireless chargers
– M4d
|
Direct costs
|
Increased wireless charger costs €0.15 per unit (average)
|
N/A
|
N/A
|
Increased wireless charger costs per unit: €0.15
|
N/A
|
New market surveillance actions on wireless chargers
|
|
|
Indirect costs
|
N/A
|
N/A
|
N/A
|
N/A
|
N/A
|
N/A
|
Table 17 - Overview of costs – Preferred option PO6
|
III. Application of the ‘one in, one out’ approach – Preferred option PO6
|
|
[M€]
|
One-off
(annualised total net present value over the relevant period)
|
Recurrent
(nominal values per year)
|
Total
|
|
Businesses
|
|
New administrative burdens (INs)
|
-
|
400 k€
|
400 k€
|
|
Removed administrative burdens (OUTs)
|
-
|
-
|
-
|
|
Net administrative burdens
|
-
|
400 k€
|
400 k€
|
|
Adjustment costs
|
as above
|
as above
|
|
|
Citizens
|
|
New administrative burdens (INs)
|
-
|
-
|
-
|
|
Removed administrative burdens (OUTs)
|
-
|
-
|
-
|
|
Net administrative burdens
|
-
|
-
|
-
|
|
Adjustment costs
|
as above
|
as above
|
|
|
Total administrative burdens
|
-
|
400 k€
|
400 k€
|
Table 18 - Administrative burden - costs - 'One in, one out'
Annex 4: Analytical methods
1.Methodology Approach
The impact assessment is based on an analytical model aligned with the Methodology for Ecodesign of Energy-related Products (MEErP). For the purposes of analysing the impacts, the product category is sub-divided into several Base Cases to represent the various market segments and end-applications powered by external power supplies. These are chosen as such because they represent sufficiently different characteristics or use-profiles.
Policy measures are assessed first on the product level to establish a Life Cycle Cost curve to determine the point of Least Life Cycle Costs. These are then used to guide the construction of policy options.
2.Model description
To be consistent with prior long-term projections, e.g. prior revisions of the ecodesign regulation for external power supplies and the Ecodesign Impact Assessment, the definition of these Base Cases incorporates these earlier definitions. Additional Base Cases have been introduced to allow for a granular modelling of policy options such as extending the scope, mandatory interoperability for all EPS in scope or only a sub-set, and mandatory externalisation of power supply circuitries. The Base Cases assessed in this impact assessment are listed in
Table
19
.
|
|
Base Cases: output power ranges and typical end-applications
|
|
a.
|
EPS ≤ 6W, low-V (e.g. mobile phone)
|
|
aa.
|
EPS ≤ 6W (personal care)
|
|
b.
|
EPS 6-10W (e.g. tablets, smart phones etc.)
|
|
c.
|
EPS 10-12W (e.g. small network equipment, set-top boxes)
|
|
d.
|
EPS 15-20W (e.g. portable devices, portable game consoles)
|
|
dd.
|
EPS 15W (personal care)
|
|
e.
|
EPS 20-30W (e.g. notebook computer)
|
|
f.
|
EPS 30-65W, multiple-V (e.g. multi-device univ. chargers)
|
|
g.
|
EPS 30-65W (e.g. high-end notebook computers)
|
|
h.
|
EPS 65-120W (e.g. high-end notebook computers)
|
|
i.
|
EPS 65-120W, multiple-V (e.g. stationary game consoles)
|
|
j.
|
EPS 12-15W (e.g. loudspeakers, sound systems)
|
|
kk.
|
Wireless chargers
|
|
ll.
|
EPS 9 W (for standard-cell battery chargers)
|
|
mm.
|
Internal power circuitry (in standard-cell table-top battery chargers)
|
Table 19: Base Case definitions
Each of the Base Cases is modelled in terms of bill-of-materials, distribution scenario, use phase impacts, end-of-life scenario, economic figures and stock and sales in an Ecoreport spreadsheet, which has been developed as a tool to apply MEErP consistently. In these Ecoreport spreadsheet individually the Business-as-Usual (BAU) and the other policy options are modelled per Base Case and for the years 2020, 2025, 2030, 2035, and 2040. A forecast beyond 2040 regarding the development of power supply technology and even more the power demands of the various end-applications is hardly possible and therefore not covered by this assessment.
The analytical model is divided into three different connected sub-models, each covering a different aspect of the analysis. The models are:
A Data input module containing raw data for sales, power consumption, energy efficiencies and other input data gathered from the sources available for the project. The data input model also includes the data to model the various policy options by providing parameterised entries for
-Electricity costs
-Impacts of changes in electricity grid mixes in the EU
-EPS lifetime
-EPS sales (as a calculated value following lifetime changes)
-Energy efficiency / energy losses in the various modes (loads)
-Time spent under the various loads depending on the end-application
-Product cost changes due to individual measures.
A Base Case module, calculating the effects of policy options for a given year per individual Base Case.
Finally, a scenario model aggregates all relevant impacts from the Base Case models for the study including, but not limited to:
-total consumer expenditure (purchase price and electricity costs);
-societal life cycle costs (consumer LCC and externalised damages);
-total energy consumption in the production, use phase, and end-of-life of the products;
-GHG emissions for the use phase, production and end-of-life, and all other environmental impact categories provided by MEErP;
-Generation of electronics waste.
3.Data sources, scaling and projections
Emission factors
Environmental indicators to assess impacts of the various options are those used in the MEErP EcoReport tool with some major adaptations: GHG intensity of electricity in the European Union is constantly declining and electricity consumption in future years has to be modelled with significantly reduced kg CO2eq/kWh values. Forecast data are provided by the European Commission as shown in
Table
20
.
|
GHG Intensity indicators
|
2020
|
2025
|
2030
|
2035
|
2040
|
2045
|
2050
|
|
GHG intensity electricity consumption (kg CO2eq/kWh)
|
0.227
|
0.192
|
0.090
|
0.029
|
0
|
0
|
0
|
Table 20 - Carbon intensity indicators of the EU electricity grid mix (source: European Commission 2023)
SO2 and particulate matter (PM) emissions are approximated with emission factors for electricity generation derived from EEA data. All other environmental indicators as regards the impact of electricity consumption is proportionally aligned with the GHG emissions, as a proxy for the level of fossil fuelled generation in the mix as shown in
Table
21
.
|
|
Product
|
Energy
|
Water
|
Waste
|
Emissions to Air
|
to Water
|
|
|
|
GER
|
electr
|
feedst
|
water proces
|
water (cool)
|
haz.
|
non-haz.
|
GWP
|
AD
|
VOC
|
POP
|
HM
|
PAH
|
PM
|
Metal
|
EUP
|
|
|
|
MJ
|
MJ
|
MJ
|
ltr.
|
ltr.
|
g
|
g
|
kg CO2eq
|
g SO2eq
|
mg
|
ng i-Teq
|
mg Ni eq
|
mg Ni eq
|
g
|
mg Hg/20eq
|
mg PO4 eq
|
|
MEErP as-is
|
Electricity per MWh
|
9000
|
9000
|
0
|
0
|
400
|
142
|
4638
|
384.2
|
1700
|
201
|
21
|
91
|
21
|
36
|
38.74
|
1700
|
|
2020
|
Electricity per MWh
|
9000
|
9000
|
0
|
0
|
296.7
|
105.3
|
3441
|
226.7
|
95.8
|
149
|
16
|
68
|
16
|
3.7
|
29
|
1261
|
|
2025
|
Electricity per MWh
|
9000
|
9000
|
0
|
0
|
249.7
|
88.63
|
2895
|
191.9
|
78.7
|
125
|
13
|
57
|
13
|
3.0
|
24
|
1061
|
|
2030
|
Electricity per MWh
|
9000
|
9000
|
0
|
0
|
196.7
|
69.84
|
2281
|
89.6
|
51.6
|
99
|
10
|
45
|
10
|
2.0
|
19
|
836
|
|
2035
|
Electricity per MWh
|
9000
|
9000
|
0
|
0
|
149.6
|
53.12
|
1735
|
29.3
|
31.3
|
75
|
8
|
34
|
8
|
1.2
|
14
|
636
|
|
2040
|
Electricity per MWh
|
9000
|
9000
|
0
|
0
|
103.1
|
36.58
|
1195
|
0
|
25.0
|
52
|
5
|
23
|
5
|
1.0
|
10
|
438
|
Table 21- Emission factors on electricity consumption applied in the analysis (sources: MEErP, European Commission 2023, EEA)
Electricity costs
Electricity costs vary over time. The best available forecast on future price developments is based on the PRIMES model shown in
Table
22
. Although some of the EPS in scope are used in offices and might also be used in other business environments the residential electricity costs apply to the vast majority of EPS uses in scope.
|
Electricity Rates used (€/kWh)
|
2020
|
2025
|
2030
|
2035
|
2040
|
|
RePower EU Scenarios - Opt3A
Households
|
0.176
|
0.192
|
0.250
|
0.242
|
0.224
|
Table 22 - Electricity costs 2020 - 2040 (Source: European Commission, 2023)
Stock data
Stock data is derived from prior analyses of the market, considering household penetration rates for most relevant applications, estimated data from industry associations for parts of the EPS market, most recent data from other impact assessments, i.e. the Common Charger Initiative and for Ecodesign and Energy Label Regulations for mobile phones and tablets, and considers forecasts in terms of end device power demands and trends towards fast charging for an increasing number of applications. This shift is implemented in the stock data by forecasting 700 million units (i.e. almost all EPS for smartphones, tablets and similar battery powered devices) being covered by Base Case d. EPS 15-20W in 2040 which without this shift towards fast charging would be allocated to Base Case b. EPS 6-10W. Effects of the amended Radio Equipment Directive (OJ L 315/30, 7.12.2022) are taken into account for the BAU scenario.
|
|
Stock (mln. units), year
|
|
Base Case
|
2020
|
2025
|
2030
|
2035
|
2040
|
|
a. EPS ≤ 6W, low-V (e.g. mobile phone)
|
117.99
|
87.41
|
54.28
|
23.07
|
10.24
|
|
aa. EPS ≤ 6W (personal care)
|
60.00
|
80.00
|
88.00
|
96.00
|
104.00
|
|
b. EPS 6-10W (e.g. tablets, smart phones etc.)
|
616.69
|
472.56
|
208.63
|
186.86
|
158.00
|
|
c. EPS 10-12W (e.g. small network equipment, set-top boxes)
|
589.03
|
597.15
|
601.50
|
605.24
|
609.00
|
|
d. EPS 15-20W (e.g. portable devices, portable game consoles)
|
144.70
|
327.87
|
630.80
|
683.08
|
734.77
|
|
dd. EPS 15W (personal care)
|
20.00
|
40.00
|
48.00
|
56.00
|
64.00
|
|
e. EPS 20-30W (e.g. notebook computer)
|
67.90
|
64.02
|
60.98
|
56.51
|
51.86
|
|
f. EPS 30-65 W multiple-V (e.g. multi-device univ. chargers)
|
4.23
|
9.12
|
12.74
|
17.48
|
22.15
|
|
g. EPS 30-65W (e.g. high-end notebook computers)
|
2.46
|
10.42
|
19.28
|
24.56
|
24.59
|
|
h. EPS 65-120W (e.g. high-end notebook computers)
|
21.90
|
14.16
|
5.48
|
0.02
|
0.00
|
|
i. EPS 65-120W multiple-V (e.g. stationary game consoles)
|
17.12
|
12.02
|
12.11
|
12.14
|
12.14
|
|
j. EPS 12-15W (e.g. loudspeakers, sound systems)
|
126.75
|
132.17
|
133.17
|
133.55
|
133.55
|
|
kk. Wireless chargers
|
97.80
|
157.50
|
253.66
|
408.51
|
408.51
|
|
ll. EPS 9 W (for standard-cell battery chargers)
|
2.40
|
2.40
|
2.40
|
2.40
|
2.40
|
|
Totals
|
1888.96
|
2006.80
|
2131.04
|
2305.42
|
2335.21
|
|
mm. Internal power circuitry (in standard-cell table-top battery chargers)
|
2.40
|
2.40
|
2.40
|
2.40
|
2.40
|
Table 23: Stock model BAU, EPS and related products, 2020-2040
Lifetime
Data on EPS use lifetime in a BAU scenario is derived from other impact assessments. i.e. the Common Charger Initiative and for Ecodesign and Energy Label Regulations for mobile phones and tablets. Estimates on product lifetimes for powered products are aligned with similar analysis by the US DoE for the US market. End device lifetimes are taken as a proxy under the assumption that currently the end of the use lifetime of the powered product typically also terminates the use of the EPS. Effects of the amended Radio Equipment Directive (OJ L 315/30. 7.12.2022) and the unbundling requirement are taken into account for the BAU scenario. The BAU forecast consequently is already based on an extended EPS lifetime for those products covered by the RED unbundling requirements. For some product segments the shift towards interoperable EPS will not be fully completed by 2030 (e.g. laptops), and the full lifetime extending potential will be reached only after 2030.
|
|
Lifetime (years)
|
|
Base Case
|
2020
|
2025
|
2030
|
2035
|
2040
|
|
a. EPS ≤ 6W low-V (e.g. mobile phone)
|
3
|
3
|
3.5
|
3.5
|
3.5
|
|
aa. EPS ≤ 6W (personal care)
|
4
|
4
|
4
|
4
|
4
|
|
b. EPS 6-10W (e.g. tablets, smart phones etc.)
|
3
|
3
|
5
|
5
|
5
|
|
c. EPS 10-12W (e.g. small network equipment, set-top boxes)
|
4
|
4
|
4
|
4
|
4
|
|
d. EPS 15-20W (e.g. portable devices, portable game consoles)
|
3
|
3
|
5
|
5
|
5
|
|
dd. EPS 15W (personal care)
|
4
|
4
|
4
|
4
|
4
|
|
e. EPS 20-30W (e.g. notebook computer)
|
5
|
5
|
6.5
|
7.5
|
7.5
|
|
f. EPS 30-65W multiple-V (e.g. multi-device univ. chargers)
|
5
|
5
|
5
|
5
|
5
|
|
g. EPS 30-65W (e.g. high-end notebook computers)
|
5
|
5
|
6.5
|
7.5
|
7.5
|
|
h. EPS 65-120W (e.g. high-end notebook computers)
|
5
|
5
|
6.5
|
7.5
|
7.5
|
|
i. EPS 65-120W multiple-V (e.g. stationary game consoles)
|
5
|
5
|
5
|
5
|
5
|
|
j. EPS 12-15W (e.g. loudspeakers, sound systems)
|
5
|
5
|
5
|
5
|
5
|
|
kk. Wireless chargers
|
4.5
|
4.5
|
4.5
|
4.5
|
4.5
|
|
ll. EPS 9 W (for standard-cell battery chargers)
|
6
|
6
|
6
|
6
|
6
|
|
mm. Internal power circuitry (in standard-cell table-top battery chargers)
|
6
|
6
|
6
|
6
|
6
|
Table 24: Lifetime BAU. EPS and related products. 2020-2040
Sales data
Sales figures are a result of the stock model combined with the lifetime data and forecasts. Resulting sales forecast is presented in
Table 25
.
For standard-cell battery chargers EBPA reports a sales figure of 1.6 million units in 2022 for EU-27. The model relies on the following estimations:
·Share wall-plugged: 25%
·Share 220V-wired (and thus subject to the externalisation requirement, see options below): 25%
·Share already compatible with USB-EPS (i.e. assumed sold without EPS): 25%
·Share with conventional EPS: 25%
Base case ll represents those EPS for chargers, which are not yet USB-EPS. USB-EPS used with standard-cell battery chargers are included in other base cases. Base case mm covers the internal power circuitry of those table-top chargers, which are directly powered from 220V, i.e. ¼ of the chargers market. Forecast until 2040 is an estimated constant sales figure of 1.6 million chargers in the EU-27, thereof ¼ as wall-plugged units. Assumed lifetime of chargers is 6 years.
|
|
Sales (mln. units), year
|
|
Base Case
|
2020
|
2025
|
2030
|
2035
|
2040
|
|
a. EPS ≤ 6W low-V (e.g. mobile phone)
|
39.33
|
29.14
|
15.51
|
6.59
|
2.92
|
|
aa. EPS ≤ 6W (personal care)
|
15.00
|
20.00
|
22.00
|
24.00
|
26.00
|
|
b. EPS 6-10W (e.g. tablets, smart phones etc.)
|
205.56
|
157.52
|
41.73
|
37.37
|
31.60
|
|
c. EPS 10-12W (e.g. small network equipment, set-top boxes)
|
147.26
|
149.29
|
150.38
|
151.31
|
152.25
|
|
d. EPS 15-20W (e.g. portable devices, portable game consoles)
|
48.23
|
109.29
|
126.16
|
136.62
|
146.95
|
|
dd. EPS 15W (personal care)
|
5.00
|
10.00
|
12.00
|
14.00
|
16.00
|
|
e. EPS 20-30W (e.g. notebook computer)
|
13.58
|
12.80
|
9.38
|
7.53
|
6.91
|
|
f. EPS 30-65W multiple-V (e.g. multi-device univ. chargers)
|
0.85
|
1.82
|
2.55
|
3.50
|
4.43
|
|
g. EPS 30-65W (e.g. high-end notebook computers)
|
0.49
|
2.08
|
2.97
|
3.27
|
3.28
|
|
h. EPS 65-120W (e.g. high-end notebook computers)
|
4.38
|
2.83
|
0.84
|
0.00
|
0.00
|
|
i. EPS 65-120W multiple-V (e.g. stationary game consoles)
|
3.42
|
2.40
|
2.42
|
2.43
|
2.43
|
|
j. EPS 12-15W (e.g. loudspeakers, sound systems)
|
25.35
|
26.43
|
26.63
|
26.71
|
26.71
|
|
kk. Wireless chargers
|
21.73
|
35.00
|
56.37
|
90.78
|
90.78
|
|
ll. EPS 9 W (for standard-cell battery chargers)
|
0.40
|
0.40
|
0.40
|
0.40
|
0.40
|
|
Totals
|
530.59
|
559.01
|
469.34
|
504.52
|
510.67
|
|
mm. Internal power circuitry (in standard-cell table-top battery chargers)
|
0.40
|
0.40
|
0.40
|
0.40
|
0.40
|
Table 25 - Sales forecast BAU. EPS and related products. 2020-2040
Assumptions in relation to the Radio Equipment Directive
The following matrix provides an overview of the base cases which mainly contain products already covered indirectly by the interoperability requirements of the Radio Equipment Directive, and of those base cases which are not yet subject to interoperability requirements. Some of the latter are covered by the policy measure on interoperability, others are excluded from the interoperability scope.
|
Base Case
|
in scope (indirectly) of RED interoperability requirements
|
newly in scope under potential ecodesign interoperability requirements
|
out of scope of interoperability requirements
|
|
a. EPS ≤ 6W low-V (e.g. mobile phone)
|
x
|
|
|
|
aa. EPS ≤ 6W (personal care)
|
|
|
x
|
|
b. EPS 6-10W (e.g. tablets, smart phones etc.)
|
x
|
|
|
|
c. EPS 10-12W (e.g. small network equipment, set-top boxes)
|
|
x
|
|
|
d. EPS 15-20W (e.g. portable devices, portable game consoles)
|
x
|
|
|
|
dd. EPS 15W (personal care)
|
|
|
x
|
|
e. EPS 20-30W (e.g. notebook computer)
|
x
|
|
|
|
f. EPS 30-65W multiple-V (e.g. multi-device univ. chargers)
|
|
x
|
|
|
g. EPS 30-65W (e.g. high-end notebook computers)
|
x
|
|
|
|
h. EPS 65-120W (e.g. high-end notebook computers)
|
x
|
|
|
|
i. EPS 65-120W multiple-V (e.g. stationary game consoles)
|
|
x
|
|
|
j. EPS 12-15W (e.g. loudspeakers, sound systems)
|
|
x
|
|
|
ll. EPS 9W (for standard-cell battery chargers)
|
|
x
|
|
Table 26 - EPS already in scope (indirectly) of RED interoperability requirements, newly in scope under potential ecodesign interoperability requirements, and out of scope of interoperability requirement under both RED and potentially ecodesign, as represented by the base cases. NB: these represent a market segment under which, for simplifying the modelling, a range of products are covered, and should not be mistakenly interpreted as defining the scope of any given regulatory requirement.
Regarding stock and sales, the following table provides an overview the market shares that might be subject to new interoperability requirements.
|
|
2025
|
2030
|
2035
|
2040
|
|
Stock
|
|
|
|
|
|
in scope (indirectly) of RED interoperability requirements
|
49%
|
46%
|
42%
|
42%
|
|
newly in scope under potential ecodesign interoperability requirements
|
38%
|
36%
|
33%
|
33%
|
|
out of scope of interoperability requirements under both RED and potentially ecodesign
|
6%
|
6%
|
7%
|
7%
|
|
Sales
|
|
|
|
|
|
in scope (indirectly) of RED interoperability requirements
|
56%
|
42%
|
38%
|
38%
|
|
newly in scope under potential ecodesign interoperability requirements
|
32%
|
39%
|
37%
|
36%
|
|
out of scope of interoperability requirements under both RED and potentially ecodesign
|
5%
|
7%
|
8%
|
8%
|
Table 26: Market share of EPS already in scope (indirectly) of RED interoperability requirements, newly in scope under potential ecodesign interoperability requirements, and out of scope of interoperability requirements under both RED and potentially ecodesign
Fuel consumption for electricity generation
The fuel use avoided per MWh of electricity use avoided has been calculated from the energy mix of the PRIMES reference scenario. The resulting figures by fuel type and in total are shown in
Table
27
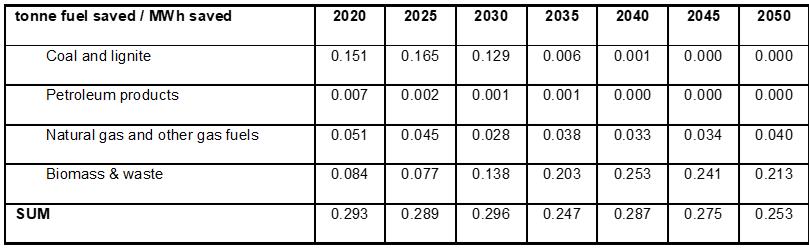
Table
27
below.
Table 27 - Fuel combustion per MWh electricity
Employment
To provide an impact of the scale of employment impacts of the policy options considered a simple approach is to assume that the impact of the measures on employment is proportional to the impact on turnover by each economic sector. While this approach fails to capture interactions between sectors and is an over-simplification it is considered adequate.
To indicate the likely scale of employment related to EPS manufacture for the EU market, data from a leading EPS supplier indicates an output of roughly 43,000 EPS per employee. For the EU sales figures above this means approximately 11,500 employees in the EPS manufacturing industry related to EU sales. The vast majority of these employees are employed in manufacturing outside the EU and a very small share of R&D, administration and sales employment is in the EU.
The key impacts of the policy options on employment will be seen in the electricity supply, retail sectors and the whole economy. To assess the scale of these, figures for employment and turnover by NACE sector are taken from Eurostat.
Table
28
shows the relevant employment intensities:
|
Employment per €mln turnover
|
|
All NACE
|
4.8
|
|
NACE C Manufacturing
|
3.6
|
|
NACE D Electricity. gas. steam and air conditioning supply
|
0.7
|
|
NACE G Retail
|
3.0
|
|
NACE G47.5.4 Retail electrical
|
4.4
|
Table 28 - Employment intensity by turnover
Based on these employment intensities an estimate of the likely effect on EU employment in electricity supply and retail as well as changes in the overall EU economy due to increased consumer purchasing power can be calculated.
4.Consideration of impacts of EPS harmonisation and voluntary unbundling on consumers and economic operators
Harmonisation of the EPS will likely have impacts on consumers and economic operators. Given current trends in the market it is assumed that manufacturers will voluntary unbundle products and EPS once EPSs are interoperable and widely available and in use in households. This observation is made for the smartphone market and some other markets (gadgets being sold without EPS but being chargeable through USB), but can be expected to be business practice once manufacturers can rely on the existence of USB EPS in households.
The expected extended use lifetime of interoperable and voluntary unbundling of EPS is 1.5 times the product lifetime for all relevant product segments. This factor is derived from a representative consumer survey as part of the Impact Assessment Study to Assess Unbundling of chargers asking for the willingness to purchase a device without EPS, in case an unbundled version is available, and the intention to purchase a stand-alone EPS with an unbundled product. Stand-alone EPS sales result in a measurable rebound effect. However, in average the consumer survey findings indicate that one out of two EPS will be reused for a second product use, resulting in a calculated average 50% longer EPS lifetime.
For the data model the number of EPS in stock is assumed to remain the same as a conservative assumption as several products in practice might share the same EPS. The modelled effect is solely the effect of reusing an EPS for another following product with compatible power requirements. The sales figures per Base Case are modelled to decline accordingly as an effect of same stock. longer lifetime.
The stock model established by the Impact Assessment Study to Assess Unbundling of Chargers indicates that the EPS use lifetime will be extended by 50% in average. Lifetime extension for EPS for mobile phones / smartphones and tablets is slightly more than these 50% as these devices are also forecasted to be used longer given the Ecodesign and Energy Label requirements recently adopted. A 50% lifetime extension is also a plausible assumption for EPS for small ICT devices under the Radio Equipment Directive, such as digital cameras, fitness trackers, smart watches, bluetooth loudspeakers and similar as they all feature similar charging power requirements and will benefit from interoperable chargers, i.e. EPS.
·in the central scenario EPS reuse is done in 1 out of 2 cases, i.e. EPS use lifetime is in average extended by a factor 1.5.
As the actual consumer willingness to purchase products without EPS, to reuse existing EPSs, and the manufacturers business strategy to provide products without EPS is based solely on surveys and observations in some selected markets the assumption of a 50% longer use lifetime for each EPS is subject to some uncertainty. A sensitivity analysis assumes that
·in a worst-case scenario EPS reuse is done only in 1 out of 4 cases, i.e. EPS use lifetime is in average extended by a factor 1.25 (i.e. half the rate assumed in the central case)
·in a moderate best-case scenario 3 out of 4 EPSs are reused once for a second product and every EPS reuse replaces one new EPS purchase (i.e. product lifetime is extended by a factor of 1.75 instead of 1.5 in the central case). This scenario also covers better the assumed effect of parallel use of an EPS in an household for several devices. In the model however this is calculated with still a non affected stock, but 1.75times the EPS use lifetime, i.e. correspondingly lower sales figures. Technically an effect, where each EPS is used for multiple devices in parallel and consecutively is feasible, but will face constraints in daily life due to inconvenience and lost EPSs.
Interoperability of EPS technically enables unbundling of EPS from the products they power, which producers may then wish to practice on a voluntary base. Voluntary unbundling of EPS from the products they power allows producers high degree of control over the impacts on their own products and business by the degree and extent of unbundling.
For mobile phones, most economic operators in the sector are big companies located outside the EU. and several of them already offer unbundling. There are also a few small mobile phone manufacturers that are based in the EU (IA Unbundling 2021). Most of these manufacturers already practice voluntary unbundling, i.e. they sell their smartphones without EPS - one manufacturer even without a cable as the default setting - even though not necessarily for all their models. Voluntary unbundling was also observed for e-readers (predominantly) or digital cameras (partially). For other products than the above, unbundling is hardly practiced (IA Unbundling 2021).
As a legally required harmonisation and respective information for customers reduces uncertainties as to the interoperability of EPS, it might encourage more customers to select unbundling options where offered. For products in the scope of the revised RED, which may require producers to offer an unbundling option. the current degree of customers opting for unbundling may thus increase and reduce producers’ economic benefits arising from sales of products with EPS. There are however no data available that would allow quantifying these impacts for producers.
Producers of products outside the RED but within the scope of the revised directive who so far have not offered unbundling might be incentivized to offer their products without EPS voluntarily, or customers may ask them to offer it. Improved interoperability and information might motivate customers to choose these options. which would reduce producers’ economic profits. As unbundling would be voluntary for these producers, it can be assumed that they would avoid unbundling beyond a degree where it might have severe impacts on their business.
Manufacturers of EPS would be affected if the number of EPS sold decreases. For telecommunication, around 100 companies manufacture power supply units with an estimate turnover in 2020 of 154 million EUR including only turnover from sales of chargers. On average, there were around 1900 people in the EU employed in the production of chargers. Unbundling reducing the number of EPS sales affects the firms’ turnover and therefore may have wider macroeconomic implications on production and employment. However, given the small size of the market, the significance of the impact on employment in the EU would be low (IA Unbundling 2021).
Unbundling will probably also affect traders. They generate their incomes from profit margins in relation to product prices, and these profits would decrease provided that ErPs sold without EPS are cheaper than those sold with EPS. A minor portion of these losses may be compensated by higher sales of separate EPS. There are however no data available to quantify these impacts for traders.
5.Modelling Data for the Assessment of Policy Measures and resulting Policy Options
M1 - Scope extension
As certain options to extend the scope to EPS, such as those for charging e-bikes and for lighting products, were omitted after further evaluation, and as the effect on some other products depends on the mandatory externalisation of the power circuitry, the sole extension of the scope does not change any stock model assumptions.
M2 - Requiring compatibility with USB-PD specifications to increase interoperability
EPS powering RED devices are already (indirectly) required to be USB compatible. Under M2a they are subject only to additional information requirements which are discussed in Section
8.6
.
Under M2b, the expected extended use lifetime of interoperable EPS is 1.5 times the initially assumed product lifetime for all relevant product segments as shown in
Table 29
.
The number of EPS in stock is assumed to remain the same as a conservative assumption, as several products in practice might share the same EPS. The modelled effect is solely the effect of reusing an EPS for another following product with compatible power requirements. The sales figures per Base Case are modelled to decline accordingly as an effect of the same stock at longer lifetime.
|
|
Lifetime (years)
|
|
Base Case
|
2020
|
2025
|
2030
|
2035
|
2040
|
|
a. EPS ≤ 6W low-V (e.g. mobile phone)
|
3
|
3
|
3.5
|
3.5
|
3.5
|
|
aa. EPS ≤ 6W (personal care)
|
4
|
4
|
5
|
6
|
6
|
|
b. EPS 6-10W (e.g. tablets, smart phones etc.)
|
3
|
3
|
5
|
5
|
5
|
|
c. EPS 10-12W (e.g. small network equipment, set-top boxes)
|
4
|
4
|
6
|
6
|
6
|
|
d. EPS 15-20W (e.g. portable devices, portable game consoles)
|
3
|
3
|
5
|
5
|
5
|
|
dd. EPS 15W (personal care)
|
4
|
4
|
5
|
6
|
6
|
|
e. EPS 20-30W (e.g. notebook computer)
|
5
|
5
|
6.5
|
7.5
|
7.5
|
|
f. EPS 30-65W multiple-V (e.g. multi-device univ. chargers)
|
5
|
5
|
6.5
|
7.5
|
7.5
|
|
g. EPS 30-65W (e.g. high-end notebook computers)
|
5
|
5
|
6.5
|
7.5
|
7.5
|
|
h. EPS 65-120W (e.g. high-end notebook computers)
|
5
|
5
|
6.5
|
7.5
|
7.5
|
|
i. EPS 65-120W multiple-V (e.g. stationary game consoles)
|
5
|
5
|
6.5
|
7.5
|
7.5
|
|
j. EPS 12-15W (e.g. loudspeakers, sound systems)
|
5
|
5
|
6.5
|
7.5
|
7.5
|
|
kk. Wireless chargers
|
4.5
|
4.5
|
4.5
|
4.5
|
4.5
|
|
ll. EPS 60W (e.g. power tools, gardening tools)
|
6
|
6
|
7.5
|
9
|
9
|
|
mm. Internal power circuitry (e.g. EPS for power tools, gardening tools)
|
6
|
6
|
6
|
6
|
6
|
Table 29 - Lifetime M2 (where applicable)
Implementing USB results in additional losses due to the USB receptacles and cable, compared to conventional 2-wire DC cable: For the EPS, an additional USB receptacle resistance of 40mOhm and an additional USB cable (wires only) resistance of 80mOhm compared to a replaced hard-wired 2-wire cable resistance of 35mOhm (20AWG, 0.5mm2) results in a total additional resistance of 85mOhm. On the end device side, a 40mOhm USB receptacle has to be fitted instead of a 20mOhm barrel connector. This results in a total additional resistance of 105mOhm. The additional losses in W are calculated based on this resistance, and the power output modelled at low load and active load due to the assumed use profiles.
For table-top battery chargers implementing USB results in additional losses due to the USB receptacles and cable, compared to conventional 2-wire AC cable: For the EPS an USB receptacle resistance of 40mOhm and a USB cable resistance of 80mOhm compared to a replaced hard-wired 2-wire cable resistance of 18mOhm (17AWG, 1mm2) results in a total additional resistance of 102mOhm. On the end device side another USB receptacle with a resistance of 40mOhm has to be implemented instead of a 20mOhm barrel connector. This results in a total additional resistance of 122mOhm.
The calculated additional electrical losses are shown in
Table
30
.
|
Base Case
|
Additional power consumption due to USB implementation
|
|
|
Low load power output (W)
|
Active power output (W)
|
R (Ohm)
|
Typical I at low load (A)
|
Typical U at low load (V)
|
additional power loss at low load (W)
|
Typical I at active power (A)
|
Typical U at active power (V)
|
power loss at active load (W)
|
|
a. EPS ≤ 6 W low-V (e.g. mobile phone)
|
0.60
|
1.30
|
|
|
|
0
|
|
|
0
|
|
aa. EPS ≤ 6 W (personal care)
|
0.60
|
1.30
|
0.105
|
0.119
|
5
|
0.0015
|
0.259
|
5
|
0.007
|
|
b. EPS 6-10 W (e.g. tablets, smart phones etc.)
|
1.70
|
3.70
|
|
|
|
0
|
|
|
0
|
|
c. EPS 10-12 W (e.g. small network equipment, set-top boxes)
|
0.24
|
7.20
|
0.105
|
0.048
|
5
|
0.0002
|
1.440
|
5
|
0.218
|
|
d. EPS 15-20 W (e.g. portable devices, portable game consoles)
|
3.06
|
6.66
|
|
|
|
0
|
|
|
0
|
|
dd. EPS 15 W (personal care)
|
2.55
|
5.55
|
0.105
|
0.510
|
5
|
0.0273
|
1.110
|
5
|
0.129
|
|
e. EPS 20-30 W (e.g. notebook computer)
|
5.10
|
11.10
|
|
|
|
0
|
|
|
0
|
|
f. EPS 30-65 W multiple-V (e.g. multi-device univ. chargers)
|
6.12
|
13.32
|
0.105
|
0.408
|
15
|
0.0175
|
0.888
|
15
|
0.083
|
|
g. EPS 30-65 W (e.g. high-end notebook computers)
|
11.05
|
24.05
|
|
|
|
0
|
|
|
0
|
|
h. EPS 65-120 W (e.g. high-end notebook computers)
|
20.40
|
44.40
|
|
|
|
0
|
|
|
0
|
|
i. EPS 65-120 W multiple-V (e.g. stationary game consoles)
|
1.22
|
72.00
|
0.105
|
0.061
|
20
|
0.0004
|
3.600
|
20
|
1.361
|
|
j. EPS 12-15 W (e.g. loudspeakers. sound systems)
|
0.48
|
5.38
|
0.105
|
0.095
|
5
|
0.0009
|
1.08
|
5
|
0.122
|
|
kk. Wireless chargers
|
|
|
|
|
|
|
|
|
|
|
ll. EPS 9 W (for standard-cell battery chargers)
|
1.53
|
8.10
|
0.12
|
0.306
|
5
|
0.0112
|
1.620
|
5
|
0.315
|
Table 30 – M2 - Additional power losses due to USB implementation
M2b assumes the following additional costs:
·€0.60 due to the required surge protection design changes to make all interoperable EPS meet the requirements of network equipment.
·€1.50 for adaptation to the USB-C receptacle and USB-PD circuitry.
·€1 for the shift from an existing cable and connector to a USB cable.
The discarded interoperability measure for wet-use EPS considered an additional cost of €2.00 for all interoperable EPS due to the required IPx4 protection level.
Information requirements: the effect of an interoperability marking on the EPS is considered a means of information complementing the RED requirements and providing further clarity on compatible product – EPS combinations, but as the effect on the market cannot be quantified and the additional burden to add related markings on the product is considered minor, no changes to the stock model are implemented under measure M2a or M2b.
An information requirement on energy efficiency on the EPS nameplate has been discarded to avoid coherence issues with the DoE requirements, as the testing at different grid voltages may lead to slightly different results for the same product.
M3 - Minimum energy efficiency at 10% load
A minimum requirement set at 10%pt below current average active efficiency (policy option M3a) actually means banning very few outliers resulting in marginal improvements. It is expected that such a requirement increases efficiency at this load-point across the market by 0.04%pt at negligible costs.
M3b foresees a low-load threshold 6%pt below the revised active average efficiency defined under M4a, for EPS with an output power higher than 10W. Based on market statistics and adaptation of the cost analysis carried out by the US Department of Energy on EPS costs in relation to power consumption levels, efficiency and cost parameters per Base Case are modelled with the data provided in
Table 31
for M3a and M3b.
|
|
Measure M3a
|
Measure M3b
|
|
Base Case
|
market share below threshold
|
resulting efficiency gain across market
|
cost increase per non-compliant unit
|
cost increase across market
|
market share below threshold
|
resulting efficiency gain across market
|
cost increase per non-compliant unit
|
cost increase across market
|
|
a. EPS ≤ 6W. low-V (e.g. mobile phone)
|
100.0%
|
2.2%
|
0.04 €
|
0.04 €
|
N/A
|
0.0%
|
0.00 €
|
0.00 €
|
|
aa. EPS ≤ 6W (personal care)
|
100.0%
|
2.2%
|
0.04 €
|
0.04 €
|
N/A
|
0.0%
|
0.00 €
|
0.00 €
|
|
b. EPS 6-10W (e.g. tablets. smart phones etc.)
|
100.0%
|
2.1%
|
0.05 €
|
0.05 €
|
N/A
|
0.0%
|
0.00 €
|
0.00 €
|
|
c. EPS 10-12W (e.g. small network equipment. set-top boxes)
|
72.7%
|
2.8%
|
0.07 €
|
0.04 €
|
72.7%
|
2.8%
|
0.07 €
|
0.04 €
|
|
d. EPS 15-20W (e.g. portable devices. portable game consoles)
|
56.4%
|
1.2%
|
0.14 €
|
0.06 €
|
56.4%
|
1.2%
|
0.14 €
|
0.06 €
|
|
dd. EPS 15W (personal care)
|
56.3%
|
1.2%
|
0.12 €
|
0.07 €
|
56.3%
|
1.2%
|
0.12 €
|
0.07 €
|
|
e. EPS 20-30W (e.g. notebook computer)
|
32.1%
|
1.1%
|
0.24 €
|
0.08 €
|
32.1%
|
1.1%
|
0.24 €
|
0.08€
|
|
f. EPS 30-65W. multiple-V (e.g. multi-device univ. chargers)
|
17.8%
|
0.5%
|
0.48 €
|
0.09 €
|
17.8%
|
0.5%
|
0.48 €
|
0.09 €
|
|
g. EPS 30-65W (e.g. high-end notebook computers)
|
17.8%
|
0.6%
|
0.48 €
|
0.09 €
|
17.8%
|
0.6%
|
0.48 €
|
0.09 €
|
|
h. EPS 65-120W (e.g. high-end notebook computers)
|
10.1%
|
0.4%
|
0.80 €
|
0.08 €
|
10.1%
|
0.4%
|
0.80 €
|
0.08 €
|
|
i. EPS 65-120W. multiple-V (e.g. stationary game consoles)
|
10.1%
|
0.4%
|
0.80 €
|
0.08 €
|
10.1%
|
0.4%
|
0.80 €
|
0.08 €
|
|
j. EPS 12-15W (e.g. loudspeakers. sound systems)
|
81.3%
|
2.2%
|
0.09 €
|
0.07 €
|
81.3%
|
2.2%
|
0.09 €
|
0.07 €
|
|
kk. Wireless chargers
|
N/A
|
N/A
|
N/A
|
N/A
|
N/A
|
N/A
|
N/A
|
N/A
|
|
ll. EPS 9 W (for standard-cell battery chargers)
|
100.0%
|
1.8%
|
0.05 €
|
0.05 €
|
N/A
|
0.0%
|
0.00 €
|
0.00 €
|
Table 31: M3 - Low load efficiency and costs (where applicable)
M4 - Raising the minimum requirement on active average efficiency
and limiting stand-by losses for wireless chargers
Current average active efficiency requirements are listed below in comparison to those analysed by US Department of Energy as candidates for Level VII.
|
|
|
AC-AC external power supplies. except low voltage and multiple voltage output external power supplies
|
AC-DC external power supplies. except low voltage and multiple voltage output external power supplies
|
Low voltage external power supplies
|
Multiple voltage output external power supplies
|
|
Regulation (EU) 2019/1782
|
PO ≤ 1.0W
|
0.5 × PO/1W+ 0.160
|
0.5 × PO/1W+ 0.160
|
0.517 × PO/1W+ 0.087
|
0.497 × PO/1W+ 0.067
|
|
|
1 W < PO ≤ 49.0 W
|
0.071 × ln(PO/1W) – 0.0014 × PO/1W+ 0.67
|
0.071 × ln(PO/1W) – 0.0014 × PO/1W+ 0.67
|
0.0834 × ln(PO/1W) – 0.0014 × Po/1W+ 0.609
|
0.075 × ln(PO/1W) + 0.561
|
|
|
PO > 49.0W
|
0.880
|
0.880
|
0.870
|
0.860
|
|
M4a - US DoE CSL1
|
PO ≤ 1.0W
|
0.5 × PO/1W+ 0.169
|
0.5 × PO/1W+ 0.169
|
0.517 × PO/1W+ 0.091
|
0.497 × PO/1W+ 0.067
|
|
|
1 W < PO ≤ 49.0W
|
0.0582 × ln(PO/1W) – 0.00104 × PO/1W+ 0.727
|
0.071 × ln(PO/1W) – 0.00115 × PO/1W+ 0.67
|
0.0834 × ln(PO/1W) – 0.0011 × Po/1W+ 0.609
|
0.0782 × ln(PO/1W) – 0.0013 × Po/1W + 0.643
|
|
|
PO > 49.0W
|
0.902
|
0.890
|
0.880
|
0.885
|
|
M4b - US DoE CSL2 Top 50%
|
PO ≤ 1.0W
|
|
0.5 × PO/1W+ 0.169
|
0.517 × PO/1W+ 0.091
|
0.497 x PO/1W + 0.067
|
|
|
1 W < PO ≤ 49.0W
|
|
0.0617 × ln(PO/1W) – 0.00105 × PO/1W+ 0.704
|
0.0741 × ln(PO/1W) – 0.00105 × PO/1W+ 0.643
|
0.0782 × ln(PO/1W) – 0.0013 × Po/1W + 0.643
|
|
|
PO > 49.0W
|
|
0.895
|
0.885
|
0.885
|
|
M4c - US DoE CSL3 Best In Market
|
PO ≤ 1.0W
|
|
0.5 × PO/1W+ 0.169
|
0.517 × PO/1W+ 0.091
|
0.497 x PO/1W + 0.067
|
|
|
1 W < PO ≤ 49.0W
|
|
0.0582 × ln(PO/1W) – 0.00104 × PO/1W+ 0.727
|
0.0706 × ln(PO/1W) – 0.00104 × PO/1W+ 0.666
|
0.0861 × ln(PO/1W) – 0.00169 × Po/1W + 0.642
|
|
|
PO > 49.0W
|
|
0.902
|
0.892
|
0.895
|
Table 32: Active average efficiency requirements: as per Regulation (EU) 2019/1782; M4a - aligned with US DoE CSL1; M4b - aligned with CSL2; M4c - aligned with CSL3
Modelling costs and use phase impacts of M4a, M4b and M4c are provided in
Table 33
and
Table
34
.
|
Base Case
|
Average active efficiency
|
|
|
Policy measure M4a (US DoE CSL1)
|
Policy measure M4b (US DoE CSL2)
|
|
|
market share below CSL1
|
average MPC to reach new level
|
average MPC increase across Base Case segment
|
average efficiency increase across market
|
delta level VI vs. US DoE CSL2
|
market share below CSL2
|
average MPC to reach new level
|
average MPC increase across Base Case segment
|
average efficiency increase across market
|
|
a. EPS ≤ 6W low-V (e.g. mobile phone)
|
2%
|
0.04 €
|
0.00 €
|
0.01%
|
2.0%
|
50%
|
0.25 €
|
0.13 €
|
0.50%
|
|
aa. EPS ≤6 W (personal care)
|
2%
|
0.06 €
|
0.00 €
|
0.01%
|
2.0%
|
50%
|
0.26 €
|
0.13 €
|
0.50%
|
|
b. EPS 6-10W (e.g. tablets, smart phones etc.)
|
2%
|
0.05 €
|
0.00 €
|
0.01%
|
2.0%
|
50%
|
0.26 €
|
0.13 €
|
0.50%
|
|
c. EPS 10-12W (e.g. small network equipment, set-top boxes)
|
5%
|
0.06 €
|
0.00 €
|
0.03%
|
1.5%
|
50%
|
0.27 €
|
0.14 €
|
0.38%
|
|
d. EPS 15-20W (e.g. portable devices, portable game consoles)
|
10%
|
0.08 €
|
0.01 €
|
0.05%
|
1.3%
|
50%
|
0.30 €
|
0.15 €
|
0.33%
|
|
dd. EPS 15W (personal care)
|
10%
|
0.06 €
|
0.01 €
|
0.05%
|
1.4%
|
50%
|
0.28 €
|
0.14 €
|
0.35%
|
|
e. EPS 20-30W (e.g. notebook computer)
|
10%
|
0.11 €
|
0.01 €
|
0.05%
|
1.3%
|
50%
|
0.32 €
|
0.16 €
|
0.33%
|
|
f. EPS 30-65W multiple-V (e.g. multi-device univ. chargers)
|
30%
|
0.40 €
|
0.12 €
|
0.15%
|
1.4%
|
50%
|
0.72 €
|
0.36 €
|
0.35%
|
|
g. EPS 30-65W (e.g. high-end notebook computers)
|
30%
|
0.14 €
|
0.04 €
|
0.15%
|
1.4%
|
50%
|
0.31 €
|
0.16 €
|
0.35%
|
|
h. EPS 65-120W (e.g. high-end notebook computers)
|
30%
|
0.20 €
|
0.06 €
|
0.15%
|
1.5%
|
50%
|
0.29 €
|
0.14 €
|
0.38%
|
|
i. EPS 65-120W multiple-V (e.g. stationary game consoles)
|
30%
|
0.49 €
|
0.15 €
|
0.15%
|
1.5%
|
50%
|
0.67 €
|
0.34 €
|
0.38%
|
|
j. EPS 12-15W (e.g. loudspeakers. sound systems)
|
10%
|
0.05 €
|
0.01 €
|
0.05%
|
1.4%
|
50%
|
0.28 €
|
0.14 €
|
0.35%
|
|
kk. Wireless chargers
|
N/A
|
N/A
|
N/A
|
N/A
|
N/A
|
N/A
|
N/A
|
N/A
|
N/A
|
|
ll. EPS 9 W (for standard-cell battery chargers)
|
2%
|
0.05 €
|
0.00 €
|
0.01%
|
2.0%
|
50%
|
0.26 €
|
0.13 €
|
0.50%
|
Table 33: No-load efficiency and average active efficiency - Incremental costs per unit - policy measures M4a and M4b
|
Base Case
|
Average active efficiency
|
No-load
|
|
|
Policy measure M4.c (US DoE CSL3)
|
Policy measures M4a, M4b, M4c
|
|
|
delta level VI vs. US DoE CSL3
|
market share below CSL3
|
average MPC to reach new level*
|
average MPC increase across Base Case segment
|
average efficiency increase across market
|
status quo (no-load)
|
all EPS above threshold are assumed to exactly meet threshold
|
|
a. EPS ≤ 6W. low-V (e.g. mobile phone)
|
4.4%
|
82%
|
0.57 €
|
0.47 €
|
1.81%
|
0.06
|
0.054
|
|
aa. EPS ≤6 W (personal care)
|
4.4%
|
100%
|
0.59 €
|
0.59 €
|
2.20%
|
0.084
|
0.071
|
|
b. EPS 6-10W (e.g. tablets. smart phones etc.)
|
3.3%
|
100%
|
0.60 €
|
0.60 €
|
1.65%
|
0.067
|
0.063
|
|
c. EPS 10-12W (e.g. small network equipment. set-top boxes)
|
3.0%
|
100%
|
0.61 €
|
0.61 €
|
1.50%
|
0.066
|
0.062
|
|
d. EPS 15-20W (e.g. portable devices. portable game consoles)
|
2.7%
|
77%
|
0.62 €
|
0.48 €
|
1.04%
|
0.093
|
0.068
|
|
dd. EPS 15W (personal care)
|
2.8%
|
50%
|
0.62 €
|
0.31 €
|
0.70%
|
0.093
|
0.068
|
|
e. EPS 20-30W (e.g. notebook computer)
|
2.5%
|
88%
|
0.64 €
|
0.56 €
|
1.10%
|
0.066
|
0.064
|
|
f. EPS 30-65W. multiple-V (e.g. multi-device univ. chargers)
|
4.5%
|
88%
|
1.25 €
|
1.10 €
|
1.97%
|
0.089
|
0.077
|
|
g. EPS 30-65W (e.g. high-end notebook computers)
|
1.4%
|
50%
|
0.60 €
|
0.30 €
|
0.35%
|
0.089
|
0.077
|
|
h. EPS 65-120W (e.g. high-end notebook computers)
|
1.5%
|
50%
|
0.90 €
|
0.45 €
|
0.38%
|
0.111
|
0.097
|
|
i. EPS 65-120W. multiple-V (e.g. stationary game consoles)
|
1.5%
|
50%
|
0.90 €
|
0.45 €
|
0.38%
|
0.111
|
0.097
|
|
j. EPS 12-15W (e.g. loudspeakers, sound systems)
|
1.4%
|
50%
|
0.40 €
|
0.20 €
|
0.35%
|
0.08
|
0.064
|
|
kk. Wireless chargers
|
N/A
|
N/A
|
N/A
|
N/A
|
N/A
|
N/A
|
N/A
|
|
ll. EPS 9 W (for standard-cell battery chargers)
|
3.3%
|
100%
|
0.60 €
|
0.60 €
|
1.65%
|
0.089
|
0.063
|
Table 34 – Incremental costs per unit - average active efficiency costs policy measure M4c and no-load efficiency policy measure M4a, M4b and M4c
M4d defining a stand-by power requirement of maximum 0.48W for wireless charging pads is modelled based on data from DoE according to which 70% of the market is already in compliance with this requirement, while the remaining 30% have to improve. Average additional product costs across the whole market is a price increase of €0.15 per wireless charger / charging pad.
M5 - Externalisation of power supply circuitries for battery charging devices
and wireless chargers
The stock of single cell battery chargers shifts over time from Base Case mm. Internal power circuitry to the other Base Cases as a shared use of already existing EPS is assumed. Redesign costs for the charger have to be considered: Battery chargers with internal AC-DC circuitry or conventional EPS are in the price range of 30€. Comparable chargers with integrated USB logic and Type-C receptacle are currently sold at around 20€. For the modelling this means a net 10€ cost for an internal power circuitry, and thus savings of 10€ net for each unbundled USB-compatible charger.
Wireless chargers are largely already placed on the market with an externalised USB power supply. No additional costs are assumed for this product under this measure.
M6 - Durability
Given that the use lifetime is not only related to the technically feasible lifetime, but also to use patterns and other factors leading to premature end of life of EPS this policy option is calculated with a lifetime extended by another 2 months on top of the effect of M2b (interoperability).
Even with a requirement of a 10 year technical lifetime the overall lifetime extension potential is limited by factors, which also lead to the assumption of 1.5 times lifetime extension through interoperability: Although users will have the option to use existing EPS for multiple powered products consecutively the consumer survey undertaken as part of the Unbundling Impact Assessment indicated a strong motivation to purchase a new EPS with a new device. Consequently it is expected, that also in future many fully functional EPS are hoarded unused, or are used interchangeably. The technical lifetime in most cases will not be the driving factor for replacement sales of EPS.
Vice versa, the lifetime extending effect has to be modelled only for those EPS which are taken out of operation due to technical defects or wear-out, which is assumed to be a minor share. Beyond anecdotal evidence there is no data on the share of defect EPSs. Under these conditions it is safe to assume that the 10 year lifetime turns into actually longer use of individual EPSs only in a very limited number of cases. These considerations justify an average lifetime extension of 2 months across all EPSs.
The incremental cost per unit under M6 is shown in
Table 35
. With no changes to the EPS stock of EPS it is modelled to lead to decreasing sales of EPS accordingly.
|
Base Case
|
Product price increase (€)
|
|
a. EPS ≤ 6W low-V (e.g. mobile phone)
|
0.06
|
|
aa. EPS ≤ 6W (personal care)
|
0.00
|
|
b. EPS 6-10W (e.g. tablets, smart phones etc.)
|
0.06
|
|
c. EPS 10-12W (e.g. small network equipment, set-top boxes)
|
0.06
|
|
d. EPS 15-20W (e.g. portable devices, portable game consoles)
|
0.06
|
|
dd. EPS 15W (personal care)
|
0.00
|
|
e. EPS 20-30W (e.g. notebook computer)
|
0.08
|
|
f. EPS 30-65W multiple-V (e.g. multi-device univ. chargers)
|
0.10
|
|
g. EPS 30-65W (e.g. high-end notebook computers)
|
0.10
|
|
h. EPS 65-120W (e.g. high-end notebook computers)
|
0.10
|
|
i. EPS 65-120W multiple-V (e.g. stationary game consoles)
|
0.10
|
|
j. EPS 12-15W (e.g. loudspeakers, sound systems)
|
0.06
|
|
kk. Wireless chargers
|
0.00
|
|
ll. EPS 9 W (for standard-cell battery chargers)
|
not applicable
|
Table 35: M6 – EPS Lifetime EPS
M6 only makes sense in conjunction with the interoperability measure M2 under which the additional costs and energy losses due to detachable cables have already been considered as a consequence of the USB requirements. To avoid double counting they have not been considered separately also under M6.
Uncertainty
As noted during the analysis there are considerable uncertainties in many of the underlying assumptions. Future projections about electricity prices and GHG intensity of electricity generation are inevitably uncertain. However, their impacts will simply linearly change the value of the estimated electricity or GHG savings.
There is also uncertainty in how to value the contribution to the different specific objectives. However, by testing with different weightings for the energy, emissions and materials savings this has been shown to not have a dramatic effect on the rankings of the policy options.
The biggest uncertainty relates to how consumers will react to the availability of interoperable EPS. The sensitivity tests discussed in Annex 13 indicate the magnitude of such effects. The assumption that consumers will reuse and therefore choose to purchase less new EPS is central to the reduced purchase costs of the interoperability measure M2b. The prolongation of the EPS life also ensures that the policy options including higher energy efficiency deliver sufficient savings to offset the higher purchase costs.
A shorter assumed life extension would have a much larger proportionate impact on the overall benefits of the combined options. The opposite would also be true.
Annex 5: The Ecodesign and Energy Labelling Framework
The
Ecodesign Framework Directive
and
Energy Labelling Framework Regulation
are framework rules, establishing conditions for laying down product-specific requirements in regulations adopted by the Commission. The Commission's role in the implementation of delegated and implementing acts is to ensure a maximum of transparency and stakeholder participation in presenting a proposal, based on generally accepted data and information, to the European Parliament and Council for scrutiny.
Figure
18
gives an overview of the procedures leading to a voluntary agreement, Ecodesign requirements or an Energy label.

Figure 18 - Overview of the three processes
Ecodesign and Energy labelling are complementary. Ecodesign implementing measures lay down minimum energy efficiency requirements for a product group and therefore ban worse performing products. In contrast, energy labelling provides objective comparable information to enable consumers to choose better performing products through mandatory rating. In view of the complementarity, energy labelling delegated acts are usually adopted in parallel with Ecodesign implementing acts to ensure coherence between the measures.
The process starts with establishing the priorities for Union action in this area. Priority product groups are selected based on their potential for cost-effective reduction of energy use and GHG emissions and follows a transparent process culminating in a working plan that outlines the priorities for the development of implementing measures for the next years. Working plans are adopted by the Commission after consultation of the
Ecodesign and Energy labelling Consultation Forum
. The forum brings together representatives of Member States and relevant stakeholders. The
Ecodesign and Energy labelling Working plan 2022-24
identifies EPS as a priority.
Once the product group has been selected, a preparatory study is undertaken by an independent consultant, also involving extensive technical discussions with interested stakeholders. The preparatory study follows the standard
Methodology for the Ecodesign of Energy Related Products
(MEErP). Subsequently. the Commission's first drafts of Ecodesign and energy labelling measures are submitted for discussion to the Consultation Forum.
After the Consultation Forum. the Commission drafts an impact assessment, which after RSB approval accompanies the draft implementing measures in the Commission’s inter-service consultation. In this and subsequent steps, the Parliament's functional mailboxes for delegated/implementing acts are copied on each message from the Commission services. After the inter-service consultation, stakeholders are alerted when the draft measures are published in the WTO (World Trade Organisation) notification database.
After the WTO notification phase is completed, the two procedures follow different paths. The draft energy labelling delegated act is discussed in a Member States Expert Group where opinion(s) are expressed and consensus is sought but no vote is taken. The draft Ecodesign measure is submitted for vote to the Regulatory Committee.
The European Parliament and Council have the right of scrutiny for a period of up to four months. Within this time, the co-legislators can block the adoption process by the Commission. Parliament committees sometimes discuss draft objections to measures (light bulbs and fridges in 2009) or vote to reject a measure (vacuum cleaners in 2013
). On one occasion. an objection was adopted in plenary, blocking the measure for televisions in 2009
.
Today, 30 Ecodesign Regulations, 15 Energy Labelling Regulations. 2 voluntary agreements and 2 tyre labelling regulations have been implemented. An
overview of the measures in force
is available on the Europa website.
The Market Surveillance Regulation
establishes the rules on Union market surveillance and control of products entering the Union market. Market Surveillance Authorities (MSAs). designated by Member States. will verify the conformity of the products with the requirements laid down in the implementing measures and delegated acts. Checks can be done on the product itself or by verifying the technical documentation.
Annex 6: Products in scope of the current EPS regulation
EPS are devices used to supply electricity to, and to charge built-in batteries of electronic and electric devices ("primary load products") such as laptops, mobile phones, tablets and electric shavers. For other products without built-in batteries. they serve as the main continuous source of power – for example standalone loudspeakers or computer network equipment such as modems and routers. The use of such products spans both domestic and office settings. An EPS transforms the voltage supplied by an electric socket normally at 230V to a lower voltage level suitable to the primary load product – often between 5V and 20V.
An EPS also often rectifies the Alternating Current (AC) from the electric socket to Direct Current (DC) typically used for portable electric and most electronic products. It may also contain intelligent electronics to enable fast charging cycles and to avoid detrimental over-charging of built-in batteries. The figure below shows examples of typical EPS types:

Figure 19 - Pictures of typical EPS types. Source: EPS manufacturers
COMMISSION REGULATION (EU) 2019/1782 establishing minimum efficiency requirements for external power supplies was adopted on 1 October 2019. Its scope covers EPS that meet all of the following criteria:
·designed to convert alternating current (AC) power input from the mains power source input into one or more lower voltage direct current (DC) or AC outputs;
·used with one or more separate devices that constitute the primary load;
·contained in a physical enclosure separate from the device or devices that constitute the primary load;
·connected to the device or devices that constitute the primary load with removable or hard-wired male/ female electrical connections, cables, cords or other wirings;
·a nameplate output power not exceeding 250 watts; and
·used with electrical and electronic household and office equipment included in Annex I of the Regulation
Annex I of the Regulation lists the following electrical and electronic household and office equipment applications of EPS to be in scope:
1. Household appliances:
·Appliances for cooking and other processing of food. preparing beverages. opening or sealing containers or packages. cleaning. and maintenance of clothes.
·Appliances for hair cutting, hair drying, hair treatment. tooth brushing, shaving, massage and other body care appliances.
·Electric knives.
·Scales.
·Clocks. watches and equipment for the purpose of measuring, indicating or registering time.
2. Information technology equipment. including copying and printing equipment, and set-top boxes, intended primarily for use in the domestic environment.
3. Consumer equipment:
·Radio sets.
·Video cameras.
·Video recorders.
·Hi-fi recorders.
·Audio amplifiers.
·Home theatre systems.
·Televisions.
·Musical instruments.
·Other equipment for the purpose of recording or reproducing sound or images. including signals or other technologies for the distribution of sound and image other than by telecommunications.
4. Electrical and electronic toys. leisure and sports equipment:
·Electric trains or car racing sets.
·Game consoles. including hand-held game consoles.
·Sports equipment with electric or electronic components;
·Other toys. leisure and sports equipment.
Annex 7: Evaluation of Regulation (EU) 2019/1782 on Ecodesign requirements for External Power Supplies
Introduction
This evaluation is of Commission Regulation (EU) 2019/1782 laying down ecodesign requirements for external power supplies (EPS), hereafter referred to as ‘the EPS Regulation’. It was adopted as an implementing measure under the Ecodesign Directive (2009/125). The Ecodesign Directive and the EPS Regulation have the internal market provisions of the treaty as their legal base (now TFEU Article 114). This evaluation was carried out back-to-back with an impact assessment (IA) as part of the review required by Article 7 of the Commission Regulation.
The review article refers to the need to carry out the review ‘in the light of technological progress’. In addition, the evaluation will primarily consider the effectiveness, efficiency and relevance of the EPS Regulation. Because the regulation is adopted under the Ecodesign Directive, it is not considered necessary to address the coherence and EU added value criteria in detail since they are presumed to have been assessed for the main Directive and therefore also apply to implementing measures adopted under it.
The methodology used for the evaluation has included seeking public comments on the Commission Regulation, gathering manufacturer EPS data, review of literature and technical documentation and some limited testing of EPS.
The period covered by the evaluation is from the date of adoption of the EPS Regulation in October 2019 to the present. The geographical scope of the evaluation is the whole EU.
What was the expected outcome of the intervention?
Description of the intervention and its objectives
Under the Ecodesign Directive the Commission should set ecodesign requirements for energy-related products which account for significant volumes of sales and trade in the Union and which have a significant environmental impact and present significant potential for improvement through design in terms of their environmental impact, without entailing excessive costs. Ecodesign requirements for EPS were originally established in Regulation (EC) No 278/2009. The Commission subsequently reviewed the regulation and a revised regulation
was adopted after the normal procedure accompanied by an impact assessment
.
The revised regulation was intended to set harmonised ecodesign requirements for the energy consumption of EPS. These requirements were intended to improve the environmental performance of EPS and contribute to the functioning of the internal market. The main problems identified in the impact assessment were: outdated energy efficiency requirements; outdated scope; lack of readily available information and missed opportunities for contributing to circular economy objectives. The adopted EPS Regulation addressed the scope, no-load and active load energy efficiency and information requirements. It did not include any specific targeted circular economy requirements. It is considered that the impact assessment remains broadly relevant.
At the time of adoption of the Commission Regulation it was considered to contribute to a set of broader policy objectives. The main ones were: the Energy Union Framework Strategy, which called for a sustainable, low-carbon and climate-friendly economy; the Paris Agreement, which called for a renewed effort in GHG emissions abatement; the Gothenburg Protocol, which aimed at controlling air pollution; the Circular Economy Initiative, which amongst others stressed the need to include reparability, recyclability and durability in ecodesign; the Emissions Trading Scheme (ETS), aimed at cost-effective GHG emissions reductions and was indirectly affected by energy consumption of ecodesign products; and the Energy Security Strategy, which set out a strategy to ensure a stable and abundant supply of energy.
At the time of adoption there was no assessment of the UN Sustainable Development Goals (SDGs) that the EPS Regulation could contribute to. However, increased energy efficiency in line with other ecodesign regulations is expected to contribute to SDG 7 (affordable and sustainable energy), SDG 8 (sustainable economic growth) and SDG 13 (climate action). The evaluation will provide evidence on the contribution this regulation makes to these SDGs.
The general objectives of the intervention were described in the impact assessment to:
1.Facilitate free circulation of efficient EPSs in the internal market;
2.Create or expand the internal market for more sustainable products to support competitiveness;
3.Promote EPS energy efficiency to contribute overall EU energy and climate objectives;
4.Contribute to reduced EU energy dependency and increased energy security.

Figure 20 - Intervention Logic
The intervention logic shown in
Figure
20
illustrates how the needs connect with the objectives and the requirements established in the EPS Regulation to deliver the expected achievements in terms of outputs, results and impacts.
The main achievements expected at the time of the impact assessment were:

Changes in employment were expected as a consequence of the increased business turnover (shown by the lower saving in consumer expenditure compared to consumer electricity savings).
Closer alignment was expected with requirements in other economies (in particular the US) and with the most stringent requirements of the International Efficiency Marking Protocol and finally there were expected to be limited impacts on SMEs manufacturing products that use EPS.
These outcomes were primarily expected to be delivered by the stricter energy efficiency requirements set in the EPS Regulation. These would have a modest cost but be more than offset by reduced expenditure due to the energy savings throughout the life of the product. The additional information was expected to support the choice of more efficient EPS and thus further boost energy savings.
It was estimated that EPS manufacturers would bear compliance costs associated with testing. certification and documentation that of €5.29m, which equates to €0.01 per unit sale.
Success would mean that only products meeting the minimum requirements set in the Regulation would be placed on the EU market. Compared to the situation without the minimum requirements this would result in lower energy use and lower GHG emissions.
As shown in
Figure
20
several external factors may have affected the outcome, for example:
·Technological progress may have made the ecodesign requirements easier and cheaper to comply with than anticipated;
·Since the same EPS are likely to be sold in multiple jurisdictions there can be an impact if strict requirements are set in those jurisdictions on products placed on the EU market;
·Changes in electricity supply costs can alter the level of consumer benefits achieved;
·The GHG intensity of EU electricity production is inversely related to the GHG benefit of using less electricity. If the intensity has reduced faster than expected then the GHG benefits of the Regulation will be lower.
Points of comparison
The key factors that will determine whether the expected energy savings are delivered will be the active energy efficiency requirements and the no-load power consumption limits.
The energy savings would also be affected if use patterns had changed compared to those assumed, but no information is available on actual use patterns in the EU.
The total level of energy savings will be affected by the annual sales of EPS and the overall stock of them.
The level of GHG savings are a consequence of the level of electricity savings and the GHG intensity of electricity supply.
The level of primary energy savings will be affected by the electricity generation mix and the consequent primary energy factor.
In view of these relationships, the relevant points of comparison would be:
·EPS sales and stock figures
·EPS active energy efficiency
·EPS no-load losses
·Electricity GHG intensity
·The electricity Primary Energy Factor
·Consumer electricity costs
How has the situation evolved over the evaluation period?
Current state of play
As the intervention was in the form of a regulation no implementation was required by Member States and therefore also no infringements have occurred. Member States do however have responsibility to carry out market surveillance and verify compliance with the requirements. The main need for implementation lies with business which needs to ensure that only EPS complying with the ecodesign requirements were procured and placed on the market after the specified dates. No difficulties have been reported in complying with the legal requirements by any of the actors involved.
A complication with EPS is that the vast majority are not sold separately but are bundled with other products that they are intended to be used to power. There is therefore no readily available information from the market on either the quantities of EPS sold or their cost or price. This situation is broadly the same as at the time of the previous impact assessment.
Estimates of the impact of the regulation are made annually as part of the Ecodesign Impact Accounting. However, these estimates essentially take the product related assumptions in the previous impact assessment and update them with any changes in relevant external factors. They do not constitute actual monitoring of the market.
Evolution of relevant parameters
Energy efficiency
It was assumed that in the absence of any regulation, active mode losses would decrease autonomously by 1% per year due to technical developments. In view of this, the active efficiency would have improved as shown in
Figure 21
below. It is clear from this figure that even in the best case the active efficiency would not have reached the same level as in the US by 2030.
|
EU Regulation 278/2009
|
2019
|
2020
|
2025
|
2030
|
US DoE
|
|
Lower efficiency
|
65.5%
|
65.8%
|
67.5%
|
67.8%
|
70.9%
|
|
Upper efficiency
|
87.0%
|
87.1%
|
87.8%
|
87.9%
|
88.0%
|
Figure 21 - Illustrative autonomous active efficiency improvement
If it was assumed that no-load efficiency would have improved autonomously by 1% per year the no-load losses would have decreased as shown in
Figure 22
below. At this rate, by 2030 the autonomous improvement would only have reduced the no-load losses by 1/7 of that achievable by alignment with the US DoE requirements.
|
|
2019
|
2020
|
2025
|
2030
|
US DoE
|
|
Lower no-load losses (W)
|
0.3
|
0.297
|
0.282
|
0.269
|
0.1
|
|
Upper no-load losses (W)
|
0.5
|
0.495
|
0.471
|
0.448
|
0.3
|
Figure 22 Projected autonomous improvement in no-load losses
Sales
The assumed EU-28 EPS sales from the IA are shown in
Figure 23
. Sales figures were assumed to not change from the BAU sales after introduction of the requirements in the regulation since the EPS are primarily supplied with a product and demand for those would be unaffected by the intervention.

Figure 23 - (from the 2019 IA) – Assumed annual EPS sales
No additional detailed information is available on how sales have evolved. A key factor affecting the number of sales in the EU is the effect of the UK leaving the EU. UK sales accounted for about a 15% share of sales and so after adjustment they follow the pattern shown in
Figure
24
:

Figure 24 Expected EPS sales from Ecodesign Impact Accounting 2021
Sales prices
Because EPS are primarily sold bundled with other products there is no market information available on selling prices. The analysis in the impact assessment was based on assumptions about the volume of product sales and their notional prices. No information is available to check these assumptions.
Other relevant changes
A relevant evolution is the adoption of the revised Radio Equipment Directive
among others for mobile phones, tablets and laptops. This aims at the proliferation and reuse of a ‘universal’ USB-PD charger. It requires devices in its scope to be powered through a USB-C connector with a USB protocol. Devices in its scope are currently powered by around 50% of all EPS in the current scope of the Regulation.
It is also relevant to note that authorities in the United States
and in Australia have started reviews of their legislation regulating EPS.
Sources of evidence
A call for evidence was launched to gather inputs for the evaluation and impact assessment. Most of the inputs received were opinions about future development of the policy and therefore not relevant for the evaluation. Further details of the limited comments relevant to the evaluation are provided in Annex V.
There is no specific reporting requirement in the regulation. However, the Market Surveillance Authorities (MSAs) provide information in the ICSMS database on the results of market surveillance activities. Only Germany has provided this information for EPS in the database, and Denmark provided market surveillance information separately.
An evaluation questionnaire was sent to the members of the Consultation Forum in 2022. Only two responses were received to this questionnaire (from Germany and Switzerland). providing mainly market surveillance information for 2021.
The following additional sources of information were used:
•EPS energy efficiency information from online manufacturer catalogues
•Generic market information from an interview with a component manufacturer (Power Integrations)
•Non-destructive testing of a number of EPS at different energy consumption levels
•Ecodesign Impact Accounting (EIA) report 2021
A database with EPS data on no-load energy consumption, active efficiency and efficiency at 10% load, was populated with around 500 entries sourced from manufacturers’ public online information. While this data has not been independently verified, it ought to provide a good illustration of the performance of EPS on the market, given that an EPS is a product easy to test, without user settings and corresponding variations in “real-world” performance.
Limitations
As noted, there are significant weaknesses in the information available to assess certain aspects of the intervention. The lack of sales data means that it is not possible to see whether there has been any change in the number of EPS sold or in which categories. No data is available on use patterns of EPS to verify the assumptions used previously. The absence of pricing information, primarily due to the bundling of EPS with the products they are used to power has prevented any assessment of the impact of the Regulation sale prices. No sources of cost information have been identified other than ongoing US work on a future revision of US regulations and bilateral industry contacts for confirmation of the likely impacts. These factors limit the ability to assess the cost-efficiency of the EPS Regulation.
Evaluation findings
Question 4.1 – To what extent was the intervention successful and why?
The answer to this evaluation question is based upon the assessment of the three criteria effectiveness, efficiency, coherence. Coherence is implicitly assumed as the intervention being evaluated is an Implementing Measure.
The evidence gathered shows that to a large degree products are compliant with the no-load and active load energy efficiency requirements and the information requirements including efficiency at 10% load. As a result of over-compliance, partly offset by the reduced size of the EU, actual electricity savings are calculated to be around 13% higher than projected in 2025.
With regard to the progress on energy efficiency, some part of this could have been expected to have happened without the Regulation due to business-as-usual evolution and product replacement, autonomous technical progress including new semiconductor types and spill over impacts of regulations in other jurisdictions (in particular the USA).
It is unlikely that information at 10% load would have been provided without the regulation’s requirement since this was largely absent earlier. Similarly, the specific information requirements on the EPS could not have been expected to be universally applied if they were not in the regulation.
Actual primary energy savings are lower than projected in the IA since the electricity Primary Energy Factor has progressively reduced due to changes in the electricity generation mix. The primary energy savings in 2025 are calculated to be around 15% lower than projected for this reason (see annex IV).
Actual GHG savings are lower than projected in the IA since decarbonisation of the electricity mix has happened more rapidly than was projected. The GHG intensity was around 39% lower than assumed in 2020 but this discrepancy reduced to 26% in 2021 due to the temporary rebound in coal fired generation in that year. The intensity is projected to be 50% lower by 2025. GHG savings are therefore likely to be in the range of 15 to 45% lower as shown in annex IV.
Unfortunately, there is limited market surveillance information available. What is available points to a certain non-compliant share of products tested. This is supported by the independent testing carried out in support of this evaluation and by the manufacturer data. While the manufacturer data shows a low share of EPS with reported parameters not in line with the regulation requirements, there may be other reasons for non-compliance such as failure to provide appropriate information. Unfortunately, it is not possible to draw any conclusions on the overall share of non-compliant products since market surveillance actions tend to be focussed on products that are considered to be of higher risk.
With regard to the efficiency of the regulation, it has unfortunately been impossible to gather any direct information on the cost to manufacturers of implementing the requirements or any change in product price. Similarly, it has not been possible to gather any information on the testing and administrative costs. No respondents provided any information in the consultation or has provided any information directly. In view of this lack of information it is assumed that the administrative and adjustment costs have not been higher than projected in the impact assessment.
Efficiency can however be inferred from the fact that none of the industry stakeholders has raised the cost of compliance with the requirements as an issue during the evaluation. Similarly, the scale of costs that have been identified in the work carried out for the US DoE for further stringency requirements illustrate that the underlying cost assumptions used in the IA were of the right order of magnitude.
As identified in the impact assessment, there can be significant cost efficiencies through compatible levels of energy efficiency requirements applying to EPS sold globally. If these did materialise they would have been expected to lead to lower consumer costs. There have not been changes in other major jurisdictions in the intervening period, but reviews are underway in at least Australia and the United States.
In view of this evidence, it can be concluded that the intervention has contributed to achieving the outcomes it aimed at. Some part of the energy efficiency progress might have occurred anyway, but nonetheless there is clearly benefit from the intervention. The lack of evidence on costs and the indirect evidence suggest that costs were not higher than anticipated in the impact assessment. In view of these factors the intervention can be judged to have been a success, achieving more electricity savings than expected albeit delivering less GHG and primary energy benefits due to external factors.
More detailed analysis by criterion is documented in Annex III (answers to the evaluation questions).
Question 4.2 - How did the EU intervention make a difference and to whom?
There is currently no known intervention at Member State level specifically targeting EPS. By virtue of an EU-wide measure, suppliers have the same set of (harmonised) requirements across the whole EU Single Market. This removes the risk of having to perform different tests and other performance assessments and having to meet different national requirements as regards labelling when placing products on national markets.
For consumers and component integrators, the intervention brings added value as it provides information on characteristics for choosing an EPS. For EPS producers and wholesalers the added value is that they can use the same models for the entire EU market and are not required to prepare for different requirements at national level.
For market surveillance the added value of the EU measure lies in the mutual recognition of verification assessments performed in other countries. National authorities do not need to perform verification tests on products already verified by other authorities.
If the EU ecodesign requirements were stopped it could prompt ‘dumping’ of less efficient EPS on the EU market as was feared because of stricter US legislation before the regulation was adopted. These less efficient EPS would lead to higher electricity losses and thus higher consumer costs as well as an increase in GHG and pollutant emissions and material consumption from electricity generation. These factors might prompt Member States to develop requirements themselves. This would affect the functioning of the EU Single Market and would be expected to lead to higher product costs due to the multiplicity of requirements.
The impacts of the EU intervention have been primarily felt by consumers who have received the benefits of the higher energy efficiency of EPS on the EU market and thus lower electricity consumption and cost savings. It is not expected that there would have been substantial impacts on business producing or selling EPS since there isn’t evidence of significant product price changes that would have led to a difference in sales or revenues.
Question 4.3 - Is the intervention still relevant?
The objectives of the intervention relating to the single market, promoting energy efficiency and contributing to EU energy and climate goals. have remained relevant over the implementation period. The EU is celebrating the 30th anniversary of the single market
and regards the role it plays as important as ever. The EPS Regulation continues to be relevant to contribute to the single market.
Climate and energy policies are a key element of the European Green Deal and further action to increase energy efficiency and reduce GHG emissions have been agreed. The Regulation remains relevant to contribute to these. While its contribution to the overall energy security objective is small, the Russian aggression in Ukraine has reinforced attention on energy security and therefore this contribution also remains relevant.
The range of types of products requiring EPS on the market not within the scope of regulation has grown (e.g. products with charging as a secondary function, wireless chargers, e-bikes). In view of this the regulation now addresses to a certain extent a smaller share of relevant products than it did at the time of adoption.
Since adoption of the regulation there has been an increased focus on the Circular Economy. While the regulation results in substantial material savings through reduced electricity consumption, it does not contain any specific measure targeting product lifetime or end of life. At the end of their active use EPS become part of e-waste
. The Circular Economy Action Plan calls for measures to reduce e-waste with goals like creating the right to repair and improving reusability in general, introduction of a common charger and establishing a rewards system to encourage recycling electronics. Since most EPS have a longer technical life than the products they power, they may accumulate in households for years and then become e-waste.
Products requiring an EPS continue to be purchased and their range is expanding while the policy objectives also remain relevant and are also being strengthened. Taken together these show that the intervention remains relevant. The available market evidence appears to show good overall compliance with the requirements, however, the limited information on market surveillance makes it difficult to be certain how effective the intervention is in contributing to its objectives.
New semiconductor technologies offer higher efficiency and smaller geometry, which are in turn opportunities for further improvements. The introduction of the USB-PD protocol has made interoperability of EPS feasible, but this does not appear to have yet led to any significant reuse of EPS and reduction of bundled sales.
The regulation set EPS efficiency requirements at level VI on the globally agreed energy efficiency scale. It was adopted following comparable legislation in the US and Canada. While this level has become de-facto a global standard, other jurisdictions, like the US and Australia, are now reviewing their requirements. A strengthening of requirements in other jurisdictions will support the case for reviewing the stringency of EU requirements.
Consumers are probably unaware of the energy efficiency of EPS and are unlikely to give much consideration to it when making a purchase, especially since most EPS are sold bundled with products. Despite this, given the lengthy periods for which most EPS will be used, the potential energy and cost savings for consumers are non-negligible. Technological development suggests that there could be further savings to be realised in the future that would be unlikely to materialise in the absence of regulatory requirements.
Consumers’ need for information on the characteristics and performance of EPS remains valid. Even with adaptive EPS it is still important to have EPS with adequate power for the powered device. As more devices and EPS are powered via interchangeable connectors such as USB-C, the need for information increases as the same EPS can be used with multiple products. This need is likely to increase as more devices can be interchanged with different EPS and the number of different products requiring an EPS grows.
In view of these considerations, the regulation remains relevant for providing relevant information to consumers to choose a proper EPS and for providing them with energy and costs savings that they would otherwise forego.
What are the conclusions and the lessons learned?
The conclusions presented in this section result from the evidence that has been gathered and the analysis carried out.
Did the intervention achieve its objectives?
While there is limited market surveillance information, the evidence suggests that to a large part EPS placed on the EU market mainly comply with the active and no-load efficiency requirements. Information requirements appear to be respected and information on 10% load efficiency has been provided.
No unintended consequences of the intervention have been identified. It has not been possible to gather explicit evidence of whether the intervention was more or less costly than expected, however indirect evidence suggests that it was not more costly.
Some part of the anticipated energy savings is likely to have resulted from autonomous technical progress and spill over effects from regulation in other parts of the world. Offset against that was the risk identified in the impact assessment of ‘dumping’ of EPS not compliant with requirements in the other jurisdictions in the EU. This has not happened.
While it would have been possible for Member States to have set equivalent requirements at national level, it is unlikely that these would have been uniform and the cost of establishing them and testing compliance for them and overseeing them would have been higher than setting a single set of requirements at EU level for the single market.
It can be concluded that the Regulation has broadly achieved its objectives.
Did the EU bring actors together to work on shared solutions that would not have happened otherwise?
The alignment of the EU energy efficiency requirements for EPS with the international level VI requirements will have led to economies of scale globally as manufacturers will have been able to develop and market single EPS compliance with the requirements in the major jurisdictions. This is assumed to have ultimately led to lower consumer prices.
The fact that authorities in the USA and Australia are currently reviewing their requirements may support the need for a review of EU requirements to ensure the benefits of continued alignment.
What are the lessons that can be derived from this primarily backward-looking exercise?
The underlying rationale for the intervention remains, in that there will be market failures meaning that EPS energy efficiency will not arrive at cost-optimal levels from the point of society from market forces alone.
Market data shows a considerable spread of energy efficiency performance. Technology continues to evolve, in particular with new types of semiconductors, and this means that are likely to be opportunities for more stringent requirements in the future.
The range of products powered by EPS continues to grow. This suggests that there may be a growing number of products outside the current scope. This implies that there could be benefit from a review of the scope of the regulation.
The above factors point to the continuation of problems that justified the intervention.
In addition, there are a number of evolutions that suggest other potential benefits in reviewing the requirements.
Information has been gathered on energy efficiency at low-load. This shows lower efficiency than at higher load levels, as was assumed, and appears to indicate a range of performance at this load level. These factors might merit specific action.
The regulation did not include any elements specifically related to the circular economy. In view of the increased focus in this policy area, it may be worth exploring whether there are aspects of the EPS market that could be addressed from a circular economy perspective and lead to benefits for consumers and the environment.
Since the regulations are single market measures, they are assumed to represent a simplification compared to the situation without them. The provisions for compliance are standard and there are no obvious routes to reduce their burden. Market surveillance weaknesses risk undermining compliance and thus allowing for free-riders while reducing the energy saving benefits.
No issues have been raised or identified in relation to complexity or excessive cost and it is concluded that there are no obvious inefficiencies or opportunities for simplification or burden reduction.
No problems of internal coherence have been identified or other coherence with other EU legislation. No changes have been identified in the targeted businesses that would suggest a need for a different policy design in future.
Evaluation Annex I. Methodology used
Figure
25
- Overview of the evaluation methodology
below shows the overall methodology used for the evaluation as well as the main steps followed and the types of data sources used during the process.

Figure 25 - Overview of the evaluation methodology
Evaluation Annex II. Evaluation matrix and answers to the evaluation questions (by criterion)
|
Effectiveness
|
Data sources
|
Success criteria (points of comparison)
|
Indicator(s) quantitative or qualitative
|
|
1. What progress has been made over time towards achieving the objectives and target?
|
|
Q 1.1 Has the no load energy consumption of EPS sold in the EU improved?
What would have been the improvement in the BaU situation and also developments have been seen in other parts of the world?
|
Manufacturer data
Interviews
Testing unbundled EPS
Market surveillance
Impact Assessment
|
No load power consumption
|
Quantitative
|
|
Q 1.2 Has the average active efficiency of EPS sold in the EU as a whole improved?
What would have been the improvement in the BaU situation and what developments have been seen in other parts of the world?
|
Manufacturer data
Interviews
Testing unbundled EPS
Market surveillance
Impact Assessment
|
Active load power energy efficiency
|
Quantitative
|
|
Q. 1.3 To what extent can the achieved improvements be attributed to the EPS ecodesign requirements?
|
Consultation
Interviews
Analysis
|
Alternative explanations for progress
|
Qualitative
|
|
Q. 1.4 Has the required energy efficiency information been made available to consumers? How?
|
Market data
Observation
|
Information available on EPS
|
Qualitative
|
|
2. How successful has the regulation been in achieving or progressing towards its objectives?
|
|
Q. 2.1 Do the electricity savings match the expectations from the Impact Assessment?
|
Manufacturer data
Ecodesign Impact Accounting
Impact Assessment
|
Electricity savings
|
Quantitative
|
|
Q. 2.2 Do the GHG savings match the expectations from the Impact Assessment?
|
Calculated electricity savings
Outturn electricity GHG intensity
|
GHG savings
|
|
|
Q. 2.3 Do the primary energy savings match the expectations from the Impact Assessment?
|
Calculated electricity savings
Revised PEF values
|
Primary energy savings
|
|
|
Q. 2.4 Do the consumer energy cost savings match the expectations from the Impact Assessment?
|
Calculated electricity savings
Outturn electricity prices
|
Consumer energy cost savings
|
|
|
Q. 2.5 Are their unexpected outcomes from the Regulation?
|
Market observations
Manufacturer data
|
|
|
|
3. What factors have contributed to or hindered their achievement?
|
|
3.1 To what extent have the ecodesign requirements been sufficient to contribute to improving EPS performance and meet minimum energy efficiency requirements?
|
Consultation
Interviews
Literature
Questions to Commission
|
Alternative explanations for progress
|
Qualitative
|
|
3.2 Have there been EPS technological improvements that contributed to increased energy efficiency?
|
Consultation
Interviews
Literature
|
Technological progress
|
Qualitative
|
|
3.3 What external factors have affected progress towards the objectives, and how are they linked to the EU intervention?
|
Consultation
Interviews
Literature
|
Identified external factors
|
Qualitative
|
|
4. How effective has the implementation and enforcement of the Regulation?
|
|
4.1 Status of market surveillance in MS?
Does it differ compared to other products regulated by the Ecodesign Directive?
|
ICSMS database MS information
|
Rates of surveillance
|
Quantitative
|
|
4.2 Is there non-compliance with the Regulation requirements?
If so, how much of that is due to poor enforcement?
|
Market surveillance
Testing unbundled EPS
Manufacturer data
|
Rate of identified non-compliance
|
Quantitative and Qualitative
|
|
Efficiency
|
Data sources
|
Success criteria (points of comparison)
|
Indicator(s) quantitative or qualitative
|
|
Q4. Are the costs related to the Regulation proportionate to the benefits?
|
Consultation
|
Administrative costs
Price information
|
Qualitative
|
|
Relevance
|
Data sources
|
Success criteria (points of comparison)
|
Indicator(s) quantitative or qualitative
|
|
Q5. Does the Regulation correspond to the current needs of the EU?
|
|
Q 5.1 How did the objectives of the intervention correspond to wider EU policy goals and priorities?
|
EU policy documents Literature
|
Priority EU goals
|
Qualitative
|
|
Q 5.2 To what extent is the intervention still relevant in view of its objectives?
How well do the (original) objectives of the intervention still correspond to the needs of the EU?
|
EU policy documents
Literature
|
Relevance of objectives
|
Qualitative
|
|
Q 5.3 To what extent do the needs/problems addressed by the intervention continue to require action at EU level?
|
EU policy documents
Literature
|
Continuation of needs
|
Qualitative
|
|
Q 5.4 How well adapted is the intervention to the technological progress that has happened since its introduction?
How well adapted is the intervention to social and environmental changes?
|
Consultation
Interviews
Literature
|
New needs
|
Qualitative
|
|
Q. 5.5 Are the regulation’s requirements sufficiently stringent in view of developments in other jurisdictions?
|
Information on other jurisdictions
|
Stringency in other jurisdictions
|
Quantitative
|
|
Q 5.6 How relevant is the intervention to EU citizens?
Will it continue to be relevant for them in the near future?
|
Consultation
Literature
|
Consumer needs
|
Qualitative
|
|
Q6. How flexible is the Regulation with regard to other policies and new issues?
|
Analysis
|
Need for flexibility
|
Qualitative
|
Coherence
Coherence is not investigated in detail in this evaluation because the intervention is an implementing measure adopted under a framework Directive. It is assumed that provided the Directive and its requirements is coherent with other policy objectives and goals then the implementing measures will also be coherent. This evaluation does not assess the coherence of the Ecodesign Directive, however the impact assessment and ESPR legislative proposal to amend that legal framework recognised that the framework is coherent with EU policy goals and objectives and proposes to extend that framework to a wider range of products while bringing in additional possibilities for action. The following coherence questions are considered:
|
Coherence
|
Data sources
|
Success criteria (points of comparison)
|
Indicator(s) quantitative or qualitative
|
|
Q7 How coherent is the EU intervention?
|
|
Q 7.1. To what extent is the intervention coherent internally, with other interventions with similar objectives and with wider EU policy?
|
EU policy documents Literature
|
Ecodesign regulations and EU policy documents
|
Qualitative
|
|
Q 7.2 To what extent is the intervention coherent with international obligations?
|
EU policy documents
Literature
|
|
Qualitative
|
EU added value
EU added value is not investigated in detail in this evaluation because the intervention is an implementing measure adopted under a framework Directive. It is assumed that provided the Directive and its requirements provide EU added value then the implementing measures will also.
The Framework Directive has the internal market provision of the Treaty as its legal base. The implementing measures adopted under the framework will bring harmonised product requirements across the EU Single Market. This results in single test and performance assessments for the single market thus minimising costs. In market surveillance there is added value from the mutual recognition of verification assessments performed in other Member States.
|
EU added value
|
Data sources
|
Success criteria (points of comparison)
|
Indicator(s) quantitative or qualitative
|
|
Q8. What is the EU added value of the intervention?
|
|
Q. 8.1 What is the additional value resulting from the EU intervention. compared to what could reasonably have been expected from Member States acting at national and/or regional levels?
|
EU policy documents Literature
|
Contribution to the single market
|
Qualitative
|
|
Q. 8.2 What would be the most likely consequences of stopping or withdrawing the existing EU intervention?
|
EU policy documents Literature
|
Contribution to the single market
|
Qualitative
|
Evaluation Annex III. Answers to the evaluation questions
Effectiveness
1. What progress has been made over time towards achieving the objectives and target?
Q 1.1 Has the no load energy consumption of EPS sold in the EU improved?
What would have been the improvement in the BaU situation and with developments in other parts of the world?
Figure
26
shows the situation before the Regulation was put in place and the EU ecodesign no-load power requirements were less stringent than the US DoE requirements.
|
EPS regulatory requirements
|
No-load power consumption
|
Equivalent to International Efficiency Marking Protocol
|
|
US DoE
|
0.10 - 0.30 W
|
Level VI
|
|
EU Regulation 278/2009
|
0.30 - 0.50 W
|
Level V
|
Figure 26 - Comparison of EU and US requirements shown in 2019 IA
The impact assessment reported no-load power consumption of EPS of 0.3 to 0.5W. It was expected that these would reduce through technical progress by around 1% per year. This would imply a 5% reduction since 2018 to around 0.28 and 0.47W by 2025.
The main source of information on the impact on no-load power consumption is the EPS database of manufacturer information. Manufacturer no-load power consumption information in
Figure
27
show that, for most EPS, manufacturers report no-load losses less than the regulated limits.


Figure 27 - EPS no load power consumption as reported by manufacturers
For AC-DC EPS except low voltage, manufacturer data shows 2.4% (9 out of 369) of the sample with no-load consumption above the regulated level. For low voltage EPS 1.8% (1 out of 57) report no-load consumption above the regulated level.

Figure 28 - No-load energy consumption of the tested EPS
Some limited testing of EPS performance has also been carried out during the evaluation.
Figure
28
shows the no-load results from this. The small number of fixed voltage EPS shown by the grey rings appear to show a similar pattern to that in the manufacturer data.
Most of the testing was on USB-PD EPSs (green, red. and yellow circles). This appears to show no-load consumption in the same range as for fixed voltage EPSs (grey rings). It can be seen that some EPS are not in line with the two no-load consumption thresholds. Although not explicitly shown on this graph, EPSs using silicon and gallium nitride have similar no-load consumption.

Figure 29 - No-load energy consumption at different voltage outputs
An ‘adaptive no-load’ condition is assumed where the EPS is connected to the load, not drawing power, but only to pre-set the output voltage (9V-48V).
Figure
29
shows that for adaptive EPS in these cases the no-load power is much higher than the default 5V no load and increases with output voltage. The uncertainty of the interpretation and the observed variations in performance indicate a need for clarification of the requirements.
Overall, these data show that EPS no-load consumption appears to be in line with the regulated requirements. This would not have been expected to occur through autonomous market developments.
As the US DoE also regulates EPS for no-load conditions, and in most cases, EPS are produced to supply globally, it is probable that some improvement in EU EPS no-load power would have been observed as a result of spill over from that no-load consumption threshold.
Q 1.2 Has the average active efficiency of EPS sold in the EU as a whole improved?
What would have been the improvement in the BaU situation and what developments have been seen in other parts of the world?
Figure
30
shows the situation before the Regulation was put in place and the EU ecodesign active efficiency requirements were less stringent than the US DoE requirements.
|
EPS regulatory requirements
|
Average active efficiency
|
Equivalent to International Efficiency Marking Protocol
|
|
US DoE
|
0.709 – 0.880
|
Level VI
|
|
EU Regulation 278/2009
|
0.655 – 0.870
|
Level V
|
Figure 30 - Comparison of EU and US requirements shown in 2019 IA
The active efficiency for EPS in scope was assumed to improve autonomously but very slowly beyond the existing minimum requirements. There was also considered to be a risk of EPS banned in the US entering the EU market since they could not be sold anymore in the US.
An illustration of the how the efficiency distribution was expected to evolve under BaU for one type of EPS without the intervention is shown in
Figure
31
below (figure 12 of the IA).
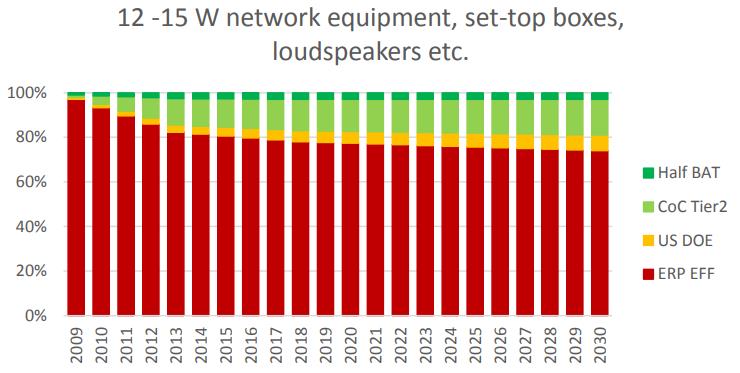
Figure 31 - Distribution of EPS efficiency for one type of EPS
Single voltage EPS except low voltage
Figure
32
shows information published by manufacturers of the active average energy efficiency of single voltage EPS other than low voltage. This shows the majority of published data on EPS are in line with the requirements of the Regulation. Only 2.4% (9 out of 369) report efficiency below the regulated limit. The EPS with average efficiency above the requirements of the Regulation show a spread up to 5% points above the requirements.

Figure 32 - EPS average active efficiency reported by manufacturers
Very similar performance and spread is reported in the United States as shown in
Figure
33
. These two analyses show that active-mode efficiency for basic voltage EPSs follow a similar efficiency level pattern globally as EPS are produced for the global market.

Figure 33 - EPS active mode performance (US DoE)
Low voltage EPS
Figure
34
shows that manufacturers’ catalogues predominantly show active average efficiency performance levels compliant to the regulated requirements for EPS with low voltage outputs.

Figure 34 - Average active efficiency of low voltage EPS reported by manufacturers
Adaptive EPS
To estimate the real-life active mode efficiency and its variation with output voltage, the average 4-point efficiency was measured for USB-PD EPS. The results are shown in
Figure
35
and
Figure
36
. In most cases, the highest efficiency is obtained at maximum voltage, but in some cases the highest efficiency is at an intermediate voltage.

Figure 35 - Efficiency of USB-PD EPSs vs output voltage
Note: Red are the cheapest EPS. Yellow by low-end OEMs. light green by large OEMs. and dark green by the end-device manufacturer (though often manufactured by an OEM)

Figure 36 - Efficiency of USB-PD EPSs vs output voltage
Active efficiency at 10% load
The previous Regulation contained no ecodesign requirements for multiple voltage output EPS, no information requirement for EPS efficiency at 10% load and no general information requirement on EPS performance. In the absence of any requirements there was not expected to be any change in the provision of this information or efficiency of multi voltage output EPS.
In terms of evolution, the problem of EPS providing power output at around 10% of their maximum was expected to increase due to more appliances being always on and in standby mode at lower power levels, including networked devices. Similarly, multiple voltage output EPS were expected to become increasingly popular and provide a means of circumventing requirements that only apply to single voltage output EPS.
The regulation requires the reporting of average efficiency at 10% load.
Figure
37
shows manufacturer reported data on efficiency at 10% load on the left for EPS except low voltage and on the right low voltage.

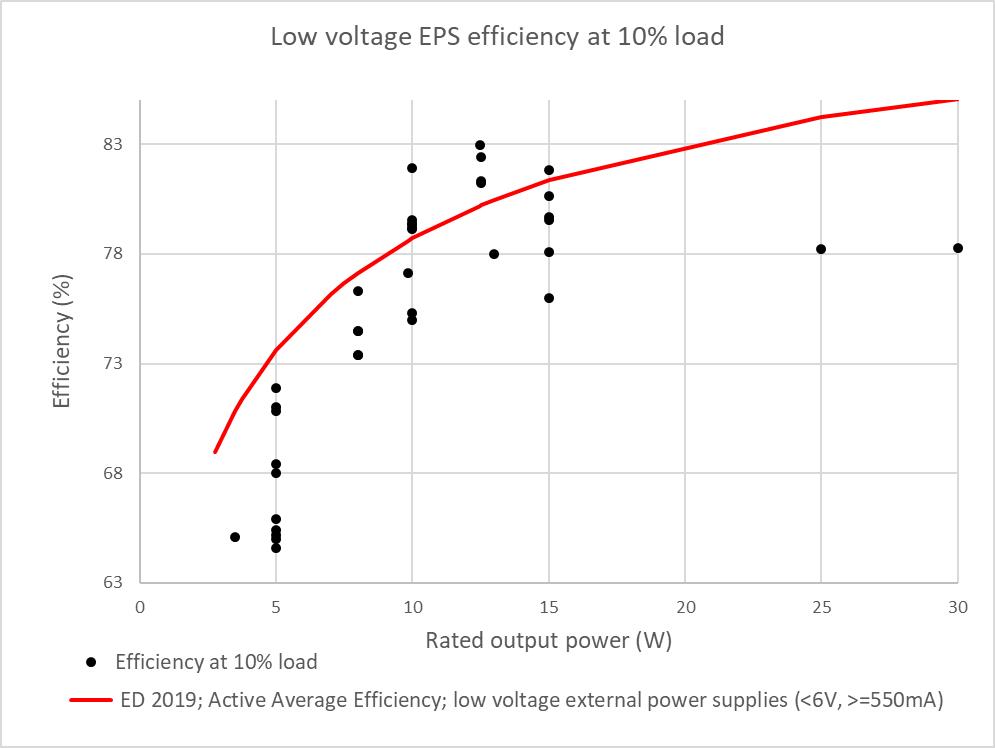
Figure 37 Graphs showing manufacturer reported efficiency at 10% load for single voltage EPS
The figures from the database show that 96% of EPS except low voltage reported efficiency at 10% load. Those not reporting were almost all under 10W. For low voltage EPS the database shows that 70% reported efficiency at 10% load. Those not reporting were all under 7.5W. All of a sample of 46 adaptive EPS reported efficiency at 10% load.
Q. 1.3 To what extent can the achieved improvements be attributed to the EPS ecodesign requirements?
The EPS performance data shows that in the majority of cases the manufacturer reported data respects the requirements of the regulation. This improved performance compared to that observed before the regulation was in place can be attributed to regulatory developments. However, it is hard to disentangle how much of this change is due to the EU regulation and how much to the US DoE requirements.
The EU and US markets for appliances powered by an EPS are of a comparable size. This is likely to mean that need to comply with both sets of regulatory requirements will have had a comparable impact on manufacturers. It is likely to be the case that because both the EU and US requirements are aligned, it provides a stronger incentive for equipment manufacturers to ensure compliance with both and also reduces their cost to do so.
The regulation and the US DoE requirements align with the levels that had been established earlier in the EU Code of Conduct. This would have provided manufacturers with a prior indication on a desirable and achievable level of performance. This may well have meant that manufacturers had a sufficient period to explore designs compliant with these levels and to optimise them thus facilitating their introduction to the market.
Q. 1.4 Has the required energy efficiency information been made available to consumers? How?
Figure
38
illustrates the observation that the information provided on EPS is sometimes confusing and often unreadable. This is primarily because:
·It contains excessive text and data;
·Very small text size (sometimes even smaller than 1mm);
·Colour used makes it difficult to read (e.g. grey over black, pale grey over white).
For adaptive EPS sometimes very complex information is provided. This can include up to 15 lines of text with lots of technical data for multiple-output adaptive EPSs. The range of power combinations can become a complex matrix that is difficult for the consumer to understand.

Figure 38 - Information provided on EPS (source: Flavio Cucchietti)
2. How successful has the regulation been in achieving or progressing towards its objectives?
The answers to Q.1. show that the majority of EPS comply with the regulation’s requirements for no-load and active-mode energy efficiency by a comfortable margin. Based on these data the following questions explore whether the expected outcomes, as a result of requiring more energy efficient EPS, have been achieved.
Q. 2.1 Do the electricity savings match the expectations from the Impact Assessment?
The electricity savings that have been achieved are estimated based on the observed manufacturer declarations of active and no-load efficiency from the database.
Figure
39
shows the comparison for active efficiency. The expected efficiency by class for sales in the year 2025 as shown in the EIA is shown in the first column. The second column shows how far products in each class have over-complied with the requirements in the regulation. The third column shows the expected energy saving for each product class and the fourth estimates the additional savings beyond those expected.
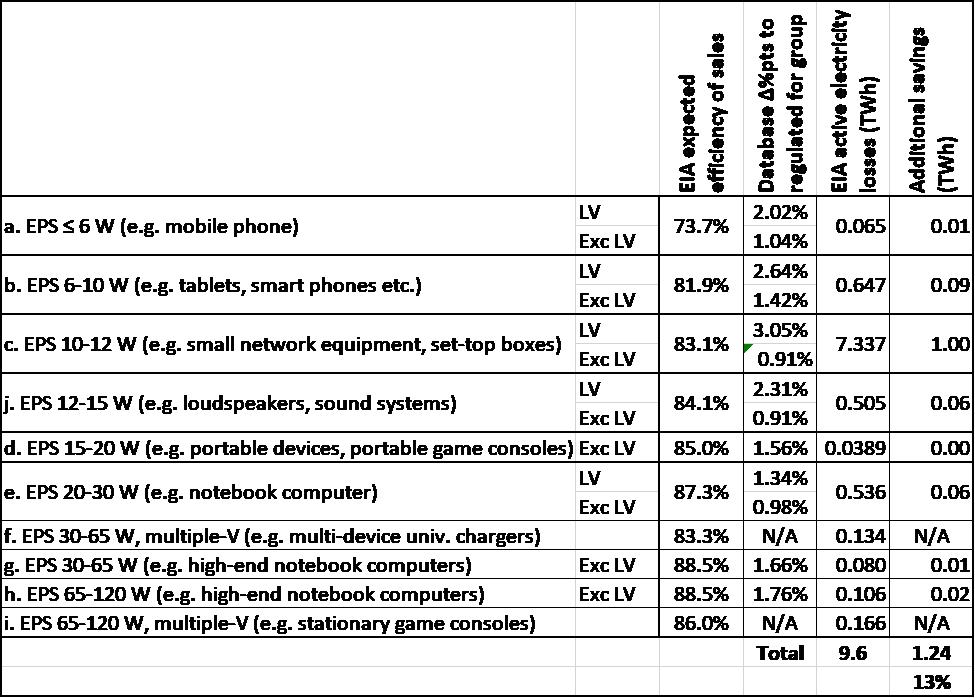
Figure 39 - Comparison of reported with expected active efficiency electricity losses by product class (TWh)
As shown, there is a modest and comparable over-compliance in most EPS classes. The largest contributor to the over-achievement comes from EPS in the 10-12W category, but this is because they constitute the largest stock of EPS. Overall, there has been an approximately 13% extra energy savings in active mode compared to the expectations of the previous impact assessment as now represented in the EIA.
Figure
40
shows the same comparison for no-load losses. The first column shows the expected no-load loss by class in the EIA as a result of the regulation’s requirements. The second column shows how far products in each class have over-complied with the requirements in the regulation. The third column shows the expected no-load energy loss for each product class and the fourth estimates the additional savings beyond those expected.
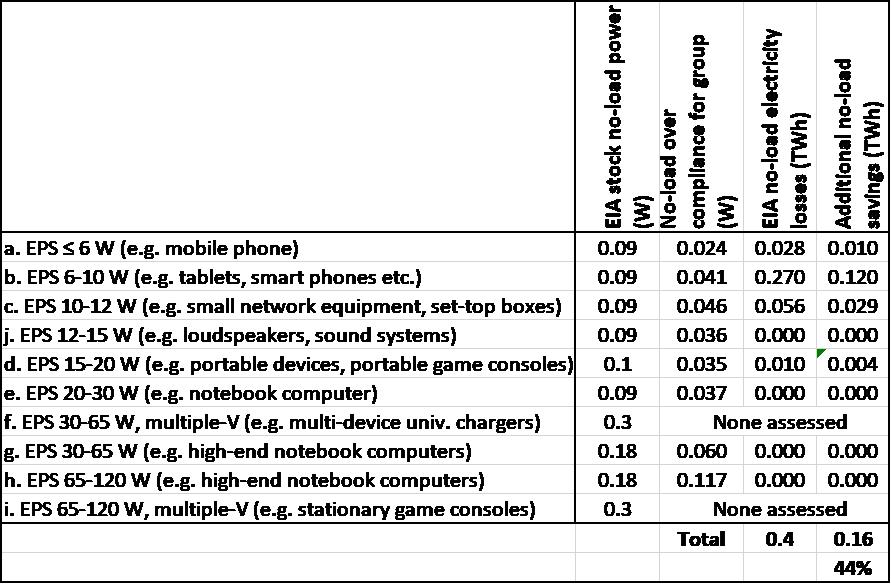
Figure 40 - Comparison of reported with expected no-load electricity losses by EPS class (TWh)
It is important to note that significant no-load benefits were only assumed in the previous analysis for four of the product classes i.e. a, b, c and d shown in the table. In view of that the significantly lower no-load consumption in the other product classes is not assumed to lead to any increased energy savings. For the categories where there is an impact, this amounts to a 44% additional energy saving compared to that estimated in the impact assessment.
It should be noted that the total no-load energy losses amount to only 5% of the active losses. In view of that, the significantly better no-load performance would only make about a further 1.5% contribution to the overall energy savings on top of the active efficiency improvement.
Taken together the impact of the better performance on active and no-load performance should deliver an additional 1.4 TWh of electricity savings per year compared to what had been expected. This means that the overall losses from EPS in 2025 would be reduced by around 14% compared to the losses expected.
Q. 2.2 Do the GHG savings match the expectations from the Impact Assessment?
Electricity GHG intensity
The evolution of EU climate policy has led to stricter climate related requirements and a more rapid decarbonisation of the electricity generating sector than was assumed. The Impact Assessment assumed a GHG intensity decreasing from 0.43 Mt CO2/TWh in 2000 to 0.39 Mt CO2/TWh in 2016 and to 0.34 Mt CO2/TWh by 2030. As can be seen in
Figure 41
the actual trajectory observed from 2000 is considerably below that assumed in the impact assessment and the expected future values are far lower than had been assumed. The % reduction in GHG savings due to this in each year is shown in the last row.
|
|
2000
|
2005
|
2010
|
2015
|
2020
|
2021
|
2025
|
2030
|
|
Interpolated IA assumed Mt CO2/TWh
|
0.43
|
0.418
|
0.405
|
0.393
|
0.376
|
0.372
|
0.358
|
0.34
|
|
Electricity generation
Mt CO2/TWh
|
0.394
|
0.379
|
0.335
|
0.314
|
0.229
|
0.275
|
0.179
|
0.90
|
|
Source
|
EEA GHGs emission intensity of electricity generation
|
REPOWER EU projection
|
|
Reduction in GHG savings compared to IA
|
|
|
|
20%
|
39%
|
26%
|
50%
|
74%
|
Figure 41 - Observed and projected electricity GHG intensity
As
Figure 41
shows, in 2021 the actual GHG intensity of EU electricity generation was around 26% lower than that projected in the IA. As a result, the GHG savings per unit of energy saved will be that much lower than were projected.
Q. 2.3 Do the primary energy savings match the expectations from the Impact Assessment?
Primary Energy Factor (PEF)
A PEF of 2.5 was used in the IA to calculate the primary energy savings based upon the avoided electricity use as set out in the Energy Efficiency Directive (EED)
Annex IV. When the EED was revised in 2018 the PEF was changed to 2.1 with effect from the end of that year. The actual primary energy factor of electricity generation has continued progressively decreasing and is projected to decrease further to 2030 as shown in
Figure 42
below. As a result, the PEF has again been revised to 1.9 from the end of 2022. The change in PEF results in lower primary energy savings than projected as shown in the last row.
|
|
2015
|
2020
|
2025
|
2030
|
|
Electricity PEF
|
2.40
|
2.12
|
1.87
|
1.60
|
|
Source
|
Support to Primary Energy Factors Review
|
|
Reduction in primary energy savings due to lower actual PEF
|
4%
|
15%
|
25%
|
36%
|
Figure 42 - Electricity PEF from review support study
Compared to the assumed PEF of 2.5 used in the IA, the use of a PEF of 2.1 would result in only 84% of the estimated primary energy savings for the same level of electricity saved. With the PEF of 1.9 effective from 2023, the estimated primary energy savings would be only 76% of those calculated previously.
Based on the calculated PEF values shown in
Figure 42
, the PEF value for 2022 can be estimated by interpolation as 2.02. In view of this primary energy savings in 2022 will have been 81% of the estimated primary energy saved per unit electricity saved.
Q. 2.4 Do the consumer energy cost savings match the expectations from the Impact Assessment?
Electricity prices
Electricity prices used in the impact assessment were obtained from the PRIMES 2016 model (scenario REF2015f). The values used (2015 prices) are shown in
Figure 43
below:
|
|
2010
|
2015
|
2020
|
2025
|
2030
|
|
Households. €/kWh
|
0.175
|
0.194
|
0.207
|
0.213
|
0.217
|
|
%
|
75%
|
76%
|
76%
|
75%
|
76%
|
|
Services. €/kWh
|
0.151
|
0.160
|
0.174
|
0.180
|
0.183
|
|
%
|
25%
|
24%
|
24%
|
25%
|
24%
|
|
Final electricity price. €/kWh
|
0.169
|
0.186
|
0.199
|
0.205
|
0.208
|
Figure 43 - Electricity prices assumed in the previous Impact Assessment
The recent Russian aggression against Ukraine has led to energy market consequences and substantially higher electricity prices in 2022. Prices had already been rising in 2021.
|
|
2010
|
2015
|
2020
|
2021
|
2022
|
|
Households EU27 2.5MWh<5MWh inc. taxes and charges €/kWh
|
0.175
|
0.208
|
0.213
|
0.228
|
0.268
|
|
|
|
|
|
|
|
|
|
Assumed % of price composition
|
75%
|
76%
|
76%
|
76%
|
76%
|
|
|
Non-household EU27 500MWh<2GWh inc. taxes and charges €/kWh
|
0.128
|
0.144
|
0.156
|
0.167
|
0.236
|
|
|
Assumed % of price composition
|
25%
|
24%
|
24%
|
24%
|
24%
|
|
|
Final electricity price €/kWh
|
0.163
|
0.193
|
0.199
|
0.213
|
0.260
|
|
|
Final electricity prices €2015/kWh
|
0.175
|
0.193
|
0.188
|
0.196
|
0.219
|
|
Figure 44 - Eurostat data on EU 27 electricity prices
Figure 44
shows Eurostat data for EU27 household and non-household electricity prices. When deflated to €2015 it can be seen that outturn electricity prices have been quite similar to those assumed in the impact assessment for the period 2015 to 2025.
Figure
45
shows the percentage variation between the IA assumed prices and the outturn.
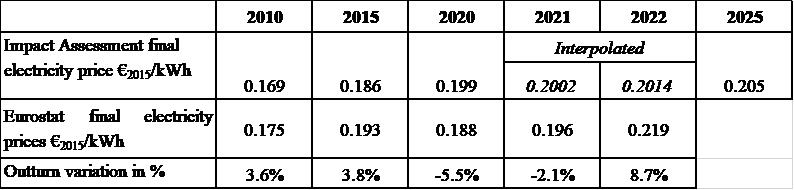
Figure 45 - Percentage variation in outturn electricity prices versus IA assumptions
As a result, consumer electricity costs savings will have been slightly lower per kWh saved than expected in 2020 and 2021 and slightly higher than expected in 2022. In view of the small deviation and the unexpected events in 2022 these do not point to any significant error in the underlying assumptions. From 2022 onwards the consumer savings will continue to be slightly higher per kWh saved.
Q. 2.5 Are their other unexpected outcomes from the regulation?
As shown by manufacturers' information and NDT results, the performance of most EPS matches the objectives of the Regulation and for some goes beyond its requirements.
While the Regulation doesn’t have any material efficiency requirements,
Figure
46
shows that recent EPS models using GaN (green circles) have a higher material efficiency than EPS using conventional technologies (yellow circles).

Figure 46 - Material efficiency of adaptive EPS
Figure
47
shows that single voltage EPS (rightmost white bars) have a much lower material efficiency than adaptive EPS.

Figure 47 - Material efficiency of adaptive and single voltage EPS
Improved material efficiency contributes to lower consumption of materials and the need for less end-of-life treatment and therefore lower environmental impacts from these life stages. Lower weight also results in reduced GHG and pollutant emissions during transport.
Economic efficiency (cost/watt) was not an objective of the regulation, but this indicator gives some useful insights. To assess the price
per rated power (W), Power on the y axis is mapped against €/W on the x axis in
Figure
48
. Both GaN and conventional EPS show a large degree of variability in €/W. However, €/W is in the same range for GaN EPS as Silicon-based EPSs, which implies that there is no cost increase with GaN. This was validated by consultation with component manufacturers.
This illustrates that technological progress, (replacing Si with GaN) and the higher efficiency associated with it is economically viable and should lead to lower consumer prices for the same rated output power. The latter is only relevant for unbundled EPS when bought separately as a replacement EPS or for a product which is not supplied with an EPS. There is no guarantee this price saving will be passed to the consumer.
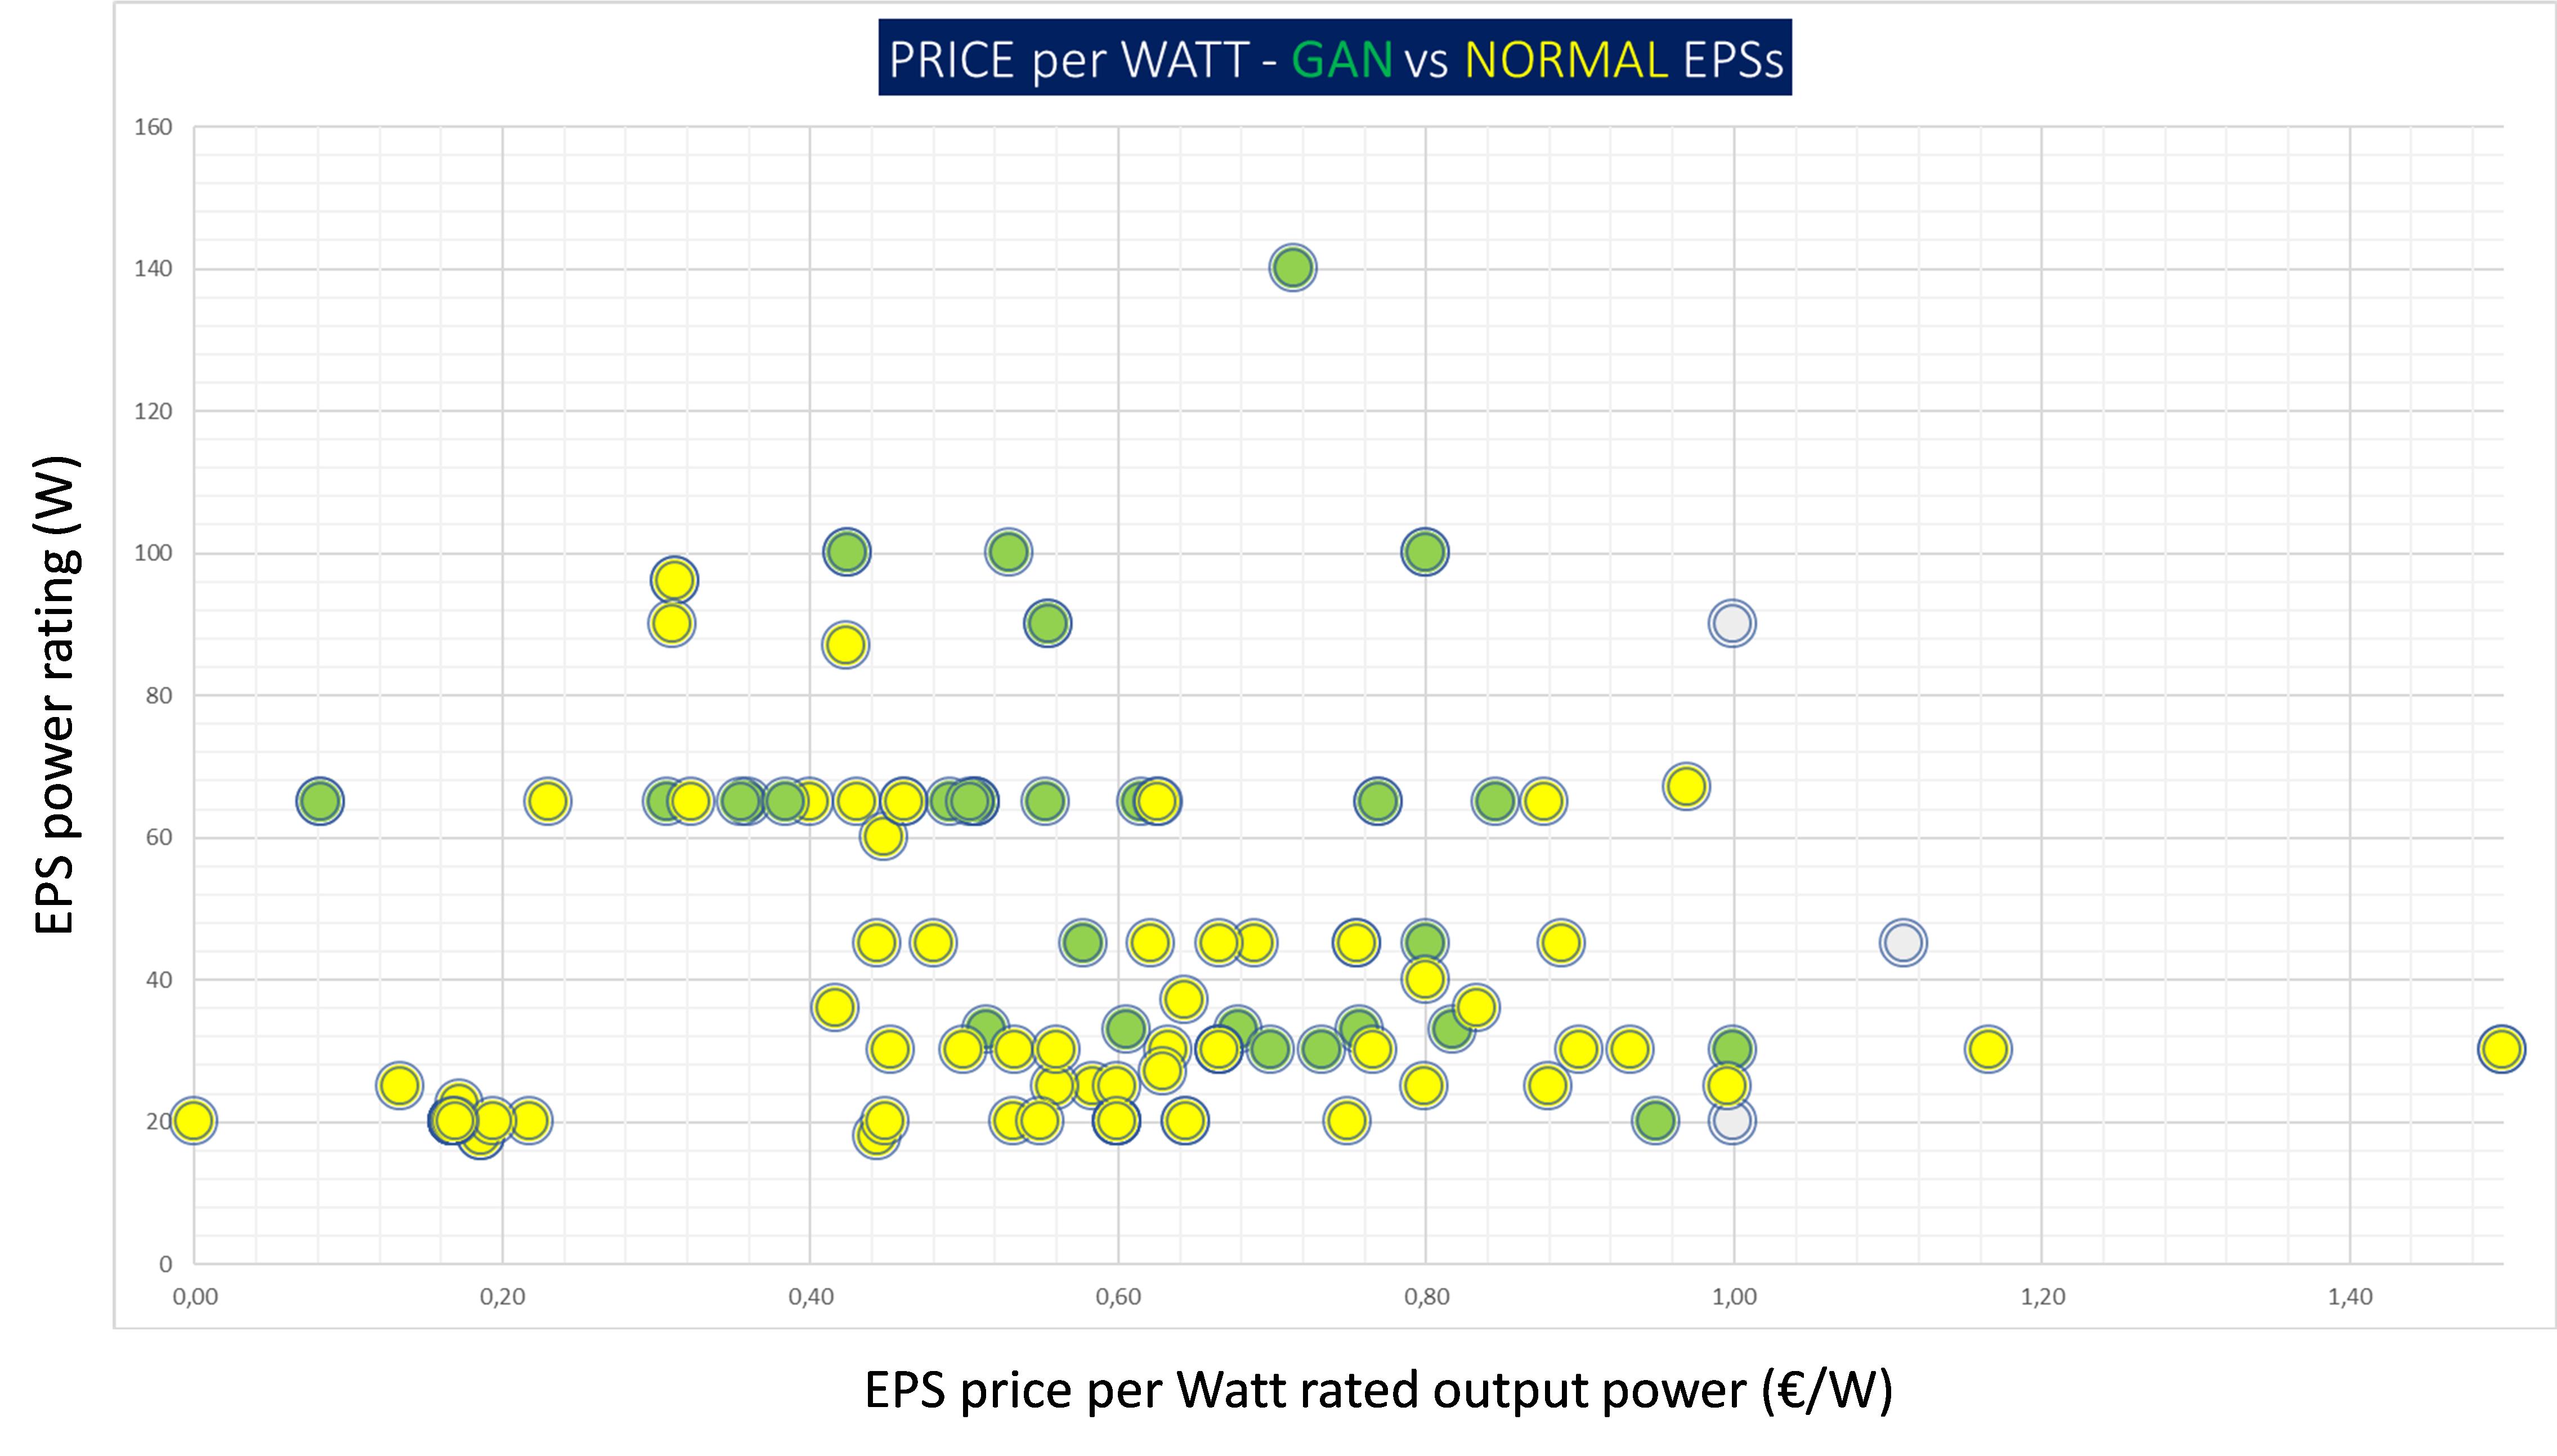
Figure 48 - Economic efficiency of the tested EPS
3. What factors have contributed to or hindered their achievement?
3.1 To what extent have the ecodesign requirements been sufficient to contribute to improving the performance of EPS and meet minimum energy efficiency requirements? (MEErP Task 6. 7)
As illustrated in the answers to Q 1.1 and 1.2. the ecodesign requirements have contributed to improve the energy efficiency of EPS. However, for no-load consumption, there remains a larger margin for further improvement. The US EPS regulations have also contributed to the improvement of EPS energy efficiency and thus through spillover effects may have contributed to achieving the objectives of the EU Regulation.
3.2 Have there been EPS technological improvements that contributed to increased energy efficiency?
A key technological development is pulse-width modulation which is also used in switching power supplies, one of the most common examples of power conversion. Switching power supplies are the type used to power virtually all personal computers, mobile devices, and appliances that run on DC. Basically, the input AC voltage is converted to DC, and then that DC is “chopped” into a high-frequency alternating-current square wave. This chopping is done by power transistors, which create the square wave by switching the DC on and off. The square wave is applied to a transformer that changes the amplitude of the wave to produce the desired output voltage. To get a steady DC output, the voltage from the transformer is rectified and filtered.
Advances in semiconductor technology, in particular gallium nitride (GaN), is another reason for improvement in power electronics. It is one of two semiconductors—the other being silicon carbide (SiC)—that have begun displacing silicon-based electronics in enormous and vital categories of power electronics. GaN and SiC devices perform better and are more efficient than the silicon components they are replacing. This technological progress (GaN technology) and the respective cost reductions have encouraged the adoption of GaN, which offers higher energy efficiency. GaN’s main advantage is its extremely high electron mobility. Electric current, the flow of charge, equals the concentration of the charges multiplied by their velocity. So you can get high current because of high concentration or high velocity or some combination of the two. The GaN transistor is unusual because most of the current flowing through the device is due to electron velocity rather than charge concentration. What this means in practice is that, in comparison with Si or SiC, less charge has to flow into the device to switch it on or off. That, in turn, reduces the energy needed for each switching cycle and contributes to high efficiency. GaN’s high electron mobility allows switching speeds on the order of 50 volts per nanosecond. That characteristic means power converters based on GaN transistors operate efficiently at frequencies in the multiple hundreds of kilohertz, as opposed to about 100 kilohertz for silicon or SiC.
Taken together, the high efficiency and high frequency enable power converters based on GaN devices to be smaller and lighter. High efficiency means smaller heat sinks and operation at high frequencies means that the inductors and capacitors can be very small too.
Starting in 2019, GaN-based wall chargers became available commercially from companies such as GaN Systems, Innoscience, Navitas, Power Integrations and Transphorm. The high switching speeds of GaN coupled with its generally lower costs. have made it the incumbent in lower-power markets (25 to 500W), where these factors, along with small size, are paramount.
3.3 What external factors have affected progress towards the objectives, and how are they linked to the EU intervention?
In additional to technological progress, other EU related external factors which have affected progress towards the objectives are: electricity price changes due to geopolitical reasons; lower GHG emission intensity of electricity generation and a lower Primary Energy Factor. In addition to these is the possible impact of the US regulations.
The effect of each of these factors on achieving the objectives of the Regulation are shown in the answers to Q2. A summary of the impact on the outcomes from each factor and the direction of the impact it has caused is shown in the table below.
|
Factor
|
Electricity price
|
Electricity GHG intensity
|
EU PEF
|
US regulation
|
|
Impact on:
|
|
|
|
|
|
Electricity savings
|
N/A
|
N/A
|
N/A
|
IMPACT ≈
|
|
GHG savings
|
N/A
|
IMPACT ˅
|
N/A
|
N/A
|
|
Primary energy savings
|
N/A
|
N/A
|
IMPACT ˅
|
N/A
|
|
Consumer energy cost savings
|
IMPACT ˄
|
N/A
|
N/A
|
IMPACT ≈
|
Table 36 - Impacts of EU related external factors
4. How effective has the implementation and enforcement of the Regulation?
There is not sufficient market surveillance information available from Member States. The ICSMS database only has data from Germany. Information was received directly from Denmark. Despite reminders sent to Member States seeking more information, no additional information was received about implementation and enforcement in other Member States.
4.1 Status of market surveillance in MS? Does it differ compared to other products regulated by the Ecodesign Directive?
From a sample of 258 EPS units tested in Germany, 57% appeared to be non-compliant.

Figure 49 - Compliance rate of the EPS (Source: ICSMS data)
In 2020. Denmark tested 117 EPS for compliance with both Regulation (EU) 278/2009 and Regulation (EU) 2019/1782, but they were not reported in the ICSMS database. 48 EPS failed in compliance for no-load, while 33 failed for average efficiency threshold. Out of these, 22 failed on both while others were on one of the thresholds. Some EPS also failed for the threshold levels of Regulation (EU) 278/2009: 8 for no load and 6 for average efficiency threshold; out of these, 3 failed for both.
Market surveillance for EPS appears to be less active than for other household goods. Projects such as EEPLIANT (https://eepliant.eu), EEPLIANT2 and EEPLIANT3 have focussed on market surveillance of products such as lamps, printers, space heaters, household refrigerating appliances, professional refrigeration products, comfort fans, household tumble dryers, water heaters and hot water storage tanks, ventilation units, lighting products and local space heaters.
4.2 Is there non-compliance with the Regulation requirements? If so, how much of that is due to poor enforcement?
As shown in section 1, based on manufacturer data, EPS largely comply with the regulation’s no-load and active efficiency requirements as well as the marking of efficiency at 10% load. The German example showed significant non-compliance for the products sampled. However, since sampling is risk based, the non-compliance rates observed cannot be assumed to be the same for the whole market. The German MSA stated that the reasons for non-compliance were:
·Non-conformities with power consumption at no load;
·Non-conformities with requirements on average active efficiency;
·Non-conformities with requirements for information on the nameplate;
·Non-conformities with requirements on published data;
·Failure to achieve the output power or output current advertised on the nameplate
·Failure to comply with the "efficiency at low load (10%)" declaration by the manufacturer;
·Non-compliance with "Article 2 (Definitions)", as some manufacturers claim that their power supply - for example installed in a socket cube - is not (at all) covered by the EPS regulation;
·Missing address;
·Contractual relationship between importer-manufacturer not clear.
Efficiency
Q4. Are the costs related to the Regulation proportionate to the benefits?
The administrative and regulatory burdens are similar to the prior Regulation (EC) No 278/2009. The measurement of active average efficiency follows the same test procedure (same test setting) as before and there are therefore no additional test costs. The new element in Regulation (EU) 2019/1782 is the reporting for the measurement at 10% load point, which led to minimal additional test costs (estimated at a maximum of €100 per model) given the synergies with active average efficiency testing. Additional cost per EPS will not have been more than a few cents.
There has been no significant price increase (especially B2B) during the last few years due to technological progress
. Minor cost increases, if any, may have been absorbed by industry or OEMs who supply the EPS with their products. However, power electronics component prices have increased recently (perhaps temporarily) due to chip shortages. The market trend is towards power supplies with increased efficiency (i.e. more benefits) and cost reduction
. This would mean that higher efficiency is leading to lower energy losses without any increase in costs to consumers.
The factors linked to the intervention which could influence efficiency are the costs related to market surveillance and enforcement costs. While they would be similar to the 2009 regulation, it seems that little market surveillance means those costs were not incurred. Another factor which could influence the costs and benefits is the EPS lifetime. While in most cases, EPS outlive the product with which they were supplied, in case of breakdown (cheaper EPS), accident or loss, additional costs will be incurred by consumers, and often the EPS sold directly to consumers can be 2 to 3 times higher than the B2B cost.
No specific inefficiencies have been identified.
Competitiveness
No substantial manufacturing of consumer EPS occurs in Europe. However. two of the major global market leaders in (power) electronic components Infineon and ST Microelectronics are from Europe. The latter is investing in the leading GaN manufacturer Exagan and expanding capacities.
Regulation has had no observed negative impact on the competitiveness of European suppliers in the EPS business and none has been reported in any interviews or feedback received.
Relevance
Q5. Does the Regulation correspond to the current needs of the EU?
The scope and objectives of the intervention remain relevant over the implementation period. However, many more products are entering the markets (e.g. products with charging as a secondary function, wireless chargers, e-bikes), which are not covered by the scope of Regulation (EU) 2019/1782, but which are powered by EPS or could be powered with these instead of an internal power supply
Q 5.1 How did the objectives of the intervention correspond to wider EU policy goals and priorities?
The objectives of the intervention correspond to wider EU policy goals, such as the EU Green deals and its climate targets. The overall ambition of the climate targets has increased along with demands for more energy savings and Regulation (EU) 2019/1782 contributes to energy savings and resulting GHG reduction.
The Circular Economy Action Plan calls for measures to reduce e-waste
with goals like creating the right to repair and improving reusability in general, introduction of a common charger and establishing a rewards system to encourage recycling electronics. Most EPS have a life longer than the products with which they are delivered as accessory, they continue to accumulate in households and often become e-waste. About 25% of the EPS at the end of their active use become part of e-waste.
Circular economy aspects are not addressed by Regulation (EU) 2019/1782.
Q 5.2 To what extent is the intervention still relevant in view of its objectives?
How well do the (original) objectives of the intervention still correspond to the needs of the EU?
The intervention remains relevant as the products requiring an EPS are still consumed by society and new products requiring EPS are appearing on the market which is likely to lead to an increased demand and stock of EPS.
The original objectives remain valid since energy and GHG savings remain a high priority for EU policy. However, since the overall policy objectives have been strengthened, this might justify a higher ambition level for example through higher average active efficiency, lower no load power consumption, and energy efficiency requirements at low load (10%), which is an aspect where no limits were defined in the existing Regulation.
Q 5.3 To what extent do the needs/problems addressed by the intervention continue to require action at EU level?
While the market seems to respond to the Regulation based on manufacturer data, there is not sufficient market surveillance information to provide assurance that the intervention is effective in fully delivering the results expected.
Q 5.4 How well adapted is the intervention to the technological progress that has happened since its introduction?
How well adapted is the intervention to social. and environmental changes?
The main change in terms of technological development is the arrival on the market of new products requiring EPS. Many of these products may be outside the scope of the current Regulation and that would require a change in the intervention for them to be addressed.
In terms of efficiency, technological progress shows that EPS with much higher efficiency can be produced at almost the same cost (manufacturer data shows EPS already perform better than the efficiency limits of the Regulation), the intervention is no longer well adapted and could be revised to better align with existing and upcoming technologies.
In terms of interoperability, despite the potential of a USB-PD ‘universal charger’ solution. the global market for power electronics in the consumer market continues to grow, according to leading market research companies (Yole Développement. 2021). The existence of USB / USB-PD has not led to EPS reuse by consumers at a large scale. The testing of the new USB standards (USB-PD) need to be reflected in the regulation.
Q. 5.5 Are the regulation’s requirements sufficiently stringent in view of developments in other jurisdictions?
There is a global shift toward IEC energy efficiency level VI,
Figure
50
shows that this is becoming a de-facto standard. Regulation (EU) 2019/1782 requiring this level of performance followed legislation in the US and Canada.

Figure 50 - Evolution of Regulations in the EU, US, Australia and Canada
In the US, DoE has done extensive work to review the EPS efficiency limits, with detailed cost curves and different thresholds. DoE recently initiated the process to revise the US Energy Conservation Standards for External Power Supplies. A notice of proposed rule making has now been published. For single-voltage EPS this is essentially aiming at the tier 2 level of the EU CoC. For multiple voltage EPSs, DoE envisages raising the efficiency requirements by as much as 2.5% and the no-load power consumption limits have been significantly reduced. These developments support the view that there is scope for strengthening the EU Regulation.
The test procedure for External Power Supplies (10 CFR Part 430) specifying test requirements has been effective since 19 September 2022, e.g. for adaptive external power supplies that conform to USB-PD specifications. Also, the active average efficiency to meet minimum requirements at the highest and lowest supported voltage levels. This test will be mandatory for product testing starting 15 February 2023.
Q 5.6 How relevant is the intervention to EU citizens? Will it continue to be relevant for them in the near future?
Consumers are probably unaware of the energy efficiency of EPS and are unlikely to give much consideration to it when making a purchase, especially since most EPS are sold bundled with products. Despite this, given the lengthy periods for which most EPS will be used, the energy and cost savings for consumers are non-negligible. Technological development suggestions that there could be further savings to be realised in the future, that would be unlikely to materialise in the absence of regulatory requirements.
Consumer’s need for information on the characteristics and performance of EPS remains valid. Even with multi-voltage EPS it is still important to have EPS with adequate power for the device. As more devices and EPS are powered via interchangeable connectors such as USB-C, the need for information increases as the same EPS can be used with multiple products. This need is likely to increase as more devices can be interchanged with different EPS and the number of different products requiring an EPS grows.
In view of these considerations. the Regulation remains relevant for providing relevant information to consumers in order to choose a proper EPS and for providing them with energy and costs savings that they would otherwise forego.
Q6. How Flexible is the Regulation with regard to other policies and new issues?
The scope of the Regulation is fixed (by its Annex I) and doesn’t therefore provide flexibility to include new products which use an EPS. Similarly, it has no flexibility in relation for example to unbundling EPS from products.

Figure 51 - Outlook on synergies of different legal acts (as regards interoperability)
The regulation does not contain any specific elements related to the common charger initiative and RED (see
Figure 51
). The regulation does not specifically identify (e.g. through product marking) the harmonised EPS that facilitates interoperability. Interoperability has the potential to reduce consumer need to purchase EPS and increase consumer convenience through ensuring that the same EPS can be used with multiple products.
Coherence
Q. 7 How coherent is the EU intervention?
Q 7.1. To what extent is the intervention coherent internally, with other interventions with similar objectives and with wider EU policy?
The objectives of the measure were to establish ecodesign requirements for EPS in in the light of technological progress made since Regulation (EC) No 278/2009. The articles and annexes of the Regulation are considered to be coherent.
External coherence with related measures was assured with Regulation 1275/2008 on standby and off-mode conditions.
The Regulation lacks any requirements related to circular economy and material efficiency and therefore opportunity for improving coherence remain in this area.
The intervention is considered coherent with wider EU policies with regard to energy saving and GHG emissions reduction. No conflicting objectives or requirements have been observed.
Q. 7.2 To what extent is the intervention coherent with international obligations?
The intervention applies similarly to intra-EU and extra-EU suppliers and applies to the EU Single Market only. A level playing field for intra/extra EU suppliers is ensured, and the regulation passed WTO scrutiny in the period before publication in 2019.
EU-added value
Q8. What is the EU added value of the intervention?
Q. 8.1 What is the additional value resulting from the EU intervention. compared to what could reasonably have been expected from Member States acting at national and/or regional levels?
There is no specific intervention at Member state level targeting EPS. By having an EU-wide measure, suppliers have the same set of (harmonised) requirements across the whole EU Single Market. This removes the risk of having to perform different tests and other performance assessments and having to meet different national requirements as regards labelling when placing products on national markets.
For consumers, the intervention brings added value as it provides information on characteristics for choosing an EPS. For suppliers the added value is that they can use the same models for the entire EU market and are not required to prepare for different requirements at national level.
For market surveillance, the added value of the EU measure lies in the mutual recognition of verification assessments performed in other countries. National authorities do not need to perform verification tests on products already verified by other authorities.
Q. 8.2 What would be the most likely consequences of stopping or withdrawing the existing EU intervention?
If the EU ecodesign requirements were stopped it may prompt Member States to develop requirements themselves. This would detrimentally affect the functioning of the EU Single Market.
Evaluation Annex IV. Overview of benefits and costs
The expected achievements at the time of the 2018 impact assessment were:
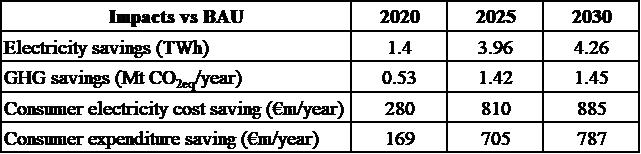
The Regulation applied from April 2020. Therefore, the comparison of its actual impacts to the assumptions in the Impact Assessment can only be done for the period 2020-2023.
Impact of various parameters on the expected impacts
Energy efficiency of EPS
As demonstrated in Q1.4, actual electricity savings have exceeded those expected since on average efficiency exceeds the minimum requirements. Since the 2018 impact assessment calculated the annual savings on the basis that the whole stock of EPS would have been replaced with EPS meeting the new requirements, this is assumed to be achieved by 2025 at the earliest.
Figure
52
shows the annual electricity savings estimated in the IA for the period 2020 to 2030. The preferred option is shown in grey.
|
Policy options
|
Saving vs. BAU, TWh/year
|
|
|
2020
|
2025
|
2030
|
|
1 BAU
|
-
|
-
|
-
|
|
2 Global alignment
|
1.40
|
3.96
|
4.26
|
|
3 Ambitious EU measure
|
1.40
|
4.31
|
4.57
|
|
4 Very ambitious EU measure
|
1.40
|
5.71
|
6.25
|
Figure 52 - IA estimation of the electricity savings from the policy options
Based on the manufacturer database and the calculations shown in Q1.1, it is estimated that when the EPS stock is fully replaced an additional 1.4TWh of electricity savings will be achieved. If this is conservatively only assumed to be the case by 2030 it would represent 33% extra savings. Assuming that the increase in savings is proportionate each year, the additional electricity savings would be 1.3TWh in 2025 and amount to a total of 5.26TWh based on the same assumptions as in the IA.
BREXIT
The UK leaving the EU in 2021 had the effect of reducing the overall size of the market covered by the Regulation. Nevertheless, the effects of the Regulation have been maintained in the UK after it ceased to be a member, as the new post-BREXIT requirements have been aligned with the EU rules. The BREXIT factor used in the EIA to account for the UK share of EPS sales is 15%.
If the UK share of EPS sales are removed from the estimation of its benefits, then these can be assumed to be to be 15% lower. This would reduce the estimated 5.26TWh annual electricity savings in 2025 to 4.47TWh.
Electricity GHG intensity
Figure
53
below shows how the actual GHG intensity of EU electricity generation has changed compared to the assumptions used in the IA. This shows that the actual GHG intensity is significantly lower than was assumed.
Figure 53 - Assumed and outturn electricity GHG intensity
The trend is less consistent than it would otherwise have been due to the impacts of COVID and the Russian aggression in Ukraine. Overall, it is clear that the GHG intensity is at least 25% lower than anticipated and may be as high as 30% lower for the period considered.
Figure
54
shows the annual GHG savings estimated in the IA for the period 2020 to 2030. The preferred option is shown in grey.
|
Policy option
|
Reductions vs. BAU Mt CO2eq/year
|
|
|
2020
|
2025
|
2030
|
|
PO1 BAU
|
-
|
-
|
-
|
|
PO2 Global alignment
|
0.53
|
1.42
|
1.45
|
|
PO3 Ambitious EU measure
|
0.53
|
1.55
|
1.55
|
|
PO4 Very ambitious EU measure
|
0.53
|
2.05
|
2.12
|
Figure 54 - IA estimation of the GHG savings for the policy options
In view of the lower outturn GHG intensity, the actual GHG savings will have been reduced compared to the assumptions.
If the known 2021 GHG intensity is used with the energy savings achieved after accounting for over-achievement and BREXIT, then in 2025 the GHG savings would amount to 1.23MtCO2. If, however, the projected GHG intensity from REPOWER EU is used then in 2025 the GHG savings would be only 0.8MtCO2.
Final electricity prices
Figure
55
below compares the electricity price assumptions used in the IA with the actual prices adjusted for inflation.
|
|
2015
|
2020
|
2021
|
2022
|
|
Assumed final electricity price. €/kWh
|
0.186
|
0.199
|
0.200
|
0.201
|
|
Actual final electricity prices €2015/kWh
|
0.193
|
0.188
|
0.196
|
0.219
|
|
Outturn change compared to IA
|
+3.7%
|
-5.5%
|
-2%
|
+9%
|
Figure 55 - Comparison of IA assumptions and outturn electricity prices
Although the data do not cover the whole period and prices are not available for 2019, it can be seen that there does not appear to have been any consistent over or under estimation of prices. Nevertheless, electricity prices remain higher than before the energy crisis and so the +9% outturn in 2022 is assumed to continue into the future.
The electricity cost savings estimated in the IA based on the estimated electricity that would be saved are shown in the table below:
|
Policy options
|
Saving vs. BAU, €m/year
|
|
|
2020
|
2025
|
2030
|
|
PO1 BAU
|
-
|
-
|
-
|
|
PO2 Global alignment
|
280
|
810
|
885
|
|
PO3 Ambitious EU measure
|
280
|
882
|
950
|
|
PO4 Very ambitious EU measure
|
280
|
1,169
|
1,298
|
Table 37 - Electricity cost savings
In fact, total electricity savings in 2025 taking account of over-compliance and BREXIT are calculated to be 13% higher than estimated in the IA. The 9% higher electricity prices result in consumer savings 23% higher than estimated in the IA. This would mean that consumer savings would be €997mln per year in 2025.
Impact of the PEF
To estimate the primary energy savings a Primary Energy Factor is used as set out in Annex IV of the Energy Efficiency Directive. At the time that the Impact Assessment was carried out the PEF value was specified as 2.5. This means that the primary energy savings were calculated as being 2.5 times the final electricity savings. As the table below shows, the actual value of the PEF when the Regulation applied from 2020 onwards was around 2.1 and decreasing.
|
|
2015
|
2020
|
2025
|
2030
|
|
Actual electricity PEF
|
2.40
|
2.12
|
1.87
|
1.60
|
|
Lower primary energy savings due to lower actual PEF
|
4%
|
15%
|
25%
|
36%
|
|
Source: Support to Primary Energy Factors Review
|
Table 38 - Primary energy savings as a function of the PEF
The PEF value in 2020 was 15% lower than the value used in the IA and this was expected to increase to 25% lower by 2025. The future figures may be impacted by the same factors that influenced the GHG intensity of electricity generation. Nevertheless, it seems reasonable to assume that the PEF will have been at least 15% lower than was assumed having a comparable impact on the actual primary energy savings. This means that these will have been around 0.64 TWh lower per year than was estimated.
Costs and employment impacts
Because it was not possible to gather any data on the costs of compliance or the price of products regulated, it has not been possible to make any revised estimates of the increased costs of the products or any consequent employment impacts.
Evaluation Annex V. Stakeholder consultation – summary of comments relevant to the evaluation
Stakeholder were invited to provide comments through a Call for Evidence covering the back-to back evaluation and Impact Assessment. Only stakeholder comments related to the evaluation are summarised below:
Applia
APPLiA note that for some products there might be a use case for 10% load operation. but for the majority of the EPS there is none or at best only during a limited timeframe. In preparing the previous IA the relevance of 10% load for certain ICT equipment was raised but it also acknowledged the lack of relevance for EPS for battery operated devices. For these typically. EPS will shut off at 15%-20% load levels. USA DoE data states over 80% of EPS are used for battery charged devices.
ECOS
Raised concern over limitations of “Back-to-back evaluation” procedure. Concern there are insufficient opportunities for consideration of stakeholder comments.
Note analysis currently under way by US DOE to revise their EPS efficiency metric. This implies that further savings should be possible.
The Common Charger initiative means that EPS are increasingly likely to be used at a wide range of loading levels – in particular at lower loading levels. EPS typically operate at reduced efficiency at these lower loads.
The scope of the regulation should be expanded to results in the best possible savings.
EPS and cables are currently marketed using a range of current (A), power (W) and cable features on packaging in a non-standard way that is confusing for consumers.
There is a lack of information on EPS and cables once they are out of their packaging. Users may have identical-looking EPS with different power ratings, and identical-looking cables that offer different charging performance or functions.
ITI
ITI supports voluntary approaches to common charging solutions. Recalls that the 2021 IA study says “the vast majority of mobile phones and EPS from major OEM manufacturers are in fact interoperable”. Market participants have provided products that are more interoperable. energy‐efficient and smart charging that can safely handle various power needs of different devices. Information requirements may be insufficient for EPSs which implement proprietary charging protocols in addition to USB-PD charging protocols.
IARU
IARU draw attention to the potential of switching power supplies to contribute to spectrum pollution. The recent evaluation of the EMC Directive covers this topic in detail.
The last-published report
by EMC MSAs showed 56% of the devices tested met the technical emissions compliance tests. It is hoped that more recent market surveillance reports will show greater compliance. EPS cables can act as an antenna adding to spectrum pollution. A lack of comprehensive standards for cables can result in poor quality cables being used in the marketplace. Testing requirements should reflect typical use cases of EPS with associated cabling.
ANEC / BEUC
The review of the EPS Regulation should assess it is successful in achieving its objectives.
Believe that the scope in the Regulation’s Annex I is too limited. It should be complementary to the Ecodesign Regulation on smartphones and tablets and the ongoing Revision of Radio Equipment Directive.
Important to see whether further efficiency improvements can be achieved at lower loads.
Starkey Laboratories
Power supply efficiency and environmental regulations should be harmonised globally to permit use of products around the world. At present this condition is met by the Level VI requirements. If a higher level of efficiency is required. it should be harmonised with requirements in North America. Asia. and Australia.
EU Citizens
Estonia (citizen) Any ecodesign is useless if it is outdated or not implemented in the consumer world.
Annex 8: The SME test
Identification of affected businesses
The EU SME Envoy has not signalled to the Commission that this initiative merits close attention from an SME perspective. Nevertheless it is important to assess to what extent the initiative is relevant for SMEs. To provide answers to this question it is broken down into the following steps:
– Are SMEs within the scope of the legislative initiative?
Various sectors are likely to be impacted by the measures considered and SMEs in them will therefore also be impacted.
The primary sector to be impacted is the manufacture of EPS. EPS are to a high degree largely standard commodity products. Their manufacture is at a large scale and no SME manufacturer of EPS has been identified. While some design and research is performed in the EU. manufacture is mainly carried out in lower cost countries.
The sales sector through which EPS are provided to end customers will contain SMEs. To the degree that the initiative impacts on the value of individual sales (either increasing it through technical requirements or reducing it through interoperability) it will also have a similar impact on SME turnover.
SMEs will be users of EPS for their business operations. for example for IT equipment. They will be affected by the energy savings and potential to reuse EPS thereby avoiding purchase costs. These impacts are likely to scale with the amount of such equipment in use and be proportionate to benefits experienced in larger businesses.
– Does the initiative specifically target SMEs?
The initiative does not specifically target SMEs.
– Will the SMEs be significantly impacted directly or indirectly by the legislative initiative?
The two sectors where SMEs are likely to be most affected are in sales of EPS and their end use.
In the case of the sales sector. EPS are relatively low cost and therefore any reduction in sales will have a small impact on overall revenue. As an illustration the Ecodesign Impact Accounting estimates for 2030 that business revenue from the sale of EPS would represent €3bn. This compares to total sales of €240bn for other electronic products regulated under ecodesign which are by far from all electronic products on sale. Since the initiative would only lead to a partial reduction in the EPS sales. while partly increasing their cost the impact would be less than 1% of revenue. This change would take place over the replacement cycle of products or EPS meaning it would be likely to be spread over some ten years. It can be concluded that the impact on SMEs in this sector will not be significant.
The scale of impact on SMEs purchasing EPS is the mirror image of that on SMEs in the sales sector. However. in addition SMEs using EPS will also benefit from the increased efficiency and durability of EPS. Added together these savings will still be modest and will likely be comparable in proportion to the impacts on large businesses.
– Are SMEs impacts likely to be more substantial than on other companies. for example in terms of adverse effects?
There is no reason to expect that SMEs in either of the sectors identified will be more substantially impacted than larger businesses either for the positive or adverse impacts.
Following this assessment it is concluded that this initiative is of very minor relevance for SMEs. In view of this no more detailed analysis of the impact on SMEs has been carried out.
Annex 9: Competitiveness Check
1.Overview of impacts on competitiveness
Table 39
summarizes the impacts of the preferred policy option on competitiveness against the four dimensions as per qualitative screening:
·What is the effect on cost and price competitiveness? (e.g. impacts on compliance costs, cost of labour or capital, prices, consumer choice. etc.)
·What is the effect on the enterprises’ capacity to innovate?
·What might be the effect on the sector’s international competitiveness? (e.g. impacts on domestic versus foreign firms, trade, cross-border investment flows, etc.)
·What is the effect on SME competitiveness?
|
Dimensions of competitiveness
|
Impact of the initiative
(++ / + / 0 / - / -- / n.a.)
|
References to sub-sections of the main report or annexes
|
|
Cost and price competitiveness
|
Between - and +
|
6.2 to 6.4 and 8 in main part; section 1 and 2 in Annex 3
|
|
Capacity to innovate
|
+
|
6.2 and 8 in main part; section 1 in Annex 3
|
|
International competitiveness
|
End-product manufacturers.
EPS manufacturers: 0
Component manufacturers: +
|
6.2 and 8 in main part; section 1 in Annex 3
|
|
SME competitiveness
|
End-product manufacturers. Refurbishers: +
EPS manufacturers: 0
|
6.2 and 8 in main part; section 1 in Annex 3
|
Table 39: Impacts in terms of SME’s competitiveness
2.Synthetic assessment
Compliance cost impacts implied by the preferred option are overall moderate, since the requirement to be compatible with USB and USB-PD protocols imply technical product changes as regards the end product. These additional product design and manufacturing costs will be by far over-compensated by the savings in case of unbundling EPS and product. In that sense the preferred option will enhance the competitiveness of those companies embracing the concept of unbundling, assuming that consumers and purchasers at large choose unbundled devices for convenience and cost benefits. The example of unbundling in the mobile phone industry shows that this product strategy does not lead to declining product sales. For those companies not following an unbundling strategy for reasons of a different product strategy or due to concerns that users might use a low-quality EPS with their devices, leading potentially to loss of brand reputation, the measures will lead to higher costs and prices. Administrative cost impacts implied by the preferred option are overall low to negligible. For EPS manufacturers a further consolidation of the market can be expected, with putting large EPS manufacturers in a better position due to effects of scale. The EPS manufacturing industry is however largely located outside the EU and there are no known European manufacturing SMEs in the market for those products in scope of this initiative. Time wise, the cost impact is expected to be relatively higher when the regulation first enters into force and to diminish afterwards, because initially the entire existing stock of end devices not yet compatible with USB or USB-PD has to be redesigned, whereas later this applies only to new models. EPS costs will increase due to the implementation of USB and USB-PD, measures to increase average active energy efficiency, efficiency in low-load and to reduce no-load losses, compliance with a broader spectrum of specifications (i.e. surge protection) and to enhance the reliability of the EPS by design changes and/or use of components with a better reliability. Data on bill-of-materials costs for USB EPS however indicates that there is currently not a major cost difference, and any such cost difference is likely to diminish with further large scale production of USB power supplies and effects of scale. Further, the mandatory interoperability requirement leads to more competition on the EPS market and positive price effects for consumers: For replacement purchases they can then choose between different power supply providers instead of having to rely on often overpriced proprietary power supplies. [rating: between - and +]
The capacity of EU firms to innovate is expected to be strengthened by policies that require higher energy efficiency for EPS as some leading semiconductor manufacturers from the EU are particularly strong in the field of novel semiconductor materials for power electronics and their market position is expected to be strengthened through such an initiative, and their innovation activities in this field are likely to be rewarded by the market, even if the overall EPS market declines as expected under this initiative.
An example is the proposed limit on efficiency at 10% load that provides an innovation opportunity that EU based companies could exploit. An example of innovation in this field is a small company based in Europe, PULSIV, that offers an innovative approach to reducing losses at 10% load that is claimed to be cheaper than existing technology.
No impact on innovation in end-use products is anticipated. If necessary these can still be powered by non-USB-C sources.
[rating: +]
The competitive position of EU firms with respect to non-EU competitors (‘level playing field’) is not negatively affected by the proposed measures. Namely, they do not affect EU manufacturers’ relative prices and market shares because non-EU competitors face the exact same requirements. There are also no suitable cheaper substitutes outside the scope of the imitative. All producers – EU and non-EU – would face some moderate additional costs for the end devices from the regulation. These additional costs are expected to be low compared to typical price fluctuations (e.g.. those driven by raw material or energy prices) observed on markets for EPS powered electronics products, and not significantly different for firms inside or outside the EU. The alignment with regulatory requirements in the US further contributes to creating a ‘level playing field’ globally and reduces administrative burden for companies. if requirements in the EU and the US are synchronized. [rating: 0]
SMEs producing products with EPS in scope of this initiative will benefit from the interoperability of EPS as the one-off costs for EPS for smaller product batches are more of a cost issue than for mass market products sold in huge numbers. SMEs with products sold in smaller numbers therefore benefit from the fact that they can rely on the existence of interoperable EPS in households across the EU. There are no known European manufacturing SMEs of EPS in scope of this initiative. [rating: +]
Annex 10: List of measures and preliminary assessment
During the review process, an extensive list of measures has been identified. This was through a supporting contract, meetings with stakeholders, interviews, a Call for Evidence and extensive desk research as well as a consultation forum meeting. Some of the identified measures have been discarded as outlined in Annex 11. The remaining set of possible measures for inclusion in policy options are outlined below.
1.Scope extension/removal of Annex I (M1)
1.1.Motivation
Extending the scope of the Regulation is specifically requested to be considered in points R2 R3 and R4 of the review clause. It is also relevant to the problem drivers D1 (too narrow scope), D2 (untapped efficiency potential), D4 (lacking interoperability), D9 (wireless charging and power over ethernet).
1.2.Considerations
EPS outside the scope of the Regulation are not subject to the current energy efficiency requirements and if the Regulation is amended, they will not be subject to the new set of ecodesign requirements that the amended Regulation would contain.
The current Regulation defines its scope through a positive list of products that are powered by EPS subject to its requirements. Moving to a comprehensive (open) scope with a negative list of defined exemptions would reduce the likelihood of relevant products to be considered outside the scope of the Regulation either because of a lack of clarity or deliberate avoidance. In particular, the introduction of interoperability requirements would mean that the scope of the Regulation would have to be extended to cover standalone USB EPS.
Energy efficiency requirements would apply also to active PoE injectors. Online data indicate that such devices are capable to meet the regulated efficiency requirements and they are already in the scope of the DoE rules.
At the same time there are changes in the market, resulting in a growing number of devices with rechargeable batteries among household appliances, power tools, gardening tools, small gadgets, and mobility solutions. There are however various reasons explained in Annex 11 why some of these cannot be brought under the scope of energy efficiency or interoperability requirements.
A significant share of table-top (i.e. not wall-plugged) battery charger models for single cell (e.g. AA, AAA) rechargeable batteries are already marketed unbundled from their USB power supply. Because they are not an EPS per se, this product group would need to be brought explicitly under the scope of the Regulation to generalise their interoperability (M5 - power supply externalisation).
While wireless charging harmonisation and active efficiency requirements are discussed and discarded in Annex 11, wireless chargers would, need to be brought under the scope of the Regulation to allow for interoperability requirements (M5 - power supply externalisation) and the limitation of their stand-by power consumption (M4d).
1.3.Stakeholder views
|
APPLiA
|
|
|
ECOS
|
|
|
Industry representatives
|
raised some issues in relation to the ecodesign requirements that might then be applied e.g. efficiency requirements at 10% load and interoperability.
raised issues regarding the scope extension to new products (see Annex 11).
|
1.4.Final measure
As a result of the reflections, it is considered desirable to bring a wider range of EPS, wireless chargers and single-cell table-top battery chargers, into the scope. This is particularly important in the light of the potential increase in interoperability that would flow from M3. Different legal mechanisms could be envisaged to achieve this. One approach could be removal of Annex I and listing only any types of EPS that would be excluded. Alternatively, the list of EPS could be modified to become more generic and cover standalone EPS, or the list could simply be retained and extended.
1.5.Description of the measure for inclusion in Policy Options
M1: Extension of the scope to wireless chargers, single-cell table-top battery chargers, active PoE injectors and standalone interoperable EPS. Discarding Annex I.
2.Increasing interoperability through requiring compatibility with USB-PD specifications and information requirements (M2)
2.1.Motivation
This measure is intended to respond to point R5 (options of interoperability). It responds to D4 (EPS lacking interoperability) and in part also to D5 (lack of information on compatibility with the load), D6 (bundling EPS with products), D8 (requirements from other legislation and standards), and D9 (wireless charging and power over ethernet).
2.2.Considerations
An important co-benefit of increasing EPS interoperability is greater consumer convenience. Interoperability would make it more feasible for consumers to charge most portable products in other locations without also necessarily having to take the EPS for that product with them. It also enables products to continue being used even if there is an EPS failure since other equivalent EPS can also be used. Interoperable EPS can be re-used for other products for other generations of the same product. While avoided EPS purchases can be quantified, the benefits for consumers of being able to use an EPS to hand rather than find a specific one suitable for their device can be significant but are very difficult to assess.
To enable the interoperability of EPS it is necessary to harmonise the connectors to be used, the voltage(s) and the communication protocol between the power source and the powered product. USB / USB-PD is at present the only standardised power supply protocol available and has been mandated for the products under the RED scope. While EPS are not directly under this scope, those powering RED devices are indirectly subject to USB requirements.
The EPS Ecodesign Regulation can foresee the following complementary actions:
·Scale-up the benefits of interoperability under RED by extending the scope of “common chargers” to power equipment other than the RED devices.
·Inform consumers by marking the “common chargers” with a corresponding logo.
·Prevent proprietary chargers from being sold with RED or other USB end-devices.
The measure would therefore entail the following requirements:
·A generic obligation for EPS with a rated power less or equal to 240W to be USB / USB-PD compliant.
·At least one standardised USB Type-C receptacle and no captive cables at the EPS side, which in turn requires detachable cables.
·No requirements regarding any additional USB-A or other ports. This would also allow the implementation of other protocols or electrical parameters on the USB-A port.
·Higher electromagnetic immunity and surge protection commonly required for example by telecom operators under the standard EN 55035 and the ITU-T K.21 recommendations.
·Obligation for USB EPS to attempt restoring operation after fault conditions. This implementation is generalised while it is an optional feature of the USB standard.
·Information requirements:
-A newly designed specific EU “Common Charger” logo (
Figure
56
), indicating the maximum power and the USB-PD compatibility, on the nameplate and the package of USB EPS. This would be complemented by an equivalent logo on the “label” required for RED devices (
Figure
57
) which provides the charging power range. Apart from that the logo itself would be the same as the one envisaged on the EPS side ().
-Port marking next to each USB Type-C output, in line with the USB-IF guidelines (
Figure
58
).
-A minimum contrast ratio for the information printed on the nameplate and EPS enclosure.

Figure 56 - Common Charger logo – initial design

Figure 57 - Common Charger "label" for RED devices - initial design

Figure 58 - USB port marking (from USB-IF guidelines)
As discussed in Section
2.2.8
, Annex 11 and Annex 17, several product types which may be powered by EPS cannot fulfil for different reasons interoperability requirements. Exemptions from these requirements are therefore proposed for EPS powering:
·products intended for wet-use, like toothbrushes, shavers, certain kitchen tools, outdoor appliances, requiring a specific liquid ingress protection (IPx);
·products requiring a high degree of antistatic protection, like vacuum cleaners;
·single-cell battery chargers with pins for direct insertion into socket outlets;
·toys;
·non battery-powered audio products;
·cordless phone base-stations with analogue line connection;
·products requiring a peak power higher than the USB-PD limits;
·products requiring technically justified high-voltage/low-power combinations falling outside the USB-PD range.
The discrete USB-PD voltage levels 5V and 9V may require an adaptation of the input power stage of certain appliances. This is however not required above 9V / 27W due to the mandatory AVS feature of the USB standard which allows setting any output voltage level in 100mV steps.
The following sub-options cover different subsets of the EPS in scope.
·M2a: USB / USB-PD for the EPS powering all products in the current scope of the RED. Information requirements.
·M2b: USB / USB-PD for the EPS powering all products in the proposed broader scope of this regulation, excluding wet-use, high ESD, audio, and toy applications plus peak power uses and technically justified exceptions . Information requirements.
The EPS used in particular by the following products remain in the scope of M2b and M2c.
·IT and network equipment, like for example routers, modems, switches, hubs.
·Consumer and office electronics, like for example computer monitors, small TVs, compact desktop PCs, set-top-boxes, printers, game consoles.
·Single-cell table-top battery chargers, wireless charging pads.
·Charging cradles and docking stations for non-exempted equipment.
2.3.Stakeholder views
|
Industry stakeholders
|
|
|
APPLiA
|
Regarding appliances that are used in (potentially) wet conditions, the EN 60335-1 harmonized standard based on the LVD stipulate that class III construction household appliances like, for example, shavers, tooth brushes, or epilators are sold with and used with safety extra low voltage wet use power supplies with power output of less than 15W. This is to ensure consumer safety in wet environment conditions, and manufacturers additionally use specific geometrical design of the device connectors for such wet conditions which they consider best practice. These specific geometries are not required in an EN 60335 substandard, nor in any other normative requirement on which industry agreed to comply with wet use condition requirements. APPLiA states that each manufacturer designs its own proprietary geometry solution to prevent that non-IPX4 power supplies are used.
|
|
APPLiA and CECAPI
|
consider USB-C unsuitable for damp or wet environments based upon internal research where the connector spacings are considered insufficient in the presence of moisture.
|
|
USB-IF
|
stated that USB-PD was developed for products used in clean and dry environments, and that have fairly constant power demand.
|
|
APPLiA
|
indicated that USB-PD is not suitable for vacuum cleaners due to the very high electrostatic discharge and pointed at the standard which must be met by their EPS.
|
|
Digital Europe
|
considers USB-PD not suitable for IT and consumer electronics equipment, claiming among other things that it cannot satisfy peak-power requirements, and cannot react properly to voltage dips and faults like over-current, over-voltage or over-temperature.
|
|
ZVEI
|
pointed out that toys are subject to very specific safety requirements which cannot be met by generic USB-PD supplies.
|
|
APPLiA, EPTA, EGMF and Digital Europe
|
concerned about the additional costs of the “externalisation” of the power supply for battery chargers and tools in general. They indicated in particular the need for an additional voltage converter, which would also reduce the overall efficiency. In addition they indicated that USB requirements should not apply to products intended ended to operate in inaccessible locations, and battery chargers with pins for direct insertion into socket outlets.
|
|
ECOS
|
proposed that information requirements should be extended to further elements such as maximum current for the cable or specific fast charging protocols supported by EPS. They state that requirements should be aligned with other industry ones. It would be intended to provide greater information to consumers as to the interoperability of EPS.
|
|
USB-IF, STMicroelectronics
|
Explained the difference between PPS and AVS, and indicated that PPS is an expensive feature which is used less frequently.
|
|
Apple
|
Explained potential peak-power issues which might be experienced by non battery powered products with an audio output.
|
|
Gigaset, Telecom Italia
|
Explained that cordless phone base-stations with analogue line connections would be exposed to safety and call quality risks if USB powered, unless fitted with a relative costly component.
|
M2a offers the minimum level of interoperability to parallel the requirements set in the RED for powered products from the side of EPS. However, it will bring very marginal benefits, primarily due to the information requirements that will make it easier for consumers to ensure they use appropriate interoperable EPS.
M2b expands the interoperability requirements to the maximum feasible while excluding products for which there are justified technical or safety considerations.
2.4.Effect of implementation and choice of measure
Table
40
below illustrates that in 2035 M2a has a marginal impact on all indicators compared to BAU. In contrast M2b leads to improvements in half the parameters.

Table 40- Estimated impacts of M2 in 2035
For M2b, while purchase costs decrease slightly due to lower EPS purchases through their reuse, electricity costs are substantially greater due to higher losses in cables and connectors and as a result overall consumer expenditure increases. Substantially more energy is required overall as a consequence of the higher electricity use and therefore more fuel is also combusted. GHG, acidification and PM emissions all decrease because of the fewer EPS purchased and therefore manufactured.
In view of this limited impact of M2a it does not merit inclusion in POs and therefore M2b is chosen to be further tested.
2.5.Description of the measure for inclusion in Policy Options
M2b: Interoperability and information requirements for all EPS in scope, excluding those powering products for which there are justified technical or safety considerations.
3.Minimum energy efficiency at 10% load (M3)
3.1.Motivation
This measure responds to point R1 (feasibility of setting efficiency requirements at 10% load) of the review article and addresses D3 (EPS less efficient at 10% load).
3.2.Considerations
Current active efficiency requirements are set for loads of 25%, 50%, 75% and 100% of the EPS maximum output power. The efficiency of all EPS drops rapidly below 25% load and the efficiencies at 10% load shown in the evaluation are mainly within the range of 10%pt below the active efficiency. The reported figures show a substantial spread. In view of this, the measure would involve establishing requirements for the minimum energy efficiency of EPS at 10% of the maximum rated power.
Based on the data in the evaluation a minimum stringency of 10%pt below the regulated average active efficiency could be considered since the majority of the market already achieves this. This would effectively prevent any backsliding that might occur if higher active efficiency requirements are set and is M3a. A more ambitious requirement is to set the minimum requirement at 5%pt below the currently regulated average active efficiency. This level of stringency would have the effect of obliging a certain proportion of the market to improve the efficiency at 10% load. The position of these two levels of ambition compared to manufacturer reported efficiency figures is shown in
Figure
59
.
This PO includes requirements for interoperability and relevant information. It increases active efficiency by a level of stringency met by 50% of current products, introduces wireless charging standby limits and requires externalisation of power supplies for single-cell battery charging applications. Durability requirements are introduced.
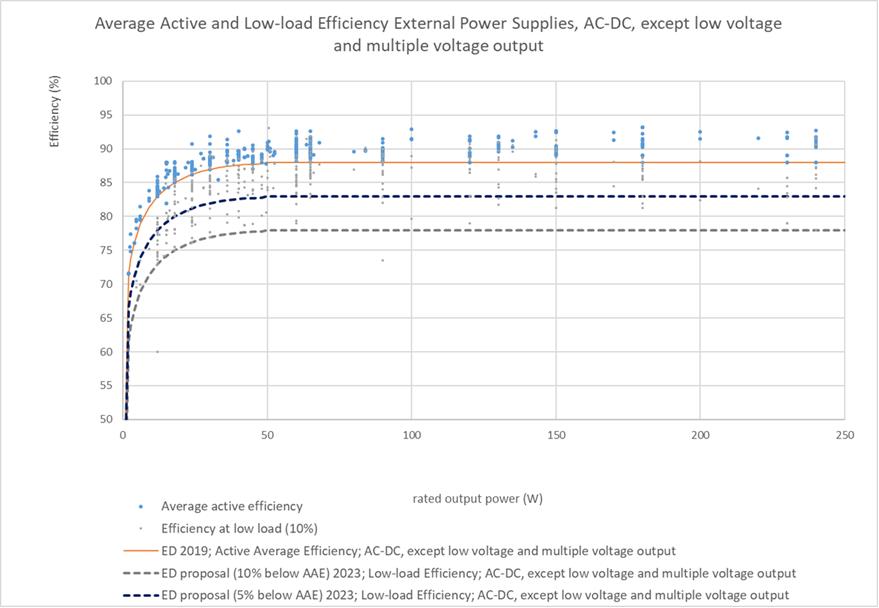
Figure 59 - Manufacturer reported EPS efficiency data with M3a and M3b thresholds (Fraunhofer IZM)
Stakeholder comments pointed out that for EPS with a low maximum power, no-load losses become a significant share of the total losses at 10% load as shown in
Figure
60
. Because of this, it is impossible for these EPS to respect a strict requirement on their overall efficiency relative to the average active efficiency.
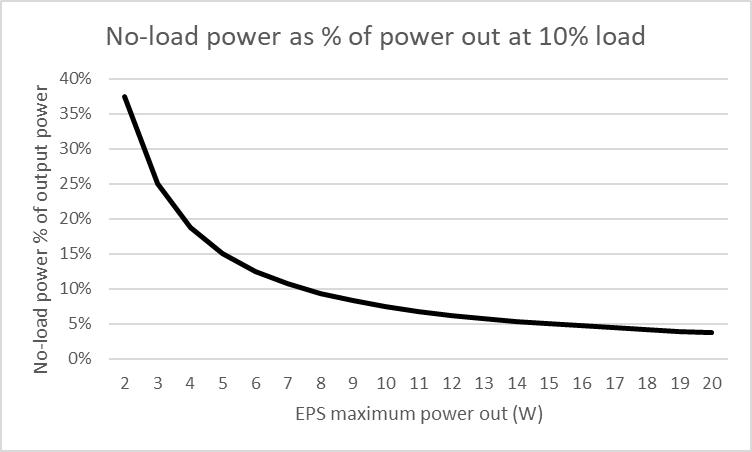
Figure 60 - Impact of no-load consumption on efficiency at 10% load
To address this constraint, a further possibility is to apply the requirement only to EPS with a 10W or greater rated power output as low load operation is mainly of relevance for these EPS. M3b is therefore to set only for EPS with an output power of 10W and above, a minimum requirement at 5%pt below the regulated average active efficiency which largely corresponds to 6%pt below the revised average active efficiency considered under M4a.
Figure
61
shows the efficiency at 10% load declared for USB PD EPS at their lowest voltage (i.e. 5V) against the proposed M4a limits, for 57 single output and 14 multiple output EPS. In line with the clarified test method, the single output EPS are considered against the “low voltage limit”, and the multiple output EPS against the “multiple voltage output” limit, and show a high degree of compliance.
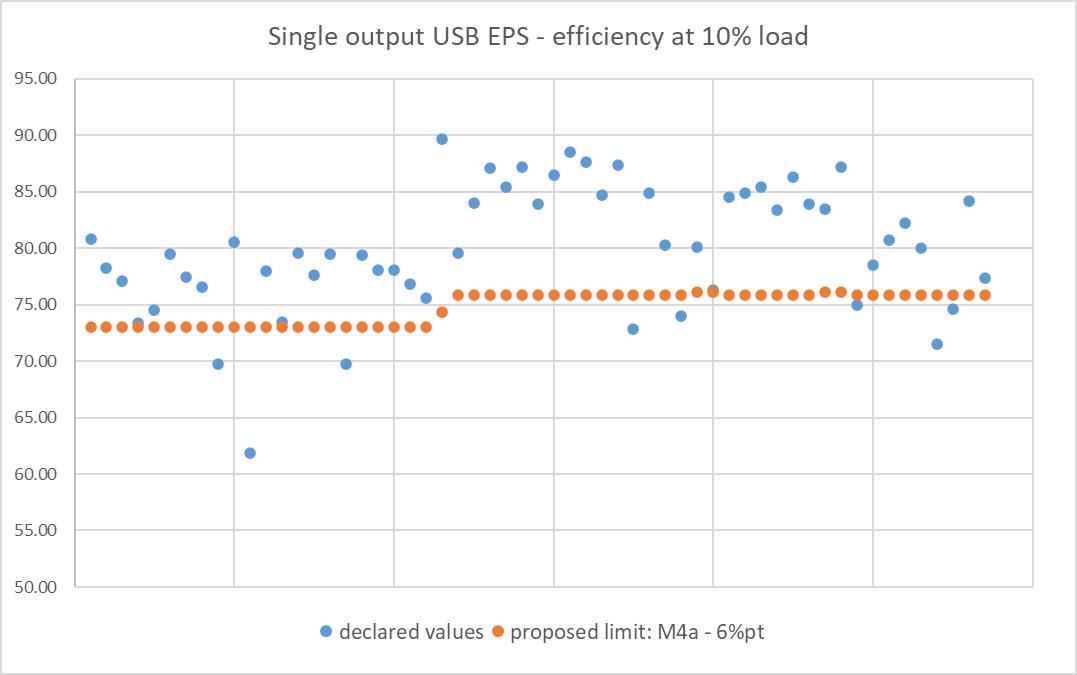

Figure 61 - Efficiency at 10% load of USB PD EPS (lowest voltage, 5V)
Data for the 10% load efficiency at the highest USB-PD voltage is scarce, partly due to the lack of clarity of the requirement and test method. It appears however that the same requirement of 6%pt below the revised average active efficiency under M4a could be more difficult to meet at that operating point and may deserve a specific consideration.
3.3.Stakeholder views
Based on the analysis and stakeholder comments two possible levels of stringency of the measure were assessed. These are:
M3a: setting a threshold for efficiency at 10% of maximum load at 10%pt below the average active efficiency.
M3b: setting a threshold for efficiency at 10% of maximum load at 6%pt below the full-power average active efficiency only for EPS with an output power of 10W and above.
3.4.Effect of implementation and choice of measure
The table below illustrates the expected impact of each of the stringencies of the efficiency requirement at 10% load in 2035:

Table 41 - Estimated impact of M3 in 2035
The assessment shows that M3a has negligible impact. It would provide an assurance against a deterioration of efficiency at 10% load but no improvement. M3b has benefits and merits assessment in policy options even though on a standalone basis it leads to a slight increase in consumer costs.
3.5.Description of the measure for inclusion in Policy Options
M3b: For EPS with an output power of 10W and above the efficiency at 10% of the maximum load must be not more than 6%pt below the regulated full power average active efficiency
4.Raising the minimum requirement on active average efficiency and limiting stand-by losses for wireless chargers (M4)
4.1.Motivation
Increasing the active efficiency requirements was not explicitly identified in the review article of the Regulation. However, the review article does request for it to be reviewed in the light of technical progress and the evaluation has identified that there has been technical progress and that a significant share of EPS on the market have efficiencies higher than the minima set in the Regulation. The measure addresses D2 (untapped potential for higher efficiency) and D9 (wireless charging).
4.2.Considerations
Data gathered as part of the evaluation indicates the possibility for more stringent active and no-load efficiency requirements for EPS. The measure would involve more ambitious average active efficiency requirements, raising the threshold across a broad range of maximum power output by approximately 1%pt in M4a, a more ambitious 2 - 3%pt in M4b and 3 - 4%pt in M4c.
The analysis of the EPS database in the evaluation has shown that the assumptions in the US about the impact of the stringency increases are broadly equivalent for the EU market. This is illustrated in
Figure
62
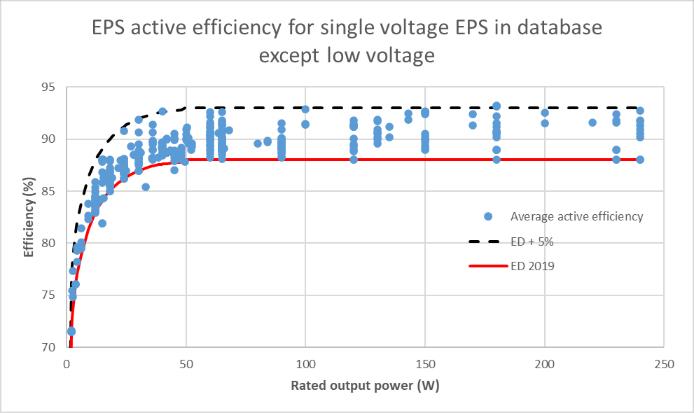

Figure 62- Active average efficiency in EU database (left) and DoE analysis (right)
A need for clarification of the application and testing of requirements and has been observed, in particular for adaptive power supplies, also in light of the recently updated DoE rule 10 CFR 430. The following clarifications are therefore considered necessary for adaptive and in particular USB-PD power supplies. They are all included in M4a, M4b and M4c:
·Application of the single voltage, low voltage, and multiple voltage output efficiency limits and the corresponding testing.
·Application of any 10% load limits and the corresponding testing.
·The no-load testing.
·Specification of a standardised USB cable for testing.
·Testing of USB power supplies embedded in other products, and of products fulfilling also other functions.
Losses in the output cables are assessed using the baseline assumptions about power profiles, assuming the majority will be powered from USB outlets with an additional assumption about the average voltage used for each profile. The USB protocol specifies the maximum resistance of the cables that may be used as 0.25Ω for 3A and 0.15Ω for 5A. Based upon the assumed load profiles and durations of use for each class of EPS the total energy losses due to the use of power cables meeting the USB protocol requirements amount to around 2.9PJ in the period covered by the Impact Assessment. These losses are around 3.6% of the total GER related to EPS.
Actual cable resistances in the market measured on a sample of 115 cables show that:
·8% exceed the overall USB resistance specification - by 0.112Ω on average;
·37% exceed the ground wire resistance specification - by 0.029Ω on average.
The cables where the ground wire resistance exceeds the specification are included in those exceeding the overall resistance.
On the assumption that this sample is representative of the overall market, it is calculated that the cable resistance would be 0.01Ω higher on average across the whole stock than the USB requirements. Using the same assumed load profiles and durations of use for each class of EPS, the total savings that can be achieved by avoiding this excess resistance amount to around 0.12PJ in the period covered by the Impact Assessment. These losses are between 2.6% and 26% of the savings achievable from the different levels of active efficiency assessed but independent of them.
The electromagnetic coupling efficiency of a wireless charging pad varies significantly with the position of the product on the pad and its distance to it. It is therefore considered impossible to date to set requirements for the coupling efficiency. This has been confirmed by recent work on EPS and battery charging efficiency by the US DoE. An outcome of the same work has been however the proposal for a stand-by limit of 0.8W for open placement wireless chargers. Assuming a (low-voltage) EPS low-load efficiency of 60% this would translate into a stand-by limit of 0.48W for the wireless charging pad. Fixed-location wireless chargers have been excluded from this limit in the DoE proposal, most probably because they are subject to battery-charging rules. There is however no technical reason observed why the fixed-location wireless charging pad should not be able to meet the same stand-by limit.
4.3.Stakeholder views
|
Industrial stakeholders
|
|
|
ANEC/BEUC and ECOS
|
|
4.4.Effect of implementation and choice of measure
Table
42
illustrates the expected impact of each of the stringencies for the active efficiency measure and separately the impact of the wireless charging pad standby limit in 2035:

Table 42 - Estimated impact of M4 in 2035
M4a to M4c are alternatives. The results clearly show that as the stringency increases from a) to c) purchase costs increase while electricity costs decrease. Of these, only M4a on its own has energy savings sufficient to offset the additional purchase costs and therefore leads to a reduction in overall consumer expenditure.
M4d is independent of M4a to M4c since it purely addresses the standby consumption of wireless charging pads that are not covered by the other sub-measures. This sub-measure leads to a significant reduction in electricity and overall consumer expenditure.
4.5.Description of the measure for inclusion in Policy Options
M4a: Active average efficiency and no-load requirements set at a level corresponding to the draft DoE level VII of the most recent proposal by the US Department of Energy. Clarification that adaptive EPS to be tested and required to meet minimum requirements at lowest and highest voltage levels.
M4b: Active average efficiency increased to a level achieved by 50% of the current market, and no-load requirements reduced to a level corresponding to the draft DoE level VII. Clarification that adaptive EPS to be tested and required to meet minimum requirements at lowest and highest voltage levels.
M4c: Active average efficiency increased to a level achieved by best performing EPS in the current market, and no-load requirements reduced to a level corresponding to the draft DoE level VII. Clarification that adaptive EPS to be tested and required to meet minimum requirements at lowest and highest voltage levels.
M4d: Open placement or fixed location wireless charging pads (without EPS) to be subject to a standby power limit of 0.48W.
5.Externalisation of power supply circuitries for single-cell battery charging devices and wireless chargers (M5)
5.1.Motivation
This measure is in response to points R2 (bringing wireless chargers in scope), R3 (bringing power over ethernet injectors in scope) and R4 (bringing EPS for equipment outside Annex I in scope) of the review article. It addresses D4 (interoperability of EPS) and D9 (wireless charging and power over ethernet), and is linked to M1.
5.2.Considerations
Single-cell table-top battery chargers and wireless charging devices are brought into the scope of the Regulation (M1) with the purpose to require by design a separation of the battery/wireless charging functionality from the power supply function. The power supply unit would be required to be USB / USB-PD compatible and would comply with efficiency and no-load requirements and potentially other requirements introduced with any of the other measures.
It is important that products intended to be used in a wet environment are exempted from this requirement to avoid any safety problems or difficulties with the connectors used.
5.3.Stakeholder views
|
APPLiA, EPTA, EGMF and Digital Europe
|
|
|
EPBA
|
|
|
EPTA
|
|
5.4.Effect of implementation and choice of measure
The table below illustrates the expected impact of this measure in 2035:

Table 43 - Estimated impact of M5 in 2035
5.5.Description of the measure for inclusion in Policy Options
M5: Externalisation of the power supply unit of wireless chargers and single-cell battery chargers with the exception of products to be used in a wet environment.
6.Durability (M6)
6.1.Motivation
Interoperable EPS are intended to be used longer than conventional device-specific external power supplies. The intention is that they would no longer be discarded at the end-of-life of the powered end-device, but rather reused with a replacement or a different device. It is therefore essential that interoperable external power supplies do not fail for reasons which can be avoided with relatively simple design measures.
This measure is partly in response to point R5 (options for interoperability) of the review clause and addresses D4 (lacking interoperability of EPS).
6.2.Considerations
The measure would introduce lifetime requirements for the electronic components of USB EPS. The aim is to limit the share of EPS that would otherwise need to be replaced due to technical defects of the electronics during the assumed longer life.
The two distinct metrics normally used to predict the durability and reliability of an electric system are lifetime and MTBF (Mean Time Between Failures). The lifetime parameter of an EPS reflects its wear-out under normal operating conditions, while the MTBF is a statistical measure for abnormal faults and failures. The standard ETSI ES 202 874-1 V1.2.1 for telecom power supplies requires 1) a reference lifetime of 10 years continual operation at maximum output power, and 2) an MTBF of 300 000h at 40°C operation. At the same time, requiring EPS to be more efficient (M4) means in turn a lower heat dissipation which prolongs the lifetime of the device.
Repair shop data indicate that 20-30% of the EPS handed in for repair had stopped functioning due to a broken DC cable or other issues related to its connectors and wiring. Due to the high number of database entries from several countries, this percentage can in turn also be assumed as representative for the entire population of damaged EPS. This failure is normally due to inadequate mechanical and sometimes electrical stress to which this external EPS component is often exposed. In particular the so called “captive”, i.e. hard-wired USB cables are prone to premature failure at the mechanical connection to the EPS body. At the same time, the electrical components are protected due to their encapsulation and are normally still functional.
Requiring USB cables to be always detachable (a co-benefit of the interoperability measure M2a) would allow their unsophisticated replacement, also by laymen, in case of cable failures. This is already a trend for wall plugged USB EPS, but usually not implemented for table top chargers with an AC cord.
6.3.Stakeholder views
|
ANEC
|
|
|
ZVEI, PSMA
|
argued that the standards to determine the MTBF are not comparable, and that the wear-out of the power supply is determined by the lifetime of electrolytic capacitors which depends on many complex design parameters.
|
|
STMicroelectronics
|
|
|
Granite River Labs
|
|
6.4.Effect of implementation and choice of measure
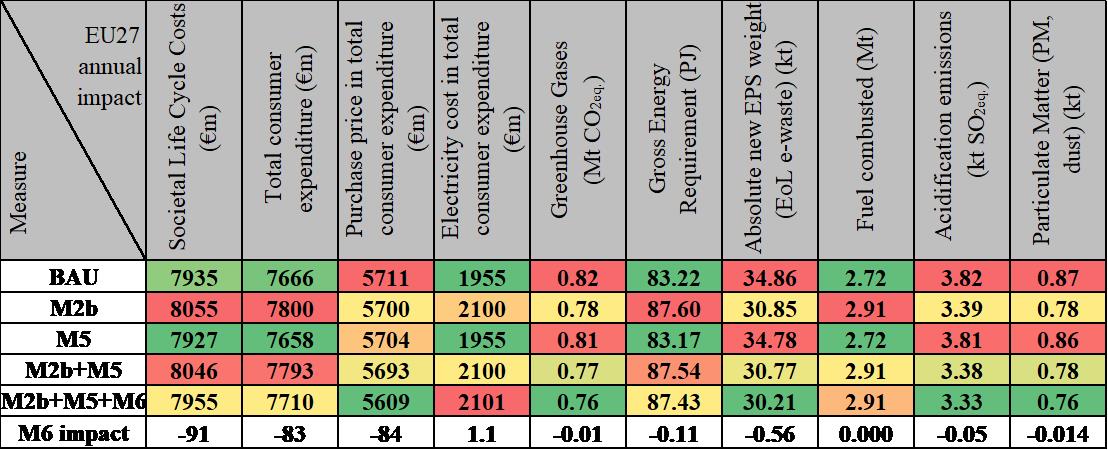
Table 44 - Estimated impact of M6 in 2035
This measure will only have an impact if implemented along with M2 since that measure will lead to longer EPS lives. It will also only have an impact on products covered by M5 if that measure is also implemented. In view of that
Table
44
shows the expected impact of the implementation in 2035 of M2 with M5 and the impact of M2 with M5 and M6. The additional impact of M6 alone when implemented in conjunction with M2 and M5 is then obtained by subtracting the two combined approaches.
Unsurprisingly, by extending the life of the EPS, the assessment of the standalone measure (in conjunction with M2 and M5) shows that it appears attractive from a consumer expenditure perspective while also delivering some modest environmental benefits due to the reduced EPS purchases.
6.5.Description of the measure for inclusion in Policy Options
M6: Introduction of mandatory ETSI durability standard requirements. Requiring USB EPS to be fitted at their output only with receptacles for detachable USB cables (covered under M2a).
7.Final measures for assessment in Policy Options
|
Name
|
Description of the measure
|
|
M1
|
Extension of the scope to wireless chargers, single-cell table-top battery chargers, active PoE injectors and standalone interoperable EPS. Discarding Annex I.
|
|
M2b
|
Interoperability and information requirements for all EPS in scope, excluding those powering products for which there are justified technical or safety considerations.
|
|
M3b
|
For EPS with an output power of 10W and above the efficiency at 10% of the maximum load must be not more than 6%pt below the regulated full power average active efficiency
|
|
M4a
|
Active average efficiency and no-load requirements set at a level corresponding to the draft DoE level VII of the most recent proposal by the US Department of Energy. Clarification that adaptive EPS to be tested and required to meet minimum requirements at lowest and highest voltage levels.
|
|
M4b
|
Active average efficiency increased to a level achieved by 50% of the current market, and no-load requirements reduced to a level corresponding to the draft DoE level VII. Clarification that adaptive EPS to be tested and required to meet minimum requirements at lowest and highest voltage levels.
|
|
M4c
|
Active average efficiency increased to a level achieved by best performing EPS in the current market, and no-load requirements reduced to a level corresponding to the draft DoE level VII. Clarification that adaptive EPS to be tested and required to meet minimum requirements at lowest and highest voltage levels.
|
|
M4d
|
Standby power limit of 0.48W for open placement or fixed location wireless charging pads (without EPS).
|
|
M5
|
Externalisation of the power supply unit of wireless chargers and single-cell battery chargers with the exception of products to be used in a wet environment.
|
|
M6
|
Introduction of mandatory ETSI durability standard requirements. Requiring USB EPS to be fitted at their output only with receptacles for detachable USB cables (covered under M2a).
|
Annex 11: Discarded measures
As a result of analysis and consultation with stakeholders a number of options were discarded. These are outlined below along with a brief description of the reasons for their rejection.
1.Setting requirements for repairability
For several product groups under the Ecodesign Framework reparability requirements have been implemented since 2019. The rationale for this is that repair can lengthen the useful lifetime of the product thus reducing the environmental impacts from producing a replacement. These requirements have mostly related to the availability of information and the supply of spare parts. Reparability scoring has been required in the regulation on Smartphones and Tablets. Work is ongoing on reparability scoring for tumble dryers.
The consumer NGO ANEC was keen for repairability options to be considered during the EPS review.
Where spare parts have been made available for other Ecodesign products a distinction has been made between those for which it is safe to consumers to carry out the repair themselves and those for which this is dangerous and so the spare parts should only be available to professional repairers and the repair be carried out by them.
In the case of EPS, a major concern would be that opening the power supply provides direct access to the 230V circuitry. This would raise major safety concerns. In view of these, repair could theoretically be carried out by professionals, but under no circumstances should repair by consumers be facilitated. However, in view of the rather low cost of EPS, repair by professionals is not economically viable and is therefore not expected to happen, even if the procedures for access were simplified and necessary spare parts made available.
In view of these considerations this measure was discarded on the grounds of safety and economic viability.
2.Wireless charging harmonisation and active efficiency requirements
The Ecodesign regulation review clause required options for the inclusion of wireless charging in the scope of the Regulation to be addressed (R2). Inclusion within the scope would enable the application of some or all of the ecodesign requirements contained in the Regulation to wireless chargers. The two main types of requirements explored in the review are for energy efficiency and interoperability. The NGOs ANEC/BEUC and ECOS strongly supported addressing wireless charging efficiency as part of the impact assessment.
The energy efficiency of wireless charging depends on the various system components including the power transformation circuitry, power transmission coil, power reception coil and battery charging. The electrical and physical characteristics of the end-device play a crucial role. At present there are no reliable, repeatable, representative means to determine the efficiency of the power transmission. A fundamental problem is how to ensure a representative alignment of the reception and transmission devices since this has a major impact on overall efficiency. In view of this difficulty, as in other global markets the possibility of regulating the active efficiency of wireless charging is discarded.
Concerning interoperability, this relates to the possibility of wireless devices to be usable with all wireless charging pads. If this were feasible it could increase consumer convenience and reduce the number of wireless charging pads needed, thus leading to reduced environmental impacts. The operation of wireless charging depends partly on the physical and electrical aspects of the two devices, including the frequency of operation and the protocol used between them. The market is split between inductive, resonant, RF and other technologies. Both resonant and RF technology are expected to grow and other various benefits.
In view of this, while some protocols such as Qi currently have a large share of the market, and the latter contains specifications for both inductive and resonant charging it is unclear whether this will end up dominating the market. In view of these developments, it would appear to be premature to attempt to define a unique approach and therefore regulating the interoperability of wireless charging is discarded.
3.Introduction of an EU Energy Label
An EU Energy Label under Framework Regulation (EU) 2017/1369 as a complement to eco-design requirements is an option for other product groups. However, there has never been an Energy Label introduced for EPS in parallel to the previous ecodesign requirements.
A key reason for this is that as long as the majority of EPS are provided bundled with an end-device, an Energy Label on the EPS only or in parallel to the main product Energy Label is very likely to create confusion to the consumer. While this situation may change if interoperability requirements are introduced and there is a widespread voluntary unbundling of EPS from end-use products, there are other reasons why an energy label may be inappropriate.
Firstly, given the high level of energy efficiency requirements put in place in the EPS ecodesign requirements, and the resulting limited performance spread in the market, there is probably insufficient distinction in performance to justify the introduction of seven efficiency classes, each with enough energy efficiency range. This range will be further reduced if stricter active efficiency requirements are implemented.
Secondly, it is unclear, given the low level of energy losses in the EPS, whether there would be sufficient motivation for consumers to pay attention to such an energy label. It is noteworthy that no stakeholder is explicitly in favour of an EU Energy Label for this product category. In view of all these factors the option of introducing an energy label is discarded.
4.Voluntary agreement by the industry
According to the Ecodesign Framework Directive, voluntary agreements must be given priority over legislative actions, provided they meet the objectives in a quicker and more cost-effective manner. The product is characterised by a very large number of manufacturers, and it is likely to be very difficult, if not impossible, for an agreement to be established covering a larger enough share of the market.
The current review is of an existing ecodesign Regulation and therefore in the past it was clearly also not possible to establish a voluntary agreement. A further relevant factor is that EPS are sold globally and subject to regulation in other jurisdictions at global level and this may hamper the ability for the industry to agree a common approach.
In view of all these factors and the fact that the industry has not proposed any voluntary agreement this option has been discarded.
5.Extension of the scope to certain other products
The current Regulation defines its scope through a positive list of products that are subject to its requirements. Moving to a comprehensive scope with defined exemptions could reduce the likelihood of relevant products to be considered outside the scope of the Regulation either because of a lack of clarity or deliberate avoidance. In view of this Measure 1 is to remove the positive list in annex I of the Regulation. However, various objections to this blanket coverage were raised.
Power supplies to charge e-bikes represent a significant and growing market. However, the Confederation of the European Bicycle Industry (CONEBI) is concerned about extending the scope of the EPS Regulation to e-bike chargers. They state that safety features of e-bike systems are built into the charger and the battery, not the e-bike itself and that therefore the charger is more than an EPS. These features include functions to measure the temperature of the battery and adjust the rate of charge or limit the output voltage to prevent overcharging even in a malfunction state. Failure to monitor charging and the battery may pose a fire hazard. E-bike chargers have a higher safety focus due to their operating environment. CONEBI doubt whether significant environmental gains can be achieved if USB EPS are used with e-bikes. In view of the stated dual function of a bike charger, the only approach to regulate their efficiency would be as with other types of chargers be to separate the EPS from the charger itself. This would either require building the charging part of the device into the e-bike or two separate external devices.
Article 1 of the Ecodesign Directive setting the subject matter and scope states that “This Directive shall not apply to means of transport for persons or goods”. While the charger for an e-bike is not in itself a means of transport, this exclusion has also been understood to apply to devices, such as for example motors, used in means of transport. Since a charger for an e-bike is functionally integrated with the e-bike due to the integration of the charging control and battery monitoring circuitry it can be strongly argued that it is specific to a means of transport and therefore outside the scope of the Ecodesign Directive and thus implementing measures adopted under it. At the same time electric vehicle chargers have been prioritised as a new product by the Ecodesign and Energy Labelling Working Plan 2022-2024. The corresponding ecodesign regulation will fall under the ESPR and the on-going work also explores requirements for e-bike chargers.
CONEBI have also stated that chargers for e-bikes are subject to industry driven harmonisation efforts and that this will in any case mean that efforts for interoperability of the chargers would be less relevant. Such harmonisation efforts are being considered under the mandate stemming from the Batteries Directive.
Lighting Europe pointed out that power supplies of lighting equipment are already regulated as control gear under Regulation (EU) 2019/2020 and therefore it would be double regulation to include them under this Regulation. In view of this, power supply units for lighting equipment are excluded from the extension of the scope.
ZVEI and EPSMA argued to maintaining the exemption of commercial and industrial power supplies, which otherwise would fall under the scope of the Regulation by abandoning Annex I. These power supplies fulfil specific additional functions, are optimised for specific operating points and are unlikely to achieve energy savings. For this reason they are excluded from the extension of the scope.
EPTA and EGMF indicated that battery chargers for power and gardening tools are often used by professionals in construction environments where they are exposed to humidity, dust, dirt and mechanical stress. For this reason a USB-C receptacle replacing the hard wired AC cord is considered not sufficiently robust. In addition, it was argued that the few products on the market with such a feature have a significant lower efficiency. This product group is therefore excluded from the extension of the scope.
6.Introduction of information requirements on efficiency
The majority of EPS are sold and used globally rather than being designed for a specific regional market. This is illustrated by the wide input voltage range that usually covers 110 to 250V AC. Observation of manufacturer data supplemented by testing of a small number of EPS illustrates that in general EPS have a slightly higher efficiency when operated at EU input voltage levels. This means that if an obligatory marking of active energy efficiency of EPS based on the testing for EU conditions was introduced this could be misleading.
There is a risk that such an obligatory marking could even be illegal for other markets which would result in EU efficiency marked EPS becoming bespoke devices purely for the EU market. This would lead to higher costs for pure EU EPS and might reduce the potential spill over benefits from other invisible EU regulatory requirements, such as setting efficiency requirements at 10% load, to other global markets.
In parallel with the thinking on the energy label, it is also unclear, given the low level of energy losses in the EPS, whether there would be sufficient motivation for consumers to pay attention to such an efficiency marking.
In view of these doubts over the effect of such a measure and the potential incompatibility with global markets an efficiency marking measure is discarded.
7.Interoperability requirements for certain product categories
In principle, the maximum environmental benefit and improvements to consumer convenience are likely to be achieved through the widest application of interoperability requirements. This was the starting point for the deliberations but industry stakeholders raised concerns regarding the suitability of the USB protocol as a common approach. In particular, they argue that it may be inappropriate for devices working in wet environment and there may be a mismatch of technical requirements.
Regarding appliances that are used in (potentially) wet conditions, APPLiA states that the EN 60335-1 harmonized standard based on the LVD stipulate that class III construction household appliances like, for example, shavers, tooth brushes, or epilators are sold with and used with safety extra low voltage wet use power supplies with power output of less than 15W. This is to ensure consumer safety in wet environment conditions, and manufacturers additionally use specific geometrical design of the device connectors for such wet conditions which they consider best practice. These specific geometries are not required in an EN 60335 substandard, nor in any other normative requirement on which industry agreed to comply with wet use condition requirements. APPLiA states that each manufacturer designs its own proprietary geometry solution to prevent that non-IPX4 power supplies are used.
APPLiA and CECAPI also consider USB-C unsuitable for damp or wet environments based upon internal research where the connector spacings are considered insufficient in the presence of moisture. In addition APPLiA indicated that USB-PD is not suitable for vacuum cleaners due to the very high electrostatic discharge and pointed at the standard which must be met by their EPS. ZVEI pointed out that toys are subject to very specific safety requirements which cannot be met by generic USB-PD supplies.
USB-IF stated that USB-PD was developed for products used in clean and dry environments, and that have fairly constant power demand. Digital Europe considers USB-PD not suitable for IT and consumer electronics equipment, claiming among other things that it cannot satisfy peak-power requirements, and cannot react properly to voltage dips and faults like over-current, over-voltage or over-temperature.
After taking account of input from stakeholders and initial analysis it was concluded that the interoperability requirements should not be considered for toys, non-battery powered audio devices, products subject to electrostatic discharge, wet-use, peak power and where there are technical reasons for a high voltage low power combination incompatible with the USB-PD protocol. Including these products in the interoperability measure is therefore discarded.
8.Unbundling EPS from the products they power
This measure would involve establishing requirements for selling products without an external power supply. This would incentivise reuse or shared use of interoperable EPS with other products and thus to purchase less EPS in total. It is considered in response to point R5 (circular economy and interoperability) of the review article and to address D6 (bundling of products).
Some industry stakeholders have raised barriers to unbundling from other requirements. For example, APPLiA state that some current safety standards (e.g. the EN 60335 series) do not allow unbundling. In addition ITI remark that unbundling could lead to additional costs through extra shipping requirements and material redundancy though additional packaging materials.
Legal analysis shows that requiring mandatory unbundling is not a feasible regulatory measure as, contrary to the RED, the empowerments in the ecodesign Directive do not allow for an unbundling requirement targeting the powered product. Annex I, part 1, point 1 sets out the phases of the product lifecycle for which requirements can be set. The supply or sale of the product is not included in this list. In view of this unbundling can therefore only be a voluntary measure. In view of this legal barrier this measure is discarded.
Annex 12: Selection of pollutants for analysis
1.Outputs from the ecoreport tool
The ecoreport tool used to carry out the LCA for this Impact Assessment provides a fixed set of outputs as shown below:
Other resources and waste
·Total Energy (GER)
·of which, electricity (in primary MJ)
·Water (process)
·Water (cooling)
·Waste, non-haz./ landfill
·Waste, hazardous/ incinerated
Emissions (Air)
·Greenhouse Gases in GWP100
·Acidification, emissions
·Volatile Organic Compounds (VOC)
·Persistent Organic Pollutants (POP)
·Heavy Metals
·PAHs
·Particulate Matter (PM, dust)
Emissions (Water)
·Heavy Metals
·Eutrophication
The underlined outputs are those which have been chosen for carrying out the analysis. The reasoning for the choice of these emission categories is discussed in this annex.
The main environmental impacts of EPS in the EU are a result of the electricity consumption by them. The environmental impacts of electricity generation are mainly driven by the emissions from Large Combustion Plants (LCPs). These are regulated under the industrial emissions Directive in the EU and their emissions monitored. Information on the scale of pollutant emissions from the energy sector, including LCPs, is provided in the Industrial Emissions Portal
.
2.Emissions to air
Emissions from industry represent a significant share in total emissions of many of these pollutants. This was analysed in an earlier study
which showed at the time that for emissions to air, industry represents about 86% of PAH, 73% of SOx, 68% of POPs, 30% of NOx, 22% of NMVOC, 12% of PM and in the order of 50% for many metals. These categories are therefore all relevant.
The Industrial Emissions Portal provides information on the total emissions of these pollutants from industry and the share of those for the energy sector. Additionally, an Eionet Report
provides an overview of the main pollutant emissions to air from EU industrial facilities and their relative importance through the application of damage costs for these emissions.
Taking these sources together provides the share of the energy sector in industrial emissions and the estimated damage costs for these emissions. These are shown in
Table 45
:
|
Emissions to air
|
Energy share of industry*
|
Total industry emissions*
|
Total value+
|
Electricity share of damage cost
|
|
Emissions included in IA analysis
|
|
CO2
|
60.8%
|
1238 kt
|
€184,242m
|
€112,019m
|
|
SOx
|
66.8%
|
645 kt
|
€35,360m
|
€23,620m
|
|
NOx
|
49.3%
|
1156 kt
|
€24,529m
|
€12,093m
|
|
PM
|
29.3%
|
41 kt
|
€3,393m
|
€994m
|
|
|
|
Total value of LCP emissions
|
€148,726m
|
|
Emissions not included in IA analysis
|
|
NMVOC
|
24.2%
|
225 kt
|
€736m
|
€178m
|
|
PAH
|
17.2%
|
39 t
|
€74 m
|
€13m
|
|
Organic pollutants
|
0.9%
|
24 kg
|
€62m
|
€0.6m
|
|
Hg and compounds
|
52.7%
|
15 t
|
€439m
|
€231m
|
|
|
|
Total value of emissions excluded
|
€422m
|
Table 45 - Energy sector share of industry emissions and damage costs
*From Industrial Emissions Portal
+From costs of air pollution from European industrial facilities 2008–2017
As the table shows, addressing GHG, acidification and PM emissions will cover around 99.7% of the expected damage costs of all these emissions to air. In view of this emissions of NMVOC, PAH, organic compounds and mercury are not included in the assessment.
3.Emissions to water
The ecoreport tool can produce outputs showing heavy metals and eutrophication.
Table
46
provides the total value of industry emissions from the European Pollutant Release and Transfer Register (EPRTR) and the energy shares of these in industrial emissions.
|
Emissions to water
|
Energy share of industry*
|
Total industry emissions
|
Industry share in total emissions#
|
|
Hg
|
4.1%
|
5 t
|
≈50%
|
|
Cd
|
2.3%
|
21 t
|
≈35%
|
|
Pb
|
3.1%
|
81 t
|
≈25%
|
|
N2
|
1.7%
|
246 kt
|
≈10%
|
Table 46 - Reported pollutant emissions from large EU industrial installations
*From Industrial Emissions Portal
#From contribution of industry to pollutant emissions to air and water
As shown in the last column, for emissions to water the study on industry contribution to emissions showed that industry represent between a quarter and a half of emissions of various metals and around 10% of nitrogen.
This implies that for the metals shown, the importance of the energy sector emissions will range from less than 1% to a maximum of 2% of their emissions and therefore the level of change in these will be of minor impact. For nutrient emissions the energy sector share is even smaller, representing around 0.2% of nutrient emissions and therefore any changes to these emissions can be disregarded.
In general, it has been accepted to not be possible to establish generalised damage costs for emissions to water. This is acknowledged for example in the handbook for InvestEU
, which notes ‘difficulties that arise in trying to place a monetary value on such impacts’. This also illustrates that it is difficult to arrive at any valid trade-off between these emissions and any other impacts.
4.Conclusions
For emissions to air, assessing the impacts on emissions of CO2, acidification (SOx and NOx) and PM are shown to represent around 99.7% of the damage value of emissions to air that can be assessed using the ecoreport tool. In view of this, reporting the other emissions would not bring any added value.
For emissions to water it has been shown that for the emissions available from the ecoreport tool, the energy share of total emissions is so small that the change that will be induced in them will be irrelevant. Since there is no agreed method for valuing these emissions, it is in any case impossible to explore any economic trade-offs between them and other impacts.
Annex 13: Sensitivity tests
1.Overview
There are a range of uncertainties underlying the analysis that has been carried out in support of this Impact Assessment. To assess how vulnerable the results are to these uncertainties sensitivity tests have been carried out where the various parameters are varied one by one to assess the effect on the outcome.
The largest uncertainty is considered to be how consumers will react to interoperable EPS and the resulting impact on EPS purchases.
A possible uncertainty is the weight attached to the two specific objectives and whether this will alter the choice of preferred option.
A further uncertainty relates to the effect of differing time preference for money.
Finally the thresholds chosen to translate the estimated effectiveness and efficiency of options could affect the ranking of the POs.
There is of course uncertainty over cost and price assumptions, but no specific sensitivity test is carried out on these since it is considered their impacts will be far smaller than the tests done.
2.Consumer reaction to interoperability
A main uncertainty in assessing the impact of interoperability is how this will affect consumer behaviour. The underlying hypothesis is that if EPS are interoperable, consumers will reuse them for other devices rather than buying a new one with every new end device. Clearly not all devices can be powered with all EPS and EPS themselves have finite lives and consumers may have a preference to stock more EPS to have them available in different locations.
The baseline assumption used in the analysis is that the average life of all EPS will increase by 50% when they are interoperable. To explore the assumption about how much longer each EPS will be used this 50% lifetime increase is varied. A lower variant is explored where it is assumed that the lifetime only increases by 25% i.e. 1/2 of the central assumption. A comparable upper variant assumes that the lifetime of EPS increases on average by 75% ie 1.5 times the central assumption.
It is to be noted that the assumption about the degree of reuse of EPS, and therefore any change for a sensitivity test, must be applied equally to EPS that are used for RED devices as well as those that are used for other devices not in the RED scope. The implication of this is that the change in this assumption also affects the BAU and affects PO1 that does not itself introduce additional interoperability requirements beyond those already resulting from the RED.
The impacts of changes in the assumed reaction to interoperable EPS will only appear after the initial period when the EPS stock are not interoperable. In 2030 there should be no significant impacts since the cost of implementing the interoperability requirements will be identical, but those EPS will not yet have reached the end of their lives. By 2035 those effects should be visible and so comparisons are made of the estimated impacts of the sensitivity tests in 2035 compared with the central scenario.
Impacts of an EPS life extension due to interoperability above the central case
Table
47
shows the key results for the central scenario and the sensitivity test with a longer life in 2035. It can be seen from the colouring that with the exception of the consumer costs savings, there is relatively little change in the ordering of the impacts. The most significant impacts are seen on consumer cost savings where the ordering is altered and PO4 and PO6 become the best performing while PO1 goes from best to worst performing. As noted, the change in the impacts of PO1 is primarily because of the assumed longer lives of RED devices.
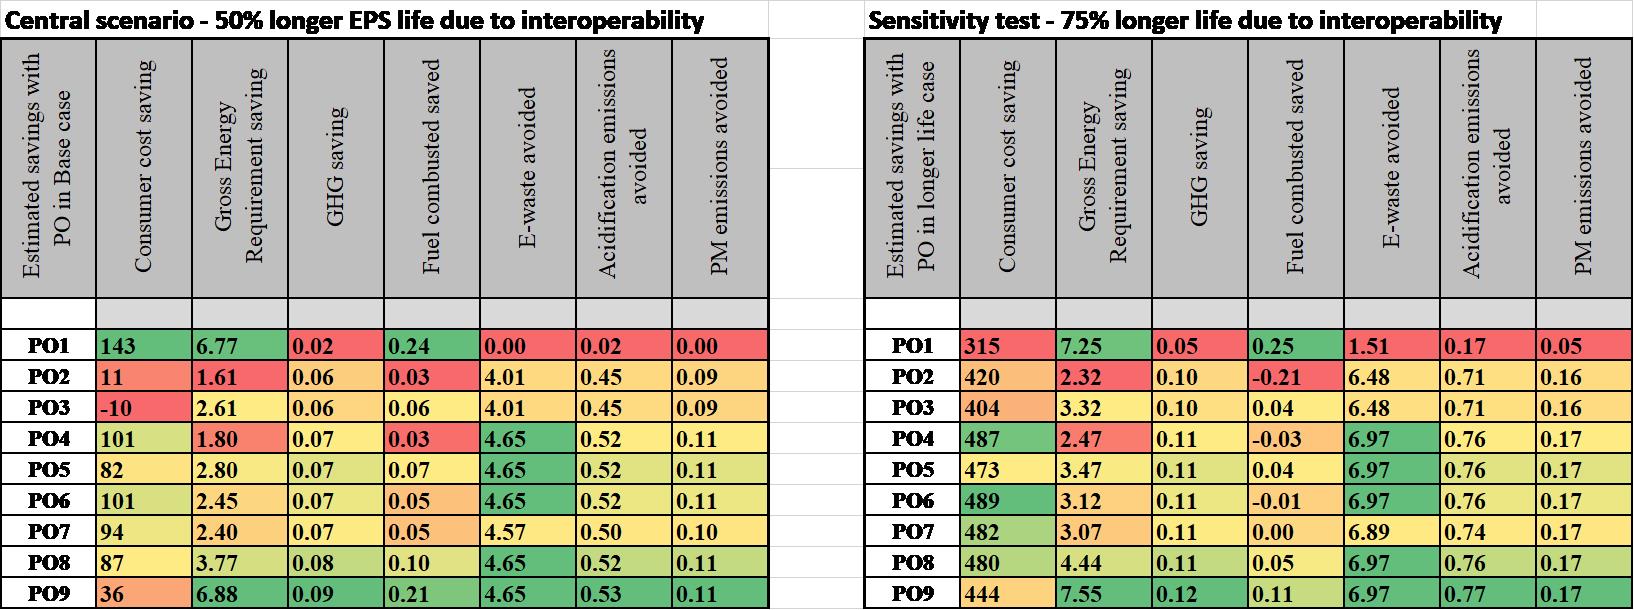
Table 47 - Comparison of benefits with an assumed 50% life increase (left) and 75% life increase (right)
Table
48
below shows the change in impacts with the sensitivity test compared to the central scenario in absolute and percentage terms. Cells coloured green show an improvement and those coloured red a deterioration compared to the central scenario. As would be expected, the impacts mainly linked to EPS production (e.g. emissions) mostly see a reduction of around 50%. Gross Energy Requirement decreases less since a large share of this relates to EPS use that is unaffected.

Table 48 - Change in impacts due to 50% increase in EPS life assumption
Impacts of an EPS life extension due to interoperability less than the central case
Table
49
below shows the key results for the central scenario and the sensitivity test with a shorter life in 2035. It can be seen from the colouring that there is relatively little change in the ordering of the impacts.
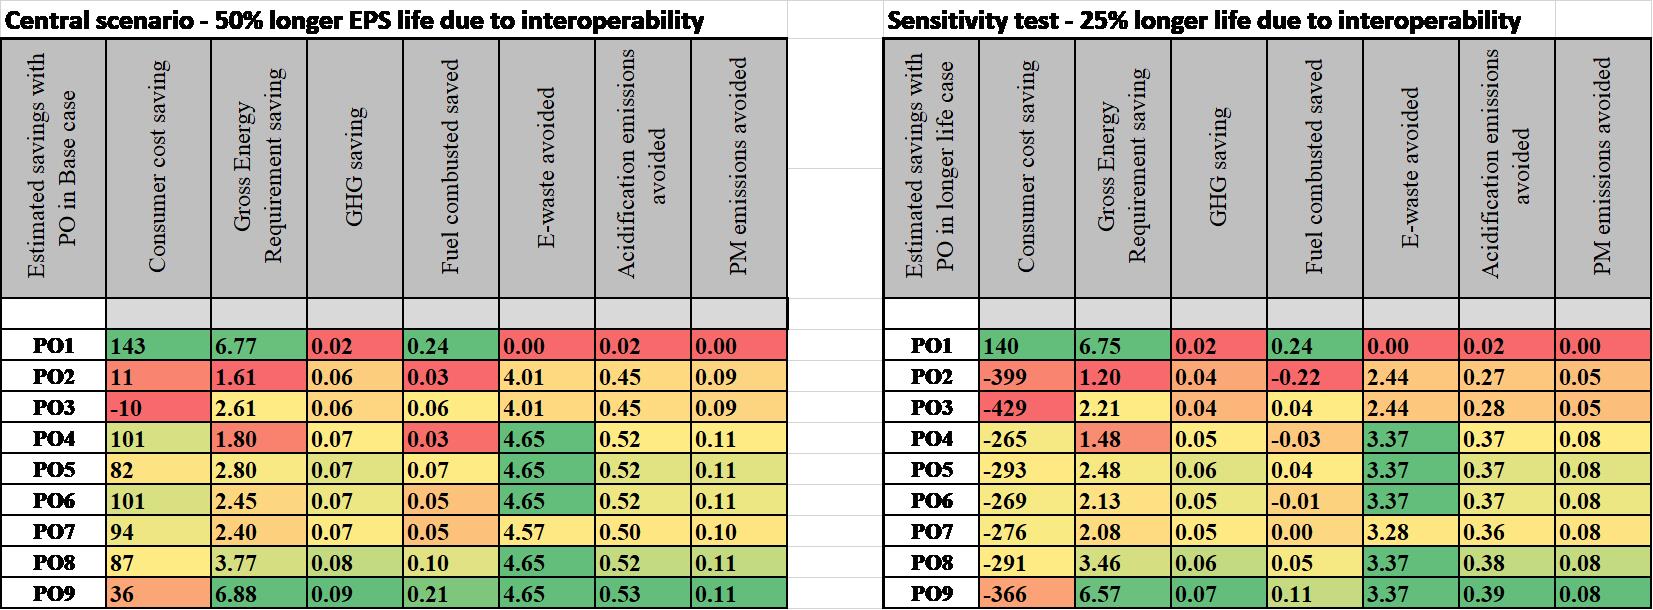
Table 49 - Comparison of benefits with an assumed 50% life increase (left) and 25% life increase (right)
Table
50
below shows the change in impacts with the sensitivity test compared to the central scenario in absolute and percentage terms. Cells coloured green show an improvement and those coloured red a deterioration compared to the central scenario. As would be expected, all impacts are worse than in the central case.

Table 50 - Change in impacts due to 50% decrease in EPS life extension assumption
3.Weighting of the specific objectives
To test the sensitivity of the assessment of effectiveness and efficiency to the assumed share of SO1 and SO2 in the assessment a range of shares were tested as shown in
Table 51
below. The central case assumes both are equally important. The moderate variants increase the share of one or the other to 60%, the extreme variants to 70% and the most extreme (EU focus) assumes a 90% share for energy and GHG emissions are counted as 90% of the SO2 impact (as opposed to 37% in the other scenarios).

Table 51 - Weighting of SO1 and SO2 for sensitivity tests
The EU focus scenario is intended to reflect the fact that most of the pollutant emissions other than Greenhouse gas will occur outside the EU and have most of their impacts outside the EU. In contrast the majority of the energy use will occur in the EU and have a cost for EU consumers while the GHG emissions have global impacts and are therefore equally important for the EU regardless of where they are emitted.
4.Effectiveness
Table
52
shows the normalised results for the Central scenario and full set of sensitivity tests for effectiveness. The range of effectiveness is 51% in the Central scenario and increases in almost all sensitivity test to reach a maximum of 66% in EU focus. In ModVAR1 the range decreases slightly to 55% variation in effectiveness.

Table 52 - Normalised outcomes of the sensitivity tests of Effectiveness contrasted with the Central scenario
It can be readily seen from the heat colouring that the sensitivity tests do not show any significant sensitivity in the ordering of the results except at the extremes. PO9 is in all scenarios the most effective option. PO1 is generally the least effective except if a very strong emphasis is placed on energy saving compared to environmental impacts. PO2 is generally the second worst performing although with an extreme focus on energy it replaces PO1 as the least effective.
For PO3 to PO8 the order of effectiveness from least to best is PO3, PO4, PO7, PO6, PO5, PO8 for the Central, Moderate and Ext VAR2 scenarios. PO3 and PO4 swap places in Ext VAR1 and in EU focus PO3 improves position to perform as well as PO6 but the ordering of the other POs does not change.
The broad similarity in the results of the sensitivity test can be attributed to the fact that a large share of all the impacts are closely correlated with the electricity consumption in the use phase of the EPS which was shown as around 78% in
Table 2
and which will be even higher when interoperability leads to longer EPS operating lives.
These effects are shown graphically in the radar plot below where the most obvious effect is that there is virtually no changes in the relative effectiveness axis of PO2 to PO9, however as noted for PO1 the sensitivity tests significantly alter its attractiveness.

Figure 63 - Radar plot of sensitivity impacts on normalised effectiveness of PO1 to PO9
5.Efficiency
Efficiency is assessed on the basis of the effect of the POs on consumer costs. It must be borne in mind that the cost impacts of the various measures occur in different time frames. Some result immediately in increased EPS purchase prices while others only occur at the end of the EPS life when a new EPS needs to be purchased and the effect of the efficiency measures is felt throughout the life. To take account of these temporal differences it is necessary to use a discount rate to account for the higher preference for money in the short term. A 3% discount rate is used as the central hypothesis but sensitivity tests with a 0% and 6% rate are carried out.
a)No discounting
Table
53
shows the full set of sensitivity tests for efficiency without discounting for the same options and sensitivities as effectiveness. The central case shows an 83% efficiency range. In the other scenarios this range either increases to 88% (ExtVAR2) or 86% (ModVAR2) or decreases to 73% (ExtVAR1), 77% (EU focus) or 79% (ModVAR1).
In terms of the ordering of the efficiency of the POs, PO1 is the most efficient in all scenarios except EU focus. PO3 is the least effective in all scenarios. PO2 and PO9 are then the next least efficient changing order depending on whether the focus is on energy (PO9 less efficient) or emissions (PO2 less efficient).
It is noticeable that with a greater emphasis on energy rather than emissions PO4, 6 and 7 appear significantly more efficient and PO4 actually becomes the most efficient with a very high energy focus.

Table 53 - Normalised outcomes of efficiency sensitivity tests with no discounting
b)3% discount rate
Using a 3% discount rate will means that the present value of the electricity savings in use will be valued less highly while the reduced EPS purchase costs at the end of life will be even further discounted compared to the case with no discounting. The results of the sensitivity tests in this case are shown in
Table
54
.

Table 54 - Normalised outcome of efficiency sensitivity tests with 3% discounting
In terms of the range of variation between the scenarios, there is no difference with the scenarios without discounting. There is no particularly significant change in the relative ordering of the POs with the different scenarios with 3% discount rate compared to no discounting.
c)6% discount rate
The results using a 6% discount rate are shown in
Table
55
below. In this case the present value of the electricity savings in use will be valued even less highly while the reduced EPS purchase costs at the end of life will be even further discounted. Although there are further small differences the overall ranking of the POs is unchanged.
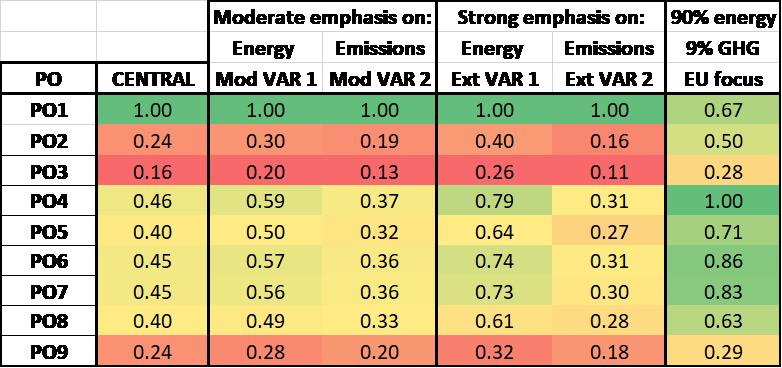
Table 55 - Normalised outcome of efficiency sensitivity tests with 6% discounting
These effects are shown graphically in the radar plots in
Figure
64
for the three levels of discounting.
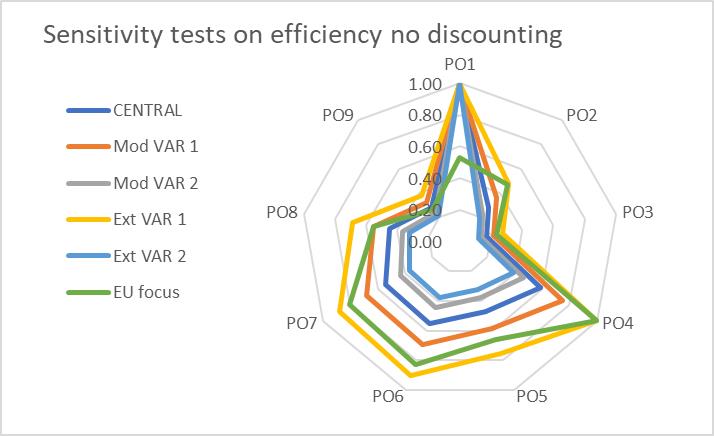
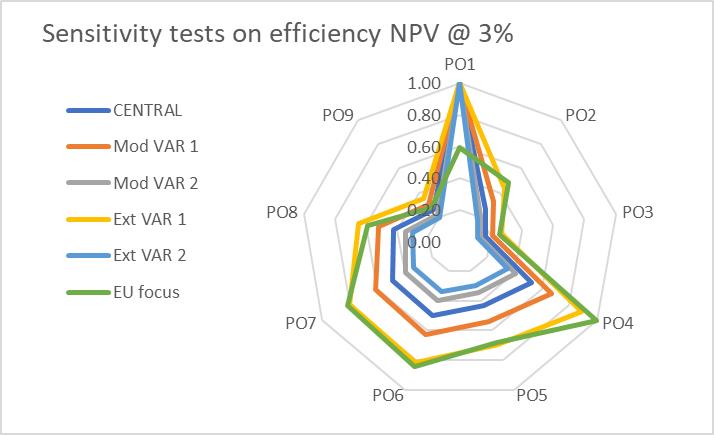
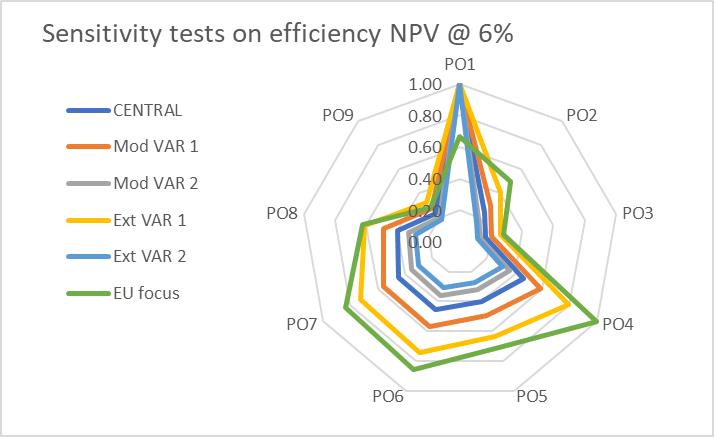
Figure 64 - Radar plots showing sensitivity impacts on normalised efficiency of the POs
The radar plots illustrate that there is no really significant variation across the three sensitivity tests in terms of the ranking of the POs. It is really only in the most extreme cases (EU focus and Ext VAR1) that there is a noticeable impact in the rankings.
6.Effects of the effectiveness and efficiency sensitivity tests on ranking off the POs.
The sensitivity tests have shown that varying the importance given to SO1 and SO2 in the scoring does not lead to very significant changes in the actual scoring of effectiveness and efficiency. Nonetheless, it is important to check whether these changed weights would lead to a different ranking of the POs or the choice is robust regardless. The results of this are shown in
Table
56
without discounting. In this table the scoring for LLCC and coherence (shown shaded) are held constant In the right hand side are shown the final scores, coloured green for best, yellow for second best and red for third best.

Table 56 - Final rankings using effectiveness and efficiency scores from the sensitivity tests
In the central scenario and 4 out of the 5 sensitivity tests, PO6 scores highest. In ModVAR1 it scores equally well with PO4 and PO8. Those two POs, along with PO7 score fairly consistently in joint second place in the rankings.
7.Effects of the weighting applied to LLCC on ranking of the POs.
In the ranking of the POs, the approach followed means that a maximum score of 2 is given for LLCC, maximum 3 each for effectiveness and efficiency and maximum 2 for coherence giving a maximum score of 10 and a 20% weight for LLCC in the maximum score. Since the LLCC requirement is clearly stated, subject to taking account of the environmental impacts, it is desirable to see whether giving a higher weight to LLCC in the scoring leads to any change in the ranking of the POs.
For this test the scores from the sensitivity tests for effectiveness and efficiency are used, and these along with the scores for coherence are held constant (shown shaded in
Table
57
). In contrast, the scores for LLCC are doubled, increasing the LLCC weight from a maximum of 20% to maximum of 33% in the final scoring.
The highest ranked PO in each scenario is shown in green, the second best in yellow and the third best in red. A clear impact of the increased emphasis on LLCC is to increase the clarity that PO6 is the best ranked PO in all sensitivity tests, always scoring better than any other PO. PO1, 4, 7 and 8 remain the other best scoring POs although their rankings change and PO1 is now second or joint second best in many of the cases.
This sensitivity test tends to confirm that PO6 is the best performing given the LLCC cost constraint.
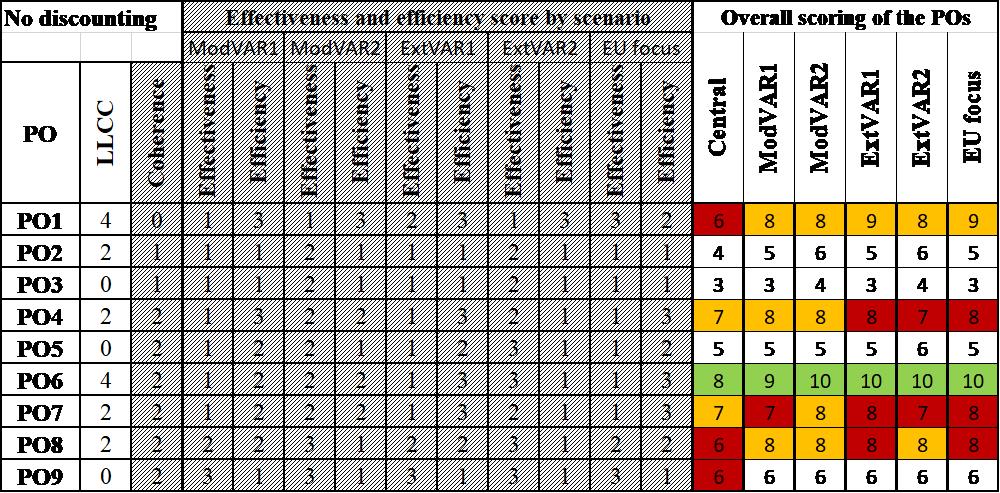
Table 57 - Impact of increased LLCC weight in rankings
8.Societal costs
A further sensitivity is to see whether using societal costs rather than consumer costs changes the results. The results of this test are shown in the table and radar plot in
Figure
65
below.

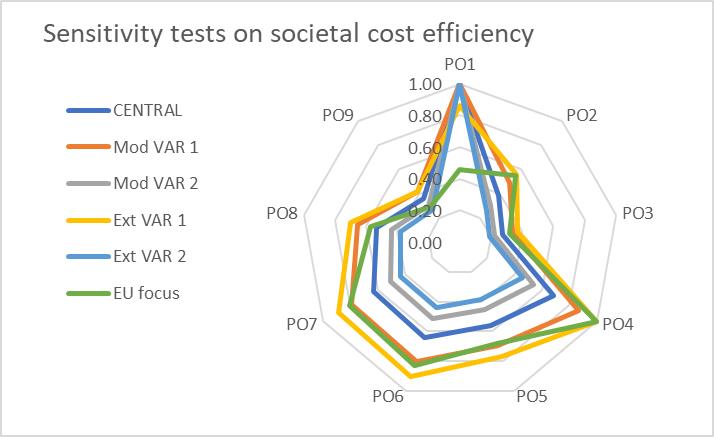
Figure 65 - Table and radar plot showing societal cost efficiency of the POs
The most noticeable change compared to using consumer costs, is that there is a slightly smaller efficiency range across the POs. With the central scenario the range is 73% which increases to a maximum of 81% in ExtVAR2 and decreases to a minimum of 63% in ExtVAR1. The main reason these scenarios lead to the largest variation in both directions is because the emissions to air are included in both the denominator and the numerator of the calculation and so the change in their importance is thus exaggerated in both directions.
While there are some differences compared to efficiency based on consumer cost, it can be concluded that using societal costs as the basis for assessing cost efficiency does not lead to any substantial change in the cost efficiency ranking of the POs.

Table 58 - Ranking of POs based on societal costs
Table 58
shows that the final rankings of the POs based upon societal costs rather than consumer cost are largely unchanged. The entries shown shaded are unchanged in this assessment. The clear best performing option remains PO6, with PO4, 7 and 8 the second best and PO1 and 9 third ranked. This is in line with the results of using the other sensitivity tests to produce rankings of the POs.
9.Impact of the thresholds for effectiveness and efficiency
As explained in section 7.4, the calculated values of effectiveness and efficiency are translated into a scoring of 1 to 3 to enable ranking of the POs. If the scores are translated to the same scale using figures to one decimal place instead of integers the ranking might change. The effect of this test is shown in table below.

Table 59 - Comparison of ranking POs with integers or to one decimal place
It can be seen that there is no significant impact on the rankings. The most noteworthy change is that PO8 scores slightly better with decimals and ranks second instead of joint third while PO4 scores slightly worse with decimals and ranks joint third instead of joint second.
These minor changes in ranking should be contrasted with the necessarily quite basic scoring of LLCC and coherence as tested for example in point 7 above.
Annex 14: Additional impacts of the Policy Options
Main indicators for POs in 2030:

Table 60 - Main indicators of PO impacts in 2030 with colour coding
Main indicators for POs in 2040:
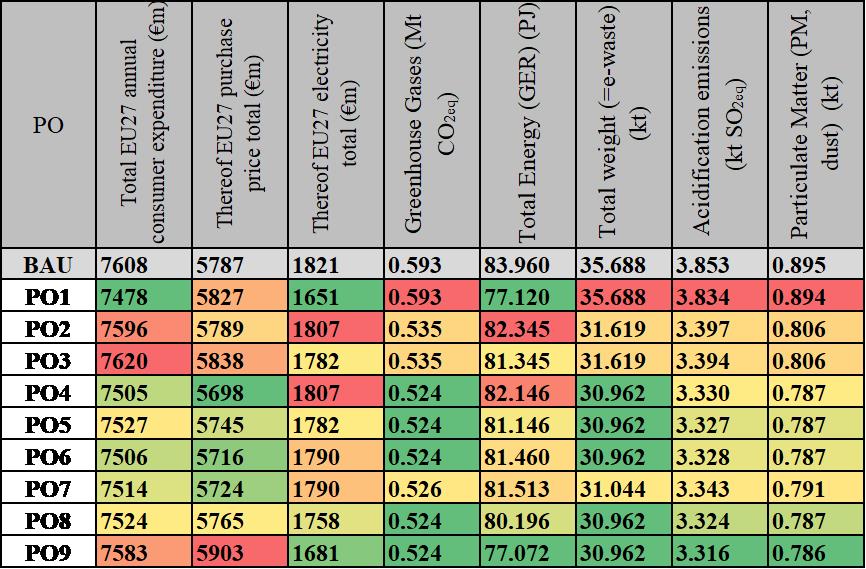
Table 61 - Main indicators of PO impacts in 2040 with colour coding

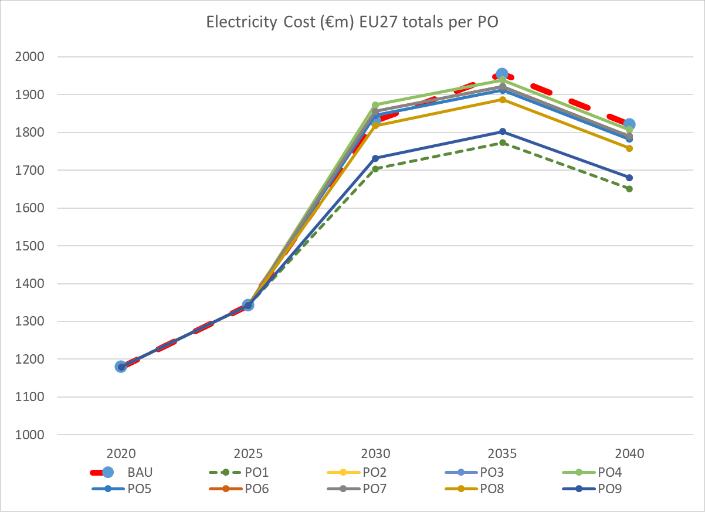
Figure 66 - Graphs showing (left) purchase price impacts and (right) electricity cost impacts of BAU and the POs from 2020 to 2040


Figure 67 - Graphs showing (left) acidification and right particulate matter emissions of BAU and the POs from 2020 to 2040
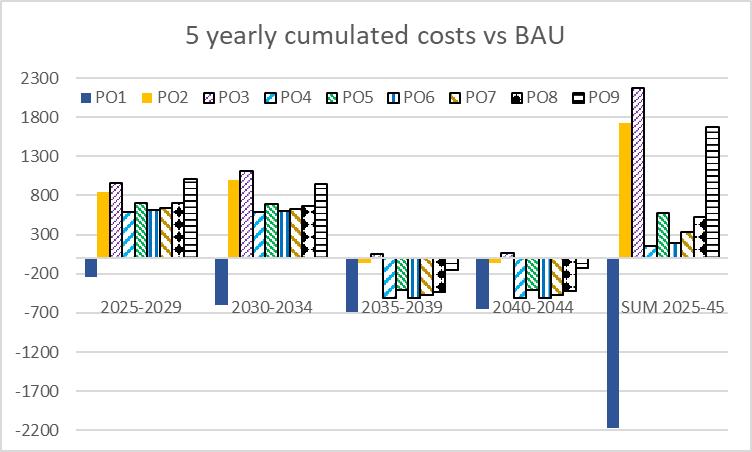
Figure 68 - Cumulative costs of the POs versus BAU for 5 year periods to 2045
Annex 15: Valuing consumer (In)Convenience
Valuation of consumer convenience in this Impact Assessment
The core analysis carried out in this Impact Assessment focusses on the direct costs and environmental impact of the measures and policy options. However, a key objective of the Common Charger initiative and an important co-benefit of the interoperability aspects of the EPS review is to increase consumer convenience. The difficulty arises in quantifying this increase in consumer convenience in a precise manner. No consumer studies have been carried out in the course of this work to attempt to allocate monetary values to those benefits.
Because of this challenge, the approach followed has been to exclude the valuation of the benefits of the policy options for consumer convenience from the assessment of the effectiveness and efficiency of the POs. However, a rough estimation may be made of the likely scale of the consumer convenience benefits to provide a benchmark to understand the likely importance this can have.
Likely benefits of EPS interoperability for consumer convenience
The whole motivation for the common charger initiative is predicated on an assumption that consumers would value being able to use the same EPS for multiple devices. This would be applicable at the same moment in time but also over time as the end device is replaced.
Additional benefits may arise in the case of failure of an EPS since if they are interoperable, another EPS may simply be used to replace the broken one without the need to immediately buy a new one. More commonly, in case an EPS is forgotten, and an end device needs to be powered or charged, interoperable EPS means that this is feasible using someone else’s EPS.
Further benefits may arise from a reduced need to carry EPS from one location to another to power a device, since there will be interoperable EPS available at that location that will be usable with the device.
The potential to reuse EPS over time is internalised in the analysis by the assumed longer EPS lifetimes. Similarly, some of the consumer convenience is already included in the baseline due to the RED requirements for USB receptacles on the range of RED end devices. What is clearly not internalised are situations where there is:
·a need to buy a replacement for a failed or lost non-interoperable EPS;
·a need to temporarily use another EPS in case of forgetting a non-interoperable EPS.
Replacements for failed EPS
The modelled assumption for durability is that this would lead to an average 2 month longer life for EPS assuming that average lifetimes increase to 7.5 years. This implies an approximate failure rate of 2% over this lifetime. The cost of purchasing the replacement for the failed EPS is internalised in the modelling assumptions. However, what is not internalised is the inconvenience at the moment of the failure both in terms of the time needed to identify and purchase a replacement and the inability to use the powered device in the meantime.
In the case of non-interoperable EPS it can be assumed that obtaining a replacement will not be immediate. In the best case in can be assume that it would need an hour of searching and at least a day if not longer wait for the new EPS to be available. We can assume a low hourly rate of €10 per hour for the personal effort involved. For the delay to using the end device, this will clearly vary enormously depending on the what the end device is. A lower limit is probably zero, since for many devices the inconvenience would be minimal, while an upper limit might be set by the cost of replacing the end device rather than waiting for a replacement EPS. It is proposed that the cost of this inconvenience be assumed to be €10 per failure.
Since there is a total stock of approximately 2bn EPS, of which around 60% will be covered by the RED interoperability requirements, the additional consumer convenience will relate to the other 40% i.e. 800mln EPS. Based on the assumed 2% premature failure rate, this will amount to an average of 16mln EPS failures per year. If the inconvenience to consumers for each failure is valued at €20 this would provide an indicative value of the consumer inconvenience from prematurely failing non-interoperable EPS of €320mln per year.
Clearly the fact that EPS would be interoperable cannot remove all the cost of this inconvenience. For example, the failure might occur in circumstances where there is no alternative EPS available. In view of this it may be reasonable to assume that this represents half of the situations and therefore the actual avoided inconvenience may only be around half of the estimated value, i.e. €160mln per year.
Temporary use of another EPS
The supporting study for the Common Charger IA reported that for mobile phone users a problem arising from the situation with incompatible EPS was:
“Consumer inconvenience: Most mobile phone users (84% according to the consumer panel survey) have experienced problems related to their phone chargers in the last two years. Commonly cited problems (each experienced by between one third and half of respondents) were the inability to charge certain devices (as fast) with certain chargers; having too many chargers taking up space in the home and/or workplace; situations where they needed to charge their phone, but the available chargers were incompatible with it; and confusion about which charger works with what device. Around 15% to 20% of all survey respondents who experienced one or more of these problems reported it had caused them significant issues.”
This would imply that around 6% of mobile phone users may have experienced significant inconvenience due to the lack of interoperability per year. However, this figure cannot readily be translated to other sorts of devices with EPS since by their nature mobile phones are frequently carried without their EPS while in the majority of cases most end devices are likely to be used and remain with their EPS.
It is therefore supposed that for the non-RED devices, the scale of this problem would be very much smaller, and it hypothesised to maybe be only 2% of the level identified for mobile phone users. This would imply that around 0.1% of EPS users would experience significant issues. This case would apply to the 800m non-RED EPS meaning that these difficulties would be experienced for 0.8mln EPS. If it is assumed that the value of these significant difficulties to the consumers is also €10 it would imply a consumer inconvenience of €8mln.
Network or scale effects
A further factor that increases consumer convenience is the effect of more devices and EPS being interoperable. This scale effect increases the likelihood that a given EPS will be interoperable and therefore substitutable with another one. This scale effect applies to all EPS since even the users of RED devices will benefit if there are more possible USB EPS available that they could potentially use for their devices.
The effect means that anyone with any EPS, even users of RED devices, are more likely to readily be able to use an alternative EPS when their own one is unavailable. The value of this for users of RED devices is calculated on the basis that 6% of users off RED devices may experience significant inconvenience each year. If it is assumed that there are 400mln such users, 24mln per year will suffer significant inconvenience. By increasing the likelihood that there is an alternative usable EPS available (by 60%) though ensuring that the remaining 40% of non-RED device EPS are also interoperable, the value of this inconvenient will be reduced. If the inconvenience is assumed to be inversely related to the availability of interoperable EPS it would reduce the inconvenience by 1/3 i.e. by €3.3 based on the assumed value of €10 per significant inconvenience. This improved consumer convenience from the scale effect is therefore worth around €79mln per year.
Summary and conclusions
Two possible types of consumer inconvenience have been identified that the increased interoperability of non-RED EPS will alleviate. A third benefit is identified based on the network effects from a wider range of interoperable EPS. The central estimated values for the three different effect are shown below with an indication of how large the values might be if they were either 50% lower or 50% higher than the estimate.

Figure 69 - Illustrative ranges of estimated consumer convenience benefits
Based on these very approximate estimates the additional value of the consumer convenience arising due to the interoperability requirements envisaged in M3 and included in PO2 to PO9 range between a low of €123mln and a high of €370mln per year with a central estimate of around €250mln.
Annex 16: Evidence underlying assumptions of extended interoperable EPS lifetimes
One of the major reasons for the assumed environmental benefits from interoperable EPS is that consumers will continue to use the same EPS with other products even if the end-use product reaches the end of its life. Coupled with this is an assumption that manufacturers will progressively choose to unbundle the sales of end-use products from EPS as the latter become interoperable.
There is little hard evidence that can support these assumptions since the traditional business model involved an EPS being supplied with each end-use product and therefore implicitly being disposed of when the end-use product reached the end of its life.
This annex brings together a range of information sources that by analogy can be used to arrive at plausible assumptions about the likely rate of reuse of EPS and their increased lifetime.
Work carried out for the revision of the Radio Equipment Directive
In the 2021 Impact Assessment study on unbundling of chargers some data was given on the state of unbundling for various related products. This showed the following shares at that time that were sold without an EPS or charger:
|
Product
|
Number reviewed
|
Proportion without EPS or charger
|
|
Mobile phone
|
186
|
17%
|
|
Tablet
|
Not known
|
0%
|
|
Camera
|
29
|
28%
|
|
Hearing aids
|
34
|
100%
|
|
Video game consoles
|
9
|
22%
|
|
Portable speakers
|
26
|
81%
|
|
E-readers
|
8
|
100%
|
|
Smart watches
|
11
|
55%
|
Table 62 - Share of unbundled EPS for various products from 2021 Impact Assessment
It should be recalled that at the time there were no requirements relating to unbundling. While no survey has been carried out to assess how these figures have evolved, there is anecdotal evidence of a trend towards unbundling with for example many tablets now offered without EPS.
The 2019 public consultation that was carried out for the review of the Radio Equipment Directive received 2,850 responses. An overwhelming majority (96%) were EU citizens, with all Member States represented. Most citizens were not satisfied with the existing situation and 76% agreed or strongly agreed that it was a source of inconvenience (because of multiple chargers for different devices taking up space in their homes or generating confusion, or difficulties finding a suitable charger when away from home). This consumer reaction suggests a strong interest in purchasing less EPS and reusing them from one device to another.
Manufacturer willingness to offer other products without EPS – i.e. unbundling
Examples can be found for many products such as monitors, battery chargers, grooming tools, power banks, bike lights. While no data is available on market shares for USB-C power supply for these types of products their existence clearly demonstrates a consumer demand for them and willingness on behalf of manufacturers to supply this.
Consumer reasons for disposing of other products
EPS are essentially functional devices rather than fashionable ones. They are not something that have a status value but are rather kept out of the way and largely carry out their job unseen. In view of this they may be considered like other functional household equipment.
The PROMPT project investigated causes for disposing of five types of household electrical and electronic equipment. It showed that the rate at which these were kept in use until defective varied substantially according to the type of equipment as shown in
Table 63
.
|
Equipment
|
Proportion replaced because defective
|
Proportion replaced because not working well
|
|
Washing machine
|
69%
|
|
|
Vacuum cleaner
|
34%
|
29%
|
|
Television
|
44%
|
|
|
Smartphone
|
Around 30%
|
Around 10 to 20%
|
Table 63 - PROMPT data on the share of various products used till defective
Although they relate to very different types of products and these products have very different functions from EPS it is interesting to note that somewhere between a minimum of 30% and a maximum of 69% of respondents appear to be willing to continue using these products while they are sufficiently functional.
Other evidence of consumer interest in prolonging product lives
The Impact Assessment for the Ecodesign for Sustainable Products Regulation (ESPR) argues that many individual are interested in prolonging the lives of products but are hampered by a range of factors:
“Similarly, as information on the lifespan of products is regularly not available to consumers, they often use other indicators (e.g. price or brand) to gauge the durability of the goods. This often leads to consumers associating more expensive goods with longer lifespans, despite the fact that consumer organisations point out that “in non-transparent markets high purchase prices are not always good indicators for the durability of products”. Ultimately, the lack of information on a product’s durability can lead to sub-optimal purchase choices, with consumers unknowingly purchasing goods that are potentially more difficult to repair or that have worse software update/upgrade policies than the available alternatives, in turn leading to increased ‘hassle costs’ (e.g. related to efforts and expenses with organising repair or replacing the good).”
It stated that in a 2018 public consultation, 83.4% responded that ‘the EU should set rules to make sure products have a long lifetime’.
The measures envisaged for EPS would aim to remove the uncertainties for consumers through ensuring that EPS are reusable by consumers without any effort on their behalf.
The ESPR IA also states that among EU citizens:
·56% are ‘occasional’ consumers of environmentally friendly products;
·23% pay attention to the environmental impact of all or most goods and services;
·67% buy products that are better for the environment even if they cost more;
·56% would use the information to buy ‘more environmentally friendly’ products.
While none of these statements exactly relates to the reuse of EPS, the latter behaviour is in line with the statements in that it is more environmentally friendly by reducing the environmental impact form EPS production, it would in fact cost less, not more, and by avoiding the need for a new EPS makes new end-use products more environmentally friendly.
A consumer behavioural study in 2018 explored consumer attitudes. Some relevant findings from that survey are set out below:
Concerning how long consumers wish to use products it was stated that:
‘With respect to keeping things for a long time, agreement rates were high. Overall, 93% agreed to this statement with 42% even stating strong agreement.’
However, interestingly the statements on whether they always buy new the newest electronic goods and gadgets was almost completely balanced implying that there is a disconnect between the two statements. Enabling EPS to be used longer offers a route to partially reconcile these two wishes of consumers.
The survey also showed:
‘consumers’ significant willingness-to-pay for better durability/reparability for all product categories. Depending on how durability/reparability information was presented, willingness-to-pay for an additional year of durability ranged between €20-36 for vacuum cleaners and dishwashers, €92-148 for TVs, €148-217 for smartphones’.
Both aspects indicate that in general consumers are open to using products for longer and claim that they are willing to pay a comparable amount per expected year of life for this as the cost per year of the product.
Finally, the survey reports that:
‘A majority of survey respondents attached high importance to product durability. Among these respondents, the top reason was that durable products would save them money in the long run.’
Another analysis carried out for ING shows that in many (mainly EU) countries between 40 and 70% of people say they are willing to increase the reuse of products by having them repaired as indicated in
Figure
70
. The share shows a decreasing trend with per capita income. There is clearly a higher barrier to reusing products after repair than reusing an EPS when the original end-use product is no longer in use, but this nevertheless provides a useful indication of the proportion of the population that may be open to reuse EPS.

Figure 70 - Relation between per capita income and openness to reuse of products after repair
Conclusions
The information gathered shows that even without any obligation, manufacturers are willing to offer a share of powered products without an EPS with the product. This share appears to be slowly increasing.
For this unbundling by manufacturers to result in an environmental benefit requires consumers to be willing to reuse EPS from one product to another. While there is limited information about this, other evidence is available that suggests by analogy that there would be a substantial willing ness to do this. The main elements can be summarised as being:
·76% of consumers say they are inconvenienced by a multiplicity of EPS;
·depending on the product, between 30 and 69% of people want to use them till they fail;
·93% of people say they use products a long time;
·83% of consumers want the EU to set rules to prolong product lives;
·between 23% and 67% of people state they take account of different environmental aspects in their product purchases;
·consumers appear to be willing to pay for extra life from new product prices;
·consumers say they want more durable products to save money;
·between 40 and 70% of people are willing to increase their reuse of products.
Taking all these different surveys together they point to a range between 25% and 75% of consumers that appear to be keen to use products longer, take the environment into account in their actions and to prolong product lives to save money.
The reuse of EPS would increase consumer convenience, save money and lead to environmental benefits without any effort by the consumer. These factors would suggest that a reuse rate towards the higher end of the range could be expected. However, an added uncertainty relates to how much longer an EPS would actually function for if it is reused. There is no real information on this since in the past EPS generally outlived the products they powered. It is most likely that the actual technical lifetime of EPS will depend both on their design and the duty cycle to which they are subject. In the absence of any detailed information it is taken as a working assumption that an EPS would be capable of functioning for twice as long as the device that it initially powers. This does not seem unreasonable since manufacturers would have no reason to wish their EPS to fail quickly and because the main determinant of EPS lives seems to be the temperature which the electrolytic capacitors in the EPS will experience.
In view of this analysis, the central assumption used in this Impact Assessment is that the lives of EPS will be extended by 50% above the life they would have had powering the initial product. The upper and lower limits of the identified range are tested with a sensitivity test of half this rate or an increase of it by 50%.
Annex 17: Detailed complementary and supporting information
USB-PD power curve (USB-IF)

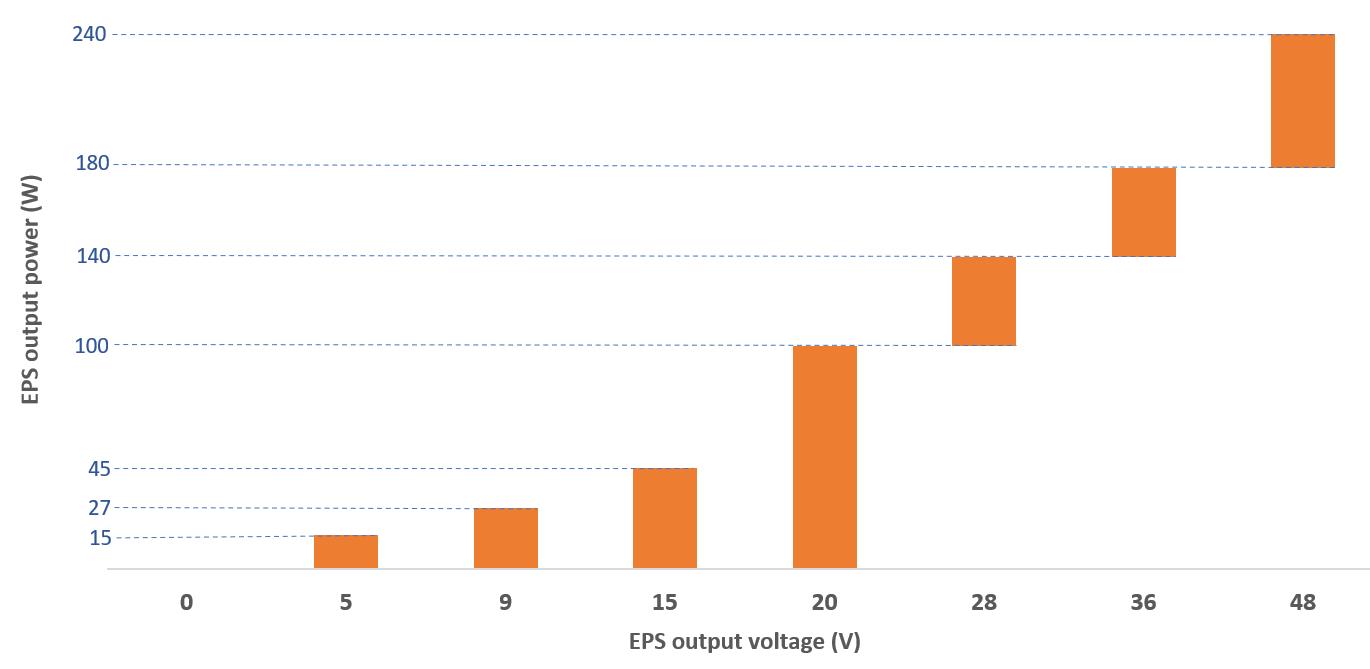
Figure 71 - USB-PD EPS output voltage and power
In-line with the USB-PD 3.1 specifications, EPS falling under the interoperability measure would need to be able to supply standardised fixed voltages demanded by the specific end-devices. Each EPS has a maximum power rating which determines all the lower fixed voltages which the EPS must be able to supply. This is illustrated in
Figure
71
. Above 20V, the USB-PD specification requires the power supply to be able to deliver a minimum power as shown by the lower end of the bars, i.e. 100W for 28V output, 140W for 36V output and 180W for 48V output.
Vacuum cleaners
A number of handheld vacuum cleaners was analysed regarding their EPS (cf.
Figure
72
). They are supplied (charged) with fixed voltages between 15V and 42V and a maximum power ranging from 5W to 35W. Supplying these devices with USB-PD power supplies would require for most of them more expensive oversized high power 100W or 140W EPS operated with EPR-grade e-marked cables necessary for voltages above 20V. To avoid the potentially expensive oversizing of certain EPS, is necessary for the interoperability measure to allow for exemptions in technically justified cases of high-voltage/low-power combinations falling outside the USB-PD range.
Figure 72 - Handheld vacuum cleaners' charging voltage and power (online data)
 Peak-power illustration

Figure 73 - Peak power above the USB-PD maximum power limit (illustration provided by Apple)
Active PoE injectors

Figure 74 - Outline of PoE with a midspan power over ethernet injector
Scale of electricity savings as a proportion of the EED 2030 energy savings goals
The Energy Efficiency Directive sets targets for energy savings through efficiency measures by 2030. It requires a reduction of energy consumption of at least 11.7 % in 2030 compared to the 2020 EU Reference Scenario projections. This would mean that the EU’s 2030 final energy consumption should be no more than 763 Mtoe. Since this is an 11.7% reduction, the decrease is 101 Mtoe which equals 1174 TWh.

Table 64 - PO electricity savings as proportion of EED final energy target
The table above shows the estimated EPS share of EU electricity consumption in 2035, and the expected reduction under each PO. The right-hand column indicates the share that the 2035 electricity savings under the different POs would represent as a proportion of the overall 2030 EED final energy target.
Annex 18: References
APPLIA (2022): Contribution to call for evidence on external power supplies, https://ec.europa.eu/info/law/better-regulation/have-your-say/initiatives/13351-External-power-supplies-ecodesign-information-requirements-review-/F3255604_en.
Directive 2009/125/EC (2012): Directive 2009/125/EC of the European Parliament and of the Council of 21 October 2009 establishing a framework for the setting of ecodesign requirements for energy-related products (recast). Ecodesign Directive; https://eur-lex.europa.eu/legal-content/EN/TXT/?uri=CELEX%3A02009L0125-20121204.
Directive 2014/35/EU (2014): Directive 2014/35/EU of the European Parliament and of the Council of 26 February 2014 on the harmonisation of the laws of the Member States relating to the making available on the market of electrical equipment designed for use within certain voltage limits (Text with EEA relevance). Low Voltage Directive; https://eur-lex.europa.eu/legal-content/EN/TXT/?uri=CELEX%3A32014L0035.
Ecodesign Impact Accounting (2021) https://op.europa.eu/en/publication-detail/-/publication/392bc471-76ae-11ed-9887-01aa75ed71a1/language-en#share
IA Common Charger (2019): Impact assessment study on common chargers of portable devices, European Commission. Directorate General for Internal Market. Industry. Entrepreneurship and SMEs; IPSOS, Trinomics, Fraunhofer Fokus, Economisti Associati.
IA Unbundling (2021): Impact assessment study to assess unbundling of chargers: final report. European Commission. Directorate General for Internal Market, Industry, Entrepreneurship and SME.; Economisti Associati, IPSOS, Trinomics, Fraunhofer.
Regulation (EU) 2019/1782 (2019): Commission Regulation (EU) 2019/1782 of 1 October 2019 laying down ecodesign requirements for external power supplies pursuant to Directive 2009/125/EC of the European Parliament and of the Council and repealing Commission Regulation (EC) No 278/2009 (Text with EEA relevance), https://eur-lex.europa.eu/legal-content/EN/TXT/?uri=uriserv%3AOJ.L_.2019.272.01.0095.01.ENG&toc=OJ%3AL%3A2019%3A272%3ATOC#.
TS Wireless Charging (2021): Technical supporting study to assess the status of wireless charging technologies used for mobile phones and similar portable equipment and next expected main technological developments: deliverable 5 (D5) : final report. European Commission. Directorate General for Internal Market. Industry. Entrepreneurship and SMEs; Fraunhofer IZM.

