 EUROPEAN COMMISSION
Brussels, 23.11.2017
SWD(2017) 395 final
COMMISSION STAFF WORKING DOCUMENT
Energy Union Factsheet France
FMT:ItalicAccompanying the document/FMT
COMMUNICATION FROM THE COMMISSION TO THE EUROPEAN PARLIAMENT, THE COUNCIL, THE EUROPEAN ECONOMIC AND SOCIAL COMMITTEE, THE COMMITTEE OF THE REGIONS AND THE EUROPEAN INVESTMENT BANK
Third Report on the State of the Energy Union
{COM(2017) 688 final}
{SWD(2017) 384 final}
{SWD(2017) 385 final}
{SWD(2017) 386 final}
{SWD(2017) 387 final}
{SWD(2017) 388 final}
{SWD(2017) 389 final}
{SWD(2017) 390 final}
{SWD(2017) 391 final}
{SWD(2017) 392 final}
{SWD(2017) 393 final}
{SWD(2017) 394 final}
{SWD(2017) 396 final}
{SWD(2017) 397 final}
{SWD(2017) 398 final}
{SWD(2017) 399 final}
{SWD(2017) 401 final}
{SWD(2017) 402 final}
{SWD(2017) 404 final}
{SWD(2017) 405 final}
{SWD(2017) 406 final}
{SWD(2017) 407 final}
{SWD(2017) 408 final}
{SWD(2017) 409 final}
{SWD(2017) 411 final}
{SWD(2017) 412 final}
{SWD(2017) 413 final}
{SWD(2017) 414 final}
 France
Energy Union factsheet
1.Macro-economic implications of energy activities
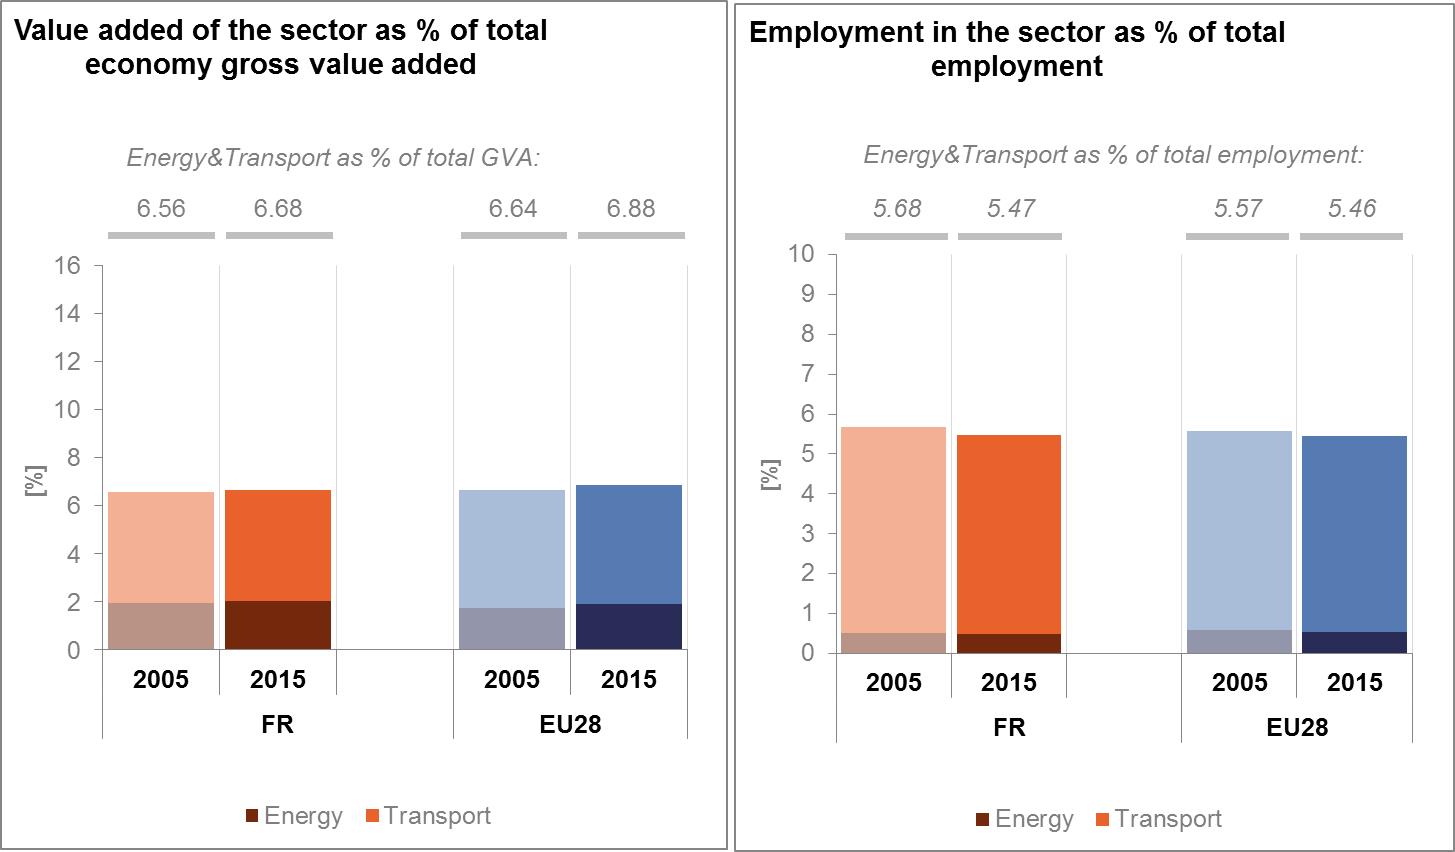
Energy and transport are key sectors for the overall functioning of the economy as they provide an important input and service to the other sectors. Together the activity in these two sectors
accounted for 6.7% of the total value added of France in 2015. Similarly, their share in total employment
was 5.5% in 2015, of which 5% in the transport sector and 0.5% in the energy sector.
(source: Eurostat)
The decarbonisation of the energy and transport sectors will require significant investments and economic activity beyond the remit of these sectors themselves. The energy transition implies a structural shift in economic activity. Energy-related investment and jobs will in part migrate from traditional fossil fuel based activities towards construction, equipment manufacturing and other services related to the deployment of low carbon and clean energy technologies. At the moment, the efforts related to the low-carbon and clean energy transition in sectors beyond energy can only be partially quantified and are therefore not included in this analysis.
In the case of renewable energy sector, both the direct as well as the indirect effects on employment are being estimated. According to EurObserv'ER, in 2015, the share of direct and indirect renewable energy related employment in total employment of the economy in France was at about 0.63%, above the EU average of 0.54%. The turnover of the renewable energy industry in the same year was estimated at around EUR 20.03 billion, the biggest part being attributed to the biomass followed by photovoltaic.

(source: EC based on Eurobserv'Er and Eurostat)
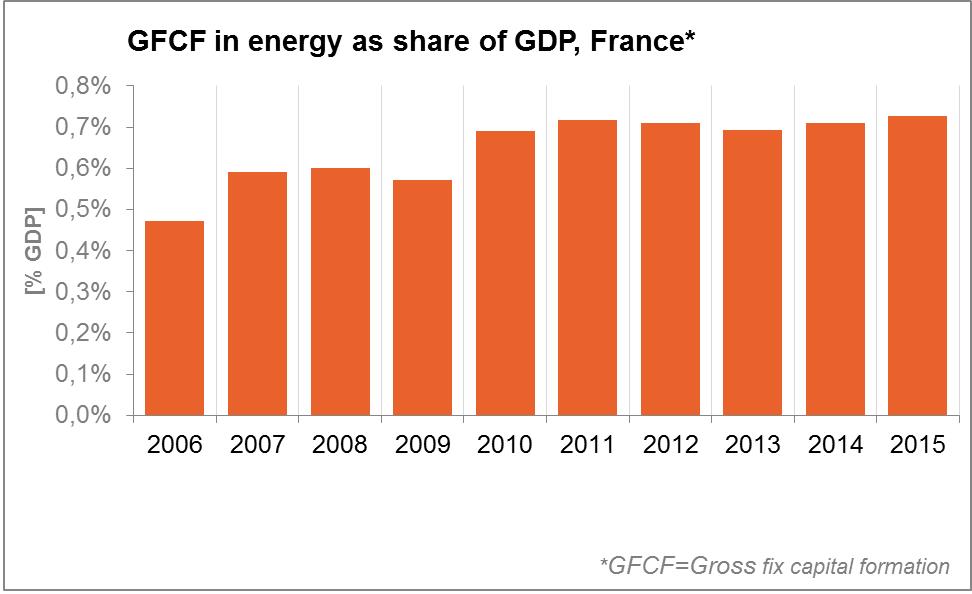
An indication of the level of investments in the energy sector in France is given by the Gross fixed capital formation (GFCF)
. These investments, in the electricity and gas sectors, which are taken as reference sectors, have been on an increasing trend since 2010. They represented around 0.7% of the country's GDP in 2015, higher than in the pre-crisis period.
(source: Eurostat)
In terms of trade, France is a net importer of fossil fuels and a net exporter of electricity. The trade deficit in energy products has fallen from about 2.4% of GDP in 2006 to 1.8% in 2015 influenced by improvements in energy efficiency and an increase of domestic renewable energy sources and by the decrease in the prices of energy commodities. The largest decrease is accounted for by petroleum products. The trade deficit for gas is on a decreasing trend since its peak in 2011/2012. It amounted to 0.5% of GDP in 2015, which was similar to its level in 2007.

(source: Eurostat)
2.Energy security, solidarity and trust
2.1.Energy Mix
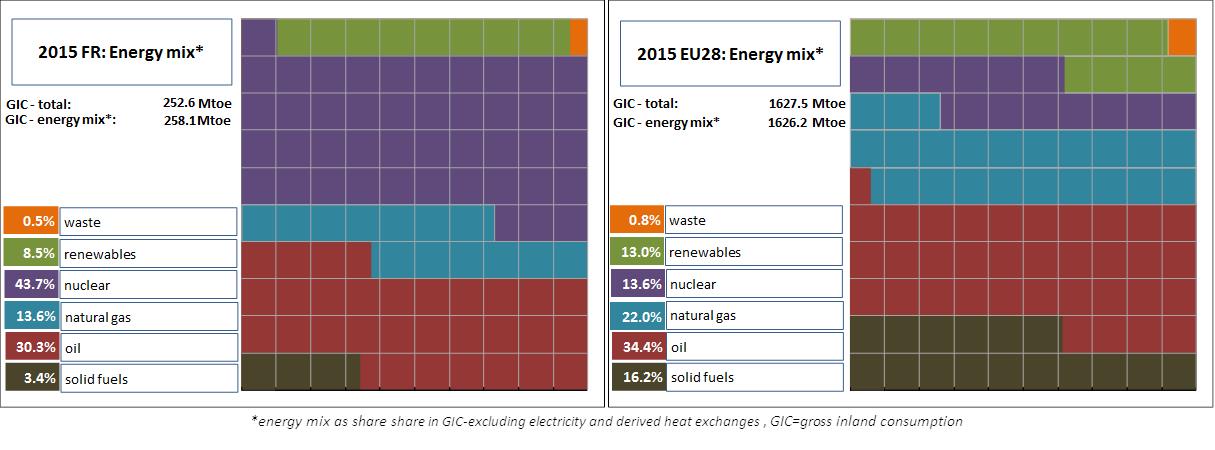
France's average energy mix has a much higher share of nuclear energy (43.7% vs 13.6%) compared to the EU average. Conversely, fossil fuels are much lower than the EU average (with respectively 13.6% vs 22% for natural gas, 30.3% vs 34.4% for oil, and 3.4% vs 16.2% for solid fuels). The renewable energy portion is also lower (8.5% France vs 13% for all EU), and the gap with the EU average has been widening since 2001 because the increase of renewable energy is slower in France than in the EU overall.
(Source: Eurostat)
2.2.Import dependency and security of supply
46% of France's energy consumption is met by imports, somewhat less than the EU average (54.1%). This is due to the high importance of nuclear energy in the energy mix which represents almost half of the country's energy needs
. The overall energy import bill for 2015 amounted to 39.7 billion euros (far behind the 69 billion paid in 2012), representing 1.8% of the GDP. This decrease can notably be explained by the fall in international fossil fuel prices.
The overall import dependency of France recorded a decrease of about 5.6 p.p. between 2005 and 2015, whilst at the EU level, import dependency increased by 1.9 p.p. over the same period. France imported almost all its fossil fuels needs in 2015, but the diversification of its import sources coupled with its good capacity levels at interconnection entry points and LNG terminals as well as adequate storage facilities make the French market less vulnerable than most Member States in relation to security of supply.

(source: Eurostat)
Imports of natural uranium and nuclear fuels are not included in Eurostat's energy balances and therefore import dependency cannot be calculated in the same way as for the main fossil fuels. France is importing most of its natural uranium needs from five main countries (Canada, Kazakhstan, Russia, Australia and Niger), relying on all major suppliers. The uranium bill represented less than one billion euros in 2015, to be compared to the 39 billion for fossil fuels. Concerning nuclear fuel cycle services (conversion, enrichment, fuel fabrication), EDF (the operator of the 58 nuclear reactors) is supplied by Areva to a large extent but also by other competitors such as Urenco (Great Britain-Netherlands-Germany), Tenex (Russia) or Westinghouse (USA-Japan). Therefore, import dependency risks on nuclear fuel are mitigated by good supply diversification of the entire chain of the nuclear fuel cycle. EDF also holds strategic inventories of nuclear materials and additional stocks of reprocessed uranium which provide further security of supply.
The security of gas supply Regulation requires that, if the single largest gas infrastructure fails in one Member State, the capacity of the remaining infrastructure is able to satisfy total gas demand during a day of exceptionally high gas demand. France complies with this rule thanks to its gas infrastructure which includes seven major interconnection entry points and three LNG terminals, allowing an access to gas from the North Sea (mainly Norway), Russia, the Netherlands, North Africa (mainly Algeria) but also more generally to the international LNG market.

(source: gas coordination group)
3.Internal market
3.1.Interconnections and wholesale market functioning
3.1.1.Electricity
|
|
|
(source: EC based on ENTSO-E scenario outlook and adequacy forecast 2014)
|
(sources: EC services based on Eurostat for the left graph and based on Platts and European power exchanges for the right graph)
|
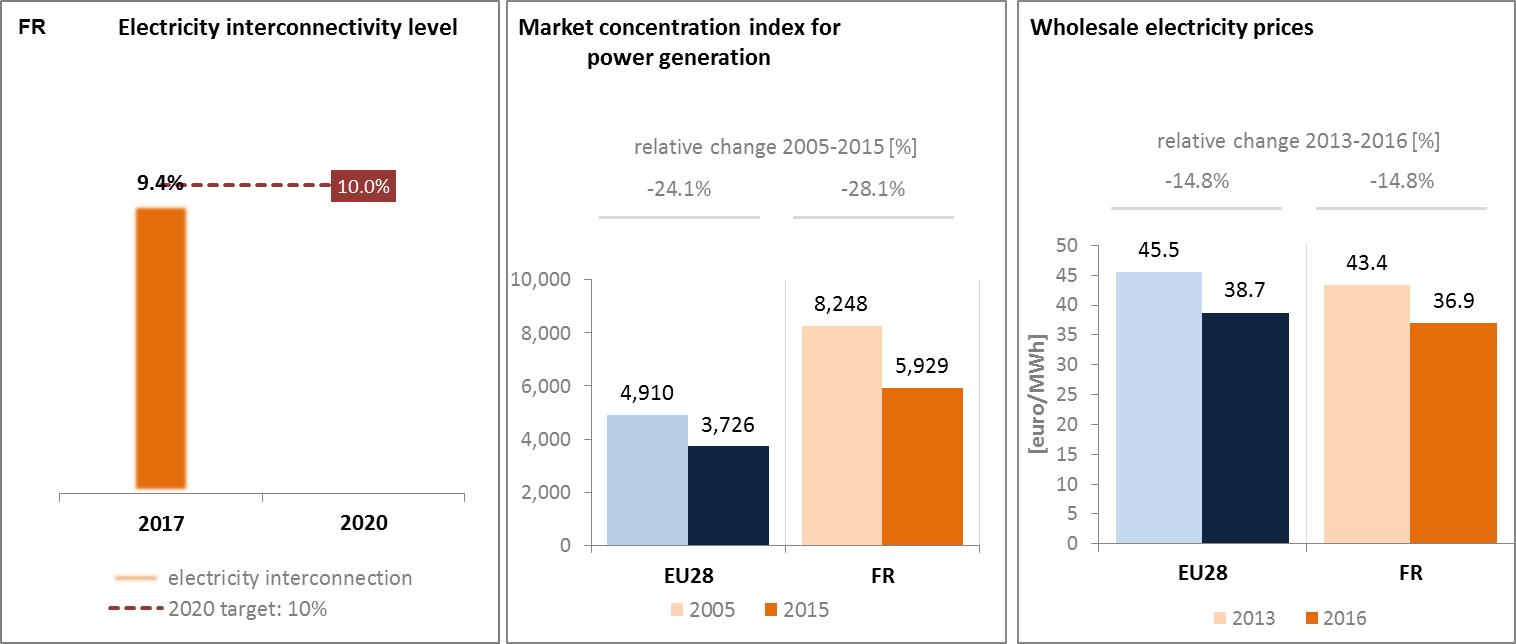
In 2017, France's level of electricity interconnection was 9.4%, close to the 10% target set by the European Council for 2020. Nevertheless, the country is on the path to reach the 10% target by 2020 through the completion of PCIs currently under way. France had 12 GW import capacity and 17.4 GW export capacity in 2016, making it a net exporter to all neighbouring countries with the exception of Germany. Further market integration and new interconnection capacities with the Iberian Peninsula, such as the Biscay Bay HVDC subsea cable and two other projects across the Pyrenees have been given priority in the Madrid Declaration signed in 2015 and would benefit consumers and businesses. The Biscay Bay project, France — Spain interconnection between Nouvelle Aquitaine (FR) and the Basque country (ES) will bring the interconnection level to 5000 MW by 2025. The two planned projects for increasing the interconnection with France through the Pyrenees with estimated commissioning date on 2026 will increase the interconnection up to 8.000 MW.
The French electricity market is characterised by a very strong concentration of the market share in the power generation, as well as in the supply market on all market segments, from households to big industrial consumers, with EDF - the incumbent - remaining the dominant market player. An increase in the market share of alternative suppliers to EDF can however be noticed on big industrial sites (reaching a market share of 46%, against 13% for households). This can be explained by the end of regulated tariffs for this category of consumers, while regulated prices remain, alongside with “market offers”, for those who have subscribed less than 36 kVA.
France is part of the North West Europe market. Despite reinforced market coupling, wholesale prices have not fully converged over the 2011-2015 period, in particular due to episodes of interconnections saturation. Prices differ in particular when there is a massive influx of electricity from renewable sources in Germany, which reduces wholesale prices and can occasionally cause negative prices due in particular to the limited flexibility of the power generation park both in France and Germany.
Wholesale electricity prices in France remain below the EU average thanks to the low marginal costs of nuclear power generation (2 €/MWh below the EU average in 2015) although since 2008 the price differential with the EU average has narrowed substantially, mostly due to a faster reduction in EU prices. French wholesale prices remain higher than in Germany (8 €/MWh. in 2016).
3.1.2.Gas
The concentration observed in the gas market is much lower than in the electricity market, and the concentration index is well below the EU average. Wholesale prices are on par with EU average.
In the gas sector, France is well connected. A new LNG terminal in Dunkirk commissioned in December 2016 allowed for the creation of a new interconnection point with Belgium. The High Level Group for Interconnections in South-West Europe set in 2015 aims at enabling increased interconnection capacity through targeted projects between France and the Iberian Peninsula such as the Eastern gas axis through the phased development of Midcat if the studies being made presently confirm the interest of this project.
The creation of one single market zone in France is ongoing and on track, and will be completed by end 2018 through the commissioning of the PCI Val-de-Saone, co-financed through EEPR (European Energy Programme for Recovery).

(source: ACER for the left graph and EC services based on on Platts, gas hubs, Eurostat for the right graph)
3.2.Retail electricity and gas markets
3.2.1.Electricity
In 2016, households' electricity prices in France were below the EU average. Between 2013 and 2016, average band retail electricity prices for households increased, due to the increase in electricity network costs and taxes and levies (mainly network costs such as the TURPE, "tarif d'utilisation du réseau public de l'électricité" and the CSPE, the "Contribution au service public de l’électricité", which includes renewable levies), similar to EU average.
Retail electricity prices are correlated to the existence of regulated tariffs (TRV, i.e. "tarifs réglementés de vente") that accounted at the end of 2016 for 86% of residential customers. As part of the opening up of markets to competition, residential and business customers have the choice between TRV, offered only by EDF and local distribution companies, and market offers offered by all energy suppliers including historical suppliers. The principle of reversibility makes it possible to switch from TRV to market offers and vice versa without limitation. Between 2011 and 2015, the annual switching rate for households was on average 3.5%, below the EU average (5.8%).
The deployment of smart meters (Linky) has started in December 2015 and will continue until 2021, although it is facing some opposition among French households. It should help limiting electricity consumption of households and therefore lead to lower energy costs and prices.

(source: ACER)
(source: Eurostat)
(source: Eurostat)
3.2.2.Gas
The opening to competition of the gas market is now very advanced, especially on the non-domestic consumers market. The market offers (vs. the regulated tariffs – TRVs - accessible for households) are largely the majority in volume (86%) and concern more than 50% of sites at the end of 2016. Market share of alternative suppliers reached 23% in volume of consumption in the household segment and 67% in the non-residential one. The market offers pull prices down with discounts up to 15% in comparison to the TRVs.
As for electricity, households may choose between TRVs with historical suppliers, or market offers with alternative ones (or historical suppliers). In such a context, switching rates have increased much more than in the electricity market, from 4.5% in 2011 to 7.7% in 2014 and 9.4% in 2015 (vs 4.3% the same year for electricity).

(source: ACER)
(source: Eurostat)
(source: Eurostat)
3.2.3.Market performance indicators
According to the periodical survey of the European Commission (DG JUST), French consumers are more satisfied than the average EU consumer about the services received on energy retail markets (84.6% vs 75.3% for electricity, and 83.9% vs. 78.1% for gas).

(source: DG JUST survey)
3.3.Energy affordability
Energy poverty is less of an issue in France than in other EU Member States, as the energy expenditure share in overall consumption of the poorest households is lower in France than in many other Member States: the share of energy in total household expenditures of the lowest quintile of the population is among the lowest in the EU (5.7% vs. 8.6% in 2014). However, 16.3% of the citizens below the at-risk-of-poverty threshold in 2015 (vs 12.9% in 2005) consider that they are unable to keep their home adequately warm, despite the fact that protection measures for vulnerable consumers are in place, such as social tariffs for electricity and gas, soon to be replaced by "energy cheques".

(source: ad-hoc data collection of DG ENER based on HBS with the support of Eurostat and national statistics)
4.Energy efficiency and moderation of demand
Since 2005, France has decreased its primary energy consumption by 8% to reach 239.3 Mtoe
in 2015 and its final energy consumption also decreased by 10% to reach 144.1 Mtoe
in 2015, whereas the GDP increased by 9% over the same period. These figures - together with the primary energy intensity which decreased by 1.7% every year (on average) since 2005 – reflects the general decoupling between economic growth and energy consumption. However, even if France has reduced the gap towards its indicative national 2020 targets for energy efficiency (219.9 Mtoe in primary energy consumption and 131.4 Mtoe in final energy consumption, both targets excluding international transport), the rapid and thorough implementation of the "Energy Transition for green growth" Act
of 17 August 2015 is required to further tap into the significant potential for energy demand reductions in areas such as the building sector in order to achieve its targets.

(source: Eurostat)
Although primary energy intensity decreased over the 2000-2015 period, it was at a slower pace than the EU average, putting France slightly above the EU average in terms of performance (i.e. with a higher intensity: 114.1 toe/mn EUR of GDP, vs. 113.3 for the EU). In 2000, France was 9th in terms of primary energy intensity, and 13th in 2015, behind countries like Spain, Germany and the UK.
The structure of final energy consumption per sector is quite similar to the EU average. In 2015, transport was the biggest energy consuming sector representing a 34.7% share in the total final energy consumption, which is very close to the EU average (i.e. 33.1%), followed by residential sector (26.1% vs 25.4% for the EU average), industry (19.9% vs. 25.3%) and services (15.6% vs. 13.6%).

(source: Eurostat)
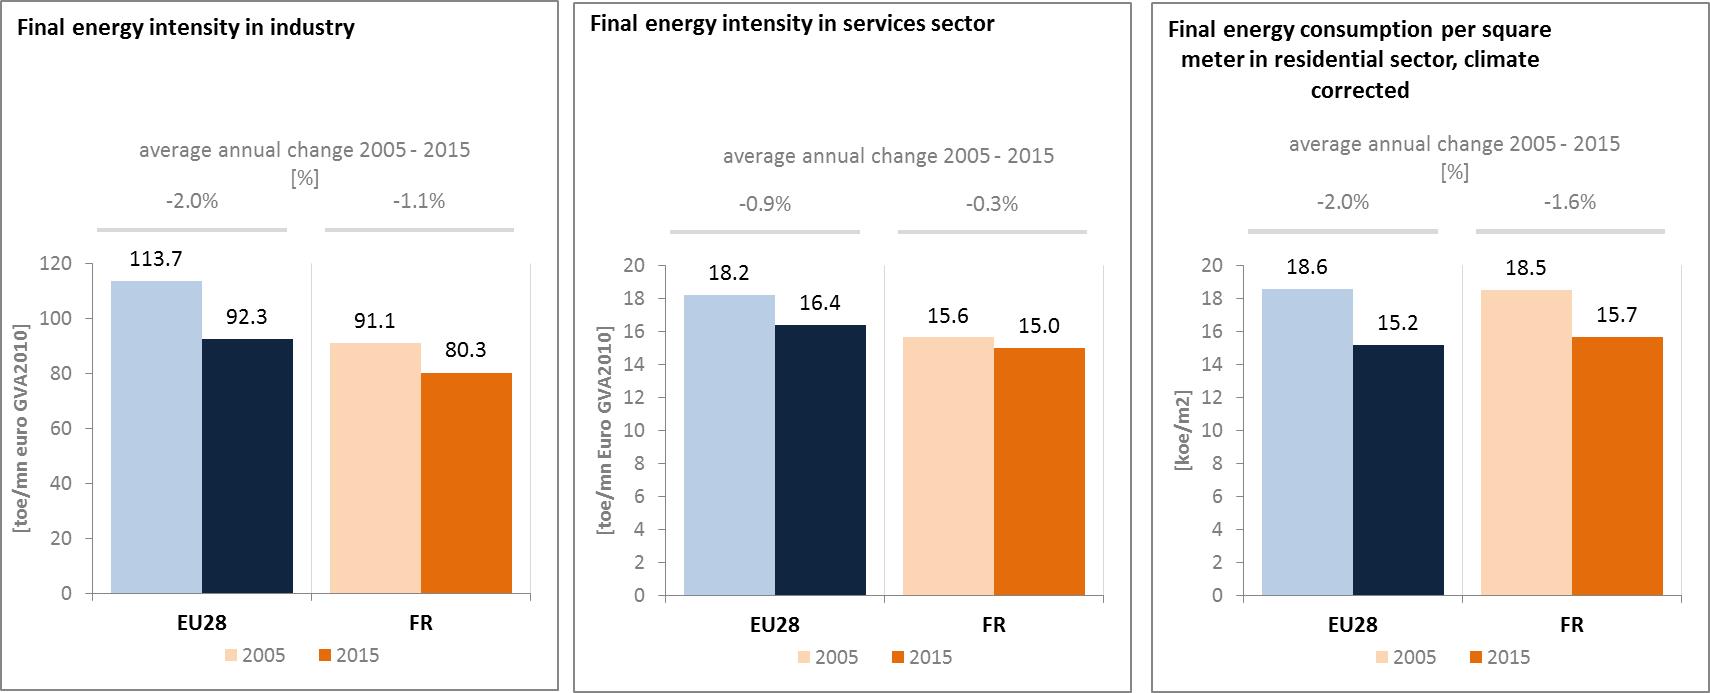
Final energy intensity levels are decreasing at a slower pace than the EU average but the trends remain encouraging in most sectors. In the industry and services sectors, final energy intensity levels remain well below EU average, reflecting the improvements in energy efficiency realised over the past decade. However, the final energy consumption per m² of floor area of residential building (climate corrected) is slightly above EU average. Additional efforts could therefore be envisaged to accelerate the energy renovation of residential buildings.
(source: Eurostat)
(source: Eurostat)
(source: Odyssee database)
In the transport sector, the final energy consumption remained stable over the period 2005-2015 but since 2013 it started increasing to reach a level above its 2011 level, while GDP increased by 0.9% per annum on average. Passengers transport activity increased in 2015 by 5.8% as comparing to 2005. This trend in final energy consumption can be explained by the decrease in freight transport activity, which decreased by 16.5% over the period 2005-2015 but also by more energy-efficient new cars. In addition, the share of collective passengers land transport has slightly increased, indicating a lower use of private transport.
 (source: Eurostat)
(source: Eurostat and DG MOVE pocketbook)
(source: Eurostat)
(source: Eurostat and DG MOVE pocketbook)

(source: Eurostat)
The French transport policy framework is developed around three priorities: (i) to end the road transport paradigm, (ii) to develop passenger public transport, and (iii) to reduce air transports pollution. In terms of infrastructure, priority is given to the improvement of existing networks and the development of clean alternative modes of transport to the air and the road.
The Energy Transition Act has established the objectives of a new energy model in France and aims to foster "green growth" by reducing energy costs and favouring energy efficiency, renewable energies and the circular economy. It sets targets for the promotion of energy efficiency, renewable energies and the use of cleaner modes of transport. At the local level, the development of urban mobility plans – "Plans de Déplacements Urbains" (PDU) – is mandatory in urban transport perimeters of urban agglomerations with more than 100,000 inhabitants, and must be accompanied by an environmental impact assessment.
5.Decarbonisation of economy
5.1.GHG emissions
In 2016 GHG emissions in France were 16.4% below their 1990 levels, slightly above the EU average of -22.1%. According to the latest national projections in a with existing measures scenario, the level in France's non-ETS greenhouse gas emissions by 2020 is projected to be 20% lower than in 2005. France is consequently expected to achieve its 2020 target under the Effort Sharing Decision by a 6 pps gap.

(source: EC and EEA)
According to 2016 European Environmental Agency (EEA) estimates, the GHG intensity of France's economy is well below the EU average, since 1990, decreasing however slightly slower than in the EU. In 2016 the GHG emissions per capita in France were also significantly below the EU average. GHG emissions have continuously decreased since 1990s thanks to large reductions in industry and energy production, as well as the high nuclear share. Emissions of the transport sector have shown a rising trend between 1990 and 2004 with an increase of 20%, followed by a slight decrease of 7% between 2004 and 2008, and a stabilisation since 2008.Emissions in the residential/tertiary sectors have shown a rising trend between 1990 and 2005 (+20%), followed by a decrease between 2005 and 2015 (-19%). French authorities have introduced under the 2014 Finance Act a carbon element in the energy tax which is proportional to GHG emission content imposed to sectors outside the ETS.
In 2015, the largest sectors in terms of GHG emissions were the transport sector (29% of the total GHG emissions) followed by industry (20.8%), agriculture & fisheries (19.8%) and the residential sector (16.5%). One particularity of this structure concerns the power sector, mainly based on nuclear energy, and therefore contributing to 10.1% only of the total emissions. In relative terms, the GHG emissions from transport and agriculture were well above the EU average.

(source: EC and EEA)
In France, agriculture has a relatively large share in national emissions (over 15% on average 1990-2013) and higher than average share of agriculture in the Effort Sharing sectors. Emissions in agriculture have been slowly decreasing since 1990 (-4.4% between 1990 and 2015).
Preliminary accounts under the Kyoto Protocol for France show overall removals of -5.9 Mt CO2-eq. as an annual average in the period 2013-2015. For comparison, the annual average of the EU-28 accounted for removals of -119.0 Mt CO2-eq. It should be noted that in this preliminary simulated accounting exercise, removals from Forest Management did by far not exceed the accounting cap.
Emissions by Deforestation are slightly higher than removals by Afforestation. The relative importance of removals by Forest Management, at a similar level as other activities in 2013, reduced over time. Overall, there is a decreasing trend in removals, mainly due to previously noted declining removals by Forest Management. Removals by Afforestation slightly increased while emissions by Deforestation remained unchanged over the course of the three-year period.
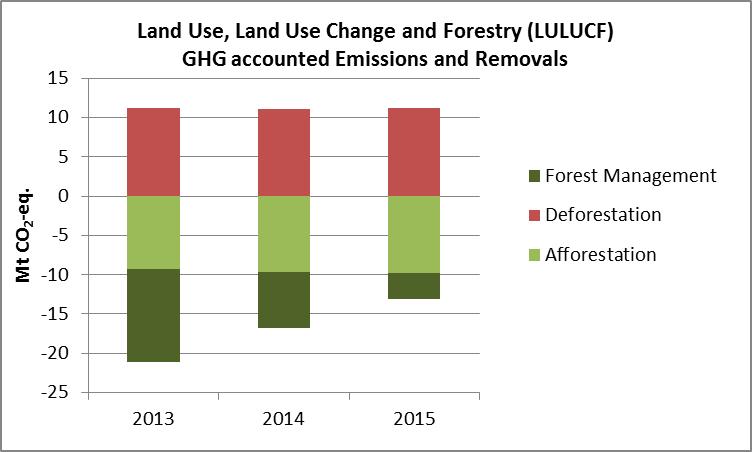
Note: Forest Management credits are capped and presented as yearly averages when the total Forest Management credits of the considered period exceed the simulated cap over the same period.
(source: EC and EEA)
CO2 emissions in transport and alternative fuelled vehicles
In 2015, road transport emissions were 10.7 % higher than 1990 levels. Average emissions for newly registered cars are low with a level of 109.8 g CO2/km and decreased by 28 % between 2005 and 2016, similar to the EU average. The National Low Carbon Strategy has set indicative emission targets. For the transport sector, the indicative target is a reduction of 29 % by 2028 compared to 2013, and by 66 % by 2050 compared to 1990.

(source: European Environment Agency)
The number of electric charging points in France has over the period 2013 to 2016 increased significantly, reaching 15 843 units in 2016.

(European Environment Agency)
(European Alternative Fuels Observatory)
National Policy Frameworks under Directive 2014/94/EU on alternative fuels infrastructure have to establish targets, objective and measures for the development of the market of alternative fuels in the transport sector and the deployment of the relevant infrastructure. France has submitted its National Policy Framework as requested under article 3 of the Directive 2014/94/EU.
A detailed assessment of the French National Policy Framework in terms of its compliance with the requirements of Directive 2014/94/EU on alternative fuels infrastructure, its contribution to achievement of long-term energy and climate objectives of the Union and coherence of its targets and objectives in terms of cross-border continuity has been published as part of the Communication on Alternative Fuels Action Plans (COM(2017)652) and the related staff working document SWD(2017)365.
5.2.Adaptation to climate change
In France, a National Adaptation Strategy was adopted in 2006 and the National Adaptation Plan was adopted in 2011, covering 20 thematic areas: cross-cutting actions, health, water, biodiversity, natural hazards, agriculture, forests, fisheries and aquaculture, energy and industry, transport infrastructures, urban planning and the built environment, tourism, information, education and training, research, funding and insurance, coastlines, mountains, European and international actions, and governance. A second adaptation plan is foreseen for adoption in 2017. As the integration of adaptation into sectorial policies is part of the NAP's specific actions and measures, the monitoring scheme looks at a qualitative assessment of the status of implementation of the 230 measures in the different sectors.
5.3.Taxes on energy and transport and fossil fuel subsidies
The overall tax burden on energy and transport (including carbon taxation) in relation to GDP amounted to 1.9% in 2014, nearly 0.5 p.p. lower than the EU average. This relative gap is quite stable since 2005. Taxation of heat and electricity is lower than the EU-average, but has shown a steep increase since 2005. The tax burden on transport fuels has in contrast fallen since 2005, while it has remained broadly stable for vehicles. The tax burden on vehicles was significantly lower than the EU average at that time.
France uses taxation as part of its climate policy, and has a carbon tax in place. In 2017, it amounts to €30.5/tCO2, and was increased in early 2016 by 8.5€/tCO2. It is applied on transport and heating fuels as well as on natural gas and coal. Revenues from this carbon tax were estimated at 2.3 billion EUR in 2015 and 3.8 billion EUR in 2016. The Energy Transition Act
established a long-term trajectory for this tax to 56 EUR in 2020 and to reach a rate of 100 EUR per tonne of CO2 in 2030.
For vehicles a revenue neutral bonus-malus system is applied. In addition, excise duties on diesel have increased in 2017 (by 0.01 EUR per litre) while they have decreased on petrol by the same amount. As a result the taxation gap between diesel and petrol is closing but still remains.
Fuel taxation in France is above the EU average. The road fuel excise duties on petrol are the eighth highest among EU Member States, and the excise duties on diesel are the fifth highest (EEA, 2016). In the context of the 2016 Finance Act, France decided to converge the tax rates on diesel and petrol over the next five years. For 2017, the tax difference is at 0.10 EUR/litre and the government announced a total convergence by 2022 in its Climate Plan. An important measure to incentivise the purchase of low-CO2 emitting cars is France’s ‘bonus-malus’ system. Based on the CO2 emissions of the purchased car, the government offers a bonus payment (credit) on the purchase of low-emitting cars, and levies an additional fee (tax) on the purchase price of high-emitting vehicles. The government regularly adjusts the emission levels for eligible cars.
In July 2017 the Government published a comprehensive Climate Plan with new targets and tools addressing both cross-cutting and specific sectors. Regarding transport, a fund for sustainable mobility and alternative fuels is scheduled, and a plan to end the sales of GHG emitting vehicles by 2040 is included.

(source: Eurostat)
Fossil fuel subsidies have increased in France in the last decade, predominantly driven by the reduced rates of excise tax applicable to certain users of diesel fuel.

(source: OECD Inventory of Support Measures for Fossil Fuels 2015)
5.4.Renewable energy
The share of renewable energy in gross final energy consumption reached 15.2% in 2015, which is approximately 1-percentage point below its interim-target objective for 2015/2016 (16%).
Renewable energy developments will also need to be significant in the medium term to comply with the ambitious objectives of the Energy Transition Act, in particular the objective of having 32% of energy consumption from renewable sources by 2030. In that respect, investor confidence in France would be reinforced by further certainty on the concrete measures planned to achieve the objective of decreasing the share of nuclear electricity to 50% by 2025.

(source: Eurostat-SHARES)

(source: Eurostat-SHARES)
Concerning electricity from renewable energy sources (RES), France is almost in line with its planned trajectory set in the National Renewable Energy Action plan (NREAP). In 2015, the country was approximately 2-percentage points behind its objective (18.5% vs 21%), which is not negligible. Renewable electricity is mainly promoted through feed-in-tariffs up until now, but the Energy Transition Act has set a feed in premium system ("complément de rémunération") to support PV, onshore and offshore wind, as well as hydroelectricity and bioenergy. Moreover, the Ministry for Ecological and Inclusive Transition publishes calls for tenders in order to support the development of renewable energy projects, such as photovoltaic plants, large solid biomass plant or offshore wind farms.
Concerning the RES share in heating & cooling, the French NREAP anticipates a share of 33% for in 2020. However, since 2010, the actual deployment has constantly been below the planned trajectory. Moreover, the spread between the anticipated share and the effective share has increased. Low prices of fossil fuels these last years create a negative incentive for renewable heat projects, although the government helps these projects via tax credits or subsidies of the ADEME (agency for environment and energy efficiency).
In the field of transport, according to the NREAP, the anticipated national RES share is 10.5% by 2020. Since 2010, France is on track regarding its planned trajectory. If the current trend is maintained, the country is projected to be almost in line in with its 2020 anticipation. Due to a very important diesel fueled car market, France is by far the top European biodiesel consumer. The country owns a structured biodiesel industry with some of the main European producers.
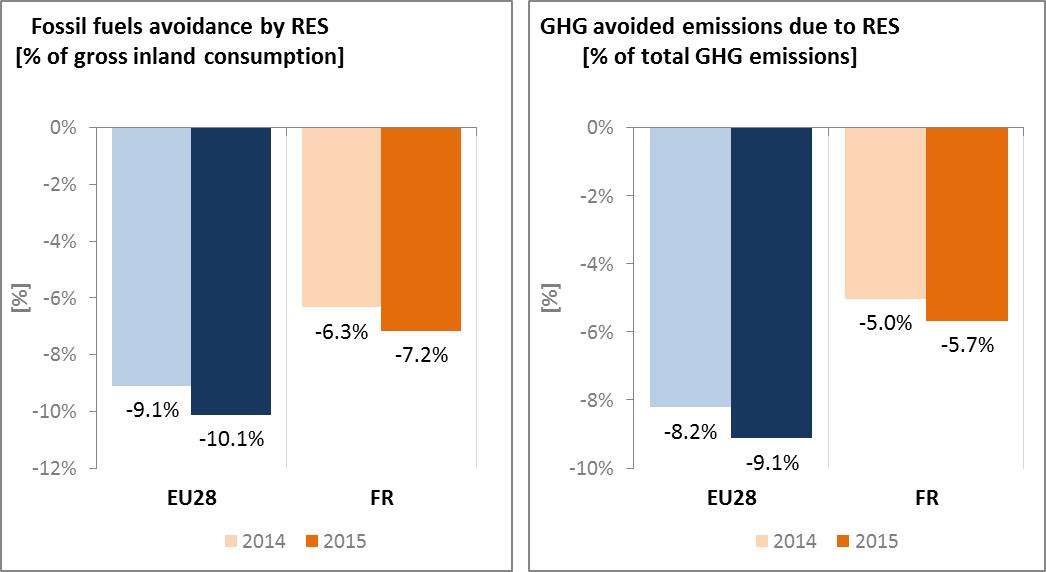
Thanks to the deployment of renewables since 2005, it is estimated that France avoided in 2014 about 6% of fossil fuel use in gross inland consumption and about 4.8% of GHG emissions at national level, which is below the EU average
.
(source: EEA)
5.5.Contribution of the Energy Union to better air quality
Air quality in France continues to give cause for severe concern. For the year 2013, the EEA estimated that about 45,120 premature deaths were attributable to fine particulate matter (PM2.5) concentrations and 8,230 to nitrogen dioxide (NO2) concentrations
.
For both pollutants France reported exceedances of the binding EU air quality standards
. For the year 2015, France reported exceedances of the limit value for PM10 in 6 out of the 76 air quality zones in France, while exceedances of the limit value for PM2.5 were reported in 1 zone, and of the limit value for NO2 in 15 out of 76 zones
.

(source: EEA)
The health-related external costs from air pollution in France have been estimated to be more than EUR 37 billion/year (income adjusted, 2010), which includes the intrinsic value of living a healthy life without premature death as well as the direct costs to the economy such as healthcare costs and lost working days due to sickness caused by air pollution
.
In order to meet air quality targets, France published in May 2017 a national action plan, le Plan national de réduction des émissions de polluants atmosphériques (PRÉPA), setting out measures to reduce emissions of air pollutants from different contributing sectors.
Local authorities were also involved in drawing up the PRÉPA and its implementation.
The Energy Union can further contribute to addressing these air quality problems through measures reducing emissions of both emissions and air pollutants such as PM and nitrogen oxides (NOx) from major contributing sectors such as (road) transport, energy production, industry and residential heating (e.g. stoves and boilers) as shown in the figure below
. In this context, Paris announced its ambition to electrify nearly all of its public transportation by 2025.

(Source: EEA. This table reflects only sources of primary PM2,5 emissions.)
6.Research, innovation and competitiveness
6.1.Research and innovation policy
France adopted in 2016 a National Research Strategy for Energy, as requested by the Energy Transition Act of 2015. The broad 'Programme d’Investissements d’Avenir' (PIA) is a major instrument for clean energy research & innovation (R&I) funding in France. A first round of this programme was launched in 2010 and a second one in 2014. Within this framework, the Environment and Energy Management Agency (ADEME) manages around EUR 3 billion of financing for the 2010-2020 period. ADEME has launched a series of calls for demonstration projects in the field of clean energy. So far, more than 620 projects have been supported with EUR 2.1 billion. An additional 15 calls were opened at the beginning of November 2016 on various topics linked to the French participation in the international initiative Mission Innovation initiative (see below).
The National Research Agency (ANR) operates another PIA programme called 'Instituts de la transition énergétique' (ITE), with EUR 1 billion funding during the 2010-2020 period. The ITE programme brings together private companies and public laboratories to create new institutes dedicated to R&I in the field of clean energy
.
In addition to the PIA programme, ANR also runs a basic research funding programme based on annual calls for projects focused on the priorities defined in the French National Research Strategy, which includes a 'clean, secure and efficient energy' challenge similar to that in the Horizon 2020 programme (see below), focused on five areas: (a) Dynamic management of energy systems; (b) Multi-scale governance of new energy systems; (c) Energy efficiency in all fields of the economy; (d) Reduced need for strategic materials; (e) Decarbonisation of energy and chemistry sectors.
These focus areas are also followed by the main energy research entities (CEA, IFPEN, CNRS, universities…), which are grouped in a 'research alliance' dedicated to energy called ANCRE ("Alliance Nationale de Coordination de la Recherche pour l'Energie").
France is a very active contributor to the ongoing work of the Strategic Energy Technologies (SET) Plan. It participates in all the temporary working groups for the implementation of the integrated SET Plan, leading the one dedicated to batteries and co-leading the one dedicated to nuclear safety.
Regarding the Horizon 2020 programme, France has received so far 8.2% of the EU contribution devoted to the 'secure, clean and efficient energy' part of the programme. As of September 2017, 287 participations from French organisations have been awarded over EUR 148 million in Horizon 2020 energy projects. This includes a grant of EUR 8.4 million to Fonroche Geothermie for its participation in project DEEPEGS (deep enhanced geothermal systems), and eight grants totalling almost EUR 7.8 million to French beneficiaries participating in project SMARTER TOGETHER (smart and inclusive solutions for urban districts).
France is a founding member of Mission Innovation
. As a result, it has committed to doubling its state funding
in clean energy R&I from the baseline level of EUR 440 million in 2014 to EUR 880 million in 2020. These investments will focus on renewable energy, energy storage, carbon capture storage and use, and innovations aiming at improving energy efficiency (including in industry, buildings, transport, circular economy, and smart grids). They will cover the whole chain of innovation, from basic research to demonstration.
6.2.Investments and patents in the Energy Union R&I priorities
In 2015, France was the EU Member State with the highest public (national) investments in the Energy Union R&I priorities. R&I investments reached EUR 1 023 million, having decreased by 3% compared to 2014. The highest share of investments (44%) was attracted by the Nuclear Safety priority of the Energy Union, followed by the Sustainable Transport and Smart System priorities (21% and 19% respectively). In the period 2007-2015, the maximum annual public investment was EUR 1 109 million, reported in 2011. In 2014, the most recent year for which data from most Member States are available, public investment per GDP in France was higher than the EU average.
Private investment in the Energy Union R&I priorities in 2013 was estimated at EUR 2 582 million (16% of the private R&I investment in Energy Union R&I priorities in the EU). The focus was on Sustainable Transport, which received 33% of these investments, followed by the Smart System priority with a share of 25%.
In 2013, the most recent year for which complete patent statistics are available, 409 companies and research organisations based in France filed 1 030 patents in low-carbon energy technologies (16% of the EU total). The focus was on Sustainable transport (35%), followed by the Smart System (22%) and Efficient Systems (19%) priorities.
In 2013, private R&I investment and patents in the Energy Union R&I priorities were higher than the EU average, when normalised by GDP and by population respectively. In the period 2007-2013, both private R&I investments and the number of patents in Energy Union R&I priorities increased on average by 10% and 20% per year, increasing faster than the indicators at EU level (6% and 15% respectively).

Note: The international comparison (right) is shown for 2014 (France had reported EUR 1 054 million). Reporting at EU level for 2015 is not as complete, and very few countries have reported for 2016.

(Data sources: Public investment as available in the International Energy Agency RD&D Statistics database for codes relevant to Energy Union RIC priorities. Patent data based on the European Patent Office PATSTAT database. Private investment as estimated by JRC SETIS. Detailed methodology available from the JRC.)
6.3.Competitiveness
In 2014, the real unit energy costs (RUEC)
in France (at 16% of value added) were slightly above the EU average (15.3), around two times more than those in the US but below those in Japan and China. Over the recent years, energy intensity improved but electricity prices increased, resulting in an overall increase in real unit energy costs.

(source: ECFIN)
(source: ESTAT and IEA)
Regarding the competitiveness in wind and solar energy, France does not show a revealed comparative advantage in either sector as indicated by a value of this indicator
below 1. This means that France exports proportionally less of wind and solar technologies, when compared to its total exports, than other countries do. Nonetheless, when looking at the different components of the value chain for each technology, France displays a comparative advantage in power electronics. When looking at the trade balance (the difference between exports and imports), it shows France is a net importer of solar photovoltaic components and products
, while it exhibits a trade surplus in wind energy technologies due to its strong position in the power electronics market segment that compensates for the trade deficits in the other parts of the supply chain.

(source: UN comtrade)
7.Regional and local cooperation
France is a founding member of the Pentalateral Energy Forum created in 2005, together with Benelux, Germany, and Austria (joining the Forum in 2011), in order to promote collaboration on cross-border exchange of electricity. It counts more than one third of EU population and covers over 40% of the electricity generation in the EU. The Pentalateral forum was the first region to publish a regional Generation adequacy assessment (in March 2015), which is an important step to better assess the generation needs across borders, improving the integration of markets by minimizing the tendency for national solutions to adequacy concerns. In May 2015, it launched flow based market coupling, an improved version of market coupling, calculating transmission capacity in a dynamic manner and a world premiere.
France is also a Member of two regional High Level Groups (Northern Seas and South West Europe).
The Northern Seas HLG was established through a political declaration with the participating countries
and the Commission on 6 June 2016. The declaration sets as objective to facilitate cost-effective deployment of offshore renewable energy and to facilitate the further interconnection between Northern Sea countries and the further integration of wholesale electricity markets. It is estimated that the potential of wind resources in the region could meet up to 12% of the EU's entire electricity demand, which needs to be supported by an optimised transmission network.
The South West HLG (which includes Portugal, Spain and France) was established in March 2015 by heads of States. It promotes projects to increase the interconnectivity of the Iberian Peninsula electricity markets with the remaining European markets. These projects comprise an interconnection for electricity in the Biscay Bay as well as two additional interconnections through the Pyrenees. The three Member States also agreed to assess the gas interconnectivity between the three countries, the "Eastern Axis". One of the projects is currently known under the name MIDCAT, which will allow for bidirectional flows between the Iberian Peninsula and France. The Midcat project can be realized in two steps, with project STEP as a first phase to increase the bidirectional flows between the two countries. "Val de Saône" will offer by 2018 increased North to South flows in France along the Eastern gas Axis from the Iberian to France.
The EU macro-regional strategy for the Alpine Region in which France takes part can be used as a basis for regional cooperation on energy. European Territorial Cooperation –'Interreg' – under EU cohesion policy also provides further opportunities for cross-border, transnational and interregional cooperation, including in the Energy Union areas.
Cities and urban areas have a key role in the energy and climate challenge. The Urban Agenda for the EU, established by the Pact of Amsterdam in May 2016, better involves cities in the design and implementation of policies, including those related to the Energy Union. It is implemented through Partnerships, in which the Commission, Member States, cities and stakeholders work together on a number of important areas, including on Energy Transition, Urban Mobility, Air Quality, Climate Adaptation and Housing. France is participating in the partnerships on Energy Transition and Climate adaptation, as member.
By 2016, in the context of the Covenant of Mayors, the sustainable energy action plans delivered by 78 French municipalities had been assessed. Overall, these 78 municipalities cover about 13.7 million inhabitants. These municipalities committed to reducing GHG emissions by 23.6% by 2020 (as compared to 1990 baseline). In addition, 5 cities (covering 1.20 million inhabitants) have committed to conduct vulnerability and risk assessment and develop and implement adaptation plans.

(source: JRC 2016. Notes: SEAP=sustainable energy action plan, GHG=greenhouse gas emissions)
8.Cohesion policy and EU clean energy investments
EU cohesion policy makes a key contribution to delivering the Energy Union objectives on the ground, through European Structural and Investment Funds (ESIF) aiming to implement energy policy objectives in France which are complemented by national public and private co-financing in order to achieve optimal leverage. Cohesion policy also ensures integrated territorial solutions to energy and climate challenges, supports capacity building and provides technical assistance.
Over 2014-2020, cohesion policy is investing some EUR 1,228 million in energy efficiency improvements in public and residential buildings and in enterprises, as well as in high-efficiency cogeneration and district heating, renewable energy and smart electricity distribution grids in France. Cohesion policy is also investing significantly in R&I and in SME competitiveness, based on the regional strategies for smart specialisation. Many regional strategies include a focus on energy, mobility and transport. Furthermore, the areas of specialisation in the fields of materials, mechanics and chemistry as well as the "factory of the future" cover eco-innovation issues. Finally, many smart specialisation areas chosen by the French regions (building, mobility, energy, agribusiness etc.) are strongly characterised by their sustainability. At this stage, at least EUR 137 million is foreseen for investments in R&I and adoption of low-carbon technologies in France, but this might increase further in line with the evolving content of the smart specialisation strategies. A further estimated EUR 811 million is invested in supporting the move towards an energy-efficient, decarbonised transport sector.
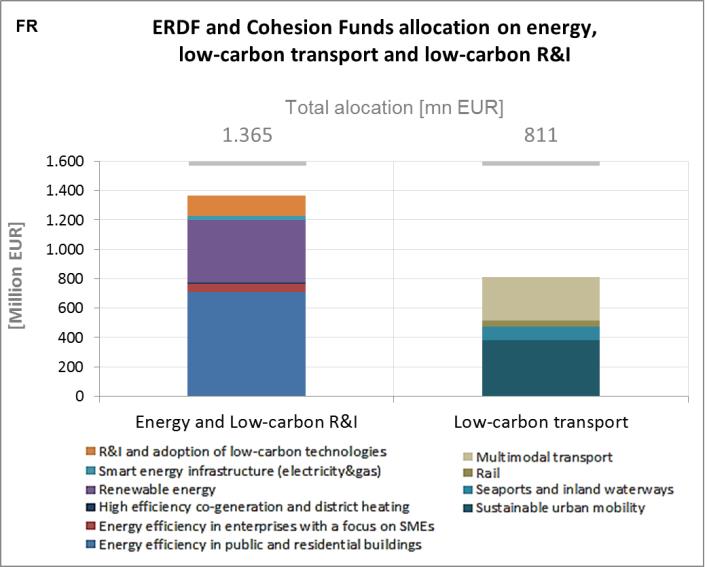
(source: DG REGIO)
These investments are expected to contribute to around 143,000 households with improved energy consumption classification, a decrease of around 83,197,000 kWh per year of primary energy consumption of public buildings, around 11,500 additional users connected to smart grids and 750 MW of additional capacity of renewable energy production, as well as to around 50 km of reconstructed or upgraded railway lines and 600 km of new or improved inland waterways. Overall, the EU cohesion policy investments in France over 2014-2020 are expected to contribute to an estimated annual decrease of GHG emissions of around 3,989,000 tonnes of CO2eq.
For example, during the 2007-2013 period, the French regions massively reprogrammed European Regional Development Fund (ERDF) programmes to finance energy renovation in social housing. A specific financial instrument ("éco-prêt logement social") was created to speed up energy renovations, and ERDF was used in a grant scheme as an additional financial resource. EUR 220 million of ERDF generated EUR 1.5 billion of total investment. With the average ERDF investment being EUR 3,276 per dwelling (17% of total investment), some 70,000 low-income households could benefit from improved energy performance and some 20 000 local jobs were created.
As another example, the CAP TRI investment fund project in Hauts-de-France shows how to usefully combine support from the ESIF and the European Fund for Strategic Investments (EFSI), in particular as it enabled maximising the private sector participation. The project is a part of a low-carbon economy strategy in the region (Third Industrial Revolution - TRI) intending to make the region a "zero-emissions" energy model by 2050, through investments in the fields of renewable energies, energy efficiency, energy management and smart grids, smart transport and circular economy. CAP TRI is a "layered” fund" which invests risk capital in enterprises developing TRI projects: the region participates, using ERDF funding, providing equity financing alongside public and private investors. The European Investment Bank (EIB), supported by the EFSI, provides mezzanine debt to the fund and commercial banks provide senior debt at project level.
As a further example, faced with a quasi-permanent saturation of the road network a large project to improve public transport in Martinique improved the conditions of travel and accessibility, reduced the environmental nuisances associated with the preponderance of private car use, reduced travel times for public transport users, and promoted intermodal practices. There are 14 intermediate stations along the road lane reserved for public transport and two new exchange centres with relay stations in Mahault and Carrère to improve the service to users from the north and south of Martinique. The multimodal pole of Pointe Simon was reinforced and the implementation of high-performance equipment and road transport systems ensured a major qualitative leap in the public transport service, including increased frequency and improved passenger information systems. The project has improved traffic conditions for approximately 70% of the population of Martinique and ensured better access to commercial and business areas and the airport. The contribution from the ERDF was EUR 66,2 million.
Through its support to sustainable transport systems, the Connecting Europe Facility (CEF) also contributes to the goals of the Energy Union. Following French participation in the CEF – Transport 2014-2015 Calls, the current French action portfolio comprises 65 signed grant agreements, allocating EU 1,907.4 million of actual CEF Transport Funding to French beneficiaries (state-of-play February 2017)
. The transport mode which receives the highest share of funding is inland waterways (IWW) (41.4% of actual funding). The actions aim to upgrade the IWW network, and so far the CEF Programme is mainly targeting the development of the Havre-Paris and Seine-Escaut axes, in particular the waterway connection between France and Belgium.
In the maritime portfolio, France is engaged in improving the infrastructure of its major ports to reduce the maritime and fluvial bottlenecks. Furthermore, France is intensifying its efforts in upgrading its maritime links through more performant ships and increased handling efficiency of ports. Together with other Member States, France is progressing in developing the intermodal freight transportation by designing a sustainable incentive scheme and an investment programme to provide integrated short-sea-shipping along the pre-defined 'Atlantis' Motorway of the Sea freight route. France also participates in projects promoting the use of LNG fuel and of greening technologies for vessels. As regards to alternative fuels, France has several road actions, as well as a number of multimodal actions focusing on the promotion of LNG fuel. For the rail transport, France is committed to ongoing works along the Mediterranean and Atlantic corridor. France is also involved in studies along the Mediterranean, Atlantic and North-Sea Mediterranean Corridors, which will prepare future construction phases.


