 EUROPEAN COMMISSION
Brussels, 23.5.2022
SWD(2022) 609 final
COMMISSION STAFF WORKING DOCUMENT
2022 Country Report – Greece
Accompanying the document
Recommendation for a COUNCIL RECOMMENDATION
on the 2022 National Reform Programme of Greece and delivering a Council opinion on the 2022 Stability Programme of Greece
{COM(2022) 609 final} - {SWD(2022) 640 final}

Economic and employment snapshot
The Greek economy has weathered the pandemic well but risks remain
Greece undertook deep structural reforms in the aftermath of the global financial crisis of 2007–2008. The global financial crisis revealed the vulnerabilities of the Greek growth model, which was essentially driven by a boom in the non-tradable sector and high consumer and housing spending, combined with high wage increases, rapid credit growth and large government deficits financed at low interest rates. These triggered a sovereign debt and liquidity crisis, during which Greece received financial assistance from the euro-area countries to support three financial assistance programmes that were complemented with fundamental economic, governance and social reforms. Following the completion of these programmes, Greece is monitored under enhanced surveillance.
When the pandemic hit, Greece’s post-programme economic adjustment was still ongoing. Greece’s GDP per capita prior to the pandemic stood at 63.3% of the EU average (), down by almost 25 percentage points compared to its peak of 88.2% in 2007. Following economic recessions in 2015 and 2016, Greece achieved modest GDP growth, peaking in 2019. Over the same period, Greece recorded significant gains in export market shares. Unemployment decreased from a peak of 27.8% in 2013 to 17.9% by the end of 2019. During the same period, Greece achieved one of the highest fiscal primary surpluses (i.e. government surpluses net of interest payments) in the euro area.
Despite the significant improvements of the last decade, Greece entered the pandemic facing major challenges. These challenges were reflected in high public debt, a deeply negative net international investment position, a high share of non-performing loans on banks’ balance sheets and a high unemployment rate. Labour productivity strengthened in 2019 yet remained low, reflecting the long period of under-investment, as well as skills mismatches.
Greece’s investment gap vis-à-vis its EU peers remains large. Investment averaged 24.1% of GDP between 2000 and 2007, above the EU average of 22.2%. () However, by 2021, it had fell to only 12.8% of GDP, the lowest in the EU and around 10 percentage points below the EU average (Graph 1.1). This decline reflected both cyclical and structural factors and was largely due to the notable decrease in private investment, which was in turn hindered by access to finance constraints, inefficiencies in the public administration and the justice system, and regulatory bottlenecks.
|
Graph 1.1:
Total investment (% GDP)
|
|

|
|
Source: Eurostat
|
The Greek economy was hit harder than the rest of the EU during the pandemic, but its recovery gained traction in 2021. Greece’s GDP contracted by 9.0% in 2020 compared to an average of 5.9% in the EU, but recorded a strong rebound of 8.3% in 2021 compared to 5.3% in the EU. Although tourism had not fully recovered, economic activity reached its pre-pandemic level already by Q3-2021. Exports of goods regained momentum during the same year and the positive labour market developments prior to the pandemic resumed, partly thanks to the short-time work schemes that helped prevent large lay-offs.
Greece reacted swiftly to the pandemic, introducing a range of public support measures. Since the onset of the pandemic, Greece has mounted a strong and rapid policy response, including with support from the EU’s SURE instrument (), to sustain the economy and support the recovery (see Annex 3:). The measures it introduced to support households and affected businesses are expected to be largely phased out in 2022. The cost of these measures along with the fiscal impact of the economic downturn caused public debt to reach 206% of GDP in 2020 before declining to 193% in 2021. The general government balance improved in 2021, reaching -7.4% of GDP from -10.2% of GDP in 2020. The authorities are planning to return to a position of a primary surplus again in 2023.
While the labour market has weathered the crisis relatively well, unemployment remains high. The unemployment rate continued its decline to reach 13.0% in the fourth quarter of 2021, while for the same quarter, the employment rate (people aged 20-64 years) reached 65%. Nevertheless, young people were severely affected by the pandemic, with youth unemployment climbing to 38.6% in Q3-2020, before falling to 31.3% in Q4-2021. Wage growth turned positive in 2021 and the minimum wage increased by 2% in January 2022 and by an additional 7.5% in May 2022. Job creation is set to continue as the economy expands and the EU-supported recovery and resiliency plan is rolled out.
Greece has made notable progress on the European Pillar of Social Rights, but challenges remain. Greece records a very high share of young people that are not in employment, education or training and one of the largest gender employment gaps in the EU with third country nationals scoring worse on both fronts. Moreover, there are persisting gaps in access to social protection for non-standard forms of employment, particularly for the self-employed, while the share of population and especially children at risk of poverty or social exclusion continues to be relatively high (see Annex 12).
Regional disparities remain significant. With more than half of its population and a little less than two thirds of its economy concentrated in the regions of Attica and Central Macedonia, Greece features a rather heterogeneous economic development model across its various regions. The large disparities in GDP per capita are notably due to regional inequalities in labour productivity, labour market conditions, and investment and competitiveness levels (see Annex 15). Education outcomes also tend to vary significantly across regions (see Annex 13).
Tourism is a key source of revenues. The direct contribution of tourism to the country's economic output is estimated at 7.7% of the total gross value added in 2019, which is the highest among Member States with a large share of tourism (). The sector is the largest export industry in the country, with international tourist receipts accounting for around a quarter of the country’s export revenue. The restrictions that were put in place during the pandemic have disrupted the operation of the sector, with tourist arrivals falling by 76.5% in 2020 compared to 2019. However, tourism partially recovered in 2021 and is expected to recover fully by 2023.
With support from EU funds, the country is gradually moving towards a more sustainable development model. Progress towards meeting the United Nations’ Sustainable Development Goals (UN SDGs) has been mixed. Albeit starting from a relatively low position, Greece has taken important steps to meet environmental sustainability goals and its performance in reducing greenhouse gas emissions and using renewable energy sources is now at the EU average. Nonetheless, challenges remain in waste and water management and the circular economy. Greece also fares better than in the past in several dimensions of fairness, productivity and macroeconomic stability, although there is room for further improvement (see Annex 1). EU funds such as the Recovery and Resilience Facility (RRF) and the EU cohesion policy funds provide key support to Greece’s efforts to meet its SDGs (see Annex 3).
Russia’s war of aggression against Ukraine impacts on the Greek economy
Greece has relatively limited trade links with Russia and Ukraine (). Tourist receipts from Russia represent around 2.5% of the total tourist receipts of Greece (). Nevertheless, dependence on industrial and energy imports from Russia is more evident, notably for natural gas and oil (though significantly declining in recent years) and, to a lesser extent, base metals and agricultural products. According to the latest data, final demand in Greece contains around 1.1% of added value produced in Russia (), with energy-intensive sectors such as manufacturing and oil refineries, as well as agriculture, depending on imports from Russia.
The increase in international energy prices places a heavy burden on households and businesses. Electricity prices in Greece increased by 44% between June and December 2021 and are expected to remain elevated in 2022. Consumer prices are expected to peak in the second quarter of 2022 and remain high thereafter, before easing in 2023. According to the Commission’s 2022 spring forecast, inflation is expected to increase by 6.3% in 2022 and drop to 1.9% in 2023, driven by energy price developments and their pass-through to other commodity prices, notably food. The hike in energy prices affects low-income households the most and add to the existing challenges, illustrated by the fact that 17.1% of the Greek population were unable to keep their homes adequately warm in 2020, around 8.2 percentage points above the EU average.
The steadily rising input prices and the supply shortages in an array of goods, are taking a toll on Greece’s production, with the latest data showing a slowdown in output growth. Based on the Commissions’ 2022 spring forecast, real GDP growth in 2022 is expected to ease but remain solid, despite the adverse impact of the military aggression in Ukraine. For 2023, the gradual easing of the inflationary pressures later during the year, is set to support private consumption and increase its contribution to growth. Over the same year, tourism is expected to fully regain the losses it suffered during the pandemic. Overall, real GDP is set to grow by 3.5% in 2022 and 3.1% in 2023.
Greece made significant progress with implementing key reforms under enhanced surveillance
Greece implemented a number of significant reforms in recent years to bolster its growth prospects. Greece took important steps to ease the administrative burden for businesses, simplify investment licensing, reform labour legislation and expand the provision of digital public services. It has also developed its energy markets, although market participation remains relatively low. These reforms helped improve cost competitiveness () before the pandemic. Nevertheless, despite notable progress in recent years, the country’s export base largely remains focused on products with a low level of technological sophistication and the exports-to-GDP ratio remains relatively low, despite almost doubling over the past decade. Regarding public finances, progress in clearing outstanding obligations to the private sector has been significant and, going forward, the implementation of public investments is expected to be supported by a major public procurement reform (see Annexes 10, 11), the new Project Preparation Facility, and the Strategic Projects Pipeline put in place in 2021. The stimulus from the Recovery and Resilience Facility and other EU funds are expected to further strengthen Greece’s growth prospects and help close its large investment gap going forward.
The banking sector has become more stable and resilient, but vulnerabilities persist. In recent years, the authorities adopted significant financial sector reforms, including an overhaul of the insolvency framework and an asset protection scheme (Hercules) that contributed to a strong reduction in the ratio of non-performing loans () from its peak of 47.4% in September 2016 to 12% in September 2021. Nevertheless, it still remains among the highest in the EU. Banks’ core profitability remains low, but is expected to increase with the rebound in economic activity and the reduction in provisions set aside for potential losses. Banks’ total capital ratio stands at 15% compared to an EU average of 19.3%, while capital quality remains weak. The pandemic interrupted the declining trend of private debt, measured as a share of GDP, while the cost of borrowing continues to be high, particularly for households and small businesses, and an underdeveloped capital market limits firms’ access to non-bank financing (see Annex 16).
Greece has progressed well with its privatisation agenda and with improving the governance of state-owned enterprises. The country’s privatisation programme regained momentum in 2021, with the financial closure of the Hellinikon project, the selection of the preferred investors for the Egnatia concession and the Public Gas Corporation (DEPA) Infrastructure, among others. The privatisation programme helps to make the economy more efficient and stimulates private investment, which will greatly benefit the economy by generating value added and creating jobs (). Corporate governance of state-owned enterprises in the portfolio of the Hellenic Corporation of Assets and Participations has also significantly improved over the last few years, thanks to the adoption of best practices. In addition, the authorities are working on improving and modernising the legal framework for all state-owned enterprises.
Greece has continued to take steps to modernise its public administration and justice system. The low efficiency of the public sector has for long been a major barrier to growth. Greece has put in place modern human resources management practices in the public administration, including annual performance appraisals and a mobility scheme, and is planning to introduce goal setting as part of the appraisal exercise. As regards the justice system, the creation of special court chambers for a speedier resolution of economic disputes and the revision of the insolvency code and the code of civil procedure are expected to improve efficiency of courts, which remains particularly low (). Greece has also introduced new IT tools to speed up several types of courts proceedings (see Annex 11).
The recovery and resilience plan is underway
At 16.7% of national GDP in 2021, the Greek recovery and resilience plan (RRP) is one of the largest in the EU. Supported by the EU’s Recovery and Resilience Facility (RRF), the plan amounts to EUR 30.5 billion (in 2018 values) for 2021-2026, EUR 17.77 billion in grants and EUR 12.73 billion in loans (see Annex 2). This comes on top of EU cohesion policy support, which amounts to EUR 21.3 billion (12.8% of GDP) for 2021-2027. In the design phase of the RRP, particular attention was paid to ensuring that the two EU financing resources reinforce one another and that any overlaps are avoided. With its 174 measures consisting of 106 investments and 68 reforms, the Greek RRP is expected to have a significant impact on economic growth in Greece, increasing GDP by 2.1‑3.3% by 2026 ().
The close link between the RRP and the Council’s country-specific recommendations to Greece ensures that projects address longstanding challenges. Building on the reform agenda initiated under the financial assistance programmes and currently monitored under enhanced surveillance, the RRP covers many areas that have been identified as challenges in the European Semester cycle and outlined in the Council’s country-specific recommendations (CSRs) to Greece (see Annex 4). In particular, the RRP includes measures to improve public financial management, strengthen the resilience and accessibility of the healthcare system, improve the functioning of the labour and product markets, and support public and private investment in line with the CSRs addressed to Greece during the last 3 years.
The recovery and resilience plan is a key policy anchor for the medium term. Upon conclusion of the financial assistance programme and as part of the launch of enhanced surveillance, Greece made a number of commitments to Eurogroup partners in June 2018, which covered the period up to mid-2022. The authorities have focused their efforts on delivering on outstanding commitments. With projects aiming to improve productivity, create incentives for private investment, and support significant reforms in the labour market and the judicial and tax systems, the RRP builds upon and significantly broadens the reforms implemented under enhanced surveillance. It is expected to modernise the structure of the economy, while making it more resilient.
The plan is heavily oriented towards accelerating the green and digital transitions, including through significant reforms. The Greek energy sector is traditionally reliant on fossil fuels. EUR 11.4 billion (37.5% of Greece’s RRF allocation) under the Greek plan are dedicated to climate objectives, financing a total of 35 different reforms and investments. This will nevertheless not be sufficient to meet the country’s 2030 and 2050 climate objectives, while ensuring a fair transition. Greece notably plans to increase the share of renewable energy sources in its energy mix, including by accelerating the launch of offshore wind parks, but further efforts will be necessary, including to improve the energy efficiency of buildings, promote sustainable transport and improve water and waste management. In the area of digitalisation, Greece faces considerable challenges. These are reflected in shortfalls in connectivity, lacking digital skills at all levels, the slow uptake of digital technologies in the private and public sector and in particular by small and medium-sized enterprises (SMEs), and low digitalisation of public services. EUR 7 billion (23.3% of Greece’s RRF allocation) will support digital infrastructure development, the digitalisation of the state and public administration, digital skills and the digitalisation of businesses, with a focus on SMEs. Both the green and digital transition will also be supported through the loans extended under the plan which aim to boost private investments in the two areas.
To foster the green transition, the plan sets out measures to promote renewable energy, sustainable transport, energy-efficient buildings, and waste and water management. Investments in electricity infrastructure aim to increase the potential for renewable energy sources and storage capacity, while renovations of buildings aim to increase their energy efficiency. To make mobility more sustainable, the Greek plan invests in the installation of 8 000 charging stations for electric vehicles and supports major reforms in rail and road transport. In the area of climate change adaptation, the plan includes measures for reforestation, biodiversity, improving irrigation networks and wastewater management. The plan will also strengthen civil protection and disaster management mechanisms.
The plan will help the economy adapt to a new digital way of working, including by developing key digital skills. Projects under the plan include a widespread deployment of very high capacity networks such as fibre connections and 5G, and a thorough digital transformation of the public administration. The plan notably aims at streamlining and digitalising administrative processes, providing new IT equipment and training for public administration staff. Digitalisation also features in many other areas of the plan, such as education, lifelong learning, justice and taxation. In addition, the plan supports the digitalisation of SMEs.
The RRP proposes concrete actions to promote effective labour market integration, employment and upskilling, while modernising the education and healthcare systems, thereby contributing to implementation of the European Pillar of Social Rights. To reduce unemployment and increase the labour force, Greece has revised its Labour law and reformed the public employment service. Going forward, the reform of the unemployment insurance framework and the large-scale investments in upskilling programmes and hiring subsidies will help promote the re-entry of people into the labour market. Moreover, the modernisation of the vocational education and training system and the reform of the adult learning system should reduce skills mismatches. To increase participation in early childhood education and care, the plan will subsidise the creation of new childcare facilities in municipalities and in large companies. In healthcare, to improve resilience of the national system, the plan invests in health prevention, upgrading of the primary care network and renovation of public hospitals.
Modernising the economy and helping businesses grow and export is a key focus of the plan. The large share of micro and small enterprises in the Greek economy and the still complex business environment weigh on productivity growth and adversely affect export performance. Modernising the regulatory framework to reduce the administrative burden on businesses and supporting companies’ research and development activities are among the goals of the plan. The plan also supports companies including SMEs to develop partnerships and helps them grow, export and become more productive.
The plan aims to modernise the judicial system. The performance of the Greek justice system is among the lowest in the EU, with an estimated time needed to resolve civil and commercial cases exceeding 600 days in 2020. The plan aims to address structural and operational inefficiencies, broaden the use of IT tools in courts and improve the digital skills of judges and clerical staff. Moreover, the plan supports the revision of the judicial map that should rationalise the regional distribution of infrastructure, equipment and human resources. It also finances the construction or renovation of courthouses. Judicial police will be created to serve the specific needs of the justice system, legal procedures will be simplified and accelerated, and IT coverage of legal proceedings will be expanded.
By leveraging private investment, loans extended under the RRP should help the economy grow and become more resilient, and help close the investment gap, which is estimated at around 10% of GDP in 2021. EUR 12.7 billion will be disbursed in the form of loans and will support companies’ access to finance through loans, equity support for SMEs and InvestEU. In addition to providing funds, the plan focuses on reducing the administrative burden and improving the regulatory framework for companies, including through justice and taxation system reforms. The financial sector and capital markets will be strengthened through upgrades to the digital infrastructure to support the recently adopted insolvency framework. Reforms to address private indebtedness challenges and information asymmetries between public entities, financial institutions, households and businesses are also envisaged. Moreover, the modernisation of the capital market’s regulatory framework and the digitalisation of its supervisory authority are expected to support the provision of alternative sources of financing.
|
Box 1:
|
Key deliverables under the recovery and resilience plan in 2022-23
·Launch of rounds 2 and 3 of the energy renovation of residential buildings.
·Entry into force of a revised legislative framework for public urban and regional passenger transportation services.
·Launch of project to promote the digitalisation of SMEs. This project will finance investments in digital technologies and services for 100 000 SMEs.
·Reform of the national lifelong learning framework.
·A new legal framework to clarify responsibilities across all public administration levels and address overlaps.
·Entry into force of legislation to encourage business internationalisation by creating a system of incentives and support for micro and small enterprises to help them grow and make use of economies of scale.
·Entry into force of legislation for the launch of a performance-pay system for civil servants.
·Start of construction works for the E-65 Central Greece Highway: Trikala-Egnatia.
|
|
|
|
Full and timely implementation of the plan will be key to achieve its ambitious objectives. The responsibility for the timely implementation of the plan lies with the Greek authorities, who have committed to 331 performance-based milestones and targets linked to the various reform and investment measures. There are strong links and synergies between these measures and, given their broad scope, involvement of social partners will be key to ensuring full and timely implementation of the plan (see Annex 2).
Further priorities ahead
Beyond the challenges fully addressed by the RRP, Greece faces additional challenges. The latter include further streamlining the tax system and modernising the public administration and health system to promote investment and social inclusion, while supporting fiscal sustainability. Completing key reforms of the business environment such as the national cadastre can further promote investment. Further streamlining the public employment service could enable more systematic support to jobseekers. There is also scope to move to a more resource-efficient economy by phasing out lignite-based electricity production, promoting the take-up of renewables and further developing the electricity market. Addressing these challenges will also help Greece make further progress in achieving the UN SDGs on environmental sustainability, fairness, productivity and macroeconomic stability.
Moving towards more sustainable public finances
Returning to a primary fiscal surplus and decreasing public debt while keeping the economic recovery on track is key to ensuring sustainability of public finances. The cost of the covid-19-related public support measures increased the debt-to-GDP ratio by over 10 percentage points, to 193% in 2021 up from 180.7% in 2019. Nevertheless, borrowing costs remained broadly stable for most of this period. While the bulk of Greece’s public debt is held by its European partners at long maturities and concessional rates, the interest rate it pays on new market debt will be increasingly relevant for debt sustainability. In the long run, the sustainability of Greece’s public debt will also hinge crucially on progress with the fiscal adjustment and with achieving robust growth rates (Annex 20).
The structure of public finances has improved over time. Total revenues from taxes and social security contributions (as a share of GDP) have increased since the global financial crisis and are currently close to the EU average. Since 2020, important steps have also been taken to improve the composition of tax revenues by reducing corporate and personal tax and social security contribution rates and by improving tax collection, but challenges remain. On the expenditure side, Greece made considerable efforts prior to the pandemic to keep its current primary expenditure close to or even below the euro-area average as a share of GDP. The public sector wage bill decreased and reforms of social expenditure improved spending efficiency. Despite these efforts, expenditure on public wages and pensions as a share of GDP is still above the euro-area average.
Greece has substantially reduced corporate taxes, but investment barriers remain. The corporate income tax rate stood at 22% in 2021, down from 28% in 2019. For individual entrepreneurs, Greece applies an annual lump-sum tax of EUR 650, regardless of whether they generate profits or not and on top of the personal income tax and other taxes. This results in very high effective tax rates for low-turnover enterprises () and acts as a barrier to market entry. Moreover, this tax creates unnecessary difficulties for salaried professionals, including university academics, in starting up their own businesses (see Annex 18), and in improving the weak links between academia and the productive sector (see Annex 9). Although it has declined significantly from 29% in 2018 to 25.8% in 2019, Greece’s value added tax (VAT) gap () remains among the highest in the EU.
Companies, and in particular foreign investors, struggle with the complex tax framework. Greece ranks 29th of 38 OECD countries on the complexity of its tax system () which acts as a disincentive for foreign direct investments. Greece lacks a comprehensive advance tax ruling system, used in other Member States as a tool to provide a binding legal interpretation on the application of tax law in a specific situation. Such systems promote voluntary tax compliance, particularly among foreign investors ().
Public revenue administration has been strengthened in recent years, but tax collection remains a challenge. The collection of overdue tax debt remains a challenge in Greece, with the total amount of unpaid tax debt corresponding to 212.3% of the total net revenue in 2019. Despite past efforts to increase compliance with tax obligations, new ad hoc repayment schemes for debts owed by private individuals to the tax administration continued to be created before the pandemic (), undermining the credibility of such efforts. Through these schemes, the tax administration provided a broad range of debtors the opportunity to delay the repayment of their tax liabilities over and above the standard tax settlement scheme, thus hampering the payment discipline for both individuals and businesses. However, there has been some progress in modernising tax collection, mainly by promoting the use of electronic payment transactions with the introduction of specific incentives and thresholds (), while a digital platform (myData) has allowed businesses to submit their financial accounts and invoices digitally to the tax administration. Another positive step aiming to strengthen the tax administration’s capacity to attract and retain highly qualified staff was the completion of a key public administration reform in 2021. The reform links part of the salary with the job description and the required qualifications for the specific post. This is particularly important for the success of the ongoing digitalisation efforts in tax administration. The aim is to offer a wide range of remote services, including e-filing facilities, to reduce compliance cost for taxpayers. The RRP will help digitalise tax audits and controls that, combined with the planned acceleration of VAT refunds, should improve tax collection.
Despite improving over time, public administration performance remains low. Public consultation is used more systematically and there has been a marked reduction in the number of last-minute amendments introduced to parliament. However, there is scope to improve the quality of impact assessments of draft laws and to limit the cases of legal provisions introduced outside the normal legislative process that remain high and may risk undermining recent good law-making efforts (see Annex 11). Greece has expanded digital public services for businesses and the general public, but the challenge is to streamline and simplify the underlying processes. The national integrity system spearheaded by the Ministry of Interior and the National Transparency Authority is rolling out an internal control system across the public administration to foster accountability. The focus now turns to the implementation of various integrity system initiatives, such as putting in place integrity advisors to provide information and expertise on the planned rules and processes.
The public sector wage bill remains comparatively high. Although the size of Greece’s public sector has been reduced since 2010, the wage bill remains above the EU average (Graph 3.1). Since 2018, there has been a steep increase in temporary staff (by nearly 25%), while the number of permanent staff has been kept broadly stable, in line with the one-in-one-out hiring rule. Considering the ageing of its civil servants, with half of the permanent staff aged over 50, Greece will face a challenge, but also an opportunity, to replace the many civil servants that will retire in the coming years. The multiannual hiring plan along with the digital organisational charts and job descriptions, will help prioritise the various needs and ensure that new staff have the desired skills.
|
Graph 3.1:
Size of Greek public sector (number of employees)
|
|

|
|
Source: Greek authorities and Eurostat
|
The high number of temporary staff is a challenge for controlling the size of the public sector and maintaining transparency in hiring. With technical support from the European Commission, in 2021, Greece adopted a reform to strengthen the Personnel Selection Council (ASEP) and modernise the selection process for permanent staff through the introduction of a mandatory written test. The high number of temporary staff may lead to the expectation that these posts will be converted into permanent posts, as this was common practice previously. However, as the selection process for temporary posts is not as thorough as for permanent posts, it could weaken the integrity of the new selection process for permanent staff.
The healthcare system is still hospital-centric, with curative care spending focused on hospitalisations. Greece ranks in the bottom half of Member States on public spending on curative care (2.9% of GDP in 2019 vs the EU average of 3.7%). Of this, spending on hospitalisations is among the highest in the EU, as opposed to ambulatory care, which is among the lowest (). Public spending on pharmaceuticals is also among the highest in the EU, and is almost twice the EU average (), although planned measures such as the expansion of compulsory protocols and of centralised procurement, are expected to reduce it.
The ongoing reform of primary health care can potentially address the above weaknesses. A well-functioning primary care system covering the whole population and with the family doctor playing a central role in shaping the care pathway through referrals, i.e., gatekeeping, can increase the efficiency of access to healthcare goods and services. A reform of the primary health care system is underway, it will be adopted in May 2022 and it is expected to be rolled out by the end of the year, with substantial progress expected by October. Its implementation will be supported by the RRP infrastructure development measures, but the success of the reform will depend on the availability of an adequate stock of public sector family doctors.
The pandemic deeply challenged the healthcare system. To respond to the pandemic, Greece expanded the laboratory, intensive care and disease surveillance capacities of its healthcare system, as well as its workforce. The system benefited from increased public support which continues in 2022 at 0.15% of GDP, bringing healthcare spending closer to the EU average. Improving spending efficiency will be key to making the most of any additional resources allocated to healthcare and to sustainably enhance access (see Annex 14). Examples of measures that go in that direction and are currently missing from Greece’s RRP include a stronger enforcement mechanism to monitor and sanction the prescription of unnecessary care, a revision of incentives across the broader pharmaceuticals supply chain, and systematic communication campaigns to better inform patients on available care options.
Further easing doing business
The business environment has improved, but remains heavily regulated and complex. Doing business in Greece is easier today than a decade ago thanks to the expansion of digital public services, the reduction in corporate taxes, the creation of a unified social security system, and the reform of the labour and product markets. Despite reforms, the Greek tax system remains complex and sometimes intransparent due to legal judgements, with limited coverage of fully-updated information to tax payers. Greece also has one of the slowest court systems in Europe, while constraints in access to finance and administrative and regulatory bottlenecks prevent the full integration of companies, especially SMEs, into the single market (see Annex 10). According to the OECD, Greece has one of the more restrictive and heavily regulated business environments (), while, despite efforts to eliminate it, corruption in public administration is perceived to be still relatively high ().
One particular challenge that businesses face is the lack of a comprehensive national cadastre. The development of a modern cadastre (i.e. a register of real estate and land ownership) in Greece started in 1994 and has been an emblematic reform of the financial assistance programme. Progress so far has been significant and the full cadastre is expected to be completed by 2023. Cadastral mapping covering 63.5% of real property rights has been completed or is in the validation phase and more than half of the planned cadastral offices and branches have been set up replacing the old mortgage offices. The implementation of the cadastre has been supported by EU Structural Funds, the structural reform support programme and more recently, the Recovery and Resilience Facility.
The completion of the cadastre project requires the establishment of forest maps. While forest maps for almost all the country have been produced, the ratification of about 50% of them has faced delays due to the pandemic, the wild fires of last summer and a reorganisation of the forestry services. Ratification is expected to be largely completed by July 2022.
Supporting people getting into work in a systematic manner
While the employment and social impact of the pandemic has been mitigated, unemployment and poverty remain high. Despite having declined markedly since 2017, at 27.5%, the share of people at risk of poverty or social exclusion (AROPE) was well above the EU average (21.9%) in 2021 and energy poverty (17.1%) was more than twice as high as in the EU as a whole (8.2%) in 2020. Unemployment has been declining since 2013, but, at around 13%, it is still one of the highest in the EU and it disproportionally affects women, young people and third country nationals. In the age range 20-64, women have 30% less chances than men to be employed, while almost one fifth of young people (aged 15-29) are not in employment, education or training. Meanwhile, the risk of undeclared and under declared work remains high, although efforts have been made to eliminate the phenomenon. Tackling these challenges will allow Greece to contribute to the 2030 EU headline targets on employment and poverty reduction.
The effectiveness of active labour market policies is hampered by the capacity constraints of the public employment service. Around 1.1 million jobseekers were registered in the public employment service in March 2022. More than half had been registered for more than 12 months and, out of these, women were twice as many as men. A major reorganisation of the service was initiated in 2021 along with a sizeable expansion of its activation programmes. Nevertheless, capacity constraints remain. The service currently has 470 employment counsellors and only about half of its staff deal directly with jobseekers, which is a relatively low share (), while the complexity of back-office administrative procedures prevents a further shift of human resources to front-office counselling functions. An additional 540 counsellors will be recruited on a temporary basis in 2022 with support from the Recovery and Resilience Facility until a more sustainable structural solution to the service's capacity constraints can be found.
Fostering the green economy and reducing energy imports
Greece is moderately reliant on imports of energy from Russia. In 2020 (), natural gas accounted for 24% of Greece’s energy mix, of which 39% was imported from Russia, and crude oil accounted for 50% of its energy mix, of which 18%, excluding refined oil products (), was imported from Russia. A considerable share of oil imports serves as an input to Greece’s large refining industry, which is then re-exported in the form of finished petroleum products.
In recent years, Greece has initiated actions to diversify energy supply routes and sources, and efforts are expected to be intensified in the near future. The new geopolitical situation calls on Greece to reinforce energy diversification efforts, such as the ongoing exploration of alternative natural gas and oil supply routes. For crude oil, an initial deal to import more oil from Saudi Arabia was concluded in March 2022, while additional plans are currently under preparation. Concerning natural gas, the recently constructed Trans Adriatic Pipeline (TAP) has already allowed Greece to diversify sources of natural gas imports. To ensure the viability of additional LNG infrastructure, ensuring compatibility of existing gas distribution networks is key. It should be noted that future investments should be future-proof where possible to avoid lock-in effects. Last but not least, several interconnection projects are in the development pipeline, while other investments remain at a preparatory stage.
Greece remains committed to making its energy production more efficient. Existing lignite-fired power plants are expected to be decommissioned fully by 2028 accompanied by actions to support a fair and green transition (see Annexes 5, 6). In 2021, the share of lignite-based electricity production in overall electricity production fell below 10%. At the same time, the use of renewable energy in sectors such as buildings, construction and transport remains low, while new energy sources, such as renewable hydrogen in hard-to-abate sectors such as industry, are not sufficiently exploited. There is scope for further decarbonisation efforts in the transport sector, which remains the sector that consumes a significant part of the oil, in particular through promoting further investments on sustainable mobility. To promote renewables, Greece is setting up an organised market platform to facilitate bilateral power purchasing agreements for renewable electricity.
Greece has set a relatively modest target for reducing primary energy consumption by 2030 in its national energy and climate plan. Whereas Greece’s RRP supports the setting up of a framework to advance the energy services market, additional reforms, including to overcome the split-incentives dilemma () and to improve the capacity and qualification of buildings professionals, could help address existing market failures and boost energy renovation rates. The continuation of the popular energy efficient renovation programme for private residencies under the RRP and the extension of other energy saving measures () are positive steps, however, a stronger focus on vulnerable groups could make these actions even more impactful (see Annex 12).
The energy market has undergone major reforms but market participation remains low. The target model for the wholesale market has been in place since 2020. However, the liquidity of the energy markets could be strengthened by introducing a continuous intra-day market to improve the active participation of renewables and end-consumers. In the retail market, the market share of the Public Power Cooperation is currently close to 65%, which is significantly above the 50% target set by national legislation. Strengthening the energy markets, for example, by increasing the share of renewables, and by making demand response and storage available to market actors, is expected to increase competition and investment in the sector, which would benefit households and businesses.
Waste management and water treatment remain inadequate, although efforts are being made to improve both. Around 80% of Greece’s municipal waste is brought to landfill (vs 24% in the EU) and 5.4% of material resources come from recycled waste materials (vs 12.8% in the EU). To address these challenges, Greece has recently adopted a waste management law that introduces incentives for municipalities to achieve higher recycling rates and enforce separate collection of recycling materials, while extending the responsibility of waste producers and creating the necessary recycling facilities. The implementation of this new legal framework combined with the new landfill tax and the adoption of updated waste management plans by all Greek regions will support the transition towards a circular economy. In the area of water management, many small municipalities are still deprived of proper wastewater management and/or a reliable provision of drinking water, while distribution leakages remain an issue. To improve the management of its scarce water resources, Greece will establish a new water and wastewater regulatory authority as part of its RRP (see Annex 7).
Key findings
Greece’s recovery and resilience plan set out a wide-ranging and ambitious response to its structural challenges through:
·Investments to improve the energy efficiency of public buildings, expand renewable energy sources, storage capacities as well as promoting sustainable transport, waste and water management.
·Investments in the digitalisation of public administration and private sector companies, in connectivity infrastructure and in digital skills. Further improvements in public administration including the tax administration and justice systems are also envisaged.
·Reforms and investments fostering labour market activation and upskilling, improving the availability of early childhood education and care, and upgrading the health care system.
Beyond the reforms and investments in the RRP, Greece would benefit from:
·Improving the investment friendliness of taxation system through the introduction of a comprehensive advance tax ruling system and the improvement of the structure of the tax burden on the self-employed.
·Safeguarding the efficiency of the public administration by ensuring it can attract the right skills and maintaining its costs at pre-pandemic levels.
·Enhancing the efficiency of health care spending including by completing the roll-out of the primary health care system with adequate staffing to ensure full population coverage.
·Completing the cadastre project by completing the cadastral mapping and the forest maps.
·Ensuring effective labour market activation support with a particular focus on young people and women, and further enhancing social policies, so as to contribute to the 2030 EU headline targets on employment and poverty reduction.
·Reducing dependence on fossil fuels by a) reducing overall fossil fuel use and accelerating the deployment of renewable energy, including development of hydrogen infrastructure, thereby supporting the decarbonisation of the Greek economy and reaching national targets; b) ensuring sufficient capacity of electricity and gas interconnections and diversifying energy supply routes; c) strengthening the energy services market framework and stepping up delivery on energy efficiency-enhancing measures.
Annexes
List of Annexes
Cross-cutting progress indicators
Annex 1: Sustainable Development Goals
Annex 2: Recovery and Resilience Plan Implementation
Annex 3: Other EU instruments for recovery and growth
Annex 4: Progress in the implementation of country-specific recommendations
Environmental sustainability
Annex 5: Green Deal
Annex 6: Employment and social impact of the green transition
Productivity
Annex 7: Resource efficiency and productivity
Annex 8: Digital transition
Annex 9: Innovation
Annex 10: Industry and single market
Annex 11: Public administration
Fairness
Annex 12: Employment, skills and social policy challenges in light of the European Pillar of Social Rights
Annex 13: Education and skills
Annex 14: Health and health systems
Annex 15: Economic and social performance at regional level
Macroeconomic Stability
Annex 16: Key financial sector developments
Annex 17: Macroeconomic Imbalance Procedure assessment matrix
Annex 18: Taxation
Annex 19: Key economic and financial indicators
Annex 20: Debt sustainability analysis
LIST OF Tables
Table A2.1:Key elements of the Greek RRP
Table A4.1:Summary table on 2019,2020 and 2021 CSRs
Table A5.1:Indicators underpinning progress on the European Green Deal from a macroeconomic perspective
Table A7.1:Selected resource efficiency indicators
Table A8.1:Key Digital Economy and Society Index Indicators
Table A9.1:Key research, development and innovation indicators
Table A10.1:Key Single Market and Industry Indicators
Table A11.1:Public administration indicators – Greece
Table A12.1:Social scoreboard for Greece
Table A13.1:EU-level targets and other contextual indicators under the European Education Area strategic framework
Table A14.1:List of key indicators, health
Table A15.1:Selected indicators at regional level – Greece
Table A16.1:Financial soundness indicators
Table A17.1:Assessment of Macroeconomic Imbalances matrix
Table A18.1:Taxation indicators
Table A19.1:Key economic and financial indicators
LIST OF Graphs
Graph A1.1:
Progress towards SDGs in Greece in the last five years
Graph A2.1:
Total grants disbursed under the RRF
Graph A2.2:
Total loans disbursed under the RRF
Graph A2.3:
Fulfilment status of milestones and targets
Graph A2.4:
Share of RRF funds contributing to each policy pillar
Graph A3.1:
2014-2020 European Structural and Investment Funds – total budget by fund (1)
Graph A3.2:
Cohesion policy contribution to the SDGs (1)
Graph A4.1:
Greece’s progress on the 2019-2020 CSRs (2022 European Semester cycle)
Graph A5.1:
Fiscal aspects of the green transition: Taxation and government expenditure on environmental protection
Graph A5.2:
Thematic - Energy: Share in energy mix (solids, oil, gas, nuclear, renewables)
Graph A5.3:
Thematic - Biodiversity: Terrestrial protected areas and organic farming
Graph A5.4:
Thematic - Mobility: Share of zero emission vehicles (% of new registrations)
Graph A6.1:
Fair green transition challenges
Graph A6.2:
Energy poverty by income decile
Graph A7.1:
Economic importance and expansion of the circular economy - employment and value added in the circular economy sectors
Graph A11.1:
Performance on evidence-based policy making indicators
Graph A11.2:
Performance on the single market public procurement indicator
Graph A13.1:
Low achievement in reading by socioeconomic status, PISA 2018
Graph A14.1:
life expectancy at birth, years
Graph A14.2:
Projected increase in public expenditure on health care over 2019-2070 (AWG reference scenario)
Graph A15.1:
CO2 emissions from fossil fuels per head, 2018 (Greece)
Graph A15.2:
Territories most affected by the climate transition in Greece
Graph A15.3:
Regional performance groups (2021)
Graph A18.1:
Tax wedge indicators
Table A20.1:
Debt sustainability analysis for Greece
Table A20.2:
Heat map of fiscal sustainability risks for Greece
Cross-cutting progress indicators
Annex 1: Sustainable Development Goals
This Annex assesses Greece’s progress on the Sustainable Development Goals (SDGs) along the four dimensions of competitive sustainability. The 17 SDGs and their related indicators provide a policy framework under the UN’s 2030 Agenda for Sustainable Development. The aim is to end all forms of poverty, fight inequalities and tackle climate change, while ensuring that no one is left behind. The EU and its Member States are committed to this historic global framework agreement and to playing an active role in maximising progress on the SDGs. The graph below is based on the EU SDG indicator set developed to monitor progress on SDGs in an EU context.
While Greece performs very well or is improving on several SDG indicators related to environmental sustainability (SDGs 7 and 12), it still needs to catch up on others (SDGs 9, 11 and 13). Greece has taken important steps to meet climate action goals (SDGs 13). By 2020, the share of renewable energy in gross final energy consumption had almost reached the EU average (21.7% vs 22.1%), albeit starting from a lower level. Greece has also fared particularly well on net greenhouse gas emissions, with emissions falling by 28% between 2015 and 2020 bringing Greece to a better position than the EU average. Access to affordable energy (SDG 7) has improved markedly since 2015, but the share of Greece’s population that is unable to keep their home adequately warm remains twice as high as the EU average (17.1% vs 8.2%). Progress with meeting responsible consumption and production objectives (SDG 12) has been mixed. Energy productivity increased by 8% between 2015 and 2020 but remained well below the EU average. Generation of waste excluding major mineral wastes dropped by around 30% in Greece and increased marginally in the EU, while CO2 emissions per km from new passenger cars increased slightly in Greece but went up by 10% in the EU.
Greece is improving on some SDG indicators related to fairness (SDGs 2 and 10), it needs to catch up on others (SDGs 1, 3, 4, 5, and 8). While Greece’s labour market and social situation has improved overall over the last 5 years, it remains less favourable overall than in the EU. The share of severely materially and socially deprived people stood at 14.9% in 2020 as compared to only 6.9% in the EU, while one third of Greece’s population (32.6%) was overburdened with housing costs as compared to only 1 in 10 in the EU (SDG 1). Certain equality aspects (SDGs 5 and 10) have shown some improvement, but overall they remain less positive than in the EU as a whole. In 2020, the employment rate of women was lower than that of men by 19.4 percentage points (as compared to 11 points in the EU). Women held only 19.6% of senior management positions and 21.3% of political positions (as opposed to 30.6% and 33.1% respectively in the EU). People in rural areas in Greece face a disproportionally higher risk of poverty or social inclusion compared to the EU as a whole. Turning to health aspects (SDG 3), while healthy life expectancy (66 years) is slightly higher than in the EU (64.6 years) and more people report being healthy (78.5 vs 69.5%), a higher and increasing share of people smoke (42% in 2020 as opposed to 25% in the EU). Despite improving over time, access to healthcare remains challenging, with 6.5% of the population reporting unmet medical needs in 2020 due to cost, distance or waiting times as opposed to only 1.8% in the EU.
Greece needs to catch up on SDG indicators related to productivity (SDGs 4, 8 and 9). Greece’s education and innovation performance (SDGs 4 and 9) is mixed with better-than-EU average results in early school leaving (3.8% vs 9.9%) and tertiary education attainment (43.7% vs 40.5%), but with large gaps in reading underachievement (30.5% vs 22.5%), early childhood education attendance (68.8% vs 92.8%), adult learning participation (4.1% vs 9.2%), basic digital skills (52% vs 54%) and R&D spending (1.49% of GDP vs 2.32%). Decent work and economic growth indicators (SDG 8) have improved in the aftermath of Greece’s deep and long economic crisis, but remain less favourable than in other Member States, as reflected in the low employment rate (58.3% vs 72.4%) and the still high share of long-term unemployed people (10.5% vs 2.4%) and young people who are not in employment, education or training (18.7% vs 13.7%).
Greece needs to catch up on SDG indicators related to macroeconomic stability (SDGs 8 and 16). Greece’s GDP per capita stood at EUR 16 170 in 2020, corresponding to around 60% of the EU average (EUR 26 380) and investment was markedly low (11.7% of GDP in 2020 vs 22.3% in the EU) (SDG 8). Meanwhile, a higher share of the population (19.2%) reported crime, violence or vandalism in their area (SDG
|
Graph A1.1:
Progress towards SDGs in Greece in the last five years
|
|

|
|
Source: Eurostat, latest update of 28 April 2022. Data mainly refer to 2015-2020 and 2016-2021.
|
16).
Annex 2: Recovery and Resilience Plan Implementation
The Recovery and Resilience Facility (RRF) is the centrepiece of the EU’s efforts to support its recovery from the COVID-19 pandemic, fast forward the twin transition and strengthen resilience against future shocks. Greece submitted its recovery and resilience plan (RRP) on 27 April 2021. The Commission’s positive assessment on 17 June 2021 and Council’s approval on 13 July 2021 paved the way for disbursing EUR 17.8 billion in grants and EUR 12.7 billion in loans under the RRF in 2021-2026. The financing and loan agreements were signed on 23 and 26 July 2021 respectively, and the operational arrangement was signed on 21 December 2021. The key elements of the Greek RRP are set out in Table A2.1.
|
|
|
Table A2.1:
Key elements of the Greek RRP
|
|

|
|
Source: European Commission
|
|
|
The share of funds contributing to each of the RRF’s six policy pillars is outlined in the graph below.
The implementation of the Greek plan is well under way. The Commission disbursed EUR 4 billion to Greece in pre-financing in August 2021, equivalent to 13% of the financial allocation, to support the implementation of crucial investments and reforms. Greece’s first payment request was positively assessed by the Commission, taking into account the opinion of the Economic and Financial Committee, leading to a disbursement of EUR 3.6 billion in financial support (net of pre-financing) on 8 April. The related 15 milestones cover reforms and investments in the areas of energy efficiency, electric mobility, waste management, labour market, taxation, healthcare and the audit and control system. Their satisfactory fulfilment contributes to addressing the related country-specific recommendations addressed to Greece in 2019 and 2020, see Annex 4. Overall, Greece reports a timely implementation of the milestones and targets due by the end of Q1-2022, which however does not prejudge the timing of the submission of subsequent payment requests or the formal assessment of the fulfilment of the relevant milestones and targets.
Greece's progress in implementing its plan is set out in the
Recovery and Resilience Scoreboard
. The Scoreboard also gives a clear overview of the progress made in implementing the RRF as a whole. The graphs below show the current state of play of the milestones and targets achieved, as declared by Greece and confirmed by the Commission.
|
Graph A2.1:
Total grants disbursed under the RRF
|
|

|
|
Source: RRF Scoreboard
https://ec.europa.eu/economy_finance/recovery-and-resilience-scoreboard/country_overview.html
|
|
Graph A2.2:
Total loans disbursed under the RRF
|
|

|
|
Source: RRF Scoreboard
https://ec.europa.eu/economy_finance/recovery-and-resilience-scoreboard/country_overview.html
|
|
Graph A2.3:
Fulfilment status of milestones and targets
|
|

|
|
Source: Source: RRF Scoreboard
https://ec.europa.eu/economy_finance/recovery-and-resilience-scoreboard/country_overview.html
|
|
Graph A2.4:
Share of RRF funds contributing to each policy pillar
|
|

|
|
Source: RRF Scoreboard, https://ec.europa.eu/economy_finance/recovery-and-resilience-scoreboard/country_overview.html
|
Annex 3: Other EU instruments for recovery and growth
The EU’s budget of more than EUR 1.2 trillion for 2021-2027 is the investment lever to help implement EU priorities. Underpinned by an additional amount of about EUR 800 billion through NextGenerationEU and its largest instrument, the Recovery and Resilience Facility, it represents significant firepower to support the recovery and sustainable growth.
In 2021-2027, EU cohesion policy funds () will support long-term development objectives in Greece. They will allow investing EUR 21.3 billion (), including EUR 1.3 billion from the Just Transition Fund, to alleviate the socio-economic impacts of the green transition in the most vulnerable regions. The 2021-2027 cohesion policy funds partnership agreements and programmes take into account the 2019-2020 country-specific recommendations and investment guidance provided as part of the European Semester, ensuring that this money fully complements other EU funding. In addition, Greece will benefit from EUR 13.5 billion support for the 2023-27 period from the Common Agricultural Policy, which supports social, environmental, and economic sustainability and innovation in agriculture and rural areas, contributing to the European Green Deal, and ensuring long-term food security.
|
Graph A3.1:
2014-2020 European Structural and Investment Funds – total budget by fund (1)
|
|

|
|
Source: European Commission
|
In 2014-2020, the European Structural and Investment Funds (ESIF) for Greece were set to invest EUR 24.8 billion () from the EU budget. The total investment, including national financing, amounts to EUR 55.32 billion (Graph A3.1), representing around 2.37% of GDP for 2014-2020 and 78.31% of public investment (). By 31 December 2021, 127% of the total had been allocated to specific projects and EUR 15.2 billion was reported as spent, leaving EUR 9.6 billion to be spent by the end of 2023 (). All 11 thematic objectives are relevant for Greece. By the end of 2020, cohesion policy investments supported some 140 241 enterprises, improved research infrastructure facilities for 1 516 researchers, provided 39 382 households with improved energy consumption classification and 4 893 928 people with improved health services. In addition, 250 000 long-term unemployed participated in funded projects, 240 000 people gained a qualification and 241 community centres serving as one-stop-shops for social services were established all over Greece. The potential GDP impact of the 2014-2020 investments of the three main cohesion policy funds (ERDF, CF, ESF) for Greece is estimated at +2.19% in 2023 and +1.37% in 2033 compared to the GDP of a scenario without cohesion policy ().
|
Graph A3.2:
Cohesion policy contribution to the SDGs (1)
|
|

|
|
Source: European Commission
|
Cohesion policy funds already substantially contribute to the Sustainable Development Goals (SDGs). In Greece, cohesion policy funds support 11 of the 17 SDGs, with up to 93% of the expenditure contributing to the attainment of the goals.
Cohesion policy funds already substantially contribute to the Sustainable Development Goals (SDGs). In Greece, cohesion policy funds support 11 of the 17 SDGs, with up to 93% of the expenditure contributing to the attainment of the goals.
The REACT-EU instrument (Recovery Assistance for Cohesion and the Territories of Europe) under NextGenerationEU provided EUR 1 708 billion of additional funding to 2014-2020 cohesion policy allocations for Greece to ensure a balanced recovery, boost convergence and provide vital support to regions following the coronavirus outbreak. REACT-EU support to Greece focuses on addressing the effects of the COVID-19 crisis by funding entrepreneurship and strengthening primary healthcare.
The Coronavirus Response Investment Initiative () provided the first EU emergency support to Greece for the COVID-19 pandemic. It introduced extraordinary flexibility enabling Greece to reallocate resources for immediate public health needs (EUR 426 million) and to support businesses (EUR 1 775 million). For instance, Greece redirected funds to purchase protective equipment and healthcare material, to reinforce healthcare staff and working capital for SMEs, and to digitalise the education system and the public administration. Greece also benefited from the temporary 100% EU financing of cohesion policy measures, with approximately EUR 590 million being financed at 100% in 2021.
Greece received support under the European instrument for temporary support to mitigate unemployment risks in an emergency (SURE) to finance short-time work schemes and similar measures. The Council granted financial assistance under SURE to Greece in September 2020 and top-up support in April 2021 for a maximum of EUR 5 265 billion, which was disbursed by 25 May 2021. SURE is estimated to have supported approximately 35% of workers and 45% of firms for at least 1 month in 2020 and 15% of workers and 30% of firms in 2021, primarily in accommodation and food services, wholesale and retail trade, and manufacturing. Greece is estimated to have saved a total of EUR 0.51 billion on interest payments as a result of SURE’s lower interest rates.
The Commission provides tailored expertise to Greece under the Technical Support Instrument to help design and implement growth-enhancing reforms, including those planned in the RRP. Since 2015, Greece has received assistance through more than 200 technical support projects. Projects carried out in 2021 aimed for example to support the digital transformation of public administration by assisting with the design and communication of a comprehensive digital governance policy for the Greek public sector. The Commission also provided Greece with capacity building support to monitor, coordinate and evaluate its reforms and to help it prepare its RRP. Greece also receives ongoing support to implement specific reforms and investments planned in its RRP, such as modernising the legal framework of the public investment programme, and preparing a strategy on the quality of healthcare. In 2022, a new project will be launched to support sustainable urban mobility.
Greece also benefits from other EU programmes, such as the Connecting Europe Facility, which allocated EUR 615.7 million to specific projects on strategic transport networks, and Horizon 2020, which allocated EU funding of EUR 1 700.0 million.
Annex 4: Progress in the implementation of country-specific recommendations
Country-specific recommendations (CSRs) provide guidance to Member States on economic, budgetary, employment and structural policies. They aim to strengthen sustainable growth and job creation, while achieving or maintaining sound public finances, preventing excessive macroeconomic imbalances and fostering the twin transition.
The Commission assessed the 2019-2021 country-specific recommendations (CSRs) () addressed to Greece in the context of the European Semester. The assessment takes into account the policy action taken by Greece to date (), as well as the commitments in the Recovery and Resilience Plan (RRP) () At this early stage of the RRP implementation, overall 80% of the CSRs focusing on structural issues in 2019 and 2020 have recorded at least “some progress”, while 20% recorded “limited” (see Graph A4.1). Considerable additional progress in addressing structural CSRs is expected in the years to come with the further implementation of the RRP.
|
Graph A4.1:
Greece’s progress on the 2019-2020 CSRs (2022 European Semester cycle)
|
|

|
|
Source: European Commission
|
|
|
|
Table A4.1:
Summary table on 2019,2020 and 2021 CSRs
|
|

|
|
Source: European Commission
|
|
|
Environmental sustainability
Annex 5: Green Deal
The European Green Deal intends to transform the EU into a fair and prosperous society, with a modern, resource-efficient and competitive economy where there are no net emissions of greenhouse gases in 2050 and where economic growth is decoupled from resource use. This annex offers a snapshot of the most significant and economically relevant developments in Greece in the respective building blocks of the European Green Deal. It is complemented by Annex 6 on the employment and social impact of the green transition and Annex 7 for circular economy aspects of the Green Deal.
Greece’s greenhouse gas (GHG) emission intensity is still substantially higher than the EU average, and there is still major scope to decarbonise Greece’s economy. The country’s total greenhouse gas emissions (excluding land use, land-use change and forestry activities) have decreased since 1990, although less markedly than the EU average. Emissions per capita are slightly above the EU average. Greece is expected to overachieve its current 2030 emission reduction target under the EU Effort Sharing Regulation (-16%, with the ESR target proposed by the Commission in its Fit for 55 package being -22.7%). The scope for GHG emission reductions in the waste and transport sector is still significant. Greece's national energy and climate plan projects a further decrease of net removals in the land use and forestry sector by 2030. In its recovery and resilience plan (RRP), Greece allocates 37.5% of the available funds to climate objectives and outlines crucial reforms and investments to accelerate the transition to a more sustainable, low-carbon and climate-resilient economy. Greece met its 2020 renewable energy target and has an ambitious 2030 goal.
Greece is collecting high environmental tax revenues. As a share of total tax revenues as well as GDP, Greek energy and transport tax revenues are much higher than the EU average, and have remained fairly stable over time. In contrast, resource and pollution taxes are very low (). The share of expenditure on environmental protection in total government expenditure is higher than the EU average (Graph A5.1).
|
Graph A5.1:
Fiscal aspects of the green transition: Taxation and government expenditure on environmental protection
|
|

|
|
Source: Eurostat
|
|
Graph A5.2:
Thematic - Energy: Share in energy mix (solids, oil, gas, nuclear, renewables)
|
|

|
|
Source: Eurostat
|
Greece’s energy mix has been historically reliant on fossil fuels. In 2020, the share of natural gas in the gross inland consumption of energy reached 24%, while solid fuels and oil accounted for 9% and 50% respectively. With an ambitious national energy and climate plan, Greece has decided to decommission its lignite plants by 2028 (most by 2023) and almost double renewable energy by 2030, which reached 17% of final inland consumption of energy in 2020. As Greece intends to continue to use natural gas as a transitional fuel, by 2030, gas and renewables will increase their share in the energy mix, while coal will virtually disappear and oil will decline considerably.
In terms of biodiversity and ecosystem health, Greece presents a mixed picture. By 2021, 27.6% of the national land area of Greece was covered by Natura 2000 (EU average 18.1%), with Special Protection Areas (SPAs) classified under the Birds Directive covering 20% (EU average 12.3%) and Sites of Community Importance (SCIs) under the Habitats Directive covering 15% (EU average 13.8%) of the Greek territory. The latest assessment of the SCI part of the Natura 2000 network shows that Greece’s Natura 2000 network is now considered to be complete. Today, the Natura 2000 network covers 19.6% of the country's total sea area. Considering both Natura 2000 and other nationally designated protected areas, Greece legally protects 35.2% of its land areas (EU average 26%) and 4.6% of its marine areas (EU average 8%).
Air quality in Greece continues to be a serious concern. The latest available annual estimates by the European Environment Agency point to about 10 400 premature deaths attributable to fine particulate matter concentrations, 650 to ozone concentrations and 2 310 to nitrogen dioxide concentrations (). The emissions of several air pollutants have decreased significantly in Greece over the last years, while GDP growth continued. According to the latest projections (as submitted under Article 10(2) of the National Emission Reduction Commitments Directive) Greece expects to fulfil its emission reduction commitments for all air pollutants covered by the directive for 2020-2029 and for 2030 onwards. For 2020, exceedances above the EU air quality standards were registered for nitrogen dioxide (NO2) in one air quality zone and for particulate matter (PM10) in two zones. Furthermore, for several air quality zones the target values on ozone concentration are not being met.
The transition to a sustainable transport system remains a key challenge. Greece is well behind in the adoption of electric vehicles. The market for zero-emission passenger cars is low, mirrored by the lack of charging infrastructure and the fact that Greece has among the highest congestion rates in the EU. Investments and reforms included in the recovery and resilience plan aim to contribute to addressing these challenges, in particular through the installation of publicly accessible charging stations. The air quality issues noted above are also connected to transport. Furthermore, better use should be made of the rail connection between Athens and Thessaloniki to reduce the number of short haul flights between these two major cities. Finally, there are no zero or low emission passenger ships connecting the islands with the mainland.
|
Graph A5.3:
Thematic - Biodiversity: Terrestrial protected areas and organic farming
|
|

|
|
Source: EEA (terrestrial protected areas) and Eurostat (organic farming)
|
|
Graph A5.4:
Thematic - Mobility: Share of zero emission vehicles (% of new registrations)
|
|

|
|
Source: European Alternative Fuels Observatory
|
|
|
|
Table A5.1:
Indicators underpinning progress on the European Green Deal from a macroeconomic perspective
|
|

|
|
Source: Eurostat, JRC, European Commission, EEA, EAF
|
|
|
Annex 6: Employment and social impact of the green transition
The green transition not only encompasses improvements to environmental sustainability, but also includes a significant social dimension. While measures in this regard include the opportunity for sustainable growth and job creation, it must also be ensured that no one is left behind and all groups in society benefit from the transition.
The Greek recovery and resilience plan (RRP) outlines crucial reforms and investments for a fair green transition. In particular, several projects on employment support, education and skills have a strong green dimension. The new strategy for lifelong learning includes training programmes on green skills, targeted hiring incentives and private investments in climate-friendly business activities supported by the Loan Facility to support quality job creation in the green economy. The Just Transition Fund will finance reskilling programmes, employment incentives and social measures in the three territories most affected by climate transition, and the European Social Fund Plus (ESF+) will support green skills and help workers adapt to change, among other measures. An energy poverty action plan outlines targeted policy measures for economically-vulnerable households and measures to improve energy efficiency, as well as to promote the use of renewables in residential buildings. The integrated national energy and climate plan for Greece of 23 December 2019 sets a target of reducing energy poverty by 75% by 2030, compared to 2016 (when it affected 29.1% of the population). It considers the social, employment and skills impacts of a transition towards a carbon-neutral economy, particularly in the lignite-dependent regions, but proposes only a partial set of measures to address them.
The Greek economy has reduced its carbon footprint, which nonetheless remains sizeable, and the green economy provides strong potential for creating quality jobs. The greenhouse gas (GHG) emissions intensity of the Greek economy decreased by 12% between 2015 and 2020 (in terms of gross value added) - less than the EU average. It is now 20% above the EU average, with the average carbon footprint per worker at 16.13 tonnes of GHG emissions (against 13.61 in the EU) (see Graph A.6.1). Coal, lignite, and fossil fuel-based industries have been identified () as declining sectors. Especially for lignite, in the region of Western Macedonia (and notably in the Kozani prefecture where the largest mines and most power plants are located), lignite-based electricity production is the most important economic sector, accounting for over one third of regional GDP. This highlights the need to mitigate employment and social impacts with appropriate accompanying measures () (). Up- and reskilling are particularly important here (see Annex 15). Energy-intensive industries provide jobs to less than 1.2% of the total employed workforce, one of the lowest shares in the EU. The country does not have data on the environmental goods and services sector. Wind and solar energy potential as well as energy efficiency improvements offer further opportunities for green jobs (Eurofound, 2021).
Greece faces substantial challenges on the social dimension of the green transition, including access to essential transport and energy services, and energy poverty of low-income households. The share of the population in rural areas at risk of poverty decreased in the last 5 years but remains above the EU average (22.4% vs 18.7%) (). While the share of the population unable to keep their homes adequately warm decreased from 29.2% in 2015 to 17.1% in 2020, it remains twice as high as the EU average (8.2%). Lower-income groups are affected the most (see Graph A6.2), with the country being one of the worst performers in the EU for the poorest 20% of the population. Patterns in energy use vary across the population with the top 10% of emitters having around 4.5 times the carbon footprint of the bottom 50% (5.3 times in the EU).
Tax systems are key to ensuring a fair transition towards climate neutrality (). Greece’ revenues from total environmental taxes were stable between 2015 (3.83% of GDP) and 2019 (3.87%) and stood at 3.77% of GDP in 2020 (against 2.24% in the EU). The labour tax wedge for low-income earners () was also stable between 2015 and 2019 at around 32%, and decreased to 29.9% in 2021 when it averaged 31.9% in the EU (see Annex 18). Redistributive measures accompanying environmental taxation could have a positive impact, notably on the disposable income of households in the bottom 10% of the income distribution ().
|
Graph A6.1:
Fair green transition challenges
|
|

|
|
Source: Eurostat, world inequality database
|
|
Graph A6.2:
Energy poverty by income decile
|
|

|
|
Source: Eurostat EU-SILC survey (2020, 2019 for IT and DE)
|
Productivity
Annex 7: Resource efficiency and productivity
The efficient use of resources is key to ensuring competitiveness and open strategic autonomy, while minimising the environmental impact. The green transition presents a major opportunity for European industry by creating markets for clean technologies and products. It will have an impact across the entire value chains in sectors such as energy and transport, construction and renovation, food and electronics, helping create sustainable, local and well-paid jobs across Europe.
Recycling nearly doubled in 2015-2020. During this period, the share of material recycled to the overall material use has been significantly increased by 184% In 2020, about 5.4% of material resources used in Greece came from recycled waste materials, which is only about half of the EU average rate. However, some circular economy measures set out in the RRP should help the country close the gap.
Resource productivity has been growing steadily in recent years, which is an encouraging trend. Purchasing power per kilogram of material consumed increased significantly in 2015-2020, and current levels are just slightly below the EU average (2.14 vs 2.23).
A successful circular economy requires social and technological innovation across all value chains. Eco-Innovation is therefore an important enabling factor for the circular economy. Product design approaches and new business models can help to produce 'circular' innovations, thus creating new business opportunities. Greece ranked 17th (with a score of 102) in the 2021 EU Eco-Innovation Scoreboard, making it an 'average eco-innovation leader'. Greece scores below the EU average on all five components of the 2021 Eco-innovation index, namely eco-innovation activities, eco-innovation outputs, socio-economic, eco-innovation input and resource efficiency outcomes.
After a downward trend, municipal waste generation in Greece has started to increase in recent years, rising to 524 kg/year/inhabitant in 2019, although it remains relatively close to the EU average (502 kg/year/inhabitant). It indicates that Greece’s economic growth is not yet decoupled from its generation of waste. Greece disposes most of its municipal waste in landfills (78%), with only 21% being recycled (EU average 48%). A significant number of irregular and substandard landfills continue to operate in Greece and present serious risks for human health and the environment. Greece has adopted and notified the Commission of its updated national waste management plan (ESDA), which is under assessment, but has not yet notified its updated regional waste management plans.
|
Graph A7.1:
Economic importance and expansion of the circular economy - employment and value added in the circular economy sectors
|
|

|
|
Source: European Commission
|
|
|
|
Table A7.1:
Selected resource efficiency indicators
|
|

|
|
Source: Eurostat
|
|
|
Annex 8: Digital transition
The Digital Economy and Society Index (DESI) monitors EU Member States’ digital progress. The areas of human capital, digital connectivity, the integration of digital technologies by businesses and digital public services reflect the Digital Decade’s four cardinal points (). This Annex describes Greece’s DESI performance.
The Greek recovery and resilience plan (RRP) dedicates more than 23% of its allocation to measures supporting the digital transition, in particular boosting connectivity, improving the digitalisation of public services and promoting the digitisation of businesses.
Stepping up efforts to develop digital skills remains a priority for Greece. Just over half the population has at least basic digital skills, very close to the EU average. The share of ICT specialists in employment remains very low compared to the EU average, but the proportion of women among ICT specialists is above the EU average.
In the area of connectivity, Fixed Very High Capacity Networks (VHCN) coverage doubled in one year and 5G coverage has developed very fast. Despite progress made, in 2021, the percentage of households covered with VHCN was low compared to the EU average. By contrast, 5G coverage had reached the EU average and Greece scored very high (99%) in the 5G readiness indicator in 2021/22 (EU average 56%).
Digital technologies are slowly being integrated into business activities. Four out of 10 SMEs have a basic level of digital intensity. On the adoption of advanced digital technologies, enterprises in Greece are almost at the EU average for the adoption of big data, though they are below the EU average for cloud and artificial intelligence.
Greece is in the process of digitally transforming its public services and has made substantial progress with on-line public services. However, the results are not yet reflected in the indicators on digital public services for businesses and the general public, which remain far below the EU average, mainly because of the lack of cross-border services.
|
|
|
Table A8.1:
Key Digital Economy and Society Index Indicators
|
|

|
|
Source: Digital Economy and Society Index
|
|
|
Annex 9: Innovation
This Annex provides a general overview of the performance of Greece’s research and innovation (R&I) system.
In the 2021 edition of the European Innovation Scoreboard () Greece is a moderate innovation performer and faces challenges in reducing its gap with the EU innovation leaders. The country's total research and development (R&D) intensity reached 1.50% in 2020, which is still well below the EU average of 2.32%.
Greece has gradually improved its R&I performance, and its commitment to increasing investment in research is encouraging. Greece has steadily increased its R&D investment in the last decade (from 0.60% in 2010 to 1.50% in 2020), although it still continues to lag behind the EU average. Notably, public expenditure on R&D as percentage of GDP reached EU average levels in 2020. The increase in R&D investment has contributed to the increase of high-technology exports as a percentage of total manufacturing exports, from 8.5% in 2013 to 13.2% in 2020. Despite this progress, the still low intensity of R&D weighs on Greece’s growth potential and calls for improvements in the effectiveness of related investments to raise innovation performance and ensure sustainable growth. To tackle these key challenges, Greece's RRP includes targeted reforms and investments to increase public and private R&D spending, upgrade the country’s research infrastructures, increase the internationalisation of the Greek research ecosystem, and develop research collaborations.
The links between Greek academia and the productive sector remain weak. The low level of business enterprise expenditure on R&D as a percentage of GDP (0.69% vs an EU average of 1.52%) affects the capacity to strengthen stronger business-science links. Greece registers low total public sector support for business enterprise expenditure on R&D (0.064% of GDP in 2017 vs an EU average of 0.196%) and public expenditure on R&D financed by business enterprise has remained rather stagnant and scores below the EU average (0.041% of GDP in 2020 vs 0.054%). While Greek universities perform well on research output, this is not oriented to support the productive sector and is not used productively, as demonstrated by the relatively low number of patents (0.6 patent applications per billion GDP vs an EU average of 3.5).
|
|
|
Table A9.1:
Key research, development and innovation indicators
|
|

|
|
Source: European Innovation Scoreboard: https://ec.europa.eu/docsroom/documents/45916
|
|
|
Annex 10: Industry and single market
Productivity growth is a critical driver of economic prosperity, well-being and convergence over the long run. A major source of productivity for the EU economy is a well-functioning single market, where fair and effective competition and a business friendly environment are ensured, in which small and medium enterprises (SMEs) can operate and innovate without difficulty. Businesses and industry rely heavily on robust supply chains and are facing bottlenecks that bear a negative impact on firms’ productivity levels, employment, turnover and entry/exit rates. This may impact the Member States’ capacity to deliver on Europe’s green and digital transformation.
Greece's labour productivity level is increasing, but is still lower than the rest of the EU. After a considerable drop following the financial crisis, labour productivity has been increasing in Greece, from 98.7 in 2018 to 105.4 points in 2020 but is still lower than the EU average (108.6 points in 2020) ().
Access to finance remains difficult for many companies in Greece. Both loans and equity capital is lower than the EU average, and the percentage of SMEs whose banks loan applications were rejected is almost the double the EU average. In the last 2 years, equity seems becoming a bigger source of funding as the number of Greek SMEs that used equity capital in the last 6 months increased by 2.4%. The Loan Facility and related reforms under the recovery and resilience plan (RRP) will be instrumental. Late payments is another major difficulty for many firms (26%). Despite recent progress, the share of SMEs experiencing late payments in the last 6 months is higher than the EU average (54.9% vs 45%).
In public procurement, the percentage of bids from SMEs has increased considerably and the percentage of contractors that are SMEs has increased slightly. A new public procurement law was adopted in March 2021, and complemented in May 2021 by an action plan to implement a new national strategy for 2021-2025. Two of the action plan's measures - the digital transformation of public procurement processes and the professionalisation of public procurement services, will be implemented under the RRP.
On single market integration and compliance, Greece’s performance in terms of the number of EU directives transposed into national law is above the EU average, but transposition timelines vary. Greece is among the Members States with the highest number of infringement cases. Problematic sectors include environment, transport and waste management. The professional services regulatory restrictiveness remains high compared to the EU average.
|
|
|
Table A10.1:
Key Single Market and Industry Indicators
|
|

|
|
Source: See above in the table the respective source for each indicator in the column “description”.
|
|
|
Annex 11: Public administration
Good administrative capacity enables economic prosperity, social progress and fairness. Public administrations at all government levels deliver crisis response, ensure the provision of public services and contribute to building resilience for the sustainable development of the EU economy.
Overall, despite some progress achieved in recent years, public administration performance in Greece is relatively low (). Although the ability of the government to plan and coordinate policymaking has improved, it remains below the EU average. An impact assessment is required for every new draft law submitted to Parliament, but evaluations on actual implementation are not systematically carried out. While draft laws are systematically uploaded on a government platform, the consultation period is brief and usually inconsequential (Graph A11.1). The Greek recovery and resilience plan (RRP) aims to strengthen institutional resilience, for example through clear responsibilities between public administration levels. Policy planning and regulatory impact assessment will also be reinforced.
Greece’s administrative capacity faces challenges. The share of civil servants participating in adult learning and the share of public administration employees with tertiary education are both below the EU average. The RRP aims to build capacity and to upskill a significant proportion of civil servants, while modernising hiring procedures and reward systems for civil servants to increase motivation and effectiveness.
|
Graph A11.1:
Performance on evidence-based policy making indicators
|
|

|
|
Source: OECD (iREG indicators)
|
|
Graph A11.2:
Performance on the single market public procurement indicator
|
|

|
|
Source: Single market scoreboard 2020 data
|
Public financial management can be further improved. Despite a steady improvement, Greece’s performance in public procurement remains relatively low. This is due to inefficiencies in transparency, competition, efficiency and quality of information (Graph A11.2). In addition, the mandate of Greece's independent fiscal institution is narrower than that of other EU countries. The RRP will invest in digital tools to support public financial management, including procurement, enterprise resource planning, payment execution and the implementation of public investment projects. The governance of state-owned-enterprises will be strengthened.
The justice system continues to face efficiency and quality challenges. The time needed to resolve litigious civil disputes in first instance has continued to increase (637 days in 2019 vs 559 days in 2018) (no data are available for 2020). Meanwhile, e-justice can be further developed. On judicial independence, no systemic deficiencies have been reported ().
|
|
|
Table A11.1:
Public administration indicators – Greece
|
|

|
|
Source: ICT use survey, Eurostat (# 1); E-government benchmark report (# 2); Open data maturity report (# 3); Fiscal governance database (# 4, 9, 10); Labour Force Survey, Eurostat (# 5, 6, 8), European Institute for Gender Equality (# 7), Single Market Scoreboard public procurement composite indicator (# 11); OECD indicators for regulatory policy and governance (# 12).
|
|
|
Fairness
Annex 12: Employment, skills and social policy challenges in light of the European Pillar of Social Rights
The European Pillar of Social Rights provides the compass for upward convergence towards better working and living conditions in the EU. The implementation of its 20 principles on equal opportunities and access to the labour market, fair working conditions, social protection and inclusion, supported by the 2030 EU headline targets on employment, skills and poverty reduction, will strengthen the EU’s drive towards a digital, green and fair transition. This Annex provides an overview of Greece’s progress in achieving the goals under the European Pillar of Social Rights.
|
|
|
Table A12.1:
Social scoreboard for Greece
|
|

|
|
Source: European Commission
|
|
|
While the labour market has weathered the COVID-19 crisis well, strengthening the effectiveness of active labour market policies remains key to support employment, in particular of women, young people and vulnerable groups, such as people with a migrant background. After rising in the wake of the COVID-19 pandemic, the unemployment rate resumed its downward trend and reached 14.7% in 2021, the lowest level since 2010. Young people have been hit hard by the COVID-19 crisis and the share of those not in employment, education or training (NEET) has just returned to its pre-pandemic level. The NEET rate in the age group 25-29 (28.7% in 2020) is much higher than in the 15-24 age group (11% in 2021). The employment rate is increasing but still remains among the lowest in the EU for both men and women. Moreover, the gender employment gap of almost 20 pps poses a critical challenge. The disability employment gap is slightly above the EU average (27.7 pps vs 24.5 pps). The participation of children under the age of 3 in formal early childhood education and care fell from 40.9% in 2018 to 21.5% in 2020 (vs 32.3% in the EU), possibly also due to the COVID 19 pandemic. The recovery and resilience plan (RRP) will support the creation of new childcare facilities in municipalities and in large companies. Greece has strengthened its hiring subsidy scheme for private sector employment, and the European Social Fund Plus (ESF+) will provide significant funding for active labour market policies. Enhancing public employment services and providing tailor-made support to jobseekers will be key to ensure the effectiveness of these measures and to help Greece achieve the 2030 EU headline target on employment.
While Greece is a top performer in preventing early school leaving, its education system faces challenges. Greece managed to reduce the share of early leavers from education and training from 13.5% in 2010 to 3.2% in 2021. However, for the non-EU born, early school leaving (30% in 2021) is a considerable challenge. The low achievement rate among 15 year-old students is high (around one third) and the impact of students’ socio-economic background on school performance is among the strongest in the EU (see Annex 13). In this respect, the ESF+ will provide important support for inclusive education.
Skills have yet to catch up with labour market needs. Greece is one of few EU Member States where the employment rate of recent graduates is lower than the overall employment rate, suggesting difficulties in school-to-work transitions. Skills mismatches are pronounced and, while many tertiary graduates end up being overqualified for their jobs, vocational education and training remains an unattractive option for upper-secondary students. The proportion of adults aged 25-64 who participated in learning in the past 4 weeks is far below the EU average (3.5% vs 10.8% in 2020). A considerable share of adults state that they lack technical skills (47% vs an EU average of 28%) or general skills (38% vs 22%) to perform their work at the required level. The share of individuals with at least basic digital skills increased from 46% in 2017 to 52% in 2021 (EU average: 54%). The reform of the adult learning system planned in the RRP and the accompanying investments are expected to improve the quality and take-up of upskilling and reskilling programmes. Strengthening adult learning is key if Greece is to achieve the 2030 EU headline target on skills.
Risk of poverty in Greece remains among the highest in the EU but is declining. The share of people at risk of poverty or social exclusion decreased from 32.2% to 27.4% between 2017 and 2021 as a result of the economic recovery and social welfare reforms. The share is higher, though, among children (30.8% in 2021), and the share of children with severe material and social deprivation (19.6% in 2020) is among the highest in the EU. The poverty reducing impact of social transfers (other than pensions) has improved. However, the adequacy of the guaranteed minimum income scheme is lower than in most other EU Member States and gaps persist in access to social protection for non-standard forms of employment in general and self-employment in particular (respectively 44% and 29% of the working-age population in 2020). Self-reported unmet needs for medical care have been decreasing, but affordability of healthcare remains critical, with out-of-pocket payments accounting for 35% of total healthcare expenditure. Public expenditure on long-term care is significantly below the EU average (0.2% vs 1.7% of GDP in 2019), and there is no comprehensive strategy in place. The share of the population affected by excessive housing costs continues to be among the highest in the EU, despite a decrease of 7 pps between 2018 and 2020. Strengthened social policy action is needed if Greece is to achieve the 2030 EU headline target on poverty reduction. The ESF+ will provide substantial funding for combating child poverty and further improving access to social and healthcare services.
Annex 13: Education and skills
This Annex outlines the main challenges for Greece's education and training system in light of the EU-level targets of the European Education Area strategic framework and other contextual indicators, based on the analysis from the 2021 Education and Training Monitor
Greece’s education system is highly centralised. It lags behind the EU average and fails to meet EU targets on participation in early childhood education (in particular for children under the age of 4), basic skills, and public expenditure on education (particularly tertiary education).
Greece ranks last in the EU on participation in early childhood education and care (age 3+) with major challenges linked to affordability and quality. Greece has much higher participation rates for the 4+ age bracket than for the 3+. Mandatory pre-primary attendance was extended to include 4 year-olds, but implementation is difficult due to capacity constraints. An integrated policy approach (covering the continuum from 0-6 years) could lead to progress.
|
Graph A13.1:
Low achievement in reading by socioeconomic status, PISA 2018
|
|

|
|
Source: OECD (2019), PISA 2018
|
Greece recorded the largest drop in the share of early leavers from education and training in the last decade, and now has one of the lowest rates in the EU. Early school leaving is higher in rural areas (4.1%), but still well below the EU target of less than 9%.
Underachievement in basic skills remains high with considerable disparities by socio-economic and migrant status. Greece has the highest shares of low achievers in the EU in all three PISA tests. Almost half of the students from the lowest socio-economic quartile lack basic skills in reading compared to almost 1 in 7 in the highest quartile (figure A13.1). Similarly, about half of students with a migrant background are low achievers compared to 1 in 3 students without a migrant background. The performance gap between public and private schools is among the highest in the EU, corresponding approximatively to 2 years of schooling.
Teachers in Greece are highly educated but lack opportunities to develop their pedagogical competences. Education is valued highly in Greece, but it translates poorly into teacher education. Steps are being taken to improve the quality of school education by providing teachers with some autonomy and appraising performance. Regularising the large temporary teacher workforce with contracts that reward performance and provide career prospects, would raise teachers’ morale and teaching quality (). Teachers constitute an ageing workforce in Greece, with more than half the Greek teachers being set to retire within this decade.
Regional disparities in tertiary education attainment persist with a considerable urban-rural gap. The rate of people aged 25-34 with a tertiary degree is above the EU average. However, access of migrant children to post-secondary and tertiary education remains a challenge for the country as the integration of recently arrived migrants into education has so far primarily focused on schools. The internationalisation of the country’s higher education institutions needs particular action.
Public spending on education remains low. General government spending on education in 2019 remained below the EU average, both as a proportion of GDP (4.0% vs 4.7%) and of total general government spending (8.3% vs 10%), the latter being the second lowest in the EU. In contrast, private spending on education is high. Tertiary education is considerably underfunded. This situation may improve, partly thanks to new legislation adopted in January 2020 () that introduces performance-based funding in higher education based on objective criteria, starting from the 2021/2022 academic year.
An effective implementation of Greece’s national recovery and resilience plan could help address several of these longstanding challenges. Key measures focus on improving the education system, improving skills, the digitalisation of education, excellence in Greek universities, upgrading vocational education and training (VET), and supplying laboratory equipment to VET educational units.
|
|
|
Table A13.1:
EU-level targets and other contextual indicators under the European Education Area strategic framework
|
|

|
|
Source: Eurostat (UOE, LFS), OECD (PISA)
|
|
|
Annex 14: Health and health systems
Especially relevant in light of the ongoing COVID-19 pandemic, resilient healthcare is a prerequisite for a sustainable economy and society. This Annex provides a snapshot of the healthcare sector in Greece.
Life expectancy in Greece is above the EU average, although it fell by more than 3 months in 2020 due to COVID-19. By 17 April 2022, 2.67 cumulative COVID-19 deaths and 303 confirmed cumulative COVID-19 cases per 1 000 inhabitants were reported. Treatable mortality was 93.1 per 100 000 population in 2019 (EU average in 2017: 92.1). Premature deaths from ischaemic heart disease and cerebrovascular disorders (including stroke) accounted for 36% of treatable mortality.
|
Graph A14.1:
life expectancy at birth, years
|
|

|
|
Source: Eurostat database
|
Health spending relative to GDP in Greece was below the EU average in 2019. Spending per capita is around half the EU average, but spending on pharmaceuticals and inpatients is relatively high. Since 2015, spending increases have been small but steady. The COVID-19 pandemic prompted additional funding injections in 2020 to support the health sector. Public spending on health is projected to increase by 0.8 percentage points (pps) of GDP by 2070 (vs 0.9 pp for the EU) ().
|
Graph A14.2:
Projected increase in public expenditure on health care over 2019-2070 (AWG reference scenario)
|
|

|
|
Source: European Commission/EPC (2021)
|
Greece has the highest number of doctors per capita in the EU, but the lowest number of nurses. The vast majority of doctors are specialists. General practitioners (GPs) make up only 7% of doctors (EU: 26%). Ensuring an adequate GP supply remains a major challenge in strengthening primary healthcare. High consumption of antibiotics raises public health concerns over antimicrobial resistance.
Through its recovery and resilience plan, Greece plans to invest EUR 1.48 billion in healthcare (4.8% of the total). A broad range of reforms and investments are envisaged for strengthening many parts of the health system: public hospitals, primary care, mental health and addictions, public health, reimbursement of pharmaceuticals and community-based care. Many investments concern capital asset formation (new or refurbished energy-efficient facilities, and acquisition of medical equipment) and a sizeable share of investments will go towards the digital transformation of the health system.
|
|
|
Table A14.1:
List of key indicators, health
|
|

|
|
Source: Eurostat, except: * Eurostat Database and OECD, ** ECDC.
|
|
|
Annex 15: Economic and social performance at regional level
The regional dimension is an important factor when assessing economic and social developments in Member States. Taking into account this dimension enables a well-calibrated and targeted policy response that fosters cohesion and ensures sustainable and resilient economic development across all regions. Regional disparities remain significant in Greece with a noticeable difference between the capital and the southern regions on the one hand, and the northern regions on the other hand.
All Greek regions remain below 75% of the EU average in terms of GDP per capita. Greek regions have been catching up with the rest of the EU since the economic crisis, but GDP per head is still below 50% of the EU average in four regions, while it reaches 91% in the capital region (Attica). Average growth in GDP per person was negative for all regions in 2010-2019 and below the national average in a number of less developed regions. As a result, internal convergence in Greece did not advance. While unemployment rates are more than double than the EU average, there is a 10.2 pp difference between the unemployment in the best (Peloponnese) and least performing region (Western Greece). As half of the population and two thirds of the economy is concentrated in the capital region, significant regional disparities persist.
|
Graph A15.1:
CO2 emissions from fossil fuels per head, 2018 (Greece)
|
|

|
|
Source: European Commission
|
In 2018, productivity in Greece was below the EU average (at 71%). At the regional level, it ranges between 89% of the EU average in the capital region of Attica and 53% in East Macedonia, Thrace, while a further three regions remain below 60%.
Multiple factors affect development in the Greek regions, including: low connectivity between and within regions and limited roll-out of regional smart specialisation strategies. In three regions, less than 25% of the population has a tertiary degree, while employment in high-technology sectors and R&D expenditure are particularly low.
Greece has the 16th highest fossil CO2 emission intensity per person in the EU. Greek regions affected by the climate transition include West Macedonia, South Aegean and North Aegean, including specific carbon-intensive areas in Peloponnese region (Megalopoli, Tripoli, Gortynia and Oichalia). Concrete plans on social and regional development for the affected areas and communities are being rolled out, namely the relevant Territorial Just Transition plans. They will include upskilling and reskilling programmes for affected workers and measures to address the social consequences of the transition.
|
Graph A15.2:
Territories most affected by the climate transition in Greece
|
|

|
|
Source: European Commission
|
|
Graph A15.3:
Regional performance groups (2021)
|
|

|
|
Source: European Commission
|
The country shows a relatively low innovation performance. Most of the regions are emerging innovators, while Attica (99.75) and Crete (94.25) are closer to the EU average (100). ICT uptake is also below the EU average. In 2020, 53% of the population used the internet for their interactions with public authorities (vs an EU average of 56%).
Greek regions face significant challenges on access to health services. With a national average of 6.4% (EU: 1.8%), a significant 10% of citizens in East Macedonia, Thrace report foregoing medical consultations due to high costs, long travelling distances or waiting lists.
The unemployment rate is higher in the less developed regions of Western Greece (21.6%) and West Macedonia (19.7%). There are clear social disparities across regions, with Western Greece also having a high share of people at risk of poverty or social exclusion (42.4%). Between 2011 and 2019, the population in the capital region of Attica shrunk by 6.4%, while negative trends are observed in another nine regions. Net migration is negative in six NUTS2 regions, while it increased by 17.2% in the insular region of North Aegean.
All regions in Greece were affected by the COVID-19 pandemic, though to a varying degree. A high proportion of microenterprises, a low level of digital skills and strong dependency on tourism rendered regional economies vulnerable to the socio-economic consequences of COVID-19. The region of Crete faced the highest increase in unemployment rates in 2020 (+5.6 pp compared with 2019), while COVID-19's impact on tourism has been translated to higher unemployment in South Aegean and the Ionian Islands (where the tourism sector employs 66% and 48% of the active population, respectively). Regions also differ significantly in terms of excess mortality due to COVID-19, with higher rates recorded in East Macedonia, Thrace, Central Macedonia, West Macedonia (more than 10%), while in South Aegean and Crete it was less than 3%.
|
|
|
Table A15.1:
Selected indicators at regional level – Greece
|
|

|
|
Source: Eurostat
|
|
|
Macroeconomic Stability
Annex 16: Key financial sector developments
This Annex provides an overview of key developments in Greece's financial sector. Greece has a predominantly bank-based financial sector, characterised by a very high concentration rate and very low foreign ownership. The loan-to-deposit ratio has continued to decrease in recent years and it has remained well below the EU average, reflecting the gradual return of deposits since 2016, coupled with overall muted lending activity over this period, especially for households, while the extensive non-performing securitisations and sales have led to a further sharp drop over the last 2 years.
|
|
|
Table A16.1:
Financial soundness indicators
|
|
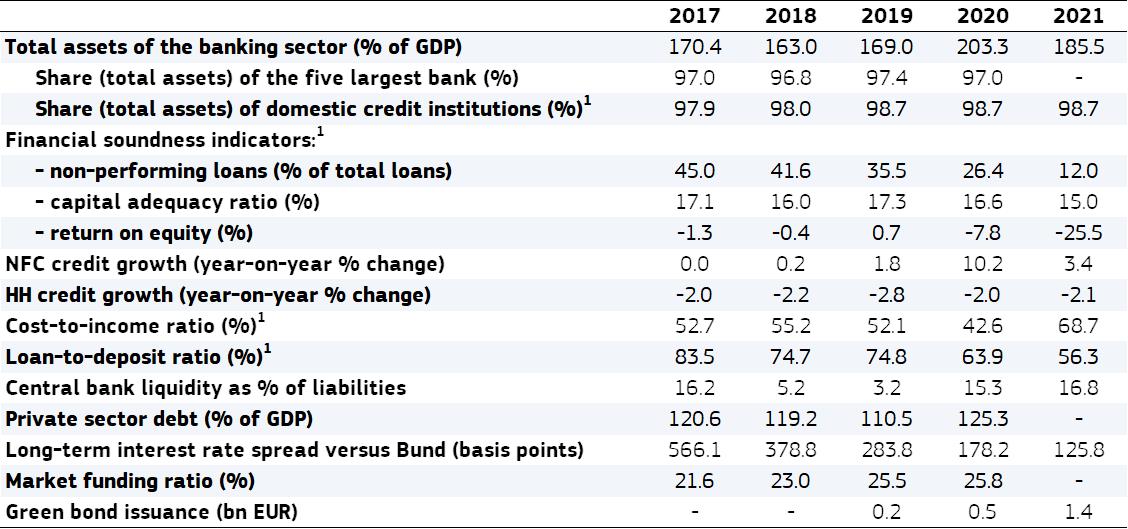
|
|
|
|
|
Banks have reduced legacy non-performing loans but the outlook remains challenging. The banking sector significantly reduced its stock of non-performing loans in 2021 to 12% of total loans compared to 26.4% a year earlier through a series of securitisations of unprecedented size under the Hercules scheme. Vulnerabilities for the banking sector remain as net inflows of non-performing loans continue, albeit at a limited rate. The securitisations under the Hercules scheme will allow banks to reduce their cost-of-risk going forward and free up space in their balance sheets for new, more profitable lending. However, securitisations have resulted in temporarily increased provisioning needs leading some systemic banks to post losses in the first 9 months of 2021. Overall, banks’ core profitability is still positive, albeit low. The impact of the securitisations on banks’ capital positions was partly offset by successful capital enhancing actions in 2021, but their total capital ratio remains one of the lowest in the EU. Moreover, its quality remains weak, due to the increasing share of deferred tax credits in the banks’ supervisory capital. Overall, the banks’ link to the Greek sovereign, through various channels, has been further strengthened partly as a result of the response to the pandemic crisis, as was the case in other Member States. Meanwhile, systemic banks have comfortable liquidity coverage ratios, on the back of strong deposit growth and abundant central bank liquidity (16.8% of total liabilities in Q3-2021).
Private debt rose sharply in 2020 and may burden the economic recovery. Although its cost of servicing remains so far at lower levels than in the recent past, it may represent a burden to economic recovery going forward. Moreover, a large amount of non-performing private debt that has exited the banks’ balance sheets remains in the economy, in the hands of servicers. The new insolvency framework is expected to help banks and servicers to offer viable long-term restructuring solutions to distressed companies and, where this is not feasible, facilitate firm exit and entry through simplified procedures and appropriate debt discharge periods that do not excessively punish business failure.
The Greek capital markets are underdeveloped and alternative sources of non-bank financing remain limited. The market-funding ratio has improved steadily since 2016 but remains low, reaching 25.8% in 2020 compared to an EU average of 50%. Initial public offering and bond issuance activity rebounded in 2021. This includes the issuance of green bonds which has started to gain momentum in 2021, albeit remaining below EU average levels. In the area of FinTech, a supervisory sandbox was launched by the Bank of Greece in June 2021, thanks to EU financing and technical assistance from the European Bank for Reconstruction and Development.
Annex 17: Macroeconomic Imbalance Procedure assessment matrix
The Macroeconomic Imbalance Procedure matrix presents the main elements of the in-depth review undertaken for the Greece in accordance with Article 5 of Regulation (EU) No 1176/2011 on the prevention and correction of macroeconomic imbalances, as summarized in SWD(2022)630 final (). For Member States selected in the 2022 Alert Mechanism Report it presents, separately for each source of imbalance and adjustment issue, the main findings regarding the gravity and the evolution of the identified challenges, as well as policy response and gaps.
Greece entered the COVID-19 crisis with vulnerabilities linked to high public debt, a high stock of non-performing loans and incomplete external rebalancing, in a context of low potential growth and high unemployment. The pandemic has lead to an increase in the government debt and external imbalances, while further progress has been made on reducing the stock of non-performing loans and a large impact on the labour market has been successfully averted.
With the pandemic gradually fading out, the macro-economic adjustment process has restarted. Public debt-to-GDP ratio is projected to decrease in 2022, yet the current account is projected to remain wide in 2022 due to a deterioration in the trade balance of goods, in view of the projected slowdown in the EU and the global economy as a whole after the military aggression in Ukraine. It is, however, expected to shrink in 2023, yet remain below its pre-pandemic level. The current account stands well below what would be needed to ensure a lasting improvement in the net international investment position. Despite substantial progress in the reduction of non-performing loans on the banks’ balance sheets, their non-performing loan ratio remains the highest in the Euro area, while the banks’ capacity to internally generate capital remains low.
The authorities continued to take relevant measures to facilitate economic adjustment, notably through reducing the legacy of non-performing exposures to the banks’ balance sheets, improving the insolvency regime, reforming the labour market and implementing a number of structural reforms to improve the business environment and support productivity growth. Greece has also embarked on the implementation of its recovery and resilience plan, which – if fully implemented – is projected to significantly contribute to addressing the above mentioned economic vulnerabilities.
For those reasons, and more generally on the basis of the elements of the in-depth review undertaken for Greece under Regulation (EU) No 1176/2011 on the prevention and correction of macroeconomic imbalances as summarised in the Staff Working Document (SWD (2022)630 final), the Commission has considered in its Communication “European Semester – 2022 Spring Package” (COM(2022)600 final) that Greece continues to experience excessive imbalances.
|
|
|
Table A17.1:
Assessment of Macroeconomic Imbalances matrix
|
|

|
|
Source: European Commission
|
|
|
Annex 18: Taxation
This Annex provides an indicator-based overview of Greece’s tax system. It includes information on the tax structure, i.e. the types of tax that Greece derives most revenue from, the tax burden for workers, and the progressivity and redistributive effect of the tax system. It also provides information on tax collection and compliance and on the risks of aggressive tax planning activity.
Greece’s tax revenues are around the EU average in relation to GDP, and the tax system is slightly less reliant on labour taxation while relatively more on growth-friendly tax bases. Greece’s tax revenues have been increasing in recent years and are now in line with the euro-area average. Since 2020, important steps have been made to improve the composition of tax revenues by reducing corporate and personal tax and social security contribution rates and improving tax collection, but challenges remain in all these areas.
|
|
|
Table A18.1:
Taxation indicators
|
|

|
|
Source: European Commission, OECD
|
|
|
Greece’s labour tax burden is around the EU average at various wage levels. The labour tax wedge for Greece in 2020 was around the EU average at various income levels, i.e. for single people at the average wage (100%) as well as at 50%, 67% and 167% of the average wage. Second earners at a wage level of 67% of the average wage, whose spouse earns the average wage, also face a tax wedge around the EU average, but they are taxed slightly more than single people at the same wage level. Despite relatively large tax revenues, in 2020 the tax-benefit system helped reduce inequality, as measured by the GINI coefficient, by less than the EU average.
Greece is continuing the digitalisation of the tax administration, which can help reduce tax arrears as well as cut compliance costs. Outstanding tax arrears declined by 13.4 pp. between 2018 and 2019 to 212.3% of total net revenue, but remained well above the EU27 average of 31.8%. However, in individual terms, there is a clear declining trend. More recent data on tax return e-filing rates in the Annual Report for Taxation reveal an encouraging trend (). The VAT gap (an indicator of the effectiveness of VAT enforcement and compliance) has declined significantly from 29% in 2018 to 25.8% in 2019. However, it remained well above the EU-wide gap of 10.5% (). Finally, the average forward-looking effective corporate income tax rates have decreased but remained above the EU average in 2020 (23% vs. 19.3%).
|
Graph A18.1:
Tax wedge indicators
|
|

|
|
Source: European Commission
|
Annex 19: Key economic and financial indicators
|
|
|
Table A19.1:
Key economic and financial indicators
|
|

|
|
Source: Eurostat and ECB as of 2022-05-02, where available; European Commission for forecast figures (Spring forecast 2022)
|
|
|
Annex 20: Debt sustainability analysis
This annex assesses fiscal sustainability risks for Greece over the short, medium and long term. It follows the same multi-dimensional approach as the 2021 Fiscal Sustainability Report, updated on the basis of the Commission 2022 spring forecast.
Table 1 presents the baseline debt projections. It shows the projected government debt and its breakdown into the primary balance, the snowball effect (the combined impact of interest payments and nominal GDP growth on the debt dynamics) and the stock-flow adjustment. These projections assume that no new fiscal policy measures are taken after 2023, and include the expected positive impact of investments under Next Generation EU.
Graph 1 shows four alternative scenarios around the baseline, to illustrate the impact of changes in assumptions. The ‘historical SPB’ scenario assumes that the structural primary balance (SPB) gradually returns to its past average level. In the ‘lower SPB’ scenario, the SPB is permanently weaker than in the baseline. The ‘adverse interest-growth rate’ scenario assumes a less favourable snowball effect than in the baseline. In the ‘financial stress’ scenario, the country temporarily faces higher market interest rates in 2022.
Graph 2 shows the outcome of the stochastic projections. These projections show the impact on debt of 2 000 different shocks affecting the government’s budgetary position, economic growth, interest rates and exchange rates. The cone covers 80% of all the simulated debt paths, therefore excluding tail events.
Table 2 shows the S1 and S2 fiscal sustainability indicators and their main drivers. S1 measures the consolidation effort needed to bring debt to 60% of GDP in 15 years. S2 measures the consolidation effort required to stabilise debt over an infinite horizon. The initial budgetary position measures the effort required to cover future interest payments, the ageing costs component accounts for the need to absorb the projected change in ageing-related public expenditure such as pensions, health care and long-term care, and the debt requirement measures the additional adjustment needed to reach the 60% of GDP debt target.
Finally, the heat map presents the overall fiscal sustainability risk classification (Table A20.2). The short-term risk category is based on the S0 indicator, an early-detection indicator of fiscal stress in the upcoming year. The medium-term risk category is derived from the debt sustainability analysis (DSA) and the S1 indicator. The DSA assesses risks to sustainability based on several criteria: the projected debt level in 10 years’ time, the debt trajectory (‘peak year’), the plausibility of fiscal assumptions and room for tighter positions if needed (‘fiscal consolidation space’), the probability of debt not stabilising in the next 5 years and the size of uncertainty. The long-term risk category is based on the S2 indicator and the DSA.
Overall, short-term risks to fiscal sustainability are high. The Commission’s early-detection indicator (S0) signals high short-term fiscal risks (Table A20.2). However, financing conditions should remain favourable, mainly since a large share of debt is held by the official sector. (Table 1).
Medium-term risks to fiscal sustainability are high. The two elements of the Commission’s medium-term analysis lead to this conclusion. First, the debt sustainability analysis (DSA) shows that government debt is projected to decline from around 186% in 2022 to about 131% of GDP in 2032 in the baseline (Table 1). However, the debt path is highly sensitive to possible shocks to fiscal, macroeconomic and financial variables, as illustrated by alternative scenarios and stochastic simulations (Tables A20.1 and A20.2). Moreover, the sustainability gap indicator S1 signals that an adjustment of 4.4 pps. of GDP of the structural primary balance would be needed to reduce debt to 60% of GDP in 15 years’ time (Table 2). Overall, the high risk reflects the high debt level and the high sensitivity to adverse shocks.
Long-term risks to fiscal sustainability are medium. Over the long term, the sustainability gap indicator S2 (at -3.2 pps. of GDP) points to low risks, while the DSA points to substantial vulnerabilities, leading to the overall medium risk assessment. The S2 indicator suggests that the projected decline in public pension expenditure relative to GDP will help stabilise debt over the long term despite budgetary pressures stemming from health care (Table 2).
|
Table A20.1:
Debt sustainability analysis for Greece
|
|

|
|
Source: European Commission
|
|
Table A20.2:
Heat map of fiscal sustainability risks for Greece
|
|

|
|
(1) Debt level in 2032: green: below 60% of GDP, yellow: between 60% and 90%, red: above 90%. (2) The debt peak year indicates whether debt is projected to increase overall over the next decade. Green: debt peaks early; yellow: peak towards the middle of the projection period; red: late peak. (3) Fiscal consolidation space measures the share of past fiscal positions in the country that were more stringent than the one assumed in the baseline. Green: high value, i.e. the assumed fiscal position is plausible by historical standards and leaves room for corrective measures if needed; yellow: intermediate; red: low. (4) Probability of the debt ratio exceeding in 2026 its 2021 level: green: low probability, yellow: intermediate, red: high (also reflecting the initial debt level). (5) The difference between the 90th and 10th percentiles measures uncertainty, based on the debt distribution under 2000 different shocks. Green, yellow and red cells indicate increasing uncertainty.
Source: European Commission (for further details on the Commission’s multi-dimensional approach, see the 2021 Fiscal Sustainability Report).
|


