Table of contents
1.Introduction
1.1 Background
1.2 Purpose and scope of the evaluation
1.3 Methodology (robustness and limitations)
2.What was the expected outcome of the intervention?
2.1 Description of the intervention and its objectives
2.1.1 Problems identified in the 2011 impact assessment
2.1.2 Objectives
2.1.3 Measures (activities and outputs) and expected achievements (results and impacts)
2.2 Point(s) of comparison
2.2.1 Environmental dimension
2.2.2 Economic and social dimensions
2.2.3. Governance dimension
2.2.4 Efficiency
2.2.5 Coherence
2.2.6 External events
2.3 Key performance indicators
3.How has the situation evolved over the evaluation period?
3.1 Environmental sustainability
3.1.1 Evolution of fish stocks
3.1.2 Evolution of discards
3.1.3 Evolution of the impact of aquaculture and fishing activities on the marine ecosystem
3.2 Socio-economic sustainability
3.2.1 Evolution of situation of the fleet and fleet capacity
3.2.2 Evolution of EU production
3.2.3 Evolution of profitability of sectors
3.2.4 Evolution of competitiveness
3.2.5 Evolution of the promotion of sustainability standards contributing to a level playing field with third countries
3.2.6 Evolution of the structuration of the sector through professional organisations
3.2.7 Evolution of accessibility, availability, affordability for EU consumers
3.2.8 Evolution of consumer awareness, understanding, confidence and ability to make informed choices
3.2.9 Evolution of employment
3.2.10 Evolution of wages
3.2.11 Evolution of safety
3.2.12 Evolution of coastal fishing activities
3.2.13 Evolution of main areas of European funding
3.3 Governance
3.3.1 Evolution of regionalised decision-making
3.3.2 Evolution of stakeholder involvement
3.3.3 Evolution of stocks under each management type
3.3.4 Evolution of data collection and scientific advice
3.3.5 Evolution of compliance by Member States
3.3.6 Evolution of control and enforcement by Member States
3.3.7 Evolution of the EU’s international presence and action
4.Evaluation findings
4.1 To what extent was the intervention successful and why?
4.1.1 Effectiveness
4.1.2 Efficiency
4.1.3 Coherence
4.2 How did the EU intervention make a difference and to whom?
4.3 Is the intervention still relevant?
5. Conclusions
5.1 What has worked or not?
5.2 Lessons Learnt
Annex I. Procedural Information
Annex II. Methodology and Analytical models used
Annex III. Evaluation Question Matrix
Annex IV. Overview of benefits and costs and table on simplification and burden reduction
Annex V. Stakeholders consultation - Synopsis report
Annex VI. Additional data, graphs and tables
Annex VII. Common Fisheries Policy Acquis
Annex VIII. Key Performance Indicators (KPIs)
Glossary
|
Term or acronym
|
Meaning or definition
|
|
AC
|
Advisory Council
|
|
AGRIFISH
|
Agriculture and Fisheries Council
|
|
AIDCP
|
Agreement on the International Dolphin Conservation Programme
|
|
BAR
|
Brexit Adjustment Reserve
|
|
BBNJ
|
Biodiversity Beyond National Jurisdiction
|
|
BMSY
|
Biomass (total weight) of a fish stock that enables the Maximum Sustainable Yield
|
|
CAOFA
|
Central Arctic Ocean Fisheries Agreement
|
|
CCAMLR
|
Commission for the Conservation of Antarctic Marine Living Resources
|
|
CCBSP
|
Convention on the Conservation and Management of Pollock Resources in the Central Bering Sea
|
|
CCSBT
|
Commission for the Conservation of Southern Bluefin Tuna
|
|
CECAF
|
Fishery Committee for the Eastern Central Atlantic
|
|
CFP
|
Common Fisheries Policy
|
|
CINEA
|
Climate, Infrastructure, and Environment Executive Agency
|
|
CITES
|
Convention on International Trade in Endangered Species of Wild Fauna and Flora
|
|
CMO
|
Common Market Organisation
|
|
CMS
|
Convention of Migratory Species
|
|
DCF
|
Data Collection Framework
|
|
DCR
|
Data Collection Regulation
|
|
DTMT
|
Data Transmission Monitoring Tool
|
|
DWF
|
Distant Water Fleet
|
|
EFARO
|
European Fisheries and Aquaculture Research Organisation
|
|
EFH
|
Essential Fish Habitats
|
|
EMFAF
|
European Maritime, Fisheries and Aquaculture Fund
|
|
EMFF
|
European Maritime and Fisheries Fund
|
|
EU
|
European Union
|
|
EUMOFA
|
European Union Market Observatory for Fisheries and Aquaculture products
|
|
FAD
|
Fish Aggregating Devices
|
|
FAMENET
|
Fisheries and Aquaculture Monitoring, Evaluation and Local Support Network
|
|
FAO
|
Food and Agriculture Organisation
|
|
FAP
|
Fishery and Aquaculture Products
|
|
FDI
|
Fisheries Dependent Information
|
|
FMSY
|
Fishing mortality rate that, if applied constantly, produces the Maximum Sustainable Yield (MSY) over the long-term
|
|
FPA
|
Fisheries Partnership Agreement
|
|
FRA
|
Fisheries Restricted Area
|
|
FTA
|
Free Trade Agreement
|
|
FTE
|
Full Time Equivalent
|
|
GFCM
|
General Fisheries Commission for the Mediterranean
|
|
GT
|
Gross Tonnage
|
|
GVA
|
Gross Value Added
|
|
I.
|
Impact
|
|
ICCAT
|
International Commission for the Conservation of Atlantic Tunas
|
|
ICES
|
International Council for the Exploration of the Sea
|
|
IL
|
Intervention Logic
|
|
ILO
|
International Labour Organisation
|
|
IMO
|
International Maritime Organisation
|
|
IOTC
|
Indian Ocean Tuna Commission
|
|
IUU Fishing
|
Illegal, Unreported and Unregulated Fishing
|
|
JR
|
Joint Recommendation
|
|
KPI
|
Key Performance Indicator
|
|
kW
|
kilowatts
|
|
LTMP
|
Long-Term Management Plans
|
|
LSF
|
Large Scale Fleet
|
|
MAPs
|
Multiannual Plans
|
|
MCRS
|
Minimum Conservation Reference Size
|
|
MCS
|
Monitoring, Control and Surveillance
|
|
MEA
|
Multilateral Environmental Agreement
|
|
MFF
|
Multiannual Financial Framework
|
|
MNSPAs
|
Multiannual National Strategic Plans for Aquaculture
|
|
MSE
|
Management Strategy Evaluation
|
|
MSFD
|
Marine Strategy Framework Directive
|
|
MSG
|
Member State Group
|
|
MSY
|
Maximum Sustainable Yield
|
|
MSY BTRIGGER
|
Fisheries management reference point within ICES MSY framework, that indicates the level of biomass used to trigger cautionary management actions
|
|
NAFO
|
Northwest Atlantic Fisheries Organisation
|
|
NASCO
|
North Atlantic Salmon Conservation Organisation
|
|
NEAFC
|
North-East Atlantic Fisheries Commission
|
|
NGO
|
Non-Governmental Organisation
|
|
NPFC
|
North Pacific Fisheries Commission
|
|
NWW
|
North Western Waters
|
|
OIG
|
Other Interest Group
|
|
OMC
|
Open Method of Coordination
|
|
OR
|
EU Outermost Regions
|
|
PMP
|
Production and Management Plan
|
|
PO
|
Producer Organisation
|
|
PSMA
|
Port State Measures Agreement
|
|
R.
|
Results
|
|
RCG
|
Regional Coordination Group
|
|
RDB
|
Regional Data Bases
|
|
RFMO/A
|
Regional Fisheries Management Organisation/ Agreement
|
|
SDG
|
Sustainable Development Goal
|
|
SEAFO
|
South East Atlantic Fisheries Organisation
|
|
SFPAs
|
Sustainable Fisheries Partnership Agreements
|
|
SIOFA
|
Southern Indian Ocean Fisheries Agreement
|
|
SPRFMO
|
South Pacific Regional Fisheries Management Organisation
|
|
SSCF
|
Small Scale Coastal Fisheries
|
|
SSF
|
Small Scale Fleet
|
|
STECF
|
Scientific, Technical and Economic Committee for Fisheries
|
|
SWD
|
Staff Working Document
|
|
SWW
|
South Western Waters
|
|
TAC
|
Total Allowable Catches
|
|
TCA
|
Trade Cooperation Agreement
|
|
TFC
|
Transferable Fishing Concessions
|
|
TFEU
|
Treaty on the Functioning of the European Union
|
|
TMR
|
Technical Measures Regulation
|
|
UN
|
United Nations
|
|
UNFSA
|
United Nations Fish Stocks Agreement
|
|
UNGA
|
United Nations General Assembly
|
|
VME
|
Vulnerable Marine Ecosystems
|
|
VMS
|
Vessel Monitoring System
|
|
WCPFC
|
Western and Central Pacific Fisheries Commission
|
|
WTO
|
World Trade Organisation
|
|
|
|
List of figures
Figure 1 - Intervention logic scheme of the environmental dimension
Figure 2 - Intervention logic scheme of the economic and social dimensions
Figure 3 - Intervention logic scheme of the governance dimension
Figure 4 - Trends in fishing pressure between 2003-2023
Figure 5 - Percentage of stocks above biomass reference points (BMSY/MSYBtrigger) in the NEA (121 stocks) and the M&BS (34 stocks)
Figure 6 - Percentage of stocks below the biomass reference point for impaired reproductive capacity (BLIM) in the NEA (92 stocks) and the M&BS (34 stocks)
Figure 7 - Vessel numbers and age of the active and inactive fleet.
Figure 8 - Number of registered EU fishing vessels from 2014-2023 (fleet size)
Figure 9 - Variation on revenue and profits for the EU active fleet.
Figure 10 - Apparent consumption and self-sufficiency rates for fishery and aquaculture products
Figure 11 - Landings in volume by management system 2014-2024
Figure 12 - Total number of surveys performed, indicating if they are mandatory (Y/N), coordinated internationally (Y/N) and not coordinated (N/N) by Regional Coordination Group and year
List of tables
Table 1 - Evolution of fish stock exploited at FMSY or below from 2012 till 2022
Table 2 - Number of species in all fisheries examined that show increasing, decreasing, or no trend of undersized catches, for the basins considered in Davie et al. (2025)
Table 3 - EMFF implementation per Union Priority
Table 4 - Number of decisions and recommendations agreed by the Regional Coordination Groups
Table 5 - Draft and final Regional Work Plans presented by year and Regional Coordination Group
Table 6 - Number of data calls and reporting obligations issued by end user
Table 7 - Summary of conclusions
1.Introduction
1.1 Background
The Common Fisheries Policy (CFP) is rooted in the EU Treaties, which confer exclusive competence to the EU for the conservation of marine biological resources under the CFP. The CFP was first formalised in 1970 and has since been adapted several times to address changing needs and challenges within the sector. Major reforms took place in 1983, 1992, 2002, and 2013. The current regulatory framework, Regulation (EU) No 1380/2013, entered into force in 2014 and introduced key changes through a maximum sustainable yield (MSY) approach for all managed fish stocks, a landing obligation to contribute to ending discards, a regionalised decision-making system, objectives and principles for external action, as well as a mechanism of policy coordination among Member States for the development of aquaculture.
1.2 Purpose and scope of the evaluation
This Staff Working Document (SWD) presents the findings of the evaluation of the 2013 CFP Regulation
. It assesses the performance of the Regulation in achieving its objectives and addressing emerging challenges. In doing so, it examines whether the current CFP Regulation remains fit for purpose, i.e. capable of delivering environmental sustainability that supports economic and social objectives in the fisheries and aquaculture sectors in the EU waters and beyond.
The CFP Regulation functions as a basic regulation which is complemented by a variety of legal acts that supplement specific elements of the CFP Regulation. This body of secondary legislation includes a large number of legal acts, including regulations, delegated and implementing acts, and guidelines. All these legal instruments, together with the dedicated fund (previous EMFF and current EMFAF), contribute to achieving the CFP Regulation’s objectives.
This evaluation focuses solely on the basic regulatory framework, assessing whether the CFP Regulation has achieved its objectives, identifying how stakeholders have been impacted by it and determining if it is still fit for purpose in today’s context. However, since many of the general principles and basic rules set out in the CFP Regulation were further developed in dedicated specialised regulations, this evaluation considers the links between these instruments, as well as their general contribution to the effectiveness, efficiency, relevance, coherence and EU added value of the CFP Regulation’s objectives. Annex VII compiles the full list of secondary legislation/instruments as well as a table explaining how the main acts are covered in this evaluation.
The evaluation encompasses the 11-year period (2014-2025)
since the entry into force of the 2013 CFP Regulation (1 January 2014). As per its provisions, it covers all EU waters, including the outermost regions, as well as areas beyond EU waters where EU fishing vessels operate, such as those covered by the Trade and Cooperation Agreement with the UK or by other bilateral agreements, those covered by Regional Fisheries Management Organisations (RFMOs) to which the EU is a party
, or those under the jurisdiction of third countries with whom the EU has concluded Sustainable Fisheries Partnerships Agreements
(SFPAs). The CFP Regulation also promotes sustainable aquaculture across inland and coastal waters.
This evaluation does not stem from a legal requirement in the CFP Regulation. It was formally announced through a
call for evidence
published on 20 June 2024, in the wake of the extensive feedback received from other EU institutions and stakeholders on the
fisheries policy package
presented in February 2023 and was then embedded as one of the key priorities of Commissioner Kadis’ mandate in his mission letter
.
The findings and conclusions of this evaluation will contribute to inform the Commission in deciding whether the basic regulation should remain unchanged or be amended to address any significant shortcomings or emerging needs. In case it is decided to amend the regulation, the evaluation will serve as the foundation for a future impact assessment to evaluate potential reform options. The evaluation will also feed into the Commission’s 2040 Vision for Fisheries and Aquaculture which will provide a strategic framework for fisheries and aquaculture policy development over the next 15 years.
1.3 Methodology (robustness and limitations)
The evaluation’s findings are based on research, data collection and analyses which included, among others:
·STECF scientific reports as well as other reports and studies commissioned by DG MARE, such as the study on the landing obligation, the study on the European Union’s fishing fleet, the study on the Common Market Organisation, the mid-term assessment of the implementation of the aquaculture strategic guidelines, amongst others. See Annex III for the full list of sources provided in the Evaluation Question Matrix (EQM).
·Three supporting studies commissioned to external entities and focusing on (1) the collection and analysis of quantitative and qualitative data for the evaluation; (2) the analysis of the results of the open public consultation; and (3) the conduct of interviews with stakeholders. The first study included the analysis of relevant datasets available through the Data Collection Framework (environmental, social and economic variables) and EUMOFA which were complemented by desk research.
·Extensive consultation also took place through a call for evidence (87 responses), open public consultation (362 responses), 66 individual interviews, a cost survey sent to Member States, a cost survey to operators via the Advisory Councils and interviews with the fisheries scientific community (ICES, STECF, EFARO).
For further details about the methodology see Annex II.
Available datasets and reports were used to provide robust evidence on the evolution of the situation over time. The situation was then compared to the expected outcomes laid out in the 2011 impact assessment, which acted as a counterfactual assessment of the situation. Given the complex interactions of the different tools in the policy, there were limitations in terms of determining unequivocal causal relations. These limitations are mentioned in chapter 4 where relevant.
Regarding the stakeholder consultation, substantial input was received and used in this document to illustrate where stakeholder concerns concurred with or differed from our findings.
As per the Better Regulations guidelines, the evaluation assessed the CFP Regulation against five criteria: effectiveness, efficiency, relevance, coherence and EU added value. The questions of the evaluation question matrix are based on these five criteria in order to ensure full coverage of the Better Regulation criteria (see Annex III).
2.What was the expected outcome of the intervention?
Since its first formalisation in the 1970s, the CFP Regulation has played a critical role in the EU's system for the conservation and management of fishery resources. It has sought to ensure a resilient activity through healthy resources. As such, the CFP Regulation pre-dated Sustainable Development Goal 14: "Life Below Water" which aims to conserve and sustainably use the ocean, seas, and marine resources for sustainable development. Nevertheless, its objectives are fully coherent with SDG 14.4 on sustainable fishing.
By the early 2010s, the social and political context was shifting towards increased attention and integration of environmental issues in the policy agenda. This shift bolstered the need to act against the continued decline of fish stocks while still balancing environmental, economic and social considerations.
The following section presents the logic of the CFP Regulation and its expected outcomes, based on the elements of the 2011 impact assessment. Notwithstanding the European Parliament and the Council’s amendments to the Commission proposal, most of the proposed measures were adopted, with the notable exception of transferable fishing concessions (TFCs). The impact assessment results therefore remain largely relevant.
2.1 Description of the intervention and its objectives
The following section describes the CFP Regulation’s logic, i.e. the reasoning and expected outcome underpinning the text. Given the depth and breadth of the basic regulation’s provisions, the intervention logic was broken down into 3 key dimensions: environmental (Figure 1), one of the three pillars of sustainability which covers an important part of the Regulation’s articles; social and economic (Figure 2) that constitute two other key pillars of sustainability and are intrinsically linked to one another; and governance (Figure 3), linked to many of the CFP’s challenges (especially post-Brexit).
2.1.1 Problems identified in the 2011 impact assessment
The CFP Regulation was introduced to rectify the shortcomings of the 2002 CFP Regulation
. These were outlined in a 2009 Green Paper
, which highlighted problems across all dimensions of the CFP: overfished stocks, which led to financially strained fleets despite significant public financial support, low-quality jobs, precarious conditions in coastal fishing communities and stagnating aquaculture production. An impact assessment
expanded on these findings in 2011 and exposed the following problems:
As far as environmental problems (Figure 1) were concerned, overfishing, defined as fishing at levels that exceed maximum sustainable yield fishing mortality rate (FMSY), was identified as the central problem in EU and international fisheries. This was driven by overcapacity, a complex and over-centralised policy approach and unclear prioritisation of the different CFP objectives. Relative stability
, the high level of discards (returning unwanted catches into the sea), poor compliance and insufficient scientific and economic data/advice exacerbated the problem. At international level, Fisheries Partnership Agreements (FPAs) did not seem to be sufficiently linked with sustainable fishing in third countries due to economic access objectives often outweighing sustainability goals and lack of up-to-date stock assessments. In RFMOs, overexploitation remained a key challenge driven by overcapacity, lack of robust data and weak compliance and control.
The assessment stressed that all other problems were closely tied to the lack of environmental sustainability.
Regarding economic and social dimensions (Figure 2), different elements were identified.
Poor economic sustainability was identified as a major concern, with declining performance indicators for many fleet segments and ancillary services. This was driven by the persisting structural imbalance of the fleet (overcapacity), biomass decline affecting landings, high and volatile costs (fuel), dependence on public support, weak market power and inefficient governance.
While processing and aquaculture performed better than the catching sector in terms of revenues, aquaculture production stagnated. Additionally, public financial support failed to improve economic performance. The Common Market Organisation (CMO) in fishery and aquaculture products, the CFP’s market instrument, was found to have a marginal impact on prediction and management of market fluctuations and unexpected shocks, and a limited impact on competitiveness due to lack of organisation of the sector. Overall, it was considered a complex framework resulting in untapped market potential. The poor economic performance of the catching sector led to deviations from scientifically recommended total allowable catches (TACs), resulting in non-compliance and exacerbating overfishing.
Poor social sustainability was another key concern, illustrated by declining employment, especially in the catching sector. Key drivers for this situation included the structural imbalance of the fleet leading to poor economic performance and low wages, as well as poor working conditions (high safety risks with lack of sufficient professional training and re-training and weak social protection) resulting in an unattractive sector for younger generations of local fishers. This decline in employment contributed to the decline of certain fisheries-dependent coastal communities.
Concerning governance (Figure 3), the impact assessment underlined the complexity of the CFP framework, which was driven by centralised micromanagement, poor data and scientific base and weak enforcement culture and accountability of industry. Fishers had to deal with overlapping and sometimes contradictory provisions scattered across different legal texts, which were further complicated by derogations or exemptions granted to certain Member States or vessels. At international level, RFMOs were considered to underperform due to various factors, such as lack of robust governance, lack of reliable and timely data, and insufficient monitoring, control and enforcement of rules, while FPAs lacked relevant rules on funding and key governance principles.
Finally, the lack of prioritisation of the three dimensions of sustainability (environmental, economic and social) incentivised policy decisions based on short-term economic and social considerations, at the expense of long-term environmental sustainability.
In addition, external factors such as pollution, climate change, and the increased competition for maritime space with activities other than fishing and aquaculture, created additional challenges. Moreover, potential impacts of climate change on the abundance and spatial distribution of species, risked creating winners and losers among coastal communities and fleets, further complicating resource management.
2.1.2 Objectives
To address these problems, the CFP Regulation includes a comprehensive set of objectives: many derive from the proposal itself while others were introduced during the negotiations with the EU co-legislators. The Regulation maintains environmental, social and economic dimensions of sustainability as its core objectives in Article 2(1). Principles of good governance (Article 3) complete the core objectives of Article 2.
It is important to note that the Regulation only provides measurable and time-bound targets in relation to MSY. Even though the 2011 impact assessment included measurable socio-economic expectations in its different options, the co-legislators chose to adopt broader, non-specific wording to allow for the necessary flexibility on these topics. The Key Performance Indicators (KPIs) presented hereafter (see Annex VIII) are partly based on the impact assessment’s expectations and provide one possible translation of the CFP Regulation objectives into more operational criteria, including for socio-economic and governance objectives.
Environmental objectives (Figure 1) aim to ensure that fishing and aquaculture activities are environmentally sustainable in the long-term, notably through the restoration or maintenance of populations of harvested species above levels which can produce Maximum Sustainable Yield (MSY)(fig.1, Annex VI). In order to reach that objective, the MSY exploitation rate (‘FMSY’) was to be achieved by 2015 where possible and, on a progressive, incremental basis at the latest by 2020 for all stocks. Any fishing mortality below FMSY is theoretically considered to ensure that the stock biomass remains high enough to reproduce and to contribute to maintain fish populations above MSY A stock with biomass below MSY is considered under-productive leading to lower future yields. The CFP Regulation mandates the gradual elimination of discards, on a case-by-case basis, through avoiding and reducing unwanted catches and through ensuring that unwanted catches of species subject to catch limits and, in the Mediterranean, also subject to minimum sizes are landed (landing obligation). Improved data availability, scientific advice (addressed under governance issues) and coherence with EU environmental legislation are strengthened to increase the environmental dimension sustainability. The EU’s fishing activities outside EU waters are based on the same principles and objectives as within the EU, to contribute to sustainable fishing activities, including through active support to international efforts to eradicate Illegal, Unreported and Unregulated (IUU) fishing and advancing scientific knowledge in RFMOs and SFPAs.
Economic objectives (Figure 2) focus on creating conditions for an economically viable and competitive fishing capture and processing industry, without overexploiting marine biological resources (via the FMSY exploitation rate), including land-based fishing-related activities, as well as promoting the development of sustainable aquaculture activities. The CFP Regulation aims for an efficient and transparent internal market for fishery and aquaculture products, ensuring level playing field on the EU market. It introduces a dual focus on consumers and producers and, where necessary, the best use of unwanted catches, without creating a market for catches under the minimum conservation reference size. It also considers the specific case of small-scale producers. The EU’s external fisheries policy (the EU’s fishing activities outside EU waters) should enhance the economic viability of EU fleets and promote employment within the EU.
Social objectives (Figure 2) centre on ensuring a fair standard of living for those dependent on fishing activities, with explicit reference to promoting coastal fishing activities. The CFP Regulation also includes provisions on the promotion of sustainable EU aquaculture activities, contributing to food security and supplies as well as supporting growth, diversification and improvement of the quality of life in coastal and inland areas.
Governance principles (Figure 3) expand on existing principles of good governance while maintaining the core principles of decision-making based on best available scientific advice and broad stakeholder involvement. A specific decision-making process is introduced to provide proper consideration for regional specificities on conservation measures (Article 18). The need for improved control and enforcement is reaffirmed. Internationally, while seeking access to non-EU waters for the EU fleet, the Regulation also aims at strengthening governance, scientific base, performance and compliance in RFMOs and in arrangements on fish stocks shared with non-EU countries, as well as increasing the capacity of third countries to manage and monitor their fisheries resources sustainably, in particular in the context of SFPAs.
2.1.3 Measures (activities and outputs) and expected achievements (results and impacts)
In terms of impacts, the sustainability of fisheries resources and aquatic ecosystems (Impacts I and II) is considered to be the necessary underpinning for long-term economic competitiveness, fair living conditions and sustained employment, as well as the continued availability of sea food supply from fisheries and aquaculture (Impacts III, IV and V). Achieving these impacts also depends heavily on efficient and inclusive decision-making as well as robust control and compliance, which are part of a sound governance framework (Impacts VI and VII). The CFP Regulation introduces a range of measures to reach these objectives.
To achieve the objective of environmental sustainability, the CFP Regulation lays out different measures. Taken together, they are intended to ensure the long-term conservation and sustainable exploitation of fish stocks (I.I) and to contribute to the protection of their ecosystems (I.II) within and beyond EU waters.
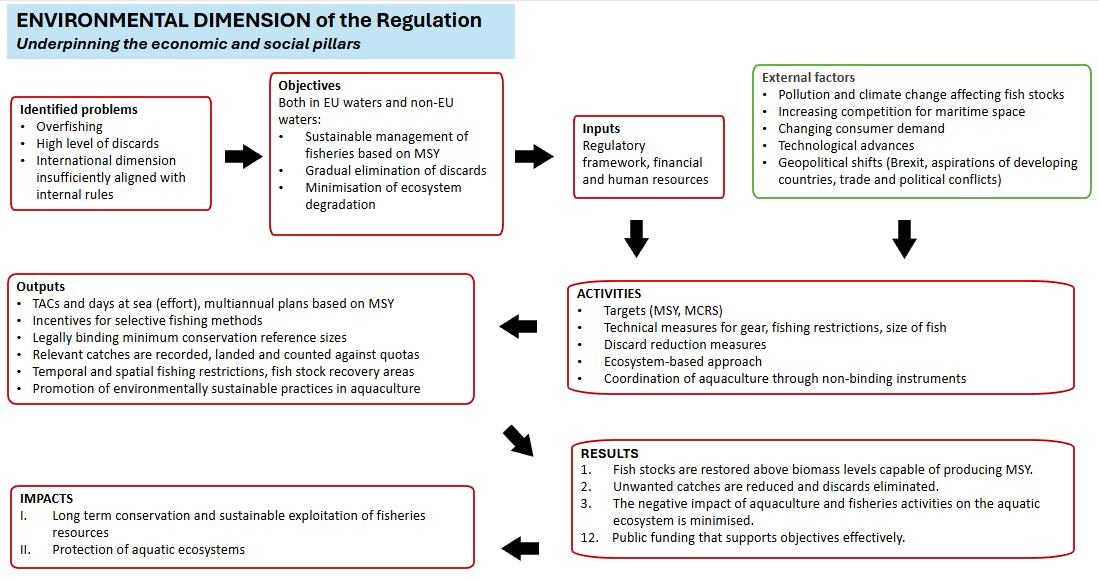
Figure 1 - Intervention logic scheme of the environmental dimension
The long-term conservation and sustainable exploitation of stocks (I.I) hinges on the introduction of quantifiable targets, namely the concept of Maximum Sustainable Yield exploitation rate (FMSY) (R.1) based on the best available science. The “science of MSY” thus becomes a key component of the policy. This shift is central to the determination of fishing opportunities and becomes a key element of the multiannual plans (MAPs).
Another key element is selectivity (R.2) to incentivise fishers to use techniques (gear, devices) that avoid or minimise unwanted bycatch or juvenile fish as well as to eliminate discarding practices. A mandatory ‘landing obligation’ is introduced - which requires all catches subject to catch limits and, in the Mediterranean, also catches of species which are subject to minimum conservation reference sizes to be landed - alongside existing technical measures and related provisions in multiannual plans.
Other measures aim at protecting the aquatic ecosystems (I.II), which is key for fishing and aquaculture resources. The ecosystem-based approach, introduced in the 2002 CFP Regulation, to minimise the degradation of the marine environment from fishing and aquaculture activities (R.3) is reinforced through provisions to ensure specific coherence with EU environmental legislation. This is achieved through the introduction of temporary or permanent protected areas (fish stock recovery areas/closures), incentives for operators using techniques with a reduced environmental impact (on fish stocks and sensitive species and sensitive habitats) and multi-annual national strategic plans for aquaculture (MNSPAs).
Regarding economic and social objectives, the CFP Regulation focuses on measures that are expected to improve the economic performance of the sectors (I.III), contribute to long-term food security (I.IV) and provide the necessary underpinning for improved livelihoods of coastal fisheries, and, in the case of aquaculture, diversification and improvement of the quality of life in coastal and inland areas (I.V). These overarching impacts are dependent on different elements.

Figure 2 - Intervention logic scheme of the economic and social dimensions
One expected result is improved profitability and competitiveness (R.4A), which relies on the allocation of fishing opportunities in a transparent, stable and fair manner, and an efficient market, as well as measures ensuring a stable and enduring balance between the fishing capacity and available fishing opportunities.
The core principles of the 2002 CFP Regulation regarding fishing opportunities are maintained (relative stability, access to waters, national choice for allocation of fishing opportunities). One key element of the 2011 Commission proposal, a new system of mandatory transferable fishing concessions (TFCs) to regulate the market and incentivise capacity balance, was not however maintained in the regulation adopted by the EU co-legislators
. Instead of this mandatory requirement, Member States were given the possibility to adopt TFCs on a voluntary basis while a clear prohibition to exceed fishing capacity ceilings as of 2014 was introduced, as well as detailed provisions on the assessment of balance between fishing capacity and fishing opportunities (see Addendum 1, Annex VI).
The basic principles of the Common Market Organisation in fishery and aquaculture products are fully embedded in the CFP Regulation. The principles are revised to improve the efficiency of its organisation, thus contributing to increased competitiveness and fairer prices along the supply chain. The development of the aquaculture sector in the EU is guided by the Commission’s Strategic Guidelines for a more sustainable and competitive EU aquaculture. These guidelines form the basis of the multi-annual national strategic plans for aquaculture (MNSPAs), which aim to develop aquaculture activities and production
Economic measures linked to economic performance in fisheries and aquaculture are also construed as the main means to achieve social objectives, namely improved livelihoods of coastal fisheries, understood as stable employment opportunities and fair wages (R.4B). In the case of aquaculture, the social objectives laid down in the CFP Regulation are diversification and improvement of the quality of life in coastal and inland areas.
Another expected result is the promotion of a level-playing field for EU operators (R.5). This relies notably on transparent and fair allocation of fishing opportunities, through arrangements on fish stocks of common interest with coastal states, SFPAs, RFMOs and diplomacy promoting EU standards (R.5). Marketing standards, consumer information, and market intelligence contribute to the transparency required for achieving a level playing field. It is also very dependent on proper control and enforcement (see R.10 under the governance section).
A final expected result involves the stability of markets and resilience to external shocks (R.6), while the fourth element focuses on the diversification of food supplies, development of verifiable information and responsible consumption (R.7). Both elements depend on measures laid out in the revised CMO Regulation which establishes a simplified market-oriented policy that introduces production and marketing plans for producer organisations to better seize market opportunities and implement the CFP objectives on the ground. Meanwhile, marketing standards, consumer information and market intelligence aim to establish common rules on the market, better-informed consumers to drive responsible consumption and support sector stakeholders’ strategies and policymaking. Outside the framework of the CMO Regulation, resilience to external shocks is supported inter alia through compensation for temporary and permanent cessation of vessels, as well as crisis measures for disruptions resulting from events such as the COVID-19 pandemic and the war of aggression against Ukraine.

Figure 3 - Intervention logic scheme of the governance dimension
Regarding governance principles (Figure 3 above), the CFP Regulation focuses on measures for a clear and efficient system of decision-making (I.VI) that allows the EU to lead by example internationally (I.VII). This is achieved through decisions based on best available science and consultation with stakeholders (R.8), governance adapted to local realities within the EU (R.9), proper compliance and enforcement (R.10), and strengthened capacities, performance and governance of RFMOs and of third countries through SFPAs at international level (R.11).
Measures to ensure stakeholder involvement and decisions based on scientific advice (R.8) include a harmonised framework for data collection (DCF), the formalised consultation of scientific bodies, as well as of the eleven Advisory Councils, four of which were newly established. Science-based decision-making is also actively supported at international level, in RFMOs and SFPAs. This complements the measures to take local realities into account (R.9) such as the new mechanism to decentralise decision-making through joint recommendations (JRs) for the conservation policy, whereby Member States collaborate to develop and suggest measures to the Commission, with the input of Advisory Councils (ACs), as well as the shift towards fewer multiannual plans that cover more stocks.
The CFP Regulation provides the basis for other instruments to strengthen compliance, control and enforcement within and beyond EU waters (R.10). These rely on a dedicated EU system for control, inspection and enforcement (Control Regulation); a system to combat illegal, unreported and unregulated fishing globally (IUU regulation); an expert group on compliance; and the conditionality of financial assistance to Member States, operators and third countries: only by complying with the rules of the CFP, would they be able to receive financial assistance (R.12).
This dimension also includes provisions on the EU’s role in international fisheries governance (R.11). In RFMOs, the EU seeks to lead the process of strengthening their performance regarding the conservation and management of marine living resources under their purview. In addition, the EU promotes robust science to underpin decision-making, and a culture of compliance based on effective monitoring, control and surveillance tools and contributes to combatting IUU fishing at regional and global levels. SFPAs include a legal, environmental, economic and social governance framework for EU fishing activities in third country waters, ensuring that the agreements are of mutual benefit. Another instrument for the external dimension allows the identification and use of appropriate measures regarding third countries that allow non-sustainable fishing.
All of these different dimensions are supported by a dedicated EU fund (EMFF then EMFAF) through shared, direct or indirect management (R.12).
In a nutshell, the CFP Regulation conservation measures aim to rebuild and maintain fish stocks at a healthy status and contribute to the protection of aquatic environment in the long-term by minimising the negative impacts of fishing and aquaculture activities on the marine biodiversity and ecosystems. They also aim to optimise yields in the medium- to long-term to lead to increased income and profitability for the fishing industry and contribute to food security, including through the sustainable growth of aquaculture. This applies within and outside the EU. These benefits should extend beyond the economic dimension: by securing business stability, the CFP Regulation also aims to strengthen the social fabric of coastal communities (fishers, fish farmers, processors, auction houses, etc.), providing stable livelihoods and preserving cultural traditions tied to fishing, and diversifying employment. Minimising damages to and avoiding degradation of marine ecosystems is not just an environmental necessity but a long-term investment for resilient and profitable fishing and aquaculture sectors. The success of these measures depends heavily on efficient, science-based and inclusive decision-making, sufficient financial support, as well as robust control and compliance measures.
2.2 Point(s) of comparison
The following section outlines the expected outcomes as presented in the 2011 impact assessment, with the exception of status of stocks (see section 2.2.1). They have been re-arranged around the three intervention logics presented above. These outcomes provide a key counterfactual point of comparison for the evaluation complemented by trends over time, which will be presented in chapter 3. The full list of indicators used to assess the different elements are listed in the Evaluation Question Matrix in Annex III.
2.2.1 Environmental dimension
The CFP Regulation provides a clear target related to the status of stocks, which differs from the projections included in the impact assessment: in order to restore and maintain fish stocks above biomass levels capable of producing maximum sustainable yield (BMSY), the maximum sustainable yield exploitation rate (FMSY) is to be achieved by 2015 where possible and by 2020 at the latest for all stocks. The impact assessment further explains that the way in which these stocks reach FMSY will greatly depend on the rate at which information improves to reduce uncertainty and deliver conclusive stock assessments and scientific advice. For not assessed or poorly assessed stocks to move to FMSY, it would be necessary to improve data collection, develop new or strengthen existing stock assessments to manage fish stocks in line with MSY.
Increased funding of RFMOs and SFPAs for strengthening data collection and scientific processes would assist in closing gaps in knowledge, improve stock assessments and underpin science-based decisions. This would help ensure that most RFMO stocks reach FMSY by 2020 at the latest.
By decoupling SFPAs sectoral support from payments for access rights, the reform would improve the sustainability of third countries' fishing activities, including through better funding for partner countries in monitoring, control, and surveillance (MCS), and research programs to address data necessary for identifying surplus for targeted stocks.
2.2.2 Economic and social dimensions
Net profit margin was expected to be multiplied by 3.5 by 2022 owing to the achievement of the FMSY target. Income would improve steadily from 2012 onwards, eventually increasing by 14%-15% in 2017 and 24% in 2022. This increase in income, along with changes to fleet structure, would result in an 89-90% increase in Gross Value Added (GVA) by 2022 (57-58% by 2017), 13-14% increase in revenue over break even revenue and a 14-15 percentage points increase in return on investment, reflecting the opportunity cost of investing in a high-risk sector.
Other economic indicators would also see an improvement, although there would be short term (1-2 year) reductions in some indicators as catches would initially be reduced while stocks rebuild. The Small-Scale Costal Fisheries (SSCF) sector would perform best in general and remain very profitable, despite the relatively low effort per vessel. The weakest improvements would be obtained by the 24-40m segment. The 12-24m segment performance would correspond to the average, whereas that of the >40m would exceed the average but remain below the SSCF.
Implications for the processing sector, in particular to the primary processing sector, would be positive, with the increase in catches. GVA would increase by 16% in 2017 and by 26% in 2022.
Regarding overcapacity, since the main tool for managing overcapacity (TFCs) was not adopted and most previous provisions maintained with some additional elements regarding capacity ceilings, the expected outcome should logically be situated between the status quo scenario of 15.1% fleet decrease and the chosen scenario for the proposal (1A) of 17.7% fleet decrease by 2022.
Employment was expected to continue to decline in the catching sector, decreasing by 15-16% in 2017 and by 22-23% in 2022. Crew wages would increase by 73-76% in 2017 and 125-131% in 2022 and improve the attractiveness of the sector. The largest vessels would see a small increase in employment per vessel. This would be a result of increasing fishing opportunities accompanying the reduction in the fleet at the same time as increasing catches. This would be positive in safety terms as it appears that many vessels go to sea short-handed, which presents an increased safety hazard.
As for primary processing, as stocks and catches increase in the long-term, an increase in processing employment would occur.
Regarding aquaculture, the growth of the sector, supported by improved coordination, would contribute to maintaining employment while enhancing efficiency through innovation.
Decoupling of funding in SFPAs would enable better alignment with other EU instruments, by allowing the EU to respond more promptly to weaknesses in supporting implementation or human rights violations, without terminating agreements.
2.2.3. Governance dimension
There should be a significant improvement in governance resulting from the coordinated regional approaches by Member States. Among other things, it should improve the basis for management plans. The increased industry involvement in the choices for implementation should increase acceptance by all stakeholders, which in turn should also improve compliance. The simplification of the legal framework through one basic Regulation covering all pillars and fewer secondary regulations would also increase compliance.
In RFMOs, the EU would focus on improving their performance, through capacity building, particularly for scientific data and advice, as well as by reinforcing monitoring, control and surveillance tools and strengthening compliance processes.
In SFPAs, sharing of the costs of access to third country waters between public and private actors while increasing the EU financial contribution to sectoral support in partner countries would allow EU funds to focus more on reinforcing scientific base of fisheries management, monitoring, control and surveillance, as well as development policy goals.
2.2.4 Efficiency
Improved governance would be a key pillar of improved efficiency (see 2.2.3). For instance, the 2011 impact assessment considered that the transfer of the FPAs’ cost of access to vessel owners might entail simplification of administrative procedures. However, management costs were expected to significantly increase with the requirement for better scientific advice.
2.2.5 Coherence
The 2011 impact assessment and CFP Regulation identified two important areas requiring greater coherence: environment and development policy.
FMSY, ecosystem approach to fisheries management, the landing obligation and the creation of a new provision to ensure coherence with environmental legislation are key tools that were expected to ensure greater coherence with EU environmental policy, specifically contributing to the achievement of Good Environmental Status (GES). In the fisheries sector, this would materialise through improved status of stocks as explained under point 2.2.1 and through reduction and mitigation of negative impacts of fishing activities on marine biodiversity and ecosystems.
Regarding coherence with development policy, the uncoupling of sectoral support from access costs in FPAs would enable sectoral support to be aligned more closely with other EU development instruments, to support the development needs of partner countries in the area of fisheries, while promoting key EU standards such as the respect for human rights.
2.2.6 External events
Systemic critical events took place during the evaluation period whose impact needs to be taken into account, namely Brexit as of 2021, the war of aggression against Ukraine, the COVID-19 pandemic and major geopolitical changes at global level.
2.3 Key performance indicators
The supporting study and evolution used the indicators presented in the EQM in Annex III. Annex VIII presents a selection of key performance indicators (KPIs) from the EQM and provides, where available, baseline data, expected outcomes and observed value between 2014 and 2024.
3.How has the situation evolved over the evaluation period?
3.1 Environmental sustainability
3.1.1 Evolution of fish stocks
Evident progress was recorded in reducing fishing mortality and in achieving the FMSY target along with progress on scientific advice. However, overall, the conservation status of the stocks in terms of biomass did not achieve the expected target of reaching levels that can produce MSY (BMSY) despite some regional positive signals.
The overall analysis of the stocks regulated under EU fishing opportunities shows a decline in overexploitation (exploitation at F>FMSY). the proportion of stocks exploited at or below FMSY has increased from 50% in 2014 to 63% in 2022
,
(see Figure 4 below; Fig.2-3 and Tab.1, Annex VI).

Figure 4 - Trends in fishing pressure between 2003-2023. Red line: NEA EU waters; green line: NEA but outside EU waters; and black line from the M&BS. The dashed line indicates the level of fishing mortality consistent with MSY.
Source: supporting study based on STECF ad hoc 25-01
The baseline reflected in the 2011 impact assessment (5% of stocks at FMSY in 2012) was exceeded before the implementation of the CFP owing to the quick increase in the number of stocks assessed with an estimated FMSY reference point (see Table 1 below). This improvement reflects the expectation outlined in the impact assessment of not assessed or poorly assessed stocks to move to FMSY through improving existing assessments as well as the associated data collection.
|
|
2012
|
2014
|
2017
|
2022
|
|
Indicator
|
IA baseline
|
Observed
|
Expected
|
Observed
|
Expected
|
Observed
|
|
Stocks with F≤FMSY
|
7
|
90
|
70
|
88
|
121
|
120
|
|
Assessed stocks with FMSY known
|
136
|
180
|
136
|
184
|
136
|
190
|
|
%
|
5%
|
50%
|
51%
|
47%
|
89%
|
63%
|
Table 1 - Evolution of fish stock exploited at FMSY or below from 2012 till 2022
Such a steep increase in FMSY-based advice is entwined with the stocks management framework and the scientific advice providers. Indeed, the stocks relying on ICES advice show an increase (+8 %) of FMSY as a reference point (from 2014 to 2022). Therefore, the success in achieving FMSY is more evident in some regions (in South Western Waters, 90% of assessed stocks achieved FMSY) than others (Mediterranean 48%). In absolute terms, the number of observed stocks exploited at or below FMSY in 2022 is almost at the expected levels (120 observed vs 121 expected as identified in the 2011 impact assessment) but, in relative terms (percentages), the current figures are still below the 89% of stocks at FMSY by 2020/2022, because of the increase in the number of stocks with quantitative assessments available.
In the North-East Atlantic the number of stocks fished in line with FMSY increased from 49 in 2014 to 62 in 2022 and in the Mediterranean and Black Seas from 19 in 2014 to 32 in 2022 (STECF ad hoc 25-01).
The analysis of the stocks that were subject to overfishing (F>FMSY) in 2014 and are still so in 2023 (see Tab.2, Annex VI), shows a decreasing trend in fishing mortality detected for most of these (52%). However, about 21% of the stocks show increasing fishing mortality, pointing to a continued or worsening overexploitation status especially in the most recent years. The remaining 27% of the stocks subject to persistent overfishing show not clear trend or stable fishing mortality.
Progress was also evidenced in RFMOs where the EU is a significant player. In tuna RFMOs
, the share of the commercially exploited tuna stocks not subject to overfishing increased from 43% in 2014 to 87% by 2024. Moreover, while in 2014 only 69% of the tuna catch originated from stocks subject to sustainable levels of fishing pressure (F≤FMSY), this share steadily increased to reach 90% in 2024. For stocks managed by non-tuna RFMOs, the trends have been more diverse. For instance, regarding small pelagic stocks, the situation significantly improved during the evaluation period in the South Pacific but worsened in the North Pacific Ocean. Concerning demersal stocks, the situation and trends also varied depending on the region, with positive trends for instance in the North-West Atlantic and Southern Oceans, and mixed trends in West Africa.

Figure 5 - Percentage of stocks above biomass reference points (BMSY/MSYBtrigger) in the NEA (121 stocks) and the M&BS (34 stocks).
Source: supporting study based on STECF ad hoc 25-01
The biological status of the stocks did not follow similar trends as there is an overall stabilisation or slight decrease between 2014 and 2022, in the number of stocks considered at healthy status (see Figure 5 above and Tab.3-5, Annex VI) i.e. those showing biomass levels above the biomass reference points of BMSY or MSY BTRIGGER
. With fluctuations over the studied period, the Baltic, Black Sea and North Western Waters show decreases in the proportion of healthy stocks, while the Mediterranean stocks show a slight increase in healthy stock status between 2016-2017 (40% to 46.7%), followed by a decrease down to ~35% by 2022. The North Sea and South Western Waters show only a very small improvement.
Among stocks identified as persistently below biomass reference points (BMSY or MSY BTRIGGER) over the evaluation period, 35% show signs of gradual biomass rebuilding, while 43% show further decreasing biomass trends and 21% show no changes.

Figure 6 - Percentage of stocks below the biomass reference point for impaired reproductive capacity (BLIM) in the NEA (92 stocks) and the M&BS (34 stocks)
Source: supporting study based on STECF ad hoc 25-01
The number of stocks for which biomass is below the level that is considered as a minimum to avoid impaired reproductive capacity (BLIM) and hence are threatened by collapse due to impaired recruitment increased during the reporting period (see Figure 6 above and Tab.6, Annex VI): the percentage of assessed stocks below BLIM was 16% in 2014 (n=128) and 20% in 2022 (n=129). The trend is different per region and some of them evidenced improvements (South-Western Waters), while others showed mixed patterns (Mediterranean and North Sea) or negative results (Baltic Sea and North Western Waters).
The observed variation in stock size for the 21 modelled stocks that were used to make projections in the 2011 impact assessment (see Tab.7, Annex VI) show an 8% decrease in the biomass for those populations. However, stock size rates and numbers of the present evaluation cannot be compared to the figures shown in the 2011 impact assessment (expected increase of 70% of stock populations) due to changes in the assessment method for some of those stocks during the evaluation period. The observed average trends are a decrease in biomass for those stocks rather than the expected increase, despite the evident decrease in fishing pressure.
A wider analysis of variation in biomass including more stocks
showed regional variations of the trend in biomass with negative results in some areas (e.g. Celtic Sea) and positive in others (e.g. Western Mediterranean). From 2014 to 2022, the overall trend in B/B2003 (biomass standardised to the point estimate in 2003) based on 123 stocks, shows a slight increase from 0.74 to 0.81 with fluctuations and no clear positive or negative trend during the reporting period.
The described situation regarding the reduction of overexploitation (achieving FMSY target) and uneven evidence of biomass rebuilding can also be observed in the stocks covered by Multiannual Plans (MAPs).
The share of EU-MAP
stocks fished above FMSY declines over time, with the biggest improvement visible in the North Sea MAP and Baltic MAP stock sets. The picture for the Baltic Sea is however more nuanced as the number of TACs set in line with ICES MSY or precautionary advice was 8 out of 10 from 2017 to 2019 but has since then decreased to 6 out of 10 TACs. Four TACs are today with zero-catch advice in the Baltic Sea. While many Baltic Sea fish stocks have been fished at or below FMSY in terms of fishing pressure, the biomass of some has however not recovered or even further declined. The degraded ecosystem situation, which is not sufficiently improving, is likely to play a role for some stocks here. ICES also identified problems with misreporting.
In the Western Mediterranean MAP (in force since 2019 with the objective of achieving FMSY in 2025, as opposed to 2020 elsewhere), overfishing is also decreasing but remains comparatively higher and declines less steeply than in the North Sea/Baltic sets, indicating slower progress in reducing fishing pressure in that MAP stocks.
The share of healthy stocks in EU MAPs assessed by ICES (biomass above MSYBTRIGGER) increases in the North Sea MAP stocks but declines in the Western Waters MAP stock.
The share of stocks below BLIM tends to rise in several MAP stock sets (notably Western Waters and to a lesser extent North Sea/Western Mediterranean), while the Baltic set shows fluctuations.
Catches of the analysed stocks in all EU waters decreased between 2014 and 2022 by more than 700,000 tonnes (an average of 8% decrease in catches). This amount cannot be compared with the figures expected for the modelled populations in the 2011 impact assessment mainly because of the limited number of stocks considered at that time, but the negative trend is contrary to the expected increase of catches (catches would increase by 550,939 tonnes (17.62%)).
3.1.2 Evolution of discards
The CFP Regulation objective of gradually eliminating discards, on a case-by-case basis, was based on two main actions: (i) avoiding and reducing, as far as possible, unwanted catches; and (ii) gradually ensuring that catches are landed.
The 2011 impact assessment did not suggest quantitative targets regarding this objective, given the recognised absence of reliable data about the level of discards at that time. It counted on reducing discards via (i) overall reduction of fishing pressure, (ii) the introduction of TFCs, and (iii) the reinforced cooperation at regional level. In addition, it assumed the introduction of a more active policy against discards, in particular, the introduction of catch-quota (as opposed to quotas based on landings) and/or discard bans. After the adoption of the CFP Regulation in 2013, the introduction of the landing obligation was phased in from 2015 to full implementation on 1 January 2019. With the introduction of the landing obligation, the Commission proposes TACs on the basis of catch (advice) instead of previously used landings advice. In order to cater for the transition towards increased selectivity, there are estimations indicating that TACs were adjusted upwards (top-ups) by 36% on the basis of ICES advice (Borges, 2021). Currently, the Commission deducts the de minimis or high survivability exemptions from the ICES advice where appropriate and possible.
The 2025 study supporting the evaluation of the landing obligation evidenced that, despite the overall reduction of fishing pressure, discarding of unwanted catches is still occurring within EU fisheries. There is a “high degree of variability in discarding rates, with no single trend apparent across all sea basins, fleet or fisheries over the studied period (2013 – 2022). This variability is partly due to differences in fishing operations across fleet and fishery segments in different Member States and is further influenced by the inherent noise in the data, which may obscure any clear trends. Discard sampling is notoriously variable and based on low sampling coverage within a given sampling frame.”
During the reporting period, an improvement in the available quantitative discard data has been observed. However, there are still important data gaps. For example, the STECF FDI data does not currently incorporate the level of detail required to analyse the potential impact of exemptions to the landing obligation and the percentage of catches affected by such derogations in the observed continuation of discards.
The 2025 study also stated that (i) “based on the STECF FDI data, selectivity of fishing techniques does not appear to have increased”, (ii) “the rates of unwanted catch observed across regions and gear selectivity measures show no clear patterns over the time”, and (iii) “there does not appear to be a marked increase in the uptake of more selective fishing techniques and gears”.
The reinforced regional cooperation led to an observed increase in the number of joint recommendations for exemptions to allow the discarding of a level of unwanted catches rather than improving selectivity of fishing practices (STECF, PLEN-21-01). The need for evidence supporting exemptions has, however, improved the current knowledge about discards.
The evolution of undersized unwanted catches (below MCRS) increased or showed no improvement in the majority of fisheries and species considered for the Baltic, the North Sea and the South Western Waters areas, while the number of fisheries and species with decreasing undersized unwanted catches was relatively high only in the North Western Waters (see Table 2 below).
|
|
Decreasing
|
No trend
|
Increasing
|
|
Baltic
|
1
|
24
|
10
|
|
NS
|
35
|
62
|
81
|
|
NWW
|
23
|
29
|
13
|
|
SWW
|
14
|
87
|
42
|
Table 2 - Number of species in all fisheries examined that show increasing, decreasing, or no trend of undersized catches, for the basins considered in Davie et al. (2025)
3.1.3 Evolution of the impact of aquaculture and fishing activities on the marine ecosystem
Several aspects to measure the evolution of the impacts of aquaculture and fishing activities on the marine ecosystem have been considered under the current analysis.
Incidental catches of sensitive species including protected elasmobranchs, corals, sponges, sea turtles, seabirds and marine mammals represent one such aspect. The main evidenced progress in this respect is the increase in monitoring and coverage of some fishing fleets resulting in a better reporting of interactions. However, available data coming from the DCF are insufficient in quantity or quality to assess in a comprehensive manner neither trends in interaction rates for most of the relevant fleets, nor any conservation benefits during the evaluation period. Given this caveat, the significant increases in the total number of incidental catches must be considered with caution.
Overall, in the area covered by the 2024 ICES advice (ecoregions in the Northeast Atlantic and adjacent seas, including Mediterranean and Black Seas and non-EU countries)
, the incidental catches of marine mammals show no consistent trend with peaks in 2017 and 2021 and then stabilisation. A different pattern is observed more recently for common dolphins in the Bay of Biscay, where incidental catches declined significantly in 2024 and 2025 (i.e. estimated at 1,900 individuals in 2025 compared to approximately 4,700 individuals per year during 2017-2023). This reduction is attributed to the one-month closure applied to pelagic and bottom trawls, purse seiners and netters during the period of highest bycatch risk
. With respect to bird bycatch, a fluctuating pattern with peaks in 2017 and 2019 was observed. A sharp decrease in catches of elasmobranchs was observed after extremely high rates in 2016-2017. No trend can be extracted with the existing data about sea turtles.
Regarding the evolution of fisheries restricted areas (FRAs), in 2016 the Mediterranean Sea contained FRAs covering a total of 1,493 km². By 2025, the Mediterranean FRAs network doubled to six sites covering ≈ 8,480 km². A total of eleven FRAs have been adopted at the level of the GFCM since 2005. Five of these protect predominantly Essential Fish Habitats (EFH), four protect mainly Vulnerable Marine Ecosystems (VME) and two protect both. In order to ensure uniform protection throughout all FRAs of the Mediterranean and Black Seas, the GFCM adopted in 2022, minimum standards for FRAs.
Across the Atlantic North Western and South Western Waters, the introduction of the 2022 deep‑sea closure network protecting VMEs at depths ≥ 400 m resulted in 43 closures covering 9,501 km² and 44 closures covering 7,341.66 km² respectively each.
In the North Sea and in the Baltic Sea, since 2015 and more intensively since 2019, FRAs have been introduced in Marine Protected Areas under different legal bases of the CFP Regulation and the Technical Measures Regulation (TMR). About 35 marine Natura 2000 sites and MSFD areas in the North Sea have been protected under Article 11 of the CFP Regulation
covering ~12,300 km2 in the North Sea, ~1,900 km2 in the Kattegat and ~1,200km2 in the Skagerrak. In the Baltic, FRAs have been created in about 27 marine Natura 2000 sites covering ~18,500 km2, using both Article 11 of the CFP Regulation and Article 15 of the TMR. In recent times, Member States have also used other tools in the CFP Regulation, such as Article 20, to create FRAs within the 12 nautical miles zone.
In international fisheries, all RFMOs have advanced in defining and implementing an ecosystem approach to fisheries management. This has mainly consisted in expanding data collection processes regarding bycatch and regulating interactions with sensitive species and ecosystems, in particular VMEs. For instance, NAFO, NEAFC, CCAMLR, SPRFMO, and SIOFA introduced measures to protect VMEs, including prohibiting fishing in areas where VMEs have been identified (see Tab.9, Annex VI). In NAFO there are 27 closed areas (≈ 330,000 km²). In NEAFC there are also closures to protect VMEs (bottom contacting fishing is limited to a small portion (≈ 170,000 Km², <3% of the high seas under the NEAFC scope), where there was historical bottom fishing and no identified VMEs). Around 72% (1.55 M km²) of CCAMLR waters are no‑take zones. In tuna fisheries, for example, conservation measures were gradually introduced to protect sensitive species (e.g. protected sharks, sea turtles, seabirds etc) and reduce negative environmental impacts of Fish Aggregating Devices (FADs), in particular through the adoption and implementation of non-entangling and biodegradable designs.
Regarding aquaculture, in line with the Commission’s Strategic Guidelines, and the MNSPAs for the development of aquaculture activities, which Member States are required to adopt under the CFP Regulation, most Member States have introduced measures to improve the environmental performance of the aquaculture sector
. 21 Member States have integrated aquaculture in environmental strategies, 16 have developed and funded measures, programmes, projects or investments to further mitigate the environmental impact of aquaculture, 10 have used EU funding to promote the use of more sustainable feed for fed aquaculture, 13 have established performance indicators for aquaculture, and 10 have developed model or reference environmental monitoring plans (see Fig.4, Annex VI). However, it remains difficult to assess the practical contribution of these measures to the environmental sustainability of the aquaculture sector, as there is currently no common set of indicators or reporting obligations to assess progress.
3.2 Socio-economic sustainability
3.2.1 Evolution of situation of the fleet and fleet capacity
The number of vessels in the EU fishing fleet has reduced since 2014, both in terms of the total number of registered vessels in the fleet (-8.6%)
and in terms of the number of active vessels in the fleet (-6,7%). A significant portion of this decrease has been borne by the large-scale fleet (20.5%)
compared to the small-scale coastal fleet ( -6.2%) and the distant water fleet (-17.3%) (see Tab.10, Annex VI).
This reduction is also reflected in the capacity of the fleet: the gross tonnage (GT) and engine power (in kW) in the active fleet have decreased by 12% and 10% respectively. This is due both to a decrease of the GT and kW of the active fleet as well as the increase of the proportion of inactive vessels (19% of the fleet was inactive in 2013 and 24% in 2023). While overall decrease in the number of fishing vessels, whether total or active fleet, is much lower than the expected scenario of -17.7% by 2022 or even the status quo scenario of -15.1% by 2022, most of the decrease has been borne by the LSF and DWF vessels that have decreased at the expected rate or more.
At the same time, the average age of EU registered fishing vessels (including inactive vessels) has progressively increased from 26 years in 2014 and reached in 2023 34.8 years and 33.5 years for active vessels only. The distant water fleet is also impacted by the ageing of vessels, but the average age is significantly lower (24 years in 2023). The number of recent and new-built vessels entering in the EU fleet has dropped significantly over the last two decades (see Figure 7 below and Fig.5, Annex VI). The renewal rate is below 1% for both the total and active fleet and for all three main fleet categories (SSF, LSF, DWF).
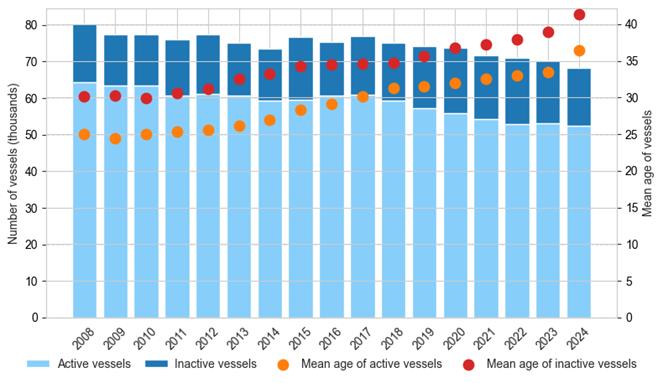
Figure 7 - Vessel numbers and age of the active and inactive fleet.
Source: DCF data
Additionally, over the period of 2014 to 2023 the EU fleet decreased by a total of 5,058 vessels. Of these vessels, 1,565 (31%) were withdrawn through EMFF and EMFAF funding covering the period 2014 to 2025. After a brief increase in 2015, fleet size declined overall from 2016 onwards, with the largest annual decrease occurring between 2020 and 2021 (Figure 8 below).
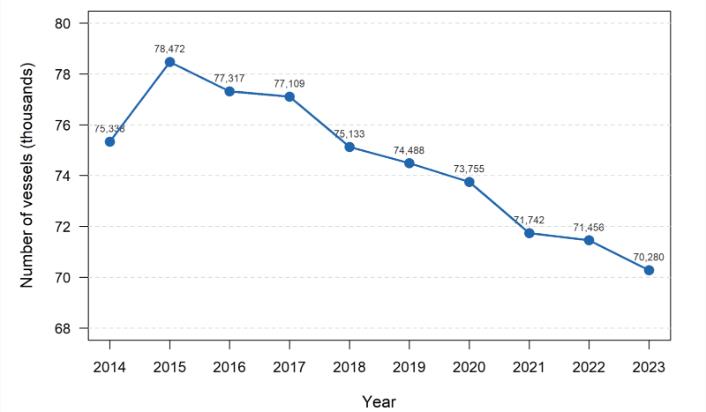
Figure 8 - Number of registered EU fishing vessels from 2014-2023 (fleet size)
Source: supporting study based on STECF 25-07 dataset
Given changes in fleet structure, fluctuations in stock status and fishing opportunities, robust conclusions cannot be drawn concerning the evolution of the balance between fishing capacity and fishing opportunities. However, according to the 2026 fleet study, EU balance capacity indicators show that many fleet segments remain imbalanced in 2023 (see Tab.11, Annex VI). Hence, the observed decrease in EU fishing fleet capacity (by means of total kW and GT) did not translate into an overall balanced capacity with the available fishing opportunities in EU waters. In addition, the actual active capacity is well below the country-specific ceilings for most EU countries, meaning there is significant unused capacity.
3.2.2 Evolution of EU production
Globally, the EU is a minor producer of fishery and aquaculture products (FAPs), accounting for only 2% of world production, with a growing gap compared to major Asian producers whose output is driven primarily by aquaculture. Despite this, the EU remains the 4th largest market for FAPs, behind China, India and Indonesia.
According to EUMOFA data, aquaculture growth has been modest since the last Common Fisheries Policy reform, showing a 2% increase in volume and 35% increase in value (real terms) reaching €4.17 billion in 2023. The sector consists of around 13,855 enterprises and microenterprises, divided between freshwater and shellfish, with only a small percentage of marine fish aquaculture. The mid-term assessment published in October 2025 looks at progress on licensing and access to space since 2021. It points to a partial streamlining of licensing procedures: 65% of Member States have taken steps to coordinate regulatory and administrative systems for aquaculture and to digitalise licensing processes. Despite this, the overall number of new licences has decreased. Only Germany, Lithuania and Portugal recorded increases, while nine countries reported decreases and two remained unchanged. Comparing the periods 2016–2020 and 2021–2023, the time required to process aquaculture licences has increased in some Member States (e.g. in Denmark), while others report that processing times have remained stable.
In the fish processing sector, the number of enterprises remained stable (3,245) with a significant turnover increase of 50%, reaching €33.5 billion. Spain leads this sector, followed by Italy, France, and Poland. Additionally, FAPs processing as a secondary activity in food industry branches contribute €1.6 billion in turnover, a 69% increase since 2014, accounting for 5% of the sector's total turnover (see Fig.24, Annex VI). There has been a shift towards larger enterprises over the last decade, with large companies now dominating the turnover share. Meanwhile, the share of turnover of small and micro-enterprises declined to 22% and 4%, respectively.
Total landings by EU vessels in 2023 were the lowest in a decade at 3.39 million tonnes valued at €6.14 billion, marking a 22% decline in volume since 2014. This trend began in 2018 and has become more pronounced after 2021 due to stock changes and consequent reduced fishing opportunities. These developments affect both total landings and their distribution across management systems and fleet segments. The three fleet categories (SSCF, DWF, LSF) have experienced a comparable decline in landings over the period (see Fig.7, Annex VI).
Price variability at first sales shows high intra-year swings, particularly for quota-driven pelagics and mixed groundfish, while high-volume and niche species remain more stable. Some species are also characterised by high biological variability and rapid fluctuations in abundance (like small pelagics). Besides, auctions are generally characterised by significant volatility due to uneven catches and spot pricing (see Addendum 2, Annex VI).
3.2.3 Evolution of profitability of sectors
The net profit margin across all fleet segments has decreased significantly from 8% in 2014 to 1% in 2023 and thus did not reach the expected average 18% net profit margin
. Gross profit margins have equally declined from 21% in 2014 to 16% in 2023 (STECF 25-07). Looking at the distribution of profitability across the fleet, over the 2013-2023 period, about 20% of the fleet appears to be in gross losses (excl. Greece). While the rest of the fleet has experienced a decrease of profitability over the period, it remains profitable at the end of the evaluation period (see Figure 9 above and Tab.12-17, Annex VI).
Energy costs have had a big impact on the profitability of the EU fishing fleet (notably the LSF and DWF) as they are variable and account for a significant part of its operational expenses. From 2013 to 2023, energy costs as a percentage of revenue for fishing fleets varied, with a peak of almost 22% in 2022, similar to 2013 levels, and a decrease to lower levels in 2023 (19%).
Given the ageing of the EU fishing fleet and low entry of new vessels, the depreciation costs of the fleet are currently low. The average return on investment was 5% in 2022, far below the 18% that was expected and would be necessary for investing in a high-risk sector (see Tab.17, Annex VI).

Figure 9 - Variation on revenue and profits for the EU active fleet.
Source: STECF 25-07
The real terms net profit of the EU aquaculture industry has risen by 104% from €388.8 million to €793.8 million between 2014 and 2022. During this period, ten Member States saw a decrease in net profits in real terms, whilst nine saw an increase. Total income of the EU aquaculture industry has risen by 59.7% since 2014 from €3.8 billion to €6.07 billion in 2022
. This growth results from an evolution of the species farmed towards higher-value fish species rather than to change in volumes farmed. Growth is constrained by high costs. In the case of finfish, feed (around 43% of total costs) is the largest cost. Feed prices have risen sharply since 2020 due to inflation and raw material shortages.
Regarding the EU processing industry, the data shows a marked improvement in the sector’s productivity and profitability between 2013 and 2023. Net profit margins show the most significant trend, increasing from between 2–5% in 2013–2019 to 19% in 2023, signalling a robust recovery in profitability and reduced operational inefficiencies. Persistent cost pressure means that, even after energy markets stabilised, total costs were still 80.6% of income in 2023. As a result, companies have had to rely increasingly on automation and tighter cost control to protect margins. These investments contributed to GVA rising but they also require capital and are harder to implement for smaller companies (see Fig.8, Annex VI).
3.2.4 Evolution of competitiveness
Between 2015 and 2024, the value of EU trade in fishery and aquaculture products grew by 18% in real terms and 2% in volume, with a compound annual growth rate of 2% in real terms. Despite this growth, trade volume reached its lowest level in a decade in 2024, while both real and nominal values were the third-highest recorded in the period (EUMOFA, 2025).
The EU remains a net importer with a trade deficit of €21.6 billion in 2024, up 4% in real terms compared to 2015. In 2024, imports totalled 5.95 million tonnes (€29.9 billion), while exports reached 2.2 million tonnes (€8.25 billion), with frozen and fresh products accounting for the largest deficits.
The EU's self-sufficiency in fishery and aquaculture products has declined since the 1990s, covering only 38.1% of demand in 2023, down from a peak of 46.1% in 2014 (See Figure 10 below). This is particularly evident in the five most consumed main commercial species (tuna, salmon, cod, Alaska pollock, and shrimp), where self-sufficiency was just 12% in 2023.

Figure 10 - Apparent consumption and self-sufficiency rates for fishery and aquaculture products
Source: EUMOFA- EU fish market 2025
3.2.5 Evolution of the promotion of sustainability standards contributing to a level playing field with third countries
Several elements and tools of the CFP Regulation have helped promote comparable sustainability standards, contributing to a level playing field with third countries. Some key developments in RFMOs are shown in Tab.36 of Annex VI. In this context, they concern in particular the establishment and strengthening of monitoring, control and compliance review processes aiming at ensuring the effective implementation of applicable rules by all RFMOs members.
SFPAs, notably for tuna agreements, represent an additional tool for the EU to promote compliance in RFMOs as their provisions require compliance with the RFMO conservation and management measures. In addition, all SFPAs or their protocols include a clause providing that partner countries should not give more favourable conditions to the fleets of foreign non-EU countries than to the EU fleet. However, evaluating the implementation of this clause is challenging due to a lack of data availability on the conditions granted to other foreign fleets. Issues on the implementation of this non-discrimination clause have been reported for specific types of fisheries and species with some partner countries.
Moreover, and in accordance with Article 31 of the CFP Regulation, SFPAs include an exclusivity clause (usually in the framework agreement), which provides that only EU fishing vessels authorised under the SFPAs can access the waters of partner countries. In the prolonged absence of an implementing protocol to an SFPA (dormant agreement), this can have adverse effects as the EU fleet is unable to access important fishing areas for extended periods of time. These cases do not support a level playing field for EU operators, since foreign competitors are not subject to the same access restrictions. Section 3.3.7 details further initiatives and actions contributing at promoting EU environmental and social standards in RFMOs and SFPAs.
In addition, the EU IUU catch certification scheme (see section 3.3.7) ensures the legality of imported fishery products and, therefore contributes to enhancing the level playing field for operators.
Regarding aquaculture, the EU has contributed to the development and the adoption of the FAO Guidelines for Sustainable Aquaculture by the FAO Committee on Fisheries (COFI) in 2024 and continues to support their dissemination and implementation. The EU is also supporting sustainable aquaculture practices in other fora, notably the GFCM under the 2030 GFCM Strategy for Fisheries and Aquaculture.
Notwithstanding these developments, the EU’s standards remain higher than many other environmental and social standards around the globe. This is also reflected in the difficulties often faced by the EU in its endeavours to promote higher standards in international fisheries and relates to a large extent to the diversity in terms of development, institutional/administrative capacities, political priorities and societal needs and expectations in third countries participating along with the EU in various international fisheries fora. This dynamic is particularly evident in the Coastal States forum in the NEAFC, where the EU is at times confronted with positions that do not fully align with sustainability objectives, including fishing levels exceeding scientific advice or the indirect support of such practices. As a result, the EU’s principled stance in favour of sustainable fisheries has occasionally led to a degree of isolation.
3.2.6 Evolution of the structuration of the sector through professional organisations
In 2025, there were 226 professional organisations in fisheries and aquaculture in the EU, including 207 Producer Organisations (POs), 10 Associations of POs (APOs), and 9 Interbranch Organisations (IBOs). The sector features a predominantly horizontal structure with many POs, while vertical coordination remains limited (only few IBOs). Only 5 transnational POs in fisheries have been formally recognized, and there are few national POs with members or vessels from multiple Member States.
Since the 2013 CMO Regulation reform, the total number of POs has remained stable, though more Member States now have POs. Latest data could indicate an overall increase in the representativity of POs since the reform of the CMO, with POs covering 56% of fisheries production and 37% of aquaculture in 2022. Only eight Member States have formally delegated quotas management to POs which gives POs partial authority to manage the fishing opportunities. Overall, POs represent a substantial portion of fishing opportunities for some stocks, while for many of the high‑value or low‑stock species, their share remains modest. Most fishery POs have some small-scale fishers as members. However, the membership of SSCF and aquaculture producers in POs remains relatively low in most countries
.
3.2.7 Evolution of accessibility, availability, affordability for EU consumers
Since 2014, retail prices for FAP have risen steadily at an average annual rate of 3.8% (2015-2024), totalling a 41.5% increase since 2015. While this growth outpaced meat prices, it remained below the 44% increase in overall food prices (EUMOFA 2025).
In 2023, EU apparent FAP consumption
reached 10.25 million tonnes (22.89 kg per capita) a 7% decrease since 2014. The market remains concentrated, with the top five species (tuna, salmon, Alaska pollock, shrimp, and cod) accounting for 43% of consumption - much of which is imported.
Fresh/chilled products made up 42% of household FAP expenditures in 2023, though this share has declined since 2014. Meanwhile, preserved/processed products gained popularity, rising from 24% in 2018 to 27% in 2024.
3.2.8 Evolution of consumer awareness, understanding, confidence and ability to make informed choices
From 2014-2024, price became increasingly important in FAP purchasing decisions due to economic pressures and inflation. Recent Eurobarometer surveys reveal consumer trade-offs between price, quality and sustainability.
The CMO Regulation governs mandatory and voluntary consumer information. While existing mandatory information (expiration dates, species names, production methods) remains valued, according to the Eurobarometer there is growing demand from consumers for additional details: such as catch/harvest dates, environmental information, or the vessel flag.
Currently, 73% of at-home FAP consumption falls under CMO mandatory information requirements, though this coverage has decreased from 78% in 2017 due to rising consumption of prepared/preserved products (not covered by these requirements). When additionally considering out-of-home consumption, only about 50% of the overall FAP consumption is covered by CMO mandatory information requirements.
3.2.9 Evolution of employment
In the catch sector, there has been a steady decline in total employment and full-time equivalent (FTE) employment (see Fig.8-11, Annex VI). In 2014, 141,064 fishers were directly employed in the EU fishing fleet corresponding to 105,103 FTEs. By 2023 it was 119,479 total employment corresponding to 73,974 FTEs (-15.3% and -29.6% compared to 2014). The expected outcome of the impact assessment estimated a reduction in employment by 16% in 2017 and 23% by 2022 in the catch sector: therefore, the actual decrease of total employment was less than expected. However, the decrease of FTEs was higher, indicating a growing prevalence of part-time or seasonal employment. Additionally, the impact assessment predicted an improvement in social indicators after 2017 (in this case reduced decrease of total employment): on the contrary, the decrease in employment accelerated from 2017 onwards.
There is also a clear ageing of EU fishers: between 2017 and 2023 the number of workers in age categories 40-64 and over 65 have both increased, respectively by 3.5% and 2.1%, while the number of workers in the age categories 25-39 and 15-24 have respectively decreased by 4.1% and 1.6% over the same period (see Tab.20 and Fig.12, Annex VI). This ageing must be viewed in the context of a general ageing of the European population while keeping in mind that in many countries, retirement age usual takes place at or before 65. Therefore, the catch sector is seeing an increase of its workforce beyond retirement age to compensate for the lower number of new entrants.
In fish processing, the total EU number of engaged crew in processing shows a generally increasing trend since 2014 (+9.5%), also reflected in the total EU FTEs (+11%). Processing maintains a consistently high FTE/employment ratio (0.89-0.92), indicating stable full-time employment (see Fig.13-16 and Fig.24, Annex VI). The general trend exceeds the expected outcome of a very moderate increase (1-2%) for the sector by 2022, but this increase is not distributed equally across the EU.
In aquaculture, total employment (workers) and FTEs stayed roughly the same between 2016 (72,183 total and 40,881 FTEs) and 2022 (72,799 total and 40,730 FTEs), with ratios indicating a stable prevalence of part-time work (0.56 in 2016 and 0.57 in 2022) (see Fig.17-19, Annex VI).
3.2.10 Evolution of wages
Globally, since 2014, the average wage per employee in the catch sector has increased moderately and the average wage per FTE very moderately by 7% (see Tab. 12 and Fig.20-21, Annex VI). It can therefore be considered that, overall, the intervention did not meet the expected target of the impact assessment, which foresaw an increase in wages by 73% in 2017 and by 125% in 2022 in the catch sector.
Regarding the level of average wages in the catch sector, there are also significant variations per fleet segment and Member State (see Fig.22-23, Annex VI). The highest wages occur in the LSF or DWF. For these fleet segments, half of the coastal Member States provide an average wage equal or higher than the national average.
The average wage in the processing sector has increased by 25% (see Fig.24, Annex VI) and the comparison to national average wage shows, for all Member States, except Malta, Ireland and Lithuania, that the ratio is stable or has increased over the period, indicating that wages in processing have increased equally or more rapidly than the rest of national economies (see Fig.25, Annex VI).
The average wage within the aquaculture industry has increased by 7% since 2013, rising from €24,070 to €25,800 in 2022. However, it remains overall below the average EU wage, earning around 72% of the average EU wage in 2022, albeit with significant differences between Member States (see Fig.26-27, Annex VI).
3.2.11 Evolution of safety
Data on safety does not provide a clear picture of the situation. Eurostat data covers both fisheries and aquaculture sectors and indicates a general decrease of fatal accidents between 2014 and 2021 (but a jump in 2022), as well as non-fatal injuries by 33.3% (2014-2022) illustrating improved safety conditions (see Fig.28-29, Annex VI). However, EMSA data on marine casualties at sea (which relate to fishing vessels of over 15 metres in length) shows an opposite trend with a significant increase (see Fig.30, Annex VI). It could therefore be concluded that the discrepancy is linked to an improvement of safety in aquaculture and processing rather than the catch sector. The EMSA trends contradict the expected outcome of the impact assessment, which foresaw a moderate improvement of safety conditions specifically onboard vessels. In addition, as described also in section 3.2.1, the mean age of active fishing vessels has increased across the EU from 26 years in 2014 to 34 years in 2024 (see Figure 7). This means that many vessels are moving towards their technical end of lifetime, which may lead to increased safety issues in the future if they remain in operation.
3.2.12 Evolution of coastal fishing activities
Over time, the number of small-scale fishing vessels has only decreased slightly compared to the LSF (-6.2% for the SSCF compared to –20.5% for the LSF)
.The promotion of coastal fishing activities since the introduction of the CFP Regulation can be considered through the use of preferential allocation criteria for fishing opportunities (quota or effort) and preferential spatial access to the 0-12 nautical mile zone. In both cases, this remains a national prerogative. Regarding allocation criteria, more than 50% of coastal Member States have some form of measure encouraging small scale fishing, including dedicated quotas, or weighting factors that reward low-impact gears. However, it is not always clear when these measures were introduced therefore any conclusion on the evolution of such measures over time should be considered with caution. Evidence from the supporting study also indicates that no cases were found where parts of the 12-nm zone are formally reserved for SSCF (see Addendum 3, Annex VI).
3.2.13 Evolution of main areas of European funding
During the previous EMFF programming period (2014-2020), the total public expenditure (Table 3 amounted to more than €4.8 billion (85.5% of the total commitment amount), with the main areas of funding being used to support the “promotion of environmentally sustainable, resource efficient, innovative, competitive and knowledge-based fisheries” (Union Priority 1), the “fostering of marketing and processing” (Union Priority 5) and “data collection, control and enforcement” (Union Priority 3).

Table 3 - EMFF implementation per Union Priority
Source: EMFF ex post evaluation based on Infosys data 2023
During the EMFAF programming period (2022-2027)38, more than €2.1 billion was committed so far, with control and data collection, sustainable aquaculture production and marketing and processing receiving the most support (Fig.31-32 Annex VI). To contribute to the resilience of the sector to external shocks, temporary cessation of fishing activities has been financed with €62.7 million under the EMFAF so far and was financed with a total of €224.8 million under the EMFF. Similarly, permanent cessation of fishing activities has been financed with €59.0 million under the EMFAF so far and was financed with a total of €92.1 million under the EMFF. Emergency measures for mitigation of the COVID-19 outbreak, or measures to alleviate the consequences of the military aggression of Russia against Ukraine on fishing activities, and to mitigate the effects of the market disruption caused by that military aggression on the supply chain of fishery and aquaculture products, received €349.2 million under the EMFF. €17.9 million was committed so far to compensate for unexpected environmental, climatic or public health events
.
From 2014 to 2024, the EU allocated more than €98 million as voluntary contributions to RFMOs to support the improvement of their performance in many key areas. In addition, the total amount of EU compulsory contributions paid to RFMOs during the same period was €55 million.
From 2014 to 2020, the EU support to partner third countries under SFPAs represented an annual average of €126 million (€98 million as contribution for access and €28 million as contribution for sectoral support). This figure excludes the fees paid by EU operators benefiting from the fishing opportunities available under SFPAs. From 2021, a relative increase of the share of operators’ fees in the total contribution for access can be observed in the new protocols signed.
Member States’ responses, collected through a survey carried out in the context of the supporting study, show reliance on EU funding, with EMFF/EMFAF contributions totalling more than €2 billion, compared to approximately €500 million from national budgets, for the 9 Member States that responded to the survey.
3.3 Governance
3.3.1 Evolution of regionalised decision-making
The CFP Regulation introduces the regional approach that provides a procedure to adopt regional measures on the basis of proposals submitted by Member States (joint recommendations (JR)). Each JR submitted to the Commission has to be consistent with the Regulation’s objectives and based on the best available scientific advice. The Commission may adopt the measures by means of delegated acts.
The objective is to enable decision-making “closer to the ground”, at regional level and involving stakeholders, to take into account the unique ecological and socio-economic contexts in the different sea basins. JRs can be proposed to contribute to complying with EU environmental legislation (Article 11), exemptions to the landing obligation (multiannual plans), establishment of fish stock recovery areas (Article 8) and technical measures (Article 15 of the TMR).
Since 2013, Member States with a direct management interest in the fisheries of a given geographical area have established the Member States Groups (MSGs) to cooperate at regional level and formulate JRs. Overall, seven MSGs have been set up: Baltfish, North Sea (i.e. the Scheveningen group), NWW, SWW, PESCAMED, ADRIATICA and SUDESTMED. When preparing a JR, the Member States concerned consult the relevant ACs before submitting it to the Commission.
Over the period 2014-2025:
·12 delegated acts were adopted outlining conservation measures that are necessary to comply with environmental obligations referred to in Article 11 of the CFP Regulation, concerning 31 marine Natura 2000 sites. No measures were adopted in the Mediterranean and Black Seas, nor in the Atlantic under this procedure although national measures exist. Only one delegated act was rejected by the European Parliament during the scrutiny period
. The Commission has ongoing infringement procedures under environmental legislation for insufficient management of the Marine Protected Areas against 14 Member States.
·29 delegated acts were adopted under the TMR based on JRs amending the technical measures set out in the Annexes to that Regulation as well as adopting specific measures to protect marine mammals (harbour porpoise and dolphins) for Natura 2000 sites.
·74 delegated acts
were adopted specifying details of implementation of the landing obligation (Article 15) of which 7 are still in force today and 11 were adopted to implement international obligations on the landing obligation.
Evidence from 2014-2024 indicates that the duration of JR preparation and submission varies substantially depending on the regulatory subject, duration of negotiations among Member States (due to diverging political priorities, contentious measures, time to collect relevant supporting information, level of impact of the proposed measures on other Member States, etc.), duration of consultations with ACs, and feedback from the Commission.
On the other hand, the time required for the Commission to adopt a delegated act based on a JR can depend on different factors, notably obtaining robust scientific advice. Revisions and requests to Member States for further information following scientific advice contributed to longer timelines.
Disruptions caused by the COVID-19 pandemic (2020-2021) had a pronounced impact owing to remote working constraints and postponed meetings. Some improvement in timeliness was observed in the most recent years (2022-2024) due to increased experience with the process from all parties involved.
However, challenges persist, particularly when proposals aim to partially or completely restrict fishing activities with the aim to protect sensitive habitats or species. Specific challenges relate to lengthy scientific data collection periods and long negotiation periods (due to unanimity requirements) and results that can be less ambitious than the conservation measures suggested by the ‘initiating Member State’.
3.3.2 Evolution of stakeholder involvement
The CFP Regulation’s main tool to reinforce stakeholder cooperation is the involvement of ACs. The Regulation provides ACs with a specific role in fisheries and aquaculture management through the submission of recommendations to the Commission, Member States and MSGs. These submissions provide stakeholder insights supporting the development of conservation and management measures. Their membership is designed to reflect both business interests, as well as other interest groups (OIGs) such as NGOs.
Over the assessed period (2014-2024), the number of ACs recommendations have increased by 86% (from 59 in 2014 to 110 in 2024). However, structural imbalances between industry representatives and OIGs persist since 2020, with many ACs having difficulties to meet the regulatory representation requirement of 60% business and 40% OIGs. Following a drop in membership, OIGs are currently under-represented.
In parallel, the involvement of fishers in other consultation fora for the blue economy sectors regulated outside of the CFP (e.g. maritime spatial planning, strategic environmental assessments, etc.) have significantly increased. ACs have been instrumental in formulating advice on other policy areas, although this is outside their mandate.
3.3.3 Evolution of stocks under each management type
The CFP Regulation established four types of fisheries management: for EU waters, stocks of common interest, RFMOs and SFPAs.
Across the evaluation period, the total number of assessed stocks remains broadly stable, with EU-only stocks consistently representing the largest management category until 2020 (approx. 3/4 of managed stocks). From 2020 onwards, a marked increase in the number and share of stocks of common interest is observed with EU only stocks representing only 1/5 of all managed stocks (see Fig.33, Annex VI). This shift reflects geopolitical changes following the United Kingdom’s withdrawal from the EU, where several stocks previously managed exclusively under EU competence became jointly managed with a third country.
The same applies to landings, although EU-only stocks represent more in landings post-Brexit (approx. 1/3, see Fig.34, Annex VI and Figure 11 below) than the number of assessed stocks (approx. 1/5). Small-scale vessels consistently land a higher proportion of EU-only stocks than larger vessels (see Fig.35, Annex VI). Although the proportion of stocks of common interest increases after 2021, EU-only stocks continue to represent most of small-scale landings.

Figure 11 - Landings in volume by management system 2014-2024
Source: the STECF FDI dataset. “Shared” refers to stocks of common interest.
Regarding the value of landings, the same trend is observed with an increase in the value associated with stocks of common interest. However, the total value of landings of EU-only stocks remains higher than that of stocks of common interest and equivalent to all other than EU-only stocks combined (see Fig.36, Annex VI).
Stocks managed under RFMOs and SFPAs account for a smaller and relatively stable share throughout the period. This is also the case for landings in volume and value. However, the decrease of total landings over the period has led to the relative increase in their proportion of total landings.
3.3.4 Evolution of data collection and scientific advice
Between 2014-2024, data collection expanded in scope through the inclusion of land-locked countries in 2017 and new requirements incorporated in 2017 and in 2022, on fisheries, environmental impacts (including bycatch of sensitive species), recreational fisheries, diadromous species, aquaculture and social data. A concomitant improvement in data quality was evidenced.
In 2011, the impact assessment of the CFP Regulation reform evaluated the DCF against its predecessor, the DCR, concluding
that the DCF generally fulfilled its intended purposes, however, further rationalisation was necessary to reduce administrative burden.
Between 2014 and 2024, the planning and reporting workflows to the Commission have been further simplified with interactive webpages, and a dedicated IT platform linked to legal obligations under the DCF. Rationalisation of data reporting to end users has improved through regional databases (RDBs) with DCF data at low aggregation level.
|
Agreements and Decisions
|
|
|
|
2014
|
2015
|
2016
|
2017
|
2018
|
2019
|
2020
|
2021
|
2022
|
2023
|
2024
|
|
Baltic
|
Recommendation
|
3
|
2
|
3
|
3
|
5
|
2
|
9
|
16
|
10
|
11
|
19
|
|
|
Decision/Agreement
|
1
|
1
|
0
|
0
|
9
|
9
|
8
|
11
|
7
|
6
|
5
|
|
North Sea and Eastern Arctic
|
Recommendation
|
6
|
6
|
3
|
5
|
14
|
|
|
|
|
|
|
|
|
Decision/Agreement
|
0
|
0
|
0
|
0
|
4
|
|
|
|
|
|
|
|
North Atlantic
|
Recommendation
|
3
|
12
|
10
|
10
|
10
|
|
|
|
|
|
|
|
|
Decision/Agreement
|
0
|
0
|
0
|
0
|
4
|
|
|
|
|
|
|
|
NANSEA
|
Recommendation
|
|
|
|
|
|
7
|
9
|
16
|
10
|
11
|
19
|
|
|
Decision/Agreement
|
|
|
|
|
|
10
|
8
|
11
|
7
|
6
|
5
|
|
Mediterranean and Black Sea
|
Recommendation
|
2
|
7
|
13
|
11
|
4
|
10
|
10
|
13
|
8
|
10
|
6
|
|
|
Decision/Agreement
|
0
|
0
|
0
|
0
|
0
|
0
|
0
|
0
|
0
|
1
|
0
|
|
Long Distance Fisheries
|
Recommendation
|
0
|
1
|
4
|
2
|
2
|
4
|
2
|
2
|
2
|
0
|
5
|
|
|
Decision/Agreement
|
0
|
0
|
0
|
0
|
0
|
0
|
0
|
1
|
0
|
2
|
4
|
|
Large pelagic
|
Recommendation
|
|
|
4
|
4
|
1
|
0
|
2
|
6
|
0
|
9
|
11
|
|
|
Decision/Agreement
|
|
|
0
|
0
|
0
|
0
|
0
|
0
|
0
|
1
|
3
|
|
PGECON / ECON
|
Recommendation
|
6
|
7
|
11
|
18
|
14
|
35
|
9
|
10
|
14
|
16
|
7
|
|
|
Decision/Agreement
|
|
|
|
|
|
|
|
|
|
1
|
|
|
Source
|
Decision/Agreement
|
LM report
|
LM report
|
LM report
|
LM report
|
LM report
|
RCG report
|
RCG report
|
RCG report
|
RCG report
|
DM report
|
DM report
|
Table 4 - Number of decisions and recommendations agreed by the Regional Coordination Groups
Sources: supporting study based on the following: from 2014 to 2017, the Liaison Meeting report was used to gather all agreements and recommendations (https://dcf.ec.europa.eu/regional-coordination/liaison-meetings_en); from 2019 to 2022, RCG reports served as the source (https://dcf.ec.europa.eu/regional-coordination/rcg-reports_en); in 2023 and 2024, the Decision meeting report was used (https://www.fisheries-rcg.eu/rcg-nansea/).
The emphasis on regionalisation resulted in the formation of Regional Coordination Groups (RCGs) for Fisheries Data Collection which produced numerous agreements (from 33 in 2014 to 25 in 2024 – see Tab.23, Annex VI), decisions and recommendations (from 21 in 2014 to 84 in 2024 – see Tab.24, Annex VI and Table 4), leading to six regional work plans adopted in 2024 for all sea basins (see Table 5 and Tab.25, Annex VI). In addition, the total number of coordinated surveys at sea grew in each sea basin over the evaluation period (see Figure 11 and Tab.26, Annex VI), showing the strong commitment of Member States to cooperate.
|
|
RCG
|
Year presented
|
|
Regional Work Plan 2025-2027
|
NANSEA
|
2024
|
|
Regional Work Plan 2025-2027
|
Baltic
|
2024
|
|
Regional Work Plan 2025-2027
|
LDF
|
2024
|
|
Regional Work Plan 2025-2027
|
LP
|
2024
|
|
Regional Work Plan 2025-2027
|
Med & BS
|
2024
|
|
Regional Work Plan 2025-2027
|
ECON
|
2024
|
|
Draft Regional Work Plan 2021 (FishN’Co)
|
NANSEA
|
2020
|
|
Draft Regional Work Plan 2021 (FishN’Co)
|
Baltic
|
2020
|
|
Draft Regional Work Plan 2021 (FishN’Co)
|
LP
|
2020
|
|
Draft Regional Work Plan 2021 (FishN’Co)
|
ECON
|
2020
|
|
Draft Regional Work Plan 2023 (STREAMLINE)
|
Med&BS
|
2022
|
Table 5 - Draft and final Regional Work Plans presented by year and Regional Coordination Group
Source: supporting study based on https://www.fisheries-rcg.eu/; https://dcf.ec.europa.eu/regional-coordination/rcg-reports_en; https://www.fisheries-rcg.eu/projects/
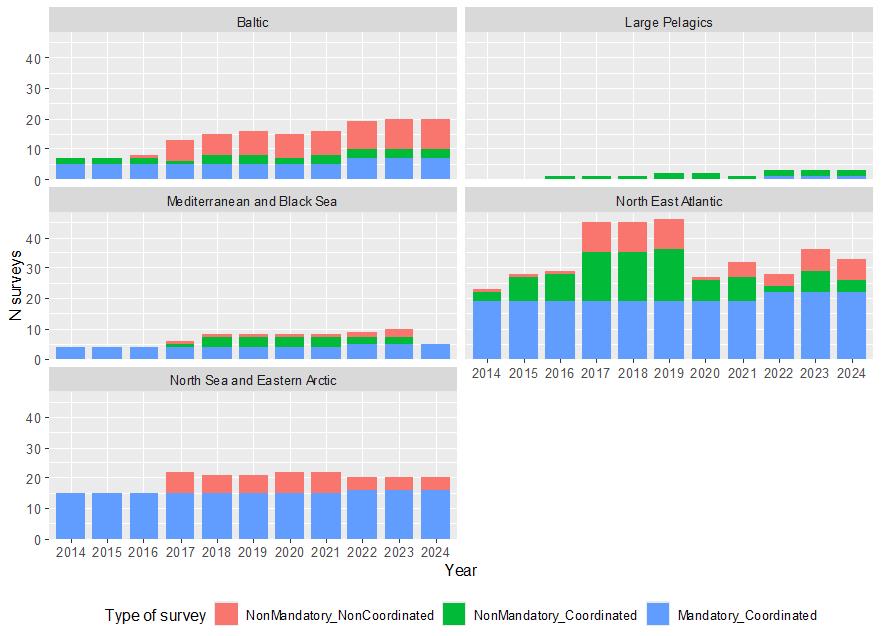
Figure 12 - Total number of surveys performed, indicating if they are mandatory (Y/N), coordinated internationally (Y/N) and not coordinated (N/N) by Regional Coordination Group and year
Source: supporting study
DCF data have been essential in meeting end user needs, including RFMOs and SFPAs. For the DCF data submitted to the end users
the Data Transmission Monitoring Tool (DTMT) was introduced in 2013, improving harmonisation and data reliability. At the same time, there has been a significant increase in the number of data calls and reporting obligations to Member States by most end users (see Table 6 below), while their number remained relatively stable. This is corroborated by an increase in the number of Working Groups using DCF data (see Tab.28, Annex VI). While DCF data was under-utilized beyond the traditional end users in 2015, data requests for scientific purposes increased from 0 in 2014 to 15 in 2024 (see Tab.29, Annex VI), contributing to the multi-use of DCF data.
|
Year
|
DG MARE/ STECF
|
ICES
|
GFCM
|
ICCAT
|
IOTC
|
NAFO
|
|
2014
|
5
|
2
|
|
7
|
|
5
|
|
2015
|
3
|
7
|
|
7
|
2
|
5
|
|
2016
|
4
|
9
|
|
7
|
2
|
5
|
|
2017
|
4
|
10
|
39
|
7
|
3
|
5
|
|
2018
|
4
|
14
|
44
|
7
|
5
|
5
|
|
2019
|
5
|
13
|
57
|
7
|
7
|
5
|
|
2020
|
5
|
12
|
70
|
7
|
7
|
5
|
|
2021
|
5
|
16
|
79
|
7
|
7
|
5
|
|
2022
|
5
|
15
|
91
|
9
|
7
|
5
|
|
2023
|
5
|
17
|
119
|
9
|
11
|
5
|
|
2024
|
5
|
13
|
140
|
10
|
12
|
5
|
Table 6 - Number of data calls and reporting obligations issued by end user
Source: supporting study
Decision-making was based on the best available scientific advice provided by highly reputable and independent scientific bodies, such as ICES and STECF, which operate with the support of dedicated national scientists from the EU Member States. In the case of RFMOs the advice is provided by their respective Scientific Committees, where EU scientists also participate.
Between 2014-2024, a substantial increase in the number of conclusive assessments was observed for ICES and RFMO stocks (see Fig.37-38, Annex VI), together with increases in the number of stocks assessed by some RFMOs (e.g. ICCAT, GFCM, NAFO, etc), as a result of strengthened data collection, harmonized methodologies, and longer time series, reducing uncertainty and improving reliability of stock assessments. Between 2014 and 2023, the proportion of stock assessments with known reference points increased significantly, from 44% to 66% (see Tab.30-31, Annex VI). The share of catches from stocks with known reference points also rose slightly, reaching 96% for biomass and 86% for fishing mortality (see Tab.32-33, Annex VI), as most major stocks were already well assessed when the CFP Regulation came into effect.
Despite extensive academic work on Management Strategy Evaluation (MSE)
over the past decade, the use of such approaches in operational fisheries management has remained limited for stocks within the EU. In RFMO-managed stocks, it increased significantly (see Fig.39-43, Annex VI), with EU support reflecting a more adaptive and risk-averse approach to fisheries management.
Between 2014 and 2024, scientific advice on environmental impacts of fisheries grew from 3 to 18 (see Tab.34, Annex VI), addressing multiple dimensions like bycatch, seabed impacts, sensitive species, and VMEs. By later years, multiple environmental dimensions were covered simultaneously. Scientific advice incorporating socio-economic considerations increased from 1 in 2014 to 31 in 2020 (see Tab.35, Annex VI), across all the major sea basins, reflecting a growing demand for socio-economic integration within scientific advice.
3.3.5 Evolution of compliance by Member States
Since the entry into force of the CFP Regulation, the Commission handled 27 infringement cases concerning alleged non-compliance with the CFP rules (2 ongoing). Only 10 infringement cases (37%) specifically concerned an alleged non-compliance with the CFP Regulation as legal basis linked to provisions on multiannual plans, the landing obligation, and control and enforcement. However, given that the EU’s secondary CFP legislation details the provisions of the CFP Regulation and therefore contributes to achieving its objectives, the analysis includes all infringements rather than focusing only on those using the CFP Regulation as a legal basis. Overall, 19 cases concerned control and enforcement, 10 concerned conservation measures, 4 concerned the external policy, 1 concerned access to waters, and 1 concerned the common market. Infringement cases covered all major EU sea-basins, with a predominance of cases concerning the Mediterranean (10 out of 19).
The 27 infringement cases covered approximately 245 non-compliances, ranging between 1 and 54 non-compliances per infringement case. About 197 non-compliances were successfully resolved (80%) and thus led the Member States concerned to remedy the situation. However, in about 48 non-compliances (20%), it could not be concluded that the Member State concerned had not complied with its obligations. The reasons for this varied: insufficient evidence, consequential non-compliances, a changing legal framework, or a combination thereof. Five of the seven unsuccessful cases specifically concerned non-compliance with the landing obligation and control and enforcement provisions. These cases were eventually closed in view of the adoption of the revised Control Regulation.
3.3.6 Evolution of control and enforcement by Member States
The control and enforcement of the CFP is based on the objectives and principles set out in Article 36(2) of the CFP Regulation. The Fisheries Control Regulation is the legal instrument that sets out detailed rules on control and enforcement. In 2017 and 2021, the Commission adopted reports on the implementation and evaluation of the Control Regulation covering two consecutive 5-year periods (2010-2014 and 2015-2019).
Audits and verifications performed by the Commission indicated many significant shortcomings concerning the control, enforcement and implementation of essential EU rules which may jeopardise the long-term objectives of the CFP, as laid out in the CFP Regulation
. The Fisheries Control Regulation has since been revised in 2023, with its related secondary legislation being developed up to 2029.
In terms of actions taken under the Control Regulation, over the reporting period 2019-2024, in parallel to negotiating the revision of the Control Regulation, the Commission has developed and maintained IT infrastructure that enables the exchange of fisheries data, conducted around 50 audits, and offered expert guidance to facilitate implementation of control measures by the Member States. Data exchanges have increased, and quota transfers streamlined, leading to greater transparency and efficiency.
The use of new surveillance technologies, such as drones (from 39 devices in 2019 to 56 devices in 2024) and sophisticated electronic reporting systems, has reinforced fisheries inspections and monitoring. In 2024, 96% of vessels over 15 metres and 48% of vessels between 12-15 metres (up from 36% in 2020) were equipped with vessel-monitoring systems (VMS). There has also been a notable rise in the number of patrol days (from 100,000 days in 2015-2019 to 115,000 in 2020-2024) at sea and the operational use of aerial surveillance assets.
Persistent challenges remain, however, such as discarding, inconsistencies in reporting, the dependency on unreliable paper-based systems, and limited or insufficient monitoring of some fleets, such as the SSF, the DWF etc. Deficiencies in data-validation, traceability systems, and the sanctions applied for infringements also remain. A number of these challenges (paper-based systems, sanction system, vessel tracking, fishing activity data) are addressed by the revised Control Regulation.
3.3.7 Evolution of the EU’s international presence and action
The EU continued upholding and strengthening multilateral fisheries governance at global level, in particular in the context of the UN (e.g. UNGA Resolution on Fisheries, UNGA Resolution on VMEs, review of UNFSA), as well as of other relevant global instruments, such as FAO, PSMA, WTO (fisheries subsidies). The EU also reinforced its bilateral high-level fisheries dialogues with key partners, namely, Australia, Canada, Chile, China, Japan, Iceland, India, Indonesia, New Zealand, Norway and USA. During the evaluation period, the EU joined 3 new RFMO/As, namely CCSBT, CAOFA and NPFC (see full list in footnote 3).
Many of the key contributions of the EU in RFMOs were made by tabling and/or co-sponsoring proposals in RFMOs which aimed at rebuilding or maintaining stocks at sustainable levels, reducing negative impacts of international fisheries on marine ecosystems and biodiversity, and reinforcing effective documentation and control of fishing activities, including high-risk operations such as transhipments. These proposals also aimed at strengthening the scientific basis underpinning the decision-making processes, stepping up the fight against IUU, and promoting performance reviews as basis for further improvements in the functioning and governance of RFMOs. Examples of key developments supported by the EU are shown in Tab.36 of Annex VI.
The total number of SFPAs has remained stable over the period 2014-2024. The specific list of active SFPAs has varied over the period, with a minimum of 10 active in any one year (see full list in footnote 4). The distribution over ocean basins has also been stable with a majority of SFPAs concluded in the Atlantic. In addition, SFPA sectoral support provided around € 28 million on average annually i.e. on aggregate over the period 2015-2020, 26 % of the EU contributions for sectoral support in the framework of SFPAs focused on developing partner countries’ capacity to establish management measures and monitor and control fishing activities under their responsibility.
Employment conditions of third country fishers onboard EU vessels fishing under SFPAs are governed by a social clause introduced in protocols from 2018. The latest protocol concluded with Seychelles (2020) increased the scope of social benefits to include inter alia pension benefits and end of contract’s compensation benefits. Since 2024, the social clause has been further strengthened and includes a clear reference to the ILO convention on fundamental principles and rights at work, to freedom of association, to the effective recognition of the right to collective bargaining, and the elimination of discrimination. The revamped social clause has been included in the recently signed protocols with Cabo Verde, Guinea-Bissau, Côte d’Ivoire, and Sao Tome. The role of RFMOs in addressing labour issues has been also increasing during the evaluation period. The EU has supported integrating the ILO Work in Fishing Convention in some RFMOs, such as ICCAT and WCPFC.
Moreover, almost all SFPAs since 2015 contain a transparency clause which, depending on the SFPA, requires partner countries either to make public the agreements authorizing non-EU foreign fleets in national waters, or to inform the EU about them via the Joint Committee. In practice, very few partner countries actually publish these agreements with foreign fleets, and when the agreements are provided in Joint Committees, there are some indications that the information is sometimes below expectations. However, for many SFPAs, this does allow the EU to access scientific data on the activity of foreign fleets at the appropriate granularity level.
As a major global importer of fishery products, the EU has a responsibility and the tools to prevent products from IUU fishing entering its market, which can at the same time contribute to a level playing field for operators. To this end, the EU IUU Regulation 2008/1005 introduced a Catch Certification Scheme and a system for cooperation with non-EU countries in the implementation of their international responsibilities as flag, coastal, port and market States.
The EU catch certification scheme in place since 2010 is pioneering and most comprehensive globally with 93 non-EU countries notified when exporting to the EU. Since 10 January 2026 it has been digitalised through CATCH to improve traceability. More than 1500 EU importer declarations were validated in its first 10 days of operation.
Under the bilateral IUU cooperation pillar, the EU has engaged with 77 countries globally since the entry into force of the IUU Regulation. 28 countries have been pre-identified as non-cooperating with the EU in the fight against IUU fishing, via a warning (yellow card). For 15 of them the lack of substantive reforms and political commitment triggered identification and listing as non-cooperating, resulting in a ban on imports of fishery products originating from them (red card). Bilateral IUU dialogues have prevented the identification of 14 yellow-carded countries, while 3 red cards have been successfully lifted. At the end of 2025, there were 8 pre-identified and 5 identified non-EU countries with ongoing IUU formal dialogues.
During the evaluation period significant synergies between the external policy and other EU sectorial policies have been evidenced. In this regard, NDICI – Global Europe played an important role in supporting and complementing their implementation, through several regional, continental, cross-continental and bilateral programmes covering marine and inland fisheries as well as aquaculture around the world, including to combat IUU and promote sustainable and inclusive aquatic food systems. Regional programmes such as PESCAO, TRUEFISH, ECOFISH, PEUMP, have supported the improvement of the management of shared fish stocks, through data collection, strengthening scientific advice, development of management plans, and providing support to regional fisheries bodies in West Africa, the Indian Ocean and the Pacific. Moreover, the EU has actively supported the mainstreaming of relevant environmental policies, for instance through the adoption of provisions to reduce marine litter and plastics in several RFMOs, such as IOTC, WCPFC and CCAMLR. Also, synergies between the CFP and the EU trade policy have been strengthened during the evaluation period. At multilateral level, the WTO Fisheries Subsidies Agreement was a major step in establishing multilateral rules on fisheries subsidies. Bilateral agreements between the EU and third countries (FTAs) include chapters on trade and sustainable development, which now systematically cover fisheries and aquaculture. Finally, marine and maritime research, including fisheries, has been increasingly supported through EU’s framework programme (FP) for research and innovation, currently Horizon Europe, and previously Horizon 2020 (H2020) and FP7.
4.Evaluation findings
The following findings are structured around the five Better Regulations criteria. In answering the effectiveness criteria, the answers are built around the seven main impacts of the intervention logic, which echo the objectives of the CFP Regulation i.e. the impacts correspond to what should have been achieved if the objectives were successfully implemented.
The methodology relies on observational data to understand complex situations and to assess whether the results and impacts align with the expected causal pathways between the implemented activities, their expected outputs as defined in the 2011 impact assessment, and the results and impacts observed in practice. These links were based on the intervention logic and theoretical considerations set out in the previous impact assessment, as outlined in section 2.1. In the absence of experimental or quasi-experimental counterfactual designs, these findings should be interpreted as indicating contributions and likely causal pathways, subject to the limitations of the available evidence and underlying assumptions.
4.1 To what extent was the intervention successful and why?
4.1.1 Effectiveness
Impact 1: Long-term conservation and sustainable exploitation of fisheries resources
Since 2014, the CFP Regulation has strengthened the regulatory, scientific and governance frameworks underpinning sustainable fisheries management, but translation into consistent and widespread positive environmental outcomes is considered to be moderate.
Regarding sustainable exploitation of marine biological resources, clear progress is observed in reducing fishing pressure on harvested stocks towards the target of maximum sustainable yield exploitation rate (FMSY), although the expected timeframe (2020) was not met. However, improvements in fishing mortality have not translated into consistent stock rebuilding and, therefore, the Regulation’s overarching objective of rebuilding and maintaining harvested populations above levels which can produce maximum sustainable yield (BMSY) has not been reached. Various stakeholder groups highlighted different difficulties around the practical application of the MSY concept and existing practices (e.g. mixed fisheries) or uncertainties (e.g. multispecies interactions, climate change or environmental conditions) (see Annex V).
Several reasons can explain why the reduction of fishing pressure towards sustainable levels (F/FMSY<1) did not result in the expected biomass growth of fish stocks, such as, short timeframe (more time is needed to see results, especially for less productive stocks), legacy depletion (measures aiming at reducing fishing pressure were implemented too late or applied reductions were insufficient for rebuilding impaired stocks or ecosystems), and additional pressures beyond fisheries (such as decline in natural productivity driven notably by climate change or habitat degradation by pollution and eutrophication). It is impossible to generalise and attribute those results to a single driver, as they are more likely to be the result of cumulative effects.
Differences between sea basins can also point to some reasons as more relevant than others. The Baltic Sea and the Black Sea are particular cases with poor ecosystem situations that impact fish stocks. There is also a growing body of scientific evidence that shows a general decline in ecosystem productivity across the wider North-East Atlantic most likely linked to climate change. Misreporting has also been identified by ICES as one problem affecting the accuracy of assessments, which are the basis of management measures. This misreporting may therefore impact the state of fish stock in some areas but, as with external pressures, the extent is unknown.
Finally, while the previous impact assessment made a clear link between excess capacity and overfishing, evidence for the 2014-2024 period shows that even though overcapacity persists within the EU, exploitation rates (F) have reduced significantly over time towards FMSY.
Significant progress in terms of meeting conservation and sustainability objectives was achieved in RFMOs. Some emblematic stocks that, for many years, had raised strong concerns within the civil society, have been rebuilt during the evaluation period. This was the case, for instance, for the bluefin tuna stocks, in the Atlantic, Pacific and Southern Oceans, that all rebuilt faster than foreseen following the adoption and successful implementation of robust management and control frameworks adopted by ICCAT, WCPFC, IATTC and CCSBT. Positive trends have also been experienced for some important demersal stocks under the purview of RFMOs, such as toothfish or cod (e.g. CCAMLR, NAFO). The adoption of more precautionary objectives and the gradual introduction in many RFMOs of robust and adaptive management frameworks based on MSE, driven to some extent by certification requirements, appear to be among the key drivers of these positive developments.
Impact 2: Protection of aquatic ecosystems
With respect to the implementation of an ecosystem-based approach to fisheries management to ensure that negative impacts of fishing on the marine ecosystem are minimised, the CFP Regulation has strengthened knowledge and enabling conditions through expanded spatial protection, adoption of conservation and technical measures and increased international engagement.
Nevertheless, progress towards eliminating discards has been limited. Although selectivity improvements and technical innovation have been promoted, discarding remains a structural feature of many fisheries, especially mixed fisheries, and the objective of eliminating discards has not been achieved.
There was no evidence to show that the entry into force of the landing obligation resulted in a relevant change in fishing behaviour or catch composition and, therefore, its contribution to increasing selectivity and reducing discards was negligible. Stakeholders have very diverging views on this topic (see Annex V). Many business associations and public authorities argue that the landing obligation is ineffective because it is badly defined and impractical, while NGOs have the view that this is due to a clear lack of compliance, as well as the extent of the exemptions, a point that was also raised by the scientific community. A lack of clear and uniform application by Member States on effective control means may also have contributed to limited control and enforcement (5 out of 7 unsuccessful infringement cases). The revised Control Regulation adopted in 2023 seeks to address this weakness with new provisions on the control of the landing obligation that will enter into force in 2028.
The main reasons behind the unsuccessful implementation of the landing obligation are: the insufficient data on discards occurring under the existing exemptions, the high number of these exemptions, the lack of incentives for fishers to comply, the ineffective monitoring and enforcement tools and lack of control, and the low uptake and buy-in at industry level who considered this measure difficult to implement.
Also of relevance to the minimisation of adverse impacts on the marine environment is the coverage of MPAs and FRAs which has increased substantially since the beginning of the implementation of the CFP Regulation. However, evidence of direct ecological effectiveness remains limited. Incidental catches of sensitive species show no consistent declining trend at EU scale, although in several regions, it cannot be robustly assessed due to data limitations.
At international levels, RFMOs have progressed in terms of implementing an ecosystem approach, albeit in different ways and at different paces. Most, if not all, RFMOs have adopted binding measures for minimising interactions and negative impacts on sensitive species (e.g. protected sharks, seabirds, sea turtles, cetaceans) and marine ecosystems (e.g. VMEs). However, limitations in data collection, observer coverage and monitoring still hamper, in some cases, a robust assessment of the expected conservation benefits. Another positive ongoing development, supported by the EU in many RFMOs, concerns the scientific integration of ecosystem level information, through the development of dedicated scientific approaches aiming at capturing impacts from key environmental factors, including climate change, on international fisheries.
The CFP Regulation, together with dedicated EU funding, has been more effective in supporting the strengthening of data collection, scientific advice and governance. Harmonisation in data collection and improved coordination through Regional Coordination Groups have resulted in Regional Work Plans, while the use of fisheries data for management has increased, particularly since 2020. Scientific advice has broadened in scope, with greater integration of ecosystem and socio-economic considerations and expanded coverage in international contexts. However, gaps remain in timeliness, regional coverage, and advice addressing discard reduction.
Finally, in aquaculture, the CFP Regulation, together with the dedicated fund, has encouraged the adoption of environmental sustainability measures in most Member States. The environmental objectives set by the CFP Regulation for the MNSPAs have contributed to the adoption of measures by Member States supporting the environmental performance of aquaculture activities. However, implementation remains uneven and there is a lack of evidence to demonstrate a sector-wide transition towards environmentally sustainable practices.
Impact 3: Strengthened economic performance of the sector
Since the 2013 reform, stock recovery has been uneven across sea basins and species, with a significant number of stocks still below healthy biomass levels. In the short to medium term, this incomplete recovery has translated into restricted fishing opportunities and lower catches for parts of the EU fleet, contributing to income losses in several fleet segments and regions. In this sense, lower incomes reflect adjustment on the pathway towards more abundant stocks and better economic performance of the fishing fleet in the long-term. While all three fleet categories have experienced a decrease in landings, this has not translated into a comparable loss of profitability.
In addition, incomplete capacity reduction of the fleet appears strongly correlated to the lack of profitability of the EU fishing fleet. The reluctance of Member States to engage in far-reaching rationalisation plans that would have a strong short-term impact on employment, has led to a slow unavoidable degradation of the socio-economic situation. Having too much capacity for too few resources produces suboptimal economic outcomes for the fishing sector. Public support has only partially alleviated these difficulties, through temporary and permanent cessation schemes. However, these schemes are only offered to a limited number of vessels. Evidence shows that 31% of permanent cessations occurredwith public funding and when unavailable to operators, many of them choose to remain in the sector, whether for financial reasons, desire to maintain access to fishing and/or fishing opportunities, lack of alternatives or other reasons. This appears to have led to increasing political pressure to maintain or increase fishing effort and even deviate from scientific advice.
During the negotiation of the CFP Regulation, fishing capacity ceilings replaced TFCs as the main mechanism for this rationalisation. This alternative mechanism does not appear to have achieved the expected reduction of capacity.
Limited profitability constrains the ability of operators to invest in fleet modernisation and renewal. Together with the strict conditions regarding the use of public funding to support these investments, this results in a number of ageing fleet segments posing safety risks, technologically outdated and less competitive than some foreign fishing fleets. The ageing of vessels, coupled with high energy dependency and rising operational costs, further erodes economic resilience toward external shocks and uncertainties.
In the stakeholder consultation, the fishing sector criticised the way capacity is measured.
On the one hand, the sector claims that kW and GT metrics do not reflect real fishing effort, which is increasingly driven by factors such as gear efficiency, digitalisation and vessel modernisation. However, the study on the EU fishing fleet highlights that short-term solutions to reduce fossil fuel consumption in fisheries generally do not involve increasing capacity (in GT or kW) and may help to minimise energy use before shifting over to alternative fuels.
On the other hand, critics also point out that current CFP rules do not distinguish between vessel volume that is directly related to harvesting capacity and volume linked to other functional purposes. In particular, vessel volume is not decomposed into subcomponents reflecting different functions (e.g. safety, energy transition, fishing capacity, and crew wellbeing), which limits the ability to appropriately control and monitor vessel volumes in line with their actual impacts on fishing capacity. This, in turn, may constrain opportunities to allocate more space for improved living and working conditions on board or for larger alternative fuel engines.
These elements must also be placed in a context where many Member States currently have spare capacity margins which remain unused for the energy transition of their fleets. The need for Member States to further rationalise or re-distribute the capacity of their fleets therefore appears to be an imperative both for long-term socio-economic viability and for a successful energy transition.
While EU aquaculture is generally profitable, the economic sustainability of EU aquaculture between 2017 and 2022 presents a varied landscape, with some segments showing growth and others experiencing significant challenges. The sector remains relatively small, limiting its capacity to significantly strengthen the overall economic performance of the EU aquatic food sector and its contribution to the EU blue economy.
The EU fishery and aquaculture sector has faced significant uncertainties in recent years, driven by a series of unexpected events that have disrupted operations and market dynamics. Such uncertainties impact heavily the economic sustainability of fisheries and aquaculture. Brexit reduced fishing opportunities, while the COVID-19 pandemic caused sudden shifts in demand, supply chains, and consumption patterns, favouring frozen and canned products. The war in Ukraine further exacerbated challenges by driving up energy, feed, and fertilizer prices, as well as increasing production costs across fisheries and aquaculture. Additionally, consumer behaviour has evolved, with rising demand for processed, convenient seafood products and growing trade-offs between price, quality, and sustainability. While these uncertainties stem from events beyond CFP control, stakeholders expect the policy to offer tools to mitigate some of those impacts.
In relation to market uncertainty and income stability, the post-2013 framework of the CFP and CMO Regulations has shifted away from classical market intervention towards collective planning. In particular, production and marketing plans (PMPs) empower producer organisations (POs) to pool resources, collectively programme production and marketing activities, and better align supply to market requirements. This market policy orientation is also reflected in the funding pattern: support has been channelled predominantly to POs through PMPs, whereas storage aid has been used only marginally.As a result, POs no longer rely on traditional market intervention tools
which confirms that POs were able to adapt swiftly to the new market tools in particular PMPs.
POs focused on collectively organising supply, possibly through quota management and mutualising resources to carry-out market-oriented activities (quality standards, certification, promotion and communication). In parallel, the representativeness of POs has increased over the period, strengthening their legitimacy as collective actors within the market. At the same time, inherent price volatility persists, notably for quota-managed species, and the extent to which POs mitigate such variability remains unclear. Only a certain share of POs manages quotas, sales or negotiates prices collectively, and many producers prefer to retain autonomy over marketing and sales channels, thereby reducing the scope for observable price stabilisation effects at EU level. Besides, weak structuring of small-scale fishers and aquaculture farmers through POs limits their ability to benefit from collective bargaining power. Overall, however, the structuration of the market appears to have been broadly effective in strengthening POs’ capacity to engage in market-oriented activities, thereby contributing to the CFP Regulation’s economic objective. Challenges remain in fully translating these organisational gains into more stable prices and incomes across all segments of the sector.
In response to a growing demand from decision-makers and stakeholders for socio-economic data, economic considerations are increasingly reflected in scientific advice under the CFP Regulation, while the inclusion of social considerations is still in the early stages of development. However, the inclusion of such data has often resulted in assessments that tend to focus primarily on short-term distributional and income effects, whereas the Regulation’s management objectives are inherently long-term. In practice, this short-term framing can reinforce policy choices that prioritise immediate economic relief over longer-term stock rebuilding and sector resilience, leading to trade-offs that risk suboptimal outcomes for resource sustainability, for medium- and longer-term employment, wages and profitability, and for the future viability of the fishing industry. This problem had already been identified in 2011 and, due to the persistent challenges identified in this section, has not been effectively remedied.
Impact 4: Contribution to long term food security
The EU's dependence on imported FAPs has significantly increased since the last reform of the CFP Regulation. This trend is driven by a combination of declining domestic landings and stagnation in aquaculture, which is not sufficient to meet domestic demand even in a context of declining apparent consumption. Domestic production from both fisheries and aquaculture now covers only 38% of the EU's aquatic food demand, with many of the most consumed species being imported. The strong reliance of the EU fish processing industry on imported raw materials increases its exposure to global market volatility and external shocks.
Despite the Regulation's objective of promoting sustainable aquaculture growth, progress has been minimal, around 2% between 2013 and 2023. This stagnation is largely due to persistent regulatory and administrative challenges, such as complex licensing procedures, as well as limited access to suitable sites for aquaculture development. Additionally, aquaculture has not received sufficient political attention at national level, further hindering the capacity to take the necessary action to support its growth. Mechanisms like the Commission's Strategic Guidelines, Multi-annual National Strategic Plans for aquaculture (MNSPAs) and the Open Method of Coordination (OMC) have had limited impact on complex licensing procedures and access to space, as evidenced by the mid-term assessment of the implementation of the strategic guidelines. This has resulted in an uneven playing field for aquaculture producers in different Member States/regions. All these elements discourage investment in the sector.
During the evaluation period, the EU became member to three new RFMOs and access to new fishing grounds and fishing opportunities were obtained, in particular in the North Pacific Ocean. The number of SFPAs has remained steady between 2014 and 2024, ensuring continued access to important fishing grounds, particularly in the Atlantic. Long-standing partnerships with countries like Mauritania, Côte d’Ivoire, Seychelles, and Greenland have deepened economic ties and strengthened cooperation. Although RFMOs and SFPAs have continued to contribute significantly to the EU's supply of a variety of species, including highly migratory species, overall landings by the EU DWF have been decreasing during the evaluation period.
The EU fleet is generally subject to stricter standards than other fleets, whether environmental standards or social standards, as pointed out by business associations and some ACs in the public consultation. This puts the EU fleet at a competitive disadvantage due to the costs of implementation and compliance with such standards in fisheries shared with non-EU countries that have lower standards.
The CFP Regulation has contributed to improving the international level playing field by leveraging EU external fisheries instruments, notably via RFMOs and SFPAs, to fighting against IUU and to promoting higher standards of compliance, transparency and responsibility, environmental and social standards in line with those applied in the EU, such as those deriving from the IMO and ILO, as well as technical standards such as, the use of the UN/FLUX standard for sharing VMS and e-logbook data. This has proved more difficult to achieve in the complex multilateral context of RFMOs, due in particular to the significant differences in terms of development and capacities among the respective members of these organisations, therefore remaining a longer-term objective that may only be achieved incrementally.
All SFPAs include a non-discrimination clause and a transparency clause, which aim at ensuring that the EU fleet does not face unfair competition from other foreign fleets. While some potential discrimination issues have been reported, these remain centred on specific types of fisheries in specific countries and the EU generally has access to information on other fleets with an appropriate level of detail. In the case of dormant SFPAs (where there is no implementing protocol), the exclusivity clause has in some cases adverse effects on level playing field, as the lack of implementing protocols prevents EU operators from fishing in those partner countries while other foreign fleets have access to the fishing zones.
With regards to aquaculture, the EU promotes sustainabile aquaculture at global and regional levels. In particular, the EU has played a major role in the development and adoption of the FAO Guidelines for Sustainable Aquaculture and supports their dissemination and implementation on a voluntary basis. The EU also promotes the sustainability of aquaculture activities within the framework of the GFCM 2030 Strategy for Fisheries and Aquaculture.
In terms of fair competition on the EU market, the mandatory consumer information requirements under the CMO Regulation provide an important basis for a level playing field; however, their scope does not extend to prepared and preserved (i.e. processed) FAPs, even though consumers are increasingly shifting towards these products. As a result, a growing share of products competing on the EU market, and in the same retail environment, are not subject to the specific CMO information requirements, which can affect comparability across products and to some extent consumers’ ability to make informed choices.
In addition, while origin information is formally provided for fishery and aquaculture products, in practice transparency may be limited for fishery products, as certain elements (notably catch area information and the way it is presented) can be technical, difficult to interpret and occasionally ambiguous for consumers. This can limit the effectiveness of labelling in supporting informed purchasing choices and fair competition.
Impact 5: Improved livelihoods of coastal and inland communities
Throughout the period, employment in the catch sector continued to decline, albeit less so than foreseen. Evidence suggests a correlation with the situation of the active fleet: since overcapacity was not reduced as expected across all fleet segments, this may have artificially protected employment. However, for many sea basins and fleet segments, this relative protection could not take place on a viable economic basis, as the main economic indicators attest.
While the relative “sparing” of employment can be considered positive for fisheries and the coastal communities depending on them in the short to medium term, the lack of economic sustainability appears to have had knock-on effects on wages and full-time employment.
Wages in the catch sector have remained largely stable relative to national averages, with no evidence of convergence or improvement over time, except in very specific segments of the fleet (LSF and DWF). The impact assessment had, on the contrary, expected wages to improve significantly due to the rationalisation of the fleet and improvement of stocks. This absence of improvement may also be linked to external shocks, notably the COVID-19 pandemic and energy price volatility.
Declining FTE-to-employment ratios points to a growing prevalence of reduced-hour or seasonal work, weakening job stability. There is also a clear ageing of the EU fishers, which is not compensated for by a sufficient influx of new entrants. This problem of generational renewal was mentioned in the stakeholder consultation by business associations, ACs, as well as public authorities, and is further compounded by the general ageing of the European population as well as difficult working conditions and safety, which do not seem to be improving for the catch sector.
The CFP Regulation intends to support small-scale and coastal fleets primarily through encouraging quota allocation criteria and preferential access within the 12-nautical-mile zone, both of which remain national prerogatives. Evidence shows that support for coastal fisheries seems to have been more administrative (through allocation criteria) than spatial, and limited data prevents an assessment of whether this support has expanded since 2014. SSCF stakeholders consider unequal access to fishing opportunities as a critical concern for their viability. Evidence also shows that limited capacity rationalisation in the SSCF (compared to the LSF and DWF) may have contributed to business models where economic viability is harder to achieve. In many cases, this relative protection of SSCF is linked to its higher perceived value to the livelihoods of coastal communities.
In aquaculture, aggregated employment has remained broadly stable since 2016, notwithstanding the objective of the CFP Regulation to promote the sustainable development and growth of the sector. The prevalence of part-time work remains constant over the period while youth employment has declined markedly since 2017, indicating reduced sector attractiveness and an ageing workforce. Nominal wage growth has not kept pace with inflation, implying declining real purchasing power, while relative wages remain well below national averages.
The processing sector has been comparatively more resilient, with a slight increase in employment, predominant full-time employment and wage growth. However, differences remain between Member States and overall earning power remains below national averages in most countries.
Regarding safety, outcomes are inconclusive but seem to point to a worsening of the safety conditions onboard vessels as they continue to age and face increasing extreme climatic events, compared to processing or aquaculture. Business associations and some ACs state that the current calculation of capacity prevents potential safety-related vessel improvements, which is partially contradicted by the existing unused capacity in many national fleets which could be allocated to address these concerns. That said, while the impact assessment and recitals of the CFP Regulation both mention safety issues, there is no clear evidence to attribute improvement or decline of safety primarily to capacity ceiling rules under the CFP Regulation: other important EU legislation regarding the safety and working conditions onboard vessels play a key role, most notably Directive EU 2017/159 and Directive 93/103/EC as well as other factors such as the ageing of the fishing fleet and uneven access to national safety training
, particularly for small-scale fishers. The ageing fleet can be linked to difficulties in raising finance, as well as uncertainty over the long-term business model.
Overall, the outcome of the CFP intervention for coastal communities linked to fishing, processing and aquaculture is mixed. Structural difficulties persist in the catch and aquaculture sector, which seem to be deterring new generations from entering the sector, while the processing sector is relatively more resilient. This is linked to poor economic performance as well as factors that go beyond the remit of the CFP Regulation (demographic ageing, safety and working conditions).
Impact 6: A clear and efficient governance allows for the objectives of the CFP Regulation to be fulfilled
Data collection
The CFP has been effective in strengthening data collection, which is essential to underpin robust scientific advice, with EU funding playing a vital role in supporting Member States to develop and implement their respective data collection programs. Rationalisation and flexibility were achieved by setting minimum requirements in the legislative framework, while allowing end users and regional specificities to further refine data collection. This new perspective has been feeding into the work of end users, such as ICES, STECF, the scientific committees of RFMOs and the Joint Scientific Committees under SFPAs. At the same time, policy needs have increased and expanded, which, combined with a lack of clear prioritisation processes, have added pressure on Member States to collect more data despite fixed financial allocations, and on end users to deliver advice on a wider range of topics. This required Member States and end users to build new expertise, develop procedures and invest in infrastructure, gradually reaching their limits. Such emerging requirements, for which end-user needs are not yet fully defined, have resulted in data collectors not investing in data collection unless there is a dedicated data call, and end users not able to deliver in the absence of time series. Data on the environmental impact of fisheries has progressed to serve various reporting obligations, like those under Birds and Habitats Directives and MSFD, but its focus on the main commercial fleets, as legally defined under the DCF, and the assessment of commercial fish stocks means that it cannot adequately cover all the requirements of environmental legislation. In that respect, such data can complement other data streams, that are coordinated at Member State level.
While progress in harmonisation is evident, regionally agreed sampling schemes for commercial fisheries remain limited, reflecting the challenge of reconciling national specificities. Brexit has further affected harmonisation of data collection in several ecoregions.
The use of DCF data has increased over time, indicating improved accessibility to and relevance for end users (ICES, STECF and RFMOs) and for research purposes. Transparency through documentation of all steps of data collection has improved understanding of data and its limitations. However, national confidentiality rules have hindered full data access to end users. Additionally, data coverage and quality remain uneven across end users and regions, and data transmission issues persist, suggesting that data is not always suitable for scientific advice. Issues in data coverage and quality may also stem from decreasing fishing activities, which reduce sampling opportunities, competition for space leading to displacement of sampling activities, administrative delays affecting the onset of sampling, or external factors like the COVID-19 pandemic.
Scientific Advice
Stock assessment coverage expanded, and the quality of advice increased significantly, with most fishing opportunities now based on quantitative advice. The proportion of stocks fished above FMSY has declined, particularly where MAPs were decisively implemented. Methodological consistency, transparency and alignment between management plans and scientific advice also improved, supported by EU funding and stronger roles for ICES, STECF, and RFMOs.
The CFP Regulation substantially strengthened the scientific and governance framework for fisheries management, notably through Multiannual Management Plans (MAPs) across sea basins. These plans operationalised FMSY-based management, strengthened the link between scientific advice and fishing opportunities, and introduced remedial measures when biomass fell below biological reference points. However, as explained previously, despite reductions in fishing mortality, the rebuilding of stock biomass has been slower than expected and uneven across sea basins, especially in mixed fisheries. The assumption that achieving FMSY would rapidly restore biomass has not fully materialised.
Ecosystem-based advice, mixed-fisheries management, and MSE within the EU remain constrained by data and capacity gaps. External factors such as Brexit and geopolitical disruptions have further complicated implementation.
Regionalisation
The results regarding the regionalisation process are uneven. In the North Sea and Western Waters regional groups, the move from EU-only management to shared stock management following the Brexit resulted in transfering the fisheries management and governance to the EU-UK Specialised Committee on Fisheries or other Coastal States fora.
Within EU waters, the empowerment of Member States through the production of JRs has brought decision-making closer to the ground, while the consolidation of MAPs, from 22 individual long-term management plans (LTMPs) to four multi-species plans (Baltic Sea, North Sea, Western Waters, Western Mediterranean), has enabled a more comprehensive approach per sea basin.
However, the efficiency of the JR process is variable and dependent on different factors, such as the political will of Member States to move forward, the need for unanimity among Member States concerned, and the time required to gather robust scientific evidence to validate JRs and subsequently align JRs with scientific advice (through exchanges with Member States). This has had consequences on the adoption of conservation measures that are elaborated through this process, most notably measures necessary for compliance with obligations under Union’s environmental legislation, where only 12 delegated acts were adopted outlining conservation measures that are necessary to comply with environmental obligations, with measures concerning 31 marine Natura 2000 sites.
Regarding MAPs, results are also uneven, with some sea basins fairing better than others in terms of achieving their objectives. Discrepancies have to be viewed in light of other key factors like vulnerability to environmental pressures (such as climate change, pollution, invasive species), idiosyncrasies of fishing practices or persistent overcapacity.
The results of the public consultation show that, while the concept of regionalisation does not seem questioned, its implementation is criticised. 76% of stakeholders have identified challenges in implementing regionalisation, specifically for measures to comply with environmental obligations. 71% of them also underline the lack of flexibility of the regional sea basin framework (MAPs). Finally, 75% of respondents view regional disparities within the EU as a major challenge: given previous responses, this points rather to concerns about control and enforcement affecting internal level playing field, rather than a desire for more centralisation.
Stakeholder engagement
There has been a clear strengthening of stakeholder engagement through the EU Advisory Council (AC) system. The number of AC recommendations increased substantially over the evaluation period, alongside the establishment of new councils covering aquaculture, markets and outermost regions. This expansion reflects both increased stakeholder mobilisation and the maturation of EU-level participatory structures. Peaks in recommendations during periods of heavy policy agenda further indicate that the system is responsive and capable of obtaining stakeholder input when it is urgently needed. However, several ACs experience internal divergences, among members or between members and management teams, creating a trust deficit and leading to a decline in members’ engagement. Structural imbalances between industry representatives and other interest groups (OIGs) persist since 2020, with many ACs struggling to meet the regulatory 60%/40% representativity requirement. Following a drop in membership of other interest groups members, notably NGOs and SSCF, are currently under-represented, with some stakeholders requesting a dedicated SSCF AC, while some ACs already have a much greater SSCF focus than others.
These imbalances are partly attributable to external shocks affecting membership (e.g. COVID-19 pandemic and Brexit), but are also linked to internal governance issues, relations between members, as well as members facing financial and human resources difficulties. As a result, the core regulatory objective of achieving consensus and balanced AC advice is not always easily met. In the stakeholders’ consultation process, business associations, NGOs and stakeholders at large repeatedly called for greater stakeholders’ involvement, including through the Advisory Councils and emphasising the need for constructive dialogue as opposed to “parallel monologues”. Business associations, as well as NGOs, stated that their influence in policymaking is limited and requested the Commission to give more visibility on the impact of Advisory Councils’ recommendations and feedbacks. Much of this frustration is linked to the advisory nature of the recommendations.
Control, enforcement and compliance
Audits and verifications performed by the Commission between 2015-2019 indicated shortcomings concerning the control, enforcement and implementation of essential EU rules which jeopardised the long-term objectives of the CFP, as laid out in the CFP Regulation. They also highlighted that, although the Control Regulation helped to improve both the fisheries-control system and compliance with the CFP rules, it was not entirely fit for purpose. To help address the identified shortcomings, the Commission adopted a proposal to revise the EU’s fisheries-control system48. The revised Regulation was adopted in 202349, with most amendments applicable from January 2026 onwards. As such at this stage it is not possible to make an assessment of their impacts.
Impact 7: The EU is leading by example in promoting sustainable fisheries practices internationally, making the CFP Regulation’s benefits extend beyond the Union
The EU reinforced high-level fisheries dialogues with major partners broadening these discussions into wider international ocean governance initiatives. These efforts have helped build effective alliances and advance international cooperation to jointly progress on sustainable fishing practices and the international ocean governance agenda, and to promote stronger cooperation among relevant international instruments, e.g. RFMOs, Multilateral Environmental Agreements (MEAs) etc.
The EU’s participation in RFMOs has been crucial in terms of promoting EU standards and the Regulation’s objectives, implementing international commitments and steering the international agenda towards achieving SDG14.4. The EU remained a key player in many RFMOs, especially those where the presence and activity of the EU DWF are predominant, such as ICCAT, NAFO, IOTC, GFCM, NEAFC. Moreover, also in other RFMOs where the EU fleet is less present/active, the EU has consistently been a strong advocate of sustainable and science-based management in line with the CFP.
The EU action has been instrumental in shaping and strengthening the legal and governance frameworks, reinforcing the operational capabilities and improving the functioning of these organisations. Several RFMOs have undertaken a performance review during the evaluation period, often proposed and/or financially supported by the EU. The recommendations from these performance reviews have been useful in identifying strengths, weaknesses and shortcomings in the functioning of RFMOs, which enabled these organisations to prioritise and plan future work and allocate resources accordingly. These recommendations, together with those issued annually by relevant subsidiary bodies of RFMOs, informed the development of EU proposals and the channelling of EU financial voluntary contributions, aiming at filling important identified gaps. Such targeted EU financial voluntary contributions have been instrumental for developing, for instance, the scientific basis to underpin the decision-making in RFMOs, for operationalising some of the key measures adopted by these organisations, or for increasing the capacity of their secretariats to develop the tools, means and processes for implementing their respective annual work programmes.
The cumulative effects of these longstanding and substantial efforts have resulted in significant success stories, such as the recovery of the Atlantic bluefin tuna stock, demonstrating that effective multilateral cooperation in fisheries management is essential for paving the way towards sustainability. The progressive introduction in many RFMOs of participatory and adaptive fisheries management based on MSE frameworks, supported by the EU, has emerged as a new norm in international fisheries. It allowed to reconcile multiple management objectives in various fisheries and introduced a more robust approach addressing some key governance shortcomings identified in the past in the decision-making process of RFMOs, without requiring moving away from an inclusive approach.
However, despite the undeniable progress achieved in many RFMOs, important challenges remain. For instance, while data collection processes, including through observer programs, have been established in all RFMOs, gaps in data (both in terms of quantity and quality) remain and in many cases the observer coverage is still too low to provide sufficiently meaningful data, including regarding interactions with sensitive species and vulnerable ecosystems. Moreover, the lack of independent sources of verification of data provided by the flag States, together with the lack of harmonised and effective monitoring, control and sufficiently deterrent enforcement mechanisms, continues to weaken the effectiveness of the compliance monitoring schemes established by RFMOs. Despite substantial EU support, including through voluntary financial contributions, limitations in resources (in terms of both expertise and financial) remain an important challenge in most RFMOs. This is mainly due to an ever-increasing number of needs and priorities for scientific and technical work and tools to be developed for ensuring the effective functioning of these organisations, plus an expansion of the scope to address new issues, such as socioeconomic aspects, labour issues or climate change, as well as a need for ensuring stronger cooperation with relevant existing (e.g. MEAs) and new international instruments (e.g. BBNJ). The introduction of new and modern technologies (e.g. electronic monitoring, AI) in different aspects of the work of RFMOs is also expected to exacerbate the pressure on the already overstretched budgets of RFMOs.
In addition, the multilateral nature of RFMOs and the significant discrepancies in the capacities and aspirations of their respective membership remain an important governance challenge, including in terms of decision-making, implementation and compliance with the rules and often an obstacle to achieving progress faster. Divergences in positions can undermine long-term negotiation processes, as seen in the Coastal States forum in the North-East Atlantic, where the absence of a comprehensive agreement on stocks of common interest reflects differences in priorities and approaches among members, often leaving the EU’s sustainability-focused stand isolated. Finally, the functioning of RFMOs was impacted by an increasingly complex and rapidly evolving geopolitical environment and an ever-stronger competition for natural resources.
SFPAs promoted conservation and management measures aligned with those of the CFP Regulation, as well as with the international rules, for example those stemming from RFMOs. SFPAs catch limits on the targeted resources was determined through the best scientific advice available or following the relevant RFMO management measures. SFPAs also contributed to supporting the implementation of the IUU Regulation though capacity building of the partner’s authorities and coherently accompanied the zero tolerance approach by refraining from negotiating SFPAs with countries which had not tackled their shortcomings under the IUU pre-notification procedures. SFPAs have effectively promoted social sustainability through two mechanisms: the possibility to suspend implementing protocols when human rights violations occur, and the social clause laying down employment conditions of third-country national fishers onboard EU vessels fishing in the framework of SFPAs.
In addition, EU interventions within the framework of SFPAs were coherent with other EU interventions affecting the fisheries sector of the partner third countries through development programmes implemented at national or regional levels, with numerous examples of synergies and complementarities between the different EU interventions.
Significant progress in combatting IUU fishing has been achieved since the entry into force of the EU IUU Regulation. It prevented fishery products originating from IUU fishing from entering the EU market and boosted global efforts to fight IUU fishing through the IUU bilateral dialogue mechanism and within multilateral forums. The carding system under the IUU Regulation has become an internationally recognised tool attracting political attention. The IUU dialogue process has provided a framework for countries to enhance their national legal frameworks and align them with their international obligations. Non-EU partners have improved their monitoring, control and surveillance systems, and adopted effective, proportionate and dissuasive sanctions to strengthen enforcement.
4.1.2 Efficiency
The efficiency of the CFP Regulation is assessed by examining the extent to which the objectives of the intervention were achieved at a reasonable cost, taking into account the balance between regulatory, administrative and financial inputs and the results delivered.
A lack of available data regarding costs and benefits and their impacts has rendered this question difficult to evaluate in the supporting study. Literature searches and stakeholder consultations provided a limited set of information on the costs and benefits of the CFP Regulation. Therefore, the following cost benefit analysis can only provide partial insight or trends.
The main costs linked to the intervention fall on public authorities at both Member State and EU level, with limited direct costs for citizens. National administrations bear substantial expenditure for core obligations such as data collection and reporting (around €695 million), marketing and processing measures (€599 million), and other implementation tasks (€819 million). Control and enforcement activities account for a further €578 million, largely linked to the implementation of the landing obligation, and administrative capacity has increased significantly, with staff dedicated to CFP tasks rising from about 38.4 to 81.6 FTEs between 2014 and 2024, most of them in data collection and reporting. It is important to note that costs presented are not extrapolated for the entire EU, but composed of data collected from nine Member States that provided input for the evaluation. These Member States cover 44.7% of the EU fleet in terms of vessels and 52.5% in terms of gross value of landings.
At EU level, direct management spending and coordination functions also represent a major cost component, alongside the operational costs of control coordination bodies. For businesses, reported direct costs include higher compliance and monitoring burdens, increased control-related costs. Indirect costs include productivity losses associated with reduced fishing opportunities, while consumers have faced rising retail prices for fishery and aquaculture products. Assessment of specific fisheries costs (discarded catches, selective gear, vessel modernisation) would require delving into the 525 fleet segments and dozens of gear types (each with national specificities). With the available information, providing an average number at European level could be misguiding. Nevertheless, an ambitious cost analysis of the fisheries sector from a business operators’ perspective has just been launched by the European Commission with the aim of identifying and mapping the costs of fisheries-related stakeholder groups (such as fishers, aquaculture producers, processors etc.) in relation to their business activities and also investigating into the extent and sources of these costs.
When it comes to costs for DCF activities in 2018, funded under the EMFF, total annual DCF funding averaged at €83.6 million, with staff (46%) and vessel costs (30%) dominating expenditures. Key data collection modules included research surveys at sea (43%) and biological data on stocks (31%), while 16% was dedicated to attendance of meetings related to scientific advice and 6% was spent on socio-economic data collection. These figures indicate the additional costs incurred upon Member States with the new obligations under the DCF.
It is important to note that, regarding EU funding for the 2021-2027 period (EMFAF), it is too early to systematically assess its impact. At this stage, information is mostly available on outputs rather than on results and impacts which will be assessed in full through the ex-post evaluation of EMFAF. Particularly for investments, the results and impacts that have been achieved at the mid-term point cover initial steps, such as a launch of calls for tenders, proposals and projects, or signing of procurement contracts; whilst the final milestones and targets due in the second half of the fund’s lifetime will increasingly cover final investment outputs. Therefore, the potential long-term economic, environmental, and social impacts of the fund will be measured based on the actual projects supported by the end of the programming period.
The benefits linked to the intervention cover environmental, economic, and governance dimensions and are shared across citizens, businesses, and public authorities. Environmentally, the share of fish stocks exploited at sustainable levels (FMSY) increased from 50% in 2014 to 63% in 2022, indicating progress toward sustainable resource management. Economically, the value of EU trade in fishery and aquaculture products grew by 18% in real terms and 2% in volume between 2015 and 2024, while aquaculture value rose by 35% and the processing sector recorded a 50% turnover increase to €33.5 billion. Although catching volumes declined, employment and wage indicators improved in downstream sectors, with wages per employee rising by 26% and processing maintaining a high employment intensity. Indirectly, more stable and sustainably managed stocks support long-term market predictability, food supply security, and investment conditions, while at governance level the conservation of marine resources as an exclusive EU competence reduces fragmentation and aligns policy delivery with international ocean sustainability objectives.
To estimate the EU-added benefits of the CFP, this analysis uses the gross value added (GVA) and gross profits generated by the EU fishing fleet over 2014–2025 as proxy indicators. This approach is subject to important limitations, notably the lack of granular data allowing a more precise quantification of socio-economic benefits. It should therefore be seen as an indicative approximation rather than a definitive measurement. First, the benefits of the CFP extend beyond economic performance and include environmental and social dimensions that are not easily monetised, such as improved ecosystem health, biodiversity conservation, and cultural heritage. GVA captures only part of these benefits, namely profits and wages. Second, the absence of a credible counterfactual prevents disentangling the share of benefits attributable specifically to the CFP Regulation from those linked to broader fisheries activity. Nevertheless, a scenario without the CFP Regulation would likely lead to lower GVA due to overfishing and inefficient “race-to-fish” dynamics. Against this background, the estimated cumulative GVA of €47.5 billion and gross profits of €17.7 billion (STECF 25-07) can be interpreted as an upper bound of direct economic benefits. In addition, the fisheries sector supports employment in coastal economies, with estimates suggesting around 25 jobs per €1 million of production along the value chain.
For aquaculture, a similar estimation has not been possible. While the CFP Regulation provides for the promotion of sustainable aquaculture, the sector does not rely on the exploitation of a common-pool resource. This makes it more difficult to quantify the benefits associated with the CFP, notably in the absence of an appropriate counterfactual analysis.
Despite fisheries under Union Priority 1 receiving the largest share of EMFF funding, chapter 3 shows that landings declined between 2014 and 2024, which is most probably linked to challenges with stock conservation and rebuilding long-term sustainability as explained in earlier sections. While some stakeholders therefore assume that the costs and administative burden outweigh the benefits of the CFP Regulation, an opposite analysis can also be made. If there had been no such requirements and control (even if they are perceived as administrative burden), the situation of stocks may be even worse.
By contrast, turnover in the aquaculture and processing sectors increased over the evaluation period, which may be partly attributed to their prioritisation under the EMFF and EMFAF. However, other factors, including market conditions, technological developments and external shocks, have also contributed and should not be overlooked when assessing efficiency.
The CFP Regulation objectives related to control, data collection, conservation and fleet adaptation were, to a large extent, implemented through EU co-financing, notably under the EMFF and EMFAF, which helped reduce the financial burden on national budgets. By pooling resources at EU level, these funds enabled Member States to implement mandatory CFP Regulation objectives that would have been costly to finance solely with national funds, in particular in areas such as fisheries control systems, scientific data collection and monitoring, and structural adjustment of fleets. EU co-financing also ensured a more even level of implementation across Member States, reducing the risk that budgetary constraints at national level would undermine policy delivery. At the same time, the use of shared funding frameworks limited duplication of investments and promoted economies of scale, especially for data systems and control technologies. Overall, this financing model supported the achievement of CFP objectives while containing national expenditure and improving cost efficiency in policy implementation.
As highlighted in chapter 3, the scope of data collection expanded over the evaluation period, notably with the inclusion of land-locked Member States in 2017 and the introduction of additional data requirements, while the overall quality of data improved. At the same time, efforts were made to improve efficiency through the establishment of an end user driven data collection system, that focused on collecting data that is meaningful for scientific advice. Further simplification measures included the use of interactive webpages, the establishment of a dedicated IT platform and increased data harmonisation, which reduced duplication and inconsistencies. In addition, the creation of Regional Coordination Groups (RCGs) supported more coordinated data planning and sharing, contributing to more efficient data collection and use despite the broader scope of requirements.
In a similar vein, the EU has supported RFMOs through significant voluntary financial contributions (€98 million) that have funded scientific and technical work of RFMOs subsidiary bodies and working groups that would not have been possible without that support. This has been instrumental for strengthening the operational capacities and governance in these organisations.
In order to improve SFPA efficiency, since 2020, increased efforts have been made to adapt fishing opportunities from one SFPA protocol to the next, based on the level of utilisation of opportunities available by the fleet and conservation objectives.
The two types of payments made in the context of SFPAs have generally been efficient. First, regarding the access contribution, the cost-benefit ratio of EU public investments is positive (cf. supra), with this ratio being generally higher for tuna than for multispecies SFPAs. The fees paid by shipowners are generally commensurate and lead to effective catches and profits. Second, regarding the sectoral support, the EU contribution is generally aligned with the absorption capacity of partner countries, and more dispositions have been taken to ensure the respect of time limits in sectoral support spending.
Moreover, when it comes to control and monitoring, section 3.3.6 shows that, when there is use of digitalisation (new surveillance technologies such as drones, development of IT infrastructure), compliance is improved and efficiency is increased. On the other hand, where the use of paper-based systems prevails, efficiency is undermined and the implementation of the CFP objectives is being hindered.
The reduction of the total fleet capacity (expected outcome) was supported through the permanent and temporary cessation schemes under the EMFF and EMFAF, which were designed as targeted instruments to address specific imbalances rather than to provide open-ended support. Although fleet reduction remained below initial expectations and capacity imbalances persist in some fleet segments, —also influenced by market conditions, fleet profitability and national implementation choices—the capped nature of fleet measures was foreseen in order to limit budgetary exposure and preserve resources for other priorities of the Fund. In this context, capacity adjustment was pursued within clearly defined financial boundaries, suggesting a prudent and targeted use of available funding. Nevertheless, evidence suggests that many operators still choose to wait for permanent cessation schemes funded by the EU to exit the sector.
With regard to regionalisation, the rationalisation of MAPs (from 22 to 4) reduced the need for frequent annual regulatory adjustments, lowering administrative and compliance costs for both authorities and operators. Nevertheless, in some instances and as highlighted in chapter 3, the evaluation has shown that the time required for Member States cooperating in regional groups to adopt JRs undermines the efficiency of the regionalisation, which is logical in a co-management setting given that collaboration necessarily takes more time, especially at the beginning of the process.
On the efficiency of the implementation of the landing obligation, evidence from the study supporting the evaluation of the landing obligation indicates that the transition to new practices has generated additional costs and workload, with administrative and economic impacts varying widely across regions due to the complexity of implementation. According to this study, public authorities costs are limited in some Member States with pre-existing low discard practices, while others with more complex fisheries structures face significant financial and logistical challenges, and operators incur additional costs related to gear adaptation, sorting, storage and administration. The study also notes that de minimis exemptions help manage unwanted catches but entail their own administrative burden, including scientific assessment by the STECF, and that the landing obligation has fostered improved regional coordination through standardised data and joint recommendations. By contrast, stakeholder consultations (Annex V) report that the landing obligation has added administrative burden and complexity for businesses and fishers. It is however noted that the landing obligation has only been implemented in a fragmented manner and numerous derogations and micromanagement approaches could therefore lead to increasing costs without proportional benefits. The revised Control Regulation seeks to address these issues.
Furthermore, the very low level of investment in fleet renewal, highlighted in chapter 3, reflects the inherently high-risk nature of the fishing sector, where long asset lifetimes and uncertain returns discourage capital expenditure. This risk profile is closely linked to the current fragility of biological resources which limits predictability of fishing opportunities including through annual TAC and effort setting under Article 16 and increases uncertainty over future revenues. This uncertainty further weakens incentives to invest in fleet modernisation and adaptation.
Finally, in the context of the stakeholder consultation undertaken for the purposes of this evaluation, efficiency losses were also attributed (by some academia and research organisations) to the mismatch between policy and reality, often indicating that the CFP Regulation establishes uniform standards for local realities that can be very different. However, as these standards often pertain to other, auxiliary legislations (such as the MAP Regulations and the TMR), safe conclusions that concern efficiency losses directly linked to the CFP Regulation cannot be drawn.
As regards aquaculture, it is difficult to quantify the costs associated with implementating the Open Method of Coordination under the CFP Regulation, as it encompasses (i) the Commission’s preparation of strategic guidelines, (ii) Member States’ preparation and periodic updating of multi-annual national strategic plans for aquaculture, (iii) Commission-facilitated exchanges between Member States on the sharing of good practices in implementating those plans. In principle, the alignment of national strategies with Commission’s Strategic Guidelines, together with structured cooperation to address sectoral challenges and opportunities, could be regarded as justifying the resources expended. However, as noted above, this coordination framework has not, to date, delivered the expected growth of the EU aquaculture sector.
4.1.3 Coherence
Given the broad scope of the CFP Regulation, it has potential links to many other EU policies. The following analysis therefore focuses on those mentioned in the CFP Regulation itself (environmental policy, trade and development policies, maritime policies) as well as those explicitly mentioned in the impact assessment (see section 2.2).
Internal coherence
The CFP Regulation provides a coherent mechanism to reconcile its three core objectives (environmental, economic and social sustainability): when stocks are healthy, the fleet has the opportunity to make a profit which can then be translated into employment and/or wage benefits. Perceptions of incoherence are linked to uneven implementation that break the links in this logical chain: if healthy stocks are not achieved, there can be no socio-economic viability. If the fleet is not rationalised, economic profit is undermined as well as wages. External disruptions (e.g. COVID19, war in Ukraine, climate change), which have impacted all economic sectors on a global scale, further exacerbate these structural weaknesses.
Beyond these effectiveness issues, some topics that are cited in the preamble of the CFP Regulation are not addressed at a substantive level in the instrument itself, thus creating issues of internal coherence.
The first topic is safety and working conditions for fishing operators (recital (15)), which has no corresponding provisions. De facto, social legislation is beyond the remit of the CFP under the TFEU and addressed through other legislation such as Directive 2017/159 on working conditions onboard vessels and Directive 93/103/EC on minimum safety and health requirements for work on board fishing vessels.
The second topic is recreational fisheries. In recital (3) it is observed that “recreational fisheries can have a significant impact on fish resources” but at a substantive level, the CFP Regulation does not address the topic. However, recreational fisheries have since been addressed in secondary CFP legislation including the DCF Regulation (which includes recreational fisheries in its definition of the fisheries sector), the TMR (in its articles 7, 10, 11 and 12), and the revised Control Regulation (in its article 55).
The third aspect concerns animal health and welfare. Recital (16) states the CFP “should pay full regard, where relevant, to animal health, animal welfare, food and feed safety”. These aspects are not, however, specifically regualted by substantive provisions of the CFP Regulation. Nevertheless, action has been taken by the Commission and Member States in these areas in the context of the 2021 Commission’s Strategic Guidelines for a more sustainable and competitive EU aquaculture and the multi-annual national strategic plans for aquaculture. Such action contributes to strenghtening the resilience and competitiveness of the aquaculture sector, as well as contribute to the green transition.
Coherence with environmental policy
One of the stated objectives of the CFP Regulation is that it should be coherent with EU environmental legislation. The CFP Regulation specifically mentions in its article 11 the Birds Directive, the Habitats Directive and the Marine Strategy Framework Directive. Since that date, the Nature Restoration Regulation
has also entered into force in 2024 which aims to restore ecosystems across the EU, including marine ecosystems.
With its objective of environmental sustainability in the long term through FMSY, the elimination of discards, minimisation of bycatch of sensitive species, application of the precautionary principle and adoption of an ecosystem based approach to fisheries management, the CFP Regulation objectives and provisions are coherent with the objectives of EU environmental legislation. In particular, the CFP objective of maintaining the biomass of all stocks above levels capable of producing maximum sustainable yields by 2020 comes hand in hand with the objective of achieving a good environmental status also by 2020 as enshrined in the Marine Strategy Framework Directive. The regulation also provides a specific process to establish conservation measures necessary for compliance with obligations under Union environmental legislation (article 11) alongside other conservation measures listed under its Title I.
Beyond the coherence of objectives, the effectiveness of these measures have an impact on the coherence between fisheries and environmental legislation in practice. While FMSY has seen significant improvement, other measures (landing obligation, ecosystem based approach, precautionay principle) have had limited results, including measures adopted under article 11, as mentioned in chapter 3.
Indeed, while article 11 of the CFP Regulation is a key enabler for the implementation of conservation measures in marine Natura 2000 sites designated under the Birds and Habitats Directives, where such measures require regulating fishing activities, evidence shows that the process of joint recommendations (‘regionalisation’) has proven challenging (see section 3.3.1). While the regionalisation process clearly supports the delivery of objectives under EU environmental law, the process has been slow, with relatively few measures requiring compromises in order to ensure their adoption by Member States.
The Nature Restoration Regulation, which entered into force on 18 August 2024, strengthens the link between regionalisation and implementation of measures identified in the Member States’ national nature restoration plans. In preparing national plans that include fisheries conservation measures,, Member States must initiate consultations with other Member States whose fisheries would be potentially affected by these measures to enable timely agreement on and submission of joint recommendations, while also including time estimates in the national restoration plans.
The CFP Regulation has complementary objectives to those set out in the various strands of environmental legislation. Socio-economic objectives need to be fulfilled alongside environmental objectives, all of which need to be factored into fisheries management decisions. Moreover, while negative socio-economic impacts of environmental decisions appear very quickly, their benefits are usually assessed in the long term and cannot always be measured precisely.
At international level, the coherence of the external dimension of the CFP Regulation with relevant environmental policies and international instruments is an important issue, particularly in light of the EU’s global commitments to achieving relevant SDGs, biodiversity conservation and international ocean governance. During the evaluation period, EU environmental policies, including the EU Biodiversity Strategy 2030 and its ambitious global biodiversity agenda, have been mainstreamed into international fisheries action. The EU has supported, including through voluntary financial contributions, actions aiming at defining and operationalising an ecosystem-based approach to fisheries management in various RFMOs (see 3.1.3). Synergies between RFMOs, Regional Seas Conventions and IMO were promoted and materialised through the adoption in several RFMOs of measures aiming to reducing marine pollution and plastics from fishing operations (e.g. GFCM 2030 Strategy on the minimisation and mitigation of pollution caused by the fishing sector). Commitments under the UN Convention on Biological Diversity (CBD) & Kunming-Montreal Global Biodiversity Framework (GBF), in particular the "30x30" target (protecting 30% of marine areas by 2030), have been supported by the EU through the adoption of measures for the protection of Vulnerable Marine Ecosystems in many RFMOs and the continuous efforts for the establishment of MPAs in CCAMLR to protect fragile Antarctic ecosystems.
In addition, the EU, as key player both in RFMOs and multilateral environmental agreements (MEAs), has been promoting cooperation and synergies among these international bodies in the frame of their respective mandates, while striving to avoid unnecessary overlapping of efforts and duplication of resources. In particular, these efforts concerned the Convention on Migratory Species (CMS) and the Convention on International Trade in Endangered Species of Wild Fauna and Flora (CITES) where significant emphasis on aquatic animals, in particular shark species, has been observed during the last decade. The recent entry into force of the BBNJ Agreement is introducing a requirement for cooperation with RFMOs that will have impacts on international ocean governance.
The 2017 Regulation on the sustainable management of external fleets (SMEFF Regulation) contributed to promote the objectives of the CFP Regulation internationally, ensuring that EU fishing activities outside EU waters are authorised and monitored by the Member State of the vessel’s flag while regulating the access of third-country vessels to EU waters to ensure that the same principles and standards apply to EU and non-EU operators thus contributing to a level playing field between EU and non-EU operators.
Objectives of the CFP Regulation relating to aquaculture have also informed the EU’s position in international fora, in particular within the FAO and the GFCM. The FAO Guidelines for Sustainable Aquaculture are broadly consistent with the 2021 Commission’s Strategic Guidelines for a more sustainable and competitive EU aquaculture.
Coherence with development policy
The EU development policy has increasingly supported the development of fisheries and aquaculture (see also section 3.3.7). Whilst improvement of the value for money from the EU contribution to the payment of access fees is moderate, the SFPA sectoral support is now recognised as a strong contribution to the reinforcement of third countries’ capacities in fisheries management, monitoring and control systems, scientific analysis, support to small-scale fisheries and the development of the blue economy. On the other hand, the EU financial contribution for access to waters of the SFPAs has been criticised for being a subsidy by other World Trade Organisation (WTO) Members in the context of the ongoing negotiations of additional provisions of the WTO Agreement on Fisheries Subsidies, even though government-to-government payments under fisheries access agreements are not considered subsidies within the meaning of the Agreement.
Coherence with trade policy
Synergies between the CFP and the EU trade policy have been strengthened, this is reflected in their increasing interconnections, with sustainability playing a growing role. For example, the Free Trade Agreements (FTAs) include Trade and Sustainable Development (TSD) chapters that include conditionalities related to sustainable management of marine resources and aquaculture, alongside commitments to international labour standards. These chapters are supported by dedicated committees to monitor and enforce compliance. These frameworks reinforce the coherence with the EU’s CFP objectives by promoting sustainable fisheries governance, responsible aquaculture, and international standards beyond EU waters.
Another example is the EU’s accession to the WTO Agreement on Fisheries Subsidies, which entered into force on 15 September 2025. This Agreement prohibits harmful subsidies contributing to overfished stocks, illegal, unreported and unregulated (IUU) fishing, and fishing on the unregulated high seas. It complements CFP objectives by strengthening multilateral trade rules against global drivers of overexploitation.
The IUU Regulation (see section 3.3.7) also plays a key role in ensuring sustainability of seafood imports in the EU and promoting alignment of third countries’ legal frameworks with relevant international law
To further enhance coherence, the Commission is assessing the introduction of sustainability criteria into the Autonomous Tariff Quota (ATQ) regime, where access is currently not conditional on such requirements, limiting full alignment with CFP objectives.
Coherence with EU maritime policies
Over the past decade, the implementation of the maritime spatial planning Directive has strengthened a holistic approach to the use of the marine space and cooperation between EU Member States and endeavoured to prevent tensions between different maritime sectors.
Fisheries are likely to be impacted by further development of offshore wind energy and marine protected areas, both offshore and in coastal areas. Fisheries are currently associated to planning processes in EU energy and environmental legislation. These concerns are clearly mentioned by business associations and Advisory Councils in the public consultation. Recent developments in EU policy (Ocean Pact and upcoming Ocean Act) seek to address these concerns, through broader policy coordination of different legal instruments, including the CFP Regulation.
Coherence with funding instruments
The EMFF and EMFAF have been the main financing instruments for the implementation of the CFP Regulation. These funds support the CFP objectives by promoting sustainable and competitive fisheries, balanced fleet management, sustainable aquaculture, efficient markets, coastal development, scientific data collection, and strengthened control systems, including through digitalisation. The alignment between the EMFF/EMFAF and the CFP Regulation is reflected in the Member States’ programme design, in terms of types of actions, allocation of resources, as well as reporting on these objectives through the transmission of data via the dedicated EU funding tool (Infosys).
Regarding coherence with other financing instruments, it is noted that, as per Tab.39, Annex VI, Horizon2020 has so far supported actions relevant to the CFP Regulation with approximately 30 topics and 5 actions and a budget of approximately EUR €381 million between 2021 and 2025.
Other aspects of coherence
Labour issues linked to migrant workers in the DWF have received increasing attention both in RFMOs and SFPAs although trade unions still express concerns about fair working conditions, pay and certification. This requires a shift in mindset and legal frameworks, as RFMOs are historically dedicated to fisheries management rather than social issues.
4.2 How did the EU intervention make a difference and to whom?
The conservation of marine biological resources under the CFP falls under the exclusive competence of the Union, whereas measures related to aquaculture and the common market organisation are subject to shared competence between the Union and the Member States. In the field of aquaculture, Member States are responsible for the management of aquaculture activities, subject to compliance with applicable EU legislation.
Munro and Gordon (2002
) have shown that when States set their fishing effort levels without coordinating, total fishing mortality is higher than at the cooperative optimum, leading to biological overexploitation and associated economic inefficiencies. Indeed, optimal effort must be set at stock level rather than at national level to account for the transboundary nature of fish stocks. This counterfactual suggests that by regulating fishing effort and coordinating it at stock level, the CFP Regulation is likely to mitigate the adverse environmental and socio-economic outcomes associated with unregulated and uncoordinated fisheries management, particularly for shared fish stocks. This coordination is therefore in the interest of operators, to ensure viable operations; of Member States, to enable stable employment; and of society at large, to ensure sustainable fish supplies at reasonable prices.
The open method of coordination applied to national aquaculture measures under the CFP Regulation benefits both Member States and aquaculture producers. In particular, the multi-annual national strategic plans, established on the basis of the Commission’s Strategic Guidelines, and supported by the exchange of good practices among Member States, aim to facilitate support for the sustainable development of the aquaculture sector.
Common rules and shared decision-making
Internally, regarding fisheries, added value comes from the establishment of harmonised rules and shared decision-making structures, including common sustainability objectives, technical measures, and control systems. These aspects reduce fragmentation and provide a framework for resolving allocation and management issues within the EU.
Evidence shows that, between 2014 and 2024, no formal fisheries-related dispute settlement cases between EU Member States were identified in publicly available legal or policy sources. While disagreements do arise during annual TAC and quota negotiations, these are resolved within CFP governance structures, notably Council (e.g. Working Party, AGRIFISH) negotiations, Commission-led mediation and the application of independant scientific advice and sustainability objectives. The absence of formal dispute settlements indicates that the CFP internalises conflicts and channels them into cooperative decision-making frameworks.
In contrast, relations with non-Member States require separate legal and diplomatic frameworks. During the reporting period, one formal fisheries dispute was identified with the UK after Brexit: the EU-UK dispute started in 2024 under the Trade and Cooperation Agreement (TCA) concerning the closure of the sandeel fishery (European Commission, 2025d). Other external disagreements, including with Norway and Iceland, have been managed through negotiations rather than formal dispute settlements, highlighting a clearer risk of escalation outside the CFP framework.
Evidence also shows that EU mechanisms for quota management, particularly quota swaps, transfers and reallocations, play an important role in balancing fishing opportunities across fleets, areas and years. Between 2013 and 2025, substantial volumes of fishing opportunities were exchanged under EU coordination, covering Union waters, RFMOs and SFPAs. These involved a wide range of input or output metrics (e.g. tonnes, fishing days, kW-days and individual fish; CECAF, 2024, 2025). This flexibility allows surplus opportunities in some Member States or segments to be reallocated to others with unmet demand, reducing the risk of underutilisation and supporting alignment with scientific advice.
In governance terms, EU-level stakeholder involvement through regionalisation provides institutionalised cross-border participation that would be difficult to achieve through individual Member State action alone, particularly for stocks of common interest, EU-wide markets and common policy processes. Evidence shows a clear strengthening of stakeholder engagement through the EU Advisory Council (AC) system, even though problems of representativeness persist.
Regarding aquaculture, the CFP Regulation provides primarily for a coordination-based framework, facilitated by the Commission. Member States are required to adopt multi-annual national strategic plans for aquaculture addressing a range of objectives. However, the non-binding nature of these instruments limits the CFP’s ability to address the fragmentation of the legal framework governing aquaculture within the EU.
International presence and leverage
The added value of EU action is particularly relevant in its external dimension. Acting collectively, the EU negotiates access, conservation and management measures and cooperation frameworks through RFMOs, SFPAs and other bilateral agreements, such as the EU-UK Trade and Cooperation Agreement.
Throughout the period covered, EU fleets have maintained a continuous presence across multiple RFMOs and bilateral access agreements (SFPAs, TCA, etc), reflecting the existence of stable access frameworks. While the activity of the DWF fluctuated over time and does not show a clear upward trend, these variations reflect operational choices, specific conditions and constraints rather than the absence of access. The scale and geographic spread of the activities of the DWF demonstrates clear EU added value. Coordinating access across diverse regions and third countries requires collective negotiation capacity and leverage, common legal frameworks, and harmonised authorisation procedures. This, in turn, ensures continuity and predictability for economic operators under changing geopolitical circumstances, an outcome that individual Member Stateswould be unlikely to replicate on their own.
EU added value is particularly evident in the post-Brexit context. In 2021, nearly 6,000 EU vessels were authorised to fish in UK waters under the TCA, showing the EU’s ability to negotiate and manage large-scale access in a politically sensitive environment. Subsequent reductions in authorised vessels reflect adjustments within a common legal framework, rather than decreasing leverage, and highlights the importance of EU-level coordination in managing complex relations.
In addition, the stability of EU membership in RFMOs reflects a commitment to multilateral fisheries governance that individual Member States would be unlikely to replicate at the same level, particularly in distant water fisheries. Evidence from compliance and monitoring reports of major RFMOs shows that EU participation strives to ensure that agreed conservation and management measures apply equally and are implemented consistently by all Contracting Parties. Regarding SFPAs, the inclusion of provisions strengthening human rights and social clauses also reflects EU-level policy choices and negotiation capacity that go beyond what individual Member States could realistically secure through bilateral arrangements.
EU engagement through informal dialogues on illegal, unreported and unregulated (IUU) fishing has been sustained across the period. These dialogues typically span multiple years and highlight the EU’s role as a consistent international actor promoting compliance with international law and relevant fisheries related obligations.
Level playing field on EU market
Binding objectives such as MSY, the ecosystem-based approach, and the landing obligation apply uniformly across the EU fleet, ensuring that all Member States face comparable biological and operational constraints. The CFP Regulation further supports a level playing field for fishers from different Member States through harmonised technical measures, fleet-capacity balancing obligations, strengthened control and reporting requirements and a common organisation of the market.
By contrast, for aquaculture, the CFP Regulation does not lay down detailed, harmonised rules governing the authorisation, establishment and operation of aquaculture activities at national level. Its main requirement in this area is that Member States prepare multiannual national strategic plans for aquaculture. Accordingly, apart from setting out general objectives and principles (including an ecosystem-based approach), the CFP Regulation provides limited mechanisms to harmonise the conditions under which aquaculture is established and operated across Member States; those conditions largely remain governed by national law, subject to the application of relevant EU legislation (notably environmental, animal health and food-safety rules).
The market pillar of the CFP, the CMO for fishery and aquaculture products, provides clear EU added value by creating a harmonised framework at EU level that improves market functioning, transparency, and stability across Member States. By setting common rules on marketing standards, consumer information, professional organisations and competition, the CMO helps to ensure a level playing field within the single market, reduces market fragmentation, and facilitates intra-EU trade. However, under the current framework, the added-value of EU rules on consumer information is limited by their scope (not covering preserved products).
Overall, action at EU level delivers benefits that could not be achieved as effectively by Member States acting alone, particularly in managing cross-border markets, ensuring consistent standards, and reinforcing fair competition for EU producers on the EU market. Having EU rules, as opposed to national or private ones, can improve the level playing field both within the EU and with non-EU products as they apply to all products entering the EU market.
4.3 Is the intervention still relevant?
Regarding environmental needs, the increasing pace of climate change constitutes a major pressure for fisheries and aquaculture. Rising sea temperatures, pollution and change in seawater composition are already altering the distribution, productivity and seasonal patterns of fish stocks, as well as productivity of aquaculture farms, with uneven impacts across sea basins. Increased frequency and intensity of extreme weather events also affect safety at sea. These developments interact with existing pressures on marine ecosystems and challenge traditional management approachess. The Commission SWD on climate-change adaptation in the aquaculture sector describes the significant impact of climate change on aquaculure activities, as well as the urgency for Member States to adopt sector-specific plans for the adaptation of aquaculture to climate change. The lack of such plans has been one of the weaknesses identified in the mid-term assessment of the aquaculture strategic guidelines published in October 2025.
Other environmental pressures, such as the spread of invasive alien species, pathogens and pollution-related pressures, have been increasing with significant consequences on certain closed sea basins (Baltic, Black and Mediterranean Seas) and play an increasing role in the relations of the EU with third countries regarding its external fishing fleet. Evidence suggests that mechanisms exist (precautionary principle, ecosystem-based approach) to address these concerns, but their deployment has not followed the pace of changes. Current fisheries management is struggling to take into account non-fishing pressures to achieve its objectives. Likewise, aquaculture has suffered significant losses due to external factors (e.g. clams losses in the Mediterranean due to the predation by invasive alien species).
In this context, MSY remains a realistic approach to achieve environmental results that contribute to viable socio-economic performance. However, the use of FMSY as the main target for achieving MSY has not led so far to the expected rebuilding of stocks especially those suffering declining productivity in the context of growing uncertainties on the effects of climate change on fish stocks. In addition, the consultation of the scientific community indicated a strong consensus towards the need for clearer socio-economic targets to operationalise socio-economic objectives alongside MSY.
The CFP has been adopted before the Biodiversity Strategy for 2030. Relevant related actions are therefore not taken into consideration. These include the definition of protected areas and strictly protected areas, as well as the adoption of the Nature Restoration Regulation. The potential of certain types of aquaculture to contribute to the restoration of ecosystems and biodiversity is barely mentioned in the CFP. Article 34 of the CFP Regulation provides that multi-annual national strategic plans shall, inter alia, aim at the “promotion of aquaculture practices and research with a view to enhancing positive effects on the environment and on the fish resources”. Even if the 2021 Commission’s Strategic Guidelines refer more specifically to the types of aquacultures that contribute to ecosystems and biodiversity, there are no clear rules on how these types of aquaculture should be integrated and supported.
The growing contribution of recreational fisheries to fishing mortality is an increasing challenge. Recreational users are currently estimated at about 10 million across EU marine waters. Lack of formal recognition of recreational fisheries, limited mapping, insufficient data collection and inconsistent governance across the EU and at national and international levels, puts the relevance of the CFP Regulation at risk in coastal systems where recreational and commercial pressures increasingly overlap or compete. The Commission has been working, under the DCF and Control Regulations, to mitigate issues of data integration and governance, including through a specific application (RecFishing) that seeks to provide harmonised and comparable data to support new EU-wide electronic reporting obligations. This system was introduced in 2026 through the revised Control Regulation and its implementation will need to be assessed.
Regarding economic and social needs, evidence presented in previous sections suggests that the economic performance of the sector has not evolved in a way that supports generational renewal. Decreasing profitability and continued volatility of prices has led to lack of income stability, undermining the sector’s attractiveness for new entrants. There is a growing gap between policy ambition and the economic conditions required to ensure generational renewal. This situation is compounded by an ageing workforce that cannot be easily compensated by non-EU labour due to entrance barriers linked to certification requirements, especially in the LSF and DWF, as well as in aquaculture. Broader societal changes, including evolving expectations regarding working conditions, social protection, gender equality and work-life balance, may also explain the increasing lack of attractiveness of the sector although clear data is missing to determine its main drivers. Finally, the persistent increase in vessel age suggests that issues of overcapacity have not been sufficiently adressed thus leading to structural and financial barriers to renewal.
Technological change is accelerating across the fisheries and aquaculture value chain. Digital tools, automation, artificial intelligence, advanced and remote monitoring systems, selective fishing gear and novel production systems are being developed and progressively rolled out. At the same time, access and deployment of these tools remains very unequal between Member States and fleet and aquaculture segments. The deployment of advanced technologies, notably for control and improved selectivity, suggests that the current CFP Regulation provides sufficient scope for these changes.
Consumption patterns and sustainability standards are evolving in response to income levels, prices, food availability, health considerations and sustainability awareness. While price remains the main driver for consumption choices, consumers also increasingly expect reassurance on transparency, traceability and low environmental footprints.
In that regard, private eco-label and certification schemes continued to expand in the aquatic food sector in response to a growing concern regarding the importance of sustainably sourced products. This expansion raises questions about possible discrepancies between the sustainability standards of private certification schemes versus those defined by the CFP Regulation.
Animal welfare considerations have gained importance since 2013. The welfare of fish, notably farmed fish, is receiving increasing attention. The current CFP Regulation refers to the issue only in recital 16. While Article 34 of the CFP Regulation does not mention this issue among the objectives of Member States’s multi-annual national strategic plans, the 2021 Commission’s Strategic Guidelines for aquaculture address this issue explicitly and provide guidance on actions to be undertaken, including the identification of good practices, indicators, research and innovation, and skills.
Regarding governance needs, shifts in global power balances, increased competition for natural resources including fisheries and evolving trade relations have influenced access to fishing opportunities, markets and inputs. Regional instability and conflicts, such as the Russian war of aggression against Ukraine, have disrupted supply chains, affected fuel, energy and feed availability, and increased volatility in prices. Although the Regulation has foreseen management processes to deal with access to internationalwaters, the relative importance of fisheries along with the scope of geopolitical shifts, make it difficult to weigh on global diplomatic agendas.
Due to Brexit, a large portion of waters in the North-East Atlantic have become third-country waters, thus shifting the type of management from EU-only waters (using regionalisation) to shared management. This shift involves significant changes in practices, as the previous use of regionalisation is no longer relevant in a context where joint management measures must be negotiated by the Commission on behalf of the Union in annual consultations an/or via the Specialised Committee on Fisheries (SCF). This does not undermine the CFP Regulation, whose objectives already apply to all types of management (EU only, stocks of common interest, RFMO-based and SFPA-based) but it increases the use of shared stock procedures, whose outcomes cannot be controlled in the same way as when dealing with EU waters only.
5. Conclusions
5.1 What has worked or not?
Over the past decade, there has been clear progress in reducing fishing pressure towards the maximum sustainable yield exploitation rate (FMSY). However, this reduction was not achieved for all the stocks within the initial timeframe (2020) and has not consistently led to maintaining or rebuilding fish stocks above biomass levels that can produce maximum sustainable yield (BMSY). Internal factors (extended deadline to achieve FMSY) as well as external factors such as declining productivity across sea basins, likely amplified by climate change and other environmental pressures, have contributed to this outcome.
Significant advancements have been made in improving conservation and sustainability within Regional Fisheries Management Organisations (RFMOs), supported by the adoption of more precautionary objectives and the introduction of robust, adaptive management frameworks, based on MSE.
Progress in operationalising ecosystem-based approaches to minimise negative impacts of fishing on marine biodiversity and ecosystems has been evident but relatively slow. This has been achieved primarily through protecting marine space, technical measures and international cooperation. On the other hand, the landing obligation did not trigger evident changes in fishing behaviour, selectivity, or catch composition. Reasons for this include implementation and enforcement challenges, especially in mixed fisheries, as well as limited sector buy-in.
Economic performance has not been as expected: insufficient rationalisation of capacity in certain fleet segments combined with reduced landings in several sea basins, continues to weigh on incomes and undermines the long-term profitability of many fleet segments. However, these income pressures reflect, at least in part, the adjustments on the pathway towards more abundant and economically productive stocks in the medium to long term. In this sense, the slower the recovery of stocks, the slower the potential recovery of profitability, especially in a context where rationalisation of capacity has not met expectations for all fleet segments.
This limited profitability constrains the ability and willingness of operators to invest in fleet modernisation and renewal, which, together with lack of balance between fishing opportunities and fishing capacity to allow use of public funding, leave parts of the EU fleet technologically outdated and less competitive than some global counterparts. The ageing of vessels, coupled with high energy dependency and rising operational costs, further erodes economic resilience to external shocks and uncertainties. This is partially mitigated through improved structuring of the sector via producer organisations and collective approaches, although many operators are not members of such organisations.
The CFP Regulation has contributed only moderately to food security, as a result of static or declining domestic fisheries and aquaculture production: the catch sector is facing difficulties due to the situation of fish stocks, while EU aquaculture, even though profitable, remains relatively small and has not yet achieved a significant production growth. Notwithstanding the strategic planning of actions related to aquaculture introduced by the CFP Regulation (Strategic Guidelines and MNSPs), obstacles remain linked to administrative complexity in licensing as well as insufficient allocation of space, both of which are national matters. The processing sector is comparatively more resilient, partly due to the concentration of operators and the ability to diversify raw material sources, including through imports. However, reliance on imported inputs raises level playing field concerns and exposes the EU aquatic food supply to external market shocks and geopolitical risks.
While EU external fisheries maintain access to non-EU waters through bilateral and multilateral agreements such as the TCA, SFPAs and RFMOs, this has not compensated for the overall shortfall in supply due to the slow recovery of EU stocks. As a result, the EU is increasingly dependent on imports, especially the processing and fed aquaculture sectors that rely on imported raw materials and feed (fish meal and fish oil). This increases strategic and competitive vulnerabilities as well as level playing field concerns regarding imports from third countries which may be applying less stringent standards.
From the consumer perspective, while availability and product diversity remain high, weaker affordability and demand are limiting market growth and EU operators’ ability to maximise profit.
Results concerning the living standards of coastal communities involved in fishing, processing, and aquaculture are mixed. In the catch sector, weak economic performance - due to slow stock recovery and insufficient capacity rationalisation – appears to undermine job security and wages while the average age of vessels, safety conditions and uneven level of skills across Member States is not conducive to attractive working conditions. This combination of factors makes the sector less attractive to new generations and emphasises the need to build robust business models with realistic socio-economic trajectories that take into account the situation of stocks, to improve the attractiveness of the sector. The aquaculture sector faces similar issues of generational renewal linked to administrative burden and efficiency issues, while the processing sector is relatively more resilient, thanks to better economic performance.
The CFP Regulation has substantially strengthened the scientific basis and the governance framework of fisheries management. Through the DCF, it has effectively improved data collection and its link to scientific advice, with enhanced harmonisation through Regional Coordination Groups. The use of DCF data has also increased, signalling better accessibility and relevance for scientific advice and for research purposes. EU funding has been critical in achieving these changes. Still, challenges remain such as uneven data coverage, quality issues, national confidentiality rules as well as expanding policy needs, all of which require further investment in research infrastructure and scientific expertise.
The development and use of the “science of MSY” has become a central instrument to achieve the Regulation’s targets. While this has led to an increase in quantitative advice, it has only partially translated into restoring and maintaining resilient, climate-adapted fish stocks: MSY remains a realistic approach to achieve environmental results that ensure viable socio-economic performance, but the use of FMSY as the main target for MSY has faced inherent and implementation difficulties, due to its limited capacity to address multispecies interactions and environmental conditions.
The CFP Regulation has also played a crucial role in bringing stakeholders together to work on shared solutions to increasing challenges: regionalisation, even with its limitations, as well as ACs, have been an important part of this process in EU waters.
Internationally, the EU’s active building of strategic partnerships with key third countries through bilateral agreements, RFMOs and SFPAs, has contributed to maintaining access to non-EU waters and shaping and strengthening the legal and governance frameworks in international fisheries. This includes the fight against IUU, which provides the one of the most comprehensive systems in the world to certify that imported fishery products were captured legally and to ensure their traceability as well as a unique approach to bilateral cooperation to boost compliance of partner countries (IUU Regulation).
These aspects are crucial when it comes to the management of shared resources whose natural boundaries are evolving significantly with climate change: Member States acting independently would be very unlikely to achieve similar leverage and results.
Finally, evidence points to shortcomings in control, enforcement and compliance over the past decade, with the former Control Regulation identified as not entirely fit for purpose. Although some improvements have been made over time, the critical change lies with the revision of the Control Regulation adopted in 2023, with most provisions applicable from January 2026 onwards. The reforms introduced are essential steps towards modernisation of the EU fisheries control system, ensuring that the Control Regulation remains a fundamental pillar of the CFP necessary for its effective implementation, for sustainable fisheries management and for ensuring level playing field within the Union market.
Regarding the efficiency of the intervention, administrative and compliance costs have increased in some areas, and a significant part of these costs is linked to the need to ensure control, data collection and quality, and sustainability outcomes. Expanded monitoring, reporting, and enforcement requirements generate additional burden, but they are connected to achieving more reliable data, better compliance, and more sustainable stock management. Targeted EU funding (through EMFF and EMFAF) co-financed the costs for control, data collection and fleet adjustment, limiting national budget pressures and duplication. Simplification, digitalisation, multiannual management plans and regional coordination also helped to reduced administrative burdens where effectively implemented.
Indeed, efficiency also depends strongly on how Member States implement the rules, with fragmented or uneven application reducing cost-effectiveness. Differences in administrative capacity, digitalisation, enforcement approaches, and the fragmented use of certain measures (such as the landing obligation and regional tools) lead to variable costs and results, meaning that implementation choices at national and regional level are a key driver of overall efficiency.
Importantly, a share of the observed costs cannot be attributed directly to the CFP Regulation itself but rather to auxiliary and implementing legislation. Several efficiency concerns raised by stakeholders relate to complexity and burden stemming from related instruments (such as multiannual plans, technical and control rules) and from how these are designed and applied, which makes it difficult to link all reported costs exclusively to the core CFP framework.
5.2 Lessons Learnt
·The CFP Regulation provides a coherent approach to reconcile its three core objectives (environmental, economic and social sustainability): when stocks are healthy, the fleet has the opportunity to generate profits which can then be translated into employment and/or wage benefits. Its comprehensive objectives and principles therefore remain relevant, including in the face of accelerating and emerging challenges such as climate change and geopolitical changes. In all cases, achieving the conservation objectives of the CFP Regulation provides the basis for the socio-economic prosperity of the fisheries and aquaculture sectors. Catering to possible resulting transitional impacts across different parts of the fleet needs to be addressed.
·The success of the CFP Regulation does not depend on the Regulation alone: much of the implementation depends on detailed provisions laid down in secondary legislation, such as the DCF, MAPs, Control Regulation, TMR, CMO, etc. Even for CFP Regulation measures that do not have dedicated secondary legislation (landing obligation, capacity rules), their effectiveness is closely dependent on control or funding provisions present in other secondary legislation.
·Excess capacity does not necessarily lead to excessive fishing pressure as can be evidenced by the reduction in fishing pressure even though capacity rationalisation has not decreased as expected. Excess capacity does, however, seem to have a strong impact on levels of profitability and wages.
·External disruptions (COVID19, war in Ukraine) and systemic changes (demographic ageing, geopolitical shifts, accelerating climate change), increasingly affect fisheries and aquaculture. Although they go beyond the remit of the CFP Regulation, they are consistently mentioned by stakeholders who expect the Regulation to provide means to address them.
·The very low level of investment in fleet renewal reflects the inherently high-risk nature of the fishing sector, where long asset lifetimes and uncertain returns discourage capital expenditure.
·Availability of accurate and reliable data is essential to inform sound policy decisions, as well as to ensure proper monitoring, control of fishing operations and enforcement of common rules. The evaluation identified a number of data gaps, with incomplete time series or evolving indicators resulting in difficulties to compare and assess trends. In addition, new data needs keep increasing to provide more detailed biological data (sensitive species, discards, habitats) and address social concerns (profile of fishers, working conditions, socio-economic links to coastal communities). A detailed list of data gaps is included in Annex II.
·Since Brexit, there has been a fundamental shift for many stocks in the northern sea basins that have moved from EU-only management setting to a shared stock management setting. While the CFP Regulation contains the appropriate provisions to deal with this change, it involves a fundamental shift in practices, including for the use of scientific advice. Moreover, this has resulted in shifting the “centre of gravity” of the CFP Regulation towards its external dimension, which has now become much more prominent than in 2013.
·The external dimension of the CFP has reinforced the role of the EU as a frontrunner and strong advocate of sustainability in international fisheries. Despite the significant progress achieved in improving the performance of RFMOs and SFPAs and other bilateral agreements with coastal States, and ensuring access to fisheries resources beyond EU waters, challenges remain which require continued effort to project the Regulation’s objectives and sustainability standards beyond EU waters and contribute to strengthening international ocean governance.
·While the concepts of empowerment and co-management through regionalisation and AC recommendations seem undisputed, the representativeness of some ACs and the length and complexity of the regionalisation process are questioned. The latter issue poses a fundamental dilemma: discussion and consensus-building, often more time-consuming versus top-down decisions, potentially more time-efficient.
·The CFP Regulation objectives and provisions are coherent with the objectives of EU environmental legislation. However, the process of joint recommendations (‘regionalisation’) under Article 11 has proven challenging and slow, due to complexity of data required, limited political appetite and growing spatial squeeze. This is due to the fact that measures to comply with obligations under Union environmental legislation need to be fulfilled alongside the Regulation’s socio-economic objectives, all of which need to be factored into management decisions.
·Some topics with growing impact are mentioned in the recitals of the Regulation but have no related provisions (e.g. health and safety) or very few (e.g. recreational fisheries). However, in many instances, they have been addressed in secondary legislation, raising the question of the need for more substantive provisions in the Regulation.
·Increasing spatial squeeze is a key concern for many fisheries and aquaculture operators, particularly linked to the development of offshore wind energy and marine protected areas. Managing limited space requires increasing involvement and collaboration in planning processes. While the CFP Regulation does not cover this topic directly, recent developments in EU policy (European Ocean Pact and upcoming European Ocean Act) seek to address these concerns, through broader policy coordination of different legal instruments, including the CFP Regulation.
·Regarding aquaculture, the evaluation shows the limits of the use of non-binding EU tools in ensuring that Member States address the challenges to the growth of the sector, notably on access to space and water and licensing complexity.
All in all, the CFP Regulation remains a very important and relevant tool to manage a common natural resource and related economic activities in a changing world. Its broad and comprehensive objectives allow it to cater to many emerging issues. Inefficiencies and gaps identified in the evaluation and by stakeholders are often dependent on the full implementation of CFP provisions or on detailed provisions and implementation of secondary legislation. The fundamental pillars of environmental, economic and social sustainability are however not put into question.
|
Topic
|
What has worked as expected
|
What has not worked as expected
|
|
Fishing pressure and stock biomass
|
·Reduction towards maximum sustainable yield rate (FMSY)
·Significant improvements in RFMOs through precautionary objectives and MSE
|
·Not achieved for all stocks within the initial timeframe
·Inconsistent rebuilding above target biomass levels (BMSY)
|
|
Ecosystem-based approach
|
·Progress in ecosystem-based approaches through protection of marine space, technical measures and international cooperation
|
·Progress is slow and joint recommendations require compromises
·Challenges in landing obligation implementation
|
|
Economic Performance
|
·EU aquaculture profitable
·Improve economic performance of EU processing industry
·Sector structuring through professional organisations
|
·Reduced landings affect incomes and profitability
·Insufficient progress towards capacity balance undermines profitability and incomes
·Poor profitability hampers fleet renewal
·High operational costs and sensitivity to energy costs hamper profitability
|
|
Food Security
|
·Resilience in processing sector
·Diversification of sources, including imports
·Access to non-EU waters maintained through RFMOs, SFPAs, bilateral and multilateral agreements
|
·Lack of growth of aquaculture production
·Declining fisheries landings
·Increased reliance on imports
·Competitive vulnerabilities
|
|
Consumers
|
·Availability and diversity of products remain high
|
·Demand is weakening
·Incomplete consumer information, in particular as regards processed FAPs
|
|
Social sustainability i.e. living standards of coastal communities linked to fishing and aquaculture
|
·Resilience in processing sector
|
·Weak economic performance affecting job security and wages, along with safety risks, result in an unattractive catch sector (low generational renewal)
·Administrative burden affecting capacity to enter the aquaculture sector
|
|
Scientific base
|
·Strengthened and expanded data collection and data harmonisation at regional level
·“Science of MSY” (via quantitative assessments) is central to management of fisheries
|
·Uneven data coverage in a context of ever-increasing scientific needs and new sources of uncertainties (e.g. climate change)
·FMSY approach challenging in multispecies interactions and mixed fisheries
|
|
Regionalisation and stakeholder consultation
|
·Regionalisation and ACs bring stakeholders and authorities together to work on solutions
|
·Lengthy processes
·Dependence on national political impetus
·Structural imbalance in membership of ACs
|
|
Control and Compliance
|
·Modernisation of Control Regulation to address caveats
·Strengthened strategic partnerships, including to fight IUU
|
·Level playing field and full compliance across Member States not yet achieved
|
Table 7 - Summary of conclusions
Annex I. Procedural Information
Directorate-General for Maritime Affairs and Fisheries (DG MARE)
PLAN/2024/801 - Better Regulation Evaluation of Regulation (EU) 1380/2013 of the European Parliament and of the Council of 11 December 2013 on the Common Fisheries Policy.
Organisation and timing of the Staff Working Document
|
Tasks
|
Time
|
|
ISG launch for the evaluation of the CFP Regulation
|
26 March 2024
|
|
ISG consultation on IL and EQM
|
20 May 2025
|
|
RSB upstream meeting
|
10 November 2025
|
|
ISG meeting
|
9 December 2025
|
|
ISG meeting to discuss the draft final report
|
17 February 2026
|
|
Final report supporting study
|
16 March 2026
|
|
RSB opinion
|
27 March 2026
|
|
Final ISC
|
8 April 2026
|
Interservice Group members
Secretariat-General, Legal Service, DG AGRI, DG CLIMA, DG COMP, DG EMPL, DG ENV, DG INTPA, JRC, DG MOVE, DG REGIO, DG RTD, DG SANTE, DG TRADE and the European Environment Agency.
Evidence, sources and quality
The Intervention Logic and Evaluation Question Matrix for this SWD were developed in-house.
The data collection and analysis used for this SWD is informed by many sources of information and reports, including a supporting study conducted by an independent consultant. This supporting study took place from August 2025 till February 2026 under the guidance of an interservice steering group (ISG) through written and oral consultation of different services of the European Commission under framework contract CINEA/2023/OP/0002 Specific Contract 04: Data collection and analysis supporting the evaluation of the CFP Regulation.
Key sets of data used by the consultant and DG MARE included:
·DG MARE internal databases (FDI, socio-economic, Mediterranean)
·STECF Reports (on the fleet, fishing opportunities, aquaculture, processing, social data)
·Study supporting the evaluation of the landing obligation
·Study on the state of the fleet
·Report on the mid-term assessment of the implementation of the strategic guidelines on aquaculture
·Study on the Common Market Organisation
A full list of all sources used is included in Annex III and the presentation of the Regulation acquis covering the Evaluation in Annex VII.
During the production of the supporting study, some gaps or limitations were identified including lack of available data, incomplete times series, inadequate presentation of data (e.g. graphs when tables were needed), discrepancies between the supporting study and public peer-reviewed datasets. DG MARE mitigated these gaps by extracting, cross checking or analysing the data internally. These limits and mitigations are further elaborated in Annex II.
The stakeholder consultation was also developed in-house by DG MARE. It consisted in a Call for Evidence, Open Public Consultation with follow-up interviews, official recommendations from Advisory Councils
and group discussions with key fisheries scientific community (STECF, EFARO, ICES). The analysis of the outcomes of the call for evidence was done internally, while the analysis of the outcomes of the open consultation was conducted by FAMENET. FAMENET also conducted and analysed the follow-up interviews.
Regulatory Scrutiny Board’s (RSB)
The evaluation was reviewed by the RSB via a written procedure under PLAN/2024/801 and was reviewed with a positive opinion with recommendations to be taken into account before the Final Interservice Consultation. The table below summarises the recommendations from the board and explains how this was addressed in the SWD.
|
RSB Recommendation
|
Integration in SWD
|
|
On effectiveness, for the seven impacts outlined, the report should be clear about the Key Performance Indicators (KPI) and the assessment of the main causal pathways from activities and outputs to results and impacts. The report should better evaluate the causal links in the intervention logic, including regarding how lower rates of extraction of fish (FMSY) are expected to affect the growth in fish stocks.
|
In annex VIII, a KPI table was added presenting, for each main indicator, the baseline, expected outcome and actual values.
To better illustrate the causality of the Intervention Logic, the SWD now refers to underlying problem drivers that link the three Logics.
Further text was added to clarify the relationship between FMSY and biomass.
|
|
Based on an improved assessment of effectiveness, the report should analyse in a more granular manner the costs induced by the intervention, particularly for fisheries. It should be made clear whether the costs to Member States are extrapolated. The benefits need to be quantified and monetised as far as possible. The conclusions on the efficiency of the intervention should be based on this improved analysis of costs and benefits.
|
A more granular presentation was added in Chapter 4.1.2. detailing costs for national administrations and fishers related to the biggest share in expenditure (data collection) based on an internal study carried out in 2020 and that included data from Member States data that didn’t respond to the current survey.
Further information was included in chapter 4.1.2 regarding extrapolation. Data received from DK after the submission of the SWD to the RSB was added.
Clarification regarding specific fisheries costs and benefits of the CFP Regulation and data limitations were included under section 4.1.2.
|
|
Based on a better definition of the scope, an analysis of coherence of the CFP with linked and secondary legislation could be added. The coherence of the CFP with EU-level funding should be analysed.
|
The list of the key secondary legislation mentioned in SWD has been added in Annex VII detailing the extent to which those instruments were analysed in the SWD.
Further elements of analysis on secondary legislation that have not been assessed under effectiveness, were provided under section 4.1.3 i.e. the coherence chapter, including coherence with funding instruments, trade related instruments and relevant environmental policies (EU and international).
|
|
Based on a reflection of existing data gaps, in particular regarding the assessment of effectiveness and efficiency, the report should analyse what methods and data are needed to improve monitoring and better inform future evaluations
|
Regarding conclusions and data gaps, a table was added in Chapter 5 summarising key conclusions and indicating what has worked and what has not worked. These measures represent the key elements introduced in the 2013 reform of the CFP Regulation.
A compiled list of data gaps mentioned throughout the SWD was presented in Annex II.
|
Annex II. Methodology and Analytical models used
The evaluation of the Common Fisheries Policy (CFP) Regulation has been developed by DG MARE using internal databases, publicly available scientific reports, studies as well as a supporting study for data collection and analysis executed by external contractors. Additional sources of information included two FAMENET reports on the analysis of the open public consultation and interviews.
Intervention Logic and EQM
DG MARE developed the Intervention Logic presented in section 2.1 of the SWD and Evaluation Question Matrix presented in Annex III. This formed the analytical framework for the development of indicators and identification of relevant sources to be used by the contractors to assess and answer the evaluation questions.
The impact assessment conducted in 2011 (SEC (2011) 891 final) and adopted CFP Regulation were used to build the intervention logic and identify key elements introduced in the 2013 revision of the Regulation.
The EQM was then built based on the intervention logic and the 5 mandatory evaluation criteria of efficiency, effectiveness, coherence, EU added value and relevance. Then, these overarching questions were mapped to success criteria. These success criteria represent results which, if realised, would contribute to the successful achievement of the objectives of the 2013 CFP Regulation. Each success criterion was then linked to qualitative and/or quantitative indicators within the EQM.
DG MARE compiled a list of quantitative and qualitative data sources including data from public and restricted databases1 for each indicator. An important aspect of this evaluation exercise was the many studies that were executed in parallel such as the landing obligation study, fleet study, CMO study and the mid-term assessment of the strategic guidelines for Aquaculture that fed into this Staff Working Document.
Evolution of the EQM indicators
The key indicators listed in annex 5 of the 2011 impact assessment were used as the starting point for the EQM indicators. However, these indicators only covered part of the CFP Regulation and some of them were closer to general assessment criteria than precise qualitative or quantitative indicators. New indicators were developed based on specific success criteria to provide a more complete picture. A key challenge was to develop indicators that were measurable, where data was available and that provided valuable input to understand the performance of the Regulation. Successive iterations of the EQM took place until November 2025. At this point, a final assessment was made on the availability of data and relevance of each indicator.
Stakeholder consultation
At the start of the evaluation the Commission launched a call for evidence (CfE) which was followed by an Open Public Consultation (OPC). To better understand contributions to the public consultation, a series of interviews was programmed. The CfE and OPC questionnaire were fully developed by DG MARE while the interviews were built together with external contractors (FAMENET).
The analysis of the CfE was done internally by DG MARE through a ranking system of topics mentioned. The analysis of the OPC as well as conducting and analysing the interviews were executed with the assistance of external contractors (FAMENET).
Open Public Consultation (OPC)
The OPC was developed by DG MARE and analysed with the help of an external contractor (FAMENET). Contributions to the OPC were published on the Have Your Say portal, including attached position papers. The outcomes of the report feeds into this evaluation and presented in detail in annex V. The analysis put particular emphasis on the identification of perceived shortcomings of the CFP Regulation.
Interviews
The Commission added a stakeholder consultation which was not initially foreseen in the call for evidence. Respondents to the open public consultation could volunteer to be interviewed especially if they felt that certain elements had not been addressed in the consultation questionnaire. Semi-structured interviews were chosen to provide feedback both on specific topics chosen by DG MARE (e.g. costs/administrative burdens associated with the CFP Regulation) as well as open-ended feedback on topics of interest to respondents.
After adjusting for duplicate survey responses to reduce bias/overrepresentation, a weight was applied to each group based on the number of volunteers from that category. A total 90 respondents were then identified and contacted, which resulted in 66 interviews taking place.
FAMENET and DG MARE developed an internal template/script to help interviewers guide the discussions. Participants were encouraged to speak at length in an open-ended and uninhibited way, to explain their views on several aspects related to the functioning of the CFP Regulation. Detailed notes were taken during the interviews to capture all feedback and input from participants. All open-ended responses were then compiled, reviewed and manually ‘coded’ to categorise participant responses and sentiments, to allow for quantitative figures and meaningful summaries to be generated from their input. These outcomes are part of Annex V. Synopsis report, and specifically outcomes of costs were used for the efficiency section of the SWD.
Advisory Council position papers
Official recommendations were received from all eleven ACs, as well as a Joint Advice, submitted by ten ACs and presented at an inter-AC meeting. Key points raised by ACs are presented in the main body of the report as well as in detail in Annex V Synopsis report. It is worth mentioning here that several AC submissions revealed internal divergences among their own members, reflecting the pluralism of representations included in these advisory bodies. Diverging positions were included in their recommendations, either in the form of formal minority positions or explicitly recorded on specific issues.
Consultation of research communities
DG MARE requested targeted scientific input from the Scientific, Technical and Economic Committee for Fisheries (STECF), the International Council for the Exploration of the Sea (ICES) and the European Fisheries and Aquaculture Research Organisation (EFARO). STECF1 and ICES are the main sources of scientific advice related to the CFP while EFARO2 is composed of directors of the main European research institutes involved in fisheries and aquaculture research.
In the case of ICES and EFARO, group discussions were conducted online with each organisation around a list of questions that had been submitted previously. This allowed the experts to provide their views orally which was then followed by consolidated written input.
The STECF plenary was requested to give their views on the CFP evaluation using a number of structured questions that focused more specifically on the different articles of the CFP Regulation. As background for this exercise, STECF was provided with the 2022 STECF consultation on the functioning of the CFP Regulation. Following a first discussion on the evaluation of the CFP Regulation at STECF 25-01 PLEN, STECF proposed to discuss the issue at July plenary (PLEN 25-02). In the meantime, two ad hoc contracts were launched summarising previous assessments and evaluation from STECF to provide the basis for discussion at STECF 25-02 Plenary. The outcomes of the discussions at STECF 25-02 Plenary are available in the report of STECF 25-02 Plenary.
Data collection and analysis
An external contractor specialised in regional marine knowledge assisted DG MARE in a significant part of the data collection and analysis. This was complemented by internal analysis for sensitive information or where data discrepancies were found.
The starting point for the contractors was the EQM which included a detailed list of indicators and data sources provided by DG MARE. A data tracker was set up to keep track of data sources used and progress for the indicators. First, the contractor collected and validated the available data and then developed point of comparisons for the indicators.
The contractors employed a series of cross-cutting methodologies including secondary data collection, literature reviews and surveys with Member States and fishing operators to triangulate the collected information.
Monitoring data was gathered through the annual communication monitoring reports and Scientific, Technical and Economic Committee for Fisheries (STECF) assessments, with the main data source being the EU Data Collection Framework (DCF).
A comprehensive literature search using databases such as Google Scholar and key websites such as those of the DG MARE, STECF, the European Environment Agency (EEA), and other Commission websites as appropriate, ACs, ICES and RFMOs were used to identify and collate peer-reviewed papers, national evaluation reports, ACs recommendations/advice, book chapters, position papers, technical reports, and Member State reports. The literature gathered were used to complement documents identified by the European Commission.
In cases where sensitive internal data could not be shared with the contractor (e.g. compliance, control and enforcement), the analysis was executed internally as well. For control and enforcement, data from the latest 5-year implementation report (that is yet to be published) were used. For compliance, an analysis on numbers and subjects of infringements was executed internally by the DG MARE legal unit.
Cost analysis
Following feedback from the RSB during the upstream meeting, two surveys were developed to acquire more concrete data for the cost analysis. One of the surveys was circulated through Advisory Council platforms to operators. The other survey was directed at national authorities to provide the contractors with quantitative data on FTEs and spending to execute the regulation, where possible categorised per activity. Due to the timing of the second survey (December-mid January), which partly overlapped with the December negotiations on fishing opportunities and Christmas break, only 9 Member States provided feedback (Bulgaria, Cyprus, Finland, Greece, Ireland, Lithuania, the Netherlands, Spain and Denmark) despite 2 deadline extensions and numerous reminders sent. While this does not include all Member States, it covers all sea basins as well as countries with small-scale and large-scale fleet and countries with a strong aquaculture sector.
Assessment of specific fisheries costs (discarded catches, selective gear, vessel modernisation) remains general as a more nuanced analysis would require delving into the 525 fleet segments and dozens of gear types (each with national specificities) in order to fully understand the actual cost for different types of operators. With the current available information, providing an average number at European level could be very misguiding. Nevertheless, in the context of the recent simplification exercise of the European Commission, an ambitious cost analysis of the fisheries sector from a business operators’ perspective has just been launched by DG MARE with the aim of identifying and mapping the costs of fisheries-related stakeholder groups (such as fishers, aquaculture producers, processors etc.) in relation to their daily business activities and also investigating into the extent and sources of these costs (which specific EU legislation among the CFP acquis or national legislation).
Data limitations
Data range/time series
Data is not systematically available for the full period (2014-2025). This is due to different circumstances:
·The length of the evaluation process: the call for evidence was launched in June 2024. Following a first unsuccessful attempt to commission a supporting study in 2024, a second more focused terms of reference was prepared in 2025. The contract then started in August 2025, therefore full data was not available for 2025 at the time the collection and analysis was taking place.
·The standard time lag between data collection, data calls/data reporting in DG MARE’s scientific assessments (up to one or two years).
·Some data collection frameworks were not available in 2014 (e.g. aquaculture or processing data) or only in a limited way (e.g. no social data about nationality or age before 2017, RFMO data).
Environmental data
The SWD employed graphs and data provided by external contractors, although the analysis was grounded in internal work. Differences between the supporting study and internal findings were visible in timelines and figures particularly due to months versus years format and were explained in the SWD.
The supporting study also included the presentation of data by a number of stocks, which meant that only stocks with available data for the specified period were included. Although raw data from the study was utilised, it was presented differently in relation to the STECF data to offer varying levels of granularity.
In addition, spatial limitations inherent to the SWD resulted in the omission of pertinent details and reduced the capacity for a more granular presentation.
External dimension data
In the supporting study, the time series data regarding the status of fish stocks in RFMOs were found to be incomplete and inaccurate. There was noticeable scarcity in quantitative analysis regarding socio-economic data within the RFMO realm, while the SFPAs were more thoroughly covered and therefore overrepresented.
To mitigate these challenges, key facts and figures were included in the SWD based on DWF data but this was too aggregated to permit a detailed comparison between RFMOs and SFPAs.
Economic data
When the results of the supporting study came in, they differed from DG MARE while using the same sources. As these raised concerns, it was decided to use published and peer reviewed reports from EUMOFA, STECF, Eurobarometers and the CMO study rather than the data collected by the external study.
Social data
The work of the supporting study was of good quality on the general indicators (total employment, FTEs, wages). More detailed social data was complemented by information collected via the first dedicated social report (STECF 25-13) which was not transmitted to the contractor because still pending publication.
To be noted that the collection of social data for the processing sector is not mandatory in the DCF (and therefore results are partial). For all 3 sectors (fleet, aquaculture and processing) the collection of more detailed social variables (beyond total employment and FTE) only started in 2017.
Data gaps mentioned in the SWD
Throughout the SWD, a certain number of data gaps limited the possibility to establish clear causality or categorical conclusions. These gaps are often a result of incomplete or unavailable data or data that is currently not gathered but would improve monitoring of the Regulation’s effectiveness.
Environmental data
·STECF FDI data does not currently incorporate the level of detail required to analyse the potential impact of exemptions to the landing obligation and the percentage of catches affected by such derogations in the observed continuation of discards.
·Scientific advice has broadened in scope, with greater integration of ecosystem and socio-economic considerations and expanded coverage in international contexts. However, gaps remain in timeliness, regional coverage, and advice addressing discard reduction.
·Ecosystem-based advice, mixed fisheries management, and MSE within the EU remain constrained by scientific knowledge and capacity gaps. External factors such as Brexit and geopolitical disruptions have further complicated implementation.
External dimension
·Gaps remain depending on the RFMO, with incomplete time series for some indicators and lack of independent sources of verification, resulting in difficulties to compare and assess trends and impacts.
oRegarding fishing practices and biological data, this is partly linked to limited observer coverage in some fisheries, which is expected to be addressed through the ongoing development of electronic monitoring programs (e.g. CCTVs for data collection and IA for data mining).
oRegarding socio-economic data, this is linked to a lack of requirement for RFMO members to provide such data, although voluntary submissions are encouraged. Socio-economic data are generally considered as sensitive and confidential hence generally they are not submitted. In addition, beyond some very limited information, RFMOs scientific committees in general do not include socioeconomics on their agendas and workplans.
·New data needs keep increasing to provide more detailed biological data (sensitive species, discards, habitats), address social concerns (profile of fishers, working conditions, socio-economic links to coastal communities) and underpin the research activities required for sourcing robust scientific advice and supporting policy.
·Lack of data availability on the conditions granted to other foreign fleets in SFPAs (access agreements).
Efficiency
·Problems with systematically assessing the impact of EMFAF, as the programming period is still ongoing: at this stage, information is mostly available on outputs rather than on results and impacts which will be assessed in full at the time of the ex-post evaluation.
·Partial information from Member States on costs: only ten Member States responded to a survey on CFP-related costs carried out in the context of the supporting study. It is important to note that costs presented are not extrapolated for the entire EU but composed of data collected from the Member States that provided input for the evaluation. These Membre States cover however all sea basins.
·Limited assessment of specific fisheries costs: this would require delving into the 525 fleet segments and dozens of gear types (each with national specificities). With the available information, providing an average number at European level could be misguiding. Nevertheless, an ambitious cost analysis of the fisheries sector from a business operators’ perspective has just been launched by the European Commission with the aim of identifying and mapping the costs of fisheries-related stakeholder groups (such as fishers, aquaculture producers, processors etc.) in relation to their business activities and also investigating into the extent and sources of these costs.
Economic
·Lack of timeseries data for the balance between fishing capacity and fishing opportunities at EU level due to changes in fleet structure and balance calculations.
·Lack of data on vessel volume decomposed by functions (e.g. safety, energy transition, fishing capacity, and crew wellbeing).
·Lack of data on FO allocation within Member State (e.g. share of FO allocated per fleets segments, share of FO allocated to POs).
·Lack of granular data on producer organisations, including their representativeness (e.g. share of production volumes and fishing opportunities, and coverage across fleet segments), as well as comprehensive information on their activities.
Social
·Incomplete time series for more specific employment variables (employment by age, nationality, employment type, education) as data only started being collected in 2017.
·Broad age classes hinder a more detailed analysis of the ageing of the sector.
·Social variables for the processing sector provided on a voluntary basis. Some Members States are missing, therefore numbers are extrapolated by STECF (see explanations in STECF 25-15).
·Different trends on accidents between EMSA and Eurostat data would require more granular data analysis to fully understand the causes.
·Lack of data on evolution over time of allocation criteria favouring small-scale fishing.
Data collection
·Related to Table 25 - Number of data calls and reporting obligations issued by end user: certain RFMOs are not included (CECAF, SIOFA, SEAFO, CCAMLR, WCPFC and SPFRMO).
·Related to Table 26 - Number of meetings using DCF data by STECF, ICES and Regional Management Fisheries Organisations: information on CECAF, SPFRMO, SIOFA, SEAFO, CCAMLR, WCPFC may not be complete
·Related to Table 28 - Percentage of stocks with known biomass references points by regional basin (2014-2024): 2024 contains only partial information and data on RFMOs are only partial and indicative
·Related to Table 29 - Percentage of stocks with known biomass references points by regional basin (2014-2024): 2024 contains only partial information and data on RFMOs are only partial and indicative
·Related to Table 30 - Percentage of catches with known biomass references points by regional basin (2014-2024): 2024 contains only partial information and data on RFMOs are only partial and indicative
·Related to Table 31 - Percentage of catches with known fishing mortality references points by regional basin (2014-2024): 2024 contains only partial information and data on RFMOs are only partial and indicative
Analysis limitations
Establishing causality
The depiction of the current state of play in chapter 3 is strongly substantiated through the data collected under the numerous indicators. However, clear-cut causality was more difficult to prove: while plausible correlations appear in many instances, strong causality cannot be fully demonstrated. This is due to different factors:
·The CFP Regulation is the policy’s basic regulation laying down principles as well as a number of tools that are further fleshed out in secondary legislation. This a challenge in determining the extent to which references should be made to the overarching CFP Regulation rather than secondary legislation within the available space.
·External factors like climate-driven changes, pollution, habitat destruction etc. also influencing fisheries were difficult to quantify, complicating efforts to attribute changes solely to the CFP Regulation.
Integrating funding aspects
The impact of financing on creating real benefits and fulfilling the objectives of the CFP Regulation has been difficult to assess. The ex-post evaluation of the EMFF is still ongoing and the mid-term evaluation provides information on outputs rather than on results and impacts of the EMFAF. Plausible correlation was therefore put forward over causality where strong conclusions could not be drawn.
Annex III. Evaluation Question Matrix
|
Evaluation Question
|
Success Criteria
|
Sources
|
Indicators
|
|
1.To what extent is the CFP Regulation effective in ensuring that fishing and aquaculture activities are environmentally sustainable in the long term?
|
1.1Stocks exploited in line with the MSY objective (target for setting of FO)
1.2Negative impacts of fishing activities on the marine ecosystem have been minimised, aquaculture and fisheries activities avoid the degradation of the marine environment (ecosystem-based approach)
1.3Overcapacity is reduced
1.4Discards are eliminated by avoiding and reducing unwanted catches
1.5Discards are eliminated by gradually ensuring that catches are landed (LO)
1.6A harmonised data collection at EU level
1.7Collected data is fit for purpose (fisheries management)
1.8EU has supported science-based decisions in RFMOs and SFPAs
1.9Provision of scientific advice meets CFP needs
1.10Scientific bodies advice followed
1.11Improved compliance by the MS
1.12Regionalisation provides an effective way to manage EU stocks or stocks of common interest
1.13EU contribution to improving the performance of RFMOs
1.14The EU is effective in combatting IUU fishing in non-EU waters (RFMO, SFPA, IUU bilateral dialogues).
|
oScientific advice from RFMOs and scientific advisory council bodies plus raw data since 2003
oICES data on bycatches
oRFMOs SCs communications and websites, CINEA studies, MARE FWC BEUW
oSFPA horizontal evaluation,
oSFPA JSC reports,
oSFPA ex post evaluation
oStudy MAPAFISH Mapping of marine protected areas and their associated fishing activities
oEuropean Environment Agency: Marine protected areas in Europe's seas
oVME implementing act 2022
oSTECF Annual Economic Fleet Reports
oStudy supporting the evaluation of the landing obligation
oSTECF Plenary report 2025/02
|
Overfishing (exploitation rate):
-Nr and % of stocks F/FMSY>1
Stock situation (2 Healthy stocks-relative stock size):
-Nr and % of Stocks B/BMSY>1
Stock situation (3 Impaired reproductive capacity):
-Nr and % of stocks below B/BLIM <1
-Stocks that were overexploited in 2014 and were still overexploited in 2023
-Percentage of stocks and/or catches covered by LTMP/MAP
-Incidental catches of sensitive species Incidental catches of sensitive species
-Number of EU proposed measures in RFMOs and SFPAs in line with the ecosystems-based approach (sensitive species, VMEs, MPAs, FRAs, Marine pollution, unwanted bycatch, mitigation, protection of juveniles etc.)
-Nr of Marine Protected Areas established
-Nr of closures for “Vulnerable Marine Ecosystems” established in EU waters, in RFMOs and in the High seas, and spatial extent of protection
-Catches of individuals under MCRS
-Level of discarding (Use conclusions of LO study)
-Nr of coordinated surveys at sea
-Number of agreements and decisions of regional coordination groups
-Nr of standardised methods and sampling schemes
-Nr of Regional Work Plans
-Nr of STECF, ICES, RFMOs WG reports using DCF data
-Number of addressed issues’ / ‘total no of issues’
-Nr of data calls issued
-Nr of request for Data Collection Framework data for management purposes
-Nr of stocks with known status against Bmsy or B reference point
-Nr of stocks under Management Strategy Evaluation
-Nr of scientific advice provided that includes socio economic considerations
-Nr of scientific advice environmental impact of fisheries aquaculture
|
|
2.To what extent does the current CFP Regulation effectively provide social and employment benefits to fishing and aquaculture activities?
|
2.1Employment benefits (art 2, art 28, art 34) = at least maintaining same level as 2011
2.2Fair standard of living >> improved working conditions and safety (= art 2f, recital 15))
2.3Fair standard of living >> increased income & purchasing power of fishers and fish farmers (= art 2 fair standard of living)
2.4Promote coastal fishing activities (art 2) (= recital 12 job creation and economic development of coastal areas)
|
oSOCIAL report STECF 2005-13
oSTECF report annual economic 26-11 25/07
oDCF AER
oDCF Aquaculture
oEurostat Fatal accidents at work
oPaper: Remuneration and attractiveness of EU blue economy sectors analysis
oSTECF Economic and Social analyses - STECF 23-14 - Economic Report on the EU fish processing industry
oSTECF Economic report on EU aquaculture)
oEUMOFA
oSTECF Economic report on EU aquaculture
oSTECF report processing
oAnnual fleet reports submitted by MS
oReport on the mid-term assessment of the implementation of the strategic guidelines
oEffort and catch reporting, ECR (former ACDR)
|
-Total employment for fishing, processing and aquaculture
-Number of FTEs in Fisheries, processing and aquaculture
-Ration FTE to employment
-Wages
-Average age of fishers
-Nationality of fishers
-Nr of fatal and non-fatal accidents for fishers and aquaculture
-Nr of MS that allocate FO for SSCF coastal fishing
-Fleet Capacity (in GT and KW, no of vessels, active and active, per fleet segment)
-Table balanced capacity.
-Data on enforcement, no of drones, use of VMS, nr patrolling days
-Nr of infringements per legal basis and sea basin
|
|
3.To what extent does the current CFP Regulation effectively contribute to the improvement of the economic performance of the fishery and aquaculture sector?
|
3.5Economic competitiveness of EU fleet
3.6Increased profitability of EU fisheries (SSCF/LSF/DWF) and aquaculture operators (marine finfish/freshwater finfish/shellfish) and fish processors (per Member State)
3.7Well functioning and stable market contributing to balance supply and demand
3.8CFP contributes to a level playing field between EU and third country operators’ countries
3.9Diversified and improved EU seafood supplies
3.10Improved ratio imports/domestic products put on the EU market
3.11Adds accessibility, availability, affordability for EU consumers
3.12Increased consumer awareness, understanding, confidence and ability to make informed choices
|
oDCF AER
oDCF Aquaculture
oEurostat Fatal accidents at work
oPaper: Remuneration and attractiveness of EU blue economy sectors analysis
oSTECF Economic and Social analyses - STECF 23-14 - Economic Report on the EU fish processing industry
oEUMOFA
oSTECF Economic report on EU aquaculture
oSTECF report processing
oAnnual fleet reports submitted by MS
oReport on the mid-term assessment of the implementation of the strategic guidelines
oEffort and catch reporting, ECR (former ACDR)
oCommon Market Organisation (CMO) provisions on
Professional Organisations and consumer information
oStudy on the Common Market Organisation
oEurobarometer
|
-Number of vessels per fleet segment
-Gross tonnage of the fleet (added, STECF AER)
-Age of vessels (added, EU fleet register)
-Newly built vessels per fleet segment
-Permanent cessation
-EU aquaculture production (volume and real value)
-Number of aquaculture companies
-Number of processing companies
-Turnover of processing companies
-Total EU landing in volume and real value
-Gross profit margin of the fleet
-Operational profit margin of the fleet (new, internal calculation based on STECF AER)
-Energy costs (new, STECF AER)
-Value of physical capital (new, STECF AER)
-Net profit margin of aquaculture
-Capital productivity of processing industry (new, STECF processing report)
-Net profit margin of processing industry
-GVA of processing industry
-Net profit margin for fishery
-Value and volume of imports and exports,
Self-sufficiency ratio
-Level and periodicity of inter-annual variations in TACs and Nr of TACs concerned
-Energy costs as a share% of cost per input for aquaculture
-number of professional organisations (new, CMO study)
-Volumes and fishing opportunities managed by Pos (new, CMO study)
-Consumer price of fishery and aquaculture products
-EU apparent consumption
-Household expenditures
-Consumer interest in environmental information
-Share of products certified
-Share of products covered by mandatory labelling
|
|
4.To what extent do the current CFP Regulation governance mechanisms effectively contribute to achieving its objectives?
|
|
oPublications of advice from the Advisory Councils
oDelegated Acts
oJoint Recommendations
oEffort and catch reporting, ECR (former ACDR))
oEU fishing authorisations database
|
-N° JRs
-N° DA
-N° of AC recommendations
-Average time to adopt DA
-Average time to adopt JRs
-Number of cases that were not adopted within deadlines
-Number of cases adopted with consultation of ACs within the deadlines
-Number of stocks per type of management
-% of stocks per type of management
-Volume of landings per stock and per type of management
-Value of landings per stock and per type of management
|
|
5.To what extent are the incurred costs justifiable and proportionate to the benefits achieved by the CFP Regulation? And what factors influences this efficiency?
|
5.1Costs are reasonable relative to the scale of activities, with administrative and compliance burdens minimized.
5.2Environmental sustainability, economic stability, and social outcomes are clearly improved or maintained compared to the situation in 2014
5.3Rules align with CFP objectives, ensure compliance, and contribute to progress toward long-term sustainability
|
oEUMOFA
oEffort and catch reporting, ECR (former ACDR))
oSTECF Economic report on EU aquaculture
oSTECF report processing
oFAMENET 2025 Public consultation
oFAMENET 2025 Interviews
|
-Gross value added
-Income from landings
-Total income (aquaculture and fish processing)
-% of stocks F/FMSY, EU prices (fisheries and aquaculture)
-Value and volume of landings by EU fleets per segment
-Average wage/national average wage for fishers per segment
-Average wage/national average wage for fish farmers per activity
-Average wage/national average wage for fish processors per MS
-Ratio of FTEs to total number of persons employed
|
|
6.Is there room for simplification?
|
6.1Digitalisation of obligations stemming from CFP Regulation is advancing.
6.2Administrative burden on national authorities and operators is being reduced.
|
oFAMENET 2025 Public consultation
oFAMENET 2025 Interviews
|
-Stakeholder perception on administrative burden regarding the CFP Regulation.
-Evaluation of potential room for simplification by the findings of the other evaluation questions, especially the ones related to efficiency.
|
|
7To what extent are the CFP Regulation objectives still relevant in the current context compared to 2013?
|
7.1Capable of addressing accelerating climate change impacts (expected and unexpected) on fisheries management
7.2Capable of addressing the catch and production losses linked to the accelerating pollution of the ocean (eutrophication, plastic pollution)
7.3The current focus of the CFP Regulation on the internal dimension (EU only stocks) is still relevant.
7.4Change of situation due to Brexit (contextualisation)
|
oFAMENET 2025 Public consultation
oFAMENET 2025 Interviews
|
-Qualitative analysis
|
|
8To what extent are the internal and external dimension of the CFP Regulation contributing to the overall objectives in a coherent way?
|
8.1the CFP Regulations objectives are internally coherent
8.2The CFP Regulation is coherent with environmental legislation
8.3The CFP Regulation is coherent with international obligations
|
oFAMENET 2025 Public consultation
oFAMENET 2025 Interviews
|
-Coherence with Nature Restoration Regulation
-Coherence with Good Environmental Status (Marine Directive)
-Coherence with International obligations
|
|
9To what extent does EU action/the CFP Regulation add value – i.e., does it produce results beyond what would have been achieved by Member States alone
|
9.1Guarantee for stakeholder involvement across all MS
9.2Stable fishing opportunities
9.3Strengthening of the EU's partnerships and international presence
9.4EU consumers valuing EU standards (and, therefore, consume EU-caught fish)
9.5Greater access to non-EU water
9.6CFP contributes to a level playing field between EU and third country operators
|
Sources previously mentioned
|
-Qualitative input based on effectiveness
|
Annex IV. Overview of benefits and costs and table on simplification and burden reduction
This annex represents an overview of all costs and benefits that can be linked to the intervention, as identified by the evaluation.
·The “citizens” columns include socio-economic and environmental data presented in the SWD.
·The “businesses” columns include economic data presented in the SWD and results from a survey conducted with operators via Advisory Councils. There were 27 respondents.
·The “national administrations” columns include data from EU funds (under shared management) as well as results from a survey sent out to all national administrations. There were 9 respondents (Member States) to this survey.
·The “EU” columns include economic data from the SWD, internal DG MARE data (FTEs), as well as data from EU funds.
Overview of costs and benefits
|
Overview of costs and benefits identified in the evaluation
|
|
|
Citizens
|
Businesses
|
National Administrations
|
EU
|
|
|
Quantitative
|
Comment
|
Quantitative
|
Comment
|
Quantitative
|
Comment
|
Quantitative
|
Comment
|
|
Direct costs
|
N/A
|
N/A
|
12/27 respondents from AC members reported increase of costs for control measures
|
Ongoing and increasing costs to comply with the CFP during 2014-2024. Main areas: handling bycatch, landing obligation, monitoring and control. Mid-sized vessels (12-40m) report higher administrative burden.
|
Data collection and reporting: 695 mln EUR
Marketing and processing measures: 599 mln EUR
Other: 819 mln EUR
1 bn EUR come from national budgets against 2,2 bn EUR from EU funding
In 2018, 16 MS reported an annual average of 83,6 mln EUR for costs under the DCF.
|
Public authorities are the main direct cost bearers, implementing core CFP obligations such as data collection, control, enforcement and reporting.
Data from 9 MS (BU, CY, FI, EL, IE, LT, NL, ES, DK) that completed the relevant survey
|
Main costs
EMFF direct management: 480 mln EUR in 2014-2024
EMFAF direct management: 243 mln EUR in 2021-2024
|
European Commission represents the second largest cost bearer.
Direct costs under EMFF/EMFAF direct management commitments (e.g., scientific advice, data collection, communication etc.)
|
|
Enforcement costs
|
N/A
|
N/A
|
N/A
|
N/A
|
578 mln EUR for control and enforcement
Data from 9 MS that completed the relevant survey
|
Costs mainly relate to the implementation of landing obligation
|
EFCA costs: 206 mln EUR in 2014-2024
|
EFCA commitments slightly increase over time.
|
|
Indirect costs
|
Retail prices for FAPs increase with an annual growth rate of 3.8% between 2015 and 2024
|
Taxes contributing to EU contributions (the portion of taxes paid by citizens that support EU operations and contributions)
|
11/27 respondents from AC members reported losses due to the decrease of fishing opportunities
12/27 respondents from AC members reported large increase in losses due to reduced productivity
|
|
2014: 38.4 FTEs
2024: 81.6 FTEs
Data from 9 MS that completed the relevant survey
|
Over 80% of these FTEs are dedicated to data collection and reporting.
Data from the 9 MS that completed the relevant survey
|
331 FTEs in DG MARE working on different aspects of the CFP (2024 data – this number is relatively stable throughout the evaluation period)
|
European Commission is the largest bearer of indirect costs, while Advisory Councils, the Council and the Parliament contribute significantly. These costs arise from binding requirements distributed across EU governance actors.
|
|
Direct benefits
|
Environmental benefits; the overall number of stocks exploited at FMSY has increased from 50% in 2014 to 63% in 2022
The value of EU trade in fishery and aquaculture products grew by 18% in real terms and 2% in volume between 2015 and 2024
|
Citizens benefit from thriving oceans that can ensure long-term socio-economic prosperity.
|
€47.5 billion GVA and
€17.7 billion of gross profits for fisheries between 2014-2025
3.39million tonnes of landings valued at EUR 6.14 billion, marking a 22% decline in volume since 2014
35% increase in aquaculture in real terms reaching EUR 4,17 billion between 2014 and 2023
turnover increase of 50%, reaching €33.5 billion in the processing sector between 2014 and 2023
|
EU production increased in aquaculture and the processing sector, but decreased in the catching sector
|
N/A
|
N/A
|
Environmental benefits; the overall number of stocks exploited at FMSY has increased from 50% in 2014 to 63% in 2022
The value of EU trade in fishery and aquaculture products grew by 18% in real terms and 2% in volume between 2015 and 2024
|
The CFP directly benefits the EU by ensuring sustainable fish stocks while securing long-term food supply and economic activity for coastal communities.
|
|
Indirect benefits
|
25 jobs for every
€1 million of fisheries production
25% increase of wage in processing sector since 2014
21% increase of wage per employee in catch sector since 2014
|
Sustainable fisheries help ensure long-term access to safe, high-quality seafood at more stable prices while protecting marine ecosystems they depend on.
|
|
Stable and sustainably managed fish stocks reduce long-term risk and create more predictable market conditions for investment and planning.
|
|
The conservation of marine resources under the CFP Regulation, being an exclusive EU competence, shifts the burden of management from national administrations to the Commission.
|
|
The CFP is aligned with some of the targets under UN Sustainable Development Goal n.14 - Life under water
|
Simplification and burden reduction
The CFP Regulation being a basic Regulation leaves limited room for simplification without unravelling its core components or looking into auxiliary legislation. Nonetheless, some existing margins for simplification and burden reduction have been identified by the evaluation.
|
PART I: Simplification and burden reduction (savings already achieved)
Report any simplification, burden reduction and cost savings achieved already by the intervention evaluated, including the points of comparison/ where available (e.g. REFIT savings predicted in the IA or other sources).
|
|
|
Citizens/Consumers/Workers
|
Businesses
|
National Administrations
|
EU
|
|
|
Qualitative
|
Qualitative
|
Qualitative
|
Qualitative
|
|
|
|
Type: recurrent
|
N/A
|
N/A
|
By strengthening regionalisation, the 2013 reform of the CFP Regulation allowed Member States to tailor measures jointly rather than through detailed EU rules.
|
N/A
|
|
Type: recurrent
|
N/A
|
N/A
|
N/A
|
The 2013 reform of the CFP Regulation replaced a fragmented system of annual, short-term rules with clear objectives, the MSY target, and multiannual plans, which reduced the need for constant ad-hoc decision-making
|
|
|
|
PART II: II Potential simplification and burden reduction (savings)
Identify further potential simplification and savings that could be achieved with a view to make the initiative more effective and efficient without prejudice to its policy objectives136.
|
|
|
Citizens/Consumers/Workers
|
Businesses
|
National Administrations
|
EU
|
|
|
Qualitative
|
Qualitative
|
Qualitative
|
Qualitative
|
|
Description:…
|
|
Type: recurrent
|
The introduction of the landing obligation has been reported, in the context of stakeholder consultation (Annex 5) to add administrative burden and complexity to businesses and fishers. It is however noted that the landing obligations has only been implemented in a fragmented manner.
|
The introduction of the landing obligation has been reported, in the context of stakeholder consultation (Annex 5) to add administrative burden and complexity to businesses and fishers. It is however noted that the landing obligations has only been implemented in a fragmented manner.
|
The introduction of the landing obligation has been reported, in the context of stakeholder consultation (Annex 5) to add administrative burden and complexity to businesses and fishers. It is however noted that the landing obligations has only been implemented in a fragmented manner. National administrations are tasked with ensuring implementation through control and enforcement.
|
N/A
|
|
Type: recurrent
|
Digitalization and better data use could enhance the efficiency gains stemming from the implementation of the CFP
|
Digitalization and better data use could enhance the efficiency gains stemming from the implementation of the CFP
|
Digitalization and better data use could enhance the efficiency gains stemming from the implementation of the CFP
|
Digitalization and better data use could enhance the efficiency gains stemming from the implementation of the CFP
|
|
Type: recurrent
|
simplified aquacultural licensing
|
simplified aquacultural licensing
|
simplified aquacultural licensing
|
N/A
|
|
Type: recurrent
|
Recognition of foreign fishers’ licenses to facilitate recruitment
|
Recognition of foreign fishers’ licenses to facilitate recruitment
|
N/A
|
N/A
|
Annex V. Stakeholders consultation - Synopsis report
Disclaimer:
This report represents the perspectives of a wide range of stakeholders. When reading through the responses analysis, one should remember the variety of stakeholders, the individual and/or collective nature of their responses, which do no not necessarily constitute a representative sample at all times. While stakeholders’ opinions are important to understand perception of challenges and successes, they may be based on interpretations that are at odds with the European Commission’s interpretation of the law.
Additionally, many stakeholders do not fully distinguish between the CFP basic Regulation and the CFP policy (which covers many other secondary legislation), especially as they use identical names. Therefore, caution should be applied when reviewing stakeholder feedback as the two concepts sometimes seems to be used by stakeholders interchangeably.
Stakeholders’ contributions do not bind the Commission.
The Common Fisheries Policy (CFP) Regulation impacts the work and lives of many people. To ensure that their diverse views and expertise inform the evaluation of the CFP Regulation, DG MARE’s consultation strategy identified the following relevant stakeholders: national and regional authorities, fisheries and aquaculture operators and representatives, environmental and animal welfare organisations - contributing individually or through ACs -, the scientific community and EU citizens. In order to ensure the utility and representativeness of their input, these groups were targeted through a mix of methods, including an open call for evidence, a public consultation, semi-structured interviews, a call for position papers as well as targeted reach-outs to ACs and scientific groups.
The following synopsis report outlines each step of the consultation process, the audience reached, the key points raised by different groups, and how their input was considered during the evaluation process.
Methodology
Call for evidence
An open Call for evidence was published on the Commission's Have your Say portal1, inviting groups and individuals to provide their views on the CFP’s performance between 2014 and 2024. The feedback period was open from June to September 2024. There were no guiding questions, so that respondents could share what they considered relevant. 87 individuals and groups took part in the Call, with more than a quarter coming from business associations and environmental/animal welfare non-governmental organisations (NGOs) respectively, followed by 17% (15 answers) from public authorities as shown in Figure 1.
Spain and Belgium were by far the most represented countries among respondents, with 20 and 19 answers respectively (23% and 22%) as can be seen in Figure 2. It is to be noted that many respondents based in Belgium were in fact European organisations, rather than national representatives. The remaining respondents originate from 15 other EU countries, including from outermost regions (La Réunion).

Figure 1 Overview Call for evidence sorted by respondents. source: have your say portal

Figure 2: Overview respondents Call for evidence by country. source: Have your say portal.
Open public consultation
The Call for evidence was followed by a public consultation conducted through an online questionnaire, available from January to April 2025. Respondents were asked to answer questions aligned with the Better Regulation criteria, including on the effectiveness, efficiency, relevance and coherence of the CFP Regulation. The questionnaire covered the same dimensions as the evaluation, i.e. environmental, economic and social sustainability as well as governance issues affecting producers, consumers and public authorities over the past ten years of the CFP Regulation’s implementation. In total 362 responses were received and all contributions, including annexes, were published on the European Commission’s Have your say portal2, accompanied by a factual summary.
Individuals responding to the public consultation originated from 30 different countries, including 23 EU Member States as seen in Figure 3, and 7 non-EU countries (Canada, Montenegro, Russia, Switzerland, Ukraine, the United Kingdom (UK) and the United States). As for the Call for evidence, most responses (over 58%, representing 212 responses) were received from Spain providing their input mainly as citizens or business associations. Other countries with an important – albeit significantly lower – number of respondents (between 20 and 30) were France, Sweden and Belgium. Figure 4 shows the division of respondents based on category of respondents.

Figure 3: Public consultation respondents sorted per country. source: Famenet 2025

Figure 4: Public consultation respondents sorted per stakeholder group. Source: Famenet 2025
It should be noted that many Spanish responses appear to have been submitted in a coordinated manner, with identical or highly similar answers provided across all quantitative questions. In many cases, an agreed verbatim was repeatedly used in the qualitative responses. These submissions predominantly expressed the view that the CFP Regulation has neglected the socioeconomic wellbeing of the fisheries sector, especially small scale and artisanal fisheries, while favouring environmental goals. Consequently, the aggregated results for several survey questions may reflect a degree of response bias, with a stronger representation of negative assessments of the socioeconomic dimensions of the CFP Regulation while indicating that environmental performance has been better achieved. In order to address this bias, the outcomes of the consultation are presented per category of stakeholders, to ensure that business concerns are not disproportionately reflected.
Targeted interviews
In the public consultation, individuals could opt to be contacted for individual interviews on topics not addressed in the questionnaire. Out of 362 survey respondents, 159 indicated that they were interested in participating in an interview. After adjustment of duplicate survey responses to reduce bias and overrepresentation, 131 respondents were identified as candidates for an interview. To ensure a balanced but representative group, the Commission asked a contractor to conduct interviews with 90 participants who were selected on the basis of their representativeness in terms of interest group, nationality and the topics they indicated. In the end, 66 respondents reacted to the invitation for an interview. The contractor conducted semi-structured interviews using guiding questions developed together with DG MARE. The interviews were all conducted online and in a window of nearly three months (between 08 July and 24 September 2025). Figures 5 and 6 present the division of interviewees by country of origin and type of organisation. Note that Belgium is overrepresented due to the place of origin of a lot of organisations in Brussels.
The goal was to gather specific elements of the CFP Regulation that they felt needed improvement; costs/administrative burdens associated with the CFP Regulation and recommendations for future CFP Regulations and related legal frameworks.

Figure 5: Interview Participants sorted per country. Source: FAMENET 2025

Figure 6: Interview Participants sorted per type of organisation. Source: FAMENET 2025
Oral input through meetings
Throughout the evaluation process, DG MARE informed interested stakeholders about the purpose, process and development of the evaluation, in both formal and informal settings. This was an opportunity to remind them of the different ways they could participate in the consultation process. Meetings were held with different stakeholder representatives, such as with the 11 ACs, social partners, Norway, the UK, NGOs, and various fisheries attachés3. While the main purpose of these interactions was to update stakeholders about the evaluation, it also offered a space for stakeholders to contextualise the input they provided.
How stakeholders’ input has been considered
Stakeholders’ input has informed the evaluation of the CFP Regulation in three ways:
·The review of stakeholder perspectives enabled the identification of common themes and priority issues. This provided direction when building the foundations of the evaluation, guiding the selection of indicators and their analysis in the Staff Working Document.
·While the evaluation is grounded in extensive data, stakeholders added critical context, helping to interpret and contextualise the findings.
·Beyond this, the input from the scientific community (STECF, ICES and EFARO) was treated as scientific expertise.
Business associations/companies
In the call for evidence, 24 contributions were received from business associations and companies. Two themes were mentioned most frequently: the necessity for balanced attention to the three dimensions of the CFP – i.e., prioritising social and economic factors as much or more as environmental ones – and the need to ensure a level playing field, both externally and internally. Most respondents highlighted the need for a level playing field between European products and imports from third countries, urging the Commission to enforce uniform standards, strengthen efforts against illegal, unreported and unregulated (IUU) fishing, and prioritise harmonised standards in trade negotiations. Five business associations specifically underscored the risks of importing marine food from countries with weaker standards, with implications for both sustainability and competitiveness. Additionally, one business association pointed to an uneven playing field among Member States, citing uneven EU funding distribution for Producer Organisations and inconsistent systems of distributing penalty points in different Member States.
The third most frequent feedback point concerned business associations’ request to review the landing obligation, whose implementation was described as very difficult.
In the open public consultation, as previously mentioned, Spanish industry was dominantly present which should be taken into account when reading their opinions on the success criteria below.
Regarding effectiveness, business associations shared criticisms with public authorities but were more outspoken about the economic consequences. They considered the CFP environmentally beneficial but operationally inefficient and financially damaging. Respondents described the policy as poorly adapted to real fishing conditions, stifling competitiveness and innovation. They also argued that the CFP’s governance system privileges larger operators and marginalizes smaller ones. Business representatives demanded simplification of administrative rules, fairer market conditions, and EU funding mechanisms that enable technological renewal and sustainable vessel construction.
Regarding efficiency they described the policy as rigid, bureaucratic, and inefficient. They argued that measures like excessive reporting and strict technical controls burden smaller fleets, discourage innovation, and limit modernisation. They urged streamlined rules, regional differentiation, and fairer competition with imports, while keeping environmental standards intact.
Regarding relevance, they saw the CFP’s principles as still valid but unevenly applied. They argued that environmental goals have outweighed social and economic priorities, particularly in the Mediterranean, and urged better balance, regional adaptation, and modernisation support to maintain competitiveness.
They viewed the CFP’s goals as coherent in theory but clash with other EU policies in practice—especially energy, trade, and environmental legislation. They warned that contradictory rules create uncertainty and extra costs, and urged better integration between fisheries, maritime, and climate policies to ensure regulatory stability and competitiveness.
In the interviews, business associations expressed concerns over the CFP's complexity, fragmentation and its failure to adapt to the diverse realities of sub-sectors. Fishing associations pointed to operational challenges from the landing obligation, capacity rules, and spatial squeeze. According to them, this complexity deters younger people from entering the sector. They also emphasised the disadvantages faced by small-scale passive gear operators under uniform regulations that treat them the same as industrial trawlers. They also saw maritime spatial planning processes as sidelining fisheries.
A number of associations highlighted concerns about the impact of external factors on EU fisheries management, with Brexit as the primary focus, followed by Russia’s war against Ukraine and the Covid 19 pandemic. While some argued that the CFP is no longer fit for purpose in this evolving context, others called for these external challenges to be integrated into the evaluation of the CFP Regulation.
Several business associations requested a change to the current quota system based on MSY. While various associations recognised the positive impact the MSY objective has had on fish stocks, they criticised it being a legal obligation as well as the ambition to fish every stock at MSY all the time, rather than achieving it over time. This leads to abrupt quota changes and uncertainty. Another frequently mentioned critique targeted the CFP Regulation’s restrictions on fishing capacity, which hinder investment in the renewal and modernisation of vessels, impacting crew safety. Current capacity definitions based on gross tonnage include non-operational spaces such as kitchens, cabins and recreational spaces for crew members – elements that do not affect a vessel’s ability to locate, catch or store fish. One respondent suggested using net tonnage as an alternative definition.
Aquaculture representatives requested aquaculture to be given a higher priority. They worry that EU aquaculture has stagnated while competitors such as Norway, the UK and Iceland have expanded significantly. Both European and international aquaculture business associations advocated for simplified aquacultural licensing, targeted aquaculture funding, and stronger recognition of aquaculture ecosystem services. Key concerns were inconsistent environmental rules, water quality standards that affect certification, and the risk of being sidelined in maritime spatial planning due to the expansion of offshore renewables and tourism. International aquaculture producers highlighted declining shellfish output, generational renewal problems, administrative barriers, and vulnerability to climate change impacts such as invasive species and ocean warming.
NGO and environmental organisations
To the call for evidence, 24 NGOs and environmental organisations answered, including organisations representing environmental concerns, animal welfare considerations or more specific thematic or geographic interests. The most recurring topic mentioned by 15 organisations was the alleged failure to allocate fishing opportunities based on social and/or environmental criteria, as required by Article 17 of the CFP Regulation. In this context, many respondents also mentioned the lack of transparency around allocation criteria as well as the resulting pressures on small-scale coastal fisheries.
Four other topics were frequently highlighted: (1) the poor compliance with the landing obligation, coupled with the persistence of discards; (2) the lack of coherence between the CFP and environmental legislation, with initiatives such as Marine Protected Areas, the Habitats and Birds Directives, Natura 2000, the Nature Restoration Law, Good Environmental Status under the Marine Strategy Framework Directive as well as the Marine Action Plan all cited as examples and the practice of bottom trawling in protected areas, which conflicts with environmental objectives; (3) overfishing, specifically the alleged failure to meet the 2020 deadline for ending overfishing as a result of setting total allowable catches (TACs) above scientific advice, a management approach that maintains stocks at the lowest biological reference point, TACs allegedly disregarding ecosystems-based fisheries management or the precautionary principle and TACs ignoring poor compliance with the landing obligation; and (4) the fact that unmet CFP objectives are mostly linked to weak implementation, deliberate misinterpretation of rules and insufficient enforcement.
In the open public consultation, NGOs presented a contrasting perspective. They regarded the CFP Regulation as a strong and necessary instrument that has made substantial progress toward sustainable fisheries and healthy ecosystems. However, they blamed uneven implementation, weak enforcement, and political compromises—particularly in quota setting—for its shortcomings. For NGOs, ineffectiveness lies not in the policy design but in Member States’ alleged failure to apply it consistently. They urged the EU to focus on full enforcement, eliminate harmful subsidies, and ensure transparent, science-based governance. NGOs also advocated fairer quota allocation criteria under Article 17 to support small-scale, low-impact fisheries.
Regarding efficiency, NGOs and environmental organisations accepted the need for simplification but warned against weakening conservation goals, while identifying inefficiency as a result of poor enforcement rather than flawed design. They called for stronger, clearer implementation of existing provisions—especially Articles 2, 11, and 17.
Regarding relevance and coherence, NGOs and environmental organisations viewed the CFP’s objectives as essential yet under-implemented. They praised its sustainability focus but criticised weak enforcement, notably of Article 17 on fair quota allocation. They advocated for full application of current rules, stronger links with the European Green Deal and Biodiversity Strategy, and improved transparency. Despite being mostly coherent with EU sustainability policies, they argued that weak enforcement and political compromises undermine this coherence, highlighting inconsistencies in quota decisions, regional management, and environmental protections. True policy alignment, according to them, requires stricter adherence to scientific advice and full application of existing conservation rules.
NGOs broadly agree that the CFP is structurally fit for purpose but chronically undermined by weak implementation, limited enforcement, and poor integration with wider EU policies. They advocate for binding and transparent quota allocation, prioritisation of low-impact and small-scale fishers, stronger ecosystem-based management, and systematic monitoring of compliance. Across regions, NGOs/environmental organisations had a consensus that there should be less focus on reforming legal frameworks and more on making existing rules work—ensuring ecological sustainability, fairness, welfare, and resilience for local communities and marine ecosystems.
EU citizens
Nine3 contributions were made by citizens to the call for evidence, coming from Germany, Ireland, Greece, Spain, Finland and Sweden. Among them were individuals with expertise in the field, such as fishers or scientists, while others shared their views as concerned citizens. Given the limited number of participants and their diverse perspectives, only a few themes emerged repeatedly, concerns about the CFP permitting overfishing, either through TACs that are set too high, that deviate from scientific advice or through flawed assessments.
In the public consultation a large group of Spanish industry filled in the questionnaire as EU citizen and small-scale fishers.
They expressed frustration at what they saw as the policy’s neglect of social justice and community survival. While recognising the importance of environmental protection, they said the CFP has eroded local economies, reduced employment, and accelerated generational decline in the sector. Many described the governance system as top-down and inaccessible, with decisions made far from coastal realities. They called for fairer representation, local participation in decision-making, and clear labelling and market support for EU-caught products to ensure both ecological and social sustainability.
They saw the CFP as bureaucratic and detached from local realities, with smaller operators bearing disproportionate costs. They called for simpler procedures, easier access to funding, and fairer quota allocations.
They felt that, while the CFP’s aims are important, it has drifted away from local needs. They called for renewed focus on employment, community resilience, and local seafood consumption.
They perceived contradictions between EU sustainability rhetoric and the everyday reality of declining small-scale fleet viability. They called for policies that genuinely integrate environmental aims with social justice and community survival.
The interviewed EU citizens called for a more sustainable, transparent, and participatory fisheries policy. They expressed a desire for clearer regulatory differentiation between different types of fishers, better communication, and stronger ecological commitments. Regional experiences varied—from recreational fishers’ concerns in Belgium, to ecological failures cited by German citizens, to social crises in Greece, and structural decline in Sweden—but all converged on the need to reform the CFP to integrate environmental sustainability with fairness towards fishers, improved focus on socioeconomic status of fishing communities, preservation of fishers’ cultural heritage and community resilience.
Advisory Councils
Three ACs submitted official feedback to the Call for evidence under the category ‘Other’. Given their different geographical and/or thematic occupations, as well as the variety of stakeholders composing these ACs, their feedback points showed a lot of diversity. Two points that were mentioned by two ACs were the difficulties in implementing the landing obligation, as well as the need for greater regionalisation, while stressing that the process needed an overhaul post-Brexit to provide Member States and ACs with a meaningful role. There were further mentions of the need to adapt measures according to the needs of the regional context.
A concern on the stagnation of aquaculture production and employment was voiced, as well as the limited impacts of the non-binding aquaculture strategic guidelines. ACs also highlighted the lack of indicators to monitor the sustainability of EU aquaculture.
There was a focus as well on emerging elements which raise the question of whether the CFP remains fit for purpose, including Brexit, competition for maritime space, conflicts, as well as generational renewal and decline in employment. ACs requested a bigger role for experts on the ground and the adaptation of the CFP to climate change, including the allocation of fishing opportunities and fleet capacity measures.
ACs further emphasised the need to consider the socioeconomic dimensions alongside environmental ones, highlighting issues related to generational renewal and undignified living conditions of fishers (including the low compensations paid during cessation periods). ACs repeatedly called for greater stakeholders’ involvement, including in maritime spatial planning decisions and scientific processes, as well as between stakeholders, scientists and managers generally (emphasising the need for dialogue as opposed to parallel monologues). ACs requested the Commission to give more visibility on the impact of ACs’ recommendations and feedback. One Advisory Council specifically criticised the alleged lack of implementation of an ecosystem-based approach and expressed support to an adaptive and flexible framework to fisheries management in the light of climate change.
In parallel, official recommendations were received from all eleven ACs, as well as a Joint Advice, submitted by ten ACs and presented at an inter-AC meeting. Key points raised by ACs are presented below; however, several AC submissions revealed internal divergences among their own members, reflecting the pluralism of representations included in these advisory bodies. Diverging positions were included in their recommendations, either in the form of formal minority positions or explicitly recorded on specific issues.
Across the AC submissions, there is a strong perception that the current governance of the CFP does not sufficiently reflect the biological, ecological, social, and economic complexities of the EU’s diverse sea basins.
Also, across all ACs, climate change is interpreted as an active driver, reshaping fisheries reality. Some ACs emphasised stock mobility and cross-border quota implications, while others focused on ecosystem degradation and environmental stress. Many ACs highlighted the need for advice, management and implementation to integrate climate impacts – and in some cases also pollution and biodiversity loss.
Concerning MSY, various perspectives emerged. On the one hand, there is broad recognition that mixed fisheries challenge the current implementation of MSY. Many ACs argue that a rigid application of the MSY objective does not account for species interactions, multi-species catch realities, biological variability, gear and fleet diversity, or socio-economic impacts. On the other hand, several ACs also stressed that not all stocks are yet fished at MSY and that overfishing remains a persistent problem.
A strong consensus emerged around the view that the landing obligation has not achieved its intended objective of discard reduction. In practice, many ACs argued that it has generated operational problems including choke species effects and heightened administrative burdens. Multiple ACs observed that discarding is unavoidable in mixed fisheries with existing quota structures. Some ACs supported targeted reform of the landing obligation, while others propose its transition into a broader approach centered on full documentation and electronic monitoring.
Many ACs highlighted a perceived imbalance between environmental objectives and socio-economic sustainability, with repeated reports that small-scale and other fishers feel burdened by compliance obligations that do not align with practical feasibility or local fishing realities.
Socio-economic vulnerability, particularly regarding employment, is another pervasive concern. Many ACs note that the labour force is ageing and that fishing occupations are unattractive to younger generations, hindering generational renewal. Some ACs link this to current working conditions and incomes, as well as a neglect of the social dimension and small-scale fishers, particularly in the allocation of fishing opportunities by Member States under Article 17. The continuation of fishing as a viable livelihood – especially in small-scale and artisinal enterprises – is presented as both a cultural and economic imperative. Employment shortages were also reported in processing, marketing, fish auctions and aquaculture.
Many ACs called for greater participation across all aspects of fisheries governance, including scientific advisory processes. There were repeated requests for improved data collection, integration of fishers’ ecological knowledge, and clearer demonstration of how AC recommendations influence final decisions. Some ACs also mentioned the need for greater balance within ACs, as well as the effects of Brexit on regionalisation.
Another widely discussed topic was spatial competition with other maritime uses (such as deep-sea mining, ocean energy) and insufficient coherence with other European policies, including environmental legislation. Concerns were raised that maritime spatial planning is not sufficiently accounting for socio-economic impacts and that fishers are not adequately represented in spatial-allocation decisions.
Fleet renewal and technological modernisation were discussed in several ACs in relation to decarbonisation, digital monitoring and the age of vessels. Opinions diverged on capacity rules: Some argued that current capacity ceilings inhibit investment in safer and more efficient vessels, while others – including the CC SUD4 minority opinion – called for mainaining capacity limits. An AC stressed the need to reduce fleet capacity in certain overfished areas, in line with Green Deal objectives, while also ensuring that socioeconomic aspects are considered in such management decisions.
The concept of level playing field – particularly ensuring that imported seafood meet standards equivalent to EU production – emerged in some submissions. ACs noted that EU producers operate under stricter labour, monitoring, and sustainability regulations, which may disadvantage them competitively, particularly given the high rate of seafood imports. Issues related to an internal level playing field (i.e., among EU producers) were also raised in relation to inconsistent enforcement, lack of control or differences in access to public financing.
Finally, specific issues emerged in certain AC submissions: several ACs highlighted challenges resulting from Brexit, including the loss of access to fishing grounds, administrative burdens, tariff disruptions, and employment effects and requested a greater role in EU-UK negotiations. It was also argued that existing CFP provisions for outermost regions are insufficiently robust and do not adequately reflect their structural constraints, and the Aquaculture AC criticised the CFP’s insufficient attention to aquaculture.
Joint AC Advice
10 out of the 11 ACs worked on a Joint Advice, which highlighted that, despite the formal role of ACs in the CFP, their influence in policymaking is limited because of a lack of transparency and feedback regarding how their advice is used. Their recommendations are non-binding, often receive insufficiently detailed responses according to them, and are not systematically incorporated or acknowledged by the Commission or Member States, which undermines stakeholder motivation and trust in the process. Representation imbalances persist - both between sector organisations and other interest groups, and across Member States within regional ACs - leading to skewed influence, insufficient participation of some fleet segments, and neglected regional perspectives. Furthermore, the consensus-based model can suppress minority views, unless dissenting positions are explicitly documented - which is not always done systematically.
The ACs also pointed out that, according to them, their contributions to scientific advice requests and international fisheries governance remain underutilised, with limited access to the early stages of advice formulation to ICES, RFMOs, and regional seas conventions. Current funding and operational frameworks restrict their ability to source external expertise, engage in targeted research, or participate meaningfully in international policy fora. Additionally, timing mismatches between Commission processes and AC consultation cycles reduce their capacity to deliver relevant and timely advice, and there is insufficient alignment of policy calendars, work programmes, and regulatory consultations. The ACs argued in favour of a more accountable CFP process, including mechanisms to track the uptake of AC advice, extended dialogue with EU institutions, better communication to civil society, and reforms to ensure that AC participation is not symbolic but materially influences policy outcomes.
Public Authorities
15 public authorities contributed to the call for evidence, representing national and regional authorities from eight EU Member States as well as one intergovernmental authority and one international organisation representing regional authorities, with responsibilities across various sectors such as agriculture, maritime policy, environment, water management, and fisheries. This explains why there was some heterogeneity in the points raised.
The three most commonly discussed topics, mentioned by seven authorities (i.e. 50%), were concerns about generational renewal, the lack of coherence with environmental legislation, and the need to balance different sustainability dimensions. Like a number of business associations, many authorities argued that the environmental dimension has been prioritised so far, and that the focus should now shift towards the social or socio-economic dimensions. One authority suggested establishing quantitative socio-economic objectives, which was also proposed in the feedback from STECF. Regarding the incoherence between fisheries and environmental legislation, some advocated for greater cross-sectoral collaboration, while two authorities each suggested that the CFP should take precedence over environmental policy or instead contribute more to them.
In the open public consultation, public authorities generally acknowledged that the CFP Regulation has been effective in improving environmental outcomes, particularly in rebuilding fish stocks and advancing sustainability goals. However, they viewed it as economically and socially weak, emphasising that rigid rules, complex administrative procedures, and limited regional flexibility have undermined the viability of fishing communities—especially in the Mediterranean. Authorities called for clearer governance, simplified implementation, and policies that better integrate environmental, economic, and social objectives while supporting fleet modernization and decarbonization.
They viewed the CFP Regulation as solid in principle but weighed down by complex, overlapping rules and heavy compliance costs. They called for simplification, clearer coordination among Member States, and greater regional flexibility to make implementation more practical and cost-effective.
They agreed the CFP’s goals remain relevant – especially environmental sustainability and stock management but said socioeconomic aims like fleet renewal and stable income lag behind.
Public authorities generally viewed the CFP Regulation as internally coherent but poorly aligned with related EU policies. They cited inconsistencies between fisheries' objectives and broader frameworks like the European Green Deal, Biodiversity Strategy, and Marine Strategy Framework Directive. Many called for stronger policy coordination, clearer legal definitions, and harmonized objectives across environmental, economic, and social pillars.
The outcomes of the public authorities stakeholder consultation echoed the sentiments expressed in other stakeholder consultations, including the citizen and the business associations stakeholder consultations. All stakeholders emphasised the need for a more sustainable, transparent, and participatory fisheries policy that integrates environmental sustainability with social justice and community survival.
Public authorities see the CFP as making important progress on ecological sustainability but failing to adequately address socio-economic sustainability, competitiveness, and resilience. Fleet renewal, generational renewal, fairer funding, and stronger external and trade measures were repeatedly identified as critical for the future of European fisheries.
No public authority asked to be interviewed.
Other (Trade Unions, Companies, Consumer associations)
The other category of the respondents to the call for evidence contains stakeholders that didn’t fit in the standard Commission categories, that were not involved in any of the 11 ACs or had a too low representation to reflect the opinion of the stakeholder group.
Companies advocated for new technological and digital innovations, proposing the example of a DNA tracing technology which allows for more specific fish stock identification. This could be used to inform consumers about the sustainability and origin of the products they consume. The other companies raised concerns about offshore wind farms limiting fishing areas, but their installation could be beneficial if paired with aquaculture support. They also noted recruitment constraints, as many foreign fishers’ licenses are not recognised across all Member States. They also advocated for better control of landings at docks to combat fish evasion and for horizontal investment in aquaculture. They stressed the need for coastal support infrastructure (nurseries etc.) but said that tourism was a major constraint for this due to competition for space. Finally, they criticized the investment limit.
The trade union echoed many points raised by business associations, such as the decline of vessels, companies and fleet workers as well as the need to balance all three sustainability objectives and to address other human activities that stress marine biomass (such as pollution or climate change). The sector’s lack of attractivity leads to labour shortages and growing reliance on migrant workers, resulting in challenges related to fair conditions, pay, certification, and rule enforcement.
The (self-identified) consumer organisation raised the issue of antimicrobial resistance, as a result of the mis- and overuse of antimicrobials in humans, animals and plants. While there are efforts to tackle this within the EU, the organisation called for the harmonisation and expansion of labelling requirements to inform about the use of antibiotic treatment for fish originating from within and outside EU.
In the interviews, participants identifying themselves as ‘other’ types of organisations included fisheries organisations from the Atlantic, Baltic, and Mediterranean Sea basins. Their sentiments converge on the need for a more balanced CFP that better integrates social and economic objectives with ecological goals, reduces bureaucracy, and ensures fairer treatment of small-scale fishers in quota allocation, political representation and support.
There was no “other” category in the Open Public Consultation.
Academics and research associations
Two research institutions responded to the call for evidence. One urged fisheries to catch up with other sectors to integrate animal welfare policy guidelines into general policy guidelines, following society’s shift towards sustainable consumption. The other institution raised various points, many of which were also mentioned by other stakeholders: lack of coherence between fisheries and environmental policy; ‘overreliance’ on MSY which are often overestimated and neglect ecosystem impacts leading to critical situations such as in the Baltic; ineffective landing obligation for demersal fishing due to a lack of adequate control; meaningless capacity ceilings in the light of technological creep which leads to increased catch intensity; the regionalisation process leading to a slow-down in the adoption of conservation measures and a decrease in transparency of negotiations.
In the open public consultation, the two participating academic and research institutions offered a balanced view on effectiveness, recognising clear environmental gains but highlighting structural inefficiencies and governance fragmentation. They stressed that regional disparities persist, particularly between the Atlantic and Mediterranean basins, and that the policy’s environmental focus has at times overshadowed socioeconomic realities. They called for evidence-based, region-specific management, improved data integration, and clearer accountability mechanisms. They viewed better coordination and simplification – not reform –as key to enhancing both effectiveness and governance.
They found the policy structurally sound but operationally cumbersome. They suggested efficiency could improve through digitalization, better data use, and more coordinated governance.
Regarding Relevance, they said the CFP remains conceptually sound but needs updating to address climate change and regional inequalities.
They found that while the CFP’s structure is conceptually coherent, implementation suffers from fragmentation across institutions and regions. They recommended improving inter-policy coordination and aligning fisheries management with EU climate and biodiversity goals to enhance overall coherence.
Interviews revealed a consensus among academic and research institutions that the CFP is overly complex, hard to enforce, and not well aligned with realities at sea. Impractical regulations, poor data quality, and selective enforcement undermine trust between fishers, scientists and policymakers, with regional disparities as a result. In the Atlantic region, trust issues between fishers and governance were highlighted, while in the Baltic concerns centred around the vulnerability of small-scale fisheries and ecological challenges. In the Mediterranean, institutes expressed concern with the vulnerability of small-scale fishers and discussed the need for broader, more flexible scientific advice, stronger regionalisation and better stakeholder involvement, with some noting that MEDAC input has little impact in their view.
Scientific Community
Besides responses from the two academic and research organisations to the consultations (see previous section), the Commission actively asked for input from the scientific communities STECF, ICES and EFARO.
Scientific input was particularly relevant for the CFP Regulation evaluation given the science-based nature of the CFP Regulation itself. DG MARE requested targeted scientific input from the Scientific, Technical and Economic Committee for Fisheries (STECF), the International Council for the Exploration of the Sea (ICES) and the European Fisheries and Aquaculture Research Organisation (EFARO). STECF1 and ICES are the main sources of scientific advice related to the CFP while EFARO2 is composed of directors of the main European research institutes involved in fisheries and aquaculture research. The following themes were highlighted in the organisations’ feedback:
Lack of measurable management objectives and need to balance investment in the three sustainability pillars
All three organisations mentioned the vague definition of objectives, with MSY as an exception. STECF highlighted that this ambiguity complicates operationalisation and monitoring. Related challenges include unclear indicators and threshold5. EFARO identified the absence of clear metrics for socio-economic objectives, and ICES observed that the monitoring of social and economic sustainability is less developed. Both called for greater emphasis on these dimensions and for assessments of the social value of fishing when it does not align with economic efficiency.
Reflections on the potential conflict between objectives, STECF members suggested that tension between socio-economic and conservation objectives are likely more pronounced in the short term, than in the long-term. ICES emphasised the need for a clear framework to specify which objectives are prioritised in the case of conflicts and address trade-offs – a crucial element to advance Ecosystem-Based Fisheries Management (EBFM). Governance reforms are needed to better operationalise EBFM, involving stakeholders.
Coherence with environmental policy
All three organisations highlighted gaps in integrating the CFP with environmental policies, like the Marine Strategy Framework Directive, Birds and Habitats Directives, Maritime Spatial Planning or the Nature Restoration Law. ICES and STECF noted that Article 11 does not ensure coherence with environmental legislation in practice. This incoherence is also linked to governance and funding complexities, as policies are overseen by multiple Commission’s Directorates Generals and funded by different streams.
MSY: Limits, alternatives, advantages
All bodies mentioned limitations of the single-species MSY objective, with ICES and EFARO noting that not all stocks can be managed at MSY simultaneously. Both organisations also highlighted that the legal obligations linked to MSY create tension between scientific uncertainty and regulatory demands.
Some scientists from across the organisations argued that MSY is not fit for purpose due to its limited capacity to address multispecies interactions and environmental conditions, as well as insufficient data quality in certain cases to reliably calculate MSY. Climate change adds further uncertainty to MSY assessments. As species distribution and productivity shift, this dynamic is likely to become more variable and unpredictable in the future.
While suggestions for ecosystem-based alternatives to MSY were made by scientists from all three organisations, others contended that MSY remains the best available tool if its implementation is improved. ICES noted that the precautionary approach to fisheries management is a necessary but insufficient condition for reaching MSY; and that the MSY concept is needed but not inherently sufficient to ensure sustainable fisheries across ecological, economic and social dimensions. Multi-annual adaptive management plans with stock-specific approaches and harvest control rules are recommended. Trade-offs and risk assessments across ecological, social, and economic dimensions are critical.
Data and research gaps
ICES mentioned the ‘loosely defined and prohibitive’ data management framework in Article 25, which has led to inconsistent interpretations of confidentiality rules across Member States. This complicates data access and hampers scientific work. EFARO raised concerns over public misinterpretation of open data, due to the complexity of environmental science.
Data gaps: EFARO identified uneven attention to fish stocks, with some oversampled and others poorly studied. STECF noted persistent issues with Member States providing irrelevant or outdated data despite guidelines on data needs. Research gaps: Key gaps include insufficient understanding of the ecological impacts of fishing practices; the conservation status of various species; the interaction between fisheries, other human activities and nature conservation; as well as climate change, which risks undermining the CFP objectives. Research and data gaps largely stem from insufficient prioritisation and funding for research and data collection, as highlighted by both EFARO and ICES.
Scientific advisory process
ICES and EFARO pointed to the increasing complexity and normativity of fisheries management, especially post-Brexit. The pressure to provide precise figures risks oversimplifying a highly complex system. ICES noted rising uncertainty in assessments due to rapid ecosystem change, emphasising that scientific understanding of ecosystem dynamics lags behind these developments. Both organisations also advocated for closer collaboration between science, policy and stakeholders.
Annex VI. Additional data, graphs and tables
Contents
3.1 Environmental dimension
3.1.1 Evolution of fish stocks
3.1.2 Other environmental measures
3.2 Socio-economic dimension
3.2.1 EU fishing Fleet
3.2.2 Main socio-economic results for the catch sector
Addendum n°1: analysis of price variability at first sales
Addendum n° 2: Transferable Fishing Concessions (TFCs)
3.2.3 Social data: employment, wages, accidents
Addendum n°3: analysis of preferential quota allocation and preferential access to 12 nautical mile zone for small-scale fisheries
3.2.4 Funding
3.3 Governance
3.3.1 Evolution of management systems for the catch sector
3.3.2 Data collection
Addendum n°4: Regional Coordination Groups
3.3.3 RFMO summary table
List of figures
Figure 1 - Graphical overview of MSY, BMSY and FMSY
Figure 2 - Trends in stock status in the NEA (North East Atlantic) between 2003-2023
Figure 3 - Percentage of stocks above F/FMSY in the NEA (119 stocks) and the Mediterranean & Black Sea (M&BS) (70 stocks)
Figure 4 - Adoption of measures on climate change by Member States as of 2021
Figure 5 - Age of the vessels per fleet segment
Figure 6 - Share of EU active fleet in losses, moderate profits and healthy profits period 2013-2022
Figure 7 - Total landings in the EU
Figure 8 - Trends on EU fishing fleet employment (in persons employed and FTE)
Figure 9 - Full time equivalent (FTE) in the small-scale coastal fleet by sea basin
Figure 10 - Full time equivalent (FTE) of the large-scale fleet by sea basin
Figure 11 - Ratio FTE to total employment in the fishing sector in EU member states (2016 vs 2022)
Figure 12 - Age composition of the EU fishing fleet of total employment by Member State, 2023 (%)
Figure 13 - Total employment in the fish processing sector (2012-2021)
Figure 14 - Total FTEs in the fish processing sector
Figure 15 - Average ratio FTE to total employment in the fish processing sector in the EU
Figure 16 - Ratio FTE to total employment in the processing sector per EU member states (2013 vs 2023)
Figure 17 - Employment and full-time employment (FTE) in aquaculture in the EU (excl. Luxembourg and UK)
Figure 18 - Employment (number of people) in aquaculture in EU Member States (2016 vs 2022)
Figure 19 - Ratio FTE to total employment in aquaculture in EU 2016 to 2022
Figure 20 - Average labour cost per total employment and FTE in the fishing sector
Figure 21 - Average labour cost per FTE by Member State
Figure 22 - Ratio of wage (average wage/national average wage) per segment, aggregated at the EU level
Figure 23 - Ratio of Member State fishing fleet segment average wage to national average wage
Figure 24 - EU fish processing industry sector overview 2013-2023, including average wage
Figure 25 - Ratio of Member State average wage within the fish processing sector to national average wage
Figure 26 - Average wage of aquaculture workers excluding the value and numbers of unpaid labour 2012-2022
Figure 27 - Ratio of the Average wage of aquaculture workers to the national average wage by Member State (2012-2022)
Figure 28 - Number of fatal accidents by EU regional basin (2014-2022)
Figure 29 - Number of non-fatal accidents at work within the EU fisheries and aquaculture sector by region (2014-2022)
Figure 30 - Accidents at sea involving the EU fishing fleet, by severity
Figure 31 - EMFAF financial allocation by priority and specific objective
Figure 32 - EMFAF commitments by priority and specific objective
Figure 33 - Number of assessed stocks by management system (all regions) 2014-2023
Figure 34 - Landings in volume by management system for all EU vessels, 2014-2024
Figure 35 - Landings in volume by management system for small-scale EU fishing vessels only 2014-2024
Figure 36 - Landings in value by management system 2014-2024
Figure 37 - Number of conclusive stock assessments among ICES and selected RFMOs
Figure 38 - Percentage of increase in conclusive stock assessments (including those accepted as qualitative) among ICES and selected RFMOs between 2014 and 2024
Figure 39 - Number of stocks with harvest control rules (HCR) from MSE adopted by year per RFMO
Figure 40 - Number of stocks with management procedures (MPs) from MSE adopted by year
Figure 41 - Number of stocks with management procedures (MPs) from MSE adopted by year
Figure 42 - Potential MSE-based advice (management procedure ‘MP’ listed under ICES advice category for all ICES stocks
Figure 43 - Potential MSE-based advice (management procedure ‘MP’ listed under ICES advice category for ICES stocks amongst EU basins and outermost regions (‘Non-EU’)
List of tables
Table 1 - Percentage of stocks where F/FMSY > 1
Table 2 - Stocks overexploited in 2014 and 2023 by basin
Table 3 - Percentage of stocks where B/BMSY > 1
Table 4 - Percentage of stocks where B/BMSY or B/MSYBtrigger > 1
Table 5 - Percentage of stocks where B/MSYBtrigger > 1
Table 6 - Percentage of stocks where B/BLIM < 1
Table 7 - List of stocks modelled in 2011 impact assessment
Table 8 - Cumulative number, area (km2) and percent change of MPAs across sea basins between 2014 and 2024
Table 9 - VMEs within RFMO areas
Table 10 - Fleet size evolution between 2014 and 2023
Table 11 - Balance indicators with numbers of fleet segments in balance or out of balance, by Member State in 2022, including trends between 2018-2022
Table 12 - Main socio-economic results for the EU active fleet (including Greece) for 2013-2023 and nowcasts for 2024 and 2025
Table 13 - Main socio-economic results for the EU small scale coastal fleets (excluding Greece) for 2013-2023 and nowcasts for 2024 and 2025
Table 14 - Main socio-economic results for the EU fleets less than 12 meters with active gear (L12AG) for 2013-2023 and nowcasts for 2024 and 2025
Table 15 - Main socio-economic results for the EU large-scale fleets for 2013-2023 and nowcasts for 2024 and 2025
Table 16 - Main socio-economic results for the EU distant water fleet for 2013-2023 and nowcasts for 2024 and 2025
Table 17 – EU fleet: comparison of expected outcomes vs. actual situation (2017 and 2022)
Table 18 - EU processing sector: main productivity performance indicators 2013 –2023
Table 19 - Item weights of EU household expenditure on total goods and services
Table 20 - Total employment of the EU fishing fleet by age groups at EU level (2023) and change (2017-2023)
Table 21 - Proportion of Member States national budget covered by funds from EMFF/EMFAF for the different years (total for Bulgaria, Cyprus, Greece, Finland, Ireland, Lithuania, Netherlands, Spain, Denmark)
Table 22 - Horizon2020 work programme 2025 allocations per cluster (for 2021-2027)
Table 23 - Number of agreements related to concrete data collection activities which are coordinated among different Member States in the same region
Table 24 - Qualitative indicators showing the evolution of the decision-making process in the Regional Coordination Groups (RCGs)
Table 25 - Draft and final Regional Work Plans presented by year and Regional Coordination Group
Table 26 - Total number of surveys performed, indicating if they are mandatory (Y/N), coordinated internationally (Y/N) and not coordinated (N/N) by Regional Coordination Group and year
Table 27 - Number of data calls and reporting obligations issued by end user
Table 28 - Number of meetings using DCF data by STECF, ICES and Regional Management Fisheries Organisations
Table 29 - Number of data requests for DCF data made to the Commission
Table 30 - Percentage of stocks with known biomass references points by regional basin (2014-2024)
Table 31 - Percentage of stocks with known fishing mortality references points by regional basin (2014-2024)
Table 32 - Percentage of catches with known biomass references points by regional basin (2014-2024)
Table 33 - Percentage of catches with known fishing mortality references points by regional basin (2014-2024)
Table 34 - Number of scientific advice products addressing environmental impacts of fisheries
Table 35 - Annual advice that includes socio-economic considerations
Table 36 - Examples of EU support to improving the performance and governance of RFMOs (2014-2025)
3.1 Environmental dimension
3.1.1 Evolution of fish stocks
Figure 13 - Graphical overview of MSY, BMSY and FMSY

Table 8 - Percentage of stocks where F/FMSY > 1
Source of data: based on ICES, STECF, selected RFMOs and SFPAs assessment data. (N.B.: data on RFMOs/SFPAs are only partial and indicative).


Figure 14 - Trends in stock status in the NEA (North East Atlantic) between 2003-2023
Blue line: the proportion of stocks with F>FMSY and yellow line: the proportion of stocks outside safe biological limits SBL (F>FPA or B<BPA)
Source: STECF ad hoc 25-01
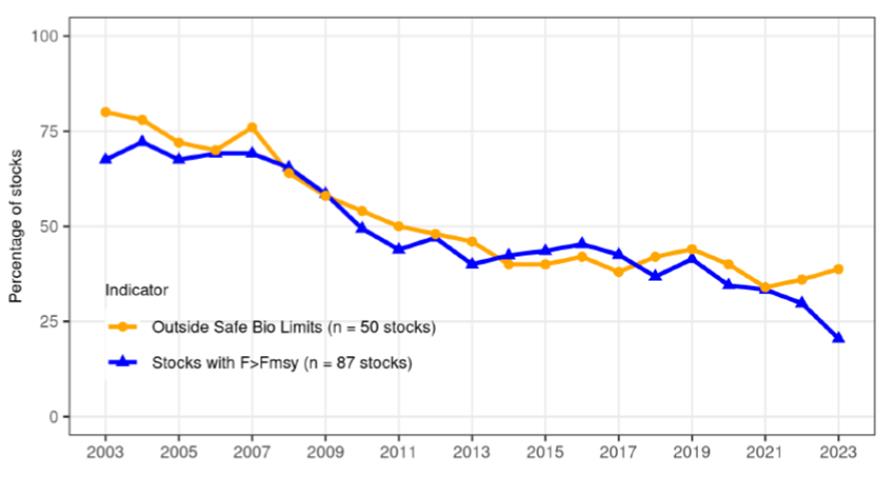
Figure 15 - Percentage of stocks above F/FMSY in the NEA (119 stocks) and the Mediterranean & Black Sea (M&BS) (70 stocks)
Source: supporting study based on STECF ad hoc 25-01

Table 9 - Stocks overexploited in 2014 and 2023 by basin
|
Region
|
Stocks
|
|
NWW
|
cod.27.7e-k; had.27.7b-k; her.27.nirs; sol.27.7fg; whg.27.7a; whg.27.7b-ce-k
|
|
NS
|
cod.27.46a7d20N; cod.27.46a7d20S; cod.27.46a7d20V; nep.fu.32; nep.fu.6; pok.27.3a46; pra.27.3a4a; wit.27.3a47d
|
|
SWW
|
hke.27.8c9a; pil.27.8c9a
|
|
Baltic
|
spr.27.22-32
|
|
Med
|
ANE_17_18; ARA_1_2; ARA_5; ARA_6_7; ARS_8_9_10_11; HKE_1_5_6_7; HKE_8_9_10_11; MUR_5; MUT_1; MUT_6; MUT_9; NEP_6; PIL_17_18; SBR_1_3
|
|
BS
|
0 stocks
|
|
NEA
|
reb.2127.dp; sbr.27.10; whb.27.1-91214
|
Table 10 - Percentage of stocks where B/BMSY > 1
Source: supporting study based on ICES, STECF, selected RFMOs and SFPAs assessment data. (N.B.: data on RFMOs/SFPAs are only partial and indicative).

Table 11 - Percentage of stocks where B/BMSY or B/MSYBtrigger > 1
Source: supporting study based on ICES, STECF, selected RFMOs and SFPAs assessment data. (N.B.: data on RFMOs/SFPAs are only partial and indicative).
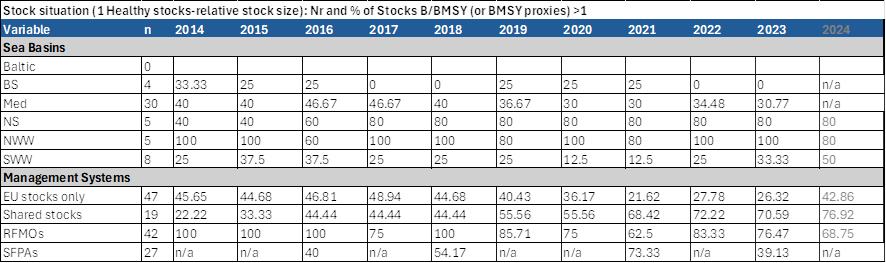
Table 12 - Percentage of stocks where B/MSYBtrigger > 1
Limited to only ICES stocks. Data on RFMOs/SFPAs are only partial and indicative.
Source: supporting study based on ICES assessment data.

Table 13 - Percentage of stocks where B/BLIM < 1
Data on RFMOs/SFPAs are only partial and indicative.
Source: supporting study based on ICES, STECF, selected RFMOs and SFPAs assessment data.


Table 14 - List of stocks modelled in 2011 impact assessment
|
Baltic herring 22-24
Blue whiting
Cod 22-24
Eastern channel sole VIId
North Sea haddock
North Sea Saithe
Southern hake
|
Baltic sprat
Celtic Sea sole VIIfg
Cod 25-30
Irish Sea sole VIIa
North Sea Herring
North Sea Sole
North East Atlantic mackerel
|
Bay of Biscay sole VIIIab
Central Baltic herring
Cod northeast Arctic
North Sea Cod
North Sea Plaice
Northern hake
Western horse mackerel
|
Source: Annex 6 of the Impact Assessment SEC()891 final
3.1.2 Other environmental measures
Table 15 - Cumulative number, area (km2) and percent change of MPAs across sea basins between 2014 and 2024
Source: supporting study based on data from Natura 2000 and nationally designated sites data held by the European Environment Agency (EEA), OSPAR, HELCOM and MAPAMED
|
CFP Region
|
Number of MPA
|
Area of MPA
|
|
|
2014
|
2024
|
% increase
|
2014
|
2024
|
% increase
|
|
Baltic
|
2 510
|
2 860
|
14
|
108 996
|
135 903
|
25
|
|
Black Sea
|
42
|
44
|
5
|
7 150
|
9 016
|
26
|
|
Mediterranean
|
988
|
1 075
|
9
|
115 058
|
198 148
|
72
|
|
North Sea
|
592
|
657
|
11
|
112 557
|
146 902
|
31
|
|
Northwestern Waters
|
351
|
435
|
24
|
43,278
|
70,961
|
64
|
|
Outermost Regions
|
139
|
161
|
16
|
115,948
|
195,730
|
69
|
|
Southwestern Waters
|
278
|
314
|
13
|
181,889
|
393,299
|
116
|
Table 16 - VMEs within RFMO areas
Source: supporting study based on data from selected RFMOs
|
RFMO
|
Number
|
Area, km2
|
|
|
2014
|
2024
|
% change
|
2014
|
2024
|
% change
|
|
CCAMLR
|
110
|
143
|
30
|
2 872
|
3 046
|
6
|
|
GFCM
|
3
|
4
|
33
|
15 660
|
16 287
|
4
|
|
NAFO
|
24
|
55
|
129
|
381 742
|
743 995
|
95
|
|
NEAFC
|
24
|
29
|
21
|
446 520
|
461 252
|
3
|
|
NPFC
|
2
|
6
|
200
|
546
|
1 093
|
100
|
|
SEAFO
|
21
|
22
|
5
|
1 172 860
|
1 173 016
|
0
|
|
SIOFA
|
-
|
5
|
|
-
|
25,148
|
|
Figure 16 - Adoption of measures on climate change by Member States as of 2021
Source: supporting study based on data from the report on the mid-term assessment of the implementation of the strategic guidelines

3.2 Socio-economic dimension
3.2.1 EU fishing Fleet
Table 17 - Fleet size evolution between 2014 and 2023
|
Fleet Category
|
2014
|
2023
|
Absolute Change
|
Percentage Change
|
|
Large-scale fleet
|
14 982
|
11 915
|
-3,067
|
-20.5%
|
|
Small-scale coastal fleet
|
43 833
|
41 106
|
-2,727
|
-6.2%
|
|
Distant water fleet
|
289
|
239
|
-50
|
-17.3%
|
Source: STECF 25-07 (see table 12 for full data set)
Figure 17 - Age of the vessels per fleet segment
Source: DCF data

Table 18 - Balance indicators with numbers of fleet segments in balance or out of balance, by Member State in 2022, including trends between 2018-2022
Source: STECF 24-13 and Study of the EU fishing fleet (2026)
Colour of cells represent trends: improving (green), deteriorating (red) or stable/none (blue). The total number of fleet segments showing different trends (increasing, decreasing, stable) for each Member State may differ to the total number of fleet segments (i.e. both in balance and imbalanced) for each indicator due to data availability.
|
Member State
|
Biological
|
Technical
|
Economic
|
|
|
SHI
|
SAR
|
VUR
|
ROI/ RoFTA
|
CR-BER
|
|
Belgium (BE)
Area 27
|
In balance
|
2
|
1
|
5
|
1
|
2
|
|
|
Out of balance
|
0
|
2
|
0
|
2
|
1
|
|
|
Decreasing trend
|
0
|
-
|
0
|
3
|
1
|
|
|
Increasing trends
|
0
|
-
|
0
|
-
|
1
|
|
|
Stable/no trend
|
2
|
-
|
5
|
-
|
1
|
|
Bulgaria (BGR)
Area 37
|
In balance
|
4
|
18
|
16
|
13
|
6
|
|
|
Out of balance
|
7
|
5
|
7
|
3
|
10
|
|
|
Decreasing trend
|
-
|
-
|
1
|
8
|
7
|
|
|
Increasing trends
|
6
|
-
|
2
|
4
|
4
|
|
|
Stable/no trend
|
-
|
-
|
14
|
-
|
1
|
|
Croatia (HRV) Area 37
|
In balance
|
2
|
9
|
12
|
9
|
12
|
|
|
Out of balance
|
12
|
20
|
18
|
14
|
11
|
|
|
Decreasing trend
|
6
|
-
|
-
|
14
|
11
|
|
|
Increasing trends
|
1
|
-
|
-
|
6
|
8
|
|
|
Stable/no trend
|
4
|
-
|
26
|
|
1
|
|
Cyprus (CYP) Area 37
|
In balance
|
1
|
3
|
0
|
2
|
2
|
|
|
Out of balance
|
1
|
4
|
7
|
4
|
4
|
|
|
Decreasing trend
|
0
|
-
|
0
|
4
|
3
|
|
|
Increasing trends
|
0
|
-
|
1
|
2
|
1
|
|
|
Stable/no trend
|
2
|
-
|
6
|
0
|
2
|
|
Denmark (DNK)
Area 27
|
In balance
|
4
|
7
|
-
|
7
|
12
|
|
|
Out of balance
|
3
|
18
|
-
|
18
|
13
|
|
|
Decreasing trend
|
1
|
-
|
-
|
6
|
1
|
|
|
Increasing trends
|
0
|
-
|
-
|
0
|
3
|
|
|
Stable/no trend
|
1
|
-
|
-
|
0
|
2
|
|
Estonia (EST)
Area 27
|
In balance
|
1
|
1
|
0
|
2
|
2
|
|
|
Out of balance
|
2
|
3
|
3
|
1
|
1
|
|
|
Decreasing trend
|
2
|
-
|
0
|
1
|
1
|
|
|
Increasing trends
|
0
|
-
|
0
|
0
|
0
|
|
|
Stable/no trend
|
0
|
-
|
1
|
0
|
0
|
|
Finland (FIN)
Area 27
|
In balance
|
3
|
1
|
3
|
1
|
1
|
|
|
Out of balance
|
0
|
4
|
2
|
4
|
4
|
|
|
Decreasing trend
|
3
|
-
|
-
|
3
|
2
|
|
|
Increasing trends
|
0
|
-
|
-
|
0
|
0
|
|
|
Stable/no trend
|
0
|
-
|
-
|
0
|
1
|
|
France (FRA)
Area 27
|
In balance
|
20
|
36
|
-
|
24
|
24
|
|
|
Out of balance
|
5
|
32
|
-
|
8
|
4
|
|
|
Decreasing trend
|
4
|
-
|
-
|
16
|
10
|
|
|
Increasing trends
|
0
|
-
|
-
|
16
|
11
|
|
|
Stable/no trend
|
19
|
-
|
-
|
0
|
11
|
|
France (FRA)
Area 37
|
In balance
|
6
|
14
|
-
|
14
|
14
|
|
|
Out of balance
|
0
|
12
|
-
|
1
|
1
|
|
|
Decreasing trend
|
0
|
-
|
-
|
8
|
11
|
|
|
Increasing trends
|
1
|
-
|
-
|
2
|
4
|
|
|
Stable/no trend
|
5
|
-
|
-
|
5
|
0
|
|
France (FRA)
OFR
|
In balance
|
1
|
0
|
-
|
0
|
0
|
|
|
Out of balance
|
0
|
1
|
-
|
1
|
1
|
|
|
Decreasing trend
|
0
|
-
|
-
|
1
|
1
|
|
|
Increasing trends
|
0
|
-
|
-
|
0
|
0
|
|
|
Stable/no trend
|
1
|
-
|
-
|
0
|
0
|
|
Germany (DEU)
Area 27
|
In balance
|
7
|
11
|
11
|
2
|
4
|
|
|
Out of balance
|
3
|
4
|
13
|
13
|
11
|
|
|
Decreasing trend
|
5
|
-
|
3
|
7
|
5
|
|
|
Increasing trends
|
0
|
-
|
0
|
2
|
2
|
|
|
Stable/no trend
|
2
|
-
|
10
|
0
|
2
|
|
Greece (GRC)
Area 37
|
In balance
|
1
|
9
|
10
|
9
|
9
|
|
|
Out of balance
|
5
|
5
|
4
|
5
|
5
|
|
|
Decreasing trend
|
1
|
-
|
2
|
7
|
7
|
|
|
Increasing trends
|
0
|
-
|
4
|
3
|
3
|
|
|
Stable/no trend
|
0
|
-
|
4
|
0
|
0
|
|
Ireland (IRL) Area 27
|
In balance
|
7
|
12
|
2
|
8
|
10
|
|
|
Out of balance
|
4
|
9
|
26
|
9
|
7
|
|
|
Decreasing trend
|
1
|
-
|
-
|
2
|
1
|
|
|
Increasing trends
|
6
|
-
|
-
|
1
|
1
|
|
|
Stable/no trend
|
3
|
-
|
-
|
0
|
1
|
|
Italy (ITA)
Area 37
|
In balance
|
8
|
9
|
7
|
12
|
15
|
|
|
Out of balance
|
11
|
19
|
23
|
9
|
6
|
|
|
Decreasing trend
|
10
|
-
|
10
|
12
|
7
|
|
|
Increasing trends
|
0
|
-
|
2
|
8
|
8
|
|
|
Stable/no trend
|
8
|
-
|
15
|
0
|
5
|
|
Latvia (LVA)
Area 27
|
In balance
|
0
|
4
|
1
|
4
|
4
|
|
|
Out of balance
|
2
|
-
|
3
|
0
|
0
|
|
|
Decreasing trend
|
-
|
-
|
0
|
-
|
0
|
|
|
Increasing trends
|
-
|
-
|
0
|
-
|
1
|
|
|
Stable/no trend
|
-
|
-
|
2
|
-
|
1
|
|
Lithuania (LTU)
Area 27
|
In balance
|
1
|
1
|
4
|
1
|
1
|
|
|
Out of balance
|
2
|
4
|
1
|
2
|
2
|
|
|
Decreasing trend
|
0
|
-
|
0
|
1
|
0
|
|
|
Increasing trends
|
3
|
-
|
1
|
0
|
0
|
|
|
Stable/no trend
|
0
|
-
|
2
|
0
|
1
|
|
Lithuania (LTU)
OFR
|
In balance
|
2
|
1
|
1
|
1
|
1
|
|
|
Out of balance
|
0
|
1
|
0
|
0
|
0
|
|
|
Decreasing trend
|
1
|
-
|
0
|
0
|
0
|
|
|
Increasing trends
|
0
|
-
|
0
|
1
|
1
|
|
|
Stable/no trend
|
1
|
-
|
1
|
0
|
0
|
|
Malta (MLT) Area 37
|
In balance
|
1
|
3
|
10
|
5
|
6
|
|
|
Out of balance
|
6
|
7
|
9
|
4
|
4
|
|
|
Decreasing trend
|
2
|
-
|
2
|
3
|
4
|
|
|
Increasing trends
|
0
|
-
|
0
|
5
|
5
|
|
|
Stable/no trend
|
4
|
-
|
13
|
0
|
0
|
|
The Netherlands (NLD)
Area 27
|
In balance
|
1
|
10
|
4
|
7
|
11
|
|
|
Out of balance
|
5
|
1
|
7
|
3
|
0
|
|
|
Decreasing trend
|
3
|
-
|
0
|
3
|
4
|
|
|
Increasing trends
|
0
|
-
|
0
|
7
|
5
|
|
|
Stable/no trend
|
3
|
-
|
8
|
0
|
2
|
|
Poland (POL)
Area 27
|
In balance
|
5
|
3
|
2
|
3
|
6
|
|
|
Out of balance
|
0
|
7
|
9
|
4
|
1
|
|
|
Decreasing trend
|
4
|
-
|
2
|
4
|
4
|
|
|
Increasing trends
|
0
|
-
|
1
|
0
|
0
|
|
|
Stable/no trend
|
0
|
-
|
3
|
0
|
0
|
|
Portugal (PRT)
Area 27
|
In balance
|
10
|
26
|
24
|
29
|
305
|
|
|
Out of balance
|
0
|
9
|
13
|
6
|
6
|
|
|
Decreasing trend
|
0
|
-
|
0
|
14
|
9
|
|
|
Increasing trends
|
2
|
-
|
0
|
20
|
23
|
|
|
Stable/no trend
|
8
|
-
|
36
|
1
|
3
|
|
Portugal (PRT)
OFR
|
In balance
|
2
|
0
|
2
|
2
|
2
|
|
|
Out of balance
|
0
|
2
|
0
|
0
|
0
|
|
|
Decreasing trend
|
-
|
-
|
-
|
-
|
-
|
|
|
Increasing trends
|
-
|
-
|
-
|
-
|
-
|
|
|
Stable/no trend
|
-
|
-
|
-
|
-
|
-
|
|
Romania (ROU)
Area 37
|
In balance
|
2
|
7
|
4
|
2
|
2
|
|
|
Out of balance
|
3
|
0
|
3
|
1
|
1
|
|
|
Decreasing trend
|
-
|
-
|
0
|
2
|
2
|
|
|
Increasing trends
|
-
|
-
|
4
|
0
|
0
|
|
|
Stable/no trend
|
-
|
-
|
2
|
0
|
0
|
|
Slovenia (SVN)
Area 37
|
In balance
|
-
|
2
|
3
|
3
|
3
|
|
|
Out of balance
|
-
|
1
|
0
|
0
|
0
|
|
|
Decreasing trend
|
-
|
-
|
-
|
1
|
-
|
|
|
Increasing trends
|
-
|
-
|
-
|
2
|
-
|
|
|
Stable/no trend
|
-
|
-
|
-
|
0
|
-
|
|
Spain (ESP)
Area 27
|
In balance
|
19
|
22
|
26
|
22
|
23
|
|
|
Out of balance
|
3
|
15
|
11
|
4
|
3
|
|
|
Decreasing trend
|
3
|
-
|
4
|
13
|
12
|
|
|
Increasing trends
|
1
|
-
|
3
|
10
|
10
|
|
|
Stable/no trend
|
7
|
-
|
24
|
0
|
1
|
|
Spain (ESP)
Area 37
|
In balance
|
10
|
12
|
18
|
12
|
13
|
|
|
Out of balance
|
3
|
15
|
9
|
8
|
7
|
|
|
Decreasing trend
|
7
|
-
|
3
|
11
|
9
|
|
|
Increasing trends
|
0
|
-
|
0
|
7
|
9
|
|
|
Stable/no trend
|
1
|
-
|
21
|
0
|
0
|
|
Spain (ESP) OFR
|
In balance
|
4
|
2
|
8
|
5
|
6
|
|
|
Out of balance
|
0
|
6
|
0
|
1
|
1
|
|
|
Decreasing trend
|
1
|
-
|
2
|
3
|
3
|
|
|
Increasing trends
|
0
|
-
|
0
|
3
|
3
|
|
|
Stable/no trend
|
2
|
-
|
6
|
0
|
0
|
|
Sweden (SWE)
Area 27
|
In balance
|
17
|
15
|
2
|
5
|
5
|
|
|
Out of balance
|
4
|
16
|
7
|
4
|
4
|
|
|
Decreasing trend
|
7
|
-
|
2
|
6
|
6
|
|
|
Increasing trends
|
3
|
-
|
0
|
3
|
3
|
|
|
Stable/no trend
|
7
|
-
|
18
|
0
|
2
|
3.2.2 Main socio-economic results for the catch sector
Table 19 - Main socio-economic results for the EU active fleet (including Greece) for 2013-2023 and nowcasts for 2024 and 2025
Source: Member States data submissions under the 2025 Fleet Economic data call

Table 20 - Main socio-economic results for the EU small scale coastal fleets (excluding Greece) for 2013-2023 and nowcasts for 2024 and 2025

Table 21 - Main socio-economic results for the EU fleets less than 12 meters with active gear (L12AG) for 2013-2023 and nowcasts for 2024 and 2025

Table 22 - Main socio-economic results for the EU large-scale fleets for 2013-2023 and nowcasts for 2024 and 2025

Table 23 - Main socio-economic results for the EU distant water fleet for 2013-2023 and nowcasts for 2024 and 2025
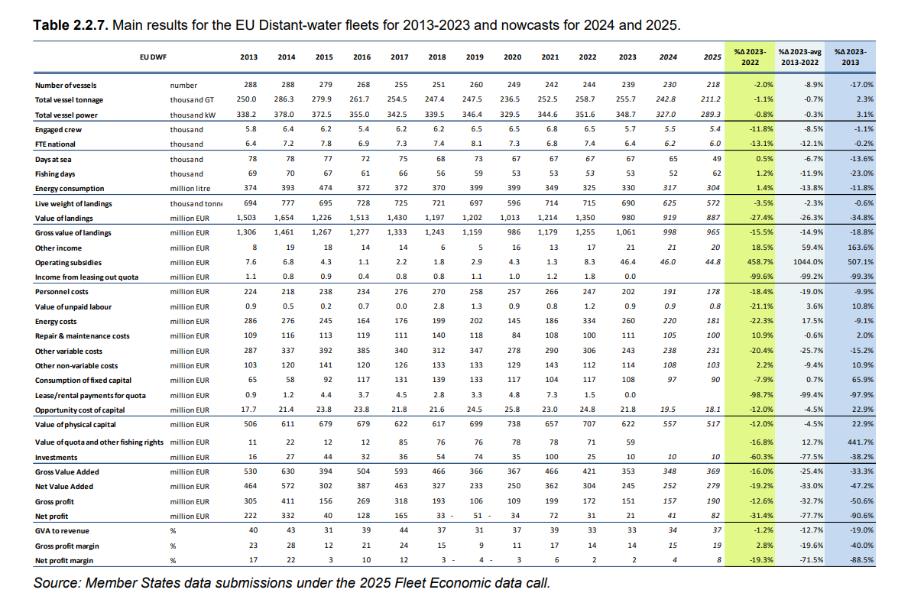
Table 24 – EU fleet: comparison of expected outcomes vs. actual situation (2017 and 2022)
Source: CFP Impact assessment 2011 and annual economic report on the EU fishing fleet
|
|
|
|
2012
|
2017
|
|
2022
|
|
|
|
Indicator
|
Unit (baseline)
|
Baseline
|
Expected
|
Observed
|
Expected
|
Observed
|
|
|
Net profit margin
|
%
|
5
|
15
|
12
|
18
|
2
|
|
|
Income
|
million EUR
|
6,900
|
+14%
|
+8.9
|
+24%
|
-1
|
|
|
GVA
|
million EUR
|
3,300
|
+58%
|
+29
|
+90%
|
-1.4
|
|
|
CR/BER
|
ratio
|
1.15
|
-
|
-
|
1.31
|
1.05
|
|
|
Return on Investment
|
%
|
3
|
15
|
13
|
18
|
5
|
Note: Observed changes in Income and Gross Value Added (GVA) are calculated using 2013 as the baseline year, rather than 2012. As a result, observed trends also reflect changes from a different starting point. Comparisons between projected and observed changes should therefore be interpreted with care, as differences may partly reflect baseline effect, and not solely differences in performance.
Table 25 - EU processing sector: main productivity performance indicators 2013 –2023
Source: Economic Report on the EU fish processing industry (STECF 23-14)

Table 26 - Item weights of EU household expenditure on total goods and services
Source: EUMOFA EU fish market report edition 2025
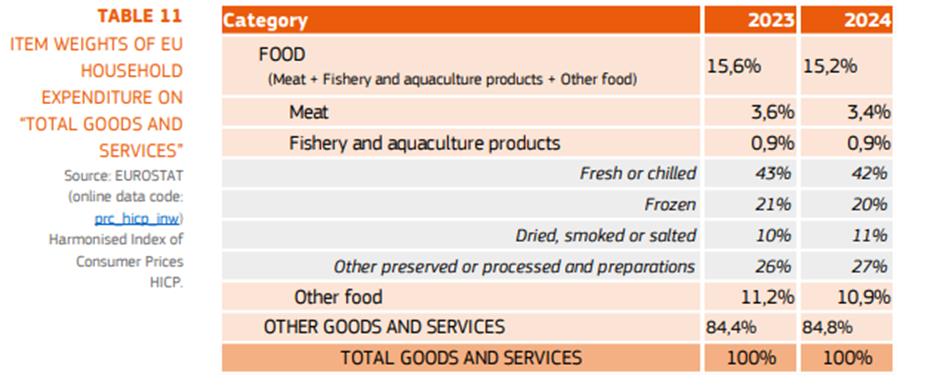
Figure 18 - Share of EU active fleet in losses, moderate profits and healthy profits period 2013-2022
Source: DCF data
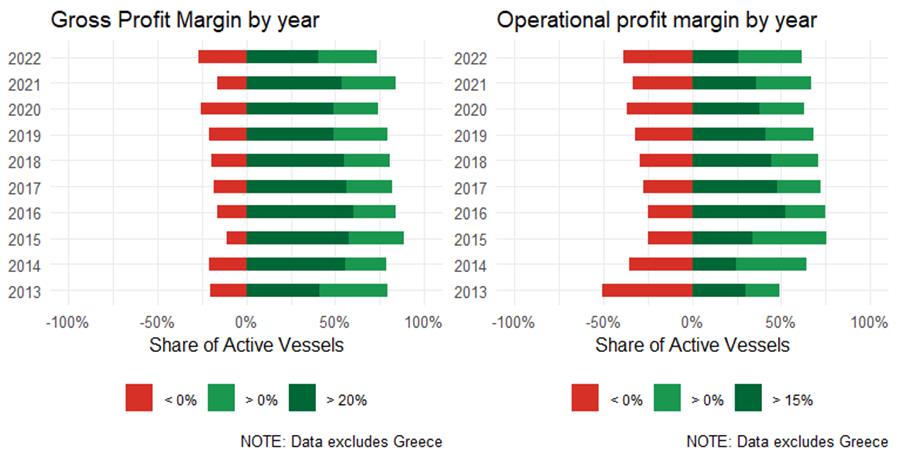
GVA fell from €530M in 2013 to €353M in 2023 and gross profit was nearly halved between 2013 and 2023, reaching €151M. Accordingly, net profit margins have shrunk from 17-22% in 2013-14 to just 2% in 2023.
Figure 19 - Total landings in the EU
Source: EUMOFA EU fish mart 2025 edition

Addendum n°1: analysis of price variability at first sales
Looking at price volatility at first sales, roughly 31% of Member States/species combinations are classed as “high” or “very high” volatility[1]reflecting large swings. Many wild pelagics and quota‐driven species (e.g. Atlantic mackerel, miscellaneous small pelagics, other marine fish) show extreme intra‐year swings. This matches known patterns: first‐sale auctions are “generally characterised by significant volatility” [2] due to uneven catches and spot pricing. To be noted that small pelagics also show extreme biological variability, rapidly fluctuating in abundance which may impact price variability.
About 42% of series are in the “low” or “very low” class. These are often staple or niche products with steady supply. For instance, sprat (Brisling) and certain flatfish (sole, European plaice) have many very low‐volatility series. Some crustaceans (e.g. Norway lobster) and bivalves (clams) also appear often in low‐volatility categories.
The first‐sale data show clear geographic patterns. Sweden and Denmark have the most “very high” series (193 and 123, respectively), often reflecting their pelagic and mixed fisheries. In contrast, Ireland, Croatia, and Portugal show the largest shares of “very low” volatility series. These country differences partly mirror the landings analysis (which found Spain/Netherlands very volatile, Denmark/Portugal very stable), but with shifts: for example, Sweden (leader in FS volatility) was not highlighted in the annual analysis. At the species level, our findings largely agree with the yearly analysis: wild pelagics (mackerel, horse mackerel, miscellaneous small pelagics, herring) and other marine species dominate the high-volatility class. Conversely, some high-volume species (sprat, common sole, certain shrimp) and seasonal products can be relatively stable. Notably, eel is highly volatile in both datasets, while Norway lobster and many molluscs tend to be steadier in FS data.
Because this dataset is monthly, it captures short-term price fluctuations linked to seasonality, auctions, and demand cycles. The median intra-year volatility (SD ≈ 0.24) corresponds to typical month-to-month price changes of around 25–30%. By contrast, the annual landings analysis captures longer-term structural shifts—such as quota changes or stock shocks—which can generate very large year-to-year price changes (SD ≫ 1 for some species). The two measures therefore reflect different time scales of price risk and are not directly comparable.
High monthly volatility may be due to the fact that less “important” species can go from very low price to none in a single month. Overall, however, the picture is consistent: both analyses find that quota‐driven, wild fisheries are volatile and low‐stock/season-driven, while steady, high-volume products (or those with strong supply chains) are much more price‐stable.
The first‐sale price data confirms that volatility is a defining feature of EU wild fisheries prices. Many country/species series exhibit very high intra‐year swings, especially quota‐driven pelagics and mixed groundfish, while high‐volume species or niche products are quite stable.
Footnotes:
[1] Volatility was measured as the standard deviation (SD) of year-on-year log price changes. We classify SD <0.10 as “Very low” volatility, 0.10–0.20 “Low”, 0.20–0.35 “Medium”, 0.35–0.60 “High”, and >0.60 “Very high”.
[2]
https://eur-lex.europa.eu/legal-content/EN/TXT/PDF/?uri=CELEX:52011SC0883#:~:text = First%20sale%20prices%20of%20fresh,therefore%20do%20not%20adapt%20their
Addendum n° 2: Transferable Fishing Concessions (TFCs)
TFCs entitle their holder to catch a certain share of fishing opportunities. This explicit entitlement allows operators to trade their fishing shares or licences: concretely, this means that less efficient operators can trade their “concessions” with efficient operators and exit the fishery without requiring public support.
The system presents both opportunities and challenges.
On the one hand, it may lead to a market-driven, autonomous adjustment of the fleet to fishing opportunities and therefore contribute to reducing excessive fishing capacity and fishing pressure. Operators are more likely to accept short-term losses knowing that they will benefit from longer term improvements in ecosystem health and stock status. Moreover, the value of their TFCs may increase even in the short term as they limit catches to allow stock recovery.
On the other hand, TFCs tend to concentrate fishing rights in the hands of fewer operators thus creating significant barriers to new entrants, who may have to pay a high price to acquire rights and enter the market. Safeguards are therefore commonly used to reserve part of the FO to specific vessel types or categories of fishers (e.g. new entrants) and/or to limit transfers of FO between regions within a country, between countries or between types of vessels. In addition, the status of fish stocks is also dependent on external factors that are not linked to fishing pressure (e.g. climate change and pollution/eutrophication of water) which fishers have little influence over. In some cases, the state of the stock may lead to closing fishing activities altogether (“zero catch” advice). These external factors may affect the market value of the TFCs.
It is to be noted that, in 2013, Member States chose to maintain their prerogative to organise the allocation of fishing opportunities rather than have it managed through market mechanisms, with the possibility to adopt TFCs on a voluntary basis.
3.2.3 Social data: employment, wages, accidents
Figure 20 - Trends on EU fishing fleet employment (in persons employed and FTE)
Source: STECF Annual Economic Report on the EU fishing fleet 25-07. Figure 8 (below) includes data from Greece, whereas Table 12 (also from STECF 25-07) does not. STECF choose to exclude Greek data the table summarising main socio-economic results (Table 12) due to incomplete data sets submitted.
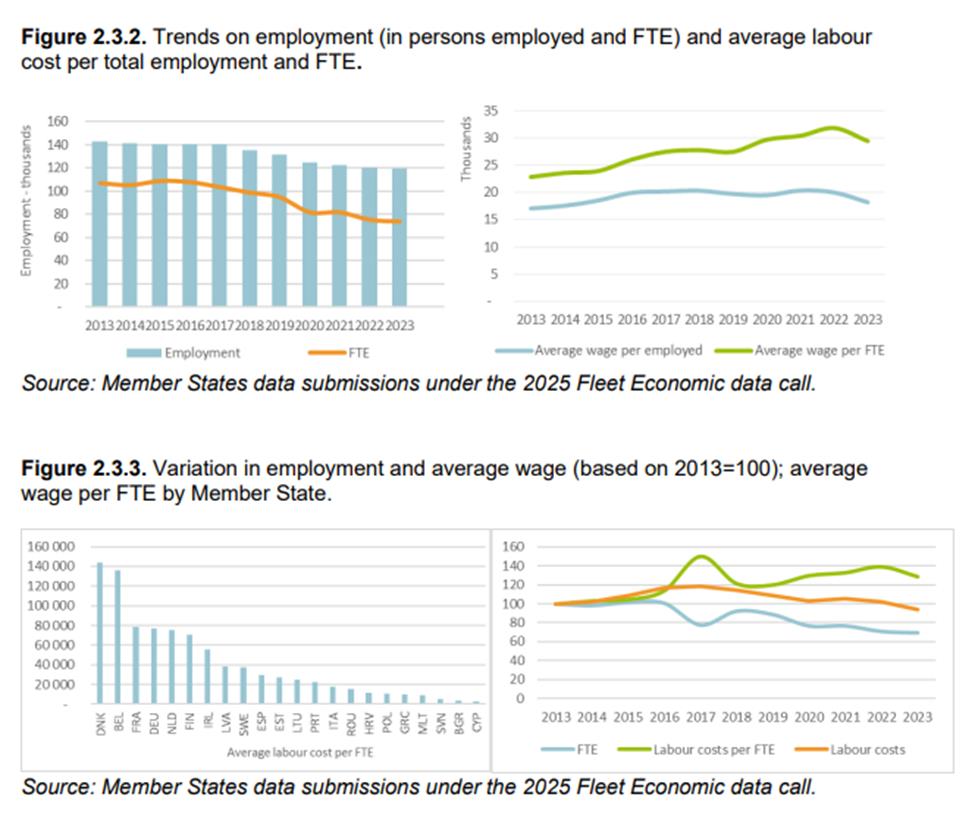
Figure 21 - Full time equivalent (FTE) in the small-scale coastal fleet by sea basin
Source: elaboration by contractors of supporting study based on STECF 25-07

Figure 22 - Full time equivalent (FTE) of the large-scale fleet by sea basin
Source: elaboration by contractors of supporting study based on STECF 25-07

Figure 23 - Ratio FTE to total employment in the fishing sector in EU member states (2016 vs 2022)
Source: elaboration by contractors of supporting study based on STECF 25-07
Table 27 - Total employment of the EU fishing fleet by age groups at EU level (2023) and change (2017-2023)
Source: STECF Annual Social Report on the EU fishing, aquaculture and processing sectors 25-13
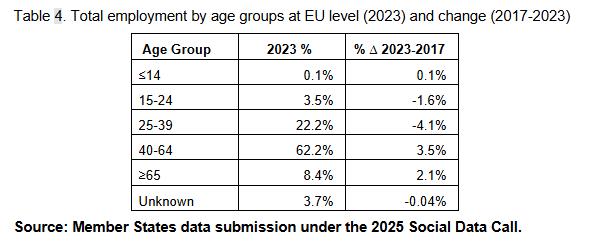
Figure 24 - Age composition of the EU fishing fleet of total employment by Member State, 2023 (%)
Source: STECF 25-13 (Annual Social Report on the EU fishing, aquaculture and processing)

Figure 25 - Total employment in the fish processing sector (2012-2021)
Source: elaboration by contractors of supporting study based on STECF 23-24 and STECF 21-14
Figure 26 - Total FTEs in the fish processing sector
Source: supporting study based on STECF 25-15
Figure 27 - Average ratio FTE to total employment in the fish processing sector in the EU
Source: supporting study based on STECF 25-15
Figure 28 - Ratio FTE to total employment in the processing sector per EU member states (2013 vs 2023)
Source: elaboration by contractors of supporting study based on STECF 25-15
Figure 29 - Employment and full-time employment (FTE) in aquaculture in the EU (excl. Luxembourg and UK)
Source: supporting study based on STECF Economic reports on aquaculture 2018-2024 (STECF 18-19, STECF 20-12, STECF 22-17, STECF 24-14)

Figure 30 - Employment (number of people) in aquaculture in EU Member States (2016 vs 2022)
Source: elaboration by contractors of supporting study based on STECF Economic reports on aquaculture 2018-2024 (STECF 18-19, STECF 20-12, STECF 22-17, STECF 24-14)

Figure 31 - Ratio FTE to total employment in aquaculture in EU 2016 to 2022
Source: supporting study based on STECF Economic reports on aquaculture 2018-2024 (STECF 18-19, STECF 20-12, STECF 22-17, STECF 24-14)

Figure 32 - Average labour cost per total employment and FTE in the fishing sector
Source: STECF 25-07 (Annual Economic Report on the EU fishing fleet). Labour cost is used as a proxy for wage by STECF.
Figure 33 - Average labour cost per FTE by Member State
Source: STECF 25-07 (Annual Economic Report on the EU fishing fleet). Labour cost is used as a proxy for wage by STECF.
Figure 34 - Ratio of wage (average wage/national average wage) per segment, aggregated at the EU level
Source: supporting study based on STECF 25-07

Figure 35 - Ratio of Member State fishing fleet segment average wage to national average wage
Source: elaboration by contractors of supporting study based on STECF 25-07

Figure 36 - EU fish processing industry sector overview 2013-2023, including average wage
Source: Economic Report on the EU fish processing industry (STECF 25-15)

Figure 37 - Ratio of Member State average wage within the fish processing sector to national average wage
Source: elaboration by contractors of supporting study based on STECF 25-15

Figure 38 - Average wage of aquaculture workers excluding the value and numbers of unpaid labour 2012-2022
Source of data: elaboration by contractors of supporting study based on STECF 24-14

Figure 39 - Ratio of the Average wage of aquaculture workers to the national average wage by Member State (2012-2022)
Source of data: elaboration by contractors of supporting study based on STECF 24-14

Figure 40 - Number of fatal accidents by EU regional basin (2014-2022)
Source of data: supporting study based on Eurostat data
Figure 41 - Number of non-fatal accidents at work within the EU fisheries and aquaculture sector by region (2014-2022)
Source of data: supporting study based on Eurostat data

Figure 42 - Accidents at sea involving the EU fishing fleet, by severity
Source: STECF Report 25-13 based on EMSA database of Marine Casualties and Incidents

Addendum n°3: analysis of preferential quota allocation and preferential access to 12 nautical mile zone for small-scale fisheries
Source: supporting study of the evaluation
The use of allocation criteria that favour small-scale coastal fishers in the attribution of fishing opportunities remains a national prerogative, which is based on Article 17 of the CFP Regulation. More than 50% of coastal Member States (14 out of 22) have some form of measure encouraging SSCF fishing, including dedicated quotas (the most prevalent), weighting factors that reward low-impact gears, and specific access arrangements. However, it is not always clear when these measures were introduced therefore any conclusion on the evolution of such measures over time should be considered with caution.
Evidence indicates that the CFP objective of providing preferential spatial access to small-scale coastal fisheries within the 0–12 nautical mile zone has not been implemented in practice. A review of Member State responses to the Article 17 questionnaire, synthesised by STECF, and supplemented by the underlying Member State submissions provided by DG MARE for this evaluation, found no cases where parts of the 12-nm zone are formally reserved or prioritised for SSCF. This finding is supported by a recent global inventory of preferential access areas for small-scale fisheries, which identified no substantive EU examples of SSCF-only spatial reservation (DeLand et al., 2025). The sole EU case flagged (Latvia) was confirmed to be a gear-based restriction in shallow waters, rather than a spatial access regime granting preferential rights to SSCF.
3.2.4 Funding
Figure 43 - EMFAF financial allocation by priority and specific objective
Source: EMFAF mid-term evaluation based on Infosys data
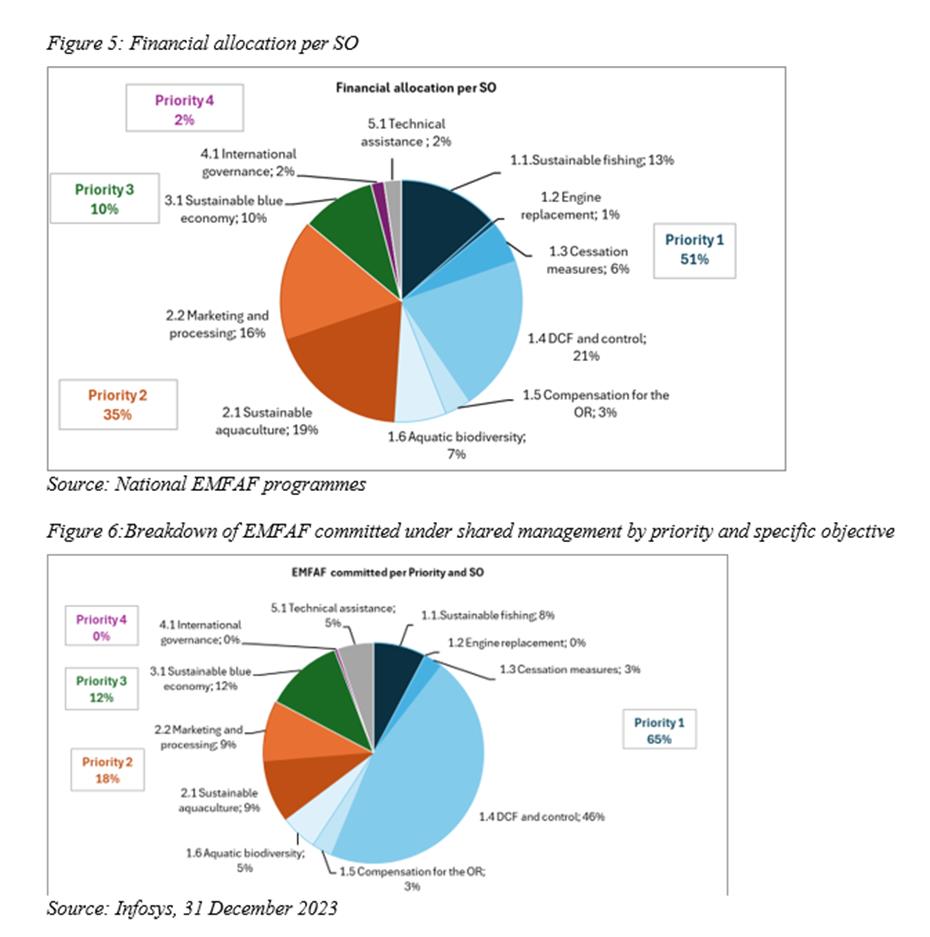
Figure 44 - EMFAF commitments by priority and specific objective
Source: EMFAF mid-term evaluation based on Infosys data
Table 28 - Proportion of Member States national budget covered by funds from EMFF/EMFAF for the different years (total for Bulgaria, Cyprus, Greece, Finland, Ireland, Lithuania, Netherlands, Spain, Denmark)
Source: MS survey for the purposes of the evaluation answered by 9 countries

Table 29 - Horizon2020 work programme 2025 allocations per cluster (for 2021-2027)
Source: internal DG MARE analysis, clusters directly relevant to the CFP Regulation are mostly cluster 5, 6 and Mission restore our ocean and waters by 2030
|
Cluster / other parts of the work programme
|
Budget M EUR
|
Number of topics relevant for DG MARE
|
|
3 Civil security for society
|
10
|
1
|
|
4 Digital, industry and space
|
12.1
|
3
|
|
5 Climate, energy, mobility
|
127
|
11
|
|
6 Food, bioeconomy, natural resources, agriculture and environment
|
127.5
|
11
|
|
Mission restore our ocean and waters by 2030
|
126.49
|
8 + 5 actions
|
|
Mission adaptation to climate change
|
30
|
1
|
|
Total
|
433.09
|
35 topics + 5 actions
|
3.3 Governance
3.3.1 Evolution of management systems for the catch sector
Figure 45 - Number of assessed stocks by management system (all regions) 2014-2023
Source: To assess the distribution of assessed stocks by type of management system, stock-level data were used assigning each stock–year combination one of four management system categories: EU-only, shared, RFMO or SFPA, based on the governance arrangements applicable to the stock in the given year. In this context, shared stocks refer to stocks jointly managed by the EU and one or more third countries through bilateral or multilateral arrangements (e.g. EU–UK, EU–Norway), where the CFP continues to apply within EU waters. While some stocks may be subject to both EU measures and RFMO frameworks, for the purposes of this indicator each stock is classified according to its primary management arrangement.

|
Figure 46 - Landings in volume by management system for all EU vessels, 2014-2024
Source: supporting study based on FDI dataset
|
Figure 47 - Landings in volume by management system for small-scale EU fishing vessels only 2014-2024
Source: supporting study based on FDI dataset

|
Figure 48 - Landings in value by management system 2014-2024
Source: To assess the volume of landings per type of management system, the STECF FDI dataset was used. It should be noted the STECF FDI dataset does not report landings at stock level, preventing a direct analysis of volume changes per stock. Results therefore reflect aggregated management-system and basin-level dynamics. Each record was assigned to an EU region (BS, Black Sea, NS, NWW, SWW, and Med) and Non-EU based on the spatial attribution of the landings. Landings were further grouped according to the applicable management system (EU-only stocks, shared stocks, RFMO-managed stocks, and SFPAs). Landings were disaggregated by fleet segment, distinguishing between small-scale vessels (≤12 m) and large vessels (>12 m).
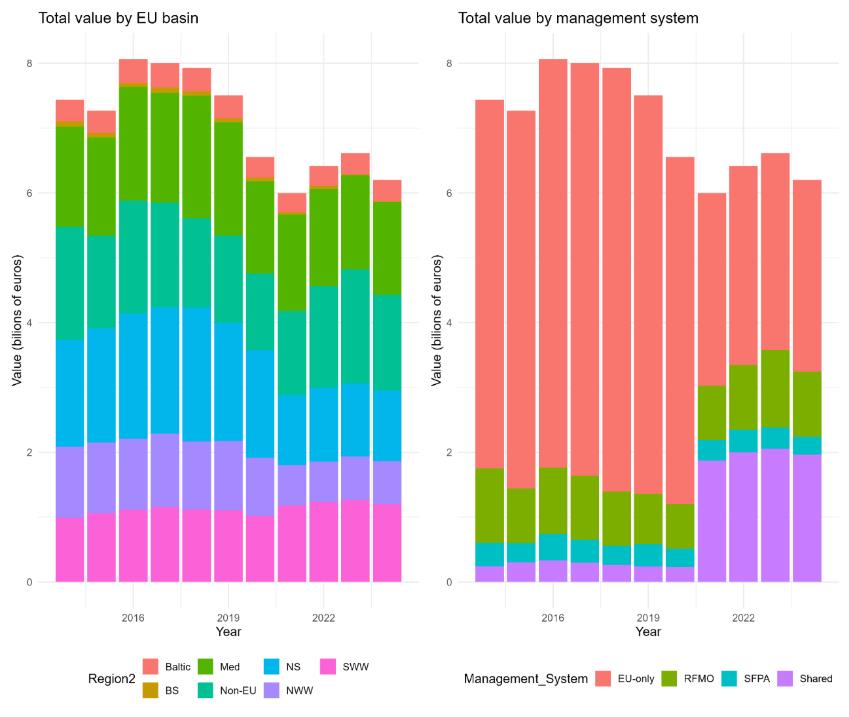
3.3.2 Data collection
Figure 49 - Number of conclusive stock assessments among ICES and selected RFMOs
To evaluate the number of conclusive stock assessments for target stocks, stock-level information was compiled and analysed for the period 2014–2025. FOR ICES-assessed stocks, “conclusive” entails the ICES stocks category for which MSY based advice can be provided. Specifically, the ICES Stock Information Database (SID) and associated stock assessment graphs were reviewed in detail for this purpose. Consistent with this approach, the GFCM advisory framework classifies validated (i.e. conclusive) assessments as either quantitative or qualitative. While qualitative assessments are considered adequate to inform stock status relative to reference points, estimates of fishing mortality and biomass are not considered sufficiently reliable for quantitative advice. For GFCM stocks, assessment reports from the Working Groups on Stock Assessment of Demersal Species (WGSAD), Small Pelagic Species (WGSASP), and Black Sea (WGBS) were reviewed, with particular emphasis on the Tables of Advice and, where necessary, the associated summary sheets. Reports from the EU STECF for Mediterranean stocks were also examined. In addition, assessment reports from ICCAT, covering stocks in the Atlantic and Mediterranean, as well as reports from the NAFO and NASCO RFMOs, were reviewed, with more detailed examination of the underlying assessments undertaken where required.
Thus, for the purposes of the report, three categories of stock assessments were identified a) conclusive, b) conclusive on qualitative basis and c) non conclusive i.e. cases that no advice is provided. Assessments of all Scientific Bodies in the past do not distinguish clearly between Fmsy and Fpa, Bmsy and Bpa, that requires manual extraction from meeting reports and working group outputs.
Source: supporting study based on Stock assessment reports from the ICES Stock Information Database, EU STECF (Mediterranean), ICCAT, NAFO, NASCO, and GFCM (Mediterranean and Black Sea)
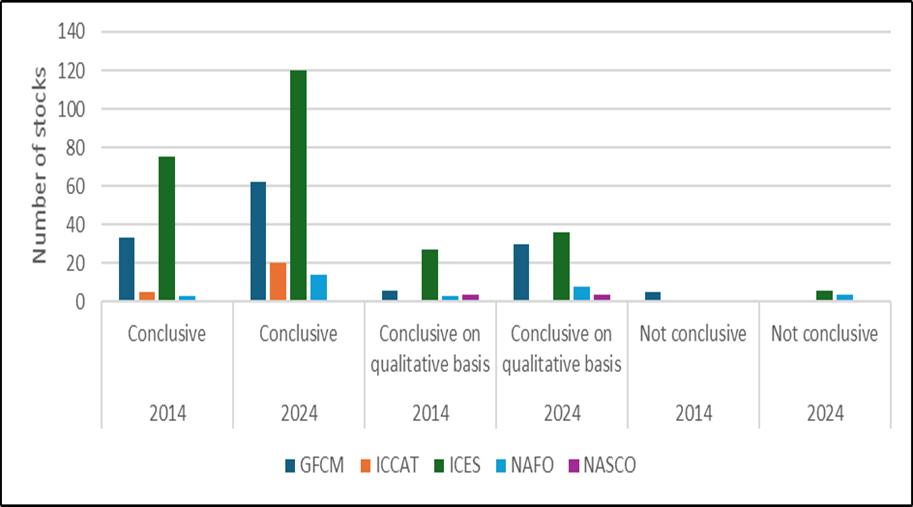
Figure 50 - Percentage of increase in conclusive stock assessments (including those accepted as qualitative) among ICES and selected RFMOs between 2014 and 2024
Source: supporting study based on Stock assessment reports from the ICES Stock Information Database, EU STECF (Mediterranean), ICCAT, NAFO, NASCO, and GFCM (Mediterranean and Black Sea)

Figure 51 - Number of stocks with harvest control rules (HCR) from MSE adopted by year per RFMO
This indicator assesses the extent to which science-based decision-making frameworks are applied in Regional Fisheries Management Organisations (RFMOs), using the adoption of Management Strategy Evaluation (MSE)–related instruments as an operational proxy.
Source: supporting study based on HarvestStrategies.org database.
NB: There is an absence of clear MSE indicators in GFCM databases. References are missing for ICES.

Figure 52 - Number of stocks with management procedures (MPs) from MSE adopted by year

Figure 53 - Number of stocks with management procedures (MPs) from MSE adopted by year

Figure 54 - Potential MSE-based advice (management procedure ‘MP’ listed under ICES advice category for all ICES stocks
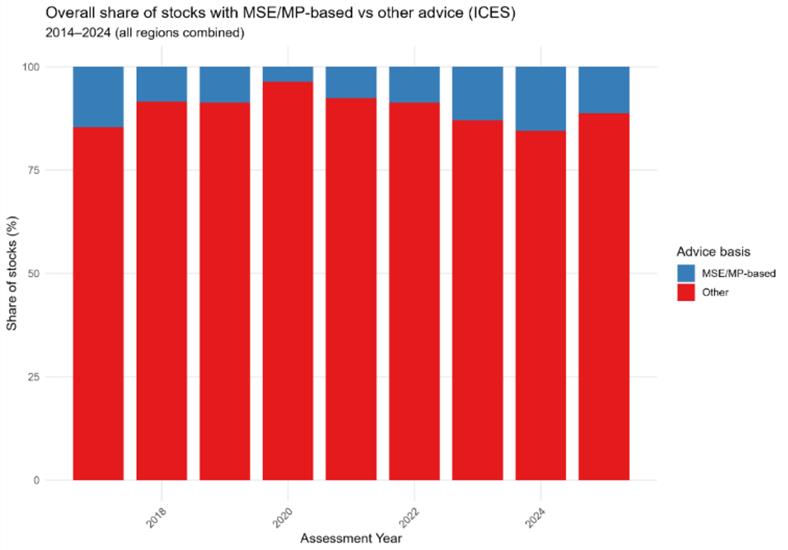
Figure 55 - Potential MSE-based advice (management procedure ‘MP’ listed under ICES advice category for ICES stocks amongst EU basins and outermost regions (‘Non-EU’)

Table 30 - Number of agreements related to concrete data collection activities which are coordinated among different Member States in the same region
Number of bilateral and multilateral agreements by region and Regional Coordination Group (LDF: long distance fisheries; LP: large pelagics; Med & BS: Mediterranean and Black Sea; NANSEA: North Atlantic, North Sea and Eastern Arctic).
Source: Annual Reports available here:
Annual Reports - Data Collection Framework - DCF - European Commission
|
Number of bilateral and multilateral agreements
|
|
|
|
2014
|
2015
|
2016
|
2017
|
2018
|
2019
|
2020
|
2021
|
2022
|
2023
|
2024
|
|
Baltic
|
|
10
|
10
|
11
|
9
|
10
|
11
|
10
|
9
|
11
|
11
|
11
|
|
LDF
|
|
2
|
3
|
3
|
3
|
3
|
3
|
3
|
3
|
2
|
2
|
2
|
|
LP
|
|
3
|
4
|
4
|
3
|
3
|
3
|
2
|
1
|
0
|
0
|
0
|
|
Med&BS
|
|
1
|
4
|
4
|
5
|
5
|
5
|
5
|
5
|
5
|
5
|
5
|
|
NANSEA
|
|
17
|
18
|
18
|
17
|
16
|
16
|
15
|
13
|
6
|
6
|
7
|
|
Total
|
|
33
|
39
|
40
|
37
|
37
|
38
|
35
|
31
|
24
|
24
|
25
|
Addendum n°4: Regional Coordination Groups
Regional Coordination Meetings (RCMs) evolved into Regional Coordination Groups (RCGs) in 2017. RCMs used to meet once a year. RCGs have meetings throughout the year, work intersessionally, have expanded their tasks and can propose Regional sampling plans and Regional work plans. The geographical scope of RCGs has also experienced changes over time, depicted by the greyed areas in the Table. In 2019, RCG North Sea and Eastern Arctic (NSEA) and RCG North Atlantic (NA) were merged into RCG NANSEA; and the RCG Large Pelagics was under RCG Mediterranean and Black Sea in 2014 and 2015. RCG ECON is EU wide and was created in 2020 as a follow-up to a permanent group on economic issues (PGECON, an EC expert subgroup); RCG Large Pelagics and RCG Long Distance Fisheries span several regions. All recommendations, agreements and decisions generated by the RCGs in the reference time period were counted. Agreements and decisions were grouped in the same category, whereas recommendations were counted separately. This list does not include the bilateral and multilateral agreements, which are treated separately in Table 20.
Table 31 - Qualitative indicators showing the evolution of the decision-making process in the Regional Coordination Groups (RCGs)
In the transition from Regional Coordination Meetings to Regional Coordination Groups (RCGs) between 2014 and 2017, COM launched a series of grants to facilitate this evolution and further support RCGs, following their establishment. Part of these projects aimed to develop a Secretariat for the RCGs, which has played an important role in harmonizing the decision-making process, the communication of recommendations, and the structure of meetings and reports. In this process, the Decision Meeting has become a fundamental tool in the decision-making and communication process between RCGs and National Correspondents.
Source: supporting study based on the following: EU completed projects aimed to strengthen regional cooperation (
https://www.fisheries-rcg.eu/projects/
); RCG reports (
https://dcf.ec.europa.eu/regional-coordination/rcg-reports_en
); Decision meeting report (
https://www.fisheries-rcg.eu/rcg-nansea/
).
|
Qualitative indicators
|
|
|
|
|
|
|
|
|
|
|
|
|
|
|
|
2014
|
2015
|
2016
|
2017
|
2018
|
2019
|
2020
|
2021
|
2022
|
2023
|
2024
|
|
Finished projects on strengthening regional cooperation
|
|
|
|
|
|
|
|
|
|
|
|
|
FishPi
|
|
|
x
|
x
|
|
|
|
|
|
|
|
|
|
MARE/2014/19 Med&BS
|
|
|
x
|
x
|
|
|
|
|
|
|
|
|
|
FishPi2
|
|
|
|
|
|
x
|
x
|
|
|
|
|
|
|
Stream
|
|
|
|
|
|
x
|
x
|
|
|
|
|
|
|
Recolape
|
|
|
|
|
|
x
|
x
|
|
|
|
|
|
|
Secfish
|
|
|
|
|
|
x
|
x
|
|
|
|
|
|
|
Fish N'Co
|
|
|
|
|
|
|
|
|
x
|
x
|
|
|
|
Streamline
|
|
|
|
|
|
|
|
|
x
|
x
|
|
|
|
Med&BS RDBFIS
|
|
|
|
|
|
|
|
|
x
|
x
|
|
|
|
SECWEB
|
|
|
|
|
|
|
|
|
x
|
x
|
|
|
|
Other indicators
|
|
|
|
|
|
|
|
|
|
|
|
|
|
Visual identity/ format report
|
|
|
|
|
|
|
|
|
x
|
x
|
x
|
x
|
|
Establishment of the Secretariat
|
|
|
|
|
|
|
|
|
|
|
x
|
x
|
|
Decision meeting (RCG NANSEA & RCG Baltic)
|
|
|
|
|
|
|
x
|
x
|
x
|
|
|
|
Decision meeting (all RCGs)
|
|
|
|
|
|
|
|
|
|
|
x
|
x
|
Table 32 - Draft and final Regional Work Plans presented by year and Regional Coordination Group
The first draft Regional Work Plans (RWPs) presented for all RCG correspond to the time period 2020-2022 (NANSEA: North Atlantic, North Sea and Eastern Arctic; LDF: long distance fisheries; LP: large pelagics; Med & BS: Mediterranean and Black Sea; ECON: economics). Based on EU project FishN’Co, a draft non-binding Regional Work Plan was submitted to the Commission in October 2020, by RCG NANSEA, RCG Baltic, RCG LP and RCG ECON. Based on EU project STREAMLINE, a draft non-binding Regional Work Plan was submitted to the Commission by the RCG Med&BS in October 2022. The first Regional Work Plans for all RCGs were submitted in 2024 and correspond to the time period 2025-2027. This table is duplicated in the SWD as Table 5.
|
|
RCG
|
Year presented
|
|
Regional Work Plan 2025-2027
|
NANSEA
|
2024
|
|
Regional Work Plan 2025-2027
|
Baltic
|
2024
|
|
Regional Work Plan 2025-2027
|
LDF
|
2024
|
|
Regional Work Plan 2025-2027
|
LP
|
2024
|
|
Regional Work Plan 2025-2027
|
Med & BS
|
2024
|
|
Regional Work Plan 2025-2027
|
ECON
|
2024
|
|
Draft Regional Work Plan 2021 (FishN’Co)
|
NANSEA
|
2020
|
|
Draft Regional Work Plan 2021 (FishN’Co)
|
Baltic
|
2020
|
|
Draft Regional Work Plan 2021 (FishN’Co)
|
LP
|
2020
|
|
Draft Regional Work Plan 2021 (FishN’Co)
|
ECON
|
2020
|
|
Draft Regional Work Plan 2023 (STREAMLINE)
|
Med&BS
|
2022
|
Table 33 - Total number of surveys performed, indicating if they are mandatory (Y/N), coordinated internationally (Y/N) and not coordinated (N/N) by Regional Coordination Group and year
Number of research surveys at sea per category during the reporting period, as reported by Member States under the DCF.
Supporting study based on the following: mandatory research surveys at sea are defined in past and current DCF legislation (EU 2016/1251, EU 2019/909, EU 2021/1168)which can be found in this
link
. All mandatory surveys were considered to be internationally coordinated. The total number of surveys was calculated by listing the surveys (mandatory and non-mandatory) planned and executed by Member States, as described in the DCF Annual Reports which can be found in this
link
. Non-mandatory surveys were classified as internationally coordinated using the criteria defined in STECF-SGRN 10-03 and STECF 19-05 (i.e. the survey complies with an international co-ordination group, is bilaterally coordinated or in direct cooperation with relevant RFMO and the survey uses a harmonized protocol). When interpreting the data, it is important to note that: (i) in 2017, Member States started reporting non-mandatory, non-coordinated surveys; (ii) in 2020, the total number of surveys for the North Atlantic decreased due to the Brexit.
|
Region
|
Mandatory
|
Internationally coordinated
|
2014
|
2015
|
2016
|
2017
|
2018
|
2019
|
2020
|
2021
|
2022
|
2023
|
2024
|
|
Baltic
|
Y
|
Y
|
5
|
5
|
5
|
5
|
5
|
5
|
5
|
5
|
7
|
7
|
7
|
|
Baltic
|
N
|
Y
|
2
|
2
|
2
|
1
|
3
|
3
|
2
|
3
|
3
|
3
|
3
|
|
Baltic
|
N
|
N
|
|
|
1
|
7
|
7
|
8
|
8
|
8
|
9
|
10
|
10
|
|
Large Pelagics
|
Y
|
Y
|
0
|
0
|
0
|
0
|
0
|
0
|
0
|
0
|
1
|
1
|
1
|
|
Large Pelagics
|
N
|
Y
|
|
|
1
|
1
|
1
|
2
|
2
|
1
|
2
|
2
|
2
|
|
Large Pelagics
|
N
|
N
|
|
|
|
|
|
|
|
|
|
|
|
|
Mediterraneanand Black Sea
|
Y
|
Y
|
4
|
4
|
4
|
4
|
4
|
4
|
4
|
4
|
5
|
5
|
5
|
|
Mediterranean and Black Sea
|
N
|
Y
|
|
|
|
1
|
3
|
3
|
3
|
3
|
2
|
2
|
|
|
Mediterranean and Black Sea
|
N
|
N
|
|
|
|
1
|
1
|
1
|
1
|
1
|
2
|
3
|
|
|
North East Atlantic
|
Y
|
Y
|
19
|
19
|
19
|
19
|
19
|
19
|
19
|
19
|
22
|
22
|
22
|
|
North East Atlantic
|
N
|
Y
|
3
|
8
|
9
|
16
|
16
|
17
|
7
|
8
|
2
|
7
|
4
|
|
North East Atlantic
|
N
|
N
|
1
|
1
|
1
|
10
|
10
|
10
|
1
|
5
|
4
|
7
|
7
|
|
North Sea and Eastern Arctic
|
Y
|
Y
|
15
|
15
|
15
|
15
|
15
|
15
|
15
|
15
|
16
|
16
|
16
|
|
North Sea and Eastern Arctic
|
N
|
Y
|
|
|
|
|
|
|
|
|
|
|
|
|
North Sea and Eastern Arctic
|
N
|
N
|
|
|
|
7
|
6
|
6
|
7
|
7
|
4
|
4
|
4
|
|
Total
|
|
|
49
|
54
|
57
|
87
|
90
|
93
|
74
|
79
|
79
|
89
|
81
|
Table 34 - Number of data calls and reporting obligations issued by end user
Source: supporting study based on the following:
For ICES:
https://ices-library.figshare.com/pubtype_datacalls-dataoutputs/category
; https://dcf.ec.europa.eu/data-calls_en https://ices-library.figshare.com/pubtype_datacalls-dataoutputs/category)
For DG MARE/ STECF: In general, 4 data calls are issued annually (AER, FDI, MEDBS, SOCIAL) and 2 alternate every two years (FISHPROIND, Aquaculture), although some years the dates may vary. Information on issued data calls is in the DCF website (
https://dcf.ec.europa.eu/data-calls_en
and
https://stecf.ec.europa.eu/reports/economic-and-social-analyses_en
).
For GFCM: (
https://www.fao.org/gfcm/data/calendar/en/
). However, the list of data calls from 2017 to 2024 were provided via email communication. All GFCM data calls were considered for this indicator, including those on the Data Collection Reference Framework (DCRF), and also the non-DCRF ones.
For IOTC: the basis for IOTC requirements is resolutions 15/01 and 15/02. In addition to these requirements, some resolutions have been approved during the time period analysed (
https://data.iotc.org/reference/latest/guidelines/
), setting additional reporting requirements, such as resolutions 19/02, 23/01 and 24/02 defining additional reporting obligations on FADs; and Res. 17/05, 18/02, 18/05, 19/03, 23/07, defining obligations on the reporting of species-specific catches and mitigation measures. The mentioned resolutions have been used to build the indicator.
For ICCAT: ICCAT centralizes the data request in a single annual statistics circular which is issued annually in early February, fixing 15 July as deadline for data submission. Although the dates are fixed and have not changed over time, new data have been incorporated to the request during the time period analysed. For the indicator, the categories of data listed in the data call (2025 is used as reference) were used, and the corresponding ICCAT recommendations to set the date when each data started to be collected.
For NAFO: the NAFO Core statistical data calls on catch and effort (STATLANT 21) are issued every year. In addition, there are also annual data requests for biological sampling, research surveys and tagging data sets. In principle, these data calls have remained constant over the years.
The rest of RFMOs are not included (CECAF, SIOFA, SEAFO, CCAMLR, WCPFC and SFRMO).
This table is duplicated in the SWD as Table 6.
|
Year
|
DG MARE/ STECF
|
ICES
|
GFCM
|
ICCAT
|
IOTC
|
NAFO
|
|
2014
|
5
|
2
|
|
7
|
|
5
|
|
2015
|
3
|
7
|
|
7
|
2
|
5
|
|
2016
|
4
|
9
|
|
7
|
2
|
5
|
|
2017
|
4
|
10
|
39
|
7
|
3
|
5
|
|
2018
|
4
|
14
|
44
|
7
|
5
|
5
|
|
2019
|
5
|
13
|
57
|
7
|
7
|
5
|
|
2020
|
5
|
12
|
70
|
7
|
7
|
5
|
|
2021
|
5
|
16
|
79
|
7
|
7
|
5
|
|
2022
|
5
|
15
|
91
|
9
|
7
|
5
|
|
2023
|
5
|
17
|
119
|
9
|
11
|
5
|
|
2024
|
5
|
13
|
140
|
10
|
12
|
5
|
Table 35 - Number of meetings using DCF data by STECF, ICES and Regional Management Fisheries Organisations
Source: supporting study based on the following:
ICES: Data calls issued by ICES in the period 2015 - 2024 are available in the web
https://ices-library.figshare.com/search?groups=37113
. The list was reviewed to identify the WG asking for the data each year. When the data call had not an EWG behind, it was not considered for the analysis.
STECF/DG MARE: The list of DG MARE data calls can be found in the link
Data Calls - Data Collection Framework - DCF - European Commission
(AER, FDI, MEDBS, FISGPROIND, SOCIAL, AQUACULTURE). For the analysis, relevant meetings associated with each data call were included.
GFCM: The list of meetings for the period 2014 – 2024 is available in the web
https://www.fao.org/gfcm/technical-meetings/es/
. Each meeting is classified depending on the subsidiary body to whom it belongs. Meetings assigned to the Scientific Advisory Committee on Fisheries (SAC), the Sub-Committee for Stock Assessment (SCSA), and the Working Group on the Black Sea (WGBS) where considered for the indicator, as they are the ones responsible for providing advice on established priorities for Mediterranean and Black Sea fisheries. In the information provided by GFCM, year 2020 is empty due to COVID (no scientific work took place).
IOTC: The list of meetings for the period 2014-2024 is available in the web
https://iotc.org/meetings
. The meetings dedicated to stock assessment and scientific advice were selected to be used for the estimate.
ICCAT: The list of meetings for the period 2014-2024 is available in the web
https://www.iccat.int/es/Meetings.asp
. The meetings assigned to the Standing Committee Research and Statistics (SCRS) are considered to calculate the indicator. The SCRS is responsible for developing and recommending to the Commission all policy and procedures for the collection, compilation, analysis and dissemination of fishery statistics.
NAFO: The list of meetings for the period 2014-2024 is available in the web
https://www.nafo.int/Meetings/Past-Meetings
. The meetings corresponding to the Scientific Council were selected to be used for the analysis. Selected meetings were checked with the meetings reported by countries in the AR. To ensure that there were EU participation
Information on CECAF, SFRMO , SIOFA , SEAFO , CCAMLR , WCPFC may not be complete
|
Year
|
ICES
|
GFCM
|
ICCAT
|
IOTC
|
DG MARE/ STECF
|
NAFO
|
CECAF
|
SIOFA
|
SEAFO
|
CCAMLR
|
WCPFC
|
SPRFO
|
|
2014
|
|
20
|
11
|
8
|
22
|
3
|
NA
|
NA
|
NA
|
NA
|
NA
|
NA
|
|
2015
|
16
|
11
|
9
|
7
|
23
|
3
|
NA
|
NA
|
NA
|
NA
|
NA
|
NA
|
|
2016
|
15
|
11
|
12
|
7
|
20
|
3
|
NA
|
NA
|
NA
|
NA
|
NA
|
NA
|
|
2017
|
17
|
13
|
14
|
7
|
24
|
3
|
NA
|
NA
|
NA
|
NA
|
NA
|
NA
|
|
2018
|
18
|
16
|
12
|
7
|
23
|
4
|
NA
|
NA
|
NA
|
NA
|
NA
|
NA
|
|
2019
|
23
|
13
|
15
|
8
|
22
|
5
|
NA
|
NA
|
NA
|
NA
|
NA
|
NA
|
|
2020
|
23
|
NA
|
17
|
7
|
19
|
5
|
4
|
0
|
0
|
2
|
4
|
1
|
|
2021
|
28
|
13
|
17
|
9
|
21
|
5
|
5
|
0
|
0
|
2
|
4
|
1
|
|
2022
|
25
|
28
|
18
|
10
|
24
|
5
|
4
|
1
|
1
|
5
|
2
|
2
|
|
2023
|
31
|
33
|
14
|
9
|
24
|
4
|
6
|
3
|
1
|
4
|
1
|
2
|
|
2024
|
26
|
33
|
15
|
10
|
24
|
4
|
NA
|
NA
|
NA
|
NA
|
NA
|
NA
|
Table 36 - Number of data requests for DCF data made to the Commission
The number of data requests for scientific purposes sent to DG MARE, asking for access to DCF data collected by Member States, is listed for the reporting period. Most requests were made in the last four years, which coincided with the launching of the data request template. This template gave more visibility to DCF data. In the majority of the cases, Member states consented to the sharing of data and/or sent data requested to the data requesters, showing that the dissemination of DCF data has increased with time for different uses and not only for fisheries management purposes, serving the principle 'collect once, use many times'.
Source: supporting study based on Commission’s records.

Table 37 - Percentage of stocks with known biomass references points by regional basin (2014-2024)
N.B. 2024 contains only partial information.
Source: supporting study based on ICES databases, on the STAR database (before 2018 through individual reports of the Scientific Advisory Committee on Fisheries (SAC)), data on stock assessment of selected RFMOs. (N.B.: data on RFMOs are only partial and indicative).

Table 38 - Percentage of stocks with known fishing mortality references points by regional basin (2014-2024)
N.B. 2024 contains only partial information.
Source: supporting study based on ICES databases, on the STAR database (before 2018 through individual reports of the Scientific Advisory Committee on Fisheries (SAC)), data on stock assessment of selected RFMOs. (N.B.: data on RFMOs are only partial and indicative).
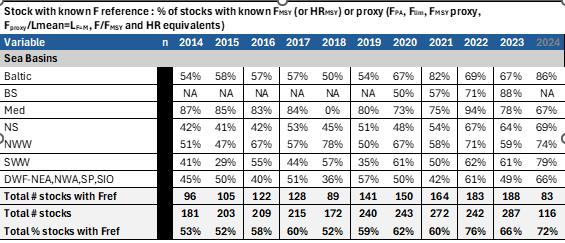
Table 39 - Percentage of catches with known biomass references points by regional basin (2014-2024)
The number of stocks with known status against Bmsy or reference point reference point and the number of stocks with known status against Fmsy or reference point reference point was assessed counting the number of stocks with such status know based on data available from advice requesters and institutions performing stock assessments (i.e. ICES, GFCM, STECF and several RFMO’s for distant waters fisheries). The data bases of each of these institutions were consulted to collect yearly data on stock assessment for all requested stocks (under the stock list). Assessment reports and databases were considered to only provide information on the reference years. In both cases, stock was considered to have a known status for F, when Fmsy, Fpa, Flim, Fmsy proxy = Lmean=LF=M and/or F/Fmsy or corresponding equivalents Harvest Rates reference points and to have known status for B, when Bmsy, Bpa, Blim, MSYBtrigger and/or B/Bmsy reference points are presented for the stock assessment in each specific reference year. N.B. 2024 contains only partial information
ICES: Data on status of the stock against reference points was collected from the ICES databases, which are of public access and easily accessible through R (ICES SAG and ICES ASD)
STECF/ FAO-GFCM/: Data on stock assessment available on the STAR database does not go back further than 2018. Data on stock assessments for the affected regions (i.e. Mediterranean and Black Sea) before 2018 was therefore collected on a manual basis by consulting individual reports of the Scientific Advisory Committee on Fisheries (SAC).
Source: supporting study based on ICES databases, on the STAR database (before 2018 through individual reports of the Scientific Advisory Committee on Fisheries (SAC)), data on stock assessment of selected RFMOs. (N.B.: data on RFMOs are only partial and indicative).

Table 40 - Percentage of catches with known fishing mortality references points by regional basin (2014-2024)
N.B. 2024 contains only partial information.
Source: supporting study based on ICES databases, on the STAR database (before 2018 through individual reports of the Scientific Advisory Committee on Fisheries (SAC)), data on stock assessment of selected RFMOs. (N.B.: data on RFMOs are only partial and indicative).
|
Catches with known F reference : % of catches with known FMSY (or HRMSY) or proxy (FPA, Flim, FMSY proxy, Fproxy/Lmean=LF=M, F/FMSY and HR equivalents)
|
|
Variable
|
n
|
2014
|
2015
|
2016
|
2017
|
2018
|
2019
|
2020
|
2021
|
2022
|
2023
|
2024
|
|
Sea Basins
|
|
|
|
|
|
|
|
|
|
|
|
|
|
Baltic
|
|
90%
|
91%
|
94%
|
95%
|
84%
|
98%
|
99%
|
100%
|
100%
|
100%
|
100%
|
|
BS
|
|
NA
|
NA
|
NA
|
NA
|
NA
|
NA
|
59%
|
85%
|
60%
|
97%
|
NA
|
|
Med
|
|
82%
|
88%
|
82%
|
89%
|
0%
|
73%
|
54%
|
67%
|
99%
|
88%
|
100%
|
|
NS
|
|
71%
|
46%
|
63%
|
54%
|
67%
|
64%
|
51%
|
64%
|
73%
|
72%
|
81%
|
|
NWW
|
|
56%
|
73%
|
68%
|
84%
|
72%
|
87%
|
67%
|
83%
|
85%
|
86%
|
83%
|
|
SWW
|
|
36%
|
52%
|
80%
|
80%
|
75%
|
63%
|
76%
|
79%
|
80%
|
73%
|
79%
|
|
DWF-NEA,NWA,SP,SIO
|
|
92%
|
96%
|
94%
|
96%
|
94%
|
97%
|
89%
|
85%
|
87%
|
87%
|
88%
|
|
Total catches with Fref (1000 tons)
|
|
6,630
|
6,210
|
6,660
|
7,317
|
7,017
|
6,320
|
6,310
|
5,302
|
5,170
|
5,953
|
4,939
|
|
Total # catches (1000 tons)
|
|
7,822
|
7,705
|
7,779
|
8,480
|
8,096
|
7,115
|
7,853
|
6,484
|
6,043
|
6,934
|
5,639
|
|
% catches with Fref
|
|
85%
|
81%
|
86%
|
86%
|
87%
|
89%
|
80%
|
82%
|
86%
|
86%
|
88%
|
Table 41 - Number of scientific advice products addressing environmental impacts of fisheries
Annual count of ICES and STECF advice products addressing environmental impacts (ecosystem overviews, bycatch, seabed impacts, and sensitive species/VMEs), disaggregated by sea basin and request origin (EU vs. other).
Source: supporting study based on systematic searches of ICES advice collections and STECF reports covering the period 2014–2024. ICES ecosystem overviews were included as advice products with explicit environmental considerations.

|
Year
|
Bycatch
|
Seabed
|
Sensitive species and VME's
|
TOTAL
|
|
|
EU request
|
OTHER
|
EU request
|
OTHER
|
EU request
|
OTHER
|
|
|
2014
|
|
|
|
1
|
1
|
1
|
3
|
|
2015
|
1
|
|
|
|
1
|
1
|
3
|
|
2016
|
1
|
|
2
|
2
|
|
1
|
11
|
|
2017
|
2
|
|
1
|
1
|
1
|
1
|
8
|
|
2018
|
2
|
|
|
|
1
|
|
10
|
|
2019
|
4
|
|
|
|
|
1
|
14
|
|
2020
|
|
|
|
1
|
|
2
|
15
|
|
2021
|
|
1
|
|
|
2
|
1
|
15
|
|
2022
|
4
|
1
|
1
|
1
|
|
2
|
18
|
|
2023
|
4
|
1
|
1
|
|
2
|
4
|
15
|
|
2024
|
4
|
1
|
1
|
|
|
2
|
18
|
Table 42 - Annual advice that includes socio-economic considerations
The analysis covers advice provided through: mixed fisheries considerations, fisheries overviews, ecosystem overviews, STECF Annual Economic Reports, Multiannual Plan (MAP) supporting analyses, and other STECF economic and socio-economic advice reports. Advice products were counted annually and attributed to relevant regions where applicable. EU-wide STECF reports were counted separately, as they provide horizontal socio-economic coverage across multiple sea basins. To note that, advisory activity or capacity remained high throughout the reporting period, even if ICES’s transitioning to multi-year update cycles resulted in a decrease in publications.
Source: supporting study based on ICES advice collections and STECF reports for the period 2014–2024. Advice products were screened to identify those that explicitly include socio-economic considerations alongside biological and environmental information.


3.3.3 RFMO summary table
Table 43 - Examples of EU support to improving the performance and governance of RFMOs (2014-2025)
Source: DG MARE
|
RFMO
|
Key developments supported by the EU
|
|
ICCAT
|
Performance review and governance
·A performance review was undertaken in 2016 with EU financial and technical support.
Conservation and Fisheries management
·The EU provided funding for a management strategy evaluation, leading to the adoption of a management procedure in 2022 for both eastern and western bluefin tuna stocks, a significant milestone for ICCAT, and a significant step in both stocks’ recovery. ICCAT has also developed a Management Strategy Evaluation (MSE) framework for North Atlantic Albacore, that the EU supported financially and also chaired the working group.
Data collection and management
·The EU has a comprehensive scientific data collection system, providing additional scientific data beyond the core data requested by ICCAT. This has contributed significantly to complementary studies discussed at the ICCAT’s scientific committee and has pushed forward the scientific process and scientific knowledge.
·The ICCAT Integrated Online Management System (IOMS) is a long-term project that aims to manage online (compile, validate, store, publish, etc.) and in a centralised manner, all the structured information reported by ICCAT Contracting Parties in accordance with the data requirements contained in the ICCAT regulatory measures. The EU is one of the main funders of IOMS.
Science
·The Grand Bluefin Tuna Year Program (GBYP) was established with the aim to improve knowledge and understanding of the Atlantic bluefin tuna (Thunnus thynnus) stocks and populations through: a) improved basic data collection including through a large scale scientific tagging programme; b) improve understanding of key biological and ecological processes through electronic tagging experiments to determine habitat and migration routes, broad scale biological sampling of live fish and dead fish landed (e.g. gonads, liver, otoliths, spines, etc.), histological analyses to determine bluefin tuna reproductive state, biological and genetics analyses to investigate mixing and population structure and ecological processes, including predator-prey relationships; c) improve assessment models and provision of scientific advice on stock status through improved modelling of key biological processes (including growth and stock-recruitment), further developing stock assessment models including mixing among areas, and developing and use of biologically realistic operating models for more rigorous management option testing. Since 2008, the EU has financed 80% or almost €18,5 million of the €23 million of this comprehensive scientific research program.
Compliance, monitoring, control and enforcement
·The EU is very active in Committee of Compliance (COC) and provides comprehensive compliance assessments. It has been active in detecting infringements with any ICCAT measures and ensuring appropriate follow up corrective and enforcement actions. The EU has recently launched a process to simplify the unmanageable amount of information that the COC now has to handle, and to make the compliance assessment process more effective.
·The EU has led most initiatives to improve MCS in ICCAT, notably for bluefin tuna. The EU is by far the CPC that contributes the most resources to international inspection schemes for bluefin tuna and swordfish (In 2024, at least 306 days of sea inspections and 47 air surveillance flights).
·The EU has promoted the use of new technologies to improve control, for example by developing the first comprehensive and mandatory set of minimum standards in an RFMO for Electronic Monitoring Systems (EMS), or by launching several pilot projects for testing (EMS, AI, stereoscopic cameras).
Ecosystem approach and climate change
·Cetaceans, sea turtles, rays and certain protected species of sharks all have a regulatory protective framework established in ICCAT, with the EU being active in the adoption of such proposals.
·The ICCAT Subcommittee on Ecosystem is developing an Ecosystem Report Card to facilitate the monitoring and communication of the impacts of fisheries on ecosystem components and to assess the influence of climate variability on species managed by ICCAT. The EU is heavily involved in the development of this work.
|
|
NEAFC
|
Performance review and governance
·The European Union has been a strong advocate of conducting a comprehensive performance review in NEAFC. The last performance review was conducted more than 10 years ago (2014) and for this reason the EU suggested that NEAFC sets out a timetable for the next performance review to be conducted during 2026-2027.
·The EU has actively supported the setup and pursuit of a “Like-Minded” Contracting Parties format to allow for NEAFC activities to be carried out while Russia’s war of aggression against Ukraine is ongoing.
·The EU supported the increased inclusion of observer participation in the different NEAFC subsidiary bodies and in the Coastal States forum consultation plenaries.
·The EU initiated efforts to amend Rules of Procedures to ensure transparent decision-making in the NEAFC Committees. However these efforts were not retained.
Conservation and Fisheries management
·The EU has been underlining the need for NEAFC to take sustainable management measures for stock management in the North East Atlantic to ensure stock sustainability. At the initiative of the EU, all Contracting Parties except Russia have closed their ports for Russian vessels with catches on board of Irminger Sea redfish, which is depleted.
·In 2025 the EU pushed for the adoption of a TAC for mackerel in line with the scientific advice and for a comprehensive sharing arrangement among Coastal States in order to preserve the stock, but this was not retained by other Contracting Parties.
Data collection and management
·The EU has advocated in favour of ensuring that NEAFC receives data and scientific information needed for management of stocks under the NEAFC purview. NEAFC adopted the EU proposed decision to request that information from a Contracting Party that has failed to submit it is duly submitted.
Science
·The EU has fully supported the role of the International Council of the Exploration of the Sea (ICES), which is the independent scientific body providing scientific advice to NEAFC as per the NEAFC Convention, in providing independent scientific advice. At the initiative of the EU the NEAFC Memorandum of Understanding with ICES includes all stocks present in the NEAFC Regulatory Area.
Compliance, monitoring, control and enforcement
·At the initiative of the EU, NEAFC adopted comprehensive compliance reports that have evidenced high levels of non-compliance of rules for transshipments and fishing in restricted areas to protect VMEs.
·The EU has been very active in the Committee of Compliance (PECMAC) and provides comprehensive compliance assessments.
·In 2024 and 2025 the EU proposed control measures for Irminger redfish pelagic stocks to deter unsustainable fishing by certain Contracting Parties.
·EU timely contribution to the flag State performance evaluation carried out by NEAFC and finalised in 2025 (first RFMO).
·The EU proposed full transparency of fisheries data via NEAFC ERS User Interface since 2024.
·The EU was the first Party to implement the UN/CEFACT FLUX standard in NEAFC, which became the first RFMO to adopt it.
·The EU contributes the most resources to international inspection scheme and on Port State Control (PSC).
·The EU has promoted the use of new technologies to improve control, including remote electronic monitoring (REM) and continues to promote the integration of control measures for pelagic stocks within the NEAFC framework.
Ecosystem approach and climate change
·In 2025, the EU organised and hosted a workshop of five NEAFC Contracting Parties and stakeholders on the ecosystem-based approach to fisheries management.
·NEAFC, with the EU’s engagement, has been taking steps to set higher-level biodiversity and ecosystem objectives for which it requested ICES to provide advice on how to best monitor and assess ecosystem-based objectives. This advice was issued in 2024.
·The International Council of the Exploration of the Sea (ICES) incrementally integrates the Ecosystem Approach to Fisheries Management into its scientific advice.
·Climate change is a standing agenda item and NEAFC adopted a climate change resolution to give more direction to the consideration of climate change in its work.
|
|
GFCM
|
Performance review and governance
·The EU was instrumental in reshaping the GFCM governance framework after the adoption of the CFP, through political leadership, as well as technical and financial support. The EU promoted key CFP elements in GFCM – MSY, multiannual management plans based on sound scientific advice, monitoring and control measures, and regionalisation through the establishment of sea basin capacity development frameworks for the Mediterranean (MedSea4Fish) and the Black Sea (BlackSea4Fish) supported by 5 subregional technical units (for the Med - western, central, eastern, Adriatic and the Black Sea).
·To achieve these goals, the EU promoted a top-down approach, based on political commitments that would later on be developed into concrete actions and constantly increased its voluntary financial contribution (up to 8 mil Euro/Grant contract).
·The EU initiated in 2016 discussions that led to the adoption of the 2017 MedFish4Ever political declaration, a 10-year roadmap setting out the vision for the development of the sea basin, signed by 16 riparian Mediterranean countries. Currently, the EU as legal repository of the Declaration, is working on the renewal of the 2017 declaration. A similar process is envisaged also for the assessment and renewal of the 2018 signed Sofia Ministerial declaration, for the Black Sea.
·A second performance review of GFCM was undertaken in 2019, with EU financial support.
Conservation and Fisheries management
·The EU has supported, including through financial voluntary contribution and technical expertise, the development of Multiannual Management Plans (MAPs) in GFCM. So far since 2013, 11 MAPs have been adopted for key species including Hake and Deep water Rose shrimps in the Strait of Sicily (Sos), Deep water Red Shrimps (ARA and ARS) in the SoS, Ionian and Levant, Blackspot Seabream in west Mediterranean, Small pelagic and demersal species in the Adriatic, Common Dolphinfish, and Turbot in the Black Sea.
·EU has also supported through the financial voluntary contributions the MSE work done under 2 MAPs notably (Blackspot Seabream and the small pelagic in the Adriatic). Currently EU is also supporting ongoing MSE work, both financially and technically with the participation of EU MSE experts for stocks under 4 MAPs (HKE and DPS in the SoS and DWRS (ARS and ARS) for the SoS, Ionian and Levant).
Data collection and management
·EU has supported through voluntary financial contributions the development of the Data Collection Reference Framework platform of GFCM that allows for reporting, managing and validating, in a centralized manner, all the structured information reported by GFCM Contracting Parties in accordance with the data requirements contained in the GFCM regulatory measures.
·As the main donor to GFCM, EU also supports regional capacity development programs for each sea basin (Medsea4fish and BlackSea4fish) including on data collection, data preparation, surveys, stocks assessments, as well as administrative capacity.
Science
·EU has contributed through significant financial support work related to data preparation, stock assessments, benchmark sessions, MSE work for several stocks. EU scientists have been also participating to relevant stock assessment meetings (WGSAD) and benchmark sessions, contribution to the work of GFCM.
·EU has supported (financially and technically with participation of MS) the implementation of several research programs:
oResearch Programme on red coral (2020-2023). Its main objective was to assist the GFCM, through the best available scientific and technical advice, in improving the management of red coral fisheries and in creating a dedicated catch certification scheme, with a view to ensuring sustainability at the environmental, social and economic levels.
oA dedicated research program on recreational fisheries (2024-2026). This initiative aims to enhance recreational fisheries data collection, develop a framework for integrating recreational fisheries data into stock assessments, identify existing management measures, and facilitate networking among stakeholders.
oResearch programme on common dolphinfish (2021-2024). The main objective of the research programme was to assess the state of common dolphinfish stock and to define FAD fisheries management measures that would contribute to the sustainability of the stock.
oRegional Research programme for rapa whelk fisheries in Black Sea (2019-2023). The project was a first, aiming to improve scientific, technical and socio-economic knowledge of the fisheries exploiting a stock which was considered invasive species and transformed to a commercial stock with high commercial value and significant landings. Data collection, scientific knowledge, and scientific advice have been significantly improved providing critical information on stock management, including standardisation of regional surveys at sea.
oResearch programmes and pilot projects for piked dogfish, sturgeons, and mitigation measures for harbour porpoise bycatch in turbot gillnet fisheries provided important scientific elements to base the decision making for management measures.
Compliance, monitoring, control and enforcement
·The EU, based on the MedFish4Ever and Sofia declarations consistently promoted the strengthening of the Compliance committee and the enhancement of compliance mechanisms to improve the culture of compliance with the regional rules as it was lagging behind and the GFCM capacity to detect and follow up on cases of non-compliance aiming to ensure a level playing field among operators working in the same region.
·The EU also promoted operations at sea and strengthened the operational capacity of GFCM partners to perform fisheries control, monitoring and surveillance to fight effectively against IUU fishing. Four GFCM international joint inspections schemes (Adriatic, Strait of Sicily, Ionian and Common Dolphinfish), coordinated by EFCA, were fundamental to promote best practices, train national inspectors and deter illegal activities on the ground.
Ecosystem approach and climate change
·Four EU-tabled recommendations on the protection of vulnerable species and mitigation of bycatch were adopted in 2021. This also came after the adoption in 2018 of an EU proposal for the protection of sharks and rays. The EU also supported the adoption of the Resolution on a regional plan of action to monitor and mitigate interactions between fisheries and vulnerable species in the Mediterranean and the Black Sea.
·The EU has tabled over the past several years a number of proposals for the creation of Fisheries Restricted Areas. This has led to the adoption of 11 different FRAs.
·The EU is at the basis the GFCM work on non-indigenous species (NIS), notably through its Grant to the GFCM. A research programme on Blue Crabs and a pilot project on NIS in the Eastern Mediterranean are now ongoing
|
|
NAFO
|
Performance review and governance
·A performance review was undertaken in 2018 with EU financial and technical support.
Conservation and Fisheries management
·The EU has supported, including through financial voluntary contribution and technical expertise, the development of robust management frameworks (including MSE approaches) for key stocks (eg, cod, Greenland halibut, cod, redfish) under its dedicated precautionary framework.
Data collection and management
·NAFO maintained structured data collection for catch statistics, VMS, logbooks, observer reports and GIS data through the Secretariat’s data repository. The EU co-financed studies (e.g., on merged VMS/logbook data quality and advanced assessment models) that have enhanced understanding and technical capacity for data analysis supporting NAFO scientific advice.
Science
·NAFO addressed. The EU supported efforts to address scientific challenges around uncertainty in assessments, development of MSEs, integration of ecosystem-based advice, spatial distribution changes and data limitations through active scientific engagement, and contributions to improved data, modelling and assessment frameworks. EU also supported revision of NAFO’s Precautionary Approach Framework (PAF) by contracting 3 experts enabling development of new PAF that NAFO successfully adopted by NAFO in September 2023.
Compliance, monitoring, control and enforcement
·NAFO’s annual compliance review process has been maintained and progressively refined since 2014 (format, reporting templates, observer and VMS data use, follow-up on non-compliance). The EU regularly tabled proposals on monitoring, observer programmes, electronic reporting and inspection standards. The EU also provided operational support through EFCA coordination of inspections and control of EU vessels in the NAFO area.
·The EU has led proposals to revise the observer program standards and protection measures.
·The EU organised 3 observer-related workshops to improve data quality and implementation. These workshops are instrumental in bringing control authorities and NAFO observers together, fostering dialogue and collaboration.
·The EU also organised, jointly with other Contracting Parties, workshops for inspectors
Ecosystem approach and climate change
·NAFO has progressively developed an Ecosystem Approach to Fisheries Management roadmap, with scientific and management work on ecosystem indicators, multispecies analysis, and integration of ecosystem considerations into advice and measures. NAFO also identified and closed multiple VME areas to bottom fishing. The EU contributed significantly to these important areas of policy work through financial voluntary contributions supporting dedicated research, (eg: Nereida project).
|
|
NASCO
|
Performance review and governance
·A performance review was undertaken in 2023 with EU financial support.
Conservation and Fisheries management
·The EU actively supported the adoption in 2024 of NASCO's ten-year strategic plan to curb the decline of wild Atlantic salmon populations and promote restoration.
·The EU supported, including financially, several activities for the international year of the Atlantic salmon (2019). This funding facilitated projects aiming at educating the public about wild Atlantic salmon, raising awareness about the factors driving wild salmon abundance and the environmental and anthropogenic challenges they face, with a view to securing its involvement in concrete actions that contribute to the conservation of wild Atlantic salmon populations.
Science
·EU scientists contribute to the assessment of Wild Atlantic Salmon in European jurisdictions. EU has also provided support to tracking programs of pink salmon which is considered an invasive species in European jurisdictions.
·The EU supported small and large scale scientific projects to explore the migration and survivability of wild Atlantic salmon during the marine phase of their life cycle.
|
|
IOTC
|
Performance review and governance
·The EU supported conducting a second review and after a proposal of the EU, a process to implement follow-up actions was agreed in 2016.
Conservation and Fisheries management
·MSE-tested management procedures have been recently adopted for SWO, BET, and SKJ. The work on another MSEs is ongoing for BSH, YFT and ALB with the technical and financial support of the EU.
Data collection and management
·As a result of the EU initiative, the regulatory framework for catch, effort and statistical reporting requirements has been established. The EU has continued to demonstrate its commitment to expanding observer coverage and supporting electronic monitoring by presenting proposals. The EU has also funded projects to support the implementation of the IOTC ROS and to improve the quality and quantity of data available.
Science
·EU scientists have participated and developed the stock assessment for tropical tunas, as well as, for bycatch species. In addition, EU scientists led the review of the YFT stock assessment and the development of a new evaluation of the stock. The EU funded various projects such as BIOFADs (development of biodegradable FADs), the results of which have contributed to their current improved regulation.
Compliance, monitoring, control and enforcement
·The IOTC compliance process has been completely reviewed and significantly improved in the course of last years, mostly under the impulse of the EU, including the establishment of a framework for penalties applicable in case of non-compliance.
·The EU has supported the establishment of important MCS tools such as VMS, Register of Authorised Vessels etc. Since 2022 the is proposing the implementation of an HSBI which has not gathered yet sufficient support.
Ecosystem approach and climate change
·Cetaceans, sea turtles, seabirds, rays and endangered shark species have a regulatory framework. These requirements have been strengthened in recent years, with the EU playing a key role in this context by putting forward numerous proposals.
|
|
SIOFA
|
Performance review and governance
·A performance review was undertaken in 2023 upon a proposal of the EU and with EU financial support.
Conservation and Fisheries management
·Conservation and management measures on key demersal stocks were adopted during the evaluation period based on EU proposal.
·Management measure to establish a framework for the conduct of new and exploratory fisheries was adopted upon an EU proposal.
Data collection and management
·Guidelines, handbook and procedures for human observer and EMS was heavily pushed and drafted by EU scientist.
Science
·The EU supported through voluntary financial contributions projects aiming at supporting the scientific work of SIOFA, such as, stock assessments of key stocks such toothfish, orange roughy, alfonsino and establishment of management procedures.
Compliance, monitoring, control and enforcement
·Compliance monitoring scheme adopted and refined based on a proposal cosponsored by the EU.
·SIOFA VMS adopted based on EU proposal, intersessional work leaded by an EU chaipersonship, and operationalised based on EU voluntary contributions.
·HSBI adopted based on proposal cosponsored by the EU.
·Port Inspections framework developed based on EU proposal.
Ecosystem approach and climate change
·Conservation and management measure for sharks adopted based on EU proposal.
·Conservation and management measure for seabirds adopted based on EU proposal.
|
|
IATTC
|
Performance review and governance
·Terms of reference were drafted in 2014, but no consensus has yet been reached to undertake a performance review.
Conservation and Fisheries management
·An effort-based management is in place in the IATTC and adapted on the basis of the scientific advice. This has allowed to maintain the level of catches within sustainable levels.
Data collection and management
·The EU has proposed to expand observer coverage and has actively participated in the definition of guidelines for the implementation of electronic monitoring.
Science
·EU voluntary contributions have supported several scientific projects such as, the undertaking of stock assessments of several stocks, introduction of CKMR, biodegradable FADs projects, biological tissue library, tagging of key species etc.
Compliance, monitoring, control and enforcement
·The compliance process has been improved thanks to the efforts of the EU and like-minded CPCs. Moreover, a dedicated meeting on compliance process improvements is held every second year.
·The EU has driven the adoption of an MCS framework for Pacific bluefin tuna by both IATTC and WCPFC.
Ecosystem approach and climate change
·The IATTC adopted one of the first climate change resolutions in tuna RFMOs (2023) and since then a specific climate change workshop has been organised in cooperation with the WCPFC to fully grasp the consequence of climate changes on tuna. In addition to fully support this work, the EU supported significant improvements in the regulatory framework of IATTC, such as the consolidation and reinforcement of the Sharks CMM, the removal of the fins to carcass ration from the option available for implementing the finning ban reinforced, guidelines for handling and safe release of sharks, introduction of non entangling and biodegradable FADs etc.
|
|
WCPFC
|
Performance review and governance
·Last performance review in 2012. The EU supports a second performance review but this has not been prioritized yet.
Conservation and Fisheries management
·The EU supported financially the establishment of “managers-scientists dialogues” and a harvest strategy workplan that have paved the way to the development and adoption of MSE-tested harvest strategies for key species.
Data collection and management
·The EU has been supporting the increasing in observer coverage in longline fisheries, including through the introduction of electronic monitoring, for improving the data collection and cross verification processes in WCPFC.
Science
·EU voluntary contributions have supported several scientific projects such as, the undertaking of stock assessments of several stocks, including SPBSH, introduction of CKMR, biodegradable FADs, biological tissue library, tagging of key species etc.
Compliance, monitoring, control and enforcement
·The EU has been consistently advocating for improving the transparency of the compliance review process in WCPFC which is still undertaken in closed sessions. Moreover, the EU continues to actively promote the expansion of the scope of the compliance monitoring scheme following its recent reduction.
·The EU has driven the adoption of an MCS framework for Pacific bluefin tuna by both WCPFC and IATTC.
Ecosystem approach and climate change
·EU supported significant improvements in the regulatory framework of WCPFC, such as the consolidation and reinforcement of the Sharks CMM, the removal of the fins to carcass ration from the option available for implementing the finning ban reinforced, guidelines for handling and safe release of sharks, introduction of non entangling FADs etc.
·The EU has supported the adoption of a climate change resolution in 2019.
|
|
SPRFMO
|
Performance review and governance
·Two performance reviews were undertaken during the evaluation period (in 2018 and 2024), both funded by the EU.
Conservation and Fisheries management
·Chilean jack mackerel (CJM) has been recovering for more than a decade with TAC increasing every year, mostly in line with the rebuilding plan supported by the EU, which has also financed a large part of the scientific needs for that stock.
·The ongoing development of the CJM MSE is mostly financed by the EU, with technical contributions from EU scientists. The EU is also promoting the development and adoption of a Management Procedure resulting from the MSE work by the Commission.
·Adoption of a capacity limit for the squid jigging fishery, based on EU proposal.
Data collection and management
·The EU has earmarked funding for work on chub mackerel which is caught in association with the jack mackerel fishery. Data collection is ongoing, with a first stock assessment is expected in the years to come.
·The EU financed the accreditation of Members’ observer programmes to ensure they meet SPRFMO standards.
Science
·The EU has provided significant financial support for scientific work such as stock assessments and the development of a CJM MSE.
Compliance, monitoring, control and enforcement
·In the last decade, SPRFMO adopted a regional VMS, based on an EU proposal and with EU financial support, and a HSBI scheme.
Ecosystem approach and climate change
·The EU actively supported the review of SPRFMO’s bottom fishing framework in 2023 and has been providing funding for the assessment of significant adverse impacts on VMEs.
·SPRFMO has adopted a bottom fishing impact assessment standard and a VME encounter review standard, both supported by the EU.
|
|
NPFC
|
Performance review and governance
·Performance review undertaken in 2022 (agreed before the EU joined the organisation).
Conservation and Fisheries management
·The EU supported the adoption of rebuilding plans for chub mackerel and pacific saury.
Data collection and management
·The EU funded the development of the NPFC online database for the comprehensive collection, storage and mining of data both for scientific and compliance processes.
Compliance, monitoring, control and enforcement
·The EU supported the development and implementation of a new and more robust Compliance Monitoring Scheme.
|
|
CCAMLR
|
Performance review and governance
·A second performance review of CCAMLR was undertaken in 2016, based on an EU proposal and with EU financial support. In 2024 and 2025, the EU has proposed to undertake a third performance review and has earmarked funding for this purpose, but no consensus has yet been reached on the proposal.
·The EU is funding a dedicated project to enhance transparency by making historical CCAMLR meeting documents publicly available.
Data collection and management
·The EU has proposed to improve observer coverage requirements for new and exploratory fisheries, but these proposals have not yet reached consensus.
·The EU has provided funding to improve data quality and the analytics available to support science-based decision making and real-time fishery monitoring and control.
Science
·The EU and its Member States have supported an improved process for designating Special Areas for Scientific Study (SASS) in newly-exposed marine areas following the retreat or collapse of any ice shelf, glacier or ice tongue around the Antarctic continent, and the designation of the Pine Island Glacier as such an area.
Compliance, monitoring, control and enforcement
·In 2017, CCAMLR adopted an EU proposal to improve its scheme to promote compliance by Contracting Party nationals with CCAMLR conservation measures.
·The EU has provided funding to CCAMLR to support international cooperation with INTERPOL and the International MCS Networks Joint Analytical Cell (JAC) notably to improve compliance and eliminate IUU fishing in the Convention area.
·The EU has proposed improving CCAMLR’s scheme to promote compliance by non-Contracting Party vessels with CCAMLR conservation measures by extending its scope to include vessels without nationality, but this proposal did not reach consensus.
·The EU has proposed an enforceable prohibition of shark finning, but this proposal did not reach consensus.
·The EU has proposed improving CCAMLR’s compliance assessment procedure by preventing Contracting Parties from blocking consensus on their own compliance issues, but this proposal did not reach consensus.
·The EU has supported efforts to improve regulation of transhipment at sea in the Convention Area.
Ecosystem approach and climate change
·The EU supported the designation of the Ross Sea region MPA in 2016 and has submitted, together with its Member States and other Members, proposals to designate MPAs in East Antarctica and in the Weddell Sea.
·The EU and its Member States co-sponsored Resolution 36/41 on Climate Change adopted by CCAMLR in 2022 which, among others, encourages Members to engage actively with and support climate change science and to engage in climate change research, and calls for increased consideration of climate change impacts in the waters surrounding Antarctica to better inform CCAMLR management decisions.
·The EU has proposed the protection of fish nest areas in the Convention Area, but this proposal has not yet reached consensus.
·In 2022, CCAMLR adopted an EU proposal to improve environmental protection in the Convention area by extending the scope of Conservation Measure 26-01 to all fishing vessels including carriers (rather than just harvesting vessels) and to a larger area.
|
Annex VII. Common Fisheries Policy Acquis
List of the key secondary legislation and contribution to SWD
Detailed Common Fisheries Policy Acquis
Conservation and sustainable exploitation of marine biological resources
Scientific base for fisheries management
Common market organization (CMO)
Advisory Councils
Management of fishing capacity
External policy
Aquaculture
Financial instruments
Control and enforcement
General remark
This evaluation considers the general contribution of secondary legislation/instruments to the achievement of the CFP Regulation objectives. This is necessary as many of the provisions of the CFP Regulation provide a framework for action which is then fleshed out in secondary legislation/instruments. The evaluation does not, however, analyse the impact of individual provisions of these secondary instruments.
The following annex provides:
1.A list of main secondary legislation/instruments, as mentioned in the evaluation. This "shortlist" is based on the intervention logic described in section 2.1 of the SWD. The table includes a brief explanation of the way in which these instruments contribute to the CFP Regulation objectives and in which sections they have been covered.
2.A detailed list of all instruments per topic.
List of the key secondary legislation/instruments mentioned in the SWD
|
Instruments that are
detailed in secondary legislation
|
Acronym
|
Data and/or analysis
in sections
|
Comments
|
|
Multiannual Plans
Baltic - Regulation (EU) 2016/1139
North Sea - Regulation (EU)2018/973
Western Waters - Regulation (EU)2019/472
Western Mediterranean - Regulation (EU)2019/1022
|
MAP
|
3.1, 4.1.1, 4.1.2
|
The current evaluation did not carry out an assessment of the existing multiannual plans. It considers only their general contribution to the achievement of the CFP Regulation objectives, especially regarding fishing pressure, and regional variation in stock management as well as regionalisation and scientific advice.
|
|
Technical measures
Regulation (EU) 2019/1241
|
TMR
|
3.1.3, 4.1.2, 3.3.1,
4.1.1
|
The current evaluation did not carry out an assessment of the existing technical measures. It considers only their general contribution to the achievement of the CFP Regulation objectives, especially regarding their role in the conservation of fisheries resources and in mitigating the negative impact of fishing activities on the marine ecosystem. The findings established links between technical measures and shared decision-making structure (regionalisation), selectivity and level playing field (harmonisation).
|
|
Vulnerable marine ecosystems
Regulation (EC) 734/2008
Regulation (EU) 2016/2336
|
VME
|
3.1.3
|
The current evaluation did not carry out an assessment of the existing measures to protect vulnerable marine ecosystem from the adverse impacts of bottom contacting gears. It considers only their general contribution to the achievement of the CFP Regulation objectives, especially to ensure that negative impacts of fishing activities on marine ecosystem are minimised and to endeavour that fisheries activities avoid the degradation of the marine environment both in EU waters and in international waters.
|
|
Funding (EMFF/EMFAF)
EMFAF - Regulation (EU) 2021/1139
EMFF - Regulation (EU) 508/2014
|
EMFF/
EMFAF
|
3.1.3, 4.1.2
|
The current evaluation did not carry out an assessment of the existing funding instruments available to support the CFP. It considers only their general contribution to the achievement of the CFP Regulation objectives, especially regarding main areas of funding, adjustment of fleet capacity (permanent cessation of fishing activity), efficiency and coherence of CFP Regulation with funding instruments.
|
|
Annual fishing opportunities (quota, efforts, etc)(Annual acts)
|
FO
|
3.1.1, 3.2.1, 3.2.2,
4.1.1, 4.2
|
The current evaluation did not carry out an assessment of the different fishing opportunities set during the period studied. It considers only their general contribution to the achievement of the CFP Regulation objectives, given the existing link between the fishing opportunities determined in the annual regulations and the evolution of stocks, the balance of the fishing capacity and the evolution of landings. Fishing opportunities contributed also to governance and shared decision-making issues (role of POs, allocation of FO & preferential allocation to SSCF, scientific advice) and external factors (Brexit, access to non-EU fishing grounds, RFMOs, SFPAs).
|
|
Common Market Organisation
Regulation (EC) 1379/2013
|
CMO
|
3.2.8, 3.2.10, 4.1.1,
4.2
|
The current evaluation did not carry out an assessment of the Common Market Organisation (CMO) Regulation but CMO is an integral part of the CFP. The CMO and its objectives are established in article 35 of the CFP Regulation. Being the market pillar of the CFP, the CMO is governed by the same principles of good governance and contributes to achieve CFP objectives regarding sustainability, fair competition and equivalent standards to those applying to EU products and activities.
|
|
Data Collection Framework
Regulation (EU) 2017/1004
|
DCF
|
3.1.3, 3.3.3, 4.1.1,
4.1.3
|
The current evaluation did not carry out an assessment of the existing Data Collection Framework. It considers only their general contribution to the CFP Regulation requirement for data collection and, under efficiency, the structure for financial support for Member States to conduct data collection activities.
|
|
Control Regulation
Regulation (EC) 1224/2009
Regulation (EU) 2023/2842
|
CR
|
3.2.6, 3.2.15, 3.3.5,
3.3.6, 3.3.7, 4.1.2,
4.1.3, 4.4.1, 4.2, 4.3
|
The current evaluation did not carry out an assessment of the existing Control measures nor the enforcement of the existing rules. However, the requirements for control and enforcement are set out in Articles 2 and 36 of the CFP Regulation. Control is present in different sections of the evaluation given that the successful implementation of the CFP depends on an effective, efficient, modern and transparent system of control and enforcement.
|
|
Illegal, Unreported and Unregulated fishing
Regulation (EC) 1005/2008
|
IUU
|
3.2.6, 3.3.7, 4.1.1, 4.2, 4.3
|
The current evaluation did not carry out an assessment of the existing system to prevent, deter and eliminate IUU. It considers only their general contribution to the achievement of the CFP Regulation objectives, especially regarding conservation of fisheries resources and EU international commitments, given the serious threat that IUU represents to the sustainable exploitation of living aquatic resources.
|
|
Aquaculture guidelines
COM(2021)236
|
-
|
3.1.3, 3.2.6, 4.1.1, 4.1.2
4.1.3, 4.2, 4.3
|
The current evaluation did not carry out an assessment of the existing Strategic guidelines for a more sustainable and competitive EU aquaculture. It considers only their general contribution to the achievement of the CFP Regulation objectives given that aquaculture activities are included in the scope of CFP in relation to market measures and financial measures to support of CFP objectives as well as the improvement of environmental sustainability and reduce ecological impacts associated with the aquaculture industry.
|
|
Autonomous Tariff Quotas
Regulation (EU) 2020/1706
|
ATQ
|
4.1.3
|
The current evaluation did not carry out an assessment of the existing ATQ Regulation. It considers only its general coherence with the CFP Regulation objectives, other EU trade instruments and international trade instruments.
|
|
Sustainable Management of External Fishing Fleets Regulation
Regulation (EU) 2017/2403
|
SMEFF
|
4.1.3.
|
The current evaluation did not carry out an assessment of the existing SMEFF Regulation. It considers only its general coherence with the CFP Regulation objectives given that SMEFF ensures that Union fishing activities outside Union waters are based on the same principles and standards as those applicable under Union law, while promoting a level playing field for Union operators and third-country operators.
|
|
RFMOs transpositions and SFPA acts
(Several legislative acts
RFMOs
and
SFPAs)
|
RFMOs SFPAs
|
3.2.5, 3.3.7, 4.1.1, 4.1.3
|
The current evaluation did not carry out an assessment of these legislative acts. It considers only its general coherence with the CFP Regulation objectives given that RFMO transposition acts aim at enshrining into EU law the rules adopted by RFMOs to which the EU is a Party to ensure legal consistency and clarity, while SFPA related acts regulate the access of EU fishing vessels to waters under the jurisdiction of third countries in line with the CFP.
|
Detailed Common Fisheries Policy Acquis
Conservation and sustainable exploitation of marine biological resources
Fishing opportunities regulations (FOR)
·Policy statement (annual Commission communication on the intentions for the annual FOR exercise)
·General fishing opportunities regulation (Union waters and Union vessels outside Union waters (annual exercise governing FO for the Atlantic, North Sea, RFMOs, Coastal States and bilateral agreements)
·Regulation for the Baltic Sea (every year)
·Regulation for the Mediterranean and Black Sea (every year)
·Regulation for deep sea species (every two years)
·Fishing opportunities regulations - Protocols to SFPAs (established upon the conclusion of each Protocol)
Mediterranean regulation
·
Regulation (EC) No 1967/2006
Multiannual plans (MAPs)
·Baltic -
Regulation (EU) 2016/1139
·North Sea -
Regulation (EU)2018/973
·Western Waters -
Regulation (EU)2019/472
·Western Mediterranean -
Regulation (EU)2019/1022
Technical measures regulation (TMR)
·
Regulation (EU) 2019/1241
·Action plan for reducing incidental catches of seabirds in fishing gears - COM(2012)0665 final
COM delegated acts through regionalisation
·Discard plans
·Conservation measures under MAPs
·Acts to comply with environmental legislation
·Establishment of fish stock recovery areas
·Technical measures (under TMR)
Other legislative acts on conservation
·VME regulation -
(EC) No 734/2008
·Eel regulation -
(EC) No 1100/2007
·Shark finning regulation -
(EC) No 605/2013
·Deep sea access regulation -
(EU) 2016/2336
·Western waters effort regime -
Regulation (EC) No 1954/2003
Other Commission acts
·International obligations - discards
·Commission emergency measures
·Implementation of TMR
National measures
·National emergency measures
·Other national measures
Scientific base for fisheries management
Data Collection Regulation
Regulation (EU) 2017/1004
Commission acts
·STECF Decision -
2016/C 74/05
·Rules on work plan and annual report format -
Decision (EU) 2022/39
·EU-MAP multiannual programme from 2022 -
Decision (EU)2021/1167
and
Decision (EU)2021/1168
Common market organization (CMO)
CMO Regulation
Regulation (EC) No 1379/2013
Common marketing standards Regulation
·
Regulation (EC) No 2406/96
·Council Regulation (EC) No 2406/96 (fresh and chilled fish)
·Council Regulation (EEC) No 1536/92 of 9 June 1992 laying down common marketing standards for preserved tuna and bonito
·Council Regulation (EC) No 2406/96 of 26 November 1996 laying down common marketing standards for certain fishery products
Commission acts
·Recognition producer organisations (POs)
·Production and marketing plans -
Regulation (EU) No 1418/2013
·Common marketing standards regulations
Advisory Councils
Commission acts
·Detailed rules -
Regulation (EU) 2015/242
Management of fishing capacity
·Annex II CFP (fishing capacity ceilings)
Commission acts
·Fishing fleet register –
Regulation (EU) 2017/218
External policy
International agreements and arrangements
·UN treaties and conventions
·Bilateral agreements and arrangements
·Coastal State arrangements
·Sustainable fisheries partnership agreements (SFPAs)
·Regional fisheries management organisations (RFMOs)
Negotiation mandates
Article 218 (3) and (4) TFEU
RFMO transposition
Various legislative acts
SMEFF Regulation
Regulation (EU) 2017/2403
Autonomous tariff quotas (ATQs)
Regulation (EU) 2020/1706
Trade measures regulation
Regulation (EU) 2025/2077
Conclusion SFPAs and protocols
Article 43(2) in conjunction with point (a) of Article 218(6)(a)(v) and 218(7)
TFEU
Signature SFPAs and protocols
Sustainable fisheries partnership agreements (SFPAs) and their implementing protocols
Commission acts
·Detailed rules on fishing authorisations
Blue fin tuna
·Regulation (EU) 2023/2833 (BFT catch documentation)
·Regulation (EU) 2023/675 (BFT conservation and management)
·Regulation (EU) 2023/2053 (BFT MAP)
Northern agreements
·Bilateral agreements and arrangements with: the United Kingdom, Norway, Faroe Islands and Iceland
·Trilateral agreements
·Multilateral agreement - Coastal states
Aquaculture
Aquaculture guidelines
·
COM(2021)236
Alien species regulation
·
Regulation (EC) No 708/2007
Financial instruments
EMFAF/EMFF Regulations
·
Regulation (EU) 2021/1139
·
Regulation (EU) No 508/2014
EMFF/EMFAF Commission acts
·Several delegated and implementing acts
oCommission Implementing Regulation (EU) 2022/45 of 13 January 2022
Commission Implementing Regulation (EU) 2022/44 of 13 January 2022
Commission Implementing Regulation (EU) 2022/46 of 13 January 2022
·Approval of MS Operational Programmes (OPs)
·Decisions on interruptions and suspensions
State aid rules for fisheries and aquaculture
·State aid guidelines
2015/C 217/01
·Fisheries block exemption regulation -
Regulation (EU) No 1388/2014
·Fisheries de minimis regulation -
Regulation (EU) No 717/2014
Control and enforcement
Control regulation
·Council Regulation (EC) 1224/2009 amended in 2023
Flexibility regulation
·
Regulation (EC) No 847/96
Commission acts on control
·Control
Implementing Regulation (EC) No 404/2011
·Deduction Guidelines -
2012/C 72/07
+ Amendment
2019/C 192/0
·Fishing stops
·Action plans
·Administrative enquiries
·Deductions and transfer of quotas
Regulation establishing the European Fisheries Control Agency (EFCA)
·
Regulation (EU) 2019/473
IUU regulation
Regulation (EC) No 1005/2008
Commission acts on IUU
·IUU
Implementing Regulation (EC) No 1010/2009
·IUU vessel list -
Regulation (EU) No 468/2010
·List of non-cooperating third countries -
Decision 2014/170/EU
·Third country notification acts
·Third country identification act
|
Annex VIII. Key Performance Indicators (KPIs)
|
|
Impacts
|
Key Performance Indicator
|
Baseline Value (2014 if not indicated otherwise)
|
Expected value
when defined in 2011 IA
|
Observed value
(2024 if not indicated otherwise)
|
|
#1: Long-term conservation and sustainable exploitation of fisheries resources
|
Overfishing (exploitation rate): Nr and % of stocks F/FMSY>1
|
90
|
121 (2022)
|
120 (2022)
|
|
|
|
50%
|
89%
|
63%
|
|
|
Stock situation (Healthy stocks-relative stock size): Nr and % of Stocks B/BMSY (or BMSY proxies)>1 or B/MSYBTRIGGER>1
|
87
|
Not defined
|
74
|
|
|
|
65%
|
Not defined
|
55%
|
|
|
Stock situation (Impaired reproductive capacity): Nr and % of stocks below B/BLIM <1
|
21
|
Not defined
|
26
|
|
|
|
16%
|
Not defined
|
20%
|
|
#2 Protection of aquatic ecosystems
|
Nr of Marine Protected Areas established (Table 8)
|
4,900
|
Not defined
|
5,546
|
|
|
Nr of “Vulnerable Marine Ecosystems” established in EU waters, in RFMOs and in the High seas, and spatial extent of protection (Table 9)
|
187
|
Not defined
|
357
|
|
|
Number of scientific advice products addressing environmental impacts of fisheries
|
3
|
Not defined
|
18 (2024)
|
|
|
Discard rates
|
No baseline
|
Decrease
|
No evidence of reduction of discard rates. Important data gap.
|
|
#3 Strengthened economic performance of the sector
|
N° of vessels (STECF 25-07)
|
75,049 (2013)
|
62,290 (2022)
|
71,094 (2022)
|
|
|
Net profit for aquaculture in real term (CFP external study)
|
388.8 million EUR
|
Not defined
|
793.8 million EUR, +104% (2022)
|
|
|
Net profit margin for fishery in real term (STECF 25-07)
|
5% (2013)
|
18% (2022)
|
2% (2022)
|
|
|
GVA for fishery in real term (excl. GRC, STECF 25-07)
|
3,611 million EUR (2013)
|
+90% (2022)
|
3, 346 million EUR, -4.8% (2022)
|
|
|
GVA of processing industry in real term (STECF 25-15)
|
5,352 million EUR (2013) (2013)
|
+26% (2022)
|
9,276 million EUR, +73% (2022)
|
|
|
GVA for aquaculture in real term (STECF 24-14)
|
1,622 million EUR (2013)
|
Not defined
|
2,127 million EUR, +31% (2022)
|
|
|
Income for fishery (excl. GRC, STECF 25-07)
|
7,311 million EUR (2013)
|
+24% (2022)
|
6,951 million EUR, -5% (2022)
|
|
|
Return on investment for fishery (STECF 25-07)
|
3% (2013)
|
18% (2022)
|
5% (2022)
|
|
|
Net profit margin processing industry (STECF 25-15)
|
2-5%
|
Not defined
|
19%
|
|
#4 Contribution to long term food security
|
Value and volume of EU fishery production (Excl. Greece, STECF 25-07)
|
4,313 thousand tonnes LWE/ 7,362 million EUR
|
Not defined
|
3,334 thousand tonnes/ 6,194 million EUR (2023)
|
|
|
Value and volume of EU aquaculture production (EUMOFA)
|
1,022 thousand tonnes LWE/3,082 million EUR
|
Not defined
|
1,043 thousand tonnes LWE/ 4,174 million EUR (2023)
|
|
|
Self-sufficiency ratio (EUMOFA)
|
46,1%
|
Not defined
|
38,1% (2023)
|
|
|
Volumes managed by POs (new, CMO study)
|
No baseline
|
Not defined
|
56% of fishery production
37% of aquaculture production
|
|
|
Consumer price index of fishery and aquaculture products (EUMOFA based on EUROSTAT)
|
100 (2015)
|
Not defined
|
141.5 (2024)
|
|
|
Share of products covered by mandatory labelling (in value) (CMO study)
|
77% of at home consumption
|
Not defined
|
73% of at home consumption (2024)
|
|
# 5 Improved livelihoods of coastal and inland communities
|
Total employment in the fishing fleet
STECF 25-07 raw data set (including Greece)
|
141,064
|
-22% by 2022
|
119,500 (2023)
(-15.3%)
|
|
|
Number of FTEs in the fishing fleet
STECF 25-07 raw data set (including Greece)
|
105,103
|
Not defined
|
73,974 (2023)
(-29,6%)
|
|
|
Average labour cost per FTE (EUR) - proxy for wages
STECF 25-07
|
27,500
|
+125% (2022)
|
29,400 (2023)
+7%
|
|
|
Average age of fishers
STECF 25-13 (ASOR)
|
/
|
Not defined
|
-4.1% (25-39)
-1.6% (15-24)
+3.5% (40-64)
+2.1% (65+)
|
|
|
Total employment in aquaculture
STECF 24-14
|
72,183 (2016)
|
Not defined
|
72,798 (2022)
|
|
|
Number of FTEs in aquaculture
STECF 24-14
|
40,881 (2016)
|
Not defined
|
40,727 (2022)
|
|
|
Average wage of aquaculture workers (EUR)
STECF 24-14 (datasets)
|
24,070 (2013)
|
Not defined
|
25,800 (2022)
+ 7%
|
|
|
Average age of aquaculture workers
STECF 25-13 (ASOR)
|
No baseline
|
Not defined
|
7% (15-24)
31% (25-39)
57% (40-64)
|
|
|
Total employment for processing sector
STECF 25-15
|
101,185
|
Increase
|
110,879 (2023)
+9.5%
|
|
|
Number of FTEs in the processing sector
STECF 25-15
|
91,231
|
Not defined
|
102,354 (2023)
+10.9%
|
|
|
Average wage of processing workers (EUR)
STECF 25-15
|
26,100
|
Not defined
|
32,600 (2023)
|
|
|
Nr of fatal and non-fatal accidents in the fishing fleet EMSA data in STECF 25-13 (ASOR)
|
~450
|
Expected decrease
|
~650 (2023)
(+44%)
|
|
|
Nr of fatal and non-fatal accidents in fisheries and aquaculture (Eurostat)
|
/
|
Expected decrease
|
-33.3% (2014- 2022)
|
|
# 6 A clear and efficient governance allows for the objectives of the CFP Regulation to be fulfilled
|
N° of delegated acts
|
0
|
Not defined
|
131 (2025)
|
|
|
N° of Advisory Councils (ACs)
|
7
|
Not defined
|
11
|
|
|
N° of AC recommendations
|
59
|
Not defined
|
110 (2024)
|
|
Management types
|
Fish stocks per type of management (n° and %)
|
EU only: 221 (78%)
Shared: 34 (12%)
RFMO: 26 (9%)
SFPA: -
|
Not defined
|
Shared: 136 (45%)
SFPA: 68 (22%)
EU only: 67 (22%)
RFMO: 36 (12%)
|
|
|
Landings per type of management
Volume in thousands of tonnes (KT)
Value in billions of EUR
|
EU only:
4061 KT, 5.7 B€
RFMO:
599 KT, 1.2B€
SFPA:
364 KT, 0.4B€
Shared:
156 KT, 0.2 B€
|
Not defined
|
Shared:
1518 KT, 2B€
EU only:
1059 KT, 3B€
RFMO:
572 KT, 1B€
SFPA:
191 KT, 0.3B€
|
|
|
N° of fisheries management plans
|
22 (LTMPs)
|
Expected decrease
|
4 (MAPs)
|
|
Data collection – regional dimension
|
Nr of coordinated surveys at sea
|
48
|
Not defined
|
60 (2024)
|
|
|
Number of agreements coordinated among different Member States in the same region
|
33
|
Not defined
|
25 (2024)
|
|
|
Number of agreements and decisions of regional coordination groups
|
21
|
Not defined
|
84 (2024)
|
|
|
Nr of Regional Work Plans
|
0
|
Not defined
|
6 (2024)
|
|
Data collection – update by end users of DCF data
|
Nr of data calls issued by end user
|
19
|
Not defined
|
185 (2024)
|
|
|
Nr of STECF, ICES, RFMOs WG reports using DCF data
|
64
|
Not defined
|
112 (2024)
|
|
|
Nr of stocks under Management Strategy Evaluation
|
1
|
Not defined
|
26 (2024)
|
|
|
N° of EU infringement cases
|
No baseline
|
Not defined
|
27 over the period
|
|
|
N° of EU non-compliance cases by Member States
|
No baseline
|
Not defined
|
245 over the period
|
|
|
N° of vessels covered with VMS
|
No baseline
|
Not defined
|
96% of vessels over 15 meters
48% of vessels between 12-15 meters
|
|
# 7 The EU is leading by example in promoting sustainable fisheries practices internationally, making the CFP Regulation’s benefits extend beyond the Union
|
Performance reviews undertaken in RFMOs
|
2 (up until 2014)
|
Not defined
|
9 (since 2015 included)
|
|
|
Number of stocks at sustainable levels
|
For tunas (2014): F<FMSY = 43%
B>BMSY = 52%
|
Not defined
|
For tunas (2024): F<FMSY = 87%
B>BMSY = 65%
|
|
|
Share of catches deriving from sustainable stocks
|
For tunas (2014): 69%
|
Not defined
|
For tunas (2024): 88%
|
|
|
EU voluntary contributions to RFMOs
|
/
|
Not defined
|
98 M€ (2014-2024)
|
|
|
EU Membership in RFMO/As
|
14
|
Not defined
|
17
|
|
|
N° of SFPAs
|
15
|
Not defined
|
14 (2024)
|
|
|
SFPA sectoral support contribution (in €) towards sustainable fisheries management in third partner countries
|
11,3M
|
Not defined
|
21,1M (2024)
|


