 EUROPEAN COMMISSION
Brussels, 23.9.2022
SWD(2022) 307 final
COMMISSION STAFF WORKING DOCUMENT
Statistical evaluation of irregularities reported for 2021: own resources, agriculture, cohesion and fisheries policies, pre-accession and direct expenditure
Accompanying the document
COMMISSION REPORT TO THE COUNCIL AND THE EUROPEAN PARLIAMENT
33rd Annual Report on the protection of the European Union's financial interests and the fight against fraud - 2021
{COM(2022) 482 final} - {SWD(2022) 302 final} - {SWD(2022) 303 final} - {SWD(2022) 304 final} - {SWD(2022) 305 final} - {SWD(2022) 306 final}
Contents
List of abbreviations
1.INTRODUCTION
1.1.Scope of the document
1.1.Structure of the document
2.TRADITIONAL OWN RESOURCES
Executive summary
2.1.Introduction
2.2.General analysis –Trend analysis
2.2.1.Reporting years 2017-2021
2.2.2.OWNRES data vs TOR collection
2.2.3.Recovery
2.3.Specific analysis
2.3.1.Cases reported as fraudulent
2.3.2.Cases reported as non-fraudulent
2.3.3.Fraudulent and non-fraudulent cases and COVID-19 related goods
2.4.Member States’ activities
2.4.1.Classification of cases as fraudulent and non-fraudulent and related rates
2.4.2.Recovery rates
2.4.3.Commission’s monitoring
3.COMMON AGRICULTURAL POLICY
Executive summary
3.1.Introduction
3.2.General analysis
3.2.1.Irregularities reported in the years 2017-2021
3.2.2.Irregularities reported as fraudulent
3.2.3.Irregularities not reported as fraudulent
3.3.Specific analysis
3.3.1.Modus operandi
3.3.2.Fraud and Irregularity Detection Rates (FDR and IDR) by CAP components
3.3.3.Market measures – fraudulent and non-fraudulent irregularities
3.3.4.Risk analysis and spontaneous reporting
3.4.Anti-fraud work carried out by the Member States
3.4.1.Duration of irregularities
3.4.2.Detection of irregularities reported as fraudulent by Member State
3.4.3.Fraud and Irregularity Detection by sector and Member State
3.4.4.Follow-up to suspected fraud
3.5.Recovery cases
Main findings
4.COHESION, FISHERIES AND OTHER INTERNAL POLICIES
Executive summary
4.1.Introduction
4.2.General analysis
4.2.1.Irregularities reported as fraudulent
4.2.2.Irregularities not reported as fraudulent
4.2.3.Irregularities reported in relation to the PP 2014-2020: comparison with PP 2007-2013
4.3.Specific analysis
4.3.1.Irregularities by area of the cohesion policy
4.3.2.Irregularities by type
4.4.Risk analysis and spontaneous reporting
4.5.Antifraud and control activities by Member States
4.5.1.Duration of irregularities
4.5.2.Detection of irregularities reported as fraudulent by Member State
4.5.3.Fraud detection rate
4.5.4.Irregularity detection rate
4.5.5.Follow-up to suspected fraud (programming period 2007-2013)
4.6.Other internal policies
Main Findings
5.PRE-ACCESSION POLICY
Executive Summary
5.1.Introduction
5.2.Instruments for Pre-accession Assistance
5.2.1.Before 2007: Pre-accession Assistance (PAA)
5.2.2.2007-2013: The Instrument for Pre-accession Assistance (IPA I)
5.2.3.2014 – 2020: The Instrument for Pre-accession Assistance (IPA II)
5.2.4.2021 – 2027: The Instrument for Pre-accession Assistance (IPA III)
5.3.General analysis
5.4.Pre-accession Assistance (PAA 2000-2006)
5.4.1.Recent trends
5.4.2.Recent trends by component
5.4.3.Recent trends by beneficiary country
5.4.4.Trends since the start of PAA, by beneficiary country and component
5.5.Instrument for Pre-Accession Assistance (IPA I, 2007-2013)
5.5.1.Recent trends
5.5.2.Recent trends by component
5.5.3.Recent trends by beneficiary country
5.5.4.Trends since the start of IPA I, by beneficiary country and component
5.6.Instrument for Pre-accession Assistance II (IPA II 2014-2020)
5.6.1.Recent trends
5.6.2.Recent trends by component
5.6.3.Recent trends by beneficiary country
5.6.4.Trends since the start of IPA II, by beneficiary country and component
6.Direct Management
6.1.Introduction
6.2.General analysis
6.2.1.Five year analysis 2017-2021
6.3.Specific analysis
6.3.1.Recoveries according policy areas
6.3.2.Recoveries according to legal entity residence
6.3.3.Method of detection
6.3.4.Types of irregularity
6.3.5.Recovery
COUNTRY FACTSHEETS
Belgium - Belgique/België
Bulgaria – България
Czech Republic - Česká republika
Denmark – Danmark
Germany – Deutschland
Estonia – Eesti
Ireland – Éire
Greece – Ελλάδα
Spain – España
France
Croatia – Hrvatska
Italy – Italia
Cyprus – Κύπρος
Latvia – Latvija
Lithuania – Lietuva
Luxembourg
Hungary - Magyarország
Malta
Netherlands - Nederland
Austria – Österreich
Poland – Polska
Portugal
Romania – România
Slovenia – Slovenija
Slovakia – Slovensko
Finland – Suomi-Finland
Sweden – Sverige
ANNEXES
List of abbreviations
|
|
Asylum, Migration and Integration Fund
|
|
|
Common Agricultural Policy
|
|
|
Community Assistance for Reconstruction, Development and Stabilisation
|
|
|
|
|
|
|
|
|
Direct payments to farmers
|
|
|
European Agricultural Fund for Rural Development
|
|
|
European Agricultural Guarantee Fund
|
|
|
European Agricultural Guidance and Guarantee Fund
|
|
|
|
|
|
European Globalisation Adjustment Fund
|
|
|
European Maritime and Fisheries Fund
|
|
|
European Regional Development Fund
|
|
|
|
|
|
European Structural and Investment Funds
|
|
|
|
|
|
|
|
|
Fund for European Aid to the Most Deprived
|
|
|
|
|
|
European Agricultural Guarantee and Guidance Fund – Section Guidance
|
|
|
Pre-accession, Human Resources Development component
|
|
|
Irregularities Detection Rate
|
|
|
Irregularity Management System
|
|
|
Instrument for Pre-accession Assistance
|
|
|
Instrument for Pre-Accession Assistance for Rural Development
|
|
|
|
|
|
Instrument for Structural Policies for Pre-Accession
|
|
|
|
|
|
Pre-Accession Assistance 2000-2006
|
|
|
Pre-accession assistance programme
|
|
|
|
|
|
|
|
|
Pre-accession, Regional Development component
|
|
|
Direct Support to Agriculture
|
|
|
Special Accession Programme for Agricultural and Rural Development
|
|
|
Transition Assistance and Institution Building
|
|
|
Turkey Instrument for Pre-accession Assistance
|
|
|
Traditional Own Resources
|
|
|
Youth Employment Initiative
|
1.INTRODUCTION
1.1.Scope of the document
This document presents a statistical evaluation of the irregularities and fraud detected by the Member States during 2021, in the context of past years and relevant programming periods (PP). It covers both the revenue and expenditure sides of the EU budget. This analysis is based on the notifications provided by national authorities of cases of irregularities and suspected or established fraud. Their reporting is performed in fulfilment of a legal obligation enshrined in sectoral European legislation. The document accompanies the Annual Report adopted on the basis of article 325(5) of the Treaty on the Functioning of the European Union (TFEU), according to which “The Commission, in cooperation with Member States, shall each year submit to the European Parliament and to the Council a report on the measures taken for the implementation of this article”. Therefore, this document should be regarded as an analysis of the achievements of the Member States, in terms of detection and reporting.
The methodology (including the definition of terms and indicators), the data sources and the data capture systems are explained in detail in the Commission Staff Working Document – Methodology for the Statistical Evaluation of Irregularities accompanying the Annual Report on the Protection of the EU financial interests for the year 2015.
1.1.Structure of the document
The present document includes an analysis of the irregularities reported in the area of traditional own resources (revenue), as well as an analysis of the irregularities reported for expenditure (Common Agricultural Policy, cohesion policy, fisheries and other internal policies; the pre-accession policy and direct management).
The document is completed by 27 country factsheets, which summarise, for each Member State, the main indicators and information on the detection of irregularities and fraud.
Several annexes complement the information and data, providing a global overview of the irregularities reported according to the relevant sector regulations. Annexes 1 to 11 concern Traditional Own Resources, Annexes 12 to 14 complement information on the methodology for the analysis of irregularities concerning expenditure, Annex 15 covers all the expenditure sectors for which Member States and beneficiary countries have a reporting obligation.
2.TRADITIONAL OWN RESOURCES
Executive summary
In 2021, the COVID-19 pandemic continued to affect the lives of all individuals and businesses in the EU. Looking back, in 2020 the pandemic was experienced as an emergency, while in 2021 it became part and parcel of life. Import figures for 2021 are proof of this. After the sharp 11.6% decrease in EU-27 imports in 2020, they increased by 23% in 2021.
In 2021, the number of fraudulent and non-fraudulent irregularities related to TOR remained quite stable, the related amount of TOR increased and was the highest amount detected during the last 5 years. For both fraudulent and non-fraudulent irregularities, the amount of TOR detected increased compared to the five-year average, by 32% and 13% respectively. In total, the TOR amount increased by 18% in 2021 compared to the average for 2017-2021.
In comparison, the number of fraudulent and non-fraudulent irregularities related to TOR decreased by 3% compared to the five-year average. The number of fraudulent irregularities increased by 1 % and non-fraudulent irregularities decreased by 4%.
Of all fraudulent and non-fraudulent irregularities detected in 2021, 12% were classified as fraudulent.
National anti-fraud services, together with customs release controls, played a key role in detecting fraudulent irregularities in 2021. Inspections by anti-fraud services, the most successful method way of detecting fraudulent irregularities, surpassed post-release controls and release controls in detecting fraudulent duty evasion.
Non-fraudulent irregularities were primarily detected by means of post-release controls.
Most cases reported in 2021 as fraudulent and non-fraudulent related to undervaluation, incorrect origin or classification/misdescription of goods. Smuggling remains one of the main fraudulent irregularities. Textiles, electrical machinery and equipment were the types of goods most affected by fraud and irregularities in number of cases and in monetary terms, followed by miscellaneous chemical products, footwear and tobacco most affected in terms of amounts and by vehicles and plastics in terms of number of cases. In 2021 China remained the most important country of origin of goods affected by irregularities reported as fraudulent or non-fraudulent.
For COVID-19-related goods, in 2021, a notable increase in the amounts reported as irregular was observed for goods such as disinfectants and sterilisation products, protective garments and medical consumables. However, analysis shows that the impact of irregularities affecting COVID-19-related goods remained relatively low in 2021 (4% of the total number of irregularities reported in 2021 and 6% of the related amounts).
In 2021, the Commission continued, on-the-spot or remotely, its monitoring and control visits to ensure the correct application of EU customs and TOR legislation. Where cooperation and progress made in tackling outstanding issues are considered insufficient, corrective measures are being applied.
As the 2020 PIF report states, such corrective measures have already been applied by the Commission against the UK for undervalued textiles and footwear from China (Snapshot 1). On 8 March 2022, the CJEU issued its ruling in related Case C-213/19 against the UK. The Commission is in the process of analysing the implications of that CJEU ruling both for the UK (e.g. re-calculation of TOR losses) and for the Member States.
The Commission also quantified potential TOR losses with regard to the evasion of anti-dumping duties for solar panels and informed the EU Member States concerned.
2.1.Introduction
The technical explanations and the statistical approach are explained in the accompanying document ‘Methodology regarding the statistical evaluation of reported irregularities for 2015’
. In summary, the statistics for the 2021 PIF report were prepared based on the total established and estimated amount of TOR as reported in OWNRES. Recovery figures are based only on established amounts.
For comparability with previous years, the analysis for this report was carried out based on the figures obtained for the EU of 27 Member States
. The UK figures can nevertheless be found in the annexes.
The following analysis, based on the data available on the cut-off date (15 March 2022), aims to provide an overview of the reported cases of fraud and irregularities reported for 2021 together with their financial impact.
2.2.General analysis –Trend analysis
2.2.1.Reporting years 2017-2021
The number of cases reported in OWNRES for 2021 (3 988) is about 3 % lower than the average number of cases of irregularities reported for the 2017-2021 period (4 131).
The total estimated and established amount of TOR involved (EUR 524 million) is about 18 % higher than the average estimated and established amount for the years 2017-2021 (EUR 443 million).
In 2021, eight big
cases for a total amount of about EUR 122 million
were reported compared to 2020, when five big cases for a total amount of about EUR 67 million affected the total estimated and established amount.
CHART TOR1: Total number of OWNRES cases and the related estimated and established amount (2017-2021)

Annex 1 of the summary tables shows the situation on the cut-off date (15 March 2022) for the years 2017-2021.
2.2.1.1.Irregularities reported as fraudulent
The number of cases reported as fraudulent registered in OWNRES for 2021 (482) is currently 1% higher than the average number of cases reported for the 2017-2021 period (478).
The total estimated and established amount of TOR involved (EUR 157 million) represents an increase of 32% of the average estimated and established amount for the years 2017-2021- (EUR 119 million).
For 2021, Luxemburg, Finland and Sweden did not communicate any fraudulent case exceeding an amount of EUR 10 000.
CHART TOR2: OWNRES cases reported as fraudulent and the related estimated and established amount (2017-2021)

On the cut-off date (15 March 2022), 12% of all cases detected in 2021 were classified as fraudulent. The percentage had remained stable since 2020 (12%).
Annex 2 of the summary tables shows the situation on the cut-off date for the years 2017-2021.
2.2.1.2. Irregularities not reported as fraudulent
At the same time, the number of cases not reported as fraudulent communicated via OWNRES for 2021 (3 506) was 4% lower than the average number reported for 2017-2021 (3 653).
The total estimated and established amount of TOR (EUR 367 million) was 13% higher than the average estimated and established amount for the years 2017-2021 (EUR 324 million).
Cyprus did not report any case of irregularity exceeding an amount of EUR 10 000 for 2021.
CHART TOR3: OWNRES cases not reported as fraudulent and the related estimated and established amount (2017-2021)

Annex 3 of the summary tables shows the situation on the cut-off date for years 2017-2021.
2.2.2.OWNRES data vs TOR collection
In 2021, the total established amount of TOR (gross) was EUR 25.2 billion and about 98% was duly recovered and made available to the Commission through the A-account
. According to the OWNRES data, around EUR 524 million has been established or estimated by the Member States in connection with cases reported as fraudulent/non-fraudulent where the amount at stake exceeds EUR 10 000.
The total estimated and established amount reported in OWNRES represents 2.11% of total collected TOR (gross) amount in 2021
. This detection rate has increased compared to 2020, when it was 1.95%
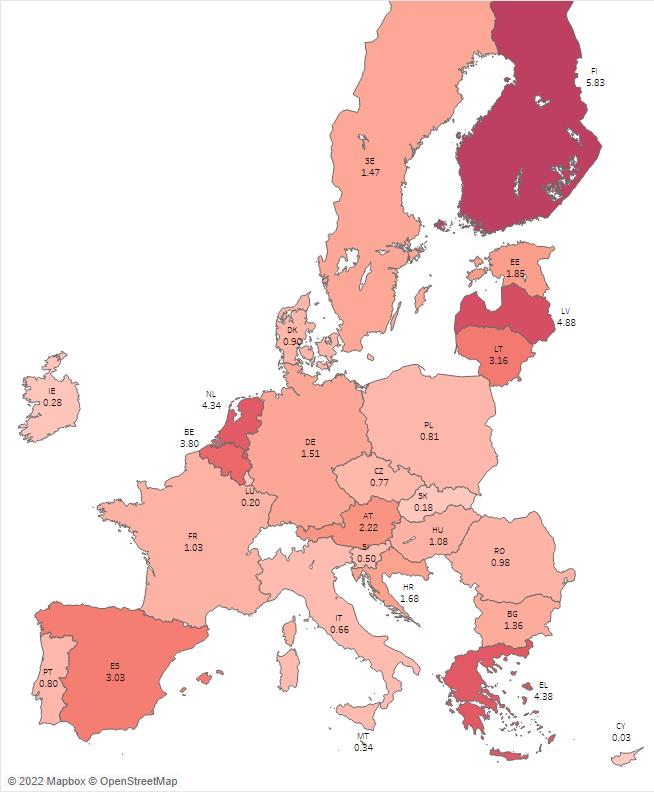
. A percentage of 2.11 % indicates that of every EUR 100 of TOR (gross) established and collected, an amount of EUR 2.11 is registered as irregular (fraudulent or non-fraudulent) in OWNRES. There are differences among the Member States. In eight Member States
, the percentage is above the average of 2.11 %. The highest percentages for 2021 can be seen in Finland, Latvia, Greece, the Netherlands and Belgium, with 5.38 %, 4.88 %, 4.38 %, 4.34 % and 3.8 % respectively.
For the seven Member States
that established and made available most TOR amounts, the average percentage of the estimated and established OWNRES amounts of TOR for 2021 was equal to 2.28%. Compared to the previous year (1.91%), this represents an increase of 0.37%. For the Netherlands, the proportion of estimated and established OWNRES amounts of TOR increased in 2021 from 0.79% to 4.34% compared to 2020, while for Belgium, Spain and Italy, it increased by 1.46%, 0.72% and 0.28% respectively. For the other three Member States
, the average proportion of estimated and established OWNRES amounts of TOR decreased in 2021 (1.27 %) compared to the previous year (2.64%).
TOR MAP1: Showing the percentage of estimated and established amount in OWNRES of established TOR for 2021
2.2.2.1. Detection rates in the COVID year 2021
Whereas the variation in the total number of cases reported as fraudulent or non-fraudulent in 2021 was within the usual range of the annual fluctuation, the related amounts increased considerably in 2021, leading to a higher overall detection rate in 2021 than in 2020.
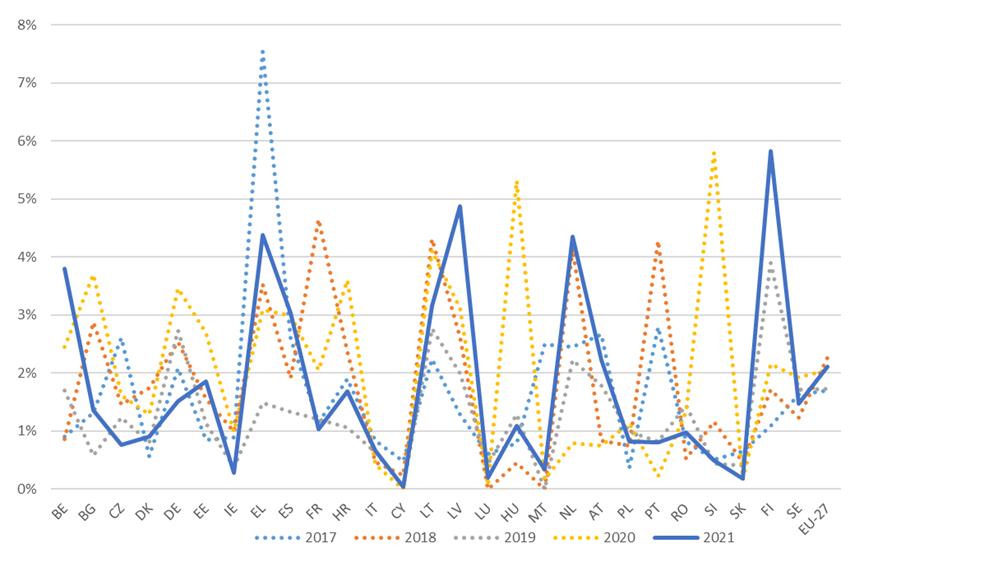
Chart TOR4 shows the variation in the annual detection rate
for each Member State in 2017-2021. Bearing in mind that a number of variable factors can affect national detection rates and that customs controls had to be performed under pandemic conditions in many cases in 2021, the overall detection rate was still the second highest in 2021 during the last 5 years. The 2021 detection rates
for Belgium, Greece, Spain, Latvia, Lithuania, the Netherlands, Austria and Finland were above the EU average. This makes it hard to say how much the detection rates are affected by the pandemic, changes in import volumes, fraud patterns or national customs control strategies.
Chart TOR4: Detection rates 2017-2021 per Member State
2.2.3.Recovery
The cases of fraud and irregularities detected in 2021 correspond to an established amount of EUR 479 million
. Nearly EUR 216 million of this was recovered in cases where there was an irregularity and EUR 24 million in fraudulent cases
. In total EUR 240 million was recovered by all Member States for all cases detected in 2021. In absolute figures, Germany recovered the highest amount in 2021 (EUR 74 million), followed by Spain (EUR 47 million) and the Netherlands (EUR 43 million). This is a starting point for recovery. Analysis shows that lengthy recovery procedures spread over several years are usually required due to administrative and judicial procedures in complex cases or cases with a huge financial impact.
Member States also continued their recovery actions for the detected cases of previous years.
2.2.3.1. Recovery rates
Over the past 5 years the annual recovery rate has varied between 50% and 77% (CHART TOR5). The recovery rate for cases reported in 2021 is currently 50%
. In other words, out of every amount over EUR 10 000 of duties established and reported for 2021 in OWNRES as irregular/fraudulent, approximately EUR 5 000 has already been recovered.
CHART TOR5: Annual recovery rates (2017-2021)

The overall recovery rate is a correlation between the detection, the established amount and the current recovery stage of individual cases (high additional duty claims are more frequently associated with lengthy administrative and criminal procedures).
Recovery rates vary among the Member States. In seven Member States, the entire established amount has already been recovered
and in another four Member States the recovery rates are above 90%. In Czechia the recovery rate is 99%, in Denmark 99%, in Germany 96% and in Sweden 95%. Differences in recovery rates may be due to factors such as the type of fraud or irregularity, or the type of debtor involved. Because recovery is ongoing, it can be expected that the recovery rate for 2021 will also go up in the future.
On the cut-off date (15 March 2022), the overall recovery rate for all years 1989-2021 was 64%.
2.3.Specific analysis
2.3.1.Cases reported as fraudulent
2.3.1.1. Modus operandi
A breakdown by type of fraud shows that most fraudulent cases in 2021 relate to incorrect declarations (incorrect classification, value, country of origin or use of preferential arrangements) and formal shortcomings (e.g. failure to observe customs procedures). Smuggling as a fraud mechanism ranked second place in 2021.
In 2021, the customs procedure ‘release for free circulation’ remained the procedure most vulnerable to fraud (71% of the number of cases and 81% of the estimated and established amount)
. A total of 10% of all cases reported as fraudulent and 12% of all estimated and established amounts in OWNRES cases registered as fraudulent for 2021 fall into the category ‘Other’
, whereas 14% of all cases reported as fraudulent and 4% of all estimated and established amounts involve the customs warehouse procedure.
Of all cases reported as fraudulent, about 76% concern goods such as tobacco, vehicles, textiles, footwear, meat and meat products, articles of leather, iron, steel and aluminium. In monetary terms, these groups of goods represent about 93% of all amounts estimated and established for cases reported as fraudulent. China, Brazil, the United Arab Emirates, Belarus, Turkey, the United States and Russia are the main – in monetary terms – reported countries of origin of goods affected by fraud.
2.3.1.2. Method of detection of fraudulent cases
In 2021
, inspections by anti-fraud services (38%) and customs controls carried out at the time of the release of goods (37%) were the most successful way of detecting fraudulent cases, followed by post-release controls (19%).
CHART TOR6: Method of detection 2021 – Cases reported as fraudulent – by number of cases

In monetary terms, of the fraudulent cases registered for 2021, involving EUR 157 million in estimated or established amounts, around 60% were detected during an inspection by anti-fraud services, 24% during a post-release control and 13 % during a control at the time of the release of the goods.
CHART TOR6: Method of detection 2021 – Cases reported as fraudulent – by estimated and established amount

In six Member States, more than 50% of all estimated and established amounts in fraudulent cases were detected by anti-fraud services
. As regards amounts, controls at the time of the release of goods were the method most used to detect fraud in Czechia, Denmark, Estonia, Greece, Croatia, Latvia, Austria, Poland, Slovenia and Slovakia, whereas post-release controls were the method most used in Bulgaria, Spain, Cyprus, Hungary, the Netherlands and Portugal.
In Denmark, 48% of all estimated and established amounts in fraudulent cases were declared voluntarily.
2.3.1.3. Smuggled cigarettes
In 2021, there were 115 cases of smuggled cigarettes registered (CN code
24 02 20 90) involving estimated TOR of around EUR 30 million. In 2020, the number of cases of smuggled cigarettes was 124, totalling around EUR 21 million of TOR.
The highest number of cases was reported by Lithuania (46), Poland (18) Belgium (11), and France (10). The highest amount was reported by Greece (EUR 9 million) and Italy (EUR 8 million), followed by Belgium (EUR 5 million). No cases were reported by 14 Member States
.
Table TOR1: Cases of smuggled cigarettes in 2021

2.3.1.4. Textiles
In 2021, textiles were the goods most vulnerable to fraudulent irregularities in monetary terms. In total 65 cases were reported, amounting to EUR 42 million. Undervaluation was the main type of irregularity. France, Bulgaria and Belgium were particularly affected by fraud, with five other Member States only marginally affected. Anti-fraud services detected most of the cases.
2.3.1.5. Cases reported as fraudulent by amount
In 2021, the estimated and established amount was below EUR 100 000 in 345 cases reported as fraudulent (72% of all fraud cases), whereas it was above EUR 100 000 in 137 cases (28%).
The total estimated and established amount in cases reported as fraudulent, where the amount at stake was above EUR 100 000, was EUR 147 million (94% of the total estimated and established amount for cases reported as fraudulent).
Table TOR2: Cases reported as fraudulent by amount category in 2021

2.3.2.Cases reported as non-fraudulent
2.3.2.1.Working method
A breakdown of fraud by type shows that most cases of fraud relate to classification/misdescription. Incorrect value, incorrect use of preferential arrangements, and irregularities related to the transit procedure are also frequently mentioned.
Not all customs procedures are equally vulnerable to irregularities; their vulnerability may change over time as certain economic sectors are briefly targeted. The customs procedure ‘release for free circulation’ is the customs procedure most affected by irregularities. This is because at the time of release for free circulation, non-compliance in the customs declaration may relate to a large number of irregularities, e.g. the tariff, the CN code, (preferential) origin, incorrect value, etc. On the other hand, in customs suspension procedures (such as warehousing, transit, inward processing, etc. – where the payment of duties is suspended) the sole irregularity that might occur is the subtraction of the goods in question from customs supervision. It is therefore normal, and to be expected, that most fraud and irregularities are reported in connection with the procedure ‘release for free circulation’.
In 2021 most of the estimated and established amounts in OWNRES for cases reported as non-fraudulent related to the customs procedure ‘release for free circulation’ (84%)
. A total of 6% of all estimated and established amounts in OWNRES registered as non-fraudulent for 2021 fall into the category ‘Other’
.
Of all cases reported as non-fraudulent, about 60% concern textiles, electrical machinery and equipment, vehicles, plastics, textiles, mechanical machinery and appliances, articles of iron and steel, footwear, organic chemicals and chemical products. In monetary terms these groups of goods represent about 73% of all amounts estimated or established for cases reported as non-fraudulent. China, the United States, Japan, India, Russia, Turkey and Taiwan are – in monetary terms – the main reported countries of origin of goods affected by irregularities.
2.3.2.2. Method of detection of non-fraudulent cases
In 2021, most non-fraudulent cases (55%) were detected during post-release customs controls. Other frequently used methods of detection of non-fraudulent cases were release controls (20%), voluntary admission (13%), inspections by anti-fraud services (5%) and tax audits (5%).
CHART TOR8: Method of detection 2021 – Cases not reported as fraudulent – by number of cases

As regards the estimated or established amounts, around 55% of all irregularities not reported as fraudulent registered for 2021 were detected during a post-release control, 19% during a control at the time of the release of the goods, 12% by voluntary admission, 9% during a tax audit and 5% during an inspection by anti-fraud services.
CHART TOR9: Method of detection 2021 – Cases not reported as fraudulent – by estimated and established amounts

In 13 Member States, more than 50% of all non-fraudulent cases — in amounts — were detected during post-release controls
, whereas in Belgium, Denmark, Luxembourg and Slovakia they were detected during release controls. In Greece, Portugal and Romania more than 50% of the amounts relating to non-fraudulent cases were detected by anti-fraud services. In Finland, 69% of all amounts reported in non-fraudulent cases were reported as voluntary admission.
In thirteen Member States voluntary admission was mentioned as a method of detection of cases reported as non-fraudulent
, with the highest amounts reported by Germany (EUR 15 million), Finland (EUR 8 million) and Spain (EUR 7 million).
2.3.2.3. Electrical machinery and equipment vulnerable to irregularities
In 2021, electrical machinery and equipment (mostly solar panels) were more vulnerable to non-fraudulent reported irregularities in monetary terms than other goods. About 18% (EUR 66 million) of the total amount established in non-fraudulent irregularities concerned this type of good. Of 18 Member States, the Netherlands reported the highest figure (63 cases totalling EUR 45 million). Incorrect classification/misdescription and incorrect value were the prevailing types of irregularity. Post-release controls were the most frequent type of check leading to the detection of irregularities in declarations of imported goods.
2.3.2.4. Cases not reported as fraudulent by amount
In 2021, the estimated and established amount was below EUR 100 000 in 3 088 non-fraudulent cases (88%), whereas it was above EUR 100 000 in 418 cases (12%).
The total estimated and established amount in non-fraudulent cases where the amount at stake was above EUR 100 000 amounted to EUR 286 million (78% of the total estimated and established amount for non-fraudulent cases).
Table TOR3: Cases not reported as fraudulent by amount category in 2021

2.3.3.Fraudulent and non-fraudulent cases and COVID-19 related goods
In 2021, imports of COVID-19-related goods continued to increase compared to 2019, but more slowly than in 2020.
Analysis of the fraudulent and non-fraudulent irregularities detected in connection with COVID-19 related-goods
over the 2017-2021 period shows that the total number of cases (191) detected in 2021 was only 6% higher than the average for the last 5 years (181). However, the related TOR amount (EUR 31 million) doubled in 2021 compared to the average for the years 2017-2021 (EUR 15 million).
The impact of irregularities affecting COVID-19-related goods, typically low, remained relatively low in 2021 (5% of the total number of irregularities reported in 2021 and 6% of the related amounts).
CHART TOR10: Cases related to COVID-19 goods reported as irregular and the related estimated and established amount (2017-2021)

Germany reported the highest number of cases (77). Belgium and Finland reported related amounts of EUR 9.5 million and EUR 8 million respectively. Thirteen other Member States were concerned to a lesser extent. The predominant types of working method were incorrect value and classification/misdescription. Errors in estimating customs duties were also found.
A notable increase in the amounts reported as irregular was observed in 2021, in particular for goods such as protective garments (gloves, boot covers, overshoes etc.), disinfectants and sterilisation products and medical consumables.
CHART TOR11: Cases related to COVID-19 goods reported as irregular and the related estimated and established amount (2019-2021)

2.4.Member States’ activities
2.4.1.Classification of cases as fraudulent and non-fraudulent and related rates
For 2021, Member States reported 482 cases as fraudulent out of a total of3 988 cases reported in OWNRES, indicating a fraud frequency level (FFL) of 12%. The differences between Member States are relatively large. In 2021, 11 Member States categorised between 10% and 50% of all cases reported as fraudulent. However, Luxembourg, Malta, Finland and Sweden did not categorise any cases reported as fraudulent. Eight Member States categorised less than 10% of cases as fraudulent
. Four Member States registered more than 50%
of cases as fraudulent.
In 2021, the total estimated and established amount affected by fraud in the EU was EUR 157 million and the overall incidence of fraud
was 0.63%. For 2021, the highest percentages are in Greece (3.5%), Belgium (3.3%) and Lithuania (2.34%)
.
The total estimated and established amount affected by cases not reported as fraudulent was nearly EUR 367 million, indicating a non-fraudulent irregularity incidence
of 1.48%. The highest percentages are in Finland (5.85%), the Netherlands (3.98%), Latvia (3.56%) and Spain (2.15%)
.
There are large differences between Member States’ classifications, partly due to their classification practices. This can affect the comparison of the amounts involved in cases reported as fraudulent and as non-fraudulent by Member States. Moreover, individual bigger cases detected in a specific year may significantly affect annual rates. Factors such as the type of traffic, type of trade, economic operators’ level of compliance, and a Member State’s location can significantly affect the rates. Bearing these in mind these, the rates of incidence can also be affected by how a Member State’s customs control strategy is set up to target risky imports and detect TOR-related fraud and irregularities.
2.4.2.Recovery rates
2.4.2.1. Cases reported as fraudulent
Over the 1989-2021 period, OWNRES shows that, on average, 22% of the initially established amount was corrected (cancelled). The recovery rate for all years (1989-2021) is 40%
. The rate for cases reported as fraudulent and detected in 2021 is 20%
. The rate for cases reported as fraudulent is in general much lower than for cases not reported as fraudulent.
2.4.2.2. Cases not reported as fraudulent
OWNRES shows that on the cut-off date, on average 27% (1989-2021) of the initially established amount in relation to cases not reported as fraudulent has been corrected (cancelled) since 1989. The recovery rate for non-fraudulent cases reported for 2021 is 60%
. On the cut-off date, the annual recovery rate for the last 5 years had varied between 60% and 88%. The overall recovery rate for all years (1989-2021) for all cases not reported as fraudulent is 76%
.
2.4.2.3. Historical recovery rate (HRR)
The HRR
confirms that in the long term, recovery in cases reported as fraudulent is generally much less successful than in cases not reported as fraudulent (Table TOR4). Classification of a case as fraudulent is therefore a strong indicator for forecasting short- and long-term recovery rates.
Table TOR4: Historical recovery rate (HRR)

2.4.3.Commission’s monitoring
2.4.3.1. Examination of the write-off reports
In 2021, 26 new write-off reports were submitted to the Commission by 9 Member States. The Commission assessed 103 cases totalling EUR 54.8 million in 2021. In 65 of these cases, amounting to EUR 22.5 million
, the Commission's view was that the Member States did not demonstrate satisfactorily that the TOR were lost for reasons not imputable to them, so they were considered financially responsible for the loss. Late payment interest totalling EUR 46 million is also due.
Examination of Member States’ diligence in write-off cases is a very effective way of gauging their recovery activity. It encourages national administrations to step up the regularity, efficiency and effectiveness of their recovery activity, since any lack of diligence leading to failure to recover results in individual Member States having to foot the bill.
2.4.3.2. Commission’s inspections
In its TOR inspections, the Commission focused on Member States’ customs control strategies. The Commission also closely monitors Member States’ actions and their follow-up on observations made during its inspections.
In 2021, Commission services performed TOR inspections (on the spot in Member States or remotely) on: (i) the reliability of the TOR accounts and related statements; (ii) the follow-up on inspections of the customs value control strategy; (iii) the control strategy for anti-dumping and countervailing duties; (iv) the management of the separate account and the corrections of the normal account (refunds of customs duties).
During the inspections carried out in 2021, the Commission identified certain shortcomings in national customs systems. These shortcomings, some of which have a potential financial impact, are being followed up and where the Commission considers that cooperation and progress in tackling outstanding issues are insufficient, it is applying corrective measures.
As the 2020 PIF report states, such corrective measures have already been applied by the Commission against the UK for undervalued textiles and footwear from China (Snapshot 1). On 8 March 2022, the CJEU issued its ruling in related Case C-213/19 against the UK. The Commission is in the process of analysing the implications of that CJEU ruling both for the UK (e.g. re-calculation of TOR losses) and for the Member States.
The Commission also quantified potential TOR losses with regard to the evasion of anti-dumping duties for solar panels and informed the EU Member States concerned.
One general conclusion the Commission has drawn from its inspections in Member States in recent years is that a timely and proactive approach to assessing and monitoring fraud risks is indispensable to effectively protect the EU’s financial interests. This includes using all available sources of information, exchanging information among the services involved and giving prompt feedback on actions taken. Such permanent assessment, exchange of information and monitoring of fraud risks and trends, as well as feedback, is required to fine-tune the measures to be taken and in this way to better protect the EU’s financial interests.
2.4.3.3. Particular cases of Member State failure to recover TOR
If TOR are not established or recovered because of an administrative error by a Member State, the Commission applies the principle of financial liability, making individual Member States responsible for the error. Member States were held financially liable in 2021 for over EUR 86 million, and new cases are being followed up by the Commission.
3.COMMON AGRICULTURAL POLICY
Executive summary
Section 3 analyses fraudulent and non-fraudulent irregularities reported by the Member States to the Commission through the Irregularity Management System. It focuses on the irregularities related to the Common Agricultural Policy, covering support to agriculture (including direct payments to farmers and market measures) and rural development, during the period 2017-2021.
Over the period 2017-2021, the reporting of fraudulent irregularities in relation to rural development increased by 23%. It decreased for the programming period 2007-2013, as expected, and had a slow start for the programming period 2014-2020, which might indicate insufficient detection work in the Member States. The level of fraud detected for support to agriculture was rather stable, even if in 2021 the number of fraudulent iregularities decreased by 17% with respect to 2020.
Over the period 2017-2021, the rural development part of the budget was more affected by fraud than support to agriculture, as a proportion of the payments received by the Member States. However, the incidence of fraud for market measures was even higher than for rural development. Direct aid to farmers accounted for most payments, but the incidence of fraud was low, as it is entitlement-based and there are systems in place to support prevention. Similar patterns applied to non-fraudulent irregularities.
Over the past years, the detection of fraud was concentrated in a few Member States and this was not substantiated by a similar level of concentration in related payments. Differences in the quality of prevention or detection work carried out or different approaches taken to criminal investigation may contribute to this.
Over the period 2017-2021, fraud in support to agriculture most often concerned the documentary proof. Fraudulent irregularities concerning the request were also recurrent. In most cases, these irregularities concerning documentary proof or request were due to falsification. In the case of direct payments, most of these violations were concentrated in two Member States. A wide range of documents and information can be falsified, such as lease agreements, property documents, compliance with the conditionality requirements. Concerning fraud about ‘product, species or land’, over or fictitious declarations were frequently detected. When fraud in support to agriculture concerned the implementation of the action, it was related to market measures, often in combination with other violations. High financial amounts were recorded in several cases investigated by OLAF where conflict of interest was combined with other violations, in relation to the market measure ‘Promotion’. The creation of artificial conditions for the purpose of receiving financial support is a potential risk. For example, beneficiaries may artificially split agricultural holdings and request aid via several linked companies, to avoid degressive aid rates or limits in terms of area or animals.
In terms of rural development fraud, fraudsters mainly used the practice of falsifying documents. For example, this may involve falsifying invoices, declarations of equipment as new while it is second-hand, bids in procurement procedures, or false information provided on compliance with the conditions for receiving the aid. A significant number of fraudulent irregularities concerned failure to fully implement the action. The creation of artificial conditions is a potential risk also for rural development funding.
Concerning market measures, the highest number of fraudulent irregularities concerned national support programmes for the wine sector, in particular investment measures and the restructuring and conversion of vineyards. The highest total financial amounts involved in fraud were related to the fruits and vegetables sector, where fraud most often concerned aid to producer groups for preliminary recognition, both measures concerning formation/administrative operation and measures concerning investment, sometimes together in the same case. The financial amounts involved were high also for the market measure specifically related to the promotion of agricultural products.
With reference to rural development and direct payments to farmers, risk analysis and spontaneous information from civil society, including from the media, have a marginal contribution in detecting fraudulent and non-fraudulent irregularities. In relation to market measures, risk analysis has a stronger role in detection, including because of the risk-based scrutiny of commercial documents of those entities receiving payments.
After about 10 years from initial reporting, the share of cases of suspected fraud that have not led to conviction remains very high, while the share of cases in which fraud is established is low. This may signal the need to invest further in reporting suspected fraud and in the investigation/prosecution phase.
3.1.Introduction
Section 3 presents a statistical evaluation of irregularities and fraud detected by the Member States in 2021 in expenditure under the common agricultural policy (CAP). It provides context to these detections by looking at past years and relevant programming periods (PP). The Member States reported these irregularities and cases of fraud to the Commission through the Irregularity Management System (IMS).
Over the period 2017-2021, the CAP’s overarching objectives were (i) viable food production; (ii) sustainable management of natural resources and climate action; (iii) balanced territorial development. Over 99% of expenditure was disbursed by Member States under shared management.
For the purpose of this analysis, the CAP is split into two main parts:
oSupport to agriculture (SA), by providing direct aid to farmers (DA) and measures to respond to market disturbances (MM), such as private or public storage and export refunds. The European Agricultural Guarantee Fund (EAGF) finances these actions.
oRural development (RD) programmes run by the Member States. The European Agricultural Fund for Rural Development (EAFRD) finances these programmes.
The European Maritime and Fisheries Fund (EMFF) provides funding and technical support to make the fishery industry more sustainable. However, EMFF is analysed together with the other structural funds, as it belongs to the ESIF (European Structural and Investment Funds) family of funding (see Section 4).
Table NR1 below shows the 2021 budget for the CAP, which represents about 33% of the EU budget.

Graph NR1 below shows the relative weight of different components of the CAP on payments and on the financial amounts involved in all CAP irregularities.
In 2021, rural development represented 26% of CAP payments, but 48% of the financial amounts involved in CAP irregularities. This difference in the percentage of payments and the percentage of irregular amounts was even more pronounced for market measures, which accounted for just 5% of payments and 42% of irregularities in terms of financial amounts. Instead, direct aid absorbed most of the CAP payments (70%), but accounted for less than 10% of the irregularities in terms of the financial amounts involved.

The European Commission is responsible for managing the EAGF and the EAFRD. However, the Commission does not pay the beneficiaries itself. Under the principle of shared management, this task is delegated to the Member States, who make the payments via national or regional paying agencies. Before these paying agencies can claim any expenditure from the EU budget, they must be accredited on the basis of a set of criteria laid down by the Commission.
Before making payments, these paying agencies must also, either directly or via delegated bodies, ensure that the aid applications are eligible. The checks they must carry out are laid down in the CAP sectorial regulations and vary from one sector to another. Specific national authorities are competent for rural development operations.
The Commission reimburses the Member States the expenditure made by the paying agencies. EAGF reimbursements are made on a monthly basis and EAFRD on a quarterly basis. Though entitlements and measures supported under the EAGF follow a yearly flow, those under the EAFRD are implemented through multiannual programmes, as action financed by other ESI Funds. In general, reimbursements are subject to possible financial corrections by the Commission, under the clearance of accounts procedures.
This report is structured as follows. Section 3.2 elaborates on general trends, broken down by fraudulent and non-fraudulent irregularities. Section 3.3 details more specific analyses (i) on the types of irregularities; (ii) on the detection rates by CAP component; (iii) on the irregularities affecting market measures; (iv) on risk analysis and spontaneous reporting. Section 3.4 focuses on the anti-fraud activities carried out and results obtained by the Member States, including analysing the fraud and irregularity detection rates (the ratio between the amounts involved in cases reported as fraudulent (FDR) or not reported as fraudulent (IDR) and the payments made during the same period of time).
3.2.General analysis
3.2.1.Irregularities reported in the years 2017-2021
The analysis in Section 3 refers to the EU-27, unless specified otherwise. UK data is added in the tables, as specified, to give a complete picture. However, the accompanying analysis focuses on the current Member States and EU-27 in aggregate. In the whole section, when reference is made to ‘fraudulent’ or ‘fraud’, this includes both ‘suspected fraud’ and ‘established fraud’.
Member States are requested to communicate:
·non-fraudulent irregularities only when they are detected after the expenditure has been introduced in a statement submitted to the Commission. This derogation does not apply to fraudulent irregularities: Member States must always report them.
·fraudulent and non-fraudulent irregularities involving financial amounts above EUR 10 000. From 2017-2021, several Member States also reported several irregularities under this threshold. However, these cases represented only about 1% and 3% of the number of irregularities reported as non-fraudulent and fraudulent, respectively. To use all information reported by the Member States, they are included in the analysis for this section.
3.2.2.Irregularities reported as fraudulent
Table NR2 below provides an overview of the number of irregularities reported as fraudulent by the Member States, broken down by the type of support, from 2017-2021. The number of irregularities found in rural development spending decreased during 2018 and 2019 (by 25%) and then bounced back during 2020 and 2021. As a result, during the overall period 2017-2021, fraudulent irregularities detected and reported for rural development increased by 23%. The irregularities found under support to agriculture were rather stable during 2018-2020. In 2021, there was a decrease of about 17% with respect to the previous year. This pattern resulted in an overall decrease of about 30% for irregularities detected and reported for support to agriculture, during the 5-year period.

The irregularities in rural development expenditure reported for 2017-2021 concerned both PP 2007-2013 and PP 2014-2020. The number of rural development cases related to PP 2007-2013 fell sharply in 2017, which was to be expected, given that the PP closed in 2015. Since then, the number of PP 2007-2013 cases has been rather stable, but still higher than the number of PP 2014-2020 cases. The start of detections related to PP 2014-2020 has been rather slow.
For PP 2014-2020, the slow start of reporting should be closely monitored to ensure it is not due to less of a focus on fraud detection. Graph NR2 below compares the first eight years of PP 2007-2013 (2007-2014) with the first eight years of PP 2014-2020 (2014-2021), in terms of number of non-fraudulent irregularities detected and reported by the Member States. Graph NR3 below extends the comparison to the financial amounts involved. The gap between the two programming periods is clear since the beginning and is significantly increasing.


As shown in Table NR2 above, several irregularities were classified SA/RD, meaning that they were related to both components of the CAP. Basically, in all of these irregularities, irregularities in rural development expenditure were found in combination with irregularities in direct aid to farmers.
The detection of fraudulent irregularities was concentrated in a few Member States. From 2017-2021, the irregularities notified by the top five Member States in terms of cases reported represented about 70% of all irregularities reported as fraudulent (85% of financial amounts). In 2021, this rose to 85%, in terms of number of irregularities and more than 95%, in terms of financial amounts involved.
A deeper analysis of concentration was included in the 2018 PIF Report. That analysis found that the concentration of detections went beyond what could be expected given the level of concentration of payments. This could be due to many different factors, including different underlying levels of irregularities and fraud, differences in the quality of the prevention or detection work or different practices concerning the stage of the procedure when potentially fraudulent irregularities are reported. The concentration of detections was more accentuated for fraudulent rather than for non-fraudulent irregularities. This suggests that different approaches to criminal investigation and prosecution could be an additional and significant factor giving rise to these different levels of detection across the Member States.
The graph attached to Table NR3 below shows the trend of financial amounts involved in irregularities reported as fraudulent. For rural development irregularities, similar to the trend in terms of number of detections, the financial amounts involved fell in 2017. Since then, these financial amounts have been fluctuating around a 5-year average of about EUR 17 million. The trend in the financial amounts involved in support to agriculture was heavily influenced by two cases concerning market measures, worth between EUR 20 and 30 million each, which Poland detected in 2017 and 2018. This is the reason for the much higher financial amounts found over these two years. Excluding these two irregularities, the irregular financial amounts detected in relation to support to agriculture were rather stable, reaching a record low in 2020, but bouncing back to the 5-year average (about EUR 13 million) in 2021.
Over the period 2017-2021, 55% of the irregular financial amounts involved were in support to agriculture irregularities, and 42% were for rural development irregularities. However, over the same period, rural development payments represented just 26% of the CAP budget. Therefore, rural development expenditure was more affected by fraud than support to agriculture expenditure. This is analysed further in Section 3.3.2., through the fraud detection rate, distinguishing between direct aid to farmers and market measures.

An analysis covering the period 2015-2019, included in the 2019 PIF Report, shows that in most fraudulent irregularities, the ‘persons involved’ were legal entities. Most of them were private companies, followed by non-profit organisations, in particular associations. For a significant one third of cases, the ‘persons involved’ were natural persons. Most of the fraudulent irregularities involved a single entity.
3.2.3. Irregularities not reported as fraudulent
Table NR4 below provides an overview of the number of irregularities not reported as fraudulent by the Member States, broken down by the type of support, from 2017-2021. The number of rural development irregularities not reported as fraudulent increased constantly until 2015, in line with implementation of the programmes, while the number of irregularities related to support to agriculture remained stable. Since then, non-fraudulent irregularites in rural development fell sharply until 2017, were rather stable in 2018-2019, and started increasing again in 2020-2021, in line with progress in the implemention of PP 2014‑2020.
Table NR5 below focuses on the financial amounts involved in these irregularities. The irregular financial amounts in rural development also peaked in 2015, then started to fall. This trend reversed in 2020, in line with the increase in the number of detected and reported irregularities during 2020-2021. The irregular financial amounts in support to agriculture fluctuated strongly around an annual average of about EUR 77 million. This was mainly due to the fact that cases involving over EUR 15 million each were reported in 2017 (one case in Romania), 2019 (two cases in Poland) and 2021 (one case in Poland, accounting for nearly EUR 40 million) but none were detected in 2018 and 2020. All of these irregularities were related to interventions in the agricultural markets.
The number of non-fraudulent irregularities in spending on rural development regularly and significantly exceeded the number on support to agriculture, over the entire 2017-2021 period. As a result, the number of irregularities in rural development were over double the number affecting support to agriculture. Non-fradulent irregularities in rural development also exceeded those in support to agriculture in terms of the financial amounts involved, but only by 16%.


Irregularities in rural development spending were found in both PP 2007-2013 and PP 2014-2020. On the one hand, the number of rural development cases related to PP 2007-2013 fell sharply during 2017-2019, which was to be expected, considering that this programming period closed in 2015. Since then, there were still detections of PP 2007-2013 cases and they have been following a stable trend. On the other hand, the Member States started reporting detections related to PP 2014-2020, following an accelerating trend, reflecting progress in the implementation under this programming period.
For PP 2014-2020, the reporting dynamics are broadly in line with those at the start of the previous programming period. Graph NR4 below compares the first eight years of PP 2007-2013 (2007-2014) with the first eight years of PP 2014-2020 (2014-2021), in terms of number of non-fraudulent irregularities detected and reported by the Member States. Graph NR5 below extends the comparison to the financial amounts involved. There is a gap between the two programming periods, but it is much narrower than that related to fraudulent irregularities.


As shown in Table NR4 above, several irregularities were classified as SA/RD, meaning that they were related to both components of the CAP. Basically, in all these cases, irregularities in rural development spending were combined with infringements concerning direct aid to farmers.
3.3.Specific analysis
3.3.1.Modus operandi
3.3.1.1. Support to agriculture
Table NR6 below provides an overview of the most frequent categories (or combinations of categories) of irregularities linked to cases reported as fraudulent in relation to support to agriculture in 2021 and the financial amounts involved. It also gives the figures over the period 2017-2021. In the following paragraphs, the adjective ‘pure’ is used to refer to cases where a specific category of irregularity is not combined with other categories.

The irregularities reported in 2021 mainly concerned the documentary proof. Over the whole period 2017-2021, irregularities concerning the request were also recurrent. Both in relation to direct payments to farmers and market measures, most of these violations concerned falsification. In the case of direct payments, most of these violations were concentrated in two Member States (Romania, for violations concerning the documentary proof, and Italy, for violations concerning the request). A wide range of documents and information can be falsified, such as lease agreements, property documents, compliance with the conditionality requirements.
Over the period 2017-2021, the Member States detected few fraudulent cases of ‘pure’ ‘(non) action’. These cases accounted for the second highest financial amount involved, but this was influenced by one irregularity related to market measures that accounted for more than EUR 20 million (out of EUR 26 million). Nearly all of these ‘pure’ ‘non-action’ violations concerned market measures. In addition, ‘(non-)action’ had a tendency to take place in combination with other violations, concerning for example the documentary proof, the request, ethics and integrity. Also all of these irregularities concerned market measures.
|
Examples of fraudulent irregularities reported as ‘(non-action)’ in relation to market measures
Example 1: The beneficiary submitted an application for support concerning the withdrawal from the market of a specified quantity of a specific agricultural product. These agricultural products should have been transferred to a charitable organisation, but this never took place.
Example 2: The beneficiary received aid for the reduction of milk production, following false declarations about the leasing/sale of part of the cows to other farmers. Actually, there was no reduction in the milk deliveries by the beneficiary. In another case, despite the declaration of reduction of milk production, the milk was still produced on the beneficiary’s farm and delivered to the first purchaser through another person linked to the beneficiary. In another case, there was only a formal relocation of part of the production among members of the same producer group.
|
Irregularities in the category ‘pure’ 'product, species and/or land' were more frequently detected, mostly in relation to direct aid to farmers. The majority of these violations concerned 'overdeclaration and/or declaration of fictitious product, species and/or land'.
|
Examples of fraudulent irregularities reported as ‘overdeclaration and/or declaration of fictitious product, species and/or land’ in relation to direct aid to farmers
Example 1: The beneficiary declared ownership of a plot of land. However, this plot was owned by a public agency.
Example 2: The beneficiary requested direct payments in relation to the use of a number of plots of land. Cross-checks revealed that these plots were declared for payment also by other beneficiaries. In another case, the beneficiary requested aid for plots of land that he had leased to another person. In another case, the beneficiary requested aid in relation to land he was not using. The lease agreement submitted with the application did not match with the contract submitted by the lessor at the request of the paying agency. In another case, the leasee did not carry out the agricultural activities he was supposed to carry out on the declared land. The application had been made just to obtain the subsidies, which were transferred to the lessor, who was the legal representative of the leasee.
|
Over the whole period 2017-2021, 22 irregularities were reported in the category ‘pure’ 'ethics and integrity'. All of these irregularities were communicated by Poland and were not reported under the types 'conflict of interest', 'bribery' or 'corruption', but as 'other irregularities concerning ethics and integrity'. Most concerned the creation of artificial conditions for receiving financial support and direct aid to farmers. For example, beneficiaries may artificially split agricultural holdings and request aid through several linked companies, to avoid degressive aid rates or limits in terms of area or animals. Other Member States may have reported this type of infringement under other categories. Two irregularities concerned instead market measures and they involved the highest financial amounts. One of these irregularities included overstating costs for assets transferred among members of the same group of producers.
|
Examples of fraudulent irregularities related to the creation of artificial conditions
Example 1: The beneficiary submitted several applications as a natural person and as manager of a number of companies. There were personal and family links between the beneficiary and the other entities applying for payments. This was meant to circumvent rules about degressive rates of support.
Example 2: The beneficiary established legal entities with personal, capital, family and business links, to obtain direct payments exceeding the maximum ceilings per beneficiary.
|
High average financial amounts (about EUR 1.8 million) were recorded in several cases of conflict of interests combined with other violations (8 irregularities). In 2019, Czechia reported two irregularities related to corruption, in combination with public procurement infringements (conflict of interests) and failure to implement the action. In five irregularities reported by Bulgaria in 2018, conflict of interests was combined with violations concerning the ‘beneficiary’ (mostly not having the required quality) and ‘(non) action’ (infringements relating to the cofinancing system). In another case detected in Bulgaria, a conflict of interests was combined with violations concerning the ‘beneficiary’ (not having the required quality) and ‘accounts & records’ (revenues not declared). All of these eight irregularities were related to the market measure ‘promotion’ (see Section 3.3.3) and were investigated by OLAF. The investigations uncovered complex fraudulent schemes, mainly based on price inflation, kickback payments and money laundering. The public procurement procedures were breached through a solid network of companies based in different countries. In some cases, the manipulation was possible also due to the collusion of the beneficiaries.
Table NR7 below provides an overview of the most frequent categories (or combinations of categories) of irregularities linked to cases not reported as fraudulent in support to agriculture expenditure in 2021 and the financial amounts involved. It also gives the total for these categories (or combinations of categories) for the period 2017-2021.
Irregularities due only to the 'request' (pure) were by far the most recurrent category during 2017-2021, most of the times related to direct payments to farmes. However, during the last year, violations concerning the category 'documentary proof' were the most frequent, with a significant increase compared with the previous four years.
Concerning the category ‘request’ in relation to direct payments to farmers, during 2017-2021, the most recurrent type of violation by far was 'false or falsified request for aid', followed by 'incorrect or incomplete request for aid'. This rate of irregularities related to falsification would not be expected for non-fraudulent irregularities. During 2021, about one third of the violations concernig the request in support to agriculture were related to market measures, which was much more than before. In general, when violations concerning the request concerned market measure, the specific infringement was about 'product, species, project and/or activity not eligible for aid'.
Concerning the category ‘documentary proof’, more than half of this type of violations reported during the past five years have been detected in 2021, with a three-fold increase compared to 2020, which had already doubled the detections from 2019. The vast majority of these infrigements reported in 2021 were detected in Greece in relation to direct payments to farmers and concerned documents that were incomplete or incorrect. During 2017-2021, the violations related to direct payments to farmers were still the majority, but the infringement related to market measures were more recurrent than during 2021. In general, during 2017-2021, there were a few cases related to false or falsified documents, which would not be expected for non-fraudulent irregularities.

During 2017-2021, the highest irregular financial amounts were due to infringements concerning ‘(non) action’. The vast majority of these irregularities were related to market measures. About 27% of the irregular financial amounts reported over the past five years for ‘(non) action’ were due to two irregularities related to market measures, totalling about EUR 36 million. Focusing on the irregularities related to market measures, the highest financial amounts were involved in cases where the action was not implemented and in cases where the beneficiary carried out an operation that was prohibited during the measure. The most reported violations were about actions not implemented or not completed. Focusing on the irregularities related to direct payments to farmers, the financial amounts involved were low and most of the violation concerned the action not implemented or not completed.
During the last year, the financial amounts related to violations concerning the category 'beneficiary' were the highest, with a significant increase compared with the previous four years. The high financial amounts concerned irregularities related to market measures. The vast majority of violations were instead related to direct payments to farmers and were about 'operator/beneficiary not having the required quality'. However, this prevalence in terms of numbers is less significant if also irregularities are considered where these violations were combined with other infringements, especially concerning ‘(non‑)action’, which were basically always related to market measures. Concerning irregularities related to market measures, half of the ‘pure’ ‘beneficiary’ cases and basically all of the cases where there is a combination of other types of infringements concerned 'operator/beneficiary not having the required quality'.
Other recurrent categories of irregularities in support to agriculture expenditure not reported as fraudulent were related to 'product, species and/or land', or 'ethics and integrity' (not combined with other categories of irregularity). The majority of the violations concerning 'product, species and/or land' were related to direct payments to farmers. In this case, the most reported violation was 'overdeclaration and/or declaration of fictitious product, species and/or land' When these irregularities concerned market measures, the most reported violation was ‘inexact quantity’. Concerning 'ethics and integrity', apart from one case of conflict of interest, all of these violations were reported as 'other irregularities concerning ethics and integrity'.
3.3.1.2. Rural development
Table NR8 below provides an overview of the most frequent categories of irregularities reported as fraudulent in rural development expenditure in 2021 and the corresponding financial amounts. It also gives the total for these categories over the period 2017-2021.
Similar to the findings for support to agriculture, there were mainly cases of ‘pure’ falsification of the documentary proof or, to a lesser extent, of requests for aid. Falsification may concern, for example, invoices, declarations of equipment as new while it is second-hand, bids in the context of procurement, and information on compliance with conditions for receiving the aid. The pure category 'documentary proof' was by far the most reported, most often because of false or falsified documents. The category pure 'request' was another frequent category, most often in relation to false or falsified requests of aid.
|
Examples of fraudulent irregularities related to the documentary proof
Example 1: The beneficiary simulated a procurement procedure in relation to the purchase of agricultural equipment. In reality, the beneficiary directly bought the equipment and the company selected through the simulated procurement procedure issued a false invoice for the same equipment. In addition, the equipment was supposed to be new, while it was second-hand. To hide this, false manufacturer labels were attached to the equipment.
Example 2: To get the reimbursement of expenditure under the EU funded project, the beneficiary had to attach two offers for the same item, to evidence that the price was reasonable. For many items, offers were received from company A and company B, always in competition among each other. However, company A did not exist; business information and employees from company B were used in the false offers of the inexistent company A.
Example 3: To receive an advanced payment, the beneficiary had to attach a guarantee from a financial institution. Checks with the financial institution ascertained that the financial institution had never issued that guarantee, which was therefore false.
Example 4: The beneficiary declared that a building funded by the EU was used for the sale of agricultural products, while it was used as home by the beneficiary.
|
A significant number of detections and irregular financial amounts were related to pure '(non) action'. Under this category, from 2017-2021, the most reported type of violation was about actions not implemented.
|
Examples of fraudulent irregularities related to the implementation of the action
Example 1: The beneficiary did not fully implement the construction works envisaged in the business plan and did not increase to number of jobs.
Example 2: The beneficiary did not use the accomodation built with the support of the EU fund for renting to the public. The beneficiary used it for private purposes, without advertising the availability of the accomodation.
Example 3: The beneficiary re-sold the agricultural vehicle bought with the support of EU funds, instead of using it during the operating period.
|
The category pure ‘ethics and integrity’ accounted for 34 irregularities found during 2017-2021.Similar to support to agriculture cases, Poland communicated most of these violations and they were not reported under the types 'conflict of interest', 'bribery' or 'corruption', but as 'other irregularities concerning ethics and integrity'. Most of these violations concerned the creation of artificial conditions for receiving financial support. Other Member States may have reported this type of infringement under other categories of irregularity, such as the one referring to the beneficiary (for example, using the the type of violation 'operator/beneficiary not having the required quality' or ‘other’).
|
Example of fraudulent irregularities related to the creation of artificial conditions
The beneficiary created false information about having had revenue from the sale of self-produced agricultural products or products resulting from their processing in the period prior to the application. This was needed to qualify for the support.
|

Table NR9 below provides an overview of the most frequent categories of irregularities not reported as fraudulent in rural development expenditure in 2021 and the corresponding financial amounts. It also gives the total for these categories over the period 2017-2021.
The highest number of detections and irregular financial amounts were related to pure '(non) action', in particular action not completed, action not implemented, or failure to respect deadlines. Violations concerning 'documentary proof' alone (pure) or the ‘beneficiary’ were also recurrent. They were also often combined with the category ‘(non) action’ and with each other.
Over the period 2017-2021, the number of infringements related to 'documentary proof' followed that of infringements concerning ‘(non) action', most often because of missing documents. However, during 2017-2021, false and/or falsified documents were reported in a number of cases (about 50, including where combined with other violations), which would not be expected for non-fraudulent irregularities. The same applies to the category 'request', with a number of cases of falsification (about 20).

The category pure ‘beneficiary’ was the third most frequent during 2017-2021 and the second in 2021, most often because of the beneficiary not having the required quality.
Most of the violations concerning product, species and/or land were due to over or fictitious declarations.
There were just a few reported cases of conflict of interest. There was one pure case of conflict of interest. In addition, there were eight other cases of conflict of interest in procurement. In 2020, one Member State reported a multi-million irregularity in rural development expenditure related to conflict of interest, corruption, use of false documents and accounts. Reporting as non-fraudulent would not be expected, but the Member State also communicated that penal proceedings were ongoing. Apart from these cases, infringements related to 'ethics and integrity' were reported as 'other'.
3.3.2.Fraud and Irregularity Detection Rates (FDR and IDR) by CAP components
Table NR10 below shows the FDR and IDR per type of policy measure.

Detection rates for support to agriculture were much lower than for rural development. However, one part of support to agriculture, interventions in agricultural markets (market measures), accounted for the highest FDR and IDR. It could be argued that this comparison is biased by a few cases related to market measures (two fraudulent and three non-fraudulent) involving exceptionally high financial amounts (more than EUR 10 million each). However, even excluding these irregularities from the calculation, the FDR and IDR for market measures were the highest, at 0.34% and 1.46%, respectively.
The detection rates for direct payments to farmers were much lower.
3.3.3.Market measures – fraudulent and non-fraudulent irregularities
As shown in Table NR10 above, the FDR and IDR of market measures are high. Table NR11 below shows the number and financial amounts of irregularities reported as fraudulent in relation to market measures for the period 2017-2021, while Table NR12 below shows the same data on irregularities that were not reported as fraudulent.
Fraudulent and non-fraudulent irregularities involving the highest financial amounts are often related to market measures. From 2017-2021, Poland reported two fraudulent irregularities related to aid to producer groups for preliminary recognition in the ‘fruits and vegetables’ sector, accounting for over EUR 20 million each. This type of aid was also subject to three non-fraudulent irregularities, accounting together for over EUR 75 million (all reported by Poland). Another non-fraudulent irregularity involving about EUR 19 million affected a food programme for deprived persons.

The highest number of irregularities reported as fraudulent were related to national support programmes for the wine sector. Irregularities affected in particular investment measures and the restructuring and conversion of vineyards. However, fraud hit also promotion measures, including in non-EU markets.
The highest financial amounts were involved in fraudulent irregularities related to ‘fruits and vegetables’. In this domain, the two above-mentioned cases reported by Poland contributed to the high financial amounts related to aid for producer groups for preliminary recognition. One of these cases concerned expenditure for investment, but also the budget for formation and administrative operation was affected. In general, fraud touched both measures concerning formation/administrative operation and measures concerning investment, sometimes together in the same case.
The financial amounts involved were high also for the market measure specifically related to the promotion of agricultural products. Fraud affected both promotion in the EU markets and in third countries, with higher irregular financial amounts involved in the latter.
Fraud affected also the school schemes and market measures related to milk and milk products.
For irregularities not reported as fraudulent, the category 'products of the wine-growing sector' was the most frequently reported. Most of the times, non-fraudulent irregularities concerned the restructuring and conversion of vineyards. Also irregularities related to investments were frequently reported. When promotion measures were concerned, the majority of cases were related to promotion in third countries.
Promotion of agricultural products was affected by non-fraudulent irregularities also when not related to the wine sector. In this case, the majority of irregularities concerned promotion within the EU.
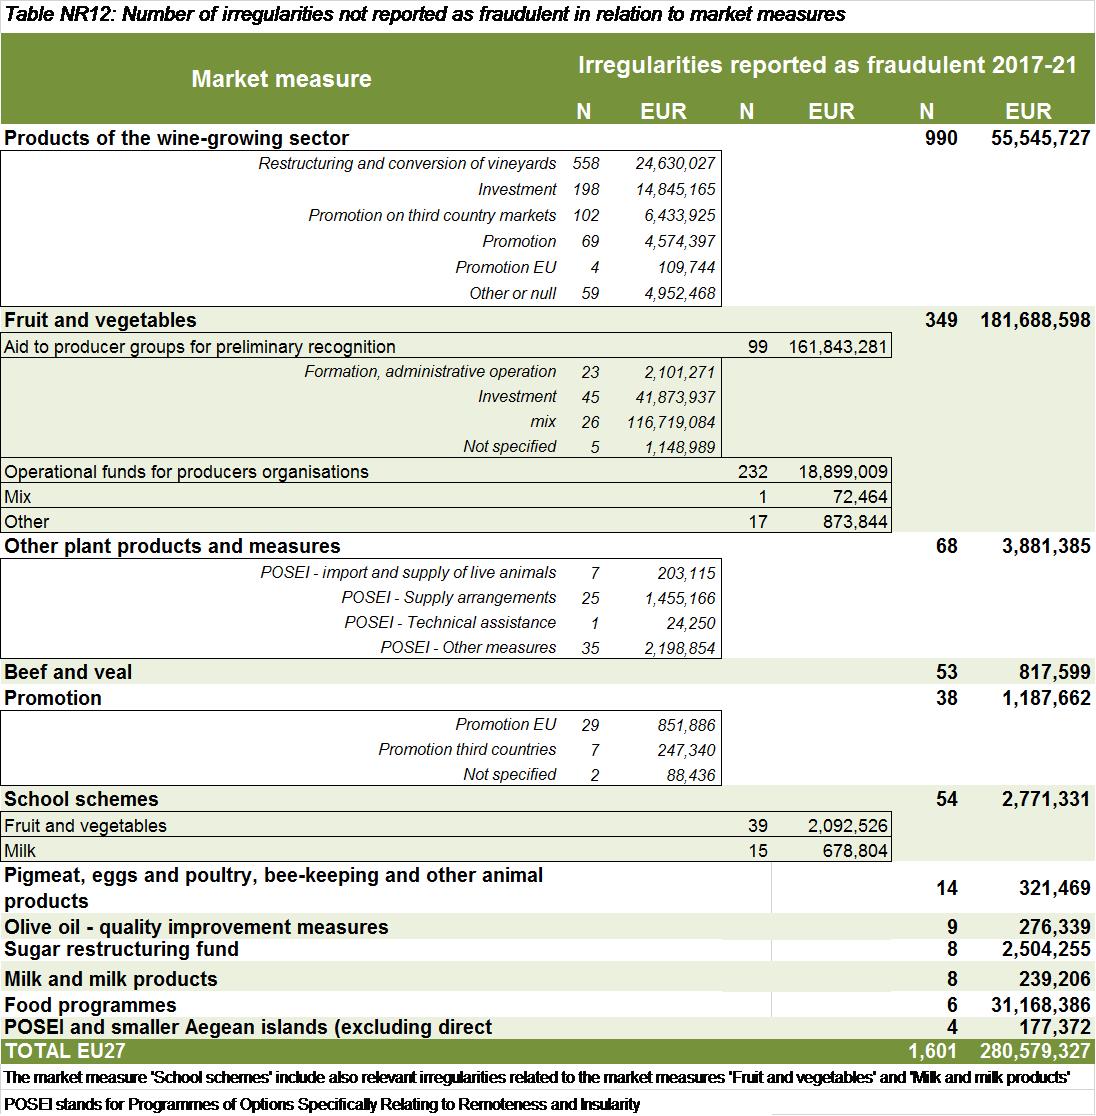
The highest financial amounts were involved in non-fraudultent irregularities related to 'fruit and vegetables'. In particular, this was due to irregularities related to aid to producer groups for preliminary recognition. They concerned both investments and formation/administrative operation, sometimes together in the same irregularity. Even more frequent than irregularities related to aid for preliminary recognition were irregularities concerning operational funds for producers organisations.
Programmes of Option Specifically Relating to Remoteness and Insularity (POSEI) were often affected by non-fraudulent irregularities. Most of the times, this was linked to supply arrangement or other measures.
The school schemes were also not free from non-fraudulent irregularities, in particular concerning the supply and distribution of the products. The majority of cases were related to fruit and vegetables.
The category 'Food programmes' was impacted by few irregularities, but high financial amounts. As mentioned, one single non-fraudulent irregularity accounted for EUR 19 million.
3.3.4.Risk analysis and spontaneous reporting
Detection capability is a key feature of the anti-fraud cycle, which contributes to the effectiveness and efficiency of the system for the protection of the EU budget. In the 2017 PIF Report, to boost the capability to detect irregularities, the Commission recommended to the Member States to improve risk analysis and the use of spontaneous reporting of potential irregularities and strengthening the protection of whistle blowers that are also a crucial source for investigative journalism. With a focus on checks that led to discovering reported irregularities, Tables NR13-NR18 below provide information on the number of checks that were carried out due to reasons that can be linked to these recommendations.
So far, there has been little improvement on the ground (see Tables NR13-NR18 below). It may take time to evolve effectively from reactive to proactive detections based on risk analyses. It should also be considered that non-fraudulent irregularities that are detected and corrected at the national level before including the expenditure in a statement submitted to the Commission for reimbursement do not have to be reported. Therefore, if risk analyses have a higher impact in terms of ‘early’ detection of these irregularities, it would not be captured by Tables NR13-NR18 below. By contrast, this exception does not apply to fraudulent irregularities, which should always be reported, even when detected before expenditure is submitted to the Commission.
3.3.4.1.Irregularities in relation to rural development
With reference to rural development, risk analysis has still a marginal contribution to detecting fraud. In addition, during the past five years, just 5% of the fraudulent irregularities were detected following tips (e.g. from whistle blowers) or information published in the media (see Table NR13 below).

Table NR14 below focuses on irregularities not reported as fraudulent in rural development. Risk analysis contribute to a higher share of detections than for fraudulent irregularities, but this share is still very low. Also the share of non-fraudulent irregularities detected following tips or information published in the media is negligible.

3.3.4.2. Irregularities in relation to market measures
In relation to market measures, risk analysis has a stronger role in detecting fraudulent irregularities than in other CAP sectors. This is influenced the overall low number of cases. However, about 11% of fraudulent irregularities were detected because of risk analysis. In addition, the categories 'scrutiny 4045', ‘scrutiny 485' and ‘scrutiny 1306’ refer to Regulation No 4045/1989, Regulation No 485/2008 and Regulation No 1306/2013, respectively. These deal with the scrutiny of commercial documents of those entities receiving payments from the Guarantee section of the EAGGF (Reg. No 4045/1989) or from the EAGF (Reg. No 485/2008 and Reg. No 1306/2013). These regulations provide for checks based on the assessment of the risks. Regulation No 4045/1989 already required the Member States to consider risk factors and concentrate on sectors or undertakings where the risk of fraud is high. Taken together, these scrutinies accounted for more than 25% of detections.
About 7% of the fraudulent irregularities were detected following tips, which is similar to other CAP sectors. The contribution of information published in the media was nil.

Also for non-fraudulent irregularities, risk analysis seem to play a more important role in detection than in other CAP sectors. Risk analysis and risk-based scrutiny accounted for about 25% of cases. The share of irregularities detected following tips or information published in the media was negligible, as in other CAP sectors.

3.3.4.3. Irregularities in relation to direct payments
With reference to direct payments to farmers, risk analysis has still a marginal contribution in detecting fraud and non-fraudulent irregularities. In addition, during the past five years, just 2-3% of the fraudulent and non-fraudulent irregularities were detected following tips (e.g. from whistle blowers) (see Tables NR17 and NR18 below) and never following information from media.


3.4.Anti-fraud work carried out by the Member States
Previous sections have examined the trend and main features and characteristics of the irregularities reported as fraudulent.
This section focuses on some aspects linked to the anti-fraud work carried out and results obtained by the Member States in particular. It analyses four aspects:
(1)Duration of irregularities (fraudulent and non-fraudulent). No analysis by Member State is presented in this section.
(2)The number of irregularities reported as fraudulent by each Member State (in 2021 and over the past five years).
(3)the FDR (the ratio between the amounts involved in cases reported as fraudulent and the payments made over the same period) and the IDR (the ratio between the amounts involved in cases not reported as fraudulent and the payments made over same period) over the past five years;
(4)the follow-up to suspected fraud.
3.4.1.Duration of irregularities
The Member States are requested to indicate the date or period when the irregularity was committed. Of the 15 549 irregularities (fraudulent and non-fraudulent) reported by Member States in 2017-2021 in relation to the CAP, 9 057 (58% of the total) involved irregularities that were protracted over a span of time. For the 1 233 irregularities reported as fraudulent, this rises to 76%. About 41% of the irregularities consisted of a single act identifiable on a precise date (about and 24% of the fraudulent irregularities). The average duration of the irregularities that were protracted over time was 26 months (two years and two months). For the irregularities reported as fraudulent, the average was one month less: 25 months.
3.4.2.Detection of irregularities reported as fraudulent by Member State
3.4.2.1. Reported over the period 2017-2021
Table NR19 below gives an overview of the irregularities reported as fraudulent by the Member States over the period 2017-2021. It also shows the related amounts, overall payments under the agricultural policy and the FDR.
Belgium, Cyprus and Malta have notified no irregularities as fraudulent. 15 other Member States reported fewer than 30 potentially fraudulent irregularities; six Member States reported between 30 and 60; and three Member States reported over 60.
The FDRs exceeded 0.5% in Estonia and 0.30% in Romania and Bulgaria. Romania was the Member State that accounted for the highest number of irregularities, and Poland reported the highest financial amounts involved.
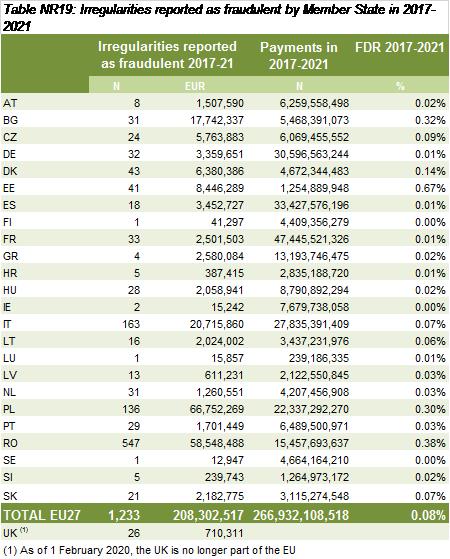

3.4.2.2.Reported in 2021
Table NR20 below gives an overview of the irregularities reported as fraudulent in 2021, broken down by Member State. It also shows the related amounts, overall payments for the common agricultural policy and the FDR.
Nine Member States reported no irregularities as fraudulent. Most Member States reported fewer than 30 fraudulent irregularities; only Romania reported over 30 fraudulent irregularities.
The highest FDR was recorded in Estonia. Romania reported the highest number of irregularities and related financial amounts.


3.4.3.Fraud and Irregularity Detection by sector and Member State
3.4.3.1. Rural development
Table NR21 and Map NR1 below provide an overview of the irregularities reported as fraudulent by the Member States over the period 2017-2021 for rural development expenditure. It also shows the total payments made for rural development and the FDR. As mentioned, the irregularities refer exclusively to the rural development component.


Estonia, Denmark and Romania recorded the highest FDR. The FDR was higher than the EU average also in Lithuania and Italy. 23 Member States reported fraudulent cases concerning rural development spending over the period 2017-2021. Romania and Poland reported the highest number of cases, and Romania reported the highest financial amounts involved.

In this map, the FDR ‘0.00’ indicates low financial amounts involved in the irregularities, in proportion to the payments received.
If no relevant irregularities were reported, no FDR is mentioned in the map for the relevant Member State. See Table NR21.
UK is not included.
Table NR22 and Map NR2 below provide an overview of the irregularities not reported as fraudulent by the Member States over the period 2017-2021 concerning rural development expenditure. Table NR22 below also shows the total payments for rural development and the IDR.


Bulgaria, Portugal and and Malta recorded the highest IDR. The IDR was higher than the EU average also in Romania, Lithuania, Estonia, Slovakia, Italy and Hungary. Portugal and Romania reported the highest number of cases, and Romania, Portugal, Italy and Bulgaria reported the highest financial amounts involved.

If no relevant irregularities were reported, no IDR is mentioned in the map for the relevant Member State. See Table NR22. UK is not included.
Tables NR21 and NR22 above indicate that the reporting of irregularities was concentrated in a few Member States. The top two Member States in terms of number of detections (Romania and Poland) reported 51% of all fraudulent irregularities related to rural development (57% in terms of the financial amounts involved), while they received about 18% of payments. For non-fraudulent irregularities, the top two Member States (Romania and Portugal) reported 30% of cases and 37% of the financial amounts involved, but received about 14% of payments.
The concentration of detections was analysed in detail in the 2018 PIF Report for the period 2014-2018. The analysis suggests that the concentration of detections went beyond what could be expected from the concentration of payments related to rural development among Member States. This could be due to many different factors, including different underlying levels of irregularities and fraud, differences in the quality of prevention or detection work or different practices concerning the stage of the procedure when potentially fraudulent irregularities were reported. This difference in concentration between detections and payments was less pronounced for non-fraudulent irregularities, which could be taken as an indication of more uniform approaches to management and administrative checks, although data on individual Member States highlighted significant discrepancies. The concentration of detections was instead more accentuated for fraudulent irregularities, suggesting that different approaches to criminal investigation and prosecution could be an additional and significant factor explaining the different levels of detection among Member States.
3.4.3.2. Market measures
Table NR23 and Map NR3 below provide an overview of the irregularities reported as fraudulent by the Member States over the period 2017-2021 for market measures expenditure. The table also gives the total payments for market measures and the FDR.


FDR was the highest in Poland and Bulgaria, but significantly higher than the EU average also in Czechia. Sixteen Member States reported fraudulent cases in this area. Poland and France reported the highest number of cases and Poland and Bulgaria reported the highest financial amounts involved.

If no relevant irregularities were reported, no FDR is mentioned in the map for the relevant Member State. See Table NR23. UK is not included in the map.
Table NR24 and Map NR4 below provide an overview of the irregularities not reported as fraudulent by the Member States over the period 2017-2021 in relation to market measures. It also gives the total payments for expenditure under market measures and the IDR.


The IDR exceeded 58% in Poland, 21% in Malta and 16% in Romania. It was higher than the EU average also in Hungary, Sweden, Croatia and Bulgaria. The huge IDR in Poland is due to three cases, accounting together EUR 75 million, which refer to multiple budget years. The IDR of Malta is due to the low overall expenditure in this CAP sector. The IDR of Romania is influenced by one irregularity accounting for EUR 20 million. 22 Member States reported non-fraudulent cases concerning market measures. Spain, France and Italy reported the highest number of cases and Poland, Romania, Spain and France reported the highest financial amounts involved.

If no relevant irregularities were reported, no IDR is mentioned in the map for the relevant Member State. See Table NR24. UK is not included in the map.
Tables NR23 and NR24 above indicate that the reporting of irregularities was concentrated in a few Member States. The top two Member States in terms of number of detections (France and Poland) reported about 50% of all fraudulent irregularities (68% of irregular financial amounts) related to market measures, while they received about 24% of payments. For non-fraudulent irregularities, the top two Member States in terms of number of detections (Spain and France) did not overlap with the highest ranking Member States in terms of the financial amounts involved (Poland and Romania). Poland and Romania reported about 72% of the irregular financial amounts and received about 4% of payments.
As mentioned in Section 3.4.3.1, the concentration of detections was analysed in detail in the 2018 PIF Report, covering the period 2014-2018. The analysis suggests that the level of concentration of detections went beyond what could be expected given the concentration of payments related to market measures among Member States, especially for fraudulent irregularities. This suggests the need for more uniform practice in criminal investigation and prosecution to protect the EU budget.
3.4.3.3. Direct payments to farmers
Table NR25 and Map NR5 below provide an overview of the irregularities reported as fraudulent by the Member States over the period 2017-2021 in relation to direct payments to farmers. It also shows the total payments for direct payments and the FDR.


Romania recorded the highest FDR, at 0.12%. Twelve Member States have reported fraudulent cases in this area. Romania and Italy reported the highest number of cases and financial amounts involved.

In this map, FDR ‘0.00’ indicates low financial amounts involved in the irregularities, in proportion to the payments received. If no relevant irregularities were reported, no FDR is mentioned in the map for the relevant Member State.See Table NR25. UK is not included in the map.
Table NR26 and Map NR6 below provide an overview of the irregularities not reported as fraudulent by the Member States over the period 2017-2021 in relation to direct payments. It also shows the total payments for direct aid and the IDR.


The IDR was the highest in Italy, more than double the rate for Romania, which ranked second. 22 Member States have reported non-fraudulent cases in direct aid.

In this map, IDR ‘0.00’ indicates low financial amounts involved in the irregularities, in proportion to the payments received. If no relevant irregularities were reported, no IDR is mentioned in the map for the relevant Member State. See Table NR26. UK is not included in the map.
Tables NR25 and NR26 above suggest that the reporting of irregularities was concentrated in a few Member States. The top two Member States in terms of number of detections (Romania and Italy) reported 80% of all fraudulent irregularities (and 79% of irregular financial amounts) related to direct aid, while they received about 14% of payments. With reference to non-fraudulent irregularities, the top two Member States in terms of number of detections (Italy and Romania) reported about 51% of such irregularities (and 69% of irregular financial amounts), while they received about 14% of payments.
The concentration of detections in relation to direct payments to farmers was analysed in detail in the 2018 PIF Report, covering the period 2014-2018. The analysis suggests that the concentration of detections went beyond what could be expected given the level of concentration of payments related to direct aid to farmers among Member States. This may be due to different factors, including no uniform management and control systems and, for the fraudulent irregularities, different approaches to criminal investigation and prosecution to protect the EU financial interests.
3.4.4.Follow-up to suspected fraud
In the 2019 PIF Report, a new analysis of the follow-up Member States give to suspected fraud has been introduced. This analysis considers the irregularities that have been reported as suspected fraud from 2007 to 2013 and look at whether these irregularities have been dismissed (meaning whether they have been de-classified to administrative irregularities), they are still pending as suspected fraud or they have been confirmed as established fraud (following a final verdict). The details about the methodology for this analysis can be found in the 2019 PIF.
Table NR27 includes the update of the dismissal ratio, established fraud ratio and pending ratio. The dismissal ratio gives the percentage of fraudulent irregularites that have been reclassified as non-fraudulent during their lifetime, until end of 2021. The established fraud ratio gives the percentage of fraudulent irregularites that were classified as established fraud by the end of 2021. The pending ratio gives the percentage of fraudulent irregularities that were still classified as suspected fraud at the end of 2021. These three percentages sum to 100%.

Similar to the situation up to 2019, about 23% of the irregularities reported as fraudulent were dismissed and reclassified as non-fraudulent by the end of 2021. Another 62% of these irregularities were still pending. This may point to a significant underestimation of the dismissal ratio, because part of these cases that are still classified as suspected fraud are already closed. In any case, between 8 and 15 years have already passed since the detection of the irregularity and the more time passes the less it can be expected that fraud will actually be established.
The dismissal ratio varied across the Member States. High dismissal ratios, especially when associated with high pending ratios, may be due either to the detection phase or to the investigation/prosecution phase. Low dismissal ratios may be positive, but they may also be the result of many irregularities still pending. After eight years following the end of the period under consideration, the dismissal ratio was zero or very low in many Member States. This indicator must be read in combination with the pending ratio. The latter points to the possibility that the dismissal ratio increases in the future (depending on the number of cases that are still open) or to an underestimation of the dismissal ratio (depending on the number of cases that are already closed). High dismissal ratios, especially when associated with a high number of still pending cases, may be due to (i) a detection phase that leads to report to the judicial authority cases that were not fraudulent; (ii) an investigation/prosecution phase that gives low priority or does not have enough resources to properly address the case; (iii) the stage of the procedure when an irregularity is classified as suspected fraud.
The cases of established fraud were few. This may point to the need to invest further in the investigation/prosecution phase. At EU-27 level, established fraud ratio was 15%. It was zero or very low in many Member States. In general, the established fraud ratio is not likely to increase significantly because, while 62% of cases are still classified as suspected fraud (pending ratio), part of them are already closed and, in any case, between 8 and 15 years have already passed since the detection of the irregularity. Similarly to the dismissal ratio, also the established fraud ratio depends on the stage of the procedure when an irregularity is classified as suspected fraud (see above).
3.5.Recovery cases
For an in-depth analysis of recovery and financial corrections in the CAP, see the DG AGRI’s 2021 Annual Activity Report and the 2021 Annual Management and Performance Report for the EU Budget.
Main findings
Fraudulent irregularities
Over the period 2017-2020, the number of fraudulent irregularities in support to agriculture expenditure and the financial amounts involved were rather stable, apart from a significant increase of the financial amounts in 2017-2018, caused by just two cases related to market measures. In 2021, the number of fraudulent irregularities decreased by 17% with respect to 2020 and the financial amounts moved in the opposite direction, bouncing back to the 5-year average, after a record low in 2020.
Over the period 2017-2021, fraudulent irregularities for rural development increased by 23%. They were related to both PP 2007-2013 and PP 2014-2020. The number of irregularities related to PP 2007-2013 fell sharply as from 2017. This is in line with the multiannual nature of the programming period, which closed in 2015. The number of reported irregularities related to PP 2014-2020 have been increasing, but slowly. During the first eight years of implementation, the management and control systems for PP 2014-2020 detected much fewer fraudulent irregularities than the systems for PP 2007-2013, during the first eight years of that programming period (during 2007-2014). This slow start should be closely monitored to ensure it is not due to a reduced focus on combatting fraud.
There were a number of fraudulent irregularities concerning both rural development spending and direct aid to farmers.
During 2017-2021, more fraud was detected in rural development than in support to agriculture expenditure, in proportion to the payments received by the Member States. The weight of the financial amounts involved in fraudulent irregularities on payments (fraud detection rate - FDR) for rural development was more than double that for support to agriculture (0.14% versus 0.06%). The FDR was 0.08% for the overall CAP expenditure. Reimbursement-based expenditure, such as rural development, is more prone to errors than entitlement-based expenditure and provides more opportunities for fraudsters. Most support to agriculture payments concern direct aid to farmers, which recorded the lowest FDR, at 0.01%. In this area the integrated administration and control system and the parcel identification system support cross-checks, which enhances prevention. However, the other component of support to agriculture, market measures, accounted for the highest FDR, at 0.72%. Excluding a few irregularities involving exceptional financial amounts, the FDR was still 0.34%, more than double that for rural development.
The detection of fraudulent irregularities was concentrated in few Member States. The level of concentration goes beyond what could be expected given the level of concentration of corresponding payments. This could be due to many different factors, including different underlying levels of irregularities and fraud, differences in the quality of prevention or detection work or different practices concerning the stage of the procedure when potentially fraudulent irregularities are reported. The concentration of detections was more accentuated for fraudulent rather than for non-fraudulent irregularities. This suggests that different approaches to criminal investigation and prosecution could be an additional and significant factor explaining the different levels of detection among Member States.
In most fraudulent irregularities, the ‘persons involved’ tend to be legal entities. Most are private companies, followed by non-profit organisations, in particular associations. Most fraudulent irregularities involve a single entity.
Non-fraudulent irregularities
Over the period 2017-2021, non-fraudulent irregularities in support to agriculture expenditure continued to be rather stable. The irregular financial amounts linked to this part of the budget fluctuated strongly, mainly due to four cases related to market measures involving over EUR 15 million each reported in 2017, 2019 and 2021, and none detected in 2018 and 2020.
Non-fraudulent irregularities in rural development expenditure concerned both PP 2007-2013 and PP 2014-2020. The number of irregularities related to PP 2007-2013 fell sharply during 2017-2019, which was to be expected, considering that this programming period closed in 2015. Since then, there were still detections of PP 2007-2013 cases and they have been following a stable trend. On the other hand, the Member States started reporting detections related to PP 2014-2020, following an accelerating trend, reflecting progress in the implementation under this programming period.
The number of non-fraudulent irregularities in rural development expenditure has regularly and significantly exceeded those in support to agriculture throughout the entire 2017-2021 period, with over double the number of irregularities. The ratio of the financial amounts involved in non-fraudulent irregularities on payments (the irregularity detection rate - IDR) was very different between the two types of support, as it was 0.19% for support to agriculture and 0.71% for rural development (0.32% for the overall CAP expenditure). Most of support to agriculture payments concern direct payments to farmers, which recorded the lowest IDR, at 0.06%. This is consistent with the the findings of the European Court of Auditors, according to which payments made on an entitlement basis (such as direct payments to farmers, which represent most of CAP expenditure) is less prone to error than reimbursement-based expenditure (such as rural development). However, another part of support to agriculture, market measures, accounted for the highest IDR, at 2.19%. Excluding a few irregularities involving exceptional financial amounts, the IDR was 1.46%, still double than that for rural development.
There were a number of non-fraudulent irregularities concerning both rural development spending and direct aid to farmers.
Types of violation – support to agriculture
Fraudulent irregularities
Over the period 2017-2021, fraudulent irregularities in support to agriculture mainly concerned the documentary proof. Fraudulent irregularities concerning the request were also recurrent. In most cases, these irregularities concerning documentary proof or request were due to falsification. In the case of direct payments, most of these violations were concentrated in two Member States. A wide range of documents and information can be falsified, such as lease agreements, property documents, compliance with the conditionality requirements.
The Member States detected few fraudulent cases related to the implementation of the action, but there were also several cases in combination with other violations, such as documentary proof, the request, ethics and integrity. These cases accounted for the second highest financial amounts involved and were related to market measures.
Irregularities concerning product, species and/or land were more frequently detected, mostly in relation to direct aid to farmers. The majority of these violations concerned over or fictitious declarations.
High average financial amounts (about EUR 1.8 million) were recorded in several cases of conflict of interest combined with other violations. These irregularities were related to the market measure ‘promotion’ and were investigated by OLAF, which uncovered complex fraudulent schemes, mainly based on price inflation, kickback payments and money laundering. The public procurement procedures were also breached via a solid network of companies based in different countries. In some cases, the manipulation was possible also due to the collusion of the beneficiaries.
One Member State reported a significant number of fraudulent cases of beneficiaries creating artificial conditions to receive financial support, under the category ‘ethics and integrity’. Most of these cases concerned direct aid to farmers. For example, beneficiaries may artificially split agricultural holdings and request aid via several linked companies, to avoid degressive aid rates or limits in terms of area or animals. Either the other Member States failed to detect similar irregularities or they reported them under other categories.
Non-fraudulent irregularities
Non-fraudulent violations mostly concerned requests for aid, most of the times because of falsification of documents (which would not be expected for non-fraudulent irregularities) or incomplete/incorrect requests, in relation to direct payments to farmers. When these violations concerned market measures, they were about products or species not eligible for aid.
Non-fraudulent violations concerning the documentary proof increased significantly in 2021, mainly because of detections in one Member State in relation to direct payments to farmers (incomplete/incorrect documents).
Concerning violations related to the implementation of the action, the infringements concerning market measures were prevalent, with (i) the highest financial amounts in cases where the action was not implemented and in cases where the beneficiary carried out an operation that was prohibited during the measure; (ii) the highest frequency of cases where the action was not implemented or not completed.
The vast majority of violations concerning the beneficiary were related to direct payments to farmers and were about the beneficiary not having the required quality. This is the cases also for the market measures, where higher financial amounts were involved and which more frequently were combined with other types of infringements, especially in the implementation of the action.
Another recurrent type of irregularities not reported as fraudulent concerned the products, species or land, in particular in relation to direct payments to farmers (mostly over or fictitious declarations), but also market measures (mostly, inexact quantities).
Concerning 'ethics and integrity', apart from two cases of conflict of interest in relation to market measures, all of these violations were reported as 'other’.
Types of violations – rural development
Fraudulent irregularities
Similar to irregularities in support to agriculture, over the period 2017-2021, irregularities in rural development mainly involved cases of falsified documentary proof or, to a lesser extent, falsified requests for aid. This may include falsified invoices, declarations of equipment as new while it is second-hand, bids in the context of procurement and information on compliance with conditions for receiving the aid. A significant number of rural development fraudulent irregularities were related to the action, which was often not implemented.
One Member State reported a high number of rural development fraudulent cases of beneficiaries creating artificial conditions to receive financial support, under the category ‘ethics and integrity’ (see also support to agriculture). Only two irregularities were reported as corruption and a few as conflict of interest, especially in procurement and in combination with other violations such as false documents or requests, non-implentation of the action.
Non-fraudulent irregularities
The highest number of non-fraudulent irregularities in rural development were related to the action, most often not completed, not implemented or delayed. Violations concerning the documentary proof (most often missing) or the beneficiary (most often not having the required quality) were also recurrent. They were also often combined with the violations concerning the action and with each other. Several cases of falsified documents or requests of aid were reported, which would not be expected for non-fraudulent irregularities. Most of the violations concerning product, species or land were due to over or fictitious declarations.There were just a few reported cases of conflict of interest, mostly in relation to procurement.
Zooming in on market measures
Individual fraudulent and non-fraudulent irregularities involving the highest financial amounts are often related to market measures. From 2017-2021, a few, but high-impact irregularities were related to aid to producer groups for preliminary recognition in the ‘fruits and vegetables’ sector and a food programme for deprived persons.
The highest number of irregularities reported as fraudulent concerned national support programmes for the wine sector. Irregularities affected in particular investment measures and the restructuring and conversion of vineyards. However, fraud hit also promotion measures, including in non-EU markets.
The highest total financial amounts were related to market measures concerning fruits and vegetables, which most often concerned aid to producer groups for preliminary recognition. In general, fraud touched both measures concerning formation/administrative operation and measures concerning investment, sometimes together in the same case. The financial amounts involved were high also for the market measure specifically related to the promotion of agricultural products. Fraud affected both promotion in the EU markets and in third countries, with higher irregular financial amounts involved in the latter.
The majority of the irregularities not reported as fraudulent concerned market measures for products of the wine-growing sector, most of the times related to restructuring and conversion of vineyards. In the context of products for the wine sector, also irregularities related to investments were frequently reported. When promotion measures were concerned, the majority of cases were related to promotion in third countries.
Promotion of agricultural products was affected by non-fraudulent irregularities also when not related to the wine sector. In this case, the majority of irregularities concerned promotion within the EU.
The highest financial amounts were involved in non-fraudulent irregularities related to 'fruit and vegetables'. In particular, this was due to irregularities related to aid to producer groups for preliminary recognition. They concerned both investments and formation/administrative operation, sometimes together in the same irregularity. Even more frequent than irregularities related to aid for preliminary recognition were irregularities concerning operational funds for producers organisations.
Programmes of Option Specifically Relating to Remoteness and Insularity (POSEI) were often affected by non-fraudulent irregularities. Most of the times, this was linked to supply arrangement or other measures.
The school schemes were also not free from non-fraudulent irregularities, in particular concerning the supply and distribution of the products. The majority of cases were related to fruit and vegetables.
Risk analysis and spontaneous reporting
With reference to rural development and direct payments to farmers, risk analysis and spontaneous information from civil society, including from the media, have a marginal contribution in detecting fraudulent and non-fraudulent irregularities.
In relation to market measures, risk analysis has a stronger role in detection, including because the risk-based scrutiny of commercial documents of those entities receiving payments. About 7% of the fraudulent irregularities were detected following tips, which is similar to other CAP sectors.
Anti-fraud work carried out by the Member States
The Member States are requested to indicate the date or period when the irregularity was committed. Most irregularities covered extended spans of time, particularly in cases of fraudulent irregularities, consistent with their intentional nature. The average duration of these protracted irregularities is about two years, both for fraudulent and non-fraudulent cases.
Detection rates are the outcome of the checks carried out by the Member States and they can vary across Member States due to different underlying levels of irregularities and fraud, but also due to differences in the quality of prevention or detection work or different reporting practices. Over the period 2017-2021, the FDRs exceeded 0.5% in Estonia and 0.30% in Romania and Bulgaria. However, the picture changes depending on the CAP sector. For rural development, Estonia, Denmark and Romania recorded the highest FDRs, while Bulgaria, Portugal and and Malta scored the highest IDRs. For market measures, the FDR was the highest in Poland and Bulgaria, but also significantly higher than the EU average in Czechia. The IDR was the highest in Poland, but it was high also in Malta and Romania. For direct aid, Romania recorded the highest FDR and Italy the highest IDR.
Therefore, detection levels were different across the Member States. In all CAP sectors (rural development, market measures and direct aid) the level of detection of irregularities and fraud across the different Member States was uneven. The level of concentration among Member States was analysed in detail in the 2018 PIF Report, covering the period 2014-2018.
For rural development, this analysis suggested that the difference in level of concentration between detections and payments was less pronounced for non-fraudulent irregularities, even though the examination of data on individual Member States highlighted significant discrepancies. The concentration of detections was instead more accentuated for fraudulent irregularities, suggesting that different approaches to criminal investigation and prosecution could be an additional and significant factor explaining the different levels of detection among Member States. Also in the specific case of market measures, this analysis found that the level of concentration of detections went beyond what could be expected given the distribution of corresponding payments, especially for fraudulent irregularities.
According to the same analysis, direct aid was the CAP sector with the highest level of concentration. This may be due to different factors, including not uniform management and control systems and, for the fraudulent irregularities, different approaches to criminal investigation and prosecution. Specific problems may occur at the local level that need to be correctly and promptly addressed by the competent national authorities.
About one fourth of the irregularities reported as fraudulent were dismissed. The dismissal ratio varied across the Member States. High dismissal ratios, especially when associated with a high number of still pending cases, may be due to (i) a detection phase that leads to report to the judicial authority cases that were not fraudulent; (ii) an investigation/prosecution phase that gives low priority or does not have enough resources to properly address the case; (iii) the stage of the procedure when an irregularity is classified as suspected fraud.
Analysis suggests that the dismissal ratio is significantly underestimated. About 62% of the irregularities reported as fraudulent were still pending. However, for part of them no changes of status are to be expected, because they are closed cases. In any case, between 8 and 15 years have already passed since the detection of the irregularity. There were few cases of established fraud. This may indicate the need to invest further in the investigation/prosecution phase.
4.COHESION, FISHERIES AND OTHER INTERNAL POLICIES
Executive summary
Section 4 analyses fraudulent and non-fraudulent irregularities reported by the Member States to the Commission through the Irregularity Management System. It mainly focuses on the irregularities related to the Cohesion and Fisheries policies, financed by the Cohesion Fund, the European Regional Development Fund, the European Social Fund and the Fisheries Funds (the European Structural and Investment Funds - ESIF).
Between 2017 and 2021, the number of fraudulent and non-fraudulent irregularities related to the programming period 2007-2013 decreased for the ESIF. The number of irregularities reported for the programming period 2014-2020 increased. These dynamics are in line with known trends and patterns in the detection and reporting of irregularities and are linked to the implementation cycle of multiannual programmes.
The number of irregularities reported as fraudulent for the programming period 2014-2020 were in line with those detected for the programming period 2007-2013 after the same number of years from the start of the period. This is not the case for non-fradulent irregularities. For them, the fall in the number and financial amounts reported after eight years from the start of the programming period is striking. Analysis identifies a number of potential explanations that may cover a significant part of this strong decline, such as delay in implementation of operational programmes, changes in reporting practices, increased use of simplified cost options, the introduction of the annual accounts, increased capability of implementing bodies and beneficiaries.
Risks of irregularities seem to be higher in the areas of the cohesion policy related to transport, environment protection, research, technological development and innovation (RTD&I), social inclusion and promotion of employment and labour mobility.
Analysis points to risks related to the green transition, including for investments in energy efficiency, in the provision of drinking water, in waste management, in renewable energy (solar) and in risk prevention. Risks to the digital transition seem to be pointing at services and applications for SMEs, in terms of number of irregularities and services and applications for e-Government, in terms of financial amounts involved. Irregularities were reported also in relation to investments in the infrastructure for the digital transition.
Concerning RTD&I, analysis suggests higher risks for investments to provide assistance to these activities in firms. Measures to stimulate research, innovation and entrepreneuship in SMEs were particularly affected.
Risks are high in relation to investments in the transport infrastructure, because of the frequency of irregularities in generic road projects, which reach the regional and local level, and because of the high financial amounts involved in irregularities concerning railways and Trans-European Network (TEN) roads. Also investments in TEN multimodal infrastructure and in the electricity networks seem to be quite risky.
Risks in relation to social inclusion, poverty and discrimination seem to be higher for investments in (i) active inclusion; (ii) health infrastructure; (iii) improved access to healthcare and social services; (iv) social infrastructure and regeneration of rural and urban areas; (v) investments in favour of marginalised communities and (vi) childcare infrastructure.
In relation to the promotion of employment and labour mobility, risks seem to be higher for investments for (i) the adaptation to change of workers and enterprises, in particular operations for the design and dissemination of innovative and more productive ways of working; (ii) access to employment, in particular operations for job-seekers and inactive people, including the long-term unemployed and people far from the labour market, and (iii) support for self-employment and business start-up.
The most frequent fraudulent violations were about the use of false or falsified documents. High financial amounts were involved where fraudulent infringements of contract provisions/rules took place. This type of fraud often consisted in incomplete or non-implementation of the funded action. Most of fraudulent violations concerning ethics and integrity were about conflict of interests. Infringements of public procurement rules were the most reported among non-fraudulent violation, but only in 4% of these cases fraud was detected.
Risk analysis has still a marginal contribution in detecting fraud, while information from civil society (including information published in the media) has a significant and growing role. This is not the case for non-fraudulent irregularities. Detection of fraud and irregularities could improve through ex-post thematic risk analysis projects focusing on groups of past transactions.
Two thirds of the irregularities have been occurring over a period of time, averaging nearly one year and a half. The rest of the irregularities consisted of a single act identifiable on a precise date. On average, it took more than one year to come to a suspicion that a fraudulent irregularity had been committed and one year and a half to close the case after reporting. These average times are expected to increase as the implementation of the operational programme progresses.
With reference to the programming period 2014-2020, the Fraud Detection Rates (FDR) recorded by Romania and Slovakia were very high, but due to single irregularities that involved huge financial amounts. These irregularities also had a strong impact on the EU-27 FDR, which was about 1% and higher than in the programming period 2007-2013. In line with the general deep decrease in non-fraudulent irregularities reported, the Irregularity Detection Rate (IDR) was above 1% only in Slovakia, Romania, Bulgaria, Greece. At EU-27 level, IDR was about 0.7%, much lower that in the programming period 2007-2013. These FDRs and IDRs for the programming period 2014-2020 are likely to change significantly in the coming years, with progress in the implementation of the operational programmes.
After about 10 years from initial reporting, the share of cases of suspected fraud that have not led to conviction remains very high, while the share of cases in which fraud is established is low. This may signal the need to invest further in reporting suspected fraud and in the investigation/prosecution phase.
Concerning shared management Funds for other internal policies, the FEAD was the Fund most affected by fraud. More than 90% of the detections of non-fraudulent irregularities were related to the following Funds: AMIF, the FEAD and the YEI.
4.1.Introduction
Section 4 presents a statistical evaluation of irregularities and fraud detected by the Member States during 2021, with reference to the cohesion and fishery policies. It places these detections in the context of past years and relevant programming periods. The Member States reported these irregularities and cases of fraud to the Commission through the Irregularity Management System (IMS).
Over half of EU funding is channelled through the five European Structural and Investment Funds (ESIF):
·The European Regional Development Fund (ERDF), which promotes balanced development in the different regions of the EU;
·The European Social Fund (ESF), which supports employment-related projects throughout Europe and invests in Europe’s human capital, i.e. its workers, its young people and all those seeking a job;
·The Cohesion Fund (CF), which funds transport and environment projects in countries where the gross national income (GNI) per inhabitant is less than 90% of the EU average. In 2014-2020, these countries were Bulgaria, Croatia, Cyprus, Czechia, Estonia, Greece, Hungary, Latvia, Lithuania, Malta, Poland, Portugal, Romania, Slovakia and Slovenia;
·The European Agricultural Fund for Rural Development (EAFRD), which focuses on resolving the particular challenges facing the EU's rural areas;
·The European Maritime and Fisheries fund (EMFF), which helps fishers to adopt sustainable fishing practices and coastal communities to diversify their economies, improving quality of life along European coasts. Due to the operating rules of the EMFF and the European Fisheries Fund (EFF), which are very similar to those of the other Structural Funds, irregularities reported by Member States in relation to fisheries policies are treated in this section, jointly with the Funds for cohesion and economic convergence.
The purpose of all these funds is to invest in job creation and a sustainable and healthy European economy and environment. They mainly focus on five areas: (i) research and innovation; (ii) digital technologies; (iii) supporting the low-carbon economy; (iv) sustainable management of natural resources; and (v) small businesses.
The European Commission and the EU Member States jointly manage ESIF. Each Member State prepared a partnership agreement, in collaboration with the Commission.
After this introduction, Section 4.2. focuses on general trends for fraudulent and non-fraudulent irregularities. It compares detection in the programming period (PP) 2014-2020 with detection in PP 2007-2013, to better assess current trends in detecting irregularities. Section 4.3. analyses more specifically fraud and irregularities to get a better undestanding on how different areas of the cohesion policy were impacted, including research and innovation and the green and digital transitions, which are central also to the Recovery and Resilience Facility. The same section includes an analysis of the types of violations reported for the cohesion policy. Section 4.4. focuses on the reasons for carrying out checks that led to the detection of irregularities. Section 4.5. takes a closer look at the Member States’ anti-fraud activities and the results obtained, analysing fraud and irregularity detection rates (the ratio between the amounts involved in cases reported as fraudulent (FDR) or not reported as fraudulent (IDR) and the relevant payments). Section 4.6. provides figures on other shared management Funds.
4.2.General analysis
The analysis in this section refers to the EU-27, unless specified otherwise. UK data is added in the tables, as specified, to give a complete picture. However, the accompanying analysis is focused on the current Member States and the EU-27 aggregate. In the whole section, when reference is made to ‘fraudulent’ or ‘fraud’, it includes ‘suspected fraud’ and ‘established fraud’.
Member States are requested to communicate:
·non-fraudulent irregularities only when they are detected after the expenditure has been introduced in a statement submitted to the Commission. This derogation does not apply to fraudulent irregularities: Member States must always report them.
·fraudulent and non-fraudulent irregularities with financial amounts above EUR 10 000. During 2017-2021, several Member States reported also a number of irregularities below this threshold. However, these irregularities represented about 1% of all irregularities reported (EU-27). They are included in the analysis for this section, to make use of all available information.
Analysis of the EU cohesion policy is more complex than other budget sectors, as information refers to different programming periods, which are regulated by different rules.
4.2.1.Irregularities reported as fraudulent
4.2.1.1. Trend by programming period
Table CP1 below provides an overview by programming period and by Fund of the irregularities reported as fraudulent in the past 5 years (2017-2021).
Fraudulent irregularities related to PP 2007-2013 peaked in 2015, gradually decreased in the following years and in 2018 they were overtaken by those related to PP 2014-2020. These dynamics are in line with known trends and patterns in the detection and reporting of irregularities and are linked to the PP 2007-2013 implementation cycle.
Reporting related to PP 2014‑2020 basically started in 2017. It has been fluctuating around an increasing trend, with ups in 2018 and 2020 and downs in 2019 and 2021. These fluctuations are typical of detection of fraudulent cases, which is less linked to routine checks than detection of non-fraudulent irregularities. The current fraud frequency level (FFL) for PP 2014-2020 is high, at 10%: one irregularites out of ten is reported as fraudulent. To put this into context, during the whole period between 2007 and 2021, FFL for PP 2007-2013 was half of it, just 5%. This higher tendency to detect fraud is influenced by a strong decrease in non-fraudulent irregularities during PP 2014-2020. This is analysed further in the next sections.

Table CP2 below provides an overview by programming period and by Fund of the financial amounts involved in cases reported as fraudulent. The financial amounts tend to fluctuate more due to the possibility of individual cases involving high amounts.
For PP 2007-2013, while the number of irregularities peaked in 2015, the financial amounts remained around the highest level until 2016. Then, the amounts significantly decreased in 2017 and further dropped in 2019. In 2020, there was a limited rebound mainly due to one ERDF irregularities reported by Italy, totalling about EUR 18 million.
For PP 2014-2020, the financial amounts skyrocketed at EUR 650 million, in 2018, and at EUR 1 600 million, in 2021. In 2018, this was due to two ERDF irregularities reported by Slovakia, accounting together for EUR 590 million. In 2021, the peak was mainly due to one ERDF irregularity reported by Romania, accounting for EUR 1 270 million. In addition, two CF irregularities reported by Slovakia and Romania, accounted together for EUR 190 million. The acceleration in 2020 was supported by five CF cases reported by Romania, totalling EUR 85 million.

Those involved in fraudulent irregularities were most often legal entities. In most Member States, private companies represent the majority of those involved. The only exception with a large sample is Spain, where most of the reported entities were sub-national governmental bodies.
4.2.1.2. Trend by Fund
Tables CP3 and CP4 below focus on the distribution by Fund of the irregularities reported as fraudulent:
(1)Also because of the higher share of EU financing channelled through it, ERDF was the Fund most affected, because it had the highest number of cases reported as fraudulent, and the related financial amounts were the highest. Of the irregularities detected between 2017 and 2021 for PP 2007-2013, 73% (79% of financial amounts) concerned ERDF. For PP 2014-2020, 65% (84% of the financial amounts) concerned ERDF.
The number of irregularities reported as fraudulent jumped in 2015. Then, it has fluctuated around the new, higher level, until 2018. In 2019, there was a significant drop in the reporting of fraudulent irregularities, due to a decrease in detections both for PP 2007-2013 and 2014-2020. Since then, the number of fraudulent irregularities related to PP 2007-2013 was rather low and stable, while the number of those related to PP 2014-2020 fluctuated around an increasing trend.
Instead of peaking in 2015, the ERDF financial amounts continued to increase in 2016, and in 2018 and 2021 they litterally skyrocketed. As mentioned, these extreme rises were due to the two irregularities reported by Slovakia (totalling EUR 590 million) and the irregularity reported by Romania (accounting for about EUR 1 270) for PP 2014-2020.
(2)After a decrease in 2017, the number of ESF fraudulent irregularities was rather stable. The financial amounts recorded an extraordinary increase in 2018, due to an irregularity reported by Portugal, accounting for more than EUR 30 million, related to PP 2007-2013.
(3)Since 2010, potential fraud affecting the CF is regularly reported. In 2018, the majority of detections took place in Slovakia, while in 2020 it was Romania reporting most cases. The amounts can fluctuate quite significantly, because of the low number of cases and high amounts involved in the projects financed by the CF. In 2020, the financial amounts jumped to nearly EUR 120 million, mainly due to five irregularities reported by Romania, totalling EUR 85 million. In 2021, the financial amounts climbed even further to more than EU 230 million, mainly due to one irregularity reported by Slovakia (accounting for EUR 118 million) and two irregularities reported by Romania (totalling together EUR 105 million).
These trends in financial amounts are also due to different reporting patterns in the Member States. This is examined in the 2019 PIF Report, with reference to the 2015-2019 period. For example, for the ERDF, Slovakia had a tendency to detect and report fraudulent cases with large financial amounts, supported by the propensity to identify irregularities covering most of the expenditure of the related projects/operations.


4.2.2.Irregularities not reported as fraudulent
Table CP5 below provides an overview by programming period and by Fund of the irregularities not reported as fraudulent in the past five years (2017-2021). Table CP6 below shows the financial amounts involved in these irregularities. As mentioned, fluctuations in the financial amounts are broader and more frequent than in the number of detections and they can be linked to individual irregularities or groups of irregularities of huge value.
The decrease in the number of irregularities and financial amounts related to PP 2007-2013 was significant. This is in line with the multiannual nature of structural programmes, which were closed already in 2015. This trend was common to all Funds. Also the financial amounts dropped in 2018 and 2019, then started increasing again. In 2020, the financial amounts increased for all Funds, except for the EFF, while in 2021, the financial amounts increased only for the CF. This was influenced by single cases with very high financial amounts involved. In 2020, Slovakia reported two CF non-fraudulent irregularities, totalling more than EUR 40 million, and Romania and Slovakia reported two ERDF cases, accounting together for EUR 30 million. In 2021, Hungary reported a CF irregularity, accounting for EUR 66 million.

Basically, reporting related to PP 2014-2020 began in 2016. Since then, these detections and irregular financial amounts have been increasing for all Funds, but less than expected when compared to the previous programming period. In 2021, despite a slight increase in the number of reported irregularities, the financial amounts involved jumped to more than EUR 650 million. The following irregularities contributed to this large increase: one ESF reported by Greece (accounting for EUR 108 million), one ERDF irregularity reported by Romania (accounting for EUR 67 million), one CF irregularity reported by Slovakia (accounting for EUR 41 million).

As for the fraudulent irregularities, these trends in financial amounts are also due to different reporting patterns in the Member States. This was examined in the 2019 PIF Report, with reference to the 2015-2019 period. For example, concerning the CF, Slovakia had a tendency to detect and report non-fraudulent irregularities with large financial amounts involved, also because on average the irregularities covered a significant share of the related expenditure.
4.2.3.Irregularities reported in relation to the PP 2014-2020: comparison with PP 2007-2013
The current programming period started in 2014, about 8 years ago. Reporting of irregularities basically began in 2016 and increased in the following years. To put this trend into perspective, it can be compared with the number and financial amounts of the irregularities that were recorded during the first 8 years of PP 2007‑2013. Tables CP7 and CP8 below provide this information.


The following graphs provide a more precise comparison, based also on the actual date of reporting. This comparison is affected by the fact that the irregularities related to PP 2007‑2013 are more 'mature' than irregularities related to PP 2014-2020, which have only just recently been reported. The number of irregularities related to PP 2007‑2013 and the financial amounts involved are the result of several years of investigation (after detection). This brought into the picture additional information to: (i) confirm or refute the hypothesis that an irregularity had been perpetrated; (ii) classify the irregularity (as fraudulent or non-fraudulent); (iii) to quantify the financial amounts actually involved, etc.


As shown by Graphs CP1 and CP2 above, the number of irregularities reported as fraudulent was similar for PP 2014-2020 and PP 2007-2013, after a comparable period from the start of the programming periods. There was a slower start of reporting for the current programming period, but, during the fifth year of implementation, there was a strong acceleration that filled the gap. The comparison is more difficult for financial amounts (see Graphs CP3 and CP4 below). The financial amounts reported for PP 2014-2020 were much higher than for the previous programming period, because there were two noticeable jumps during the fifth and eighth years of implementation. The first upswing was due to the two cases Slovakia reported for the ERDF, which totalled about EUR 590 million. The second jump was due to the case Romania reported for the ERDF, accounting for EUR 1 270 million, and two CF irregularities reported by Slovakia and Romania, accounting together for EUR 190 million (see Section 4.2.1.1). However, PP 2007-2013 experienced similar – but much smaller - shifts, during the fourth and sixth years of implementation, due to two cases, accounting about EUR 120 million each (see Graph CP3 below). Taking these outliers out of the analysis, the financial amounts involved in the fraudulent irregularities reported for PP 2014-2020 were still higher than PP 2007-2013, but more aligned.


This was the outcome of different patterns followed by different Funds.
The irregularities reported as fraudulent for the CF and the ERDF significantly increased from PP 2007-2013 to PP 2014-2020 (see Graphs CP5 and CP6 below). The increase in CF fraudulent irregularities was mainly due to detections in Slovakia and Romania, while detections in Hungary and Romania were the main contributors to the surge concerning the ERDF.
For the ESF and the Fisheries Funds, the detection and reporting of fraudulent irregularities was lower than before (see Graphs CP7 and CP8 below). ESF-related irregularities were lagging behind by a rather stable number of cases until the end of the sixth year. Then the gap widened due to an increase in irregularities for PP 2007-2013. This gap was mainly due to the decrease recorded in Germany, which was influenced by reporting practices, and Romania. Also, the cumulated financial amounts associated with the ESF‑related fraudulent irregularities for PP 2014-2020 were considerably lower than the amounts for PP 2007-2013, due to a strong increase during the seventh year of implementation of PP 2007-2013.


Focusing instead on the non-fraudulent irregularities, the fall in the number of cases and the financial amounts reported after 8 years from the start of the programming period is striking (see Graphs CP9-CP12 below). This significant difference between these two programming periods warrants further analysis.


The number of irregularities not reported as fraudulent (and the related amounts) can be influenced by the state of implementation of the programming period. An indicator to gauge this state of implementation may be the interim payments that have been made to the Member States, as these payments should reflect the progression of eligible expenditure. Graph CP13 below shows the situation concerning CF, ERDF and ESF. During the first 8 years from the start of PP 2014-2020 (from 2014 to 2021), the Member States have received fewer interim payments than during the first 8 years from the start of PP 2007-2013 (from 2007 to 2014). At the end of 2021, this (cumulative) gap still amounted to about -8% and it had been higher before (see Graph CP13 below). However, at least part of this gap could simply be due to the fact that interim payments are limited to 90% of eligible expenditure and the remaining 10 % is released after the yearly examination and acceptance of the accounts. As such, this would not reflect delayed implementation. Overall, these findings suggest that the dynamics of the gap in interim payments might explain some of the difference in the number of non-fraudulent irregularities, but certainly not all of it (as the total difference in detection is about -50% - see Table CP8 and Graph CP10 above).

In Graphs CP14-CP17 below, the irregularities not reported as fraudulent are presented by Fund. The widest gap is recorded for the ERDF (-54%). Also for the CF and the ESF, there were significant gaps with respect to PP 2007-2013, even if they were not as wide as for the ERDF (-39% for the CF, -48% for the ESF). For the CF, the financial amounts reported in relation to PP 2014-2020 were not far from those related to PP 2007-2013. Then, during 2021, the gap suddenly rose. For the ESF, the negative gap steadly widened, in terms of number of irregularities. The gap in terms of financial amounts was closed by one ESF irregularity reported by Greece, accounting for EUR 108 million. For the Fisheries Funds, the gap in terms of numbers was in line with the other Funds (-47%), but this was based on far fewer cases. The curves of the financial amounts overlap until the end of the sixth year, before diverging due to a sudden upswing of the financial amounts related to PP 2007-2013.


Given that ERDF showed the widest gap between PP 2007-2013 and PP 2014-2020, Graph CP18 below shows the comparison, Member State by Member State, in terms of number of irregularities not reported as fraudulent, with specific reference to this Fund. Graph CP19 below focuses on the irregular financial amounts.
For the majority of Member States, the numbers of non-fraudulent irregularities related to the two programming periods have been on persistently diverging paths (see Graph CP18 below). There are a few exceptions, such as Bulgaria, France, Croatia, Lithuania and Slovakia.


With general reference to the cohesion and fisheries policies, a specific analysis has been carried out, based on the non-fraudulent irregularities reported by the Member States, until 2020 included. This analysis identifies a number of potential explanations that may cover a significant part of this strong decline. The hypotheses reported below are based on the findings of this analysis.
For all the Funds, the competent national authorities should build on this analysis, to assess the extent to which these potential explanations and other possible explanations actually apply to their operational programmes, with the aim of implementing corrective measures in case the decline may be due to less effective detection and reporting.
Delays in the implementation of the operational programmes
As mentioned, delays in the implementation of the relevant operational programmes may explain part of the current gap. At the end of 2020, the cumulative amount of interim payments received by the Member States during PP 2014-2020 was 17% lower than during the first seven years of PP 2017-2013 and it had been higher before. At the end of 2021, this difference decreased to -8% (see Graph CP13 above).
Changes in the reporting practices for irregularities under EUR 10 000
In general, Member States are requested to communicate irregularities involving financial amounts above EUR 10 000. However, several Member States reported a number of irregularities involving financial amounts below this threshold. Apart from typographical errors or mis-interpretation of the reporting rules, there may be different reasons why some Member States reported many more ‘below-the-threshold’ irregularities than others did:
·An irregularity may consist of irregular operations which are interlinked and whose total financial impact exceeds EUR 10 000, even though each operation remains below the threshold. Some reporting authorities may have chosen to report these irregularities separately, while other Member States may have combined them into a single irregularity.
·The competent national authority reported the case because the initial estimation of the irregular financial amounts exceeded EUR 10 000, but subsequent updates lowered these financial amounts below the threshold.
·The competent national authority reported the irregularity with a provisional estimation under EUR 10 000, pending the exact quantification of the financial amount involved. However, at the end of the assessment, the financial amounts involved did not increase above the threshold.
Part of the decrease in non-fraudulent irregularities may be explained by a possible change in the reporting practices of some authorities for irregularities with less than EUR 10 000 involved. At the end of 2020, there was a clear difference between PP 2007‑2013 and PP 2014-2020, in terms of non-fraudulent irregularities with financial amount below the EUR 10 000 threshold. During PP 2007-2013, some reporting authorities may have been communicating irregularities also when the financial amounts involved were below EUR 10 000, despite the derogation. Then, they may have changed this practice during PP 2014‑2020 or other reporting authorities may have stepped in. Already during the meeting of May 2019 of the Advisory Committee for the Coordination of Fraud Prevention (COCOLAF), OLAF attracted the attention of all Member States on the practice of the reporting of ‘below-threshold’ irregularities and on how this varied across the Member States. A change in the frequency or in the reporting practices (from separate to aggregate reporting) concerning ‘small’ interlinked irregularities could be an additional contributing factor.
Increase in the use of Simplified Cost Options (SCO)
For PP 2014-2020, the possibility to use SCO has been extended, but the impact depends on the extent to which implementing partners used this possibility. For PP 2007-2013, about 7% of the declared ESF expenditure was under SCOs, differing widely from one Member State to another. According to estimates made in 2016 and 2018, for PP 2014-2020, this percentage is expected to rise to 33-35% for the ESF by the end of the programming period. However, the expectation concerning the percentage of the ERDF-CF budget covered by SCOs is much lower, at 4%. Strong differences between Member States are expected.
Consequently, for the ESF, the increase in the percentage of expenditure covered by SCOs (from 7% to 33%) may be a significant factor contributing to the drop in non-fraudulent irregularities. However, it also depends on (i) whether the estimated increase in the use of SCOs is actually materialising; (ii) to what extent the wrong implementation of SCOs methdologies brought to errors; (iii) to what extent the increased use of SCOs will concern projects that are more relevant for irregularity reporting; and (iv) when, during the programming period, adopting more SCOs can have a greater impact on patterns of irregularities.
The violations concerning the eligibility of the expenditure/action are experiencing the biggest drop. This may support the hypothesis that the increase in the use of SCOs is contributing to the drop in non-fraudulent irregularities. With reference to non-fraudulent irregularities concerning ESF, at the end of 2020, eligibility violations dropped from about 1 300 for the first seven years of PP 2007-2013 to about 100 for PP 2014-2020. Simplification due to the use of financing not linked to costs and SCOs may be contributing to this trend. However, the adoption of SCOs should be accompanied by more stringent controls on the implementation of the action, which could be expected to lead to the detection of more infringements of the contract provisions/rules. Consistently, at the end of 2020, this type of violations declined to a much lesser extent than eligibility infringements (from about 500 to about 350).
Delayed adaptation to the change in a derogation to reporting non-fraudulent irregularities
In 2009, there was a significant change in the reporting Regulation. Commission Regulation n. 846 of 1 September 2009 changed the derogation related to the reporting for non-fraudulent irregularities detected and corrected by the managing authority, before expenditure being declared to the Commission.
Before the change, for the derogation to apply, detection and correction should have taken place ‘before any payment to the beneficiary of the public contribution and before inclusion of the expenditure concerned in a statement of expenditure submitted to the Commission’. After the change, the derogation has been broadened, as it became enough that detection and correction took place ‘before inclusion of the expenditure concerned in a statement of expenditure submitted to the Commission’.
However, for most of the irregularities reported during the two programming periods, the derogation was the same. It could be argued that the change in the derogation helped to lower the number of reported non-fraudulent irregularities during PP 2014-2020 (more irregularities covered by the derogation). However, this should not be the case, because most of the irregularities related to PP 2007-2013 were reported when the ‘new’ derogation was already in place (after September 2009).
It cannot be excluded that some authorities did not immediately adapt their reporting practices to the ‘new’ derogation and kept on applying the previous version during PP 2007-2013. In any case, the effect would be limited to irregularities detected between any payment to the beneficiary and the inclusion of the expenditure in a statement of expenditure to the Commission.
Introduction of the annual accounts and the exclusion of ongoing assessments
As from PP 2014-2020, the Member States can exclude from the annual accounts expenditure where there is an ongoing assessment about the legality and regularity. Through this exclusion, the Member States avoid a reduction in the contribution from a given Fund, even in case of irregularities. The Member States are actually using this possibility. As from PP 2014-2020, each year, the Member State prepares the accounts, which are examined and accepted by the Commission. In the framework of the preparation of the annual accounts, article 137(2) of the Common Provision Regulation provides the Member State with the possibility to exclude from the annual accounts expenditure that has already been declared to the Commission during the accounting year under closure, where there is an ongoing assessment about the legality and regularity of this expenditure. This expenditure is automatically recovered by the Commission during the current year, without this constituting a financial correction and without it reducing support from the Fund to the relevant operational programme. In case the assessment concludes that this expenditure is legal and regular, the Member State can re-introduce the expenditure in an application for interim payment in subsequent accounting years. Also where the assessment concludes that the expenditure was irregular, there is no financial correction and reduction in support from the Fund.
The possibility offered by article 137(2) might explain part of the declined in the non-fraudulent irregularities reported by the Member States. A number of hypotheses may be formulated:
1.Some reporting authorities may have not communicated irregularities in IMS when the assessment of the excluded expenditure concluded that the expenditure was not legal and regular. At the moment of the exclusion from the annual accounts, the Member State may not be in a position to report any irregularity in IMS, as the assessment is ongoing. However, at a later stage, the competent authority could conclude that an irregularity has taken place. Even if the expenditure had been excluded from the annual accounts, this irregularity should be reported, because it was detected after previous inclusion of the expenditure concerned in a payment application to the Commission (i.e. the original application for interim payment).
2.Similarly, in the case of withdrawal of a whole project after exclusion of related expenditure following article 137(2), some reporting authorities might have assessed that the reporting of any irregularity (ascertained at the end of the assessment) was not necessary, because the project was not funded by the EU budget any longer. This would not be correct.
3.The annual accounts (and article 137(2)) may have introduced a more orderly treatment of irregular expenditure. During PP 2007-2013, when there was no ‘annual accounts’ procedure, in a number of instances, in case of doubt about legality or regularity of the expenditure, the Member States could have resorted to cancelling part of or all EU support to certain projects, just to avoid pending issues with the Commission - which could lead to a ‘net financial correction’ - and to timely free resources for other projects. In IMS, the already reported irregularity would then be labelled as ‘decertified’. If this was the case, at least a subset of the ‘decertified’ irregularities in PP 2007-2013 could be related to regular expenditure, for which the final assessment would have resulted in the cancellation of the reported irregularity.
During PP 2014-2020, the exclusion provided by article 137(2) can instead be used, at least in some cases. The presentation of the annual account represents a moment when the Member State has to certify that the declared expenditure is free from irregularities. In the presence of a piece of expenditure whose legality and regularity is dubious, possibly because of ongoing audit work, the national competent authority has now the possibility of avoiding the start of any correction procedure - that could lead to a financial correction by the Commission - by simply putting the expenditure under assessment and withdrawing it from the accounts. This can be done only for expenditure declared during the accounting year whose accounts have not been presented yet. However, the window between the payment application and the presentation of the annual accounts can reach more than one year. Then, the decision about cancelling or not the EU support can be delayed until there is clarity about legality and regularity. Often, the excluded expenditure is eventually assessed as legal and regular.
4.By putting expenditure under assessment (while excluding it from the annual accounts), the Member State may delay the communication of the irregularity. If and when the assessments will be finalised with the first conclusion that expenditure is irregular, the communication in IMS will take place. This can contribute to the current decline of non-fraudulent irregularities for PP 2014-2020, at least temporarily.
Improved practices may also be contributing to the decrease
Under certain premises, after seven years of implementation (end of 2020), the combined effect of the above mentioned potential explanations would cover about two thirds of the EU-wide decline in reporting of non-fraudulent irregularities. Of course, this is a rough estimation. However, this gives an idea of the possible contribution of these potential explanations.
The influence of increased administrative capacity could also be considered. There are no indicators to gauge the increase in the capability of the implementing bodies and of the beneficiaries and the impact that this could have had in terms of decrease of unintentional irregularities. However, also these could be contributing factors.
First of all, the legal framework for PP 2014-2020 requires the managing authorities to adopt effective and proportionate anti-fraud measures that take into account the risks identified. This is more relevant for the detection of fraudulent irregularities, which have actually increased, despite the decrease of non-fraudulent irregularities. However, the risk assessments carried out by the relevant authorities and the ensuing mitigating measures may have also contributed to preventing non-fraudulent irregularities or to detecting them before expenditure is submitted to the Commission. The actual impact of these anti-fraud measures depends on the timeliness and quality of the underlying risk assessments and ensuing actions.
At the end of 2020, the analysis of the fraudulent irregularities suggested that management and control systems detected irregulaties at an earlier stage during PP 2014-2020. As shown in Graphs CP1 and CP2 above, the number of irregularities reported as fraudulent was stable. At the end of 2020, the analysis of the time gap between the perpetration of the fraudulent irregularities and their detection suggested that this gap was shorter during PP 2014-2020 than during PP 2007-2013.
If this improvement applied also to non-fraudulent irregularities, a higher share of detected irregularities might have fallen under a derogation to reporting, because detected before inclusion of the expenditure in any statement to the Commission. Fraudulent irregularities must be reported regardless of when they are detected. This allows a comprehensive analysis of the time gap. Consequently, the finding that Member States have become faster in detecting fraudulent irregularities may lead to the hypothesis that the Member States have been detecting more fraudulent irregularities before inclusion of the expenditure in a statement to the Commission. If this is true, another hypothesis can be made: this improvement may be having an influence also on the detection of non-fraudulent irregularities. This would support the potential explanation that at least part of the decrease in reported non-fraudulent irregularities may be due to improved capacity of the management and control systems: if the same non-fraudulent irregularity is detected after inclusion in a statement to the Commission, it must be reported in IMS, while if it is detected before inclusion, it must not be reported.
Besides anti-fraud measures, other factors might have contributed to increase the administrative capacity. The 2007-2013 national strategic reference frameworks (NSRF) have been replaced by the 2014-2020 partnership agreements. These agreements must present an assessment of the administrative capacities of the authorities involved in implementating the ESI Funds together with – where relevant – a summary of actions to improve these capacities. In some Member States, the quality and experience of relevant authorities may have improved over the years, especially if these authorities did not change from one programming period to the other. During time, methodologies may have been defined by the competent authorities to decrease the amount of unintentional irregularities, shortcomings may have been identified and corrected following national and EU audit work, administrative capacity may have been built, etc. The Commission has contributed with general capacity building actions and targeted remedial actions.
Another factor could be that the beneficiaries that participate in the implementation of the projects during PP 2014-2020 might have participated to the projects also during PP 2007-2013. This experience may make easier to avoid unintentional irregularities.
On the other side, the COVID-19 outbreak could have brought in additional stress on the administrative capacity of the relavant players of the management and control systems. This could contribute to the detection of more irregularities in the years to come.
4.3.Specific analysis
With reference to the cohesion policy, this section covers the following aspects:
·How irregularities impacted on the different areas of this policy;
·What was the contribution of different types of irregularity.
4.3.1.Irregularities by area of the cohesion policy
The operational programmes financed under the EU cohesion policy are implemented along identified intervention fields. These intervention fields change depending on the programming period. Annex 14 shows the 86 intervention fields for PP 2007-2013 and the 123 fields for PP 2014-2020. For the purpose of this analysis, Annex 14 introduces a grouping of these intervention fields in areas and sub-areas. The following sections analyse the reported irregularities along these areas and sub-areas, taking into consideration also the share of expenditure declared for the operations in the relevant intervention fields (see below for further explanations).
Table CP9 below shows the fourteen areas in which the intervention fields have been grouped. Figures CP1 and CP2 below show how irregularities impacted on these areas, focusing on fraudulent and non-fraudulent cases, respectively. Annex 14 shows which intervention field is associated to which area. The following analysis concerns the irregularities under PP 2014-2020 only. For the purpose of this analysis the area of information and communication technology is associated to the digital transition. The areas related to the protection of the environment, resource efficiency, the shift towards a low-carbon economy, climate change are associated to the green transition (see Table CP9 below). In Figures CP1 and CP2 below, the size of the squares is proportional to the number of fraudulent irregularities reported by the Member States. The darker the colour of the squares, the higher the financial amounts involved.


Fraudulent irregularities
Few fraudulent irregularities concerned trasport, but the financial amounts involved were huge. Financial amounts involved in research and innovation were the second highest and this was based on a broader base of cases. Concerning transport, this was influenced by one irregularity where EUR 1 270 million were involved. Similarly, for research and innovation, the high financial amounts were influenced by two fraudulent irregularities, accounting together for about EUR 590 million.
Fraudulent irregularities were most frequent in the areas related to employment, to research and innovation and to the green transition. Concerning the green transition, they were most frequent in relation to the transition to a low-carbon economy and the protection of the environment. Excluding the above mentioned outliers (related to transport and research/innovation) the protection of the environment was the area with the highest financial amounts involved, similar to transport but based on more cases.
Non-fradulent irregularities
Research/innovation and inclusion were two areas with many non-fraudulent irregularities and high financial amounts involved. The area concerning research and innovation is the one affected by the highest number of non-fraudulent irregularities. The high financial amounts involved in inclusion were influenced by an irregularity accounting for nearly EUR 110 million.
Taken together, also the areas related to the green transition accounted for more than 1 000 non-fraudulent irregularities and about EUR 250 million. This is mainly due to non-fraudulent irregularities related to the protection of the environment and the shift towards a low-carbon economy.
Concerning non-fraudulent irregularities, the highest financial amounts were related to transport. This was based on a lower number of cases than in other areas.
Considering the share of cohesion funding devoted to the different areas
The share of total expenditure declared (EU share) for the different areas of the cohesion policy may influence the frequency of irregularities and the total financial amounts involved in these irregularities. To take this factor into consideration, Graph CP20 below proposes a comparison among areas of the cohesion policy based on:
·The percentage of irregularities related to a specific area over the total number of irregularities related to the cohesion policy;
·The percentage of the financial amounts involved in the irregularities related to a specific area over the total financial amounts involved in all irregularities related to the cohesion policy;
·The percentage of expenditure declared (EU share) for the operations belonging to a specific area over the expenditure declared (EU share) for all operation under the cohesion policy (all intervention fields).
Concerning fraudulent irregularities, this analysis confirms that the financial amounts involved in the areas transport and environment protection were very high. Graph CP20 below focuses on fraudulent irregularities. The three outliers related to transport and research and innovation (see above) are not included in Graph CP20.
Research/innovation and employment are the two areas where the frequency of fraudulent irregularities was much higher than what could be expected based on the weight of the expenditure declared (see Graph CP20 below).

Concerning non-fraudulent irregularities, Graph CP21 below confirms that research/innovation and inclusion were areas with a very high number of cases and/or financial amounts involved. Graph CP21 focuses on non-fraudulent irregularities. The outlier related to inclusion (see above) is not included in Graph CP21.
As for fraudulent irregularities, also for non-fraudulent irregularities, the irregular financial amounts involved in transport were disproportionately high, also when the expenditure declared is taken into consideration.

Based on this preliminary analysis by area of the cohesion policy:
·Trasport is a risky area because both fraudulent and non-fraudulent irregularities involved very high financial amounts;
·Research, technological development and innovation is a risky area because of the frequency of irregularities and the high financial amounts involved;
·The green transition seems to be at risk of fraud, especially considering the financial amounts involved in the area of environment protection. Also non-fraudulent irregularities were frequent and costly - especially for environment protection and transition to low-carbon economy – but this seems to be due also to the level of expenditure declared in these sectors.
·Irregularities concerning employment were quite frequent, especially fraudulent ones.
·Irregularities concerning social inclusion, poverty and discrimination were quite frequent, especially non-fraudulent ones.
These areas are further analysed in the following sections. Also the area of information, communication and technology is further analysed, because of its relevance for the digital transition, which is a key objective also of the Recovery and Resilience Facility.
4.3.1.1. The green transition
In Figures CP3 and CP4 below, the analysis drills down to the level of the sub-areas relevant to the green transition (see Annex 14). Figure CP3 is based on the fraudulent irregularities concerning the three areas that feed into the green transition (protection of the environment, the shift towards a low-carbon economy, climate change – see Table CP9 above and Annex 14). Figure CP4 focuses on non-fraudulent irregularities.
Fraudulent irregularities
The majority of these fraudulent irregularities concerned energy efficiency. This is confirmed by the comparison based also on the expenditure declared (see Graph CP22 below). Most of these irregularities have been classified in the generic intervention field ‘Energy efficiency, co-generation, energy management’, which was valid for PP 2007-2013 (see footnote 101). In the few cases where the classification was more precise (based on the PP 2014-2020 fields), fraudulent irregularities mostly concerned ‘energy efficiency renovation of existing housing stock, demostration projects and supporting measures’ and were about conflict of interests in procurement or incorrect documents.
The highest financial amounts were involved in the management and distribution of drinking water. The prevalence of water management in term of financial amounts was also due to one fraudulent irregularity accounting for more than EUR 70 million, concerning the management and distribution of drinking water (generic code under PP 2007-2013). However, the prevalence of this sub-area in terms of irregular financial amounts is confirmed by Graph CP22 below, where this outlier is excluded and the expenditure declared is considered. Most of the fraudulent irregularities concerning water management were related to the provision of water for human consumption (which may include extraction, treatment, storage and distribution infrastructure). Besides water management, another sub-area concerning water, water treatment, was affected by few but costly fraudulent irregularities. However, this may be due also to the high expenditure declared for this field (see Graph CP22 below).
Significant is also the contribution of waste management, both in terms of number and financial amounts. The majority of these fraudulent irregularities concerned household waste management (including minimisation, sorting, recycling measures) and public procurement. The high financial amounts were mainly associated to fraudulent irregularities in the management of household and industrial waste (more generic code under PP 2007‑2013).


Non-fraudulent irregularities
Also for non-fraudulent irregularities, the majority of cases concerned energy efficiency. This sub-area was followed by water and waste treatment (see Figure CP4 below). Concerning energy efficiency, the generic intervention field ‘Energy efficiency, co-generation, energy management’ - which was valid for PP 2007-2013 (see footnote 101) - was the most frequently reported. However, differently from fraudulent irregularities, this was closely followed by the more specific field about ‘energy efficiency renovation of public infrastructure, demostration projects and supporting measures’. Energy efficiency renovation of existing housing stock was instead not prevalent among non-fradulent irregularities. Water treatment was impacted by more cases than waste treatment, but considering the share of expenditue declared, waste treatment seems to be more at risk, in terms of number of non-fraudulent irregularities (see Graph CP23 below).
The highest financial amounts were involved in water management. This was mainly due to interventions related to the provision of water for human consumption, also because of one non-fraudulent irregularity accounting for more than EUR 41 million. A similar number of non-fradulent irregularities and even higher financial amounts (net of the aforementioned outlier) concerned water management and drinking water conservation (including river basin management, water supply, climate change adaptation, metering, charging systems and leak reduction). The remaining non-fradulent irregularities made generic reference to management and distribution of drinking water (PP 2007-2013 field).
Non-fraudulent irregularities related to renewable energy (solar) and risk prevention were also particularly frequent, considering weights in terms of expenditure declared for these types of investment. Risk prevention was particularly affected also in terms of irregular financial amounts. This is suggested by Graph CP23 below, where the comparison takes into consideration the share of expenditure declared for the different intervention fields.
The high financial amounts associated to climate change are mainly due to an irregularity accounting for more than EUR 18 million, out of the EUR 25 million involved. These financial amounts are noticeable in Graph CP23 below and they would stick out even more if the above mentioned outlier accounting for EUR 41 million in water management woud be excluded from Graph CP23. However, also the financial amounts involved in the adaptation to climate change and prevention and management of climate change risks are influence by a large non-fraudulent irregularity, accounting for more than EUR 18 million.


4.3.1.2. Research, technological development and innovation
In Figures CP5 and CP6 below, the analysis drills down to the level of the sub-areas of research, technological development and innovation (see Annex 14). Figure CP5 focuses on fraudulent irregularities. Figure CP6 is based on non-fraudulent irregularities.
Fraudulent irregularities
The prevalence of assistance to RTD and innovation activities in firms is clear, both in terms of number of fraudulent irregularities and financial amounts involved. The financial amounts related to this sub-area were strongly influenced by the two aforementioned irregularities, accounting together for EUR 590 million. More specifically, these outliers concerned investment in infrastructure, capacities and equipment in SMEs directly linked to research and innovation activities. However, the most reported intervention field in this sub-area was the generic (PP 2007-2013) ‘Other measures to stimulate research and innovation and entrepreneurship in SMEs’. The most recurrent violations concerned the documentary proof, in particular false or falsified documents. There were a significant number of cases of conflict of interests.

Non-fraudulent irregularities
RTD and innovation activities in firms was clearly prevalent also with reference to non-fraudulent irregularities (see Figure CP6 below). The most reported intervention field was again the generic (PP 2007-2013) ‘Other measures to stimulate research and innovation and entrepreneurship in SMEs’, followed by research and innovation processes in SMEs (including voucher schemes, process, design, service and social innovation). The highest financial amounts and a high number of cases were related to investment in infrastructure, capacities and equipment in SMEs directly linked to research and innovation activities (including innovative technologies, establishment of new firms by universities, existing RTD centres and firms, etc.).
Also the intervention fields concerning activities in reasearch centres and the technology transfer made a noticeable contribution to the total number of non-fraudulent irregularities affecting research and innovation. However, this seems to be more in line with the share of expenditure declared for these intervention fields.

4.3.1.3. Transport and networks
In Figures CP7-CP9 below, the analysis drills down to the level of the sub-areas of sustainable transport and other networks infrastructures (see Annex 14). Figure CP7 and CP8 focus on fraudulent irregularities. Figure CP9 is based on non-fraudulent irregularities.
Fraudulent irregularities
Most of the fraudulent irregularities reported under PP 2014-2020 concerned motorways or roads, with most of the irregular financial amounts involved in the Trans-European Network (TEN) infrastructure. Two irregularities reported by Slovakia and Romania, accounting for EUR 118 million and EUR 36 million, contributed to the high financial amounts involved in TEN motorways and roads. The low number of fraudulent irregularities reported so far may be due to the long implementation periods of this type of projects. For a better understanding of potential trends, reference to the situation concerning PP 2007-2013 may be useful. This is shown in Figure CP8 below.

During PP 2007-2013, most of the fraudulent irregularities were related to roads that were not part of the TEN network. However, the few irregularities related to TEN motorways and roads were enough to match the total financial amounts involved in non‑TEN projects. Concerning non-TEN infrastructure, irregularities related to regional/local roads were most frequent, but the financial amounts involved in national roads were much higher. The financial amounts involved in one irregularity related to a national road may be worth tens of millions. In the case of a TEN project the financial amounts can skyrocket. During PP 2007-2013, the three irregularities with the highest financial amounts in national roads averaged EUR 25 million, but one irregularity related to a TEN motorway accounted for EUR 120 million. The most frequent violations concerned the documentary proof, in particular false or falsified documents. There were several cases concerning ethics and integrity, including conflict of interests and corruption, and several cases related to public procurement.
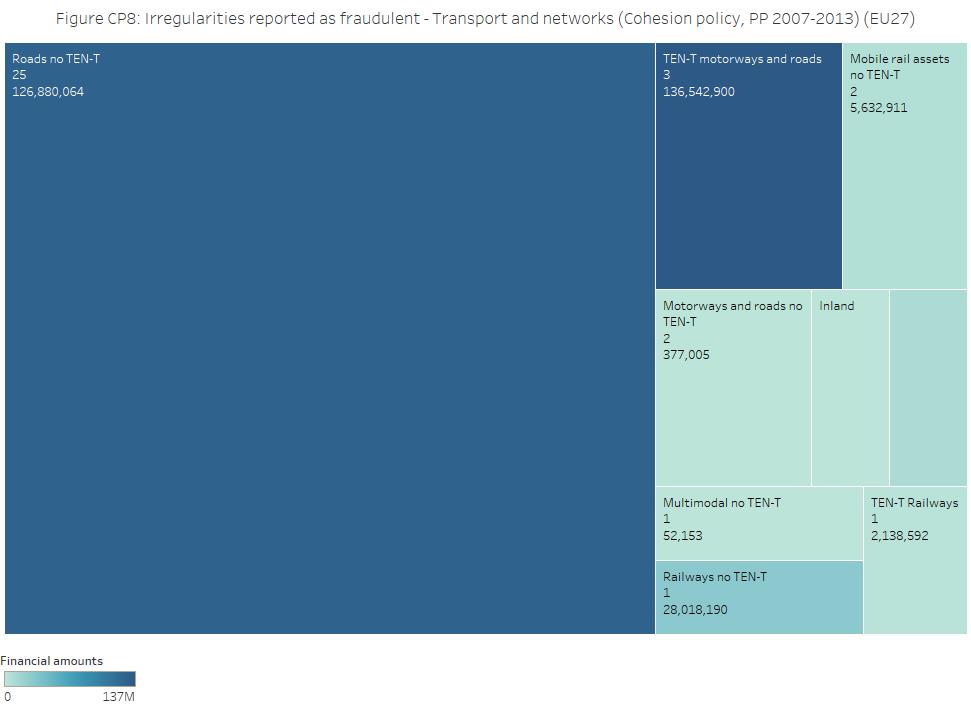
Fraudulent irregularities in investments for railways were less frequent, but financial amounts involved can be huge. So far, during PP 2014-2020, there was just one such irregularity (TEN) reported by Romania, but the amounts involved exceeded EUR 1 270 million. During PP 2007-2013, two irregularities related to railways were reported. One of them accounted for nearly EUR 30 million, despite it was not related to a TEN project.
Non-fraudulent irregularities
Also for non-fraudulent irregularities, most of cases concerned motorways and roads, with higher financial amounts involved in TEN investments (see Figure CP9 below). Graph CP24 below, where number and financial amounts are compared with the expenditure declared, confirms that the number of irregularities related to motorways and roads and the financial amounts involved in TEN infrastructure were disproportionately high.
The share of irregularities concerning railways tend to be larger in non-fraudulent irregularities than in fraudulent ones. The number of irregularities related to TEN and no TEN projects was similar, but the financial amounts related to TEN projects was much higher, also because of two irregularities accounting together for about EUR 100 million.
Despite the low level of expenditure, non-fraudulent irregularities concerning multimodal trasport in connection with the TEN network occurred. As shown by Graph CP24 below, considering the share of expenditure declared for this type of projects, the number of non-fradulent irregularities and the financial amounts involved were high.
Several non-fraudulent irregularities affected investments in the electricity network, with low financial amounts involved. When compared with the share of expenditure declared for this type of projects, the frequency of these non-fraudulent irregularities was noticeable.


4.3.1.4.Digital transition
In Figures CP10 and CP11 below, the analysis drills down to the level of the sub-areas of the information and communication technologies (see Annex 14). Figure CP10 focuses on fraudulent irregularities. Figure CP11 in based on non-fraudulent irregularities.
Fraudulent irregularities
Fraudulent irregularities related to the digital transition were not frequent and they concerned services and applications. The finding about the low frequency comes out of the analysis in Section 4.3.1., also taking into consideration the share of expenditure declared for this area. Figure CP10 below shows that these irregularities affected investments concerning services and applications both for SMEs and for e-Government. The financial amounts involved in the irregularities related to e-Government were much higher, also because of an irregularity accounting for EUR 15 million, related to discriminatory selection criteria in public procurement.

Non-fraudulent irregularities
Member States more often reported non-fraudulent irregularities, also in relation to investments for the digital transition. This higher frequency is suggested also by the analysis that considers the share of expenditure declared in this area (see section 4.3.1 and Graph CP21 above).
The financial amounts involved in non-fraudulent irregularities related to e‑Government were prevalent, but the number of irregularities related to services and applications for SMEs was also noticeable (Figure CP11 below). The financial amounts related to e-Government were very high also considering the share of expenditure declared for these investments (see Graph CP25 below). This is influenced by an irregularity in public procurement, accounting for EUR 20 million. The number of non-fraudulent irregularities related to services and applications for SMEs was lower than that related to e-Government, but it was more significant, when considering that far less expenditure has been declared for this type of investments (see Graph CP25 below).

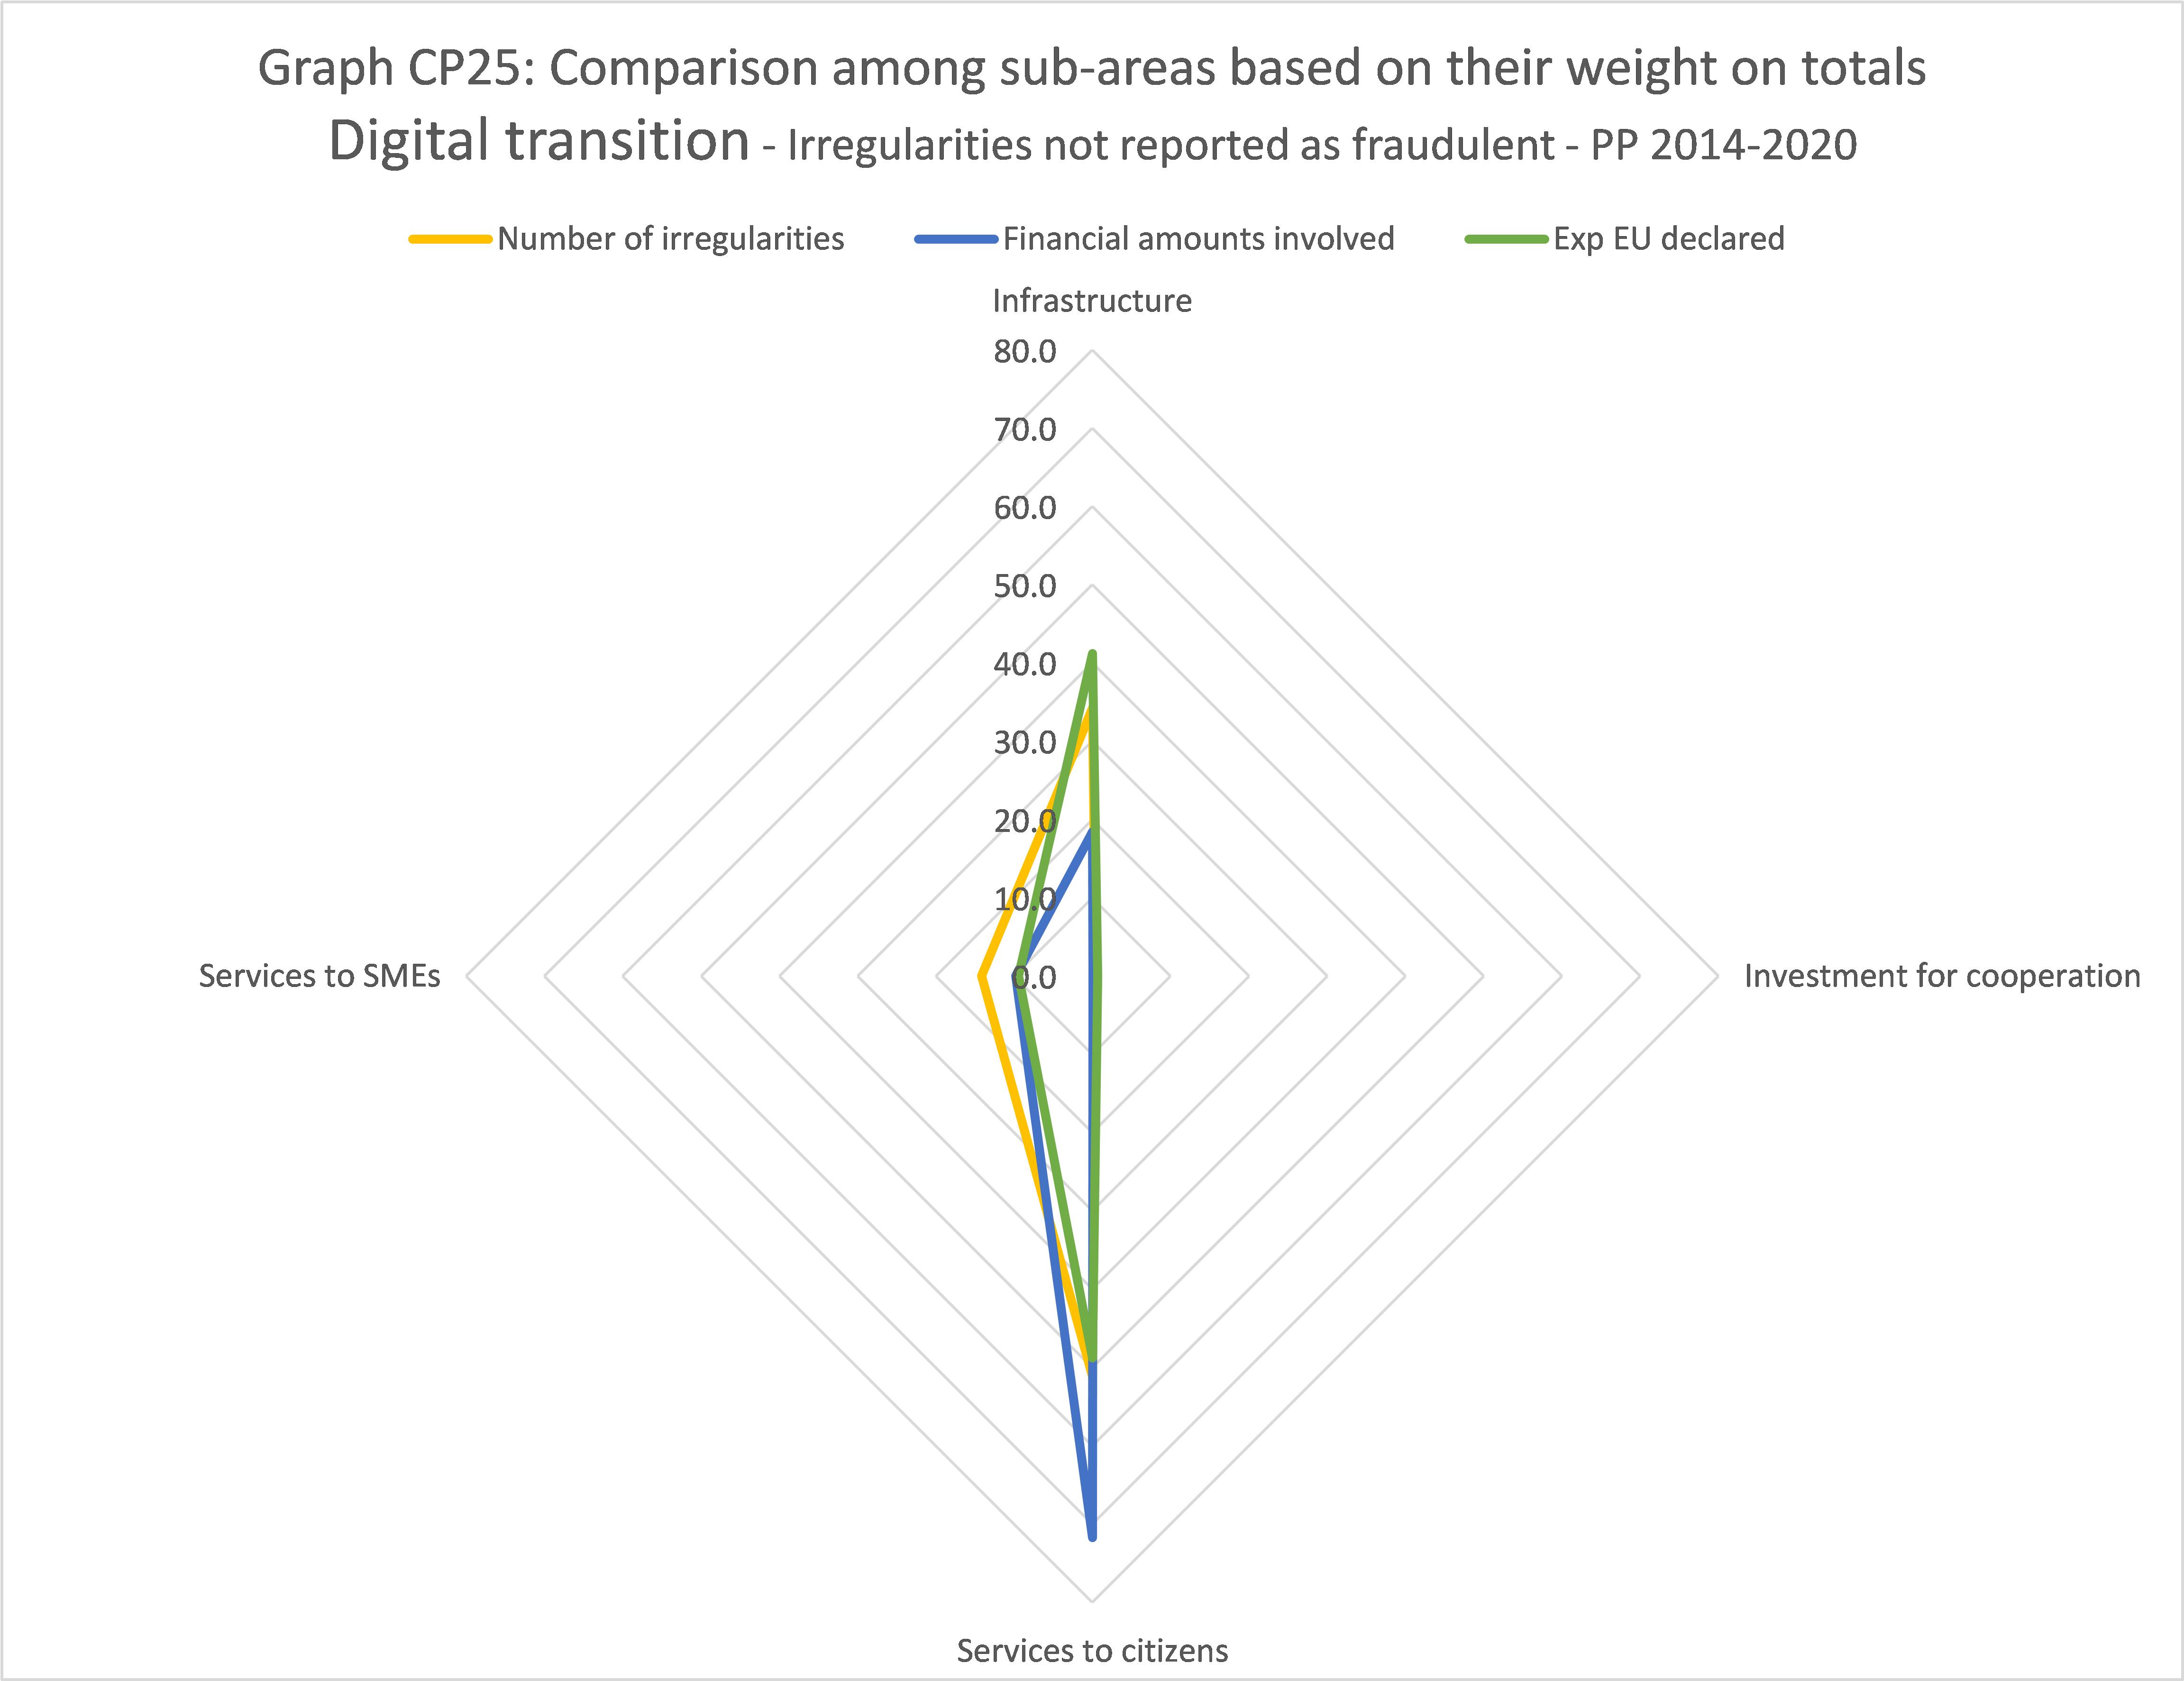
4.3.1.5. Social inclusion
In Figures CP12 and CP13 below, the analysis drills down to the level of the sub-areas of social inclusion, poverty and discrimination (see Annex 14). Figure CP12 focuses on fraudulent irregularities. Figure CP13 is based on non-fraudulent irregularities.
Fraudulent irregularities
Most fraudulent irregularities concerned active inclusion, but the highest irregular financial amounts were involved in investments to improve the health infrastructure. Active inclusion means equal opportunities, active participation, improving employability, employment for disadvantage people, etc. The most recurrent violations in active inclusion were about the implementation of the action or the documentary proof (in particular false documents). The high impact of fraudulent irregularities on active inclusion and health infrastructure is confirmed by the comparison with the share of expenditure declared for these intervention fields (see Graph CP26 below). The second highest number of fraudulent irregularities concerned access to services, which includes healthcare and social services of general interests. Most of the times, the violations related to access to services were about the non or partial implementation of the action.


Non-fraudulent irregularities
The financial amounts involved in non-fraudulent irregularities related to investments for active inclusion were very high, but this is due to one irregularity accounting for EUR 108 million (Figure CP13 below). In Graph CP27 below, the comparison is not influenced by this outlier. Graph CP27 below suggests that the detection of non-fraudulent irregularities related to active inclusion is influenced by the larger share of expenditure declared in this intervention field.
When comparing also on the basis of the share of expenditure declared, non-fraudulent irregularities related to social infrastructure and the development/regeneration of rural and urban areas come to the attention. This is shown by Graph CP27 below. The finding concerning regeneration/development may be overemphasized by the wrong use of intervention field codes by the Member States. In terms of financial amounts involved in non-fraudulent irregularities, also the investments to improve access to services (including healthcare and social services of general interest) and investments in favour of marginalised communities come to notice. In terms of number of irregularities, this is the case for the funding of child infrastructure (see Graph CP27).


4.3.1.6. Employment
In Figures CP14 and CP15 below, the analysis drills down to the level of the sub-areas of promoting sustainable and quality employment and supporting labour mobility (see Annex 14). Figure CP14 focuses on fraudulent irregularities. Figure CP15 is based on non-fraudulent irregularities.
Fraudulent irregularities
Most of fraudulent irregulaties and financial amounts involved concerned adaptation to change of workers and enterprises. The disproportionate weight of these irregularities is confirmed by Graph CP28 below, where also the share of expenditure declared for this type of projects is considered. Within this sub-area, the majority of fraudulet irregularities were related to operations for the design and dissemination of innovative and more productive ways of working. For these operations, the majority of violations concerned the non‑implementation of the action or conflict of interests, including combined in the same irregularity. In a number of cases, conflict interests was combined with multiple financing. Infringements related to the documentary proof were also recurrent, often because of false or falsified documents.
The high irregular financial amounts related to investments for the modernisation of the labour market (see Graph CP28 below) are due to one fraudulent irregularity, accounting for about EUR 4.5 million.


Non-fraudulent irregularities
Most of non-fraudulent irregulaties and financial amounts involved concerned access to employment (Figure CP15 below). However, this prevalence can be partly explained through the high share of expenditure declared for this type of operations, at least in terms of number of irregularities. Most of these irregularities and financial amounts were related to operations for access to employment for job-seekers and inactive people, including the long-term unemployed and people far from the labour market.
A disproportionate high number of non-fraudulent irregularities were reported with reference to support for self-employment and business start-up. In particular, this is suggested by Graph CP29 below, where the share of expenditure declared for this type of operations is considered.


4.3.2.Irregularities by type
Table CP10 below provides an overview of the categories of irregularities reported in connection with the Cohesion policy (CF, ERDF, ESF).
The same irregularity may be associated to several categories of infringement. That is why the row of totals does not result from summing up the figures in the respective columns of Table CP10 below: it would result in multiple counting of the same notification of irregularity.

Concerning fraudulent irregularities, the most frequent violations were about supporting documents. One out of four infringements and one out of two Euro concerning supporting documents was fraudulent (see FFL and FAL in Table CP10 above). Most of the times, false or falsified documents were used.
|
Examples of fraudulent irregularities related to the documentary proof
Example 1: Cross-checks allowed detecting that the same persons were declared as attending at the same time, different training activities, delivered by different trainers, in the framework of different projects.
Example 2: In a procurement procedure, two of the three bids were fictitious. These two offers had been made by bidders who had been told in advance by the beneficiary the prices to be used in the offers.
Example 3: With reference to the construction of ventilation systems in schools, payments to the beneficiary had been made, based on documentation evidencing the completion of the systems and their acceptance. However, these systems had not been completed.
Example 4: In the framework of an application for a grant, to evidence its financial capability, the applicant presented a false promise to grant a loan apparently issued by a leasing company. In reality, the promise had not been issued by that company and it was signed by a person with no authority for that.
|
High financial amounts were involved in fraudulent irregularities were infringements of contract provisions/rules took place. Fraud often consisted in incomplete or non-implementation of the funded action. The frequency of fraud was rather low (see FFL in Table CP10 above), also because violations concerning contract provisions were the second most reported among the non-fraudulent irregularities. The average financial amount involved in these fraudulent irregularities was high at more than EUR 5.5 million. However, this was influenced by two irregularities, accounting together for EUR 590 million. Net of these outliers, one out of four Euro involved in irregularities related to violations of contract provisions were fraudulent and the average financial amount involved in these fraudulent irregularities was still more than EUR 750 000.
|
Examples of fraudulent irregularities related to infringement of contract provisions/rules
Example 1: The beneficiary did not implement the project in line with the schedule specified in the project application, the output and the result indicators were not achieved. The funds granted to the project were used for another objective. The funds allocated to the implementation of the project were used for unreasonable and inefficient spending, which resulted in lack of liquidity. Significant amounts were transferred from the project bank account to the bank account of the beneficiary, without being covered by direct costs incurred and settled for the project.
Example 2: The beneficiary had not adapted the building in line with the project purpose (nursery) and had not obtained the authorisation that was necessary to put in place the activities for which the building should have been used.
|
Most of fradulent violations concerning ethics and integrity were about conflict of interests. Ethichs and integrity is the category of infringement with the highest frequency of fraud, also in terms of financial amounts involved. Six out of ten infringements and nine out of ten Euro concerning ethics and integrity were fraudulent (see FFL and FAL in Table CP10 above). Corruption was rarely reported.
|
Examples of fraudulent irregularities related to ethics and integrity
Example 1: A numer of companies were linked through shareholders or managers. These companies issued invoices between each other, submitted them for co-financing and then they cancelled these invoices.
Example 2: On the basis of an operational agreement with a development bank, a financial institution was in charge of granting loan supported with EU funding. There was a suspicion that the financial institution granted several loans to entities to which it was linked, in a situation of conflict of interest, which translated also in unequal treatment of potential loan-takers.
|
Infringements of public procurement rules were the most reported among non-fraudulent violation, but only in 4% of these cases fraud was detected. Despite this, one out of five Euro involved in irregularities related to public procurement were fraudulent. The low frequency of fraudulent cases suggests that either fraud detection, investigation and prosecution concerning public procurement or the administrative capability of contracting authorities should be improved.
4.4.Risk analysis and spontaneous reporting
In the antifraud cycle, the capability of detecting fraud and irregularities is a key feature that helps making the system effective and efficient in protecting the EU budget. In the 2017 PIF Report, to boost the capability to detect irregularities, the Commission recommended to the Member States to improve risk analysis and the use of spontaneous reporting of potential irregularities and strengthening the protection of whistle blowers that are also a crucial source for investigative journalism.
So far, there has been little improvement on the ground in the use of risk analysis (see Tables CP11, CP12 below). Effectively shifting from reactive to proactive detections based on risk analysis can take time. In addition, non-fraudulent irregularities that are detected and corrected at the national level before the expenditure is included in a statement submitted to the Commission for reimbursement do not have to be reported. Therefore, if risk analysis has a higher impact in detecting these irregularities ‘earlier’, Tables CP11-CP12 below would not capture this. On the other hand, this exception does not apply to fraudulent irregularities, which Member States should always report, even if they detect the irregularities before they submit the expenditure to the Commission.
Risk analysis has still a marginal contribution in detecting fraud, while information from civil society has a significant and growing role. During the past five years, about one out of four irregularities has been detected following tips from informant, whistle-blowers, etc. and information published in the media (see Table CP11 below). During the previous five years (2012-2016) just one out of ten fraudulent irregularities were detected because of information from civil society.

In relation to non-fraudulent irregularities, neither risk analysis nor information from civil society had a noticeable role in detection (see Table CP12 below). There was no significant improvement with respect to the previous five years.

The low share of irregularities detected following risk analysis suggests room for improvement in this domain.
It is true that risk analysis might have a more important role in detecting irregularities before expenditure is introduced in a request for reimbursement to the Commission. These detections do not have to be reported in IMS and Tables CP11 and CP12 above are based on information from IMS only. However, this is valid only for non-fraudulent irregularities. As already mentioned, fraudulent irregularities must always be reported in IMS, so for fraudulent irregularities the contribution of risk analysis to detections was certainly low.
In addition, analyses suggest that the total error rate (as an indicator of the amount of expenditure at risk and a proxy of the unknown value of the irregularities committed) tend to be higher than the detection rate (as a measure of the irregularities actually detected) in several Member States. The difference between total error rate and detection may be due to several reasons, including the functioning of the detection function of the management and control systems. This includes the possibility that, in some cases, there is no adequate follow up with reference to past operations on the risks identified during audit work.
Detection may improve by strengthening ex-post risk analysis, in view of performing tailored checks.
Checks before payment:
·may focus on single items of expenditure or single operations, in view of accepting them for reimbursement;
·may be carried out in a rather standard way and under time pressure, in view of respecting mandatory deadlines and facilitate legitimate business.
A significant part of the irregularities reported in IMS may be the outcome of the work of the national audit authorities, after payment. In the framework of the assurance package, the audit authorities target a number of operations selected on the basis of sampling methods where representativeness is the main leading principle, in view of projecting findings to the whole population of reference. Risk analysis can only have a limited role. In addition, audit work does not aim at detecting fraud.
Detection of fraud and irregularities could improve by adding to the above mentioned preventive checks and audits of operations also ex-post thematic risk analysis projects focusing on groups of past transactions. The choice of the groups of transactions could be based also (but not only) on the finding of previous audit work, including system audits. These risk analyses should consider these transactions in the wider context, including linking them to other transactions, considering links through beneficiaries, contractors, subcontractors, beneficial owners. They would result in selecting a number of transactions for tailored ex-post checks.
These risk analyses should be carried out by bodies that are external to the management authorities, to maximise positive incentives to detection. The involvement of the national Anti-fraud Coordination Services (AFCOS) could be considered, in line with the recommendation of the European Court of Auditors to expand the functions of these bodies to improve coordination. In case the AFCOS has no powers for administrative checks following risk analysis, arrangements with national bodies with such powers would be needed. In case the analysis or the following administrative checks would lead to suspicion of fraud, this should be reported with no delay to the competent national bodies, in line with relevant national rules, to be further investigated.
4.5.Antifraud and control activities by Member States
The present section aims to examine some aspects linked to the anti-fraud and control activities and results of Member States. Four elements are taken into account:
·duration of irregularities (fraudulent and non-fraudulent). No analysis by Member State is presented in this section;
·the number of irregularities reported as fraudulent by each Member State;
·the ratio between the amounts involved in cases reported as fraudulent and the payments that occurred in relation to PP 2014-20 (FDR) and the ratio between the amounts involved in cases not reported as fraudulent and the payments that occurred in relation to PP 2014-20 (IDR);
·the follow-up given to suspected fraud.
4.5.1.Duration of irregularities
Two third of the irregularities have been occurring over a period of time, averaging one year and a half. With reference to the cohesion and fisheries policies, of the 6 411 non‑fradulent irregularities reported by the Member States in relation to PP 2014-2020, 4 074 (64% of the total) have been occuring over a period of time. For the 687 irregularities reported as fraudulent, this percentage was similar, at 68%. The remaining irregularities consisted of a single act identifiable on a precise date (33% of the non-fraudulent irregularities and 29% of the fraudulent irregularities) or irregularities for which Member States have not provided the necessary information. The average duration of the irregularities that occurred over a period of time was about 16 months.
On average, it took more than one year to come to a suspicion that a fraudulent irregularity had been committed and one year and a half to close the case after reporting. The average duration of the different phases a case can go through, from perpetration to case closure, is visualised in Figures CP16 and CP17 below. For fraudulent irregularities, on average, it took 15 months to suspect that an irregularity had been or was being perpetrated. Once the suspicion arose, the Member States detected the fraudulent irregularity in three months. Then the fraudulent irregularity was reported to the Commission only eight months after detection. The average time from the reporting to the Commission to the case closure was one year and a half. For the non-fraudulent irregularities this took less than one year. This delay in closing fraudulent cases is consistent with the longer duration of criminal proceedings.
These average times are expected to increase as the implementation of the operational programmes progresses. Irregularities that are more craftily hidden or that are more difficult to investigate (and to close) will probably add as time passes, pushing these averages up. The average durations for the PP 2007-2013, which closed already in 2015, could be an interesting reference. They have been analysed in detail in the framework of the 2018 PIF Report. Both for fraudulent and non-fraudulent irregularities, on average, it took nearly two and a half years to suspect that an irregularity had been or was being perpetrated. This is much higher than the current averages for PP 2014-2020, so they can be expected to increase. Once the suspicion arose, the Member State detected the irregularity in less than half a year. Then the irregularity was reported to the Commission eight months after detection. This is similar to PP 2014-2020. The average time from the reporting to the Commission to the case closure was nearly three years and 21 months, for fraudulent and non-fraudulent irregularities, respectively. This is much longer than the current averages for PP 2014-2020, so they can be expected to increase.

4.5.2.Detection of irregularities reported as fraudulent by Member State
Map CP1 shows the number of irregularities each Member State reported as fraudulent for PP 2014-2020. In Map CP1, the darker the Member State, the higher the number of detections.

Past analysis based on PP 2007-2013 suggested that the concentration of detections is not fully explained by the concentration of payments. This analysis was quite solid, as it was based on operational programmes closed several years before. This finding seems to be confirmed by the emerging differences in the fraud detection rates related to PP 2014-2020, even if implementation is still ongoing and data can change. The outcome of that analysis based on PP 2007-2013 could be due to many different factors, including different underlying levels of irregularities and fraud, differences in the quality of prevention or detection work or different practices concerning the stage of the procedure when potentially fraudulent irregularities were reported. This analysis found that the divergence between the distribution of detections and the distribution of payments among Member States was smaller for the cohesion and fisheries policies than for CAP, especially in the case of fraudulent irregularities. This could suggest that when it come to cohesion and fisheries policies Member States take a more similar approach to criminal investigation and prosecution to protect the EU budget or to report suspected fraud than when it comes to agriculture.
4.5.3.Fraud detection rate
The fraud detection rate (FDR) compares the results obtained by Member States in the fight against fraud with the payments they received. Given the multi-annual nature of cohesion programmes, focus is on the whole PP 2014-2020.
Table CP13 below shows data on fraud detection in the Member States for PP 2014-2020. For reference purposes, the FDR for PP 2007-2013 is also included in the table. These two FDRs cannot be directly compared. While PP 2007-2013 has already gone through the whole implementation cycle, data for PP 2014-2020 are expected to change as implementation progresses. Many fraudulent irregularities are still to be detected. The increase in the financial amounts involved in irregularities will be at least partly counterbalanced by the increase in the payments made to the Member States.
The huge FDR recorded by Romania (12%) and Slovakia (nearly 10%) are due to single irregularities that involved huge financial amounts. These irregularities also have a strong impact on the EU-27 FDR, which is higher than in PP 2007-2013. Excluding these outliers the FDR of Romania and Slovakia would be about 2% and the EU-27 FDR would be 0.24%. The FDR exceeded 0.1% only in Latvia, Portugal, Sweden, Hungary, Denmark, Estonia. In the other Member States, the FDR was still close to zero. Comparison with the values consolidated for PP 2007-2013 suggests that the FDRs for PP 2014-2020 are likely to change significantly in the coming years.


4.5.4.Irregularity detection rate
This section focuses on the irregularity detection rate (IDR), which compares the results obtained by Member States in detecting non-fraudulent irregularities with the related payments.
Slovakia recorded the highest IDR, at more than 6.5%. In line with the general deep decrease in non-fraudulent irregularities reported, the IDR is above 1% only in Romania, Bulgaria, Greece. It is between 0.5% and 1% in Estonia, Austria, Croatia, Latvia, Czechia and Lithuania. In all other Member States, IDR is below 0.5%.


4.5.5.Follow-up to suspected fraud (programming period 2007-2013)
In the 2019 PIF Report, a new analysis of the follow-up Member States give to suspected fraud has been introduced. This analysis considers the irregularities that have been reported as suspected fraud from 2007 to 2013 and look at whether these irregularities have been dismissed (meaning whether they have been de-classified to administrative irregularities), they are still pending as suspected fraud or they have been confirmed as established fraud (following a final verdict). The details about the methodology for this analysis can be found in the 2019 PIF.
Table CP15 includes the update of the dismissal ratio, established fraud ratio and pending ratio. The dismissal ratio gives the percentage of fraudulent irregularites that have been reclassified as non-fraudulent during their lifetime, until end of 2021. The established fraud ratio gives the percentage of fraudulent irregularites that were classified as established fraud by the end of 2021. The pending ratio gives the percentage of fraudulent irregularities that were still classified as suspected fraud at the end of 2021. These three percentages sum to 100%.

Similar to the situation up to 2019, 27% of the irregularities reported as fraudulent were dismissed and reclassified as non-fraudulent by the end of 2021. Another 56% of these irregularities were still pending. This may point to a significant underestimation of the dismissal ratio, because part of these cases that are still classified as suspected fraud are already closed. In any case, between 8 and 15 years have already passed since the detection of the irregularity and the more time passes the less it can be expected that fraud will actually be established.
The dismissal ratio varied across the Member States. High dismissal ratios, especially when associated with high pending ratios, may be due either to the detection phase or to the investigation/prosecution phase. Low dismissal ratios may be positive, but they may also be the result of many irregularities still pending. After eight years following the end of the period under consideration, the dismissal ratio was zero or very low in many Member States. This indicator must be read in combination with the pending ratio. The latter points to the possibility that the dismissal ratio increases in the future (depending on the number of pending cases that are still open) or to an underestimation of the dismissal ratio (depending on the number of pending cases that are already closed). The dismissal ratio also depends on the stage of the procedure when an irregularity is classified as suspected fraud. For example, if such classification takes place when the administrative authority forwards a case to the prosecution service, dismissal is more likely. If an irregularity is classified as suspected fraud only when a prosecutor requests the indictment, dismissal is less likely.
The cases of established fraud were few. This may point to the need to further invest in the investigation/prosecution phase. At EU-27 level, the established fraud ratio was about 16%. It ranged from zero or about zero, in nearly half of the Member States, to 45%, in Germany. The established fraud ratio is not likely to increase significantly because, while 56% of cases are still classified as suspected fraud (pending ratio), part of them are already closed and, in any case, between 8 and 15 years have already passed since the detection of the irregularity. Similarly to the dismissal ratio, also the established fraud ratio depends on the stage of the procedure when an irregularity is classified as suspected fraud (see above).
4.6.Other internal policies
Other Funds are used under shared management to finance other internal policies. Tables CP16 and CP17 below provide an overview of all the irregularities and related financial amounts reported by the Member States up to 2021 with reference to the:
·Asylum, Migration and Integration Fund (AMIF): This Fund was set up for the period 2014-2020, with a total envelope of EUR 7.7 billion. It is meant to promote the efficient management of migration flows and the implementation, strengthening and development of a common EU approach to asylum and immigration. The largest proportion of the AMIF (approximately 62%) is channelled through shared management. Member States implement their multiannual national programmes, which the responsible national authorities prepare, implement, monitor and evaluate, in partnership with the relevant stakeholders in the field, including the civil society. All Member States except Denmark participate in the Fund’s implementation. Beneficiaries of the programmes implemented under the AMIF include state and federal authorities, local public bodies, non-governmental organisations, humanitarian organisations, international organisations and public law companies and education and research organisations.
·Fund for European Aid to the Most Deprived (FEAD): Over EUR 3.8 billion are earmarked for this Fund for the period 2014-2020. The FEAD supports Member States in providing material assistance to the most deprived, including food, clothing and other essential items for personal use. Material assistance has to go hand in hand with social inclusion measures, such as guidance and support to help people out of poverty. National authorities may also support non-material assistance to the most deprived people to help them integrate better into society. Following the Commission's approval of national programmes, national authorities decide on the delivery of the assistance through partner organisations (public bodies or often non-governmental organisations).
· European Globalisation Adjustment Fund (EGF): This Fund provides support to people who lose their jobs as a result of major structural changes in world trade patterns due to globalisation or as a result of the global economic and financial crisis. The EGF has a maximum annual budget of EUR 150 million for the period 2014-2020. It can fund up to 60% of the cost of projects designed to help workers made redundant find another job or set up their own business. EGF cases are managed and implemented by national or regional authorities. Each project runs for 2 years.
·Internal Security Fund (ISF): This Fund was set up for the period 2014-2020, with a total envelope of EUR 4.2 billion. The Fund promotes the implementation of the internal security strategy, law enforcement cooperation and the management of the EU's external borders. The 2014-2020 ISF is composed of two instruments, ISF Borders and Visa (B&V) and ISF Police. For the 2014-2020 period:
oEUR 3 billion is available to fund actions under the ISF B&V instrument, of which EUR 2.4 billion are to be channelled through shared management. All Member States except Ireland participate in the implementation. The United Kingdom also does not participate;
oabout EUR 1.2 billion is available to fund actions under the ISF Police instrument, of which EUR 754 million are to be channelled through shared management. All Member States except Denmark participate in the implementation. The United Kingdom also does not participate.
·Youth Employment Initiative (YEI): While supporting the Youth Guarantee, the YEI is aimed at young people who are not in education, employment or training (NEETs), including the long-term unemployed or those not registered as job-seekers. It ensures that in parts of Europe where the challenges are most acute, young people can receive targeted support. The YEI’s total budget is EUR 8.8 billion for the period 2014-2020. Of the total budget of EUR 8.8 billion, EUR 4.4 billion comes from a dedicated youth employment budget line, which is complemented by another EUR 4.4 billion more from ESF national allocations.
The FEAD was the Fund most affected by fraud. Financial amounts involved in these irregularities tend to be high. More than half of the irregularities reported as fraudulent were related to the FEAD and they represented 98% of the irregular financial amounts. The average financial amounts of these cases was nearly EUR 1 million and this was not due just to one case; 6 out of 8 cases ranged between about EUR 850 000 and EUR 1.8 million.

More than 90% of the detections of non-fraudulent irregularities were related to the following Funds: AMIF, the FEAD and the YEI. After a slight decrease in 2019, the number of AMIF irregularities increased in 2020, exceeding also the level reached in 2018, and dropped in 2021. The reporting of FEAD irregularities has been increasing since 2020, with higher financial amounts involved than with the AMIF. However, half of the irregular financial amounts were associated with the YEI.
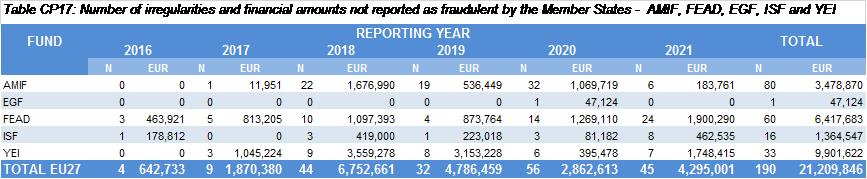
Main Findings
Fraudulent irregularities
Fraudulent irregularities related to PP 2007-2013 peaked in 2015, gradually decreased in the following years and in 2018 they were overtaken by those related to PP 2014-2020. Reporting related to PP 2014‑2020 basically started in 2017. It has been fluctuating around an increasing trend, with ups in 2018 and 2020 and downs in 2019 and 2021. These dynamics are in line with known trends and patterns in the detection and reporting of irregularities and are linked to the implementation cycle of multiannual programmes. For PP 2014-2020, the financial amounts skyrocketed in 2018 and 2021, but just because of single cases with huge amounts involved.
Also because of the higher share of EU financing channelled through it, ERDF was the Fund most affected by fraud, as it had the highest number of cases reported as fraudulent, and the related financial amounts were the highest. Since 2019, the number of ERDF fraudulent irregularities related to PP 2007-2013 has been rather low and stable, while the number of those related to PP 2014-2020 has been fluctuating around an increasing trend. After a decrease in 2017, the number of ESF fraudulent irregularities has been rather stable. Since 2010, potential fraud affecting the CF is regularly reported. In 2020, the majority of detections took place in Romania, while in 2018 it was Slovakia reporting most cases.
Non-fraudulent irregularities
The decrease in the number of non-fraudulent irregularities and financial amounts related to PP 2007-2013 was significant. This is in line with the multiannual nature of these structural programmes, which were closed already in 2015.
Basically, reporting related to PP 2014-2020 began in 2016. Since then, these detections and irregular financial amounts have been increasing for all Funds, but less than expected when compared to the previous programming period. In 2021, despite a slight increase in the number of reported irregularities, the financial amounts involved significantly rose, because of single cases with huge amounts involved.
As for the fraudulent irregularities, trends in financial amounts are also due to different reporting patterns in the Member States, in terms of the tendency to detect irregularities with high or low financial amounts involved and the tendency to detect irregularities that covered a significant or marginal share of the whole expenditure in the relevant project.
Is reporting for PP 2014-2020 in line with past trends?
Apart from outliers, the number and financial amounts reported as fraudulent for PP 2014-2020 were in line with those detected for PP 2007-2013 after a comparable period from the start of the programming period.
Focusing instead on the non-fraudulent irregularities, the fall in the number and financial amounts reported after 8 years from the start of the programming period is striking. The gap is significant for all Funds.
Analysis suggests the following potential causes covering a significant part of the decline:
·The implementation of the operational programmes under PP 2014-2020 has been delayed when compared with what the progress of implementation was under PP 2007‑2013.
·These was a noticeable change in the reporting of irregularities below the threshold of EUR 10 000. This may be due a change in the reporting practices or to less instances of small interlinked cases reported separately.
·For PP 2014-2020, the possibility to use simplified cost options (SCOs) has been extended. For the ESF, the increase in the percentage of expenditure covered by SCOs may be a significant factor contributing to the drop in non-fraudulent irregularities.
·For PP 2014-2020, the annual accounts have been introduced, with the new possibility of excluding expenditure under assessment of legality and regularity without a reduction in the support by the Fund. This may have brought a more orderly treatment of irregularities.
Also changes in the derogations to reporting, which entered into force in 2009, might have played a role, in case Member State were slow in adapting their reporting practices.
There are no indicators to gauge the increase in the capability of the implementing bodies and of the beneficiaries and the impact that this could have had in terms of decrease of unintentional irregularities. However, this can be an additional factor contributing to the trend in non-fraudulent irregularities. Capacity building actions may have been put in place in recent years and this is relevant, especially in case implementing bodies and beneficiaries during PP 2014-2014 are the same as during PP 2007-2013.
Member States should assess the extent to which these potential explanations and other possible explanations actually apply to their operational programmes, with the aim of implementing corrective measures in case the decline may be due to less effective detection and reporting.
Irregularities by area of the cohesion policy
Concerning fraud, risks seem to be higher in the areas of the cohesion policy related to:
·transport and environment protection, because of the high financial amounts involved in fraudulent irregularities;
·research, technological development and innovation (RTD&I) and employment, because of the frequency of fraudulent irregularities.
Concerning non-fraudulent irregularities, RTD&I and inclusion were areas with very high number of cases and/or financial amounts involved. As for fraudulent irregularities, also for non-fraudulent irregularities, the irregular financial amounts involved in transport were disproportionately high.
Green transition
Concerning fraud in relation to the green transition, analysis suggests higher risks for investments in:
·energy efficiency (contributing to the transition to low-carbon economy), because of the number of fraudulent irregularities. When specified, they mostly concerned renovation of existing housing stock and were about conflict of interests in procurement or incorrect documents;
·provision of drinking water (contributing to environment protection), because of the financial amounts involved;
·waste management (contributing to environment protection), both in terms of number of fraudulent irregularities and financial amounts. Most of these fraudulent irregularities concerned household waste management and public procurement.
Concerning non-fraudulent irregularities in relation to the green transition, analysis suggests higher risks for investments in:
·water management, because of the financial amounts involved on the irregularities;
·energy efficiency, including the renovation of public infrastructure, and waste management, because of the number of irregularities.
·renewable energy (solar) and risk prevention, because of the number of irregularities and, for risk prevention, because of the financial amounts involved in the irregularities.
Reseach, technological development and innovation
Research, technological development and innovation was an area at risk, with frequent irregularities and the high financial amounts involved, in particular with reference to assistance to these activities in SMEs. For the latter, the most recurrent fraudulent violations concerned the documentary proof, in particular false or falsified documents. There were also a significant number of fraudulent cases of conflict of interests.
Activities in reasearch centres and the technology transfer contributed to the total number of non-fraudulent irregularities affecting research and innovation. However, this seems to be more in line with the share of expenditure declared for these intervention fields.
Transport and networks
Concerning fraud in relation to trasport and networks, analysis suggests higher risks for investments in:
·roads that are not part of TEN, because of the number of fraudulent irregularities, which is probably linked to the higher number of projects, which reach the regional or local level. The most frequent violations concerned the documentary proof, in particular false or falsified documents. There were several cases concerning ethics and integrity, including conflict of interests and corruption, and several cases related to public procurement;
·railways and TEN roads, because of the high financial amounts involved in fraudulent irregularities;
Concerning non-fraudulent irregularities in relation to trasport and networks, analysis suggests higher risks for investments in:
·roads, with higher financial amounts involved in TEN investments;
·no TEN railways, because of the number of irregularities and TEN railways, because of the financial amounts involved;
·TEN multimodal transport investments;
·investments in the electricity networks, because of the number of irregularities despite the low amount of expenditure declared so far in this area.
Digital transition
Fraudulent irregularities related to the digital transition were not frequent and they concerned services and applications both for SMEs and for e-Government, with higher financial amounts involved in the latter.
Non-fraudulent irregularities were more frequent. The number of irregularities related to services and applications for SMEs was more significant than that related to e‑Government, when considering the lower amount of expenditure declared in services and applications for SMEs. However, the financial amounts involved in irregularities related to services and applications for e-Government were higher. Non-fraudulent irregularities were reported also in relation to investments in the infrastructure for the digital transition.
Social inclusion, poverty and discrimination
Concerning fraud in relation to social inclusion, poverty and discrimination, analysis suggests higher risks for investments in:
·active inclusion, because of the number of fraudulent irregularities. The most recurrent violations were about the implementation of the action or the documentary proof (in particular false documents);
·health infrastructure, because of the financial amounts involved in fraudulent irregularities. In addition, fraudulent irregularities impacted also on the funding for the improvement of access to services, which include healthcare, and most of the times, these violations were about the non or partial implementation of the action.
Concerning non-fraudulent irregularities, analysis suggests higher risks for investments in:
·social infrastructure and projects for urban and rural regeneration;
·improved access to health care and social services and investments in favour of marginalised communities, because of the financial amounts involved in irregularities, and child infrastructure, because of the number of cases despite low expenditure declared.
Promoting sustainable and quality employment and supporting labour mobility
Concerning fraud in relation to the promotion of employement and labour mobility, analysis suggests higher risks for investments in the adaptation to change of workers and enterprises, in particular operations for the design and dissemination of innovative and more productive ways of working. For these operations, the majority of violations concerned the non‑implementation of the action or conflict of interests, including combined in the same irregularity. In a number of cases, conflict of interests was combined with multiple financing. Infringements related to the documentary proof were also recurrent, often because of false or falsified documents.
Concerning non-fraudulent irregularities, analysis suggests higher risks for investments in:
·access to employment, in particular operations for job-seekers and inactive people, including the long-term unemployed and people far from the labour market;
·support for self-employment and business start-up, because of the number of fraudulent irregularities.
Irregularities by type
Concerning fraudulent irregularities, the most frequent violations were about supporting documents, in particular the use of false or falsified documents.
High financial amounts were involved in fraudulent irregularities were infringements of contract provisions/rules took place. Fraud often consisted in incomplete or non-implementation of the funded action.
Most of fraudulent violations concerning ethics and integrity were about conflict of interests. Ethichs and integrity is the category of infringement with the highest frequency of fraud.
Infringements of public procurement rules were the most reported among non-fraudulent violation, but only in 4% of these cases fraud was detected. The low frequency of fraudulent cases suggests that either fraud detection, investigation and prosecution concerning public procurement or the administrative capability of contracting authorities should be improved.
Risk analysis and spontaneous reporting
Risk analysis has still a marginal contribution in detecting fraud, while information from civil society has a significant and growing role. During the past five years, about one out of four irregularities has been detected following tips from informant, whistle-blowers, etc. and information published in the media.
In relation to non-fraudulent irregularities, neither risk analysis nor information from civil society had a noticeable role in detection. There was no significant improvement with respect to the previous five years.
Detection of fraud and irregularities could improve by adding to preventive checks before payments and audits of operations also ex-post thematic risk analysis projects focusing on groups of past transactions. The choice of the groups of transactions could be based also (but not only) on the finding of previous audit work, including system audits. These risk analyses should consider these transactions in the wider context, including linking them to other transactions, considering links through beneficiaries, contractors, subcontractors, beneficial owners. These risk analysis projects should be carried out by bodies that are external to the management authorities and would result in selecting a number of transactions for tailored ex-post checks. The involvement of the national Anti-fraud Coordination Services (AFCOS) could be considered.
Antifraud and control activities by the Member States
Two third of the irregularities have been occurring over a period of time, averaging one year and a half. The rest of the irregularities consisted of a single act identifiable on a precise date. On average, it took more than one year to come to a suspicion that a fraudulent irregularity had been committed and one year and a half to close the case after reporting. These average times are expected to increase as the implementation of the operational programe progresses.
With reference to PP 2014-2020, the Fraud Detection Rates recorded by Romania (12%) and Slovakia (nearly 10%) were huge, but due to single irregularities that involved enormous financial amounts. These irregularities also had a strong impact on the EU-27 FDR, which was about 1% and higher than in PP 2007-2013. The FDR exceeded 0.1% only in Latvia, Portugal, Sweden, Hungary, Denmark, Estonia.
With reference to PP 2014-2020, Slovakia recorded the highest Irregularity Detection Rate, at more than 6.5%. In line with the general deep decrease in non-fraudulent irregularities reported, the IDR was above 1% only in Romania, Bulgaria, Greece. At EU-27 level, IDR was about 0.7%, much lower that in PP 2007-2013.
These FDRs and IDRs for PP 2014-2020 are likely to change significantly in the coming years, with progress in the implementation of the operational programmes.
About one fourth of the irregularities reported as fraudulent were dismissed. The dismissal ratio varied across the Member States. High dismissal ratios, especially when associated with a high number of still pending cases, may be due to (i) a detection phase that leads to report to the judicial authority cases that were not fraudulent; (ii) an investigation/prosecution phase that gives low priority or does not have enough resources to properly address the case; (iii) the stage of the procedure when an irregularity is classified as suspected fraud.
Analysis suggests that the dismissal ratio is significantly underestimated. About 56% of the irregularities reported as fraudulent were still pending. However, for part of them no changes of status are to be expected, because they are closed cases. In any case, between 8 and 15 years have already passed since the detection of the irregularity. There were few cases of established fraud. This may indicate the need to invest further in the investigation/prosecution phase.
Other shared management funds
Concerning shared management Funds to finance other internal policies, the FEAD was the Fund most affected by fraud. Financial amounts involved in these irregularities tend to be high, as the average financial amounts of these cases was nearly EUR 1 million.
More than 90% of the detections of non-fraudulent irregularities were related to the following Funds: AMIF, the FEAD and the YEI. After a slight decrease in 2019, the number of AMIF irregularities increased in 2020, exceeding also the level reached in 2018, and dropped in 2021. The reporting of FEAD irregularities has been fluctuating during the period, with higher financial amounts involved than for the AMIF. Half of the irregular financial amounts were associated with the YEI.
5.PRE-ACCESSION POLICY
Executive Summary
Irregularities reported during the period 2017-2021 in relation to pre-accession occurred in connection with funds distributed under Pre-accession Assistance (2000-2006, PAA), the Instrument for Pre-accession Assistance I 2007-2013 (IPA I) and the Instrument for Pre-accession Assistance II 2014-2020 (IPA II). About 19% of these irregularities were reported as fraudulent. This percentage (fraud frequency level – FFL) changed over time, increasing in 2019 and peaking in 2021 at 25%. In 2021, nearly 60% of cases and more than 70% of the related financial amounts were reported by Turkey.
There was just one non-fraudulent irregularity related to PAA reported in 2021, while the latest fraudulent irregularities were detected in 2018. This is in line with the implementation cycle of the PAA programmes, which covered the period 2000-2006. Since 2000, 14 beneficiary countries have reported 3 269 irregularities (accounting for around EUR 416 million). The three most affected funds were SAPARD (rural development), PHARE (institution building, cohesion and cross border cooperation) and ISPA (large infrastructure). In terms of financial amounts, ISPA was more affected than PHARE, even though ISPA accounted for fewer irregularities. This is in line with the larger size of the projects funded by ISPA. Most of the irregularities related to SAPARD were reported by Romania, followed by Bulgaria and Poland. Most of the irregularities related to PHARE were evenly split between Romania and Bulgaria. Reporting from Romania accounted for the bulk of irregularities related to the ISPA programme.
About 65% of the irregularities reported during the past 5 years were still related to IPA I, although the number of such irregularities fell markedly in the last two years. The fraud frequency level was 18% over the past five years, although in 2019 it exceeded 30%. Since 2007, 10 beneficiary countries have reported 860 irregularities (accounting for EUR 76 million). The highest number of irregularities concerned IPARD (the successor of SAPARD for rural development), with over 87% of the irregularities detected by Turkey. Only two other countries, Croatia and North Macedonia, reported IPARD cases. A broader range of countries reported irregularities concerning cross border cooperation (CBC); this was the second most affected component of IPA I. The majority of these irregularities were reported by Bulgaria. Turkey reported 76% of the irregularities related to human resources development (HRD) programmes, the third most affected component of IPA I.
2017 saw the start of irregularities reporting for IPA II. The number of irregularities reported fell markedly in 2020, to bounce back in 2021. During the past 5 years, the fraud frequency level was 19%, close to the FFL for IPA I. The two main contributors to detection were Turkey and North Macedonia, which together reported about 77% of irregularities and 82% of the related financial amounts. More than 76% of the 227 irregularities related to IPA II (accounting for EUR 5 million) concerned IPARD. The only other component with more than 20 irregularities was cross border cooperation. Most of these irregularities were detected by Serbia and Bulgaria.
5.1.Introduction
Section 5 presents a statistical evaluation of irregularities and fraud detected by the beneficiary countries during 2021 with reference to the pre-accession policy. It places these detections in the context of past years and relevant programming periods.
The EU provides pre-accession assistance to candidate countries and potential candidates for EU membership to support them in meeting the accession criteria and to bring their institutions and standards in line with the EU acquis. The current candidate countries are Albania, Montenegro, North Macedonia, Serbia and Turkey; potential candidates are Bosnia and Herzegovina and Kosovo.
In the whole section, when reference is made to ‘fraudulent’ or ‘fraud’, it includes ‘suspected fraud’ and ‘established fraud’.
5.2.Instruments for Pre-accession Assistance
5.2.1.Before 2007: Pre-accession Assistance (PAA)
Before 2007, the EU provided pre-accession assistance to candidate countries through a number of separate instruments. The PHARE programme provided support for institution-building measures and associated investment, as well as funding measures to promote economic and social cohesion and cross border cooperation. The ISPA programme dealt with large-scale environmental and transport infrastructure projects, while the SAPARD programme supported agricultural and rural development. For the programme years 2002‑2006, Turkey received assistance under the specific pre-accession-oriented framework of the Pre‑accession Financial Assistance for Turkey (TIPAA). The CARDS programme was the main financial instrument to promote stability in the Western Balkans and facilitate the region’s closer association with the EU. The countries that joined the EU in 2004 received a Transition Facility (TF) in 2004-2006, as did Bulgaria and Romania in 2007-2010. All pre‑2007 programmes and projects have been completed.
5.2.2.2007-2013: The Instrument for Pre-accession Assistance (IPA I)
For the period 2007-2013, the EU supported reforms in the ‘enlargement countries’ (i.e., the candidate countries Albania, Montenegro, North Macedonia, Serbia, and Turkey and potential candidates Bosnia and Herzegovina and Kosovo), providing financial and technical help via the Instrument for Pre-accession Assistance (IPA I). IPA I funds built up the capacities of these countries throughout the accession process. IPA I had a budget of about EUR 11.5 billion and consisted of five components.
The five components of IPA I were: (i) transition assistance and institution building (TAIB); (ii) cross border cooperation (CBC); (iii) regional development (transport, environment and economic development) (REGD); (iv) human resource development (strengthening human capital and combatting exclusion) (HRD); and (v) rural development (IPARD). Candidate countries were eligible for all five components; potential candidates were eligible only for the first two.
The policy and programming of IPA I consisted of (i)
multiannual indicative financial framework
on a three-year basis, established by country, component and theme; and (ii)
multiannual indicative planning documents
per country or per groups of countries (regional and horizontal programmes). The candidate countries also had to submit strategic coherence frameworks and multiannual operational programmes for the third and fourth component. Their principal aim was to prepare beneficiary countries for the future use of cohesion policy instruments by closely imitating its strategic documents, national strategic reference framework and operational programmes, and management modes.
5.2.3.2014 – 2020: The Instrument for Pre-accession Assistance (IPA II)
For the period 2014-2020, IPA II built on the results achieved under IPA I and set a new framework for providing pre-accession assistance. The primary innovation of IPA II is its strategic focus on specific objectives. The multiannual financial framework for 2014-2020 allocated EUR 12.8 billion for the instrument.
Financial assistance under IPA II pursues four specific objectives: (i) support for political reforms; (ii) support for economic, social and territorial development; (iii) strengthening the beneficiaries’ ability to fulfil (future) obligations stemming from EU membership by supporting progressive alignment with the EU acquis; and (iv) strengthening regional integration and territorial cooperation. The IPA II Regulation limits financial assistance to five policy areas: (i) reforms in preparation for EU membership and related institution-and capacity-building; (ii) socio-economic and regional development; (iii) employment, social policies, education, promotion of gender equality, and human resources development; (iv) agriculture and rural development; and (v) regional and territorial cooperation.
To provide an individual implementation framework for each beneficiary, country strategy papers were drafted, identifying sectors where improvements were necessary to advance membership goals. The priorities outlined in these papers were translated into detailed actions, included in annual or multiannual action programmes that take the form of financing decisions adopted by the European Commission.
The bulk of IPA II assistance is channelled through the country action programmes; these are the main vehicles for addressing country-specific needs in priority sectors as identified in the indicative strategy papers. Additionally, IPA II funded multi-country action programmes to enhance regional cooperation, particularly in the Western Balkans. Financial assistance was also provided via cross border cooperation programmes to encourage territorial cooperation between IPA II beneficiaries and via rural development programmes to encourage the development of rural areas.
In accordance with the Financial Regulation, IPA II-funded activities are managed either directly (meaning that the Commission implements them directly until the relevant national authorities are accredited to manage the funds) or indirectly (meaning that the Commission delegates the management of certain actions to external entities, while still retaining overall final responsibility for the general budget execution). Cross border cooperation programmes with Member States are administered via shared management, meaning that implementation tasks are delegated to the Member States.
5.2.4.2021 – 2027: The Instrument for Pre-accession Assistance (IPA III)
The general objective of the new IPA III instrument is to support the beneficiaries in adopting and implementing the political, institutional, legal, administrative, social and economic reforms required by those beneficiaries to comply with Union values and to progressively align to Union rules, standards, policies and practices with a view to Union membership.
IPA III will leverage support to reforms fostering sustainable socio-economic development and bringing the partners closer to the Union’s values and standards.
The new programming framework 2021-2027 reflects the specific objectives of the IPA III Regulation and focuses on the priorities of the enlargement process according to five thematic windows, which mirror the clusters of negotiating chapters as per the revised enlargement methodology.
For the new multiannual financial framework period 2021-27, the IPA III budgetary envelope is EUR 14.2 billion.
5.3.General analysis
This section focuses on the 700 irregularities reported during the period 2017-2021, in relation to pre-accession funds. These irregularities occurred in connection with funds distributed under the 2000-2006 PAA and under IPA I and IPA II. This is further explored in Sections 5.4, 5.5 and 5.6. There were no irregularities reported under IPA III yet.
Table PA1 (and the related graph) shows all the fraudulent and non-fraudulent irregularities detected by the beneficiary countries during the past 5 years under pre-accession programmes. About 19% of these irregularities were reported as fraudulent. This percentage (the fraud frequency level – FFL) changed over time, increasing significantly in 2019 and peaking in 2021 at 25%.


For 2021, irregularities were reported by eight beneficiary countries (see Table PA2). Nearly 60% of these cases and more than 70% of the related financial amounts were reported by Turkey. As mentioned, the global fraud frequency level in 2021 was 25%, ranging from 54% in Serbia to 0 in Albania, Bulgaria, Croatia and Romania. When focus is on the financial amounts, the differences were even greater. Here, comparison is based on the share of financial amounts reported as fraudulent (fraud amount level – FAL). Serbia recorded the highest FAL, at 72%, while Turkey accounted for the lowest, at 32% (apart from Albania, Bulgaria, Croatia and Romania, which reported no fraudulent cases and Montenegro, which reported one case but without specifying of the financial amounts involved).

5.4.Pre-accession Assistance (PAA 2000-2006)
5.4.1.Recent trends
There was just one non-fraudulent irregularity related to PAA reported in 2021, while the latest fraudulent irregularities were detected in 2018. During the past 5 years, the beneficiary countries reported just 15 irregularities, where about EUR 3 million were involved (see Table PA3 and related graph).


5.4.2.Recent trends by component
The 15 irregularities related to PAA reported during the past 5 years concerned four components. TIPAA accounted for the highest number of irregularities and ISPA for the highest financial amounts (see Table PA4).

5.4.3.Recent trends by beneficiary country
The 15 irregularities related to PAA reported during the past 5 years were evenly split among three countries: Bulgaria, Romania and Turkey. The highest financial amounts were reported by Bulgaria (see Table PA5).

5.4.4.Trends since the start of PAA, by beneficiary country and component
Table PA6 and related graph show the number of irregularities and related financial amounts concerning PAA since 2000, by beneficiary country and component.
Since 2000, 14 beneficiary countries have reported 3 269 irregularities related to six components. The three most affected components were SAPARD, PHARE and ISPA. In terms of financial amounts, ISPA was more affected than PHARE, even though ISPA accounted for fewer irregularities. The PHARE programme provided support for institution building, as well as for promoting economic and social cohesion and cross border cooperation. The ISPA programme dealt with large-scale environmental and transport infrastructure projects. This contributed to the higher financial amounts involved in the irregularities related to ISPA.
Most of the irregularities related to SAPARD (rural development) were reported by Romania, followed by Bulgaria and Poland. Most of the irregularities related to PHARE were evenly split between Romania and Bulgaria. Reporting from Romania accounted for the bulk of irregularities related to the ISPA programme (see Table PA6 and related graph).


5.5.Instrument for Pre-Accession Assistance (IPA I, 2007-2013)
5.5.1.Recent trends
Most of the irregularities reported during 2017-2021 were still related to IPA I (458 out of 700), although the number of these irregularities fell markedly in the last two years. The FFL was 18% during the past 5 years, although in 2019 it exceeded 30%. The number of detections of fraudulent irregularities was particularly high in 2019 (see Table PA7 and related graph).


5.5.2.Recent trends by component
The 458 irregularities related to IPA I during the past 5 years concerned five components. By far, the highest number of cases and the highest financial amounts concerned IPARD, the successor of SAPARD supporting agriculture and rural development.

5.5.3.Recent trends by beneficiary country
During the past 5 years, irregularities related to IPA I were reported by nine countries. The leading contributor to detection was Turkey, which reported about 74% of irregularities and 87% of the financial amounts.

5.5.4.Trends since the start of IPA I, by beneficiary country and component
Table PA10 and related graph show the number of irregularities and related financial amounts concerning IPA I since 2007, by beneficiary country and component.
Since 2007, 10 beneficiary countries reported 860 irregularities related to five components. The highest number of irregularities concerned IPARD. About 87% of the irregularities related to IPARD were detected by Turkey. Only two other countries, Croatia and North Macedonia, reported IPARD cases. A broader range of countries reported irregularities concerning cross border cooperation programmes (CBC-IPA), the second most affected component of IPA I. The majority of irregularities were reported by Bulgaria. The only non‑Member State that reported irregularities relating to CBC was Serbia (apart from one irregularity reported by Turkey). Besides reporting most of the IPARD irregularities, Turkey also reported 76% of the irregularities related to the human resources development (HRD) programmes, the third most affected component of IPA I (see Table PA10 and related graph).


5.6.Instrument for Pre-accession Assistance II (IPA II 2014-2020)
5.6.1.Recent trends
The reporting of irregularities relating to IPA II started in 2017. The number of irregularities reported fell markedly in 2020, to bounce back in 2021. During the past 5 years, the fraud frequency level was 19%, close to the FFL for IPA I (see Table PA11 and related graph).


5.6.2.Recent trends by component
The 227 irregularities related to IPA II during the past 5 years concerned five components. By far, the highest number of cases and the highest financial amounts concerned IPARD. The only other component with more than 20 irregularities was cross border cooperation. Most of these irregularities were detected by Serbia, closely followed by Bulgaria.

5.6.3.Recent trends by beneficiary country
During the past 5 years, irregularities related to IPA II were reported by seven countries. The two main contributors to detection were Turkey and North Macedonia, which together reported about 77% of irregularities and 82% of the related financial amounts.

5.6.4.Trends since the start of IPA II, by beneficiary country and component
Table PA14 and the related graph show the number of irregularities and related financial amounts concerning IPA II, by beneficiary country and component. As reporting for IPA II started in 2017, data for the past 5 years and data from the start of the programmes (2014) coincide.


6.Direct Management
6.1.Introduction
Section 6 contains a descriptive analysis of the data on recovery orders issued by Commission services in relation to expenditures managed under ‘direct management’ mode, which is one of the three implementation modes the Commission can use to implement the budget.
According to the Financial Regulation, the Commission implements the budget directly (‘direct management’) as set out in Articles 125 to 153, through its departments, including its staff in the Union delegations under the authority of their respective Head of delegation, in accordance with Article 60(2), or through executive agencies as referred to in Article 69.
For the financial year 2021, a total of EUR 21 711 million has been disbursed under ‘direct management’ mode. Table DM1 presents the actual payments by policy areas. Compared to previous years, actual payments are lower.
Table DM1 – Payments made in financial year 2021 by policy area

6.2.General analysis
For the financial year 2021, the Commission services registered 879 recovery items in ABAC that were qualified as irregularities, for a total financial value EUR 42.89 million irregular amounts. Among these recovery items, 54 have been reported as fraudulent, involving EUR 7.04 million irregular amounts.
However, qualifications attributed to recovery items may change over the years: it may happen that cases of irregularities are turned into suspicions of fraud or the other way round, suspicions of fraud are reclassified as non-fraudulent irregularities upon the closure of the OLAF investigation.
6.2.1.Five year analysis 2017-2021
The following analysis gives an overview of recovery data recorded in the ABAC system in the last five years. Between 2017 and 2021, on average, for one year, there were 50 recovery items qualified as ‘irregularities reported as fraudulent’. The ratio between the financial amounts related to these irregularities and expenditure during 2017-2021 is very small, it remains close to zero (0.041%). This ratio is quite stable throughout the years. Figures are presented in Table DM2 below.
Table DM2 – Irregularities reported as fraudulent and related amounts, financial years 2017-2021

With regard to ‘irregularities not reported as fraudulent’, between 2017 and 2021, on average, for one year, 1 420 recovery items are registered. Since 2020, there is a noticeable decline, both in the number of cases and in the percentage of irregular amount per payments. Figures are presented in Table DM3 below.
Table DM3 – Irregularities not reported as fraudulent and related amounts, financial years 2017-2021

Between 2017 and 2021, in total, there were 7 102 registered recovery items qualified as ‘irregularities not reported as fraudulent’, with an aggregate recovery amount of EUR 271.72 million. The ratio between these aggregate irregular amounts corresponding to the recovery items and expenditure during 2017-2021 is less than 0.25% (see Total in Table DM3). This ratio has been steadily declining for many years now from the zone of 0,5-0,6% (six years ago).
These figures show the efficiency of the irregularity detection and recovery mechanisms in place.
6.3.Specific analysis
6.3.1.Recoveries according policy areas
Table DM4 provides an overview of irregularity statistics by policy area for 2021.
Table DM4 – Irregularities reported by policy areas and related amounts, 2021

In the financial year 2021, the highest numbers of recovery items qualified as 'irregularities not reported as fraudulent' was recorded in the budget area ‘Research and innovation’ (126). It was the ‘Single Market’ policy field where the highest irregular amounts were registered (EUR 11.54 million).
During the same year, 54 recovery items were registered as ‘irregularities reported as fraudulent’. The three policy areas with the highest number of irregularities reported were ‘Environment and Climate Action’ (12 items), ‘Security, Defence, Border Management’ (11 items) and ‘European Strategic Investments’ (10 items). EUR 7.04 million were involved in these irregularities, out of which 31% (EUR 2.16 million) were related to the policy area ‘Research and Innovation’.
6.3.2.Recoveries according to legal entity residence
During 2017-2021, with regard to ‘irregularities not reported as fraudulent’, 74% of the total number of recovery items and 70% of the related recovery amounts concerned legal entities that are resident of the EU-27. For ‘irregularities reported as fraudulent’, these ratios are higher: 76% of the total number of recovery items and 75% of the related recovery amounts concerned a legal entity residing in the EU-27.
Table DM5 – Recoveries per country of residence of the legal entity, 2017-2021

Table DM5 above summarises the total recoveries made during the past five years according to the country of residence of the legal entity to which the payment was unduly made.
6.3.3.Method of detection
For each recovery item, the Commission service issuing the recovery order has to indicate how the irregularity has been detected. Six different categories are pre-defined for this purpose, two of which fall under the direct responsibility of the European Commission: ‘Ex-ante controls’ and ‘Ex-post controls’. Table DM6 provides a breakdown of the recoveries by source of detection and by qualification.
Table DM6 – Irregularities reported by source of detection and by qualification, 2017-2021

With reference to the ‘irregularities reported as fraudulent’, ‘OLAF’ has been mentioned as the source of detection in relation to 86% of recovery items, corresponding to 91% of total recovery amounts. Meanwhile ‘Ex-post controls’ were the source of detection of another 10% of this type of recovery items, corresponding to another 7% of the recovery amounts.
About 97% of ‘irregularities not reported as fraudulent’ were detected through Commission controls (ex-ante and ex-post controls). The share of ex-ante controls has been steadily declining from 30% (six years ago) to 8% (value of the indicator now).
6.3.4.Types of irregularity
The Commission services also have to specify, in the recovery context, the type of irregularity in relation to each recovery item. Several types can be attributed to one recovery item. For ‘irregularities reported as fraudulent’, ‘Amount ineligible’ was the most frequent type during the past five years. In relation to ‘irregularities not reported as fraudulent’, ‘Amount ineligible’ remains the most frequent irregularity type, followed by ‘Under-performance/non-performance’ and then by ‘Documents missing’.
Table DM7 provides the full picture regarding the frequency of each type during the past five years. The figures are stable and have been following the same pattern for many years.
Table DM7 – Types of irregularity, 2017-2021

6.3.5.Recovery
Once a recovery order is issued, the beneficiary is requested to pay back the amount unduly received or the amount is offset from remaining payments for the same beneficiary.
For the recovery orders issued between 2017 and 2021, 55% of the total irregular amounts have already been recovered. The recovery rate for ‘irregularities reported as fraudulent’ (30%) remains well below the one calculated for ‘irregularities not reported as fraudulent’ (59%)
COUNTRY FACTSHEETS
Belgium - Belgique/België


Bulgaria – България


Czech Republic - Česká republika


Denmark – Danmark


Germany – Deutschland


Estonia – Eesti


Ireland – Éire


Greece – Ελλάδα


Spain – España


France


Croatia – Hrvatska


Italy – Italia


Cyprus – Κύπρος


Latvia – Latvija


Lithuania – Lietuva


Luxembourg


Hungary - Magyarország

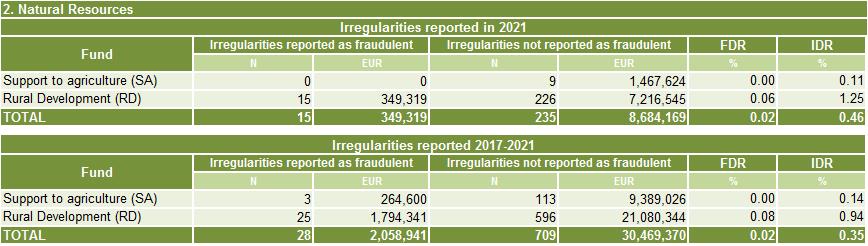


Malta


Netherlands - Nederland


Austria – Österreich



Poland – Polska


Portugal


Romania – România


Slovenia – Slovenija


Slovakia – Slovensko


Finland – Suomi-Finland



Sweden – Sverige


ANNEXES
Annex 1

Annex 2

Annex 3

Annex 4

Annex 5

Annex 6

Annex 7

Annex 8

Annex 9

Annex 10

Annex 11

ANNEX 12
Classification of cases in relation to common agricultural policy expenditure
This Annex describes the methodology adopted for classifying irregularities concerning the common agricultural policy (CAP) in the components ‘rural development’ (RD) and ‘support to agriculture’ (SA). The methodology also covers the classification of the SA irregularities in the two sub-components ‘market measures’ (MM) and ‘direct aid to farmers’ (DA).
For each irregularity related to the common agricultural policy, the competent national authorities should provide the following information in the irregularities management system (IMS):
|
Fund
The options are EAGF, EARDF, EAGF/EARDF
|
Budget year
|
Budget line
e.g. B050209/08/0000007
|
Budget post
e.g. B050209
|
Budget article
e.g. B050209/08
|
Budget measure
e.g. B050209/08/0000007
|
This methodology is based on the information included in the fields ‘Fund’, ‘Budget line’ and ‘Budget post’. Budget line and budget post are IMS terminology. In the current EU budget, reference is made to chapters (corresponding to the first part of the IMS budget post above) and articles (corresponding to the IMS budget post).
Cases are classified as RD, SA, SA/RD, Blank.
Irregularities classified as RD
Irregularities are classified as RD, where they concern only expenditure on IMS budget lines/posts that contain the codes ‘B0803', B0504', 'B01-4' or 'B01-50.In addition, it has been considered that there are irregularities where the field 'Fund' refers to the EARDF (European Agriculture Rural Development Fund), even if the budget line/post is not specified.
Irregularities classified as SA
Irregularities classified as SA/RD
Irregularities classified as ‘Blank’
Classification as ‘market measures’ or ‘direct payments’
Some parts of the analysis in Section 3 'Common agricultural policy' separately focus on 'interventions in agricultural markets' (or 'market measures') and 'direct payments' (or ‘direct aid’).
In fact, since 2006, the EU budget provides for support to agriculture to be structured along two main budget chapters:
·Budget chapter B0502 'interventions in agricultural markets' (B080201, B080202, B080203, for budget 2021);
·Budget chapter B0503 'direct aids' (B080204, B080205, for budget 2021).
For the purpose of the analysis in Section 3 'Common agricultural policy', cases are classified as:
·'Market measures', where they concern expenditure on IMS budget lines/posts that contain the code '502', as from the 2006 EU budget (B080201, B080202, B080203, for budget 2021) (NB, the same case may also concern other areas, including rural development or direct payments);
·'Direct payments', where they concern expenditure on IMS budget lines/posts which contain the code '503', as from the 2006 EU Budget (B080204, B080205, for budget 2021) (NB, the same case may also concern other areas, including RD or market measures).
Cases concerning only expenditure in 2005 (budget year) or before are not considered 'market measures' or 'direct payments'. Before 2006, the EU budget had a different structure:
·In 2004 and 2005, the budget chapters 0502 and 0503 referred respectively to 'Plant products' and 'Animal products';
·Before 2004, budget subsection B01 covered the Guarantee Section of the EAGG fund and was split, among others, in:
oB01-1 'Plant products';
oB01-2 'Animal products'.
ANNEX 13
Categories of irregularities and related types
This Annex shows the types of violations in the IMS and how they are grouped in categories. These categories are used in used in Tables NR6-NR9.
In Table CP10 the following grouping is used:
·Infringements concerning the request: T11/00, T11/01, T11/99
·Eligibility / Legitimacy of expenditure/measure: T11/02
·Multiple financing: T11/03, T11/04
·Violations/breaches by the operator: T12
·Incorrect, absent, falsified accounts: T13
·Incorrect, missing, false or falsified supporting documents: T14
·Product, species and/or land: T15
·Infringement of contract provisions/rules: T16/00, T16/01, T16/02, T16/03, T16/04, T16/05, T16/06, T16/07, T16/09, T16/10, T16/99
·Movement: T17
·Bankruptcy: T18
·Ethics and integrity: T19
·Infringement of public procurement rules: T40, T41, T16/08
·State aid: T50
|
Code
|
Category
|
Type
|
|
T11
|
Request
|
T11/00: Incorrect or incomplete request for aid
|
|
|
|
T11/01: False or falsified request for aid
|
|
|
|
T11/02:Product, species, project and/or activity not eligible for aid
|
|
|
|
T11/03: Incompatible cumulation of aid
|
|
|
|
T11/04: Several requests for the same product, species, project and/or activity
|
|
|
|
T11/99: Other
|
|
T12
|
Beneficiary
|
T12/00: Incorrect identity operator/beneficiary
|
|
|
|
T12/01: Non-existent operator/beneficiary
|
|
|
|
T12/02: Misdescription of the holding
|
|
|
|
T12/03: Operator/beneficiary not having the required quality
|
|
|
|
T12/99: Other
|
|
T13
|
Accounts and records
|
T13/00: Incomplete accounts
|
|
|
|
T13/01: Incorrect accounts
|
|
|
|
T13/02: Falsified accounts
|
|
|
|
T13/03: Accounts not presented
|
|
|
|
T13/04: Absence of accounts
|
|
|
|
T13/05: Calculation errors
|
|
|
|
T13/06: Revenues not declared
|
|
|
|
T13/99: Other
|
|
T14
|
Documentary proof
|
T14/00: Documents missing and/or not provided
|
|
|
|
T14/01: Documents incomplete
|
|
|
|
T14/02: Documents incorrect
|
|
|
|
T14/03: Documents provided too late
|
|
|
|
T14/04: Documents false and/or falsified
|
|
|
|
T14/99: Other
|
|
T15
|
Product, species and/or land
|
T15/00: Over or under production
|
|
|
|
T15/01: Inexact composition
|
|
|
|
T15/02: Inexact origin
|
|
|
|
T15/03: Inaccurate value
|
|
|
|
T15/04: Inexact quantity
|
|
|
|
T15/05: Variation in quality or content
|
|
|
|
T15/06: Quantities outside permitted limits, quotas, thresholds
|
|
|
|
T15/07: Unauthorised substitution or exchange
|
|
|
|
T15/08: Unauthorised addition or mixture
|
|
|
|
T15/09: Unauthorised use
|
|
|
|
T15/10: Falsification of the product
|
|
|
|
T15/11: Incorrect storage or handling
|
|
|
|
T15/12: Fictitious use or processing
|
|
|
|
T15/13: Incorrect classification (incl. incorrect tariff heading)
|
|
|
|
T15/14: Overdeclaration and/or declaration of fictitious product, species and/or land
|
|
|
|
T15/99: Other
|
|
T16
|
(Non-)action
|
T16/00: Action not implemented
|
|
|
|
T16/01: Action not completed
|
|
|
|
T16/02: Operation prohibited during the measure
|
|
|
|
T16/03: Failure to respect deadlines
|
|
|
|
T16/04: Irregular termination, sale or reduction
|
|
|
|
T16/05: Absence of identification, marking, etc.
|
|
|
|
T16/06: Refusal of control, audit, scrutiny etc.
|
|
|
|
T16/07: Control, audit, scrutiny etc. not carried out in accordance with regulations, rules, plan etc.
|
|
|
|
T16/08: Infringement of rules concerned with public procurement
|
|
|
|
T16/09: Infringements with regard to the cofinancing system
|
|
|
|
T16/10: Refusal to repay not spent or unduly paid amount
|
|
|
|
T16/99: Other
|
|
T17
|
Movement
|
T17/00: Irregularities in connection with final destination (change of, non arrival at, etc.)
|
|
|
|
T17/01: Fictitious movement
|
|
|
|
T17/99: Other
|
|
T18
|
Bankruptcy
|
T18/00: Legal persons - liquidation
|
|
|
|
T18/01: Legal persons - reorganisation to structure debt
|
|
|
|
T18/02: Natural persons - repayment plan
|
|
|
|
T18/03: Natural persons - repayment plan not possible
|
|
|
|
T18/99: Other
|
|
T19
|
Ethics and integrity
|
T19/00: Conflict of interest
|
|
|
|
T19/01: Bribery - passive
|
|
|
|
T19/02: Bribery - active
|
|
|
|
T19/03: Corruption
|
|
|
|
T19/04: Corruption - passive
|
|
|
|
T19/05: Corruption - active
|
|
|
|
T19/99: Other irregularities concerning integrity and ethics
|
|
T40 and T41
|
Public procurement
|
T40/01: Lack of publication of contract notice
|
|
|
|
T40/02: Artificial splitting of works/services/supplies contracts
|
|
|
|
T40/03: Non-compliance with - time limits for receipt of tenders; or - time limits for receipt of requests to participate
|
|
|
|
T40/03A: Non-compliance with time limits for receipt of tenders
|
|
|
|
T40/03B: Non-compliance with time limits for receipt of requests to participate
|
|
|
|
T40/04: Insufficient time for potential tenderers/candidates to obtain tender documentation
|
|
|
|
T40/05: Lack of publication of -extended time limits for receipt of tenders; or - extended time limits for receipt of requests to participate
|
|
|
|
T40/05A: Lack of publication of extended time limits for receipt of tenders
|
|
|
|
T40/05B: Lack of publication of extended time limits for receipt of request to participate
|
|
|
|
T40/06: Cases not justifying the use of the negotiated procedure with prior publication of a contract notice
|
|
|
|
T40/07: For the award of contracts in the field of defence and security falling under directive 2009/81/EC specifically, inadequate justification for the lack of publication of a contract notice
|
|
|
|
T40/08: Failure to state: - the selection criteria in the contract notice; and/or - the award criteria (and their weighting) in the contract notice or in the tender specifications
|
|
|
|
T40/08A: Failure to state the selection criteria in the contract notice
|
|
|
|
T40/08B: Failure to state the award criteria ( and their weighting) in the contract notice or in the tender specifications
|
|
|
|
T40/09: Unlawful and/or discriminatory selection and/or award criteria laid down in the contract notice or tender documents
|
|
|
|
T40/09A: Unlawful and/or discriminatory selections criteria laid down in the contract notice or tender documents
|
|
|
|
T40/09B: Unlawful and/or discriminatory award criteria laid down in the contract notice or tender documents
|
|
|
|
T40/10: Selection criteria not related and proportionate to the subject-matter of the contract
|
|
|
|
T40/11: Discriminatory technical specifications
|
|
|
|
T40/12: Insufficient definition of the subject-matter of the contract
|
|
|
|
T40/13: Modification of selection criteria after opening of tenders, resulting in incorrect acceptance of tenderers
|
|
|
|
T40/14: Modification of selection criteria after opening of tenders, resulting in incorrect rejection of tenderers
|
|
|
|
T40/15: Evaluation of tenderers/candidates using unlawful selection or award criteria
|
|
|
|
T40/16: Lack of transparency and/or equal treatment during evaluation
|
|
|
|
T40/17: Modification of a tender during evaluation
|
|
|
|
T40/18: Negotiation during the award procedure
|
|
|
|
T40/19: Negotiated procedure with prior publication of a contract notice with substantial modification of the conditions
|
|
|
|
T40/20: Rejection of abnormally low tenders
|
|
|
|
T40/21: Conflict of interest
|
|
|
|
T40/22: Substantial modification of the contract elements set out in the contract notice or tender specifications
|
|
|
|
T40/23: Reduction in the scope of the contract
|
|
|
|
T40/24: Award of additional works/services/supplies contracts without competition
|
|
|
|
T40/24A: Award of additional works/services/supplies contracts (if such award constitutes a substantial modification of the original terms of the contract) without competition in the absence of extreme urgency brought about by unforeseeable events
|
|
|
|
T4024B: Award of additional works/services/supplies contracts (if such award constitutes a substantial modification of the original terms of the contract) without competition in the absence of an unforeseen circumstance for complementary works, services, supplies
|
|
|
|
T40/25: Additional works or services exceeding the limit laid down in the relevant provisions
|
|
|
|
T40/50: Unjustified direct award (i.e. unlawful negotiated procedure without prior publication of a contract notice)
|
|
|
|
T40/51: Lack of justification for not subdividing contract into lots
|
|
|
|
T40/52: Failure to extend time limits for receipt of tenders where significant changes are made to the procurement documents
|
|
|
|
T40/53: Restrictions to obtain tender documentation
|
|
|
|
T40/54: Failure to extend time limits for receipt of tenders where, for whatever reason, additional information, although requested by the economic operator in good time, is not supplied at the latest six days before the time limit fixed for the receipt of tenders.
|
|
|
|
T40/55: Non-compliance with the procedure established in the Directive for electronic and aggregated procurement
|
|
|
|
T40/56: Failure to describe in sufficient detail the award criteria and their weighting.
|
|
|
|
T40/57: Failure to communicate/publish clarifications/additional information (in relation to selection/award criteria or conditions for performance of contracts or technical specifications).
|
|
|
|
T40/58: Unjustified limitation of sub-contracting
|
|
|
|
T40/59: Selection criteria (or technical specifications) were incorrectly applied.
|
|
|
|
T40/60: Evaluation of tenders using award criteria that are different from the ones stated in the contract notice or tender specifications
|
|
|
|
T40/61: Evaluation using additional award criteria that were not published
|
|
|
|
T40/62: Insufficient audit trail for the award of the contract
|
|
|
|
T40/63: Irregular prior involvement of candidates/tenderers towards the contracting authority
|
|
|
|
T40/64: Bid-rigging
|
|
|
|
T40/99: Other
|
|
|
|
T41/01A: Lack of publication of contract notice
|
|
|
|
T41/01B: Unjustified direct award (i.e. unlawful negotiated procedure without prior publication of a contract notice)
|
|
|
|
T41/02: Artificial splitting of works/services/supplies contracts
T41/03: Lack of justification for not subdividing contract into lots
T41/04A: Non-compliance with time limits for receipt of tenders
|
|
|
|
T41/04B: Non-compliance with time limits for receipt of requests to participate
T41/04C: Failure to extend time limits for receipt of tenders where significant changes are made to the procurement documents
T41/05A: Insufficient time for potential tenderers/candidates to obtain tender documentation
T41/05B: Restrictions to obtain tender documentation
T41/06A: Lack of publication of extended time limits for receipt of tenders
T41/06B: Failure to extend time limits for receipt of tenders
T41/07A: Cases not justifying the use of a competitive procedure with negotiation
T41/07B: Cases not justifying the use of a competitive dialogue
T41/08: Non-compliance with the procedure established in the Directive for electronic and aggregated procurement
T41/09A : Failure to publish in the contract notice the selection and/or award criteria (and their weighting)
T41/09B : Failure to publish in the contract notice the conditions for performance of contracts or technical specifications.
T41/09C : Failure to describe in sufficient detail the award criteria and their weighting
T41/09D : Failure to communicate/publish clarifications/additional information.
T41/10A : Use of criteria for exclusion, selection, award that are discriminatory on the basis of unjustified national, regional or local preferences
T41/10B : Use of conditions for performance of contracts that are discriminatory on the basis of unjustified national, regional or local preferences
T41/10C : Use of technical specifications that are discriminatory on the basis of unjustified national, regional or local preferences
T41/11A : Use of criteria for exclusion, selection, award that are not discriminatory in the sense of the previous type of irregularity but still restrict access for economic operators
T41/11B : Use of conditions for performance of contracts that are not discriminatory in the sense of the previous type of irregularity but still restrict access for economic operators
T41/11C : Use of technical specifications that are not discriminatory in the sense of the previous type of irregularity but still restrict access for economic operators
T41/12 : Insufficient or imprecise definition of the subject-matter of the contract
T41/13 : Unjustified limitation of subcontracting
T41/14A: Selection criteria (or technical specifications) were modified after opening of tenders.
T41/14B: Selection criteria (or technical specifications) were incorrectly applied.
T41/15A: Evaluation of tenders using award criteria that are different from the ones stated in the contract notice or tender specifications
T41/15B: Evaluation using additional award criteria that were not published
T41/16: Insufficient audit trail for the award of the contract
T41/17A: Negotiation during award procedure
T41/17B: Modification of the winning tender during evaluation
T41/18: Irregular prior involvement of candidates/tenderers towards the contracting authority
T41/19: Competitive procedure with negotiation, with substantial modification of the conditions set out in the contract notice or tender specifications
T41/20: Unjustified rejection of abnormally low tenders
T41/21: Conflict of interest
T41/22: Bid-rigging
T41/23A: Modification of the contract elements set out in the contract notice, not in compliance with the directives
T41/23B: Modification of the contract elements set out in the tender specifications, not in compliance with the directives
T41/70: For the award of contracts in the field of defence and security falling under directive 2009/81/EC specifically, inadequate justification for the lack of publication of a contract notice
T41/71: Lack of transparency and/or equal treatment during evaluation
T41/72: Award of additional works/services/supplies contracts (if such award constitutes a substantial modification of the original terms of the contract) without competition in the absence of the applicable conditions (extreme urgency brought about by unforeseeable events; an unforeseen circumstance for complementary works, services, supplies)
T41/73: Additional works or services exceeding the limit laid down in the relevant provisions
T41/99: Other
|
|
T50
|
State aid
|
T50/01: Failure to notify State Aid
|
|
|
|
T50/02:Wrong aid scheme applied
|
|
|
|
T50/03:Misapplication of the aid scheme
|
|
|
|
T50/04:Monitoring requirements not fulfilled
|
|
|
|
T50/05:Reference investment not taken into account in the applicable aid scheme
|
|
|
|
T50/06:No consideration of revenue in the applicable aid scheme
|
|
|
|
T50/07:No respect of the incentive effect of the aid
|
|
|
|
T50/08:Aid intensity not respected
|
|
|
|
T50/09:De Minimis threshold exceeded
|
|
|
|
T50/99:Other State aid
|
|
T90
|
Other
|
T90/99: Other irregularities
|
ANNEX 14
On the analysis by intervention fields
EU expenditure is targeted to specific intervention fields, which change depending on the programming period. In IMS, the reporting authorities are requested to specify the intervention fields affected by the irregularities they communicate.
For the cohesion policy, Annex 14.1 shows the intervention fields related to the programming period 2007-2013. Annex 14.2 shows the intervention fields related to the programming period 2014-2020.
For the purpose of this analysis, the intervention fields have been grouped along these areas:
·Strengthening research, technological development and innovation;
·Enhancing accessibility to and use and quality of information and communication technologies (digital transition);
·Supporting the shift towards a low-carbon economy in all sectors (green transition);
·Promoting climate change adaptation, risk prevention and management (green transition);
·Preserving and protection the environment and promoting resource efficiency (green transition);
·Promoting sustainable transport and removing bottlenecks in key network infrastructures;
·Promoting sustainable and quality employment and supporting labour mobility;
·Promoting social inclusion, combating poverty and any discrimination;
·Investment in education, training and vocational training for skills and lifelong learning;
·Enhancing competitiveness of enterprises
·Culture and tourism;
·Technical assistance;
·Outermost regions.
For most of these areas, a number of sub-areas have been defined. They are shown in Annex 14.3.
Annex 14.4 shows the association of these intervention fields to each area and sub-area, both for the intervention fields of PP 2014-2020 and those of PP 2007-2013.
Annex 14.1


Annex 14.2


Annex 14.3


Annex 14.4


ANNEX 15
Abbrevations
SA: Support to agriculture
RD: Rural development
SA/RD: Support to agriculture/ rural development
GUID: European Agricultural Guarantee and Guidance Fund – Section Guidance
EFF: European Fisheries Fund
EMFF: European Maritime and Fisheries Fund
CF: Cohesion Fund
ERDF: European Regional Development Fund
ESF: European Social Fund
AMIF: Asylum, Migration and Integration Fund
YEI: Youth Employment Initiative
HRD: pre-accession, Human Resources Development component
IPARD: Instrument for Pre-Accession Assistance in Rural Development
PHARE: Pre-accession assistance programme
REGD: pre-accession, Regional Development component
TAIB: Transition Assistance and Institution Building
TIPAA: Turkey Instrument for Pre-accession Assistance
CBC: pre-accession, Cross-Border Cooperation component


