 EUROPEAN COMMISSION
Brussels,7.3.2018
SWD(2018) 202 final
COMMISSION STAFF WORKING DOCUMENT
Country Report Czech Republic 2018
Accompanying the document
COMMUNICATION FROM THE COMMISSION TO THE EUROPEAN PARLIAMENT, THE COUNCIL, THE EUROPEAN CENTRAL BANK AND THE EUROGROUP
2018 European Semester: Assessment of progress on structural reforms, prevention and correction of macroeconomic imbalances, and results of in-depth reviews under Regulation (EU) No 1176/2011
{COM(2018) 120 final}
Contents
Executive summary
1.Economic situation and outlook
2.Progress with country-specific recommendations10
3.Reform priorities
3.1.Public finances and taxation
3.2.Financial sector
3.3.Labour market, education and social policies
3.4. Investment
3.5. Sectoral policies
Annex A: Overview table
Annex B: Macroeconomic Imbalance Procedure Scoreboard
Annex C: Standard tables
References
LIST OF Tables
Table 1.1:Key economic, financial and social indicators - Czech Republic
Table 2.1:Annual assessment of the 2017 CSRs
Table 3.1.1:New 2018 ageing projections (% of GDP)
Table B.1:The MIP Scoreboard for the Czech Republic
Table C.1:Financial market indicators
Table C.2:Labour market and social indicators
Table C.3:Labour market and education indicators
Table C.4:Social inclusion and health indicators
Table C.5:Product market performance and policy indicators
Table C.6:Green growth
LIST OF Graphs
Graph 1.1:
Real GDP growth and breakdown
Graph 1.2:
GNI per person (PPS) as a percentage of EU-28
Graph 1.3:
Potential GDP growth and drivers
Graph 1.4:
Investment by category (Czech Republic and EU)
Graph 1.5:
Labour shortages (% of respondents)
Graph 1.6:
Nominal unit labour cost (breakdown)
Graph 1.7:
Current and capital accounts
Graph 2.1:
Overall multiannual implementation of 2011 – 2017 CSRs to date
Graph 3.1.1:
VAT gap (2011-2015)
Graph 3.1.2:
Tax wedge for families with and without children (2016)
Graph 3.1.3:
Number of primary self-employed
Graph 3.1.4:
Time to comply with tax requirements (2016, in hours)
Graph 3.2.1:
Overvaluation gap
Graph 3.2.2:
House prices and loans for house purchase
Graph 3.2.3:
Building permits and dwellings statistics
Graph 3.2.4:
Mortgage loans: stock and new loans
Graph 3.2.5:
HH and NFC Indebtedness
Graph 3.3.1:
Labour market developments
Graph 3.3.2:
Parenthood impact on employment
Graph 3.3.3:
Net childcare costs for a lone mother with earnings (2015)
Graph 3.3.4:
Employment rate by age & education level
Graph 3.3.5:
At-risk-of-poverty or social exclusion rate, age groups
Graph 3.3.6:
Percentage of variation in science performance explained by students' socio-economic status (2015)
Graph 3.3.7:
Early school leaving by region (2016)
Graph 3.4.1:
Share of export value in top quality category
Graph 3.5.1:
Value added in high- and medium-high-tech manufacturing and KIS as % of value added
Graph 3.5.2:
Investment in road infrastructure (% of GDP)
LIST OF Boxes
Box 1.1: Exchange rate developments and external position
Box 2.1: Tangible results delivered through EU support to structural change in the Czech Republic
Box 3.3. 1: Monitoring performance in light of the European Pillar of Social Rights
Box 3.4.1: Investment challenges and reforms in the Czech Republic
Box 3.5.1: Policy highlights - European Semester process
Executive summary
As economic growth accelerated significantly in 2017, the Czech Republic is in a good position to address remaining structural challenges.
Economic convergence has resumed and is likely to continue, while the current unemployment rate is the lowest recorded in any EU Member State since 2002. However, rising labour supply shortages, long-term fiscal sustainability pressures, regulatory and administrative burdens, and low public investment in knowledge-intensive activities pose long-term challenges to the economy. Given the country's highly favourable economic situation, appropriate policies could sustainably raise the Czech economy's growth potential and make growth more inclusive. (
)
The Czech Republic is enjoying an economic upswing. Real GDP is expected to have increased by 4.5 % in 2017 and to grow by around 3 % in both 2018 and 2019, according to the Commission Winter 2018 forecast. Boosted by consumer confidence, increasing wages and low credit costs, private consumption growth remained high. After plunging in 2016, investment is expected to have bounced back in 2017, supported by the private sector and the renewed drawdown of EU funds. Foreign direct investment (FDI) is highly productive, supporting over a quarter of all private sector jobs and more than three quarters of all exports. On the other hand, investment in infrastructure continues to remain below the EU average.
Labour market indicators set new records but at the same time signal limits to future growth. With an increasing level of employment approaching 80 % and an unemployment rate of 2.5 % in the fourth quarter of 2017, the country is facing a tightened labour market and increased labour shortages. Consequently, due to limited scope for a further increase in labour participation and demographic constraints, employment gains are likely to stall from 2018 onwards. Due to a low ratio of jobseekers per vacancy, the tightened labour market will continue to spur wage growth acceleration in 2018 and 2019, albeit more slowly, allowing private consumption to remain robust.
Inflation has moved above the central bank’s 2.0 % target. The inflation rate reached 2.4 % in 2017, rising significantly from 0.6 % in 2016. Meanwhile, the appreciation of the koruna following the decision of the Czech National Bank (CNB) to remove the exchange rate floor against the euro is tempering inflationary pressures, especially for imported goods and services. In 2018 and 2019 the inflation rate is expected to moderate and stabilise around the 2 % target.
The Czech Republic has made some progress in addressing the 2017 country-specific recommendations (CSRs). It has made limited progress in addressing the long-term sustainability of public finances. Some progress has been made in improving the anti-corruption and public procurement frameworks and in streamlining procedures for granting building permits. The range of e-government services has expanded and the quality of R&D has slightly improved. Some progress has also been observed in fostering employment of under-represented groups.
The Czech Republic has either reached, or is on track to reach, its Europe 2020 targets in most areas. These include poverty or social exclusion, employment, renewable energy, greenhouse gas emissions and tertiary education. More action is needed to reduce the increasing early school leaving rate, improve energy efficiency and reach the R&D target.
The Czech Republic performs relatively well on the indicators of the Social Scoreboard supporting the European Pillar of Social Rights, while challenges remain. The labour market is strong, yet the low participation in employment of women with small children and of vulnerable groups remains a challenge. At the same time, the Czech Republic has very low income inequality and a very low share of people at risk of poverty or social exclusion.
Key structural issues analysed in this report, which point to particular challenges for the Czech Republic’s economy, are the following:
·The increasing complexity of the tax system is a concern. Tax collection has improved, but the frequency of changes and higher compliance costs are worrisome for businesses. Reform of income tax legislation is still ongoing. The tax-wedge on labour remains high for low-income single earners.
·Long-term fiscal sustainability worsened and age-related expenditures are causes for concern. While the short- and medium-term fiscal outlook appears sound, the expected raise in pension expenditures and the limited cost-effectiveness of the healthcare sector are long-term risks. The independent fiscal council is not yet operational and the coordination of fiscal and budgetary policies among the various government bodies remains a weakness.
·Housing prices are increasing rapidly against a backdrop of high demand, constrained supply and regulatory obstacles. Since 2013 housing prices have increased faster than nominal income, especially in Prague. Although the government tries to streamline the procedures, building regulations continue to put pressure on the housing supply, contributing to the price rises. The market has become one of the fastest-growing in the EU, keeping credit growth strong. The central bank has limited tools for ensuring stability, but there are ongoing discussions about imposing binding lending limits.
·Certain regulatory and administrative burdens are deterring further investment. Pending issues related to building permit procedures for households were in part addressed by the amendment of the Construction Act. Payment practices worsened in 2017 and the costs of resolving insolvencies remain above the EU average. A slower start of the 2014-2020 ESI Funds programming period and certain implementation problems resulted in a low absorption of EU funds, notably in areas such as energy efficiency or broadband infrastructure.
·Steps were taken to improve the public procurement framework and the anti-corruption agenda. Tailored training schemes and initiatives to increase transparency have aimed to improve procurement practices. While setting up joint procurement procedures remains a major challenge, corruption is an ongoing concern that has a negative impact on the business environment. Various reforms have been adopted, but the anti-corruption agenda has not been fully completed yet.
·Despite high demand for labour, certain groups continue to be under-represented in the labour market. Gender inequalities in terms of pay and employment remain high despite recent measures that have made parental leave more flexible and increased the number of childcare facilities. Labour market participation for low-skilled and disabled people remains low. Despite having one of the lowest proportions of people at risk of poverty overall, a number of localities face an increasing number of socially excluded people, growing indebtedness and housing exclusion.
·The attractiveness of the teaching profession remains low in spite of recent salary increases. Education performance continues to be strongly affected by the socioeconomic background of students. Inclusive education measures still need to be fully implemented, in particular for Roma children. The low early school leaving rate has risen, contrary to the EU trend. On the other hand, the tertiary education attainment continues to increase.
·Whilst the Czech economy continues its shift towards more knowledge-intensive activities, several bottlenecks still hamper the R&D system. These include emerging shortages of skilled human resources, the low level of public-private cooperation and the relatively low performance of the public science base. While foreign R&D funding is trending upwards, domestic firms reduced their R&D spending.
·E-government services are being enhanced, but remain below EU average. Several initiatives adopted aimed to enable secure access to e-government services. A national electronic identity card and other digital initiatives are planned to be introduced in 2018.
1.
Economic situation and outlook
Economic growth
The Czech Republic is enjoying an economic upswing. Following a shallow recession in 2012 and 2013, real GDP grew by 3.5 % per year on average between 2014 and 2016. According to the Commission Winter 2018 forecast, real GDP growth is expected to have accelerated to 4.5 % in 2017, supported by strong domestic and external demand, after growth of 2.6 % in 2016 (Graph 1.1). Rapidly increasing wages are projected to have supported solid household consumption growth in 2017. Following a strong decline in 2016, a new wave of investment also appears to have set in, helping to propel economic growth to the unusually high rate seen in 2017. While public sector investment has yet to show signs of revival since its 2016 low, private sector investment is estimated to have rebounded strongly. Net exports are also projected to have provided a positive contribution to GDP in 2017, against a backdrop of strong external demand and only gradually rising import levels. This is particularly noteworthy given the strong investment rebound and the high import intensity of investment and exports in the Czech Republic.
|
Graph 1.1:Real GDP growth and breakdown
|
|

|
|
Source: AMECO, Commission Winter 2018 forecast
|
In 2018 and 2019 GDP growth is forecast to stabilise at around 3 %. Labour shortages are the main constraint for the lower GDP and private consumption growth rates expected in the years ahead. Investment is expected to increase strongly as companies — especially in manufacturing industries — ramp up investment in machinery to compensate for a growing scarcity of labour. The Czech Republic’s considerable trade surplus is expected to decline slightly over the forecast horizon, as imports are likely to grow somewhat faster than exports in 2018 and 2019.
The Czech Republic witnessed considerable catch-up growth relative to the EU average. Between 2003 and 2008, income per person and wages converged steadily in line with what could be expected based on their initial level of development (Arpaia, A. and Thirion, G., 2017). However, the global crisis appears to have temporarily stalled this process. In 2015, the convergence resumed as both real wages and productivity started to increase. Sound economic policies that encouraged both foreign and domestic investment and significant financial support in the form of EU structural funds underpinned the convergence process.
|
Graph 1.2:GNI per person (PPS) as a percentage of EU-28
|
|

|
|
Source: AMECO, European Commission
|
Between 2000 and 2016, Czech gross national income (GNI) (
) per person (adjusted for purchasing power parity) rose from 72.0 % to 82.6 % of the EU-28 average, an increase of 10.6 pps (Graph 1.2). The main driver of convergence was the Czech Republic’s faster growth in nominal GNI compared to the EU average. By contrast, a more rapid increase in the price level in the Czech Republic than in the rest of the EU slowed down its economic convergence.
High inflows of foreign direct investment (FDI) have been a significant driver of convergence. However, as in other countries in the region, they have come down from the levels observed in the early 2000s. Not only did the corresponding FDI inflows lead to major productive investment, they are also likely to have boosted productivity growth by making rapid technology and skills transfer in the manufacturing sector possible. FDI inflows were facilitated by the relatively low level of Czech wages and the country’s proximity to the most developed European markets. This favourable environment gave rise to both significant brown-field investment and export-oriented green-field investment.
|
Graph 1.3:Potential GDP growth and drivers
|
|

|
|
Source: European Commission
|
Potential GDP growth risks being constrained by unfavourable demographics (Graph 1.3). It dipped in 2016 but is estimated to have increased to around 3 % in 2017, supported by an increase in potential hours worked and total factor productivity gains. From 2018, potential growth is forecast to decline steadily towards 2 % in 2022, owing to adverse demographics and limited productivity increases. The real GDP growth rate in 2018 and 2019 is forecast to be slightly above the estimated potential growth rate, widening the already positive output gap. This suggests that continued economic expansion at that rate would likely be inflationary.
Risks to the growth outlook are tilted to the downside. Wage pressure linked to labour shortages might reduce the costcompetitiveness of exports if wage growth continually outpaces productivity growth. The appreciation of the koruna since April 2017 could reinforce this development though the potential negative impact on Czech exports is deemed to be milder due to their high content of foreign value added. The exchange rate appreciation is also having an anti-inflationary effect on import prices, preventing stronger consumer price growth. A potential slowdown in global trade is yet another persistent risk, since the Czech Republic is exposed to external demand swings from its main trading partners due to its high openness. Finally, house prices rose faster than wages in 2016 and 2017, harming housing affordability (see Section 3.2). In this context, the interest rate hikes since the second half of 2017 intend to address inflationary pressures; while macro-prudential recommendations aim to cool the bank lending and housing market (see Section 3.2).
Inflation and monetary policy
After three subdued years, inflation moved above the central bank’s target of 2.0 % in 2017. Harmonised Index of Consumer Prices inflation reached 2.4 % in 2017, a marked increase from 0.6 % in 2016. It was mainly driven by strong increases in food and services prices. According to the Commission Winter 2018 forecast, inflation is expected to remain higher than in the euro area. Continued rises in food and services prices are supposed to keep annual inflation at 2.4 % in 2018. In 2019, inflation is forecast to stabilise at the CNB inflation target of 2 %, potentially supported by further monetary policy tightening.
The Czech National Bank (CNB) has discontinued the use of the exchange rate commitment as an additional monetary policy instrument. In April 2017, the CNB abandoned the exchange rate commitment in place since November 2013 (see Box 1.1). The appreciation of the koruna which followed this decision is tempering inflationary pressures, particularly for imported goods and services. In August 2017, the CNB was the first central bank in the EU to raise interest rates since 2012. Two more hikes followed afterwards, setting the base rate at 0.75 % (February 2018). The real effective exchange rate deflated by unit labour costs is projected to have appreciated by 5.5 % in 2017 (Commission Autumn 2017 forecast). A slightly smaller appreciation is forecast in 2018 (4.7 %).
Investment
|
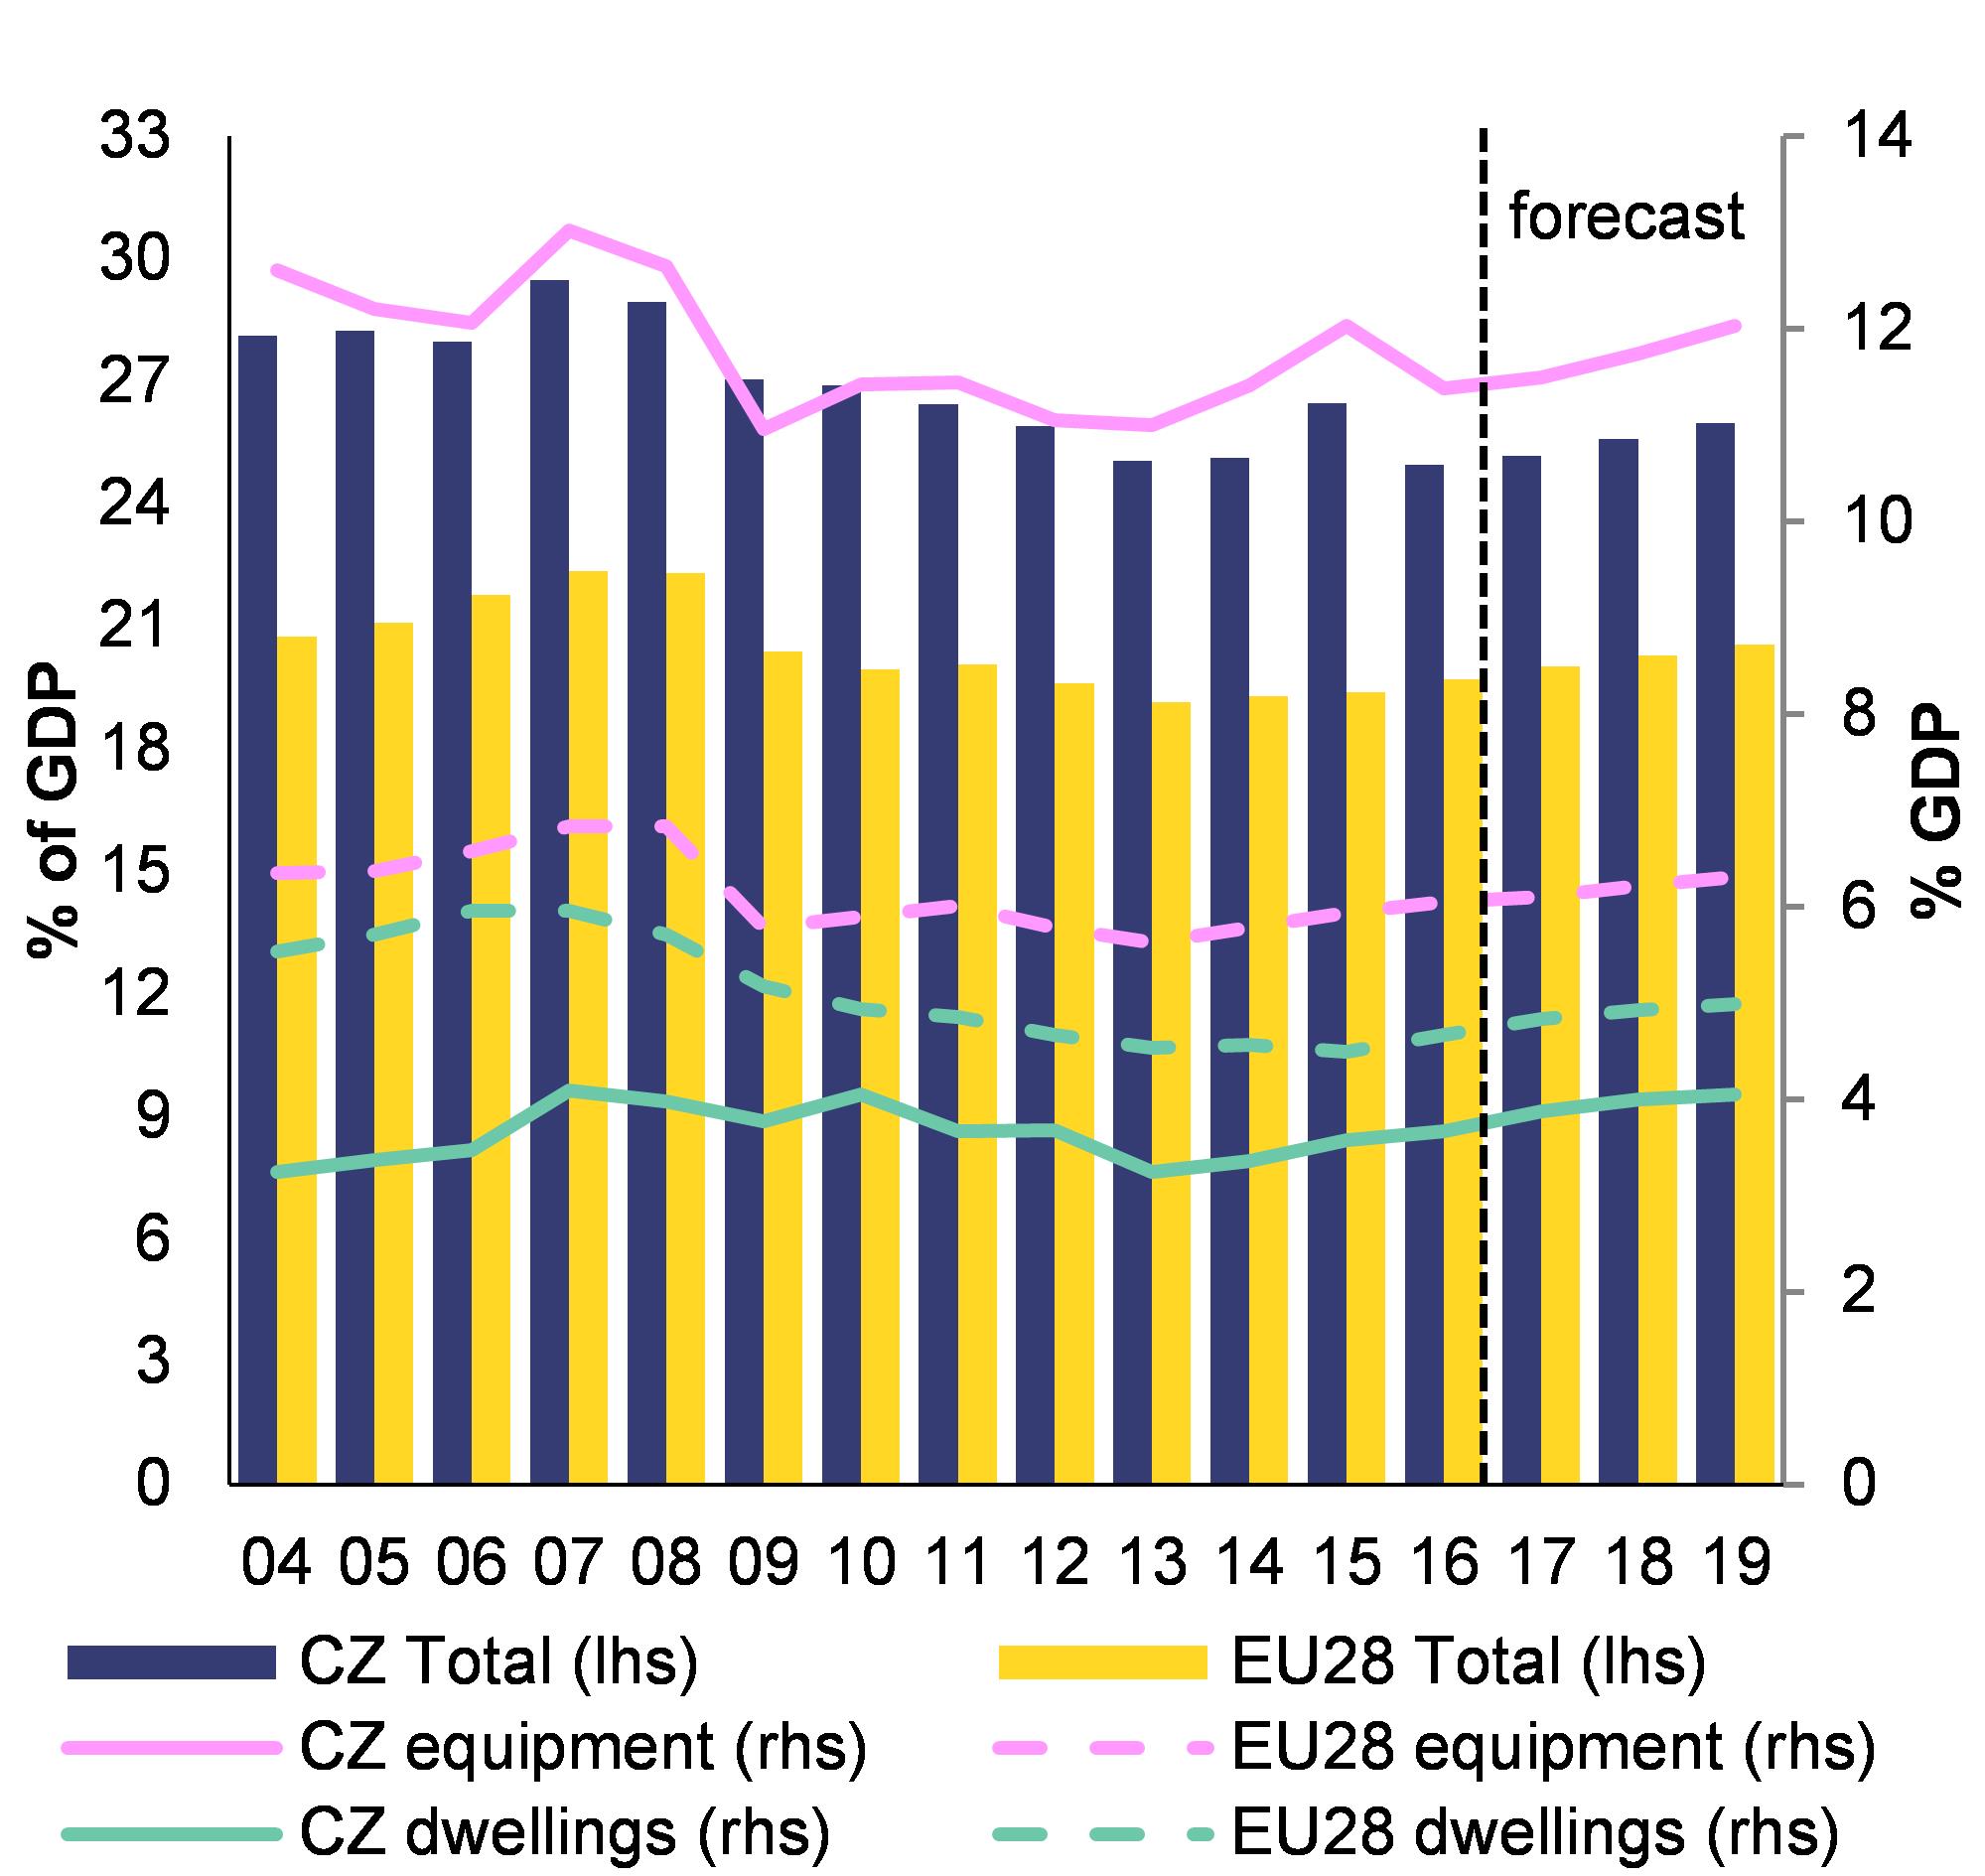
Graph 1.4:Investment by category (Czech Republic and EU)
|
|
|
|
Source: Ameco, Commission Autumn 2017 Forecast
|
The Czech Republic’s investment outlook is buoyant. Recent data show large and broad-based investment growth, which remains above the EU average as a share of GDP (Graph 1.4). This outlook is supported by positive expectations for economic growth, the new cycle of European Structural and Investment (ESI) Funds, very cheap financing conditions, labour market shortages and a strong demand for dwellings in the context of constrained housing supply (see Box 3.4.1). Relatively low investment in housing over the past decade, compared to the EU average, may also indicate an additional supply backlog. The existence of this backlog would be confirmed by the accelerating house prices (see Section 3.2).
Household spending
Private consumption increased above 3.5 % in 2015 and 2016 and is expected to remain the main driver of real GDP growth in the coming years, boosted by the strength of the labour market and low credit costs. According to the Commission Autumn 2017 forecast, household spending is projected to have grown by 3.5 % in 2017 and to ease slightly over the next two years, owing to the slowdown in employment growth. The record-low unemployment rate and increasing labour shortages are expected to drive up salaries. Nominal wage is projected to increase by an average of 6.4 % per year in 2017-2019, far exceeding consumer price inflation. In this context, real household disposable income is forecast to grow by 2.8 % in 2017 and 2018, then to slow down a bit in 2019, to 2.4 %.
Consumer confidence and cheap borrowing costs also support households’ spending activity. In Q4-2017 consumer confidence reached an all-time high, having consistently outperformed its long-term average since 2014. Strong consumer confidence combined with low credit costs have contributed to rising household indebtedness, which increased faster than disposable income in 2016 (see Section 3.2 on private indebtedness). The saving rate of households declined slightly in 2016 to 11.2 % and is expected to moderate further from 2017 to 2019, while remaining above 10 % (Commission Autumn 2017 forecast).
Social developments
The Czech Republic has one of the lowest levels of income inequality in the EU, but poverty risk and educational outcomes depend very much on parental background. The incomes of the richest 20 % of the population were around 3.5 times higher than the incomes of the poorest 20 % in 2016. This ratio has remained stable since 2005 (
). Stability in the degree of inequality reflects the fact that real disposable household income has grown relatively evenly across the income distribution in recent years. Together with low and decreasing unemployment and share of people at risk of poverty or social exclusion, this suggests relatively inclusive economic growth. Low inequality in the Czech Republic can be explained by relatively equally distributed market incomes, i.e. income received by households before taxes and social transfers. The gap between market income inequality and disposable income inequality (i.e. after taxes and transfers) is similar to the EU average, suggesting the Czech tax-benefit system functions in line with the EU average in terms of reducing inequality.
However, there is still considerable inequality of opportunity between socioeconomic groups. The risk of poverty for the children of low-skilled parents is among the highest in the EU, but among the lowest for the children of the high-skilled. Educational outcomes also vary considerably. In 2015, the variation in science PISA scores which could be attributed to parental background was one of the highest in the EU (see Section 3.3).
Labour market
The Czech labour market is a top performer in the EU, although growing labour shortages may limit future growth. Over the past six years the employment rate has risen steadily, reaching 78.9 % in Q3-2017. Overall employment growth is expected to slow down in the coming quarters, given the reduced scope for further increases in the participation rate (see Section 3.3). The unemployment rate has fallen considerably, reaching 2.5 % in Q4-2017, and is currently the lowest in the EU. It is 2.9 % as annual average for 2017 and is expected to stabilise at this level over the next two years (Commission Autumn 2017 forecast). With the Czech economy near full employment, labour shortages are becoming apparent and spurring wage increases. 43 % of manufacturers cited labour shortages as a factor limiting production in Q1-2018 (Graph 1.5).
Despite its outstanding performance, the labour market outcomes remain significantly weaker for low-skilled workers and women with young children. Unemployment disproportionately affects those with primary and lower secondary education, who represent only 9 % of the working-age population. Against the backdrop of labour shortages, there is scope for increasing female labour market participation, which is still hampered by the lack of affordable childcare (despite the recently increased number of childcare facilities). The gender employment gap in the Czech Republic is particularly high for middle aged women. Motherhood has a major impact on labour market participation, linked to the low availability of affordable childcare, long parental leave entitlements, low use of flexible working arrangements and the lack of long-term care facilities. In 2015, only 3 % of children under three were in formal childcare. This share has slightly increased to 4.7 % in 2016.
|
Graph 1.5:Labour shortages (% of respondents)
|
|

|
|
Source: European Commission (Business Climate Indicator)
|
Competitiveness
Following the negative growth seen in 2015, nominal unit labour costs (ULC) started growing in 2016 (3.3 % year-on-year) (see Graph 1.6). This was caused, on the one hand, by a productivity growth slowdown, mostly due to a slight productivity decline in market services and construction, while productivity continued to grow in the manufacturing sector. On the other hand, nominal compensation per employee grew by 4.6 % in 2016, faster than in 2014 and 2015 (3 %).
Real wages are forecast to increase significantly in 2017 and further push real wage convergence with the EU-28, due to a record low ratio of job seekers per vacancy. Nominal compensation per employee is expected to have risen by 7.1 % in 2017, according to the Commission Autumn 2017 forecast. It is expected to slow slightly in 2018 (6.6 %) amid easing inflationary pressures and the potential appreciation of the exchange rate. As a result, nominal ULC are expected to continue to increase by around 3½ % in 2017 and 2018 (see Graph 1.6).
|
Graph 1.6:Nominal unit labour cost (breakdown)
|
|

|
|
Source: Commission Autumn 2017 forecast
|
External position
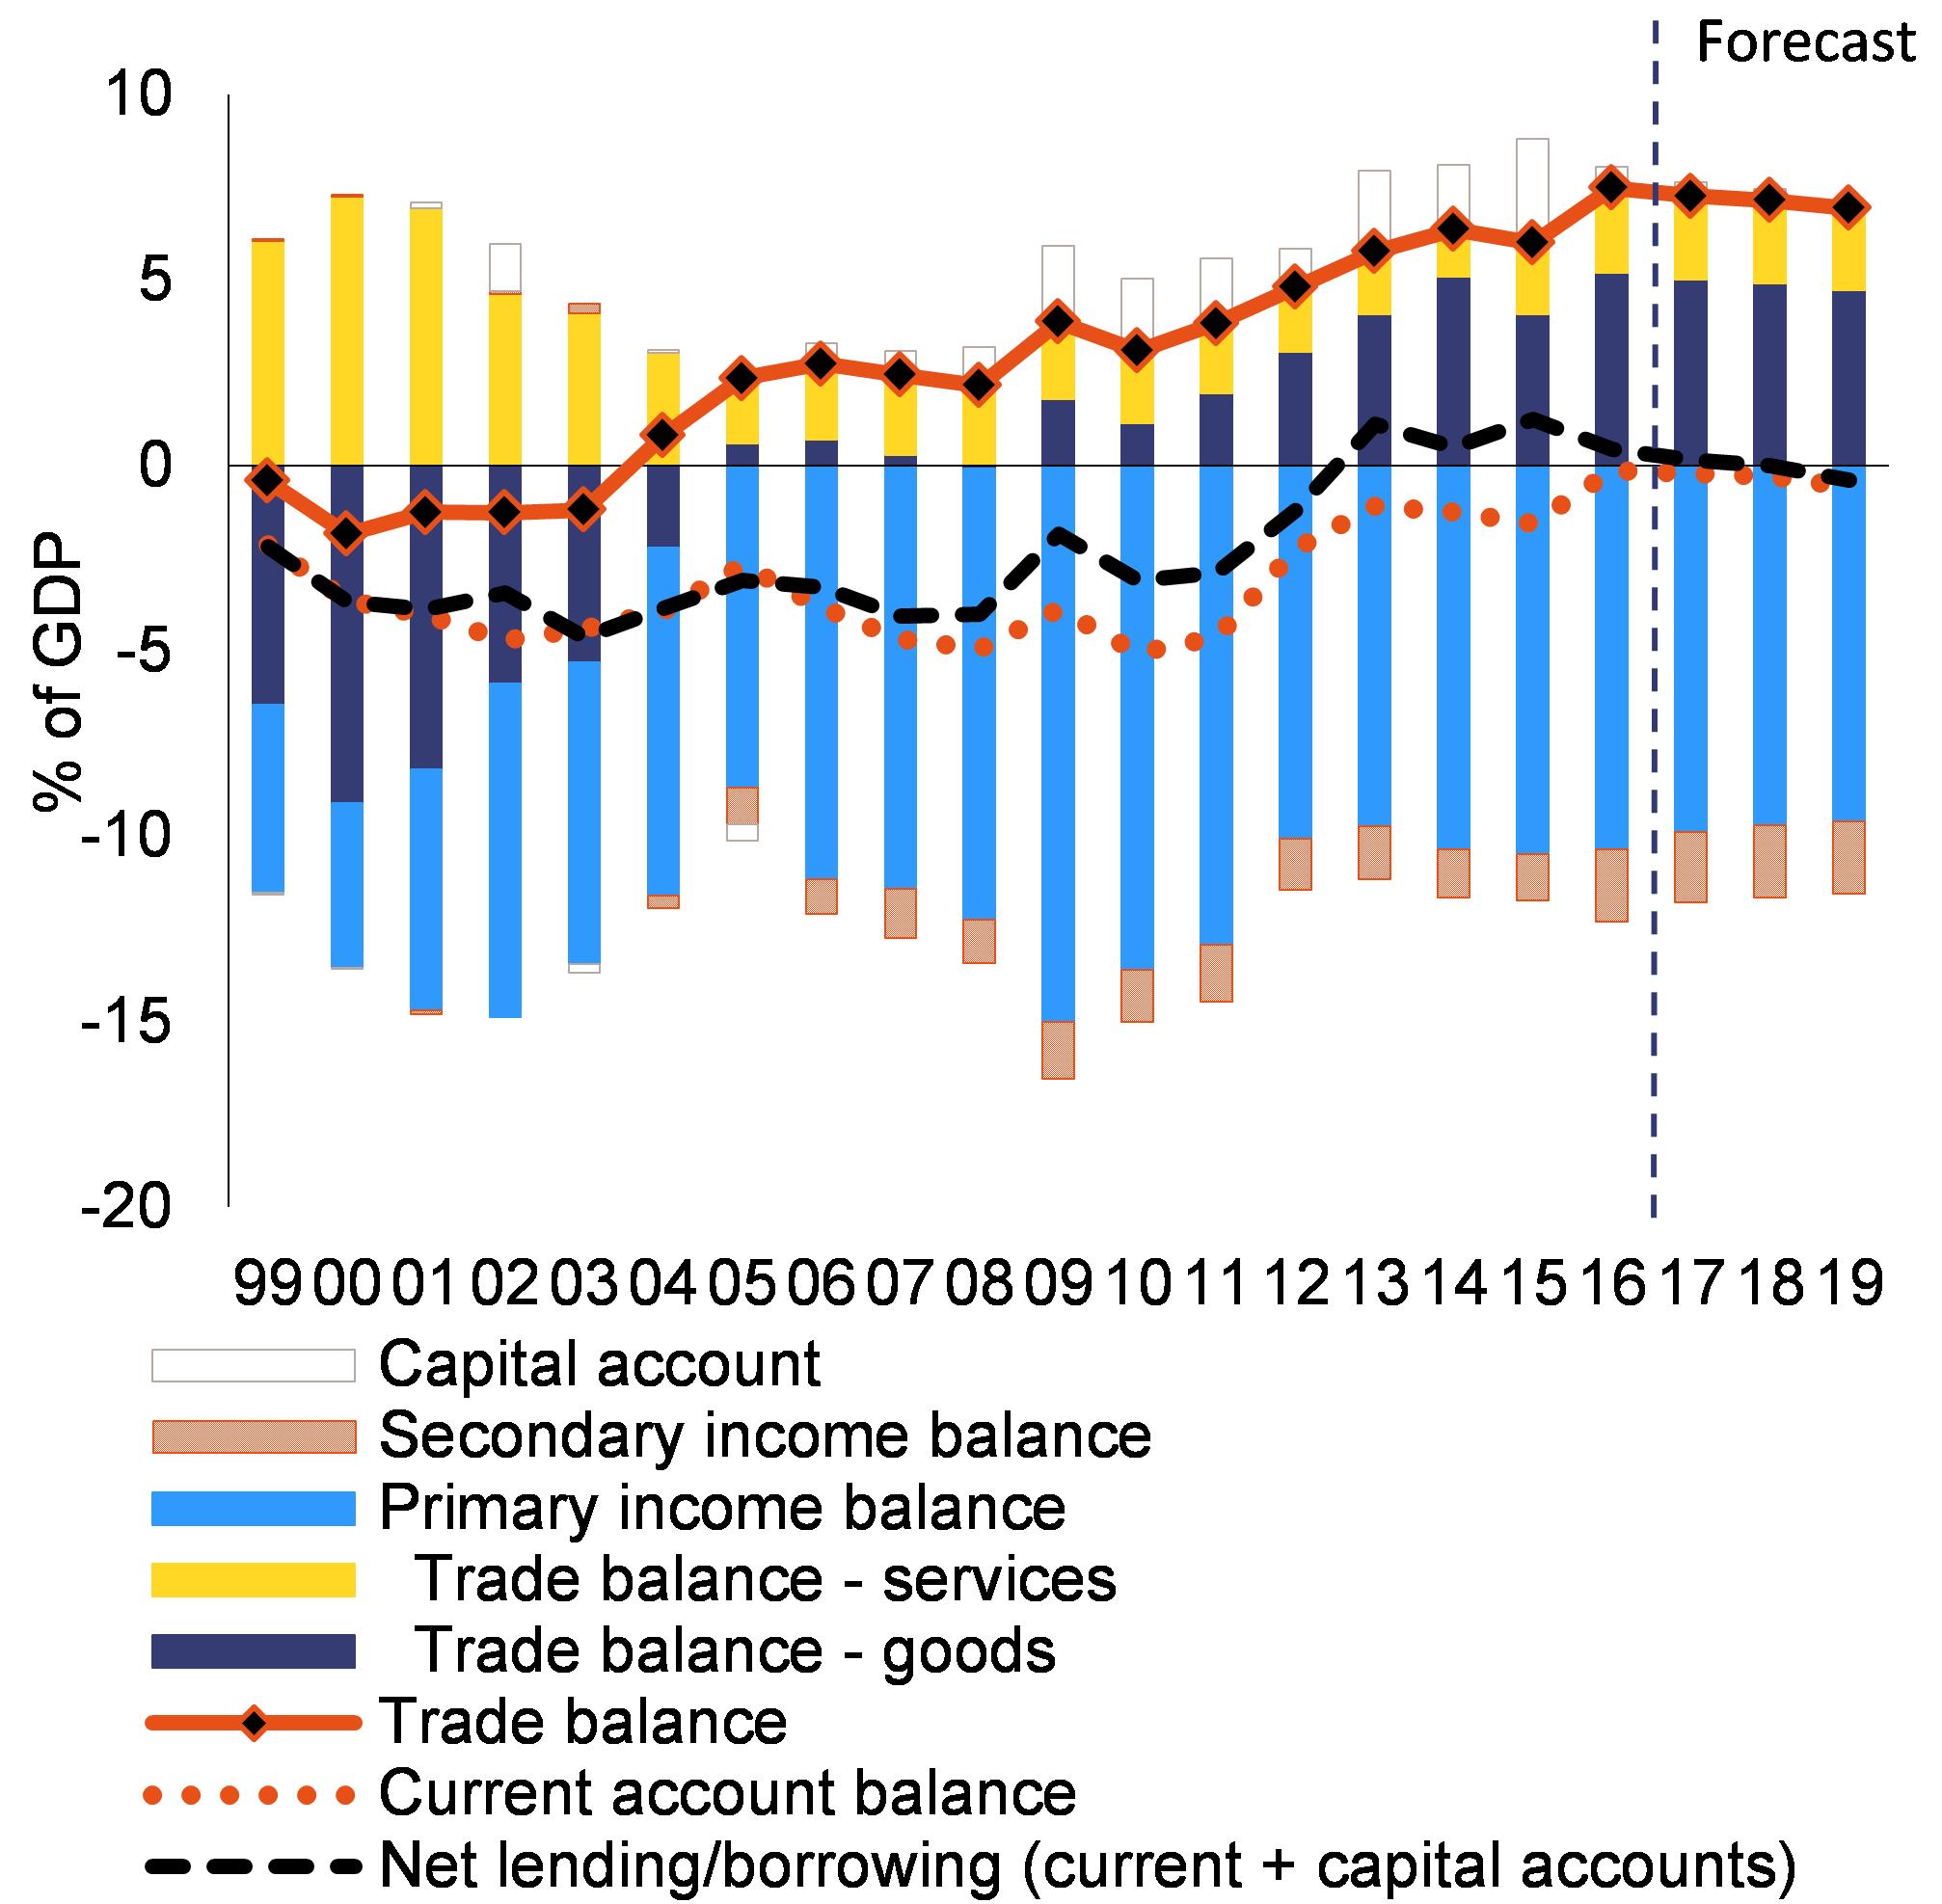
The Czech Republic’s trade balance is firmly in positive territory (Graph 1.7). Its trade surplus of 7.5 % of GDP, recorded in 2016, helped mitigate the current account deficit. According to the Commission Autumn 2017 forecast, the trade balance is expected to have declined slightly in 2017 and to recede further in the two subsequent years (up to 6.9 % in 2019). Export growth is expected to be steady in 2018 and 2019 thanks to revitalised global trade and a positive outlook for the Czech economy’s main trading partners. Conversely, given the upswing in domestic investment and its relatively high import content, imports are likely to grow slightly faster than exports over the forecast horizon.
The primary income balance is persistently negative. This is to a large degree due to dividend outflows of foreign investors. The primary income balance is forecast to remain somewhat flat, moving from -6.4 % of GDP in 2016 to 6.2 % in 2019 (Commission Autumn 2017 forecast). The current account balance is forecast to worsen slightly between 2017 (0.2 % of GDP) and 2019 (-0.6 %), driven by the decline in the trade surplus.
|
Graph 1.7:Current and capital accounts
|
|
|
|
Source: Eurostat, National Accounts data; Commission Autumn 2017 forecast
|
Public finances
Public finances are set to remain in surplus territory over the forecast period. The current fiscal surplus is supported by tax-rich growth. In particular, direct taxation receipts are boosted by rising wage levels, while VAT revenues should continue to benefit from measures to prevent tax evasion (see Section 3.1). On the expenditure side, public wages scales increased by 10 % for public employees and 15 % for teachers in November 2017. In 2018, public expenditure levels are expected to reflect the full impact of the wage hike, with additional outlays for higher pensions and social benefit levels. Public investment in 2018 is forecast to increase somewhat given the deadline for EU funds linked to 2015 project commitments. Savings from lower debt servicing costs were sizeable in previous years but are likely to dwindle from 2017 onwards.
Despite the improved outlook for the headline balance, the structural surplus is projected to decline slightly. This is a result of the widening positive output gap. Nevertheless, the structural balance is expected to stay in surplus territory of around 0.8 % of GDP in 2017. Over the next two years the structural surplus is expected to shrink to around zero. The debt-to-GDP ratio is set to continue on a downward path, reaching around 32.5 % of GDP in 2019 (Commission Autumn 2017 forecast)
|
Box 1.1: Exchange rate developments and external position
On 6 April 2017 the Board of the Czech National Bank discontinued its exchange rate commitment and allowed the koruna (CZK) to fluctuate with market conditions. Since it started using the exchange rate as a monetary policy instrument in November 2013, the CNB’s external assets had more than tripled to around 70 % of GDP by the end of March 2017, as a result of foreign exchange market interventions necessary to counter speculative purchases of CZK-denominated assets. Starting from CZK 27/EUR in April 2017, the exchange rate has followed an appreciating trend, averaging 25.4 in January 2018. If the exchange rate were to remain at this level or further appreciate, downward pressure on inflation would likely be exerted. The appreciation of the koruna might also be influencing the value of the CNB’s external assets, which had declined to 61 % of GDP in January 2018. Given the large stock of external assets in the balance sheet of the CNB, a sustained appreciation of the koruna could imply financial losses.

The CNB’s exchange rate floor and related foreign exchange market interventions had a noticeable impact on the sectoral composition of the Czech Republic's international investment position (NIIP). While the NIIP of the CNB improved through the accumulation of external assets, the NIIP of the banking sector (excluding the CNB) and the general government sector deteriorated, although to a slightly smaller extent. Based on 2016 outturn data for the balance of payments, it would take more than 10 years for Czech exporters to fully convert their foreign exchange income by purchasing all CZK holdings accumulated by foreign investors since 2013.
An excessive appreciation of the koruna against the euro could be detrimental to the cost-competitiveness of Czech exports. Since the Czech Republic is a small open economy, its exporting firms tend to be price takers in their dealings with importers, predominantly located in the euro area. This would result in lower profit margins from foreign sales once converted into korunas. The high share of foreign value added in Czech exports should however partly offset this effect. Despite the strong appreciation of the real effective exchange rate in Q3-2017 (+3.5 % on the previous quarter), the terms of trade improved by 0.8 % quarter-on-quarter during the same period.
|
Table 1.1:
Key economic, financial and social indicators - Czech Republic
|
|

|
(1) NIIP excluding direct investment and portfolio equity shares.
(2) domestic banking groups and stand-alone banks, EU and non-EU foreign-controlled subsidiaries and EU and non-EU foreign-controlled branches.
Source: Eurostat and ECB as of 30 Jan 2018, where available; European Commission for forecast figures (Winter forecast 2018 for real GDP and HICP, Autumn forecast 2017 otherwise)
|
|
|
Progress with implementing the recommendations addressed to the Czech Republic in 2017 (
) has to be seen as part of a process which started with the introduction of the European Semester in 2011. Looking at the multiannual assessment of the implementation of CSRs since these were first adopted, 70 % of all the CSRs addressed to the Czech Republic have recorded at least 'some progress'. 30 % of these CSRs recorded 'limited' or 'no progress' (see Graph 2.1). 'Substantial progress' and 'full implementation' have been achieved in several areas. For instance, the fiscal framework was strengthened by approving the fiscal responsibility law in January 2017. 'Substantial progress' has also been observed in the fight against tax evasion. This was supported by the implementation of measures such as the control statements and electronic evidence of sales.
|
Graph 2.1:Overall multiannual implementation of 2011 – 2017 CSRs to date
|
|

|
|
Source: European Commission
|
The Czech Republic has secured a timely and durable correction of its excessive deficit. Due to the measures taken in 2014 it achieved full implementation in this area. Since then it has maintained a sound fiscal position, ensuring compliance with the medium-term budgetary objective.
The labour market participation of under-represented groups, and in particular of women, has somewhat improved but challenges remain. Improvements were supported by increasing the number of childcare facilities and other policy measures. The reform of the public employment services, which could further help the integration of other underrepresented groups such as the low-skilled, has not yet brought tangible results. Due to the lack of tailored measures, these groups do not fully benefit from the favourable conditions of the labour market. The adopted laws on public procurement and anti-corruption could improve transparency and the efficiency of procurement practices. Although measures to improve the management of ESI funds have been adopted, deficiencies in this area are still common.
The Czech Republic has made limited progress in improving the long-term sustainability of health and pension expenditure. An accelerated increase of the statutory retirement age and an explicit link to life expectancy has been recommended several times. Instead, measures have been adopted which deteriorate the long-term budgetary outlook. A number of reforms are in the pipeline to improve the efficiency of healthcare spending, but the result is still to be seen. Limited measures have been pursued to simplify the tax system or to reduce the costs associated with paying taxes.
The Czech Republic has made some progress (
) in addressing the 2017 country-specific recommendations. Limited progress has been achieved in improving the long-term sustainability of public finances. The government adopted new measures which, on the one hand, improve the adequacy of the pension system, but, on the other hand, worsen sustainability. A number of major anti-corruption reforms were adopted as part of the government’s anti-corruption strategy, but some challenges remain. To reduce obstacles to growth and administrative burden on businesses, the government amended the Construction Act. There was some progress towards increasing the availability of e-government services, enhancing the public procurement framework as well as improving the quality of R&D.
|
|
|
Table 2.1:Annual assessment of the 2017 CSRs
|
|

|
|
Source: European Commission
|
|
|
Member States can request from the Commission technical support to prepare, design, and implement growth-enhancing structural reforms. The Structural Reform Support Service (SRSS) provides, in cooperation with the relevant Commission services, tailor-made technical support, which does not require co-financing and is provided at a Member State’s request. The support provided under the Structural Reform Support Programme addresses priorities identified in the context of the EU economic governance process (i.e., implementation of country-specific recommendations), but the scope of the SRSS support is wider as it can also cover reforms linked to other Commission priorities, or reforms undertaken at the initiative of Member States.
The Czech Republic has requested technical support from the SRSS to help implement reforms in various areas such as healthcare, growth and the business environment, and the financial sector. In particular, the SRSS provides support to Czech Republic for the implementation of digitalisation in the national health system and for measures enhancing sectoral expertise in the area of energy and transport.
ESI Funds have been pivotal in addressing key challenges to inclusive growth and convergence in the Czech Republic, notably by investing in infrastructure, enhancing technology transfers between academia and business, increasing effective cooperation within public administration, improving the public procurement framework and reducing corruption. As described in Box 2.1 which introduces the ESI Funds, the financial support is also instrumental in supporting vulnerable groups in the education system and reinforcing the participation of under-represented groups, particularly mothers with young children, in the labour market.
|
Box 2.1: Tangible results delivered through EU support to structural change in the Czech Republic
The Czech Republic is a beneficiary of significant European Structural and Investment Funds (ESI Funds) support and can receive up to EUR 23.8 billion until 2020. This represents around 2 % of the annual GDP between 2014 and 2018 and 40 % of all public investment (
I
). By 31 December 2017, an estimated EUR 11 billion (46 % of the total) was allocated to projects on the ground which, among others, increased the support of inclusive education in 76 % of all Czech schools and helped almost 1 700 researchers work in improved research infrastructure facilities, due to increased private investment in innovation and R&D. At the same time, the projects financed the creation of 9 000 additional nursery places and 4 000 new places in the childcare infrastructure system. Around EUR 500 million is to be delivered via financial instruments over 2014-2020, a two-fold increase compared to the 2007-2013 period.
Various reforms were undertaken already as a precondition for ESI Funds support (
II
). Legislative changes were introduced to enhance the efficiency of the public administration, strengthen public procurement, launch the inclusive education reform, introduce the compulsory last year of pre-school education and open up the requirements for creating pre-school education entities, and diversify higher education study programmes. Smart Specialisation Strategies for research and innovation were developed to focus on product specialisation with strong market potential, improving cooperation between enterprises and public research institutions. Moreover, the national and regional transport plans, implemented with support from ESI Funds and other complementary funding, have allowed the timely preparation of projects.
ESI Funds help address structural policy challenges and implement country-specific recommendations. The financial support covers a broad range of issues such: increasing cooperation between academia and businesses; enhancing infrastructure investments; improving energy efficiency; enhancing childcare facilities; supporting the long-term unemployed, low skilled and youth through tailored measures and training, including a more market-oriented vocational education; improving the inclusiveness of the education system; enhancing the attractiveness of the teaching profession; improving the effectiveness of the public administration.
The take up of the European Fund for Strategic Investments (EFSI) in the Czech Republic is advancing. As of December 2017, the total volume of financing approved under the EFSI was EUR 543 million, which is expected to trigger a total private and public investment of EUR 2.4 billion. Within the total, 7 projects have been approved so far under the Infrastructure and Innovation Window (including 6 multi-country projects), amounting to EUR 99 million in European Investment Bank financing under the EFSI. This is expected to trigger about EUR 312 million in investments. Under the SME Window, 9 agreements with financial intermediaries have been approved. European Investment Fund financing, enabled by the EFSI, amounts to EUR 445 million, which is expected to mobilise approximatively EUR 2.1 billion in total investment. Close to 13 500 smaller companies or start-ups are expected to benefit from this support.
Allocations under Horizon 2020, the Connecting Europe Facility, and other directly managed EU funds are additional to the ESI Funds. By the end of 2017, the Czech Republic had signed agreements for EUR 1.1 billion for projects under the Connecting Europe Facility.
More data about the use of ESI Funds in Czech Republic is available at https://cohesiondata.ec.europa.eu/countries/CZ
|
3.
Reform priorities
3.1.
Public finances and taxation
Taxation
Czech tax revenues continue to evolve favourably. Total tax revenues as a proportion of GDP stood at 34.9 % in 2016, above the 2007 peak levels. The Commission Autumn 2017 forecast projects a further increase to around 35.4 % of GDP in 2019. Revenues from labour taxes have been increasing as a share of GDP in recent years, reaching 17.0 % in 2015, below the EU-28 average of 19.3 % of GDP. Tax intake in 2015 from property (0.6 % of GDP) and environmental taxes (2.1 % of GDP) continues to remain low in EU comparison.
|
Graph 3.1.1:VAT gap (2011-2015)
|
|

|
|
Source: Center for Social & Economic Research/CASE (2017)
|
VAT evasion has decreased in recent years but still remains slightly above the EU average. Measures tackling tax evasion (see 2017 country report) have started to increase VAT revenues. As a result, the VAT gap (
) is likely to further converge towards the unweighted EU average of 12.8 % (CASE, 2017). Compared to the neighbouring Central and Eastern European countries, the Czech Republic has the second lowest VAT gap after Hungary (Graph 3.1.1). The VAT actionable policy gap (
), which captures the effects of applying multiple rates and exemptions, is below the EU average (12.8 % compared to 16.4 %). This suggests that tax evasion, rather than the way the system is designed, is the main factor determining the overall VAT gap.
The taxation of labour remains high for low-income single earners. The tax wedge (
) for low-income earners is higher than the EU and OECD average at 50 % and 67 % of the average wage and continued to rise in 2016. This may have partially contributed to the lower activity rate (54.8 %) of low-skilled workers (
) (see Section 3.3). The high tax wedge is primarily due to high employers’ social contributions, which represent two thirds of the total tax burden of low-income earners. The gap for low-income single earners between the EU-28 and the Czech Republic has increased in recent years (see 2017 country report).
Tax relief for families with children alleviates the tax burden significantly, but might reduce incentives for spouses to return to work. Overall family policy is concentrated on tax-breaks for families, but public spending on services to support families with children, at 0.6 %, is well below the EU average of 1 % of GDP in 2013 (OECD Family Database). A comparison of families with and without children shows that the difference in the tax wedge is around 5 pps (Graph 3.1.2), making this one of the most generous policy frameworks in the EU. Existing tax policies for families could reduce incentives for non-working spouses (in most cases women) to return to work (
). Specifically, a primary earner with a spouse faces an average effective tax rate of 23.4 %. By contrast, if the spouse decides to take up a job, the average effective tax rate (
) is around 37.6 % (Kalíšková and Münich, 2015). An additional increase in child benefits from January 2018 could further widen this gap (see Section 3.3).
|
Graph 3.1.2:Tax wedge for families with and without children (2016)
|
|

|
|
Source: European Commission, Tax Indicators database
|
The tax burden on the self-employed is lower than for employed workers. This is mainly due to the lower assessment base for social contributions (
). This could have contributed to bogus self-employment, because of incentives in the form of lower payable social and healthcare contributions. However, the number of primary self-employed people has declined somewhat, while limited liability companies are on the rise (Graph 3.1.3). Anecdotal evidence also suggests that primary self-employed people have shifted towards limited liability companies or became secondary self-employed (
). Stricter tax rules for self-employed people are also likely to further reduce bogus self-employment. In particular, a cap on the use of lump-sum expenses has already been tightened over the past few years. The cap was further reduced since January 2018 (
). These changes benefit those self-employed people with revenues up to CZK 1 million (around EUR 40 000), while making it less attractive for high-earning entrepreneurs to be self-employed.
|
Graph 3.1.3:Number of primary self-employed
|
|

|
|
Source: Bisnode consultancy, Czech Social Security Administration
|
The complexity of the tax system has become a concern for businesses. While changes to the tax system have aimed to improve tax collection, their frequency is problematic for businesses. Tax regulation and tax rates have moved up the list of concerns as problematic areas for doing business (World Economic Forum, 2017). Similarly, more than two thirds of small and medium-sized enterprises (SMEs) would expect the new government to reduce the regulatory burden (Czech Chamber of Commerce, 2017). The new government has indicated possible changes to the tax system. There is also ongoing work to modernise the income tax legislation (see 2017 country report).
Compliance costs have slightly increased and remain above the EU average. The VAT control statement, albeit bringing in additional tax revenues (
), has increased the time needed to comply with tax requirements. This monthly statement is fully electronical, but adds 14 hours to the time needed to comply with tax requirements, totalling 248 hours in 2016 (2018 Doing Business Report). Despite the significant reduction in the number of hours recorded in the last decade, the Czech Republic is still at the higher end of the scale (Graph 3.1.4). Based on research (OECD, 2015) (
), new reduced VAT rates might also add to complexity of the VAT system, especially for SMEs.
|
Graph 3.1.4:Time to comply with tax requirements (2016, in hours)
|
|

|
|
Source: World Bank/PwC Paying Taxes 2018 Report
|
Fiscal framework
The new fiscal responsibility law in place since the beginning of 2017 has significantly strengthened the Czech fiscal framework. However, the effectiveness of the new measures will depend on their implementation. As part of the new framework, a Budgetary Strategy setting an expenditure ceiling for general government units, published for the first time in April 2017, constitutes the starting point for the budgetary process. Based on a cyclically adjusted revenue forecast, it aims to determine expenditure limits for the state budget and state funds. However, the adequacy of this new expenditure rule can only be verified in periods of economic downturn or stagnation.
The independent fiscal institution — the National Budgetary Council — is being currently set up. Albeit with a yearly delay after the law entered into force, the members of the council were appointed in January 2018 and should soon become operational. It will mainly evaluate compliance with fiscal rules. The Committee on Budgetary Forecast has yet to be created. It should assess the robustness of macroeconomic and fiscal forecasts underlying the budgetary process, prepared by the Ministry of Finance.
Coordination of the fiscal and budgetary policy objectives among general government bodies remains one of the weaknesses of the national fiscal framework. Much of general government expenditure is autonomous, with the directly managed state budget (including state funds) representing only around two thirds of it (Ministry of Finance, 2017). Starting from 2018, local governments are subject to more stringent rules on debt management (
). The Ministry of Finance will assess compliance with numerical fiscal rules for municipalities and regions for the first time in spring 2018.
The Czech Republic has not yet fully implemented Council Directive 2011/85/EU on the requirements for the budgetary framework. In particular, internal checks on and independent audits of some public accounting systems are lacking. The transposing deadline expired at the end of 2013.
Sustainability of public finance
The short- and medium-term fiscal sustainability outlook appears sound, but the long-term sustainability of public finances is a challenge (
). The long-term fiscal sustainability indicator had improved in recent years due to the fiscal surplus, but the updated age-related expenditure projections point to a higher projected increase compared with the 2015 Ageing Report (European Commission, 2018a forthcoming). The legislated changes to the pension system over the long-term offset the improvement of the fiscal position. According to the most recent calculations of the Commission, all three components — pensions, healthcare and long-term care pose a challenge, with the overall long-term risk considered medium.
Pension expenditure is expected to rise from 8.2 % of GDP in 2016 to 10.9 % of GDP in 2070. Compared to the 2015 projections, the updated 2018 projections have a more favourable starting fiscal year. This is fully offset in the long run by the worsened trends in macroeconomic and demographic assumptions (
) (Table 3.1.1). New pension measures also worsen the long-term budgetary outlook by 2 % of GDP by 2070. Firstly, the retirement age has been capped at 65, which is to be reviewed every five years as of 2019. The expected gains in life expectancy are not automatically taken into account, since the government has to approve any pension system change. Secondly, the pension indexation is now more generous, taking into account one half of real wage growth instead of the previously used one third.
|
|
|
Table 3.1.1:New 2018 ageing projections (% of GDP)
|
|

|
|
Source: Ageing Report 2015, Ministry of Finance 2017
|
|
|
Healthcare
Despite spending on healthcare below the EU average, the projected increase in age-related public expenditure on healthcare threatens long-term fiscal sustainability. Even though the Czech Republic spends less on healthcare than the EU average (7.2 % of GDP versus 9.9 % of GDP), it has the fourth highest share of public funding of healthcare services in the EU. Based on long-term ageing projections, public expenditure on healthcare is projected to increase by 1.1 pps of GDP, above the average increase of 0.9 pps for the EU. Taking into account the impact of non-demographic drivers on future spending growth, healthcare expenditure is expected to increase by 1.9 pps of GDP from 2016 till 2070, compared to the EU average increase of 1.6 pps (European Commission, 2018a forthcoming).
Efficiency in the healthcare system presents a mixed picture. In terms of the proportion of healthcare spending, the Czech Republic seems to be less hospital-centred than the EU on average. In 2015, healthcare expenditure earmarked for in-patient care was 26.3 %, compared to the EU average of 29.5 %. By contrast, the total number of hospital beds was above the EU average in 2015, indicating untapped efficiency potential in hospital care. Unlike in the case of social care, there are no patient fees in the healthcare system. This creates an incentive for patients to stay longer in hospital instead of being transferred to social care facilities. Overall, healthcare system financing is in surplus. This is partly due to the positive economic cycle, but existing financial cushions may not be enough if the economic situation worsens (Křeček, 2017).
Out-patient care receives a bigger share of financing in the Czech Republic than the EU average (32.7 % versus 29.8 %). This might be due to general overuse of resources, as suggested by the high number of out-patient visits (OECD/European Observatory on Health Systems and Policies, 2017). The high number of avoidable hospital admissions also indicates room for more effective, better coordinated treatment of patients with chronic conditions at the out-patient care level.
The lack of healthcare staff in certain areas and the relatively high average age of healthcare professionals are starting to hinder the functioning of the healthcare system. There are shortages of certain specialists and staff in general in rural areas. For example, the proportion of health professionals per 1 000 inhabitants in Prague is more than twice as large as in rural areas. The number of health professionals in the Czech Republic is around the EU average, but ageing of staff may lead to future shortages: more than 30 % of general practitioners and 40 % of paediatricians are at least 60 years old.
3.2.
Financial sector
Banking sector
The Czech financial system is highly bank-centric. Banks hold 74 % of the systemʼs total assets and 84 % of total capital. The Czech banking sector generally shows high levels of capitalisation, profitability and liquidity. Banks' capital adequacy ratio (
) appears to provide sufficient room for credit financing of the real economy. According to the European Central Bank, the non-performing loans ratio (
) decreased to 2.9 % in the mid-2017 (4.6 % EU). The current period of favourable profitability developments provides an opportunity to raise the capitalisation of the banking sector. Banks were operating with the second-highest return on equity of the EU-28 in mid-2017. Capitalisation ratios have increased slightly over the past seven years, but because they improved more rapidly in the rest of EU, capital levels in the Czech banking system are now around the EU average. Despite low interest rates, interest income remains the banksʼ main source of profit, partly thanks to increasing volumes. A downward trend in revenues from commission and fees is due to growing competition. Nevertheless, banks are shoring up profit levels due to cuts in operating costs and lower asset impairment expenses (CNB, 2017), linked to the favourable business cycle position.
Total credits linked to housing increased by CZK 116 billion in 2016 and reached to CZK 1 344 billion (by 2.4 pps to 28.2 % of GDP). This corresponds to 58 % of the loans provided to the private non-financial sector. Although the housing market is still in an upswing, potential adverse developments in the real estate market would increase the vulnerability of the banking sector. Given mortgage loans are a big part of banksʼ balance sheets, they are currently the main domestic financial stability risk for the banking sector according to the CNB (CNB, 2017, p. 12).
The banking sectorʼs liquidity position is good, but banks lend only 56 % of available funds to their customers (World Bank and European Commission, 2017, p. 12). Clientsʼ deposits and loans are denominated mostly in Czech koruna. The relatively low loan-to-deposit ratio of banks (the eleventh-lowest in the EU in mid-2017) indicates that they rely on their own deposits to lend to their customers, without any outside borrowing. Banks use the excess funds, to the tune of 22 % of GDP (2015), to purchase government securities (15 %), deposit funds in the CNB (10 %) or lend to other banks (11 %). They invest the rest in non-government securities. The net debtor position of the banking sector in relation to non-residents increased further in the first quarter of 2017. This was mostly due to growth in deposits made by non-residents in domestic banks linked to expectations of an appreciation of the koruna after the exit from the exchange rate commitment. Domestic banks placed these deposits mainly with the CNB and did not increase the money supply. Non-residents also held almost 45 % of CZK state bonds in November 2017.
The Czech insurance sector remains stable, as confirmed by stress tests carried out by the CNB. The share of investment fund assets on the households’ balance sheets increased in 2016, partly reflecting attractive investment returns. At 2.4 %, the average rate of return on investments in collective investment funds was much higher than for bank deposits in 2016, and investment funds were the fastest-growing segment in the financial sector in that year. Despite strong growth, investment funds remain a relatively small segment compared to other countries. Meanwhile, average contributions from plan holders and employers to third-pillar pension funds are trending upwards, but they remain low compared with average contributions to the first (i.e. state) pillar.
The Czech capital market is thin compared to similar-sized economies. The overall trade value of shares, debt securities, structured products and investment funds was 16.2 % of GDP in 2016. Despite the household saving rate being the third highest in the EU and annual saving in the economy exceeding the market capitalisation of the Prague Stock Exchange, the ability to turn these into equity and long-term debt financing is limited. The potential of the capital market is not fully exploited, although there are 1 640 large companies and 6 794 medium-sized companies (
) (World Bank and European Commission, 2017). The challenge remains to make it attractive for them to use the domestic capital market.
Housing market
Residential property prices are rising swiftly. In the last quarter of 2016 and the first half of 2017, the house price index (HPI) for the Czech Republic rose at an average rate of 13 % year-on-year, making it one of the fastest-increasing rates in the EU. This is an acceleration of a booming trend in the housing market that began in 2014, following a five-year downward price correction of the pre-crisis housing bubble of 2006/2007. Apartment prices in Prague, significantly higher than in the rest of the country, increased by 18.9 %, slightly above the national average (
).
Estimates of overvaluation of the Czech housing market diverge. Three standard metrics of the degree of imbalance, based on historical averages for price-to-income and price-to-rent ratios, suggested little or no overvaluation of the housing market in 2016 (Graph 3.2.1) (
). By contrast, the CNB analysis suggests that in mid-2017 apartment prices were up to 10 % above levels consistent with fundamental factors. Not only residential property, but also commercial property, may be somewhat overvalued (CNB, 2018, p. 26). Rapid house price increases can be traced back to both demand and supply effects. Demand is primarily driven by factors shaping householdsʼ current and future disposable income, including record-low unemployment and a low risk of job loss given a strong economic growth outlook. Accelerating real wage growth and low real interest rates further boost income prospects and affordability. Mortgage interest rates trended down from 2009 onwards, to bottom out at 1.8 % at the end of 2016 (Fincentrum Hypoindex). Following the turn of the Czech monetary policy cycle in 2017, they edged upwards to 2.2 % in December 2017. A legislative change that entered into force in 2016 shifted the tax burden linked to the real estate-transfer tax from sellers to buyers. Although the tax is now a liability for buyers, asking prices did not drop by the full tax due to a high demand overhang and final prices kept on growing accordingly (
).
|
Graph 3.2.1:Overvaluation gap
|
|

|
|
Source: European Commission
|
Affordability is deteriorating as housing price growth outpaces nominal income growth (Graph 3.2.2). Price-to-income ratios rose by 13.2 % between the start of 2013 and the end of 2016. Although overall affordability appears better than at the previous housing market peak in 2008, the affordability of owner-occupied housing in large cities is of particular concern. Average new apartment prices in Prague imply loans that are too high to finance on an average income when applying standard creditworthiness criteria. However, the fall in mortgage interest rates observed until recently has largely offset the effect of higher house prices (consequently, higher loan amounts) onto debt service costs, with the debt service-to-income ratio (DSTI) in 2016 having risen only slightly from its minimum in 2014.
New mortgage lending has accelerated and shows few signs of slowing down. Overall, households borrowed CZK 227 billion in 2016 to purchase dwellings, a rise of 18 % compared to 2015. In 2017, credit growth remained strong, fuelled by continued loan applications and rising real estate prices (Graphs 3.2.2 and 3.2.4). The exceptionally high demand for mortgage loans observed in the previous quarters declined in the third quarter of 2017 for the first time since 2014.
|
Graph 3.2.2:House prices and loans for house purchase
|
|

|
|
Source: Eurostat, European Central Bank
|
Housing supply remains constrained and may contribute to house price inflation, particularly in the capital region. In view of sustained housing demand growth, commensurate supply could mitigate upward pressures on prices and affordability. Demographic pressures on the housing market have so far been absorbed by an adequate housing supply with the total number of completed dwellings over the past 15 years broadly matching the increase in the number of households during that period (
). However, regional supply shortages persist, notably in Prague, where the number of new apartments available at the end of June 2017 was around 3 600, 25 % lower than in the previous year.
The rate of building permits issuance remains below historic averages and regulatory obstacles to new construction exacerbate the pressure on house prices. At all stages of the housing supply chain there appears to be an ongoing slump in the supply of new housing units (Graph 3.2.3). After a low point in 2013/2014, there were signs in 2016 that the number of building permits issued and dwellings under construction was picking up, but from a very low level and at a slow pace. During the first half of 2017, only 15 477 new building permits for residential buildings were issued. Although this was more than for the same period in the previous four years, it remains around 10 % below the 10-year average. The total number of started dwellings in the first three quarters of 2017 (23 339) was the highest since 2010, but remains significantly below pre-crisis levels. Planning and construction law rigidities appear to be severely limiting the amount of new construction, particularly in densely populated areas such as Prague (
) and areas with high wage growth rates.
|
Graph 3.2.3:Building permits and dwellings statistics
|
|

|
|
Source: Czech Statistical Office
|
In its supervisory capacity, the CNB can guide, but not directly enforce macro-prudential mortgage-lending limits. The CNB still lacks the formal power of setting limits for the loan-to-value ratio (LTV), the loan-to-income ratio (LTI) and the DSTI. Instead it sets recommendatory limits for the LTV to protect homeowners and mortgage lenders against negative equity. In June 2016, it tightened the recommendation in order to decrease the share of new loans with an LTV above 80 % (
). Banks adhered to the limit at the aggregate level in the first quarter of 2016, but they have not fully adhered (
) to the limits in effect since October 2016. In April 2017, the CNB has decreased the maximum recommended LTV by 5 pps to 90 %.
|
Graph 3.2.4:Mortgage loans: stock and new loans
|
|

|
|
Source: Czech National Bank
|
Lenders are expected to take into account borrowersʼ ability to repay loans using their own resources in bad economic times. They use LTI (
) and DSTI indicators in assessing credit applications. The CNB regards as risky mortgages those that sum up to over eight times the borrowerʼs annual income and costing more than 40 % of income to debt service. This is especially true for loans with high LTVs, which are subject to a 15 % aggregate attribution limit. CNB analysis shows that a considerable share of new mortgage loans falls into the high risk category in terms of income. The share of loans with a DSTI above 40 % and a LTI above 8 was less than 9 % in the second half of 2016. The CNB supports the introduction of legislative lending limits. These limits would be likely to increase the compliance. This may help to ensure financial stability and reduce risks for borrowers. The proposal to amend the Act on the CNB did not receive support in Parliament in 2017, but the central bank already mentioned that it would promote its reintroduction (Lidové noviny, 2018). The CNB was the first non-Scandinavian supervisor to introduce a countercyclical capital buffer above 0 % (
), raising it to 0.5 % as of January 2017. Later, it was increased to 1 % as of mid-2018.
Private indebtedness
The indebtedness of Czech households has increased significantly over the last 10 years but not enough to be a medium-term challenge. Although low by international comparison (7th lowest in the EU), household sector debt increased by 1.6 pps to 58 % of gross disposable income at the end of 2015. A buoyant housing market, strong economic fundamentals and consumer confidence resulted in debt growth that is estimated to outpace growth in disposable income in 2016, driven by mortgage lending as the largest item on the household balance sheet. The actual level of debt, both for nonfinancial corporations (NFCs) and households (HH) is lower than the value, which would signal potential risks of an upcoming banking crisis episode (ʻprudential thresholdsʼ).
|
Graph 3.2.5:HH and NFC Indebtedness
|
|

|
|
Source: European Commission
|
Indebtedness is also below what the fundamental value of macroeconomic drivers would suggest (ʻfundamental benchmarksʼ) (
). Overall, this suggests that, the private sector does not face significant deleveraging needs (Graph 3.2.5).
3.3.
Labour market, education and social policies
Labour market
The Czech Republic enjoys strong labour market performance. Strong job creation has been the engine behind consistent improvement. In the first half of 2017, for the first time, total employment exceeded 5 million. The employment rate has reached a record high of 78.9 % in Q3-2017. The job finding rate increased rapidly to a level well above the pre-crisis, while the separation rate further decreased (European Commission, 2017a). As a result, unemployment fell to the lowest level in the EU (2.5 % in Q4-2017) (Graph 3.3.1). In addition, youth unemployment (5.8 % in Q4-2017) and long-term unemployment (0.9 % in Q3-2017) further declined to reach the pre-crisis levels.
|
Graph 3.3.1:Labour market developments
|
|

|
|
Source: Eurostat
|
There is evidence of growing labour shortages. An increasing number of employers report labour shortages as the main obstacle to expanding their operations. The job vacancy rate, which reflects the unmet demand for labour, reached 4.0 % in Q3-2017, the highest level in the EU (
). According to the Commission Autumn 2017 forecast, nominal wages are expected to have grown by 7.1 % in 2017 (see Section 1 on competitiveness). However, there is scope for tapping the remaining labour potential of mothers with young children, older workers, Roma and the low-skilled.
Women’s labour market potential is underused, as reflected in the high employment and gender pay gap. Although the gap steadily declined in the past decade, the female employment rate (68.6 %) remained well below that of men (84.6 %) in 2016. The employment gap is particularly wide for women under the age of 40, and falls sharply for women above that age. The impact of having one child under 6 on the employment of women is among the highest in the EU (Graph 3.3.2) (
). More than three out of four women between the age of 20 and 49 years mention care responsibilities as the main reason for inactivity and the gap is one of the highest in the EU.
|
Graph 3.3.2:Parenthood impact on employment
|
|

|
|
Source: Eurostat
|
|
Box 3.3. 1: Monitoring performance in light of the European Pillar of Social Rights
The European Pillar of Social Rights proclaimed on 17 November 2017 by the European Parliament, the Council, and the European Commission, sets out 20 principles and rights to support citizens. In light of the legacy of the crisis and changes taking place in our societies driven by population ageing, digitalisation and new ways of working, the Pillar serves as a compass for a renewed process of convergence towards better working and living conditions.
 The Czech Republic performs relatively well on the indicators of the Social Scoreboard () supporting the European Pillar of Social Rights, while challenges remain. It has very low unemployment, 2.5 % in Q4-2017, a very low share of people at risk of poverty or social exclusion rate (AROPE), and very low income inequality. On the other hand, the socioeconomic background strongly impacting on students’ performance.
The Czech Republic combines a low participation in early childhood education and care with a high gender employment gap. Only 4.7 % of the children younger than three years take part in formal education, while the gender employment gap amounts to 16 pps. In the context of a labour market tightening and significant gender inequality, childcare provision can be an important policy lever to tap the potential of female labour force.
The Czech Republic has been undertaking reforms and using the support from the European Social Fund (ESF) to increase substantially the childcare availability. Compulsory participation in pre-school education has been gradually introduced, and working arrangements made more flexible. Besides, approximately 14 000 new places in kindergartens and child groups were created with the ESF support over the last two years which reduced the shortage by half. Moreover, an ESF pilot was started for micro-nurseries for children from 6 months to 4 years of age. Further plans include legislation changes to make new types of childcare facilities sustainable and broadening the creation of places for children younger than three years.
|
While women in general return to the labour market after the age of 40, evidence suggests that gender inequalities persist throughout their careers as the average hourly wage of a man is 22.5 % higher than that of a woman. Part of this difference can be explained by segregation — i.e. men work in better paid sectors than women (
) — but more than two thirds remains unexplained, suggesting a potentially important gender bias. Gender inequalities are largely linked to long parental leave, which is very rarely taken up by men (1.8 % of parental benefit recipients in 2015), a shortage of affordable childcare and long-term care facilities and low uptake of flexible work arrangements.
|
Graph 3.3.3:Net childcare costs for a lone mother with earnings (2015)
|
|

|
|
Source: OECD (2017a)
|
The lack of affordable childcare is a major constraint on female labour participation in the Czech Republic. In 2016 only 4.7 % of children younger than three years were in formal childcare. The net cost of childcare is high (Graph 3.3.3): in 2015 a lone mother with low (median) earnings spent 21 % (18 %) of her disposable income on full-time centre-based childcare for two children aged two and three.
High childcare costs are found to have a significant impact on the effective participation tax rate (
). This weakens the incentives to work, especially for lone parents with low earnings. Moreover, childcare tax credits introduced in 2015 aimed at reducing the overall effective tax rate, but high-income families benefit more from this change which led to a substantial reduction in net costs for couples with median earnings (OECD, 2017a). This ‘reverse targeting’ may enhance the existing inequalities, as childcare can have a positive impact on child development, particularly for children from disadvantaged families. Tax relief for families also includes other tax credits (see Section 3.1).
Improving access to formal childcare services reduces one obstacle to female employment. The Czech Republic made the last year of preschool education compulsory and guaranteed places in kindergartens. It also strengthened support for children with special education needs. Around 9 000 new places in kindergartens were created with European Social Fund (ESF) support in the last two years. Projects on children's groups also provided around 5 500 places by 2017. Moreover, an ESF pilot was started for micro-nurseries for children from 6 months to 4 years of age.
Sufficient and coordinated provision of formal accessible, high-quality and sustainable long-term care services remains a challenge. (See also Section 3.1 on healthcare). A lack of care services can be another major impediment to keeping women in employment, as informal care is often the only option for many families. It is most often women who care for dependent and elderly relatives. Introducing three months’ leave entitlement for carers — as the Czech Republic did in July 2017 — may partially enable women to reconcile caring and professional responsibilities.
In the light of the booming labour market, its performance for low-skilled and disabled people is less encouraging. Although they are a small proportion of the population, the employment rate of the low-skilled (43.7 % in 2016) is well below that of the medium and high skilled (respectively 77.9 % and 83.4 % in 2016) (Graph 3.3.4). The inactivity rate for the low-skilled is also more than twice as high as the overall inactivity rate (21.1 %). Similarly, the employment rate of disabled people is only 43 % (against an EU average of 47.4 %), which clearly contrasts with the high general employment rate.
|
Graph 3.3.4:Employment rate by age & education level
|
|

|
|
Source: Eurostat
|
The effectiveness of active labour market policies (ALMP) is low in general and particularly so for the low-skilled (
). On average, 1 in 5 people wanting to work participate in such schemes. Overall, Czech investment in ALMP is highly dependent on ESF funding. A lack of systematic impact assessment and evaluation of ALMP hampers transparency; the evaluation expected to be available in early 2018 is a step in the right direction. The preliminary results have identified some shortcomings in the design and targeting of the measures implemented since 2013. These promoted mostly subsidised employment, training or further qualifications. Evidence shows that the measures targeted groups with fewer barriers, whereas those in greatest need of support (
) were underrepresented. Efforts are being undertaken to improve the design of training through several planned projects, such as ‘Education through practice,’ offering jobseekers a choice of tailored modular training and a chance to obtain new qualifications with their employer accompanied by a mentor. This scheme can also help older workers adapt their obsolete skills to the new labour market needs.
A high proportion of the long-term unemployed, and particularly of those low-skilled, is engaged in public works which rarely lead to employment in the primary labour market. While only 1 in 10 low-skilled ALMP beneficiaries were in subsidised jobs in the private sector in 2017, more than one third were placed in public work schemes. Moreover, the new community service scheme — introduced in 2017 — creates unequal conditions of access to different levels of the minimum income allowance for its beneficiaries. While participation in this scheme is a precondition for a higher allowance, the number of eligible beneficiaries (60 000 to 70 000) far exceeds the number of available posts (11 000).
The Labour Office of the Czech Republic (PES) was reorganised in 2012 but no fundamental changes were made to provide better support for vulnerable groups. This seems to be a missed opportunity for reform, notably in the current period of low unemployment. A kind of single point of contact for a range of benefits, employment and social services, has been set up; this is a significant step towards more consistent support. However, the individual action plans for the disadvantaged unemployed became purely administrative. The initial interview at registration is not followed up by further assessments if unemployment becomes long-term and neither does it lead to a tailored support. There are no specific measures for different categories of clients according to their profile. Too little staff and training is allocated to the low-skilled and long-term unemployed to allow a genuinely personalised approach. A higher use of partnerships with municipalities and NGO’s (e.g. territorial pacts) in providing a wider range of personalised services for the long-term unemployed could help offset this weakness.
The tightening labour market is also attracting workers from both EU and non-EU countries, which could help offset labour shortages. In 2016 around 433 000 foreigners lived in the country, of whom almost two thirds were born in non-EU countries. Under the new systems of the ‘State Integration Programme’ that came into force in January 2016, beneficiaries of international protection receive assistance with housing, employment, health and education, including help to reinforce language skills. The new mobility allowance — recently piloted in a few regions — has been introduced nationwide with the view to increasing regional labour mobility. It covers commuting costs to a new job in another region for job seekers who have been registered as unemployed for over five months.
Social partners are generally involved in the governmental legislative process. They are also well involved in the EU Semester through a long negotiation process (see Box 3.5.1). To further promote social dialogue and capacity building of social partners (
), the possibility of state contributions to trade unions and employer organisations has recently been incorporated in the Labour Code.
Social policy
The Czech Republic regularly features among the European countries with the lowest proportion of people at risk of poverty or social exclusion (13.3 % in 2016) (Graph 3.3.5). This feature is, however, less positive for the 0-24 age group; the level for this group is stuck at around 16-18 %. There is also a rising trend of household poverty and social exclusion for disabled persons, as well as for the long-term unemployed. Moreover, the gap of risk of poverty between the long term unemployed and the shorter term unemployed is among the highest in the EU. The CZ is below the EU average for the maximum duration of unemployment benefits (20 weeks for someone with a 1 year work record) (
).
|
Graph 3.3.5:At-risk-of-poverty or social exclusion rate, age groups
|
|

|
|
Source: Eurostat
|
Despite the generally positive developments in poverty indicators, there are growing challenges: an increasing number of socially excluded localities, housing exclusion and homelessness, and high indebtedness. The number of individuals affected by foreclosures increased by 14 % between 2015 and 2016 and the number of people facing multiple foreclosures is also on the rise. 49 % of debtors face four or more payment orders, and so may fall into a debt trap. Geographically, these largely coincide with socially excluded districts and regions with the highest unemployment.
There are plans to tackle the increasing number of socially excluded districts by amending the law on assistance to people in material poverty of July 2017. However, the law’s aim to discourage more people from moving into these districts risks limiting the mobility of accommodation seekers who are already struggling in an overheated rental housing market.
The legal framework for the social housing plan is still lacking. Current legislation does not address the lack of affordable and quality social housing in the times of record price rises in rental housing (see Section 3.2 on housing market developments). Despite the promising initial action taken to address housing exclusion through the national social housing plan for 2015-2025 proposed in 2015, the law on social housing failed to be adopted in 2017. This act would have underpinned the currently developing coordinated approach towards the social inclusion of disadvantaged groups, including the Roma, such as measures supporting education and skills, healthcare, security and employment.
Housing is the one indicator where perceived discrimination against the Roma worsened between 2011 and 2016. The mid-term review of the EU framework for national Roma integration (2017) points to a fall in the levels of perceived discrimination, notably in education and in the workplace. However, this was not the case for access to housing, where perceived discrimination increased.
Regional social disparities have been addressed in the Czech Government’s ‘Restart’ strategy for the Karlovarský, Moravskoslezský and Ústecký Regions of July 2017. This coordinated approach proposes a number of actions to address indebtedness, provide more social housing, include children from poverty stricken families into the schooling system, make public employment services more efficient, improve health infrastructure and increase crime prevention. However, its success in the long term depends on continued budgetary support and ownership by the government.
Education and skills
Educational performance is affected by students’ socioeconomic background. The proportion of low achievers in science and reading has risen significantly since 2012 (OECD 2016a). At 30.5 pps, compared to an EU average of 26.2 pps, the country has one of the largest gaps in the proportion of low achievers in science between the bottom and top quarters of the socioeconomic index in the PISA student population, together with one of the largest differences between schools on the basis of socioeconomic status (Graph 3.3.6) (
).That disparity is increasing. This may be linked to the selectivity of the school system and the early streaming of students (OECD, 2016b). EU funds are used to support teacher training to work with heterogeneous groups to improve the situation.
|
Graph 3.3.6:Percentage of variation in science performance explained by students' socio-economic status (2015)
|
|
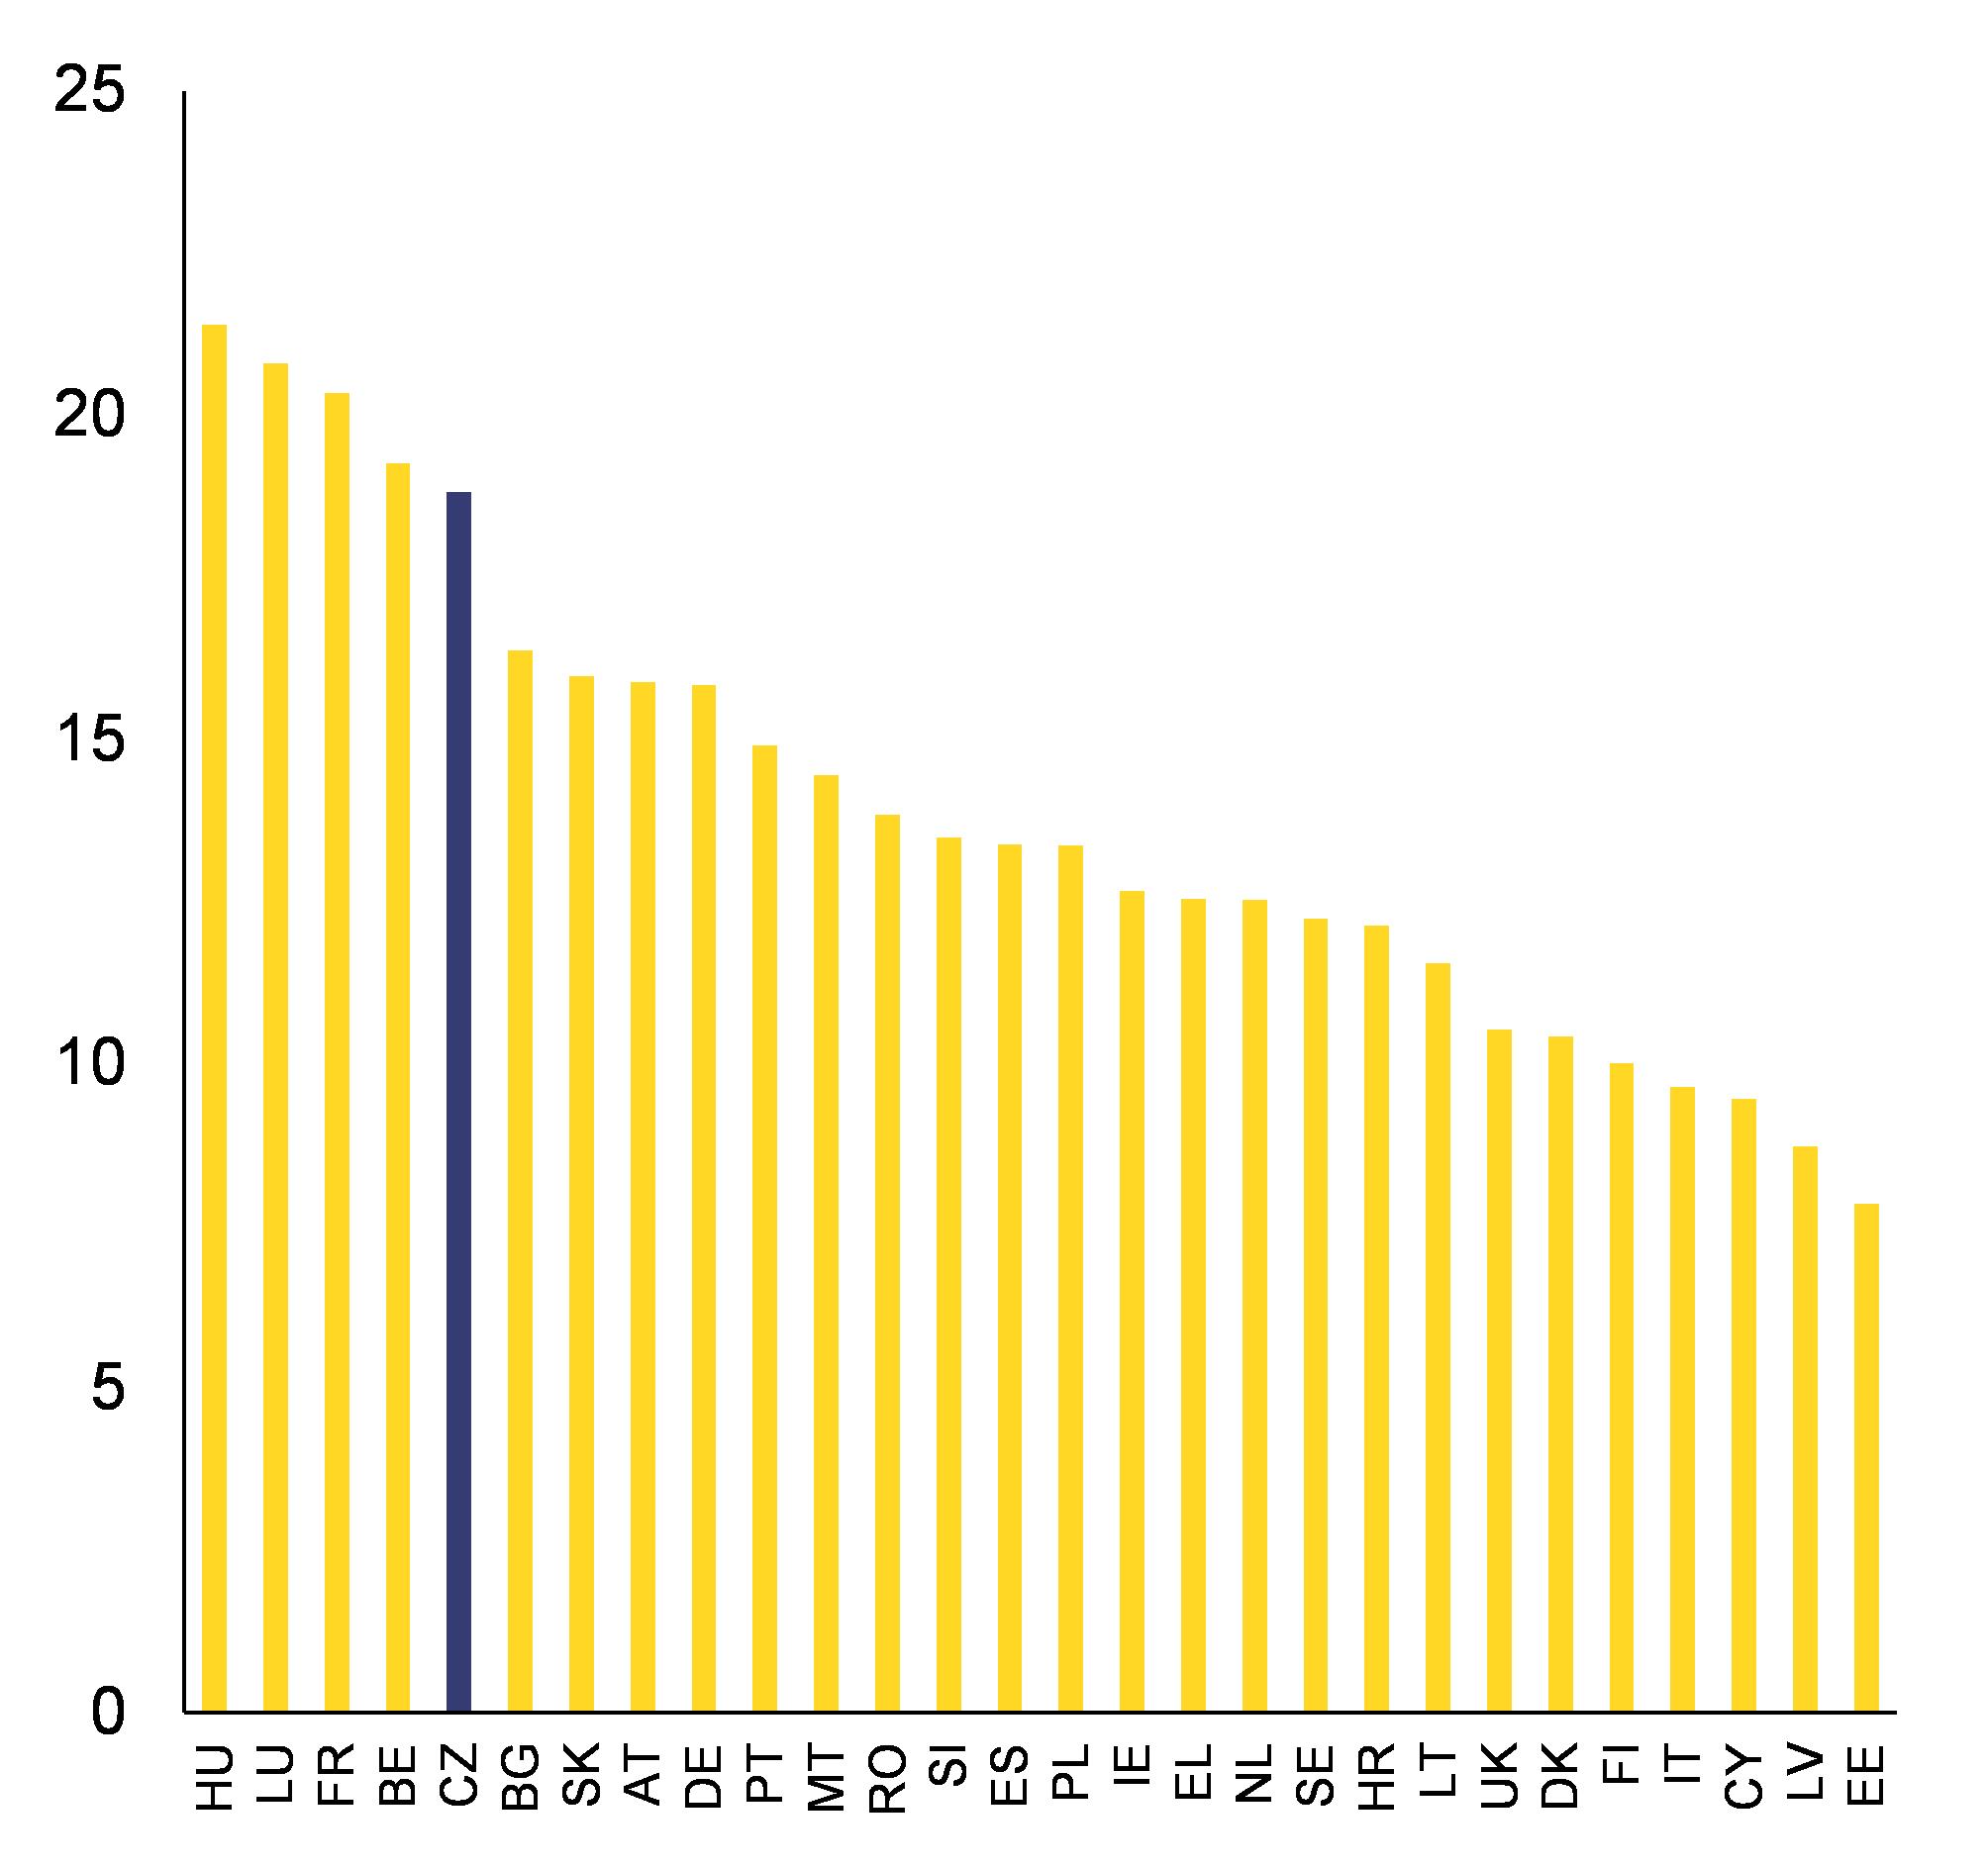
|
|
Source: OECD (2016a)
|
The reform introduced in September 2016 helps the inclusion of pupils with special needs (including socioeconomically disadvantaged children) in mainstream education with the support of the ESF (European Commission, 2017b). The long-term success of the reform will partly depend on the availability of sufficient, sustainable national funding and sufficient further teacher and assistant teacher training to teach heterogeneous groups. Appropriate awareness of the potential benefits of inclusive education and involvement of all stakeholders will also be crucial to successful implementation.
Since September 2017, the last year of preschool education has been compulsory to include more disadvantaged children. The ESF supports projects to promote the participation of the socioeconomically disadvantaged in early childhood education and care. A number of five-year-olds have not been registered so far, calling for further awareness-raising activities with families and municipalities on the benefits of participation. It is estimated that only about 34 % of Roma participate from the age of four (FRA, 2016).
While still below the 10.7 % EU average, the early school leaving rate continued to rise, to 6.6 % in 2016, in contrast to recent falls in most EU countries. Regional disparities are high, ranging from 3.2 % in Southeast region to 13.8 % in Northwest region (Graph 3.3.7). The estimated proportion of Roma children who leave school early remains very high at 72 %, which significantly impacts their future job prospects (FRA, 2016). Close monitoring and new preventive measures, such as teacher training to identify pupils at risk and to help prevent early leaving by adapting teaching methods and working with stakeholders, could improve these indicators.
|
Graph 3.3.7:Early school leaving by region (2016)
|
|

|
|
Source: Eurostat
|
Despite recent increases, teachers’ salaries remain comparatively low. They rank among the lowest in the EU compared to those of other workers with tertiary education; salary progression rates are low (OECD, 2017b). This contributes to the profession’s low attractiveness to talented young people (European Commission, 2017b). Shortages of qualified teachers, combined with demographic projections, indicate problems in recruiting and keeping new teachers. There is no systematic ex-ante assessment of the expected number of teachers needed for the following years. The government increased teacher salaries by 15 % from November 2017 in reaction to a strike warning. A long-awaited new career system for teachers linking continuing professional development, career and salaries was due to be adopted in 2017 but the legal procedure has not been completed. A systematic ESF support programme for all new teachers is being planned. It is expected to improve teaching quality and reduce the proportion of teachers leaving the profession quickly.
The tertiary education attainment rate was 32.8 % in 2016. Annual expenditure per student is only two thirds of the EU average (OECD 2017b). Tertiary-educated Czechs earned almost twice as much on average as those with only upper secondary education, while those with a bachelor’s degree earn around 50 % more. The completion rate for bachelor’s or equivalent programmes remains low at 37 %. A new funding system for higher education institutions will be introduced in 2018, to stabilise their funding while also supporting diversification and quality.
A comprehensive skills strategy supporting the adaptation of the labour force to structural changes expected in the labour market has not yet been designed. Various initiatives were developed over the last years with ESF support, such as a new system of labour market forecasting, which nonetheless have not yet evolved into a comprehensive system of skills intelligence and anticipation. The National Register of Qualifications became the reference point for accrediting Continuing vocational education and training (CVET) programmes. However, a single national Skills, Qualifications and Occupations classification has not been finalised. Stakeholder engagement and local/regional dialogue between policymakers, employers and education and training providers is key to addressing this lack of formal and systematic skills anticipation.
Several measures to improve vocational education and training (VET) and adult learning have been implemented to increase skills supply and address skills shortages. Validation of previously acquired skills and a modular approach in retraining courses are being prepared. This is in line with the recent EU skills policies ‘Upskilling pathways’.
All initial VET programmes in the Czech Republic are school-based, but mandatory practical training and work placement are also an integral part of the curricula. However, there is still substantial scope to increase work-based learning as a proportion of VET (8.8 % in 2015). The challenge to get small businesses more involved in work-based learning may be overcome through providing appropriate support or setting up regional training centres. The Czech Republic also lacks a single comprehensive national qualifications framework. Attempts to introduce the Higher Education Framework into national legislation have failed. The National Register of Qualifications has become the reference point for accrediting continuous VET programmes and for recruitment of qualified employees in occupations that face skills shortages.
3.4. Investment
Business environment
Challenges to the business environment remain, mainly in contract enforcement, construction permits and tax complexity. The Czech Republic ranks relatively high (30th out of 190 countries) in the World Bank’s Doing Business 2018 ratings. It ranks first in ‘trading across borders’ (
). In ‘enforcing contracts’ and ‘dealing with construction permits’ (
), however, it ranks among the worst in the EU (at 91st and 127th respectively). These issues remain its key obstacles to doing business. Another obstacle is the complexity of tax regulations, which has worsened recently (Global Competitiveness Index 2017/18) (see Section 3.1). For example, start-up founders indicated in a recent survey that they need to devote one employee to meeting all the tax requirements. Frequent tax inspections and the obligation to pay VAT on unpaid invoices were also mentioned as a factor that impedes cash flow (Aspen Institute Prague, 2016).
To accelerate the permit procedure, an amendment to the Construction Act was adopted in mid-2017 and is effective from January 2018. One of its main features — aimed at simplifying the building procedure — is the option of including the environmental impact assessment in the zoning decision or in the joint zoning and building permit. This is a positive development, as it reduces extra administrative steps. However, developers doubt that the amendment will make a difference to the new construction projects, mainly because various other authorisations are not included in joint permitting. This makes the simpler procedure unworkable for large infrastructure projects. Also, there is no obligation to use the integrated permitting procedure. A further concern is that the amendment will limit the existing rights of civil society to participate at various stages of a project. Moreover, the amendment does not yet fully exploit the scope for streamlining. The Ministry of Regional Development, which is responsible for it, has already presented plans for completely new construction legislation (Ministry for Regional Development, 2017). Another major barrier to infrastructure investment is the regulation for land expropriation, which remains unaddressed.
SMEs in the non-financial business economy (
) account in line with the EU average for two thirds of total employment. Czech SMEs are relatively small, employing an average of 2.4 people, compared to an EU average of 3.9. Their share of total value added (54.5 %) is slightly below the EU average (57.1 %). The main sector for Czech SMEs is manufacturing, which generates almost 30 % of SME value added and employment, nearly 10 pps more than the respective average EU share.
However, productivity growth in SMEs has not kept pace with the growth observed in large non-financial enterprises. The average labour productivity growth of SMEs in the manufacturing sector (3.1 % in 2009-2014) lags behind that of large enterprises (5.6 %) (OECD, 2017c). Similarly, average SME value added grew by 9.5 % in 2012-2016, against 16.4 % for large firms. The overall underperformance of SMEs in manufacturing compared to large firms is in large part explained by growth in the car industry, which is dominated by large firms. Another explanatory factor is SMEs’ difficulty in competing for highly qualified workers, since large companies are able to offer more competitive wages and have better access to foreign labour markets (European Commission, 2017c).
The Czech Republic performs below the EU average on entrepreneurship and new business start-ups. Despite the progress achieved since 2008 on business start-ups (such as introducing lower fees for registering simple limited liability companies) the percentage of total early stage entrepreneurial activity and the business ownership rate remain below the EU average. In addition, entrepreneurs do not enjoy a high status and entrepreneurship education is lacking at both primary and secondary levels (European Commission, 2017c).
The financing environment for SMEs continues to improve, while venture capital remains underdeveloped. Czech banks are more eager to provide loans to SMEs than they were in previous years. Of SMEs that applied for a loan, only 2 % of their applications were rejected (EU: 5 %) (European Commission, 2017d). Little public funding was devoted to support venture capital and revolving funds (Srholec et al., 2017). New start-up funding should be available via two recent funds. Firstly, a fund of funds was launched in 2017 and is currently at the stage of selecting fund managers acting as financial intermediaries. Secondly, a national innovation fund dedicated to financing SMEs and seed projects is in the final stage of implementation, waiting for the central bank's authorisation to start operations.
Payment practices in the Czech Republic worsened in 2017. The average time taken for customers to settle their invoices in B2B transactions increased from 24 days in 2016 to 32 days in 2017, exceeding the payment terms (27 days). Indeed, 88 % of Czech companies surveyed have been asked to accept longer payment terms than they could comfortably sustain, compared to the EU average of 61 % (Intrum Justitia, 2017).
The time to resolve insolvency remained the same in 2014-2017 at 2.1 years, which is in line with the EU average of 2 years. However, the cost of resolving insolvency is the third highest in the EU at 17 % of the debtor’s estate (European Commission, 2017c). The law on insolvency and resolution was amended in July 2017 to simplify the discharge procedure and strengthen protection against abuses. A legislative framework amendment to improve a ‘second chance’ for non-fraudulent bankrupt entrepreneurs was also drafted but not approved before the end of the legislature.
Czech Republic in the global value chain
The Czech Republic’s economy relies strongly on the automotive sector. With a share of 5.6 % on gross value added in 2016, manufacturing of motor vehicle ranks high in the EU. When taking into account also supply chains, the industry accounts for around 10% of the economic output (Sobíšek and Koršňák, 2017). Overall, the share of gross value added of all foreign-controlled companies has slightly declined to around 30 % in 2015, from the peak of 33 % in 2009. The difference in labour productivity as compared to domestically owned firms stopped increasing in 2007, suggesting that the Czech Republic might be gradually moving to the qualitative phase of internationalisation (TA CR, 2016), which requires policies that increase knowledge-based capital and support domestic drivers of growth.
Foreign-owned companies have a strong focus on exports. Despite representing only around 13 % of trading firms, foreign-owned firms account for more than 80 % of total exports by value (OECD, 2017c). FDI supports over one quarter of all private sector jobs and 42 % of the private sector’s value added (OECD, 2017d). Moreover, companies under foreign control report 40 % higher labour productivity than the domestic sector. While Czech firms have a high share of medium- and high-quality manufacturing exports, the top quality segment is rather small and has declined since 2011 (Graph 3.4.1).
|
Graph 3.4.1:Share of export value in top quality category
|
|

|
|
Source: European Commission calculations’ based on Comext (Eurostat) and ORBIS data.
|
A competitive service sector is crucial to boosting value-added. A full liberalisation in market services could increase the productivity of several manufacturing industries by more than 5 % (Curnis et al., 2017). The services content of the Czech Republic’s total exports of goods and services was 48 %, below the OECD median value of 57 % in 2014. A firm-level study found a strong positive relationship between services sector reform and the performance of manufacturing industries relying on services (Arnold et al., 2011). A recent study (Münich et al., 2014) concluded that cross-border investment in the service sector encourages technological upgrading, unlike investment in manufacturing.
EU funds
The slow mobilisation of resources granted for the 2014-2020 programming period led to a fall in investments co-financed by the European Structural and Investment (ESI) Funds in 2016 and 2017. While most of the operational programmes for 2007-2013 have nearly closed, the 2014-2020 programme has been slow to start, although it has accelerated recently. The factors behind this delay include: the late adoption of operational programmes; lengthy preparation of calls for applications; complex implementation rules; staff turnover in the authorities managing the funds; and the lack of projects in a limited number of areas (especially energy efficiency and broadband infrastructure, see Section 3.5). Operational programmes on employment, technical assistance and transport are performing better on contracted operations and payments made to the beneficiaries than other operational programmes. Further details on EU co-financed investment and funding from EFSI are provided in Box 2.1.
Efficiency of public administration
E-government services
The performance of e-government remains below the EU average. Although in 2017 the availability of pre-filled forms and the number of online service completion increased, the use of e-government services is well below the EU average. In particular, only 16 % of internet users submitted completed forms to public authorities over the internet, compared with an EU average of 35 %.
In 2017 two laws on secure access to e-government services have been adopted. These are the laws on electronic identification and on citizens’ identity cards. As they enable digitalisation of individual services they have the potential to boost e-government services and help to foster digital society beyond the public administration. However, their impact may be limited by the fact that e-identification will be obligatory only for those authorities that already use e-communication via data boxes or the public administration portal, while it will be voluntary for others. The impact of the new legislation and the success of the numerous planned e-government projects will depend on the ability of the authorities to raise awareness and provide user-friendly solutions.
National e-ID, which should serve as a key enabler for the use of e-government services, is set to be introduced in July 2018. The government also plans to launch an interactive citizen’s portal, acting as a national gateway for personalised e-government services. To improve accessibility, classification of the available public sector digital services (around 700) is ongoing, with a view to cataloguing them. This should raise awareness of e-government services from current low levels, which is one of the barriers to their broader usage. Work is also ongoing to improve interoperability of e-government infrastructure (
), which should help address the fragmentation of services and databases.
Public procurement
Steps were taken in 2017 to improve the legal and administrative framework for public procurement. Following the transposition of the modernised public procurement and concession directives in 2016, the conflict of interest registry has been operational since September 2017 and a new law on identifying beneficial owners was to enter into force in January 2018. These measures should, in time, improve transparency and integrity in public procurement. The percentage of contracts awarded without a call for tenders, has already decreased considerably from 21 % in 2016 to 10 % in 2017, although this still remains well above the EU average (3 %). Additionally, price has consistently been the only criterion in nearly 80 % of procedures. The proportion of public procurement contracts awarded in a procedure that attracted only one bidder has been increasing year-on-year and reached 47 % in 2017, up from 19 % in 2014 (EU Single Market Scoreboard, 2018). Survey evidence shows that 35 % of business representatives (slightly above the EU average of 31 %) considered corruption to have prevented them from winning a public tender or contract in the Czech Republic in the three preceding years (European Commission, 2017e).
Several targeted initiatives aim to improve public procurement practices. One is the establishment of competence centres by the Association of Municipalities, acting as knowledge hubs for municipalities. Another initiative, by the Association for Infrastructure Development, aims to provide guidance on the use of ‘most economically advantageous tender’ (MEAT) criteria in infrastructure projects. Furthermore, the IT vendor lock-in issue has been recognised by national case-law as an illicit practice and the government has drafted a strategy to deal with this issue. Nevertheless, aggregating procurement practices (used only in 5 % of the cases in 2017) and acquiring specialist expertise in selected areas remain major challenges for most of the public sector.
Public procurement is being professionalised via a multi-layered training framework for procurers and suppliers. In the first half of 2017, 30 training events reached 2 500 people. These training events come with documented methods and e-learning tools. This strategic approach could improve key public procurement indicators, e.g. by reducing the percentage of single bid procedures and cutting unnecessary bureaucracy. Overall, delivering better value for money and addressing challenges — for example in the health sector, which is below average in terms of procurement indicators (
) — could lead to improvements.
The government made the national electronic procurement tool NEN compulsory for all central government authorities as of June 2018. These authorities must either adopt the national platform or request an exemption and demonstrate the functional and financial advantages of an alternative tool. Specialised training on the tool has been widely delivered. However, the obligation to use the NEN has raised objections from certain government organisations and private platforms on grounds that it may reduce competition.
The Competition Office issues review decisions, which are significantly belated in case of most of the second instances. Although the review procedures by the Competition Office (ÚOHS) the first instance seem to have improved in terms of compliance with the time limits (60 days), the second instance decisions appear to be late in 92 % of the cases (average duration of 232 days). This affects the efficiency of public procurement projects.
Corruption
Corruption and bribery are ongoing concerns for businesses and the public. Corruption is considered as one of the top five most problematic factors for doing business (World Economic Forum, 2017). Issues include the diversion of public funds (the Czech Republic ranks 99th out of 137 countries), favouritism in decision-making (95th) and payments of bribes (46th). This is reflected in business perceptions: 74 % of business representatives agreed with the statement that favouritism and corruption hamper business competition (the EU average is 68 %) (European Commission, 2017e). Some 80 % of company representatives see corruption as widespread (the EU average is 71 %). Bribery cases that reach court generally lead to convictions, but relatively few suspects are accused of accepting or offering bribes (
) and the overall number of bribery investigations remains low.
A number of major reforms were adopted as part of the government’s anti-corruption strategy. Positive examples include the laws on access to information, on the origins of property, on political parties, on public procurement and on the Central Registry of Contracts. New public procurement legislation requires the winning supplier to disclose information on its ownership structure, right up to the ultimate beneficial owner, regardless of the company’s legal form. An amendment to the law on conflicts of interest introduced a central electronic registry of interest declarations and required all public officials to file declarations on taking up office. However, penalties are mainly financial. An amendment to the law on the Central Registry of Contracts introduced further exceptions in July 2017, so that the law no longer covers a large part of contracts by state and municipality-owned enterprises. This raises further concerns about transparency in public procurement.
Some areas still remain unaddressed by the anti-corruption strategy. In particular, extending the powers of the state audit office to the regional and municipal level, the lack of supervision of state-owned companies (now excluded from the scope of the Central Registry of Contracts), and gaps and inefficiencies in the conflict of interest registry remain challenges for the next action plan. Moreover, plans to revise lobbying legislation and to introduce specific legislation on whistleblower protection failed to materialise under the previous term of the Parliament.
Civil Service Act
Two years after its full entry into force in July 2015, the Civil Service Act has been implemented, but deficiencies persist. In terms of efficiency, the Act has given the civil service more transparency and predictability, but it has come hand in hand with increased administrative burdens at all levels. Cumbersome recruitment procedures combined with a very tight labour market, mean that a number of authorities struggle with understaffing (in particular of high-skilled professionals). The Act limits the ability to attract experts from academia or the private sector and is itself limited in scope (i.e. it does not cover semi-budgetary organisations).
The June 2017 amendment of the Act has addressed some of these deficiencies, but there is scope for improvements both within the Act and in its application. Progress includes simplifying recruitment procedures, making salaries more attractive for experienced applicants and introducing exceptions to the education requirements for long-serving officials. However, the adopted amendment did not fully address the systemic challenges. The act now faces a major test of its ability to withstand pressures and provide the necessary stability. In particular, the number of senior management dismissals following the arrival of the new government suggests that depoliticisation is not effectively guaranteed by the Act.
|
Box 3.4.1: Investment challenges and reforms in the Czech Republic
Macroeconomic perspective
Since accession to the EU, both private and public investment in the Czech Republic has remained above the EU average. Since the downturn in 2009, investment exhibited strong cyclical behaviour. More recently, it dropped again in 2016 (-2.3 %) due to the slump in public investment (-34 %). The volatility of public investment is closely connected with the ESI funds cycle. Total investment is projected to have risen by 4.9 % in 2017 (Commission Autumn 2017 forecast), supported by the new EU programming period. Over the period 2009-2016, the level of investment in dwellings in the Czech Republic was low (3.6 % of GDP) compared with the EU (4.7 %), while investment in equipment (11.3 %) was double the EU average (5.9 %).
Assessment of barriers to investment and ongoing reforms

Overall barriers to investment in the Czech Republic are moderate, as confirmed by the European Commission assessment. Some reforms have been adopted to reduce the administrative burden that constrains the business environment in general and the construction sector in particular, but more time is needed to assess the outcome of their effective implementation. There is a certain lack of stability of legislation, coupled with increasing costs of tax compliance. Staff turnover in public administration could affect the allocation of funds. Some efforts have been made to address problems related to public procurement and digitalization of public administration.
Main barriers to investment and priority actions underway
1. Administrative and regulatory burdens continue hampering business environment in the Czech Republic. The numerous procedures required to start a business, increasing time needed to comply with tax requirements and high cost needed to resolve commercial disputes are barriers for investment. The implementation of the amended Construction Act (in effect since January 2018) aims to shorten and streamline the procedures for granting land and building permits, e.g. providing the option of including the environmental impact assessment in the zoning decision or in the joint zoning and building permit.
2. Specific concerns about the conduct of public procurement procedures prevent public investment from fully exploiting its potential. Despite the reforms adopted by the authorities (e.g., the implementation of the public procurement directives) and the training of procurers, issues include the steadily increasing rate of single bid procedures as well as the incidence of corruption. Some action has been taken to improve efficiency of the public administration. There is still room to accelerate the drawdown of the EU funds. Several measures taken in 2017 are intended to boost the use of e-government services, one of the lowest in the EU.
|
3.5. Sectoral policies
Research & development
The Czech economy is shifting towards more knowledge-intensive activities, with increased business R&D investment, mainly through FDI. The country saw some of the strongest EU growth in high-tech and medium-high-tech manufacturing and knowledge-intensive services sectors, in terms of share of value added (Graph 3.5.1). Business expenditure on R&D (BERD) has increased from 0.7 % of GDP in 2008 to 1 % of GDP in 2016 (61.1 % of total R&D) (
). About 7.3 % of R&D expenditure in business was funded from public sources. R&D conducted by foreign companies stood at 64.1 % of total business expenditure for R&D in 2016. Public expenditure on research and development decreased by 0.27 pps to 0.65 % of GDP in 2016 (with the decrease of public R&D funded from abroad for more than 80 %).
|
Graph 3.5.1:Value added in high- and medium-high-tech manufacturing and KIS as % of value added
|
|

|
|
Source: European Commission (SRIP Report 2018).
|
While BERD spent by foreign enterprises more than doubled over the last six years, domestic enterprises actually reduced their R&D expenditure over the last two years. Foreign funds for R&D activities are mostly channelled into the manufacturing sector (about 56 % of total inward foreign R&D investment) (Czech Statistical Office, 2017). ʻInformation and communication activitiesʼ (19.6 %) received most inward foreign R&D investment in the service sector.
Skilled human resources are crucial to developing a well-functioning research and innovation ecosystem but are in short supply. The proportion of the population aged 30-34 who have completed tertiary education is still well below the EU average (
), although it has been catching-up in the last 10 years. While the country performs well for the number of graduates in computing (sixth in the EU), it is below the EU average for new graduates in science and engineering (17.2 per thousand population aged 25-34, against an EU average of 19.1). This situation is likely to lead to further skill shortages in the future. Attracting more talent into science and engineering and into a research career (
), including recruiting from abroad and improving conditions for female researchers (only around 23 % full-time equivalents of researchers in 2016 were women) (Srholec et al., 2017), could alleviate emerging shortages.
Measures have been taken to build links between academia and businesses, but knowledge flows remain weak. Key indicators of public-private cooperation remain below the EU average (
). Setting up National Innovation Platforms has enabled a more structured debate with the private sector about its needs and priorities in applied research in preparation for the updated national research and innovation strategy for smart specialization. The National Innovation Platforms are expected to encourage the establishment of collaborative networks at regional level too. Several programmes, run by the Technological Agency of the Czech Republic (TA CR), focus on supporting public-private cooperation. The new ETA programme managed by TA CR, whose aim is to strengthen social and human dimensions in applied research, experimental development and innovation includes innovative approaches to bring together research organisations and innovation stakeholders. The competence centres financed by TA CR and the regional voucher programmes (subsidies for the purchases of knowledge from regional research institutions) are effective instruments to foster public-private cooperation, with potential for scaling-up (
). However, it remains to be seen whether the reform momentum will be sustained.
The Czech Republic underperforms in terms of the quality of its public science base. Since 2010, very significant investment notably using the ESI Funds, has allowed public research capacity to grow. As a result, the Czech Republic ranked ninth in the EU in public R&D intensity in 2016 (measured as public R&D expenditures as a share of GDP: 0.65 % against an EU average of 0.69 %). However, this investment has not yet had a sizeable impact on scientific quality. For instance, the Czech Republic ranks only 20th in the EU for its share of highly-cited scientific publications (
), a key indicator of scientific quality, even if more positive developments are visible in some specific areas (Albrecht et al., 2017). The rapid rise seen in investment will need some time to raise outcome and impact indicators. However, the contrast between R&D inputs and outcome indicators highlights the importance of a more efficient R&D system. The relatively low international openness of the research system (
) is one of the factors to be addressed in raising quality (Jonkers et al., 2017).
Reforms to improve the efficiency of the public R&D system has begun, but have not yet been fully implemented. An example is the new evaluation methodology (Metodika 17+) adopted in 2017, which will be gradually implemented until 2019. The formal process for updating the national smart specialisation strategy has started. An international peer-review evaluation of most important research facilities took place in 2017 under the funding scheme for large R&D infrastructures (Roadmap for 2016-2022 based on the 2014 comprehensive ex-ante evaluation) (
).
The public research, development and innovation support system and its governance are fragmented. The August 2017 proposal for a new law on the support for research, development and innovation has been put on hold.
Telecommunications
Consumersʼ assessment of the market performance of telephone services has deteriorated since 2015 and the relevant indicators are below the EU average. The fixed telephone services market ranks fifth worst in the EU and the mobile telephone services market ranks low, with 3.9 points below the EU average (European Commission, 2018c forthcoming). Mobile broadband prices are significantly above the EU average (
). That goes for services offered for both handsets (EUR 44 against an EU average of EUR 24) and tablets/laptops (EUR 27 against EUR 17) (European Commission, 2018d). Mobile broadband take-up is below the EU average, with 81 subscriptions per 100 people in 2017. To tackle the high mobile broadband prices, the National Regulatory Authority (CTU) launched a public consultation in August 2017, inviting comments on the criteria for assessing the mobile services market. An amendment to the Telecommunications Act aims to make the retail market more competitive by reducing the time needed to switch between mobile operators from 40-60 to 10 days from February 2018.
While the target for fixed broadband full coverage target has almost been reached, next-generation access (NGA) coverage is 89 %. However, NGA coverage in rural areas (59 % of households) remains a challenge (
). Subscriptions to high speed broadband — although in line with the EU average — are based mostly on DSL technologies, while fibre technology (FTTH/B) only represents 17 % of the total (Digital Scoreboard 2017 indicators).
The Czech Republic plans to use ESI Fund to support the roll-out of broadband infrastructure. Specifically, the Operational Programme Enterprise and Innovations for Competitiveness (OPEIC) should support areas not benefitting from high-speed connectivity delivered by commercial operators. However, the implementation of the high-speed internet subsidy scheme has suffered substantial delays and encountered a number of problems that would require swift action.
Transport infrastructure
Investment in infrastructure continues to be below the EU average. The total motorway network length was 776 km in 2015 (European Commission, 2017f), with several hundreds of kilometres of core TEN-T motorways still missing. The existing investment gaps are linked to the infrastructure quality and standards, in particular with regards to the TEN-T Regulation (
). More generally, investment in transport infrastructure was inadequate in 2011-2015 (Graph 3.5.2). The analysis points to underinvestment of 0.3 pps of GDP even in 2015, a year which saw a sizeable influx of EU funds. And while EU funds are key to infrastructure funding the selection rate for projects in the 2014-2020 programme is only slowly improving.
The Czech Republic has the densest railway network in Europe (
), but lacks key cross-border linkages. In 2016, the total length of rail lines in use was 9 463 km, just 34 % of which were electrified, against an EU average of 53 %. Major cross-border links for rail and road with higher added value are missing. The national railway signalling system is outdated and the European Railway Traffic Management System (ERTMS) has not been put into operation. Opening the market for rail operations could boost rail infrastructure investment. Rail competitorʼs market shares are lower than that of the national provider (ČD) — around 9 % for passenger and 35 % for freight transport — although they have risen since 2011 (SŽDC, 2016). A new rail regulator has been set up to oversee the railway market.
|
Graph 3.5.2:Investment in road infrastructure (% of GDP)
|
|

|
|
Source: Commission Services calculations based on Eurostat/OECD
|
Energy efficiency, resources and climate
Progress towards better energy performance for residential buildings is slower than in the rest of EU, despite substantial EU funds and national budget allocations to the sector. Channelling the allocation of EU funds earmarked for energy efficiency of private housing (EUR 512 million in this programme period) and enterprises (EUR 746 million) to beneficiaries remains a challenge, while the situation of public buildings (EUR 598 million) is improving moderately. The absence of a harmonised rollout of flexible financial instruments hinders the support for energy efficiency measures.
The interconnection capacity for electricity is well above the 2020 and 2030 EU targets. However, the national arrangements for congestion management and the definition of bidding-zone in central Europe do not accurately reflect actual congestion. Lack of regional coordination is increasingly limiting cross-border electricity flow.
|
Box 3.5.1: Policy highlights - European Semester process
The European Semester process in the Czech Republic is well established and ensures strong involvement of the national parliament and stakeholders. As for the Parliament, the key milestones of the Semester, such as the Country Report, the National Reform Programme, the Convergence Programme and the country-specific recommendations (CSRs) are discussed in the EU committees of both chambers. The Commission Representation is usually invited to present the Country Report and the CSRs to the relevant parliamentary committees.
Stakeholders are involved in the European Semester primarily through the so-called ‘National Reform Programme (NRP) roundtables’, debates organised by the Office of the Government. The objective is to provide an inclusive consultation platform to prepare the National Reform Programme between February and April each year. Furthermore, the stakeholders discuss in the ‘NRP roundtable’ format the country-specific recommendations and progress with the NRP and CSR implementation in October. The government approves a detailed progress report on NRP and CSR implementation in November which is then shared with the Commission. The NRP roundtables include inter alia representatives of the ministries, Parliament (EU committees), associations of regions and municipalities, social partners, academia and NGOs. Around five roundtables are organised every year, some benefiting from visits by the Commissioners and/or the Commission officials. The Commission Representation is also invited to the roundtables and ensures participation at the level of either Head of Representation or European Semester officers.
Besides the NRP roundtables, social partners are consulted on the NRP and the Convergence Programme also via a formal tripartite process. Involvement of stakeholders in the Semester and effective communication with the Commission is further reinforced by bilateral meetings between the Commission Representation and social partners, local governments and line ministries.
|
The Czech Republic has already met its 2020 targets for renewable energy (target 13 %; 15.1 % in 2015). However, due to changes to support schemes for renewables, the development of renewable energy sources levelled off in 2015. The use of bio fuels in transport decreased in 2015 to 6.5 %, staying below the specific 10 % target.
Waste management and air pollution remain particular challenges. Air quality continues to give cause for concern. The latest reports from 2016 show breaches of the particulate matter (PM 10) limit in four air quality zones. This also raises concerns about premature deaths attributable to fine particulate matter concentrations (European Environmental Agency, 2017a). The Czech Republic is one of three Member States that granted large combustion plants more time to comply with the stricter emission limits on pollutant emissions to air, water and soil under the Industrial Emissions Directive.
Municipal waste generation remains below the EU average, with recycling of municipal waste accounting for 33 % in 2016 (EU-28: 46.3 %). The main treatment option for municipal waste is still landfilling: this accounted for 53 % of all waste in 2016, twice the EU average of 25 %. On the other hand, an Extended Producer Responsibility Scheme for packaging is working well, and delivered a recycling rate of 73 % in 2014 well above the 55 % target set out in the Packaging Directive.
Annex A: Overview table
|
Commitments
|
Summary assessment (
)
|
|
2017 Country-specific recommendations (CSRs)
|
|
CSR 1:
·Ensure the long-term sustainability of public finances, in view of the ageing population.
·Increase the effectiveness of public spending, in particular by fighting corruption
·and inefficient practices in public procurement.
|
The Czech Republic has made some progress in addressing CSR 1:
·Limited progress. Besides the cap of the retirement age at 65 a new measure increasing the indexation of pensions has been adopted. Specifically, the indexation formula now takes into account a higher proportion of the real wage growth (from ⅓ to ½). According to long-term projections, the impact on expenditure amounts to 2 pps in 2070 and worsens sustainability. A review report should assess the retirement age every 5 years, starting in 2019. These possible reviews are not part of the expenditure costs projections, because the system lacks an automatic increase of the retirement age in line with life expectancy.
·Some progress. A number of major anti-corruptions reforms were adopted as part of the government’s anti-corruption strategy. Positive examples include the laws on access to information, on the origins of property, on political parties, on public procurement and on the Central Registry of Contracts. New public procurement legislation requires the winning supplier to disclose information on its ownership structure, right up to the ultimate beneficial owner. An amendment to the law on conflicts of interest introduced a central electronic registry of interest declarations and required all public officials to file declarations on taking up office. However, penalties are mainly financial. An amendment to the law on the Central Registry of Contracts introduced further exceptions in July 2017, so that the law no longer covers a large part of contracts by state and municipality-owned enterprises. This raises further concerns about transparency in public procurement. Some areas still remain unaddressed by the anti-corruption strategy. In particular, the limited role of the state audit office, the lack of supervision of state-owned companies (now excluded from the scope of the Central Registry of Contracts), and gaps and inefficiencies in the conflict of interest registry remain challenges for the next action plan. Moreover, plans to revise lobbying legislation and to introduce specific legislation on whistleblower protection failed to materialise under the previous term of the Parliament.
·Some progress. Steps were taken in 2017 to improve the legal and administrative framework for public procurement. Following the transposition of the modernised public procurement directive in 2016, the conflict of interest registry has been operational since September 2017 and a new law on identifying beneficial owners was to enter into force in January 2018. These measures should, in time, improve transparency and integrity in public procurement. However, the proportion of public procurement contracts awarded in a procedure that attracted only one bidder has been increasing over time and reached 47 % in 2017, while it was 19 % in 2014. On the other hand, the percentage of contracts awarded without a call for tenders decreased considerably from 21 % in 2016 to 10 % in 2017..
|
|
CSR 2:
·Remove obstacles to growth, in particular by streamlining procedures for granting building permits and further reducing the administrative burden on businesses,
·by rolling out key e-government services,
·by improving the quality of R&D
·and by fostering employment of underrepresented groups.
|
The Czech Republic has made some progress in addressing CSR 2:
Some progress. To accelerate the permit procedure, an amendment to the Construction Act was adopted in mid-2017 and is effective from January 2018. One of its main features is the option of including the environmental impact assessment in the zoning decision or in the joint zoning and building permit. This is a positive development, as it reduces extra administrative steps. However, developers doubt that the amendment will make a difference to the new construction projects, mainly because various other authorisations are not included in joint permitting. This makes the simpler procedure unworkable for large infrastructure projects. Also, there is no obligation to use the integrated permitting procedure.
Some progress. The measures taken are showing some results but most are still at an early stage of implementation. In 2017 two laws on secure access to e-government services have been adopted, with the national e-ID planned to be introduced in July 2018.
Some progress. Reforms to improve the quality of public R&D have been launched, but have not yet been fully implemented. An example is the new evaluation methodology (Metodika 17+) which was adopted in 2017 and should be gradually implemented until 2019. The August 2017 proposal for a new law on the support of research, development and innovation was put on hold.
Some progress. The situation of the underrepresented groups (women, low skilled, Roma) has somewhat improved thanks to the tight labour market and consequent high demand for labour. Childcare facilities, including those for children under three, are being built with ESF financing in order to help women return faster to the labour market. However, the use of the flexible arrangement remains low and the female employment rate is still significantly lower than the male one. Moreover, only a few uncoordinated measures targeting low skilled were taken. On the contrary, the activation works, being the most used measure, were reinforced. However this measure has a strong lock-in effect in the secondary (protected) employment and rarely leads to regular employment. Specialised trainings and individualised approach are still missing. Roma are estimated to represent around a half of the low skilled unemployed and inactive. The coordinated approach, which is the main measure to address their situation, is still under development and covers only a small part of the socially excluded localities. More consistent investment may help to develop its full potential.
|
|
Europe 2020 (national targets and progress)
|
|
2020 Employment rate target:
75 %
|
The employment rate has risen steadily over the past five years, reaching 79.0 % in the third quarter of 2017.
|
|
2020 R&D rate target:
1 % (only public R&D expenditure)
|
While public R&D expenditure as a share of GDP strongly increased from 2008 to 2015 (from 0.52 % to 0.87 %), it decreased to 0.65 % in 2016. This decrease is due to a drop in the public expenditure funded by ESI Funds.
|
|
2020 Greenhouse gas emissions, national target for the non-ETS sector:
+ 9 % (compared with 2005 emissions).
|
Between 2005 and 2016 greenhouse emissions decreased by 6 pps. The Czech Republic is expected to overachieve the target in 2020 by 9pps.
|
|
2020 Renewable energy target:
13 %
|
With a renewable energy share of 14.9 % in 2016, the Czech Republic is on track to meet its target for 2020.
|
|
2020 Energy efficiency, energy consumption targets:
44.3 Mtoe (
) (primary energy consumption);
25.3 Mtoe (final energy consumption).
|
The Czech Republic increased its primary energy consumption to 39.9 Mtoe in 2015. Final energy consumption increased to 24.2 Mtoe in 2015.
|
|
2020 Early school leaving target:
5.5 %
|
Early school leaving was 6.7 % in 2016, above the national target. It has increased from last year, contrary to the EU declining trend.
|
|
2020 Tertiary education target:
32 %
|
The tertiary attainment rate rose to 31.9 % in 2016, reflecting a sharp increase in recent years.
|
|
Target for reducing the number of people at risk of poverty or social exclusion, expressed as an absolute number of people:
Reduction of 100 000 persons between 2008 and 2020.
|
The number of people at risk of poverty or social exclusion has fallen by 191 000 since 2008, reaching 1 375 000 in 2016.
|
Annex B: Macroeconomic Imbalance Procedure Scoreboard
|
|
|
Table B.1:The MIP Scoreboard for the Czech Republic
|
|

|
|
Source: European Commission 2017, Statistical Annex to the Alert Mechanism Report 2018, SWD(2017) 661
|
|
|
Annex C: Standard tables
|
|
|
Table C.1:Financial market indicators
|
|

|
|
1)Latest data Q3 2017. Includes not only banks but all monetary financial institutions excluding central banks
2) Latest data Q2 2017.
3) As per ECB definition of gross non-performing debt instruments
4) Quarterly values are not annualised
5) Latest data April 2017.
* Measured in basis points
Source: European Commission (long-term interest rates); World Bank (gross external debt); Eurostat (private debt); ECB (all other indicators).
|
|
|
|
|
|
Table C.2:Labour market and social indicators
|
|

|
|
† The Social Scoreboard includes 14 headline indicators, of which 12 are currently used to compare Member States performance. The indicators "participants in active labour market policies per 100 persons wanting to work" and "compensation of employees per hour worked (in EUR)" are not used due to technical concerns by Member States. Possible alternatives will be discussed in the relevant Committees.
(1) People at risk of poverty or social exclusion (AROPE): individuals who are at risk of poverty (AROP) and/or suffering from severe material deprivation (SMD) and/or living in households with zero or very low work intensity (LWI).
(2) Unemployed persons are all those who were not employed but had actively sought work and were ready to begin working immediately or within two weeks.
(3) Gross disposable household income is defined in unadjusted terms, according to the draft Joint Employment Report 2018.
(4) Reduction in percentage of the risk of poverty rate, due to social transfers (calculated comparing at-risk-of poverty rates before social transfers with those after transfers; pensions are not considered as social transfers in the calculation).
(5) Average of first three quarters of 2017 for the employment rate and gender employment gap.
Source: Eurostat
|
|
|
|
|
|
Table C.3:Labour market and education indicators
|
|

|
|
* Non-scoreboard indicator
(1) Long-term unemployed are people who have been unemployed for at least 12 months.
(2) Difference between the average gross hourly earnings of male paid employees and of female paid employees as a percentage of average gross hourly earnings of male paid employees. It is defined as "unadjusted", as it does not correct for the distribution of individual characteristics (and thus gives an overall picture of gender inequalities in terms of pay). All employees working in firms with ten or more employees, without restrictions for age and hours worked, are included.
(3) PISA (OECD) results for low achievement in mathematics for 15 year-olds.
(4) Impact of socio-economic and cultural status on PISA (OECD) scores. Values for 2012 and 2015 refer respectively to mathematics and science.
(5) Average of first three quarters of 2017, unless for the youth unemployment rate (annual figure).
Source: Eurostat, OECD.
|
|
|
|
|
|
Table C.4:Social inclusion and health indicators
|
|

|
|
* Non-scoreboard indicator
(1) At-risk-of-poverty rate (AROP): proportion of people with an equivalised disposable income below 60 % of the national equivalised median income.
(2) Proportion of people who experience at least four of the following forms of deprivation: not being able to afford to i) pay their rent or utility bills, ii) keep their home adequately warm, iii) face unexpected expenses, iv) eat meat, fish or a protein equivalent every second day, v) enjoy a week of holiday away from home once a year, vi) have a car, vii) have a washing machine, viii) have a colour TV, or ix) have a telephone.
(3) Percentage of total population living in overcrowded dwellings and exhibiting housing deprivation.
(4) People living in households with very low work intensity: proportion of people aged 0-59 living in households where the adults (excluding dependent children) worked less than 20 % of their total work-time potential in the previous 12 months.
(5) Ratio of the median individual gross pensions of people aged 65-74 relative to the median individual gross earnings of people aged 50-59.
(6) Fixed broadband take up (33%), mobile broadband take up (22%), speed (33%) and affordability (11%), from the Digital Scoreboard.
Source: Eurostat, OECD
|
|
|
|
|
|
Table C.5:Product market performance and policy indicators
|
|

|
|
Source: European Commission; World Bank — Doing Business (for enforcing contracts and time to start a business); OECD (for the product market regulation indicators); SAFE (for outcome of SMEs' applications for bank loans).
|
|
|
|
|
|
Table C.6:Green growth
|
|

|
|
All macro intensity indicators are expressed as a ratio of a physical quantity to GDP (in 2010 prices)
Energy intensity: gross inland energy consumption (in kgoe) divided by GDP (in EUR)
Carbon intensity: greenhouse gas emissions (in kg CO2 equivalents) divided by GDP (in EUR)
Resource intensity: domestic material consumption (in kg) divided by GDP (in EUR)
Waste intensity: waste (in kg) divided by GDP (in EUR)
Energy balance of trade: the balance of energy exports and imports, expressed as % of GDP
Weighting of energy in HICP: the proportion of 'energy' items in the consumption basket used for the construction of the HICP
Difference between energy price change and inflation: energy component of HICP, and total HICP inflation (annual % change)
Real unit energy cost: real energy costs as % of total value added for the economy
Industry energy intensity: final energy consumption of industry (in kgoe) divided by gross value added of industry (in 2010 EUR)
Real unit energy costs for manufacturing industry excluding refining : real costs as % of value added for manufacturing sectors
Share of energy-intensive industries in the economy: share of gross value added of the energy-intensive industries in GDP
Electricity and gas prices for medium-sized industrial users: consumption band 500–20 00MWh and 10 000–100 000 GJ; figures excl. VAT.
Recycling rate of municipal waste: ratio of recycled and composted municipal waste to total municipal waste
Public R&D for energy or for the environment: government spending on R&D for these categories as % of GDP
Proportion of GHG emissions covered by EU emissions trading system (ETS) (excluding aviation): based on GHG emissions
(excl land use, land use change and forestry) as reported by Member States to the European Environment Agency.
Transport energy intensity: final energy consumption of transport activity (kgoe) divided by transport industry gross value added (in 2010 EUR)
Transport carbon intensity: GHG emissions in transport activity divided by gross value added of the transport sector
Energy import dependency: net energy imports divided by gross inland energy consumption incl. consumption of international bunker fuels
Aggregated supplier concentration index: covers oil, gas and coal. Smaller values indicate larger diversification and hence lower risk.
Diversification of the energy mix: Herfindahl index covering natural gas, total petrol products, nuclear heat, renewable energies and solid fuels
* European Commission and European Environment Agency
Source: European Commission and European Environment Agency (Share of GHG emissions covered by ETS); European Commission (Environmental taxes over labour taxes and GDP); Eurostat (all other indicators)
|
|
|
References
Albrecht, V. and Frank, D. (2017), 'Widening the participation of new member states in framework programmes by increasing their collaboration with excellent European institutions'. Echo special. 3/2017.
Arnold, J. M., Javorcik, B. S., and Mattoo, A. (2011), 'Does services liberalization benefit manufacturing firms?: Evidence from the Czech Republic.' Journal of International Economics, 85(1), pp. 136-146.
Arpaia, A. and Thirion, G. (2017), 'Recent developments in wage convergence between Central and Eastern European countries and the rest of the European Union', Working Paper, DG Employment and Social Affairs, Brussels.
Aspen Institute Prague (2016), 'Czech Startups Report 2016', (https://www.aspeninstitutece.org/project/czech-startup-report).
CASE - Center for Social & Economic Research (2017), 'Study and Reports on the VAT Gap in the EU-28 Member States'. Warsaw. Study for DG Taxation and Customs Union, TAXUD/2015/CC/131, (https://ec.europa.eu/taxation_customs/sites/taxation/files/study_and_reports_on_the_vat_gap_2017.pdf).
ČHMÚ - Czech Hydrometeorological Institute (2016), 'Annual Report of the Czech Hydrometerological Institute', (http://portal.chmi.cz/files/portal/docs/reditel/vyrocni_zpravy/vz2016.pdf).
Czech Chamber of Commerce (2017), 'Entrepreneurs wish for lower regulation and a lower tax burden', Survey of members, (https://www.komora.cz/tiskova_zprava/podnikatele-si-preji-aby-nova-vlada-konecne-uvolnila-regulace-snizila-odvodovou-zatez-hospodarska-komora-predklada-desatero-pozadavku-podnikatelu/).
Czech National Bank (2017), 'Financial Stability Report 2016/17', (https://www.cnb.cz/en/financial_stability/fs_reports/fsr_2016-2017/index.html).
Czech Statistical Office (2017), Do výzkumu a vývoje vloni nejvíc investovaly podniky, 31 October 2017
OECD/European Observatory on Health Systems and Policies (2017), 'Czech Republic: Country Health Profile 2017, State of Health in the EU', OECD Publishing, Paris/European Observatory on Health Systems and Policies, Brussels, (http://dx.doi.org/10.1787/9789264283336-en).
European Commission (2017a), Labour market and wage developments in Europe, Publication Office of the European Union, Luxembourg.
European Commission (2017b), 'Education and Training Monitor 2017, Czech Republic', Brussels (https://ec.europa.eu/education/sites/education/files/monitor2017-cz_en.pdf).
European Commission (2017c), '2017 SBA Fact Sheet - Czech Republic', Brussels, (https://ec.europa.eu/docsroom/documents/26562).
European Commission (2017d), 'Access to Finance for SMEs, SAFE Report 2017 – Country data', Brussels, (https://ec.europa.eu/growth/access-to-finance/data-surveys_en).
European Commission (2017e), 'Flash Eurobarometer 457, Businesses' attitude towards corruption in the EU', Brussels,
European Commission (2017f), 'Statistical pocketbook - EU transport in figures', Publications Office of the European Union, Luxembourg, (https://ec.europa.eu/transport/sites/transport/files/pocketbook2017.pdf).
EU Single Market Scoreboard (2018), forthcoming, (http://ec.europa.eu/internal_market/scoreboard and https://opentender.eu/).
European Commission (2018a), 'The 2018 Ageing Report', forthcoming.
European Commission (2018b), Science, Research and Innovation performance of the EU 2018, forthcoming
European Commission (2018c), 'Consumer Markets Scoreboard 2018', forthcoming.
European Commission (2018d), 'Mobile Broadband Prices in Europe 2017', Publications Office of the European Union, Luxembourg, forthcoming.
European Environmental Agency (2017a), 'Czech Republic – air pollution country fact sheet 2017', Copenhagen (https://www.eea.europa.eu/themes/air/country-fact-sheets/czech-republic).
European Investment Bank (2017), 'Group Survey on Investment and Investment Finance 2017 Country Overview: Czech Republic overview', Luxembourg, (http://www.eib.org/attachments/efs/eibis_2017_czech_republic_en.pdf).
FRA - European Union Agency for Fundamental Rights (2016), 'EU-Midis II Second European Union Minorities and Discrimination Survey Roma – Selected Findings', Publications Office of the European Union, (http://fra.europa.eu/en/publication/2016/eumidis-ii-roma-selected-findings).
Intrum Justitia (2017), 'European Payment Report', (https://www.intrum.com/en/about-us/publications/european-payment-report).
Jonkers, K. and Wagner, C. S., (2017), 'Open countries have strong science'. Nature News, 550(7674), pp. 32-33, (https://www.nature.com/news/open-countries-have-strong-science-1.22754).
Kalíšková, K., & Münich, D. (2015), 'Dopady zvýšení daňových slev na děti na rozpočty rodin a státu'. Politická ekonomie, 7, pp. 847.
Křeček, S. (2017), Economic Analyses of Health Insurers in the Czech Republic, (http://www.zdravotnipojistenci.cz/static/soubory/stranka-58/ekonomicka-analyza-zdravotnich-pojistoven-v-ceske-republice-2017-29.pdf).
Lidové noviny (2018), 'Hypotéky jsou obrovská část trhu', Interview with the ČNB governor Rusnok,
(
http://www.cnb.cz/cs/verejnost/pro_media/clanky_rozhovory/media_2018/cl_18_180122_rusnok_lidove_noviny.html
)
Ministry for Regional Development of Czech Republic (2017), 'Recoding of the building legislative - main premises', Prague, (https://www.mmr.cz/getmedia/f8f3d714-f5c6-41cd-9510-53ee7d12a980/1-9-Teze-Stavebniho-zakona-docx.pdf).
Ministry of Finance CR (2017), 'Budgetary strategy for the public sector', April 2017, (http://www.mfcr.cz/assets/cs/media/Rozpoctova-strategie_2017-04_Rozpoctova-strategie-CR-duben-2017.pdf).
Münich, D., M. Srholec, M. Moritz and J. Schäffler (2014), 'Mothers and Daughters: Heterogeneity of German Direct Investments in the Czech Republic', CERGE-EI Working Paper Series No. 467, (https://dx.doi.org/10.2139/ssrn.2185359).
OECD (2013), Family Database indicators on public spending on services to support families, (http://www.oecd.org/els/family/database.htm).
OECD (2015), 'Taxation of SMEs in OECD and G20 Countries', OECD Tax Policy Studies, No. 23, OECD Publishing, Paris, (http://dx.doi.org/10.1787/9789264243507-en).
OECD (2016a), 'PISA 2015 Results (Volume I): Excellence and Equity in Education', OECD Publishing, Paris, (http://dx.doi.org/10.1787/9789264266490-en).
OECD (2016b), 'Economic Survey of Czech Republic 2016', (http://www.oecd.org/czech/economic-survey-czech-republic.htm).
OECD (2017a), 'OECD Tax wedge and effective tax rates on labour: Childcare costs in 2015', OECD Publication, Paris.
OECD (2017b), 'Education at a Glance 2017: OECD Indicators', OECD Publishing, Paris, (http://dx.doi.org/10.1787/eag-2017-en).
OECD (2017c), 'Entrepreneurship at a Glance 2017', OECD Publishing, Paris, (http://dx.doi.org/10.1787/entrepreneur_aag-2017-en).
OECD (2017d), 'Czech Repubic: Trade and Investment Statistical Note', (http://www.oecd.org/investment/Czech-Republic-trade-investment-statistical-country-note.pdf).
Šatava (2016), 'Daňový systém snižuje motivaci matek s menšími dětmi k práci: Doporučení a jeho vyhodnocení', IDEA , 2016/18.
Šatava (2017), Income of pensioners: labour, initial pensions and their indexation, IDEA, 2017/9, (https://idea.cerge-ei.cz/files/IDEA_Studie_9_2017_Prijmy_senioru/mobile/index.html).
Sobíšek, P. and Koršňák, Ľ. (2017), 'Ekonomické promeny trhu motorových vozidel v EU', Unicredit Economic Research.
Srholec, M. and Sanchez-Martinez, M. (2017), 'RIO Country Report 2017: Czech Republic', Publications Office of the European Union, Luxembourg.
SŽDC - Railway Infrastructure Administration (2016), 'Annual Report of national railway administration', Prague, (http://www.szdc.cz/soubory/vysledky-hospodareni/2016-szdc-vz-en.pdf).
Technology Agency of the Czech Republic TA CR (2016), 'INKA Innovation capacity of the Czech Republic: the main conclusions of the verification analyses', (https://www.tacr.cz/dokums_raw/inka/inka_brochure.pdf).
World Bank and European Commission (2017), 'Capital Market Assessment/Market Development Options Czech Republic', (www.mfcr.cz/assets/cs/media/Zprava_2017-10-02_CZ-CM-Assessment-Report-Final.pdf).
World Bank / PwC (2017), 'Paying Taxes 2018 Report', (https://www.pwc.com/gx/en/paying-taxes/pdf/pwc_paying_taxes_2018_full_report.pdf).
World Economic Forum (2017), 'Global Competitiveness Index 2017-2018 edition', Geneva, (http://reports.weforum.org/global-competitiveness-index-2017-2018/).
-
(I)
()Public investment = gross fixed capital formation + investment grants + national expenditure on agriculture and fisheries.
-
(II)
()Before programmes are adopted, Member States are required to comply with a number of so-called ex-ante conditionalities, which aim at improving conditions for the majority of public investments areas.

