 EUROPEAN COMMISSION
Brussels, 14.7.2021
SWD(2021) 631 final
COMMISSION STAFF WORKING DOCUMENT
IMPACT ASSESSMENT
Accompanying the
Proposal for a Regulation of the European Parliament and of the Council
on the deployment of alternative fuels infrastructure, and repealing Directive 2014/94/EU of the European Parliament and of the Council
{COM(2021) 559 final} - {SEC(2021) 560 final} - {SWD(2021) 632 final} - {SWD(2021) 637 final} - {SWD(2021) 638 final}
Table of contents
1.Introduction: Political and legal context
1.1.Political context
1.2.Legal context
1.3.Policy context
1.4.Evaluation of the existing Directive
2.Problem definition
2.1.What are the problems and their implications?
2.1.1.Lack of ambition and coherence in MS infrastructure planning leading to insufficient and unevenly distributed infrastructure
2.1.2.Interoperability issues persist in terms of physical connections and communication standards
2.1.3.Publicly accessible infrastructure does not fully correspond to user needs
2.2.What are the problem drivers?
2.2.1.Lack of binding provisions leads to different ambitions by Member States
2.2.2.Setting of targets by Member states not consistent with market developments and GHG reduction ambition
2.2.3.Implementation fails to consider necessary requirements/standards for ensuring full interoperability
2.2.4.Lack of user information about and at refuelling and recharging points
2.2.5.No uniform ad hoc payment method available at all recharging points
2.3.How will the problem evolve?
2.3.1.Lack of ambition and coherence in MS infrastructure planning leading to insufficient and unevenly distributed infrastructure
2.3.2.Interoperability issues persist in terms of physical connections and communication standards
2.3.3.Publicly accessible infrastructure does not fully correspond to user needs
3.Why should the EU act?
3.1.Legal basis
3.2.Subsidiarity: Necessity of EU action
3.3.Subsidiarity: Added value of EU action
4.Objectives: What is to be achieved?
4.1.General objectives
4.2.Specific objectives
5.What are the available policy options?
5.1.What is the baseline from which options are assessed?
5.2.Policy measures and policy options
5.2.1.Discarded policy measures
5.2.2.Retained policy measures and policy options overview
5.3.Description of policy options
5.3.1.Policy option 1
5.3.2.Policy Option 2
5.3.3.Policy Option 3
5.4.Discarded Policy Options
6.What are the impacts of the policy options?
6.1.Economic impacts
6.1.1.Impact on alternative fuels vehicles and infrastructure markets
6.1.2.Administrative burden for public authorities
6.1.3.Infrastructure costs
6.1.4.Costs and benefits on vehicle and vessel manufacturers
6.1.5.Impacts on SMEs / professional vehicle users and businesses
6.1.6.Functioning of the internal market and competition
6.1.7.Impact on innovation and industry competitiveness
6.2.Social impacts
6.2.1.Impacts on households and consumers
6.2.2.Impacts on employment and social skills
6.2.3.Impact on persons with disabilities and those with reduced mobility
6.2.4.Impact on public health
6.3.Environmental impacts
6.3.1.CO2 emission reduction
6.3.2.Air pollutants emission reduction
7.How do the options compare?
7.1.Effectiveness
7.2.Efficiency
7.3.Coherence
7.4.Proportionality and subsidiarity
7.5.Summary of comparison of options, including stakeholder views
7.6.Infrastructure needs depending on the level of stringency of CO2 standards for LDVs
7.7.Sensitivity analysis on sufficiency and share of fast chargers
7.8.Sensitivity analysis on the requirements for HDVs charging points
8.Preferred option
8.1.Context
8.2.Identifying the preferred option
8.3.REFIT (simplification and improved efficiency)
9.How will actual impacts be monitored and evaluated?
Annex 1: Procedural information
Annex 2: Stakeholder consultation
Annex 3: Who is affected and how?
Annex 4: Analytical methods
Annex 5: Methodology for the definition of policy options and measures
Glossary
|
Term or acronym
|
Meaning or definition
|
|
ACEA
|
European Automobile Manufacturers Association
|
|
AFI
|
Alternative Fuels Infrastructure
|
|
AFID
|
Alternative Fuels Infrastructure Directive 2014/94/EU
|
|
AFV
|
Alternatively Fuelled Vehicle
|
|
BEV
|
Battery Electric Vehicle
|
|
CNG
|
Compressed Natural Gas
|
|
EMSP
|
Electric Mobility Service Provider
|
|
ESR
|
Effort Sharing Regulation
|
|
ETS
|
EU Emission Trading System
|
|
EV
|
Electric Vehicle: covers BEV, FCEV and PHEV
|
|
FCEV
|
Fuel Cell Electric Vehicle
|
|
FQD
|
Fuel Quality Directive 98/70/EC
|
|
GDP
|
Gross Domestic Product
|
|
GHG
|
Greenhouse gas(es)
|
|
HDV
|
Heavy-Duty Vehicles, i.e. lorries, buses and coaches (vehicles of more than 3.5 tons)
|
|
HEV
|
(Not Off-Vehicle Charging) Hybrid Electric Vehicle (so not including PHEV)
|
|
ESO
|
European Standardisation Organisations
|
|
FEGP
|
Fixed Electrical Ground Power
|
|
ICEV
|
Internal Combustion Engine Vehicle
|
|
IEA
|
International Energy Agency
|
|
LCA
|
Life-Cycle Assessment
|
|
LCV
|
Light Commercial Vehicle(s): van(s)
|
|
LDV
|
Light-Duty Vehicle(s), i.e. passenger car(s) and light commercial vehicle(s) (van(s))
|
|
LPG
|
Liquefied Petroleum Gas
|
|
LNG
|
Liquefied Natural Gas
|
|
NEDC
|
New European Driving Cycle
|
|
NGO
|
Non-Governmental Organisation
|
|
NIR
|
National Implementation Report
|
|
NOx
|
Nitrogen oxides (nitric oxide (NO) and nitrogen dioxide (NO2))
|
|
NPF
|
National Policy Framework
|
|
OPS
|
Onshore Power Supply
|
|
PHEV
|
Plug-in Hybrid Electric Vehicle
|
|
PM
|
Particulate matter
|
|
RED II
|
Renewable Energy Directive (EU) 2018/2001
|
|
STF
|
Sustainable Transport Forum
|
|
WLTP
|
Worldwide Harmonised Light Vehicles Test Procedure
|
1.Introduction: Political and legal context
1.1.Political context
The European Green Deal
puts climate action at its core, by setting an EU climate neutrality objective by 2050. The Commission proposal for a European Climate Law turns this commitment into a legally binding target and also proposes a new colletive , net greenhouse gas emissions reduction target of at least 55% below 1990 levels by 2030 for the Union. The European Parliament and the Council have found a provisional political agreement on the European Climate Law setting into law the objective of a climate-neutral EU by 2050 and of the collective net greenhouse gas emission reuction target of at least 55% by 2030.
The Commission’s Communication on a Sustainable and Smart Mobility Strategy confirms the ambition of the European Green Deal to achieve a 90% reduction in the transport sector emissions by 2050 and sets out various milestones to show the sectors path towards achieving this objective. Those include among others the ambition to have at least 30 million zero-emission cars and 80,000 zero-emission lorries in operation by 2030 and that by 2050 nearly all cars, vans, buses as well as new heavy-duty vehicles will be zero-emission. This is also in line with the Zero Pollution ambition set up by the European Green Deal.
A comprehensive and easy to use network of recharging and refuelling infrastructure is a prerequisite to enable the widespread uptake of zero- and low-emission vehicles. Such an achievement is also of central relevance to the recovery of the European economy after the COVID pandemic – in particular of the automotive sector – and reflected accordingly in the Annual Growth Strategy 2021 under the ‘recharge and refuel’ flagship initiative.
This impact assessment addresses the needs, options and benefits for revising Directive 20014/94/EU on the deployment of alternative fuels infrastructure (AFID, in the following: the Directive) in order to ensure the necessary deployment of interoperable and user-friendly public accessible infrastructure for recharging and refuelling zero- and low-emission vehicles.
This initiative forms part of the overall effort to bring the Union on track to climate-neutrality, deliver on the long-term climate, environmental and energy objectives and build back better in terms of economic recovery, among other. It is part of a package of initiatives adopted under the “Fit for 55” package approach of the Commission in 2021. It is particularly complementary to the legislative proposal for setting new CO2 emission performance standards for cars and vans post 2020 – together both policy initiatives create a coherent approach to vehicle and infrastructure market take up.
1.2.Legal context
The Directive establishes a common framework of measures for the deployment of publicly accessible alternative fuels infrastructure. Building-up such publicly accessible infrastructure to enable the uptake of zero- and low-emission vehicles shall reduce oil dependence and mitigate environmental impacts specifically of road and waterborne transport. While it covers a range of fuels, including electricity, hydrogen, biofuels, natural gas and synthetic and paraffinic fuels, it particularly defines certain minimum requirements for fuels that require distinct infrastructure (electricity, gas, hydrogen).
The directive obliges Member States to develop National Policy Frameworks (NPFs) that shall enable to develop the market for alternative fuels and the infrastructure to support them. Member States have to assess the current state and future prospects, set targets for deploying the infrastructure and the measures necessary to meet them (electricity and natural gas for both roads and ports whereas hydrogen is voluntary). There is no common methodology for informing the development of NPFs. Member States have to ensure by certain dates a coverage of the TEN-T core network with appropriate recharging and refuelling infrastructure (“appropriate” not being defined). The directive also norms certain user information (e.g. on comparison of alternative fuels unit prices, on fuel labelling). Member States report every three years on the implementation of their NPFs.
Member States are required to support the commercial development of infrastructure, whereas public financing should support the development of infrastructure in early stage of market development and cases of market failure. This is further clarified by the revised Electricity Directive that bans Distribution System Operators to own and operate recharging points unless there is proof that no private operator is willing to do so.
The directive equally norms common technical specifications in its Annex II. Some of those technical specifications have been supplemented by means of delegated acts under the directive, following the implementation of a standardisation requests that the Commission had mandated to the European Standardisation Organisations (ESOs).
The Directive also addresses to some extent the role and responsibility of operators of recharging and refuelling points accessible to the public, for example with respect to a general obligation for price transparency, non-discrimination and the obligation to offer ad hoc payment solutions (users to charge without entering into a contract with the operator).
1.3.Policy context
The common scenarios underpinning the Climate Target Plan and the Sustainable and Smart Mobility Strategy showed at least 30 million zero-emission cars and 80,000 zero-emission lorries in operation by 2030 and also showed that by 2050 nearly all cars, vans, buses as well as new heavy-duty vehicles will be zero-emission while also the other transport modes need to shift towards zero emission fuels. The directive aims at ensuring that sufficient publicly accessible recharging and refuelling infrastructure is in place for all modes to ensure that the low and zero emission vehicles and vessels coming into the market are supported by a sufficient number and full geographic coverage of interoperable infrastructure.
The directive is an important complement to other policy instruments that address European policy objectives on climate change, transport, energy and environment. As the main policy instrument for alternative fuels infrastructure it interacts with a broad range of different policy instruments, many of which are also revised under the “Fit for 55” package. They include:
·CO2 emission performance standards: The regulations on EU emission standards for cars and vans and heavy duty vehicles set emission standards for vehicle manufacturers fleets. They provide a strong push for deployment of zero- and low-emission vehicles, creating demand for alternative fuels infrastructure. The Impact Assessment of the revision of the CO2 standards for cars and vans will provide an analysis on the numbers of zero- and low-emission vehicles needed to contribute to the increase in overall climate ambition by 2030. The revision of the directive enables this uptake by providing sufficient infrastructure.
·Energy and fuels policy: the Renewable Energy Directive
and the Refuel Aviation and FuelEU Maritime initiatives set obligations on the supply of, or demand for, renewable and low carbon transport fuels. The Fuel Quality Directive
addresses the reduction of the GHG emission intensity of road transport fuels. The CO2 emission standards for cars and vans and trucks address newly registered vehicles and ensure the increased supply and affordability on the market of new efficient and zero-emission vehicles. Fuels related legislation provides incentives for the use of low-carbon and renewable transport fuels in the existing vehicle fleet. Those are complementary instruments aiming at the reduction of transport emissions and creating demand for alternative fuels infrastructure in line with the EU Strategy for Energy System Integration.
·Related infrastructure policy: the Energy Performance of Buildings Directive
(EPBD) addresses private recharging infrastructure by stipulating requirements for roll-out of recharging infrastructure in buildings. The EPBD is complemented by flanking action in the context of the strategy “a renovation wave for Europe”
. AFID and EPBD are required to work together to provide a sufficient level of recharging infrastructure; the relationship of public and private recharging infrastructure has been thoroughly addressed in this Impact Assessment. The Regulation on the Guidelines for the Trans-European Transport Network enables at present the rollout of alternative fuels infrastructure as part of the deployment of innovation and new technology actions in form of individual projects on the TEN-T network corridors, which are established by that Regulation. Those projects have grown in scale over the years, leading to a substantive, but far from complete equipment of the TEN-T with alternative fuels infrastructure. This initiative and the initiative for the revision of the Regulation on the TEN-T guidelines are fully complementary. This initiative establishes concrete requirements for the deployment of recharging and refuelling infrastructure along the TEN-T core and comprehensive network, in urban nodes and in TEN-T ports and airports. Those requirements will be referenced in the proposal for the revision of the TEN-T regulation, so that there is a coherent policy framework
·Other policies set incentives for low- and zero-emission vehicles and vessels and their recharging and refuelling infrastructure, by internalising the climate and environmental externalities (the Eurovignette Directive
, the Emission Trading System and the EU Energy Taxation Directive
, currently under revision), by boosting vehicle demand through public procurement (the Clean Vehicles Directive
) and by setting new requirements for electric vehicle batteries (proposal for a Batteries Regulation). The pollutant emission standards, Euro 6 for cars and vans
and Euro VI for buses and lorries
require that all vehicles, including those fuelled with alternative fuels, do not emit, on the roads, more than the prescribed emission limits.
·The EU’s 2021-2027 long-term budget, together with NextGenerationEU, supports accelerated investment in alternative fuels infrastructure through Member States’ recovery plans under the Recovery and Resilience Facility (RRF). That support can be complemented by extended financing under the Connecting Europe Facility but also the InvestEU instrument and the European Structural and Investment Funds. Horizon Europe will address research and development strand, particularly through the 2Zero and Batteries Partnerships and the Fuel Cell and Hydrogen Joint Undertaking.
This Directive is fully complementary and delivers additional value added to these instruments. It is the main policy instrument to set the overall requirements for technical interoperability of alternative fuels infrastructure, related consumer information and rollout of publicly accessible infrastructure. In light of the above, the revision of this Directive sits within the broader context of the ‘Fit for 55% package’. The interactions between this impact assessment and particularly the impact assessment supporting the revision of the CO2 emission standards are most relevant, but furthermore also with the Renewable Energy Directive, the Energy Efficiency in Buildings Directive, the Energy Taxation Directive, the EU ETS, the FuelEU maritime and RefuelEU aviation and the revision of the TEN-T regulation. This impact assessment is therefore building on the analytical work of the Climate Target Plan, which takes into account the interaction and combination of the various policies. The interactions are further explored and assessed in the next sections.
1.4.Evaluation of the existing Directive
A REFIT ex-post evaluation showed that the Alternative Fuels Infrastructure Directive has supported the development of policies and measures for the roll-out of alternative fuels infrastructure in Member States, particularly through the requirement to develop National Policy Frameworks (NPFs) (see Annex 10). Despite the great differences in ambition and supportive policy measures across Member States, those policy frameworks have started to help building a medium-term perspective on infrastructure for electricity, natural gas and hydrogen until 2030 in all Member States.
However, shortcomings of the current policy framework have also been pointed out and the key objective of the Directive, namely to ensure a coherent market development in the EU, has not been met. Shortcomings arise in particular in the following three areas that are further addressed in chapter 2:
·The uptake of alternatively fuelled vehicles and deployment of corresponding infrastructure is not coherent across Member States. It has not led to a complete network of infrastructure allowing seamless travel across the EU. This is in particular the case for electric recharging points and hydrogen refuelling stations as well as with respect to on-shore power supply (OPS) and LNG infrastructure in ports. Furthermore, infrastructure for zero emission heavy-duty vehicles (HDV) is largely missing across the EU. The overall ambition for the deployment is not sufficient to meet the EU’s GHG reduction target of 55% by 2030 and the 2050 climate neutrality objective in view of the necessary significant increase of zero and low-emission light and heavy duty vehicles as well as vessels.
·While standards have been developed and prescribed to ensure interoperability between the vehicles and infrastructure, new technologies are emerging requiring further common technical specifications to ensure interoperability. In this context, and while alignment with electricity market legislation has been ensured, for the mass uptake of electric vehicles in the future, further provisions may be required to fully enable smart recharging through appropriate standards.
·User aspects have already been addressed to a certain extent in the Directive but this has not lead to full user information, uniform and easy to use payment methods and full price transparency across the EU.
The evaluation concluded that six years after the adoption of the Directive, the overall European market for alternative fuels infrastructure is still in a rather early development phase, though markets in some parts of the Union are maturing. The development of infrastructure has, however, largely kept pace with the development of the vehicle fleets that show different trends (see Annex 6 for further detail). In view of the overall relevance of ensuring sufficient infrastructure to support the needed uptake of vehicles and vessels, the evaluation recommended to retain the legislation but to revise it. The results of the ex-post evaluation are reflected in this impact assessment.
Table 1: Links between conclusions of the ex-post evaluation and the impact assessment
|
Main ex post evaluation conclusions
|
Impact Assessment
|
|
Conclusions on relevance
|
|
The issues and challenges identified at the time of the adoption as well as the general and specific objectives of the Directive are still applicable.
|
The impact assessment further develops the general and specific objectives of the directive
|
|
Conclusions on effectiveness
|
|
The directive has had a positive but relatively limited contribution towards the uptake of AFV and AFI but there is an expected positive, more sizeable contribution for the future when more AFV will come into the market. However, the directive is not effective in providing an evenly distributed infrastructure across the EU and does not address all transport modes, e.g. electric recharging and hydrogen refuelling infrastructure for HDV
|
Policy measures are defined to enlarge the scope and further strengthen investments in AFI in line with the needed contribution to the EGD objectives for all transport modes
|
|
The implementation appears to have only partly succeeded in developing a clear and consistent policy framework
|
Policy measures are defined to further strengthen the development of a fully consistent policy framework
|
|
There are positive contribution of the Directive on promoting interoperability, but impact is constrained due to ongoing issues in ensuring harmonised payment and consumer information and transparency.
|
Policy measures are defined to continue developing standards and to harmonise payment and consumer information and transparency
|
|
Conclusions on efficiency
|
|
The costs appear proportionate in relation to the benefits. Cost for the development of the NPFs and the NIRs required in the context of the implementation of the AFID were limited. No conclusions can be drawn on the efficient use of Member States’ budgets on implementing national policies and infrastructure deployment targets
|
The NPFs will be maintained as a policy instrument in the policy options.
|
|
Conclusions on coherence and coordination
|
|
The directive is internally coherent but does not fully reflect the recent policy developments set by the EGD and the 2030 CTP, considerably increasing the climate ambition and establishing 2030 climate target of at least 55% as well as 2050 climate neutrality objective. This requires large scale rollout of recharging and refuelling infrastructure reflecting recent market developments, e.g. in respect to fast recharging points.
|
The IA identifies new market developments, and reflects those in the different policy options. Full alignment shall be ensured with other initiatives under the ‘Fit for 55’ package in terms of baseline scenario, the impact of measures envisaged and their effects on vehicle fleet development.
|
|
Conclusions on EU added Value
|
|
EU level intervention brought some benefits which would not have been possible with action at national or local level alone. There is an increased need for EU action in order to deliver on the current policy objectives, to overcome the current fragmentation of the market to meet wider European Green Deal goals, and to define the timeframe for deployment.
|
EU action continues to be needed to deliver on the policy objectives.
|
2.Problem definition
Without further EU level intervention, lack of recharging and refuelling infrastructure is likely to become a barrier to the pervasive market growth in vehicles and vessels that is needed to meet the increased climate ambition of the EU for 2030. The ambition in target setting and support measures for infrastructure rollout varies greatly between Member States, as described in detail in section 2.1. Moreover, ease and transparency of use of recharging and refuelling infrastructure is a prerequisite for user acceptance and final successful vehicle and vessel uptake. Current market practice do not always guarantee this ease of use and problems of interoperability persist. At present, customers are confronted by a myriad of approaches to information on availability and accessibility of infrastructure, diverging use conditions and not fully interoperable services. Without further policy intervention, users of vehicles and vessels will continue to face an infrastructure that is not easy and transparent to use across borders in the EU. The underlying drivers, problems and implications that are relevant for the revision of the Directive are presented in the figure below:
Figure 1: Overview of drivers, problems and implications

2.1.What are the problems and their implications?
2.1.1.Lack of ambition and coherence in MS infrastructure planning leading to insufficient and unevenly distributed infrastructure
As already noted in chapter 1, there are significant differences in the level of ambition, targets set, and comprehensiveness of the measures adopted among Member States to support the rollout of alternative fuels infrastructure. `76.5% of respondents to the OPC on this question (232 out of 303) confirmed this problem analysis.
With respect to electric recharging points for road LDV the overall deployment figures match the demand from vehicles at an overall, average EU level. However, large differences in the pace of infrastructure roll-out among Member States clearly have impacts on cross-border continuity and will in some Member States also severely limit the uptake of low- and zero-emission vehicles. At present, more than 70% of all publicly accessible recharging points are located in just three Member States: The Netherlands, Germany and France. The uneven geographical distribution is likely to persist and may even intensify, as the Commission assessment of national implementation reports under the Directive in conjunction with the evaluation shows (see chapter 2.3.1, Annex 10).
Figure 2: Amount of recharging points per Member State in 2020

This discrepancy between Member States is not only evident in total numbers but also relative to the number of registered vehicles. While for example the Netherlands already have 7 recharging points deployed per 1,000 registered cars and vans, in 16 Member States less then 0.5 recharging points are installed per regsiered car/van.
Figure 3: Number of Recharging points per 1000 cars and vans, 2020
Furthermore, for electric LDV, there is an increasing gap between the growth rates for vehicle registrations and infrastructure deployment. The strong increase in new battery electric and plug in hybrid vehicle (cars and vans) registrations in 2019 (+50%) and 2020 (+52%) was not nearly met by the increase in publicly accessible recharging infrastructure (+38% and +30% respectively). While the deployment of faster recharging technology can help to address part of the increased vehicle uptake, a continued gap increase would imply a serious risk that infrastructure deployment will not go hand in hand with electric vehicle uptake in the years to come, which is expected to accelerate due to more stringent CO2 emission standards. This in turn risks to restrict the growth in electric vehicle uptake in particular post 2030.
With respect to other fuels in road transport, hydrogen infrastructure for fuel-cell hydrogen LDV is only addressed by half of the Member States in their NPFs leading to an incoherent development across the EU with huge gaps within the road network not allowing for seamless travel across the EU. For CNG and LNG, refuelling networks are developed across the EU albeit with huge differences among Member States. However, the envisaged density of refuelling stations for LNG (every 400 km along the TEN-T core network) and CNG (every 150 km along the core network) has been largely achieved in most Member States (see Annex 6 for further information).
Furthermore, there is currently no coherent approach towards the deployment of electric recharging and hydrogen refuelling infrastructure for HDV across Member States. This means that there is no network of recharging or refuelling infrastructure across the EU, which is problematic since an increased uptake of zero emission trucks is necessary for manufacturers to meet their obligation under the CO2 emission performance standards by 2025 already.
With respect to ports the existing legal provisions oblige Member States to ensure an appropriate number of LNG refuelling points to allow for circulation along the TEN-T core corridor by 2025 for maritime and 2030 for inland waterways. However, the present rate of growth in the network, that will also support the increasing replacement of LNG by biogas and synthetic gaseous e-fuels, appears to be slow. Furthermore, the development of OPS is only taking place in a small number of EU ports. There is a risk that deployment will continue to happen in a limited and uncoordinated manner. The Sustainable and Smart Mobility Strategy notes that zero-emission sea-going ships should be market-ready by 2030. A non-coordinated approach is likely to not lead to effective identification of needs and preparation of adequate rollout strategies for infrastructure.
Efforts have to be undertaken to decarbonise the aviation sector. Electricity supply for stationary aircraft is a low hanging fruit, but is not yet ensured throughout the EU and in particular not for outfield positions. Work has started on the development of zero-emission aircraft, including large-scale aircraft, where the Sustainable and Smart Mobility Strategy sets the milestone of having such aircraft market ready by 2035. The sector has to equally prepare for the built up of related infrastructure, but a non-coordinated approach is likely to lead to insufficient action. In the rail sector, an increasing number of projects deploy battery electric and hydrogen trains to decarbonise train operations on tracks that can’t be electrified. Again the absence of a strategic coordination in Member States risks not to lead to an effective approach.
2.1.2.Interoperability issues persist in terms of physical connections and communication standards
Common technical specifications help ensure full interoperability of physical connections and communication exchange between vehicle, infrastructure and user. The Directive and subsequent delegated regulations, supported by a standardisation request to European Standardisation Organisations (ESOs), has mandated various European standards. Those relate to the physical connection between the vehicle and the infrastructure for electricity recharging, natural gas refuelling and hydrogen refuelling for light duty road transport vehicles as well as electric recharging and hydrogen and natural gas refuelling in waterborne transport.
At present, requirements under the Directive focus exclusively on electro-technical issues, such as plugs, outlets and electrical safety specifications, but do not recognise the particular needs of trucks infrastructure. Furthermore, the Directive has not focused on minimum requirements for appropriate communication interfaces and data models, which is particularly relevant for electric mobility. In the Open Public Consultation (OPC), 69% (222 out of 324) of respondents noted that further mandatory technical requirements (standards) are needed to ensure full interoperability of infrastructure and services, whereas only 11% (36 out of 324) thought this was not the case.
The lack of common technical specifications for communication exchange have strong implications on the interoperability and transparent exchange of information among users and the different market actors within the electro-mobility ecosystem. Without further requirements, there will not be a smooth exchange of information on billing, charging session information, reservation, authorization, parking spot information and compatibility with smart charging and vehicle to grid functionalities, as many market operators will take forward their own approaches. With respect to the integration of electric vehicles into the electricity system, the current provisions of the Directive ensure alignment of the rules between recharging infrastructure and the electricity markets, clearly assigning all rights of the final customer in the electricity market to the CPOs. However, future mass vehicle uptake risk putting additional stress to the electricity system especially if the additional electricity demand incurs at peak times. The Impact Assessment for CO2 emission performance standards shows that by 2030 cars and vans would represent around 2% of the EU’s electricity consumption that would increase to 10% by 2040 and to 11% by 2050. From an overall network perspective, management of additional electricity demand of that magnitude over the next decades appears to be feasible. However, if this demand would occur at times when the network is already operating at the maximum, grid capacity problems in particular in the distribution grid, could arise when electric vehicles will have reached a significant share in the overall vehicle fleet. To enable smart recharging and thereby help to avoid capacity problems, common communication standards between the recharging point and the electricity grid are required.
Additional technical specifications and standardization work becomes also necessary to ensure full interoperability of the hydrogen refueling ecosystem for heavy duty road transport, including liquid hydrogen refueling. Concerning maritime transport and inland navigation, new standards are required to facilitate and consolidate the entry on the market of alternative fuels, especially in relation to fuel supply for electricity, hydrogen, advanced biofuel, methanol and ammonia bunkering, as well as communication exchange between vessel and infrastructure. Also for OPS further standards may be required considering the variety of ships at berth with different power demand.
The absence of common technical specifications in the areas addressed above risk that many recharging and refuelling services cannot develop in a competitive manner and instead proprietary solutions will develop. This will be detrimental to the internal mobility market, affecting directly consumers, infrastructure operators and service providers and vehicle manufacturers. In consequence, a lack of standardisation risks to harm the uptake of zero- and low-emission vehicles.
2.1.3.Publicly accessible infrastructure does not fully correspond to user needs
The evaluation concluded that there are still gaps and limitations in terms of ensuring access to adequate and relevant consumer information. Consumers cannot easily identify where, how and at what price they can recharge or refuel their vehicles, especially when travelling cross border. In the OPC, 80% (119 of 148) of respondents noted to have often or sometimes problems in finding alternative fuels infrastructure. While the Directive requires that information on the geographic location of the refuelling and recharging points is shared by the operators of the infrastructure, it does not impose quality requirements for those data nor does it specify where such information needs to be displayed. As a consequence, and despite the increasing availability of online platforms and digital applications, there is still no open data framework in place to provide real-time information to users, primarily for electro-mobility, but also for other alternative fuels infrastructure.
The Directive also requires charge-point operators to charge prices for public recharging that are reasonable, easily and clearly comparable, transparent and non-discriminatory. However, the evaluation and OPC revealed that often there is limited information available to the user on the price he will eventually have to pay for a recharging session. In the OPC, only 31% of respondents (37 out of 121) felt well informed on a regular basis. This problem was corroborated in the targeted consultations: prices are often not clearly displayed at a recharging point and are often also not accessible through apps. In addition, many different price components exist, including possible hidden fees that only appear at the stage of billing. This results in difficulties for users to compare end user prices. This lack of price transparency does not allow informed consumer choices and is detrimental to competition in the recharging services market.
Furthermore, the Directive sets provisions on ad hoc payment to ensure that no user gets stranded due to difficulties of payment. However, because the Directive does not set clear provisions for a common unified ad hoc payment method (such as credit/debit bank card payment), different ad hoc payment options using different technological solutions emerged, making it difficult for users to actually pay for a recharging service, e.g. by requiring pre-registration or the purchase of pre-payment cards.. In the OPC, 65% of respondents (72 out of 113) confirmed this problem. This issue may also incur in the future for other refuelling infrastructure, e.g. hydrogen, once private users will purchase hydrogen cars/vans and will depend on publicly accessible refuelling stations.
The OPC identified a clear need to change provisions on interoperability and user information, which will particularly facilitate cross-border trips: 79% of respondents to the OPC (255 out of 324) noted this to be very important or important.
All those aspects make it more difficult and cumbersome to travel across the EU and sometimes even within a Member State with an electric vehicle. Such negative user experiences can refrain other consumers from buying alternative fuels vehicles and thereby become a barrier for their uptake. Moreover, this market fragmentation can be detrimental to competition, can imply higher costs for the different market actors and can aggravate innovative service development.
This problem ultimately affects consumers. It also affects infrastructure services providers and entities that operate in the market of supplying infrastructure data to consumers.
2.2.What are the problem drivers?
2.2.1.Lack of binding provisions leads to different ambitions by Member States
Transport network coverage for road transport
The Directive requires each Member State to adopt a national policy framework (NPF) for the development of the alternative fuels market in the transport sector and the deployment of its relevant infrastructure. In particular, the NPFs have to comprise national targets and objectives for the deployment of alternatives fuels infrastructure, taking into account national, regional and union-wide demand. However, there is no clear and explicit link with reaching greenhouse gas reductions, which has become essential under the European Green Deal. In addition, Member States had to provide the necessary measures to reach national targets and the objectives set out in the NPFs. However, Member States are free to set their own targets and are not bound by any methodology to determine the need for infrastructure.
In its 2017 assessment of the NPFs (including in its 2019 update) and in its Assessment of the National Implementation Reports (NIR) in 2021 which informed the overall evaluation of the Directive, the Commission concluded that the NPFs and NIRs are not fully coherent from an EU-wide perspective in terms of the priorities they set. Member States’ ambition with regard to the uptake of alternative fuels and their targets for infrastructure varied significantly in the absence of a common methodology to set targets. For example, the share projected by Member States for electric cars and vans in the total fleet for 2030 varies between less than 1% for Cyprus and Greece and up to 45% in the case of Luxembourg. For 2020, 10 Member States planned to have less than 1000 recharging points installed and 16 less than 2000 and large parts of the TEN-T core network do not have recharging points installed every 60 km as recommended. In conclusion, a coherent network of infrastructure has not developed across the EU, even if the last two years saw considerable increase in overall investment. In the OPC, a majority of respondents noted for most of the different use cases of alternative fuels infrastructure that NPFs were not a fully adequate tool to solely rely on (see annex 2 for detailed breakdown).
Transport network coverage for waterborne transport
The Directive requires that LNG vessels can circulate along the TEN-T core network by 2025 (maritime) and 2030 (inland waterways) respectively without setting a clearer mandate as to which ports need to be equipped with LNG bunkering facilities. The directive equally requires that each NPF assesses the need for shore-side electricity – at sea and inland ports – and that this be installed, unless there is no demand or costs are disproportionate.
The assessment of the application of this Directive identified that plans to deploy LNG in maritime and inland ports for 2025 varied greatly between a few countries with high ambition (e.g. Spain, with a target of 42 maritime ports and Italy with a target of 12 maritime ports and 20 inland ports) and most others were there was no or little consideration of bunkering facilities for LNG.
With respect to shore side electricity, the evaluation found that 23 Member States assessed the need for shore-side electricity supply for inland waterway vessels and seagoing ships in their NPFs. Following their assessment, BE decided to increase on-shore power supply (OPS) in all ports, EL aimed to install supply at tourist ports and major maritime ports, while EE, FR, MT, and RO all established specific targets either for the year 2025 or 2030. Furthermore, AT, BG and SI noted the need for further studies to be carried out to better understand the benefits. The other Member States either did not specifically address the issue or concluded that it is not economically viable to install OPS supply considering the current market demand and as such no objectives were set.
For the shipping sector it can therefore be concluded that the legally binding provisions for LNG under the current Directive will ensure that a sufficient network will develop on the TEN-T core network, which is of particular relevance to sea ports. However, the lack of clear provisions with respect to OPS makes it unlikely that a coherent network of OPS develops in TEN-T core maritime and inland waterway ports in the timeframe foreseen by this Directive and corresponding to the expected increase following the ambition of the refuel EU maritime initiative.
Scope
The Directive currently defines a number of specific fuels as alternative fuels. However, since the adoption of the Directive, some technology advancements have taken place. The 2020 update of the Commission’s Report on advanced alternative fuels lists, for example, road electrification technologies, electrification/hybridisation of aircrafts used for short-distance and training flights, use of new fuel technologies in waterborne transport (e.g. advanced biofuels, ammonia, methanol, hydrogen as well as electricity for inland waterways and short sea shipping/ferries) or development of hydrogen fuel cell powertrains in rail transport. Moreover, while the scope of the Directive does not exclude recharging and refuelling stations for heavy-duty vehicles, it was formulated with a primary focus on light-duty vehicles. The inclusion of hydrogen into the NPFs has been voluntary and only half of the Member States addressed hydrogen. As a result of this approach and of rapid technology development in this segment, the Directive is currently not fully adjusted to cater for the infrastructure requirements of battery- and fuel-cell electric powertrains in the heavy-duty road sector, which is the focus, in particular, of the Hydrogen strategy.
Furthermore, questions have been raised whether the current scope diverts resources away from the infrastructure for zero-emission vehicles by including of natural gas as an alternative fuel. The use of fossil fuels is regarded to not contribute to overall emission reduction, but delay the necessary transition to zero-emission mobility. 55% of respondents the OPC (165 out of 268) asked for the exclusion of natural gas and thereby of CNG and LNG infrastructure from the scope of the directive, with strong presence of environmental NGOs, the electricity sector, electric mobility industry representatives and citizens. However, 45% (133 out of 298) of respondents, in particular representatives from the gas industry, biogas and biofuel producers, waterborne transport industry and parts of the automotive industry argued that LNG is still indispensable for maritime transport, as also noted under the FuelEU maritime initiative, and for long-distance road haul due to a lack of market-ready alternatives. Furthermore, biogas and e-gases use the same refuelling infrastructure as natural gas. Fossil natural gas can therefore be increasingly blended and phased out with low-carbon and renewable fuels (biogas and renewable synthetic e-gas) and thus fully contribute to the climate-neutrality objective.
2.2.2.Setting of targets by Member states not consistent with market developments and GHG reduction ambition
The Commission’s 2017 assessment of Member State NPFs and the 2021 assessment on the NIRs identified that in many Member States, projections on the uptake of alternative fuelled vehicles were rather low and consequently the infrastructure targets risk to be insufficient to support the expected growth in alternatively-fuelled vehicles. Since national policy frameworks were adopted (by end 2016), the EU has committed to reduce the EU’s greenhouse gas emission by 2030 by at least 55%, compared to the previous 40% reduction target. This has a major impact on the required uptake of sustainable alternative fuels, vehicles and infrastructure. In order to achieve these ambitious targets, the uptake of low and zero-emission vehicles and the related infrastructure needs to accelerate significantly in all market segments of light-duty and heavy-duty vehicles. Efforts will need to be considerably greater than the efforts reported by Member States under the Directive. This does not only relate to road transport but equally to other transport modes such as waterborne transport and aviation.
56% of OPC respondents (160 out of 288) noted that NPFs are not the right instrument and 31% (89 out of 288) noted that they are only partially sufficient in view of the increased policy ambition for 2030. Of those who responded to the question who should set mandatory deployment targets, 53% (142 out of 268) favoured direct EU legislation, whereas 38% (102 out of 268) considered the national level, but following a common methodology.
Furthermore, recommendations for using specific metrics to determine sufficient infrastructure are no longer adequate. The Directive recommends to have 1 recharging point per 10 electric vehicles. This recommendation on the number of recharging points per vehicle does not reflect variations in market requirements. The Sustainable Transport Forum of the Commission reviewed the recommendations and concluded that they should be elaborated further, including consideration of the larger demand for alternatively-fuelled vehicles, the increased vehicle ranges and different power levels of recharging points and their locations; e.g. a 350 kW recharging point can serve a considerably higher number of vehicles per day than a normal charger of 7 kW.
2.2.3.Implementation fails to consider necessary requirements/standards for ensuring full interoperability
The Directive sets common technical specifications for physical connectors. With the latest set of technical specifications added by means of Commission Delegated Regulation (EU) 2019/1745 those technical specifications set under the Directive have proven to be highly relevant.
However, new needs for technical specifications under the Directive have emerged as described in chapter 2.1.2 that are currently not foreseen under annex II of the Directive. These concern particularly the interoperability and transparent exchange of information among the different players within the electric vehicle charging system and standards for recharging heavy-duty vehicles and refuelling liquid and gaseous hydrogen. In addition, maritime transport, inland navigation and aviation will also benefit from further common technical specifications to facilitate and consolidate the entry on the market of alternative fuels, especially in relation to fuel supply for electricity and hydrogen as well as hydrogen based fuels.
In line with the Commission’s Strategy for Smart Energy System Integrationthe cost-efficient integration of an increased number of electric vehicles in the electricity system must be ensured. However, the Directive does currently not require common communication standards between the recharging point and the electricity grid that is a prerequisite for the development of smart and bidirectional recharging services in an open and competitive market.
Without a clear, updated legislative mandate to develop such standards at the EU level, there is a risk that such standards will not develop in a timely manner and hence delay market uptake of emerging technologies and services. In the OPC 78% of respondents (216 out of 278) noted it very important or important to revise the related provision of the Directive.
2.2.4.Lack of user information about and at refuelling and recharging points
Location and availability of recharging and refuelling points
A key issue for consumers is the concern that it may not be possible to find a suitable refuelling/recharging station before running out of fuel/electricity. Contributing to this, particularly on long-distance journeys on highways, is the lack of information on the distance to the next suitable recharging/refuelling station. Although the AFID requires that ‘the data indicating the geographic location of the refuelling and recharging points accessible to the public of alternative fuels covered by this Directive are accessible on an open and non-discriminatory basis to all users’, it does not specify where such information needs to be displayed. Furthermore, the evaluation also found out that action by some Member States (individually and on basis of EU funded activities) should be expected to contribute towards improving the availability and quality of information, but that this will not ensure consistent data provision and access to data across the EU network. 70% of respondents to the OPC (231 out of 324) agreed that users should get information on locations based on coherent requirements.
Digital Connectivity
A prerequisite for providing such location data, but in particular dynamic data on the availability on recharging points and on prices through digital means, is that recharging/refuelling points are digitally connected. The ability to manage contract-based payments for electric charging at other stations (i.e. when roaming) also requires stations to be digitally connected. According to estimates, by 2019 around 45% of the 1.3 million public, semi-public and private recharging points across Europe were digitally connected; by 2024 it is expected that over 60% of the recharging points will be digitally connected.
In the OPC, 90% of respondents (244 out of 269) agreed that information, including based on dynamic data, should be made available to the user by digital means. In the OPC, 62% (200 out of 324) noted that consumers should have real-time access to reliable information about the location and availability of recharging points, which requires digital connectivity of infrastructure.
Information on pricing and billing
An additional key feature to ensure user acceptance is that prices are clearly communicated before the recharging session. The Directive already requires that prices charged by the operators at publicly accessible recharging points are reasonable, easily and clearly comparable, transparent and non-discriminatory. However, no detailed provisions regulate the way prices need to be displayed.
Despite these legal requirements, 30% of respondents to the OPC (80 out of 276) noted to never or seldom have full information about prices charged, 28% (76 out of 276) noted this to be sometimes the case and 33% (92 out of 276) did not know, whereas only 11% (29 out of 276) noted that they always had full information. This confirms a practical problem with the current implementation. 67% (187 out of 278) supported a harmonisation of the display of prices at the EU level.
Moreover, for contract-based charging – which is not currently addressed in the provisions of the Directive - the actual invoiced amount often included extra charges, such as roaming charges that are not communicated beforehand to the consumer.
2.2.5.No uniform ad hoc payment method available at all recharging points
The Directive requires that users must be able to recharge their electric vehicle at any publicly accessible recharging point on an ad hoc basis, i.e. without needing to enter into a long-term contract with the operator or energy supplier. This requirement has been implemented in very diverse ways across the EU. Charge point operators developed individual solutions varying between Member States, and even within Member States. Ad hoc solutions offered at recharging points include credit card payments, pre-paid cards or payments through charge point operators’ specific apps that need to be downloaded by the user. The use of some of these payments solutions is extremely cumbersome and may even not allow for spontaneous ad hoc charging at some charging points (.e.g. when a prepaid card is required).
According to a recent assessment, many charge point operators do not provide a user friendly ad hoc charging possibility to drivers. Instead, to be able to easily use a publicly accessible recharging station, a driver must sign up for a contract with its operator. A recent overview of various aspects on price transparency in four Member States
found that ad-hoc payment systems are not widely used or offered in the Netherlands, but it is more common to use dedicated cards or web-based apps. The report concluded that ad-hoc payment is better developed in Germany and Austria but less so in France. Still, a test of 53 recharging points in Germany conducted by the German automotive club ADAC in May 2018 found that ad hoc charging was not possible in 23% of recharging cases in one of the most advanced markets in the EU. Only 8% of respondents to the OPC (9 out of 113) noted that they never faced difficulties when trying to pay. Similarly, representatives of the hydrogen sector also noted challenges with regard to uniform payment options.
2.3.How will the problem evolve?
2.3.1.Lack of ambition and coherence in MS infrastructure planning leading to insufficient and unevenly distributed infrastructure
As outlined in chapter 2.1.1 the trend towards an uneven distribution of recharging infrastructure for road transport is likely to continue and even to intensify. While there has been continuous development of AFI across the EU, progress has been very uneven across Member States, both in terms of planning and actual deployment of AFI. Deployment has been fragmented resulting in some well served hotspots but also large gaps in coverage leading to a network that is not sufficiently dense and widely spread to remove concerns around AFI availability. Furthermore, there are also indications that the roll out of AFI is not consistent with market and technological developments, as planning and deployment occurs at a different and mostly slower pace than markets for vehicles.
In the absence of an intervention, these problems and limitation are likely to continue to exist, with rapid developments in vehicle uptake not accompanied by an effective deployment of the needed AFI in a coherent manner throughout the EU. Those expected developments can be best demonstrated by comparing the Member States target setting as per their NPFs and NIRs.
Based on these targets as reported by 17 Member States it can be concluded that the problem of incoherent development in recharging infrastructure will continue to grow. For example, in Germany and Luxembourg there will be more than 20 recharging points for 1000 registered cars/vans, while other Member States will have very little recharging infrastructure with less than 2 recharging points serving 1000 cars/vans. Such a disparity in infrastructure development will not allow for easy cross-border travel. It also risks to limit the uptake of zero-emission vehicles in those Member States that provide only very little infrastructure. This is likely to undermine the accelerated uptake of vehicles to meet the increased 2030 climate ambition.
Figure 4: Targeted number of recharging points per 1000 registered cars/vans 2030, based on NIR targets of Member States
Source: National Implementation Reports, Assessment Report on the National Implementation Reports.
In conclusion, the planned AFI deployment by Member States under their NPFs and NIRs is not ambitious enough to align with the infrastructure needs induced by other policies (as outlined in the European Green Deal, the 2030 Climate Target Plan and the Smart and Sustainable Mobility Strategy). However, all policies need to contribute together to the ultimate goal of achieving necessary substantive emission reductions from the transport sector.
Such shortcomings are equally to be expected in other road transport segments. For example, only a limited number of Member States plan for hydrogen infrastructure. It will not allow for the development of a coherent network across the EU. The same goes for the heavy-duty segment, which is currently not specifically addressed in the Directive nor in most Member States’ NPFs. Besides generally requiring faster recharging and refuelling, the heavy-duty segment’s needs and use cases differ significantly from those of light-duty vehicles, and in particular of personal cars. Different use cases and related recharging/refuelling needs can be defined in relation to e.g. urban delivery, regional distribution, planned and unplanned long-haul freight transport. Furthermore, the need to integrate recharging and refuelling times in the logistics and operational planning – including by coordinating them with mandatory driver breaks as well as loading/unloading times at logistics hubs and/or at destination – will play a factor in defining the way the infrastructure is used; interactions with requirements for safe and secure parking places needs also to be taken into account. Confidence in the possibility to recharge and refuel seamlessly across borders is a crucial pre-condition for the deployment of alternative fuels in the long-haul transport sector. Without a clear European policy framework in this area it is very unlikely that a sufficiently dense European network particularly of electric charging and hydrogen refuelling stations will develop that allows the deployment of an appropriate share of low- and zero-emission vehicles into the heavy duty segment.
In contrast, the network of CNG and LNG refuelling stations across the EU’s road network is already existent and largely mature. Punctual re-enforcements are needed to accommodate the expected uptake in particular of LNG HDV. However, CNG and LNG vehicles can only contribute to the necessary emission reductions if natural gas will be gradually decarbonised and finally fully replaced by biogas and renewable low-carbon e-gases. Such decarbonisation of fuels pathways can be ensured through the existing refuelling infrastructure that can accommodate gaseous drop-in biofuels and renewable low carbon synthetic fuels needed to contribute to climate objectives.
What concerns other transport modes, it is unlikely that the On Shore Power Supply (OPS) will develop in EU ports without strengthening of the legislative requirements as only a few Member states currently plan to do so. This is in contrast to the clearly described ambition in the European Green Deal to oblige docked ships to use shore-side electricity and the FuelEU maritime initiative that aims to ensure that all containerships, cruise ships and Ro-Pax ships are equipped with OPS by 2030. Similarly from the NPFs it is not obvious that the current provisions in the Directive can ensure that alternative power trains in the shipping sector and their corresponding fuels infrastructure in ports will develop. For the maritime sector, the FuelEU maritime initiative will lead to increased demand for alternative fuels, including LNG as a short-term available fuel alternative, while zero-emission sea-going vessels are targeted for 2030.
In the absence of any provisions on aviation it is unlikely that electricity supply for all stationary aircrafts will become available. Increase demand for sustainable aviation fuels as required by the RefuelEU aviation initiative can be met by existing infrastructure. However, in the absence of any provision it is unlikely that a coherent strategic planning for the development of needed infrastructure needed for large-scale zero-emission aircraft will develop.
2.3.2.Interoperability issues persist in terms of physical connections and communication standards
As described in previous chapters, common technical specifications have been mandated in particular for physical connections through the Directive. However, as discussed in section 2.2.3, several issues still remain and new needs have emerged. While improvements will continue to take place, there is a real possibility of moving towards a fragmented ecosystem, where multiple standards will compete for a long time to become dominant, generating additional costs to operators and users. The lack of interoperability of both physical connections and communication standards could strongly prevent the progress towards a wider use of alternatively-fuelled vehicles, conditioning user aceptance. In particular:
·Interoperability and exchange of information among the different players within the electric vehicle charging ecosystem would continue to grow, however, identification and authentication of users, as well as payment methods and smart recharging solutions could develop under multiple different solutions at different paces across the EU, but not at the speed required and without the information transparency expected from users. Additionally, mass market development is likely to be affected due to user reluctancy. Certain areas of the charging ecosystems would not reach an agreement to common technical specifications, being ruled out by proprietary solutions, continuing and further deepening a plethora of non-user-friendly approaches in consequence.
·Standards for recharging HDV and refuelling HDV with liquid and gaseous hydrogen are required, but would develop at lower pace and would have less market impact if not transposed into European law.
·In addition, maritime transport and inland navigation would witness slower adoption of common technical specifications and hence a slower entry on the market of alternative fuels, especially in relation to supply of electricity and hydrogen as well as hydrogen based fuels.
2.3.3.Publicly accessible infrastructure does not fully correspond to user needs
Ever since alternatively-fuelled vehicles started gaining traction in the market, issues regarding availability of adequate consumer information have existed. With different industry players using different ways of communicating information to consumers, the problem is likely to continue to exist if there is no action to ensure a harmonised way of and a minimum set of data to be communicated by the recharging and refuelling point operator to consumers.
With respect to the lack of user information about and at recharging and refuelling points, the evaluation of the Directive found that some progress should be expected to continue to contribute towards improving the availability and quality of information (see Annex 10). Work under the Programme Support Action "Data collection related to recharging/refuelling points for alternative fuels and the unique identification codes related to e-Mobility actors" is of relevance here. However, withouth further policy intervention, the evolution will likely be limited to single Member States and not ensure consistent access to such information across the EU transport network. It is likely that important limitations in terms of the availability of information on the location of AFI infrastructure would remain, whereas other essential variables not included in the Directive would not become available. It could also become more problematic to make data accessible through the National (or Common) Access Points (NAPs) as established in the Directive 2010/40/EU on Intelligent Transport Systems.
Also without further harmonisation on EU level, individual companies will decide on the way to present prices to consumers. Such bottom-up approach would not lead to truly transparent prices across the EU.
Lack of information or filtered information on alternative fuels infrastructure locations, availability and prices, will hamper the development of a truly competitive alternative fuels services market. Only with full upfront information on their different recharging and refuelling options can consumers identify the recharging or refuelling point that best meets their needs, allowing markets to develop as competitive markets.
With respect to ad hoc payment method that has to be available at all recharging points, it is expected that without further harmonisation, individual charge point operators will continue to provide individual ad hoc payment solutions that will continue to pose problems of accessibility and understanding for consumers especially when travelling across borders.
3.Why should the EU act?
3.1.Legal basis
To ensure the correct functioning of the internal market the Treaty on the Functioning of the EU (TFEU) establishes the EU’s prerogative to makes provisions for the Common Transport Policy, Title VI (Articles 90-91) and for the trans-European networks, Title XVI (Articles 170-171). With this legal framework in mind, EU action allows better coordination for even and widespread deployment of AFI, instead of relying on the uncoordinated action of individual Member States only. This coordinated approach helps facilitating travel across the EU for consumers and transport operators. It also helps to remove lack of alternative fuels infrastructure as a potential barrier, encouraging the vehicle industry to commit to vehicle production knowing the infrastructure is in place.
3.2.Subsidiarity: Necessity of EU action
At the time of the development of the AFID, the impact assessment (European Commission, 2013) identified an EU initiative in this field as necessary - Member States did not have the instruments to achieve pan-European coordination (among vehicle manufacturers, infrastructure providers, national authorities and final users) in terms of technical specifications of infrastructure and timing of investments, and AF technology standards were not common EU-wide, thereby discouraging potential industry players, and leading to the fragmentation of the internal market.
According to the Directive itself, establishing a common framework of measures and promoting a broad market development of AFs for different transport modes and fuel types “cannot be sufficiently achieved by the Member States individually, but can rather, by reason of the need for action to meet the demand for a critical mass of alternatively fuelled vehicles and for cost-efficient developments by European industry, and to allow Union-wide mobility of alternatively fuelled vehicles, be better achieved at Union level”. Subsequent documents have provided further justification of the ongoing need and added value for action at EU level. According to the Commission’s Clean transport good practice examples published in 2016, EU intervention in the case of AFI was justified by the fact that the build-up of a European AFI “allows for free movement of goods and persons, with vehicles running on alternative fuels across the whole EU” and “facilitates the development of a single EU market for alternative fuels and vehicles which will permit the industry to benefit from economies of scale”.
3.3.Subsidiarity: Added value of EU action
The evaluation of this Directive, in conjunction with the assessment of national implementation reports of Member States under this Directive, also underlined the EU added value of the intervention in the sector, in terms of its effectiveness, efficiency and synergies that it brings. The evaluation showed that the development of a common EU framework for alternative fuels infrastructure has contributed towards avoiding the fragmentation of measures in relation to the promotion of AFIs, and thereby supporting Member States in the development of the AFI network, creating a level playing field within the industry and facilitating the free circulation of AFVs throughout the EU. All Member States have seen an increase in the level of AFI that, despite the gaps, suggest a relatively more coherent network with fewer gaps that what would have been the case in the absence of EU level intervention. Through encouraging interoperability, relevant technical standards and setting of targets on similar timescales, EU level action has provided some cost savings and better value for money by facilitating economies of scale, avoiding duplication of effort and resources, and providing funding investments for infrastructure. The implementation of the Directive (and its supporting activities) have facilitated cooperation and information exchange on alternative fuels between the relevant industry and public actors which would otherwise likely not exist.
Without EU intervention it would be very unlikely that a coherent and complete network of fully interoperable alternative fuels infrastructure develops across all Member States that will ensure that travelling across the EU with an alternatively fuelled vehicle is possible. This in turn is a prerequisite for the uptake of such vehicles across the EU which is vitally important for the EU to meet its GHG reduction ambition.
4.Objectives: What is to be achieved?
4.1.General objectives
The general objectives of this initiative are to contribute to achieving climate neutrality by 2050 (i.e. achieve net zero GHG emissions by 2050) and to contribute to the reduction of air pollution. To this end, and in line with the 2030 Climate Target Plan, the objective is to reach at least 55% net greenhouse gas emission reductions by 2030 compared to 1990 and the environmental goals of European Green Deal. This requires a coherent policy architecture for GHG reduction in transport, including the provision of sufficient and user friendly alternative fuels infrastructure as a prerequisite for the uptake of alternatively fuelled vehicles.
In particular, the transition to a climate-neutral economy requires a robust policy framework in the area of alternative fuels, in particular addressing renewable and low-carbon fuels, with the main aim of supporting the deployment of zero-emission vehicles, and infrastructure for all transport modes that must be open to future innovations. This initiative seeks to ensure the availability and usability of a dense, wide-spread network of alternative fuel infrastructure throughout the EU. All users of alternatively-fuelled vehicle/vessel/aircraft shall circulate at ease across the EU, enabled by key infrastructure such as motorways, ports and airports.
4.2.Specific objectives
This initiative is designed to effectively address the existing barriers that hamper the further deployment of a dense network of interoperable infrastructure. The specific objectives (SOs) and their correspondence with the problem drivers are presented in
Figure
5
.
Figure 5: Correspondence between the specific objectives and the problem drivers

SO1: Ensuring sufficient infrastructure to support the required uptake of alternatively fuelled vehicles across all modes and in all MS to meet the EU’s climate objective. It is essential to increase the number of recharging and refuelling points across Member States and across modes to ensure that sufficient infrastructure is available for the expected rapid uptake of alternatively fuelled vehicles and vessels in all Member States required to meet the EU’s 2030 climate ambition and 90% GHG emission reduction from transport by 2050.
SO2: Ensuring full interoperability of the infrastructure. Interoperability relates to both, physical interfaces and communication protocols as a prerequisite to provide assurance to investors about investments in recharging and refuelling infrastructure across all modes. Furthermore for road transport, it ensures that services – including smart and bidirectional recharging - can develop in a competitive manner.
SO3: Ensuring full user information and adequate payment options. Sufficient and accurate information for consumers, including information on location, accessibility, prices, payments and compatibility of fuels and recharging infrastructure are a prerequisite for users to purchase alternatively fuelled vehicles. They guarantee certainty and transparency about the use case; users know that they can use the vehicle without hassle and without surprises anywhere in the EU. Adequate payment options are highly relevant in this context – they ensure that users do not get stranded in front of recharging or refuelling points and always have a common and easy to use payment option at hand.
5.What are the available policy options?
5.1.What is the baseline from which options are assessed?
The EU Reference Scenario 2020 (REF2020) is the common starting point for the impact assessments for all the initiatives of the “Fit for 55” package and for this reason it is also used as a baseline for this impact assessment. The EU Reference scenario 2020 reflects the agreed 2030 EU climate and energy targets, the main policy tools at EU level to implement these targets as well as the aggregate ambition and, to the extent possible, the range of foreseen national policies and measures of the final National Energy and Climate Plans (NECPs) that Member States submitted in 2019 according to the Governance Regulation. The EU Reference scenario 2020 also takes into account the impacts of the COVID-19 pandemic that had a significant impact on the transport sector. More detailed information about the preparation process, assumptions and results are included in the Reference scenario publication. The most relevant information for this impact assessment is also presented in Annex 4.
The Reference scenario projects that EU level policies like CO2 standards for vehicles, together with the national contributions put forward in the NECPs and national incentives for the uptake of electric vehicles would result in an uptake of around 44 million electric light duty vehicles (30 million battery electric and 14 plug-in hybrid vehicles) by 2030. It shows that emissions from transport including intra-EU aviation and intra-EU maritime would go down by around 17% by 2030 relative to 2015 (or by 11% when all intra-EU and extra-EU aviation and maritime emissions are considered). The REF2020 scenario models the impacts of targets and policies already adopted, but not the revised EU climate ambition for 2030 or the target of net-zero emissions by 2050. Post-2030, there are no additional policies driving the decarbonisation. However, several of the measures in place today will continue to deliver emissions reductions in the long term. By 2050, the CO2 emissions from transport including intra-EU aviation and intra-EU maritime are projected to be 39% lower relative to 2015 (27% lower when all intra-EU and extra-EU aviation and maritime emissions are considered).
With regard to infrastructure, for road transport, in the baseline the trend towards an uneven distribution of recharging infrastructure is projected to continue, as explained in chapter 2.3. Eighteen Member States set targets for the deployment of recharging infrastructure for 2030 in their NPFs and NIRs, summing up to 1.9 million public recharging points in those 18 Member States. The total number of recharging points at EU level is projected to increase from 165,106 in 2019 to slightly over 2.3 million by 2030. For hydrogen infrastructure, the number of refuelling points is projected to increase from 127 in 2019 to 1,371 by 2030, which is however not expected to allow the development of a coherent network across the EU by that date. The network of CNG and LNG refuelling stations across the EU’s road network is already mature. The number of CNG refuelling stations is projected to go up from 3,519 in 2019 to 8,299 by 2030, while the number of LNG refuelling stations from 242 in 2019 to 3,527 by 2030. The uptake of liquid and gaseous drop in biofuels and synthetic fuels will be ensured through the existing refuelling infrastructure.
Less than 50% of all TEN-T maritime ports are currently equipped with LNG bunkering facilities. However, of the 22 Member States that have core TEN-T maritime ports, half are already planning to deploy LNG bunkering infrastructure in their core ports. In the baseline, 71 core TEN-T maritime ports out of 90 are projected to have LNG bunkering facilities in place by 2030. The total installed capacity for the OPS infrastructure in the maritime ports has been increasing since the 2000s and it is currently around 90MW across the EU, according to EAFO database. This trend is projected to continue, reaching 174 MW by 2030.
Based on the NPFs, 36 core TEN-T inland ports are planned to offer LNG bunkering infrastructure by 2030, out of the 85 inland TEN-T core ports in the EU. By 2030, it is also planned that 139 inland ports (67 core TEN-T ports and 72 comprehensive TEN-T ports) will have OPS installed in at least one berth.
Electricity supply for stationary aircrafts beyond what is already established and infrastructure for battery electric or hydrogen trains on railway lines that cannot be electrified are not projected to develop by 2030 in the baseline, in the absence of provisions on aviation and rail.
The Reference scenario does not include the “Fit for 55” initiatives. In order to ensure consistency with the other “Fit for 55” initiatives and in particular with the revision of the regulation on CO2 standards for vehicles, the policy options are designed in the context of the MIX policy scenario. The MIX scenario is also consistent with the “TL_MED” option of the impact assessment accompanying the revision of the emission performance standards for new passenger cars and for new light commercial vehicles. More explanations on the approach are provided in section 6 and Annex 4.
5.2.Policy measures and policy options
As a first step, a comprehensive list of possible policy measures was established after extensive consultations with stakeholders, expert meetings, independent research and the Commission’s own analysis. This initial list is presented in Annex 5.2. This list was subsequently screened based on the likely effectiveness, efficiency and proportionality of the proposed measures in relation to the given objectives, as well as their legal, political and technical feasibility.
5.2.1.Discarded policy measures
As a result of this analysis, several measures were not retained in the policy options, although, in some cases, their important role as complementary measures, supporting for example the climate objective for the maritime transport sector, is fully recognised. Based on the initial screening and tested in the OPC and through a dedicated stakeholder survey, a range of policy measures were discarded in the context of this impact assessment, also because some of the aspects will be addressed through other EU legislation or soft policy instruments.
The key discarded measures are the following:
Specific targets for electric recharging for two- and three-wheelers: In the absence of dedicated policy measures on the demand side, the uptake will be largely determined by national and regional policies which would make it impossible to determine adequate targets at EU level. Moreover, connectors for two- and three-wheelers can also be installed at recharging points preliminary designed for cars and vans, making it not necessary to create a dedicated infrastructure.
Specific deployment targets for rail such as for hydrogen refuelling, electric recharging points or electrification of railway lines: First projects are being developed in the EU on hydrogen and battery electric trains while electrification off the TEN-T core and comprehensive network is a clear EU policy priority and investments are ongoing. Those investment decisions are taken under specific consideration of the local conditions, including their specific benefits and costs. Through EU wide targets for hydrogen refuelling and battery recharging infrastructure it would not be possible to take such local condition into account. Such targets run a high risk to require unnecessary or non-optimised investment in infrastructure.
Targets for infrastructure for emerging alternative fuels in ports: Zero emission powertrains using fuels such as ammonia, hydrogen and electricity are being developed and tested in the shipping sector. However, at this stage only very few vessels are in operation. In addition, the modelling done in support of the impact assessment accompanying the FuelEU maritime initiative only shows a negligible share of those fuels in shipping until 2035. The Sustainable and Smart Mobility Strategy of the Commission notes 2030 as the milestone by when zero-emission sea-going vessels should become available to the market. A review clause at the end of 2026 under the revised Directive is well suited to ensure that the market situation can be reviewed and on that basis the Commission can decide to propose further targets for ports. For hydrogen, the policy options include mandates for hydrogen refuelling stations in urban nodes. Those can be installed in multimodal hubs such as ports and serve different transport modes at those locations. Furthermore, more detailed provisions can be better introduced into the revised NPF requirements ensuring the development of alternative fuels on TEN-T corridors for inland waterways and short sea shipping.
Targets for infrastructure to fuel hydrogen or electric (hybrid) aircrafts: First electric and hybrid planes have already been developed. The European Union Aviation Safety Agency announced the certification of an electric airplane, the Pipistrel Velis Electro, the first type certification world-wide of a fully electric aircraft. Furthermore, Airbus has revealed three concepts for the world’s first zero-emission commercial aircraft which could enter service by 2035. All of these concepts rely on hydrogen as a primary power source. However, as for ports above, the Commission does not yet have a clear indication with respect to the concrete market uptake of such aircrafts. The Sustainable and Smart Mobility Strategy notes 2035 as the milestone by when zero-emission large-scale aircraft should be available to the market. Therefore, possible infrastructure targets will be analysed under the review clause end of2026 when the markets will be more mature. In the meantime, Member States can be required through the national policy frameworks (NPF) to assess the emerging needs for recharging (electricity) and refuelling (hydrogen, other fuels) infrastructure for rail, ports and airports on their territory every two years and report in the National Implementation Reports. This should form the basis for developing a strategic framework of operation at national level. Furthermore, a dedicated infrastructure for Sustainable Aviation Fuels (e.g. biofuel blends) is not required as those fuels can be used in the existing refuelling infrastructure of airports.
Dedicated infrastructure for high blend biofuels (e.g. E85). Biofuels used in the EU are largely drop-in fuels that do not require a specific infrastructure. However, high blend biofuels require a dedicated infrastructure. Those are only used in a few Member States, in particular in Finland. Vehicles require special engines that allow them to use such fuels next to ordinary liquid fuels. However, very few manufacturers produce such vehicles or have announced that they will manufacture them in the future. In addition, the use of sustainable biofuels in the road sector will remain largely stable in the next two decades and is expected to decline post 2040 with an envisaged shift of sustainable biofuels towards other transport sectors (maritime/aviation), indicating that there is no need for shifting towards high biofuel blends in road transport that require a dedicated infrastructure. In the OPC and in dedicated interviews, stakeholders have not indicated the need of dedicated biofuels infrastructure. While individual Member States may still wish to build up their own dedicated biofuels infrastructure, there does not seem to be sufficient demand to justify EU-wide rules for dedicated biofuels infrastructure. Furthermore, vehicles that can use for example E85 can also use conventional fuels allowing such vehicles to travel across the EU without the need for dedicated EU wide biofuels infrastructure.
Exemption of certain recharging points from quality requirements. The Directive distinguishes between publicly accessible and not publicly accessible infrastructure. In particular, with respect to recharging points, publicly accessible infrastructure needs to meet certain quality and information requirements. Some stakeholders have therefore argued that “semi-public” recharging points, e.g. located at privately operated parkings at supermarkets, shopping malls, etc. could be exempted from certain quality requirements to reduce investment costs. This issue was also discussed at a dedicated workshop under the Sustainable Transport Forum, with the vast majority of stakeholders indicating that such exemptions would severely risk to jeopardise the overall objective to have a sufficient coverage of fully interoperable infrastructure accessible to all drivers across the EU.
Price setting issues. The Directive prescribes that prices charged by the operator of recharging points must be reasonable but without further specification what this should mean in practice. Over the last years there have been a number of complaints that prices charged by Charge Point Operators (CPO) to EV-drivers were very high and that the operators also charged different prices to different Electro Mobility Service Providers (EMSP). In some Member States, anti-trust authorities further analysed individual practices in this regard but have not taken action. As there is currently no evidence that there is a structural issue with discriminatory or unreasonable price setting, no policy options was considered that would further interfere in the business-to-business or business-to-customer price setting of charge point operators.
Contract-based payments through roaming. The Directive only addresses ad-hoc payments. It does not address in detail contract-based payments that requires roaming when travelling across the EU. In order for roaming to function, a bilateral agreement must be established between the operator of a recharging point (CPO) and the driver’s EMSP. As not all charge point operators offer the same conditions to all EMSPs, some calls have been made by individual stakeholders to regulate the CPO – EMSP contract setting. Such a policy measure was not further analysed in the impact assessment because of a lack evidence that there is a structural problem and because any measure would interfere heavily in the contractual freedom between the different market actors. Furthermore, further improvements are addressed under the policy options to ensure that every driver can easily pay at every recharging point in the EU. Therefore, contract based payments through roaming are not an absolute necessity to ensure that drivers can easily circulate across the EU.
Access to recharging and refuelling infrastructure to citizens with disabilities has been addressed in the evaluation support study, the impact assessment support study and in the OPC. In this context it is important to note that while the rules of the Directive on accessibility requirements for products and services will apply from 2025 onwards to payment terminals, the Directive does not apply to alternative recharging and refuelling infrastructure in its totality. It is up to Member States to decide if they apply accessibility requirements of the built environment. Stakeholders representing the interests of people with disabilities, did not indicate any concrete problems with the existing infrastructure, neither in their repsonses to the questionnaires nor in the interviews. While those stakeholders issued some general statements on ensuring the usability of infrastructure for all citizens in line with the Directive on the accessibility requirements for products and services and identifying for example the height of the connector as an important issue, they did not establish any additional concrete requirements for the roll out of infrastructure. In the absence of concrete requirements from stakeholders, no concrete policy options could be formulated and quantitatively assessed that would address the specific need of citizens with disabilities. Those aspects will nevertheless need to be addressed by Member States in their NPFs. In addition the Commission may consult its expert group, the Sustainable Transport Forum, on this issue and in addition proposes a mandate to ESOs to review the situation and develop, if need be, concrete standards concerning the the usability of infrastrucure for all citizens.
Smart Recharging – aspects addressed in other EU legislation: the uptake of electric vehicles can potentially cause congestion in the electricity grid and therefore may make expensive grid improvement necessary in some areas. However, introducing smart and bidirectional recharging and thereby shifting charging to times when there are capacities in the network or providing back up storage through electric vehicles batteries can significantly reduce such investments in electricity grids. A number of conditions must be met to ensure that smart charging can take place and is rewarded by the markets, including functioning electricity flexibility markets, technical aspects on the vehicle side, and access to battery data to ensure the development of competitive markets on the service provision side. Those aspects are outside the scope of AFID and are dealt with in other pieces of EU legislation, in particular electricity market legislation.
Near real-time access to the battery data. In order to allow the development of fully competitive markets in the area of smart and bidirectional recharging, many stakeholders pointed to the need to have near real-time access to the battery data to efficiently manage the charging process. This data is currently only available to the car manufacturers. While non-discriminatory access to such battery data is crucial for the development of competitive markets, the issues needs to be seen in the wider context of access to in-vehicle data, including for example maintenance data. Those aspects are being addressed in the ongoing work on access to in-vehicle data, where also the issue of access to battery data is being addressed in detail.
5.2.2.Retained policy measures and policy options overview
The retained policy measures have been grouped in 3 policy options (POs) as presented in
Table 2
. It presents the links of the retained policy measures with the specific policy objectives and the POs.
Table 2: Overview of specific objectives, measures and policy options
|
|
Option 1
|
Option 2
|
Option 3
|
|
Targets Road Transport, publicly accessible infrastructure (SO1)
|
|
Electricity Cars and LDV
|
Mandatory fleet based target at national level
|
Option 1 plus
Plus mandatory target on TEN-T core and TEN-T comprehensive network from 2025
|
Option 1 plus option 2 plus
Mandatory target for petrol stations from 2025
|
|
Electricity HDV
|
Mandatory target on TEN-T core and TEN-T comprehensive from 2025
Plus overnight parking on safe and secure parkings
|
As Option 1 plus
Mandatory target on urban nodes
|
As option 2 plus
Mandatory target for every filling station on TEN-T core network
|
|
LNG HDV
|
No change
|
Mandatory target along TEN-T core network
|
As option 2
|
|
Hydrogen for HDV also accessible to LDV
|
Mandatory target for 2030 for TEN-T core network
Plus mandatory target for urban nodes
Minimum capacity 1 t per station
|
As option 1 plus
Minimum daily capacity for all stations of 2t
Mandatory provision for liquid hydrogen
|
As option 2 plus
Mandatory targets as in option 2 but already for 2025
|
|
Targets Shipping (SO1)
|
|
LNG in inland ports
|
No changes
|
Delete existing provision for LNG bunkering
|
As option 2
|
|
LNG in maritime ports
|
No changes
|
No changes
|
Mandate for LNG bunkering in all TEN-T core ports in 2030
|
|
Shore side electricity supply inland ports
|
Mandatory OPS for all TEN-T core ports by 2025.
|
As option 2 plus
Mandatory OPS for all TEN-T comprehensive ports by 2030.
|
Mandatory OPS for all TEN-T core and comprehensive ports by 2025.
|
|
Shore side electricity supply in maritime ports
|
Mandatory OPS for all TEN-T core ports. 1 OPS installation per port in terminals receiving cruise, container, and Ro-pax ships above 5000GT by 2030.
|
Mandatory OPS for at least 90% of demand for all TEN-T core and comprehensive ports at terminals receiving: cruise, container, Ro-pax ships above 5000GT by 2030.
|
Mandatory OPS for at least 90% of demand for all EU Ports (TEN-T core, comprehensive ports and non TEN-T ports) at terminals receiving: cruise, container, Ro-pax ships above 5000GT by 2030.
|
|
Targets Aviation (SO1)
|
|
Electricity Supply for stationary aircrafts
|
At TEN-T core and comprehensive airports: Mandatory targets for stationary commercial passenger aircrafts at all gates in 2025
|
As option 1 plus
At TEN-T core and comprehensive airports: Mandatory targets for stationary commercial passenger aircrafts at all outfield positions by 2030
|
As option 2
|
|
Interoperability requirements (SO2)
|
|
Physical Standards
|
New Annex introducing technical specifications for new mandatory physical standards for all fuels and transport modes
|
|
Communication Standards for e-mobility
|
All new charge points to be equipped at least with open standards OCPC and OCPO
|
New Annex introducing technical specifications to be developed/completed by official standardization organizations and subsequently adopted via secondary legislation through delegated acts.
|
|
Consumer Information (SO3)
|
|
Ad hoc payments
|
Bank card (debit and credit) mandatory on all new recharging points.
|
As option 1
But all new fast chargers (>50kW) must provide NFC or terminal payment
|
As option 1
But all new fast chargers (>50kW) must provide terminal payment
|
|
Price transparency
|
Operators of recharging and refuelling points inform at the station
|
As option 1, plus EMSPs must clearly communicate all existing price components to consumers prior to the recharging session via a dedicated application.
|
|
User Information
|
Mandatory requirement on all operators of alternative fuels infrastructure to provide static data to Member States NAPs
|
Option 1 plus
Mandatory requirement on operators to provide dynamic data to Member States NAPs.
|
|
Signposting
|
No changes
|
Along TEN-T core and comprehensive inside service areas
|
As option 2 plus: along TEN-T core and comprehensive signposting outside service areas (along the corridor)
|
|
Legal Instrument / Administration
|
|
Legal instrument
|
No changes: Directive
|
No changes: Directive
|
Switch to regulation
|
|
Reporting / Monitoring
|
No changes: MS reporting through NIRs
|
MS reporting through NIRs following further specified guidelines set in EU legislation every 2 years
|
MS reporting through NIRs following further specified guidelines set in EU legislation every 3 years
|
The uptake of zero- and low-emission vehicles is driven by different policy initiatives under the ‘Fit for 55’ package, including most notably the CO2 emission performance standards for cars and vans. The Directive must ensure that sufficient infrastructure is available to allow that all those vehicles can come into the market and a lack of infrastructure does not become a barrier for the market uptake. In this logic, the policy options look at ensuring that sufficient infrastructure is available to serve the number of zero- and low-emission vehicles that is anticipated under the Fit for 55 package approach as necessary to meet the EU’s climate ambition and achieve at least 55% emission reduction by 2030. This Impact Assessment is drawing here on the findings of the Impact Assessment of the CO2 standards for cars and vans. The methodology to determine sufficient recharging and refuelling infrastructure is described in Annex 7.2. In the course of the development and assessment of the policy options, a sensitivity analysis has been carried out to test the results of different approaches to the assessment of the sufficiency of infrastructure as presented in the POs (see section 7.6).
In order to ensure that sufficient infrastructure will be available across all modes and in all Member States (SO1), mandatory deployment targets are considered to offer strong prospects, given that the indicative target setting applied under the current Directive has not delivered on this objective in all Member States.
When it comes to road transport, the analysis considers mandatory quantified targets on the basis of a minimum recharging capacity to ensure sufficient supply for the national fleet of electric vehicles on the Member State level (PO1). Fleet based targets are relevant for electric LDVs because of the more limited range of electric vehicles compared to other vehicles, the relatively long charging times (requiring more recharging points per vehicle than for example hydrogen stations per vehicle), and the great numbers of electric vehicles expected to come into the market post 2020. The rapid increase of electric LDVs require a spatially inclusive and comprehensive network of recharging points throughout the Member States.
To ensure full cross-border transport connectivity in the TEN-T core and comprehensive network, distance based targets on the TEN-T core and comprehensive network can be set in addition to fleet based targets (PO2). In addition, targets can mandate infrastructure for specific locations such as petrol stations to further determine common locations across the EU (PO3). The three policy options therefore all rely on fleet based targets but for PO2 and PO3 more specific requirements are considered for the installation of recharging points by Member States to ensure a full spatial coverage allowing for cross-border connectivity.
For hydrogen LDV and HDV, but also battery-electric HDV no fleet based targets are considered as the refuelling patterns are distinctively different from electric recharging for LDV. Instead POs propose a mix of distance based targets along the TEN-T network and location based targets in urban nodes, as defined in the TEN-T regulation. The different policy options reflect increasing ambitions in terms of size of the refuelling and recharging stations and the prescribed locations. Similarly, the provision of the current Directive for Member States to provide for an appropriate number refuelling points for LNG accessible to the public (for trucks) by 2025 is maintained, in view of the need for addressing outstanding gaps in the network.
For maritime and inland waterway ports mandatory targets have already been set for LNG refuelling in the Directive but could be strengthened for maritime ports, anticipating that such LNG infrastructure will increasingly serve higher biogas blends and e-gases. For on shore power supply (OPS) binding requirements, expressed in the form of quantified minimum targets, are considered as a measure to ensure that container, cruise and Ro-Pax ships will be offered OPS in ports and thereby enable the maritime sector to meet their obligations under the FuelEU maritime initiative. FuelEU maritime initiative proposes a goal-based approach and requires fuels used in navigation and at berth to meet maximum GHG intensity targets, while also including a reward mechanism for overachievers that will include an additional push for the use of low-carbon renewable transport fuels as part of the so called “basket of measures” approach. AFID caters for the deployment of infrastructure for certain alternative fuels that require distinct infrastructure and that are market ready. There is hence no overlap between the initiatives. Rather, the initiatives are designed to work coherently with each other. Both focus on the same type and size of vessels for which an OPS requirement is put in place. Both also anticipate an exemption for vessels staying at berth for less than 2 hours for technical reasons (i.e. the time for a vessel to connect and disconnect). Also, AFID does not require 100% coverage of OPS calls in a port but rather 90%. This difference caters for calls which for technical reasons are also excluded from FuelEU Maritime legal draft proposal (such as calls for emergency reasons, repairs etc. or calls from ships using zero-emission technologies). In addition, the maximum demand limit of AFID represents a realistic approach in that maximum energy demand need for a port may not be reached but for a few days in a year, thus a 100% demand would lead to underused investments. Furthermore, AFID introduces a minimum limit of calls below which a port would not be required to invest. This limit is set at quite low level, which indicates only occasional calls (less than once per week in most cases). The number of such calls on the one hand is low enough not to impact FuelEU Maritime initiative and on the other hand does not lead to excessive investments. With regard to the geographical scope (core, comprehensive or all ports) a narrower AFID scope as proposed under PO1 (where a mandate is introduced only on TEN-T core ports) would force a shift in traffic flows for vessels towards the OPS equipped ports as - after a small transitional period - FuelEU demands use of OPS or a penalty is imposed. Here however, it should be underlined that AFID does not restrict a port from investing in OPS, but it introduces in essence a minimum requirement. PO3 covers all ports whereas PO2 covers TEN-T core and comprehensive ports. However, despite the large number of non TEN-T ports, the impact of rerouting would be minimal to those ports. According to EMSA, of the total port calls in 2019 that would be covered under the requirements of the FuelEU Maritime only a small percentage would go to non TEN-T ports (11% of cruise vessles calls, 4% of container ships calls and 8% of Ro-Pax vessels calls).
For aviation, binding requirements for electricity supply to stationary aircrafts are considered to reduce the CO2 emission of aviation. The provision of Fixed Electrical Ground Power (FEGP) and Pre-Conditioned Air (PCA) to aircraft at the airport gate reduces emissions by allowing the aircraft to obtain electricity direct from the local grid and use the airport’s air conditioning system to control the temperature on board instead of using the Auxiliary power Unit (APU) which uses normal jet fuel. Here binding targets for aircrafts at gates (PO1) and aircrafts at gates and outfield positions (PO2 / 3) are considered.
With respect to interoperability (SO2), policy interventions are considered to complement the existing technical specifications already set for e.g. electric car recharging to recharging and refuelling heavy-duty vehicles, hydrogen refuelling, etc. Likewise, new technical specifications, not addressed under the current Directive, are retained to ensure the functioning of a common governance and IT architecture that is fully coherent with the different areas of communication within the recharging and refuelling ecosystems. With respect to communication protocols, PO1 mandates common technical specifications based on open protocols developed by the market. This approach would already cover a part of the EV charging ecosystem, namely the recharging stations software management communication (Open Charge Point Protocol (OCPP)) and the e-roaming communication (Open Charge Point Interface (OCPI). In contrast, PO2 and PO3 foresee that the Commission requests to the European Standardisation Organisation (ESOs) to develop and adopt standards covering all areas of the EV charging ecosystem, including communication between the vehicle and the recharging point and overall communication with the grid, thus ensuring full harmonisation.
Regarding user aspects (SO3), different levels of interventions are considered to oblige operators of recharging and refuelling stations to provide full and transparent information about recharging and refuelling prices at the refuelling point as well as static (e.g. location, power of the recharging point, etc.) as in PO1 and additionally dynamic (availability, occupancy, etc.) as in PO2 and PO3 data through National and Common Access Points. When it comes to payments mandatory bank card payment is being assessed with different level of prescription of the technology to be used throughout the different policy options.
While all POs deliver the necessary overall ambition for rollout of alternative fuels infrastructure, they differ in their substance and the regulatory approach to a certain extent. One difference concerns the level of degree to which the policy options address detailed requirements for the physical roll-out in a Member State – here, PO1 is least intervening into Member State action autonomy, whereas PO3 is most heavily intervening. Another difference concerns the level of degree to which the policy options address detailed requirements regarding interoperability, user information and payment services. In this area PO2 and PO3 go beyond PO1 in terms of market segments covered and the level of detail and individual standards when it comes to communication protocols. PO2 and PO3 also differ in terms of the legislative instrument, as PO3 builds on a Regulation. Table 3 provides a tabular overview on the main elements of the policy options.
Table 3: Overview of policy options in terms of ambition and level of intervention
|
Nr.
|
Policy option description
|
Degree of ambition
|
Level of intervention
|
|
PO1
|
This policy option introduces substantive changes to the Directive. While the national target setting and reporting under the National Policy Framework remain an important pillar, this approach is strengthened by mandatory fleet based targets for electric recharging points for LDV. For HDV electric recharging points and H2 mandatory distance base targets along the TEN-T network are introduced, including limited provisions for H2 in urban nodes. Mandatory targets are also introduced for stationary aircrafts and OPS in maritime and inland waterway ports. In addition, some quality aspects of the infrastructure are addressed to improve interoperability and user information.
|
++
|
++
|
|
PO2
|
This policy option represents an even more substantive change of the directive compared to PO1. In addition to the mandatory fleet based targets for electric recharging points for LDV, it sets distance based targets for all road vehicles infrastructure and strengthens targets in urban nodes for heavy duty vehcile infrastructure. It equally includes more detailed provisions for ports and airports. It also includes a greater level of harmonisation on payment options, physical and communication standards and rights of consumers while charging. It substantiates provisions on price transparency and other user information, including physical signposting of recharging and refuelling infrastructure
|
+++
|
+++
|
|
PO3
|
This policy option goes furthest in terms of binding legal instruments by changing the Directive to a Regulation. In addition to the mandatory fleet-based and distance based targets under PO2 it adds further location based targets for electric LDV and adds further targets for HDV. It also adds considerable ambition for ports infrastructure. In addition, it prescribes mandatory terminal payment at new fast-chargers as the sole payment option.
|
++++
|
++++
|
5.3.Description of policy options
5.3.1.Policy option 1
This policy option proposes a number of significant changes to the Directive to fully deliver on the 2030 Climate Target Plan objectives.
Description of the option
This options sets mandatory quantified targets on the basis of a minimum total recharging power to ensure sufficient supply for the national fleet of electric LDV on the Member State level. In addition, this option introduces mandatory distance-based targets for recharging and refuelling infrastructure on the TEN-T core network for hydrogen refuelling stations and electric recharging points for HDV, with an increase in ambition over time. All targets were derived from the methodology explained in detail in annex 7 that determines sufficiency levels for the deployment of infrastructure. Member States will be required to update their National Policy Framework with a view to detailing their planning for implementation of infrastructure rollout, including identification of emerging needs in rail and aviation, and corresponding monitoring and reporting.
Setting of mandatory targets includes (see annex 7.2 for the methodology to determine sufficient infrastructure levels):
·Member States have to ensure that there is always sufficient recharging capacity installed at publicly accessible infrastructure for the electric LDV fleet registered in that Member State. That capacity is prescribed by the Directive as installed capacity per registered electric vehicle. The compliance will be reported every year to the Commission.
·For recharging infrastructure of HDV, distance-based targets apply: Member States must ensure at least 700kW installed capacity, with 350kW (or higher) charging points, every 60 km in each direction on TEN-T core network by 2025 and 1400 kW installed capacity with 350kW (or higher) charging points by 2030. In addition, MS must ensure at least 700kW installed capacity, with 350kW (or higher) charging points every 100 km on the TEN-T comprehensive network by 2030 and 1400 kW installed capacity with 350kW (or higher) charging points by 2035. In addition, a mandatory target for safe overnight parking for heavy-duty vehicles is introduced: by 2030, each safe and secure parking area has at least one recharging point of 50kW minimum.
·For hydrogen refuelling infrastructure, distance-based targets apply: Member States must ensure every 150 km on the TEN-T core network at least one station serving both directions for heavy-duty vehicles at 700 bar (while 350 bar is optional) by 2030. Light-duty vehicles should be enabled to fuel at all stations. Stations have to provide a minimum daily output capacity of 1t. In addition, a mandatory target for providing at least one hydrogen refuelling station per urban node of the TEN-T network with a capacity of 1t hydrogen per day is defined for 2030. This target is required to ensure that destination refuelling in urban nodes is possible.
·For CNG/LNG refuelling infrastructure, the option foresees no change to the provisions of the current Directive.
Concerning waterborne transport, this option sets provisions for deployment of OPS on the back of the retained current requirements for provision of LNG infrastructure in TEN-T core ports by 2025. Those include a requirement for inland waterway ports on the TEN-T core network to have by 2025 at least one OPS installation per port. Furthermore, maritime TEN-T core ports shall provide one OPS installation in terminals receiving cruise, container, and Ro-Pax above 5000GT by 2030. Ports whose average annual traffic volume during the past 3 years is less than 25 cruise ship calls, 50 container ship calls, 40 ferry calls are exempted.
For TEN-T core and comprehensive airports, this option introduces a requirement that all stationary commercial passenger aircrafts shall have electricity supply at all gates by 2025.
This option extends the set of technical specifications under the Directive to address interoperability, including requirement for additional physical standards for charge points (e.g., charging standards for trucks, supplementary standards for hydrogen). Moreover, all new charge points need to be equipped with the following communication interfaces and protocols: Open Charge Point Protocol (OCPP) to ensure full communication of the charging point with the back-end of the charge-point operator and Open Charge Point Interface (OCPI) to enable full communication with roaming platforms. Moreover, operators have to provide static data to Member States national (or common) access points on location, opening time and specific charging station characteristics as well as clearly display prices following a format to be defined in the directive. Charge point operators must offer bank card payments through either a chip card terminal, an NFC interface or through a QR code leading to a specific payment side for the specific charging event.
How does this policy option address specific policy objectives?
SO1 Increase the number of recharging and refuelling points across Member States and across modes
This option addresses this objective to a large extent. The introduction of fleet based targets for electric recharging points for LDV will ensure that a sufficient number of recharging points will be available in all Member States. However, it is not ensured that sufficient recharging points are installed along the full TEN-T network risking not to ensure full connectivity across TEN-T. Also recharging points in urban nodes to specifically support urban and regional freight transport are not mandated under this option not guaranteeing that this infrastructure develops in all urban nodes. For long distance HDV, the mandatory distance based targets for recharging and refuelling infrastructure for road transport vehicles ensures full coverage in the TEN-T network. It enables effective cross-border connectivity for all alternative fuels HDV vehicles.
Moreover, this option enables a minimum of onshore power supply to ships in TEN-T core ports, which marks a specific but still moderate improvement compared to the current provision. There is also an increase of regulatory ambition for electricity supply to aircraft at gates in airports.
SO2 ensure the full interoperability of infrastructure and infrastructure use services
This option addresses this objective to a considerable extent by extending the efforts to further standardize recharging and refueling infrastructure in response to existing imminent needs, including for heavy-duty road transport. Moreover, requirements to charge point operators to at least ensure equipment with existing open protocols and interfaces will ensure smoother interaction between the vehicle, the charge point and its back-end.
SO3 foresee adequate information for consumers
Requiring charge point operators to display pricing in a standardized manner will help increase consumer acceptance and trust. Furthermore, the provisions for effective data reporting to national access points of Member States can enable further development of infrastructure use services, which will provide for better consumer experience. In particular better user information on e.g. location of infrastructure and the option to pay with bank card at every recharging point will significantly ease travelling especially across borders.
5.3.2.Policy Option 2
This policy option thoroughly revises the Directive. It increases the level of policy intervention: it sets the same mandatory national fleet based targets for electric LDV, but adds targets for infrastructure for electric LDV on the TEN-T network and for electric HDVs in urban nodes. It increases the level of ambition for recharging and refuelling infrastructure for HDV. It also introduces stricter deployment targets for waterborne transport and for stationary aircrafts. This policy option introduces ambitious measures in terms of interoperability and user information, including a greater level of harmonisation on physical and communication standards and more user friendly ad hoc payment options. It further substantiates provisions on price transparency and other user information, including physical signposting of recharging and refuelling infrastructure.
Description of the option
In addition to the targets already included in PO1, target setting in PO2 for alternative fuels infrastructure for road transport includes:
·In addition, Member States must ensure at least 300 kw installed capacity, including at least one 150kW recharging point, every 60 km in each direction on the TEN-T core network by 2025 and 600kW installed capacity, including at least two 150kW in each direction on the TEN-T core network by 2030. In addition, Member States must ensure every 60km on the TEN-T comprehensive network 300 kW installed capacity, including at least one 150kW, by 2030 and 600kW installed capacity, including at least two 150kW recharging points, by 2035.
·In addition to the location based targets on the TEN-T network for HDV, Member States have to ensure a minimum of electric recharging capacity (600 kW installed by 2025 and 1.2 MW installed by 2030) in every urban node of the TEN-T network (as defined in the Regulation on TEN-T guidelines) in particular to serve urban delivery trucks.
·For hydrogen refuelling infrastructure the minimum daily capacity per refuelling station increases to at least 2t of hydrogen. In addition, Member State have to ensure that every 450 km on the TEN-T network a hydrogen refuelling station serves liquid hydrogen to trucks. Moreover, the option norms a requirement to also serve liquid hydrogen in at least one third of urban nodes.
·For LNG refuelling infrastructure, Member States have to ensure that an appropriate number of refuelling points for LNG accessible to the public are put in place by 2025, at least on the TEN-T Core Network, so that LNG heavy-duty vehicles can circulate throughout the Union, where there is demand, unless the cost are disproportionate to the benefits, including environemtnal benefits.
Additional target-setting for waterborne and aviation transport include:
·For inland waterway ports, Member States have to ensure that – in addition to the installation in TEN-T core ports as in PO1 - that 1 OPS is also installed in all TEN-T comprehensive ports by 2030. The policy option removes the requirement under the current Directive for LNG bunkering in TEN-T core ports that foresees that vessels must be able to circulate along the TEN-core network.
·For maritime ports, Member States have to ensure that OPS is installed to cover at least 90%
of demand for all TEN-T core and comprehensive ports at for terminals receiving: cruise, container, Ro-Pax above 5000GT by 2030. Ports whose average annual traffic volume during the past 3 years is less than 25 cruise ship calls, 50 container ship calls, 40 ferry calls, are exempted from this obligation.
·For TEN-T core and comprehensive airports, the option norms a minimum requirement to supply electricity to stationary commercial passenger aircrafts at all gates and outfield positions by 2030.
This options includes a broader range of requirements to address full interoperability. In addition to requirements for additional technical specification for road transport as in option 1, it sets a requirement for additional technical specifications for maritime transport and inland navigation (e.g., a single solution for shore-side battery recharging points for maritime and inland waterways vessels; hydrogen, methanol and ammonia refuelling points and bunkering for maritime and inland waterways vessels). In addition, also particular aviation technical specifications would be considered. The Directive would extend the range of communication aspects covered and also require that instead of prescribing open protocols for recharging points, technical specifications are adopted by European standardization organizations and subsequently transferred into the Directive to fully cover the communication between vehicle and the charging point, the communication of the charging point with the back-end of the charge point operator, the communication with roaming platforms and the communication with the grid. Those would replace the requirements for standards as in option 1. The advantage of adopting standards developed by European standardisation organisations is that those standards are developed with the support and final consent of all Member States and all key industry players, ensuring wide support from all parties concerned.
The option foresees further harmonisation of Member State provisions for recharging infrastructure, e.g. Member States will no longer be allowed to require shutters or any other specific technical requirements to ensure that recharging points can be sold without modifications throughout the EU. Moreover, this option tightens provisions for bank card payment: all new fast chargers (>50kW) have to provide either NFC or terminal payment. Other chargers can also offer QR codes. Moreover, at every charge point, the customer must have the right to choose the payment method before initiating the charge. If automatic authentication under contract-based charging is offered by the charge-point operator, the user must have the right to choose either an ad hoc payment option or pay through another EMSP supported by the CPO.
The option extensively addresses user information aspects. In addition to static information on recharging points and price information through digital means (option 1) option 2 requires CPOs to make dynamic data available (Operational status, Availability, Price ad-hoc). It sets a requirement to install signposting of recharging points and hydrogen refuelling stations within parking and recharging/refuelling areas along the TEN-T core and comprehensive network.
The option prescribes the requirement to Charge Point Operators to display prices at all recharging points. Moreover, Mobility Service Providers must clearly communicate all existing price components (incl. possible roaming fees) to consumers prior to the recharging session via a dedicated application (except if only fixed subscription fee applies). Charge Point Operators cannot unduly differentiate (or discriminate) between the prices charged to B2B customers (EMSPs) and the prices charged to B2C customers (i.e. the ad hoc price charged directly to EV-drivers). Price charged to different Mobility Service Providers must equally be non-discriminatory. The current Directive only addresses price setting vis-à-vis the end user but not towards other businesses. Such widening of the non-discriminatory clauses is deemed relevant to ensure that non-favourable business practice, which currently represents very isolated cases, do not develop into a structural problem in the future.
How does this policy option address specific policy objectives?
SO1 Increase the number of recharging and refuelling points across Member States and across modes
This option extensively addresses this objective. For LDVs, and in addition to ensuring sufficient recharging points in each Member State, it ensures full cross-border connectivity along the TEN-T core and comprehensive network. At the same time, it leaves autonomy and flexibility to public authorities and market actors in Member States as it does not introduce location-based or distance-based requirements with the exception of the provisions for the TEN-T network. For electric, H2 and LNG HDVs it achieves full cross-border connectivity along the TEN-T network and prescribes infrastructure in urban nodes. This option also pushes all TEN-T ports to ambitious infrastructure for onshore power supply to ships at berth, and ensures that electricity is also supplied to aircraft at outfield positions.
SO2 ensure the full interoperability of infrastructure and infrastructure use services
This option addresses this objective to a full extent. The option harmonises data and communication exchange of vehicles, charge points and back ends in a phased way following increasing market maturity, and furthermore sets requirements for the subsequent adoption of physical standards to address all outstanding technical specifications for road, waterborne and aviation infrastructure.
SO3 foresee adequate information for consumers
Consumer information aspects are thoroughly addressed. All users will have full price transparency before charging at public accessible recharging points, on both ad hoc and contract based prices. It secures full flexibility for customers to choose payment options, and ensures easy payment by either terminal or NFC approach at fast recharging points. Requirements for provision of static and dynamic data will help ensure development of innovative market services informing consumers, while this option also addresses physical signpostings that will help easy navigation in the end when circulating at e.g. parking areas along the TEN-T network.
5.3.3.Policy Option 3
This policy option replaces the current Directive with a Regulation and increases further the level of ambition, resulting in a very ambitious mandate for the installation of recharging and refuelling infrastructure in roads and ports, mandating infrastructure on TEN-T core and comprehensive network corridors, at locations and through fleet based targets. Concretely, it extends the mandatory targets of option 2 with additional mandatory deployment targets for electric recharging points on petrol stations and earlier deployment targets for hydrogen stations and increases considerably the ambition of installation of alternative fuels infrastructure in ports.
Equally, strict deployment targets are introduced for waterborne transport and aviation and foresees shortening of the NPF reporting cycle from 3 to 2 years. The option reduces flexibility for charge point operators by making terminal payment at fast chargers the standard ad-hoc payment solution.
Description of the policy option
This policy option combines all distance-, location- and fleet-based target requirements of option 1 and 2. It adds a mandate for deployment of recharging points for LDV:
·by 2025, every petrol station with 12 or more pumps must be equipped with at least one recharging point with a minimum capacity of 150kW and
·by 2030, every petrol station with 8 or more pumps must be equipped with at least one recharging point with a minimum capacity of 150kW
A similar mandate is introduced for trucks (1 recharging point of 350 kW) in all petrol stations that serve trucks. This option also includes a mandate to Member States to ensure that every 150 km on the TEN-T core network there is a CNG refuelling station. The requirements for hydrogen refuelling infrastructure are the same as in option 3, but will have to be met by 2025 already.
In addition, it sets up a high ambition for provision of alternative fuels infrastructure in ports. For inland waterway ports, 1 OPS installation per TEN-T core and comprehensive port has to be achieved by 2025 while LNG . Moreover, the option mandates electricity supply for battery vessels at each TEN-T inland waterway core port by 2030. The option foresees mandatory LNG bunkering in all TEN-T core ports in 2030, thus replacing the existing provision that only prescribes that circulation on TEN-T core ports must be possible without specifying which port must deploy LNG bunkering. The option also requires the OPS provision of option 2 for all EU maritime ports. The option foresees the same requirements for airports as option 2.
The option foresees the same requirements for interoperability of infrastructure as policy option 2, but restricts ad-hoc payment by bank card at new fast chargers (>50kW) to terminal payment. It also prescribes that cables are fixed to AC chargers (helical) and DC chargers. It foresees the same requirements for user information as option 2, but extends the requirement for road signing to be available to the full TEN-T core and comprehensive network. Recharging points and hydrogen refuelling stations must be signalled along the motorways, and not only within parking areas.
A regulation marks a significant change in the legislative instrument, as it directly and automatically applies in its entiety to all Member States and defines precisely the means of achieving certain results, whereas a Directive requires Member States to achieve certain objectives, but leaves them to adopt the measures to incorporate into national law to achieve the objecticves set in the directive. In the consultation, a broader group of participants called for the directive to be changed into a regulation. Option 3 therefore design measures under the instrument of a regulation, including also measures that are binding on specific entities such as petrol stations.
How does this policy option address specific policy objectives?
SO1 Increase the number of recharging and refuelling points across Member States and across modes
This option addresses this objective to a broad extent, particularly by extending the regulatory requirements beyond the TEN-T network by addressing petrol stations. This option extensively addresses this objective by combining fleet-based, distance-based, and location-based (petrol stations and urban areas) targets. It sets a higher level of intervention into the market than option 2 thus affecting the autonomy of planning for public authorities and market actors in Member States. This option also pushes for a very ambitious timeline for provision of OPS in TEN-T ports and leaves no flexibility to ports for installing LNG infrastructure.
SO2 ensure the full interoperability of infrastructure and infrastructure use services
This option addresses this objective to a full extent. Provision for data provisions will enable the development of innovative market services. The option harmonises data and communication exchange of vehicles, charge points and back ends in a phased way following increasing market maturity, and furthermore sets requirements for the subsequent adoption of physical standards to address all outstanding technical specifications for road, waterborne and aviation infrastructure.
SO3 foresee adequate information for consumers
Consumer information aspects are thoroughly addressed. All users will have full price transparency before charging at public accessible recharging points. The option reduces flexibility of charge-point operators by making terminal payment the mandatory method for ad-hoc payment at all new recharging points. Requirements for provision of static and dynamic data will help ensure development of innovative market services, while this option also addresses physical signpostings that will help easy navigation in the end when circulating at e.g. parking areas along the TEN-T network.
5.4.Discarded Policy Options
Some stakeholders in the OPC but also in public workshops and meetings expressed the view that fleet based targets would not be required at Member State level. Instead, distance based targets along the TEN-T core network as well as location based targets at petrol stations would also ensure a sufficient level of recharging infrastructure for LDV that would deliver on the minimum infrastructure requirements for 2030. Following the stakeholder opinions the impact assessment analysed if such policy measures alone would indeed be sufficient to ensure sufficient infrastructure deployment to meet the demands of the vehicle fleet expected under the Climate Target Plan objectives in all Member States. Two policy options (POA and POB) were analysed in accordance with the proposed measures in PO2 and PO3, both excluding fleet based targets.
POA (same distance based targets as in PO2):
·For recharging infrastructure of LDV, Member States must ensure at least 300 kw installed capacity, including at least one 150kW recharging point, every 60 km in each direction on the TEN-T core network by 2025 and 600kW installed capacity, including at least two 150kW in each direction on the TEN-T core network by 2030. In addition, Member States must ensure every 60km on the TEN-T comprehensive network 300 kW installed capacity, including at least one 150kW, by 2030 and 600kW installed capacity, including at least two 150kW recharging points, by 2035.
POB (same distance based targets as in PO2 plus location based as in PO3)
·As regards a mandate for deployment of recharging points for LDV by 2025, every petrol station with 12 or more pumps must be equipped with at least one recharging point with a minimum capacity of 150kW and
·By 2030, every petrol station with 8 or more pumps must be equipped with at least one recharging point with a minimum capacity of 150kW
Using the same methodology as for the assessment of the policy options 1 – 3, the impact assessment concluded that neither individually nor combined, those two policy options would ensure sufficient recharging infrastructure for LDV in all Member States.
In fact, POA would increase the overall number of recharging points in the EU by around 6,800 recharging points compared to the baseline in 2030 while POB would lead to an increase by around 57,600 throughout the EU. However, this would not sufficiently change the overall deployment of recharging points, leaving 15 Member States short in providing sufficient infrastructure to support the required vehicle fleet under the 2030 Climate Target Plan objective. In 2030, those 15 Member States (BG, CZ, EL, IE, IT, LV, LT, PL, PT, SK, ES, RO, CY, MT, HR) would be short of a combined total of over 700,000 recharging points.
These two policy options would ensure full cross border connectivity but they would not provide sufficient recharging infrastructure to support the national electric vehicle fleets required to meet the objectives of the 2030 Climate Target Plan. The lack of infrastructure would thereby act as a barrier to the uptake of vehicles in 15 Member States not allowing for the required emission reductions. The two policy options have been discarded as they are not coherent with the Climate Target Plan ambition.
6.What are the impacts of the policy options?
This section summarizes the main expected economic, social and environmental impacts of each PO across all transport modes. In terms of time horizon, the assessment has been undertaken for the 2025-2050 period (in five-year steps). The measures that are part of the POs are assumed to be implemented from 2025 onwards, with a particular emphasis on understanding impacts for 2030, but going beyond. The analysis presented in this section covers the EU27 scope. Costs and benefits are expressed as present value using a 4% discount rate.
The impacts of the policy options, focusing on the design of the policy instrument, are assessed in the context of a policy environment achieving the overall 55% emission reduction objective by 2030. This policy context is mainly represented by the MIX policy scenario that follows a combined approach of carbon pricing instruments and regulatory-based measures, and is also consistent with option TL_Med of the impact assessment accompanying the revision of the emission performance standards for new passenger cars and for new light commercial vehicles which provides the vehicle fleet relevant for the design of the policy options. Detailed information on the methodological approach and on the MIX policy scenario can be found in Annex 4.
In view of the need to ensure consistency with other policy initiatives under the Fit for 55 package, this impact assessment has carried out an assessment of cost of infrastructure under the preferred policy option for all options assessing the different target levels in the impact assessment accompanying the revision of the emission performance standards for new passenger cars and for new light commercial vehicle, (including TL_Low and TL_High, in addition to TL_Med). This analysis is presented in section 7.6.
6.1.Economic impacts
Both quantitative and qualitative assessments of economic impacts have been undertaken for each policy option. In general, quantification of impacts using the PRIMES-TREMOVE model by E3Modelling has mainly focused on the measures covering problem area 1 (in particular road transport), and the measures related to other problem areas (2-3) have mainly relied on input from stakeholders and desk research.
6.1.1.Impact on alternative fuels vehicles and infrastructure markets
In general, investments in quantity and quality of infrastructure will not directly lead to the uptake of alternatively fuelled vehicles which are determined by other policies, e.g. the CO2 emission performance standards. However, only if sufficient, interoperable infrastructure is available that provides minimum services to consumers, it can be expected that the vehicles as considered necessary to achieve the EU’s Climate Target Plan objective will make it into the market.
Measures setting targets for road transport
The measures introducing targets for road transport aim at ensuring that sufficient infrastructure is deployed in all Member States so a lack of infrastructure does not form a barrier for the expected vehicle fleet. The structure of the vehicle fleet, which is the same under all policy options, is driven by the new policy initiatives under the “Fit for 55” package, in particular the revision of the CO2 emission performance standards for cars and vans (i.e. option TL_Med).
In the policy options, the number of battery electric vehicles (BEV) is projected to increase at a much higher speed than in the baseline and is projected to be more than twice the numbers in the baseline by 2050. By 2030, close to 37 million BEVs would be registered in PO1/PO2/PO3 relative to 30 million in the baseline. This gap is projected to widen significantly post-2030, with 140 million BEVs in 2040 and 235 million in 2050 in PO1/PO2/PO3 relative to 67 million in 2040 and 97 million in 2050 under the baseline. In contrast, PHEV will develop similarly under the policy options and the baseline until 2040 but will only play a limited role in 2050 with 15 million vehicles in PO1/PO2/PO3 compared to 54 million in the baseline.
Similar to electric LDVs, the uptake of electric HDVs is projected to be much higher in the policy options relative to the baseline by 2030 (around 110,000 in PO1/PO2/PO3 vs 50,000 in the baseline). This gap will further widen in 2040 and 2050 when 1 million and 2.4 million vehicles, respectively, are expected under the policy options (i.e. around 10 times more electric HDV by 2050 than under the baseline).
A similar development pattern is projected for fuel cell vehicles, albeit with considerably lower overall numbers than for electric LDV and higher uptake in particular expected post 2040. Relatively similar number of light duty fuel cell vehicles are projected by 2030 in the policy options and the baseline (around 306,000 vehicles in the baseline and 416,000 in the policy options). By 2040, in PO1/PO2/PO3 the number of fuel cell LDVs is projected at 12.8 million relative to 3.9 million in the baseline, while by 2050 the gap is projected to widen even further (38.7 million in the policy options versus 10.3 million in the baseline). Fuel cell HDVs are projected to play a more limited role by 2030 in the baseline and under the policy options. Post-2030 their uptake is however projected to significantly go up: to around 549,000 in the policy options compared to 63,000 in the baseline for 2040 and 1.9 million in PO1/PO2/PO3 by 2050, which is in stark contrast to the baseline where only around 102,000 vehicles are projected.
The overall numbers of LNG and CNG vehicles are projected to go up by 2030 relative to 2020, but to be lower than in the baseline for 2030. The stock of CNG vehicles is projected to reduce significantly post-2030 in the policy options and be less than half a million by 2050. CNG vehicles are expected to be strongly concentrated in only a few Member States. Almost 70% of all CNG LDVs are projected to be registered in Italy by 2030, representing however less than 6% of the fleet, and only in two other Member States (BG, SE) are CNG LDVs expected to represent more than 2% of the fleet. LNG trucks in PO1/PO2/PO3 are projected to grow at a somewhat lower rate than in the baseline and reach around 510,000 vehicles in 2030 and 1.1 million in 2040. They are expected to be gradually replaced by zero emission technologies post 2040.
Table 4: Uptake of vehicles in the baseline and in the policy options (in thousands)
|
Number of vehicles (in thousands)
|
Baseline
|
PO1 / PO2 / PO3
|
|
|
2030
|
2040
|
2050
|
2030
|
2040
|
2050
|
|
Electric BEV LDV
|
29,941
|
67,420
|
97,033
|
36,851
|
140,261
|
235,076
|
|
Electric PHEV LDV
|
13,987
|
41,007
|
54,157
|
14,343
|
40,950
|
14,897
|
|
Electric HDV
|
50
|
161
|
231
|
110
|
1,022
|
2,405
|
|
Fuel Cell Electric LDV
|
306
|
3,906
|
10,301
|
416
|
12,824
|
38,727
|
|
Fuel Cell Electric HDV
|
3
|
63
|
102
|
60
|
549
|
1,877
|
|
CNG LDV
|
4,376
|
6,265
|
6,580
|
3,954
|
3,237
|
431
|
|
LNG
|
621
|
1,246
|
1,536
|
510
|
1,082
|
918
|
Source: Ricardo et al (2021), impact assessment support study, PRIMES-TREMOVE model results (E3Modelling)
What concerns electric recharging points, the assessment of national policy planning (on the basis of the implementation reports for AFID) under the baseline shows that 18 Member States (BG, CZ, EL, FI, FR, HU, IE, IT, LV, LT, PL, PT, SK, ES, RO, CY, MT, HR) will not provide sufficient recharging infrastructure by 2030 to accommodate the anticipated number of electric vehicles that meet the 2030 increase in climate ambition. In total, there would be 2.3 million public accessible recharging points under the baseline. They will just be somewhat sufficient to accommodate the vehicle fleet under the baseline. Only 9 Member States are planning for sufficient infrastructure to accommodate the higher fleets under PO1. This gap is expected to increase even further towards 2040 and 2050 when the uptake of electric vehicles takes further pace while infrastructure is not catching up. Around 4.2 million public accessible recharges are projected in the baseline by 2040 and 6.9 million by 2050.
All POs set mandatory targets for Member States to ensure that the infrastructure is sufficient in relation to the LDV fleet. The analysis shows that overall infrastructure for electric LDV develops in all Member States by 2030 and beyond, in line with electric vehicle fleet. Based on the sufficiency index of determined as an average capacity of a recharging point for a battery electric vehicle of 1 kW and for a plug in hybrid of 0.66 kW, the POs result in a total installed capacity of 47-58 GW for 2030 at EU level (47 GW in PO1, 49 GW in PO2 and 58 GW in PO3) relative to 29 GW in the baseline. Expressed in terms of equivalent number of recharging points, while assuming an increase in the average capacity of recharging points for the LDV fleet from currently 11 kW to 14-16 kW by 2030 because of the deployment of more fast recharging points compared to 2020 (14 kW in PO1/PO2 and 16 kW in PO3 - because of the additional high power recharging points in petrol stations under PO3), POs show 3.50 to 3.57 million recharging points in the EU in 2030 compared to the baseline of 2.3 million. However, assuming that the share of fast recharging points stays constant as in 2020, the POs show a total number of recharging points of over 4 million (or over 6 million recharging points under the assumption that only normal recharging points of an average of 7.4 kW were deployed). The analysis assuming that the share of fast recharging points stays constant as in 2020 is provided in section 7.7.
Under PO1, recharging infrastructure for LDV risks, however, not to ensure an even distribution along the TEN-T network. Especially in Member States that currently plan for limited infrastructure deployment, there is a risk that the planning is not fully sufficient with respect to the deployment along the TEN-T corridors in terms of distance between recharging stations and the total power provided. For PO2 and PO3, 11,363 charging points for LDVs are estimated to be deployed on the TEN-T network (including urban nodes) by 2030 and 12,112 by 2040.
All POs lead to approx. 11.4 million recharging points in 2040 and 16.3 million by 2050, providing sufficient recharging infrastructure for the expected fleet uptake until 2050.
Table 5: Projected deployment of recharging points for LDVs in the baseline and in the policy options in 2030 (difference to the Baseline) by Member State
|
Number of recharging points for LDVs in 2030
|
Baseline
|
Difference to the Baseline
|
|
|
|
PO1
|
PO2
|
PO3
|
|
AT
|
94,500
|
0
|
273
|
1,776
|
|
BE
|
89,729
|
0
|
228
|
1,928
|
|
BG
|
5,000
|
23,901
|
24,200
|
26,730
|
|
CZ
|
16,900
|
48,513
|
48,721
|
50,925
|
|
DK
|
29,437
|
0
|
198
|
1,325
|
|
EE
|
5,666
|
0
|
92
|
363
|
|
FI
|
25,000
|
7,365
|
7,721
|
8,760
|
|
FR
|
449,981
|
56,770
|
58,302
|
64,458
|
|
DE
|
1,000,000
|
0
|
1,363
|
9,310
|
|
EL
|
10,000
|
50,261
|
50,706
|
54,250
|
|
HU
|
35,000
|
9,385
|
9,637
|
10,736
|
|
IE
|
1,200
|
37,784
|
37,932
|
38,921
|
|
IT
|
62,261
|
398,103
|
399,135
|
411,070
|
|
LV
|
466
|
3,285
|
3,511
|
3,844
|
|
LT
|
4,550
|
14,280
|
14,395
|
14,790
|
|
LU
|
10,320
|
0
|
14
|
144
|
|
NL
|
182,000
|
0
|
203
|
2,483
|
|
PL
|
13,622
|
234,851
|
235,640
|
239,835
|
|
PT
|
43,141
|
14,512
|
14,778
|
16,541
|
|
SK
|
3,000
|
13,416
|
13,574
|
14,108
|
|
SI
|
22,300
|
0
|
108
|
412
|
|
ES
|
123,099
|
203,953
|
205,491
|
211,873
|
|
SE
|
70,705
|
0
|
738
|
2,273
|
|
RO
|
5,541
|
57,902
|
58,411
|
59,649
|
|
CY
|
100
|
8,664
|
8,705
|
8,875
|
|
MT
|
362
|
3,480
|
3,485
|
3,523
|
|
HR
|
671
|
9,712
|
9,940
|
10,127
|
|
EU27
|
2,304,552
|
1,196,138
|
1,207,501
|
1,269,027
|
Source: Ricardo et al (2021), impact assessment support study
The policy options will lead to a considerable increase in infrastructure for electric HDVs in the EU by 2030 with over 6,100 charging points in PO1, 6,500 under PO2 and more than 7,600 under PO3 relative to the baseline, under which less than 100 recharging points are deployed. By 2050, the number of recharging points would go up to around 13,000 in PO1 and PO2 and more than 14,000 in PO3. All options provide sufficient infrastructure on the TEN-T network for the expected vehicle uptake, with additional targets in PO2 (urban nodes for delivery trucks) and PO3 (fast recharging points in all petrol stations along TEN-T) adding extra convenience for the users.
For hydrogen infrastructure the baseline includes some very ambitious Member State plans. For example Germany alone plans for 1,000 stations by 2030. However, many Member States currently do not plan sufficient investments in hydrogen refuelling infrastructure that would allow for the development of a coherent network across the EU. In all Member States all policy options will provide a similar and sufficient number of refuelling stations. However, the total capacity of those stations will be about twice as high in PO2 and PO3, which will add considerable convenience for the user. In addition, PO3 ensures that the infrastructure required for the vehicle numbers in 2030 is already available in 2025 to provide more investment security for the sector.
What concerns gaseous fuels, CNG vehicles are a mature technology and the deployment of CNG refuelling stations largely market driven. The same can be expected for LNG HDV, once a minimum infrastructure along the TEN-T core network is being established and thereby investment security is provided. Such investments into the TEN-T core network have already been triggered through the Directive and Member States planning suggests that sufficient infrastructure will be available in almost all Member States already in the baseline, building on the requirement under the current AFID. For LNG the mandatory target included in PO2 and PO3 would only ensure filling the remaining gaps in the TEN-T core network by 2030, relative to PO1 (where such requirement is not included), and thus ensuring full certainty about cross-border connectivity for those operators using this transitional technology. However, relative to the baseline all options show lower number of LNG refuelling stations due to the lower uptake of LNG HDVs.
For CNG the mandatory deployment targets under PO3 would only increase the total numbers minimally in 2030, relative to PO1 and PO2, by filling in remaining gaps in the TEN-T core network. However, the number of refuelling stations in 2030 would be lower in all policy options relative to the baseline, due to the lower uptake of CNG LDVs. It is also worthwhile noting that because of the expected rapid decline of the number of CNG vehicles post 2035, the required number of refuelling stations will go down to around 600 stations by 2050 which is well below the existing numbers of over 3,000 stations. Equally for LNG, the numbers will go down to around 2,900 refuelling stations by 2050 following the slow replacement of LNG vehicles by zero-emission technologies post 2040.
Table 6: Expected AFI deployment in the baseline and in the policy options for 2030-2050 (number of recharging points/facilities)
|
Infrastructure at EU27 level
|
Baseline
|
PO1
|
|
|
2030
|
2040
|
2050
|
2030
|
2040
|
2050
|
|
LDVs recharging points
|
2,304,552
|
4,228,772
|
6,905,744
|
3,500,690
|
11,398,548
|
16,259,467
|
|
HDVs charging points
|
58
|
526
|
636
|
6,173
|
10,340
|
12,694
|
|
Hydrogen fuelling facilities
|
1,371
|
3,004
|
4,603
|
1,852
|
8,222
|
20,153
|
|
CNG fuelling facilities
|
8,299
|
9,042
|
8,760
|
7,642
|
4,741
|
587
|
|
LNG fuelling facilities
|
3,527
|
4,505
|
4,850
|
2,904
|
3,914
|
2,896
|
|
Infrastructure at EU27 level
|
PO2
|
PO3
|
|
|
2030
|
2040
|
2050
|
2030
|
2040
|
2050
|
|
LDVs recharging points
|
3,512,053
|
11,410,660
|
16,268,705
|
3,573,579
|
11,472,221
|
16,330,266
|
|
HDVs charging points
|
6,493
|
10,660
|
13,014
|
7,612
|
11,779
|
14,134
|
|
Hydrogen fuelling facilities
|
1,993
|
8,341
|
20,154
|
1,990
|
8,337
|
20,104
|
|
CNG fuelling facilities
|
7,642
|
4,741
|
587
|
7,645
|
4,741
|
587
|
|
LNG fuelling facilities
|
2,904
|
3,914
|
2,896
|
2,904
|
3,914
|
2,896
|
Source: Ricardo et al (2021), impact assessment support study
All policy options are considered to provide sufficient infrastructure for the required vehicle fleet in 2030 and beyond hence ensuring that infrastructure is not a barrier for the uptake of vehicles.
Measures setting targets for AFI for waterborne transport
In the case of LNG bunkering facilities in TEN-T core maritime ports, that can also be used for decarbonised gases (i.e. bio-LNG and renewable low-carbon e-gas) to fully support the EGD objectives, the new measure is anticipated to contribute to the deployment of new infrastructure although the available evidence suggests that a significant level of deployment is expected to take place already under the baseline.
Article 6 (1) of the current Directive already required Member States to ensure that an appropriate number of refuelling points for LNG were put in place at maritime ports in the TEN-T Core Network by 2025. In the baseline scenario, 71 core TEN-T ports would have such facilities in place by 2030. The new measure under PO3 on LNG bunkering for maritime ports is anticipated to lead to the deployment of 19 additional facilities such that all 90 core TEN-T ports would be covered by 2030. It is also worth noting that, of the 22 Member States that have core TEN-T maritime ports, half are already planning to deploy LNG bunkering infrastructure in their core ports (i.e. as part of the baseline scenario); the other 11
would need to deploy infrastructure in one to three core ports each to meet the new target.
Table 7: Expected AFI deployment in 2030 by PO and in the Baseline regarding LNG bunkering for maritime ports (number of facilities)
|
Type of AFI
|
Baseline
|
PO1
|
PO2
|
PO3
|
|
|
|
Total
|
Net
|
Total
|
Net
|
Total
|
Net
|
|
Total LNG bunkering facilities in TEN-T core maritime ports
|
71
|
-
|
-
|
-
|
-
|
90
|
19
|
Source: Ricardo et al (2021), impact assessment support study
The removal of the provision for LNG bunkering in inland ports in PO3 could stop further deployment of this infrastructure for inland ports. Article 6 (2) requires Member States to ensure that an appropriate number of refuelling points for LNG are put in place at inland ports in the TEN-T core network by 2030. In the baseline scenario, 36 core ports are expected to offer LNG bunkering out of the 85 inland TEN-T core ports in the EU. By removing this provision, it is possible that some of this deployment would not take place. However, the question is also whether there is a need for such infrastructure given the expected limited use of LNG for inland navigation in the future and the availability of other solutions to achieve the environmental goals. Stakeholders that participated in the consultation for the impact assessment support study were also asked about a revision of this provision. Many respondents, including ports representatives, argued that there was no need for specific targets because LNG is not economically viable for inland navigation. As a result, the deployment of this type of infrastructure might no longer take place in the future.
For OPS infrastructure in maritime ports, the total installed capacity has been increasing since the 2000s and is now around 90MW across the EU. This trend is expected to continue in the baseline scenario, to reach 174 MW by 2030. However, it will fall short from providing the necessary capacity for servicing the containerships, passenger ships and Ro-Pax vessels that are to be equipped with OPS by 2030, in line with the FuelEU maritime initiative proposal. The total installed capacity is expected to grow significantly compared to the baseline if the new measures are adopted, especially under PO3 which covers all EU ports that meet the minimum requirements. The FuelEU initiative works in tandem to this initiative by mandating the use of OPS by the three types of vessels, thus providing the demand and increasing the business case for ports to install this technology.
Table 8: Expected AFI deployment in 2030 by PO and in the Baseline regarding OPS in maritime ports
|
Type of AFI
|
Baseline
|
PO1
|
PO2
|
PO3
|
|
|
|
Total
|
Net
|
Total
|
Net
|
Total
|
Net
|
|
Total OPS installed capacity in maritime ports (MW)
|
174
|
856
|
682
|
3,676
|
3,502
|
4,239
|
4,065
|
Source: Ricardo et al (2021), impact assessment support study
For OPS infrastructure in inland ports, up to 139 OPS facilities could be deployed in the baseline by 2030. The new measures could contribute to 18-106 additional ports in the EU having OPS depending on the policy option (values represent the upper bound of each option).
Table 9: Expected AFI deployment in 2030 by PO and in the Baseline regarding OPS in inland ports
|
Type of AFI
|
Baseline
|
PO1
|
PO2
|
PO3
|
|
|
|
Total
|
Net
|
Total
|
Net
|
Total
|
Net
|
|
Number of inland ports with OPS
|
139
|
157
|
18
|
245
|
106
|
245
|
106
|
|
TEN-T core
|
67
|
85
|
18
|
85
|
18
|
85
|
18
|
|
TEN-T comprehensive
|
72
|
72
|
-
|
160
|
88
|
160
|
88
|
Source: Ricardo et al (2021), impact assessment support study
Measures setting targets for aviation
Overall, mandatory targets for stationary aircrafts are expected to have a limited effect on the availability of infrastructure for electricity supply for stationary aircraft above what is expected under the baseline. As required by the 8th indent of Article 3(1) of the Directive, 23 Member States have considered the need to install an electricity supply for use by stationary airplanes - among those Member States
,
, AT, DK, EE and LT stated that electricity supply is already in place in a sufficient number of airports but without proving details on the installations. Other Member States have indicated deployment of electricity supply in major airports, although in most cases it is difficult to identify whether this is sufficient to support all aircraft. Moreover, three Member States (SI, SK, NL) have set targets in their NPFs to install this type of infrastructure.
A large number of airports already provide this type of infrastructure: 82% of respondents to an ACI EUROPE members survey already provide FEGP (fixed electrical ground power). Furthermore, 46% of them have 81-100% of their stands equipped with FEGP. As a result, the measure is considered to not lead to significant increase in FEGP stations at major airports, but it might be more relevant for medium-sized airports.
Because of the lack of accurate data, it is assumed that the average number of outfield positions across all airports is approximately twice the number of passenger gates. Under these assumptions, the impact under PO2 and PO3 are expected to be significantly greater than under PO1 as these measures support all gates and outfield positions in the EU with FEGP. At the same time, given the high baseline deployment, the total number of FEGP units is expected to grow by around 48%. No impacts on the uptake of aircraft are expected from this measure.
Table 10: Expected AFI deployment in 2030 by PO and in the Baseline regarding electricity supply in airports
|
FEGP deployment
|
Baseline
|
PO1
|
PO2/PO3
|
|
|
|
Total
|
Net
|
Total
|
Net
|
|
Passenger Gates
|
3,832
|
4,910
|
1,078
|
4,910
|
1,078
|
|
Outfield positions
|
6,141
|
6,141
|
0
|
9,819
|
3,678
|
|
Total
|
9,973
|
11,051
|
1,078
|
14,729
|
4,756
|
Source: Ricardo et al (2021), impact assessment support study
Measures to promote interoperability and user information of AFI
Measures focusing on promoting interoperability include requirements for ad-hoc payments, the freedom for consumers to choose payment methods, technical specifications for recharging points, physical and communication standards and improved user information. All above measures are expected to positively impact customer experience through improved convenience and reliability of recharging services. While the impact of each of the measures separately may be relatively small, combined, they could be expected to have a higher positive impact, making the entire experience of using an AFV and AFI easier and enabling a higher level of uptake of AFVs. Standards in physical and communication interfaces increase the investment security of AFI investments and the development of such European standards will therefore contribute to the deployment of AFI in all modes.
6.1.2.Administrative burden for public authorities
The costs to public authorities arise mostly from the requirements for Member States to review and update their national policy frameworks (NPFs) and subsequently report on the implementation. In the baseline, based on Member States estimates on costs for developing the NPFs under the current directive, those costs are estimated to be €3,400,000 (€126,000 per Member State) for each reporting circle with the main costs being personnel costs for drafting and publication of the document. In PO1 and PO2 the reporting cycle is kept unchanged relative to the baseline. Therefore, no additional costs are expected in PO1 and PO2 relative to the baseline. However, the reporting cycle is shortened from three to two years for PO3, which will slightly increase the overall costs. In addition, monitoring costs may increase for public authorities to report on compliance with the strict targets set under the different policy options. However, the additional costs relative to the baseline can’t be quantified; and the provision of standardised data formats, digitised data transfer and a common system of reporting to national access points of Member States will simplify overall reporting under the Directive.
6.1.3.Infrastructure costs
Road transport
Based on the expected deployment of the infrastructure as described in chapter 6.1.1, and using the cost estimates as described in annex 4, total average annual investments for road transport infrastructure for the period up to 2030 for the private sector and public authorites would be between €0.80 and 1.55 billion in the different policy options in addition to the baseline. The lowest additional annual average investments relative to the baseline are estimated for PO1 (€0.80 billion) and the highest in PO3 (€1.55 billion), with PO2 falling in between the two at €1.07 billion. For 2031-2050 the average annual investments will increase to €4.41 to 4.58 billion in the different policy options in addition to the baseline.
Table 11: Average annual investments for private operators and public authorities for 2021-2030 and 2031-2050 in the baseline and in the policy options (expressed as difference to the baseline)
|
Average annual investments (€ billion)
|
Baseline
|
PO1
|
PO2
|
PO3
|
|
|
'21-'30
|
'31-'50
|
'21-'30
|
'31-'50
|
'21-'30
|
'31-'50
|
'21-'30
|
'31-'50
|
|
LDVs recharging points
|
0.69
|
1.38
|
0.53
|
1.83
|
0.60
|
1.87
|
1.01
|
2.02
|
|
HDVs charging points
|
0.00
|
0.02
|
0.13
|
0.17
|
0.14
|
0.17
|
0.15
|
0.17
|
|
Hydrogen fuelling facilities
|
0.27
|
0.53
|
0.23
|
2.55
|
0.43
|
2.46
|
0.47
|
2.48
|
|
CNG fuelling facilities
|
0.21
|
0.11
|
-0.03
|
-0.07
|
-0.03
|
-0.07
|
-0.03
|
-0.07
|
|
LNG fuelling facilities
|
0.31
|
0.10
|
-0.06
|
-0.02
|
-0.06
|
-0.02
|
-0.06
|
-0.02
|
|
Total
|
1.49
|
2.15
|
0.80
|
4.45
|
1.07
|
4.41
|
1.55
|
4.58
|
Source: Ricardo et al (2021), impact assessment support study
Average annual maintenance costs for private operators are estimated at €0.05 to 0.16 billion in addition to the baseline for the period up to 2030 and €1.12 to 1.21 billion compared to the baseline for 2031-2050. Maintenance costs are attributed only to the private sector.
Table 12: Average annual operation costs for private operators for 2021-2030 and 2031-2050 in the baseline and in the policy options (expressed as difference to the baseline)
|
Average annual operation costs (€ billion)
|
Baseline
|
PO1
|
PO2
|
PO3
|
|
|
'21-'30
|
'31-'50
|
'21-'30
|
'31-'50
|
'21-'30
|
'31-'50
|
'21-'30
|
'31-'50
|
|
LDVs recharging points
|
0.05
|
0.24
|
0.02
|
0.30
|
0.03
|
0.31
|
0.05
|
0.35
|
|
HDVs charging points
|
0.00
|
0.00
|
0.01
|
0.03
|
0.01
|
0.03
|
0.01
|
0.03
|
|
Hydrogen fuelling facilities
|
0.04
|
0.32
|
0.03
|
0.91
|
0.05
|
0.95
|
0.12
|
0.95
|
|
CNG fuelling facilities
|
0.12
|
0.17
|
-0.01
|
-0.09
|
-0.01
|
-0.09
|
-0.01
|
-0.09
|
|
LNG fuelling facilities
|
0.05
|
0.18
|
-0.01
|
-0.04
|
-0.01
|
-0.04
|
-0.01
|
-0.04
|
|
Total
|
0.26
|
0.91
|
0.05
|
1.12
|
0.07
|
1.17
|
0.16
|
1.21
|
Source: Ricardo et al (2021), impact assessment support study
The total additional costs relative to the baseline for the private and public sector for the period 2025 – 2050, expressed as present value over 2021-2050, are estimated between €49.9 billion in PO1 and 58.9 billion in PO3, with PO2 falling in between (€53.3 billion). However, as explained in section 6.1.1, for PO1 especially in Member States that currently plan for limited infrastructure deployment, there is a risk that the planning is equally insufficient with respect to the deployment along the TEN-T corridors in terms of distance between recharging stations and the total power provided for LDVs.
Table 13: Total capital and operation costs for private operators and public authorites in the baseline and in the policy options (difference to the baseline), expressed as present value over 2021-2050
|
Total costs in the baseline and POs (difference to the baseline), expressed as PV (€ billion)
|
Baseline
|
PO1
|
|
|
CAPEX
|
OPEX
|
Total
|
CAPEX
|
OPEX
|
Total
|
|
LDVs recharging points
|
16.2
|
2.4
|
18.6
|
21.7
|
2.7
|
24.4
|
|
HDVs charging points
|
0.2
|
0.0
|
0.2
|
2.5
|
0.3
|
2.9
|
|
Hydrogen fuelling facilities
|
7.9
|
2.6
|
10.6
|
19.4
|
5.8
|
25.2
|
|
CNG fuelling facilities
|
4.5
|
2.5
|
7.0
|
-0.8
|
-0.7
|
-1.6
|
|
LNG fuelling facilities
|
4.1
|
2.0
|
6.1
|
-0.6
|
-0.4
|
-1.0
|
|
Total
|
33.0
|
9.5
|
42.5
|
42.2
|
7.7
|
49.9
|
|
Total costs in the baseline and POs (difference to the baseline), expressed as PV (€ billion)
|
PO2
|
PO3
|
|
|
CAPEX
|
OPEX
|
Total
|
CAPEX
|
OPEX
|
Total
|
|
LDVs recharging points
|
22.5
|
2.8
|
25.3
|
27.0
|
3.3
|
30.3
|
|
HDVs charging points
|
2.5
|
0.3
|
2.9
|
2.7
|
0.3
|
3.1
|
|
Hydrogen fuelling facilities
|
21.3
|
6.3
|
27.7
|
21.2
|
6.9
|
28.0
|
|
CNG fuelling facilities
|
-0.8
|
-0.7
|
-1.6
|
-0.8
|
-0.7
|
-1.6
|
|
LNG fuelling facilities
|
-0.6
|
-0.4
|
-1.0
|
-0.6
|
-0.4
|
-1.0
|
|
Total
|
44.9
|
8.3
|
53.3
|
49.4
|
9.4
|
58.9
|
Source: Ricardo et al (2021), impact assessment support study; Note: Assumed economic lifetime of investments is 10 years for electricity recharging infrastructure and 15 years for hydrogen, CNG and LNG fuelling facilities; annualised capital costs are derived assuming a weighted average costs of capital of 8%. For calculating the present value, a discount rate of 4% is assumed.
Around 46-48% of the total costs in the policy options over 2025-2050 (expressed as present value over 2021-2050) are estimated to be dedicated to electric recharging infrastructure for LDVs in POs, 3% for recharging points for HDVs, 38-40% for hydrogen refuelling points, 5-6% for LNG and 5-6% for CNG refuelling infrastructure. However, when looking at the additional costs relative to the baseline, the costs of CNG and LNG fuelling facilities would decrease relative to the baseline due to the lower uptake of the CNG and LNG vehicles.
The costs per recharging point and per refuelling station are expected to decrease over time due to economies of scale. Annex 4 provides the evolution of the capital costs per recharging point and refuelling station for 2020-2050, in five years steps. On one hand, the unit capital costs per type of recharging and refuelling station would decline over time, driven by the larger uptake of zero emission vehicles and the induced learning effects, also on the infrastructure side. On the other hand, the change in the structure of recharging points (i.e. the increase in the average capacity due to the larger share of fast chargers) and the higher capacity per refuelling station in the policy options pushes the costs up. In addition, the larger uptake of zero emission vehicles in the policy options is incentivised by more stringent CO2 standards for vehicles. As the number of zero emission vehicles increases relative to the baseline, so does the total number of recharging points and refuelling stations. Total costs therefore increase in the policy options relative to the baseline, due to the changes in the structure of recharging points and in the capacity per refuelling station as well as due to the higher number of zero emission vehicles.
Costs for authorities
Meeting the AFI targets set in the policy options will require a significant level of public support and contribution to the totat investment cost presented in the section above. This is expected to be needed for as long as the level of demand from vehicles remain at comparatively low levels and will not allow for the commercial viability of investments. However, with increasing vehicle fleets also the level of support is expected to go down to a point where public support will only be needed for infrastructure in remote locations with little demand. This is reflected in the assumptions that up to 50% public financing will be required for hydrogen and recharging stations with the remaining financing expected to come from the private sector. The share of public financing will however go down to 10% on average post 2030. For natural gas only little financing is required until 2030 while no support is expected to be required post 2030. No public support is required to cover operation costs as those costs are full covered by the operators of the recharging and refuelling infrastructure. The assumptions about the share of public support up to 2030 draw on information about the existing national and EU level support schemes.
Table 14: Estimated public support for road recharging and refuelling infrastructure, expressed as share of investments
|
Type of AFI
|
Up to 2030
|
After 2030
|
|
Slow/normal charging points for LDVs
|
40%
|
10%
|
|
Fast/Ultra-fast charging points for LDVs on the TEN-T network
|
40%
|
10%
|
|
Charging points for HDVs
|
50%
|
10%
|
|
Hydrogen fuelling stations
|
50%
|
10%
|
|
CNG fuelling stations
|
10%
|
No funding
|
|
LNG fuelling stations
|
10%
|
No funding
|
Source: Ricardo et al (2021), impact assessment support study. The estimations are based on public financing under existing national and EU level support schemes. A detailed analysis is provided in the support study.
Under the assumptions in
Table 14
, and drawing on the total average annual investments in
Table 11
, public support in comparison to the baseline is estimated at €0.39 to 0.71 billion on average per year up to 2030 and €0.45 to 0.47 billion on average per year for 2031-2050 (see
Table 15
). The rest of investments in Table 11, more specifically €0.42 to 0.84 billion on average per year up to 2030 and €3.96 to 4.11 billion on average per year for 2031-2050 would come from the private sector.
Table 15: Average annual investments by public authorities for 2021-2030 and 2031-2050 in the baseline and in the policy options (expressed as difference to the baseline)
|
Average annual investments (€ billion)
|
Baseline
|
PO1
|
PO2
|
PO3
|
|
|
'21-'30
|
'31-'50
|
'21-'30
|
'31-'50
|
'21-'30
|
'31-'50
|
'21-'30
|
'31-'50
|
|
LDVs recharging points
|
0.28
|
0.14
|
0.21
|
0.18
|
0.24
|
0.19
|
0.40
|
0.20
|
|
HDVs charging points
|
0.00
|
0.00
|
0.07
|
0.02
|
0.07
|
0.02
|
0.08
|
0.02
|
|
Hydrogen fuelling facilities
|
0.13
|
0.05
|
0.11
|
0.25
|
0.22
|
0.25
|
0.24
|
0.25
|
|
CNG fuelling facilities
|
0.02
|
0.00
|
0.00
|
0.00
|
0.00
|
0.00
|
0.00
|
0.00
|
|
LNG fuelling facilities
|
0.03
|
0.00
|
-0.01
|
0.00
|
-0.01
|
0.00
|
-0.01
|
0.00
|
|
Total
|
0.46
|
0.19
|
0.39
|
0.45
|
0.51
|
0.45
|
0.71
|
0.47
|
Source: Ricardo et al (2021), impact assessment support study
At Member State level, the costs for the public sector vary significantly.
Some Member States have already very ambitious plans under the baseline (e.g. Germany for recharging points and hydrogen). The increase in the average annual investments for public authorities in the policy options relative to the baseline in this case is explained by the difference in the type of recharging points and hydrogen fuelling facilities deployed. For example, for recharging stations for LDVs, the average capacity would increase from around 12 kW in the baseline to 14-16 kW in the policy options. For hydrogen fuelling facilities, the capacity would increase from around 0.4 t per station in the baseline to 1 t per station in PO1 and 2 t per station in PO2 and PO3.
Table 16
presents the average annual investments for public authorities for all policy options relative to the baseline. It also shows their share in the GDP. While higher average annual investments are expected in Germany, France, Italy, Spain and Poland, when expressed as a share of GDP they would be less than 0.02% in all Member States in PO1 and PO2 and less than 0.03% in PO3. The highest share of public investments would be required for recharging points for LDVs and hydrogen fuelling facilities.
Some Member States have already very ambitious plans under the baseline (e.g. Germany for recharging points and hydrogen). The increase in the average annual investments for public authorities in the policy options relative to the baseline in this case is explained by the difference in the type of recharging points and hydrogen fuelling facilities deployed. For example, for recharging stations for LDVs, the average capacity would increase from around 12 kW in the baseline to 14-16 kW in the policy options. For hydrogen fuelling facilities, the capacity would increase from around 0.4 t per station in the baseline to 1 t per station in PO1 and 2 t per station in PO2 and PO3.
Table 16: Average annual investments by public authorities by Member State for 2021-2030 in the policy options (expressed as difference to the baseline, in €million) and share of GDP
|
MS
|
Average annual public investments up to 2030 - difference to the Baseline (€ milion)
|
GDP at market prices 2020 (€ million)
|
% share of additional AFI investments in GDP
|
|
|
PO1
|
PO2
|
PO3
|
|
PO1
|
PO2
|
PO3
|
|
AT
|
5
|
7
|
12
|
375,562
|
0.001%
|
0.002%
|
0.003%
|
|
BE
|
4
|
7
|
12
|
449,571
|
0.001%
|
0.001%
|
0.003%
|
|
BG
|
7
|
9
|
16
|
60,643
|
0.011%
|
0.015%
|
0.027%
|
|
CZ
|
13
|
18
|
24
|
213,589
|
0.006%
|
0.008%
|
0.011%
|
|
DK
|
3
|
5
|
9
|
309,145
|
0.001%
|
0.002%
|
0.003%
|
|
EE
|
1
|
2
|
3
|
27,167
|
0.004%
|
0.008%
|
0.011%
|
|
FI
|
6
|
9
|
13
|
237,467
|
0.003%
|
0.004%
|
0.006%
|
|
FR
|
35
|
47
|
67
|
2,278,947
|
0.002%
|
0.002%
|
0.003%
|
|
DE
|
68
|
113
|
138
|
3,332,230
|
0.002%
|
0.003%
|
0.004%
|
|
EL
|
13
|
16
|
27
|
165,830
|
0.008%
|
0.010%
|
0.016%
|
|
HU
|
4
|
7
|
10
|
135,529
|
0.003%
|
0.005%
|
0.008%
|
|
IE
|
8
|
10
|
13
|
366,506
|
0.002%
|
0.003%
|
0.003%
|
|
IT
|
65
|
73
|
109
|
1,651,595
|
0.004%
|
0.004%
|
0.007%
|
|
LV
|
3
|
5
|
6
|
29,334
|
0.011%
|
0.017%
|
0.022%
|
|
LT
|
4
|
5
|
6
|
48,794
|
0.007%
|
0.010%
|
0.013%
|
|
LU
|
1
|
1
|
2
|
64,143
|
0.001%
|
0.002%
|
0.002%
|
|
NL
|
6
|
10
|
17
|
796,914
|
0.001%
|
0.001%
|
0.002%
|
|
PL
|
43
|
49
|
62
|
521,515
|
0.008%
|
0.009%
|
0.012%
|
|
PT
|
8
|
10
|
15
|
202,709
|
0.004%
|
0.005%
|
0.008%
|
|
SK
|
4
|
5
|
7
|
91,105
|
0.004%
|
0.006%
|
0.007%
|
|
SI
|
1
|
2
|
3
|
46,297
|
0.003%
|
0.005%
|
0.008%
|
|
ES
|
50
|
61
|
82
|
1,119,976
|
0.004%
|
0.005%
|
0.007%
|
|
SE
|
12
|
17
|
23
|
472,260
|
0.002%
|
0.004%
|
0.005%
|
|
RO
|
14
|
18
|
22
|
217,821
|
0.007%
|
0.008%
|
0.010%
|
|
CY
|
2
|
3
|
3
|
21000.3
|
0.009%
|
0.012%
|
0.015%
|
|
MT
|
1
|
1
|
1
|
12823.8
|
0.006%
|
0.009%
|
0.010%
|
|
HR
|
3
|
5
|
6
|
49,104
|
0.007%
|
0.010%
|
0.012%
|
|
EU27
|
385
|
514
|
709
|
13,297,247
|
0.003%
|
0.004%
|
0.005%
|
Source: Ricardo et al (2021), impact assessment support study
Measures setting targets for AFI for waterborne transport
Based on the expected infrastructure deployment described in section 6.1.1, the following costs were estimated for the different shipping targets. For LNG bunkering in maritime ports, infrastructure costs include:
·Capital costs linked to costs of installing LNG bunkering and storage tanks, acquisition of land, connection to natural gas pipeline, construction of quay for bunkering, other engineering works and licence costs.
·Operational costs linked to costs of pipeline, LNG terminal take-out fee, personnel / safety training and transhipment costs from import hub.
The nature and extent of these costs can vary significantly from port to port, given the differences in capacity requirements, existing infrastructure in ports, and type of bunkering implemented (i.e. Ship-to-Ship (STS), Pipeline-to-Ship (PTS), and Truck-to-Ship (TTS)). The key factors influencing the overall cost differences is the cost of truck, vessel and terminal, and the capacity. Furthermore, not all costs apply to each of these bunkering options. For example, construction of a quay and connection to the pipeline is only relevant for Pipeline-to-Ship. Even within each bunkering option, the costs are highly variable depending on the nature of each installation. The capital costs (CAPEX) of each bunkering method are estimated to be €0.2-100 million per port for TTS, compared to €23-73 million per port for STS and €33-237 million per port for PTS. Similarly, the operational costs (OPEX) vary between each port and bunkering method, although to a lesser degree.
The infrastructure is assumed to be deployed between 2025 and 2030. For the purposes of this impact assessment, we have assumed 3 scenarios in which all ports are equipped with the same type of bunkering method, thus representing a lower bound (in case of TTS) and an upper bound (in case of PTS). Based on the individual specificities of each port, the solution to fulfil the obligations under PO3 at EU level will likely include a combination of the bunkering methods. The total infrastructure costs are estimated to be between €1.1 and 3 billion relative to the baseline, expressed as present value over 2021-2050.
Table 17: Infrastructure costs of policy option 3 in comparison to the baseline regarding LNG installations for maritime ports, by bunkering method (EU total)
|
Infrastructure costs
|
STS
|
TTS
|
PTS
|
|
Costs required to install 19 LNG bunkers under PO3 (difference to the baseline)
|
|
CAPEX (€ billion)
|
0.912
|
0.952
|
2.565
|
|
OPEX per year (€ billion)
|
0.048
|
0.001
|
0.001
|
|
NPV 2021-2050 compared to the baseline (€ billion)
|
1.7
|
1.1
|
3
|
Source: Ricardo et al (2021), impact assessment support study; Notes: For calculating the present value, a discount rate of 4% is assumed.
The costs of OPS installations for maritime ports are also specific to each port and ship type. They are associated to different elements in an OPS installation, including a building/shelter and technical equipment (e.g. switchgear, transformers and frequency converters). Furthermore, cost increases with the power demand requirements such that installations in cruise berths, which require more power, will be more expensive than in ferry berths.
Overall, CAPEX can vary between €1 and €25 million depending on the size and complexity of the installation
. The average capital cost per MW of OPS capacity installed was estimated at €1.5 million for cruise ships, €1 million for container ships and €1.2 million, for Ro-Pax vessels. In addition, a ratio of operating and maintenance costs per installed MW per year has been used to estimate OPEX (estimated to be around €4,300 per year and per MW installed).
Overall, total OPS infrastructure costs are estimated to range between €1.2 billion and €6.5 billion relative to the baseline for the period between 2025 and 2050, expressed as present value over the 2021-2050 horizon.
Table 18: Summary of infrastructure costs of policy options in comparison to the baseline regarding OPS installations for maritime ports
|
Infrastructure costs
|
PO1
|
PO2
|
PO3
|
|
OPS capacity installed in MW (net from baseline)
|
652
|
3,502
|
4,065
|
|
CAPEX (€ billion)
|
0.975
|
4.6
|
5.3
|
|
OPEX per year (€ billion)
|
0.002
|
0.015
|
0.017
|
|
NPV 2021-2050 compared to the baseline (€ billion)
|
1.2
|
5.5
|
6.5
|
Source: Ricardo et al (2021), impact assessment support study; Notes: For calculating the present value, a discount rate of 4% is assumed.
The deployment requirements for installations of OPS at inland ports are the same as those for maritime ports. That is, OPS installations in inland ports still require the same building/shelter and technical equipment. However, inland vessels are typically much smaller than seagoing ships and therefore the power needs for each OPS installation is much less. Thus, the costs will be lower than for maritime ports. For the purposes of this impact assessment it has been assumed that power deployed in each installation is the same for all ports. Specifically, each installation comprises 12 CEE 400V sockets and 4 Powerlock 400V sockets, which are suitable for cargo vessels and river cruise vessels, respectively. Thus, the CAPEX and OPEX is assumed to be the same for each OPS installation across all inland ports in the EU.
The CAPEX for each installation was taken from the infrastructure costs of OPS deployment in Basel and is equal to €2.5 million, while the OPEX costs have been derived using the same method as for maritime ports, based on the operation costs reported by five EU ports
. Overall, total infrastructure costs are estimated to range between €65 million and €412 million relative to the baseline, expressed as present value over 2021-2050. Infrastructure is assumed to be deployed between 2022 and 2025 in the case of PO1, and between 2022 and 2030 in the case of PO2 and PO3.
Table 19: Summary of infrastructure costs of policy options in comparison to the baseline regarding OPS installations for inland ports
|
Infrastructure costs
|
PO1
|
PO2
|
PO3
|
|
Number of inland ports equipped (net from baseline)
|
18
|
106
|
106
|
|
CAPEX (€ million)
|
45
|
265
|
265
|
|
OPEX per year (€ million)
|
0.09
|
0.532
|
0.532
|
|
NPV 2021-2050 compared to the baseline (€ million)
|
65
|
357
|
412
|
Source: Ricardo et al (2021), impact assessment support study; Notes: For calculating the present value, a discount rate of 4% is assumed.
Costs for authorities
In light of the total infrastructure costs to achieve the targets, it is expected that a part of the total investment costs as presented in the previous section will be covered through public support. This is particularly relevant to help port authorities overcome the high capital costs associated with the deployment of OPS and to a lesser extend LNG bunkering. This will be needed until the market is mature enough such that the demand for these technologies/fuels ensures that the business model for deployment is viable. The public funding will comprise a combination of national policy instruments and EU level funding. According to the impact assessment support study, support is expected to amount to 20% for LNG bunkering and 25% for OPS up to 2030 while no support is expected to be required post 2030.
On the basis of the above scenario, the total public investments expected for the period 2021-2030 are provided in the table below. The average annual investments are estimated at € 25.5 million to 190.4 million relative to the baseline scenario, where a number of Member States are already expected to invest in AFI under the current plans.
Table 20: Estimated costs to authorities for shipping, by policy option compared to the baseline
|
Type of AFI
|
Unit
|
PO1
|
PO2
|
PO3
|
|
LNG for maritime
|
(€ billion)
|
-
|
-
|
0.1824-0.513
|
|
OPS for maritime
|
(€ billion)
|
0.244
|
1.150
|
1.325
|
|
OPS for inland shipping
|
(€ billion)
|
0.01125
|
0.06625
|
0.06625
|
|
Cumulative for 2021-2030
|
(€ billion)
|
0.25525
|
1.21652
|
1.57365 – 1.90425
|
|
Average annual per year for 2021-2030
|
(€ billion)
|
0.0255
|
0.1217
|
0.1574 – 0.1904
|
Source: Ricardo et al (2021), impact assessment support study
Measures setting targets for aviation
The main capital costs associated with FEGP installation are evenly split between hardware costs and adapting the power supply network in airports to ensure it extends to all stands. The size of the aircraft determines the system required and in turn the cost. It can be assumed that capital costs scale linearly with the power capacity of the system.
In the survey carried out as part of this study, an approximation of capital costs of €100,000 per stand was provided if electricity provision to the stand is already established for other purposes as well. In the case where airports do not already have electricity provision, the capital costs per stand is around €200,000. These costs are comparable to the costs reported in another study, which ranged from €102,000-300,000.
On this basis, total infrastructure costs are estimated to range between €227 million for PO1 and €949 million for PO2 and PO3. Infrastructure is assumed to be deployed between 2022 and 2025.
Table 21: Infrastructure costs of policy options in comparison to the baseline regarding electricity supply to aircraft
|
Infrastructure costs
|
PO1
|
PO2
|
PO3
|
|
CAPEX (€ million)
|
160.5
|
671.8
|
671.8
|
|
NPV 2021-2050 compared to the baseline (€ million)
|
227
|
949
|
949
|
Source: Ricardo et al (2021), impact assessment support study; Notes: For calculating the present value, a discount rate of 4% is assumed.
Costs for authorities
By introducing the mandates in the revision of the directive, the number of airports and the number of stands needed at each airport will increase. Given that large airports are already well equipped, the majority of investment costs will be directed at smaller airports. In the survey, ACI Europe underlined that smaller airports would benefit the most from additional support, especially as it is not easily implemented in many small airports because they frequently 'reconfigure' to accommodate seasonal/annual schedule/aircraft type changes. As such, public support will likely be needed to cover the investment costs of small airports, most likely from national funding. However, it is difficult to determine the proportion of costs covered in such cases, as there is no information available on this. At the same time, it can be expected that the level of public support will increase as a proportion of total costs from PO1 to PO2 and PO3 as the number of infrastructure needed increases, particularly for small airports, where support is needed.
Measures to promote interoperability and user information
Introducing interoperability requirements will lead to varying investment requirements but will also unlock some cost reductions through common technical specifications for AFI. The evaluation support study shows that the provision of relevant standards on an EU level has not introduced any unnecessary costs; on the contrary, since the Directive norms compulsory common technical specifications (while CEN/Cenelec standards are voluntary) it mitigates costs and prevents supplementary costs that otherwise would have been provoked by multiplication of systems . Common technical specifications ensure interoperability between Member States and avoid costs such as redundant infrastructure or underutilised infrastructure due to incompatibility between manufacturers. This observation has been reiterated by stakeholders in the impact assessment consultation process in view of areas where no or limited common technical specifications exist under the current AFID (including communication protocols). Here, standards such as ISO 15188 are nearing completion: whereas the final cost cannot be concretely assessed yet, there is widespread stakeholder support that a final comprehensive approach that is backed by all industry actors will bring much greater benefits than cost.
Mandatory bank card payment functionality will likely be the biggest source of costs for this problem area and will lead to added costs for complying with the requirements of the Directive for an ad hoc payment system to be available at each charging point. As a baseline, it is estimated that 25% of new slow chargers are installed with a bank card payment options (one of Chip + Pin, NFC or QR code) and 50% of new fast chargers are installed with such an option. All policy options allow CPOs to install one of three payment options for ad hoc charging on slow chargers. For the estimates, an equal split was assumed between the three payment methods. The same split was used for fast chargers under PO1. Under PO2, an equal split between Chip + PIN and NFC terminals installations was assumed for fast chargers. PO3 requires that all fast chargers include Chip + PIN terminals.
Single-use QR code displays are expected to be significantly cheaper than the card terminals since they only require a display and software integration. No estimate for the cost of including a QR code system is available. The impact assessment support study estimated €100 in investment costs and €10 annual operating costs for the analysis.
Table 22: Costs associated with ad hoc payment options
|
|
PO1/PO2/PO3
|
|
Chip + PIN terminals
|
|
One-off costs (per unit)
|
€833
|
|
Ongoing costs (per unit/year)
|
€178
|
|
NFC payment terminals
|
|
One-off costs
|
€667
|
|
Ongoing costs
|
€143
|
|
QR code displays
|
|
One-off costs (per unit)
|
€100
|
|
Ongoing costs (per unit/year)
|
€10
|
Source: Ricardo et al (2021), impact assessment support study
The costs for policy measures proposed for ensuring interoperability and improving the user experience are expected to be limited, especially in comparison to the expected benefits:
·The freedom for the consumers to choose the payment method is likely to represent a small cost derived from necessary back-office/software changes.
·Introduction of physical standards may lead to retrofit costs to adjust existing infrastructure to fit the new technical specifications. The new standards will also require investment into AFI production to fit the new requirements. However, single-standard infrastructure is cheaper to produce than multi-standard infrastructure and will unlock economies of scale and ultimately the additional costs could be almost negligible.
·Back-office/software changes will also be required with the introduction of communication standards for e-mobility. The required adoption of the OCPP standards in PO1 is likely to require less investment since it is already widely adopted. Several responses to the AFID OPC also noted that the use of open standards and protocols such as OCPP will lower costs. Investment in compliance with the OCPI standard (also for PO1) consists of a one-time cost of engineering staff time, but concrete costs are not available. PO2 and PO3 will cover a larger number of communication areas of the EV charging system and may therefore lead to additional costs for CPOs to implement all standards. However, standardisation will also allow AFV and AFI producers to streamline the development and production of the product parts and software involved in communication.
·Most of the measures above also include some work from official standardisation organisations to develop the technical specifications and standards. Therefore, the specifications are not determined as of yet and no associated cost can be estimated for their development (by both the standardisation bodies and the industry and government players participating in those efforts) and implementation (mostly for industry stakeholders).
Introducing requirements that ensure transparency and information availability will lead to some investment requirements for CPOs and EMSPs. Ensuring ad hoc price transparency as required under PO1 will not require significant investments and will be limited to IT, app and website adjustments – the same is true for contract-based price transparency in PO2 and PO3. Installation of physical display at the recharging stations, as proposed under PO2 and PO3, will lead to additional costs for installing such displays at each recharging station. While it was not possible to determine the costs of such displays, it is expected that many charge points already include such a display, and as such for those this would be a matter of software changes to display the price as per the measure.
The requirement for non-discrimination on prices charged to consumers is unlikely to require any additional investments, although it may lead to changes in business models, thus impacting revenues of AFI operators. A requirement for the provision of static and dynamic data by CPOs to Member State NAPs is unlikely to result in significant costs beyond those associated with software changes.
The most significant expenditure with regards to requirements for consumer information is related to roadside indicators on refuelling stations/charging areas along the TEN-T Core and Comprehensive networks. Cost data based on two roadside indicator suppliers’ product catalogues is used to estimate costs for the signs, posts and foundation. An installation cost of €200 per sign is assumed
. It is assumed that 50% of recharging and refuelling stations are already marked by indicators within the parking or recharging/refuelling area and will not require additional investment; for the remaining ones, it is assumed that one signpost would be needed. In addition, 25% of stations are assumed to be already marked by roadside indicators; for the remaining ones, two sign posts would be needed (one of each direction in the road).
Table 23: Costs associated with roadside indicators along TEN-T Core and Comprehensive (2030)
|
|
PO1
|
PO2
|
PO3
|
|
Recharging/refuelling area signposts
|
|
One-off costs (per unit)
|
€537
|
€537
|
€537
|
|
Number of units for EV recharging hubs
|
0
|
1,777
|
1,777
|
|
Number of units for hydrogen refuelling stations
|
0
|
355
|
355
|
|
Total costs
|
-
|
€1,144,938
|
€ 1,144,938
|
|
Roadside signposts
|
|
One-off costs (per unit)
|
€1,372
|
€1,372
|
€1,372
|
|
Number of units for EV recharging hubs
|
0
|
0
|
5,330
|
|
Number of units for hydrogen refuelling stations
|
0
|
0
|
1,066
|
|
Total costs
|
-
|
-
|
€8,775,724
|
|
Total costs
|
-
|
€1,144,938
|
€9,920,661
|
Source: Ricardo et al (2021), impact assessment support study. The number of units are based on the number of recharging/refuelling sites expected in PO2 and PO3.
6.1.4.Costs and benefits on vehicle and vessel manufacturers
For vehicle and vessel manufacturers, all POs will enable to increase the uptake of zero and low-emission vehicles, but for road only as a result of the revised CO2 emission performance standards and other legislation addressing the demand side.Sufficient provision of infrastructure ensures that vehicle manufacturers can realise increasing cost reductions because of growing vehicle fleets. Manufacturers also get new business opportunities with selling mobility services to their customers.
For the broader AFI sector, the new targets but also measures related to interoperability will increase the demand for recharging and refuelling infrastructure and supporting services and thus will bring benefits for the manufacturers of related equipment and other businesses along the value chain (i.e. suppliers of parts/components, software developers, and other support services providers). The measures will provide certainty to the AFI market and, as the measures become more demanding through the policy options, the business opportunities for AFI manufacturers will increase. Furthermore, the increase in the level of investment expected should also help reach the relevant economies of scale for the manufacturers of AFI as well as the service providers, allowing for efficiencies and cost reductions for the relevant businesses.
6.1.5.Impacts on SMEs / professional vehicle users and businesses
It was not possible to quantify these impacts. However, no area was identified in the analysis, where significant and disproportionate cost for SMEs, in comparison to all enterprises, would result from the changes under the different policy options. All policy options increase certainty of long-term market demand in all Member States, though at different degree. This will generally benefit all enterprises that are active in this market. Moreover, provisions for common data provision to the national access points of Member States will create a data basis on which enterprises can develop new market services, providing opportunities for innovative SMEs.
With increasing market ramp-up, project volumes and market competition will grow. It could become more difficult for SMEs to compete with larger enterprises in the market for access to sites, particularly if permitting and concession practice benefit the incumbents. However, those impacts are subject to intervention of EU competition law and planning, permitting and concession policy which are in the responsibility of Member States authorities.
Corporate fleets already today sign responsible for a significant market take-up of zero-emission cars. Such fleet operators will benefit from the revision of the Directive, as provisions ensure secure vehicle use for both short- and long-term distance anywhere in the EU. While there is a benefit under all options, PO2 and PO3 ensure certainty for fleet operators in terms of full coverage of the TEN-T core and comprehensive network and hence full cross-border connectivity. The revision particularly creates long-term certainty for logistic operators that alternatively fuelled trucks and particularly zero-emission trucks will be able to recharge and refuel when they go long-distance on the TEN-T network, supporting the market take up of such vehicles.
6.1.6.Functioning of the internal market and competition
Impacts have been qualitatively assessed. All policy options are expected to have a positive impact on the functioning of the internal market, both through increasing the even spread of the infrastructure and through simplifying its use throughout the Union, including through better ad-hoc payment services. All options provide for a level playing field. PO2 and PO3 will lead to subsequent standardisation of the interoperable communication exchange between the electric vehicle, the charge point and the backend of the charge-point, as well as with the electricity grid, creating a better level-playing field in line with the increasing maturity of the market. But these two options also foresee better equipment of ports and airports with relevant alternative fuels infrastructure and powering units, yielding additional benefits of a better functioning of the internal market in that sector.
All policy options lead to more uniform provisions for customer information that will enable the customer to better understand and compare available services and their cost at charging points of different operators. This will facilitate competition among operators and service providers, facilitated by improved requirements for data sharing through the national access points. Again, PO2 and PO3 excel in terms of their impact on market, as the requirement to share both certain static and dynamic data will enable better customer information and hence greater competition.
6.1.7.Impact on innovation and industry competitiveness
All the POs are considered having a positive impact on innovation, particularly in the area of innovative user services, related business models but also in the development of more innovative recharging and refuelling technologies. Vehicle innovation such as higher battery power, more efficient fuel cells or higher recharging and refuelling capability will remain key drivers for innovation in recharging and refuelling infrastructure technology, whereas the impact of the revision of this Directive is particularly expected in the area of service innovation and new business models. Extending the rollout of recharging and refuelling infrastructure throughout the Union coupled with the requirement to share static and dynamic data as included under PO2 and PO3 will particularly enable better innovation of use services at greater scale, enabling quicker spread of innovation in the EU.
Competitiveness of enterprises active in installing and operating recharging and refuelling infrastructure will increase under all policy options, as higher demand for recharging and refuelling practice as triggered by the CO2 emission performance standards for cars and vans, but also for heavy-duty vehicles, will lead to better profitability of operations, complemented by decreasing cost of technologies. Policy options affects also the competitiveness of the automotive sector, because the provision of sufficient infrastructure has an impact on the market uptake of zero-emission vehicles which again influences the competitiveness of the automotive sector.
6.2.Social impacts
6.2.1.Impacts on households and consumers
Impacts on consumers will largely come from common physical and communication standards that will ease the use of infrastructure and help new services to develop to the benefit of the consumers. Benefits will come from improved information on infrastructure adding certainty about location, accessibility and use (pricing) conditions as well as price transparency that will reducing informational cost of households and allow consumers to take informed choices and reduce costs. Introducing requirements for bank card payment will likely increase the investment cost of some charge points, in some case considerably (up to around €800 per charger for a PIN terminal). This could negatively impact the costs of mobility and mobility services for consumers, as some of these costs could be passed to consumers. However, these costs are balanced by bringing positive impacts as bank card payments will increase price transparency, ease the use of zero-emission vehicles, have positive impacts on the level of demand and on competition on the AFI market and thus counterbalancing any possible additional costs. Moreover, the further standardisation of infrastructure and infrastructure use services and the resulting possibilities for smart recharging services will benefit consumers who are in a position to offer their vehicle to support such smart recharging services and receive remuneration in return. Moreover, the Impact Assessment for the CO2 standards for cars and vans demonstrates overall benefits for consumers and society, resulting particularly from fuel cost savings and lower maintenance cost. Here, again, the revision of AFID helps ensure that those benefits for consumers can be fully accrued.
Costs impacts for consumers from a wide availability of AFI is likely to be indirect. More infrastructure will increase competition and will likely reduce charging and refuelling costs. It will equally enable more zero- and low-emission vehicles to come into the market driving down the vehicle costs.
6.2.2.Impacts on employment and social skills
The impact of the targets on employment is expected to be positive, although it has not been possible to quantify these. By increasing the demand for new infrastructure and supporting services, the new measures can lead to the creation of new jobs in construction, manufacturing, electricity, among other sectors. The impact is expected to increase with the level of ambition of the targets through the policy options. Those jobs are highly location-specific and cannot easily be relocated outside the EU, meaning a full benefit to the European employment market.
The measures introduced to promote interoperability will benefit the AFV and AFI markets and will require additional investments. This will have a small positive impact on employment in the industry. The introduction of standards may adversely impact some producers that do not currently comply with such standards; however, this is likely to be negligible.
6.2.3.Impact on persons with disabilities and those with reduced mobility
The qualitative analysis of this impact area concludes that while a lack of accessibility for persons with disabilities would negatively impact their mobility there is currently no evidence of such an issue. This is evidenced by the fact that none of the representatives of those person groups indicated any concrete problems with the existing infrastructure in the consultations.
6.2.4.Impact on public health
Enabling changes in the use of fuels are likely to result in reduced air pollutant emissions and subsequent positive impacts on public health. For road transport, NOx and PM emissions are projected to decrease by 7-8% relative to the baseline in 2030 and by over 90% by 2050. These decreases are mainly driven by the higher uptake of zero-emission vehicles relative to the baseline, enabled by the deployment of infrastructure, but also by other policies part of the “Fit for 55” package and other forthcoming initiatives as explained in section 6.3. The policy options would results in €1.8 billion savings in the external costs of air pollution relative to the baseline in 2030, €9.6 billion in 2040 and €10.3 billion in 2050. Expressed as present value over the 2021-2050 period, the total savings amount to €75 billion relative to the baseline.
Table 24: External costs savings on air pollution from road transport
|
External costs of air pollution compared to the Baseline (bil. €'2015)
|
2015
|
Baseline
|
PO1 / PO2 / PO3
|
|
|
|
2030
|
2040
|
2050
|
2030
|
2040
|
2050
|
|
External costs of air pollution
|
60.9
|
22.0
|
15.0
|
10.8
|
20.2
|
5.4
|
0.5
|
|
% change to Baseline
|
|
|
|
|
-8.4%
|
-64.0%
|
-95.3%
|
Source: Ricardo et al (2021), impact assessment support study, PRIMES-TREMOVE model results (E3Modelling)
The introduction of electricity as a power source at ports (inland and maritime via OPS) and airports will ensure that air pollutant emissions from stationary vessels and aircraft will be minimal. Additionally, the provision of LNG bunkering facilities at maritime ports will enable the increased refuelling with decarbonised gas (i.e. bio-LNG and e-gas), which have positive air pollutant reduction benefits compared to their diesel and heavy fuel oil counterparts. Finally, at airport level, the introduction of such measure will bring further positive impacts, from the reduction of the noise emitted on the ground, as it is an important source of noise for those who live in the vicinity of the airport, for passengers and airport workers.
6.3.Environmental impacts
The analysis of environmental impacts covers the following impact categories arising from measures identified under each policy option:
·CO2 emissions.
·Air pollutant emissions.
Environmental benefits represent the key rationale for taking action towards the faster and broader deployment of alternative fuels infrastructure. The PRIMES-TREMOVE model has been used to quantify the impacts of selected measures/options on CO2 emissions and air quality, in particular those relating to road transport. Environmental impacts from interoperability and consumer information can’t be quantified and are not further assessed.
6.3.1.CO2 emission reduction
As explained in section 6.1.1, investments in the quantity and quality of infrastructure will not directly lead to the uptake of alternatively fuelled vehicles, which are determined by other policies like for example the CO2 emission performance standards. However, only if sufficient and interoperable infrastructure is available that provides minimum services to consumers, it can be expected that the vehicles as considered necessary to achieve the EU’s Climate Target Plan objective will make it into the market.
CO2 emissions are capped by the Emissions Trading System. Considering its assumed extension to the road transport sector (and the maritime sector) this would also set the impulse for the road transport sector that the required emissions reductions are delivered according to the ETS cap - even if the infrastructure does not deliver and the CO2 emission performance standards for vehicles are not met. For example, in the foreseen case of a separate ETS for road transport this would result in a higher price of allowances to deliver the same emissions reductions and higher reduction in the road traffic if the uptake of zero emission vehicles is not possible.
Road Transport
On tank to wheel basis, the CO2 emissions from road transport are projected to decrease by 5.3% in 2030 in all policy options relative to the baseline. The reduction in emissions relative to the baseline would be much higher post 2030 (65.1% decrease in 2040 and 99% decrease in 2050), due to the higher uptake of zero-emission vehicles and renewable and low carbon fuels in road freight transport. It should be recalled that all policy options already include all other policy initiatives part of the ”Fit for 55” package and other initiatives (e.g. CO2 emissions standards for vehicles, carbon pricing, improvements in the efficiency of the transport system, etc.) and these contribute to the CO2 emissions reductions from road transport.
Table 25: Tank to wheel CO2 emissions from road transport in the policy options and the baseline
|
Tank to wheel CO2 emissions from road transport
|
2015
|
Baseline
|
PO1 / PO2 / PO3
|
|
|
|
2030
|
2040
|
2050
|
2030
|
2040
|
2050
|
|
Road transport emissions in Mt of CO2
|
722
|
574
|
453
|
389
|
543
|
158
|
4
|
|
% change to 2015
|
|
-20.5%
|
-37.2%
|
-46.1%
|
-24.7%
|
-78.1%
|
-99.5%
|
|
% change to Baseline
|
|
|
|
|
-5.3%
|
-65.1%
|
-99.0%
|
Source: Ricardo et al (2021), impact assessment support study, PRIMES-TREMOVE model results (E3Modelling); Note: excluding powered two-wheelers.
On well to wheel basis, CO2 emissions from road transport would go down by 19.3% in the baseline scenario by 2030, by 35.6% in 2040 and by 44.3% by 2050 relative to 2015. In all policy options, higher emissions reductions are projected (23.9% decrease in 2030, 75.5% in 2040 and 98% by 2050 relative to 2015) due to the higher uptake of zero-emission vehicles, but also due to the power generation sector that is set to achieve decarbonisation by 2050. The power generation mix plays an important role in this time perspective considering the large scale electrification of road transport.
The reduction in external costs of CO2 emissions is projected at €445 billion relative to the baseline over the 2021-2050 period, expressed as present value. These have been monetised using the Handbook on the external costs of transport.
Waterborne Transport
For OPS (both maritime and inland waterway), the CO2 emissions reduction only applies when the vessel is at berth. While OPS reduces onboard emissions at berth, consideration also needs to be given to the emissions associated with power generation as such, as similar to road transport the source of this electricity will have an influence on the overall emissions reductions achieved. This is particularly relevant for 2030 because, as explained above, the power generation sector is set to achieve decarbonisation by 2050. The emissions reductions are driven by the replacement of marine gasoil with electricity supply for auxiliary engines and is directly correlated with the number of vessels that are capable of using OPS. Hence, PO3 shows the highest cumulative reduction as this measure serves all maritime ports with OPS such that all ships can use electricity when at berth. The greatest reduction in emissions is expected to be derived from container ships, which emit the highest volume of CO2 at berth. For the period up to 2050, the cumulative reduction of CO2 emissions on well to wheel basis is between 48.4 million tonnes of CO2 in PO1 and 83 million tonnes of CO2 in PO3, which corresponds to 1.5 to 2.5% of total maritime emissions during that period. We note, however, that in the context of total EU maritime CO2 emissions the impact of OPS is limited, even for the most ambitious policy option covering all EU maritime ports.
Table 26: CO2 emissions impact of policy options concerning OPS for maritime in million tonnes, on well to wake basis
|
Type of AFI
|
Baseline
|
PO1
|
PO2
|
PO3
|
|
|
|
Total
|
Net
|
Total
|
Net
|
Total
|
Net
|
|
Up to 2030
|
0.3
|
5.3
|
5
|
8.2
|
7.9
|
8.7
|
8.4
|
|
2031-2050
|
3.3
|
46.7
|
43.4
|
72.8
|
69.5
|
77.8
|
74.5
|
Source: Ricardo et al (2021), impact assessment support study
Given the nature of OPS, the environmental impacts for inland waterway can be considered to be of the same nature as maritime. Specifically, CO2 emissions reduction occurring at berth, with the extent of the reduction deepening on the energy mix in electricity production. It is however worth noting the total EU CO2 emissions generated by inland navigation are significantly lower than those of the maritime sector due to the smaller vessels and much lower number of vessels. Given the limited information available on the current environmental performance of inland navigation, in particular when vessels are at berth, it has not been possible to calculate an estimated CO2 reduction. Nevertheless, it is expected that PO2 and PO3 would have the greatest impact as each of the policy options have the greatest AFI deployment, covering all TEN-T Core and Comprehensive ports.
Unlike OPS, the provisions for LNG bunkering will impact the CO2 emissions in ports when vessels are at berth and when vessels are in operation, though the exact extent is subject to discussion following continued assessments of fossil LNG emissions. However, the impact assessment accompanying the FuelEU maritime initiative has shown that fossil LNG will be gradually replaced with liquified biomethane (or bio-LNG) from 2030 onwards and renewable low-carbon synthetic e-gas from 2035 onwards. By 2050, renewable and low carbon fuels are projected to represent the large majority of gaseous fuels used in maritime. Such decarbonised gases (bio-LNG and e-gas) use the same infrastructure as the LNG and are projected to represent 21% of the fuel used in international shipping by 2050, according to the impact assessment accompanying the FuelEU maritime initiative.
Aviation
The use of FEGP in airports allows the aircrafts engines and auxiliary power unit (APU) located in the tail to be switched off once the aircraft is on stand. FEGP provides an alternative to the traditional jet fuel used to run APUs, as it runs on grid electricity and thus has a much lower carbon intensity. The exact fuel burn and environmental impact of running APUs are dependent on various factors such as aircraft type, weight and turnaround times. Furthermore, unlike aircraft main engines, APUs are not certificated for emissions, and the manufacturers generally consider information on APU emissions rates as proprietary. As a result, little data are publicly available to serve as a basis for calculating APU emissions and the extent of environmental benefits that FEGP brings is difficult to quantify and we can only provide a general assessment.
In the context of total aviation emissions, the environmental impact of FEGP is limited because APUs account for a small proportion of CO2 emissions in aviation (approximately 1% or 1.4 Mt of CO2 in 2018). Consideration needs to be given to the emissions associated with power generation and as such, the source of this electricity will have an influence on the overall emissions reduction achieved in the 2030 perspective. In particular, if renewable energy is used, near‐zero emissions of CO2 and other air pollutants can be achieved when the aircraft is on stand, representing a 1% reduction in total aviation CO2 emissions.
6.3.2.Air pollutants emission reduction
Road Transport
By 2030, driven by the uptake of zero-emission vehicles enabled by the deployment of infrastructure, NOx and PM emissions from road transport are projected to decrease by 6.6% and 7.6%, respectively, relative to the baseline. The reductions in air pollution emissions relative to the baseline are much higher post-2030, due to the larger penetration of the zero emission vehicles for both LDVs and HDVs (i.e. 60.5% decrease for NOx and 62.3% decrease for PM emissions in 2040 and over 90% decrease in 2050 for both NOx and PM emissions). Similarly to CO2 emissions, it should be recalled that all policy options already include all other policy initiatives part of the ”Fit for 55” package and other initiatives, and these contribute to the air pollution emissions reductions from road transport.
As explained in section 6.3.1, CO2 emissions are capped by the Emissions Trading System. Considering its assumed extension to the road transport sector (and the maritime sector) this would also set the impulse for the road transport sector that the required emissions reductions are delivered according to the ETS cap - even if the infrastructure does not deliver and the CO2 emission performance standards for vehicles are not met. For example, in the foreseen case of a separate ETS for road transport this would result in a higher price of allowances to deliver the same emissions reductions and higher reduction in the road traffic if the uptake of zero emission vehicles is not possible. The higher price of allowances for road transport would also result in lower air pollution emissions relative to the baseline, driven by the reduction in the road traffic and the energy use in road transport.
Table 27: Air pollutant emissions from road transport in the policy options and the baseline
|
Air pollution emissions from road transport
|
2015
|
Baseline
|
PO1 / PO2 / PO3
|
|
|
|
2030
|
2040
|
2050
|
2030
|
2040
|
2050
|
|
NOx emissions (ktons)
|
2,850
|
1,000
|
733
|
547
|
934
|
290
|
32
|
|
% change to 2015
|
|
-64.9%
|
-74.3%
|
-80.8%
|
-67.2%
|
-89.8%
|
-98.9%
|
|
% change to Baseline
|
|
|
|
|
-6.6%
|
-60.5%
|
-94.1%
|
|
PM2.5 emissions (ktons)
|
131
|
58
|
38
|
27
|
54
|
14
|
1
|
|
% change to 2015
|
|
-55.7%
|
-70.8%
|
-79.7%
|
-59.1%
|
-89.0%
|
-99.1%
|
|
% change to Baseline
|
|
|
|
|
-7.6%
|
-62.3%
|
-95.4%
|
Source: Ricardo et al (2021), impact assessment support study, PRIMES-TREMOVE model results (E3Modelling); Note: excluding powered two-wheelers.
Waterborne Transport
The reduction of air pollutants and improvement on local air quality is the main environmental benefit for both OPS and LNG as they both offer substantial reductions in air pollutants. Given that air quality is considered the top priority for ports this environmental impact represents a significant benefit to those in the maritime and inland waterway sectors. The uptake of LNG will impact both local air quality and air pollutants produced when the vessel is in operation, while OPS has a much more localised impact. As vessels spend less time at berth than navigating, understandably the volume of air pollutants at berth is limited when compared to the total emissions of a ship. However, unlike when navigating, the emissions of a vessel at berth have a direct impact at port-cities (as ports are often or within the cities) and the coastal areas. As these cities are often densely populated, the impact of emissions at berth is therefore disproportionately affecting these areas.
Electricity generation is typically located some distance from densely populated areas, whereas dockside shipping emissions will often occur close to city centres as a consequence of a port’s typical location. As with CO2 emissions, consideration needs to be given to the emissions associated with power generation. While coal‐fired power plants emit more CO2, they have lower emissions of nitrogen oxides, particulate matter and sulphur oxides, compared with those associated with burning marine diesel fuel with a 0.1 sulphur content. Hence, all policy options supporting OPS are expected to have a positive impact on air pollutants, with the effect increasing as the policy options become more ambitious and the frequency of use of OPS from vessels more widespread.
The uptake of LNG in maritime is also expected to result in a reduction on air pollutants under PO3 as a result of the uptake of LNG vessels. LNG contains little sulphur and LNG engines are tuned to emit low NOx emissions, which makes LNG an attractive fuel for ships that operate in Emission Control Areas (ECAs), where ships must comply with more stringent air quality standards. This is similar for decarbonised gases (bio-LNG and e-gas).
Aviation
An additional benefit of using FEGP in replacement of jet fuel powering APUs is the reduction of air pollutants at ground level. The main air pollutants considered here are NOx, HC, CO and PM10. As noted previously, consideration needs to be given to the emissions associated with power generation, although this is a minor issue as power generation occurs at some distance from airports. Nevertheless, it is expected that lowers emissions of air pollutants compared to the burning of jet fuel in APUs. As such, the measure will offer benefits across all air pollutants and the effects will increase the policy options become more ambitious.
As already highlighted in the section on GHG reduction, the extent of the reduction of air pollutants is difficult to assess on the basis that the exact fuel burn and environmental impact of running APUs are not well documented and dependent on various factors such as aircraft type, weight and turnaround times. Nevertheless, at Zurich Airport, it was estimated that FEGP and PCA provision at all stands would offer a reduction of NOx pollutants while stationary by 96% of APU emissions
.
7.How do the options compare?
7.1.Effectiveness
The effectiveness of the options is compared against the general and specific policy objectives as described in section 4. For the overview,
Table 28
presents the objectives and the indicators that have been developed to monitor the level of achievement of the objectives. The effectiveness of each policy option in achieving the objectives is presented in detail in annex 8, using the indicators described below.
Table 28: Linking of policy objectives to indicators
|
General objective
|
Specific objective
|
Indicator
|
|
Support the uptake of low and zero emission vehicles and vessels through sufficient and fully interoperable infrastructure and thereby contribute to achieving climate neutrality by 2050 (i.e. achieve net zero GHG emissions by 2050) and to contribute to the reduction of air pollution
|
SO1: Ensuring sufficient infrastructure to support the required uptake of alternatively fuelled vehicles across all modes and in all MS to meet the EU’s climate objective
|
Increase of number of
·public accessible recharging and refuelling points on roads,
·OPS and other alternative fuels infrastructure in ports and
·Electricity supply for stationary aircrafts
|
|
|
SO2: Ensuring full interoperability of the infrastructure
|
Extent to which outstanding technology developments are standardised
Increase in the directional alignment of the EV charging backend
|
|
|
SO3: Ensuring full user information and adequate payment options
|
Increase in the extent of customer information available
Increase in the provision of data to national access points
Availability of one common ad-hoc payment option at all recharging points
|
Concerning SO1, PO1 shows good effectiveness as it links emerging road vehicle fleet demand to overall infrastructure deployment and also ensures sufficient infrastructure to enable full circulation of heavy-duty vehicles. It is, however, less effective with regard to LDV recharging infrastructure on the TEN-T network as it leaves public authorities and operators with greater flexibility for the allocation of infrastructure, by not setting specific requirements for LDV recharging infrastructure on the TEN-T core and comprehensive network. This could impact, however, the overall effectiveness of the policy to ensure the transition to zero-emission mobility, as insufficient provision of public accessible recharging points could remain in the TEN-T, which can limit full connectivity.
PO1 is also least effective in view of OPS installation in ports, as it only addresses TEN-T core ports. PO2 is more effective than PO1, as it addresses TEN-T LDV infrastructure, recharging infrastructure for HDV in urban nodes and OPS in TEN-T core and comprehensive ports. PO3 is most effective, as it provides recharging points in all larger petrol stations for LDV and HDV. It also ensures greater equipment of ports with alternative fuels infrastructure than PO2.
PO2 and PO3 are more effective compared to PO1, when it comes to SO2 and SO3. They include a greater level of harmonisation on payment options, physical and communication protocols and interfaces standards and rights of consumers while charging. Those options also better substantiate provisions for adequate consumer information and payment options, notably through making available full static and dynamic user information and better harmonised payment options. PO3 can be considered slightly more effective compared to PO2, as it includes a more comprehensive approach to physical signposting of recharging and refuelling infrastructure.
Annex 8 provides a detailed and quantitative overview on the effectiveness of the policy options in relation to the specific objectives.
7.2.Efficiency
Efficiency concerns "the extent to which objectives can be achieved for a given level of resource/at least cost". The combined measures under the three POs have economic, social and environmental impacts. The major costs of the policy options come in the form of capital and operation costs for the installation and maintenance of public accessible recharging and refuelling infrastructure and measures related to interoperability and user information. A summary of these costs is provided in
Table 29
.
Table 29: Summary of capital and operation costs related to infrastructure – present value for 2021-2050 compared to the baseline (in €billion)
|
Costs summary - present value for 2020- 2050 compared to the baseline (bil. €'2015)
|
PO1
|
PO2
|
PO3
|
|
Capital and oparation costs related to infrastructure
|
|
Road transport
|
|
|
|
|
LDVs recharging points
|
24.4
|
25.3
|
30.3
|
|
HDVs charging points
|
2.9
|
2.9
|
3.1
|
|
Hydrogen fuelling facilities
|
25.2
|
27.7
|
28.0
|
|
CNG fuelling facilities
|
-1.6
|
-1.6
|
-1.6
|
|
LNG fuelling facilities
|
-1.0
|
-1.0
|
-1.0
|
|
Waterborne transport
|
|
|
|
|
LNG installations for maritime ports
|
|
|
1.1 - 3
|
|
OPS installations for maritime ports
|
1.2
|
5.5
|
6.5
|
|
OPS installations for inland ports
|
0.1
|
0.4
|
0.4
|
|
Aviation
|
|
|
|
|
Electricity supply to aircraft
|
0.2
|
0.9
|
0.9
|
|
Interoperability
|
|
|
|
|
Ad-hoc payments
|
6.7-10.2
|
7.0-10.4
|
7.2-10.6
|
|
Mandatory fixed cables
|
-
|
-
|
0.2
|
|
User information
|
|
|
|
|
Roadside indicators
|
-
|
0.001
|
0.004
|
|
Total capital and operation costs
|
58.1 - 61.6
|
67.1 - 70.5
|
75.2 - 80.5
|
Source: Ricardo et al (2021), impact assessment support study
It is important to keep in mind that these calculations are made on the basis of current estimations on the future costs of the various infrastructure deployment and related capital costs, but also assumptions about future use of recharging and refuelling infrastructure and their impact on overall revenue.
All POs meet the requirement for sufficient infrastructure deployment, however, at different costs. Differences mainly result, as explained in section 6.1.4, from variation in the allocation of infrastructure for road transport and particularly also from the higher level of policy ambition for roll-out of OPS in ports in PO2 and PO3 compared to PO1. PO3 can be considered less efficient than PO2 and PO1, as the interplay of fleet and distance based targets with additional location based targets (petrol stations) for electric LDV is expected to affect open and competitive market deployment. Mandatory targets for specific locations risk that not the optimal location of recharging points is chosen and that potentially this infrastructure is not being used or that investments in more suited locations will not materialise as sufficient recharging capacity has already been installed under a mandate. For hydrogen refuelling infrastructure the higher capacity for each refelling point adds to the overall costs but that is offset by the greater convenience for consumers and less waiting times that in particular for heavy duty vehciles also have cost implications.
The strict approach to addressing requirements for OPS installation in all European ports risks that investments into infrastructure are not everywhere met by sufficient demand and consequently an under-utilisation of infrastructure.
These costs can be balanced against wider cost savings from the achievement of climate and environmental objectives. Benefits are the same across the three POs as they have been designed to provide comparable deployment of recharging and refuelling infrastructure, in line with the objectives of the Climate Target Plan and the “Fit for 55” package and the corresponding developments of zero- and low-emission vehicle fleets. As explained in section 6.3.1 and 6.2.4, for all policy options the reduction in the external costs of CO2 emissions is projected at €445 billion relative to the baseline over the 2021-2050 period, expressed as present value, and the reduction in the external costs of air pollution emissions at €75 billion relative to the baseline. It should however be recalled that all policy options already include all other policy initiatives part of the ”Fit for 55” package and other initiatives (e.g. CO2 emissions standards for vehicles, carbon pricing, improvements in the efficiency of the transport system, etc.) and these effectively contribute to the CO2 emissions and air pollution emissions reductions.
All POs are similar in view of SO2 and SO3. While the impact could not be quantified, PO2 and PO3 should be regarded as more efficient than PO1 in relation to improving interoperability as a much wider set of common technical standards is being prescribed, including those between the recharging point and the DSO that ensures that smart recharging solutions can be developed. The same is true for the relation to customer information under specific objective 3. The provision of full static and dynamic data by charge point operators and their accessibility to other market actors under those POs is expected to create a whole new range of user services. Real-time information about availability of recharging stations and ad-hoc pricing will address remaining concerns of vehicle users and improve the user experience. The benefits of common standards and user information are regarded to largely outweigh the relative small increase of cost for implementing standards and making data available. PO2 can be regarded as more efficient than PO3 with regard to payment services, as it norms to provide at least one of the two most user-friendly payment options based on bank card payment (terminal or NFC) for fast recharging points, but still leave enough flexibility to market actors to consider their appropriate use in view of the specific market conditions. Whereas PO1 offers greater variety of choice for CPOs but also potentially more hassle for EV-users. Against this backdrop, PO2 can be considered the most efficient option.
7.3.Coherence
In general terms, there are no issues as regards internal or external coherence, inconsistencies or gaps among the policy options. Such outcome of overall coherence and consistency has been ensured by the policy approach as described in section 5. The main level of ambition and the main objective of this policy initiative is fully in line with the key policy objectives of the Union, in particular regarding the long-term objective of achieving climate neutrality by 2050. The POs presented in this Impact Assessment fully respond to the policy ambition that has been outlined by the European Green Deal, the Climate Target Action Plan and the Sustainable and Smart Mobility Strategy.
This initiative is fully congruent with the common economic assessment underpinning the 2030 Climate Target Plan and the Sustainable and Smart Mobility Strategy. In particular, this initiative is complementary and closely links to the policy initiative of revising the CO2 emission performance standards for cars and vans. Building on the findings of that policy initiative with regard to fleet developments for zero- and low-emission vehicles, the proposed POs are designed to ensure that there is sufficient recharging and refuelling infrastructure deployed everywhere in the Union. For waterborne transport, this initiative is fully complementary to the FuelEU maritime initiative by ensuring that sufficient OPS is installed in ports to provide electricity while cruise ships, RoPax and container vessels are at berth and accommodating the demand for decarbonised gases (i.e. bio-LNG and e-gas). The initiative is also complementary to the RefuelEU aviation maritime, supporting that initiative’s push for sustainable aviation fuels that do not distinct refuelling infrastructure with provisions for electricity supply for all stationary aircraft and thus supporting the decarbonisation of the aviation sector.
In addition, this policy initiative also links up to the policy initiative of revising the Renewable Energy Directive, where it ascertains that lack of recharging and refuelling infrastructure does not hamper the overall ramp-up of renewable and low-carbon fuels in the transport sector, where those require distinct infrastructure. There is no equivalent policy instrument at EU level to this Directive that is able to ensure the provision of public accessible recharging and refuelling infrastructure across all modes of transport in a similar manner. In this sense this initiative is also fully coherent with the Energy Performance of Buildings Directive that seeks to regulate the roll-out of private recharging infrastructure in certain parts of the building stock in the Union and which is already drawing on the technical specifications as set out by the Alternative Fuels Infrastructure Directive.
In terms of internal coherence, POs are coherent in their approach to addressing needs of both light- and heavy-duty road transport vehicle infrastructure and ports and airports infrastructure, where only the scope and level of ambition differs. Compared to PO1, PO2 and PO3 fare slightly better in terms of internal coherence as they cover all relevant segments of the vehicle-to-infrastructure and infrastructure back end ecosystem, including static and dynamic exchange, while also fully addressing outstanding interoperability needs in the waterborne sector.
7.4.Proportionality and subsidiarity
None of the policy options goes beyond what is necessary to reach the overall policy objectives. The proposed intervention ensures the uptake of sufficient infrastructure for recharging and refuelling of alternative fuels vehicles in the Union necessary for delivering on the increased climate and energy ambition for 2030 and the overall objective of reaching climate neutrality by 2050, as stipulated by among other the CO2 standards for cars and vans and the cross-border connectivity for such vehicles in the TEN-T core and comprehensive network.
Experience with the implementation of the current Directive show the need for such revised intervention. At present the implementation process of that Directive leads to an uneven rollout of infrastructure in Member States that is not adding up to the dense, widely needed network of alternative fuels infrastructure. This has been fully demonstrated in the Commission report to Parliament and Council on the application of this Directive and the baseline analysis underpinning this Impact Assessment.
The POs are designed to create a stable and transparent policy framework to help create open and competitive market development, stimulating investment into recharging and refuelling infrastructure in all modes of transport. They are designed to avoid disproportionate impacts on public authorities, operators of infrastructure and mobility service providers, notably by focusing on establishing a common minimum on which markets can build and start deliver further needs as driven by market demand. This is particularly true for the requirements for the waterborne and aviation sector, where the initiative factors in the state of maturity of different alternative fuel solutions and provides the time and flexibility needed to adapt more innovative powertrain technologies and their recharging and refuelling infrastructure needs.
Particularly concerning ports and the particular case of emissions at berth, the specific requirements for the use of OPS are foreseen to be phased-in with a sufficient lead-time and first mandated to only the most polluting ships in ports, i.e. containerships, passenger ships and Ro-Pax ships, to avoid imposing disproportionate impacts to the entire fleet and the ports. On the other hand the initiative is proportionate to the needs for infrastructure ramp-up posed in particularly in the road transport, where requirements for 2025 and 2030 ensure that infrastructure is not becoming a barrier to the needed uptake of zero and low-emission vehicles under the CO2 emission performance standards for cars and vans.
The provision set under this initiative help the transport sector to adequately contribute to the overall CO2 emission targets set for the entire EU economy, ensuring that the overall net benefits of such approach can be fully reaped. The proposed level of intervention at EU level is also considered to deliver the highest impact compared to the current approach that addresses the main responsibility for overall target setting to the national level. The nature and scope of the problem is similar across Member States and there is evidence of the need and value added of ensuring cross-border connectivity for alternative fuels vehicles in the EU, which duly justifies EU action.
7.5.Summary of comparison of options, including stakeholder views
All POS are meeting the overall effectiveness criteria, though PO2 and PO3 are slightly better suited. PO3 ranks first as it enables the strongest rollout of infrastructure in ports compared to PO2, followed by PO2 and PO1.
As regards efficiency, POs are again very close when it comes to road transport infrastructure deployment, whereas PO3 is least efficient with regard to ports infrastructure, and PO2 is considered to be the most efficient, also in view of its approach to user information and payment services.
In terms of coherence, all options align well to the general policy ambition and agenda of the “Fit for 55” package. PO2 and PO3 can be considered more coherent than PO1, as they address comprehensively the important aspect of data governance for vehicle and infrastructure use services.
Proportionality is also ensured in all POs. All POs intervene more directly into the infrastructure rollout planning at national level, as they set a fleet based sufficiency requirement. But none of the POs interferes into essential Member State competencies for planning, permitting and procuring of infrastructure. Greater level of intervention is warranted by both the requirement to adequately equip the TEN-T core and comprehensive network and ensure cross-border connectivity and to ensure a fully functioning internal market to support the transition to zero- and low-emission mobility by 2050. Moreover, all POs seek to extend necessary minimum requirements for addressing necessary interoperability in the market and ensure relevant consumer information and services that are indispensable to a fully functioning internal market. Such requirements come with an additional burden for operators of infrastructure, mobility service providers and automotive producers but are considered acceptable as greater harmonised provisions enable the quick scaling of the market for recharging and refuelling infrastructure and services in the Union, which will benefit in the end both market actors and consumers through better services at decreasing cost and opportunities for better growth and new innovative business models.
Stakeholders are principally supportive of a revision. A large majority of stakeholders has pointed out the need of an even deployment of sufficient recharging and refuelling infrastructure across the EU, in particular for low and zero emission vehicles. To achieve this objective, around 70% of respondents to the OPC were supportive of mandatory targets for electric recharging points for LDV with 50% being in favour of targets for the whole network while only 20% were opposed to targets covering the whole network. Support was only slightly less developed for mandatory targets for electric recharging points for HDV and for hydrogen refuelling points. What concerns waterborne transport, 50% of respondents were in favour of mandatory OPS requirements for TEN-T ports. Mandatory targets were supported in particular by the automotive industry, operators and manufacturers of infrastructure, NGOs and EV-users while port operators were reluctant.
The vast majority of respondents were in favour of the standardisation approach in PO2 and PO3 with regards to physical and communication standards, including the operators of recharging and refuelling stations as well as the automotive industry and the electricity sector. Also enhanced user information, including dynamic information as in PO2 and PO3, and a common ad hoc payment method was supported by a large majority of stakeholders, in particular by vehicle users and the automotive industry. However, charge point operators pointed out to the expenses of physical payment terminals (in comparison to QR codes and NFC terminals) and therefore favoured a more flexible approach as in PO1 and PO2.
7.6.Infrastructure needs depending on the level of stringency of CO2 standards for LDVs
As explained in section 6, the impacts of the POs, focusing on the design of the policy instrument, are assessed in the context of the MIX policy scenario, which is also consistent with option TL_Med of the impact assessment accompanying the revision of the emission performance standards for new passenger cars and for new light commercial vehicles. In view of ensuring consistency with that impact assessment the approach for the recharging infrastructure requirements used in policy option 2 has been also been tested in the context of options TL_Low and TL_High of the respective impact assessment, that assume less stringent and more stringent CO2 standards, respectively. PO2 (TL_Med) in this section is the same with PO2 in section 6. The results of PO2 (TL_Med) are provided here for comparison purposes.
Changes in the ambition level with respect to the uptake of electric vehicles would not affect the target setting. The fleet based targets are dependent on the number of registered vehicles and hence any increase in vehicle uptake would need to be matched with sufficient infrastructure, e.g. a matching increase in installed recharging capacity (installed power). What concerns the distance based targets, these targets provide for a sufficient level of infrastructure across the TEN-T network. In case of a higher demand at those locations, investments will be triggered through market forces, e.g. private investment will become full profitable not requiring further policy interventions trough target setting. However, higher or lower penetration of electric vehicles would require more/less infrastructure with an impact on the investment costs.
As shown in
Table 30
, by 2030 3.39 million recharging points would be needed if the CO2 standards of TL_Low option would be implemented compared to 3.51 million in TL_Med. On the other hand, if TL_High option for CO2 standards is implemented 3.62 million recharging point would be needed by 2030. The gap becomes larger post 2030. For example, in 2035 8.71 million recharging points would be needed in TL_High relative to 6.31 million in TL_Med and by 2050, 17.37 million recharging points would be needed in TL_High relative to 16.27 million in TL_Med. The analysis assumes the deployment of more fast recharging points over time in TL_Med, TL_Low and TL_High. If the average capacity of recharging points would be kept at the same level as in 2020 this would imply that a higher number of recharging points need to be deployed.
Table 30: Expected deployment of recharging points in PO2 in the context of less stringent (TL_Low) or more stringent (TL_High) CO2 standards for LDVs
|
Recharging infrastructure at EU27 level (in million)
|
PO2 (TL_Med)
|
PO2 (TL_Low)
|
|
|
2030
|
2035
|
2040
|
2050
|
2030
|
2035
|
2040
|
2050
|
|
LDVs recharging points
|
3.51
|
6.31
|
11.41
|
16.27
|
3.39
|
5.66
|
9.32
|
15.00
|
|
Recharging infrastructure at EU27 level (in million)
|
PO2 (TL_Med)
|
PO2 (TL_High)
|
|
|
2030
|
2035
|
2040
|
2050
|
2030
|
2035
|
2040
|
2050
|
|
LDVs recharging points
|
3.51
|
6.31
|
11.41
|
16.27
|
3.62
|
8.71
|
13.79
|
17.37
|
Source: PRIMES-TREMOVE model results (E3Modelling)
Based on the expected deployment of recharging infrastructure, average annual investments for the period up to 2030 would be between €1.23 billion in TL_Low and €1.33 billion in TL_High, relative to €1.29 billion in TL_Med (
Table 31
). For 2031-2035 the average annual investments would increase to €3.85 billion in TL_High compared to 1.97 in TL_Med.
Table 31: Average annual investments for 2021-2030, 2031-2035 and 2036-2050 in PO2 in the context of less stringent (TL_Low) or more stringent (TL_High) CO2 standards for LDVs
|
Average annual investments (€ billion)
|
PO2 (TL_Med)
|
PO2_low (TL_Low)
|
PO2_high (TL_High)
|
|
|
'21-'30
|
'31-'35
|
'36-'50
|
'21-'30
|
'31-'35
|
'36-'50
|
'21-'30
|
'31-'35
|
'36-'50
|
|
LDVs recharging points
|
1.29
|
1.97
|
3.68
|
1.23
|
1.67
|
3.23
|
1.33
|
3.85
|
3.60
|
Source: PRIMES-TREMOVE model results (E3Modelling)
Average annual maintenance costs for LDVs recharging points (
Table 32
) are estimated at €0.07 billion in TL_Low and €0.08 billion in TL_High, relative to €0.08 billion in TL_Med for the period up to 2030, at €0.24 to 0.34 billion for 2031-2035 and at €0.54 to 0.76 billion for 2036-2050.
Table 32: Average annual operation costs for 2021-2030, 2031-2035 and 2036-2050 in PO2 in the context of less stringent (TL_Low) or more stringent (TL_High) CO2 standards for LDVs
|
Average annual operation costs (€ billion)
|
PO2 (TL_Med)
|
PO2_low (TL_Low)
|
PO2_high (TL_High)
|
|
|
'21-'30
|
'31-'35
|
'36-'50
|
'21-'30
|
'31-'35
|
'36-'50
|
'21-'30
|
'31-'35
|
'36-'50
|
|
LDVs recharging points
|
0.08
|
0.26
|
0.64
|
0.07
|
0.24
|
0.54
|
0.08
|
0.34
|
0.76
|
Source: PRIMES-TREMOVE model results (E3Modelling)
The total additional costs relative to the baseline for the period 2025 – 2050, expressed as present value over 2021-2050, are estimated between €19 billion in TL_Low and 33.8 billion in TL_High, with TL_Med falling in between (€25.3 billion).
Table 33: Total capital and operation costs in the baseline and in the context of less stringent (TL_Low) or more stringent (TL_High) CO2 standards for LDVs (difference to the baseline), expressed as present value over 2021-2050
|
Total costs in the baseline and difference to the baseline, expressed as PV (€ billion)
|
Baseline
|
PO2 (TL_Med)
|
|
|
CAPEX
|
OPEX
|
Total
|
CAPEX
|
OPEX
|
Total
|
|
LDVs recharging points
|
16.2
|
2.4
|
18.6
|
22.5
|
2.8
|
25.3
|
|
Total costs in the baseline and difference to the baseline, expressed as PV (€ billion)
|
PO2 (TL_Low)
|
PO2 (TL_High)
|
|
|
CAPEX
|
OPEX
|
Total
|
CAPEX
|
OPEX
|
Total
|
|
LDVs recharging points
|
16.9
|
2.1
|
19.0
|
30.0
|
3.8
|
33.8
|
Source: PRIMES-TREMOVE model results (E3Modelling); Note: Assumed economic lifetime of investments is 10 years for electricity recharging infrastructure; annualised capital costs are derived assuming a weighted average costs of capital of 8%. For calculating the present value, a discount rate of 4% is assumed.
7.7.Sensitivity analysis on sufficiency, share of fast chargers and smart recharging functionalities
Sensitivity analysis on sufficiency
On the basis of policy option 2, a sensitivity analysis has been carried out to analyse the effects of the introduction of mandatory targets that would require Member States to install a greater number of electric recharging points for LDV than what is considered sufficient following the methodology to determine sufficient recharging and refuelling infrastructure to supply the fleet required to meet the Climate Target Plan objectives (see Annex 7.2). If less infrastructure was deployed in several Member State, it would risk to limit the vehicle uptake in the Member States to a lower number than required to meet the demand resulting from the CO2 standards for cars and vans. However, deploying more publicly accessible infrastructure by going beyond what is considered sufficient, is not expected to lead to a higher vehicle uptake as reflected in the common modelling framework. There is also no evidence from literature that abundance of infrastructure as compared to a sufficient level would lead to additional vehicle sales.
Instead, vehicles uptake is driven by other policies like e.g. the CO2 performance standards for cars and vans. In a sensitivity analysis on the basis of PO2, it was checked what effect an increased fleet based target for electric recharging points would have in terms of costs but also in terms of occupancy rates and the share of private charging versus charging at publicly accessible recharging points. More specifically a 20% increase of the requirements has been assumed. This would represent an equivalent of a recharging point, or installed capacity of 1.2 kW per BEV and 0.79 kW per PHEV.
In this scenario it is assumed that the mandatory targets would be 20% higher, meaning that Member States would be mandated to ensure that 20% more recharging capacity has to be installed than required under PO2. This would result in a total installed capacity at EU level of 58 GW by 2030, relative to 49 GW in PO2. This can be translated into approx. 4.17 million recharging points by 2030 and 21.2 million recharging points by 2050. Accordingly, total costs over 2025-2050, expressed as present value, would increase by approx. 26% compared to PO2. Such an approach would result in the utilisation rates of recharging points dropping for normal recharging points from around 1.8 hours to just over 1.5 hours and from 3 hours for fast recharging points to just above 2.5 hours. Such low utilisation rates would make it hard for operators to establish a profitable business case, shifting the additional investment costs largely to the public sector. However, if the occupancy rates are assumed to remain unchanged to the ones assumed in PO2, such a dense recharging network would support the recharging needs in local areas where around 50% of all recharging events are taking place, in contrast to the assumed 40% on average for the EU.
Table 34: Number of recharging points under the assumption of 20% capacity increase
|
Recharging infrastructure at EU27 level (in million)
|
PO2
|
PO2 (20% capacity increase)
|
|
|
2030
|
2040
|
2050
|
2030
|
2040
|
2050
|
|
LDVs recharging points
|
3.51
|
11.41
|
16.27
|
4.17
|
14.89
|
21.22
|
Source: PRIMES-TREMOVE model results (E3Modelling)
Table 35: Total capital and operation costs in the baseline and under the assumption of 20% capacity increase (difference to the baseline), PV of total costs for 2021-2050
|
Total costs in the baseline and difference to the baseline, expressed as PV (€ billion)
|
Baseline
|
PO2
|
PO2 (20% capacity increase)
|
|
|
CAPEX
|
OPEX
|
Total
|
CAPEX
|
OPEX
|
Total
|
CAPEX
|
OPEX
|
Total
|
|
LDVs recharging points
|
16.2
|
2.4
|
18.6
|
22.5
|
2.8
|
25.3
|
32.6
|
4.2
|
36.8
|
Source: PRIMES-TREMOVE model results (E3Modelling)
In this scenario the higher density of recharging points will not lead to the uptake of additional electric vehicles and the environmental impact as analysed under PO2 remain equally unchanged. In conclusion, a higher target on EU level than assumed in PO2 will lead to higher infrastructure costs while it will not lead to greater vehicle numbers. The additional costs would largely be borne by the public budget. However, this analysis explicitly refers to an aggregated EU level. Locally large differences exist, especially with respect to access to private recharging that will require different densities of recharging networks between rural and urban areas, and also within each urban area. As such, the proposed sufficiency level represents a basis for determining the mandatory target that applies on a national level only. Public authorities in Member States will continue to be able to determine the share of normal and fast recharging points but also the density of recharging points in the different local areas, respecting the subsidiarity principle.
Sensitivity analysis on the share of fast chargers
In an additional sensitivity analysis it was assessed how a change in the assumption on the average power output of a recharging point would affect the overall numbers on the deployment of recharging points. It is assumed that currently on average a publicly accessible recharging point has a power ouput of slightly below 11 kW. However, it can be expected that with the emergence of new technologies and the greater convenience of fast recharging points, the share of fast rechargiung points will go up. If that was the case, fewer recharging points would be required to serve a given vehicle fleet, as each fast recharging point can serve more vehicles at the same time as a normal recharging point. The above was also assumed when the number of recharging points was calculated in chapter 6.1.1 when an average power output of around 14kW was assumed for 2030 to calculate the number of recharging points per Member States and the associated costs.
However, it is yet unclear if the trend towards fast recharging points will go ahead and at which speed. This is why in a sensitivity analysis an assessment was carried under the assumption that the share of normal and fast recharging points remains constant over time and that this has no impact on the required aggregated power provided by all recharging points. Under this assumption, the total number of required recharging points would be considerable higher than under PO2 with 4.35 million for 2030 compared to 3.51 million under PO2. Different assumptions on the share of fast recharging points have also an impact on the costs. The higher total number of recharging points under the sensitivity assumptions would tend to increase the costs but as fast recharging points are also considerably more expensive than normal recharging points the average cost per recharging point also goes down. Under the assumptions of this sensitivity analysis, the total costs for 2025-2050, expressed as present value, would go down by 7% compared to PO2. On the other hand, this sensitivity analysis implies higher average recharging times.
Table 36: Number of recharging points under the assumption that the share of fast recharging points remains unchanged over time
|
Recharging infrastructure at EU27 level (in million)
|
PO2
|
PO2 (average power output of 11kW)
|
|
|
2030
|
2040
|
2050
|
2030
|
2040
|
2050
|
|
LDVs recharging points
|
3.51
|
11.41
|
16.27
|
4.35
|
15.84
|
22.50
|
Source: PRIMES-TREMOVE model results (E3Modelling)
Table 37: Total capital and operation costs in the baseline and under the assumption that the share of fast recharging points remains unchanged over time (difference to the baseline), PV of total costs for 2021-2050
|
Total costs in the baseline and difference to the baseline, expressed as PV (€ billion)
|
Baseline
|
PO2
|
PO2 (average power output of 11kW)
|
|
|
CAPEX
|
OPEX
|
Total
|
CAPEX
|
OPEX
|
Total
|
CAPEX
|
OPEX
|
Total
|
|
LDVs recharging points
|
16.2
|
2.4
|
18.6
|
22.5
|
2.8
|
25.3
|
19.5
|
2.6
|
22.2
|
Source: PRIMES-TREMOVE model results (E3Modelling)
Sensitivity analysis on smart charging functionalities
As outlined in chapter 2.1.2, the total energy demand from electric vehicles in 2030 is expected to be around 2% and will increase to up to 10% by 2040. It is expected that post 2030, around 60% of all recharging events are expected to take place at private recharging points. For smart recharging and bi-directional recharging to take place, the EV needs to be parked for a significant period of time. This is usually the case when charging at private recharging points and at normal publicly accessible recharging points with a power output of 22 kW or lower. However, while there has been progress in developing smart charging and bi-directional charging capabilities, development is still in its early stages but markets are expected to develop further towards 2030. This will be even ore the case when more renewables will come into the electricity system and the required flexibility will be fully rewarded in the electricity markets.
A recent study on recharging and grid integration estimated the costs for equipping a publicly accessible charging point with smart functionalities to be around EUR 300 EUR. These costs are expected to decrease to 136 Euro per charger by 2025 and to 113 Euro per charger by 2030. Once the electricity markets fully rewards flexibility, by 2030, every smart recharging point can create on average a system benefit of more than 100 EUR/year. However, revenues from providing flexibility largely depend on the local conditions, e.g. the need for flexibility in that specific area, that are unlikely to develop evenly across the EU. On the other hand, if a large number of non-smart charging points being developed in certain areas, system integration could be impeded. With increasing shares of variable renewable energy sources in Member States’ electricity mix putting pressures on grids, demand response is growing increasingly important as a tool to enable flexibility. The presence of a possibly significant number of non-smart charging points would hinder the ability of EV users and third parties to participate in demand response. This infrastructure could effectively comprise stranded assets.
7.8.Sensitivity analysis on the requirements for HDV recharging points
As also outlined in annex 7.2 there are uncertainties with regards to the expected uptake of electric heavy-duty vechiles. The overall ambition of the ‘Fit for 55’ package as well as the upcoming revision of the Regulation on CO2 emission performace standards for heavy duty vehciles is leikley to lead to a much higher uptake of electric heavy duty vehciles as expected at the time the targets under Policy Option 2 were formulated. Also vehicle manufacturers have in 2021 corrected their expected sale figures upwards and have been channeling investments accordingly. Therefore, it is prudent to analyse in a sensitivity analysis what a higher uptake of battery electric HDV vehicles would mean in terms of number of recharging points required and the associated costs.
To do so, three cases were analysed. All cases would assume a considerable increase in power ouput per location that would at least be able to serve twice as many trucks as in Policy Option 2. In cases 1 and 2 the power output would increase by around three times in 2025 and 3.5 times by 2030 while also assuming that larger recharging points of 500 kW or more will be deployed that would be able to charge larger batteries during the drivers break. Case 1 also reduces the distance between recharging hubs on the TEN-T comprehensive network from 100 km to 60 km to take accont of the larger electric HDV fleet. In case 3 it is assumed that twice the number of recharging points is to be deployed at every TEN-T location as under Policy Option 3 in 2025 and 2.5 times more than in 2030, or 2030/2035 for the comprehensive network respectively.
Case 1:
·Recharging hubs along TEN-T core network, every 60 km in each direction. By 2025: 2000 kW capacity and by 2030: 50000 kW capacity;
·Recharging hubs along TEN-T core, every 60 km in each direction. By 2030: 2000 kW capacity and by 2035: 5000 kW capacity.
·
Case 2:
·Same as case 1 but with 100 km distance between recharging pools on the TEN-T comprehensive network.
Case 3:
·Recharging hubs along TEN-T core network, every 60 km in each direction. By 2025: 1400 kW capacity and by 2030: 3500 kW capacity;
·Recharging hubs along TEN-T core, every 60 km in each direction. By 2030: 1400 kW capacity and by 2035: 3500 kW capacity.
Such higher taregts will have a significant impact on the number of recharging points to be deployed. The number of recharging points will go up from 6,493 under Policy Option 2 in 2030 to 15,042 or 13,728 under case 1/2 and to 12,946 under case 3. This trend will continue alo towards 2040 and 2050.
Table 38: number of HDVs charging points in PO2 and sensitivity cases
|
HDVs recharging infrastructure at EU27 level
|
PO2
|
PO2 (Case 1)
|
|
|
2030
|
2040
|
2050
|
2030
|
2040
|
2050
|
|
HDVs charging points
|
6,493
|
10,660
|
13,014
|
15,042
|
24,958
|
29,618
|
|
HDVs recharging infrastructure at EU27 level
|
PO2 (Case 2)
|
PO2 (Case 3)
|
|
|
2030
|
2040
|
2050
|
2030
|
2040
|
2050
|
|
HDVs charging points
|
13,728
|
20,624
|
24,042
|
12,946
|
19,378
|
22,664
|
Source: PRIMES-TREMOVE model results (E3Modelling)
The average annual investment and operation costs will increase in line with the increased number of recharging points.
Table 39: Average annual investments for 2021-2030 and 2031-2050 in PO2 and sensitivity cases for the HDVs charging points
|
Average annual investments (€ billion)
|
PO2
|
PO2 (Case 1)
|
PO2 (Case 2)
|
PO2 (Case 3)
|
|
|
'21-'30
|
'31-'50
|
'21-'30
|
'31-'50
|
'21-'30
|
'31-'50
|
'21-'30
|
'31-'50
|
|
HDVs charging points
|
0.14
|
0.19
|
0.49
|
0.48
|
0.45
|
0.39
|
0.31
|
0.31
|
Source: PRIMES-TREMOVE model results (E3Modelling)
Table 40: Average annual operation costs for 2021-2030 and 2031-2050 in PO2 and sensitivity cases for the HDVs charging points
|
Average annual operation costs (€ billion)
|
PO2
|
PO2 (Case 1)
|
PO2 (Case 2)
|
PO2 (Case 3)
|
|
|
'21-'30
|
'31-'50
|
'21-'30
|
'31-'50
|
'21-'30
|
'31-'50
|
'21-'30
|
'31-'50
|
|
HDVs charging points
|
0.01
|
0.03
|
0.03
|
0.07
|
0.03
|
0.06
|
0.03
|
0.05
|
Source: PRIMES-TREMOVE model results (E3Modelling)
Table 41: Total capital and operation costs in the baseline, PO2 and sensitivity cases for the HDVs charging points (difference to the baseline), PV of total costs for 2021-2050
|
Total costs in the baseline and difference to the baseline, expressed as PV (€ billion)
|
Baseline
|
PO2
|
PO2 (Case 1)
|
|
|
CAPEX
|
OPEX
|
Total
|
CAPEX
|
OPEX
|
Total
|
CAPEX
|
OPEX
|
Total
|
|
HDVs charging points
|
0.2
|
0.0
|
0.2
|
2.5
|
0.3
|
2.9
|
8.0
|
0.8
|
8.8
|
|
Total costs in the baseline and difference to the baseline, expressed as PV (€ billion)
|
Baseline
|
PO2 (Case 2)
|
PO2 (Case 3)
|
|
|
CAPEX
|
OPEX
|
Total
|
CAPEX
|
OPEX
|
Total
|
CAPEX
|
OPEX
|
Total
|
|
HDVs charging points
|
0.2
|
0.0
|
0.2
|
6.8
|
0.7
|
7.5
|
4.9
|
0.6
|
5.6
|
Source: PRIMES-TREMOVE model results (E3Modelling)
8.Preferred option
8.1.Context
When proposing its updated 2030 greenhouse gas emissions reduction target of at least 55%, the European Commission also described the actions across all sectors of the economy that would complement national efforts to achieve the increased ambition. A number of impact assessments have been prepared to support the envisaged revisions of key legislative instruments. Against this background, this impact assessment has analysed the various options through which a revision of the Alternative Fuels Infrastructure Directive could effectively and efficiently contribute to the delivery of the updated policy ambition as part of a wider “Fit for 55” policy package.
Methodological approach
Drawing conclusions about preferred options from this analysis requires tackling two methodological issues.
First, as often the case in impact assessment analysis, ranking options may not be straightforward as it may not be possible to compare options through a single metric and no option may clearly dominate the others across relevant criteria. Ranking then requires an implicit weighting of the different criteria that can only be justifiably established at the political level. In such cases, an impact assessment should wean out as many inferior options as possible while transparently provide the information required for political decision- making. This is what this report does for a number of options that would not be sufficient to deliver on the required sufficiency level for infrastructure (see discarded policy option in section 5.3) or risk to lead to an oversupply of infrastructure, leading to very high costs for public authorities (see sensitivity analysis in section 7.6).
Secondly, the “Fit for 55” package involves a high number of interlinked initiatives underpinned by individual impact assessments. Therefore, there is a need to ensure coherence between preferred options of various impact assessments.
Policy interactions
Given the complex interdependence across policy tools and the interplay with the previous methodological issue outlined above, no simultaneous determination of a preferred policy package is thus possible. A sequential approach was therefore necessary.
First, the common economic assessment, underpinning the “Communication on Stepping up Europe’s 2030 climate ambition” looked at the feasibility of achieving a higher climate target and provided insights into the efforts that individual sectors would have to make. It could not, however, discuss precise sectoral ambitions or detailed policy tools. Rather, it looked at a range of possible pathways/scenarios to explore the delivery of the increased climate ambition. It noted particular benefits in deploying a broad mix of policy instruments, including strengthened carbon pricing, increased regulatory policy ambition and the identification of the investments to step up the climate ambition.
An update of the pathway/scenario focusing on a combination of extended use of carbon pricing and medium intensification of regulatory measures in all sectors of the economy, while also reflecting the COVID-19 pandemic and the National Energy and Climate Plans, confirmed these findings.
Taking this pathway and the Communication on Stepping up Europe’s 2030 climate ambition as central reference, individual impact assessments for all “Fit for 55” initiatives were then developed with a view to provide the required evidence base for the final step of detailing an effective, efficient and coherent “Fit for 55” package.
At the aggregate level, these impact assessments provide considerable reassurances about the policy indications adopted by the Commission in the Communication on Stepping up Europe’s 2030 climate ambition.
Preferred policy approach
Preliminarily assuming this fact and the analysis above as the framework for the aggregate “Fit for 55” package, the specific analysis carried out in this impact assessment would suggest the following preferred policy approach to the revision of the Directive:
·Setting stringent mandatory national fleet based minimum targets on national level to ensure sufficiency of infrastructure supply (electric recharging points for LDV only) and distance based infrastructure targets along the TEN-T network, including OPS for ports and electricity supply for stationary aircrafts to achieve full sufficient network coverage
·Identifying a list of common technical specifications needed and continue the current mandate of the Commission to adopt delegated acts to transfer adopted European standards for physical interfaces as well as communication protocols into the Directive to achieve full interoperability
·Comprehensive minimum requirements related to user information, data provision and a common bank card based payment function to achieve full seamless user experience and enable the internal market to bring about innovative user services building on a commonly used data infrastructure.
The final step of the sequential approach outlined above for the coherent design of the “Fit for 55” proposals will be carried out on the basis of the analysis of this and the other impact assessment reports. The choices left open for policy-makers will be taken, measures fine-tuned and calibrated, and coherence ensured. Until that stage, all indications of preferred measures are to be considered preliminary as preserving effectiveness, efficiency and coherence may require adjustments as the final package takes shape.
In particular, stricter requirements on CO2 standards for cars and vans that will drive a faster uptake of zero emission - likely electric - cars and vans would be accommodated through the fleet based targets in the directive that will automatically lead to more infrastructure. Only if the targets would be much more stringent than assessed in the impact assessment accompanying the revision of the emission performance standards for new passenger cars and for new light commercial vehicles, higher recharging capacity at refueling points on the TEN-T network could be considered necessary.
A complementary document to the full set of individual impact assessments looking at the effectiveness, efficiency and coherence of the final package will accompany the “Fit for 55” proposal.
8.2.Identifying the preferred option
PO3 stands out in terms of overall impact, but also grants less flexibility to Member States and will lead to higher overall implementation costs, in particular for port infrastructure. This will likely lead to an asymmetrical abrupt impact on the deployment of alternative fuels infrastructure in all ports of the EU, constraining the flexibility of all ports in providing infrastructure according to the specific circumstances of their operation.
At the end of the other spectrum of POs, PO1 stands out as addressing all policy objectives. It is still fully in line with the ambition under the Climate Target Plan but risks not to fully achieve complete geographic coverage along the TEN-T network, possibly affecting connectivity along parts of the TEN-T network. It also sees certain shortcomings in ensuring full user-friendliness of services and full interoperability, especially in the area of communication protocols in the electro- mobility segment.
PO2 delivers a better balance of short- (2030) and medium (2040) term impact on the uptake of public accessible recharging and refuelling infrastructure in road, ports and airports. It ensures full sufficiency of recharging and refuelling infrastructure and stands out compared to PO1 with the introduction of a distance based target for LDV recharging points along the TEN-T network, further specifying the fleet based approach. This is a key achievement in view of ensuring full coverage of dense fast recharging network and thereby ensuring full connectivity throughout the EU. It also ensures that urban nodes are sufficiently equipped with recharging and refuelling infrastructure to fully accommodate long distance freight and urban delivery transport. PO2 ensures the needed uptake of low- and zero-emission vehicles, which are key for making substantial deliveries on key citizens benefits (health, quality of life) and future growth and competitiveness of the automotive and energy sector. While PO3 also provides this feature, PO2 leaves greater autonomy and flexibility to Member States, while ensuring the same overall outcome, and provides sufficient lead time for the introduction of relevant waterborne and aviation alternative fuels infrastructure.
From the overall perspective of ensuring an effective and (cost-) efficient approach that also fully respects coherence aspects, PO2 fares best among the three POs. It strikes the best balance between the achieved objectives and the implementation cost. It addresses all needs for sufficient infrastructure for light- and heavy-duty road transport vehicles and vessels as well as aircraft, taking into account the maturity of different technologies and the evolving demand from the growing fleet of vehicles and vessels. Annex 5.2 includes a detailed description of the regulatory measures included under this policy option.
8.3.REFIT (simplification and improved efficiency)
This initiative has an important REFIT dimension in terms of updating and thereby increasing the level of ambition of the current requirements for rollout of public accessible recharging and refuelling infrastructure under the Alternative Fuels Infrastructure Directive.
Much more ambitious objectives under this Directive are necessary to ensure that there is sufficient and fully interoperable recharging and refuelling infrastructure in place to support the needed market take up of zero- and low-emission vehicles in line with the overall policy ambition of the “Fit for 55” package and its related policy initiatives. At the same time, while increasing the overall policy ambition, the review also includes some important simplification aspects.
Public authorities at national, regional and local authorities will face higher cost as the installation of a sufficient infrastructure for recharging and refuelling of vehicles and vessels will require public support, particularly in areas, where initial demand is low. Higher investment cost will also relate to charge point operators, grid operators or port operators.
Such higher investment cost have to be seen, however, also against the backdrop of significantly increased user demand and large-scale opportunities for creation of new markets and business models. The review of policies under the “Fit for 55” policy package, including initiatives such as the revision of the CO2 standards for cars and vans, and other initiatives such as FuelEU maritime will enable the market take up of zero-emission vehicles as well as servicing the vessels equipped with OPS.
In addition, this initiative includes elements of simplification:
·Replacing the current system of domestic target setting by Member States under their national policy frameworks with a clear approach that sets common requirements to Member States to ensure that infrastructure rollout is in line with emerging fleet development, while at the same time fully equipping the TEN-T core and comprehensive network: this will simplify the business operations of charge-point operators and mobility service providers in the internal market. They will face similar minimum requirements in all Member States. At the same time, the trust of consumers into the robustness of a Pan-EU network of recharging and refuelling infrastructure is increased which will support the overall profitability of recharging and refuelling points and support a stable business case.
·Clear minimum requirements for transparent user information and ad-hoc payment services anywhere in the EU, while also ensuring a provisioning of all relevant data to national data access points of Member States will also benefit market actors. Those requirements will simplify the use of the infrastructure by private and corporate consumers, which currently face a plethora of use approaches, and enable better business service innovation.
This simplification affects primarily charge point operators and mobility service providers. The level of intervention is appropriate in relation to existing business practice (e.g. on providing prices more transparently will not induce substantively higher cost; providing static and dynamic data to national access points will not induce substantively higher cost; providing harmonised minimum conditions for ad-hoc payment provides some, but no intolerable cost), but create a better level-playing field in the internal market that will support both the scaling-up of business practice and the invention of new user services. Consumers and automotive manufacturers benefit from better availability of infrastructure and use services as well as greater certainty about user acceptance of alternative fuels vehicles respectively. All market actors and user groups will benefit from lower information cost and in the case of market actors lower legal compliance cost in the medium term, as the requirements for infrastructure provisioning under the Directive are better harmonised.
The overall higher cost for Member States for the rollout of alternative fuels infrastructure are a consequence of the necessary transition to a sustainable mobility system, as backed by the overall political commitment of Member States to the long-term objective of climate neutrality. Such cost have to been put into the broader context of the transition to zero-emission mobility and the broader net savings of such approach, as outlined in the Impact Assessment for the revision of the CO2 standards for cars and vans. Investment into public accessible infrastructure is a necessary condition to reach those overall net savings.
In addition to support market development, public authorities will also have to install a system of monitoring and compliance of national minimum targets, which could work against the simplification aspects initially. However, monitoring and reporting cost on the implementation of targets and other minimum requirements will be facilitated by a much more coherent approach to common data provisions by market actors and their accessibility through the national access points under the ITS Directive, which are expected to reduce cost for regulatory compliance for public authorities in the short-to-medium term.
In the end, public authorities can also benefit from the provisions of a coherent EU wide framework that will also simplify coordination with public and private market actors.
9.How will actual impacts be monitored and evaluated?
The Commission will follow the progress, the impacts and results of this initiative through a set of regular monitoring tools as well as dedicated evaluations.
The deployment of alternative fuels infrastructure will be the main criterion to evaluate the impacts of the proposed revision of the Directive. Well established monitoring instrument will be used to follow the deployment. The existing planning and reporting mechanisms under the Directive, the National Policy Frameworks and National Implementation reports, will be further strengthened. This will ensure that Member States appropriately plan the infrastructure in line with the targets set in the Directive and report to the Commission on the implementation in a coherent manner. Data provision to the National Access Points of Member States will follow commonly agreed data quality standards. In addition, the European Alternative Fuels Observatory will continue to gather and frequently update vehicle uptake and infrastructure deployment in all Member States. Those instruments combined will enable the Commission to monitor and evaluate impacts.
With respect to ensuring interoperability, the Commission will issue standardisation requests to CEN-CENELEC and then follow up with the European Standardisation Organisations on the established timelines for their development. Dedicated working groups under the Sustainable Transport Forum (STF) established under the Directive will equally monitor the progress and identify further standardisation needs.
In the area of user information and payment systems, dedicated subgroups under the STF will monitor market developments. In addition the Commission may commission a study to analyse for each Member State the implementation of the provisions with regards to user information and market operations to identify possible shortcomings in the implementation of the Directive.
The Commission will also initiate an evaluation to verify whether the objectives of the initiative have been reached, based on the data from the observatory, the NPFs/NIRs and the STF. A full review of the Directive is scheduled for end of 2026 to identify any possible shortcomings but also to identify future needs for legislative actions with respect to emerging technologies, e.g. electric/hydrogen infrastructure for aircrafts, rail and shipping and alternative fuels infrastructure for emerging shipping fuels such as ammonia, methanol and electricity. The list of operational objectives, indicators and data sources is presented in Annex 9.
Annex 1: Procedural information
1 Lead DG, Decide Planning/CWP references
The lead DG is Directorate General for Mobility and Transport (MOVE), Unit B4: Sustainable & Intelligent Transport
DECIDE reference number: PLAN/2019/6184
The development of this initiative was announced under item 1i) in Annex 1 to the Commission Work Programme 2021. The Inception Impact Assessment was published on 6 April 2020.
2 Organisation and timing
The Inter Service Steering Group (ISSG) for the evaluation was set up in March 2019 and includes the following DGs and Services: SG, LS, CLIMA, ENV, ENER, RTD, GROW, MARE, COMP, TAXUD, ECFIN, EMPL, JUST and JRC. The ISG was later extended to cover also the Impact Assessment of the Directive.
The ISSG approved the Impact Assessment roadmap, the Terms of Reference for the External Support Study and the questionnaire for the Open Public Consultation and discussed the main milestones in the process, in particular the different deliverables of the support study. In total, 8 meetings of the ISSG were organised to discuss the evaluation, including virtual meetings, due to the COVID-19 crisis. These meetings took place on 11 September 2019, 31 January 2020, , 2 April 2020, 17 June 2020, 23 September 2020, 19 October 2020, 13 January 2021 and 26 March 2021. Further consultations with the ISSG were carried out by e-mails. When necessary bilateral discussions were also organised with the most concerned services.
3 Consultation of the RSB
The Regulatory Scrutiny Board received the draft version of the impact assessment report on 7 April 2021. The Board meeting took place on 5 May 2021. The board issued a positive opinion on 7 May 2021. The Board made several recommendations. Those were addressed in the revised impact assessment report as follows in the table below.
|
RSB recommendations for IA resubmission
|
Modification of the IA report
|
|
Main considerations
|
|
1) The difference between the options and how they link to the identified problems is not always clear.
|
Section 5.2, including table 2, were updated to provide more detail and better explain the differences between the options and how they link to the problems
|
|
2) The report is not sufficiently nuanced on the extent to which the expected impacts stem from this specific initiative or from other policies, or a combination thereof.
|
More explanations have been added in sections 6.3.1 and 6.3.2 in order to address this point.
|
|
Adjustment requirements
|
|
(1) The report should clarify the content of the options and be more explicit about the differences between them. It should clarify which measures are part of which options. It should better link the options to the problems they are expected to address.
|
Section 5.2, including table 2, were updated to provide more detail and better explain the differences between the options and how they link to the problems
|
|
(2) The report should better explain which climate and pollution impacts can reasonably be attributed to the Alternative Fuels Infrastructure initiative. It should take into account that climate impacts largely derive from other ‘Fit for 55’ initiatives. Qualitative analysis could indicate the kinds of impacts this initiative could have.
|
More explanations have been added in sections 6.3.1 and 6.3.2 in order to address this point.
|
|
(3) The report could better explain the assumptions and logic of the investment needed for the deployment of the infrastructure. It should show how and why public support is expected to decrease over time and where and when private sector investment is foreseen.
|
Additional explanations have been added on the required private and public investments in section 6.1.3.
|
|
(4) The report should better explain the coherence and interaction between the proposed options and the obligation from the FuelEU Maritime initiative for certain types of ships to use onshore power supply.
|
Explaniations on the interlinkages between the FuelEU maritime and AFID have been added in section 5.2.
|
|
(5) The report could make better use of stakeholder views when describing the problem and the options. It should provide a break down of views across different groups.
|
A breakdown of views has been added in annex 3 and stakeholder views are addressed throughout the document.
|
4 Evidence, sources and quality
The impact assessment is based on research/analyses done by the Commission. The Commission also contracted an external, independent consultant (Ricardo) to support this impact assessment. The external support study will be published alongside this report.
Qualitative and quantitative data supporting this impact assessment has been collected from Member States, operators of recharging and refuelling infrastructure, service providers in the area of electro-mobility, fuel producers and distributors, electricity suppliers, Distribution System Operators, technology producers, academia and non-governmental organisations.
Modelling of the policy options in a consistent way with the scenarios prepared in support of the Climate Target Plan has been performed by E3Modelling with the PRIMES-TREMOVE transport model. This report also draws on the activities of the Sustainable Transport Forum, a Commission’s expert groups with industry stakeholders and Member States representation, which was established under the directive.
Annex 2: Stakeholder consultation
1.INTRODUCTION
This annex provides a summary of the outcomes of the consultation activities which have been carried out for the review of the Alternative Fuels Infrastructure Directive, including in the context of the external support study. It notes the range of stakeholders consulted, describes the main consultation activities and provides a succinct analysis of their views and the main issues they raised.
The objective of the consultation activities were to collect information and opinions of stakeholders on the key problem definitions and associated drivers, definition of relevant policy objectives linked to those problem areas and the identification, definition and screening of policy measures that could eventually be incorporated into policy options for this Impact Assessment as well as organise information and opinions on their likely impacts.
The main consultation activities included:
-An Open Public Consultation (OPC), organised by the European Commission that did run from 06 April 2020 to 29 June 2020. The OPC took account of both the Impact Assessment and the evaluation of this Directive.
-Exploratory interviews with EU level representatives of key stakeholders, particularly to support and refine the overall problem definition and possible policy options.
-A targeted stakeholder consultation organised by the consultant in charge of the external support study to the Impact Assessment running from December 2021 to February 2021 and including targeted surveys among key stakeholders as well as targeted interviews and data requests to fill specific information requests, particularly to support the assessment of impacts of possible policy measures
The Commission draw also strongly on the outcomes of a broad stakeholder consultation exercise on problems and future policy needs in the field of alternative fuels infrastructure that the Commission carried out among the member of the Sustainable Transport Forum, the key expert group of the Commission, in the time period of October 2018 to November 2019 and that led to the adoption of a comprehensive report by the plenary of the Sustainable Transport Forum in November 2019. Findings of that exercise helped design the overall consultation activities carried out in the context of this Impact Assessment.
The information collected from stakeholders was key in allowing the Commission to refine the design of the POs as well as to assess their economic, social and environmental impacts, compare them and determine which PO is likely to maximize the benefits/costs ratio for the society and fully contribute to achieving the 2030 climate ambition and the 2050 long-term climate neutrality objective. Findings from those processes complemented the desk research carried out in the context of the external support study.
2.METHODOLOGY
The remainder of the annex presents the main findings from the analysis of stakeholder contributions to the consultation process. They are structured around the main elements of the intervention logic, namely problems and their drivers, key policy objectives as well as key needs and possible aspects of policy design. In general, the initiative as presented in the IIA received positive reactions. A broad majority of sector representatives underlined the strong relevance of providing sufficient alternative fuels infrastructure for the needed uptake of zero- and low-emission vehicles. A broad majority of respondents also agreed to the four main policy priority areas outlined in the IIA. Some contributions called for the need to exclude fossil alternative fuels from the scope of the Directive, while other contributions called for keeping a broad approach including all alternative fuels in view of overall technological neutrality. Many contributions stressed the need for replacing the current approach of national policy frameworks with more binding, quantified targets at European level. Moreover, a broad majority of contributions stressed the need for achieving full interoperability and simplifying the use conditions for customers, including full and transparent information and payment services.
2.1. Feedback on the Inception Impact Assessment
The Commission received 86 responses to the Inception Impact Assessment (IIA) for this initiative during 06 April to 04 May 2020.
Most of the response were provided by companies and business associations (61 out of 86), including actors from both road and waterborne transport and across the entire value chain, also involving energy sector/fuel suppliers representatives., NGOs and citizens also replied to the IIA as well as one cities network. No Member State public authorities provided feedback.
2.2. Open Public Consultation
The Commission launched the 12-week OPC on 6 April and it closed on 29 June 2020. The OPC invited all citizens and organisations to provide input on both the Evaluation and the Impact Assessment of the AFID. In total, 324 responses were received. The breakdown by stakeholder type is shown in Table below.
Table 42: Classification of stakeholders responding to the OPC
|
Stakeholder group
|
Number of responses
|
% of responses
|
|
Company/business organisation
|
107
|
33%
|
|
Business association
|
80
|
24.7%
|
|
Public authority (national, regional and local authorities)
|
28
|
8.6%
|
|
Non-governmental organisation (including relevant industry associations)
|
22
|
6.8%
|
|
Consumer organisation
|
7
|
2.2%
|
|
Environmental organisation
|
1
|
0.3%
|
|
Academic/research institute
|
1
|
0.3%
|
|
EU citizen
|
70
|
21.6%
|
|
Non-EU citizen
|
1
|
0.3%
|
|
Other
|
7
|
2.2%
|
In terms of geographical/Member State distribution, the majority of respondents indicated that their country of origin was one of the EU Member States (315 respondents). Nine respondents were based outside of the EU. The number and percentage of respondents by country of origin is shown in the following table:
Table 43: Geographical distribution of responses received
|
Country of origin
|
Number of responses
|
% of responses
|
Country of origin
|
Number of responses
|
% of responses
|
|
Belgium
|
60
|
18.5
|
Slovakia
|
2
|
0.6
|
|
France
|
53
|
16.4
|
Denmark
|
1
|
0.3
|
|
Italy
|
50
|
15.4
|
Estonia
|
1
|
0.3
|
|
Germany
|
49
|
15.1
|
Greece
|
1
|
0.3
|
|
Sweden
|
19
|
5.9
|
Luxembourg
|
1
|
0.3
|
|
Netherlands
|
17
|
5.2
|
Malta
|
1
|
0.3
|
|
Spain
|
11
|
3.4
|
Romania
|
1
|
0.3
|
|
Austria
|
10
|
3.1
|
Canada
|
1
|
0.3
|
|
Czech Republic
|
8
|
2.5
|
Grenada
|
1
|
0.3
|
|
Poland
|
8
|
2.5
|
Israel
|
1
|
0.3
|
|
Finland
|
6
|
1.9
|
Japan
|
1
|
0.3
|
|
Hungary
|
6
|
1.9
|
Norway
|
1
|
0.3
|
|
Ireland
|
5
|
1.5
|
Switzerland
|
1
|
0.3
|
|
Slovenia
|
3
|
0.9
|
United Kingdom
|
2
|
0.6
|
|
Latvia
|
2
|
0.6
|
United States
|
1
|
0.3
|
2.3. Exploratory interviews and targeted consultations
Four exploratory interviews were undertaken with selected stakeholders during the inception phase of the study, including with AVERE, NGVA Europe, T&E and ACEA. Those interviews helped to refine the problem definition and the possible policy options. Furthermore, these interviews have contributed to the process of designing the draft survey questions and interview guides.
Further interviews were conducted and an online survey was distributed. Both the interviews and the survey were aimed at a range of relevant stakeholders representing public authorities and other public bodies (national, regional and local authorities, EU bodies) industry representatives (including relevant associations), and members of the civil society (NGOs, consumer groups).
The interviews and surveys focused on obtaining detailed input on the expected impacts (economic, social and environmental) of the measures under consideration in comparison to the baseline, the possible issues that may arise and identifying the level of support for specific measures. Where relevant, stakeholders were asked for input on the cost implications of each measure. Surveys and interviews commenced end October 2020 and concluded January 2021.
Table 44: Summary of stakeholder interviews and surveys completed
|
Type of stakeholder
|
Number of interviews conducted
|
Number of additional surveys received
|
Total
|
|
Public authorities and other public bodies
|
3
|
17
|
20
|
|
Industry and associations
|
16
|
25
|
41
|
|
Civic society
|
5
|
n/a
|
5
|
|
TOTAL
|
24
|
42
|
66
|
The full list of stakeholders interviewed is included in the external support study.
3.Analysis of the results of the stakeholder consultation
The remainder of the annex presents the main findings from the analysis of stakeholder contributions to the consultation process. They are structured around the main elements of the intervention logic, including the problem areas and their drivers, the policy objectives as well as the key aspects of the design of possible policy measures. The technical support study for this Impact Assessment contains the detailed presentation of findings from the OPC and the targeted consultation activities.
3.1. Problem areas and policy objectives
In the OPC, almost all OPC respondents (98%, or 296 out of 303) confimed the continued relevance of a clear policy framework for alternative fuels infrastructure.
Respondents to the OPC showed a large consensus about the relevance of the identified problem areas and their problem drivers (figure 5). When adding qualitative results from the stakeholder interviews, studies and position papers that were submitted as part of the OPC and analysed in the context of the technical support study alongside the replies to the OPC the conclusion is that there is a broad consensus among all relevant stakeholders groups on the main problems as identified by the initiaitve, while they also support the underlying objectives of ensuring accelerated rollout of alternative fuels infrastrucutre, full interoperability and sufficient consumer information.
Figure 6: Stakeholder views on key problem drivers.

The OPC also showed a large consensus about the importance of revising the identified aspects of AFID (figure 6). Those aspects include particularly the provisions to ensure appropriate infrastructure coverage, to ensure interoperability and user information as well as technical specifications. The aspect identified in the OPC as being most important to revise was ‘provisions on ensuring an appropriate infrastructure coverage’, with 267 (out of 299 respondents) indicating it was either very important or important. This was followed by ‘provisions on interoperability and user information’ (251 out of 299 respondents) and ‘provisions on monitoring and reporting’ (203 out of 292). The aspect considered to be least important in terms of revision was ‘scope with respect to fuels addressed in the Directive’, with 58 out of 324 stating it was not important, and a further 45 stating is was less important.
Figure 7: stakeholder views on the importance on the revision of parts of the Alternative Fuels Infrastructure Directive

3.2. Potential policy measures
According to the OPC results, all of the envisaged policy measures are broadly regarded to be of importance at least to some extent.
Mandatory deployment targets
Respondents to the OPC considered the following areas to be the most useful (very useful or useful) with respect to mandatory infrastructure targets in road transport - electricity for cars and vans (196 out of 279 respondents), electricity for heavy duty vehicles (177 out of 280), electricity for buses (166 out of 278) and hydrogen for heavy duty vehicles (141 out of 275). Those areas with a high number of responses stating that they were not useful included CNG for cars and vans (57 out of 280 respondents), hydrogen for cars and vans (55 out of 273), LNG for inland navigation (53 out of 278) and LNG for heavy duty vehicles (51 out of 273). A full listing for all the different targets in the different modes of transport is included in the technical support study. In waterborne transport, respondents to the OPC noted that in case of mandatory targets port service providers should offer in ports of the TEN-T network electricity with highest priority throughout all stakeholder groups (129 responses, multiple responses possible). This was followed by hydrogen (91 responses) and LNG (66 responses).
Moreover, the greatest number of stakeholders (129 out of 267 responses) agreed that deployment targets should address the entire transport network, while a smaller number (56 out of 267 responses) stated that they should be applicable to the TEN-T core and comprehensive network, and an even smaller number (48 out of 267) stating that they should be applicable only to the TEN-T core network, including the most important transport connections and nodes in EU represented by the core network corridors.
Stakeholders predominantly opted for European legislation to set binding targets for Member States following a common methodology (142 out of 268 respondents). Stakeholders majority (140 out of 261 responses) also stated that compliance could best monitored through the reporting of public authorities in Member States to the EU
Mandatory requirements for full interoperability
There was a large-scale agreement in the OPC about the need for further mandatory technical requirements/standards to ensure full interoperability of infrastructure and services across Europe. 222 out of 294 stakeholders across all groupings indicated that they did. Only 36 stakeholders did not agree.
Figure 8: Do you believe that further mandatory technical requirements/standards are required to ensure full interoperability of infrastructure and services across Europe?

The majority of follow-up responses to needs for technical interoperability concerned a range of different aspects of electric vehicle recharging, including for open standards and communication protocols. Those were corroborated by the feedback from the targeted consultations and the findings from a broad range of literature analysed in the context of the technical support study.
Minimum requirements for consumer information and payment services
Stakeholders through the OPC and the targeted consultations regarded all of the policy measures in this area to be relevant, at least to some extent.
·Stakeholders identified a clear need for making available information on alternative fuels infrastructure to users by digital means (e.g. an app). 244 out of 292 respondents to the OPC confirmed this as relevant. This view was corroborated by information from the targeted consultations about the need for digital connectivity of recharging and refuelling stations. Information to be particularly provided include location of recharging and refuelling points, operator information and opening hours as well as the type of recharging and refuelling point (e.g. power, installed capacity, available connector type etc.).
·Stakeholders, however, also pointed to the indispensable need for improving physical signposting for recharging and refuelling points and the need for common provisions. 180 out of 285 stakeholders agreed that such provisions are needed. This was the trend throughout all stakeholder groups.
·In relation to payment service provisions, the largest group of stakeholders noted that payment by bank cards should be the main mechanism (69 out 147), whereas a considerably smaller group noted that this should happen by smartphone/ banking app (36 out of 147).
·With regard to the need for harmonisation of the display of recharging fees, a clear majority of stakeholders (187 out of 278 respondents) agreed that there should be EU wide provisions. Only 32 stakeholders responded ‘no’. The highest selected option (229 out of 277 responses) was that refuelling/recharging prices should be displayed in every digital app that provides information on charging infrastructure, while a slightly lower majority (214 out of 277) noted relevance of display at the refuelling/recharging station. The third highest selected answer was prices to be displayed in every vehicle information system with much fewer votes at 90 overall. These trends were consistent throughout all stakeholder groups. Stakeholders also provided feedback that there should be possible exemption possibilities to enable a more flexible handling of minimum requirements in view of diverging implementation conditions.
·With regard to market access for service providers, respondents to the OPC showed a mixed response, but the highest picked option was that all e-mobility service providers should be allowed to offer their services at any charge-point at a non-discriminatory price set by the charge-point providers. There was confirmation in the targeted consultation that prices should be set in separate negotiations between the charge point operator and the mobility service provider.
Figure 9: overview to responses about policy measures introduced at EU level regarding market access to services

3.3. Possible impacts
In every case, the majority of respondents fully agreed or agreed with expected positive economic aspects of the review of the Directive. The areas with marked support from stakeholders include:
·Intended measures under the review of this Directive will contribute to a bigger market in the EU for alternative fuels (255 out of 286 responses);
·Intended measures under the review of this Directive will lead to growth and jobs in the production of vehicles/vessels and manufacturers of alternative fuels infrastructure (244 out of 284 responses);
·Intended measures under the review of this Directive will have a positive impact on research and innovation (243 out of 284 responses);
·Intended measures under the review of this Directive will improve international competitiveness of European industry (229 out of 283 responses).
In addition, a majority of stakeholders agreed to the positive environmental impacts of this policy initiative. 265 out 275 stakeholders agreed that the measures would lead to less emissions of CO2 from vehicle/vessel fleets. Only 6 stakeholders from industry and 4 from citizens voted ‘rather disagree’. 267 out of 274 stakeholders agreed that the measures would lead to less emissions of air pollutants from vehicle/vessel fleets. Only 7 votes disagreed, 1 from citizens and 6 from industry which also contained 1 ‘completely disagree’. 257 out of 261 stakeholders agreed that the measures would have positive effects on human health with the 4 negative votes spread between industry, citizens and authorities.
Stakeholders were split in their views on positive and negative impacts on the increase of administrative burden. 104 stakeholders agreed that there will be increase in administrative burden, while 122 disagreed. Industry and civic society had more votes indicating disagreement with 73 disagreements compared to 56 agreements for industry and 17 disagreements compared to 8 agreements for civic society. Citizens only slightly favoured agreement with 30 votes compared to 28 whilst 10 authorities agreed compared to only 4 disagreeing.
3.4. Differences among stakeholder groups
Virtually all consulted stakeholders supported the main problems and objectives addressed in this report. As regards the fuels to be included in the scope of the Directive, environmental NGOs, a majority of stakeholders from the electric mobility community and from citizens objected the continued inclusion of LNG, in particular for road transport. In their opinion, only zero-emission powertrain technologies should be supported, politically and financially. Industry representatives, particularly from the natural gas industry and from the biofuels industry, strongly advocated for natural gas to remain within the scope of the Directive, as any infrastructure that is build today can also be used for sustainable biogas and synthetic gas in the future. Those fuels would be fully in line with the EU’s ambition under the European Green Deal. For shipping a similar actor constellation can be found. Comparatively there was greater support to keep LNG in the scope of the Directive, as especially for the maritime sector there are currently no proven and economically viable alternatives to LNG available.
Regarding binding minimum targets set at EU level, there was quite a broad supportive call from automotive industry, electro mobility stakeholders, hydrogen industry and citizens for ambitious mandatory targets for electric recharging and hydrogen refuelling infrastructure. More mixed responses came from the energy sector, but still showing some support for targets that would be reflective of real vehicle uptake. Public authorities showed greater reservations. For shipping there were strong calls from environmental NGOs to introduce mandatory targets for on-shore power supply. The shipping industry and ports called for a more open goal based approach.
Throughout all stakeholder groups, the consultation showed broad support for continuing the norming of common technical specifications for all transport modes and all alternative fuels infrastructure on the basis of European standards. There was a similar support extending this approach of technical specification to communication protocols/interfaces in the electro mobility domain. There was equally wide stakeholder support for all measures improving consumer information. Operators of recharging points pointed to the potential costs that mandatory bank card payments through only terminal solutions would induce.
Annex 3: Who is affected and how?
PRACTICAL IMPLICATIONS OF THE INITIATIVE
Summary of the preferred policy option implementation
The revision of the Alternative Fuels Infrastructure Directive aims at ensuring the availability and usability of a dense, wide-spread network of alternative fuel infrastructure throughout the EU. Ensuring such a network is critical to fully support the uptake of zero- and low-emission vehicles and vessels in the EU which is relevant for ensuring the contribution of the sector to the increased climate ambition by 2030 and to the European ambition of achieving climate-neutrality in the EU by 2050. All users of alternatively-fuelled vehicle/vessel/aircraft shall circulate at ease across the EU, enabled by key infrastructure such as motorways, ports and airports.
The preferred policy option identified in the context of this Impact Assessment, policy option 2, sets minimum targets for road transport infrastructure at national level, including a vehicle-fleet based minimum target for recharging infrastructure of light-duty electric vehicles and distance-based targets for recharging and refuelling infrastructure for light- and heavy-duty electric and hydrogen-fuel cell vehicles as well as LNG trucks. The preferred policy option further sets minimum requirements for installation of on-shore power supply (OPS) in maritime and inland waterway TEN-T core and comprehensive ports, while continuing the requirement of the current Directive for provisioning of LNG refuelling points in TEN-T core maritime ports to ensure circulation of vessels on the TEN-T core network. Member States have to further ensure to address infrastructure needs for emerging alternative fuels technologies in modes of rail, waterborne and aviation through their national policy frameworks under this Directive, which will be continued in a revised format.
The preferred policy option envisages further common minimum requirements for interoperability of alternative fuels infrastructure, including defining further common technical specifications, and common minimum requirements for adequate customer information and payment options. Here, the preferred policy options aims at providing consumers with a full understanding of location, accessibility and availability of recharging and refuelling points as well as a pricing conditions and modes of payment, where minimum conditions for effective and simplified ad-hoc payment on the basis of bank cards will apply. Infrastructure operators will be required to share static and dynamic data through the national or common access points of Member States, as established under the Intelligent Transport Systems Directive. This will assist the monitoring of compliance and enforcement as well as support scaling-up of innovative use services and thus support the creation of a full internal market (see also annex 5.3 for a detailed description of the preferred policy option).
Implications on consumers, market actors and public authorities
The revision has implications for different actors across modes of transport. The following key target groups of this initiative have been identified:
·Operators of recharging and refuelling infrastructure for road transport
·Mobility service providers for recharging and refuelling of road transport vehicles
·Port operators
·Airport operators
·Distribution system operators
·Public authorities a national, regional and local levels
·Vehicle and equipment manufacturers and suppliers
·Fuel producers and suppliers
·Private vehicle users
·Logistic operators, including road and ship operators
·Airlines
·Rail operators
The remainder of this annex indicates how these actors are affected by this policy initiative. It needs to be noted that some actors can fulfil different roles at the same time, e.g. quite a few distribution system operators (electricity grid) also operate recharging infrastructure and offer electric mobility services, for example. Quite a few vehicle and equipment manufacturers also have started to provide charging services or even run recharging infrastructure. Benefits and cost can hence not always be attributed clearly to individual actors.
In road transport, charge point operators, refuelling point operators and distribution system operators are the stakeholder category mostly impacted by the proposed intervention. Charge point operators and refuelling point operators have to put into place the sufficient electricity recharging and hydrogen refuelling infrastructure in accordance with the provisions of the revised Directive, including for interoperability, consumer information and payment services. The implications for LNG infrastructure are modest, as only a very limited number of refuelling stations will need to be constructed to fill remaining gaps in the TEN-T network. Distribution system operators will have to invest into grid stability and flexibility and – where necessary -into grid extensions, in particularly in view of HDV recharging needs. Overall cost are more limited in the early phase of the intervention and increase later on. Moreover, increased demand from a quickly growing fleet of zero- and low-emission vehicles will lead to quickly improving conditions for profitability of recharging and refuelling infrastructure in many instances, leading over time to a fully mature market development model, where revenue of operations will enable infrastructure deployment and maintenance.
Measures for interoperability, consumer information and data sharing also impact on mobility service providers that sell recharging and refuelling services to their customers, but do not operate the infrastructure themselves. Their costs are however relatively low; overall those actors will strongly benefit from increased vehicle demand and increased infrastructure availability.
Public authorities are affected in two ways: They have to continue public support in areas where market demand is initially low. However, while aid intensities may be high in the initial stages, the commercial profitability of recharging and refuelling infrastructure will increase, only requiring limited support for recharging and hydrogen refuelling stations post 2030 while no public support is expected post 2030 for natural gas infrastructure. Moreover, they face cost for reviewing and updating their national policy frameworks (NPFs) and subsequently report on the implementation, including the organisation of stakeholder exchange to identify emerging needs for alternative fuels in all modes of transport and setting up a framework for discussing how to best address those needs, including through, for example extended coordination of R&I and deployment efforts at national level and cross-border with other Member States. However, these costs are not expected to be different from the baseline scenario. Data reporting will make use of the existing provisions for national access points under the ITS directive and will draw on requirements for data categories and data quality standards, that Commission and Member States authorities are already developing.
All vehicle users (private and commercial) benefit from the provisions of this Directive, as the review provides certainty about the usability and use conditions of recharging and refuelling infrastructure in the Union. Automotive and equipment manufacturers and suppliers benefit from the review, as the revised provisions support the required market take up of zero and low-emission vehicles and ensure investment in the infrastructure. Indirectly, they will be in a position to strengthen their competitiveness position and growth paths in the quickly accelerating markets of zero-emission vehicles. Fuel suppliers are indirectly impacted, as they have to provide hydrogen to an increased network of hydrogen stations. They directly profit from increased demand for renewable and low carbon transport fuels through a largely extended transport infrastructure network.
In waterborne transport, ports are directly affected by the provisions of this policy initiative. Maritime and inland ports on the TEN-T core and comprehensive network have to invest into infrastructure for OPS connections for ships at berth (focussing on container ships, passenger ships and ro-pax vessels), which will also lead to an increase in support from public authorities. Ports will also have to plan their long-term fuel mix strategies, including planning for specific infrastructure dedicated to hydrogen or ammonia or recharging of battery-electric ships. But there is no direct impact from provisions under this review. While maritime ports face no change in investment cost for LNG infrastructure in relation to the baseline, as the requirement of the current Directive continues, inland ports are relieved from investment into LNG as there is no longer a requirement for LNG infrastructure compared to the baseline. Ports will also face compliance cost in terms of reporting on their infrastructure provisioning and in view of their participation to strategy formation under the national policy frameworks review.
Ship operators indirectly benefit from this initiative. Subject to requirements for emission savings under the FuelEU Maritime initiative, this policy initiative enables infrastructure provisions that will help ship operators to meet part of their emission saving obligation, particularly through the use of on-shore power supply. Moreover, ports will provide the infrastructure needed to use all sustainable alternative fuels supposed to be blended with conventional fuels, that will help meet overall FuelEU Maritime obligations.
In aviation transport, airport operators are directly affected by the provisions of this policy initiative. Main additional investment cost stem from the provisions for electricity supply at gates and outfield posts. Airports will also have to plan their long-term fuel mix strategies, including planning for specific infrastructure dedicated to hydrogen or ammonia or recharging of battery-electric ships. But there is no direct impact from provisions under this review.
Airlines indirectly benefit from this initiative. Subject to requirements for emission savings under the RefuelEU aviation initiative, airports will provide the infrastructure needed to use all sustainable alternative fuels supposed to be blended with conventional fuels, that will help meet overall RefuelEU aviation obligations, while ensuring electricity supply at all gates and outfield positions.
SUMMARY OF COSTS AND BENEFITS
|
I. Overview of Benefits (total for all provisions) – Preferred Option - PO2 (expressed relative to the baseline)
|
|
Description
|
Amount
|
Comments
|
|
Direct benefits
|
|
Consumer and business benefits
|
|
Consumers and businesses will directly benefit from a dense and fully interoperable recharging and refuelling infrastructure for their low and zero emission vehicles as well as from transparent information and better infrastructure use services (location, accessibility, pricing transparency, payments) which will simplify vehicle operation and save informational cost. These are equally important factors when it comes to purchase decisions and therefore a prerequisite for the widespread uptake of such vehicles.
|
|
Indirect benefits
|
|
Reduction of external costs related to CO2 emissions relative to the baseline (i.e. present value over 2021-2050)
|
€445 billion
|
Indirect benefit to society at large. It is the effect of the reduction in the CO2 emissions resulting from the uptake of low- and zero-emission vehicles. The reduction in the external costs of CO2 emissions is estimated at around €445 billion relative to the baseline over the 2021-2050 period, expressed as present value. These reductions are driven by other policies, but enabled by the uptake of infrastructure.
|
|
Reduction of external costs related to air pollution emissions relative to the baseline (i.e. present value over 2021-2050)
|
€75 billion
|
Indirect benefit to society at large. It is the effect of the reduction in the air pollution emissions resulting from the uptake of low- and zero-emission vehicles. The reduction in the external costs of air pollution emissions is estimated at around €75 billion relative to the baseline over the 2021-2050 period, expressed as present value. These reductions are driven by other policies, but enabled by the uptake of infrastructure.
|
|
Innovation in the mobility sector
|
|
Provisions for static and dynamic data on recharging and refuelling infrastructure to national (and common) access points of Member States will create a commonly accessible database that will contribute to the development of new innovative services for using that infrastructure. Such common data infrastructure can particularly benefit service innovation and other innovation by SMEs.
Moreover, standardisation of interoperability for smart recharging services will enable better innovative service development which will finally benefit electric vehicle users. This is particularly relevant for smart recharging services that will draw on such common technical specifications. They can bring benefits in terms of remuneration of recharging services, particularly for large-scale corporate fleet operators..
|
|
II. Overview of costs – Preferred option - PO2 (expressed relative to the baseline)
|
|
|
Citizens/Consumers
|
Businesses
|
Administrations
|
|
|
One-off
|
Recurrent
|
One-off
|
Recurrent
|
One-off
|
Recurrent
|
|
Investments and operation costs due to the requirements for infrastructure deployment (average annual costs relative to the baseline)
|
Direct costs
|
-
|
-
|
-
|
Investments
€0.99 bn total average annual investments for 2021-2030 (€0.56 bn for road transport; €0.3648 bn for waterborne; €0.0672 bn for aviation);
€3.96 bn total average annual investments for 2031-2050 for road transport.
Operation costs
€0.08871 bn total average annual operation costs for 2021-2030 (€0.07318 bn for road transport; €0.01553 bn for waterborne);
€1.18107 bn total average annual operation costs for 2031-2050 (€1.16554 bn for road transport; €0.01553 bn for waterborne).
|
-
|
Investment support
€0.64 bn total average annual investments for 2021-2030 (€0.51 bn for road transport; €0.1217 bn for waterborne)
€0.45 bn total average annual investments for 2031-2050 for road transport
|
|
Administrative and monitoring costs
|
Direct costs
|
|
|
|
|
|
The costs to public authorities from the requirements to review and update the national policy frameworks (NPFs) and report on the implementation are the same as in the baseline. Monitoring costs may increase to some extent to report on compliance with the strict targets set. The additional costs relative to the baseline can’t be quantified; and the provision of standardised data formats, digitised data transfer and a common system of reporting to national access points of Member States will simplify overall reporting under the Directive.
|
Annex 4: Analytical methods
1.Description of the modelling tool used
The analytical framework used for the purpose of this impact assessment draws on the impact assessment support study
and builds on the PRIMES and PRIMES-TREMOVE models, complemented by the assessment of the costs for public authorities, etc.
The main models used to produce the scenarios presented in this impact assessment (PRIMES and PRIMES-TREMOVE models) have a successful record of use in the Commission's energy, transport and climate policy assessments. In particular, they have been used for the impact assessment accompanying the 2030 Climate Target Plan
, the Staff Working Document accompanying the Sustainable and Smart Mobility Strategy, the Commission’s proposal for a Long Term Strategy
as well as for the 2020 and 2030 EU’s climate and energy policy framework.
The PRIMES and PRIMES-TREMOVE models are the core elements of the modelling framework for energy, transport and CO2 emission projections. In addition, the POLES-JRC
model has been used for the world energy price projections and the GEM-E3 model
for the macro-economic developments by sector of activity, the GAINS model has been used for non-CO2 greenhouse gas emission projections, the GLOBIOM-G4M models for projections of LULUCF emissions and removals and the CAPRI model for agricultural activity projections in the baseline scenario.
The model suite thus covers:
·The entire energy system (energy demand, supply, prices and investments to the future) and all GHG emissions and removals from the EU economy.
·Time horizon: 1990 to 2070 (5-year time steps).
·Geography: individually all EU Member States, EU candidate countries and, where relevant the United Kingdom, Norway, Switzerland and Bosnia and Herzegovina.
·Impacts: energy system (PRIMES and its satellite model on biomass), transport (PRIMES-TREMOVE), agriculture, waste and other non-CO2 emissions (GAINS), forestry and land use (GLOBIOM-G4M), atmospheric dispersion, health and ecosystems (acidification, eutrophication) (GAINS).
The modelling suite has been continuously updated over the past decade. Updates include the addition of a new buildings module in PRIMES, improved representation of the electricity sector, more granular representation of hydrogen (including cross-border trade) and other innovative fuels, improved representation of the maritime transport sector, as well updated interlinkages of the models to improve land use and non-CO2 modelling. Most recently a major update was done of the policy assumptions, technology costs and macro-economic assumptions in the context of the Reference scenario 2020 update.
The models are linked with each other in such a way to ensure consistency in the building of scenarios. These inter-linkages are necessary to provide the core of the analysis, which are interdependent energy, transport and GHG emissions trends.
Figure 10: Interlinkages between models

Energy: the PRIMES model
The PRIMES model (Price-Induced Market Equilibrium System) is a large scale applied energy system model that provides detailed projections of energy demand, supply, prices and investment to the future, covering the entire energy system including emissions. The distinctive feature of PRIMES is the combination of behavioural modelling (following a micro-economic foundation) with engineering aspects, covering all energy sectors and markets.
The model has a detailed representation of policy instruments related to energy markets and climate, including market drivers, standards, and targets by sector or overall. It simulates the EU Emissions Trading System. It handles multiple policy objectives, such as GHG emissions reductions, energy efficiency, and renewable energy targets, and provides pan-European simulation of internal markets for electricity and gas.
The model covers the horizon up to 2070 in 5-year interval periods and includes all Member States of the EU individually, as well as neighbouring and candidate countries.
PRIMES offer the possibility of handling market distortions, barriers to rational decisions, behaviours and market coordination issues and it has full accounting of costs (CAPEX and OPEX) and investment on infrastructure needs.
PRIMES is designed to analyse complex interactions within the energy system in a multiple agent – multiple markets framework. Decisions by agents are formulated based on microeconomic foundation (utility maximization, cost minimization and market equilibrium) embedding engineering constraints and explicit representation of technologies and vintages, thus allowing for foresight for the modelling of investment in all sectors.
PRIMES allows simulating long-term transformations/transitions and includes non-linear formulation of potentials by type (resources, sites, acceptability etc.) and technology learning. The figure below shows a schematic representation of the PRIMES model.
Figure 11: Schematic representation of the PRIMES model

It includes a detailed numerical model on biomass supply, namely PRIMES-Biomass, which simulates the economics of current and future supply of biomass and waste for energy purposes. The model calculates the inputs in terms of primary feedstock of biomass and waste to satisfy a given demand for bio-energy and provides quantification of the required capacity to transform feedstock into bioenergy commodities. The resulting production costs and prices are quantified. The PRIMES-Biomass model is a key link of communication between the energy system projections obtained by the core PRIMES energy system model and the projections on agriculture, forestry and non-CO2 emissions provided by other modelling tools participating in the scenario modelling suite (CAPRI, GLOBIOM/G4M, GAINS).
It also includes a simple module which projects industrial process GHG emissions.
PRIMES is a private model maintained by E3Modelling, originally developed in the context of a series of research programmes co-financed by the European Commission. The model has been successfully peer-reviewed, last in 2011; team members regularly participate in international conferences and publish in scientific peer-reviewed journals.
Sources for data inputs
A summary of database sources, in the current version of PRIMES, is provided below:
•Eurostat and EEA: Energy Balance sheets, Energy prices (complemented by other sources, such IEA), macroeconomic and sectoral activity data (PRIMES sectors correspond to NACE 3-digit classification), population data and projections, physical activity data (complemented by other sources), CHP surveys, CO2 emission factors (sectoral and reference approaches) and EU ETS registry for allocating emissions between ETS and non ETS
•Technology databases: ODYSSEE-MURE, ICARUS, Eco-design, VGB (power technology costs), TECHPOL – supply sector technologies, NEMS model database, IPPC BAT Technologies
•Power Plant Inventory: ESAP SA and PLATTS
•RES capacities, potential and availability: JRC ENSPRESO, JRC EMHIRES, RES ninja, ECN, DLR and Observer, IRENA
•Network infrastructure: ENTSOE, GIE, other operators
•Other databases: EU GHG inventories, district heating surveys (e.g. from COGEN), buildings and houses statistics and surveys (various sources, including ENTRANZE project, INSPIRE archive, BPIE), JRC-IDEES, update to the EU Building stock Observatory
Transport: the PRIMES-TREMOVE model
The PRIMES-TREMOVE transport model projects the evolution of demand for passengers and freight transport, by transport mode, and transport vehicle/technology, following a formulation based on microeconomic foundation of decisions of multiple actors. Operation, investment and emission costs, various policy measures, utility factors and congestion are among the drivers that influence the projections of the model. The projections of activity, equipment (fleet), usage of equipment, energy consumption and emissions (and other externalities) constitute the set of model outputs.
The PRIMES-TREMOVE transport model can therefore provide the quantitative analysis for the transport sector in the EU, candidate and neighbouring countries covering activity, equipment, energy and emissions. The model accounts for each country separately which means that the detailed long-term outlooks are available both for each country and in aggregate forms (e.g. EU level).
In the transport field, PRIMES-TREMOVE is suitable for modelling soft measures (e.g. eco-driving, labelling); economic measures (e.g. subsidies and taxes on fuels, vehicles, emissions; ETS for transport when linked with PRIMES; pricing of congestion and other externalities such as air pollution, accidents and noise; measures supporting R&D); regulatory measures (e.g. CO2 emission performance standards for new light duty vehicles and heavy duty vehicles; EURO standards on road transport vehicles; technology standards for non-road transport technologies, deployment of Intelligent Transport Systems) and infrastructure policies for alternative fuels (e.g. deployment of refuelling/recharging infrastructure for electricity, hydrogen, LNG, CNG). Used as a module that contributes to the PRIMES model energy system model, PRIMES-TREMOVE can show how policies and trends in the field of transport contribute to economy-wide trends in energy use and emissions. Using data disaggregated per Member State, the model can show differentiated trends across Member States.
The PRIMES-TREMOVE has been developed and is maintained by E3Modelling, based on, but extending features of, the open source TREMOVE model developed by the TREMOVE modelling community. Part of the model (e.g. the utility nested tree) was built following the TREMOVE model. Other parts, like the component on fuel consumption and emissions, follow the COPERT model.
Data inputs
The main data sources for inputs to the PRIMES-TREMOVE model, such as for activity and energy consumption, comes from EUROSTAT database and from the Statistical Pocketbook "EU transport in figures. Excise taxes are derived from DG TAXUD excise duty tables. Other data comes from different sources such as research projects (e.g. TRACCS project) and reports.
In the context of this exercise, the PRIMES-TREMOVE transport model is calibrated to 2005, 2010 and 2015 historical data. Available data on 2020 market shares of different powertrain types have also been taken into account.
2.Baseline scenario
In order to reflect the fundamental socio-economic, technological and policy developments, the Commission prepares periodically an EU Reference Scenario on energy, transport and GHG emissions. The scenarios assessment used for the “Fit for 55” policy package builds on the latest “EU Reference 2020 scenario” (REF2020). This is also used as a baseline for this impact assessment.
The main assumptions related to economic development, international energy prices and technologies are described below. The same assumptions are used in the baseline and in the assessment of the policy options.
Main assumptions of the Baseline scenario
The main assumptions related to economic development, international energy prices and technologies are described below.
Economic assumptions
The modelling work is based on socio-economic assumptions describing the expected evolution of the European society. Long-term projections on population dynamics and economic activity form part of the input to the energy model and are used to estimate final energy demand.
Population projections from Eurostat are used to estimate the evolution of the European population, which is expected to change little in total number in the coming decades. The GDP growth projections are from the Ageing Report 2021 by the Directorate General for Economic and Financial Affairs, which are based on the same population growth assumptions.
Table 45: Projected population and GDP growth per Member State
|
|
Population
|
GDP growth
|
|
|
2020
|
2025
|
2030
|
2020-‘25
|
2026-‘30
|
|
EU27
|
447.7
|
449.3
|
449.1
|
0.9%
|
1.1%
|
|
Austria
|
8.90
|
9.03
|
9.15
|
0.9%
|
1.2%
|
|
Belgium
|
11.51
|
11.66
|
11.76
|
0.8%
|
0.8%
|
|
Bulgaria
|
6.95
|
6.69
|
6.45
|
0.7%
|
1.3%
|
|
Croatia
|
4.06
|
3.94
|
3.83
|
0.2%
|
0.6%
|
|
Cyprus
|
0.89
|
0.93
|
0.96
|
0.7%
|
1.7%
|
|
Czechia
|
10.69
|
10.79
|
10.76
|
1.6%
|
2.0%
|
|
Denmark
|
5.81
|
5.88
|
5.96
|
2.0%
|
1.7%
|
|
Estonia
|
1.33
|
1.32
|
1.31
|
2.2%
|
2.6%
|
|
Finland
|
5.53
|
5.54
|
5.52
|
0.6%
|
1.2%
|
|
France
|
67.20
|
68.04
|
68.75
|
0.7%
|
1.0%
|
|
Germany
|
83.14
|
83.48
|
83.45
|
0.8%
|
0.7%
|
|
Greece
|
10.70
|
10.51
|
10.30
|
0.7%
|
0.6%
|
|
Hungary
|
9.77
|
9.70
|
9.62
|
1.8%
|
2.6%
|
|
Ireland
|
4.97
|
5.27
|
5.50
|
2.0%
|
1.7%
|
|
Italy
|
60.29
|
60.09
|
59.94
|
0.3%
|
0.3%
|
|
Latvia
|
1.91
|
1.82
|
1.71
|
1.4%
|
1.9%
|
|
Lithuania
|
2.79
|
2.71
|
2.58
|
1.7%
|
1.5%
|
|
Luxembourg
|
0.63
|
0.66
|
0.69
|
1.7%
|
2.0%
|
|
Malta
|
0.51
|
0.56
|
0.59
|
2.7%
|
4.1%
|
|
Netherlands
|
17.40
|
17.75
|
17.97
|
0.7%
|
0.7%
|
|
Poland
|
37.94
|
37.57
|
37.02
|
2.1%
|
2.4%
|
|
Portugal
|
10.29
|
10.22
|
10.09
|
0.8%
|
0.8%
|
|
Romania
|
19.28
|
18.51
|
17.81
|
2.7%
|
3.0%
|
|
Slovakia
|
5.46
|
5.47
|
5.44
|
1.1%
|
1.7%
|
|
Slovenia
|
2.10
|
2.11
|
2.11
|
2.1%
|
2.4%
|
|
Spain
|
47.32
|
48.31
|
48.75
|
0.9%
|
1.6%
|
|
Sweden
|
10.32
|
10.75
|
11.10
|
1.4%
|
2.2%
|
Beyond the update of the population and growth assumptions, an update of the projections on the sectoral composition of GDP was also carried out using the GEM-E3 computable general equilibrium model. These projections take into account the potential medium- to long-term impacts of the COVID-19 crisis on the structure of the economy, even though there are inherent uncertainties related to its eventual impacts. Overall, conservative assumptions were made regarding the medium-term impacts of the pandemic on the re-localisation of global value chains, teleworking and teleconferencing and global tourism.
International energy prices assumptions
Alongside socio-economic projections, EU energy modelling requires projections of international fuel prices. The 2020 values are estimated from information available by mid-2020. The projections of the POLES-JRC model – elaborated by the Joint Research Centre and derived from the Global Energy and Climate Outlook (GECO) – are used to obtain long-term estimates of the international fuel prices.
The COVID crisis has had a major impact on international fuel prices. The lost demand cause an oversupply leading to decreasing prices. The effect on prices compared to pre-COVID estimates is expected to be still felt up to 2030. Actual development will depend on the recovery of global oil demand as well as supply side policies.
Table 46
shows the international fuel prices assumptions of the REF2020 and of the different scenarios and variants used in the “Fit for 55” policy package impact assessments, including the policy options of this impact assessment.
Table 46: International fuel prices assumptions
|
in $'15 per boe
|
2000
|
‘05
|
‘10
|
‘15
|
‘20
|
‘25
|
‘30
|
‘35
|
‘40
|
‘45
|
‘50
|
|
Oil
|
38.4
|
65.4
|
86.7
|
52.3
|
39.8
|
59.9
|
80.1
|
90.4
|
97.4
|
105.6
|
117.9
|
|
Gas (NCV)
|
26.5
|
35.8
|
45.8
|
43.7
|
20.1
|
30.5
|
40.9
|
44.9
|
52.6
|
57.0
|
57.8
|
|
Coal
|
11.2
|
16.9
|
23.2
|
13.1
|
9.5
|
13.6
|
17.6
|
19.1
|
20.3
|
21.3
|
22.3
|
|
|
|
|
|
|
|
|
|
|
|
|
|
|
in €'15 per boe
|
2000
|
2005
|
‘10
|
‘15
|
‘20
|
‘25
|
‘30
|
‘35
|
‘40
|
‘45
|
‘50
|
|
Oil
|
34.6
|
58.9
|
78.2
|
47.2
|
35.8
|
54.0
|
72.2
|
81.5
|
87.8
|
95.2
|
106.3
|
|
Gas (NCV)
|
23.4
|
31.7
|
40.6
|
38.7
|
17.8
|
27.0
|
36.2
|
39.7
|
46.6
|
50.5
|
51.2
|
|
Coal
|
9.9
|
15.0
|
20.6
|
11.6
|
8.4
|
12.0
|
15.6
|
16.9
|
18.0
|
18.9
|
19.7
|
Source: Derived from JRC, POLES-JRC model, Global Energy and Climate Outlook (GECO)
Technology assumptions
Modelling scenarios on the evolution of the energy system is highly dependent on the assumptions on the development of technologies - both in terms of performance and costs. For the purpose of the impact assessments related to the “Climate Target Plan” and the “Fit for 55” policy package, these assumptions have been updated based on a rigorous literature review carried out by external consultants in collaboration with the JRC.
Continuing the approach adopted in the long-term strategy in 2018, the Commission consulted on the technology assumption with stakeholders in 2019. In particular, the technology database of the main model suite (PRIMES, PRIMES-TREMOVE, GAINS, GLOBIOM, and CAPRI) benefited from a dedicated consultation workshop held on 11th November 2019. EU Member States representatives also had the opportunity to comment on the costs elements during a workshop held on 25th November 2019. The updated technology assumptions are published together with the EU Reference Scenario 2020.
Baseline scenario framework
The EU Reference Scenario 2020 as the common baseline
The EU Reference Scenario 2020 (REF2020) provides projections for energy demand and supply, as well as greenhouse gas emissions in all sectors of the European economy under the current EU and national policy framework. It embeds in particular the EU legislation in place to reach the 2030 climate target of at least 40% compared to 1990, as well as national contributions to reaching the EU 2030 energy targets on Energy efficiency and Renewables under the Governance of the Energy Union. It thus gives a detailed picture of where the EU economy and energy system in particular would stand in terms of GHG emission if the policy framework were not updated to enable reaching the revised 2030 climate target to at least -55% compared to 1990 proposed under the Climate Target Plan.
The Reference Scenario serves as the common baseline shared by the initiatives of the “Fit for 55” policy package to assess options in their impact assessments.
Difference with the Climate Target Plan “BSL” scenario
The REF2020 embeds some differences compared to the baseline used for the Climate Target Plan (CTP) impact assessment. While the technology assumptions (consulted in a workshop held on 11th November 2019) were not changed, the time between CTP publication and the publication of the “Fit for 55” package allowed updating some other important assumptions:
·GDP projections, population projections and fossil fuel prices were updated, in particular to take into account the impact of the COVID crisis through an alignment with the 2021 Ageing Report and an update of international fossil fuel prices notably on the short run.
·While the CTP baseline aimed at reaching the current EU 2030 energy targets (on energy efficiency and renewable energy), the Reference Scenario 2020, used as the baseline for the “Fit for 55” package, further improved the representation of the National Energy Climate Plans (NECP). In particular it aims at reaching the national contributions to the EU energy targets, and not at respecting these EU targets themselves.
Reference scenario process
The REF2020 scenario has been prepared by the European Commission services and consultants from E3Modelling, IIASA and EuroCare, in coordination with Member States experts through the Reference Scenario Experts Group.
It benefitted from a stakeholders consultation (on technologies) and is aligned with other outlooks from Commission services, notably DG ECFIN’s Ageing Report 2021 (see section Error! Reference source not found.), as well as, to the extent possible, the 2020 edition of the EU Agricultural Outlook 2020-2030 published by DG AGRI in December 2020.
Policies in the Reference scenario
The REF2020 also takes into account the still-unfolding effects of the COVID-19 pandemic, to the extent possible at the time of the analysis. According to the GDP assumptions of the Ageing Report 2021, the pandemic is followed by an economic recovery resulting in moderately lower economic output in 2030 than pre-COVID estimates.
The scenario is based on existing policies adopted at national and EU level at the beginning of 2020. In particular, at EU level, the REF2020 takes into account the legislation adopted in the Clean Energy for All European Package. At national level, the scenario takes into account the policies and specific targets, in particular in relation with renewable energy and energy efficiency, described in the final National Energy and Climate Plans (NECPs) submitted by Member States at the end of 2019/beginning of 2020.
The REF2020 models the policies already adopted, but not the target of net-zero emissions by 2050. As a result, there are no additional policies introduced driving decarbonisation after 2030. However, climate and energy policies are not rolled back after 2030 and several of the measures in place today continue to deliver emissions reduction in the long term. This is the case, for example, for products standards and building codes and the ETS Directive (progressive reduction of ETS allowances is set to continue after 2030).
Details on policies and measures represented in the REF2020 can be found in the dedicated publication.
Main transport-related results of the Baseline scenario
EU transport activity would continue to grow in the Baseline scenario, albeit at a slower pace than in the past. Freight transport activity for inland modes (expressed in tonne-kilometres) would increase by 31% between 2015 and 2030 (1.8% per year) and 55% for 2015-2050 (1.3% per year). Passenger traffic (expressed in passenger-kilometres) growth would be lower than for freight with a 16% increase by 2030 (1% per year) and 33% by 2050 (0.8% per year). The annual growth rates by mode, for passenger and freight transport, are provided in
Figure 12
.
Figure 12: Passenger and freight transport activity in the Baseline scenario (average growth rate per year)


Source: Baseline scenario, PRIMES-TREMOVE transport model (E3Modelling)
Note: For aviation, domestic and international intra-EU activity is reported, to maintain the comparability with reported statistics. For freight, inland navigation transport covers inland waterways and national maritime.
Road transport would maintain its dominant role within the EU. The share of road transport in inland freight would remain relatively stable by 2030 at 71% and slightly decrease to 69% by 2050. For passenger transport, road modal share is projected to decrease by 2 percentage points between 2015 and 2030 and by additional 3 percentage points by 2050. Passenger cars would still contribute 71% of passenger traffic by 2030 and more than two thirds by 2050, despite growing at lower pace relative to other modes. Rail transport activity is projected to grow significantly faster than for road, driven in particular by the assumed completion of the TEN-T core network by 2030 and of the comprehensive network by 2050, supported by the CEF, Cohesion Fund and ERDF funding. Domestic and international intra-EU air transport would grow significantly (by 46% during 2015-2030 and 91% by 2050) following the recovery from the COVID-19 pandemics, although at lower pace than projected in the past. Transport activity of freight inland navigation
also benefits from the completion of the TEN-T core and comprehensive network and the promotion of inland waterway transport and would grow by 19% during 2015-2030 and by 37% by 2050. The significant growth in freight inland navigation and rail freight activity is also supported by the implementation of electronic documentation for freight transport and the European Maritime Single Window environment. International maritime transport activity would grow strongly in the Baseline (by 20% between 2015 and 2030 and 50% by 2050), due to rising demand for primary resources and container shipping.
Total energy use in transport, including international aviation and international maritime, is projected to decrease by 6% between 2015 and 2030 and by 15% by 2050, which in the context of growing activity shows the projected progress in terms of energy efficiency. These developments are mainly driven by the implementation of the CO2 emission performance standards for new light duty and heavy duty vehicles post-2020, supported by the roll-out of recharging and refuelling infrastructure and also by the shift towards more energy efficient modes such as rail and waterborne transport. Road transport is responsible for more than 70% of total energy use in transport but this share is projected to significantly decline over time, to 68% by 2030 and 60% by 2050 thanks to the progressive electrification of the sector and greater use of more sustainable transport modes.
Alternative fuels
, including renewable and low carbon fuels, are projected to represent 13.3% of transport energy demand (including international aviation and maritime transport) in the Baseline scenario by 2030 and 24.8% by 2050. Around 6.6% of all transport fuels in 2030 would be of biological origin, as shown in
Figure 13
, driven by policy measures and notably the Renewable Energy Directive.
Electricity use in transport would steadily increase over time as a result of uptake of zero and low-emission powertrains in road transport and further electrification of rail. Its share in the total energy use in transport would go up from around 1.2% in 2015 to 3.3% in 2030 and 9% in 2050 (see
Figure
13
). The uptake of hydrogen would be facilitated by the increased availability of refuelling infrastructure, and is projected to represent 1.6% of energy use in transport by 2050.
Figure 13: Share of alternative fuels used in transport (including international aviation and maritime) in the Baseline scenario
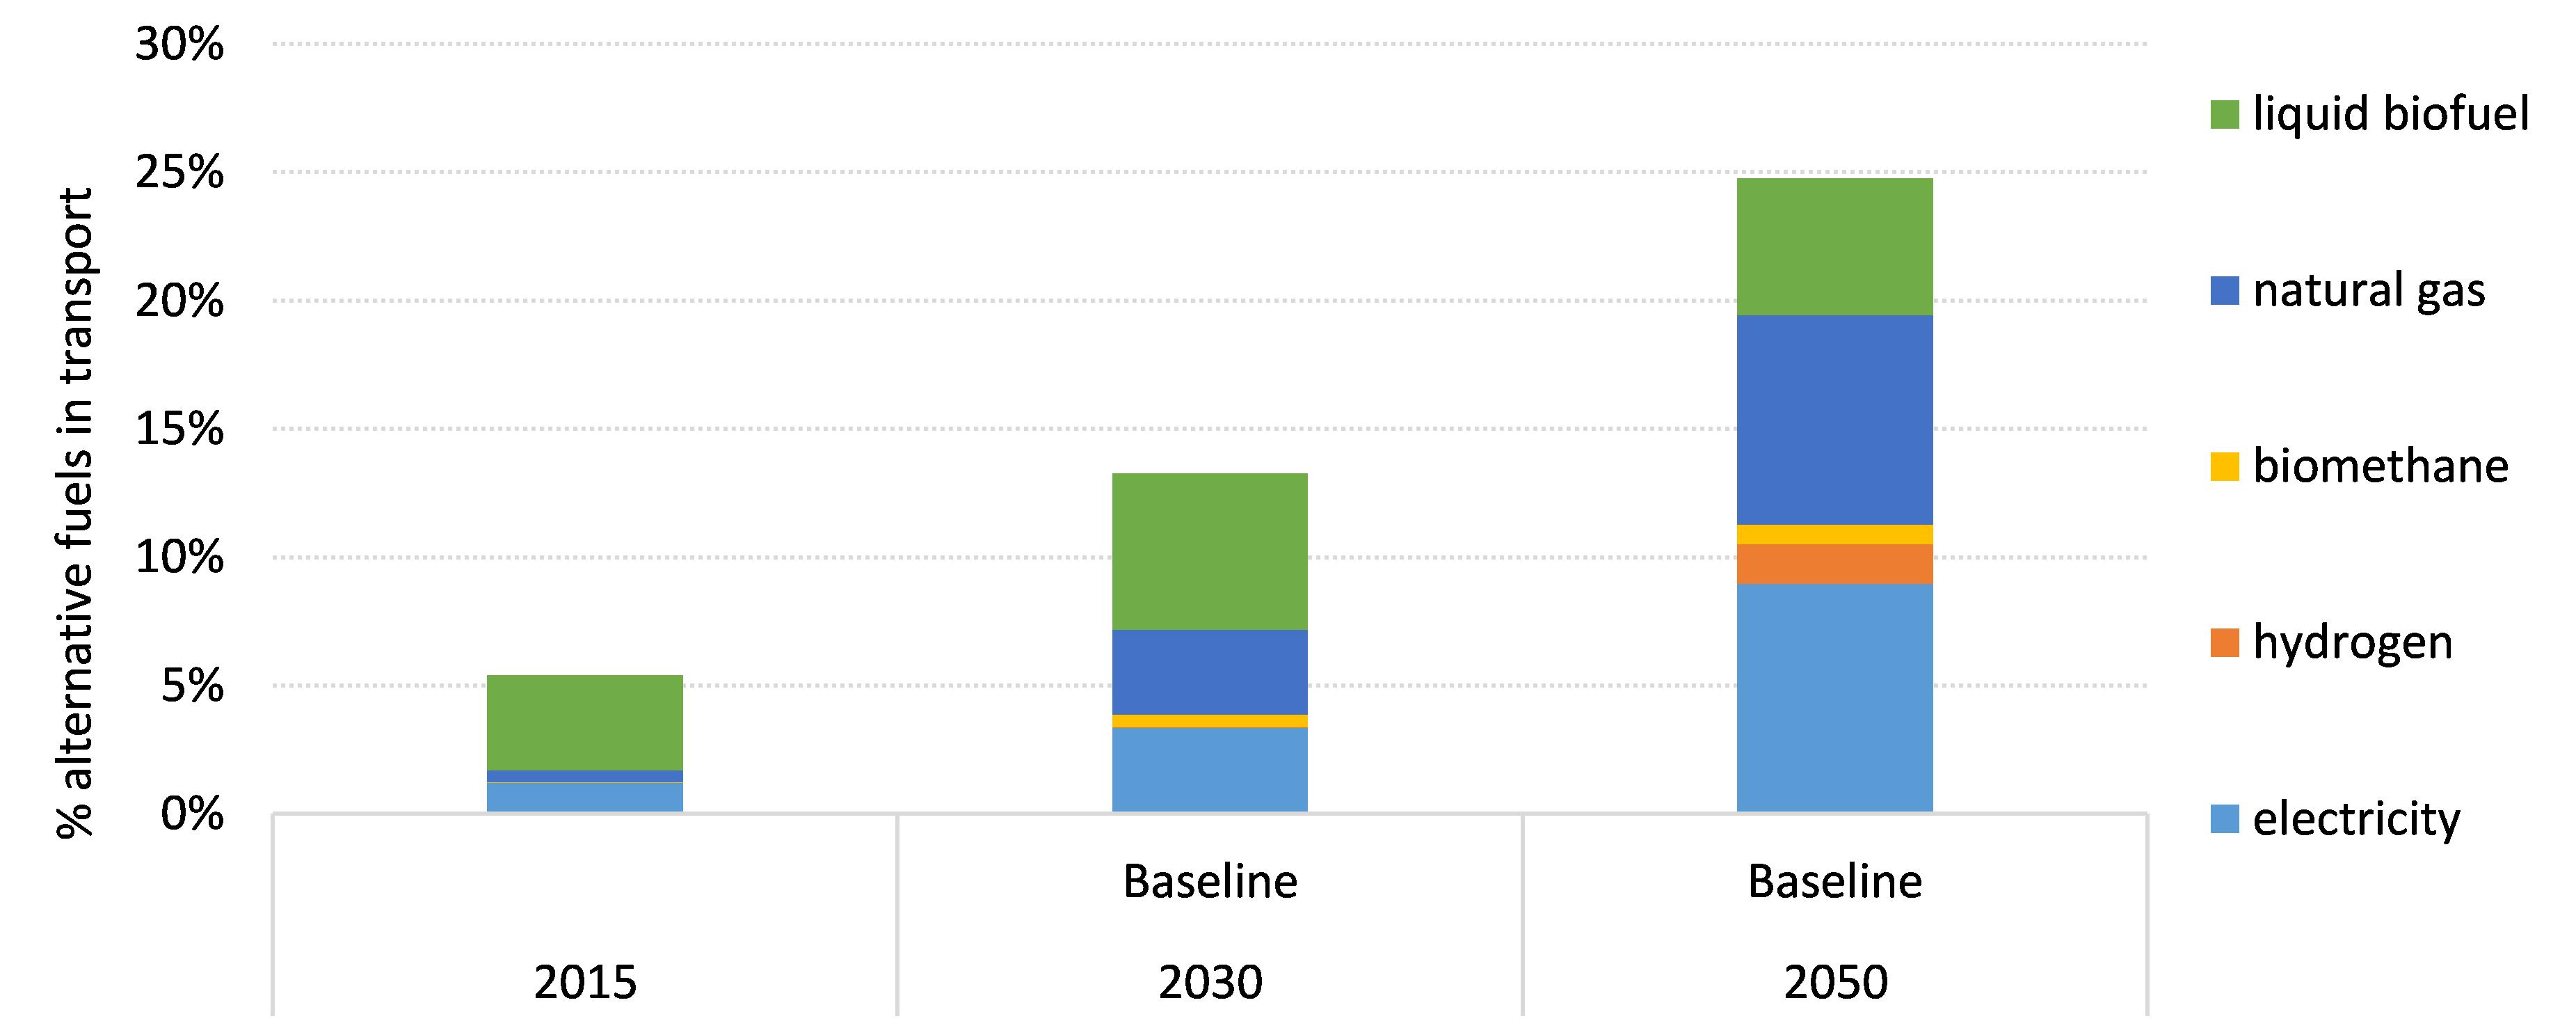
Source: Baseline scenario, PRIMES-TREMOVE transport model (E3Modelling)
Battery electric vehicles would see faster growth beyond 2020, in particular in the segment of light duty vehicles, driven by the CO2 emission performance standards, supported by the rolling-out of recharging infrastructure. The share of battery electric vehicles in the total stock of passenger cars would reach around 11% by 2030 and 33% by 2050. The share of low and zero-emissions cars (including battery electric, fuel cells and plug-in hybrids) is projected to go up to 17% by 2030 and 54% by 2050. For the light commercial vehicles segment, the share of battery electric powertrains is projected at 4% by 2030 and 25% by 2050. Electric buses are projected to represent around 11% of the vehicle stock by 2030, driven by the implementation of the Clean Vehicles Directive and air quality concerns in many cities banning combustion engine buses, while the uptake of electric and fuel cell heavy goods vehicles is projected to be more limited in the Baseline scenario (3% of vehicle stock by 2050).
Liquefied Natural Gas (LNG) is projected to represent around 3.3% of the energy use in transport by 2030 and 8.2% by 2050 in the Baseline scenario, driven by the implementation of the Directive on the deployment of alternative fuels infrastructure and of the Regulation on non-road mobile machinery, the TEN-T Regulation and also by the MARPOL Annex VI rules as regards the reduction of nitrogen and sulphur oxides emissions in the maritime transport. In the Baseline scenario, the share of LNG use in heavy goods vehicles energy demand is projected to go up to 9% by 2030 (16% by 2050) and for inland navigation to 4% by 2030 (9% by 2050). LNG would provide about 5% of maritime bunker fuels by 2030 and 19% by 2050 – especially in the segment of short sea shipping.
Oil products would still represent about 87% of the EU transport sector needs in 2030 and 75% in 2050, despite the current renewables policies, CO2 emission performance standards for new light duty and heavy goods vehicles, and the deployment of alternative fuels infrastructure which support some substitution effects towards alternative fuels such as biofuels and biomethane, electricity, hydrogen and natural gas.
Figure 14: Fuels use in transport (including international aviation and maritime) in the Baseline scenario

Source: Baseline scenario, PRIMES-TREMOVE transport model (E3Modelling)
CO2 emissions from transport including international aviation but excluding international maritime, in line with the 2030 climate and energy policy framework, are projected to be 15% lower by 2030 compared to 2015, and 36% lower by 2050. Compared to 1990 however, this translates into 4% higher emissions by 2030 and only 22% lower emissions by 2050, due to high increases in transport emissions during the 1990s. When accounting the intra-EU aviation and intra-EU maritime in the transport emissions, the Baseline projections show reductions of 17% by 2030 and 39% by 2050 relative to 2015. When all intra-EU and extra-EU aviation and maritime emissions are accounted in the transport emissions, the Baseline scenario results in 11% decrease in transport emissions by 2030 and 27% decrease by 2050 compared to 2015 levels. This illustrates the significant emissions reduction gap to be closed by 2030 and 2050, to contribute to the 2030 Climate Target Plan and the European Green Deal objectives.
Figure 15: CO2 emissions from transport (including international aviation but excluding international maritime) in the Baseline scenario

Source: Baseline scenario, PRIMES-TREMOVE transport model (E3Modelling)
The largest contribution to the projected decline in transport emissions between 2005 and 2050 is due to increased fuel efficiency of passenger cars and light commercial vehicles. Conversely, aviation has been one of the fastest growing sectors in terms of CO2 emissions over the past decades.
NOx emissions are projected to go down by 54% between 2015 and 2030 (69% by 2050), mainly driven by the electrification of the road transport and in particular of the light duty vehicles segment. The decline in particulate matter (PM2.5) would be slightly lower by 2030 at 49% relative to 2015 (72% by 2050). Air quality issues represent a particular concern in urban areas. In the Baseline scenario NOx and PM2.5 emissions are projected to decrease at higher pace in urban relative to inter-urban areas (69% reduction in NOx emissions by 2030 and 60% for PM2.5 emissions), thanks to the use of more sustainable alternative modes, including active modes, and cleaner vehicles. Overall, external costs related to air pollutants would decrease by about 60% by 2030 (78% by 2050)
.
3.Modelling framework for the policy options
From the Climate Target Plan scenarios to “Fit for 55” core scenarios
In the Climate Target Plan (CTP) impact assessment, the increase of efforts needed for the GHG 55% target was illustrated by policy scenarios (developed with the same modelling suite as the scenarios done for the “Fit for 55” package) showing increased ambition (or stringency) of climate, energy and transport policies and, consequently, leading to a significant investment challenge.
The first key lesson from the CTP exercise was that while the tools are numerous and have a number of interactions (or even sometimes trade-offs) a complete toolbox of climate, energy and transport policies is needed for the increased climate target as all sectors would need to contribute effectively towards the GHG 55% target.
The second key lesson was that even though policy tools chosen in the CTP scenarios were different - illustrating in particular the fundamental interplay between the strength of the carbon pricing and intensity of regulatory measures - the results achieved were convergent. All CTP policy scenarios that achieved a 55% GHG target showed very similar levels of ambition for energy efficiency, renewables (overall and on sectoral level) and GHG reductions across the sectors indicating also the cost-effective pathways.
The third lesson was that carbon pricing working hand in hand with regulatory measures helps avoid “extreme” scenarios of either:
·a very high carbon price (in absence of regulatory measures) that will translate into increased energy prices for all consumers,
·very ambitious policies that might be difficult to be implemented (e.g. very high energy savings or renewables obligations) because they would be costly for economic operators or represent very significant investment challenge.
With the 55% GHG target confirmed by EU leaders in the December 2020 EUCO Conclusions and the 2021 Commission Work Programme (CWP 2021) that puts forward the complete toolbox to achieve the increased climate target (so-called “Fit for 55” proposals), the fundamental set-up of the CTP analysis was confirmed. This set-up is still about the interplay between carbon pricing and regulatory measures as illustrated above, and the extension of the ETS is the central policy question.
As described above, the policy scenarios of the CTP assessment are cost-effective pathways that capture all policies needed to achieve the increased climate target of 55% GHG reductions. This fundamental design remains robust and the CTP scenarios were thus used as the basis to define the “Fit for 55” policy scenarios.
In the context of the agreed increased climate target of a net reduction of 55% GHG compared to 1990, the 50% GHG scenario (CTP MIX-50) explored in the CTP has been discarded since no longer relevant. The contribution of extra EU aviation and maritime emissions in the CTP ALLBNK scenario was assessed in the respective sector specific impact assessments and was not retained as a core scenario. This leaves the following CTP scenarios in need of further revisions and updates in the context of preparing input in a coherent manner for the set of IAs supporting the “Fit for 55” package, ensuring the achievement of the overall net 55% GHG reduction ambition with similar levels of renewable energy and energy efficiency deployment as in CTP:
·CTP REG (relying only on intensification of energy and transport policies in absence of carbon pricing beyond the current ETS sectors);
·CTP MIX (relying on both carbon price signal extension to road transport and buildings and intensification of energy and transport policies);
·CTP CPRICE (relying chiefly on carbon price signal extension, and more limited additional sectoral policies).
Scenarios for the “Fit for 55”package
Based on the Climate Target Plan analysis, some updates were needed though for the purpose of the “Fit for 55” assessment, in terms of:
·Baseline:
oto reflect the most recent statistical data available, notably in terms of COVID impacts,
oto capture the objectives and policies put forward by Member States in the NECPs, which were not all available at the time of the CTP analysis,
The baseline used in the Fit for 55 package is thus the “Reference Scenario 2020”.
·Scenario design in order to align better with policy options as put forward in the CWP 2021 and respective Inception Impact Assessments.
As a consequence, the three following core policy scenarios were defined to serve as common policy package analysis across the various initiatives of the “Fit for 55” policy assessments:
·REG: an update of the CTP REG case (relying only on very strong intensification of energy and transport policies in absence of carbon pricing beyond the current ETS sectors).
·MIX: reflecting an update of the CTP MIX case (relying on both carbon price signal extension to road transport and buildings and strong intensification of energy and transport policies). With its uniform carbon price (as of 2025), it reflects either an extended and fully integrated EU ETS or an existing EU ETS and new ETS established for road transport and buildings with emission caps set in line with cost-effective contributions of the respective sectors.
·MIX-CP: representing a more carbon price driven policy mix, combining thus the general philosophy of the CTP CPRICE scenario with key drivers of the MIX scenario albeit at a lower intensity. It illustrates a revision of the EED and RED but limited to a lower intensification of current policies in addition to the carbon price signal applied to new sectors. Unlike MIX, this scenario allows to separate carbon price signals of “current” and “new” ETS. The relative split of ambition in GHG reductions between “current” ETS and “new ETS” remains, however, close in MIX-CP to the MIX scenario leading to differentiated carbon prices between “current” ETS and “new” ETS.
These three “Fit for 55” core policy scenarios have been produced starting from the Reference Scenario 2020 and thus use the same updated assumptions on post-COVID economics and international fuel prices.
Scenarios used for this impact assessment
The policy options of this impact assessment focus on the design of the policy instrument. As explained in section 1.3, of particular relevance is to ensure coherence with the impact assessment accompanying the revision of the emission performance standards for new passenger cars and for new light commercial vehicles. For this reason, the assessment of the policy options build on MIX scenario that follows a combined approach of carbon pricing instruments and regulatory-based measures. The MIX scenario corresponds to the option TL_Med of the impact assessment accompanying the revision of the emission performance standards for vehicles, and provides the vehicle fleet relevant for the design of the policy options. In addition, as explained in section 5, to ensure consistency with the impact assessment accompanying the revision of the emission performance standards for vehicles, an assessment of the costs of infrastructure is provided for all options assessing the target levels (including TL_Low and TL_High, in addition to TL_Med). It should be noted that the target levels for CO2 standards for light duty vehicles in TL_High is the same as the one in the REG scenario, while the target levels for CO2 standards for light duty vehicles in TL_Low is the same as in the MIX-CP scenario.
The policy measures reflected in the MIX scenario, relevant for the transport sector, are summarised below:
-Extension of the EU ETS to the maritime sector, as well as to the road transport and buildings sectors;
-Revision of the Renewable Energy Directive;
-ReFuel aviation and FuelEU maritime initiatives;
-Initiatives to increase and better manage the capacity of railways, inland waterways and short sea shipping, supported by the TEN-T infrastructure and CEF funding;
-Gradual internalisation of external costs (“smart” pricing);
-Incentives to improve the performance of air navigation service providers in terms of efficiency and to improve the utilisation of air traffic management capacity;
-Incentives to improve the functioning of the transport system: support to multimodal mobility and intermodal freight transport by rail, inland waterways and short sea shipping;
-Deployment of the necessary infrastructure, smart traffic management systems, transport digitalisation and fostering connected and automated mobility;
-Further actions on clean airports and ports to drive reductions in energy use and emissions;
-Measures to reduce emissions and air pollution in urban areas;
-Pricing measures such as in relation to energy taxation and infrastructure charging;
-Revision of roadworthiness checks;
-Other measures incentivising behavioural change;
-Medium intensification of the CO2 emission standards for cars, vans, trucks and buses (as of 2030), supported by large scale roll-out of recharging and refuelling infrastructure. This corresponds to a reduction in 2030 compared to the 2021 target of around 50% for cars and around 40% for vans.
As all policy options of these impact assessment build on the MIX scenario framework, this ensure consistency with other initiatives part of the ‘Fit for 55’ package and in particular with the impact assessment accompanying the revision of the emission performance standards for new passenger cars and for new light commercial vehicles.
4.Costs assumptions for road transport refuelling/recharging infrastructure
This section presents the assumptions related to the unit costs of the refuelling/recharging infrastructure used in this impact assessment, drawing on the study supporting the evaluation of the Directive on alternative fuels infrastructure
and the Reference scenario 2020. The unit costs are assumed to be the same in the baseline and the policy options.
Electricity recharging infrastructure
The assumed costs for the electricity chargers cover capital expenditures (CAPEX) and installation costs (
Table 47
). Network upgrade costs are not included.
Three different categories of charging points based on recharging power are considered. The slow charging points, which are appropriate for use when the electric vehicle is parked for prolonged time, include public AC chargers with 7 KW power and public semi-fast AC chargers with 22 KW power. The second category of charging points considers rapid DC chargers of power output 50 KW and 150 KW. The third category of charging points includes ultra-rapid DC chargers, with typical power 350KW. These public chargers are placed in key nodes of the road network and are associated with the need for a quick recharge during a trip. Their use is likely to be restricted to premium and commercial vehicles, due to the larger battery sizes and ability to charge at these power levels.
Table 47: Electricity recharging infrastructure costs
|
Capital costs (EUR/point)
|
2020
|
2025
|
2030
|
2040
|
2050
|
|
Slow charging points
|
|
public on-street (7KW AC)
|
1,500
|
1,340
|
1,253
|
1,171
|
1,139
|
|
public spaces (22KW AC)
|
6,280
|
5,423
|
4,974
|
4,561
|
4,403
|
|
Rapid charging points
|
|
public spaces (50KW DC)
|
45,000
|
37,728
|
34,019
|
30,687
|
29,422
|
|
public spaces (150KW DC)
|
90,000
|
72,510
|
63,757
|
56,016
|
53,114
|
|
Ultra-rapid charging points
|
|
public spaces (350 KW DC)
|
230,000
|
186,614
|
164,836
|
145,532
|
138,282
|
Source: Ricardo et al. (2021), Evaluation of the Directive on the Deployment of Alternative Fuels Infrastructure
The breakdown of the charging point capital costs for 2020 into CAPEX and installation costs is provided in
Table 48
. The installation costs do not include costs related to grid reinforcement. The latter costs are accounted and reflected in the electricity prices and are provided by the PRIMES energy systems model.
Table 48: CAPEX and installation costs of chargers in 2020
|
Charging point type (EUR/point)
|
Capex
|
Installation
|
Total
|
|
Slow charging points
|
|
|
|
|
public on-street (7KW AC)
|
667
|
833
|
1,500
|
|
public spaces (22KW AC)
|
3,280
|
3,000
|
6,280
|
|
Rapid charging points
|
|
|
|
|
public spaces (50KW DC)
|
28,125
|
16,875
|
45,000
|
|
public spaces (150KW DC)
|
70,000
|
20,000
|
90,000
|
|
Ultra-Rapid fast charging points
|
|
|
|
|
public spaces (350 KW DC)
|
170,000
|
60,000
|
230,000
|
Source: Ricardo et al. (2021), Evaluation of the Directive on the Deployment of Alternative Fuels Infrastructure
The learning rates that were used to estimate the CAPEX reduction over time are around -9% for rapid and ultra-rapid charging points, -8% for public semi-fast charging points (22 KW AC) and -7% for slow on-street public charging points (7 KW AC). For the installation costs, the learning rate is assumed to be -2%.
The operation and maintenance costs (O&M) are estimated as a fraction of the capital costs per charging point per year, over the lifetime of the infrastructure (see
Table 49
). Additional lifetime extension costs of 25% are assumed, in order to extend the operation of charging points that have been installed for more than 15 years (e.g. replacement of aged components such as power electronics).
Table 49: Assumed O&M costs per year for electric vehicle recharging infrastructure (as a percentage of capital costs)
|
O&M costs (% capital costs/point per year)
|
2020-2050
|
|
Slow charging points
|
|
public on-street charging (7KW AC)
|
1.6%
|
|
public spaces (22KW AC)
|
1.2%
|
|
Rapid charging points
|
|
public spaces (50KW DC)
|
|
1.2%
|
|
public spaces (150KW DC)
|
|
1.2%
|
|
Ultra-rapid charging points
|
|
public spaces (350 KW DC)
|
|
1.2%
|
|
Lifetime extension for charging points with > 15 years lifetime (% investment cost)
|
25%
|
Source: Ricardo et al. (2021), Evaluation of the Directive on the Deployment of Alternative Fuels Infrastructure
Hydrogen
The assumed costs for hydrogen refuelling stations (HRS) consider the total cost of the installation (
Table 50
). The components of an HRS that are covered by the assumed costs include the cost of the H2 storage tank, the cost of the compressor and the cost of the dispensers. The cost for hydrogen generation, which can be either centralized or decentralized, is not included in the abovementioned total cost. The PRIMES model considers that the hydrogen production cost is included in the hydrogen fuel prices as a means for investors to recuperate their costs.
Three categories of HRS are considered based on the daily refuelling capacity in tons H2 per day: a small station of 0.4 tons H2/day capacity, a medium station of 1 ton H2/day capacity, and a large station of 2.5 tons H2/day capacity.
Table 50
presents the assumed evolution of the HRS capital costs over time. In the case of HRS of 2 tons H2/day capacity, a linear interpolation was used.
Table 50: Hydrogen refuelling station costs
|
Capital costs (EUR/Station)
|
2020
|
2025
|
2030
|
2040
|
2050
|
|
Small (0.4 tons H2/day)
|
2,500,000
|
2,324,083
|
2,148,167
|
2,069,252
|
1,990,337
|
|
Medium (1 tons H2/day)
|
3,800,000
|
3,344,280
|
2,888,561
|
2,801,448
|
2,714,336
|
|
Large (2.5 tons H2/day)
|
5,700,000
|
5,016,000
|
4,332,000
|
4,024,200
|
3,716,400
|
Source: Ricardo et al. (2021), Evaluation of the Directive on the Deployment of Alternative Fuels Infrastructure
O&M costs of hydrogen refuelling infrastructure are assumed to be 4% of the investment costs per year (over the lifetime of the infrastructure) of a refuelling station. Additional costs (e.g. refurbishment, lifetime extension) of 40% are assumed in order to extend the operation of vintage charging points with a lifetime higher than 20 years.
Furthermore, in the case of liquid hydrogen stations (capacity of 2 tons/day), a cost of 2 million EUR is added in addition to the cost of gas H2 stations.
CNG/LNG
The capital costs for CNG and LNG stations for road transport (
Table 51
) cover the total costs for the installation of the station. These costs are assumed to remain unchanged over time and they include the cost of the compressor, the storage tank and the metered dispenser. For road CNG/LNG stations three different representative station sizes are considered, namely a small 500 kg/day station, a medium 2,000 kg/day station and a large 5,000 kg/day station. O&M costs of CNG and LNG refuelling stations are assumed to be 4% of the capital costs per year (over the lifetime of the infrastructure) of a refuelling station. Additional O&M costs (e.g. refurbishment, lifetime extension) of 40% are also estimated separately, applied only to those stations installed for more than 20 years.
Table 51: Road CNG/LNG refuelling station costs
|
Capital costs (EUR)
|
2020-2050
|
|
Small station (500 kg/day)
|
450,000
|
|
Medium station (200 0kg/day)
|
720,000
|
|
Large station (5000 kg/day)
|
1,330,000
|
Source: Ricardo et al. (2021), Evaluation of the Directive on the Deployment of Alternative Fuels Infrastructure
Annex 5: Methodology for the definition of policy options and measures
5.1 Methodology
This annex presents the comprehensive list of policy measures that was established for this initiative after extensive consultations with stakeholders, expert meetings, independent research and the Commission’s own analysis.
This list also includes all policy measures that could address the roll out of alternative fuels infrastructure and quality aspects of infrastructure. In addition, measures were considered to further strengthen the development of competitive markets, in particular with respect to the recharging market. Their likely effectiveness in increasing the deployment of alternative fuels infrastructure, in increasing user friendliness and ensuring competitive markets was assessed qualitatively. Based on this initial screening, a number of policy measures were not considered to directly address the SOs or were identified as complementary measures included in the “basket of measures”.
Based on this assessment, the Commission also refined the general policy approach to narrow down the proposed intervention to a limited number of characteristics allowing to effectively address the problem drivers in a coherent manner.
Two principal characteristics were identified for the policy measure to fulfil the given objectives:
·They should provide clear guidance and targets to Member States to plan for alternative fuels infrastructure in the context of the required low and zero emission vehicle uptake under the EGD for all transport modes. Such targets should preferably be mandatory and enforceable, thus providing legal certainty.
·They should address the market and user aspects of infrastructure ensuring technical interoperability and full user information as well as access for users to services. This is essential to create a positive user experience and thereby remove obstacles for the purchase of low and zero emission vehicles.
In the next step, the retained policy measures were classified according to their approach and characteristics in relation to three areas of policy intervention: i) increase the number of refuelling and recharging points to support the required vehicle fleet under the EGD, ii) stimulate full technical interoperability in terms of physical interfaces across the transport modes and for communication protocols in the area of electric mobility, and iii) ensure user friendliness.
5.2 Full list of Policy Measures
Table
52
presents the full list of policy measures identified in the preparation of the revision of the directive. It indicates if the policy measure has been retained (R) in the detailed assessment in this Impact Assessment, discarded (D) or is considered to be only a complementary measure (C) not assessed in the framework of this impact assessment but possibly to be address in other EU legislation. The table below presents the initial long list of measures by problem areas together with a summary of last round of screening.
Table 52: Policy measures and final screening
|
Measure
|
Status
|
Comments
|
|
General measures and reporting
|
|
Change of legal instrument: Replace the Directive with Regulation
|
R
|
|
|
MS reporting through NIRs. Detailed binding requirements set in the legislation on the data to be reported. Target year: 2025, then every two years
|
R
|
|
|
Central EU monitoring of deployment of infrastructure. Market actors to report directly to the Commission. A central monitoring platform would be created. Target year: 2025, then every three years
|
D
|
Very high administrative burden that would likely require monitoring through a specific agency to follow all developments in all Member States
|
|
Revise the scope of the AFID by including new re-fuelling / re-charging infrastructure
|
R
|
|
|
Introduce common provisions to accelerate the approval of new infrastructure and to harmonise concession practises. Target year: 2025
|
D
|
Discarded. Interfering in Member States planning procedures is outside the scope of the AFID
|
|
Measures related to Road
|
|
Introduce obligations to MS to ensure that consumers have the right to request that a publicly accessible recharging point is installed within a specific distance from their home
|
D
|
This is a measure that is best introduced on local level to respect the subsidiarity principle
|
|
Electricity, Cars / LCV in private buildings: Grant owners of parking places in condominiums / apartment blocks the right to install recharging points s in their parking without agreement of co-owners (“right to plug”).
|
C
|
This is covered under EPBD (see also chapter 5, discarded measures for detailed explanation)
|
|
Set minimum target for the share of public chargers in urban areas in disadvantaged neighbourhoods.
|
D
|
This is a measure that is best introduced on local level to respect the subsidiarity principle
|
|
Set target for the minimum number of chargers in relation to number of vehicles of Transport Network Companies (i.e. ride sharing/taxis/ride hailing) in urban areas
|
D
|
Due to the very specific local conditions within each urban area, this is a measure that is best introduced on local level to respect the subsidiarity principle
|
|
Revise the current definition of “publicly accessible” infrastructure to include an additional category of “Semi-public” infrastructure (located on private premises that are accessible during specific hours, e.g. supermarket car-parks)
|
D
|
This options was not retained because of practical problems to define semi public and the little added benefit from an ev-user perspective (see also chapter 5 for detailed explanation)
|
|
Electricity for Cars / LCV publicly accessible on private properties, e.g. petrol stations
|
R
|
|
|
Mandatory targets for recharging infrastructure for electric LDV on TEN-T network including its urban nodes
|
R
|
|
|
Mandatory fleet based national targets for recharging infrastructure for electric LDV
|
R
|
|
|
Mandatory fleet based national targets for recharging infrastructure for electric LDV and complemented by a minimum share target
|
R
|
|
|
Mandatory targets for recharging infrastructure for electric LDV on TEN-T network including its urban nodes
|
R
|
Assessed
|
|
Electricity for HDVs: Mandatory targets on TEN-T core, comprehensive and urban nodes, with differentiated power requirements
|
R
|
Assessed
|
|
Electricity for HDVs in not publicly accessible areas: Mandatory targets for logistic hubs
|
D
|
The directive addresses publicly accessible infrastructure but not private infrastructure on private properties serving captive fleets
|
|
Electricity for two wheelers: Mandatory targets on TEN-T core
|
D
|
Discarded after analysis, see chapter 5 for details
|
|
Electric Road Systems for HDVs: Mandatory targets
|
D
|
The technology is not yet sufficiently mature and uptake of vehicles uncertain. However, a definition will be introduced in the directive to recognise ERS as an alternative fuels infrastructure
|
|
CNG: Mandatory quantitative targets on TEN-T core
|
R
|
|
|
Hydrogen for cars and LCVs: Mandatory targets on TEN-T core, comprehensive and urban nodes
|
R
|
|
|
Hydrogen for trucks: Mandatory targets on TEN-T core, comprehensive and urban nodes
|
R
|
|
|
Biofuels, synthetic and paraffinic fuels, e-fuels (other than hydrogen): Possible mandatory infrastructure targets on TEN-T core for the fuels in this category IF dedicated infrastructure was required.
|
D
|
Discarded as there is no demand for dedicated infrastructure throughout the EU (see also chapter 5 for more detailed assessment)
|
|
Problem area A – Waterborne
|
|
Shore side electricity supply in maritime ports: Set mandatory targets for provision of shore side electricity for TEN-T core/comprehensive sea ports for cruise ships, RoPax and container ships
|
R
|
|
|
Shore side electricity supply for inland ports: Set mandatory targets for provision of shore side electricity for all TEN-T inland ports
|
R
|
Assessed
|
|
Mandatory upgrading of existing infrastructure for the use of biofuels, biogas/methane and power-to-gas fuels (e-gas) if specific infrastructure was required in specific or all ports.
|
D
|
Discarded as there is- no need for specific infrastructure for high biofuel blends
|
|
LNG in inland ports: Mandatory refuelling points in TEN-T ports.
|
D
|
Discarded - no demand expected
|
|
LNG in inland ports: deletion of exiting provision to ensure circulation along TEN-T core network
|
R
|
|
|
Electric recharging in inland ports: mandatory electric recharging in TEN-T core ports
|
R
|
|
|
LNG in maritime ports: Mandatory refuelling points at TEN-T core ports.
|
R
|
|
|
Hydrogen infrastructure targets for maritime and inland TEN-T core ports
|
D
|
Discarded as there is no certain uptake of hydrogen in shipping by 2030. However, review clause for 2026 is introduced to look at those aspects again when the markets are expected to be more mature
|
|
Aviation
|
|
Targets for AF or AFI for ground operations at airports
|
C
|
Discarded option as private infrastructure for captive fleets is not within AFID scope
|
|
Mandatory upgrading of refuelling infrastructure for aircrafts for the use of biofuels or renewable e-fuels IF specific infrastructure was required at TEN-T core airports.
|
D
|
Discarded as there is no requirement for specific infrastructure for blended kerosen
|
|
Targets for electricity supply for stationary commercial passenger aircraft at gates and outfield positions.
|
R
|
Assessed
|
|
Targets for AFI for supply of aircrafts
|
D
|
There is no clear demand yet for such alternative fuels (e.g. electricity or hydrogen). However, it will be assessed under AFD review scheduled for 2026.
|
|
Rail
|
|
Targets for hydrogen or battery electric recharging infrastructure based on rail traffic needs.
|
D
|
Discarded as demand for alternative fuels on railway lines that can’t be electrified depends entirely on local condtions and general EU rule risk to interfere with subsidiarity principle.
|
|
Interoperability Aspects
|
|
Prescribe mandatory communication protocols currently in the market (i.e., OCPP, OCPI)
|
R
|
|
|
Prescribe mandatory communication standards developed by official standardization organizations through delegated acts
|
R
|
|
|
Prescribe mandatory physical interfaces (standards) developed by official standardization organizations through delegated acts;
|
R
|
|
|
Make third party bank card payment (with no registration requirements) mandatory on all new publicly accessible charging points
|
R
|
|
|
Partial harmonisation of technical requirements for recharging points (to be specified; e.g. provision of cables, no requirement for shutters).
|
R
|
|
|
User Information
|
|
Introduce minimum requirements for roaming platforms,
|
D
|
Roaming platform facilitate the handling of transactions between CPOs and EMSPs. No problem was identified that would justify interference in the contractual relations between roaming platforms, CPOs and EMSPs
|
|
Make roaming mandatory on all publicly accessible recharging points.
|
D
|
Discarded as it would lead to restricting contractual freedom of both CPOs and EMSPPs (see also chapter 5)
|
|
Mandatory signposting on TEN-T network
|
R
|
|
|
Mandatory signposting within rest areas along the TEN-T network
|
R
|
|
|
For ad-hoc recharging: clear specification/harmonisation of price components (allowing only time fee + kWh fee) to the customer, clearly displayed at station.
|
R
|
|
|
For ad-hoc recharging: mandatory information through electronic means (e.g. app) of all price components and expected recharging price.
|
R
|
|
|
For contract based recharging: mandatory information through electronic means (e.g. app) of all price components and expected recharging price (incl. roaming fees)
|
R
|
|
|
Oblige operators of recharging/refuelling infrastructure to provide (through NAPs) static and real-time data on location, availability and accessibility,
|
R
|
|
|
Introduce provisions for common categories and formats of data on availability and accessibility and their provision through the national and/or common access points (through development of delegated regulations under ITS Directive 2010/40/EC)
|
C
|
Data format and transfer of data will be addressed in ITS directive
|
|
Strengthening of fuel labelling requirements, including overall price comparison and fuel compatibility
|
R
|
Discarded as the evaluation and OPC has not hinted at the need to introduce further strengthening of the provisions
|
|
Smart Recharging
|
|
Make smart charging functionalities mandatory
|
D
|
Discarded as no EU wide beneit can be expected (see chapter 5 for more details)
|
|
Provide for guaranteed access to battery data to any service provider following EV-user consent
|
C
|
To be addressed in legislation on in vehicle data access
|
|
Smart meters to be installed at publicly accessible AC and DC recharging points
|
D
|
Discarded as there is no EU wide benefit expected and it risks not to be coherent with the revised electricity directive where MS decide on the roll out of smart recharging points and final customers (e.g. the operator of recharging points) can choose if they want a smart meter or not.
|
5.3 Preferred policy option
Legal Form
·The legislative instrument can remain a Directive but the provisions would also allow to change the legislation into a Regulation.
The legislation contains a variety of measures including targets to be met by Member States with respect to the deployment of alternative fuels infrastructure, reporting requirements for Member States, standardisation mandates, and market rules to support the development of the internal market in transport.
Planning and Reporting
·National Policy Frameworks (NPF) and National Implementation Reports (NIR) remain
National Policy Frameworks (NPF) remain a key instrument to ensure coherent Member States planning of infrastructure while the National Implementation Reports (NIR) remain an important panning and reporting tool allowing the European Commission to assess progress. NPFs are required to provide a clear staregy including a clear description of supporting measures for meeting the mandatory deployment targets set in the legislation. As such, the NPFs and NIRs remain a key instrument to monitor Member States policy towards achieving the targets.
The NPFs have to be presented a year after the transposition of the directive while reporting under the NIRs is due every three years. The Commission will issue detailed guidance on the planning and reporting requirements. In order to ensure consistency and quality across the national planning and reporting and that targets are met by Member States, the NPFs and NIRs will need to be developed in an iterative process with the Commission.
The National Policy Frameworks will not only contain detailed specifications on the roll out of infrastructure but, in particular for waterborne transport and aviation, will also require Member States to develop decarbonisation strategies for those transport modes by setting out clear pathways for the use of sustainable fuels in those sectors. This planning will inform the Commission in its scheduled review of the directive, envisaged for around 2026, when more detailed provisions and binding targets on sustainable fuel infrastructure for these modes could be introduced.
Target Setting Road
Electricity LDV
·Member States have to ensure that there is always sufficient recharging capacity installed at publicly accessible infrastructure for the electric LDV fleet registered in that Member State. That capacity is prescribed by the Directive as installed capacity per registered electric vehicle, resulting in approx. 1.0 kW per BEV and 0.66 kW per PHEV. The compliance will be reported every two years through the national implementation reporting by Member States, instead of every three years as in the current Directive.
·For recharging infrastructure of LDV Member States have to ensure that a minimum amount of recharging infrastructure is deployed at national level by 2025 and 2030 respectively. For 2025, this amount is calculated on the basis of all electric vehicles, as expected under the central “Fit for 55” policy scenario (MIX). For 2030, this amounts to infrastructure that is sufficient for 10% of electric vehicles in the total projected vehicle fleet, adjusted to individual Member States (which represents 54% of the overall projected recharging infrastructure need collectively, but also for each Member State individually.
·Member States must ensure at least 300 kw installed capacity, including at least one 150kW recharging point, every 60 km in each direction on the TEN-T core network by 2025 and 600kW installed capacity, including at least two 150kW in each direction on the TEN-T core network by 2030. In addition, Member States must ensure every 60km on the TEN-T comprehensive network 300 kW installed capacity, including at least one 150kW, by 2030 and 600kW installed capacity, including at least two 150kW recharging points, by 2035.
The combination of a fleet based and distance based targets ensures both, sufficient infrastructure for the uptake of the national electric vehicle fleet and full connectivity across the TEN-T network. A fleet based approach based on capacity installed, grants Member States flexibility with regards to the composition of the recharging infrastructure, e.g. the share of fast recharging points. Introducing additional locations based targets on EU level would have limited Member States flexibility without yielding any clear EU wide benefit. A safeguard mechanism of an absolute minimum share targets helps ensure sufficiency of infrastructure roll out to overcome the “chicken&egg” problem in vehicle and infrastructure rollout; this will only come into effect if real world fleet deployment is really behind expected development.
Electricity HDV
·Member States must ensure at least 700kW installed capacity, with 350kW (or higher) charging points, every 60 km in each direction on TEN-T core network by 2025 and 1400 kW installed capacity with 350kW (or higher) charging points by 2030. In addition, MS must ensure at least 700kW installed capacity, with 350kW (or higher) charging points every 100 km on the TEN-T comprehensive network by 2030 and 1400 kW installed capacity with 350kW (or higher) charging points by 2035.
·Member States must ensure that safe and secure overnight parking area for heavy-duty vehicles has at least one recharging station of 100kW minimum by 2030.
·In addition, Member States have to ensure a minimum of electric recharging capacity (600 kW installed in 2025 ans 1.2 kW installed in 2030 through recharging points of at least 150 kW each) in every urban node of the TEN-T network as defined in the Regulation on TEN-T guidelines, in particular to serve urban delivery trucks.
The combined approach of mandating distance based targets along the TEN-T network and mandating charging at safe a secure parkings will provide a sufficient infrastructure coverage along the TEN-T network across the whole EU to support the expected market uptake of battery electric HDV by 2035. The recharging points in urban nodes will ensure that urban delivery trucks – that charge overnight in private depots - will have access to opportunity charging in case needed during their delivery trips.
Hydrogen
·Member States must ensure every 150 km on the TEN-T core network at least one station serving both directions for heavy-duty vehicles at 700 bar (while 350 bar is optional) by 2030. Light-duty vehicles should be enabled to fuel at all stations. Stations have to provide a minimum daily output capacity of 2t.
·Member States must ensure that at least one hydrogen refuelling station is deployed per urban node of the TEN-T network with a capacity of 2t hydrogen per day by 2030.
·In addition, Member State have to ensure that every 450 km on the TEN-T network a hydrogen refuelling station serves liquid hydrogen to trucks and that liquid hydrogen is served in at least one third of urban nodes.
This approach will ensure that fuel cell electric trucks can circulate freely along the TEN-T core network by 2030 and that refuelling stations are equally provided within urban nodes, the most frequent destination of long haul road transport. Within the urban node, Member States should consider to deploy the stations within multimodal freight centres as those are not only the typical destination for HDV but - in such locations - they could also serve hydrogen to other transport modes, e.g. rail and inland shipping. In addition, the requirement on liquid hydrogen is introduced to ensure that emerging technologies in the HDV sector are taking into account when the infrastructure is deployed.
Because of the low number of fuel cell LDV expected in the coming decade, no specific hydrogen refuelling infrastructure is envisaged. However, fuel cell LDV should always have access to all hydrogen refuelling stations.
LNG HDV
·Member States have to ensure an appropriate number of LNG refuelling points accessible to the public by 2025, at least on the TEN-T core network, to ensure circulation of TEN-T heavy-goods vehicles, as it stipulated by the current Directive.
The analysis has shown that current Member State planning and market forces will ensure that a sufficiently dense network will develop along the TEN-T network. However, there is a risk that small gaps in some Member States (AT, RO, IE, LV, EL) may persist. This is why the current requirement of the Directive is continued so that full circulation along the TEN-T network will be possible. In order to be compliant with the long-term objective of climate neutrality, the use of LNG in road transport is dependant on the increasing blending with biogas and the increased use of renewable synthetic gas (e-gas), so that use of natural gas becomes increasingly decarbonised.
CNG
No specific requirements are foreseen for CNG refuelling infrastructure as the infrastructure is already driven by market forces, the market for CNG vehicles is heavily concentrated in a few Member States and the number of CNG vehicles is expected to drastically decrease post 2035.
Target Setting Waterborne
OPS in maritime ports
·Member States have to ensure that OPS is installed to cover at least 90%
of demand for all TEN-T core and comprehensive ports at for terminals receiving: cruise, container, Ro-Pax above 5000GT by 2030. Ports whose average annual traffic volume during the past 3 years is less than 25 cruise ship calls, 50 container ship calls, 40 ferry calls, are exempted from this obligation.
This obligation is fully aligned with the requirements under the fuelEU maritime initiative. It ensures that the sector finds sufficient OPS supply in TEN-T core and comprehensive ports to comply with those requirements without creating a risk that ships need to be diverted because of a lack of OPS infrastructure in some ports.
OPS in inland waterway ports
·For inland waterway ports, Member States have to ensure that 1 OPS is installed in all TEN-T core and comprehensive ports by 2030.
This obligation should further push the sector towards zero emission technologies. However, in the absence of demand side measures only an initial coverage with OPS is foreseen that will be subject to further scrutiny within the review process envisaged for 2027.
LNG refuelling points in maritime ports
·For inland waterway ports, the exiting provision of the directive remains in force that Member States have to ensure that by 2025 circulation along the TEN-T core network shall be possible by 2025.
The assessment as shown that it is likely that 71 out of 90 TEN-T core ports will have LNG bunkering available by 2025 which ensures that the objective is met. However, in order to be compliant with the EGD, biogas and e-gas should be used for the operations.
LNG refuelling points in inland waterway ports
·The policy option removes the requirement under the current Directive for LNG bunkering in TEN-T core ports that foresees that vessels must be able to circulate along the TEN-core network.
The provision is removed as there is great uncertainty on the decarbonisation pathway of inland waterway shipping. Instead, an obligation is introduced on Member States to develop such decarbonisation concepts along the TEN-T corridors in their NPFs to inform the review of the directive in around 2026.
Target Setting Aviation
·For TEN-T core and comprehensive airports, Member States must ensure electricity supply to stationary commercial passenger aircrafts at all gates and outfield positions by 2030.
This is considered the first step towards greening of airports. In addition, Member States are required in their NPFs to develop further concepts for the use of sustainable alternative fuels for aircrafts and airport operations. This will inform the Commission on possible targets in the 2026 review process.
Interoperability
Physical Standards
·A new Annex to the directive is introduced addressing technical specifications to be developed/completed by official standardization organizations and subsequently adopted via secondary legislation through delegated acts. Operators of recharging and refuelling infrastructure would then be obliged to meet the technical requirements. Such new standards for road transport would meet new and emerging needs / use cases in road transport (e.g., ultra-fast recharging for trucks, supplementary standards for hydrogen). Technical specifications will also be included for maritime transport and inland navigation (e.g., a single solution for shore-side battery recharging points for maritime and inland waterways vessels; hydrogen, methanol and ammonia refuelling points and bunkering for maritime and inland waterways vessels) as well as for aviation (e.g. hydrogen refuelling).
Under the directive standards have already been developed for a wide range of physical interfaces in particular for electric recharging. Those standards have been proven to be essential for the development of the European market and – in order to create the same security for investors - such standardisation work need to continue also for new and emerging technologies across all transport modes.
Communication Standards for recharging points
·A new Annex to the directive is introduced addressing technical specifications to be developed/completed by official standardization organizations and subsequently adopted via secondary legislation through delegated acts. CPOs would be required to support those standards:
·Communication between vehicle and the recharging point
·Communication between recharging point and CPO back-end
·Communication between recharging point and roaming platforms
·Communication between recharging points and the grid
Those standards would cover the different communication areas of the EV charging ecosystem fully allowing for competitive recharging and recharging service markets to develop across the EU. In particular, it would allow for the full integration of electric recharging points into the electric system allowing for smart and bidirectional recharging to develop.
Physical specification of infrastructure
·Member States will no longer be allowed to require shutters or any other specific technical requirements to ensure that recharging points can be sold without modifications throughout the EU.
In order to ensure a common market, specific national requirements – that are explicitly allowed under the existing directive - have led to additional costs on the manufacturer side that risk to make the roll out of recharging infrastructure unnecessary costly. Such specific national requires will no longer be allowed under the directive.
User Information
Data provision by operators of recharging and refuelling points
·Member States shall ensure that operators of recharging and refuelling points make the following data available to National Access Points in DATEX II format (the process of the provision of data will be further specified in the revision of the ITS directive):
oLocation (Elec, H2, CNG, LNG, LPG, biofuels), which will be specified by: longitude, latitude, country, city, street name and postal code
oOpening time (Elec, H2, CNG, LNG, LPG, biofuels)
oOperator information (Elec, H2, CNG, LNG, LPG, biofuels), which will be specified by: operator name, charging point ID code, telephone (helpdesk)
oVehicle type compatibility (Elec, H2, CNG, LNG, LPG, biofuels)
oCharging station characteristics (Elec), which will be specified by: number of connectors, identification methods, payment methods, roaming options, installed power capacity, number of vehicles that can charge simultaneously.
oCharging point characteristics (Elec), which will be specified by: type of connector, type of current (AC/DC), power phases (single or three phases), ISO 15118 capable (Plug & Charge)
oStorage tank pressure (H2)
·Member States shall ensure that operators of recharging and refuelling points make the following data available to National Access Points DATEX II format (the process of the provision of data will be further specified in the revision of the ITS directive):
oOperational status (Elec, H2)
oAvailability (Elec, H2)
oPrice ad-hoc (Elec, H2)
oEnergy source (Elec, H2: specification if 100% renewable electricity/hydrogen is provided. LNG/CNG: share of biofuel or e-fuel)
Price Transparency
·Member States must ensure that CPOs and EMSPs clearly communicate all existing price components (incl. in the case of EMSPs, possibly applying roaming fees) to consumers prior to the recharging session via a dedicated application (except for EMSPs if only fixed subscription fees apply).
·CPOs cannot unduly differentiate (or discriminate) between the prices charged to B2B customers (EMSPs) and the prices charged to B2C customers (i.e. the ad hoc price charged directly to EV-drivers). Price charged to different EMSPs must equally be non-discriminatory
This shall ensure that all users are fully informed about the price of a recharging session before the charge, including roaming fees that are charged by the EMSP. The directive will establish which price components need to be reflected in the displayed price (e.g. kwh price, time component, fixed component). Provisions on non-discriminatory practises towards EMSPs and consumers shall avoid undue preferential treatment to EMSPs associated to the CPO.
Payment options at recharging and refuelling points
·Member States must ensure that all publicly accessible electric recharging and hydrogen refueling points accept bank card payments. Easy bank card payment must be ensured by either terminal or NFC reader for all fast recharging points (>50kW) and hydrogen refueling stations. Payment by smartphone though a unique QR code is allowed at normal chargers (<50 kW) instead of NFC reader/terminal.
·Moreover, at every charge point, the customer must have the right to choose the payment method before initiating the charge. If automatic authentication under contract-based charging is offered by the charge-point operator, the user must have the right to choose either an ad hoc payment option or pay through another EMSP supported by the CPO.
To avoid the continuation of multiple different approaches with respect to ad hoc payment, one common payment method is made mandatory for all recharging and hydrogen refuelling points. Bank card (incl. credit card) payment is the most commonly used payment method across the EU. In order to keep costs for the roll out low, CPOs are allowed to allow for payments through a QR code and smartphone on normal chargers. However, for more expensive fast recharging points and hydrogen stations where the additional investment costs for terminal or readers are less relevant, those more user friendly payment methods are made mandatory. At the same time consumer choice must be maintained. Even when the recharging point and the vehicle allow for automatic authentication and automatic start of the recharging session, the ev-user shall always have the choice to use a different payment option.
Physical Signposting
·It sets a requirement to install signposting of recharging points and hydrogen refuelling stations within parking and recharging/refuelling areas along the TEN-T core and comprehensive network.
According to ev-users, it is often difficult to find the exact location of a recharging point within a larger parking area along the TEN-T network. To avoid this, clear signposting within those areas is required.


