

 EUROPEAN COMMISSION
Brussels, 15.2.2021
COM(2021) 60 final
REPORT FROM THE COMMISSION
on the use of contract staff in 2017 and 2018
EUR-Lex Access to European Union law
This document is an excerpt from the EUR-Lex website
Document 52021DC0060
REPORT FROM THE COMMISSION on the use of contract staff in 2017 and 2018
REPORT FROM THE COMMISSION on the use of contract staff in 2017 and 2018
REPORT FROM THE COMMISSION on the use of contract staff in 2017 and 2018
COM/2021/60 final
EUROPEAN COMMISSION
Brussels, 15.2.2021
COM(2021) 60 final
REPORT FROM THE COMMISSION
on the use of contract staff in 2017 and 2018
Table of Contents
1.Introduction
2.Contract staff in institutions, agencies and ju/eit
3.Contract staff at the European Commission
4. Breakdown of contract staff among other institutions, agencies and joint undertakings/EIT
ANNEX I
1.Introduction
This report fulfils the obligation arising from Article 79(3) of the Conditions of Employment of Other Servants of the European Union (CEOS), which provides that ‘the Commission shall provide a yearly report on the use of contract staff including numbers of staff, level and type of posts, geographical balance and budgetary resources per function group’. It includes the information related to years 2017 and 2018, with data taken at 31 December.
This report includes data for 57 different entities: a) the institutions as defined in article 13 of the Treaty on the European Union, except for the European Central Bank; b) the bodies assimilated to the institutions by article 1b of the Staff regulations and c) the bodies to whom the Staff Regulations apply under the Union acts establishing them, as defined in Article 1a, paragraph 2, of the Staff Regulations 1 . These bodies include executive and decentralised Agencies, Joint Undertakings (JU) 2 and the Europen Institute of Innovation and Technology (EIT).
Data concerning the Commission include all contract staff, i.e. staff financed upon administrative, operational and research budget lines as well as upon revenue stemming from Service Level Agreements with the other institutions and bodies. 3
The category of contract staff was created in 2004 as part of the reform of the Staff Regulations. Since then, contract staff have made a useful contribution to the work of the institutions by carrying out administrative support activities at a lower cost and by bringing in skills not always readily available within the institutions.
Articles 3a and 3b of the CEOS define the role of contract staff and functions that they may perform.
Contract staff 3a can be engaged, on either a part time or full-time basis in a post not included in the establishment plan:
·for the institutions' services: to carry out exclusively manual or administrative support tasks in function group I,
·for the EU Representations and Delegations, the Agencies and other entities: to perform the functions specified in Article 80.2 of the CEOS in function groups I, II, III and IV.
This staff benefit from a contract that can be converted into a contract of indefinite duration, after a first renewal.
Contract staff 3b type are employed:
·to perform tasks other than those referred to in article 3a of the CEOS in a post not included in the establishment plan, or
·to replace an official or temporary staff member who is temporarily unable to perform his or her duties.
This staff are engaged for short periods, from a minimum of 3 months to a maximum of 6 years.
Article 80 of the CEOS establishes a link between each function group (FG) and the duties that contract staff may perform:
|
Function group |
Grade |
Tasks |
|
IV |
13 to 18 |
Administrative, advisory, linguistic and equivalent technical tasks, performed under the supervision of officials or temporary staff |
|
III |
8 to 12 |
Executive tasks, drafting, accountancy and other equivalent technical tasks, performed under the supervision of officials or temporary staff |
|
II |
4 to 7 |
Clerical and secretarial tasks, office management and other equivalent tasks, performed under the supervision of officials or temporary staff |
|
I |
1 to 3 |
Manual and administrative support service tasks, performed under the supervision of officials or temporary staff. |
2.Contract staff in institutions, agencies and ju/eit
The number of contract agents on 31 December of the respective years is split as follows:
Table 1 - Number of contract agents at the Commission, other institutions and agencies and JU/EIT in 2017
|
European Commission |
7165 |
|
Other institutions |
2425 |
|
Agencies and JU/EIT |
3749 |
Table 2 - Share of contract agents at the Commission, other institutions and agencies and JU/EIT in 2017

Table 3 - Number of contract agents at the Commission, other institutions and agencies and JU/EIT in 2018
|
European Commission |
7238 |
|
Other institutions |
2608 |
|
Agencies and JU/EIT |
3995 |
Table 4 - Share of contract agents at the Commission, other institutions and agencies and JU/EIT in 2018

Table 5 - Variation of number of contract agents at the Commission, other institutions and agencies and JU/EIT (2017 on 2016)
|
European Commission |
+ 0,48% |
|
Other institutions |
+ 7,59% |
|
Agencies and JU/EIT |
+ 7,42% |
Table 6 - Variation of number of contract agents at the Commission, other institutions and agencies and JU/EIT (2018 on 2017)
|
European Commission |
+ 1,02% |
|
Other institutions |
+ 7,55% |
|
Agencies and JU/EIT |
+ 6,56% |
Table 7 - Variation of relative quota of contract agents among the Commission, other institutions and agencies and JU/EIT (2017 on 2016)
|
European Commission |
- 1,67% |
|
Other institutions |
+ 0,67% |
|
Agencies and JU/EIT |
+ 1,00% |
Table 8 - Variation of relative share of contract agents among the Commission, other institutions and agencies and JU/EIT (2018 on 2017)
|
European Commission |
- 1,42% |
|
Other institutions |
+ 0,66% |
|
Agencies and JU/EIT |
+ 0,76% |
3.Contract staff at the European Commission
3.1 Evolution in the use of contract staff at the Commission
Table 9 - Evolution over time within the Commission

3.2 Breakdown by gender and by function group of Commission’s contract staff
The breakdown of contract staff by gender, function group (FG) and grade for both 2017 and 2018 is shown in the tables below.
Table 10a - Breakdown by gender, FG and grade of Commission’s contract staff in 2017

|
Male |
Female |
Total |
|||||
|
FGIV |
FGIV18 |
102 |
65.0% |
55 |
35.0% |
157 |
5.6% |
|
FGIV17 |
133 |
64.9% |
72 |
35.1% |
205 |
7.3% |
|
|
FGIV16 |
328 |
56.8% |
249 |
43.2% |
577 |
20.5% |
|
|
FGIV15 |
420 |
47.7% |
460 |
52.3% |
880 |
31.3% |
|
|
FGIV14 |
369 |
46.0% |
434 |
54.0% |
803 |
28.5% |
|
|
FGIV13 |
92 |
47.4% |
102 |
52.6% |
194 |
6.9% |
|
|
|
1444 |
51.3% |
1372 |
48.7% |
2816 |
39.3% |
|
|
FGIII |
FGIII12 |
30 |
49.2% |
31 |
50.8% |
61 |
4.6% |
|
FGIII11 |
66 |
44.9% |
81 |
55.1% |
147 |
11.0% |
|
|
FGIII10 |
132 |
40.0% |
198 |
60.0% |
330 |
24.6% |
|
|
FGIII09 |
177 |
37.9% |
290 |
62.1% |
467 |
34.9% |
|
|
FGIII08 |
105 |
31.4% |
229 |
68.6% |
334 |
24.9% |
|
|
|
510 |
38.1% |
829 |
61.9% |
1339 |
18.7% |
|
|
FGII |
FGII07 |
29 |
14.6% |
170 |
85.4% |
199 |
9.0% |
|
FGII06 |
134 |
16.8% |
664 |
83.2% |
798 |
36.1% |
|
|
FGII05 |
134 |
16.3% |
687 |
83.7% |
821 |
37.2% |
|
|
FGII04 |
75 |
19.2% |
315 |
80.8% |
390 |
17.7% |
|
|
|
372 |
16.8% |
1836 |
83.2% |
2208 |
30.8% |
|
|
FGI |
FGI03 |
208 |
69.3% |
92 |
30.7% |
300 |
37.4% |
|
FGI02 |
273 |
59.6% |
185 |
40.4% |
458 |
57.1% |
|
|
FGI01 |
35 |
79.5% |
9 |
20.5% |
44 |
5.5% |
|
|
|
516 |
64.3% |
286 |
35.7% |
802 |
11.2% |
|
|
TOTAL |
2842 |
39.7% |
4323 |
60.3% |
7165 |
100% |
|
Table 10b - Breakdown by gender, FG and grade of Commission’s contract staff in 2018

|
Male |
Female |
Total |
|||||
|
FGIV |
GFIV18 |
84 |
63.6% |
48 |
36.4% |
132 |
4.7% |
|
GFIV17 |
117 |
62.6% |
70 |
37.4% |
187 |
6.6% |
|
|
GFIV16 |
338 |
54.7% |
280 |
45.3% |
618 |
21.9% |
|
|
GFIV15 |
376 |
47.7% |
412 |
52.3% |
788 |
28.0% |
|
|
GFIV14 |
453 |
45.1% |
552 |
54.9% |
1005 |
35.7% |
|
|
GFIV13 |
93 |
44.9% |
114 |
55.1% |
207 |
7.3% |
|
|
|
1461 |
49.7% |
1476 |
50.3% |
2937 |
40.6% |
|
|
FGIII |
GFIII12 |
25 |
47.2% |
28 |
52.8% |
53 |
4.0% |
|
GFIII11 |
60 |
45.8% |
71 |
54.2% |
131 |
9.8% |
|
|
GFIII10 |
148 |
42.7% |
199 |
57.3% |
347 |
25.9% |
|
|
GFIII09 |
187 |
34.6% |
354 |
65.4% |
541 |
40.4% |
|
|
GFIII08 |
96 |
30.1% |
223 |
69.9% |
319 |
23.8% |
|
|
|
516 |
37.1% |
875 |
62.9% |
1391 |
19.2% |
|
|
|
GFII07 |
26 |
14.1% |
158 |
85.9% |
184 |
8.3% |
|
FGII |
GFII06 |
122 |
16.8% |
604 |
83.2% |
726 |
32.9% |
|
GFII05 |
153 |
17.1% |
743 |
82.9% |
896 |
40.6% |
|
|
GFII04 |
53 |
17.3% |
253 |
82.7% |
306 |
13.9% |
|
|
|
354 |
16.8% |
1758 |
83.2% |
2112 |
29.2% |
|
|
FGI |
GFI03 |
272 |
70.3% |
115 |
29.7% |
387 |
48.3% |
|
GFI02 |
211 |
57.3% |
157 |
42.7% |
368 |
45.9% |
|
|
GFI01 |
36 |
83.7% |
7 |
16.3% |
43 |
5.4% |
|
|
|
|
519 |
65.0% |
279 |
35.0% |
798 |
11.0% |
|
|
|
|
|
|
|
||
|
TOTAL |
2850 |
39.4% |
4388 |
60.6% |
7238 |
100.0% |
|
3.3 Breakdown by nationality, gender and FG of Commission’s contract staff
It is worth noting that, as for officials and temporary agents 4 , engagement of contract staff is carried out on the basis of the required profile and the applicants' abilities and language knowledge, without any definition of national quotas.
In 2017, as in 2018, all the Member States were represented in all function groups with the exception of Austrians and Swedes in FGI. The nationalities most represented among contract staff are - in descending order - Italians, Belgians, French, Spaniards and Greeks, followed by Romanians and Poles. The share of the first four nationalities altogether has been the same since 2005 (around 60%). The British and the Germans, like the Poles and the Dutch, are rather under-represented in relation to their population. Conversely, the Belgians and the Italians are over-represented in relation to their population.
The breakdown by nationality is influenced by a combination of factors, in particular geographical proximity to the location of the institution’s headquarters (for the Commission, mainly Brussels, Luxembourg and Ispra), salary levels and the duration of the proposed contracts. Candidates are more likely to accept a post with a fixed-term contract if they are resident at or near the site of the institution offering them a job, also considering that the duration of the first contract is as a general rule of just one year. As reported in the tables below, this is in particular true for contract staff FGI and FGII, while the geographical balance is slightly better for contract staff in FGIII and FGIV.
Table 11a - Breakdown by nationality and gender of Commission's contract staff in 2017

Table 11b - Breakdown by nationality and gender of Commission's contract staff in 2018

Table 11c - Contract staff by nationality and gender in 2017 at the Commission.
|
|
M |
F |
TOTAL |
% |
Aggr. |
||
|
IT |
658 |
46.1% |
768 |
53.9% |
1426 |
19.9% |
19.9% |
|
BE |
446 |
34.6% |
844 |
65.4% |
1290 |
18.0% |
37.9% |
|
FR |
387 |
43.2% |
509 |
56.8% |
896 |
12.5% |
50.4% |
|
ES |
305 |
40.7% |
444 |
59.3% |
749 |
10.5% |
60.9% |
|
EL |
198 |
49.1% |
205 |
50.9% |
403 |
5.6% |
66.5% |
|
RO |
97 |
28.4% |
245 |
71.6% |
342 |
4.8% |
71.3% |
|
PL |
67 |
24.0% |
212 |
76.0% |
279 |
3.9% |
75.2% |
|
DE |
114 |
45.1% |
139 |
54.9% |
253 |
3.5% |
78.7% |
|
PT |
83 |
35.0% |
154 |
65.0% |
237 |
3.3% |
82.0% |
|
BG |
44 |
27.2% |
118 |
72.8% |
162 |
2.3% |
84.3% |
|
UK |
71 |
53.4% |
62 |
46.6% |
133 |
1.9% |
86.1% |
|
HU |
49 |
39.2% |
76 |
60.8% |
125 |
1.7% |
87.9% |
|
NL |
49 |
51.0% |
47 |
49.0% |
96 |
1.3% |
89.2% |
|
LT |
28 |
35.4% |
51 |
64.6% |
79 |
1.1% |
90.3% |
|
SK |
17 |
24.6% |
52 |
75.4% |
69 |
1.0% |
91.3% |
|
AT |
31 |
45.6% |
37 |
54.4% |
68 |
0.9% |
92.2% |
|
IE |
31 |
45.6% |
37 |
54.4% |
68 |
0.9% |
93.2% |
|
HR |
24 |
36.9% |
41 |
63.1% |
65 |
0.9% |
94.1% |
|
CZ |
14 |
22.6% |
48 |
77.4% |
62 |
0.9% |
94.9% |
|
SI |
21 |
36.2% |
37 |
63.8% |
58 |
0.8% |
95.7% |
|
SE |
20 |
36.4% |
35 |
63.6% |
55 |
0.8% |
96.5% |
|
FI |
19 |
35.8% |
34 |
64.2% |
53 |
0.7% |
97.3% |
|
LV |
11 |
24.4% |
34 |
75.6% |
45 |
0.6% |
97.9% |
|
EE |
7 |
17.9% |
32 |
82.1% |
39 |
0.5% |
98.4% |
|
DK |
17 |
47.2% |
19 |
52.8% |
36 |
0.5% |
98.9% |
|
CY |
13 |
43.3% |
17 |
56.7% |
30 |
0.4% |
99.3% |
|
Other |
14 |
56.0% |
11 |
44.0% |
25 |
0.3% |
99.7% |
|
MT |
4 |
30.8% |
9 |
69.2% |
13 |
0.2% |
99.9% |
|
LU |
3 |
33.3% |
6 |
66.7% |
9 |
0.1% |
100.0% |
|
Total |
2842 |
39.7% |
4323 |
60.3% |
7165 |
100.0% |
100.0% |
Table 11d - Contract staff by nationality and gender in 2018 at the Commission
|
|
M |
F |
TOTAL |
% |
Aggr. |
||
|
IT |
675 |
46.4% |
780 |
53.6% |
1455 |
20.1% |
20.1% |
|
BE |
450 |
35.4% |
820 |
64.6% |
1270 |
17.5% |
37.6% |
|
FR |
384 |
42.8% |
513 |
57.2% |
897 |
12.4% |
50.0% |
|
ES |
301 |
40.6% |
441 |
59.4% |
742 |
10.3% |
60.3% |
|
EL |
192 |
44.0% |
244 |
56.0% |
436 |
6.0% |
66.3% |
|
RO |
99 |
28.0% |
254 |
72.0% |
353 |
4.9% |
71.2% |
|
PL |
65 |
23.2% |
215 |
76.8% |
280 |
3.9% |
75.1% |
|
DE |
125 |
48.8% |
131 |
51.2% |
256 |
3.5% |
78.6% |
|
PT |
78 |
33.9% |
152 |
66.1% |
230 |
3.2% |
81.8% |
|
BG |
51 |
32.1% |
108 |
67.9% |
159 |
2.2% |
84.0% |
|
HU |
51 |
39.8% |
77 |
60.2% |
128 |
1.8% |
85.7% |
|
UK |
58 |
51.8% |
54 |
48.2% |
112 |
1.5% |
87.3% |
|
NL |
44 |
48.9% |
46 |
51.1% |
90 |
1.2% |
88.5% |
|
LT |
26 |
29.5% |
62 |
70.5% |
88 |
1.2% |
89.7% |
|
SK |
23 |
27.4% |
61 |
72.6% |
84 |
1.2% |
90.9% |
|
CZ |
21 |
28.8% |
52 |
71.2% |
73 |
1.0% |
91.9% |
|
IE |
33 |
46.5% |
38 |
53.5% |
71 |
1.0% |
92.9% |
|
SI |
22 |
32.4% |
46 |
67.6% |
68 |
0.9% |
93.8% |
|
AT |
29 |
44.6% |
36 |
55.4% |
65 |
0.9% |
94.7% |
|
FI |
22 |
38.6% |
35 |
61.4% |
57 |
0.8% |
95.5% |
|
HR |
14 |
25.0% |
42 |
75.0% |
56 |
0.8% |
96.3% |
|
SE |
21 |
38.9% |
33 |
61.1% |
54 |
0.7% |
97.0% |
|
LV |
11 |
22.4% |
38 |
77.6% |
49 |
0.7% |
97.7% |
|
EE |
7 |
17.1% |
34 |
82.9% |
41 |
0.6% |
98.3% |
|
CY |
13 |
37.1% |
22 |
62.9% |
35 |
0.5% |
98.8% |
|
DK |
14 |
40.0% |
21 |
60.0% |
35 |
0.5% |
99.3% |
|
Other |
13 |
46.4% |
15 |
53.6% |
28 |
0.4% |
99.6% |
|
LU |
3 |
23.1% |
10 |
76.9% |
13 |
0.2% |
99.8% |
|
MT |
5 |
38.5% |
8 |
61.5% |
13 |
0.2% |
100.0% |
|
TOTAL |
2850 |
39.4% |
4388 |
60.6% |
7238 |
100.0% |
100% |
Table 12a - Contract staff by gender, function group and nationality in 2017 at the Commission
|
FGIV |
|
|
M |
F |
TOTAL |
% |
Aggr. |
||
|
IT |
341 |
55.0% |
279 |
45.0% |
620 |
22.0% |
22.0% |
|
FR |
222 |
55.0% |
182 |
45.0% |
404 |
14.3% |
36.4% |
|
ES |
167 |
49.0% |
174 |
51.0% |
341 |
12.1% |
48.5% |
|
BE |
124 |
53.0% |
110 |
47.0% |
234 |
8.3% |
56.8% |
|
EL |
111 |
65.3% |
59 |
34.7% |
170 |
6.0% |
62.8% |
|
DE |
85 |
53.1% |
75 |
46.9% |
160 |
5.7% |
68.5% |
|
RO |
41 |
42.3% |
56 |
57.7% |
97 |
3.4% |
71.9% |
|
PT |
39 |
43.3% |
51 |
56.7% |
90 |
3.2% |
75.1% |
|
PL |
28 |
32.6% |
58 |
67.4% |
86 |
3.1% |
78.2% |
|
BG |
20 |
28.6% |
50 |
71.4% |
70 |
2.5% |
80.7% |
|
UK |
49 |
72.1% |
19 |
27.9% |
68 |
2.4% |
83.1% |
|
HU |
30 |
52.6% |
27 |
47.4% |
57 |
2.0% |
85.1% |
|
AT |
23 |
46.0% |
27 |
54.0% |
50 |
1.8% |
86.9% |
|
NL |
31 |
62.0% |
19 |
38.0% |
50 |
1.8% |
88.7% |
|
IE |
18 |
45.0% |
22 |
55.0% |
40 |
1.4% |
90.1% |
|
HR |
17 |
54.8% |
14 |
45.2% |
31 |
1.1% |
91.2% |
|
SK |
11 |
37.9% |
18 |
62.1% |
29 |
1.0% |
92.2% |
|
SE |
14 |
48.3% |
15 |
51.7% |
29 |
1.0% |
93.3% |
|
LT |
10 |
38.5% |
16 |
61.5% |
26 |
0.9% |
94.2% |
|
SI |
10 |
40.0% |
15 |
60.0% |
25 |
0.9% |
95.1% |
|
CZ |
8 |
33.3% |
16 |
66.7% |
24 |
0.9% |
95.9% |
|
FI |
9 |
37.5% |
15 |
62.5% |
24 |
0.9% |
96.8% |
|
Other |
11 |
50.0% |
11 |
50.0% |
22 |
0.8% |
97.5% |
|
DK |
10 |
55.6% |
8 |
44.4% |
18 |
0.6% |
98.2% |
|
LV |
4 |
25.0% |
12 |
75.0% |
16 |
0.6% |
98.8% |
|
EE |
3 |
21.4% |
11 |
78.6% |
14 |
0.5% |
99.3% |
|
CY |
5 |
38.5% |
8 |
61.5% |
13 |
0.5% |
99.7% |
|
LU |
1 |
25.0% |
3 |
75.0% |
4 |
0.1% |
99.9% |
|
MT |
2 |
50.0% |
2 |
50.0% |
4 |
0.1% |
100.0% |
|
TOTAL |
1444 |
51.3% |
1372 |
48.7% |
2816 |
100% |
100% |
Table 12b - Contract staff by gender, function group and nationality in 2018 at the Commission
|
FGIV |
|
M |
F |
Total |
% |
Aggr |
|||
|
IT |
369 |
54.3% |
311 |
45.7% |
680 |
23.2% |
23.2% |
|
FR |
217 |
53.6% |
188 |
46.4% |
405 |
13.8% |
36.9% |
|
ES |
169 |
48.8% |
177 |
51.2% |
346 |
11.8% |
48.7% |
|
BE |
121 |
51.5% |
114 |
48.5% |
235 |
8.0% |
56.7% |
|
EL |
108 |
60.7% |
70 |
39.3% |
178 |
6.1% |
62.8% |
|
DE |
89 |
54.9% |
73 |
45.1% |
162 |
5.5% |
68.3% |
|
RO |
47 |
39.8% |
71 |
60.2% |
118 |
4.0% |
72.3% |
|
PL |
30 |
31.3% |
66 |
68.8% |
96 |
3.3% |
75.6% |
|
PT |
37 |
39.4% |
57 |
60.6% |
94 |
3.2% |
78.8% |
|
BG |
23 |
32.9% |
47 |
67.1% |
70 |
2.4% |
81.2% |
|
HU |
32 |
55.2% |
26 |
44.8% |
58 |
2.0% |
83.1% |
|
UK |
39 |
72.2% |
15 |
27.8% |
54 |
1.8% |
85.0% |
|
AT |
22 |
44.9% |
27 |
55.1% |
49 |
1.7% |
86.7% |
|
NL |
25 |
52.1% |
23 |
47.9% |
48 |
1.6% |
88.3% |
|
IE |
20 |
45.5% |
24 |
54.5% |
44 |
1.5% |
89.8% |
|
LT |
12 |
33.3% |
24 |
66.7% |
36 |
1.2% |
91.0% |
|
SK |
12 |
37.5% |
20 |
62.5% |
32 |
1.1% |
92.1% |
|
SE |
14 |
48.3% |
15 |
51.7% |
29 |
1.0% |
93.1% |
|
CZ |
9 |
33.3% |
18 |
66.7% |
27 |
0.9% |
94.0% |
|
FI |
10 |
37.0% |
17 |
63.0% |
27 |
0.9% |
94.9% |
|
SI |
10 |
37.0% |
17 |
63.0% |
27 |
0.9% |
95.8% |
|
Other |
12 |
48.0% |
13 |
52.0% |
25 |
0.9% |
96.7% |
|
HR |
9 |
40.9% |
13 |
59.1% |
22 |
0.7% |
97.4% |
|
DK |
7 |
36.8% |
12 |
63.2% |
19 |
0.6% |
98.1% |
|
LV |
6 |
35.3% |
11 |
64.7% |
17 |
0.6% |
98.7% |
|
EE |
4 |
25.0% |
12 |
75.0% |
16 |
0.5% |
99.2% |
|
CY |
5 |
38.5% |
8 |
61.5% |
13 |
0.4% |
99.7% |
|
LU |
0 |
0.0% |
6 |
100.0% |
6 |
0.2% |
99.9% |
|
MT |
3 |
75.0% |
1 |
25.0% |
4 |
0.1% |
100.0% |
|
TOTAL |
1461 |
49.7% |
1476 |
50.3% |
2937 |
100.0% |
100.0% |
Table 12c - Contract staff by gender, function group and nationality in 2017 at the Commission
|
FGIII |
|
|
M |
F |
TOTAL |
% |
Aggr. |
||
|
IT |
103 |
40.2% |
153 |
59.8% |
256 |
19.1% |
19,1% |
|
BE |
72 |
44.7% |
89 |
55.3% |
161 |
12.0% |
31.1% |
|
FR |
73 |
45.3% |
88 |
54.7% |
161 |
12.0% |
43.2% |
|
ES |
49 |
36.8% |
84 |
63.2% |
133 |
9.9% |
53.1% |
|
EL |
34 |
34.0% |
66 |
66.0% |
100 |
7.5% |
60.6% |
|
RO |
26 |
31.0% |
58 |
69.0% |
84 |
6.3% |
66.8% |
|
PL |
16 |
26.2% |
45 |
73.8% |
61 |
4.6% |
71.4% |
|
DE |
19 |
34.5% |
36 |
65.5% |
55 |
4.1% |
75.5% |
|
BG |
12 |
29.3% |
29 |
70.7% |
41 |
3.1% |
78.6% |
|
PT |
12 |
33.3% |
24 |
66.7% |
36 |
2.7% |
81.3% |
|
UK |
16 |
48.5% |
17 |
51.5% |
33 |
2.5% |
83.7% |
|
LT |
11 |
44.0% |
14 |
56.0% |
25 |
1.9% |
85.6% |
|
NL |
11 |
44.0% |
14 |
56.0% |
25 |
1.9% |
87.5% |
|
HU |
9 |
37.5% |
15 |
62.5% |
24 |
1.8% |
89.2% |
|
SK |
2 |
12.5% |
14 |
87.5% |
16 |
1.2% |
90.4% |
|
CZ |
2 |
13.3% |
13 |
86.7% |
15 |
1.1% |
91.6% |
|
SI |
4 |
26.7% |
11 |
73.3% |
15 |
1.1% |
92.7% |
|
SE |
5 |
33.3% |
10 |
66.7% |
15 |
1.1% |
93.8% |
|
HR |
3 |
21.4% |
11 |
78.6% |
14 |
1.0% |
94.8% |
|
LV |
3 |
23.1% |
10 |
76.9% |
13 |
1.0% |
95.8% |
|
AT |
5 |
50.0% |
5 |
50.0% |
10 |
0.7% |
96.6% |
|
IE |
8 |
80.0% |
2 |
20.0% |
10 |
0.7% |
97.3% |
|
EE |
3 |
33.3% |
6 |
66.7% |
9 |
0.7% |
98.0% |
|
CY |
4 |
57.1% |
3 |
42.9% |
7 |
0.5% |
98.5% |
|
DK |
3 |
42.9% |
4 |
57.1% |
7 |
0.5% |
99.0% |
|
FI |
2 |
40.0% |
3 |
60.0% |
5 |
0.4% |
99.4% |
|
MT |
1 |
20.0% |
4 |
80.0% |
5 |
0.4% |
99.8% |
|
Other |
2 |
100.0% |
0 |
0.0% |
2 |
0.1% |
99.9% |
|
LU |
0 |
0.0% |
1 |
100.0% |
1 |
0.1% |
100.0% |
|
TOTAL |
510 |
38.1% |
829 |
61.9% |
1339 |
100% |
100% |
Table 12d - Contract staff by gender, function group and nationality in 2018 at the Commission
|
FGIII |
|
M |
F |
Total |
% |
Aggr |
|||
|
IT |
102 |
38.9% |
160 |
61.1% |
262 |
18.8% |
18.8% |
|
FR |
69 |
41.6% |
97 |
58.4% |
166 |
11.9% |
30.8% |
|
BE |
68 |
42.8% |
91 |
57.2% |
159 |
11.4% |
42.2% |
|
ES |
50 |
36.8% |
86 |
63.2% |
136 |
9.8% |
52.0% |
|
EL |
34 |
28.8% |
84 |
71.2% |
118 |
8.5% |
60.5% |
|
RO |
27 |
30.7% |
61 |
69.3% |
88 |
6.3% |
66.8% |
|
PL |
15 |
23.4% |
49 |
76.6% |
64 |
4.6% |
71.4% |
|
DE |
26 |
41.9% |
36 |
58.1% |
62 |
4.5% |
75.8% |
|
BG |
19 |
43.2% |
25 |
56.8% |
44 |
3.2% |
79.0% |
|
PT |
12 |
34.3% |
23 |
65.7% |
35 |
2.5% |
81.5% |
|
UK |
13 |
46.4% |
15 |
53.6% |
28 |
2.0% |
83.5% |
|
HU |
9 |
36.0% |
16 |
64.0% |
25 |
1.8% |
85.3% |
|
NL |
11 |
44.0% |
14 |
56.0% |
25 |
1.8% |
87.1% |
|
LT |
10 |
43.5% |
13 |
56.5% |
23 |
1.7% |
88.8% |
|
SK |
4 |
18.2% |
18 |
81.8% |
22 |
1.6% |
90.4% |
|
CZ |
6 |
28.6% |
15 |
71.4% |
21 |
1.5% |
91.9% |
|
SI |
5 |
29.4% |
12 |
70.6% |
17 |
1.2% |
93.1% |
|
HR |
3 |
20.0% |
12 |
80.0% |
15 |
1.1% |
94.2% |
|
SE |
5 |
41.7% |
7 |
58.3% |
12 |
0.9% |
95.0% |
|
CY |
5 |
50.0% |
5 |
50.0% |
10 |
0.7% |
95.8% |
|
LV |
1 |
10.0% |
9 |
90.0% |
10 |
0.7% |
96.5% |
|
EE |
2 |
22.2% |
7 |
77.8% |
9 |
0.6% |
97.1% |
|
FI |
5 |
55.6% |
4 |
44.4% |
9 |
0.6% |
97.8% |
|
IE |
7 |
77.8% |
2 |
22.2% |
9 |
0.6% |
98.4% |
|
AT |
4 |
50.0% |
4 |
50.0% |
8 |
0.6% |
99.0% |
|
DK |
3 |
42.9% |
4 |
57.1% |
7 |
0.5% |
99.5% |
|
MT |
0 |
0.0% |
3 |
100.0% |
3 |
0.2% |
99.7% |
|
LU |
0 |
0.0% |
2 |
100.0% |
2 |
0.1% |
99.9% |
|
Other |
1 |
50.0% |
1 |
50.0% |
2 |
0.1% |
100.0% |
|
TOTAL |
516 |
37.1% |
875 |
62.9% |
1391 |
100.0% |
100.0% |
Table 12e - Contract staff by gender, function group and nationality in 2017 at the Commission
|
FGII |
|
|
M |
F |
TOTAL |
% |
Aggr. |
||
|
BE |
63 |
10.5% |
538 |
89.5% |
601 |
27.2% |
27.2% |
|
IT |
67 |
19.6% |
275 |
80.4% |
342 |
15.5% |
42.7% |
|
FR |
48 |
18.3% |
215 |
81.7% |
263 |
11.9% |
54.6% |
|
ES |
44 |
21.4% |
162 |
78.6% |
206 |
9.3% |
63.9% |
|
RO |
26 |
17.3% |
124 |
82.7% |
150 |
6.8% |
70.7% |
|
PL |
20 |
18.5% |
88 |
81.5% |
108 |
4.9% |
75.6% |
|
EL |
25 |
26.6% |
69 |
73.4% |
94 |
4.3% |
79.9% |
|
PT |
10 |
14.1% |
61 |
85.9% |
71 |
3.2% |
83.1% |
|
BG |
10 |
20.4% |
39 |
79.6% |
49 |
2.2% |
85.3% |
|
HU |
7 |
17.5% |
33 |
82.5% |
40 |
1.8% |
87.1% |
|
DE |
7 |
20.6% |
27 |
79.4% |
34 |
1.5% |
88.7% |
|
LT |
6 |
22.2% |
21 |
77.8% |
27 |
1.2% |
89.9% |
|
UK |
4 |
16.7% |
20 |
83.3% |
24 |
1.1% |
91.0% |
|
SK |
2 |
9.1% |
20 |
90.9% |
22 |
1.0% |
92.0% |
|
CZ |
3 |
14.3% |
18 |
85.7% |
21 |
1.0% |
92.9% |
|
HR |
3 |
15.8% |
16 |
84.2% |
19 |
0.9% |
93.8% |
|
FI |
4 |
21.1% |
15 |
78.9% |
19 |
0.9% |
94.7% |
|
NL |
4 |
22.2% |
14 |
77.8% |
18 |
0.8% |
95.5% |
|
SI |
4 |
26.7% |
11 |
73.3% |
15 |
0.7% |
96.2% |
|
EE |
0 |
0.0% |
14 |
100.0% |
14 |
0.6% |
96.8% |
|
LV |
2 |
14.3% |
12 |
85.7% |
14 |
0.6% |
97.4% |
|
IE |
1 |
7.7% |
12 |
92.3% |
13 |
0.6% |
98.0% |
|
SE |
1 |
9.1% |
10 |
90.9% |
11 |
0.5% |
98.5% |
|
CY |
3 |
33.3% |
6 |
66.7% |
9 |
0.4% |
98.9% |
|
DK |
3 |
33.3% |
6 |
66.7% |
9 |
0.4% |
99.3% |
|
AT |
3 |
37.5% |
5 |
62.5% |
8 |
0.4% |
99.7% |
|
MT |
1 |
25.0% |
3 |
75.0% |
4 |
0.2% |
99.9% |
|
LU |
0 |
0.0% |
2 |
100.0% |
2 |
0.1% |
100.0% |
|
Other |
1 |
100.0% |
0 |
0.0% |
1 |
0.0% |
100.0% |
|
TOTAL |
372 |
20.3% |
1836 |
83.2% |
2208 |
100% |
100% |
Table 12f - Contract staff by gender, function group and nationality in 2018 at the Commission
|
FGII |
|
M |
F |
Total |
% |
Aggr |
|||
|
BE |
69 |
11.9% |
510 |
88.1% |
579 |
27.4% |
27.4% |
|
IT |
58 |
18.8% |
250 |
81.2% |
308 |
14.6% |
42.0% |
|
FR |
54 |
20.8% |
205 |
79.2% |
259 |
12.3% |
54.3% |
|
ES |
37 |
19.3% |
155 |
80.7% |
192 |
9.1% |
63.4% |
|
RO |
21 |
15.4% |
115 |
84.6% |
136 |
6.4% |
69.8% |
|
EL |
22 |
21.8% |
79 |
78.2% |
101 |
4.8% |
74.6% |
|
PL |
17 |
17.7% |
79 |
82.3% |
96 |
4.5% |
79.1% |
|
PT |
8 |
12.9% |
54 |
87.1% |
62 |
2.9% |
82.1% |
|
BG |
7 |
16.3% |
36 |
83.7% |
43 |
2.0% |
84.1% |
|
HU |
8 |
19.0% |
34 |
81.0% |
42 |
2.0% |
86.1% |
|
DE |
7 |
25.0% |
21 |
75.0% |
28 |
1.3% |
87.4% |
|
LT |
3 |
10.7% |
25 |
89.3% |
28 |
1.3% |
88.7% |
|
SK |
5 |
17.9% |
23 |
82.1% |
28 |
1.3% |
90.1% |
|
CZ |
5 |
21.7% |
18 |
78.3% |
23 |
1.1% |
91.1% |
|
UK |
4 |
17.4% |
19 |
82.6% |
23 |
1.1% |
92.2% |
|
SI |
4 |
19.0% |
17 |
81.0% |
21 |
1.0% |
93.2% |
|
LV |
2 |
10.0% |
18 |
90.0% |
20 |
0.9% |
94.2% |
|
HR |
1 |
5.6% |
17 |
94.4% |
18 |
0.9% |
95.0% |
|
FI |
3 |
18.8% |
13 |
81.3% |
16 |
0.8% |
95.8% |
|
EE |
0 |
0.0% |
14 |
100.0% |
14 |
0.7% |
96.4% |
|
NL |
5 |
35.7% |
9 |
64.3% |
14 |
0.7% |
97.1% |
|
IE |
2 |
15.4% |
11 |
84.6% |
13 |
0.6% |
97.7% |
|
SE |
2 |
15.4% |
11 |
84.6% |
13 |
0.6% |
98.3% |
|
CY |
2 |
18.2% |
9 |
81.8% |
11 |
0.5% |
98.9% |
|
AT |
3 |
37.5% |
5 |
62.5% |
8 |
0.4% |
99.2% |
|
DK |
3 |
42.9% |
4 |
57.1% |
7 |
0.3% |
99.6% |
|
MT |
1 |
20.0% |
4 |
80.0% |
5 |
0.2% |
99.8% |
|
LU |
1 |
33.3% |
2 |
66.7% |
3 |
0.1% |
100.0% |
|
Other |
0 |
0.0% |
1 |
100.0% |
1 |
0.0% |
100.0% |
|
TOTAL |
354 |
16.8% |
1758 |
83.2% |
2112 |
100% |
100% |
Table 12g - Contract staff by gender, function group and nationality in 2017 at the Commission
|
FGI |
|
|
M |
F |
Total |
% |
Aggr. |
||
|
BE |
187 |
63.6% |
107 |
36.4% |
294 |
36.7% |
36.7% |
|
IT |
147 |
70.7% |
61 |
29.3% |
208 |
25.9% |
62.6% |
|
ES |
45 |
65.2% |
24 |
34.8% |
69 |
8.6% |
71.2% |
|
FR |
44 |
64.7% |
24 |
35.3% |
68 |
8.5% |
79.7% |
|
PT |
22 |
55.0% |
18 |
45.0% |
40 |
5.0% |
84.7% |
|
EL |
28 |
71.8% |
11 |
28.2% |
39 |
4.9% |
89.5% |
|
PL |
3 |
12.5% |
21 |
87.5% |
24 |
3.0% |
92.5% |
|
RO |
4 |
36.4% |
7 |
63.6% |
11 |
1.4% |
93.9% |
|
UK |
2 |
25.0% |
6 |
75.0% |
8 |
1.0% |
94.9% |
|
FI |
4 |
80.0% |
1 |
20.0% |
5 |
0.6% |
95.5% |
|
IE |
4 |
80.0% |
1 |
20.0% |
5 |
0.6% |
96.1% |
|
DE |
3 |
75.0% |
1 |
25.0% |
4 |
0.5% |
96.6% |
|
HU |
3 |
75.0% |
1 |
25.0% |
4 |
0.5% |
97.1% |
|
NL |
3 |
100.0% |
0 |
0.0% |
3 |
0.4% |
97.5% |
|
SI |
3 |
100.0% |
0 |
0.0% |
3 |
0.4% |
97.9% |
|
BG |
2 |
100.0% |
0 |
0.0% |
2 |
0.2% |
98.1% |
|
CZ |
1 |
50.0% |
1 |
50.0% |
2 |
0.2% |
98.4% |
|
DK |
1 |
50.0% |
1 |
50.0% |
2 |
0.2% |
98.6% |
|
EE |
1 |
50.0% |
1 |
50.0% |
2 |
0.2% |
98.9% |
|
LV |
2 |
100.0% |
0 |
0.0% |
2 |
0.2% |
99.1% |
|
LU |
2 |
100.0% |
0 |
0.0% |
2 |
0.2% |
99.4% |
|
SK |
2 |
100.0% |
0 |
0.0% |
2 |
0.2% |
99.6% |
|
HR |
1 |
100.0% |
0 |
0.0% |
1 |
0.1% |
99.8% |
|
CY |
1 |
100.0% |
0 |
0.0% |
1 |
0.1% |
99.9% |
|
LT |
1 |
100.0% |
0 |
0.0% |
1 |
0.1% |
100.0% |
|
TOTAL |
516 |
64.3% |
286 |
35.7% |
802 |
100% |
100,00% |
Table 12h - Contract staff by gender, function group and nationality in 2018 at the Commission
|
FGI |
|
M |
F |
Total |
% |
Aggr |
|||
|
BE |
192 |
64.6% |
105 |
35.4% |
297 |
37.2% |
37.2% |
|
IT |
146 |
71.2% |
59 |
28.8% |
205 |
25.7% |
62.9% |
|
ES |
45 |
66.2% |
23 |
33.8% |
68 |
8.5% |
71.4% |
|
FR |
44 |
65.7% |
23 |
34.3% |
67 |
8.4% |
79.8% |
|
EL |
28 |
71.8% |
11 |
28.2% |
39 |
4.9% |
84.7% |
|
PT |
21 |
53.8% |
18 |
46.2% |
39 |
4.9% |
89.6% |
|
PL |
3 |
12.5% |
21 |
87.5% |
24 |
3.0% |
92.6% |
|
RO |
4 |
36.4% |
7 |
63.6% |
11 |
1.4% |
94.0% |
|
UK |
2 |
28.6% |
5 |
71.4% |
7 |
0.9% |
94.9% |
|
FI |
4 |
80.0% |
1 |
20.0% |
5 |
0.6% |
95.5% |
|
IE |
4 |
80.0% |
1 |
20.0% |
5 |
0.6% |
96.1% |
|
DE |
3 |
75.0% |
1 |
25.0% |
4 |
0.5% |
96.6% |
|
HU |
2 |
66.7% |
1 |
33.3% |
3 |
0.4% |
97.0% |
|
NL |
3 |
100.0% |
0 |
0.0% |
3 |
0.4% |
97.4% |
|
SI |
3 |
100.0% |
0 |
0.0% |
3 |
0.4% |
97.7% |
|
BG |
2 |
100.0% |
0 |
0.0% |
2 |
0.3% |
98.0% |
|
CZ |
1 |
50.0% |
1 |
50.0% |
2 |
0.3% |
98.2% |
|
DK |
1 |
50.0% |
1 |
50.0% |
2 |
0.3% |
98.5% |
|
EE |
1 |
50.0% |
1 |
50.0% |
2 |
0.3% |
98.7% |
|
LV |
2 |
100.0% |
0 |
0.0% |
2 |
0.3% |
99.0% |
|
LU |
2 |
100.0% |
0 |
0.0% |
2 |
0.3% |
99.2% |
|
SK |
2 |
100.0% |
0 |
0.0% |
2 |
0.3% |
99.5% |
|
HR |
1 |
100.0% |
0 |
0.0% |
1 |
0.1% |
99.6% |
|
CY |
1 |
100.0% |
0 |
0.0% |
1 |
0.1% |
99.7% |
|
LT |
1 |
100.0% |
0 |
0.0% |
1 |
0.1% |
99.9% |
|
MT |
1 |
100.0% |
0 |
0.0% |
1 |
0.1% |
100.0% |
|
AT |
0 |
0.0% |
0 |
0.0% |
0 |
0.0% |
100.0% |
|
SE |
0 |
0.0% |
0 |
0.0% |
0 |
0.0% |
100.0% |
|
TOTAL |
519 |
65.0% |
279 |
35.0% |
798 |
100% |
100% |
3.4 Breakdown by DG of Commission’s contract staff
In the tables that follow, it is reported how contract staff are distributed across the different DGs, services and offices attached to the Commission 5 , with particular reference to gender, nationality and function group.
Table 13a - Breakdown by gender, DG and two clusters of FGs of Commission's contract staff in 2017
|
|
FG I-II-III |
FG IV |
TOTAL ALL FG |
||||||||
|
M |
F |
Total |
% |
M |
F |
Total |
% |
Total |
% |
||
|
AGRI |
15 |
33 |
48 |
49.5% |
20 |
29 |
49 |
50.5% |
97 |
1.4% |
|
|
BUDG |
15 |
34 |
49 |
89.1% |
1 |
5 |
6 |
10.9% |
55 |
0.8% |
|
|
CdP-OSP |
0 |
10 |
10 |
100.0% |
0 |
0 |
0 |
0.0% |
10 |
0.1% |
|
|
CLIMA |
3 |
13 |
16 |
64.0% |
7 |
2 |
9 |
36.0% |
25 |
0.3% |
|
|
CNECT |
54 |
92 |
146 |
71.6% |
25 |
33 |
58 |
28.4% |
204 |
2.8% |
|
|
COMM |
95 |
217 |
312 |
88.1% |
11 |
31 |
42 |
11.9% |
354 |
4.9% |
|
|
COMP |
20 |
32 |
52 |
85.2% |
4 |
5 |
9 |
14.8% |
61 |
0.9% |
|
|
DEVCO |
62 |
148 |
210 |
22.8% |
363 |
350 |
713 |
77.2% |
923 |
12.9% |
|
|
DGT |
26 |
51 |
77 |
52.7% |
24 |
45 |
69 |
47.3% |
146 |
2.0% |
|
|
DIGIT |
11 |
23 |
34 |
48.6% |
24 |
12 |
36 |
51.4% |
70 |
1.0% |
|
|
EAC |
22 |
28 |
50 |
80.6% |
5 |
7 |
12 |
19.4% |
62 |
0.9% |
|
|
ECFIN |
7 |
10 |
17 |
63.0% |
7 |
3 |
10 |
37.0% |
27 |
0.4% |
|
|
ECHO |
29 |
59 |
88 |
77.2% |
12 |
14 |
26 |
22.8% |
114 |
1.6% |
|
|
EMPL |
32 |
98 |
130 |
83.9% |
9 |
16 |
25 |
16.1% |
155 |
2.2% |
|
|
ENER |
15 |
33 |
48 |
80.0% |
5 |
7 |
12 |
20.0% |
60 |
0.8% |
|
|
ENV |
8 |
29 |
37 |
68.5% |
7 |
10 |
17 |
31.5% |
54 |
0.8% |
|
|
EPSO |
7 |
17 |
24 |
96.0% |
0 |
1 |
1 |
4.0% |
25 |
0.3% |
|
|
ESTAT |
16 |
35 |
51 |
60.7% |
17 |
16 |
33 |
39.3% |
84 |
1.2% |
|
|
FISMA |
8 |
6 |
14 |
93.3% |
1 |
0 |
1 |
6.7% |
15 |
0.2% |
|
|
FPI |
4 |
31 |
35 |
41.2% |
23 |
27 |
50 |
58.8% |
85 |
1.2% |
|
|
GROW |
30 |
61 |
91 |
74.0% |
17 |
15 |
32 |
26.0% |
123 |
1.7% |
|
|
HOME |
9 |
34 |
43 |
79.6% |
4 |
7 |
11 |
20.4% |
54 |
0.8% |
|
|
HR |
58 |
95 |
153 |
92.7% |
3 |
9 |
12 |
7.3% |
165 |
2.3% |
|
|
IAS |
0 |
9 |
9 |
81.8% |
1 |
1 |
2 |
18.2% |
11 |
0.2% |
|
|
IDEA |
0 |
3 |
3 |
37.5% |
3 |
2 |
5 |
62.5% |
8 |
0.1% |
|
|
JRC |
110 |
183 |
293 |
26.1% |
494 |
337 |
831 |
73.9% |
1124 |
15.7% |
|
|
JUST |
11 |
30 |
41 |
73.2% |
10 |
5 |
15 |
26.8% |
56 |
0.8% |
|
|
MARE |
6 |
27 |
33 |
56.9% |
14 |
11 |
25 |
43.1% |
58 |
0.8% |
|
|
MOVE |
17 |
43 |
60 |
85.7% |
5 |
5 |
10 |
14.3% |
70 |
1.0% |
|
|
NEAR |
55 |
98 |
153 |
28.8% |
183 |
195 |
378 |
71.2% |
531 |
7.4% |
|
|
OIB |
245 |
534 |
779 |
97.9% |
3 |
14 |
17 |
2.1% |
796 |
11.1% |
|
|
OIL |
79 |
119 |
198 |
99.0% |
1 |
1 |
2 |
1.0% |
200 |
2.8% |
|
|
OLAF |
10 |
18 |
28 |
84.8% |
5 |
0 |
5 |
15.2% |
33 |
0.5% |
|
|
OP |
7 |
6 |
13 |
92.9% |
0 |
1 |
1 |
7.1% |
14 |
0.2% |
|
|
PMO |
121 |
288 |
409 |
100.0% |
0 |
0 |
0 |
0.0% |
409 |
5.7% |
|
|
REGIO |
32 |
70 |
102 |
92.7% |
5 |
3 |
8 |
7.3% |
110 |
1.5% |
|
|
RTD |
78 |
145 |
223 |
52.5% |
97 |
105 |
202 |
47.5% |
425 |
5.9% |
|
|
SANTE |
14 |
53 |
67 |
69.1% |
10 |
20 |
30 |
30.9% |
97 |
1.4% |
|
|
SCIC |
24 |
29 |
53 |
100.0% |
0 |
0 |
0 |
0.0% |
53 |
0.7% |
|
|
SG |
27 |
53 |
80 |
74.1% |
15 |
13 |
28 |
25.9% |
108 |
1.5% |
|
|
SJ |
1 |
18 |
19 |
70.4% |
3 |
5 |
8 |
29.6% |
27 |
0.4% |
|
|
TAXUD |
4 |
5 |
9 |
52.9% |
3 |
5 |
8 |
47.1% |
17 |
0.2% |
|
|
TF50 |
0 |
3 |
3 |
100.0% |
0 |
0 |
0 |
0.0% |
3 |
0.0% |
|
|
TRADE |
11 |
28 |
39 |
83.0% |
3 |
5 |
8 |
17.0% |
47 |
0.7% |
|
|
Total |
1 398 |
2 951 |
4 349 |
60.7% |
1 444 |
1 372 |
2 816 |
39.3% |
7 165 |
100.0% |
|
Table 13b - Breakdown by gender, DG and two clusters of FGs of Commission's contract staff in 2018
|
|
FGI-II-II |
FG IV |
|
TOTAL ALL FG |
|||||||
|
M |
F |
Total |
% |
M |
F |
Total |
% |
|
Total |
% |
|
|
AGRI |
8 |
27 |
35 |
43.2% |
19 |
27 |
46 |
56.8% |
|
81 |
1.1% |
|
BUDG |
13 |
32 |
45 |
81.8% |
3 |
7 |
10 |
18.2% |
|
55 |
0.8% |
|
CdP-OSP |
0 |
9 |
9 |
100.0% |
0 |
0 |
0 |
0.0% |
|
9 |
0.1% |
|
CLIMA |
3 |
12 |
15 |
62.5% |
6 |
3 |
9 |
37.5% |
|
24 |
0.3% |
|
CNECT |
42 |
97 |
139 |
70.2% |
24 |
35 |
59 |
29.8% |
|
198 |
2.7% |
|
COMM |
98 |
225 |
323 |
87.5% |
14 |
32 |
46 |
12.5% |
|
369 |
5.1% |
|
COMP |
16 |
37 |
53 |
88.3% |
4 |
3 |
7 |
11.7% |
|
60 |
0.8% |
|
DEVCO |
69 |
147 |
216 |
21.3% |
392 |
405 |
797 |
78.7% |
|
1013 |
14.0% |
|
DGT |
22 |
45 |
67 |
45.6% |
31 |
49 |
80 |
54.4% |
|
147 |
2.0% |
|
DIGIT |
7 |
22 |
29 |
43.3% |
23 |
15 |
38 |
56.7% |
|
67 |
0.9% |
|
EAC |
17 |
27 |
44 |
78.6% |
4 |
8 |
12 |
21.4% |
|
56 |
0.8% |
|
ECFIN |
7 |
8 |
15 |
65.2% |
3 |
5 |
8 |
34.8% |
|
23 |
0.3% |
|
ECHO |
27 |
60 |
87 |
72.5% |
11 |
22 |
33 |
27.5% |
|
120 |
1.7% |
|
EMPL |
32 |
79 |
111 |
82.2% |
7 |
17 |
24 |
17.8% |
|
135 |
1.9% |
|
ENER |
15 |
33 |
48 |
82.8% |
4 |
6 |
10 |
17.2% |
|
58 |
0.8% |
|
ENV |
4 |
31 |
35 |
66.0% |
6 |
12 |
18 |
34.0% |
|
53 |
0.7% |
|
EPSC |
1 |
3 |
4 |
50.0% |
3 |
1 |
4 |
50.0% |
|
8 |
0.1% |
|
EPSO |
7 |
18 |
25 |
96.2% |
0 |
1 |
1 |
3.8% |
|
26 |
0.4% |
|
ESTAT |
16 |
32 |
48 |
58.5% |
12 |
22 |
34 |
41.5% |
|
82 |
1.1% |
|
FISMA |
6 |
10 |
16 |
100.0% |
0 |
0 |
0 |
0.0% |
|
16 |
0.2% |
|
FPI |
7 |
31 |
38 |
38.8% |
31 |
29 |
60 |
61.2% |
|
98 |
1.4% |
|
GROW |
27 |
60 |
87 |
78.4% |
14 |
10 |
24 |
21.6% |
|
111 |
1.5% |
|
HOME |
10 |
27 |
37 |
82.2% |
2 |
6 |
8 |
17.8% |
|
45 |
0.6% |
|
HR |
63 |
131 |
194 |
91.1% |
6 |
13 |
19 |
8.9% |
|
213 |
2.9% |
|
IAS |
1 |
7 |
8 |
57.1% |
1 |
5 |
6 |
42.9% |
|
14 |
0.2% |
|
JRC |
102 |
132 |
234 |
21.7% |
500 |
345 |
845 |
78.3% |
|
1079 |
14.9% |
|
JUST |
4 |
31 |
35 |
76.1% |
6 |
5 |
11 |
23.9% |
|
46 |
0.6% |
|
MARE |
7 |
37 |
44 |
67.7% |
12 |
9 |
21 |
32.3% |
|
65 |
0.9% |
|
MOVE |
12 |
40 |
52 |
82.5% |
4 |
7 |
11 |
17.5% |
|
63 |
0.9% |
|
NEAR |
52 |
102 |
154 |
28.9% |
182 |
197 |
379 |
71.1% |
|
533 |
7.4% |
|
OIB |
320 |
559 |
879 |
97.9% |
4 |
15 |
19 |
2.1% |
|
898 |
12.4% |
|
OIL |
82 |
115 |
197 |
99.0% |
1 |
1 |
2 |
1.0% |
|
199 |
2.7% |
|
OLAF |
7 |
19 |
26 |
96.3% |
1 |
0 |
1 |
3.7% |
|
27 |
0.4% |
|
OP |
9 |
6 |
15 |
93.8% |
0 |
1 |
1 |
6.3% |
|
16 |
0.2% |
|
PMO |
121 |
302 |
423 |
100.0% |
0 |
0 |
0 |
0.0% |
|
423 |
5.8% |
|
REGIO |
24 |
58 |
82 |
94.3% |
3 |
2 |
5 |
5.7% |
|
87 |
1.2% |
|
RTD |
54 |
122 |
176 |
46.4% |
92 |
111 |
203 |
53.6% |
|
379 |
5.2% |
|
SANTE |
13 |
49 |
62 |
67.4% |
12 |
18 |
30 |
32.6% |
|
92 |
1.3% |
|
SCIC |
27 |
31 |
58 |
100.0% |
0 |
0 |
0 |
0.0% |
|
58 |
0.8% |
|
SG |
27 |
50 |
77 |
72.0% |
14 |
16 |
30 |
28.0% |
|
107 |
1.5% |
|
SJ |
1 |
16 |
17 |
65.4% |
3 |
6 |
9 |
34.6% |
|
26 |
0.4% |
|
TAXUD |
2 |
6 |
8 |
44.4% |
5 |
5 |
10 |
55.6% |
|
18 |
0.2% |
|
TF50 |
0 |
2 |
2 |
100.0% |
0 |
0 |
0 |
0.0% |
|
2 |
0.0% |
|
TRADE |
7 |
25 |
32 |
82.1% |
2 |
5 |
7 |
17.9% |
|
39 |
0.5% |
|
Total |
1 389 |
2 912 |
4 301 |
59.4% |
1 461 |
1 476 |
2 937 |
40.6% |
|
7 238 |
100.0% |
Contract staff 3a
Table 14a - 3a contract staff by FG, gender and DG in 2017 at the Commission
|
|
FGI |
FGII |
FGIII |
FGIV |
|
|
|
||||||||
|
|
M |
F |
TOTAL |
M |
F |
TOTAL |
M |
F |
TOTAL |
M |
F |
TOTAL |
|
Total |
% |
|
AGRI |
6 |
7 |
13 |
0 |
0 |
0 |
0 |
0 |
0 |
2 |
1 |
3 |
16 |
0.5% |
|
|
BUDG |
6 |
14 |
20 |
0 |
0 |
0 |
0 |
0 |
0 |
0 |
0 |
0 |
20 |
0.6% |
|
|
Cdp-OSP |
0 |
0 |
0 |
0 |
0 |
0 |
0 |
0 |
0 |
0 |
0 |
0 |
0 |
0.0% |
|
|
CNECT |
14 |
5 |
19 |
0 |
0 |
0 |
0 |
0 |
0 |
0 |
0 |
0 |
19 |
0.6% |
|
|
COMM |
31 |
7 |
38 |
33 |
138 |
171 |
24 |
59 |
83 |
11 |
31 |
42 |
334 |
10.4% |
|
|
COMP |
8 |
2 |
10 |
0 |
0 |
0 |
0 |
0 |
0 |
0 |
0 |
0 |
10 |
0.3% |
|
|
DEVCO |
5 |
12 |
17 |
0 |
0 |
0 |
28 |
15 |
43 |
308 |
264 |
572 |
632 |
19.7% |
|
|
DGT |
9 |
4 |
13 |
0 |
0 |
0 |
0 |
0 |
0 |
0 |
0 |
0 |
13 |
0.4% |
|
|
DIGIT |
2 |
5 |
7 |
0 |
0 |
0 |
0 |
0 |
0 |
0 |
0 |
0 |
7 |
0.2% |
|
|
EAC |
13 |
1 |
14 |
0 |
0 |
0 |
0 |
0 |
0 |
0 |
0 |
0 |
14 |
0.4% |
|
|
ECFIN |
3 |
2 |
5 |
0 |
0 |
0 |
0 |
0 |
0 |
0 |
0 |
0 |
5 |
0.2% |
|
|
ECHO |
1 |
5 |
6 |
0 |
0 |
0 |
0 |
0 |
0 |
0 |
0 |
0 |
6 |
0.2% |
|
|
EMPL |
7 |
16 |
23 |
0 |
0 |
0 |
0 |
0 |
0 |
0 |
0 |
0 |
23 |
0.7% |
|
|
ENER |
5 |
9 |
14 |
0 |
0 |
0 |
0 |
0 |
0 |
0 |
0 |
0 |
14 |
0.4% |
|
|
ENV |
3 |
3 |
6 |
0 |
0 |
0 |
0 |
0 |
0 |
0 |
0 |
0 |
6 |
0.2% |
|
|
EPSO |
2 |
0 |
2 |
5 |
15 |
20 |
0 |
2 |
2 |
0 |
1 |
1 |
25 |
0.8% |
|
|
ESTAT |
4 |
5 |
9 |
0 |
0 |
0 |
0 |
0 |
0 |
0 |
0 |
0 |
9 |
0.3% |
|
|
FISMA |
2 |
4 |
6 |
0 |
0 |
0 |
0 |
0 |
0 |
0 |
0 |
0 |
6 |
0.2% |
|
|
FPI |
0 |
2 |
2 |
0 |
0 |
0 |
2 |
5 |
7 |
19 |
21 |
40 |
49 |
1.5% |
|
|
GROW |
6 |
11 |
17 |
0 |
0 |
0 |
0 |
0 |
0 |
0 |
0 |
0 |
17 |
0.5% |
|
|
HOME |
0 |
1 |
1 |
0 |
0 |
0 |
0 |
0 |
0 |
0 |
0 |
0 |
1 |
0.0% |
|
|
HR |
28 |
16 |
44 |
0 |
0 |
0 |
0 |
0 |
0 |
0 |
0 |
0 |
44 |
1.4% |
|
|
JRC |
53 |
8 |
61 |
0 |
0 |
0 |
0 |
0 |
0 |
0 |
0 |
0 |
61 |
1.9% |
|
|
JUST |
5 |
2 |
7 |
0 |
0 |
0 |
0 |
0 |
0 |
0 |
0 |
0 |
7 |
0.2% |
|
|
MARE |
3 |
12 |
15 |
0 |
0 |
0 |
0 |
0 |
0 |
5 |
1 |
6 |
21 |
0.7% |
|
|
MOVE |
4 |
7 |
11 |
0 |
0 |
0 |
0 |
0 |
0 |
0 |
0 |
0 |
11 |
0.3% |
|
|
NEAR |
7 |
9 |
16 |
0 |
0 |
0 |
14 |
6 |
20 |
150 |
131 |
281 |
317 |
9.9% |
|
|
OIB |
138 |
49 |
187 |
74 |
449 |
523 |
33 |
36 |
69 |
3 |
14 |
17 |
796 |
24.8% |
|
|
OIL |
42 |
16 |
58 |
23 |
93 |
116 |
14 |
10 |
24 |
1 |
1 |
2 |
200 |
6.2% |
|
|
OLAF |
8 |
2 |
10 |
0 |
0 |
0 |
0 |
0 |
0 |
0 |
0 |
0 |
10 |
0.3% |
|
|
PMO |
35 |
13 |
48 |
52 |
234 |
286 |
34 |
41 |
75 |
0 |
0 |
0 |
409 |
12.7% |
|
|
REGIO |
6 |
5 |
11 |
0 |
0 |
0 |
0 |
0 |
0 |
0 |
0 |
0 |
11 |
0.3% |
|
|
RTD |
22 |
7 |
29 |
0 |
0 |
0 |
0 |
0 |
0 |
0 |
1 |
1 |
30 |
0.9% |
|
|
SANTE |
3 |
5 |
8 |
0 |
0 |
0 |
0 |
0 |
0 |
0 |
0 |
0 |
8 |
0.2% |
|
|
SCIC |
19 |
7 |
26 |
0 |
0 |
0 |
0 |
0 |
0 |
0 |
0 |
0 |
26 |
0.8% |
|
|
SG |
10 |
8 |
18 |
0 |
0 |
0 |
0 |
0 |
0 |
0 |
0 |
0 |
18 |
0.6% |
|
|
TAXUD |
1 |
1 |
2 |
0 |
0 |
0 |
0 |
0 |
0 |
0 |
0 |
0 |
2 |
0.1% |
|
|
TRADE |
5 |
4 |
9 |
0 |
2 |
2 |
0 |
0 |
0 |
2 |
2 |
4 |
15 |
0.5% |
|
|
TOTAL |
516 |
286 |
802 |
187 |
931 |
1 118 |
149 |
174 |
323 |
501 |
468 |
969 |
3 212 |
100.0% |
|
Table 14b - 3a contract staff by FG, gender and DG in 2018 at the Commission
|
|
FGI |
FGII |
FGIII |
FGIV |
|
|
|||||||||
|
M |
F |
TOTAL |
M |
F |
TOTAL |
M |
F |
TOTAL |
M |
F |
TOTAL |
Total |
% |
||
|
AGRI |
3 |
5 |
8 |
0 |
0 |
0 |
0 |
0 |
0 |
1 |
1 |
2 |
10 |
0.3% |
|
|
BUDG |
5 |
12 |
17 |
0 |
0 |
0 |
0 |
0 |
0 |
0 |
0 |
0 |
17 |
0.5% |
|
|
CNECT |
7 |
4 |
11 |
0 |
0 |
0 |
0 |
0 |
0 |
0 |
1 |
1 |
12 |
0.4% |
|
|
COMM |
31 |
4 |
35 |
31 |
143 |
174 |
25 |
65 |
90 |
14 |
32 |
46 |
345 |
10.4% |
|
|
COMP |
6 |
2 |
8 |
0 |
0 |
0 |
0 |
0 |
0 |
0 |
0 |
0 |
8 |
0.2% |
|
|
DEVCO |
3 |
10 |
13 |
0 |
1 |
1 |
29 |
13 |
42 |
332 |
304 |
636 |
692 |
20.8% |
|
|
DGT |
5 |
3 |
8 |
0 |
0 |
0 |
0 |
0 |
0 |
0 |
0 |
0 |
8 |
0.2% |
|
|
DIGIT |
1 |
3 |
4 |
0 |
0 |
0 |
0 |
0 |
0 |
0 |
0 |
0 |
4 |
0.1% |
|
|
EAC |
12 |
1 |
13 |
0 |
0 |
0 |
0 |
0 |
0 |
0 |
0 |
0 |
13 |
0.4% |
|
|
ECFIN |
1 |
1 |
2 |
0 |
0 |
0 |
0 |
0 |
0 |
0 |
0 |
0 |
2 |
0.1% |
|
|
ECHO |
1 |
5 |
6 |
0 |
0 |
0 |
0 |
0 |
0 |
0 |
0 |
0 |
6 |
0.2% |
|
|
EMPL |
4 |
14 |
18 |
0 |
0 |
0 |
0 |
0 |
0 |
0 |
0 |
0 |
18 |
0.5% |
|
|
ENER |
5 |
8 |
13 |
0 |
0 |
0 |
0 |
0 |
0 |
0 |
0 |
0 |
13 |
0.4% |
|
|
ENV |
1 |
0 |
1 |
0 |
0 |
0 |
0 |
0 |
0 |
0 |
0 |
0 |
1 |
0.0% |
|
|
EPSO |
2 |
0 |
2 |
5 |
16 |
21 |
0 |
2 |
2 |
0 |
1 |
1 |
26 |
0.8% |
|
|
ESTAT |
3 |
4 |
7 |
0 |
0 |
0 |
0 |
0 |
0 |
0 |
0 |
0 |
7 |
0.2% |
|
|
FISMA |
0 |
3 |
3 |
0 |
0 |
0 |
0 |
0 |
0 |
0 |
0 |
0 |
3 |
0.1% |
|
|
FPI |
0 |
2 |
2 |
0 |
0 |
0 |
2 |
3 |
5 |
25 |
22 |
47 |
54 |
1.6% |
|
|
GROW |
1 |
9 |
10 |
0 |
0 |
0 |
0 |
0 |
0 |
0 |
0 |
0 |
10 |
0.3% |
|
|
HOME |
0 |
0 |
0 |
0 |
0 |
0 |
0 |
0 |
0 |
0 |
0 |
0 |
0 |
0.0% |
|
|
HR |
28 |
24 |
52 |
0 |
0 |
0 |
0 |
0 |
0 |
0 |
0 |
0 |
52 |
1.6% |
|
|
JRC |
53 |
7 |
60 |
0 |
0 |
0 |
0 |
0 |
0 |
0 |
0 |
0 |
60 |
1.8% |
|
|
JUST |
1 |
1 |
2 |
0 |
0 |
0 |
0 |
0 |
0 |
0 |
0 |
0 |
2 |
0.1% |
|
|
MARE |
3 |
12 |
15 |
0 |
0 |
0 |
0 |
0 |
0 |
5 |
0 |
5 |
20 |
0.6% |
|
|
MOVE |
3 |
7 |
10 |
0 |
0 |
0 |
0 |
0 |
0 |
0 |
0 |
0 |
10 |
0.3% |
|
|
NEAR |
4 |
8 |
12 |
0 |
0 |
0 |
13 |
7 |
20 |
152 |
131 |
283 |
315 |
9.5% |
|
|
OIB |
211 |
67 |
278 |
73 |
458 |
531 |
36 |
34 |
70 |
4 |
15 |
19 |
898 |
27.1% |
|
|
OIL |
43 |
14 |
57 |
24 |
91 |
115 |
15 |
10 |
25 |
1 |
1 |
2 |
199 |
6.0% |
|
|
OLAF |
4 |
3 |
7 |
0 |
0 |
0 |
0 |
0 |
0 |
0 |
0 |
0 |
7 |
0.2% |
|
|
PMO |
32 |
13 |
45 |
53 |
247 |
300 |
36 |
42 |
78 |
0 |
0 |
0 |
423 |
12.7% |
|
|
REGIO |
4 |
4 |
8 |
0 |
0 |
0 |
0 |
0 |
0 |
0 |
0 |
0 |
8 |
0.2% |
|
|
RTD |
11 |
6 |
17 |
0 |
0 |
0 |
0 |
0 |
0 |
0 |
0 |
0 |
17 |
0.5% |
|
|
SANTE |
1 |
5 |
6 |
0 |
0 |
0 |
0 |
0 |
0 |
0 |
0 |
0 |
6 |
0.2% |
|
|
SCIC |
17 |
7 |
24 |
0 |
0 |
0 |
0 |
0 |
0 |
0 |
0 |
0 |
24 |
0.7% |
|
|
SG |
10 |
8 |
18 |
0 |
0 |
0 |
0 |
0 |
0 |
0 |
0 |
0 |
18 |
0.5% |
|
|
TAXUD |
1 |
0 |
1 |
0 |
0 |
0 |
0 |
0 |
0 |
0 |
0 |
0 |
1 |
0.0% |
|
|
TRADE |
2 |
3 |
5 |
0 |
2 |
2 |
0 |
0 |
0 |
2 |
1 |
3 |
10 |
0.3% |
|
|
CdP-OSP |
0 |
0 |
0 |
0 |
0 |
0 |
0 |
0 |
0 |
0 |
0 |
0 |
0 |
0.0% |
|
|
TOTAL |
519 |
279 |
798 |
186 |
958 |
1 144 |
156 |
176 |
332 |
536 |
509 |
1 045 |
3 319 |
100.0% |
|
Contract staff 3b
Table 15a - 3b contract staff by FG, gender and DG in 2017 at the Commission
|
|
FGII |
FGIII |
FGIV |
|
|
|
||||||
|
|
M |
F |
TOTAL |
M |
F |
TOTAL |
M |
F |
TOTAL |
|
Total |
% |
|
AGRI |
3 |
16 |
19 |
6 |
10 |
16 |
18 |
28 |
46 |
|
81 |
2.0% |
|
BUDG |
0 |
13 |
13 |
9 |
7 |
16 |
1 |
5 |
6 |
|
35 |
0.9% |
|
CdP-OSP |
0 |
10 |
10 |
0 |
0 |
0 |
0 |
0 |
0 |
|
10 |
0.3% |
|
CLIMA |
2 |
12 |
14 |
1 |
1 |
2 |
7 |
2 |
9 |
|
25 |
0.6% |
|
CNECT |
4 |
36 |
40 |
36 |
51 |
87 |
25 |
33 |
58 |
|
185 |
4.7% |
|
COMM |
5 |
7 |
12 |
2 |
6 |
8 |
0 |
0 |
0 |
|
20 |
0.5% |
|
COMP |
3 |
10 |
13 |
9 |
20 |
29 |
4 |
5 |
9 |
|
51 |
1.3% |
|
DEVCO |
8 |
57 |
65 |
21 |
64 |
85 |
55 |
86 |
141 |
|
291 |
7.4% |
|
DGT |
16 |
46 |
62 |
1 |
1 |
2 |
24 |
45 |
69 |
|
133 |
3.4% |
|
DIGIT |
0 |
12 |
12 |
9 |
6 |
15 |
24 |
12 |
36 |
|
63 |
1.6% |
|
EAC |
2 |
14 |
16 |
7 |
13 |
20 |
5 |
7 |
12 |
|
48 |
1.2% |
|
ECFIN |
2 |
3 |
5 |
2 |
5 |
7 |
7 |
3 |
10 |
|
22 |
0.6% |
|
ECHO |
8 |
20 |
28 |
20 |
34 |
54 |
12 |
14 |
26 |
|
108 |
2.7% |
|
EMPL |
7 |
29 |
36 |
18 |
53 |
71 |
9 |
16 |
25 |
|
132 |
3.3% |
|
ENER |
3 |
13 |
16 |
7 |
11 |
18 |
5 |
7 |
12 |
|
46 |
1.2% |
|
ENV |
4 |
23 |
27 |
1 |
3 |
4 |
7 |
10 |
17 |
|
48 |
1.2% |
|
EPSC |
0 |
3 |
3 |
0 |
0 |
0 |
3 |
2 |
5 |
|
8 |
0.2% |
|
ESTAT |
1 |
22 |
23 |
11 |
8 |
19 |
17 |
16 |
33 |
|
75 |
1.9% |
|
FISMA |
1 |
1 |
2 |
5 |
1 |
6 |
1 |
0 |
1 |
|
9 |
0.2% |
|
FPI |
0 |
6 |
6 |
2 |
18 |
20 |
4 |
6 |
10 |
|
36 |
0.9% |
|
GROW |
5 |
28 |
33 |
19 |
22 |
41 |
17 |
15 |
32 |
|
106 |
2.7% |
|
HOME |
1 |
14 |
15 |
8 |
19 |
27 |
4 |
7 |
11 |
|
53 |
1.3% |
|
HR |
18 |
58 |
76 |
12 |
21 |
33 |
3 |
9 |
12 |
|
121 |
3.1% |
|
IAS |
0 |
8 |
8 |
0 |
1 |
1 |
1 |
1 |
2 |
|
11 |
0.3% |
|
JRC |
31 |
141 |
172 |
26 |
34 |
60 |
494 |
337 |
831 |
|
1 063 |
26.9% |
|
JUST |
2 |
16 |
18 |
4 |
12 |
16 |
10 |
5 |
15 |
|
49 |
1.2% |
|
MARE |
0 |
6 |
6 |
3 |
9 |
12 |
9 |
10 |
19 |
|
37 |
0.9% |
|
MOVE |
1 |
22 |
23 |
12 |
14 |
26 |
5 |
5 |
10 |
|
59 |
1.5% |
|
NEAR |
10 |
26 |
36 |
24 |
57 |
81 |
33 |
64 |
97 |
|
214 |
5.4% |
|
OLAF |
0 |
11 |
11 |
2 |
5 |
7 |
5 |
0 |
5 |
|
23 |
0.6% |
|
OP |
3 |
2 |
5 |
4 |
4 |
8 |
0 |
1 |
1 |
|
14 |
0.4% |
|
REGIO |
8 |
26 |
34 |
18 |
39 |
57 |
5 |
3 |
8 |
|
99 |
2.5% |
|
RTD |
17 |
73 |
90 |
39 |
65 |
104 |
97 |
104 |
201 |
|
395 |
10.0% |
|
SANTE |
5 |
39 |
44 |
6 |
9 |
15 |
10 |
20 |
30 |
|
89 |
2.3% |
|
SCIC |
5 |
22 |
27 |
0 |
0 |
0 |
0 |
0 |
0 |
|
27 |
0.7% |
|
SG |
8 |
26 |
34 |
9 |
19 |
28 |
15 |
13 |
28 |
|
90 |
2.3% |
|
SJ |
0 |
16 |
16 |
1 |
2 |
3 |
3 |
5 |
8 |
|
27 |
0.7% |
|
TAXUD |
1 |
2 |
3 |
2 |
2 |
4 |
3 |
5 |
8 |
|
15 |
0.4% |
|
TF50 |
0 |
1 |
1 |
0 |
2 |
2 |
0 |
0 |
0 |
|
3 |
0.1% |
|
TRADE |
1 |
15 |
16 |
5 |
7 |
12 |
1 |
3 |
4 |
|
32 |
0.8% |
|
TOTAL |
185 |
905 |
1 090 |
361 |
655 |
1 016 |
943 |
904 |
1 847 |
|
3 953 |
100,0% |
Table 15b - 3b contract staff by FG, gender and DG in 2018 at the Commission
|
|
FGII |
FGIII |
FGIV |
|||||||||
|
M |
F |
TOTAL |
M |
F |
TOTAL |
M |
F |
TOTAL |
Total |
% |
||
|
AGRI |
2 |
14 |
16 |
3 |
8 |
11 |
18 |
26 |
44 |
71 |
1.8% |
|
|
BUDG |
2 |
8 |
10 |
6 |
12 |
18 |
3 |
7 |
10 |
38 |
1.0% |
|
|
CLIMA |
2 |
11 |
13 |
1 |
1 |
2 |
6 |
3 |
9 |
24 |
0.6% |
|
|
CNECT |
5 |
33 |
38 |
30 |
60 |
90 |
24 |
34 |
58 |
186 |
4.7% |
|
|
COMM |
6 |
7 |
13 |
5 |
6 |
11 |
0 |
0 |
0 |
24 |
0.6% |
|
|
COMP |
1 |
12 |
13 |
9 |
23 |
32 |
4 |
3 |
7 |
52 |
1.3% |
|
|
DEVCO |
12 |
57 |
69 |
25 |
66 |
91 |
60 |
101 |
161 |
321 |
8.2% |
|
|
DGT |
15 |
42 |
57 |
2 |
0 |
2 |
31 |
49 |
80 |
139 |
3.5% |
|
|
DIGIT |
2 |
12 |
14 |
4 |
7 |
11 |
23 |
15 |
38 |
63 |
1.6% |
|
|
EAC |
1 |
12 |
13 |
4 |
14 |
18 |
4 |
8 |
12 |
43 |
1.1% |
|
|
ECFIN |
2 |
4 |
6 |
4 |
3 |
7 |
3 |
5 |
8 |
21 |
0.5% |
|
|
ECHO |
5 |
21 |
26 |
21 |
34 |
55 |
11 |
22 |
33 |
114 |
2.9% |
|
|
EMPL |
6 |
24 |
30 |
22 |
41 |
63 |
7 |
17 |
24 |
117 |
3.0% |
|
|
ENER |
3 |
12 |
15 |
7 |
13 |
20 |
4 |
6 |
10 |
45 |
1.1% |
|
|
ENV |
2 |
25 |
27 |
1 |
6 |
7 |
6 |
12 |
18 |
52 |
1.3% |
|
|
EPSC |
0 |
2 |
2 |
1 |
1 |
2 |
3 |
1 |
4 |
8 |
0.2% |
|
|
ESTAT |
2 |
22 |
24 |
11 |
6 |
17 |
12 |
22 |
34 |
75 |
1.9% |
|
|
FISMA |
1 |
2 |
3 |
5 |
5 |
10 |
0 |
0 |
0 |
13 |
0.3% |
|
|
FPI |
1 |
6 |
7 |
4 |
20 |
24 |
6 |
7 |
13 |
44 |
1.1% |
|
|
GROW |
3 |
21 |
24 |
23 |
30 |
53 |
14 |
10 |
24 |
101 |
2.6% |
|
|
HOME |
2 |
7 |
9 |
8 |
20 |
28 |
2 |
6 |
8 |
45 |
1.1% |
|
|
HR |
18 |
77 |
95 |
17 |
30 |
47 |
6 |
13 |
19 |
161 |
4.1% |
|
|
IAS |
1 |
7 |
8 |
0 |
0 |
0 |
1 |
5 |
6 |
14 |
0.4% |
|
|
JRC |
26 |
94 |
120 |
23 |
31 |
54 |
500 |
345 |
845 |
1 019 |
26.0% |
|
|
JUST |
0 |
16 |
16 |
3 |
14 |
17 |
6 |
5 |
11 |
44 |
1.1% |
|
|
MARE |
1 |
6 |
7 |
3 |
19 |
22 |
7 |
9 |
16 |
45 |
1.1% |
|
|
MOVE |
1 |
22 |
23 |
8 |
11 |
19 |
4 |
7 |
11 |
53 |
1.4% |
|
|
NEAR |
6 |
27 |
33 |
29 |
60 |
89 |
30 |
66 |
96 |
218 |
5.6% |
|
|
OLAF |
0 |
9 |
9 |
3 |
7 |
10 |
1 |
0 |
1 |
20 |
0.5% |
|
|
OP |
3 |
1 |
4 |
6 |
5 |
11 |
0 |
1 |
1 |
16 |
0.4% |
|
|
REGIO |
2 |
15 |
17 |
18 |
39 |
57 |
3 |
2 |
5 |
79 |
2.0% |
|
|
RTD |
12 |
52 |
64 |
31 |
64 |
95 |
92 |
111 |
203 |
362 |
9.2% |
|
|
SANTE |
6 |
34 |
40 |
6 |
10 |
16 |
12 |
18 |
30 |
86 |
2.2% |
|
|
SCIC |
9 |
24 |
33 |
1 |
0 |
1 |
0 |
0 |
0 |
34 |
0.9% |
|
|
SG |
8 |
20 |
28 |
9 |
22 |
31 |
14 |
16 |
30 |
89 |
2.3% |
|
|
SJ |
0 |
14 |
14 |
1 |
2 |
3 |
3 |
6 |
9 |
26 |
0.7% |
|
|
TAXUD |
0 |
4 |
4 |
1 |
2 |
3 |
5 |
5 |
10 |
17 |
0.4% |
|
|
TF50 |
0 |
1 |
1 |
0 |
1 |
1 |
0 |
0 |
0 |
2 |
0.1% |
|
|
TRADE |
0 |
14 |
14 |
5 |
6 |
11 |
0 |
4 |
4 |
29 |
0.7% |
|
|
CdP-OSP |
0 |
9 |
9 |
0 |
0 |
0 |
0 |
0 |
0 |
9 |
0.2% |
|
|
TOTAL |
168 |
800 |
968 |
360 |
699 |
1059 |
925 |
967 |
1 892 |
3 919 |
100.0% |
|
4. Breakdown of contract staff among other institutions, agencies and joint undertakings/EIT
The number of contract agents working for the other institutions increased by 7,59% from 2016 to 2017 and by 7,55% from 2017 to 2018. A similar pattern can be observed for agencies, with an increase of 7,42% and 6,56% respectively.
Table 16 - Trends in the breakdown of contract staff between other institutions and agencies
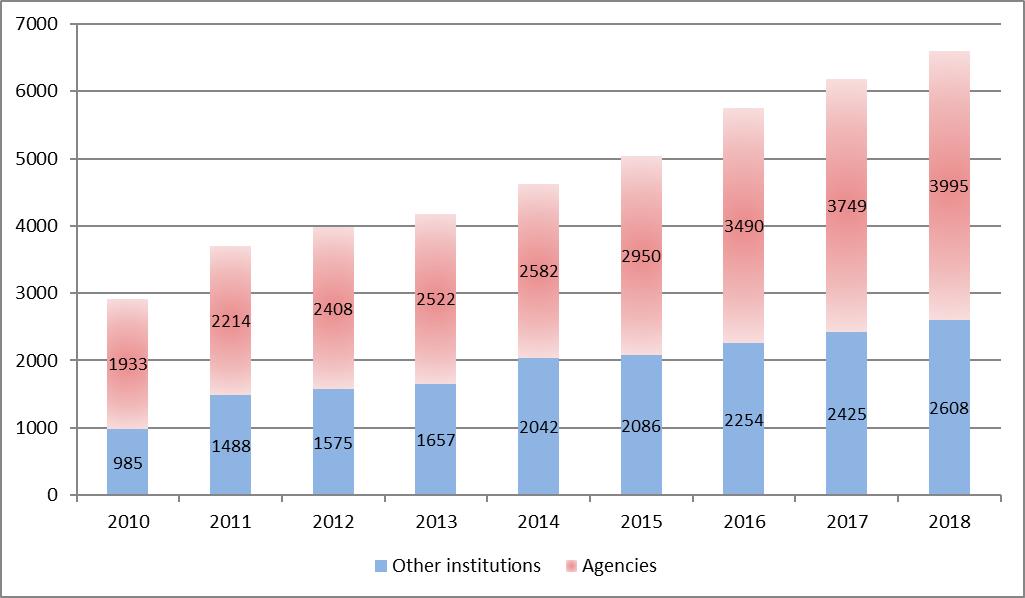
4.1 Breakdown of contract staff among the other institutions
The tables that follow shows distribution of contract agents in the institutions other than the Commission.
Table 17a Breakdown of contract staff among the other institutions in 2017

Table 17b Breakdown of contract staff among the other institutions in 2018

4.2 Breakdown by gender and by function group in the other institutions
Table 18a - Gender and function group in 2017
|
|
FGI |
FGII |
FGIII |
FGIV |
Total |
||||||||
|
F |
M |
Total |
F |
M |
Total |
F |
M |
Total |
F |
M |
Total |
||
|
COMMITTEE OF THE REGIONS |
8 |
13 |
21 |
7 |
2 |
9 |
4 |
4 |
8 |
6 |
8 |
14 |
52 |
|
COUNCIL OF THE EUROPEAN UNION |
23 |
107 |
130 |
21 |
14 |
35 |
8 |
4 |
12 |
35 |
15 |
50 |
227 |
|
COURT OF AUDITORS |
5 |
40 |
45 |
6 |
0 |
6 |
6 |
4 |
10 |
7 |
4 |
11 |
72 |
|
COURT OF JUSTICE |
4 |
75 |
79 |
10 |
11 |
21 |
30 |
11 |
41 |
12 |
2 |
14 |
155 |
|
EUROPEAN DATA PROTECTION SUPERVISOR |
0 |
1 |
1 |
3 |
0 |
3 |
4 |
2 |
6 |
5 |
1 |
6 |
16 |
|
EUROPEAN ECONOMIC AND SOCIAL COMMITTEE |
7 |
13 |
20 |
13 |
2 |
15 |
1 |
1 |
2 |
4 |
1 |
5 |
42 |
|
EUROPEAN EXTERNAL ACTION SERVICE |
14 |
16 |
30 |
126 |
11 |
137 |
57 |
60 |
117 |
43 |
75 |
118 |
402 |
|
EUROPEAN OMBUDSMAN |
1 |
2 |
3 |
5 |
1 |
6 |
0 |
1 |
1 |
5 |
1 |
6 |
16 |
|
EUROPEAN PARLIAMENT |
220 |
713 |
933 |
129 |
23 |
152 |
99 |
76 |
175 |
107 |
76 |
183 |
1443 |
|
Total |
282 |
980 |
1262 |
320 |
64 |
384 |
209 |
163 |
372 |
224 |
183 |
407 |
2425 |
Table 18b - Gender and function group in 2018
|
|
FGI |
FGII |
FGIII |
FGIV |
Total |
||||||||
|
M |
F |
Total |
M |
F |
Total |
M |
F |
Total |
M |
F |
Total |
||
|
COMMITTEE OF THE REGIONS |
15 |
8 |
23 |
1 |
4 |
5 |
2 |
5 |
7 |
7 |
6 |
13 |
48 |
|
COUNCIL OF THE EUROPEAN UNION |
110 |
23 |
133 |
11 |
16 |
27 |
0 |
8 |
8 |
12 |
22 |
34 |
202 |
|
COURT OF AUDITORS |
40 |
5 |
45 |
1 |
1 |
2 |
3 |
10 |
13 |
6 |
10 |
16 |
76 |
|
COURT OF JUSTICE |
80 |
4 |
84 |
10 |
10 |
20 |
10 |
28 |
38 |
2 |
13 |
15 |
157 |
|
EUROPEAN DATA PROTECTION SUPERVISOR |
0 |
0 |
0 |
2 |
5 |
7 |
5 |
8 |
13 |
3 |
13 |
16 |
36 |
|
EUROPEAN ECONOMIC AND SOCIAL COMMITTEE |
13 |
7 |
20 |
1 |
11 |
12 |
4 |
3 |
7 |
3 |
4 |
7 |
46 |
|
EUROPEAN EXTERNAL ACTION SERVICE |
17 |
15 |
32 |
10 |
127 |
137 |
73 |
57 |
130 |
96 |
67 |
163 |
462 |
|
EUROPEAN OMBUDSMAN |
2 |
1 |
3 |
1 |
3 |
4 |
0 |
0 |
0 |
1 |
4 |
5 |
12 |
|
EUROPEAN PARLIAMENT |
712 |
230 |
942 |
21 |
117 |
138 |
82 |
151 |
233 |
95 |
161 |
256 |
1569 |
|
Total |
989 |
293 |
1282 |
58 |
294 |
352 |
179 |
270 |
449 |
225 |
300 |
525 |
2608 |
4.3 Breakdown by nationality in the other institutions
Table 19a – Nationalities in 2017
|
|
AT |
BE |
BG |
CY |
CZ |
DE |
DK |
EE |
EL |
ES |
FI |
FR |
HR |
HU |
IE |
IT |
LT |
LU |
LV |
MT |
NL |
PL |
PT |
RO |
SE |
SI |
SK |
UK |
Other |
Total |
|
COMMITTEE OF THE REGIONS |
0 |
13 |
1 |
1 |
2 |
1 |
0 |
1 |
3 |
6 |
0 |
6 |
2 |
0 |
0 |
5 |
0 |
0 |
0 |
0 |
1 |
3 |
1 |
1 |
0 |
1 |
0 |
3 |
1 |
52 |
|
COUNCIL OF THE EUROPEAN UNION |
2 |
73 |
2 |
0 |
3 |
3 |
3 |
1 |
8 |
24 |
1 |
16 |
4 |
4 |
3 |
38 |
1 |
1 |
1 |
3 |
1 |
10 |
8 |
7 |
2 |
1 |
3 |
4 |
0 |
227 |
|
COURT OF AUDITORS |
2 |
2 |
1 |
1 |
0 |
2 |
0 |
1 |
7 |
2 |
0 |
21 |
0 |
1 |
1 |
6 |
2 |
5 |
0 |
0 |
0 |
1 |
10 |
2 |
0 |
2 |
0 |
0 |
3 |
72 |
|
COURT OF JUSTICE |
0 |
12 |
1 |
0 |
3 |
5 |
1 |
1 |
8 |
3 |
4 |
48 |
3 |
3 |
0 |
22 |
1 |
5 |
1 |
1 |
2 |
4 |
11 |
3 |
1 |
1 |
4 |
4 |
3 |
155 |
|
EUROPEAN DATA PROTECTION SUPERVISOR |
0 |
5 |
0 |
0 |
0 |
1 |
0 |
0 |
1 |
1 |
0 |
2 |
0 |
0 |
0 |
3 |
0 |
0 |
0 |
0 |
0 |
0 |
1 |
0 |
0 |
0 |
0 |
0 |
2 |
16 |
|
EUROPEAN ECONOMIC AND SOCIAL COMMITTEE |
0 |
10 |
0 |
1 |
0 |
1 |
0 |
0 |
5 |
8 |
0 |
1 |
1 |
0 |
0 |
9 |
0 |
0 |
0 |
0 |
0 |
1 |
3 |
2 |
0 |
0 |
0 |
0 |
0 |
42 |
|
EUROPEAN EXTERNAL ACTION SERVICE |
6 |
74 |
10 |
0 |
2 |
13 |
0 |
1 |
9 |
29 |
3 |
66 |
1 |
1 |
5 |
45 |
2 |
0 |
1 |
0 |
3 |
12 |
19 |
20 |
1 |
0 |
5 |
10 |
64 |
402 |
|
EUROPEAN OMBUDSMAN |
0 |
4 |
1 |
0 |
0 |
0 |
0 |
0 |
1 |
1 |
0 |
3 |
0 |
0 |
0 |
1 |
1 |
0 |
0 |
0 |
0 |
2 |
0 |
1 |
0 |
1 |
0 |
0 |
0 |
16 |
|
EUROPEAN PARLIAMENT |
8 |
392 |
19 |
4 |
6 |
24 |
3 |
6 |
69 |
99 |
4 |
337 |
9 |
15 |
11 |
159 |
6 |
9 |
5 |
4 |
8 |
33 |
62 |
105 |
4 |
11 |
13 |
16 |
2 |
1443 |
|
Total |
18 |
585 |
35 |
7 |
16 |
50 |
7 |
11 |
111 |
173 |
12 |
500 |
20 |
24 |
20 |
288 |
13 |
20 |
8 |
8 |
15 |
66 |
115 |
141 |
8 |
17 |
25 |
37 |
75 |
2425 |
Table 19b – Nationalities in 2018
|
|
AT |
BE |
BG |
CY |
CZ |
DE |
DK |
EE |
ES |
FI |
FR |
UK |
EL |
HR |
HU |
IE |
IT |
LT |
LU |
LV |
MT |
NL |
PL |
PT |
RO |
SE |
SI |
SK |
Other |
Total |
|
COMMITTEE OF THE REGIONS |
0 |
13 |
1 |
1 |
1 |
1 |
0 |
0 |
6 |
0 |
7 |
3 |
3 |
0 |
0 |
2 |
4 |
0 |
0 |
0 |
0 |
1 |
2 |
1 |
1 |
0 |
0 |
0 |
1 |
48 |
|
COUNCIL OF THE EUROPEAN UNION |
1 |
76 |
3 |
0 |
2 |
3 |
0 |
1 |
19 |
1 |
13 |
5 |
5 |
2 |
3 |
1 |
35 |
0 |
1 |
0 |
2 |
1 |
9 |
5 |
9 |
2 |
0 |
3 |
0 |
202 |
|
COURT OF AUDITORS |
1 |
4 |
2 |
1 |
1 |
4 |
0 |
1 |
2 |
0 |
21 |
0 |
7 |
1 |
1 |
0 |
6 |
1 |
4 |
1 |
0 |
0 |
1 |
10 |
2 |
0 |
3 |
0 |
2 |
76 |
|
COURT OF JUSTICE |
0 |
10 |
3 |
1 |
2 |
7 |
2 |
0 |
3 |
3 |
47 |
3 |
7 |
1 |
3 |
0 |
18 |
2 |
6 |
1 |
1 |
2 |
10 |
11 |
6 |
2 |
3 |
2 |
1 |
157 |
|
EUROPEAN DATA PROTECTION SUPERVISOR |
0 |
11 |
0 |
0 |
0 |
2 |
0 |
0 |
2 |
0 |
4 |
0 |
4 |
0 |
0 |
0 |
7 |
0 |
0 |
0 |
0 |
0 |
1 |
1 |
2 |
0 |
0 |
0 |
2 |
36 |
|
EUROPEAN ECONOMIC AND SOCIAL COMMITTEE |
0 |
13 |
0 |
0 |
0 |
1 |
0 |
1 |
7 |
0 |
1 |
0 |
2 |
0 |
1 |
0 |
11 |
0 |
0 |
0 |
1 |
1 |
1 |
4 |
2 |
0 |
0 |
0 |
0 |
46 |
|
EUROPEAN EXTERNAL ACTION SERVICE |
9 |
99 |
11 |
4 |
5 |
22 |
0 |
2 |
34 |
4 |
75 |
8 |
10 |
4 |
5 |
5 |
64 |
4 |
1 |
3 |
0 |
5 |
10 |
17 |
25 |
1 |
1 |
5 |
29 |
462 |
|
EUROPEAN OMBUDSMAN |
0 |
2 |
0 |
0 |
0 |
1 |
0 |
0 |
1 |
0 |
3 |
0 |
1 |
0 |
0 |
0 |
1 |
1 |
0 |
0 |
0 |
0 |
2 |
0 |
0 |
0 |
0 |
0 |
0 |
12 |
|
EUROPEAN PARLIAMENT |
12 |
398 |
27 |
4 |
9 |
26 |
7 |
5 |
125 |
10 |
332 |
16 |
81 |
13 |
23 |
8 |
175 |
10 |
10 |
7 |
5 |
10 |
42 |
65 |
116 |
9 |
13 |
11 |
0 |
1569 |
|
Total |
23 |
626 |
47 |
11 |
20 |
67 |
9 |
10 |
199 |
18 |
503 |
35 |
120 |
21 |
36 |
16 |
321 |
18 |
22 |
12 |
9 |
20 |
78 |
114 |
163 |
14 |
20 |
21 |
35 |
2608 |
4.4 Breakdown of contract staff in the agencies and joint undertakings/EIT
Table 20 - Breakdown of contract staff by type of agency in 2013 - 2018

In 2017, 46,2 % of contract staff were employed in executive agencies, 47,2% in decentralised agencies, and 6,6% in joint undertakings and the European Institute of Information Technology (EIT). A similar distribution is observed in 2018, when 46,5% of contract staff were employed by the executive agencies, 47,4 % by the decentralised agencies and 6,1 % were employed by joint undertakings and the EIT.
4.5 Breakdown by gender and by function group in the agencies, and joint undertakings / EIT
The breakdown by function group is relatively uniform between the decentralised and the executive agencies. Detailed data for 2017 and 2018 are as follows:
Table 21a - Breakdown by function group in 2017
|
|
GFI |
GFII |
GFIII |
GFIV |
TOTAL |
|||||
|
Decentralised agencies |
37 |
68.5% |
320 |
43.0% |
682 |
47.7% |
729 |
47.9% |
1768 |
47.2% |
|
Joint undertakings / EIT |
0 |
0.0% |
30 |
4.0% |
99 |
6.9% |
120 |
7.9% |
249 |
6.6% |
|
Executive agencies |
17 |
31.5% |
394 |
53.0% |
649 |
45.4% |
672 |
44.2% |
1732 |
46.2% |
Table 21b - Breakdown by function group in 2018
|
|
GFI |
GFII |
GFIII |
GFIV |
TOTAL |
|||||
|
Decentralised agencies |
42 |
73.7% |
292 |
41.5% |
743 |
48.3% |
818 |
48.2% |
1895 |
47.4% |
|
Joint undertakings / EIT |
0 |
0.0% |
29 |
4.1% |
92 |
6.0% |
123 |
7.3% |
244 |
6.1% |
|
Executive agencies |
15 |
26.3% |
382 |
54.3% |
704 |
45.7% |
755 |
44.5% |
1856 |
46.5% |
Table 22a - Breakdown by function group and gender for each agency or joint undertakings/EIT in 2017
|
|
|
|
FGI |
FGI Total |
FGII |
FGII Total |
FGIII |
FGIII Total |
FGIV |
FGIV Total |
Grand Total |
||||
|
|
|
|
F |
M |
|
F |
M |
|
F |
M |
|
F |
M |
|
|
|
Decentralised agencies |
4 |
33 |
37 |
262 |
58 |
320 |
462 |
217 |
682 |
384 |
345 |
729 |
1768 |
||
|
ACER |
Ljubljana, SI |
AGENCY FOR THE COOPERATION OF ENERGY REGULATORS |
0 |
0 |
0 |
3 |
0 |
3 |
1 |
0 |
1 |
3 |
14 |
17 |
21 |
|
Eu-LISA |
Tallinn, EE; Strasbourg (FR) |
AGENCY FOR THE OPERATIONAL MANAGEMENT OF LARGE-SCALE IT SYSTEMS IN THE AREA OF FREEDOM, SECURITY AND JUSTICE |
0 |
0 |
0 |
0 |
0 |
0 |
1 |
3 |
4 |
9 |
18 |
27 |
31 |
|
EFCA |
Vigo, ES |
COMMUNITY FISHERIES CONTROL AGENCY |
0 |
0 |
0 |
1 |
0 |
1 |
4 |
1 |
5 |
1 |
0 |
1 |
7 |
|
CPVO |
Angers, FR |
COMMUNITY PLANT VARIETY OFFICE |
0 |
0 |
0 |
0 |
0 |
0 |
1 |
1 |
2 |
0 |
4 |
4 |
6 |
|
Eu-OSHA |
Bilbao, ES |
EUROPEAN AGENCY FOR SAFETY AND HEALTH AT WORK |
0 |
0 |
0 |
8 |
1 |
9 |
11 |
2 |
13 |
2 |
2 |
4 |
26 |
|
EASO |
Valletta, MT |
EUROPEAN ASYLUM SUPPORT OFFICE |
0 |
1 |
1 |
1 |
1 |
2 |
22 |
17 |
39 |
13 |
12 |
25 |
67 |
|
EASA |
Cologne, DE |
EUROPEAN AVIATION SAFETY AGENCY |
0 |
0 |
0 |
0 |
0 |
0 |
32 |
20 |
52 |
9 |
16 |
25 |
77 |
|
EBA |
London, UK |
EUROPEAN BANKING AUTHORITY |
0 |
0 |
0 |
0 |
0 |
0 |
11 |
2 |
13 |
14 |
12 |
26 |
39 |
|
FRONTEX |
Warsaw, PL |
EUROPEAN BORDER AND COAST GUARD AGENCY |
0 |
13 |
13 |
2 |
2 |
4 |
77 |
8 |
85 |
28 |
20 |
48 |
150 |
|
ECDC |
Stockholm, SE |
EUROPEAN CENTRE FOR DISEASE PREVENTION AND CONTROL |
0 |
2 |
2 |
11 |
1 |
12 |
31 |
6 |
37 |
33 |
13 |
46 |
97 |
|
CEDEFOP |
Thessaloniki,EL |
EUROPEAN CENTRE FOR THE DEVELOPMENT OF VOCATIONAL TRAINING |
0 |
4 |
4 |
11 |
1 |
12 |
2 |
3 |
5 |
3 |
1 |
4 |
25 |
|
ECHA |
Helsinki, FI |
EUROPEAN CHEMICALS AGENCY |
0 |
0 |
0 |
27 |
6 |
33 |
32 |
30 |
62 |
11 |
13 |
24 |
119 |
|
EEA |
Copenhagen, DK |
EUROPEAN ENVIRONMENT AGENCY |
0 |
0 |
0 |
9 |
0 |
9 |
8 |
4 |
12 |
23 |
20 |
43 |
64 |
|
EFSA |
Parma, IT |
EUROPEAN FOOD SAFETY AUTHORITY |
1 |
0 |
1 |
19 |
5 |
24 |
1 |
3 |
4 |
53 |
32 |
85 |
114 |
|
EUROFUND |
Dublin, IE |
EUROPEAN FOUNDATION FOR THE IMPROVEMENT OF LIVING AND WORKING CONDITIONS |
1 |
1 |
2 |
0 |
1 |
1 |
2 |
1 |
3 |
1 |
2 |
3 |
9 |
|
GSA |
Prague, CZ |
EUROPEAN GNSS SUPERVISORY AUTHORITY |
0 |
0 |
0 |
3 |
0 |
3 |
6 |
2 |
8 |
18 |
22 |
40 |
51 |
|
EIGE |
Vilnius, LT |
EUROPEAN INSTITUTE FOR GENDER EQUALITY |
0 |
0 |
0 |
2 |
0 |
2 |
6 |
3 |
9 |
3 |
3 |
6 |
17 |
|
EIOPA |
Frankfurt a.M., DE |
EUROPEAN INSURANCE AND OCCUPATIONAL PENSIONS AUTHORITY |
0 |
0 |
0 |
9 |
2 |
11 |
12 |
1 |
13 |
4 |
6 |
10 |
34 |
|
EMSA |
Lisbon, PT |
EUROPEAN MARITIME SAFETY AGENCY |
0 |
2 |
2 |
10 |
1 |
11 |
2 |
1 |
3 |
5 |
7 |
12 |
28 |
|
EMA |
London, UK |
EUROPEAN MEDICINES AGENCY |
0 |
0 |
0 |
67 |
8 |
75 |
11 |
5 |
19 |
39 |
17 |
56 |
150 |
|
EMCDDA |
Lisbon, PT |
EUROPEAN MONITORING CENTRE FOR DRUGS AND DRUG ADDICTION |
0 |
3 |
3 |
12 |
1 |
13 |
6 |
3 |
9 |
3 |
1 |
4 |
29 |
|
EUROPOL |
The Hague, NL |
EUROPEAN POLICE OFFICE |
0 |
0 |
0 |
24 |
10 |
34 |
52 |
42 |
94 |
11 |
18 |
29 |
157 |
|
ESMA |
Paris, FR |
EUROPEAN SECURITIES AND MARKETS AUTHORITY |
0 |
0 |
0 |
1 |
0 |
1 |
19 |
3 |
22 |
14 |
14 |
28 |
51 |
|
ETF |
Turin, IT |
EUROPEAN TRAINING FOUNDATION |
0 |
0 |
0 |
6 |
2 |
8 |
21 |
2 |
23 |
6 |
3 |
9 |
40 |
|
EUROJUST |
The Hague, NL |
EUROPEAN UNIION'S JUDICIAL COOPERATION UNIT |
0 |
0 |
0 |
8 |
4 |
12 |
4 |
4 |
8 |
4 |
0 |
4 |
24 |
|
FRA |
Vienna, AT |
EUROPEAN UNION AGENCY FOR FUNDAMENTAL RIGHTS |
0 |
0 |
0 |
4 |
1 |
5 |
6 |
5 |
11 |
9 |
5 |
14 |
30 |
|
CEPOL |
Budapest, HU |
EUROPEAN UNION AGENCY FOR LAW ENFORCEMENT TRAINING |
0 |
0 |
0 |
4 |
6 |
10 |
3 |
0 |
3 |
1 |
2 |
3 |
16 |
|
ENISA |
Heraklion, EL |
EUROPEAN UNION AGENCY FOR NETWORK AND INFORMATION SECURITY |
0 |
1 |
1 |
0 |
0 |
0 |
5 |
6 |
11 |
10 |
6 |
16 |
28 |
|
ERA |
Valenciennes, FR |
EUROPEAN UNION AGENCY FOR RAILWAYS |
2 |
1 |
3 |
6 |
0 |
6 |
6 |
3 |
9 |
4 |
11 |
15 |
33 |
|
EUIPO |
Alicante, ES |
EUROPEAN UNION INTELLECTUAL PROPERTY OFFICE |
0 |
5 |
5 |
10 |
2 |
12 |
67 |
33 |
100 |
40 |
44 |
84 |
201 |
|
BEREC |
Riga, LV |
OFFICE OF THE BODY OF EUROPEAN REGULATORS FOR ELECTRONIC COMMUNICATIONS |
0 |
0 |
0 |
0 |
1 |
1 |
0 |
0 |
0 |
4 |
4 |
8 |
9 |
|
CdT |
Luxembourg, LU |
TRANSLATION CENTRE FOR THE BODIES OF THE EUROPEAN UNION |
0 |
0 |
0 |
4 |
2 |
6 |
0 |
3 |
3 |
6 |
3 |
9 |
18 |
|
Joint undertakings and EIT |
0 |
0 |
0 |
26 |
4 |
30 |
76 |
23 |
99 |
44 |
76 |
120 |
249 |
||
|
BBI |
Brussels, BE |
BIO-BASED INDUSTRIES JOINT UNDERTAKING |
0 |
0 |
0 |
0 |
0 |
0 |
2 |
3 |
5 |
1 |
1 |
2 |
7 |
|
Clean Sky |
Brussels, BE |
CLEAN SKY JOINT UNDERTAKING |
0 |
0 |
0 |
2 |
1 |
3 |
0 |
2 |
2 |
1 |
0 |
1 |
6 |
|
ECSEL |
Brussels, BE |
ELECTRONIC COMPONENTS AND SYSTEMS JOINT UNDERTAKING |
0 |
0 |
0 |
6 |
0 |
6 |
6 |
2 |
8 |
0 |
0 |
0 |
14 |
|
EIT |
Budapest, HU |
EUROPEAN INSTITUTE OF INNOVATION AND TECHNOLOGY |
0 |
0 |
0 |
4 |
1 |
5 |
6 |
4 |
10 |
1 |
1 |
2 |
17 |
|
F4E |
Barcelona, ES |
EUROPEAN JOINT UNDERTAKING FOR ITER AND THE DEVELOPMENT OF FUSION ENERGY |
0 |
0 |
0 |
12 |
2 |
14 |
49 |
5 |
54 |
34 |
71 |
105 |
173 |
|
FCH2 |
Brussels, BE |
FUEL CELLS AND HYDROGEN JOINT 2 UNDERTAKING |
0 |
0 |
0 |
0 |
0 |
0 |
0 |
1 |
1 |
0 |
1 |
1 |
2 |
|
IMI2 |
Brussels, BE |
INNOVATIVE MEDICINES INITIATIVE JOINT 2 UNDERTAKING |
0 |
0 |
0 |
1 |
0 |
1 |
9 |
2 |
11 |
0 |
1 |
1 |
13 |
|
SESAR |
Brussels, BE |
SESAR JOINT UNDERTAKING |
0 |
0 |
0 |
0 |
0 |
0 |
1 |
1 |
2 |
3 |
0 |
3 |
5 |
|
S2R |
Brussels, BE |
SHIFT2RAIL |
0 |
0 |
0 |
1 |
0 |
1 |
3 |
3 |
6 |
4 |
1 |
5 |
12 |
|
Executive agencies |
4 |
13 |
17 |
343 |
51 |
394 |
415 |
234 |
649 |
412 |
260 |
672 |
1732 |
||
|
CHAFEA |
Luxembourg, LU |
CONSUMERS, HEALTH, AGRICULTURE AND FOOD EXECUTIVE AGENCY |
0 |
1 |
1 |
8 |
0 |
8 |
6 |
3 |
9 |
17 |
13 |
30 |
48 |
|
EACEA |
Brussels, BE |
EDUCATION, AUDIOVISUAL AND CULTURE EXECUTIVE AGENCY |
3 |
3 |
6 |
63 |
8 |
71 |
89 |
59 |
148 |
68 |
19 |
87 |
312 |
|
ERCEA |
Brussels, BE |
EUROPEAN RESEARCH COUNCIL EXECUTIVE AGENCY |
0 |
2 |
2 |
75 |
15 |
90 |
79 |
54 |
133 |
68 |
51 |
119 |
344 |
|
EASME |
Brussels, BE |
EXECUTIVE AGENCY FOR SMALL AND MEDIUM-SIZED ENTERPRISES |
0 |
2 |
2 |
31 |
7 |
38 |
89 |
38 |
127 |
96 |
64 |
160 |
327 |
|
INEA |
Brussels, BE |
INNOVATION AND NETWORKS EXECUTIVE AGENCY |
0 |
0 |
0 |
34 |
3 |
37 |
31 |
22 |
53 |
57 |
35 |
92 |
182 |
|
REA |
Brussels, BE |
RESEARCH EXECUTIVE AGENCY |
1 |
5 |
6 |
132 |
18 |
150 |
121 |
58 |
179 |
106 |
78 |
184 |
519 |
|
|
|
Grand total |
8 |
46 |
54 |
631 |
113 |
744 |
953 |
474 |
1430 |
840 |
681 |
1521 |
3749 |
Table 22b - Breakdown by function group and gender for each agency or joint undertakings/EIT in 2018
|
FGI |
FGI Total |
FGII |
FGII Total |
FGIII |
FGIII Total |
FGIV |
FGIV Total |
Total |
|||||||
|
F |
M |
|
F |
M |
|
F |
M |
|
F |
M |
|
||||
|
Decentralised agencies |
4 |
38 |
42 |
241 |
51 |
292 |
520 |
223 |
743 |
435 |
383 |
818 |
1895 |
||
|
ACER |
Ljubljana, SI |
AGENCY FOR THE COOPERATION OF ENERGY REGULATORS |
0 |
0 |
0 |
1 |
0 |
1 |
1 |
0 |
1 |
5 |
15 |
20 |
22 |
|
Eu-LISA |
Tallinn, EE; Strasbourg ,FR |
AGENCY FOR THE OPERATIONAL MANAGEMENT OF LARGE-SCALE IT SYSTEMS IN THE AREA OF FREEDOM, SECURITY AND JUSTICE |
0 |
0 |
0 |
0 |
0 |
0 |
1 |
5 |
6 |
7 |
18 |
25 |
31 |
|
EFCA |
Vigo, ES |
COMMUNITY FISHERIES CONTROL AGENCY |
0 |
0 |
0 |
1 |
0 |
1 |
9 |
1 |
10 |
2 |
1 |
3 |
14 |
|
CPVO |
Angers, FR |
COMMUNITY PLANT VARIETY OFFICE |
0 |
0 |
0 |
0 |
0 |
0 |
1 |
0 |
1 |
0 |
5 |
5 |
6 |
|
Eu-OSHA |
Bilbao, ES |
EUROPEAN AGENCY FOR SAFETY AND HEALTH AT WORK |
0 |
0 |
0 |
9 |
1 |
10 |
12 |
2 |
14 |
2 |
2 |
4 |
28 |
|
EASO |
Valletta, MT |
EUROPEAN ASYLUM SUPPORT OFFICE |
0 |
0 |
0 |
1 |
0 |
1 |
22 |
14 |
36 |
11 |
12 |
23 |
60 |
|
EASA |
Cologne, DE |
EUROPEAN AVIATION SAFETY AGENCY |
0 |
0 |
0 |
0 |
0 |
0 |
38 |
21 |
59 |
10 |
13 |
23 |
82 |
|
EBA |
London, UK |
EUROPEAN BANKING AUTHORITY |
0 |
0 |
0 |
0 |
0 |
0 |
9 |
1 |
10 |
14 |
15 |
29 |
39 |
|
FRONTEX |
Warsaw, PL |
EUROPEAN BORDER AND COAST GUARD AGENCY |
1 |
19 |
20 |
8 |
1 |
9 |
85 |
14 |
99 |
32 |
25 |
57 |
185 |
|
ECDC |
Stockholm, SE |
EUROPEAN CENTRE FOR DISEASE PREVENTION AND CONTROL |
0 |
2 |
2 |
9 |
1 |
10 |
30 |
6 |
36 |
31 |
13 |
44 |
92 |
|
CEDEFOP |
Thessaloniki,EL |
EUROPEAN CENTRE FOR THE DEVELOPMENT OF VOCATIONAL TRAINING |
0 |
4 |
4 |
11 |
1 |
12 |
2 |
4 |
6 |
3 |
2 |
5 |
27 |
|
ECHA |
Helsinki, FI |
EUROPEAN CHEMICALS AGENCY |
0 |
0 |
0 |
30 |
7 |
37 |
30 |
30 |
60 |
13 |
14 |
27 |
124 |
|
EEA |
Copenhagen, DK |
EUROPEAN ENVIRONMENT AGENCY |
0 |
0 |
0 |
8 |
0 |
8 |
10 |
3 |
13 |
30 |
25 |
55 |
76 |
|
EFSA |
Parma, IT |
EUROPEAN FOOD SAFETY AUTHORITY |
0 |
0 |
0 |
15 |
5 |
20 |
2 |
3 |
5 |
60 |
34 |
94 |
119 |
|
EUROFUND |
Dublin, IE |
EUROPEAN FOUNDATION FOR THE IMPROVEMENT OF LIVING AND WORKING CONDITIONS |
1 |
1 |
2 |
1 |
1 |
2 |
3 |
0 |
3 |
3 |
2 |
5 |
12 |
|
GSA |
Prague, CZ |
EUROPEAN GNSS SUPERVISORY AUTHORITY |
0 |
0 |
0 |
3 |
0 |
3 |
2 |
2 |
4 |
21 |
23 |
44 |
51 |
|
EIGE |
Vilnius, LT |
EUROPEAN INSTITUTE FOR GENDER EQUALITY |
0 |
0 |
0 |
2 |
0 |
2 |
5 |
2 |
7 |
2 |
3 |
5 |
14 |
|
EIOPA |
Frankfurt a.M., DE |
EUROPEAN INSURANCE AND OCCUPATIONAL PENSIONS AUTHORITY |
0 |
0 |
0 |
5 |
2 |
7 |
14 |
1 |
15 |
4 |
4 |
8 |
30 |
|
EMSA |
Lisbon, PT |
EUROPEAN MARITIME SAFETY AGENCY |
0 |
2 |
2 |
13 |
4 |
17 |
3 |
3 |
6 |
8 |
9 |
17 |
42 |
|
EMA |
London, UK |
EUROPEAN MEDICINES AGENCY |
0 |
0 |
0 |
50 |
4 |
54 |
33 |
14 |
47 |
50 |
17 |
67 |
168 |
|
EMCDDA |
Lisbon, PT |
EUROPEAN MONITORING CENTRE FOR DRUGS AND DRUG ADDICTION |
0 |
3 |
3 |
11 |
1 |
12 |
6 |
3 |
9 |
4 |
1 |
5 |
29 |
|
EUROPOL |
The Hague, NL |
EUROPEAN POLICE OFFICE |
0 |
0 |
0 |
30 |
13 |
43 |
56 |
25 |
81 |
16 |
31 |
47 |
171 |
|
ESMA |
Paris, FR |
EUROPEAN SECURITIES AND MARKETS AUTHORITY |
0 |
0 |
0 |
0 |
0 |
0 |
22 |
3 |
25 |
15 |
29 |
44 |
69 |
|
ETF |
Turin, IT |
EUROPEAN TRAINING FOUNDATION |
0 |
0 |
0 |
6 |
2 |
8 |
20 |
2 |
22 |
6 |
3 |
9 |
39 |
|
EUROJUST |
The Hague, NL |
EUROPEAN UNIION'S JUDICIAL COOPERATION UNIT |
0 |
0 |
0 |
7 |
1 |
8 |
3 |
2 |
5 |
2 |
0 |
2 |
15 |
|
FRA |
Vienna, AT |
EUROPEAN UNION AGENCY FOR FUNDAMENTAL RIGHTS |
0 |
0 |
0 |
4 |
1 |
5 |
7 |
5 |
12 |
9 |
6 |
15 |
32 |
|
CEPOL |
Budapest, HU |
EUROPEAN UNION AGENCY FOR LAW ENFORCEMENT TRAINING |
0 |
0 |
0 |
0 |
0 |
0 |
13 |
6 |
19 |
5 |
5 |
10 |
29 |
|
ENISA |
Heraklion, EL |
EUROPEAN UNION AGENCY FOR NETWORK AND INFORMATION SECURITY |
0 |
1 |
1 |
0 |
0 |
0 |
4 |
5 |
9 |
11 |
5 |
16 |
26 |
|
ERA |
Valenciennes, FR |
EUROPEAN UNION AGENCY FOR RAILWAYS |
2 |
1 |
3 |
7 |
0 |
7 |
5 |
3 |
8 |
3 |
10 |
13 |
31 |
|
EUIPO |
Alicante, ES |
EUROPEAN UNION INTELLECTUAL PROPERTY OFFICE |
0 |
5 |
5 |
4 |
3 |
7 |
70 |
39 |
109 |
43 |
36 |
79 |
200 |
|
BEREC |
Riga, LV |
OFFICE OF THE BODY OF EUROPEAN REGULATORS FOR ELECTRONIC COMMUNICATIONS |
0 |
0 |
0 |
0 |
1 |
1 |
1 |
0 |
1 |
5 |
2 |
7 |
9 |
|
CdT |
Luxembourg, LU |
TRANSLATION CENTRE FOR THE BODIES OF THE EUROPEAN UNION |
0 |
0 |
0 |
5 |
2 |
7 |
1 |
4 |
5 |
8 |
3 |
11 |
23 |
|
Joint undertakings and EIT |
0 |
0 |
0 |
25 |
4 |
29 |
72 |
20 |
92 |
49 |
74 |
123 |
244 |
||
|
BBI |
Brussels, BE |
BIO-BASED INDUSTRIES JOINT UNDERTAKING |
0 |
0 |
0 |
0 |
0 |
0 |
2 |
3 |
5 |
3 |
2 |
5 |
10 |
|
Clean Sky |
Brussels, BE |
CLEAN SKY JOINT UNDERTAKING |
0 |
0 |
0 |
1 |
0 |
1 |
1 |
3 |
4 |
1 |
0 |
1 |
6 |
|
ECSEL |
Brussels, BE |
ELECTRONIC COMPONENTS AND SYSTEMS JOINT UNDERTAKING |
0 |
0 |
0 |
5 |
0 |
5 |
7 |
2 |
9 |
1 |
1 |
2 |
16 |
|
EIT |
Budapest, HU |
EUROPEAN INSTITUTE OF INNOVATION AND TECHNOLOGY |
0 |
0 |
0 |
4 |
1 |
5 |
4 |
4 |
8 |
5 |
1 |
6 |
19 |
|
F4E |
Barcelona, ES |
EUROPEAN JOINT UNDERTAKING FOR ITER AND THE DEVELOPMENT OF FUSION ENERGY |
0 |
0 |
0 |
12 |
2 |
14 |
48 |
4 |
52 |
31 |
64 |
95 |
161 |
|
FCH2 |
Brussels, BE |
FUEL CELLS AND HYDROGEN JOINT 2 UNDERTAKING |
0 |
0 |
0 |
1 |
0 |
1 |
0 |
1 |
1 |
0 |
1 |
1 |
3 |
|
IMI2 |
Brussels, BE |
INNOVATIVE MEDICINES INITIATIVE JOINT 2 UNDERTAKING |
0 |
0 |
0 |
1 |
0 |
1 |
8 |
0 |
8 |
0 |
1 |
1 |
10 |
|
SESAR |
Brussels, BE |
SESAR JOINT UNDERTAKING |
0 |
0 |
0 |
0 |
0 |
0 |
0 |
0 |
0 |
3 |
1 |
4 |
4 |
|
S2R |
Brussels, BE |
SHIFT2RAIL |
0 |
0 |
0 |
1 |
1 |
2 |
2 |
3 |
5 |
5 |
3 |
8 |
15 |
|
Executive agencies |
3 |
12 |
15 |
333 |
49 |
382 |
447 |
257 |
704 |
468 |
287 |
755 |
1856 |
||
|
CHAFEA |
Luxembourg, LU |
CONSUMERS, HEALTH, AGRICULTURE AND FOOD EXECUTIVE AGENCY |
0 |
1 |
1 |
8 |
0 |
8 |
6 |
5 |
11 |
19 |
11 |
30 |
50 |
|
EACEA |
Brussels, BE |
EDUCATION, AUDIOVISUAL AND CULTURE EXECUTIVE AGENCY |
2 |
2 |
4 |
63 |
9 |
72 |
99 |
64 |
163 |
74 |
23 |
97 |
336 |
|
ERCEA |
Brussels, BE |
EUROPEAN RESEARCH COUNCIL EXECUTIVE AGENCY |
0 |
2 |
2 |
70 |
15 |
85 |
82 |
56 |
138 |
80 |
56 |
136 |
361 |
|
EASME |
Brussels, BE |
EXECUTIVE AGENCY FOR SMALL AND MEDIUM-SIZED ENTERPRISES |
0 |
2 |
2 |
29 |
5 |
34 |
88 |
40 |
128 |
106 |
73 |
179 |
343 |
|
INEA |
Brussels, BE |
INNOVATION AND NETWORKS EXECUTIVE AGENCY |
0 |
0 |
0 |
34 |
4 |
38 |
43 |
29 |
72 |
63 |
39 |
102 |
212 |
|
REA |
Brussels, BE |
RESEARCH EXECUTIVE AGENCY |
1 |
5 |
6 |
129 |
16 |
145 |
129 |
63 |
192 |
126 |
85 |
211 |
554 |
|
|
|
Total |
7 |
50 |
57 |
599 |
104 |
703 |
1039 |
500 |
1539 |
952 |
744 |
1696 |
3995 |
Table 23a - Breakdown nationality for each agency or joint undertakings/EIT in 2017
|
|
|
AT |
BE |
BG |
CY |
CZ |
DE |
DK |
EE |
EL |
ES |
FI |
FR |
HR |
HU |
IE |
IT |
LT |
LU |
LV |
MT |
NL |
PL |
PT |
RO |
SE |
SI |
SK |
UK |
Other |
Total |
|
|
Decentralised agencies |
14 |
42 |
71 |
2 |
27 |
69 |
17 |
12 |
133 |
232 |
46 |
117 |
11 |
48 |
15 |
211 |
31 |
0 |
15 |
8 |
62 |
177 |
65 |
110 |
34 |
16 |
22 |
60 |
101 |
1768 |
||
|
ACER |
Ljubljana, SI |
AGENCY FOR THE COOPERATION OF ENERGY REGULATORS |
0 |
0 |
0 |
0 |
0 |
1 |
0 |
0 |
2 |
2 |
0 |
0 |
1 |
2 |
0 |
2 |
0 |
0 |
0 |
0 |
1 |
2 |
0 |
1 |
0 |
7 |
0 |
0 |
0 |
21 |
|
Eu-LISA |
Tallinn, EE; Strasbourg (FR) |
AGENCY FOR THE OPERATIONAL MANAGEMENT OF LARGE-SCALE IT SYSTEMS IN THE AREA OF FREEDOM, SECURITY AND JUSTICE |
0 |
0 |
0 |
0 |
0 |
0 |
0 |
2 |
4 |
2 |
0 |
12 |
0 |
0 |
0 |
1 |
0 |
0 |
1 |
0 |
0 |
1 |
1 |
3 |
0 |
0 |
1 |
0 |
3 |
31 |
|
EFCA |
Vigo, ES |
COMMUNITY FISHERIES CONTROL AGENCY |
0 |
0 |
0 |
0 |
0 |
0 |
0 |
0 |
0 |
6 |
0 |
0 |
0 |
0 |
0 |
0 |
0 |
0 |
0 |
0 |
0 |
0 |
1 |
0 |
0 |
0 |
0 |
0 |
0 |
7 |
|
CPVO |
Angers, FR |
COMMUNITY PLANT VARIETY OFFICE |
0 |
0 |
1 |
0 |
0 |
0 |
0 |
0 |
0 |
0 |
0 |
3 |
0 |
0 |
0 |
0 |
0 |
0 |
0 |
0 |
0 |
0 |
0 |
2 |
0 |
0 |
0 |
0 |
0 |
6 |
|
Eu-OSHA |
Bilbao, ES |
EUROPEAN AGENCY FOR SAFETY AND HEALTH AT WORK |
0 |
0 |
2 |
0 |
0 |
1 |
0 |
1 |
0 |
16 |
0 |
1 |
0 |
1 |
0 |
1 |
0 |
0 |
0 |
0 |
0 |
0 |
0 |
1 |
0 |
0 |
0 |
2 |
0 |
26 |
|
EASO |
Valletta, MT |
EUROPEAN ASYLUM SUPPORT OFFICE |
1 |
3 |
3 |
0 |
3 |
0 |
1 |
1 |
8 |
7 |
0 |
4 |
0 |
0 |
0 |
14 |
2 |
0 |
1 |
6 |
0 |
2 |
3 |
4 |
0 |
0 |
0 |
1 |
3 |
67 |
|
EASA |
Cologne, DE |
EUROPEAN AVIATION SAFETY AGENCY |
0 |
2 |
2 |
0 |
0 |
19 |
0 |
0 |
7 |
7 |
0 |
6 |
1 |
3 |
1 |
5 |
0 |
0 |
0 |
0 |
0 |
6 |
1 |
10 |
0 |
1 |
0 |
5 |
1 |
77 |
|
EBA |
London, UK |
EUROPEAN BANKING AUTHORITY |
1 |
0 |
1 |
0 |
0 |
4 |
0 |
0 |
1 |
3 |
0 |
2 |
0 |
1 |
0 |
4 |
2 |
0 |
0 |
0 |
0 |
6 |
2 |
3 |
2 |
2 |
1 |
3 |
1 |
39 |
|
FRONTEX |
Warsaw, PL |
EUROPEAN BORDER AND COAST GUARD AGENCY |
0 |
0 |
5 |
1 |
0 |
1 |
0 |
0 |
4 |
1 |
2 |
2 |
1 |
2 |
1 |
1 |
3 |
0 |
0 |
0 |
1 |
111 |
6 |
2 |
0 |
1 |
1 |
0 |
4 |
150 |
|
ECDC |
Stockholm, SE |
EUROPEAN CENTRE FOR DISEASE PREVENTION AND CONTROL |
1 |
3 |
3 |
0 |
1 |
5 |
1 |
2 |
2 |
2 |
3 |
7 |
0 |
1 |
0 |
7 |
4 |
0 |
1 |
0 |
2 |
5 |
4 |
7 |
25 |
0 |
2 |
5 |
4 |
97 |
|
CEDEFOP |
Thessaloniki,EL |
EUROPEAN CENTRE FOR THE DEVELOPMENT OF VOCATIONAL TRAINING |
0 |
0 |
1 |
0 |
1 |
0 |
0 |
0 |
20 |
0 |
0 |
1 |
0 |
0 |
0 |
1 |
0 |
0 |
0 |
0 |
0 |
0 |
0 |
0 |
0 |
0 |
0 |
1 |
0 |
25 |
|
ECHA |
Helsinki, FI |
EUROPEAN CHEMICALS AGENCY |
0 |
3 |
7 |
0 |
1 |
3 |
0 |
2 |
11 |
7 |
33 |
5 |
0 |
2 |
2 |
10 |
0 |
0 |
1 |
0 |
2 |
3 |
2 |
13 |
0 |
2 |
0 |
5 |
5 |
119 |
|
EEA |
Copenhagen, DK |
EUROPEAN ENVIRONMENT AGENCY |
1 |
4 |
0 |
0 |
1 |
5 |
10 |
0 |
0 |
6 |
1 |
6 |
0 |
2 |
0 |
6 |
1 |
0 |
0 |
0 |
1 |
2 |
3 |
3 |
1 |
0 |
1 |
4 |
6 |
64 |
|
EFSA |
Parma, IT |
EUROPEAN FOOD SAFETY AUTHORITY |
1 |
2 |
3 |
0 |
1 |
7 |
0 |
0 |
12 |
9 |
0 |
5 |
1 |
4 |
0 |
49 |
0 |
0 |
0 |
0 |
0 |
6 |
2 |
3 |
0 |
0 |
4 |
3 |
2 |
114 |
|
EUROFUND |
Dublin, IE |
EUROPEAN FOUNDATION FOR THE IMPROVEMENT OF LIVING AND WORKING CONDITIONS |
0 |
0 |
0 |
0 |
1 |
0 |
0 |
0 |
0 |
2 |
0 |
0 |
0 |
0 |
1 |
3 |
0 |
0 |
0 |
0 |
1 |
0 |
0 |
0 |
0 |
0 |
0 |
1 |
0 |
9 |
|
GSA |
Prague, CZ |
EUROPEAN GNSS SUPERVISORY AUTHORITY |
0 |
3 |
2 |
0 |
11 |
0 |
0 |
0 |
4 |
5 |
1 |
3 |
0 |
0 |
0 |
6 |
0 |
0 |
0 |
1 |
0 |
2 |
0 |
7 |
0 |
1 |
2 |
1 |
2 |
51 |
|
EIGE |
Vilnius, LT |
EUROPEAN INSTITUTE FOR GENDER EQUALITY |
0 |
0 |
0 |
0 |
0 |
0 |
0 |
0 |
1 |
1 |
1 |
2 |
1 |
0 |
0 |
1 |
8 |
0 |
1 |
0 |
0 |
0 |
0 |
0 |
0 |
0 |
1 |
0 |
0 |
17 |
|
EIOPA |
Frankfurt a.M., DE |
EUROPEAN INSURANCE AND OCCUPATIONAL PENSIONS AUTHORITY |
1 |
0 |
3 |
0 |
1 |
6 |
0 |
1 |
1 |
2 |
0 |
2 |
1 |
0 |
2 |
1 |
1 |
0 |
0 |
0 |
0 |
2 |
0 |
4 |
0 |
0 |
2 |
2 |
2 |
34 |
|
EMSA |
Lisbon, PT |
EUROPEAN MARITIME SAFETY AGENCY |
0 |
4 |
1 |
0 |
0 |
0 |
0 |
0 |
0 |
2 |
1 |
0 |
1 |
0 |
0 |
4 |
0 |
0 |
0 |
0 |
0 |
0 |
13 |
0 |
0 |
0 |
0 |
2 |
0 |
28 |
|
EMA |
London, UK |
EUROPEAN MEDICINES AGENCY |
1 |
3 |
6 |
1 |
2 |
2 |
0 |
1 |
6 |
11 |
0 |
8 |
0 |
6 |
1 |
20 |
4 |
0 |
3 |
0 |
1 |
8 |
4 |
9 |
1 |
0 |
4 |
3 |
45 |
150 |
|
EMCDDA |
Lisbon, PT |
EUROPEAN MONITORING CENTRE FOR DRUGS AND DRUG ADDICTION |
0 |
3 |
1 |
0 |
0 |
0 |
0 |
0 |
1 |
0 |
0 |
0 |
0 |
0 |
0 |
4 |
0 |
0 |
0 |
0 |
0 |
2 |
16 |
0 |
0 |
0 |
0 |
1 |
1 |
29 |
|
EUROPOL |
The Hague, NL |
EUROPEAN POLICE OFFICE |
0 |
0 |
9 |
0 |
1 |
4 |
0 |
0 |
13 |
18 |
3 |
7 |
1 |
7 |
0 |
12 |
1 |
0 |
0 |
0 |
39 |
5 |
5 |
12 |
2 |
2 |
0 |
6 |
10 |
157 |
|
ESMA |
Paris, FR |
EUROPEAN SECURITIES AND MARKETS AUTHORITY |
0 |
1 |
2 |
0 |
1 |
3 |
2 |
0 |
4 |
5 |
0 |
15 |
0 |
1 |
0 |
8 |
0 |
0 |
1 |
0 |
1 |
2 |
0 |
4 |
1 |
0 |
0 |
0 |
0 |
51 |
|
ETF |
Turin, IT |
EUROPEAN TRAINING FOUNDATION |
1 |
1 |
0 |
0 |
1 |
0 |
0 |
1 |
0 |
2 |
1 |
0 |
0 |
0 |
1 |
23 |
0 |
0 |
0 |
0 |
0 |
1 |
0 |
2 |
0 |
0 |
0 |
1 |
5 |
40 |
|
EUROJUST |
The Hague, NL |
EUROPEAN UNIION'S JUDICIAL COOPERATION UNIT |
1 |
0 |
3 |
0 |
0 |
1 |
0 |
0 |
2 |
2 |
0 |
2 |
0 |
0 |
0 |
2 |
0 |
0 |
1 |
0 |
5 |
0 |
0 |
3 |
0 |
0 |
0 |
2 |
0 |
24 |
|
FRA |
Vienna, AT |
EUROPEAN UNION AGENCY FOR FUNDAMENTAL RIGHTS |
4 |
0 |
1 |
0 |
0 |
2 |
0 |
0 |
1 |
0 |
0 |
2 |
0 |
2 |
2 |
2 |
0 |
0 |
0 |
0 |
2 |
3 |
0 |
1 |
1 |
0 |
2 |
3 |
2 |
30 |
|
CEPOL |
Budapest, HU |
EUROPEAN UNION AGENCY FOR LAW ENFORCEMENT TRAINING |
0 |
0 |
1 |
0 |
0 |
0 |
0 |
0 |
2 |
1 |
0 |
0 |
0 |
7 |
0 |
0 |
0 |
0 |
0 |
0 |
0 |
1 |
0 |
1 |
0 |
0 |
0 |
1 |
2 |
16 |
|
ENISA |
Heraklion, EL |
EUROPEAN UNION AGENCY FOR NETWORK AND INFORMATION SECURITY |
0 |
0 |
1 |
0 |
0 |
0 |
0 |
0 |
18 |
3 |
0 |
0 |
0 |
1 |
0 |
2 |
0 |
0 |
0 |
0 |
0 |
0 |
0 |
1 |
0 |
0 |
1 |
1 |
0 |
28 |
|
ERA |
Valenciennes, FR |
EUROPEAN UNION AGENCY FOR RAILWAYS |
0 |
4 |
1 |
0 |
0 |
1 |
0 |
0 |
2 |
3 |
0 |
9 |
1 |
2 |
1 |
2 |
1 |
0 |
0 |
1 |
1 |
0 |
0 |
2 |
0 |
0 |
0 |
1 |
1 |
33 |
|
EUIPO |
Alicante, ES |
EUROPEAN UNION INTELLECTUAL PROPERTY OFFICE |
1 |
5 |
11 |
0 |
0 |
4 |
3 |
1 |
4 |
103 |
0 |
11 |
0 |
3 |
3 |
19 |
3 |
0 |
0 |
0 |
5 |
7 |
2 |
10 |
1 |
0 |
0 |
4 |
1 |
201 |
|
BEREC |
Riga, LV |
OFFICE OF THE BODY OF EUROPEAN REGULATORS FOR ELECTRONIC COMMUNICATIONS |
0 |
0 |
1 |
0 |
1 |
0 |
0 |
0 |
2 |
0 |
0 |
0 |
0 |
0 |
0 |
0 |
1 |
0 |
4 |
0 |
0 |
0 |
0 |
0 |
0 |
0 |
0 |
0 |
0 |
9 |
|
CdT |
Luxembourg, LU |
TRANSLATION CENTRE FOR THE BODIES OF THE EUROPEAN UNION |
0 |
1 |
0 |
0 |
0 |
0 |
0 |
0 |
1 |
4 |
0 |
2 |
2 |
1 |
0 |
1 |
0 |
0 |
1 |
0 |
0 |
0 |
0 |
2 |
0 |
0 |
0 |
2 |
1 |
18 |
|
Joint undertakings and EIT |
0 |
21 |
4 |
1 |
5 |
6 |
0 |
2 |
7 |
70 |
1 |
19 |
0 |
18 |
1 |
36 |
2 |
0 |
0 |
0 |
1 |
7 |
9 |
11 |
1 |
1 |
1 |
6 |
19 |
249 |
||
|
BBI |
Brussels, BE |
BIO-BASED INDUSTRIES JOINT UNDERTAKING |
0 |
1 |
0 |
0 |
0 |
0 |
0 |
0 |
1 |
1 |
0 |
0 |
0 |
1 |
0 |
1 |
0 |
0 |
0 |
0 |
0 |
0 |
0 |
2 |
0 |
0 |
0 |
0 |
0 |
7 |
|
Clean Sky |
Brussels, BE |
CLEAN SKY JOINT UNDERTAKING |
0 |
2 |
0 |
0 |
0 |
0 |
0 |
0 |
0 |
1 |
0 |
0 |
0 |
0 |
0 |
2 |
0 |
0 |
0 |
0 |
0 |
0 |
0 |
1 |
0 |
0 |
0 |
0 |
0 |
6 |
|
ECSEL |
Brussels, BE |
ELECTRONIC COMPONENTS AND SYSTEMS JOINT UNDERTAKING |
0 |
7 |
0 |
0 |
0 |
0 |
0 |
0 |
3 |
1 |
0 |
1 |
0 |
0 |
0 |
0 |
0 |
0 |
0 |
0 |
0 |
1 |
0 |
0 |
0 |
0 |
0 |
0 |
1 |
14 |
|
EIT |
Budapest, HU |
EUROPEAN INSTITUTE OF INNOVATION AND TECHNOLOGY |
0 |
0 |
0 |
0 |
0 |
0 |
0 |
0 |
0 |
0 |
0 |
0 |
0 |
13 |
0 |
0 |
0 |
0 |
0 |
0 |
0 |
1 |
0 |
1 |
0 |
0 |
1 |
0 |
1 |
17 |
|
F4E |
Barcelona, ES |
EUROPEAN JOINT UNDERTAKING FOR ITER AND THE DEVELOPMENT OF FUSION ENERGY |
0 |
7 |
3 |
0 |
2 |
6 |
0 |
2 |
2 |
64 |
1 |
14 |
0 |
3 |
0 |
29 |
1 |
0 |
0 |
0 |
1 |
3 |
7 |
5 |
1 |
0 |
0 |
6 |
16 |
173 |
|
FCH2 |
Brussels, BE |
FUEL CELLS AND HYDROGEN JOINT 2 UNDERTAKING |
0 |
1 |
0 |
0 |
0 |
0 |
0 |
0 |
0 |
0 |
0 |
0 |
0 |
0 |
0 |
1 |
0 |
0 |
0 |
0 |
0 |
0 |
0 |
0 |
0 |
0 |
0 |
0 |
0 |
2 |
|
IMI2 |
Brussels, BE |
INNOVATIVE MEDICINES INITIATIVE JOINT 2 UNDERTAKING |
0 |
0 |
1 |
0 |
2 |
0 |
0 |
0 |
1 |
1 |
0 |
1 |
0 |
0 |
1 |
3 |
0 |
0 |
0 |
0 |
0 |
1 |
1 |
1 |
0 |
0 |
0 |
0 |
0 |
13 |
|
SESAR |
Brussels, BE |
SESAR JOINT UNDERTAKING |
0 |
1 |
0 |
1 |
1 |
0 |
0 |
0 |
0 |
0 |
0 |
1 |
0 |
0 |
0 |
0 |
0 |
0 |
0 |
0 |
0 |
0 |
0 |
0 |
0 |
1 |
0 |
0 |
0 |
5 |
|
S2R |
Brussels, BE |
SHIFT2RAIL |
0 |
2 |
0 |
0 |
0 |
0 |
0 |
0 |
0 |
2 |
0 |
2 |
0 |
1 |
0 |
0 |
1 |
0 |
0 |
0 |
0 |
1 |
1 |
1 |
0 |
0 |
0 |
0 |
1 |
12 |
|
Executive agencies |
13 |
409 |
68 |
6 |
7 |
54 |
3 |
4 |
116 |
159 |
11 |
161 |
7 |
28 |
4 |
288 |
17 |
4 |
4 |
2 |
12 |
71 |
39 |
119 |
8 |
5 |
19 |
21 |
73 |
1732 |
||
|
CHAFEA |
Luxembourg, LU |
CONSUMERS, HEALTH, AGRICULTURE AND FOOD EXECUTIVE AGENCY |
1 |
7 |
3 |
0 |
0 |
3 |
0 |
0 |
4 |
5 |
0 |
7 |
0 |
1 |
0 |
6 |
1 |
0 |
0 |
0 |
0 |
3 |
1 |
3 |
0 |
1 |
0 |
0 |
2 |
48 |
|
EACEA |
Brussels, BE |
EDUCATION, AUDIOVISUAL AND CULTURE EXECUTIVE AGENCY |
3 |
100 |
6 |
0 |
1 |
13 |
0 |
0 |
18 |
18 |
4 |
33 |
0 |
6 |
3 |
50 |
3 |
2 |
1 |
1 |
1 |
7 |
8 |
5 |
1 |
1 |
4 |
5 |
18 |
312 |
|
ERCEA |
Brussels, BE |
EUROPEAN RESEARCH COUNCIL EXECUTIVE AGENCY |
3 |
93 |
15 |
1 |
0 |
6 |
2 |
2 |
23 |
33 |
0 |
31 |
2 |
9 |
0 |
47 |
1 |
0 |
0 |
0 |
3 |
11 |
7 |
34 |
0 |
1 |
4 |
2 |
14 |
344 |
|
EASME |
Brussels, BE |
EXECUTIVE AGENCY FOR SMALL AND MEDIUM-SIZED ENTERPRISES |
4 |
58 |
16 |
1 |
3 |
11 |
0 |
2 |
22 |
32 |
2 |
40 |
1 |
3 |
0 |
48 |
3 |
1 |
1 |
1 |
2 |
18 |
5 |
25 |
4 |
1 |
4 |
7 |
12 |
327 |
|
INEA |
Brussels, BE |
INNOVATION AND NETWORKS EXECUTIVE AGENCY |
1 |
26 |
6 |
3 |
1 |
9 |
1 |
0 |
11 |
18 |
2 |
14 |
2 |
0 |
0 |
30 |
4 |
0 |
1 |
0 |
2 |
14 |
7 |
15 |
2 |
0 |
3 |
3 |
7 |
182 |
|
REA |
Brussels, BE |
RESEARCH EXECUTIVE AGENCY |
1 |
125 |
22 |
1 |
2 |
12 |
0 |
0 |
38 |
53 |
3 |
36 |
2 |
9 |
1 |
107 |
5 |
1 |
1 |
0 |
4 |
18 |
11 |
37 |
1 |
1 |
4 |
4 |
20 |
519 |
|
|
|
Total |
27 |
472 |
143 |
9 |
39 |
129 |
20 |
18 |
256 |
461 |
58 |
297 |
18 |
94 |
20 |
535 |
50 |
4 |
19 |
10 |
75 |
255 |
113 |
240 |
43 |
22 |
42 |
87 |
193 |
3749 |
Table 23b - Breakdown by nationality for each agency or joint undertakings/EIT in 2018
|
AT |
BE |
BG |
CY |
CZ |
DE |
DK |
EE |
ES |
FI |
FR |
GR |
HR |
HU |
IE |
IT |
LT |
LU |
LV |
MT |
NL |
PL |
PT |
RO |
SE |
SI |
SK |
UK |
Other |
Total |
|||
|
Decentralised agency |
18 |
51 |
73 |
3 |
31 |
75 |
15 |
13 |
246 |
46 |
124 |
143 |
17 |
59 |
17 |
237 |
34 |
0 |
15 |
10 |
43 |
206 |
79 |
122 |
38 |
25 |
26 |
56 |
73 |
1895 |
||
|
ACER |
Ljubljana, SI |
AGENCY FOR THE COOPERATION OF ENERGY REGULATORS |
0 |
1 |
0 |
0 |
1 |
1 |
0 |
0 |
2 |
0 |
0 |
2 |
1 |
1 |
0 |
1 |
0 |
0 |
0 |
0 |
1 |
2 |
0 |
1 |
0 |
8 |
0 |
0 |
0 |
22 |
|
Eu-LISA |
Tallinn, EE; Strasbourg (FR) |
AGENCY FOR THE OPERATIONAL MANAGEMENT OF LARGE-SCALE IT SYSTEMS IN THE AREA OF FREEDOM, SECURITY AND JUSTICE |
0 |
1 |
0 |
0 |
0 |
1 |
0 |
3 |
2 |
0 |
12 |
4 |
0 |
0 |
0 |
1 |
0 |
0 |
0 |
0 |
0 |
1 |
1 |
3 |
0 |
0 |
0 |
0 |
2 |
31 |
|
EFCA |
Vigo, ES |
COMMUNITY FISHERIES CONTROL AGENCY |
0 |
0 |
0 |
0 |
0 |
0 |
0 |
0 |
11 |
0 |
0 |
0 |
0 |
0 |
0 |
0 |
0 |
0 |
0 |
0 |
0 |
1 |
2 |
0 |
0 |
0 |
0 |
0 |
0 |
14 |
|
CPVO |
Angers, FR |
COMMUNITY PLANT VARIETY OFFICE |
0 |
0 |
0 |
0 |
0 |
0 |
0 |
0 |
1 |
0 |
3 |
0 |
0 |
0 |
0 |
0 |
0 |
0 |
0 |
0 |
0 |
0 |
0 |
2 |
0 |
0 |
0 |
0 |
0 |
6 |
|
Eu-OSHA |
Bilbao, ES |
EUROPEAN AGENCY FOR SAFETY AND HEALTH AT WORK |
0 |
0 |
2 |
0 |
0 |
1 |
0 |
1 |
17 |
0 |
1 |
0 |
0 |
1 |
1 |
1 |
0 |
0 |
0 |
0 |
0 |
0 |
0 |
1 |
0 |
0 |
0 |
2 |
0 |
28 |
|
EASO |
Valletta, MT |
EUROPEAN ASYLUM SUPPORT OFFICE |
1 |
3 |
2 |
0 |
1 |
1 |
1 |
1 |
5 |
0 |
4 |
7 |
0 |
0 |
0 |
13 |
3 |
0 |
1 |
7 |
0 |
1 |
3 |
2 |
0 |
0 |
1 |
1 |
2 |
60 |
|
EASA |
Cologne, DE |
EUROPEAN AVIATION SAFETY AGENCY |
0 |
2 |
2 |
0 |
0 |
20 |
0 |
1 |
8 |
0 |
6 |
8 |
2 |
3 |
1 |
5 |
1 |
0 |
0 |
0 |
0 |
5 |
1 |
10 |
0 |
1 |
1 |
4 |
1 |
82 |
|
EBA |
London, UK |
EUROPEAN BANKING AUTHORITY |
2 |
0 |
1 |
0 |
0 |
3 |
0 |
0 |
5 |
0 |
2 |
1 |
1 |
0 |
0 |
7 |
1 |
0 |
0 |
0 |
0 |
3 |
2 |
3 |
2 |
2 |
1 |
2 |
1 |
39 |
|
FRONTEX |
Warsaw, PL |
EUROPEAN BORDER AND COAST GUARD AGENCY |
0 |
0 |
9 |
1 |
0 |
1 |
0 |
0 |
1 |
0 |
2 |
5 |
0 |
3 |
1 |
5 |
4 |
0 |
0 |
0 |
1 |
133 |
7 |
5 |
0 |
3 |
1 |
0 |
3 |
185 |
|
ECDC |
Stockholm, SE |
EUROPEAN CENTRE FOR DISEASE PREVENTION AND CONTROL |
1 |
3 |
2 |
0 |
1 |
5 |
1 |
1 |
3 |
3 |
6 |
3 |
0 |
1 |
0 |
6 |
4 |
0 |
0 |
0 |
2 |
7 |
4 |
7 |
26 |
0 |
1 |
5 |
0 |
92 |
|
CEDEFOP |
Thessaloniki,EL |
EUROPEAN CENTRE FOR THE DEVELOPMENT OF VOCATIONAL TRAINING |
0 |
1 |
1 |
0 |
1 |
0 |
0 |
0 |
0 |
0 |
1 |
21 |
0 |
0 |
0 |
1 |
0 |
0 |
0 |
0 |
0 |
0 |
0 |
0 |
0 |
0 |
0 |
1 |
0 |
27 |
|
ECHA |
Helsinki, FI |
EUROPEAN CHEMICALS AGENCY |
0 |
3 |
6 |
0 |
1 |
3 |
0 |
2 |
8 |
33 |
5 |
12 |
0 |
3 |
1 |
10 |
1 |
0 |
1 |
0 |
2 |
4 |
2 |
15 |
0 |
2 |
0 |
6 |
4 |
124 |
|
EEA |
Copenhagen, DK |
EUROPEAN ENVIRONMENT AGENCY |
1 |
5 |
0 |
0 |
1 |
6 |
9 |
0 |
7 |
2 |
7 |
1 |
0 |
3 |
1 |
7 |
2 |
0 |
0 |
0 |
1 |
2 |
3 |
2 |
1 |
2 |
1 |
6 |
6 |
76 |
|
EFSA |
Parma, IT |
EUROPEAN FOOD SAFETY AUTHORITY |
1 |
1 |
3 |
0 |
1 |
8 |
0 |
0 |
11 |
0 |
4 |
12 |
1 |
3 |
0 |
53 |
0 |
0 |
0 |
0 |
0 |
5 |
2 |
4 |
0 |
0 |
4 |
4 |
2 |
119 |
|
EUROFUND |
Dublin, IE |
EUROPEAN FOUNDATION FOR THE IMPROVEMENT OF LIVING AND WORKING CONDITIONS |
0 |
0 |
0 |
0 |
0 |
2 |
0 |
0 |
2 |
0 |
1 |
1 |
0 |
0 |
2 |
3 |
1 |
0 |
0 |
0 |
0 |
0 |
0 |
0 |
0 |
0 |
0 |
0 |
0 |
12 |
|
GSA |
Prague, CZ |
EUROPEAN GNSS SUPERVISORY AUTHORITY |
0 |
2 |
2 |
0 |
12 |
0 |
0 |
0 |
3 |
1 |
2 |
5 |
0 |
1 |
0 |
5 |
0 |
0 |
0 |
1 |
0 |
2 |
0 |
8 |
0 |
1 |
3 |
1 |
2 |
51 |
|
EIGE |
Vilnius, LT |
EUROPEAN INSTITUTE FOR GENDER EQUALITY |
0 |
0 |
1 |
0 |
0 |
0 |
0 |
0 |
1 |
1 |
2 |
0 |
1 |
0 |
0 |
1 |
6 |
0 |
1 |
0 |
0 |
0 |
0 |
0 |
0 |
0 |
0 |
0 |
0 |
14 |
|
EIOPA |
Frankfurt a.M., DE |
EUROPEAN INSURANCE AND OCCUPATIONAL PENSIONS AUTHORITY |
1 |
0 |
4 |
0 |
1 |
4 |
0 |
1 |
1 |
0 |
2 |
1 |
2 |
0 |
1 |
1 |
1 |
0 |
1 |
0 |
0 |
1 |
0 |
3 |
0 |
0 |
2 |
1 |
2 |
30 |
|
EMSA |
Lisbon, PT |
EUROPEAN MARITIME SAFETY AGENCY |
0 |
6 |
1 |
0 |
0 |
1 |
0 |
0 |
4 |
1 |
0 |
2 |
1 |
0 |
0 |
5 |
0 |
0 |
0 |
0 |
0 |
0 |
17 |
1 |
0 |
0 |
0 |
2 |
1 |
42 |
|
EMA |
London, UK |
EUROPEAN MEDICINES AGENCY |
2 |
3 |
6 |
1 |
4 |
4 |
0 |
1 |
18 |
1 |
9 |
10 |
1 |
8 |
1 |
20 |
4 |
0 |
2 |
0 |
1 |
11 |
7 |
12 |
2 |
1 |
5 |
3 |
31 |
168 |
|
EMCDDA |
Lisbon, PT |
EUROPEAN MONITORING CENTRE FOR DRUGS AND DRUG ADDICTION |
0 |
3 |
1 |
0 |
1 |
0 |
0 |
0 |
0 |
0 |
0 |
1 |
0 |
0 |
0 |
4 |
0 |
0 |
0 |
0 |
0 |
2 |
15 |
0 |
0 |
0 |
0 |
1 |
1 |
29 |
|
EUROPOL |
The Hague, NL |
EUROPEAN POLICE OFFICE |
0 |
1 |
10 |
1 |
3 |
5 |
0 |
0 |
19 |
4 |
7 |
13 |
2 |
9 |
1 |
22 |
1 |
0 |
0 |
0 |
23 |
10 |
10 |
13 |
3 |
3 |
0 |
5 |
6 |
171 |
|
ESMA |
Paris, FR |
EUROPEAN SECURITIES AND MARKETS AUTHORITY |
1 |
1 |
2 |
0 |
1 |
3 |
1 |
0 |
6 |
0 |
19 |
7 |
0 |
2 |
1 |
10 |
0 |
0 |
1 |
2 |
2 |
3 |
0 |
5 |
2 |
0 |
0 |
0 |
0 |
69 |
|
ETF |
Turin, IT |
EUROPEAN TRAINING FOUNDATION |
1 |
1 |
0 |
0 |
1 |
0 |
0 |
1 |
3 |
0 |
0 |
0 |
0 |
0 |
1 |
22 |
0 |
0 |
1 |
0 |
0 |
1 |
0 |
2 |
0 |
1 |
0 |
1 |
3 |
39 |
|
EUROJUST |
The Hague, NL |
EUROPEAN UNIION'S JUDICIAL COOPERATION UNIT |
2 |
0 |
2 |
0 |
0 |
0 |
0 |
0 |
1 |
0 |
1 |
1 |
0 |
0 |
0 |
3 |
0 |
0 |
1 |
0 |
2 |
0 |
0 |
2 |
0 |
0 |
0 |
0 |
0 |
15 |
|
FRA |
Vienna, AT |
EUROPEAN UNION AGENCY FOR FUNDAMENTAL RIGHTS |
4 |
0 |
1 |
0 |
0 |
2 |
0 |
0 |
1 |
0 |
3 |
1 |
0 |
2 |
2 |
2 |
0 |
0 |
0 |
0 |
2 |
3 |
0 |
1 |
1 |
0 |
2 |
3 |
2 |
32 |
|
CEPOL |
Budapest, HU |
EUROPEAN UNION AGENCY FOR LAW ENFORCEMENT TRAINING |
1 |
0 |
0 |
0 |
0 |
0 |
0 |
0 |
1 |
0 |
0 |
2 |
2 |
14 |
0 |
0 |
0 |
0 |
0 |
0 |
1 |
2 |
0 |
4 |
0 |
0 |
0 |
0 |
2 |
29 |
|
ENISA |
Heraklion, EL |
EUROPEAN UNION AGENCY FOR NETWORK AND INFORMATION SECURITY |
0 |
0 |
2 |
0 |
0 |
0 |
0 |
0 |
2 |
0 |
0 |
15 |
0 |
0 |
0 |
2 |
0 |
0 |
0 |
0 |
0 |
0 |
0 |
3 |
0 |
0 |
1 |
1 |
0 |
26 |
|
ERA |
Valenciennes, FR |
EUROPEAN UNION AGENCY FOR RAILWAYS |
0 |
8 |
1 |
0 |
0 |
1 |
0 |
0 |
1 |
0 |
9 |
2 |
1 |
1 |
1 |
1 |
1 |
0 |
0 |
0 |
0 |
1 |
0 |
2 |
0 |
0 |
0 |
1 |
0 |
31 |
|
EUIPO |
Alicante, ES |
EUROPEAN UNION INTELLECTUAL PROPERTY OFFICE |
0 |
5 |
9 |
0 |
0 |
3 |
3 |
1 |
97 |
0 |
13 |
6 |
0 |
3 |
2 |
22 |
3 |
0 |
0 |
0 |
5 |
6 |
2 |
9 |
1 |
0 |
3 |
5 |
2 |
200 |
|
BEREC |
Riga, LV |
OFFICE OF THE BODY OF EUROPEAN REGULATORS FOR ELECTRONIC COMMUNICATIONS |
0 |
0 |
2 |
0 |
1 |
0 |
0 |
0 |
0 |
0 |
0 |
0 |
0 |
0 |
0 |
0 |
1 |
0 |
5 |
0 |
0 |
0 |
0 |
0 |
0 |
0 |
0 |
0 |
0 |
9 |
|
CdT |
Luxembourg, LU |
TRANSLATION CENTRE FOR THE BODIES OF THE EUROPEAN UNION |
0 |
1 |
1 |
0 |
0 |
0 |
0 |
0 |
5 |
0 |
3 |
0 |
2 |
1 |
0 |
4 |
0 |
0 |
1 |
0 |
0 |
0 |
1 |
2 |
0 |
1 |
0 |
1 |
0 |
23 |
|
|
|
Joint Undertakings/EIT |
0 |
20 |
2 |
1 |
2 |
6 |
0 |
1 |
73 |
1 |
21 |
9 |
0 |
18 |
2 |
34 |
2 |
0 |
0 |
0 |
1 |
9 |
8 |
13 |
1 |
0 |
0 |
4 |
16 |
244 |
|
BBI |
Brussels, BE |
BIO-BASED INDUSTRIES JOINT UNDERTAKING |
0 |
1 |
0 |
0 |
0 |
0 |
0 |
0 |
2 |
0 |
0 |
2 |
0 |
1 |
0 |
2 |
0 |
0 |
0 |
0 |
0 |
0 |
0 |
2 |
0 |
0 |
0 |
0 |
0 |
10 |
|
Clean Sky |
Brussels, BE |
CLEAN SKY JOINT UNDERTAKING |
0 |
2 |
0 |
0 |
0 |
0 |
0 |
0 |
1 |
0 |
0 |
0 |
0 |
0 |
0 |
2 |
0 |
0 |
0 |
0 |
0 |
0 |
0 |
1 |
0 |
0 |
0 |
0 |
0 |
6 |
|
ECSEL |
Brussels, BE |
ELECTRONIC COMPONENTS AND SYSTEMS JOINT UNDERTAKING |
0 |
7 |
0 |
0 |
0 |
0 |
0 |
0 |
2 |
0 |
3 |
3 |
0 |
0 |
0 |
0 |
0 |
0 |
0 |
0 |
0 |
1 |
0 |
0 |
0 |
0 |
0 |
0 |
0 |
16 |
|
EIT |
Budapest, HU |
EUROPEAN INSTITUTE OF INNOVATION AND TECHNOLOGY |
0 |
0 |
0 |
0 |
0 |
0 |
0 |
0 |
0 |
0 |
0 |
1 |
0 |
13 |
0 |
0 |
0 |
0 |
0 |
0 |
0 |
2 |
0 |
2 |
0 |
0 |
0 |
0 |
1 |
19 |
|
F4E |
Barcelona, ES |
EUROPEAN JOINT UNDERTAKING FOR ITER AND THE DEVELOPMENT OF FUSION ENERGY |
0 |
7 |
2 |
0 |
2 |
6 |
0 |
1 |
64 |
1 |
13 |
1 |
0 |
3 |
0 |
26 |
1 |
0 |
0 |
0 |
1 |
3 |
6 |
5 |
1 |
0 |
0 |
4 |
14 |
161 |
|
FCH2 |
Brussels, BE |
FUEL CELLS AND HYDROGEN JOINT 2 UNDERTAKING |
0 |
1 |
0 |
0 |
0 |
0 |
0 |
0 |
0 |
0 |
0 |
0 |
0 |
0 |
0 |
1 |
0 |
0 |
0 |
0 |
0 |
0 |
0 |
1 |
0 |
0 |
0 |
0 |
0 |
3 |
|
IMI2 |
Brussels, BE |
INNOVATIVE MEDICINES INITIATIVE JOINT 2 UNDERTAKING |
0 |
0 |
0 |
0 |
0 |
0 |
0 |
0 |
2 |
0 |
1 |
1 |
0 |
0 |
1 |
1 |
0 |
0 |
0 |
0 |
0 |
2 |
1 |
1 |
0 |
0 |
0 |
0 |
0 |
10 |
|
SESAR |
Brussels, BE |
SESAR JOINT UNDERTAKING |
0 |
0 |
0 |
1 |
0 |
0 |
0 |
0 |
0 |
0 |
1 |
0 |
0 |
0 |
0 |
1 |
0 |
0 |
0 |
0 |
0 |
0 |
0 |
1 |
0 |
0 |
0 |
0 |
0 |
4 |
|
S2R |
Brussels, BE |
SHIFT2RAIL |
0 |
2 |
0 |
0 |
0 |
0 |
0 |
0 |
2 |
0 |
3 |
1 |
0 |
1 |
1 |
1 |
1 |
0 |
0 |
0 |
0 |
1 |
1 |
0 |
0 |
0 |
0 |
0 |
1 |
15 |
|
|
|
Executive Agencies |
13 |
421 |
66 |
6 |
10 |
59 |
2 |
3 |
177 |
12 |
170 |
130 |
11 |
32 |
7 |
332 |
17 |
4 |
5 |
4 |
16 |
80 |
39 |
128 |
9 |
8 |
16 |
25 |
54 |
1856 |
|
CHAFEA |
Luxembourg, LU |
CONSUMERS, HEALTH, AGRICULTURE AND FOOD EXECUTIVE AGENCY |
1 |
7 |
1 |
0 |
1 |
3 |
0 |
0 |
5 |
0 |
6 |
1 |
1 |
0 |
0 |
9 |
1 |
0 |
0 |
0 |
0 |
5 |
2 |
4 |
0 |
1 |
0 |
0 |
2 |
50 |
|
EACEA |
Brussels, BE |
EDUCATION, AUDIOVISUAL AND CULTURE EXECUTIVE AGENCY |
3 |
102 |
6 |
0 |
1 |
15 |
0 |
0 |
18 |
4 |
36 |
17 |
0 |
8 |
3 |
58 |
3 |
2 |
1 |
1 |
2 |
7 |
9 |
9 |
1 |
1 |
4 |
6 |
19 |
336 |
|
ERCEA |
Brussels, BE |
EUROPEAN RESEARCH COUNCIL EXECUTIVE AGENCY |
3 |
94 |
14 |
1 |
0 |
9 |
1 |
2 |
32 |
0 |
35 |
25 |
2 |
10 |
2 |
53 |
2 |
0 |
0 |
0 |
4 |
12 |
8 |
36 |
0 |
2 |
3 |
2 |
9 |
361 |
|
EASME |
Brussels, BE |
EXECUTIVE AGENCY FOR SMALL AND MEDIUM-SIZED ENTERPRISES |
4 |
58 |
15 |
1 |
4 |
12 |
0 |
1 |
35 |
2 |
39 |
25 |
2 |
4 |
0 |
62 |
4 |
1 |
1 |
1 |
3 |
21 |
4 |
24 |
5 |
3 |
2 |
7 |
3 |
343 |
|
INEA |
Brussels, BE |
INNOVATION AND NETWORKS EXECUTIVE AGENCY |
1 |
31 |
7 |
3 |
2 |
8 |
1 |
0 |
29 |
2 |
14 |
14 |
4 |
0 |
0 |
34 |
4 |
0 |
0 |
2 |
2 |
18 |
6 |
17 |
1 |
0 |
3 |
5 |
4 |
212 |
|
REA |
Brussels, BE |
RESEARCH EXECUTIVE AGENCY |
1 |
129 |
23 |
1 |
2 |
12 |
0 |
0 |
58 |
4 |
40 |
48 |
2 |
10 |
2 |
116 |
3 |
1 |
3 |
0 |
5 |
17 |
10 |
38 |
2 |
1 |
4 |
5 |
17 |
554 |
|
|
|
|
31 |
492 |
141 |
10 |
43 |
140 |
17 |
17 |
496 |
59 |
315 |
282 |
28 |
109 |
26 |
603 |
53 |
4 |
20 |
14 |
60 |
295 |
126 |
263 |
48 |
33 |
42 |
85 |
143 |
3995 |
ANNEX I
List of Directorates-General, Services and Offices at the European Commission on 31/12/2018
1.AGRI: Agriculture and Rural Development
2.BUDG: Budget
3.CdP-OSP: Staff Committee - Representative Trade Unions and Staff Associations
4.CLIMA: Climate Action
5.CNECT: Communications Networks, Content and Technology
6.COMM: Communication
7.COMP: Competition
8.DEVCO: International Cooperation and Development
9.DGT: Translation
10.DIGIT: Informatics
11.EAC: Education, Youth, Sport and Culture
12.ECFIN: Economic and Financial Affairs
13.ECHO: European Civil Protection and Humanitarian Aid Operations (ECHO)
14.EMPL: Employment, Social Affairs and Inclusion
15.ENER: Energy
16.ENV: Environment
17.EPSC: European Political Strategy Centre
18.EPSO: European Personnel Selection Office
19.ESTAT: Eurostat
20.FISMA: Financial Stability, Financial Services and Capital Markets Union
21.FPI: Service for Foreign Policy Instruments
22.GROW: Internal Market, Industry, Entrepreneurship and SMEs
23.HOME: Migration and Home Affairs
24.HR: Human Resources and Security
25.IAS: Internal Audit Service
26.JRC: Joint Research Centre
27.JUST: Justice and Consumers
28.MARE: Maritime Affairs and Fisheries
29.MOVE: Mobility and Transport
30.NEAR: Neighbourhood and Enlargement Negotiations
31.OIB: Office for Infrastructure and Logistics in Brussels
32.OIL: Office for Infrastructure and Logistics in Luxembourg
33.OLAF: European Anti-Fraud Office
34.OP: Publications Office
35.PMO: Office for the Administration and Payment of Individual Entitlements
36.REGIO: Regional and Urban Policy
37.RTD: Research and Innovation
38.SANTE: Health and Food Safety
39.SCIC: Interpretation
40.SG: Secretariat-General
41.SJ: Legal Service
42.TAXUD: Taxation and Customs Union
43.TF50: Task Force for the Preparation and Conduct of the Negotiations with the United Kingdom under Article 50 TEU
44.TRADE: Trade
It is to be noted that the budgetary data (sent each year with the draft budget to the Budgetary Authority - Working Document, parts II and III) show contract staff numbers at the time when the draft budget is presented (including contract staff recruited using assigned revenue), i.e.: a statement of the position at 1 April of year N-1 (where N is the year of the draft budget), budgetary implementation in year N-2 and requests for appropriations with estimates of full-time equivalents (FTE) for year N. This is why some differences appear in the numbers for contract staff, depending on the data source. Since several budget lines include appropriations for external personnel without establishing a distinction between the different categories of that personnel, the budget figures convey the best possible estimates based on the likely average costs and the repartition between categories.