 EUROPEAN COMMISSION
Brussels, 15.7.2015
SWD(2015) 142 final
COMMISSION STAFF WORKING DOCUMENT
Investment perspectives in electricity markets
Accompanying the document
COMMUNICATION FROM THE COMMISSION TOT HE EUROPEAN PARLIAMENT, THE COUNCIL, THE EUROPEAN ECONOMIC AND SOCIAL COMMITTEE AND THE COMMITTEE OF THE REGIONS
Launching the public consultation process on a new energy market design
{COM(2015) 340 final}
COUNTRIES
AT
Austria
BE
Belgium
BG
Bulgaria
CY
Cyprus
CZ
Czech Republic
DE
Germany
DK
Denmark
EE
Estonia
EL
Greece
ES
Spain
FI
Finland
FR
France
HR
Croatia
HU
Hungary
IE
Ireland
IT
Italy
LT
Lithuania
LU
Luxembourg
LV
Latvia
MT
Malta
NL
Netherlands
NO
Norway
PL
Poland
PT
Portugal
RO
Romania
SE
Sweden
SI
Slovenia
SK
Slovakia
UK
United Kingdom
US
United States
UNITS
GWh
Gigawatt hour
kWh
Kilowatt hour
Mtoe
Million tonnes of oil equivalent
MWh
Megawatt-hour
tCO2
Tons of carbon dioxide emissions
TWh
Terawatt-hour
OTHERS
CAPEX
Capital Expenditure
ECM
Error correction model
EEX
European Energy Exchange
EIA
Energy Information Administration
ENTSO
European network of transmission system operator
ETS
Emissions trading scheme
EU
European Union
EUA
European Union allowances
EUR
Euro
FiT
Feed-in tariff
GDP
Gross Domestic product
GHG
Greenhouse gas
HHI
Herfindahl-Hirschman index
HICP
Harmonized index of consumer prices
IEA
International Energy Agency
LCOE
Levelised Cost of Electricity
LRMC
Long run marginal cost
MS
Member State
OCGT
Open-Cycle Gas Turbine
OECD
Organization for Economic Cooperation and Development
OPEX
Operating expenditure
RES
Renewable energy sources
VOLL
Value of Lost Load
Executive Summary
Part I:Investments in electricity markets: evolution and drivers
Introduction
1.Investments in electricity generation: recent trends
1.1.Investment trends in electricity generation
1.2.Public support
1.3.Price evolution: electricity, carbon and commodity prices
1.4.Concluding remarks
2.Investment in electricity: assessing the drivers in renewables and conventional technologies
2.1.public support and investment
2.2.Market driven Investments
2.3.Concluding remarks
Part II:Investment needs and price signal: perspectives
Introduction
1.Price signal in electricity markets and market framework in member States
1.1.Price signal to investors
1.2.Market Frameworks in Member States
1.3.Concluding remarks
2.The transition to low carbon economies and investment needs
2.1.The case for investments in electricity markets
2.2.The ongoing transformation of European electricity markets
2.3.Concluding remarks
Part III:Reconciling markets with investment signal: which market arrangements?
Introduction
1.The economics of the transition to low carbon economies
1.1.The economics of low carbon technologies
1.2.Investment criterion in low carbon technologies in a changing electricity system
1.3.Concluding remarks
2.Market arrangements through the energy transition
2.1.Current trends
2.2.Challenges for investments and options in power systems under decarbonisation (transition phase)
2.3.Challenges for investments and options under decarbonised power systems (decarbonised phase)
2.4.Concluding remarks
References
Glossary
Annexes
A.1.Investment drivers: variables description
A.2.Power price drivers methodology and data description
A2.1.Methdology
A2.2.Data description
A.3.The transition to low carbon technologies: impact on the merit order curve
A.4.Methodology to calculate the annualized capital expenditure
LIST OF Tables
I.2.1.Results of the electricity investments drivers
II.1.1.Electricity Regional Initiatives
II.1.2.Electricity market characteristics at Member State-level
II.2.1.Electricity cost structure
III.2.1.Dispersion* in the EU electricity sector: price and market support
A1.1.Investment model
A2.1.Panel unit root test results
A2.2.Pedroni and Kao residual co-integration test results
A2.3.Panel FMOLS and DOLS long-run estimates (in logs)
A2.4.Short run causality (Variables in first differences)
A2.5.Long run causality (Variables in levels)
A2.6.Data description – Power price drivers
LIST OF Graphs
I.1.1.Evolution of installed generation capacity
I.1.2.Installed generation capacity - EU28
I.1.3.Net change in installed generation capacity 2004-2008
I.1.4.Net change in installed generation capacity 2009-2013
I.1.5.Total support to the energy sector
I.1.6.Components of total support
I.1.7.Average domestic and industrial retail electricity price, wholesale price and crude oil price evolution 2007-2013
I.1.8.EU: retail price change and the contribution of the price components 2009-2013
I.1.9.Electricity wholesale price
I.1.10.Energy commodities and CO2 prices
I.2.1.Support per electricity produced
I.2.2.RES share and support evolution
I.2.3.Investment decision
II.1.1.A generic merit-order curve and the effect of increased low marginal cost technologies
II.1.2.Taxonomy of capacity mechanisms
II.2.1.Ranges for EU28 - Net Power Capacity Investment (in GWe - aggregate 2011-2030)
II.2.2.Annual Investment Expenditures in billion of euro - 2010 (2011-2030)
II.2.3.EU28 - Electricity consumption (in TWh) - Final electricity demand in TWh*
II.2.4.Levelised costs of fossil fuel and low carbon technologies
III.1.1.Generic merit order curve under no capacity constraints
III.1.2.Generic merit order curve under scarce capacity
III.1.3.Impact of demand response on the load duration curve
III.1.4.Short-run impact of demand response on the sudden changes of power outputs
III.1.5.Cost development of an entrant and an incumbent technology
III.1.6.Estimated mark-ups for low carbon technologies with Open gas Cycle Turbine as a marginal producer
III.2.1.Estimated mark-ups in EUR/tCO2 for low carbon technologies under a marginal price regime
III.2.2.Degree of harmonisation of national market intervention
III.2.3.Cost structure of the technology mix under conventional power system
III.2.4.Cost structure of the technology mix under the decarbonised phase
A3.1.Merit-order curves under the conventional phase (stage 1)
A3.2.Merit-order curves under the transition phase (stage 2) when technologies 0 are operating
A3.3.Merit-order curves under the transition phase (stage 2) when technologies 0 are not operating
A3.4.Merit-order curves under the decarbonised phases (stage 3)
LIST OF Boxes
I.1.1.Electricity Markets and Policy Context11
I.1.2.Electricity wholesale price drivers16
I.2.1.Investment drivers: relevant literature22
I.2.2.Methodology and data25
II.1.1.Wholesale electricity markets33
III.1.1.Price developments and market adjustment through the energy transition53
III.1.2.Quantifying the investment criterion59
III.2.1.Reforms in the Emission Trading Scheme67
III.2.2.Low carbon technologies and market designs: the experience in South and Central America71
The EU has confirmed its intention to decarbonise its economies
The decarbonisation of EU economies is at the core of the EU’s agenda for climate change and energy. The Climate and Energy Package adopted in late 2008 targets require the EU’s Member States to cut their greenhouse gas emissions by 20 %, to produce 20 % of their energy from renewable sources, and to reduce their gross primary energy consumption by 20 %. In 2009, this agenda was complemented by the aspirational goal of reducing greenhouse gas emissions by 80-95 % by 2050. These ambitions were reaffirmed in October 2014, when Member States agreed to set targets for 2030 of 40 % for domestic greenhouse gas emissions reduction, at least 27 % for the share of renewable energy and at least -27 % for energy consumption.
The substantial investment in low-carbon technologies that will be needed to achieve these goals will have to be supported by an economic and institutional framework capable of facilitating this transition. The power sector is likely to play a central role in the energy transition. First, it has been the main sector experiencing decarbonisation since the last decade and its challenges still remain high. Second, in the near future, the power sector is expected to support the economy in reducing its dependence on fossil fuels, notably in the transport and heating and cooling sectors. For this reason, the cost effective promotion of private and public investments in this sector will be crucial so that consumers can reap the benefits of this strategy. This report provides analysis of the key challenges for investments in the electricity generation sector and reviews how to improve the current market arrangements or to introduce possible new ones that that could improve the current and future investment framework.
Investment in new generation capacity is increasing…
Investment in the EU’s electricity generation sector has not been affected by the economic crisis and has even been accelerating since 2009. Between 2004 and 2012, capacity increased by 30 % in the EU, in comparison to just 10 % in the US. As a result the share of renewable energy in the EU’s electricity mix has continued to rise since 2008.
… in a context of increasing public support
As with investments in other sectors of the economy, investments in electricity generation are in general driven by market conditions. They can, however, benefit from various forms of public support, provided these are in line with EU state aid rules. Public support may have different objectives, such as security of supply, environmental concerns or social inclusion. With the increasing production of renewable electricity, the support to these new technologies rose to € 40 bn in 2012, financed mostly by end-user consumers through levies on retail electricity prices. As a result, retail prices have increased for households and, to a certain extent, industries.
… and a weakening investment price signal
By contrast, the opposite trend was observed on wholesale markets. Market prices for fossil fuels have decreased since oil prices peaked in 2008. Despite a rebound in 2009-2010, oil prices have been declining since 2011. Wholesale power prices have followed the same evolution, lowering the expected profits of investors. Moreover, due to the sharp decline in the price of CO2 emission allowances, the use of high carbon emitting power plants and the investment in them has only been discouraged to a certain extent. An empirical analysis of the drivers of wholesale electricity prices shows the importance of electricity demand, as the main determinant of prices. This confirms that the economic crisis, by lowering electricity demand, has played a major role in depressing wholesale electricity prices. However, the results also suggest that renewable energy production had a downward impact on wholesale prices as their market penetration has grown, which could be interpreted as an indication of structural changes on the market.
… wholesale electricity prices still matter for competitive technologies
The investment framework has also undergone considerable changes. On the one hand, investments in maturing, clean technologies have taken place thanks to public support, which reduced the capital and operating costs and the risks for investors. On the other hand, investment in conventional technologies has been influenced by fundamental factors that matter for investors. The report includes an empirical analysis of investment drivers in conventional technologies. The results confirm the importance of the price signal as a trigger for investments in mature energy technologies, but also points to the influence of macroeconomic factors such as interest rates, competition and a favourable business environment.
Today, in wholesale electricity markets, power prices are set by the bid of the marginal unit. This is achieved mostly within day-ahead markets as currently other markets such as intra-day markets are not sufficiently developed. Under the assumption of perfect competition, bids represent the marginal costs of the plant to supply energy. But the role of the market price signal varies across market frameworks. In energy-only markets, the stability of the system in terms of new investments in capacity is achieved through price signals. When electricity demand is higher, prices increase to signal scarcity. This increases the profits of generators and gives them the incentive to invest. In other market frameworks, the energy market can be complemented by a capacity mechanism. In such markets, generators get revenues from electricity trading (energy market), but also get remunerated for their available capacity in the market.
… but the rising penetration of low-carbon technologies is changing investment conditions
The rising penetration of low-carbon technologies represents a challenge for the electricity sector under the current market arrangements. As their share of production increases, electricity markets will increasingly be dominated by units with low operating costs but high initial capital costs. The risk is that under current market arrangements and without further integrating existing markets, wholesale market price may prove too low to trigger the necessary investments in generation capacity. In such a situation, it needs to be evaluated if generators would require some additional forms of remuneration, which would have to be borne by consumers or tax payers and would need to stand in proportion to the benefits provided.
According to Commission estimates, the power sector will require up to EUR 90 billion of investment a year until 2030, of which EUR 50 billion are needed in energy generation and EUR 40 billion are needed in power grids. The high investments needs and the changing investment environment call for a reflection on the effectiveness of current market arrangements to drive investments.
The transition to a low-carbon economy impacts both capacity and prices
This report contributes to the current debate on market design by discussing the consequences of decarbonisation in a competitive market environment and by providing an analytical framework to understand the transition to a low-carbon economy. The analysis aims to describe the consequences of decarbonisation on the investment environment under current market arrangements. On this basis, the analysis identifies possible challenges that the EU could face during and after its transition to a low-carbon economy. Today, the transition is still ongoing, but markets will soon face a larger share of low carbon technologies. Investments in electricity generation are long-term by nature and investors need to assess their future profitability before deciding to invest today. The challenges of the transition phase will differ during its different stages of completion and therefore need to be well understood in order to be successfully addressed.
Under current market arrangements, the rising penetration of low-carbon technologies is likely to put pressure on wholesale market revenues during the transition phase. This may make it difficult to achieve the necessary levels of investment, and non-competitive low carbon technologies may still require some form of support. At the same time, the market is likely to face overcapacity, which will need to be addressed in order to reduce the costs of the transition. Once decarbonisation has be achieved, the issue of market revenues may become even more salient, as the cost structure of the technology mix based on low variable costs and high fixed costs could challenge the ability of market prices, formed today mostly on day-ahead markets, to allow investor to recoup their costs. As a result there could be a risk that investors may not be able recoup their investments under the current forms of market arrangements (especially in view of the existence of price caps, market fragmentation and imperfect competition).
… as a result, market arrangements may need to evolve
The report explores further possible avenues to tackle the investment challenges identified in the analysis and brought about by the transition. The central objective of any market arrangement should be to minimise public support in order to make the penetration of low-carbon technologies cost effective for end-consumers and society at large. Therefore, the report reviews how the existing market arrangements can be improved and which ones could be deployed for the transition phase. The aim of such arrangements would be to deepen market integration, make effective use of the carbon price signal, ensure the phasing out of high CO2 emitting technologies in the short run and reinforce the spot price signal.
In the long run, the challenge will be to put in place market arrangements that provide sufficient revenues for investments to take place without any form of State intervention. Given the investment challenges that successful decarbonisation may create, there is a need to start reflecting on the most suitable market arrangements for the transition phase and on the type of market arrangements that Europe will need once it has reached its decarbonisation goals.
This part describes the changing pattern of electricity investments over the past decade. EU electricity markets have been reshaped by regulatory reforms starting in the 1990s, and by the decarbonisation agenda and the adoption of targets to reduce greenhouse gas emissions and increase the share of renewables in energy consumption.
Chapter one describes the recent evolutions of investments in electricity markets. Investment in electricity generation in the EU has been steadily increasing over the last fifteen years. This trend has been driven by the energy and climate change policy agenda and has led to a significant increase in the proportion of electricity generated from renewables. Such an evolution would not have been possible without any forms of public support at production, demand or investment level. The last section highlights the divergent path of retail and wholesale electricity prices. Retail prices for both households and industries have risen largely. Wholesale prices, by contrast, have fallen in recent years due to a number of factors including lower commodity prices, the economic slowdown and higher production from renewables.
Chapter two discusses and analyses the investment drivers in electricity markets. First the analysis focuses on renewable technologies as investments in these new technologies were mostly driven by the policy agenda and the resulting public support. By contrast, investments in conventional technologies were mostly driven by macro-economic and energy specific factors. The econometric analysis carried out in this chapter shows that the price signal matters for these mature technologies along with other economy-wide factors such as demand, competition and financial conditions.
The electricity generation sector is experiencing a transformation driven by the EU policy climate and energy agenda. Generation technologies are changing in response to climate change policy as well as to security of supply concerns. At the same time, the reform of the sector through market opening is putting competitive pressure on utilities to improve the efficiency of their operations.
This chapter focuses on the electricity sector and describes the recent evolution of investment in electricity markets. Section 1 analyses the evolution of installed capacity over the period 2004 – 2013 in the Member States. Section 2 describes the increase in public support to electricity over the period. Section 3 looks at the electricity price evolution in relation to coal, oil and CO2 prices. Section 4 concludes.
1.1.Investment trends in electricity generation
Investments in power generation in the EU have continued to expand over the last 15 years. The evolution of capacity in the EU followed a steady increasing trend. Compared to the US, where the increasing trend was interrupted by a break between 1998 and 2000, growth of capacity in the EU followed a more stable and faster increasing trend, which accelerated starting in 2009 (Graph I.1.1).
|
Graph I.1.1:Evolution of installed generation capacity
|
|

|
|
Source: OECD and Eurostat
|
Generation capacity in the EU increased sharply from 2009 onwards due to the addition of new renewables technologies on the already existing capacity. The composition of the capacity mix progressively changed: nuclear capacity started declining in recent years (2010-2013) due to phasing out decisions in some Member States. Conventional capacity showed a decline in 2012-2013 (Graph I.1.2).
|
Graph I.1.2:Installed generation capacity - EU28
|
|

|
|
Source: Eurostat
|
Investment in electricity generation capacity in the post-crisis period was of greater magnitude than pre-crisis. During the period 2004-2008, generation capacity modestly increased in some Member States (Graph I.1.3). For example, 25 GW were added in Spain and 17 GW in Germany. Between 2008 and 2012, instead, a period which coincided with the development of renewables, capacity additions were much more significant, with 35 GW of additional capacity in Spain and 51 GW in Germany. The same evolution can be observed in other Member States, like Italy, Portugal, Greece, Romania, the United-Kingdom, France, Netherlands, Czech Republic, Poland, Sweden, and Denmark. This phenomenon was mainly driven by the increase in renewable installed capacity, accompanied by a more modest increase of conventional technologies.
At the same time, Member States are not following the same investment trends. Between 2009 and 2013, a majority of Member States (Germany, Italy, France, Romania, Spain, Greece, the United Kingdom, Belgium, Austria, Poland, Czech Republic, Bulgaria, Portugal, Slovakia and Ireland) increased their overall generation capacity, while for the rest there was little change in generation capacity and for some even a decrease (notably Sweden)(). With respect to investment in low carbon technologies, in Germany, Italy, France, Romania, Spain and the United Kingdom, renewable capacity increased quite substantially, whereas in the Netherlands additions in conventional capacity were larger than in renewables. France stands out as a country where conventional capacity decreased in the period 2004-2008 whereas there were additions in conventional generation in 2009-2013. In Germany, instead, where renewables increased significantly during 2009-2013, additional conventional capacity was built also due to the phasing-out of nuclear power plants (Graph I.1.4).
|
Graph I.1.3:Net change in installed generation capacity 2004-2008
|
|

|
|
Source: Eurostat, Energy Statistics
|
|
Graph I.1.4:Net change in installed generation capacity 2009-2013
|
|

|
|
Source: Eurostat, Energy Statistics
|
1.2.Public support
The expansion of capacity of the period 2008-2012 was accompanied by policy efforts, in the form of increased public support to the sector. Public support is a type of state intervention, which can take the form of direct transfer of funds, targeted tax allowances and exemptions, investment tax deductions, loan guarantees, price support, price caps, and price guarantees. Arguably, public support to energy has always been used to reach some policy objectives such as energy independence, social inclusion, environmental goals, or competitiveness exposure of energy intensive industries. More recently, the development of the new low carbon technologies and the need to secure a new investment path has triggered new forms of support to deployment.
The total amount of public support to the electricity sector increased over the period 2008-2012 from EUR36 to EUR63 billion (). Public support increased both for fossil fuel and renewable technologies, even though the latter accounted for most of the increment: support to renewables grew by 93% compared to 39% for fossil fuels (Graph I.1.5).
|
Graph I.1.5:Total support to the energy sector
|
|

|
|
Source: Own calculations based on ECOFYS, 2014
|
Support to production constitutes the main share of total support (around 45%). It includes, among others, exemptions from fuel taxes, feed-in tariffs and premia, tradable certificates for renewable energy quotas, and support to decommissioning. The increase in support to production can be explained by the increase of renewable technologies in the fuel mix. This new renewable capacity was mainly installed with the support of feed-in schemes. In the majority of Member States, most of this support has been financed by consumers through levies or surcharges, while in a few cases it has been financed through general taxation ().
Support to energy demand accounts for 30% of total support. It is granted to the demand side rather than to generators and is mainly constituted by energy and VAT tax exemptions, price guarantees (in the form of social tariffs for electricity set below a reference price or the provision of fossil fuel below costs as inputs to electricity generation), and interruptible load schemes, by which payments are provided to electricity consumers that agree to be switched off remotely where the system requires it.
In comparison, the other forms of support were smaller. Support to investment follows support to demand with a share of approximately 14%; support to energy savings has a share of 8%. Support to R&D was very low compared to the support granted to all other sectors (support to production, to investment, to energy saving and to energy demand) up until 2012, when it hit 6% of the total ().
|
Graph I.1.6:Components of total support
|
|

|
|
Source: ECOFYS, 2014
|
1.3.Price evolution: electricity, carbon and commodity prices
Trends in electricity should be interpreted in the wider context of the macro economic framework in the energy sector, which have an impact both in the retail and wholesale market.
|
|
|
|
|

|
|
|
|
(Continued on the next page)
|
|
Box (continued)
|
|
|
|

|
|
|
|
(Continued on the next page)
|
|
Box (continued)
|
|
|
|

|
|
|
|
|
1.3.1.Electricity retail price evolution
In the recent period, electricity retail prices have experienced an increase () compared to wholesale prices. This divergence is the result of the increase of renewable capacity and of public support, which has been mostly financed by consumers through levies on electricity retail prices. The increasing trend can be observed for both household and industry retail price throughout the whole EU, even though there are considerable differences in the price level between the two types of consumers across groups of Member States.
In countries with regulated retail prices, the retail tariffs are higher than in countries without regulated prices. Whereas the two groups of countries showed different levels of retail prices already in 2007, through 2012 the increase in countries with regulated prices was higher than in countries without regulated prices(). In addition, the gap between the household and industry retail price level is higher for the former than for the latter.
|
Graph I.1.7:Average domestic and industrial retail electricity price, wholesale price and crude oil price evolution 2007-2013
|
|

|
|
Source: Eurostat
|
Taxes and levies () have been the main contributor to retail price increase for households and industrial consumers. Indeed, the increase of the taxes and levies component has been particularly pronounced and on average it contributed by more than 2% to the annual increases of retail prices in the 2009-2013 period (). During the same period, a similar trend, but relatively lower, was observed for the network component. For both categories of consumers, the average annual contribution of this component to the retail prices increases was around 0.6%. In contrast, the contribution of the energy component to the retail price evolution, presented a diverging pattern between the two consumer categories for the period. In particular, the energy component put downward pressure on retail prices for households in first two years of the analysis, which then shifted to upward pressure. For industrial consumers, in contrast, it contributed to lowering retail price increases throughout the period. On average, this component decreased annually by 1.1% for industrial consumers, while for households it increased by 0.9%.
|
Graph I.1.8:EU: retail price change and the contribution of the price components 2009-2013
|
|

|
|
Source: Eurostat and own calculations
|
1.3.2. Wholesale electricity and energy commodity prices evolution
Electricity wholesale prices have been declining after 2011. After the price spike in 2008, due to the influence of oil prices, wholesale electricity price on the German market (EEX) experienced a drop of 10% between 2009 and 2014. On the French market (Powernext) and the Nordic market (Nord Pool), prices decreased by 5% and 15% respectively, in the same period. The drop in wholesale prices is the result of many different factors, among which the evolution of energy commodity prices such as coal, gas and oil prices. They are, among other things, drivers of wholesale prices because they are the inputs for most of the conventional electricity production (see box I.1.2).
|
Graph I.1.9:Electricity wholesale price
|
|

|
|
Source: Bloomberg, Platts
|
Coal, gas and oil prices followed similar decreasing paths starting from 2011. After a rebound in 2010, oil price started to decline from 2011, and experienced a sharp drop in 2014-2015. Gas and coal follow a trajectory which is similar in shape, even though the peak point for coal is 2011 while for gas it is 2013. In the period 2011-2015, gas prices dropped by 10%, while coal by 17% (Graph I.1.10).
By contrast, since 2009 the carbon price has decreased sharply. Carbon price plays a role on the wholesale electricity market in that it adjusts the relative costs of conventional and low carbon technologies and may incentivise investment in the latter. CO2 price followed a rapid and overall decreasing path: between 2008 and 2015, it dropped by 68% from 22.3EUR/tCO2 to 7.0EUR/tCO2. Such low levels have very little if not negligible effects on the relative costs of technologies and therefore can be assumed to have had a limited effect on short-term production choices. Fuel switching decisions for existing plants are mainly influenced by the relative costs of energy inputs (gas and coal). In the longer term, though, CO2 pricing is expected to play a strong role in the investment decision (see Box III.2.1).
|
Graph I.1.10:Energy commodities and CO2 prices
|
|

|
|
Source: Bloomberg, Platts
|
Other important factors contributing to lower wholesale prices are weak demand for electricity due to the economic crisis and the increasing renewable generation share. Investments in renewable generation, mostly driven by public support, and made in a situation of lower demand, contributed to lowering prices on the wholesale market. An econometric analysis of the drivers of wholesale prices confirms the upward impact of demand and commodity prices on prices, while an increasing share of renewable tend to lower prices (see box I.2.2).
|
|
|
|
|

|
|
|
|
(Continued on the next page)
|
|
Box (continued)
|
|
|
|

|
|
|
|
|
1.4.Concluding remarks
Investment in electricity generation has been resilient to the crisis but its composition has changed. The expansion of renewable sources was much more pronounced than for conventional ones, a development which became more evident after 2009.
Public support has increased both for fossil fuel and renewable technologies, even though renewables accounted for most of the increment. Its composition across types of support remained relatively stable, with the major share going to support for electricity production, followed by support to demand, to investment, and to energy efficiency.
While electricity retail prices have risen in the recent period, wholesale price have decreased. The main factor contributing to rising retail prices are taxes and levies, but network costs have also increased. Rising levies reflect, among other things, the need for financing support schemes to renewable production. Wholesale prices have, in contrast, fallen due to lower demand for electricity as well as lower prices on fossil fuels and carbon. The increasing share of renewable generation in a situation of lower demand has also contributed to lower prices.
Electricity is a sector in which investments are determined by macroeconomic conditions, but are also highly influenced by policies. Investments respond to macroeconomic conditions: general economic growth, demand evolution and financial conditions determine the general economic environment in which investment decisions are taken. Investments in the electricity sector are subject to a group of energy- specific factors which influence the decision to invest and the magnitude of the investment: the generation mix of the country, the wholesale prices, () as well as indicators about the supply side of the market such as the reserve margin and the capacity factor of the electricity system. In addition to this, policies can have a sizeable impact on investment decisions for example when they support some technology groups in order to achieve specific objectives.
This chapter explores both sets of investment drivers. Section 1 describes the different forms of support granted to renewable technologies and compares them to what is received by conventional ones. Section 2 develops an econometric model to understand the drivers of investment in conventional technologies. Section 3 concludes.
2.1.public support and investment
Public support for renewables has been justified by the need to promote low carbon technologies at early stages of development. These technologies would otherwise not be able to compete on the market due to higher costs. New renewable electricity production in Europe has been deployed mainly thanks to subsidies and priority of dispatch. Most renewable technologies remain too expensive and uncompetitive in relation to the market prices of today, even though certain are gradually becoming more mature: according to the IEA (), increased investment in research, development and demonstration (RD&D) in emerging technologies, particularly ocean and enhanced geothermal, is needed to enhance competitiveness.
For this reason, renewable technologies have received the highest level of support per MWh. In the EU28, the average support per MWh for the 2008-2012 period was around 64 EUR/MWh, starting at 54 EUR/MWh in 2008 reaching 62 EUR/MWh in 2012 () with a peak of 70 EUR/MWh in 2010. The support level increased by 27% between 2008 and 2010, reflecting the implementation of the EU renewable energy policy as agreed in 2009 (Graph I.2.1). By contrast, support to conventional technologies has been much more limited, which can be explained by their level of maturity. Public support to these technologies has slightly increased between 2008 and 2012 ().
In most Member States, support schemes and instruments have limited the risk exposure of producers, hence of investors. In 2012, seventeen Member States applied feed-in tariffs. This is an instrument which drastically reduces the risk for the producer as it provides a fixed remuneration for the renewable electricity produced. Feed-in-tariffs have proved to be very effective in promoting renewable electricity deployment, but this type of support also runs the risk of being very costly. Feed-in-premiums is another variant, which is a more market-based instrument that was used by nine Member States in 2012. It provides a premium in addition to the wholesale electricity price so that the producer is at least partly exposed to the price risk. Quota obligation systems were used in eight Member States. This implies the creation of a market for green certificates, which provides the generators with an additional remuneration source on top of the price received for the electricity produced from renewable sources. Here, the producer is exposed to both the electricity and the certificate price risk. Finally, both investment grants and fiscal incentives were used by ten Member States respectively in 2012.
|
Graph I.2.1:Support per electricity produced
|
|

|
|
Source: Own calculations based on Eurostat, Energy Statistics and ECOFYS 2014
|
Support given to renewables decreased from 2010, due to the slowdown in economic activity caused by the economic crisis but also due to reforms of support systems aimed at reducing their costs. The crisis has reduced demand and deteriorated the general investment climate. The high cost of the renewable support system induced Member States to undertake reforms to make them more cost-efficient. This development was underpinned by the economic crisis, which forced Member States to enact reforms aiming to improve the efficiency of spending. The rising cost of support to renewables has been one contributing factor behind the emergence of tariff deficits in several EU Member States (). A tariff deficit can be defined as a shortfall of revenues in the electricity system, which arises when the tariffs for the regulated component of the retail electricity price is set below the corresponding costs borne by the energy companies. Costs related to the support to renewables have been contributing to the tariff deficits in Spain, Portugal, France and Greece, and for temporary imbalances in the system in Germany and Italy. All these countries have undertaken reforms since 2012 to reduce and contain these costs and make them more market-oriented (). In some cases (i.e. Spain, Portugal, Greece etc.) these reforms were imposed retroactively, which impacted the remuneration of past investments.
Reforms to support schemes have not yet translated into a slowdown of investment in renewables, (expressed as share in total capacity) according to current data.. The share of renewables in the EU has been on an increasing trend since 2008, whereas production support started its decrease in 2010. This apparently counter-intuitive fact can be explained by considering that, despite having been revised, support schemes appear to be still enough to sustain investment, probably thanks to the reduction in their costs through learning. An additional aspect is that investment responds with a lag to the change in support schemes, hence the effect the reduced support is not visible in 2012 data. Finally, it is important to stress that, whereas the data presented are European averages, the specific situation in Member States might differ substantially.
|
Graph I.2.2:RES share and support evolution
|
|

|
|
Source: Eurostat and ECOFYS 2014
|
2.2.Market driven Investments
While renewables were developed heavily relying on public support, conventional () generation was affected by energy policy through the induced changing market conditions. EU policies are affecting the shape of the electricity market in different ways. Market liberalization introduced competition in the generation segment of the value chain; renewable obligations are reducing the residual demand that conventional technologies face; the EU emission trading scheme (ETS) is increasing the costs of production of conventional technologies in line with their carbon intensity.
2.2.1.The investment framework for conventional technologies
The factors that determine the investment decision in the power sector can be grouped into three main categories, i.e. macro-economic, competition and energy-specific. In order to understand their role, it is useful to provide a discussion of the assumptions to their contribution, which will be used to construct a model to analyse market driven investment in the recent past.
Macroeconomic conditions influence the decision to invest in electricity generation. They refer to economy-wide factors that influence the financial risk arising from the financing of investment as well as the policy objectives and institutional factors under the control of policy-makers (IEA, 2003). As such, the business environment, the cost of capital and access to finance are likely to impact the profitability of projects and ultimately the decision to invest. Moreover, given the role of electricity in the economy, economic growth is an important driver of electricity investments as it stimulates electricity consumption, hence the need to build additional generation capacity ().
Another important factor which influences the attractiveness of the market is the competition intensity and potential barriers to entry. By nature, the electricity sector displays high sunk costs and needs large capital investments, which may provide an advantage to incumbents. In general, electricity markets are concentrated, which is a consequence of the characteristics of the sector, but may also give the opportunity to adopt a strategic behaviour to limit new entries in the market (e.g. excess capacity and pricing strategies).
Finally energy-specific conditions are likely to attract investors if profit prospects are high and uncertainty is low (). Energy-specific conditions refer to those factors characterising the electricity system such as the wholesale price, () the reserve margin, the capacity factor and the generation mix. But they also include the economic conditions under which generators operate, i.e. the remuneration of their capacity or the price signal. Finally, the policy framework and the extent to which clean technologies are supported, influence the decision to invest in conventional technologies.
Graph I.2.3 summarises the main factors () influencing the investment decision in electricity markets.
|
Graph I.2.3:Investment decision
|
|

|
|
Source: European Commission
|
2.2.2.Hypotheses
The following macroeconomic factors are assumed to play a role in investment decision:
Macroeconomic factors
Higher electricity demand leads to higher investment in power generation
Economic growth is normally accompanied by higher investments. () In electricity markets, demand is strongly correlated with economic growth, mainly because increased business activity implies higher electricity consumption (). Hence it can be seen as a sign of an expanding market that businesses will want to exploit by increasing their investments in installed capacity. This indicates that demand is positively correlated with investment. In the future electricity demand is expected to be decoupled from economic growth, as a result of energy efficiency policies, so far it appears that it parallels economic growth.
Investments are negatively associated with interest rates
Power plants are capital-intensive investments, for which the cost of financing plays a substantial part. Interest rates are used in the economic literature as an indication of the cost of capital: it is expected that higher interest rates have a negative effect on investments as they make investments more expensive.
A stable and transparent policy environment reduces investment risk and contributes positively to new investments
Quality of regulation is an important factor in determining the investment environment. Good regulation that removes barriers to entry generally induces new entry and investment. Better regulation also induces investments when it is able to reduce the level of economic rents in a specific sector (see Box I.2.2). Because of the long time horizon, economies of scale and scope and the regulatory and political risks, investment will be especially sensitive to a country's institutional environment. It is expected that the better the policy environment in terms of commitment and transparency, the better the business environment and the more attractive the investment.
|
|
|
|
|

|
|
|
|
(Continued on the next page)
|
|
Box (continued)
|
|
|
|

|
|
|
|
|
Competition and Energy-specific factors
The following competition and energy-specific factors are analysed:
Electricity wholesale price as a signalling device for investment
In a market, where the only commodity is energy (energy-only market) and there is no extra trade in capacity or other products, the primary income source for recovery of capital costs is the infra-marginal rent generated by the difference between the clearing price and the generators' marginal costs. According to the theory of spot pricing, the optimal capacity stock is such that the price resulting from scarcity is high enough to repay the capital costs of the marginal generators when demand exceeds supply (). Therefore, when prices are high, the system signals the need for new investment; hence, it is expected that higher prices are positively correlated with investment.
Highly concentrated markets create significant barriers to entry that may impede new investment or expansion in electricity generation
Concentrated markets are likely to suffer from abuse of market dominance, by which the incumbent firms enjoy the ability to unilaterally raise prices by providing a less-than-optimal capacity. It is therefore expected that the market concentration, as captured by HHI, CR3, etc. indexes, has a negative impact on investments.
Overcapacity reduces the motive for new investments
The reserve margin indicator is defined as the ratio between total available generation and the maximum level of electricity demand, at the time at which that demand occurs (). It can be interpreted as an indicator of overcapacity in the sense that a high value implies that there is a large amount of available generation to meet peak demand. On the other hand, if the indicator is low, it means that available capacity is small compared to maximum demand. Hence, it is expected that incentives to invest in market-oriented power plants are higher the lower the reserve margin.
Penetration of renewable technologies induce lower incentives for new investments in conventional power plants
Renewable penetration reduces the residual demand for conventional generation, therefore reducing the size of the market they can bid on. Penetration of renewable was incentivised by support schemes, which are assumed to make investment in such technologies more attractive to investors (for example, because of more stable and higher returns) and hence to divert resources from conventional to low-carbon investment. It is expected that a higher renewable share decreases the scope for investment in conventional technologies because they increase their risk profile. In fact, the presence of renewables makes the revenue stream for conventional power plants very uncertain, whereas in their absence, conventional power plants will be operating a more predictable number of hours over the year.
Additional revenues from capacity mechanisms increase the incentives for new investments
In energy only markets price caps may not allow power producers to receive the full amount of scarcity rents and to be able to recoup the fixed cost of their investment. The presence of capacity mechanisms, which act as complementary source of revenues, helps to mitigate price uncertainty and volatility caused by weather conditions and intermittent generation by providing additional sources of revenues to producers than the energy only market (). Capacity mechanisms can be seen as a factor that competes with spot prices for the role as a signal for investment needs; this is because if all the capacity is procured though capacity mechanisms, scarcity prices that reflect a structural lack of capacity will never appear on the spot market. For this reason, the analysis includes a dummy variable for the presence of capacity mechanisms to capture the effect on investment.
|
|
|
|
|

|
|
|
|
(Continued on the next page)
|
|
Box (continued)
|
|
|
|

|
|
|
|
|
2.2.3.Results
Table I.2.1 presents the estimation results of four distinct Tobit models based on the EU-28 Member States for the period 2005-2012. The difference between the four specification models is the choice of the variables included in the analysis. The consistency of the coefficients in terms of statistical significance and their size between the various specifications, indicate that the results are robust (). In addition, in order to reflect the time effect on investment, the model includes lags. ()
Electricity wholesale prices are a key driver of investment in power generation. The positive and statistically significant sign of the electricity wholesale price changes indicates that the observation of increasing prices stimulates investment in the near future. This finding confirms that investors in power plants react to high prices as a signal for higher expected returns, compared to other investment opportunities.
Increasing demand for electricity creates the need for new generating capacity. What matters for new investment in power generation is the growth in electricity demand in the course of time, rather than its level in comparison to other countries. Under an increasing demand pattern, investors are faced with less uncertainty on load factors for their plants, when and how often they will run, and the prices that could be achieved when they do run, as higher demand is associated with higher wholesale prices. Thus, it increases the expectations for higher profitability of the investment as the anticipation for the growth of the electricity demand is optimistic.
The cost of financing is of considerable importance to investments in power plants. As expected, the statistical significance and the negative sign of the coefficient of the interest rates imply that a rise in interest rates has a sizable negative effect on capital expenditures in power plants. In particular, the market interest rate is considered to be a key building block in the firm’s user cost of capital, which, combined with the resulting stream of expected cash flows, constitute the primary determinants of whether and how much to invest.
Tight reserve margins trigger investment in power plants. The negative correlation between the reserve margin and the new additions in electricity installed capacity implies that, under conditions of high reserve margins investments are not attractive. The reason is that a high reserve margin is an indication of excess capacity, which means that the probability for a new investment to recover its capital plus a fair return on the assets is relatively limited.
Competitive markets reflect a good business environment and create incentives for investment in power generation. A competitive environment provides a steady and reliable business environment for new investments in electricity markets. The coefficient of the accumulated shares of the three larger electricity producers that was used as proxy of the degree of competition indicates that new additions in installed capacity are negatively correlated with concentrated market structures.
However, in order for competition to deliver its anticipated benefits, the market also requires governments to commit to policy and regulatory authorities to ensure transparency and optimal monitoring of the functioning of the electricity markets. Although in all specifications the proxy that was used in order to capture the quality of regulation had the expected sign, it was not statistically significant. ()
|
|
|
Table I.2.1:Results of the electricity investments drivers
|
|

|
|
Source: Commission Services
|
|
|
Higher penetration of renewables in total installed capacity is associated with lower investments in conventional generation technologies. The negative and statistically significant coefficient of the share of renewables in the total installed capacity implies that renewables replace over the years larger and larger part of the electricity supply curve.
The coefficient of the dummy variable for the presence of capacity markets was statistically insignificant though it presented the expected sign, The insignificance of this coefficient may be explained by the fact that most of the capacity mechanism incentives were introduced mainly over the recent years. This implies that other factors played a crucial role in the period of the analysis.
2.3.Concluding remarks
Investment in renewables was driven by public support, which was much higher than the support granted to nuclear and fossil fuels. Public support started decreasing in 2010 as a response to fiscal consolidation and to the increasingly heavy burden on public finances.
Market fundamentals were important drivers of investments in conventional technologies, mainly represented by the wholesale electricity price, financial conditions, demand and the level of competition on the market. The relevance of wholesale price for investment signals the remuneration investors can expect from the market. Similarly, the impact of financial conditions and demand captures the effects of the economic slowdown brought about by the recent economic crisis. Finally, the level of competition on the market explains the influence of the market structure.
In the future, in a world of competitive electricity technologies, the price signal as well as the macro-economic framework will matter for investors, hence the importance of market functioning and price formation.
Both the macro-economic framework and the energy market design play an important role in driving investments in electricity generation. This part looks at price formation in electricity wholesale markets and presents the main characteristics of the sector. It also assesses the challenges posed by the increasing penetration of low carbon technologies.
Chapter one describes the marginal pricing principle of wholesale electricity markets and discusses the different types of market design to keep the system reliable, i.e. energy-only market or capacity mechanism. It also presents the different market frameworks in place in Member States. Efforts to integrate energy markets in the EU are relatively recent but are showing signs of progress. Still the design of electricity markets varies considerably across the EU.
Chapter two discusses the investment needs to meet the decarbonisation policy agenda. Substantial investment will be required in the electricity sector both because of the sector's own need to reduce emissions, but also because demand is expected to rise from other sectors of the economy seeking to lower their emissions. The chapter also analyses the ongoing transformation of electricity markets induced by low carbon technologies. It discusses how the ongoing transformation contributes to changing the framework for investors, which points to the need to have the right market framework.
Prices are a key drivers of investment decisions as they influence potential remuneration to investors. In well-functioning competitive markets, high prices are expected to signal the need for additional investment. For investors, it is important that prices are above the long run marginal costs so that producers can recover their fixed costs.
This chapter describes the main characteristics of electricity markets. Section 1 focuses on the price formation mechanism in today's electricity markets. Section 2 looks at market features in Member States. Section 3 concludes.
1.1.Price signal to investors
1.1.1.Remuneration in the electricity market
Expected remuneration is the key signal for investment because it represents the profitability of the undertaking. For electricity producers, remuneration can come from different sources, which also differ according to the market design (section 1.1.2). Generators can be remunerated for the energy they deliver from bilateral contracts and/or from the wholesale market; they can be remunerated from balancing services they provide; or, if such markets exist, they can get remuneration for the availability of production capacity that they offer (refer to Box II.1.1 for a more detailed description). All such products contribute to the final remuneration of generators.
The spot price on the wholesale market is used as a reference price for all other markets where energy is traded, forward markets or bilateral agreements. In a market which is not distorted by external interventions, the variability of the spot price plays a role in signalling the need of investment in new resources. Where interventions are in place which protect some technologies from exposure to prices (for example remuneration from pre-determined schemes rather than from the market price), distortions might appear that weaken the price signal.
In general, the spot price on the wholesale market corresponds to the price set on the day-ahead market. Generators bid on the day-ahead market and then refine their positions during intraday trade. Both markets are linked and participants get revenues from both intraday and day-ahead markets (see box II.1.1).
1.1.2.Marginal cost pricing
Electricity prices on the spot market are based on the bid of the marginal unit (). The typical electricity supply curve is a piecewise linear function. Each step represents a type of generation source, with the quantity of electricity that can be supplied at the quoted price. Cheaper generation is dispatched first in the market, so that the supply function is upward sloping: demand is first met with lower cost energy, and higher cost generation is called in progressively with increased quantity. The equilibrium price (the 'spot price') is the price of the marginal generation source needed to meet demand. Simplifying, it can be said that this is the price that all generators receive. The supply curve obtained by aggregation of the different bids is also known as merit-order curve. All bids below the clearing price are in the merit whereas all bids above the clearing price are out of merit.
.
|
|
|
|
|

|
|
|
|
(Continued on the next page)
|
|
Box (continued)
|
|
|
|

|
|
|
|
(Continued on the next page)
|
|
Box (continued)
|
|
|
|

|
|
|
|
|
Graph II.1.1 shows a generic merit-order curve with six generation technologies: renewables, nuclear, lignite, hard coal, natural gas and oil. They are ordered left to right on the basis of their marginal costs from the cheapest to the most expensive. Demand intersects the merit-order curve at a point in the supply served by hard coal plants. The price is set by the bid of the last hard coal plant in the merit. This means that all other generation units with lower bids earn an infra-marginal rent equal to the difference between their bid and the bid of the hard coal plant (that is the spot price). Under the assumption of perfect competition in the market, bids represent the marginal costs of the plant to supply energy.
|
Graph II.1.1:A generic merit-order curve and the effect of increased low marginal cost technologies
|
|

|
|
Source: AGORA Energiewende
|
With such a mechanism, a well-functioning and competitive power market produces electricity at the lowest cost for each hour of the day. The equilibrium price reflects both: (i) the cost of producing one kWh of electricity from the most expensive source needed to meet the demand; and (ii) the price that consumers are willing to pay for the final kWh required to meet the demand.
1.1.3.Economic approach to the equilibrium of the electricity system
The characteristics of electricity production make the reality of electricity markets complex. First, storability of electricity is currently limited, which means that the electricity produced is consumed instantaneously. Any oversupply of electricity would be lost at the moment it is produced. Second, demand is still rather inelastic (although important improvements in demand response are foreseen in the near future), and prices can reach very high levels within a short period if demand is not met. By contrast, when demand is low, a large part of capacity remains idle, hence not remunerated by the market. The task of ensuring a sufficient level of supply to meet demand at all moments is a challenging one, not only for the daily dispatching, but also in a long term perspective. The electricity system needs to be able to invest in capacity ahead of demand developments in order to make sure that enough production capacity is available when needed.
For this reason, an important aspect of market design is the need to keep the system reliable. Different market designs exist, which can be classified under two main categories based on the products traded: in an energy only market, the only product is the power produced, whereas in the presence of a capacity market, the availability of power plants is an additional product.
In an energy-only market, the signal for investment relies on high prices that materialise in moments of excess demand (these are called scarcity prices and moments of excess demand are scarcity scenarios): whenever there is a scarcity scenario, prices are allowed to rise so that generators start earning 'scarcity rents' that are high enough to cover their fixed costs of capital and induce new investment/new entry in the market. The problem with this approach is that it may lead to high price volatility, which increases the investment risk associated to the electricity market and the uncertainty – especially for peaking plants, but also for variables renewable plants() – to recuperate their investments; the possibility for prices to reach very high levels may also be used strategically by market players to abuse market power. For these and other reasons, wholesale electricity prices are usually capped. Finally, potentially variable and high prices might not be desirable if they expose consumers, both households and industry, to unsustainable high prices; nonetheless, long term contracts could be devised for customers not willing to be exposed to price volatility.
Alternatively, the market can be designed as an energy market complemented by a capacity mechanism. Markets designed in this way involve the trade of two products: scheduled energy (and services) and the ability to deliver power at some point in time (that is: "generation capacity"). For the trade of electricity, these markets make use of the same wholesale market design as energy-only markets. The difference is that they complement it with a capacity mechanism. Capacity mechanisms are tools to remunerate capacity for the simple fact of being available if needed. They can be price-based, hence setting a price for capacity availability; or they can be quantity based, in which case the required volume is determined at the outset and it is left to the market to set the appropriate price. All the relative costs associated with capacity mechanisms should be borne by consumers.
The Commission distinguishes six categories of capacity mechanisms () which are split between targeted and market-wide mechanisms. Targeted mechanisms focus on the additional capacity expected on top of what the market will provide. Market-wide mechanisms provide support to the majority of capacity providers in the market. Both targeted and market wide mechanisms can be further split between volume-based and price-based intervention. Volume-based mechanisms are: tender, reserve, central buyer, de-centralised obligation; while price based mechanisms are: capacity payment and targeted capacity payment.
|
Graph II.1.2:Taxonomy of capacity mechanisms
|
|

|
|
Source: European Commission
|
1.2.Market Frameworks in Member States
Historically energy policy in the Member States was managed at national level, whereas only relatively recently efforts have been made to steer the architecture of the different energy systems towards an integrated design.
|
|
|
Table II.1.1:Electricity Regional Initiatives
|
|

|
|
Source: European Commission
|
|
|
1.2.1.EU integration
Market integration has improved thanks to the Electricity Regional Initiatives (ERI), launched in 2006, aimed to create seven regional electricity markets in Europe, as an interim step towards the Internal Electricity Market. Each region brings together regulators, companies, Member States, the European Commission and other interested parties to focus on developing and implementing solutions to improve the way in which regional energy markets develop. An overall monitoring process at EU level ensures that progress towards a single EU market is not hampered, and that there is convergence and coherence across the regions.
A similar harmonisation effort started in 2014 with respect to support schemes. Investment in renewables was achieved mainly through support schemes that were national in scope (chapter I.2). In 2014 the new Guidelines for state aid for environmental protection and energy () set the path towards harmonisation of support schemes across Europe.
Market coupling has also improved. On 24 February 2015, for the first time, day-ahead power markets were linked from Finland to Portugal and Slovenia, accounting for about 2,800 TWh of yearly consumption and encompassing nineteen power systems. The EU has also agreed to achieve an interconnection level of at least 10 % of their installed electricity production capacity for all Member States by 2020. This target has been proposed to be extended to 15% by 2030. () In addition, regional cooperation is being pursued, for instance, to reinforce cross-border network infrastructures such as in the North Sea area (through the North Seas Countries' Offshore Grid Initiative), in the Baltic region (through the Baltic Energy Market Interconnection Plan - BEMIP) and in the Pentalateral Energy Forum between Germany, Belgium, France, Luxembourg, the Netherlands and Austria.
|
|
|
Table II.1.2:Electricity market characteristics at Member State-level
|
|

|
|
Source: ACER 2013
|
|
|
1.2.2.Member States
In terms of market design, most Member States employ a power exchange (), where trade through the market is optional (see table III.1.2). Greece, Ireland, Portugal and Spain have adopted a power pool, where all transactions must go through the market. In Bulgaria, Cyprus, and Luxemburg there is no wholesale market and transactions are either agreed on a bilateral basis (over the counter) or are managed by the central authority.
Member States differ also in the choice of reliance on an energy-only or a capacity market. Currently, most of the active capacity mechanisms aim to ensure the firmness and adequacy of the overall capacity of the market to meet demand. Some Member States purely rely on an energy-only market (Austria, Bulgaria, Czech Republic, Estonia, Latvia, Lithuania, Netherlands, Romania, Slovakia and Slovenia) whereas others made the choice to accompany the energy-only market by some form of capacity mechanism (see section 1.1.3).
Different forms of capacity mechanisms have been implemented in several European countries while others are discussing their implementation. Belgium, Sweden, Finland, and Germany operate strategic reserves (). Ireland, Italy, Portugal and Spain practice capacity payments. France plans to implement a capacity obligation scheme supported by certification of capacity. Denmark plans to implement a strategic reserve. Greece has a capacity obligations scheme since 2005 (). The United Kingdom has opted for a centralized, market wide capacity auction. Other Member States are supporting new investments through tenders for new capacity. Various Member States are considering new capacity mechanisms. ().
Support schemes are evolving. Even though a big part of investment in renewables is driven by support schemes, evolution towards market-based allocations and/or pricing can be observed in some Member States. To tackle the problem of revenue uncertainty in electricity generation and a consequent difficulty in getting private sector investment, the United Kingdom passed the Energy Act 2013 to implement Electricity Market Reform (EMR) which implements legally-binding Contracts for Difference. Through a Contract for Difference the electricity generator is paid the difference between the price reflecting the cost of investing in a particular low carbon technology – and the ‘reference price’– a measure of the average market price for electricity in the British market. In addition, the scope of the schemes is changing from renewable-targeted (a type of action which is more technology-specific) to low-carbon (a requirement which is instead emission reduction- specific). In Spain, feed-in tariffs and feed-in premia were replaced by investment support schemes () based on which renewable producers must submit offers to the market operator. If the revenues collected from the market are not sufficient to cover their costs plus a fair return, then a subsidy will be given in €/MW on a yearly basis in order to ensure that the predetermined level of profitability () will be achieved.
The presence or not of a price-cap on the wholesale market is one additional source of heterogeneity across Member States. For instance, price caps have been set in the French and German power exchange at +/-3000 EUR/MWh, which means that the price cannot exceed these limits. Nord Pool Spot has a range of -200 EUR/MWh to +2,000 EUR/MWh (), (). The Irish power exchange SEM has a price cap of 1 000 EUR/MWh. In the Iberian power market OMEL bids are allowed between 0 and 180 EUR/MWh (). Possibly, also other Member States implement price caps.
1.3.Concluding remarks
Power price formation is based on the bid of the marginal unit required to meet demand, which in a competitive market will correspond to its marginal cost. For each technology, the difference between the market price and its costs, i.e. the inframarginal-rent, allows investors to breakeven. Some additional revenue can also be realised on the balancing market.
The role of the price is different across market frameworks. In energy only markets, the stability of the system in terms of investments in capacity is achieved through electricity prices. When demand is in excess, prices increase to signal scarcity on the market. The high scarcity price enables the generators to cover their fixed capital costs and provide an incentive to invest so that the capacity will be able to meet market demand. In other market frameworks, the energy market is complemented by a capacity mechanism to incentivise investment to make the capacity available to meet the demand (often targeting a long term reliability standards).
Although EU wholesale markets have been progressively harmonised, market framework still differ across Member States in terms of electricity traded via various markets (day-ahead, intra-day, balancing markets), implementation of capacity mechanisms and other forms of price regulation, e.g. price caps.
The decarbonisation agenda of the European Union requires large investments to take place in the next future. At the same time, the liberalisation of the electricity market has enhanced the role of spot markets in providing the signal for investment. However, the penetration of low carbon technologies is challenging the functioning of the market and changing the investment landscape.
The objective of this chapter is to reflect on the evolution of key features for investment in electricity markets. Section 1 assesses investment needs in electricity generation; Section 2 describes the ongoing transformation of electricity markets and the potential impact on power prices. Section 3 concludes.
2.1.The case for investments in electricity markets
The transition to a low-carbon and energy-secure economy requires mobilisation of significant investments in Europe. The Impact Assessment of the energy efficiency review and its contribution to energy security and the 2030 Framework for climate and energy policy estimated the investment needs related both to the achievement of the 2030 targets and the modernization and transformation of the energy system in the EU Member States (). These projections show that EUR 90 billion of investments are needed annually up to 2030 in the power sector, of which EUR 50 billion for energy generation and EUR 40 billion related to power grids. This is driven by the need to modernise the EU's ageing energy infrastructure (for generation as well as transmission and distribution), as a response to security of supply issues, and due to energy and climate policy ambitions.
Significant investments in renewable power capacity will be needed up to 2030 under decarbonisation. Graph II.2.1 presents the ranges of net capacity investment in the period 2011-2030 for the different scenarios of the Impact Assessment of the energy efficiency review and its contribution to energy security and the 2030 Framework for climate and energy policy. These investment numbers include lifetime extensions of existing plants, refurbishments and replacement investments on existing sites.
|
Graph II.2.1:Ranges for EU28 - Net Power Capacity Investment (in GWe - aggregate 2011-2030)
|
|

|
|
Source: European Commission (2014 f)
|
In addition to the investment needs for the power sector, substantial investments are also required in other sectors of the economy, i.e. transport (energy efficiency, electrification), buildings (energy efficiency, innovation) and industry (energy efficiency, innovation). Total investment needs are estimated at EUR 850 billion annually up to 2030.
|
Graph II.2.2:Annual Investment Expenditures in billion of euro - 2010 (2011-2030)
|
|

|
|
Source: European Commission (2014 f)
|
Decarbonisation of the rest of the economy is expected to lead to higher demand for the generation electricity sector. Electricity consumption is still largely driven by GDP growth although energy efficiency improvements have contributed to decouple energy performance from economic growth. Electricity consumption decreased starting in 2008 due to the impact of the economic crisis and the subsequent sluggish recovery, as well as to energy intensity improvements. At the end of 2012, total electricity consumption was still 2.3% lower than in 2008, whereas analysts were expecting an average annual growth rate of about 2% () at the time. In the future, the energy efficiency improvement in the rest of the economy is expected to increase the demand for electricity. According to the Energy Roadmap 2050 (), the electricity share in the final energy consumption is expected to double compared to 2005 in the decarbonisation scenarios () reaching 36% - 39% of final energy demand in 2050. This reflects the increasing role played by electricity in decarbonising final demand sectors such as heating and services and in particular transport.
|
|
|
Table II.2.1:Electricity cost structure
|
|

|
|
Source: Own calculations based on Impact Assessment accompanying the document Energy Roadmap 2050, part 2, Table 31.
|
|
|
|
Graph II.2.3:EU28 - Electricity consumption (in TWh) - Final electricity demand in TWh*
|
|

|
|
Source: European Commission
|
Electricity demand in the transport sector in 2050 increases by almost a factor eight compared to 2005 under the different scenarios of the Impact Assessment of the energy efficiency review and its contribution to energy security and the 2030 Framework for climate and energy policy. This is mainly due to the electrification of road transport, in particular private cars. About 80% of private passenger transport activity is foreseen to be carried out with electrified (plug-in or pure electric) vehicles by 2050. Compared to transport, the electricity demand of households and the tertiary sector is expanding more modestly by 2050, yet markedly, mainly driven by the electrification of heating and cooling. This new usage of electricity overcomes the improvements achieved by 2050 in energy efficiency of appliances as well as the increased thermal integrity in the residential and service sectors and more rational use of energy in all sectors. By contrast, industrial electricity demand remains quite stable by 2050 compared to 2005.
2.2.The ongoing transformation of European electricity markets
2.2.1.Changing cost structure: high capital costs technologies
From an economic perspective, low-carbon technologies can be considered as low-marginal cost technologies. Low carbon technologies share the same cost-structure: high fixed (investment) and low marginal (operating) costs; whereas conventional fossil fuel-based power sources have lower capital costs and higher operating costs (Graph II.2.4). This has an important effect on the market outcome because as the share of low-carbon technologies increases, average spot market prices may tend to decrease () and price volatility to increase.
|
Graph II.2.4:Levelised costs of fossil fuel and low carbon technologies
|
|
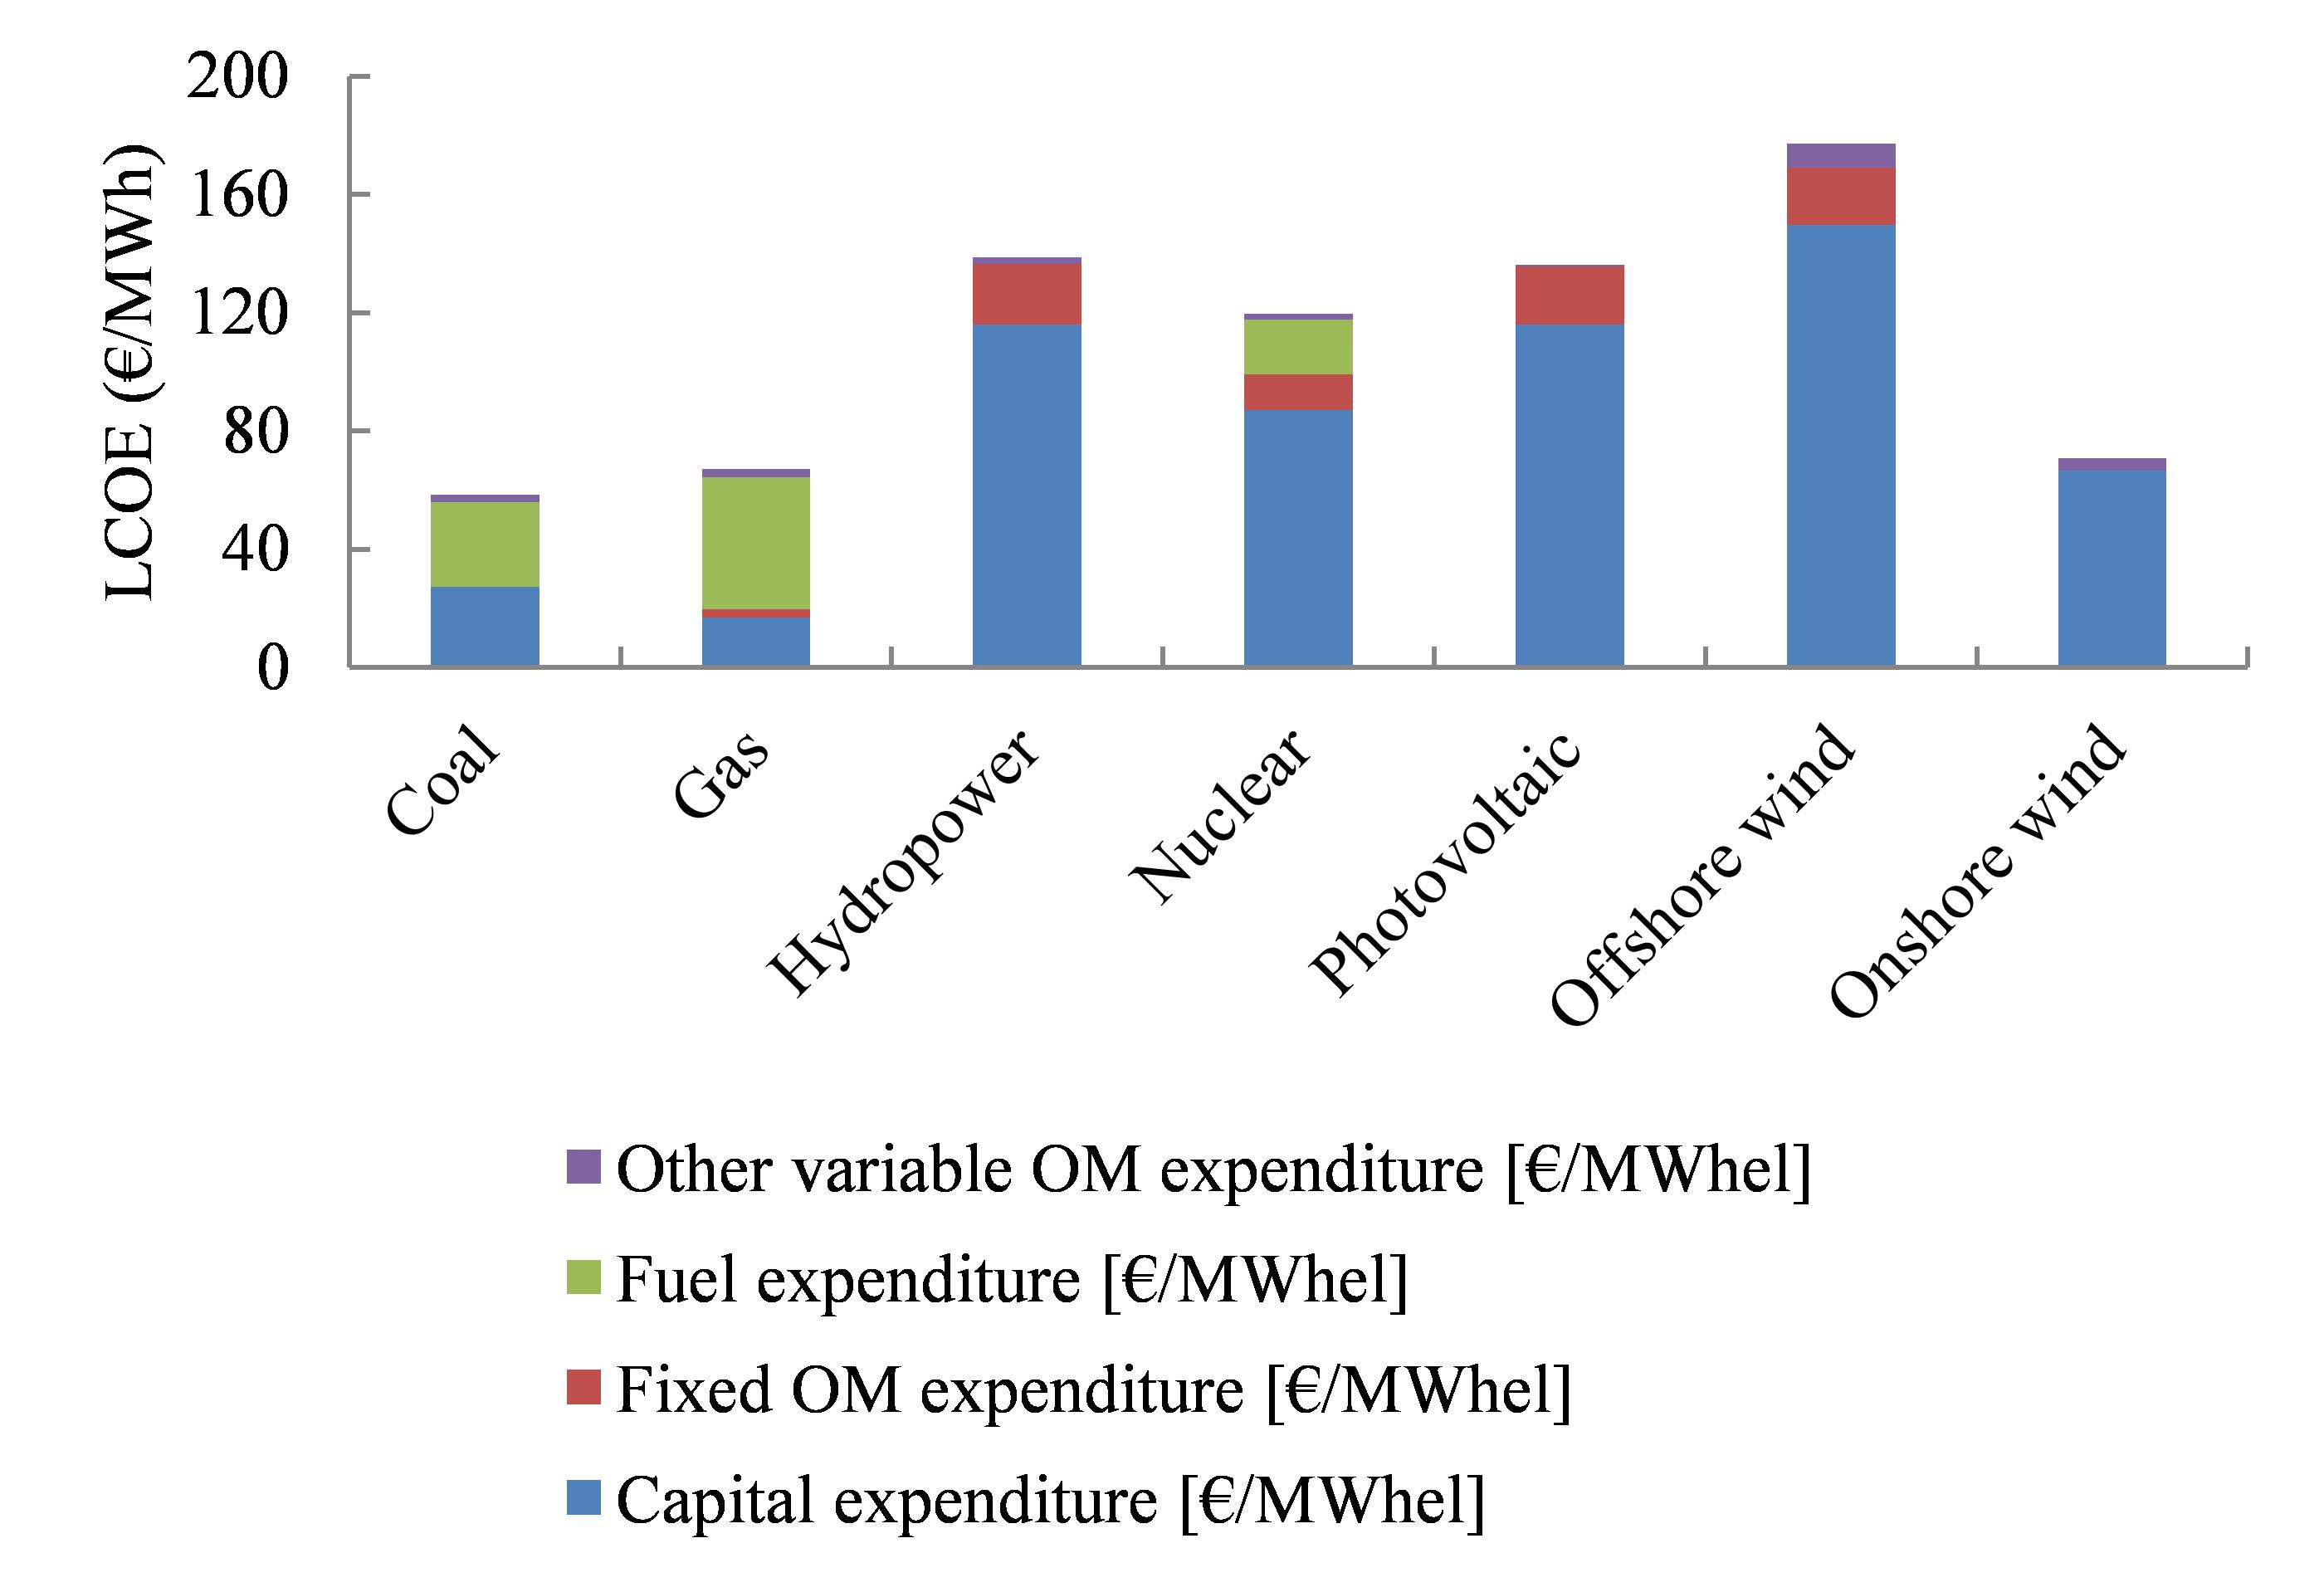
|
|
Source: SETIS
|
Studies have estimated the role that fixed and marginal costs will play in a system dominated by low carbon technologies. The Impact Assessment accompanying the Communication from the European Commission "Energy Roadmap 2050 ()" analyses policy scenarios with high penetration of low marginal cost technologies (renewables and nuclear). The study models the evolution of electricity prices, and includes projections on fixed and variable costs of the generation mix induced by the policy. The fixed costs can be identified as the capital costs; while variable costs can be identified with the marginal costs on which the wholesale electricity price is determined. The figures provided in the Impact Assessment clearly show that, under the current policy scenario, with relatively low penetration of renewables, variable and fixed costs represent approximately 50% of the costs each. Under the High renewable penetration scenario, fixed costs constitute more than 2/3 of the overall costs, while variable costs decrease to 1/3. Similar figures are obtained for the high nuclear penetration scenario (see Table II.2.1).
2.2.2.The penetration of variable technologies
Beyond the common cost structure, low carbon technologies differ in the type of capacity they provide: nuclear and hydro plants provide firm capacity (meaning that they can reliably predict the amount of energy they will be able to deliver), whereas wind and solar are variable (or intermittent) technologies which depend on uncertain and difficult to predict weather conditions (at least over a lead time of more than 24 hours). Intermittency is a technical characteristic with great impact on the requirements of the electricity infrastructure, where ancillary services are likely to play a bigger role than what they historically did. In addition, intermittency translates into an economic impact because the unpredictable amount of cheap energy on the market increases the price risk.
The day-by-day market activities are impacted by the intermittent nature of wind and solar power. Increased penetration of this type of technology creates challenges to the reliability of the electricity system: it is not just a matter of having enough installed capacity to meet demand; the issue is rather ensuring that the system is flexible enough to supply electricity when the high share of variable renewables is not able to supply power due to weather conditions.
2.2.3.Changing conditions for investors: lower price and intermittency
Both the electricity price (which depends on the cost characteristic) and the increased uncertainty of revenue streams (due to intermittent energy sources) are crucial elements of the investment decision. If the average electricity price on wholesale markets is too low to cover the fixed costs together with the marginal cost of electricity production, investment is not profitable in expectation, and rational market actors will not undertake it. On the other hand, intermittency in the availability of cheap energy sources increases the variance of price: this means that the price can be low, but also very high in periods when low carbon technologies are not available. This translates into higher investment risk () negatively affecting the investment decision.
For the electricity system to be reliable, most of low marginal cost units cannot serve the system alone: nuclear plants are, in general, independent from weather conditions (), but they require long booting periods, while wind and solar power (variable renewable sources) are, by definition, dependent on weather conditions which are not easily predictable. This means that large scale deployment of low marginal cost units, and in particular variable renewables, challenges the reliability of the electricity system. For reliability to be maintained, they need to be complemented with other types of resources, like demand response, storage, and generation units for moments of unfavourable weather or to cope with sudden demand spikes requiring fast-responding generators (). Fast responding generation units (mainly secondary reserves) can be procured by transmission system operators (TSOs) through balancing and ancillary service markets It is important to notice, though, that balancing services are not designed for, and hence not likely to substitute other forms of generation for a long duration of high demand and low output from intermittent renewables; to solve this adequacy problem, more resources would be needed.
This means that the introduction of low carbon technologies requires flexibility resources to stay in the market (fast responding firm capacity, currently represented by conventional peaking and mid-range plants, demand response, storage, better use of interconnections and more efficient use of existing plants). With small shares of variable renewables in the system, their intermittency can be smoothed out with existing conventional capacity. But when the variable renewable share reaches higher levels (some estimates put the threshold at 20-25% () back-up capacity runs for very limited amounts of time, with a consequential decrease in profitability that may force them to exit the market and/or discourages new investment.
Reliability of the system and generation capacity adequacy are interlinked problems. If low carbon technologies depress wholesale prices and cause a lack of conventional capacity in the overall generation mix, the provision of back up capacity in the form of ancillary services and balancing power might become more burdensome, if flexibility is not appropriately rewarded. Hence, the fact that there might be a capacity problem overall, and in particularly for gas and coal, risks increasing the size of the reliability problem.
2.2.4.Marginal cost pricing and investment signal
Whereas the marginal cost based pricing mechanism is widely considered as the best way to achieve efficient use of resource in the short term, its role in guiding investment is being challenged by the changing environment imposed by low carbon technologies, (intermittency, fewer hours run for peaking units and lower market prices). Depending on the techno-economical characteristics of the generation mix, price formation in a short-run, competitive market may not turn out to be functional to send long term price signals to induce investment, (de Castro et al 2010) ().
There is a broad consensus on the need to promote market-based investments without any form of support. However, the views diverge on the way to achieve this end. The main debate is between. energy-only markets where prices would be allowed to reach high levels during scarcity hours; or by capacity remuneration mechanisms, remunerating some capacities for their availability.
Energy-only markets are potentially able to deliver an investment equilibrium, by pushing out of the market unneeded peak plants when in excess, as well as being able to attract new investment through high prices. Oren (2005) and Hogan (2005) explain that generators should be able to balance their expenditures through bidding higher than marginal costs in hours of supply shortage. For this to happen, markets need to allow prices to reach high levels during scarcity events, which means that price cap, where existent, should be removed (Giuli 2015; Grigorjeva, 2015).
Some authors (Cramton and al, 2013) discuss the ability of scarcity price to fix the investment equilibrium. In reality, markets are imperfect and prices are usually capped to avoid the abuse of market power. One of the difficulties is to set the "value of lost load (VoLL) which corresponds to what consumers would pay to avoid power interruption. For this reason, the authors argue that the scarcity price approach relies on the quality of the regulator's estimate. Finally, the existence and frequency of high prices question the political acceptability of the consequences of an equilibrium based on scarcity prices (ACER, 2013; OECD et al., 2015).
For all these reasons, some authors claim that capacity mechanisms are necessary to compensate for market imperfections. Cramton and Stoft (2005), and Joskow and Tirole (2007) emphasize that there will always be imperfections in the energy-only market leading to, e.g., price spikes and market power, because the demand side does not actively participate in the market. They conclude that there is a need for a different market scheme that would ensure generation adequacy, e.g., a capacity market. Originally, capacity mechanisms were created to make up for the lost profits due to the existence of stringent price caps (Giuli, 2015). Capacity mechanisms can take different forms (see chapter II.1), but they are all based on the idea of remunerating the capacity to produce electricity, rather than the electricity actually delivered.
However, capacity mechanism may have adverse effects linked to the ability to forecast demand and predict the right capacity adequacy. In addition, capacity mechanisms implemented without taking into account cross-border trade is likely to cause over-capacity and distort allocation of investments. (Tennbakk 2013; Grigorjeva, 2015). Moreover, as most of systems remunerate incumbents, the risk is that the existence of remuneration for capacity freezes the market and hampers innovation by delaying investments in new facilities (Grigorieva, 2015). Finally, it needs to be noted that model based analyses show that there is no urgent need for capacity mechanisms in most European countries in the first few years to come (Tennbakk, 2013).
Recently, the investment challenge has been aggravated by the penetration of low carbon technologies, as these technologies tend to lower wholesale prices, hence the remuneration of investors while increasing volatility. Castro and al (2010) show that a system dominated by low carbon technologies leads to reduced market prices independent of production costs and does not guarantee the financial viability of existent firms., Cramton et al. (2013) argue that renewables aggravate the adequacy problem because their production is entirely price-inelastic (due to marginal costs close to zero). Because of this characteristic, renewables intensify demand fluctuations, and thereby price fluctuations. The authors add that with rising renewable in-feed, generation adequacy is challenged because, conventional investments get less attractive due to lower load factors.
On the issue of increased volatility and its effect on investments, Blyth et al. (2015) analyse the effects of an increasing share of renewables on the price formation mechanism. They demonstrate that over time the wholesale market will present an increasingly less attractive risk/return profile, with lower average prices and higher volatility, which will induce market concentration as larger companies can more easily bear these risks. They also show that inadequate near-term investment signals emerge when market participants are confronted with behavioural considerations of risk, limited foresights and excessive discounting. Similarly, Pikk and Viiding (2013) analyse the potential impact of more renewable electricity production on wholesale prices in the NordPool spot market, in the context of significant help from government support schemes for investment in renewable production capacity. Their results are in line with the findings of Blyth et al. (2015) as they show that, ceteris paribus, NordPool Spot is likely to have very high price volatility in the future and alternative revenue sources are required for new investment.
This dynamic is the starting point for a reflection by OECD et al. (2015), which observe that the design of wholesale electricity markets is not strategically aligned with the transition to low carbon. The current market design is failing to provide the visibility of future electricity prices that would help secure investment in the low-carbon, high-capital cost technologies needed for the transition. The reflection leads to the conclusion that, despite the fact that wholesale electricity markets will remain useful for the least-cost dispatching of existing capacity, left on their own, they would require repeated periods of very high prices, with a high price on CO2, and scarcity periods and risks of rolling brown-outs, before investors would unlock financing of these technologies. The OECD et al. claim, instead, that the right investments could be achieved more cost-effectively if new forms of market arrangements were agreed. Similarly, IEA (2015) questions the ability of the current model of liberalised markets with a carbon price to deliver investment at a scale and pace needed to achieve decarbonisation. It concludes that additional instruments to secure investments for decarbonisation might be needed on top of a carbon price and well-designed short term markets.
2.3.Concluding remarks
Investments in the power generation are expected to play a central role in the transition to low carbon economy. Not only the electricity sector has a large decarbonisation potential; it is also expected to contribute to the decarbonisation of other sectors of the economy by supplying low carbon electricity.
The increasing share of low carbon technologies in the electricity mix is likely to lower the prices on the spot market. Under current market arrangements, this corresponds to the day ahead market. These price developments can be explained by the price formation (i.e. assuming generators bid according to their marginal costs) and the cost structure of these technologies with high fixed costs and low operating costs. In such a system, there is a risk that a market price based on the operating cost of the marginal unit may not be sufficient for investors to generate sufficient revenue to cover their fixed costs. This is under the assumption that technologies with low variable costs will dominate the market and therefore regularly act as the marginal producer.
This translates into a risk that the current arrangements of wholesale markets will not provide the proper incentives for long-term investment in the power generation sector. Markets are supposed to serve two functions: optimisation of resources already in place, and driving investment for the future. Whereas the electricity market serves the first function well, it is not clear whether the current electricity market design will be sufficient to convey the right long term investment signals in a system dominated by low-carbon technologies with low operating costs. However, a proper market framework is important to make these investments happen.
The increasing penetration of low carbon technologies is changing the market reality and poses several challenges for both investors and public authorities. From a dynamic perspective, the transition to a low carbon economy influences both prices and capacities and leads to new equilibriums for each stage of the transition. This part aims to provide an economic framework for the transition to a low carbon economy and discusses possible market arrangements.
Chapter one analyses the impact of the decarbonisation using different sequences – yesterday, a world dominated by conventional fuels; today with a transition phase led by the penetration of new technologies and, tomorrow with a decarbonised world where electricity is mostly produced by low carbon technologies.
Chapter two reviews the challenges for each sequence – today and tomorrow – and identifies possible market-based arrangements that would incentive investments while minimising the cost for society.
The increasing penetration of low carbon technologies is affecting the cost structure and composition of the technology mix (see part I and II). This impacts the price formation on the market and hence the way investors recoup the costs for their investments.
The objective of this chapter is to understand the evolution of the investment conditions in power markets during the decarbonisation process. Section 1 analyses the impacts of low carbon technologies on prices and quantities. Section 2 looks at the cost developments and learning potential of low carbon technologies. Section 3 concludes.
1.1.The economics of low carbon technologies
1.1.1.Impact of low carbon technologies on prices and capacities
The transition to a low carbon economy leads to a shift to technologies with high fixed costs and low operating costs (see part II). This evolution changes the cost structure as well as the total capacity of the electricity system in the short and medium run. From an investor's perspective, the overall conditions to invest will change due to the impact on the price of the energy transition, thereby changing the incentive to invest or not. From public authorities' perspective, it is important that the impact on the capacity and prices induced by the changing structure of the electricity mix remains compatible with an efficient and cost-effective electricity market.
Investment decisions need long term predictability, which makes it important to understand the consequences of the transition to low carbon technologies in both the short and medium term. The market transition can be summarised by three chronological stages with their own characteristics in terms of price and production conditions. In order to understand the impact of this development, three power systems are constructed that represent each stage of the energy transition, from yesterday (conventional phase – stage 1) to today (transition phase – stage 2) and tomorrow (decarbonised phase – stage 3) (). During the transition phase, most of low carbon technologies are not yet competitive and would not enter in the market without any form of support. During the decarbonised phase, it is assumed that low carbon technologies dominate the technology mixes of the European power systems and compete on the market. Each stage corresponds to a changing electricity mix induced by the increased penetration of low carbon technologies and leads to different equilibriums in terms of price and quantity. The magnitude of the quantity (or capacity) and the price (cost structure) effect differs across the stages of the transition.
Remuneration for producers relies mainly on the price fixed by the marginal unit (see chapter II.1). Each technology available on the market will face a remuneration which is composed of the sum of infra-marginal rents gained during the different periods of time as well as scarcity rents when demand is scarce (see graph III.1.1 and III.1.2 and annex 3). These rents allow for the recovery of the fixed cost of the peaking units, and also contribute to the cost recovery of the other technologies.
|
Graph III.1.1:Generic merit order curve under no capacity constraints
|
|

|
|
Source: European Commission
|
|
Graph III.1.2:Generic merit order curve under scarce capacity
|
|
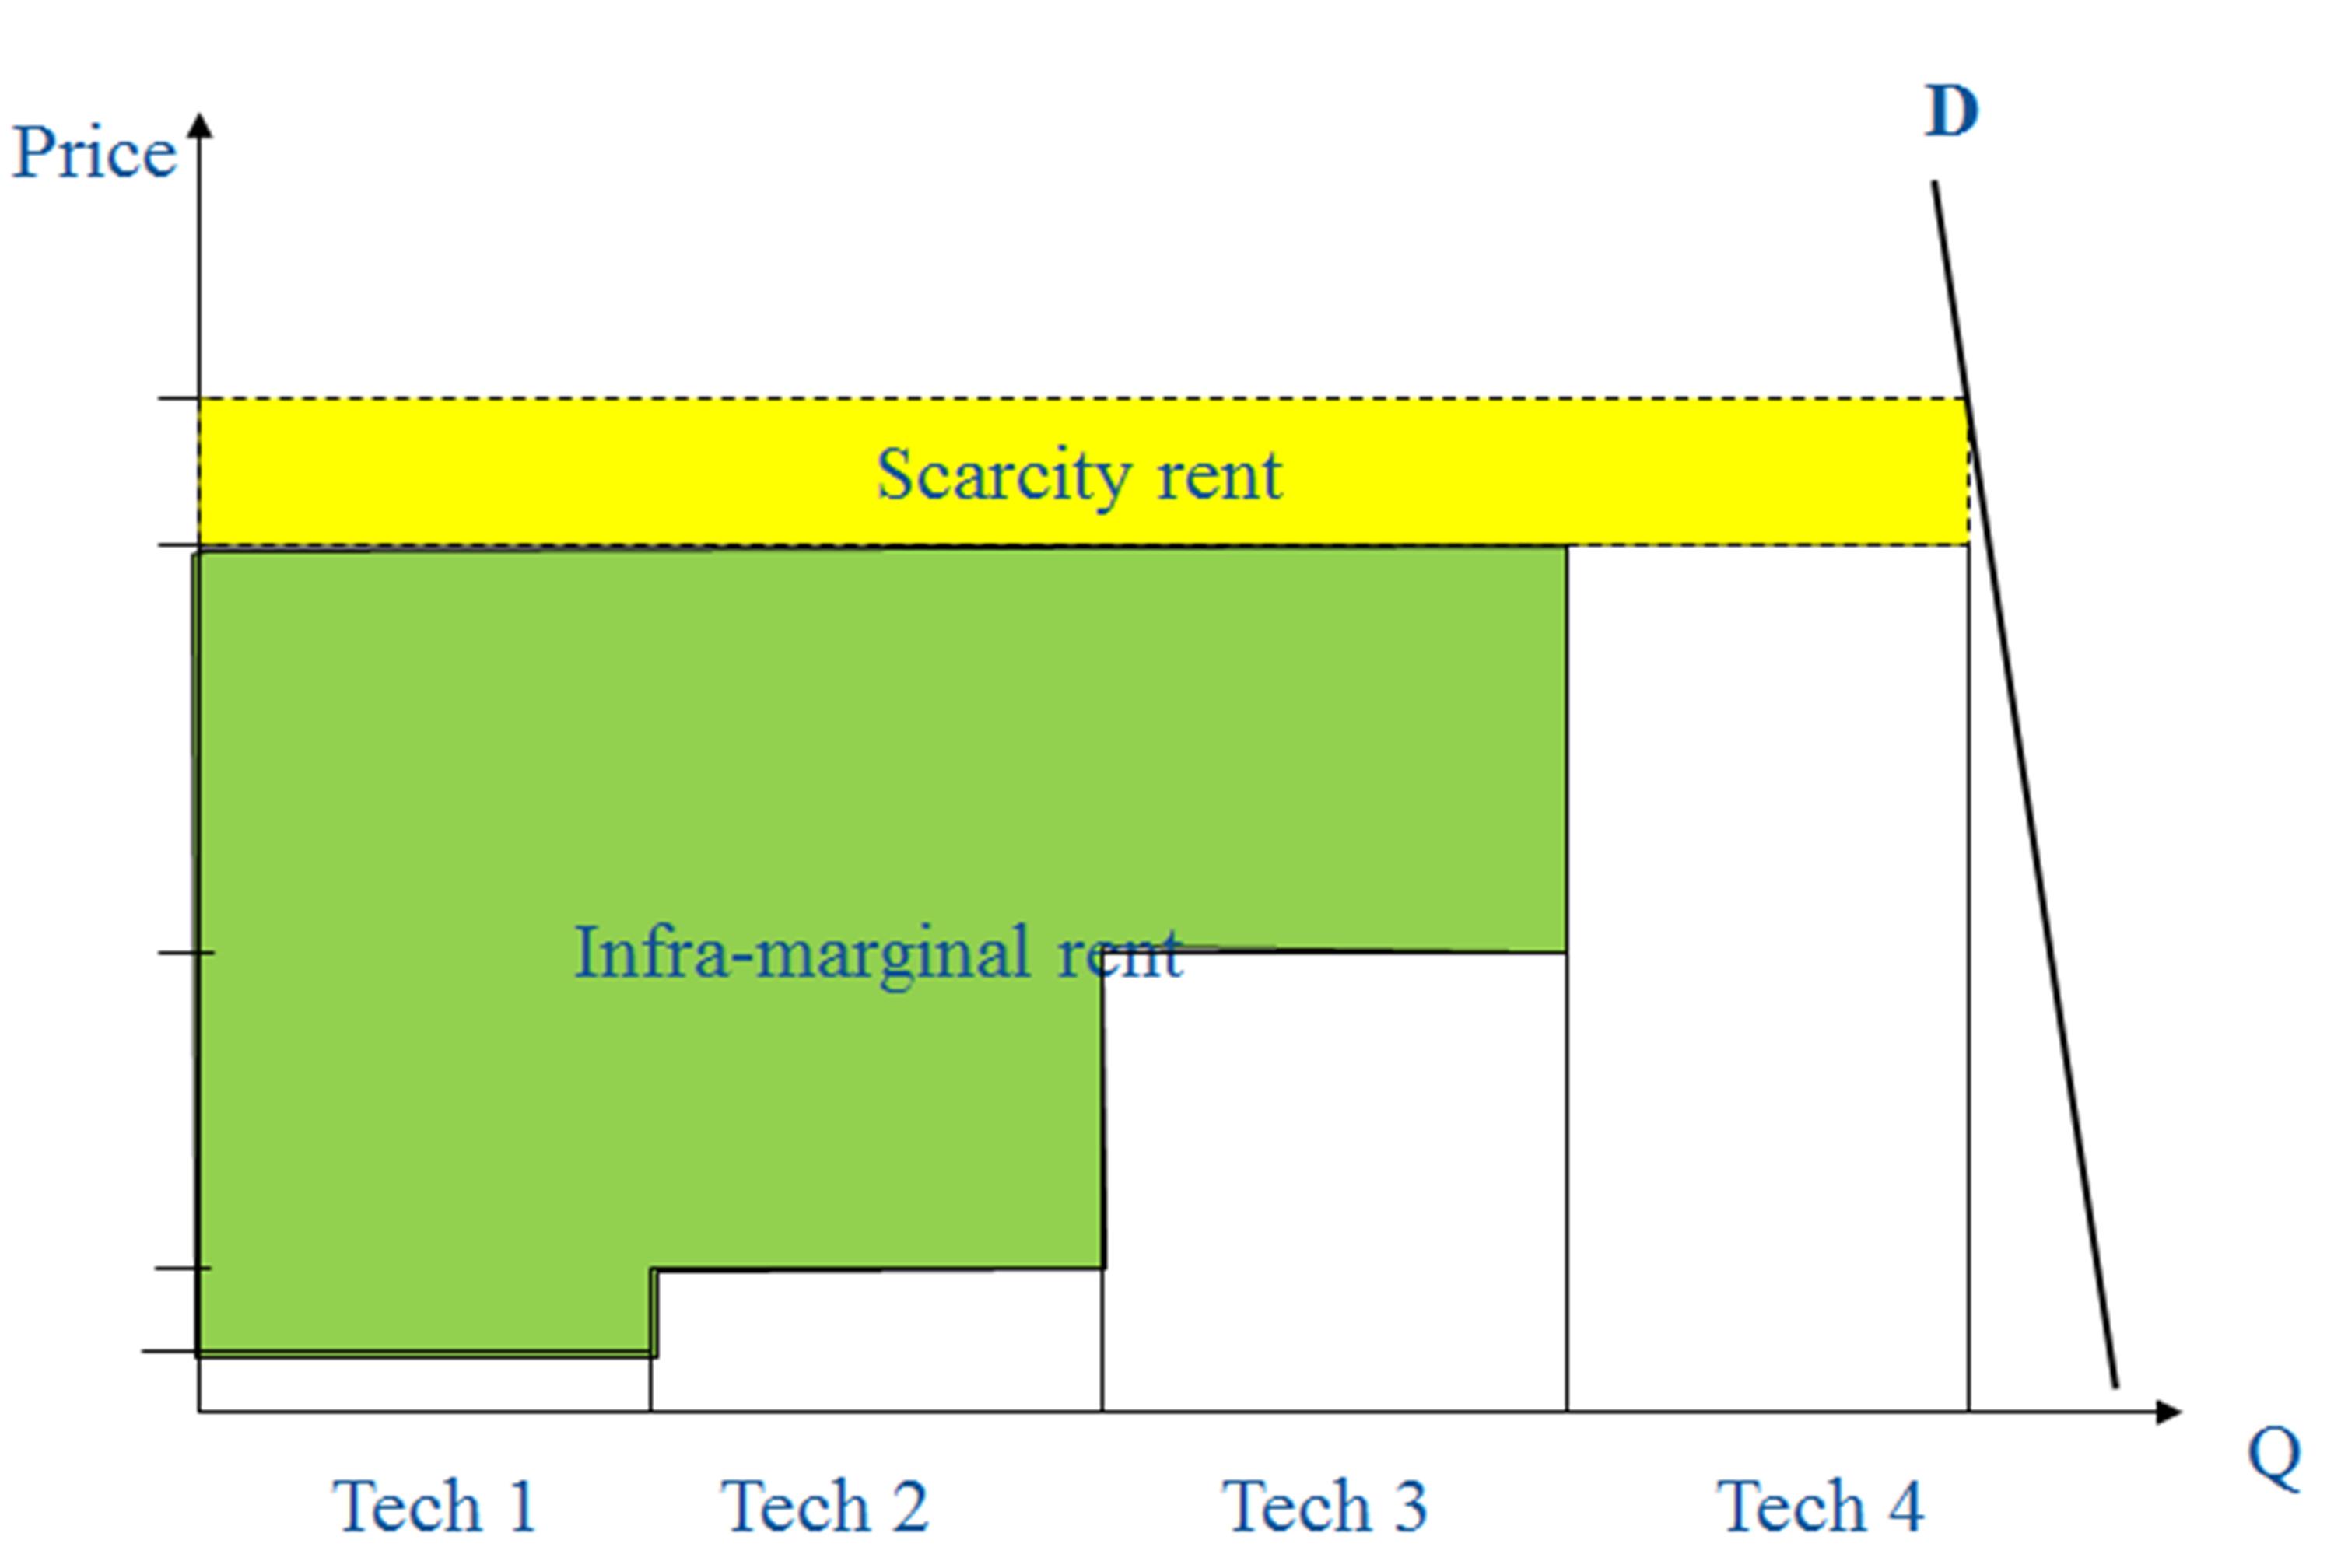
|
|
Source: European Commission
|
The penetration of low carbon technologies changes the merit order curve. Under the transition phase, it is assumed that current market arrangements remain and electricity demand is constant (). The introduction of low carbon technologies changes dynamically the merit order curve by pushing the supply to the right for a certain period of time proportional to their capacity factors. By contrast, when these technologies are not operating, the power system uses conventional technologies (see graph A3.3 of annex 3). In the decarbonised phase, merit order curves are getting flatter with steeper ends that reflect a technology mix dominated by low carbon technologies with low variable costs and conventional capacity to ensure that demand is met at any time. Indeed, low carbon technologies are able to operate during most of the year due to a high degree of European market integration that allows drawing on their spatial and time complementarities. This, in particular, changes the operating conditions (reduction of number of hours) of peaking technologies.
As a result, and under current market arrangements, two main effects would be at play during the energy transition that affect the level of installed capacity and market revenues. The first effect is a capacity adjustment effect, which corresponds to a change in supply and demand that requires the production to be adjusted to the new conditions. Depending on the stage of the transition, this adjustment can be positive or negative. The second effect is a revenue effect which is due to the entry of technologies with lower variable costs than the existing technology mix. In both stages, this revenue effect is negative for producers (see Box III.1.1) ().
The transition phase under current market arrangements, which corresponds to the situation of today, is likely to benefit from lower equilibrium prices (), but would display transitory over-capacity of installed capacity. During the transition phase, low carbon technologies are continuously introduced in order to meet the EU climate and energy targets during the transition phase. This may create temporary overcapacity that would be corrected by adjustment of the total generating capacity to reach a new equilibrium, for instance through decommissioning of plants with the highest operating costs. As the marginal cost of total supply would decrease as low carbon technologies enter into the market, this would result in a new equilibrium price that is lower than the previous equilibrium price, triggering a revenue reduction for the producers (see Box III.1.1).
The decarbonised phase, which is representative of the market of tomorrow, is likely to be dominated by a much lower equilibrium price for most part of the year and by the need for strong price spikes (and its associated uncertainty) to recoup the fixed cost of investments. Under the decarbonised phase, the energy transition is achieved, i.e. low carbon technologies are dominating the technology mixes of the European power systems. Due to the high penetration of low marginal cost carbon technologies, the supply curve becomes flatter with steeper end compared to the transition phase resulting in lower price equilibrium in most part of the year and high prices when demand is high and capacity is scarce. The feasibility of frequent and intense price spikes is uncertain in the future, notably due to factors such as public acceptance, regulatory intervention to prevent market power, low price caps set in power markets. Due to this uncertainty, a revenue decrease for the producers can overall be expected. As prices are lower, demand increases (as a result of the elasticity of demand), which requires increasing the quantity produced. The example presented in box III.1.1 is neutral on the way to achieve this new equilibrium. For example, the increase in quantity can be achieved through the addition of new capacity (investments). An alternative would be to maintain some capacity from the transition phase, provided they have the right flexibility and CO2 emissions characteristics and the (stranded) cost of keeping them is not too high ().
|
|
|
|
|

|
|
|
|
(Continued on the next page)
|
|
Box (continued)
|
|
|
|

|
|
|
|
(Continued on the next page)
|
|
Box (continued)
|
|
|
|

|
|
|
|
(Continued on the next page)
|
|
Box (continued)
|
|
|
|
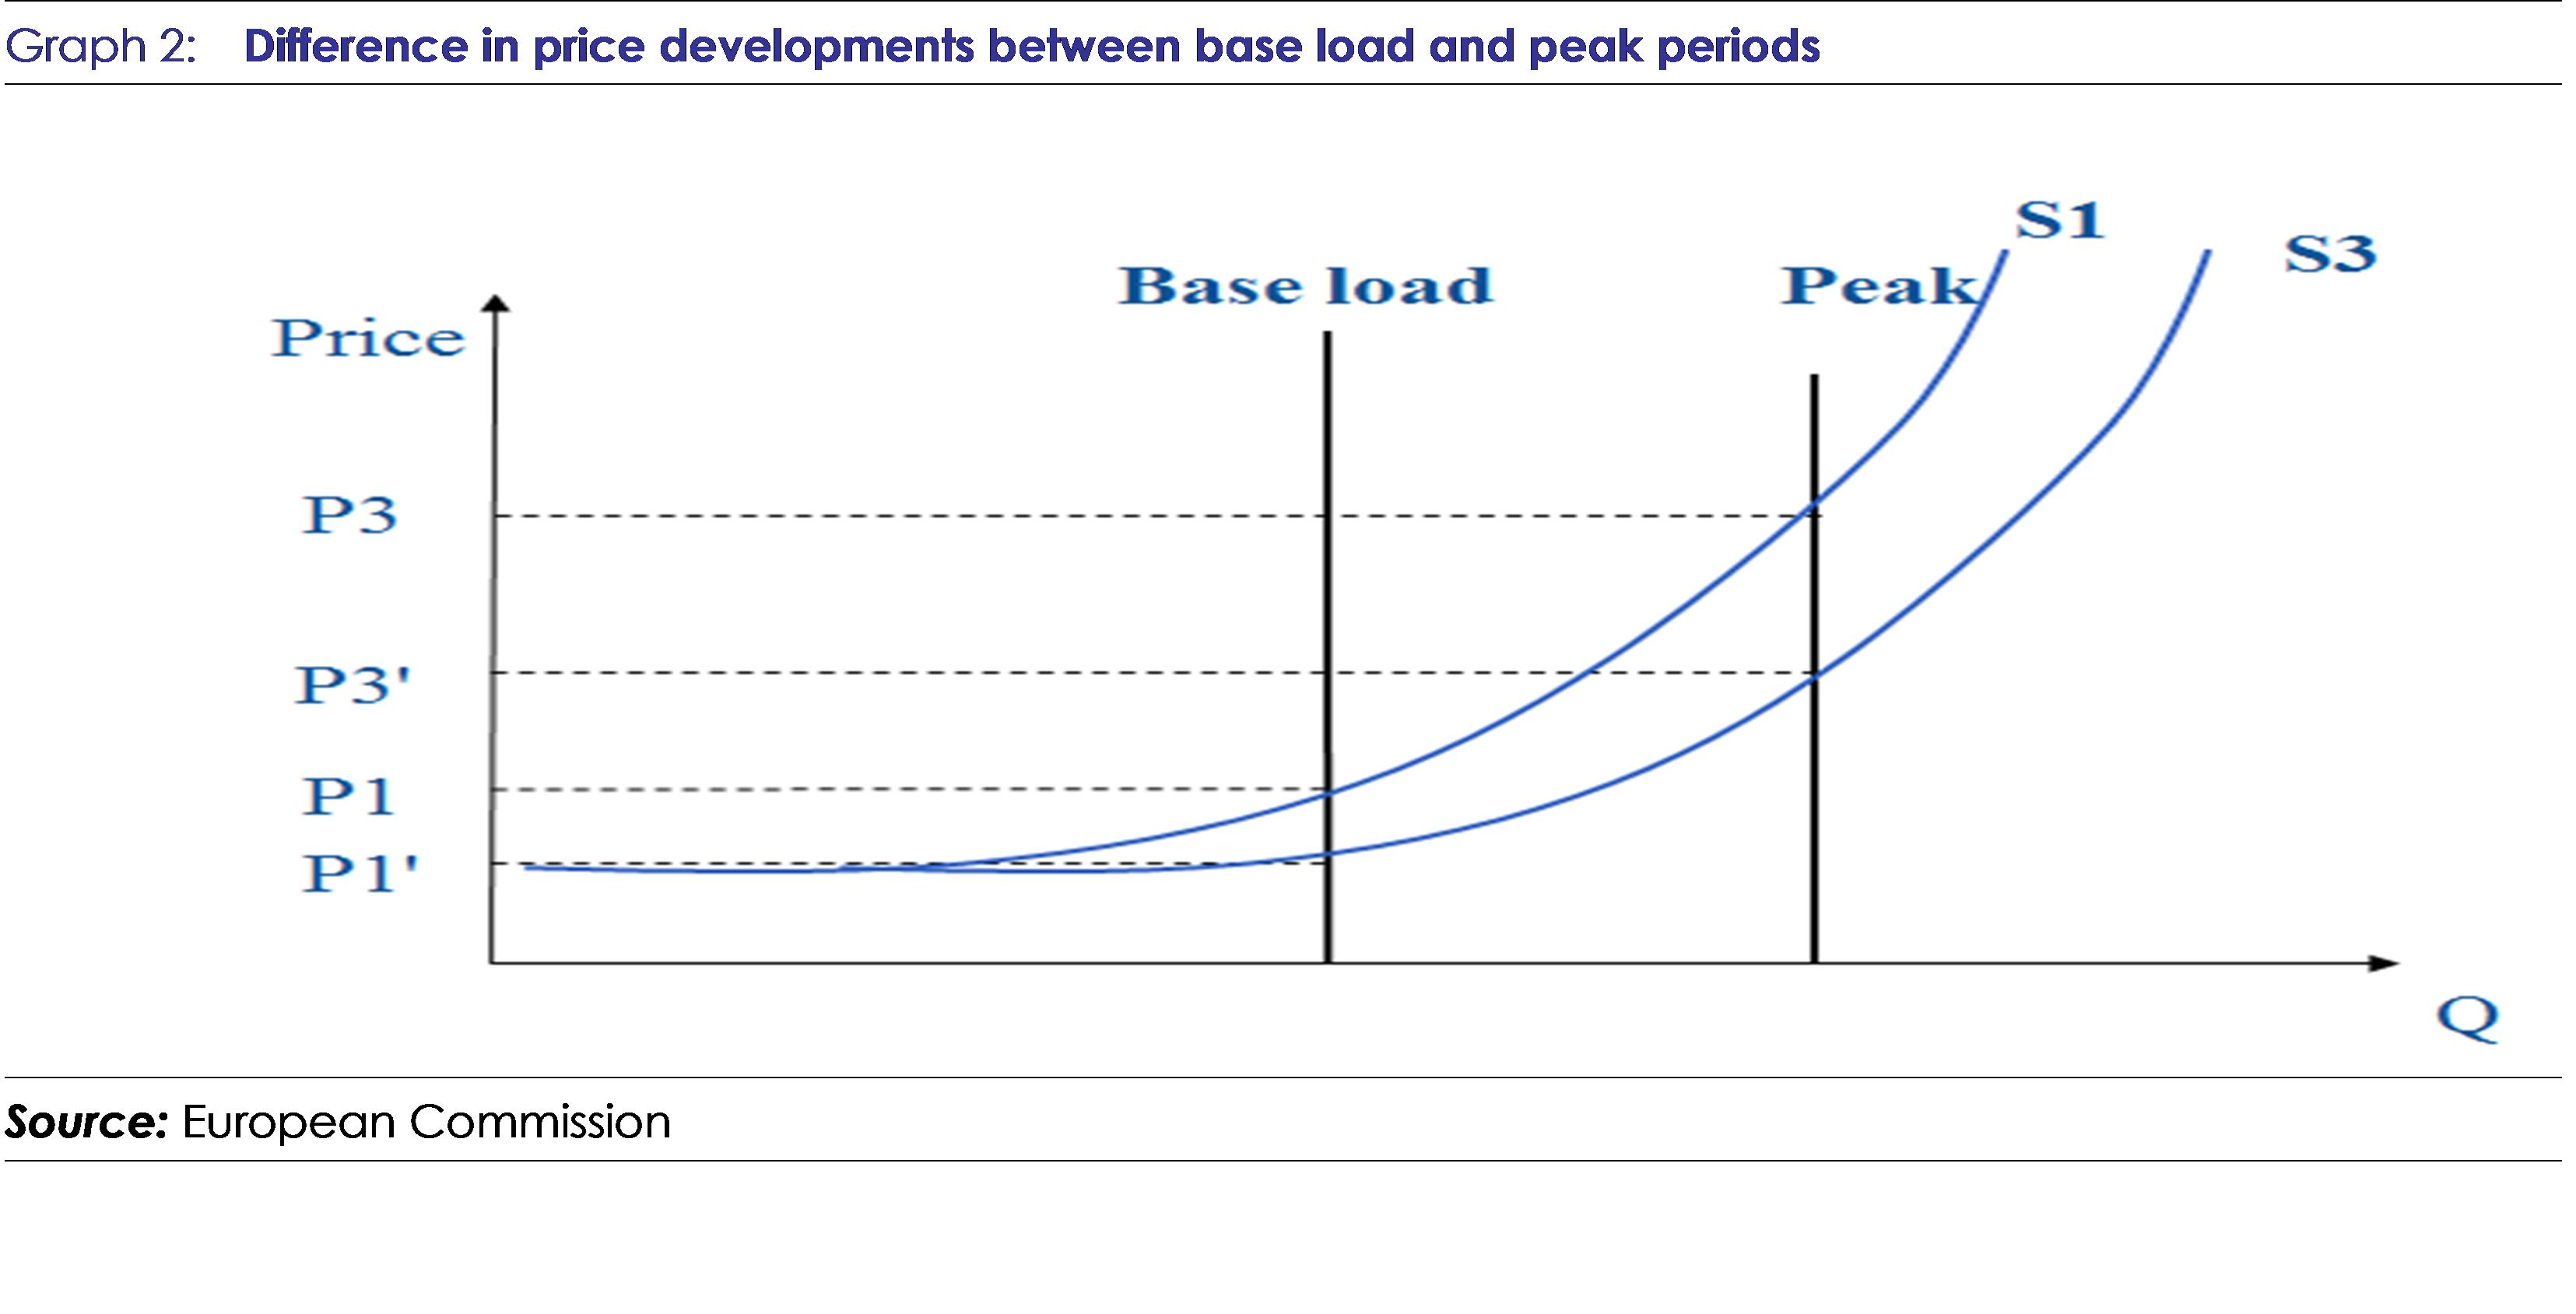
|
|
|
|
|
1.1.2.Impact of Demand Response
Demand response enables consumers to change voluntarily their consumption pattern in response to market signals. Consumers can also themselves (or through aggregators) place bids on power exchanges () and thereby agree to change their demand for electricity at a given point in time (). In practice, consumers would be asked to decrease their consumption when the power system is facing a stress or peak and incentivised to consume in periods of low demand or over-capacity. Demand response allows also consumers to reveal their willingness to pay during periods of scarcity, which would provide reliable information to investors with respect to investments in peaking capacities.
With the development of demand response, the revenue streams for the different technologies can be expected to slightly decrease or remain equivalent () to the previous situation with inelastic demand, while revenue needs in peaking technologies would decrease. This effect is shown in Graph III.1.1, where demand response tends to increase consumption during semi-base load and base-load periods where prices are lower at the detriment of the peak period.
|
Graph III.1.3:Impact of demand response on the load duration curve
|
|

|
|
Source: European Commission
|
Demand response would also mitigate the impact of the variability of wind and PV generation on market revenues. In the case of sudden and unforeseen increase in wind or PV generation (supply curve with sudden surge in output in Graph III.1.2) that normally would tend to depress prices, the effect of demand response would be to consume more during this period (shift demand from Q1 to Q2), which is effectively a transfer of consumption from a higher price period to this low price period. The resulting impact on the different technologies would be overall less revenue for power producers (). The opposite would happen in case of a sudden decrease of wind or PV power generation that could trigger high prices; the effect of demand response would be to absorb this decrease in production by shifting the consumption to other periods (from Q1 to Q3), hence preventing periods of scarcity pricing. Assuming schematically an equal probability of sudden positive or negative output of wind and PV production, the development of demand response would tend to mitigate their effect on market revenues.
|
Graph III.1.4:Short-run impact of demand response on the sudden changes of power outputs
|
|

|
|
Source: European Commission
|
1.1.3.The dynamic of the transition: addressing the competitiveness of new technologies
Most low carbon technologies in the transition phase are entrant technologies, which are not yet fully competitive in the market (e.g. off-shore wind, advanced bio-power, carbon capture and storage). Therefore, the level of fixed costs is influenced by the degree of maturity of these technologies and also their capacity of further decreasing costs. This means that, as regards the dynamic of the transition, the investments in the different technology mixes composing the transition phase and decarbonised phase will depend on the capacity of these technologies to reduce their costs proportionally to the decrease in revenues that occurs during this transition through the different stages.
This cost reduction should take place notably through learning effects. Learning effects represents the observation that the cost of a technology decreases by a certain amount with every doubling of installed capacity (). Each time a unit of technology is manufactured, some knowledge and learning accumulates that makes the future technology units cheaper to produce. This concept is also used to extrapolate cost reductions to future cumulative production levels and assess the "learning investment" which corresponds to the difference between the costs of the entrant technology and the cost of incumbent technologies () (Graph III.1.3). Without learning effects to compensate for the revenue decrease, no investments would take place or public support would be needed.
|
Graph III.1.5:Cost development of an entrant and an incumbent technology
|
|

|
|
Source: JRC, European Commission
|
Learning effects are realised through research and innovation, but can also be incentivised by support to deployment (). The rationale is that deployment of these new technologies increases the cost reduction, suggesting that further deployment decreases costs. However, as mentioned by Stern (2006), reversing the causation may lead to disappointing results, hence the need to reflect on the potential of these new technologies to minimise the costs of development.
1.2.Investment criterion in low carbon technologies in a changing electricity system
1.2.1.The decision to invest
The investment decision is based, and will remain based, on the expected profits. To invest in any technological projects, investors require that revenues recoup at minima the total costs incurred during the project life time (e.g. technical or economic life) of the project. This investment criterion can be reformulated into the following revenue/cost expenditure balance as follows:
> 0
with
With:
: Annual profit for technology i, in EUR/yr in year y
PLT : project life time (in year)
d: discount rate
t: index of a demand period of a year, e.g. base, medium and peak
: Revenue for technology i during demand period t and in year y. can be written as , where, is the equilibrium price for demand t (in and is the energy quantity generated by technology i during the demand period t in and in year y.
: Annual total costs for technology i in year y, in EUR/yr. This is equal to, with : Variable cost of technology i, in and Annual fixed cost of technology , in EUR/yr, in year y.
This investment criterion implies that revenues acquired by technology i through infra-marginal rents during the different periods of time of a year and over the entire project life time shall cover its fixed costs.
or
With : infra-marginal rent for technology i during period t and in year y
1.2.2.Quantification of the investment criterion
Investing in low carbon technologies (for which the fixed costs account for about 70% of their total costs) under market conditions and without any support will depend on the relative cost levels of these technologies compared to the other technologies of the system. An important aspect will be their learning potential over time, i.e. the ability to accommodate for the decreasing rate of revenues through cost reduction as the energy transition progresses (from the convention phase to the decarbonised phase).
|
|
|
|
|

|
|
|
|
(Continued on the next page)
|
|
Box (continued)
|
|
|
|

|
|
|
|
(Continued on the next page)
|
|
Box (continued)
|
|
|
|

|
|
|
|
|
The cost performance of low carbon technologies is improving over time, which means that they would be able to cover an increasing part of their costs through the market in the future. This is explained by research and innovation efforts that decrease the cost of technologies over time as well as the expectation of increasing fuel prices and CO2 prices in the long run. For mature technologies such as onshore wind, market revenues as modelled with the optimistic assumptions presented in Box III.1.2 would be sufficient to cover investment costs by 2020 and 2030.
Nonetheless, most of the low carbon technologies will not be competitive during the transition phase. A price gap is likely to remain for less mature low carbon technologies until 2030, which will prevent them to cover their total cost with market revenues. This means that investors would not have incentives to invest in low carbon technologies under these market conditions, unless the price gap is expected to be covered over time.
|
Graph III.1.6:Estimated mark-ups for low carbon technologies with Open gas Cycle Turbine as a marginal producer
|
|

|
|
Source: European Commission
|
1.3.Concluding remarks
The success of the transition depends on the capacity of the low carbon technologies to reduce their costs and to improve their integration into the power system. The cost performance of low carbon technologies is improving over time due notably to learning effects. Nonetheless, most of low carbon technologies will not be competitive during the transition phase which means that investors would not have incentives to invest in low carbon technologies under these market conditions, unless the price gap is expected to be covered over time.
Under the current market arrangements which include institutional barriers, the increasing penetration of low carbon technologies is changing the way the market is functioning. In the short to medium term, further investments in low carbon technologies are likely to result in price decreases. Without parallel exit of sufficient conventional capacity, this would also result in over-capacities that would further decrease prices. Both effects would contribute to the emergence of specific investment challenges to be addressed.
As the energy transition approaches completion, the cost structure effect of low carbon technologies is setting prices for most part of the year, putting a strong emphasis on very high (and/or frequent) price spikes to allow recoup investment costs. Considering the uncertainty of these price spikes, notably due to factors such as public acceptance, regulatory intervention to prevent market power, low price caps set in power markets, the cost structure effect of low carbon technologies risks being dominating which could induce a lower equilibrium price on the wholesale market, challenging further the way investment costs are recouped. This development would be influenced by the carbon price.
The investment conditions for new technologies will be evolving significantly as the energy transition progresses (see chapter III.1). Investment decisions are system dependent. Therefore, for investments to happen, it requires market frameworks that match over time the economics of power systems with higher levels of decarbonisation.
This chapter analyses the investment conditions in two power systems representatives of the middle point and end point of the energy transition: power systems under decarbonisation and decarbonised power systems. This corresponds to the transition phase and decarbonised phase of section III 1.1 respectively. Section 1 summarises investment challenges for the transition phase and investigates possible market arrangements to strengthen the market framework. Section 2 performs a similar analysis for the decarbonised phase. Section 3 concludes.
2.1.Current trends
A well-integrated internal energy market with increasing demand response and decarbonisation of energy supply is the cornerstone of the EU strategy to achieve a low carbon economy by 2050.
The starting point of this analysis is, therefore, the current market model pursued in the European Electricity Target Model () and characterised by an increased integration of power markets at EU level with more cross-border interconnections and enhanced regional cooperation. Under this market framework, prices are determined under the marginal cost pricing principle, although wholesale prices are currently capped either by regulations or through rules imposed by power exchanges. Demand response is progressively deployed pushed notably by the regulatory framework ().
The current market framework also includes CO2 pricing through the European Emission Trading System (ETS). The European Council has agreed to strengthen the ETS through the introduction of a market stability reserve and a faster reduction of the number of allowances as of 2021, by increasing the annual linear reduction factor which determines the EU ETS cap.
The market framework is also complemented by various interventions on the market. For instance, national market support schemes aim at fostering investments in low carbon technologies. Capacity mechanisms in some Member States aim at incentivising investments to ensure that a sufficient amount of capacity will be available. Rules for both types of support schemes are included in the guidelines on State aid for environmental protection and energy 2014-2020 and a number of Communications from the Commission ().
2.2.Challenges for investments and options in power systems under decarbonisation (transition phase)
2.2.1.Challenges
A key challenge for investors under the transition phase might be the decrease of market revenues triggered by the penetration of low carbon technologies. This phenomenon is due to the capacity adjustment and revenue reduction effects identified in section III 1.1. This expected decrease in market revenues might risk stifling investments and/or increasing their cost through higher market premiums, while deteriorating the financial positions of existing power plants. At the same time, the risk of "non-investments" due to the decrease of market revenues might place a risk of security of supply and of increasing need for market support with impact on consumer bills and potentially also on public finances.
Less mature low carbon technologies will continue to suffer from a price gap that will prevent them to cover their total costs from market revenues during the transition phase (). Investments in these technologies will therefore not take place under market conditions. This poses a challenge to public authorities to improve the cost-effectiveness of support schemes and make them more market-based, and to integrate low carbon technologies in the market. This effect will be enhanced by the revenue compression occurring when the share of low carbon technologies is increased.
Under the transition phase, there will also be a need to manage an over-capacity in generation. As the energy transition is pushed by the policy objective of decarbonisation, this will mean that there will be an overcapacity in fossil fuel generation to manage, while maintaining security of supply through investments in flexibility solutions such as demand response, flexible generation, storage and grid expansion. Disinvestments are currently taking place limited to some extent by existing exit barriers and mostly in gas-fired power plants as a result of low wholesale and CO2 prices together with low coal and higher gas prices. This may pose a challenge in terms of security of supply as these gas plants are the most flexible generation units, which play a key role in maintaining the reliability of the power system ().
2.2.2.Different forms of market arrangements
The investment challenges identified above would intensify without adjustments to the current market framework as the decarbonisation of the European power systems progresses through the transition phase in line with the EU Energy and Climate Agenda.
The effectiveness of the market framework can be analysed through the following dimensions: level of price and market risks for an investor, degree of public intervention and level of competition. An additional issue is how to strengthen price signals based on market arrangements to cover the price gap that remains for some low carbon technologies in the most effective way, while incentivising investments in flexible solutions to ensure security of supply.
By definition, the objective of market arrangements should be to minimise public support in order to make the penetration of low carbon technologies cost effective for consumers and society at large. Market integration and price signal are obvious solutions as they would incentivise investments when necessary while increasing competition. More challenging is to address the competitiveness gap of most of new low carbon technologies. The carbon price is expected to orient investments towards clean technologies. However, its low level might not be sufficient to trigger these investments. Any other form of interventions would need to be designed in a way that would not weaken the wholesale market price signal.
In this context, i.e. during the transition to a decarbonised system, three strands of market arrangements could be explored:
Reinforcing the price signal through scarcity pricing
Reinforcing the price signal to orient investments in clean technologies through the carbon price
Continuing European Market Integration to reduce market fragmentation and benefit from economies of scale and scope
Reinforcing the price signal through Scarcity pricing
Market prices, if not restricted, signal the market value of investments according to the need of the system. When investments are needed in order to cope with sudden demand or supply variations, prices will be allowed to increase during these times thereby indicating to potential investors the need, through scarcity prices, for solutions with the right characteristics (e.g. flexible power plants, demand response, storage).
Limiting the price signal () undermines the capability of the market to generate scarcity prices, thereby limiting the rents that are required to cover the total costs of investments. This leads to a shortfall of revenues to finance new generation investment. Higher price variability is also important for demand response, as it acts as an incentive for consumers to become active during critical periods, while also incentivising the use of storage.
Wholesale prices could therefore be allowed to reflect consumers’ willingness to pay and to value investments according to the needs of the system in order to ensure welfare maximisation. An indicator for this willingness to pay is the Value-of-Lost-Load (VOLL). Accurately estimating VOLL is challenging as it depends on multiple factors such as the type of customer affected, regional economic conditions and demographics, time and duration of outage, and the structure of economic activities etc. ()
Reinforcing the price signal to orient investments in clean technologies through the carbon price
Investment in electricity is expected to play a fundamental role in the decarbonisation of the economy. The external costs of low carbon technologies is lower than that of fossil fuels and the market price should be able to reflect the overall different social costs of the technologies. The carbon price changes the relative costs between technologies (see Chapter II.2) and it helps to reduce emissions in a cost effective way. Hence, a sufficiently high carbon price would induce a switch to cleaner energy sources (i.e. switch from coal to gas and/or renewables).
Achieving high levels of decarbonisation in the power sector requires a portfolio of low carbon technologies. Several of these key technologies will not yet have reached a sufficient cost performance during the transition phase to generate enough revenues to cover their total costs. The CO2 price in the ETS will increase the cost of fossil fuel based technologies, and thereby contribute to cover the relative price differential of less mature low carbon technologies. It improves the competitiveness of low carbon technologies, and thus supports the energy transition. The recently agreed reforms of the ETS as of 2020 are expected to strengthen the carbon price signal (see Box III.2.1).
The need for additional price mark-up will diminish over time as the competitiveness of low carbon technologies is improved. A higher CO2 price in the ETS, which is likely in the long run, would also contribute (graph III.2.1). Mature technologies such as wind on-shore will not require additional support towards 2020. For less mature technologies, the additional CO2 price required by 2020 would range from 50 to 150 EUR per tonne of CO2 on top of the 20 EUR/tCO2. By 2030, the mark-up is reduced for most of the low carbon technologies due to learning effects. The price differential ranges from 20 to a bit more than 50 EUR/tCO2 on top of the CO2 price assumed in the reference case. These estimates are only indicative and should be read as an order of magnitude.
|
Graph III.2.1:Estimated mark-ups in EUR/tCO2 for low carbon technologies under a marginal price regime
|
|

|
|
Source: SETIS (2015), Own calculation
|
Continuing European Market Integration
Market integration is fundamental to ensure optimised and cost-effective investments for the energy transition. The interconnections contribute to a better utilization of existing transmission infrastructure and help to reduce the intermittency of supply induced by variable technologies, hence reduce price volatility. The increase in the size of the energy market also reduces the need for investment in back up generating capacity and provides greater liquidity of wholesale markets. Finally, it increases competition among generators ().
The expected benefits of market integration translate into cost and price reduction for consumers. Increased competition is expected to decrease mark-ups, which translates into lower prices. Empirical analysis shows that market opening and competition appear to have significant downward effects on consumer prices (both households and industry) (). In addition market integration contributes to lowering costs. According to some estimates, the net economic benefits from the completion of the internal market mainly refers to cost savings () and ranges from 13 to 40 billion Euros per year by 2030. () The basis for these estimates is a higher level of market integration than today through market coupling, that remains based on national self-sufficiency with only short term arbitrage.
Price convergence is another expected outcome of market integration as domestic and foreign prices should progressively equalise according to the most efficient supplier (). Hence, the degree of price convergence is used as a good indicator of market integration. However, in the case of electricity, national factors such as the energy mix play an important role and will influence the resilience of economies to external price shocks. Despite these limitations, in well-functioning markets, the convergence of retail price should mirror the convergence of wholesale prices.
|
|
|
Table III.2.1:Dispersion* in the EU electricity sector: price and market support
|
|

|
|
Source: Platts, Ecofys, Eurostat
|
|
|
Electricity wholesale market exhibits low price dispersion. The dispersion of the day-ahead wholesale price in thirteen European power exchanges () was about 20% in the 2008-2014 period. The day-ahead price convergence is even higher within the seven regional markets launched in 2006 by the European regulators, with price dispersion levels below 10% () (Table III.2.1).
Retail price dispersion has increased between 2008 and 2014 for industrial customers and households. It is also higher than for the wholesale market, which can be explained by the fact that taxes and levies are managed at national level. Nevertheless, price dispersion remains higher even when taxes and levies are excluded, indicating that the relative higher dispersion of retail prices can be attributed to other factors than the fragmentation of the wholesale market (Table III.2.1).
By contrast, the high dispersion of public support reflects the fragmentation of the market (Table III.2.1). A large part of the incentives for investments in security of supply and decarbonisation are promoted through public support within national borders. The dispersion shows consistent high levels from 2008 to 2012, reflecting the management of these schemes at national level.
2.2.2.1.Instruments
Considering the long life time of energy investments, the long term evolution of the economics of the power system should be accounted for when selecting market arrangements in the short to medium term. In particular, the decrease in market prices due to the increased penetration of low carbon technologies, as described under section III 1.1, is expected to intensify as European power systems complete their decarbonisation process. This can be foreseen to have a strong impact on market revenues.
Reinforcing price signal and market integration are a way to drive further the energy transition in a cost effective way. The different strands of market arrangements can be implemented in different ways. Scarcity pricing could be implemented, for instance, by setting price caps at VoLL or implementing scarcity pricing through Operating Reserves (). Similarly, different degrees of harmonisation could be considered regarding the Europeanisation of market interventions (Graph III.2.2). For instance, under the full harmonisation option, design elements of low carbon technology market support or capacity remunerations schemes such as eligible technologies, capacity cap, support and duration levels, operating rules would be decided and implemented at EU level. The minimum harmonisation option is similar to the approach currently undertaken through the State Aid guidelines for environment and energy. In this case, all the design elements and operating rules of the schemes remain determined at national level. However, they could follow guidelines at EU level that also impose minimum requirements such as cross-border participation, competitive allocation of support, competition between technologies, and requirements to ensure beneficiaries are integrated into the market.
|
Graph III.2.2:Degree of harmonisation of national market intervention
|
|

|
|
Source: European Commission
|
R&I support and market pull measures need to be synchronised to effectively unlock the cost reduction potential of less mature low carbon technologies, flexible solutions and demand services. Relying on market based instruments is critical in this period of transition in order to ensure that investments are guided by the specific needs of the system through the indication of the price signals. This will give benefits from competition to keep cost in check. Other gains include promotion of innovation in technologies, services and business models.
|
|
|
|
|

|
|
|
|
(Continued on the next page)
|
|
Box (continued)
|
|
|
|

|
|
|
|
(Continued on the next page)
|
|
Box (continued)
|
|
|
|

|
|
|
|
|
2.3.Challenges for investments and options under decarbonised power systems (decarbonised phase)
2.3.1.Challenges
In a future decarbonised system, the effectiveness of the market framework can also be assessed through the incentives investors get from market signal, the degree of public intervention and the level of competition. Compared to stage 2, most of technologies are expected to have become competitive.
The cost structure of the technology mix of decarbonised power systems will exhibit decreasing average cost trend due to fact that low carbon technologies have low variable costs and fixed costs constitute more than 2/3 of the overall costs (see chapter II.2). Nonetheless, conventional capacity will be needed to meet high demand and account for resource availability and the lack of firmness of some low carbon technologies. This will result in merit order curves with steep ends.
When technologies display decreasing average costs and positive fixed costs, assuming perfect competition, marginal pricing may default to produce sufficient revenues to cover the fixed costs of the technologies (). The main reason as discussed under Part III.1.1 and shown under graph III.2.4 is that the marginal cost never crosses the average cost, hence pricing at marginal cost would lead to an economic loss for generators. This is a noticeable difference with a conventional power system as shown in Graph III.2.3, which exhibit increasing average costs that allows for an equilibrium to be found between the marginal cost, average cost and demand. This revenue shortfall will be strongly dependent on the frequency and intensity of price spikes in the future. However, in the decarbonised phase, it is uncertain if these price spikes will be feasible and enough or allowed to be high enough to recoup the fixed costs.
Under the decarbonised phase, the decreasing level of CO2 emissions of the technology mix will reduce the social cost of the power system. . In a decarbonised system which mainly applies clean technologies on the margin, the carbon price will have less influence on wholesale market prices. As a result, the role of the carbon price to generate infra-marginal rents for low-carbon technologies can be expected to be reduced.
|
Graph III.2.3:Cost structure of the technology mix under conventional power system
|
|

|
|
Source: European Commission
|
|
Graph III.2.4:Cost structure of the technology mix under the decarbonised phase
|
|

|
|
Source: European Commission
|
2.3.2.Different forms of market arrangements
As in the previous phases, the effectiveness of the market framework needs to take account of the price signal for an investor, the degree of public intervention and level of competition, while maximising the overall social welfare. In the decarbonised phase, low carbon technologies are expected to be competing on the market. Investments in a market environment characterised by technologies with high fixed costs and low variable costs will depend on the price signals and their ability provide remuneration to compensate for the structural revenue gap induced by this cost structure and uncertainty related to price spikes.
In this phase, the transition is assumed to have been successfully completed, and the objective of market arrangements would be to ensure security of supply in the short and long run. There are currently few markets in the world which are dominated by low carbon technologies, but their experience shows that ensuring investment in the long term is a crucial issue (see box III 2.2). Any market arrangements should be able to deliver long term investments without relying on state interventions or guarantees.
|
|
|
|
|

|
|
|
|
(Continued on the next page)
|
|
Box (continued)
|
|
|
|

|
|
|
|
|
Three separate strands of market arrangements could be further explored in view of a future fully decarbonised power system:
Reinforcing the price signal through scarcity pricing
A wholesale market complemented by an EU wide capacity market
An EU wide market for long term contracts based on average cost pricing
Reinforcing the price signal through scarcity pricing
Reinforcing the price signal through scarcity pricing will become essential in decarbonised power systems as the high share of low carbon technologies coupled with high demand response will tend to result in very low prices during most part of the time. Prices should then be allowed to indicate accurately and visibly through scarcity prices the specific needs for the proper functioning of the power system in the short run for periods of scarcity (e.g. to trigger demand response, storage and other forms of flexible solutions) and in the long run (e.g. to foster investments).
A wholesale market complemented by an EU wide capacity market
The main feature of such a market arrangement would be to develop, besides the wholesale market, a market for capacity where producers would contract out and be able to get a return on the availability of their capacity. Under this configuration, the wholesale market is kept to ensure efficient short-term dispatching and as an indicator of the real time value of each energy assets for signalling specific investment gaps (e.g. in peak or base load, flexible etc.).
An EU wide market for long term contracts based on average cost pricing
The main feature of this market arrangement would be to shift competition from the spot market - competition in the market - to a long term contract market - competition for the market. Under this configuration, suppliers are required to cover their forecasted demand through long-term contracts with low carbon generators and flexible solution providers. In exchange, generators receive long term contracts with conditions and terms allowing them to recover the total costs of their investments. The short-term market in this context acts as a balancing market to settle imbalances arising from contractual differences between generators and suppliers.
Some regions of the world such as Latin America, where power systems are dominated by low carbon technologies, namely hydropower, have adopted markets for long term contracts. One of the main reasons often cited for this change in market structure is related to the effect of hydropower plants () on price signals. Under power systems dominated by hydropower, it was observed that prices mask structural supply problems. As a result, price increases only when the power system is about to fail, for instance due to a drought that reduces the outputs of hydropower plants, which does not allow enough time to make investments. (See box III.2.2). Such market form shows noticeable difference with today's EU markets as, in particular, it replaces the wholesale market and there is no carbon market.
2.4.Concluding remarks
EU power systems have entered an era of profound changes. The cost structure of low carbon technologies is increasingly influencing the price formation on the wholesale market, and thereby the incentives to invest in energy assets. Therefore, there is a need to ensure that market designs are not carved in stone but evolve with the energy transition.
In the short to medium term, the critical challenges are (i) to trigger investments in low carbon technologies while making public support more focused and market-based, (ii) to avoid (structural) over/under capacity, while investing in flexibility solutions and (iii) to foster the competitiveness of low-carbon technologies. For this, scarcity pricing, reinforcing CO2 prices, and continuing the market integration are options to strengthen price signals to drive investment and improve the efficiency of the current market framework. Hence, these options are solutions that can improve the market functioning both in the shorter and longer term.
In the long term, it is uncertain whether wholesale prices based on existing market arrangements will be able to provide the revenues necessary to cover the total costs of investments and thereby incentivise investments in low-carbon generation. In this context, the market design might need to evolve, which could entail, for example, scarcity pricing, European efficient and integrated markets, and, when needed, an increasing reliance on long term contracts or some form of capacity markets. On the latter option, it remains unclear to which extent the market itself, under current arrangements, can cater for this development e.g. through the development of new forms of contracts. These changes of the market frameworks can be expected to be needed in the next decades. Considering the inertia of the energy system and life time of energy assets, this calls for starting a reflection already now on these long term issues related to the electricity market design at the EU level.
ACER (2013), Capacity Remuneration Mechanisms and the Internal Market for Electricity, ACER Report
Alesina, A., S. Ardagna, G. Nicoletti and F. Schiantarelli (2005), "Regulation and investment", Journal of the European Economic Association 3(4): 791-825
Baritaud, M. (2012), "Securing Power during the Transition: Generation Investment and Operation Issues in Electricity Markets with Low Carbon Policies", IEA Energy Papers, No. 2012/13, OECD Publishing.
Blyth, W., D. Bunn, M. Chronopulos and J. Munos (2014), "Systematic Analysis of the Evolution of Electricity and Carbon Markets under Deep Decarbonisation". Norwegian School of Economics, Department of Business and Management Science Research Paper Series, n° 2014/39
Boot, P.A. and B. van Bree (2010), "A zero-carbon European power system in 2050: proposals for a policy package", ECN-E-10-041, April 2010
Booz & Company (2013) "Benefits of an Integrated European Energy Market", 20 July 2013.
Brett, M. F. and CH. Hogendorn (2015), "The Marginal Cost Controversy", Journal of Economic Perspectives — Volume 29, Number 1 — Winter 2015 — Pages 193–206.
Caldecott, B. and J. McDaniels (2014), "Stranded Generation Assets: Implications for European Capacity Mechanisms", Energy Markets and Climate Policy Working Paper. University of Oxford’s Smith School of Enterprise and the Environment - January 2014
Castalia Strategic Advisor (2013), "International Experience with Single Buyer Models for Electricity" - Report to Contact Energy - August 2013
Cochran, J., M. Miller, M. Milligan, E. Ela, D. Arent and M. Fuctch (2013), "Market Evolution: Wholesale Electricity Market Design for 21st Century Power Systems".
Commissariat Général à la stratégie et à la prospective CGSP (2014), "The Crisis of the European Electricity System - Diagnosis and possible ways forward" - January 2014
Crampton, P., A. Ockenfels and S. Stoft (2013), "Capacity Market Fundamentals", Economics of Energy & Environmental Policy, 2:2.
De Castro, J.N., R. Brandão, S. Marcu and G. Dantas (2010), Market Design in Electric Systems with High Renewables Penetration". Grupo de Estudos do Setor Eletrco, working paper presented at International Conference on Applied Business & Economics.
DECC (2011), "Electricity Market Reform – Options for Ensuring Electricity Security of Supply and Promoting Investment in Low-carbon Generation" - 12 July 2011
ECF (2012), "From Roadmaps to Reality" process, Briefing note for discussion - Theme 3: wholesale power markets, 2012.
ECOFYS, S. A. (2014), "Subsidies and costs of EU energy". ECOFYS.
EMCC (2009), Results of the first 25 days of Nordic-German tight volume market coupling", Press Release Hamburg, 4 December 2009.
ENTSO-E (2014), "Market Design Policy Paper". Brussels.
Eurelectric (2011), "Integrating Intermittent Renewable Sources into the EU Electricity System by 2020: Challenges and Solutions". Brussels: Eurelectric documents.
Eurelectric (2014), "Renewable Energy and Security of Supply: finding Market Solutions". Eurelectric Report.
Eurelectric (2015), "A reference model for European capacity markets", March 2015.
European Commission (2008), Commission Staff Working Document, "Second Strategic Energy Review - an EU Energy Security and Solidarity Action Plan, Energy Sources, Production Costs and Performance of Technologies for Power Generation, Heating and Transport". SEC(2008) 2872
European Commission. (2011). "Impact Assessment accompanying the Communication Energy Roadmap 2050", SEC(2011) 1565/2 and SEC(2011) 1565.
European Commission (2012), "The state of the European carbon market in 2012", COM(2012)652.
European Commission (2013a), Staff Working Document "Generation Adequacy in the internal electricity market - guidance on public interventions", SWD(2013) 438
European Commission (2013b), Commission Staff Working Document, "Incorporating Demand Side Flexibility, in particular Demand Response, in Electricity Markets". SWD(2013) 442
European Commission (2013 c), Communication Delivering the Internal Energy Market in Electricity and making the most of Public Intervention, COM(2013) 7243.
European Commission (2013 d), Staff Working Document "Guidance on the use of renewable energy cooperation mechanism", SWD(2013) 440
European Commission (2014a). "Electricity Tariff Deficit: Temporary or Permanent Problem in the EU?" European Economy, Economic Papers 543.
European Commission (2014b). "Energy Economic Development in Europe", European Economy 1/2014.
European Commission (2014c). "Infrastructure in the EU: Developments and Impacts on Growth", European Economy, Occasional Papers 203 | December 2014.
European Commission (2014d) – "Guidelines on State aid for Environmental Protection and Energy 2014-2020" (2014/C 200/01)
European Commission (2014e), Communication "Progress Towards Completing the Internal Energy Market", COM(2014) 634 final
European Commission (2014f) - IMPACT ASSESSMENT – "Energy Efficiency and its contribution to Energy Security and the 2030 Framework for Climate and Energy Policy", SWD(2014) 255
European Environmental Agency (2014), Trends and projections in Europe 2014; "Tracking progress towards Europe's climate and energy targets for 2020", EEA Report, No 6/2014.
EUROSTAT (2015), Newsrelease 10 February 2015.
Eyraud, L., A. Wan, C. Zhang and B. Clements (2011), "Who's going Green and Why? Trends and Determinants of Green Investments", WP/11/296, IMF.
Finon D. (2013), “The Transition of the Electricity System Towards Decarbonisation: the need for change in the market regime”, Climate Policy, Vol. 12(2012), pp. 1-16.
Finon, D., & Roques, F. (2013), European Electricity Markets Reforms: the "Visible Hand" of Public Coordination. Chaire European electricity Markets CEEM Working Paper.
Genoese, F. and C. Egenhofer (2015), "Reforming the Market Design of EU Electricity Markets: Proposals to address the Challenges of a Low-Carbon Power Sector", CEPS Task Force Report.
Giuli, M. (2015), "Capacity mechanismes – A credibility test for the Energy Union", Policy Brief, European Policy Centre (EPC).
Green, R. (2004), "Did English Generators Play Cournot? Capacity withholding in the Electricity Pool,"
Working Papers
0410, Massachusetts Institute of Technology, Center for Energy and Environmental Policy Research.
Green, R. and N. Vasilakos (2011), "The Long-term Impact of Wind Power on Electricity Prices and Generating Capacity", University of Birmingham - Discussion Papers, (11)09.
Griffith, R. (IFS and CEPR) and R. Harrison (IFS) (2004), "The link between product market reform and macro-economic performance" European Economy n°209.
Grigorjeva, J. (2015), "Capacity mechanisms in the EU: Nationalizing Energy Security", Policy Paper N° 134, Jacques Delors Institut.
Haavelmo, T (1960), "A study in the Theory of Investment", The University of Chicago Press.
Hammons, T. J. (2011), "Market Mechanisms and Supply Adequacy in the Power Sector in Latin America, Electricity Infrastructures in the Global Marketplace", (Ed.), ISBN: 978-953-307-155-8, InTech, Available from:
http://www.intechopen.com/books/electricity-infrastructures-in-the-global-marketplace/market-mechanismsand-supply-adequacy-in-the-power-sector-in-latin-america
Hartley, P. and A. Moran (2000), "Marginal Costs and Prices in the Electricity Industry", IPA June 2000
Hauge, J. and D. Sappington (2010), "Pricing in Network Industries", The Oxford Handbook of Regulation.
Henisz, W.J. (2002), "
The institutional environment for infrastructure investment
,"
Industrial and Corporate Change
, Oxford University Press, vol. 11(2), pages 355-389.
Henisz, W.J. and A.Z. Bennet (2001), "
The Institutional Environment for Telecommunications Investment
,"
Journal of Economics & Management Strategy
, Wiley Blackwell, vol. 10(1), pages 123-147, 03.
Hope, E. (2005), "Market Dominance and Market Power - A Competition Policy Perspective", Konkurrensverkets uppdragsforskningsserie.
IDB FACT SHEET (2013), "Central American Electrical Interconnection System (SIEPAC) and Regional Electricity Market (MER)"
IEA (2003), "Power Generation Investment in Electricity Markets", OECD/IEA, Energy Market Reform.
IEA (2007), "Tackling Investments in Power Generation".
IEA (2008), "Global Energy Trends", Energy Outlook, Chapter 2, Table 2.3, page 84.
IEA (2014), "Energy Technology Perspectives 2014", Chapter 2, page 68.
IEA (2015), "Energy Technology Perspectives 2015".
Ishii J. and J. Yan (2004), "Investment under Regulatory Uncertainty: US Electricity Generation Investment since 1996". CSEM WP 127.
Jakubiak, J. (2004), "Marginal Cost Pricing Has Little Place in Electricity Regulation", 24th Annual North American Meeting of the USAEE/IAEE
Joint Research Centre. (2013), Technology Map of the European Strategic Energy Technology Plan 2013. JRC Science and Policy Reports.
Jorgenson, D.W. (1967), "Capital Theory and Investment Behaviour" in Determinants of Investment Behaviour by Robert Ferber, NBER p.129-175 , 1967
Kalantzis (2010), Market integration and price dispersion in the European electricity market, Energy Market (EEM), 2010 7th International Conference on the European
Keay, M. (2013), "The EU "Target Model" for Electricity Markets: fit for purpose?" Oxford Energy Comment. The Oxford Institute for Energy Studies.
Keay, M., J. Rhys and D. Robinson (2012), "De-carbonization of the Electricity Industry: Is there still a Place for Markets?" The Oxford Institute for Energy Studies.
Léautier, T. (2013), "The Visible Hand: Ensuring Optimal Investment in Electric Power Generation", IDEI Working Paper Series.
LEI (2013), "Estimating the Value of Lost Load" - Briefing paper prepared for the Electric Reliability Council of Texas, Inc. by London Economics International LLC, June 17th, 20138
Levy, B. and P.T. Spiller (1994), "
The Institutional Foundations of Regulatory Commitment: A Comparative Analysis of Telecommunications Regulation
,"
Journal of Law, Economics and Organization
, Oxford University Press, vol. 10(2), pages 201-46, October.
Linklaters (2014), "Capacity Mechanisms. Reigniting Europe's Energy Markets"
Maurer, L. T. A. and L. A. Barroso (2011), "Electricity Auctions: An Overview of Efficient Practices", World Bank 2011
Malik, A. and S. Al-Zubeidi (2006), "Electricity Tariffs based on long-run Marginal Costs for Central Grid System of Oman", Energy, 31 (12), 1703-1714
Mastropietro, P., C. Batlle, L.A. Barroso and P. Rodilla (2013), "Electricity Auctions in South America: Towards Convergence of System Adequacy and RES-E Support", IIT Working Paper. September 2013
Neuhoff K, (2004), "Large Scale Deployment of Renewables for Electricity Generation", OCDE, SG/SD/RT(2004)4.
Neuhoff K. and L. de Vries (2004), "Insufficient Incentives for Investment in Electricity Generation", Cambridge Working Papers in Economics CWPE 0428.
Neves Ferreira, P. (2013), "The Re-regulation Debate: Average vs. Marginal Pricing", Evanston, "Wholesale Electricity Markets - Hurdles to overcome" Northwestern University Workshop.
OECD/NEA. (2012), "Nuclear Energy and Renewables: System Effects in Low Carbon Electricity Systems".
OECD (2014), "The Patterns of Entry in the Generation Segment of the Electricity Supply Sectors of OECD Countries", WPIEEP (2014)8 final.
OECD (2015) (forthcoming), "Aligning Policies for the Transition to a Low Carbon Economy", SG/APT (2015)1.
Pikk P. and M. Viiding (2013), "The Dangers of Marginal Cost Based Electricity Pricing", Baltic Journal of Economics, 13:1, 49-62.
Pöyry for the European Wind Energy Association. (2010), "Wind Energy and Electricity Prices".
Ragwitz, M., J. Winkler, C., M.G. Klessmann and, G. Resch (2012), "Recent Developments of Feed-in Systems in the EU" – A research Paper for the International Feed-In Cooperation, A report commissioned by the Ministry for the Environment, Nature Conservation and Nuclear Safety (BMU) - January 2012
Rathmann, M. (2007), "Do support systems for RES-E reduce EU-ETS driven prices?", Energy Policy, (35)342-349.
Roques, F., D. Newbery and W. Nuttall (2005), "Investment Incentives and Electricity Market Design: the British Experience", Review of Network Economics, Vol. 4, Issue 2.
Rudinger A., T. Spencer, O. Sartor, M. Mathieu, M. Colomber and T. Ribera (2014), "Getting out of the Perfect Storm: Towards Coherence between Electricity Market Policies and EU Climate and Energy Goals", IDDRI Working Paper, n° 12/14.
SETIS (2015) available at
https://setis.ec.europa.eu/EnergyCalculator/
Staffell, I. and R. Green (2012), "Is there still a Merit in the Merit Order Stack?", Imperial College Business School.
Stern, N., (2007). "The Economics of Climate Change: The Stern Review", Cambridge and New York: Cambridge University Press.
Spiller, P.T. and I. Vogelsang (1993), "Regulation without Commitment" Boston University - Industry Studies Programme.
Stoft, S. (2002), "Power System Economics: Designing Markets for Electricity", IEEE Press.
Tennbakk, B., J-B. Lafitte, P. Capros, C. Delkis, N. Tasios and M. Zabara (2013), "Capacity Mechanisms in Individual Markets witin the IEM", Cowi, E3M-Lab, THEMA.
The Economist, "How to lose half a trillion euros - Europe's Electricity Providers face an Existential threat", (2013, October 13).
Tobin, J. (1958a), "Estimation of Relationships for Limited Dependent Variables". Econometrica (The Econometric Society) 26 (1): 24–36.
doi
:
10.2307/1907382
.
JSTOR
1907382
.
Traber, T. and C. Kemfert (2011), "Gone with the wind? - Electricity Market Prices and Incentives to Invest in Power Plants under Increasing Wind Energy Supply". Energy Economics, (33) 249-256.
Vagliasindi, M. (2012), "Key Drivers of PPPS in Electricity Generation in Developing Countries", Policy Research Working Paper 6118, The World Bank.
Vassilopoulos, P. (2007), "Les Prix des Marchés de Gros de l'Electricité Donnent-ils les Bons Signaux et les Bonnes Incitations pour l'Investissement en Capacité de Production Electrique?", Thèse de doctorat; Université Paris Dauphine.
Varian, H.R. (1996), "Differential Pricing and Efficiency", First Monday peer-reviewed Journal on the Internet, Volume 1, Number 2 - 5 August 1996
Vyre, C. V. (2014), "Financial Investors and the Unbundling Provisions for TSOs", European Energy and Environmental Law Review.
Weron, R. (2006), Modeling and Forecasting Electricity Loads and Prices. Wiley Finance.
Hogan, W.W. (2013), "Electricity Scarcity Pricing Through Operating Reserves" Working paper in Economics of Energy and Environmental Policy, Volume 2 – Number 2
Wilde, D. (2011), "How Reliable is the Price Forming Mechanism on the European Energy Exchange (EEX) for the German Wholesale Electricity Market?", University of Dundee.
Adequacy: power generation (or supply) adequacy can be defined as the ability of the system to meet the aggregate power and energy requirement of all consumers at virtually all times.
Ancillary Services: are those services necessary to support the transmission of capacity and energy from resources to loads while maintaining reliable operation of the transmission service provider in accordance with good utility practice. They refer to a range of functions which TSOs contract so that they can guarantee system security. These include black start capability (the ability to restart a grid following a blackout); frequency response (to maintain system frequency with automatic and very fast responses); fast reserve (which can provide additional energy when needed); the provision of reactive power and various other services. Some are serviced through markets, simultaneously cleared with energy markets; others are serviced through cost-based mechanisms and do not have markets.
Balancing refers to the situation after markets have closed (gate closure) in which a TSO acts to ensure that demand is equal to supply, in and near real time.
Base load plants: they are those plants that run continuously all year round with a steady load. In the EU they are the lignite fired conventional plants, gas fired combined cycle generation, and, wherever possible, nuclear plants.
Baseload: it is the minimum basic amount of electricity needed to meet demand.
Capacity factor: the ratio of the total energy generated by a generating unit for a specified period to the maximum possible energy it could have generated if operated at its maximum capacity rating for the same period (NERC).
Conventional plants: the term refers to the non-low carbon technologies, based on fossil fuels (lignite, hard coal, natural gas, oil). They usually constitute the mid-range and peaking plants.
Capacity mechanism: capacity mechanisms in general reward capacity providers for their ability to deliver electricity when needed, rather than the actual delivery of electricity, even though various models exist. A capacity market does not need price spikes to induce investments.
Demand response: refers to a mechanism that enables consumers to change voluntary their consumption pattern in response to market signals.
Dispatchable generation: is electricity produced by those generating plants that can be turned on or off, or can adjust their output at the request of the power grid operators. This is not the case, for example, with some types of base load generation like nuclear power, which can't easily adjust its generation on demand; or some renewable sources like wind power, which can't be controlled by operators. Dispatachable generation is used in order to (but is not limited to) meet peak demand.
Firm capacity is the amount of energy available for production or transmission which can be (and in many cases must be) guaranteed to be available at a given time. Of the firm capacity available, the actual energy guaranteed to be available is referred to as firm energy. Nonfirm energy, in contrast, refers to all available energy above and beyond firm energy.
Flexibility is the ability to reconcile volatile consumption and volatile generation. This implies a capability (e. g. ramping), coupled with a high level of controllability and reliability / availability of the power system.
Gate closure: the moment when contracts are frozen. After gate closure, no trading is allowed anymore for the day-ahead. At this point, parties are expected to adhere to the physical data submitted to the System Operator and to the contracted volumes submitted before Gate Closure.
Imbalances: an imbalance occurs whenever there is a mismatch between the quantity of electricity traded on the spot (day ahead) market and the actual generation/consumption when contracts are executed. For example, generators may physically produce more or less energy that they have sold and suppliers (through their customer demand) may physically consume more or less energy than they have purchased. These surpluses and deficits are referred to as imbalances.
Inframarginal rent: inframarginal rent refers to the rent earned by all generation sources utilized to serve demand that have lower marginal costs than the marginal generation source. The final price for electricity will be, in fact, the marginal cost of the last generator needed to meet demand, and all other generators in the merit will be able to earn the difference between their marginal costs and the final electricity price.
Load factor: it can be defined as either: (i) the number of hours of electricity generated over the year divided by the total number of hours in the year; or (ii) the amount of generation (in MWh) produced during the year divided by the theoretical maximum production during the year.
Load: is the total electricity demand.
Mega Watt (MW): is the most common unit of measure of electricity. It corresponds to the power needed to light approximately 750-1000 homes.
Peaking plants: plants that are characterised by low fixed costs and high marginal costs. They also have rather long booting periods.
Ramp up: in electricity jargon it means "increase output".
Scarcity rent: it is the rent earned by electricity generators during scarcity periods, that is: periods when demand cannot be met by increased supply. The electricity price during scarcity periods can increase dramatically.
Spin: is the increase in output that a generator can provide/back down in a very short period (usually 10 minutes).
|
|
|
Table A1.1:Investment model
|
|

|
|
Source: European Commission
|
|
|
The relationship between electricity wholesale prices, electricity demand, imports, exports, renewables and other external factors (Brent oil, Coal-ARA, Natural Gas-TTF and carbon prices) on a monthly basis over the period September 2007- July 2014 is examined for 13 EU day-ahead electricity markets (Austria, Belgium, Germany, Denmark, Greece, Spain, Finland, France, Italy, The Netherlands, Portugal, Sweden, United Kingdom). The objective is to see whether there is a long term relationship between some of these variables and how they relate to each other. For this purpose, a panel analysis is employed, consisting of three main steps: First, the order of integration of all variables is tested. Second, after having determined the order of integration in the series, heterogeneous panel co-integration tests were used to investigate whether a long term relationship between the variables in question exists. Third, in case of a long term relationship, a panel based error correction model is developed in order to identify the short and long-run causal relationship between the variables examined.
A2.1.Methdology
Panel Unit Root Tests
A number of unit root tests have been developed for establishing the order of integration of series in a panel context. The most common of them are Levin, Lin and Chu (2002), Breitung (2000), Im, Pesaran and Shin (2003), Fisher-type tests using ADF and PP tests-Maddala and Wu (1999), Choi (2001), and Hadri (2000). These tests present many similarities with the unit root tests used on single series.
The basis of panel unit root test is to identify if there are restrictions on the autoregressive process across cross-sections or series. This can be tested based on the following AR(1) process for panel data:
(1)
where i stands for cross-section units or series, that are observed over periods t.
The Xit represent the exogenous variables in the model, including any fixed effects or individual trends, ρi are the autoregressive coefficients, and the errors are assumed to be mutually independent idiosyncratic disturbance. If , is said to be weakly (trend-) stationary. On the other hand, if |ρi|=1 then Yi contains a unit root.
For purposes of testing, two additional assumptions can be made. First, one can assume that the persistence parameters are common across cross-sections so that ρi=ρ for all. The Levin, Lin, and Chu (LLC), Breitung, and Hadri tests all employ this assumption. Alternatively, one can allow ρi to vary freely across cross-sections. The Im, Pesaran, and Shin (IPS), and Fisher-ADF and Fisher-PP tests are of this form.
The results of the LLC, IPS, Fisher-ADF, and Fisher-PP, Breitung and Hadri panel unit root tests, for each of the variable, are presented in Table A2.1. The test is performed both for the level and first difference of electricity wholesale prices (PSPOT), electricity demand (ELDEM), electricity imports (IMP) and exports (EXP), the share of RES in total electricity production (SHRES), the Brent crude oil (POIL), the Coal ARA (PCOAL), the natural gas-TTF (PNG) and the carbon prices (PCO2).
|
|
|
Table A2.1:Panel unit root test results
|
|

|
|
Source: Commission Services
|
|
|
The tests are rather inclusive in levels regarding stationarity. The null hypothesis of a unit root cannot be rejected for Hadri tests for all variables and for the LLC and Breitung tests for some variables, including the wholesale electricity prices, electricity demand and imports, share of renewable and the carbon prices. Only the exports of electricity can be considered as stationary variable in levels. After taking the first difference of the first set of variables that found to be non-stationary, the tests indicate that the series become stationary at 1% confidence level. Thus, the results are fairly conclusive on regards first differences and indicate that these variables are non-stationary in levels, and become stationary only in first differences, which mean that they are integrated of order one or I(1).
Panel Co-integration Tests
After taking into account the results of the panel unit root tests, the next step involves the test for co-integration of the variables in question based on the heterogeneous panel co-integration techniques developed by Pedroni (1999) and Kao (1999), which allow for cross-sectional interdependence with different individual effects. Both have extended the Engle-Granger framework on co-integration analysis by adjusting the analysis in panel data. These tests are considered as improvements of conventional tests due to the increasing power of the panel co-integration tests (Rapach and Whohar, 2004). Pedroni (1999) proposes two types of residual-based tests for panel co-integration. The first type tests, including panel v-statistic, panel ρ-statistic, panel PP-statistic and panel ADF-statistic, provide within estimations and follow a standard normal asymptotically distribution. The second type tests, including the group r-statistic, the group PP-statistic and the group ADF-statistic, are also asymptotically normal distributed tests. Compared to the first type test, they provide between estimations as they pool the residuals for the between-group.
According to Pedroni (1999) the following general specification can be used to test for co-integration. It allows for heterogeneous intercepts and trend coefficients across cross-sections:
(2)
where i stands for cross-sections, t for time periods and αi and δi are individual and trend effects, respectively, Yit is the electricity wholesale price and Git is a vector of the other explanatory variables. Under the null hypothesis of no co-integration, the residuals eit will be I(1). The Kao test follows the same basic approach as the Pedroni tests, but specifies cross-section specific intercepts and homogeneous coefficients on the first-stage regressors. In addition, Maddala and Wu (1999) used Fisher’s result to propose an alternative approach to testing for co-integration in panel data by combining tests from individual cross-sections to obtain at test statistic for the full panel.
Overall, it can be concluded that there is a panel long-run equilibrium relationship between the variables examined each time. Taking into account the non-stationarity property of all the variables and the aforementioned residual panel co-integration tests, the Pedroni’s (2004), the Kao’s (1999) and the combined Johanshen and Fisher tests were used to establish whether a long-run relationship exists.
Table A2.2 reports the within and between dimensions of the panel co-integration tests, the Kao's test and the Johanshen- Fisher panel co-integration test. The results of heterogeneous panel tests indicate that the null of no co-integration between variables in Model 1 and these of Model 2 can be rejected at the 1% significance levels in all tests. In fact, the combined Johansen and Fisher tests imply that there might be up to two co-integrating relationships among the variables of the two models. For both cases it seems that individual coefficients can be estimated when estimating the long-run relationship. Electricity exports were excluded from both models as they were not statistically significant, as well as the coal prices because there was indication of severe case of multicolinearity based on the variance inflation indicator and the coefficient of variance decomposition. Along the same lines, the variables of the Brent oil prices and the natural gas prices was decided not to be included in the same regression and this was the main reason for estimating two separate models.
|
|
|
Table A2.2:Pedroni and Kao residual co-integration test results
|
|

|
|
Source: Commission Services
|
|
|
Given these findings, two main estimators are used for estimating the cointegrating vector in a panel context, the Fully Modified Ordinary Least Square (FMOLS) estimators and the Dynamic Ordinary Least Square (DOLS) estimators. () The FMOLS estimator, proposed by Phillips and Hansen (1990), employs a semi-parametric correction to eliminate the problems caused by the long run correlation between the cointegrating equation and stochastic regressors innovations. The DOLS estimator, advocated by Saikkonen (1992) and Stock and Watson (1993), is a parametric approach that eliminates the feedback in the cointegrating system.
The long-run equilibrium is then estimated using the FMOLS and DOLS technique () (Table A2.3). Results of panel FMOLS and DOLS indicate that electricity wholesale prices are positively correlated with all the variables in both models, except for the share of renewables in the total electricity production. Almost all of the estimated coefficients are statistically significant at the 1% levels, implying that there is a strong long-run relationship between the variables included in the analysis based on both approaches: FMOLS and DOLS.
|
|
|
Table A2.3:Panel FMOLS and DOLS long-run estimates (in logs)
|
|
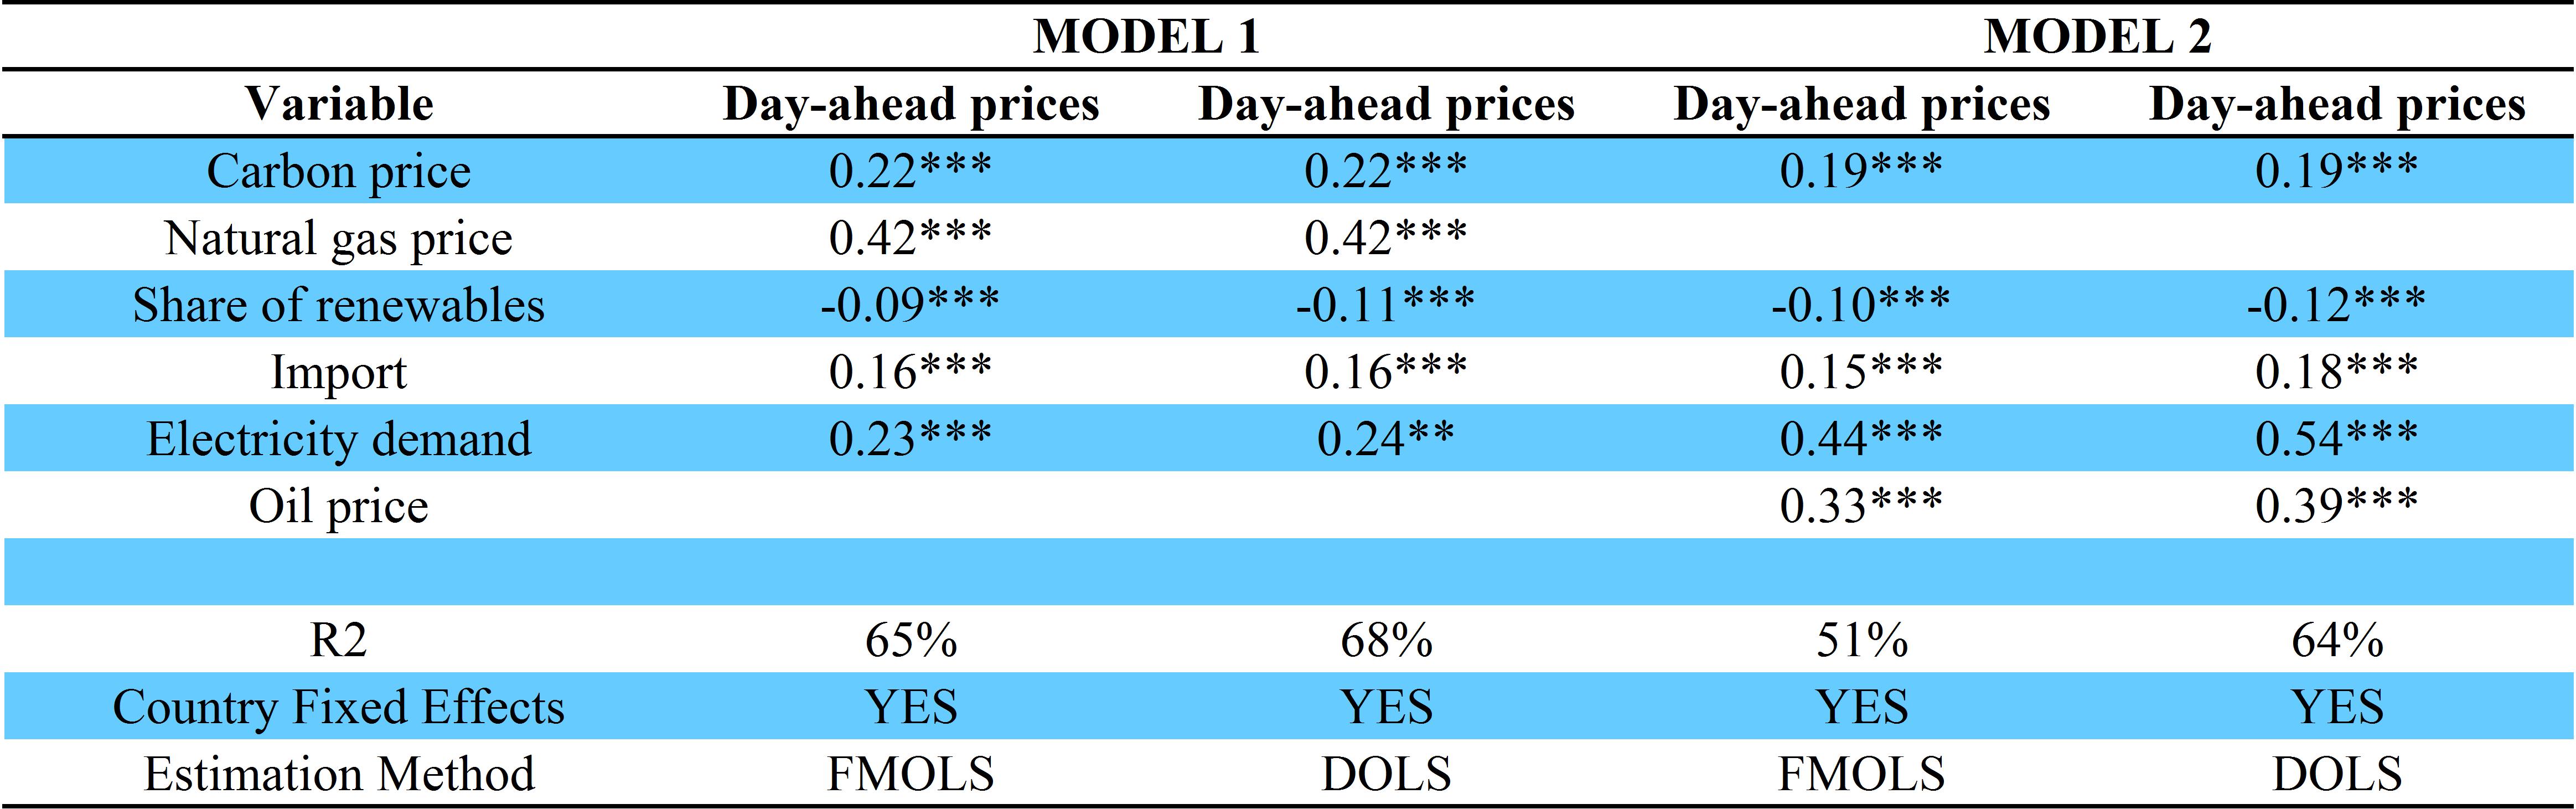
|
|
Source: Commission Services
|
|
|
Panel Granger Causality Tests
Once a long-run relationship between the variables examined has been identified, this relationship is used to estimate a panel error correction model, with the same specifications as in the co-integration tests. This will indicate the direction of the causal relationship of the variables in question, both in the long and short-run. Thus, the residuals of the lon-run model (equation 2) are included as regressor in the dynamic error correction model, which is specified as follows:
(3)
Where Δ represents the difference operator, EC is the lagged error correction term derived from the long-run model (equation 2), αi,λi and βi are the coefficients, u is the error of the equations, Y represents the dependent variable each time, G is the set of the explanatory variables and k is the number of lags based on Schwarz information criterion.
The direction of the causal relationship will be determined by the results of the Granger causality test, after treating the panel data as one large stacked set of data. The only exception of the test is not letting the data from one cross-section enter the lagged values of data from the next cross-section. This method assumes that all coefficients are same across all cross-sections.
Taking into consideration of the residuals of the long-term equilibrium, a panel VECM model is used to estimate the direction of causality in the short and the long run. The results of the VECM with six simultaneous equations for the analysis of the causal () relationships for Model 1 and 2 are presented in Tables A2.4 and A2.5 below. The optimal lag structure of 13 and 11 months, respectively for Model 1 and 2, for the two relationships is chosen based on the Schwarz Information Criterion, in order to remove autocorrelation in the residuals.
|
|
|
Table A2.4:Short run causality (Variables in first differences)
|
|

|
|
Source: Commission Services
|
|
|
Table A2.4 presents the results of the short run Granger causality tests for both models. Their findings appear to converge regarding the direction of the causality of most of the variables, except for the change of the electricity imports in the electricity wholesale prices equation and for the change in the electricity imports equation and the renewables equation. In general the tests suggest that for most of the variables there is a bi-directional causality. In particular, in the short run the findings indicate that the electricity wholesale prices are influenced by changes in the carbon prices, the electricity demand and imports, the share of renewables in the total electricity production and the natural gas prices. In the same context, the carbon prices are driven by the wholesale electricity prices, the electricity demand, and the share of the renewables production and the development of fossil fuel prices (Brent, Natural gas). Along the same lines, electricity demand is affected by the electricity wholesale prices and carbon prices, the share of the renewables and the changes in fossil fuel prices that influence the production cost. The share of renewables is influenced mainly by the electricity demand evolution and the carbon and fossil fuel prices. The fossil fuel prices are affected by almost of all explanatory variables through the impact that these variables have on the demand for the fossil fuel commodities. In contrast to the rest of the variables, the tests indicate that the electricity imports are driven only by the electricity demand evolution.
|
|
|
Table A2.5:Long run causality (Variables in levels)
|
|

|
|
Source: Commission Services
|
|
|
Turning now to the long-run causality among the variables (Table A2.5), the tests suggest that almost for all variables a bi-directional causality exists. Only the electricity imports can be considered as a weakly exogenous variable. The findings indicate that the electricity imports are not influenced in the long run by any of the variables included in the analysis, while they influence only the share of renewables production over the total electricity production.
A2.2.Data description
|
|
|
Table A2.6:Data description – Power price drivers
|
|
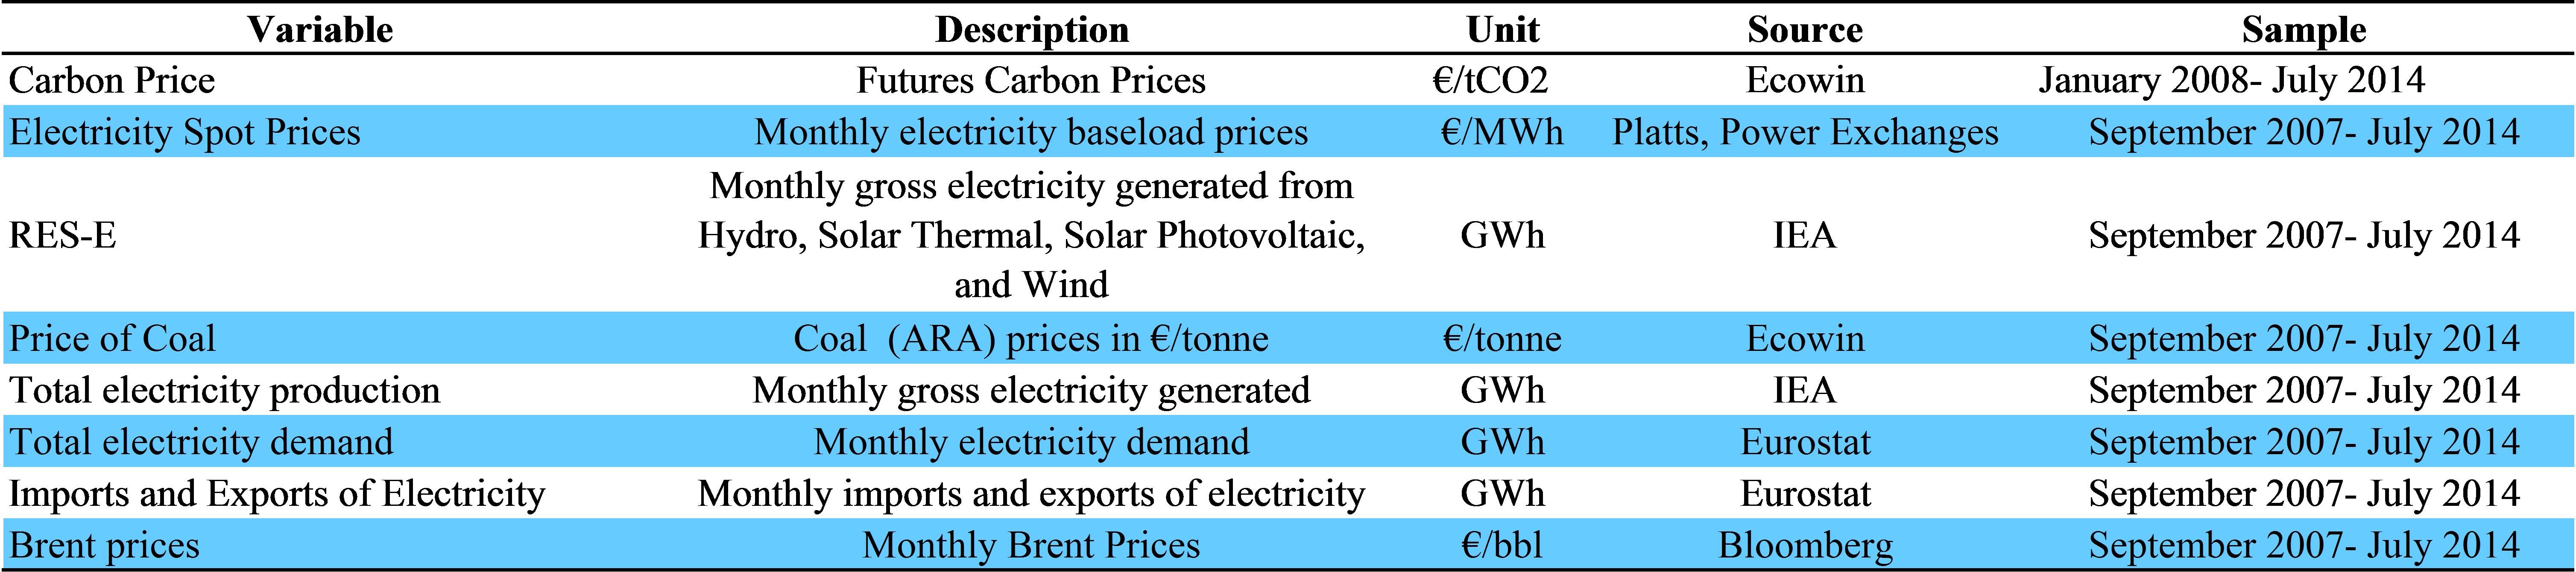
|
|
Source: European Commission
|
|
|
To understand the impact on the investment framework of a shift to a technology mix dominated by low carbon energy technologies with high fixed costs and low operating costs, three power systems are constructed that represent each stage of the energy transition.
- Stage 1, the conventional phase, represents power systems that existed 15 to 20 years ago before the deployment of low carbon technologies such as wind and PV
- Stage 2, the transition phase, is representative of current power systems with an increasing penetration of low carbon technologies such as wind and photovoltaic
- Stage 3, the decarbonised phase) represents a future power system dominated by low carbon technologies as can be expected in a medium to long term timeframe.
The demand level to be met is assumed to be the same in each scenario. It is composed of three distinct periods: a base load period where the average power demanded is D1; a semi-base load period with an average demanded power D2 and a peak period with an average demanded power D3. In order to factor in policy developments, the demand is considered increasingly price-responsive, i.e. more elastic, as the energy transition progresses. This is due to a wider deployment of demand response over time in industrial and services sector as well as in households, notably through the use of aggregators. Therefore, the slope of the demand curve changes from stage 1 to stage 3.
Under stage 1, the demand can be met by two technology classes. One technology class is composed of two technologies (tech 1 and tech 2) with low operating costs (OPEX) and high capital costs (CAPEX) such as nuclear or hydro technologies. The other technology class is made of two technologies with high OPEX and low CAPEX such as coal or gas-fired power plants (tech 3 and tech 4). The revenues (R_(i,t) () gained by each technology in this market framework are sketched in graph A3.1.
|
Graph A3.1:Merit-order curves under the conventional phase (stage 1)
|
|

|
|
Source: European Commission
|
Revenues for each technology are the difference between the variable cost of the technology and the revenue acquired at the market price when selling the quantity demanded (so-called infra-marginal rents). Accordingly, revenues for technology 1 are the sum of the revenues acquired during demand D1 (R1, 1) when the price is set by technology 2 which is the marginal technology in this case; and the revenues during demand D2 (R1, 2) when technology 3 is the marginal producer; and the revenues during demand D3 (R1, 3) when prices reach P3 that can go up to the value of loss load (VoLL). Indeed, a number of hours of unmet demand are considered to allow for the recovery of the fixed cost of the peaking technology 4, and also to contribute to the cost recovery of the other technologies. The investment criterion for technology 1 is met when these revenue streams equal the fixed cost of technology 1. The same logic applies for all technologies.
Stage 2 differs from stage 1 as the penetration of low carbon technologies is higher. This is achieved with the introduction of a new technology class, represented by tech 0 that has the lowest variable costs (e.g. wind farms, photovoltaics). The demand levels are assumed to remain constant compared to stage 1, but with an increasing price responsiveness of demand which translates into a flatter curve. This power system could be representative of the current European power systems. The effect on the merit-order curves of the entry of this technology class is portrayed under graph A.3.2. Given that the technologies composing technology class 0 have limited capacity factors due to the intermittency of their primary energy sources, the different demand segments D'1, D'2, D'3 are met alternatively as shown under graph A.3.2 when technologies 0 are operating or as shown under graph A.3.3 when technologies 0 are not operating.
|
Graph A3.2:Merit-order curves under the transition phase (stage 2) when technologies 0 are operating
|
|

|
|
Source: European Commission
|
|
Graph A3.3:Merit-order curves under the transition phase (stage 2) when technologies 0 are not operating
|
|

|
|
Source: European Commission
|
The introduction of technology class 0 pushes the merit order curve to the right for a certain period of time proportional to their capacity factors, while the increased responsiveness of the demand decreases the scarcity rent gained by the different technologies. By contrast, when the technology 0 is not operating, the power system is operating with the technology mix as under stage 1. It is noted that under constant demand levels, the financial position of technology 4 deteriorates under stage 2 compared to stage 1 due to an overcapacity effect which limits the number of hours where the price goes above its marginal costs and due to the increasing demand responsiveness which limits the height of price spikes. The resulting impact of the introduction of technology 0 is an overall price, hence revenue, decrease.
Stage 3 represents a power system that would be dominated by low carbon technologies (), with a demand (D''1, D''2, D''3) exhibiting higher levels of price-responsiveness and with a high degree of European market integration. In this context, the system can be managed so that low carbon technologies (class 0) are able to operate during most of the year. This is feasible through drawing on spatial and time complementarities, which can be utilised due to high market integration and regional coordination. The increased penetration of low carbon technologies has resulted in a change in the technology mix, with for instance, no tech 3 and a quantity of technology 4 (as a representative of flexible systems) to meet period of high demand and to account for the resource availability. This results in merit order curves which are flatter and steeper at the end as shown under Graph A.3.4.
|
Graph A3.4:Merit-order curves under the decarbonised phases (stage 3)
|
|

|
|
Source: European Commission
|
The effect on revenues of this almost complete decarbonisation of power systems is an overall decrease in prices, hence revenues compared to stage 2 for most part of the year. The financial position of all technologies will depend extensively on the frequency and ability of prices to reach high levels. The feasibility of such price spikes is uncertain.
The annualized capital expenditure of technology i CAPEXi is calculated using the methodology described in (), as follows:
With:
SCI: the specific overnight capital investment of the power generation facility, in €/MW
IDC: the interest during construction
CRF: the capital recovery factor
Load Factor: the annual load factor of the facility
Values for future SCIs are calculated on the assumption that current prices will decrease due to learning effects. Hence, based on the technology learning theory, the future specific cost of a technology, SCIF, is calculated using the global installed capacity as a proxy, based on the formula:
Where:
SCIP or F: the current and future specific capital investment cost
CP: the current global installed capacity
CF: the installed capacity of the technology in a future time
LR: the learning rate of the technology.
The IDC is calculated considering the construction time for each plant and a capital expenditure profile during construction:
Where:
CT: is the construction time,
Wk: is the fraction of total capital used in year k,
R: is the interest rate.
For all technologies an interest rate of 10% is assumed for the calculation of IDC. The capital recovery factor (CRF) is calculated from the formula, with d is the real discount rate and n is the economic life time.

