

 EUROPEAN COMMISSION
Brussels, 26.11.2015
COM(2015) 700 final
DRAFT JOINT EMPLOYMENT REPORT
FROM THE COMMISSION AND THE COUNCIL
accompanying the Communication from the Commission
on the Annual Growth Survey 2016
EUR-Lex Access to European Union law
This document is an excerpt from the EUR-Lex website
Document 52015DC0700
DRAFT JOINT EMPLOYMENT REPORT FROM THE COMMISSION AND THE COUNCIL accompanying the Communication from the Commission on the Annual Growth Survey 2016
DRAFT JOINT EMPLOYMENT REPORT FROM THE COMMISSION AND THE COUNCIL accompanying the Communication from the Commission on the Annual Growth Survey 2016
DRAFT JOINT EMPLOYMENT REPORT FROM THE COMMISSION AND THE COUNCIL accompanying the Communication from the Commission on the Annual Growth Survey 2016
COM/2015/0700 final
EUROPEAN COMMISSION
Brussels, 26.11.2015
COM(2015) 700 final
DRAFT JOINT EMPLOYMENT REPORT
FROM THE COMMISSION AND THE COUNCIL
accompanying the Communication from the Commission
on the Annual Growth Survey 2016
DRAFT JOINT EMPLOYMENT REPORT
FROM THE COMMISSION AND THE COUNCIL
accompanying the Communication from the Commission
on the Annual Growth Survey 2016
The draft Joint Employment Report (JER), mandated by Article 148 TFEU, is part of the Annual Growth Survey (AGS) package launching the European Semester. As a key input to EU economic governance, the JER provides an annual overview of key employment and social developments in Europe as well as Member States' reform actions in line with the Guidelines for the Employment Policies of the Member States and AGS priorities.
In this context, the draft Joint Employment Report 2016 indicates the following:
The employment and social situation slowly improves while signs of divergence among and within Member States persist. In line with the gradual economic recovery, employment rates are increasing again, and unemployment rates are falling in almost all of the Member States. In 2014, the annual unemployment rate for the EU-28 was still over 10%, and higher in the euro area, but have further decreased in the course of 2015. Youth unemployment and long-term unemployment are also declining since 2013, while remaining at overall high levels. Wide differences between Member States persist, despite the timid convergence in labour market conditions observed in 2014. Household incomes in the EU rose slightly in 2014 and early 2015, benefitting from stronger economic activity and improving labour market circumstances. The number and proportion of people at-risk-of poverty or social exclusion stabilised overall in both 2013 and 2014. But social developments still point to further divergence across the EU as the scoreboard of key employment and social indicators shows in relation to at-risk-of poverty and inequality developments. Based on good practices, a number of common benchmarks could be defined, to support upward convergence processes, while recognising the diversity of starting points and practices across Member States.
Reforms supporting well-functioning, dynamic and inclusive labour markets must continue. Several Member States have pursued reforms, with positive effects visible for instance in increasing employment rates. However, more efforts are needed to stimulate growth and create a positive environment for the creation of quality jobs. Considering that recent employment growth is largely accounted for by an increase in fixed-term contracts, Member States should also continue, and in some cases step up, measures addressing the challenge of segmented labour markets, ensuring a proper balance between flexibility and security.
Tax systems must better support job creation. Reforms of tax systems have been initiated so as to reduce disincentives to take up jobs and - at the same time - decrease labour taxation to support companies (re)hire, often targeted at groups such as the young and long-term unemployed. Even so, in recent years the overall tax wedge on labour has increased in a considerable number of Member States, notably for low-wage and average wage earners. This trend is worrying in light of still high unemployment rates in many Member States, considering that high tax wedge levels can constrain both labour demand and labour supply.
Wage-setting has been overall displaying continued wage moderation. Reforms have strengthened wage-setting mechanisms that promote the alignment of wage developments to productivity and to support households' disposable income, with a particular focus on minimum wages. Overall, recent wage developments appear to be rather balanced in most Member States and have contributed to rebalancing within the Euro Area. Real wages move broadly in line with productivity in most Member States, with a few exceptions. This is a positive development for the countries' internal and external equilibrium even if some further adjustments are needed.
Investment in human capital through education and training has been predominantly focused on the young but some Member States have also engaged in broad efforts to reform their education systems or extend adult education and vocational training opportunities. However, public expenditure on education decreased in almost half of Member States and fell by 3.2% for the EU as a whole compared to 2010. Modernisation, better alignment of skills and labour market needs and sustained investment in education and training, including digital skills, are essential for future employment, economic growth and competitiveness in the EU.
Member States sustained their efforts to support youth employment and address high levels of NEETs (those not in employment, education or training. The Youth Guarantee has become a driver for improving school-to-work transitions and reducing youth unemployment, and first results have now become visible with the share of young people not in employment, education or training decreasing. However, continued implementation, also supported through national funding sources and a focus on structural reform will be essential for sustainable achievements. The EU youth unemployment rate has started to decrease but not in all countries and cross-country differences remain considerable.
Labour market reintegration of long-term unemployed must remain a priority. Long-term unemployment now accounts for 50% of unemployment, posing an important challenge to employment and social policies. The probability to transit from unemployment to inactivity increases with the time spent in unemployment. This can have important negative consequences for economic growth, also in view of required productivity increases and demographic change. Transitions from long-term unemployment to employment should in many Member States be better supported through active labour market measures. Immediate action on both the demand and supply side is needed before the long-term unemployed become discouraged and move into inactivity.
Ongoing social dialogue reform is mostly linked to collective bargaining reform and also to workers' representation. Collective bargaining is becoming more decentralised from the (cross-) industry level to the company level. In those Member States where (cross-) industry collective agreements exist, the scope for company level agreements to set working conditions has increased. In such contexts of decentralised collective bargaining, structures for workers' representation and the coordination of bargaining with higher levels and horizontally are crucial to secure increased productivity and employment as well as a fair share of wages for workers. Involvement of social partners in policy design and implementation needs to be improved.
Despite the fact that women are increasingly well qualified, even out-performing men in terms of educational attainment, they continue to be underrepresented in the labour market. The gender employment gap remains especially wide for parents and people with caring responsibilities, suggesting the need for further action e.g. in the area of childcare, while the substantial gender gap in pensions in the EU stands at 40%, reflecting the lower pay and shorter careers of women. It leads to the need for further action towards a comprehensive integration of the work-life balance approach into policy making, including care facilities, leave and flexible working time arrangement, as well as tax and benefit systems free of disincentives for second earners to work or work more.
Member States have continued to modernise their social protection systems to facilitate labour market participation and to prevent and protect against risks throughout the life-course. Social protection systems must better protect against social exclusion and poverty and become encompassing instruments at the service of individual development, labour market and life-course transitions and social cohesion. Adequate pensions remain contingent on the ability of women and men to have longer and fuller careers with active ageing policies sufficiently covering health and training. Investment in the working age population, including through the provision of childcare, is essential to secure inclusive employment outcomes as well as sustainable public finances. Health systems contribute to individual and collective welfare and economic prosperity. Sound reforms ensure a sustainable financial basis and encourage the provision of, and access to effective primary health care services.
In the course of 2015 Member States have been faced with the need to respond to an increasing inflow of refugees, with some Member States particularly affected. Member States have taken decisions on integration packages as well as dissuading measures. If short-term impact via higher public spending is relatively small, albeit more pronounced for some Member States, in the medium to long term, labour market integration matters most. Member States must ensure that asylum seekers have access to the labour market at the latest within 9 months from the date when they apply for international protection.
1. LABOUR MARKET AND SOCIAL TRENDS AND CHALLENGES IN THE
EUROPEAN UNION
This section presents an overview of labour market and social trends and challenges in the European Union. It commences with the general findings deriving from the scoreboard of key employment and social indicators. What follows is more detailed analytical account of major employment and social areas.
1.1 General findings from the scoreboard of key employment and social indicators
In its current third edition, the scoreboard of key employment and social indicators constitutes now a part and parcel of the Joint Employment Report. As confirmed by the latest Employment Guidelines 1 , the scoreboard is a particularly useful tool to contribute to detecting key employment and social problems and divergences in a timely way and identify areas where policy response is most needed. This is done by carefully monitoring and interpreting both levels and changes of each indicator. The Commission drew on the results of the scoreboard when drafting the 2015 Country Reports and Country Specific Recommendations with the aim of better underpinning challenges and policy advice.
The analysis of the findings from the scoreboard feeds into better understanding of employment and social developments. This in turn contributes to a stronger focus on employment and social performance in the European Semester as promoted by the Five Presidents Report on Completing Europe's Economic and Monetary Union 2 and outlined in the recent Communication on Steps towards Completing Economic and Monetary Union 3 . Improvements to the interpretation of the scoreboard help to objectively identify employment and social divergence trends. The scoreboard should be read in conjunction with findings of other instruments such as the Employment Performance Monitor (EPM), the Social Protection Performance Monitor (SPPM) and the scoreboard of the Macroeconomic Imbalances Procedure (MIP) with its recently added employment headline indicators 4 .
Potentially worrying key employment and social developments and levels leading to divergences across the EU and warranting further analysis and possibly stronger policy response are detected along three dimensions (see detailed tables in Annex):
•For each Member State, the change in the indicator in a certain year as compared with earlier periods in time (historical trend);
•For each Member State, the difference from the EU and the euro zone average rates in the same year (providing a snapshot of existing employment and social disparities);
•The change in the indicator between two consecutive years in each Member State relative to the change at the EU and euro zone levels (indicative of the dynamics of socio-economic convergence/divergence).
Looking at historical developments and distances to the EU average based on the scoreboard 5 shows that Member States have been hit by the crisis in different ways and the recovery has been uneven. In around half of the EU Member States, there are developments in at least two indicators that raise some concern.
Six Member States (Greece, Croatia, Cyprus, Portugal, Spain and Italy) face a number of substantial employment and social challenges. The situation in two Member States (France and Finland) points to problematic developments in the unemployment and youth unemployment rates, accompanied by a decrease in disposable income in Finland. Indicators highlighting phenomena related to social exclusion are flagged for five countries (Romania, Bulgaria, Lithuania, Latvia and Estonia). Finally two Member States (Malta, Luxembourg) represent a mix of a problematic situation in one indicator with a good but deteriorating performance in another.
In detail, Greece faces a critical situation across all indicators. Croatia shows problematic developments and levels in unemployment, NEETs and poverty indicators. In Cyprus, the general and youth unemployment rates as well as the at-risk-of-poverty indicator show worrying trends while the NEETs rate is considered as weak but improving. Italy shows very worrying trends in indicators related to the situation of young people on the labour market as well as quite problematic developments in the general unemployment rate and social indicators. In Portugal general and youth unemployment rates are still worrying but have been improving in the recent period. These positive changes have not yet translated into the social area with AROP and inequality indicators showing still high levels. In Spain, the developments regarding unemployment and NEET rates have been improving (from problematic levels) while the situation regarding youth unemployment, poverty and inequalities remains challenging.
Finland has recorded negative developments in all three employment indicators, in view of very high increases recorded over the last period, and records a worsening in gross household disposable income. In France, the general and youth unemployment rates are above the EU average and still increasing.
While the labour market situation in several countries is stable or improving, a more worrying situation can be detected regarding the social indicators. Romania faces critical situations regarding NEETs rate, AROP and inequalities. Bulgaria experienced the second highest growth in inequalities, from already high levels while the situation regarding NEETs still considered as weak (but improving). Both social indicators are still seen as problematic in Latvia, Lithuania and Estonia.
The developments in two Member States show a mixed picture with some indicators deteriorating from good or already problematic levels. In Luxembourg, the NEETs rate increased (from still good levels) and the inequality indicator points to problems to watch. Malta experienced high increases in the AROP rate (from the relatively good levels) and in the NEETs rate.
In addition, Austria shows an overall good or very good situation across all indicators, although a slight deterioration is observable as concerns the total unemployment and NEET rates.
1.2 Labour market trends and challenges
The economic recovery in the EU started in the course of 2013, and most labour market indicators have began to improve soon after. However, the depth of the crisis and the slow recovery, particularly in the Euro Area, have not yet allowed to reach the pre-crisis levels of real GDP. Employment rates are now increasing again (Figure 1). In 2014, the employment rate (20-64 year - olds) increased by 0.8 percentage points (pps) compared to the previous year, to 69.2% in the EU-28 and by 0.4 pps to 68.1% in the EA-19 6 . At the same time, the activity rate (15-64) rose by 0.3 and 0.1 pps, respectively, reaching a level of 72.3% in both the EU-28 and the EA-19. The steady increase in unemployment that had started in 2008 reverted in 2013, with the unemployment rate (15-74) falling from 10.8% to 10.2% in the EU-28 and from 12.0% to 11.6% in the EA-19 between 2013 and 2014 The decreasing trend was confirmed in the first half of 2015, as the unemployment rate decreased by respectively 0.7 pps in the EU-28 and 0.5 pps in the euro area compared to the same period of 2014.
Figure 1: Employment, unemployment and activity rates, EU-28, total and for women


Source: Eurostat, LFS
Trends in employment and unemployment are driven by movements in job finding and job separation rates. From the low levels seen in the beginning of 2013, job finding rates have recovered, while at the same time job separation rates have started to decline since early 2012. The observed declines in unemployment over 2013 and 2014 have been mostly linked to reductions in job separation rates, while job finding rates, altough recovering, are still below pre-crisis levels and remain particularly low for job seekers with long unemployment spells.
Employment growth dynamics have been different across Member States, economic sectors and types of contract. In 2014, employment rates (age group 20-64) increased in all Member States compared to 2013, except for Finland (-0.2 pps), Austria (-0.4), and the Netherlands (-0.5). However, differences in the levels remain, with 2014 rates ranging from 53.3% in Greece and slightly below 60% in Croatia, Italy and Spain to over 75% in the Netherlands (75.4%), Denmark (75.9%), the UK (76.2%), Germany (77.7%), and Sweden (80.0%). As regards sectoral developments, the improvement in employment rates has now reached most sectors, including those most affected by the crisis such as agriculture, construction and industry. Looking at contract types, in line with expectations, over the past years employment has been most volatile for temporary contracts, and less so for permanent contracts or self-employment, which have remained more or less stable since 2011. From 2013 the increase in overall employment has been mainly driven by an increase in temporary contracts. As Figure 2 shows, the use of temporary contracts varies widely between Member States, with 2014 shares ranging from below 5% in Romania and the Baltic countries to more than 20% in the Netherlands, Portugal, Spain and Poland. Transition rates from temporary to permanent contracts also vary between countries, and it seems that transition rates are highest (lowest) for those countries where the share of temporary contracts is lowest (highest). Both the shares of temporary contracts and the transitions from temporary to permanent contracts are indicative of how flexible labour markets are. They also possibly reflect differences in employment protection legislation across countries and the extent to which national labour markets are characterised by insider-outsider effects. This is of particular concern in countries using temporary contracts on a wide scale, where temporary contracts often do not improve the chances of getting a permanent full-time job, as shown in Figure 2.
Non-standard employment contracts are more prevalent among women, young people and non-routine manual work. These appear to be associated with a wage penalty and to be concentrated among low earners 7 . Another facet of job precariousness is the extent of involuntary part-time work, which has increased from 16.7% to 19.6% of total employment and the spread and diversification of forms of casual working 8 .
Figure 2: Share of temporary contracts and transitions from temporary to permanent

Source: Eurostat, LFS and SILC. Short description: Data on transitions for BG, EL, PT, HR refer to 2012, for AT to 2014. Data on transitions are not available for IE and SE.
The evolution of employment reflects (net) job creation trends, with small- and medium-sized enterprises (SMEs) being traditionally seen as the engine of employment growth. Between 2002 and 2010, 85% of new jobs in the EU were created by SMEs. By contrast, between 2010 and 2013, employment in SMEs in the EU fell by 0.5%. To date and in many Member States, credit availability to the non-financial sector remains weak, due to both supply and demand factors including sectorial restructuring and deleveraging that followed the financial crisis. Limited access to finance is also likely to curb the number of start-ups. In 2014, the number of self-employed increased at about the same pace as employment, leaving the self-employment rate at EU level unchanged at 14.6%, below the 15% rate seen for 2004-2006. The self-employment rate of women continued to be around 10%, while the male rate remained roughly one in five. The level and changes in Member States’ self-employment rates are very unequal and reflect a number of factors, such as framework conditions, national entrepreneurial spirit and opportunities for paid employment. The rates are significantly above the levels observed 10 years ago in the Netherlands, Slovakia, Slovenia, Greece, the United Kingdom and the Czech Republic.
Activity rates differ across population groups and Member States. They move in a more stable way than employment rates, potentially indicating only modest discouragement effects. Consistent with longer term trends, they have been showing a consistent increase for certain groups, in particular women and older workers, while activity rates have decreased for the low-skilled and male youths aged 15 to 24 years. Although differences in activity rates have narrowed over time, both between men and women and between older and prime age workers, they remain sizeable. In 2014, the activity rate of women stood at 66.5% in the EU-28; while still 11.5 pps below that for men, the difference decreased from 13.2 pps in 2010. Gender differences in full-time/part-time work add to differences in activity rates and translate into gender pay gaps which over the working life accumulate into gender pension gaps. Between 2010 and 2014, the difference in activity rates between older workers (55-64) and prime age workers (25-54) decreased from 35.4 to 29.6 pps. In contrast, the differences between nationals and non-nationals and between persons with and without disabilities have not diminished. Across countries, considerable variation remains, in overall activity rates (ranging from 63.9% in Italy to 81.5% in Sweden in 2014) and for specific groups, reflecting differences in economic conditions, institutional set-ups, and workers' individual preferences.
Unemployment and youth unemployment have started to decrease, but not in all Member States, and cross-country differences remain considerable. Based on findings from the scoreboard of key employment and social indicators, some convergence on unemployment rates can be observed across Europe, with stronger-than-average decreases in a number of Member States which had recorded very high levels of unemployment (Spain and Portugal are the most relevant examples, followed by Greece). Still, as Figure 3 shows, in the first half of 2015 unemployment rates ranged from around 5% in Germany to more than 20% in Spain and Greece. The unemployment rate also appears very high in Croatia and Cyprus, with a continued increase in the latter.
A deteriorating trend, with significantly higher than average increases, can be observed in a number of countries performing relatively better in terms of unemployment rate levels. This is the case of Belgium, France, Finland and Austria (the latter, though, still presenting a very low unemployment rate of 5.1%). Among these countries, Finland shows the highest increase in the EU28, by 0.8 pps. While unemployment is decreasing in Italy, the pace of reduction is slow compared to the average. These developments should be carefully analysed as they may turn into longer-term trends.
In a gender perspective, the decrease in the unemployment rate is overall comparable for men and women (by 0.8 and 0.7 pps respectively in the EU28). Unemployment rates of women remain problematic in Southern Europe (especially in Greece and Spain) and in some Eastern European countries (Croatia, Slovakia).
Figure 3: Unemployment rate and yearly change, as reported in the scoreboard of key employment and social indicators

Source: Eurostat, LFS (DG EMPL calculations). Period: 1st semester 2015 levels and yearly changes with respect to 1st semester 2014. Note: Axes are centred on the unweighted EU28 average. EU28 and EA19 refer to the respective weighted averages. The legend is presented in the Annex.
As shown in Figure 4, cross-country differences are even larger as regards youth unemployment rates. Two countries (Greece and Spain) still present levels of youth unemployment rate of around 50%, two (Italy and Croatia) above 40% and two (Cyprus and Portugal) above 30%; these countries also show the highest values for women. Although the negative slope of the regression line suggests that Member States have begun converging, in these countries a faster decrease would be necessary to quickly bring youth unemployment back to reasonable levels. In this group, Portugal appears to be the country that converges most quickly. A small group of countries (including France and Finland) show signs of deterioration in youth unemployment from a comparatively good starting point. The case of Finland deserves particular attention, in view of an increase by 2.5 pps over the period reflecting the weak economic conditions (largest increase in the EU28, as for the overall unemployment rate).
Figure 4: Youth unemployment rate and yearly change, as reported in the scoreboard of key employment and social indicators

Source: Eurostat, LFS (DG EMPL calculations). Period: 1st semester 2015 levels and yearly changes with respect to 1st semester 2014. Note: Axes are centred on the unweighted EU28 average. EU28 and EA19 refer to the respective weighted averages. The legend is presented in the Annex.
The share of young people not in employment, education or training (NEET rate) is also decreasing (Figure 5). However, very high NEET rates are still recorded by a number of countries (Ireland, Cyprus, Spain, Romania, Greece, Croatia, Bulgaria and Italy, the latter two countries with values above 20%). Among women, the highest share of NEETs is also observed in Greece, Italy, Romania and Bulgaria. While Spain, Bulgaria, Greece and Cyprus seem to be converging at a reasonably quick rate, the speed of adjustment (if any) appears insufficient in Italy, Croatia and Romania. Also in this case, a few Member States with relatively low – or close to the average – NEET rates show yearly changes significantly higher than the EU average. This is the case of Luxembourg, Austria, Finland and Malta.
Figure 5: NEET rate and yearly change, as reported in the scoreboard of key employment and social indicators

Source: Eurostat, LFS (DG EMPL calculations). Break in series in FR and ES. Period: 2014 levels and yearly changes with respect to 2013. Note: Axes are centred on the unweighted EU28 average. EU28 and EA19 refer to the respective weighted averages. The legend is presented in the Annex.
Early school leaving rates have improved for most countries. In 2014 early school leaving decreased in 20 Member States compared to 2013, while a relatively strong increase was observed in Estonia. Notwithstanding positive developments in a large majority of Member States, levels remain particularly high for several countries (Malta, Italy, Portugal and Spain). In addition, foreign-born young people have on average 10 percentage points higher rates than the native-born, with peaks of around 20 points in Greece and Italy. 9
Despite the overall improvement on the labour market, long-term unemployment remains at very high levels in several Member States. Following the crisis, long-term unemployment rates increased in all Member States between 2008 and 2014, with the notable exception of Germany (Figure 6). Overall, rates are still relatively high, in particular in Greece, and to a lesser extent in Spain, with the rate observed in 2014 in both cases still very close to its maximum level. Long-term unemployment affects men, young people and low-skilled workers relatively more than other groups on the labour market, and especially hits those that used to work in declining occupations and sectors. The overall state of the economy remains an important factor in determining changes in the levels and flows to and from long-term unemployment, but there are also strong country-specific effects mostly related to institutional differences.
Figure 6: Long-term unemployment rates (2008, 2014 and maximum levels)

Source: Employment and Social Developments in Europe (ESDE) 2015, European Commission
There are differences between Member States as regards the dynamics of long-term unemployment. Figure 7 shows transition rates for the long-term unemployed between 2013 and 2014. For several Member States persistence rates in long-term unemployment (the long-term unemployed that are still unemployed one year later) are considerable and reach levels above 50% in Lithuania, Bulgaria, Greece and Slovakia. On the other hand, outflows to employment occur comparatively frequently in Denmark, Sweden, Estonia and Slovenia. Outflows to inactivity are likely to reflect discouraged worker effects, and are particularly large in Italy, and to a somewhat lesser extent in Finland, Estonia, and Latvia.
Figure 7: Labour market status in 2014 of those in long-term unemployment in 2013

Source: Employment and Social Developments in Europe (ESDE) 2015, European Commission
Despite the largely unfavourable situation for the long-term unemployed, overall spending on active labour market policies has gone down in quite a few Member States, reflecting tight government budgets. Between 2007 and 2012 total spending (as a share of GDP in 2007) decreased in 8 Member States, while spending per person wanting to work fell in 13 countries (Figure 8). It mainly increased in Member States where levels were comparatively low in 2007. Although more recent cross-country spending data are not available yet, it is not likely that spending has substantially improved overall given that government budgets have remained tight also after 2012 in many Member States. Furthermore, in a considerable number of countries, ALMP expenditure is not strongly targeted at the long-term unemployed, with rates below 20% of expenditure targeting in about half the Member States. PES coverage, benefit coverage and participation in education and training for the long-term unemployed also seem to have decreased over time in several Member States, possibly linked to difficulties of reaching-out to the very long-term unemployed (2 years and over). 10
Figure 8: Annual real growth of ALMP expenditure, 2007-2012

Source: Eurostat, LMP database. DG EMPL calculations of EU-28 average value. Note: Member States are arranged into low/medium/high spender groups by 2007 spending on ALMP (cat. 1-7, % of GDP). EU-28 aggregate estimated by using, due to missing data, for the United Kingdom and Greece 2010 value for 2011-13, and for Spain, France, Cyprus, Malta and Romania using the 2012 value also for 2013, and excluding Croatia. Croatia and Portugal not included due to lack of data and breaks in series. *Due to breaks in series, for Greece, France and the United Kingdom 2007-2010 averages used instead of 2007-2012, for Slovakia 2008-2012 period used, and for Cyprus the 2007-2011 period was used.
Lower activation of the (long-term) unemployed may add to already existing skills bottlenecks. Less spending on activating the (long-term) unemployed may, in particular if it concerns training, prevent them from acquiring the skills that they need to regain employment. This would not only increase persistence rates in unemployment, but it would also add to already existing skills bottlenecks. As Figure 9 shows, in several Member States a sizeable share of employers report difficulties in finding staff with the required skills. Relatively large difficulties are found for the Baltic countries (which may be related to comparatively large outflows of people from these countries to other EU Member States) and also for low unemployment countries such as Austria, Belgium and Germany. Fewer difficulties are reported for Member States such as Spain, Greece, Croatia, and Cyprus, where the lack of labour supply is not a constraining factor on hiring. Better quality and further investments in lifelong learning provision would contribute to diminishing skills bottlenecks. According to Eurostat figures, between 2009 and 2014 lifelong learning increased in a vast majority of Member States (not in Croatia, Cyprus, Greece, Poland, Spain and Slovenia), but large differences remain, with 2014 figures on participation in lifelong learning ranging from 1.5% in Romania and 1.8% in Bulgaria to over 25% in Finland, Sweden and Denmark.
Figure 9: Difficulties finding staff with the required skills in European firms, 2013

Source: 3rd European Company Survey (2013), Eurofound (Reading Note: Proportion of firms replying affirmatively to the question ‘Did your establishment encounter difficulties in finding staff with the required skills?’)
Difficulties in finding staff may have various causes, one of which is workers lacking the right skills. Recent analyses on skills mismatch indicate though that only less than half of the recruitment difficulties constitute genuine skill shortages, while almost a third can be attributed to unattractive pay. Atypical working hours and lack of training opportunities on the job, together with unattractive pay, reduce the ability of employers to attract workers. In addition, research shows that the companies which are unable to find workers with the required skills are often those unwilling to offer long-term contracts 11 .
Europe's growth potential is threatened by structural weaknesses in its skills base. Recent data from the OECD-EC Survey on Adult Skills (PIAAC) show that about 20% of the working-age population have only low basic skills (literacy and numeracy), and in some countries (France, Spain, Italy) this proportion is even higher. Only a few countries (Estonia, Denmark, Finland, the Netherlands and Sweden) have a high proportion of people with very good basic skills and most European countries do not come near the top-performing countries outside Europe (such as Japan or Australia). Regarding digital skills, in 2014 on average 22% of the EU population had no digital skills, ranging from 5% in Luxemburg to 45% in Bulgaria and 46% in Romania 12 . Considering that to function effectively in the digital society an individual needs more than low level skills (e.g. only being able to send emails), 40% of the EU population can be considered as insufficiently digitally skilled. Data on government spending confirm an increasing risk of investment gaps in human capital, as public expenditure on education has recorded a 3.2% decrease since 2010, with decreases in eleven Member States in the most recent year 2013. Europe is not investing effectively in education and skills, which poses a threat to its competitive position in the medium term and to the employability of its labour force.
Labour mobility is a potentially important adjustment mechanism for reducing cross-country differences in unemployment and for resolving skills bottlenecks. The intra-EU mobility rates shown in Figure 10 display a relatively clear pattern, with people moving out of countries that were hit hardest by the crisis towards countries that weathered the crisis relatively well. This has added to longer-term flows from Central and Eastern Europe to the richer North-Western European countries. In terms of absolute numbers, the net outflow is largest in Spain and Poland, while the net inflow is largest in Germany and the UK. Overall, mobility across EU countries remains modest. Mobile citizens are on average young and highly educated, contributing to address skills shortages in receiving countries but also posing some challenges for the countries that they leave behind even if they contribute to remittances. 13 Full transparency and comparability of qualifications across the EU could ease the mobility of workers by helping employers to understand and trust qualifications gained by an individual in another Member State. To this end, the Member States are referencing their national qualification to the European Qualifications Framework.
Figure 10: Net intra-EU mobility rates and flows, 2013

Source: Labour Market and Wage Developments in Europe 2015, European Commission. Note: Luxemburg omitted as out-of-scale outlier. Net intra-EU mobility rates are computed as the difference between immigration and emigration to and from other EU countries over total population at the beginning of the year per 1,000 inhabitants.
Wage developments seem to be in line with productivity in most Member States and have contributed to rebalancing within the Euro Area. Up to 2008, unit labour cost developments were increasing faster in Euro Area deficit countries than in surplus countries. This trend was then reversed, which contributed to restoring the external equilibria of the affected Member States. Moreover, as Figure 11 shows, in recent years real wages seem to be moving more or less in line with productivity (contrary to what was observed the years before in several countries), with only small deviations in many countries (with the exception of Cyprus, Greece, Spain, Estonia, Romania and Bulgaria). This is overall a positive development for the countries' internal and external equilibrium.
Figure 11: Real compensation and productivity, average growth rates 2012-2014

Source: Labour Market and Wage Developments in Europe 2015, European Commission
In recent years the tax wedge on labour has increased in a considerable number of Member States, especially for low-wage and average wage earners, adding to already high levels in several countries. 14 Tax wedge levels differ substantially between Member States, ranging from below 30% in Malta and Ireland to more than 45% in Belgium, Germany, France and Hungary in 2014 (and for Austria and Italy only for average wage earners). Figure 12 shows the change between 2010 and 2014 in the tax wedge (single earner, no children) at both 67% and 100% of the average wage. The tax wedge decreased in only 8 countries at both income levels, most strongly in the United Kingdom and France. On the contrary, comparatively strong increases can be seen for Malta (100% level, but from a low level), and for Luxemburg, Portugal, Slovakia, Hungary and Ireland (at both the 67% and 100% level, but in Ireland from a low level). These trends are a matter of concern in light of still high unemployment rates in many Member States. Reductions in the tax wedge, appropriately financed, would increase demand, growth and support job creation, and contribute to the smooth functioning of the EMU 15 .
Figure 12: Change between 2010 and 2014 in the tax wedge

Source: Tax and benefits database, OECD/EC. Note: Data are for single earner households (no children), 2013 data instead of 2014 for BG, LT, LV, MT and RO.
1.3 Social trends and challenges
Household incomes in the EU are on the rise again, benefitting from stronger economic activity and improving labour market circumstances. On average in the EU, Real gross disposable household income (GHDI) was estimated to have risen by 2.2% over the year to the first quarter of 2015 (Figure 13). The rise of real household income was driven by increases in market income, mostly wages, and to a lesser extent from self-employment and net property income. Taxes on income and wealth slightly reduced the progression of real GHDI income in 2014 and the first quarter of 2015.
Figure 13: Change of GHDI and its components in the EU

Source: Eurostat, National Accounts (DG EMPL calculations)
A closer look at country performance confirms that most Member States have benefitted from an increase in GHDI in 2014. Evidence from the scoreboard of key employment and social indicators (Figure 14) 16 shows that in the majority of Member States real disposable income of households has increased over 2014. Sweden, Lithuania, Hungary, Slovakia and Latvia have experienced the largest improvement in household income, with increases higher than 2% on a yearly basis. On the contrary, a decrease was recorded in United Kingdom, Italy and Finland, the latter case to be read in parallel with the general deterioration in unemployment indicators. No data are available yet to assess the recent evolution of GHDI in some countries heavily hit by the crisis (e.g. Greece and Cyprus).
Figure 14: Change of GHDI in 2014, as reported in the scoreboard of key employment and social indicators

Source: Eurostat, national accounts (DG EMPL calculations).
The share of people at-risk-of-poverty or social exclusion (AROPE) stabilised in 2013 and 2014 after a continuous increase between 2009 and 2012.
The Europe 2020 poverty reduction target is measured using the at-risk-of-poverty or exclusion (AROPE) rate, provided by Eurostat. The AROPE ratio is the share of people:
• at risk of poverty (AROP), i.e. equivalised 17 household disposable income (after social transfers and after pensions) below 60% of the median national household disposable income;
• OR severely materially deprived (SMD) 18 ;
• OR living in households with very low work intensity 19 .
The AROPE rate in the 28 EU Member States (EU-28) decreased slightly in 2014 to 24.4% 20 or 122 million people, down from 24.5% in 2013 and 24.7% in 2012. Nevertheless, it was still 1 percentage point higher than in 2009 (23.3%).
Jobless households and severe material deprivation explain most of the evolution in AROPE. In 2013, severe material deprivation decreased slightly to 9.6% of the whole population. Based on EUROSTAT provisional data for 2014 21 , it is expected to have decreased further since then while remaining well above the 8.2% of 2009 (see Figure 15). Moreover the share of jobless households rose to 10.8% in 2013, well above the pre-crisis level of 9.1%. The at-risk of poverty rate, which refers the group of people who receive less than 60% of median household income after transfers 22 remained stable at around 16.6%, but the poverty thresholds under which people are considered to be at the risk of poverty are still declining, reflecting a continuous deterioration of living standards. The degree to which the risk of poverty and social exclusion could be contained has been contingent on national automatic stabilisers.
Figure 15: Trends in poverty and social exclusion in the EU

Source: Eurostat, EU-SILC.
Note: Provisional figures for 2014. EU27 till 2009; jobless households: % of population aged 0 to 59; AROPE, AROP: previous year income; SMD: current year; jobless households: previous year.
Nine Member States achieved AROPE rates below 20% in 2013 and 2014 (the Czech Republic, the Netherlands, Finland, Sweden, France, Austria, Denmark, Luxembourg and Slovakia) which broadly remained at the same level as in 2009. On the contrary, six Member States had AROPE rates above 30%, and among them, 4 countries achieved reductions of their national AROPE rate from the previous year (Figure 16).
Figure 16: At-risk-of-poverty or social exclusion rates (AROPE) as % of total population

Source: Eurostat, EU-SILC
The working age population and their children were the most at risk of poverty and social exclusion, while the elderly were better protected by the relative stability of pensions compared to earnings from employment (Figure 17). The risk of poverty and exclusion of the working age population increased from 23% in 2008 to 25.3% in 2013 due to job losses and rising in-work poverty. Men continued to be at a slightly lower risk of poverty or social exclusion than women in the EU 28 Member States in 2013: the AROPE rate for men stood at 23.6%, compared to 25.4% for women.
Figure 17: Risk of poverty and social exclusion by age group, labour market status and skill level, 2008 and change 2008-2013

Source: Eurostat, EU-SILC
Looking at the working age population (age group 18-64), evidence from the scoreboard of key employment and social indicators shows that three countries with at-risk-of-poverty (AROP) levels above or around EU average (Cyprus, Portugal and Romania) experienced further increases in 2013. In Cyprus and Portugal the magnitude of the increase was elevated (respectively 2.2 and 1.5 pps). Other countries with poverty levels much higher than average (Greece, Spain and Lithuania) did not record any statistically significant downward development; their situation thus remains critical. Among the countries with relatively lower at-risk-of-poverty levels, the situation of Malta and Sweden was to watch, in view of much higher than average increases. As displayed in Figure 18 23 , the positive slope of the regression line indicated a diverging trend across Member States.
Figure 18: At-risk-of-poverty rates in working age (18-64), as reported in the scoreboard of key employment and social indicators

Source: Eurostat, EU-SILC (DG EMPL calculations). Period: 2013 level and change 2012-2013.
Note: Axes are centred on the unweighted EU28 average. EU28 and EA19 refer to the respective weighted averages. The legend is presented in the Annex. Statistically insignificant changes and differences to the (unweighted) EU average are set to zero. For methodological information, consult the Annex.
The unemployed are facing the highest risk of poverty and exclusion, but in-work poverty also increased during the crisis even if the in-work AROP rate stabilised on average in the 28 EU Member States, at 8.9% in 2013 compared to 9.0% in 2012. The in-work poverty rate varied from 3.7% in Finland to 18% in Romania. Reductions in unemployment will contribute to reducing levels of poverty but only half of the poor who find a job actually escape poverty 24 . Indeed, the impact of job creation and employment growth on poverty depends on whether the new jobs offer a living wage (both in terms of hours worked and hourly wage) and on whether they go to job rich, or job poor, households.
While the risk of poverty or exclusion of children stabilised in 2013 in most countries, it was still very high at 27.7% and the share of children in jobless households continued to increase (9.7% in the EU in 2013). Children's living standards greatly depend on the parents' labour market situation. Children living in jobless households, with lone parents, or with only one parent working, face much greater risk of poverty. In many countries, cash transfers contribute to reduce the risk of poverty of children by compensating to a varying extent the lack of work income (from less than 20% in Greece and Romania to more than 50% in Sweden, Germany, Austria, the United Kingdom and Ireland).
Persons with disabilities tend to experience higher AROPE rates (30% in 2013) and the risk is increasing with the degree of disability (severe – moderate). The AROPE gap between persons with and without disabilities (8.5 p.p.in the EU) is not decreasing. Educational attainment continued to be a key driver of differences in monetary poverty rates. AROP rates for persons having achieved tertiary education (levels 5 and 6) were less than one third the AROP rate for persons having achieved a primary or lower secondary level of education. In 2013, the rates were 7.5% and 23.7% respectively. For persons with upper secondary education the corresponding rate was 14.5%.
Income inequality remained broadly stable in 2013. The S80-S20 ratio, 25 included in the scoreboard of key employment and social indicators, recorded a slight increase (by 0.1 pps) in the euro area, while remaining almost constant in EU28 (Figure 19). However, a broad and increasing dispersion of inequality figures was observed across Europe, as a result, among others, of the different impact of the crisis on employment and households' disposable income, the different redistributive role of tax and benefits systems, and different stances of national social protection systems. The highest inequality figures were observed in Portugal, Lithuania, Spain, Latvia, Greece, Bulgaria and Romania, all displaying a S80-S20 ratio higher than six. Among these countries, relevant increases were recorded by Lithuania and Bulgaria. Luxembourg also showed a much higher than average increase in income inequality in 2013, although its level remained relatively lower.
Figure 19: Inequality (S80/S20 measure), as reported in the scoreboard of key employment and social indicators

Source: Eurostat, EU-SILC (DG EMPL calculations). Period: 2013 level and change 2012 – 2013.
Note: Axes are centred on the unweighted EU28 average. EU28 and EA19 refer to the respective weighted averages. The legend is presented in the Annex. Statistically insignificant changes are set to zero. For methodological information, consult the Annex.
Social protection expenditure as a share of GDP increased slightly on average in the 28 EU Member States. It rose to 29.4% of EU-28 GDP in 2012 from 29.0% of GDP in 2011. Ten Member States devoted more than 30% of their GDP to social protection expenditures in 2012 (Denmark, France, the Netherlands, Ireland, Greece, Finland, Belgium, Sweden, Italy and Austria), while in eight countries it was less than 20% (Latvia, Estonia, Romania, Lithuania, Bulgaria, Poland, Slovakia and Malta). In terms of expenditure shares, in 2013 more than half of total spending was related to old age (pensions; Figure 20).
Figure 20: Social expenditure components in 2013, EU-28, as % of total social protection expenditure

Source: Eurostat, ESSPROS
In 2014, while the economic environment improved, both cash and in-kind expenditure increased in real term in the EU and the EA at a faster pace than in 2013 (Figure 21). However, the increase of in-kind benefits in 2014 only partially compensated for the declines observed between 2010 and 2012. Most Member States registered similar increases, except for Ireland, Greece, Spain, Cyprus, Croatia and Slovenia where in-kind benefits continued to decline.
Figure 21: Breakdown of the annual change in real public social expenditure between the contributions from in-cash and in-kind benefits (2001–14) in EU28 and EA19


Source: Eurostat, National Accounts (DG EMPL calculations). Note: the values for 2014 are an estimate based on National Accounts. Note: When no data are available in the National Accounts (annual), the data were either based on National Accounts (quarterly) or the AMECO database (in the latter case by usually applying calculated growth rates to the data available from National Accounts (annual).
Changes in the tax-benefit system over the period 2008-14 had a strong impact on household incomes across the Member States 26 . In some countries, the measures adopted since 2008 lead to a strong reduction of household incomes (-17% in Greece, -4.5% in Latvia, and around -4% in Italy and Estonia), even if the impact was generally greater on high incomes than on low incomes. More recently, in most of the Member States assessed, the measures adopted in 2013-14 had a positive overall impact on incomes and in most cases were more beneficial to lower income groups. It can be noted that in countries that experienced a similar average impact on household incomes the distributional impact of measures over the period 2008-2014 varied between lower and higher income groups, highlighting the importance of the design of measures in terms of policy outcomes.
In some countries, access to healthcare for low income households has become more difficult. On average in the EU, 6.4% of people living in low income households (lowest quintile) reported an unmet need for healthcare 27 , against 1.5% of those living richer households (top quintile). The gap in access to healthcare between rich and poor increased during the crisis in Member States (Figure 22).
Figure 22: Self-reported unmet need for medical exam (lowest quintile-top quintile)

Source: Eurostat, EU-SILC. Notes: Reason: too expensive or too far to travel or waiting list. No (Eurostat published data available for SI)
2.
EMPLOYMENT AND SOCIAL REFORMS – MEMBER STATE ACTION
This section presents an overview of recent key employment and social reforms and measures taken by the Member States in priority areas identified by the new EU employment guidelines. 28 The guidelines for the employment policies of the Member States combine demand and supply side orientations and, while addressed to Member States, should be implemented fully associating social partners and stakeholders. The section draws on LABREF 2014 data as well as Member States’ National Reform Programmes 2015 and European Commission sources. 29
2.1 Boosting demand for labour
Employment subsidies remain a widely used instrument to support employment and job creation, with some countries having scaled up or fine-tuned existing programmes (Lithuania, Sweden, Ireland), and others having introduced new schemes altogether (Cyprus, France, Romania and Italy). Start-up incentives including measures encouraging entrepreneurship were decided in Spain, Cyprus, Portugal and Slovakia.
Member States’ action in the field of labour taxation has since the onset of the crisis shown a relationship between government budget balance and the direction of labour taxation reforms. On average, countries with a persistent negative budget balance have passed more reform measures that increased the taxation on labour. Moving towards reducing the high tax wedge on labour remains a challenge but several countries did recently pass measures to lower the tax wedge.
Structural reductions of social security contributions were introduced or reinforced to support labour demand in France, Greece, Latvia, Belgium, Italy, Romania and Sweden. Targeted reductions for vulnerable groups were made in Croatia, Slovenia, Portugal, Slovakia, Belgium and the UK. Spain introduced in 2015 a reduced social security contribution rate for hiring on open-ended contracts. Finland reduced employee social security contributions to counterbalance low wage growth. In Italy, the 2015 Stability Law introduced several measures to lower the tax wedge on labour, including reduced labour costs for employers, tax credits for low-wage earners and a three-year reduction of social security contributions for open ended hires in 2015. In France, the 'Responsibility and Solidarity Pact' added in 2014 further reductions in social security contributions for low and medium wage earners to the existing non-targeted tax credits for competitiveness and employment. Greece introduced a new tax scale, abolished the tax free thresholds and replaced it by targeted tax credits.
Following far-reaching action in preceding years, wage-setting has generally come to show real wages move in line with productivity developments, with some countries recently taking measures to address the minimum wage. Inter-sectorial wage moderation agreements were agreed in Finland for 2014-2015 and in Spain for 2015-2016. In Slovenia a Social Agreement was concluded in 2015 setting collective agreements, inflation and a share of sectorial productivity as the basis for private sector wage-setting. To ensure alignment between wage and productivity developments, the Belgian government temporarily suspended automatic wage indexation until 2016, while in Cyprus the suspension of wage indexation was extended to 2016 also for the private sector. There were new mechanisms to set the minimum wage in Greece (as of 2017), Ireland and Croatia, and the introduction of a national statutory minimum wage in Germany as of 2015. In Portugal, the 13th and 14th month of public wages were reinstated following a Constitutional Court ruling. In the United Kingdom, the government is introducing a national living wage which is determined by a different set of criteria than that which applied to the existing national minimum wage.
2.2
Enhancing labour supply, skills and competences
In a number of Member States reductions in personal income taxes have supported labour market participation. Reductions in personal income taxes, notably to tackle the poor financial position and disincentives to work of low-income groups, were passed in Spain, Latvia. Others increased the lower income threshold or tax credits (Sweden, Latvia, Lithuania, the Netherlands and Germany). Austria made significant changes in the personal income tax in 2015, including through a reduction in the entry rate for personal income tax.
Pension reforms continue to focus on rebalancing time spent in work and in retirement, mainly through higher pensionable ages, tighter eligibility conditions and reduced early retirement opportunities. Over the past year, several Member States (Belgium, Bulgaria, Netherlands, Portugal and the United Kingdom) have adopted new or brought forward previously planned increases of the pensionable age. In total, 25 of 28 Member States have now legislated current or future increases. Among those, seven (Cyprus, Denmark, Greece, Italy, Netherlands, Portugal and Slovakia) have explicitly linked the pensionable age to future gains in life expectancy, and more countries (Belgium, Finland, Slovenia) are considering doing the same.
More Member States are taking steps to reduce labour market exit through early retirement, for instance, by increasing the eligibility age and/or career length requirement (Belgium, Latvia) or phasing out specific early retirement benefits or schemes (Luxembourg, Poland). Several Member States (Bulgaria, Denmark, Croatia) have introduced more stringent criteria and procedures regulating access to disability benefits, to ensure they are targeted at the genuinely deserving and not used as a proxy early retirement scheme.
Some Member States have undertaken reforms in 2014-2015 to enhance work-life balance policies with view of increasing labour market participation. Austria has announced investments totalling EUR 800 million by the year 2018/2019 for increasing the number and availability of places in all-day schools, as well as for improving the quality of their services. The United Kingdom has introduced shared parental leave, allowing parents to share 52 weeks of paid leave and pay following the birth or adoption of a child.
Enhancing women’s labour market participation can help to address their increased risk of poverty and social exclusion, especially in case of single parent families, as well as help prevent their experience of poverty in old age due to lower pension entitlements.
Encouraging more women to enter and stay on the labour market can also help to counterbalance the effects of a shrinking working-age population projected in most EU Member States by enhancing labour supply. It would thereby help reduce the strain on public finances and social protection systems, make better use of women’s skills and competences and raise growth potential and competitiveness.
Structural weaknesses in education and training systems continue to have an impact on skills levels. Recent reforms in Italy have targeted a stabilisation of the public educational system via permanent contracts for people working in the sector. In 2015, Spain reformed the organisation and governance of its so-called training for employment subsystem in an effort to link training contents with labour market needs, while in Sweden a new adult education initiative will increase the number of places in the municipal adult education system. Improving the skills intelligence (skills needs assessment, anticipation and forecasting) and its use to steer the education and training offer could help to achieve a better balance between the demand for and the supply of skills. While some Member States have an established tradition of quantitative and qualitative forecasting and clear cooperation mechanisms between education and training institutions and labour market actors (e.g. Denmark, Sweden), others have less coherent systems. Some Member States are in the process of developing skills intelligence (e.g. Estonia, Romania), often with the support of the European Social Fund (ESF) 30 . Still, public expenditure on education decreased in almost half of Member States and fell by 3.2% for the EU as a whole compared to 2010 31 .
Member States sustained efforts to support youth employment and address high levels of NEETs. Substantive Member State action has focused on improving the quality of education and training for better school-to-work transitions. Germany amended its law to implement "assisted vocational training", allowing for a better preparation and follow-up of disadvantaged young people as well as providing services to companies engaged in training of disadvantaged young people. In France, a comprehensive plan to reduce early school leaving is being implemented since end 2014. For pupils at risk aged 15 or more, a specific "adapted initial training path" combining regular education with out of school activities is being experimented. For early-school leavers aged between 16 and 25 a legal right to get back into education or training has been introduced.
Poland has taken measures to provide internships for students both with major companies and in public administration. Denmark implements a major vocational education reform as from 2015 inter alia with a view to reducing drop-out, promoting the popularity of vocational education and increasing apprenticeship opportunities. In Bulgaria changes have been made to the legislation on the provision of internships and work is ongoing to adapt curricula to better meet labour market needs. In Austria a focus on youth was also very much on education, including reforms in vocational training as well as in higher education, in order to better facilitate the pathway from education to working life. A reform of the “Vocational Training Act” aims to further improve the apprenticeship training system and to enhance its quality. Italy approved a school reform which promotes the use of traineeships and focuses on a co-operation with companies,
Efforts to support early activation of NEETs and outreach towards young people furthest away from the labour market were stepped up in many Member States. Jointly with the European Commission, Latvia, Finland, Portugal and Romania have developed activities in early 2015 to increase awareness of opportunities offered by the Youth Guarantee, encourage NEETs to register with providers and benefit from support. Portugal has created a broad network of partners to increase outreach to NEETs. Besides, a Youth Guarantee online platform has been put in place where each NEET can register, and be automatically redirected to the Public Employment Services (PES), EURES network or to the centres for qualification and professional training. In Sweden municipalities' responsibility for intervening vis-à-vis young NEETs has been considerably strengthened as from January 2015. Bulgaria launched the National programme “Activating the inactive” with the aim to register discouraged NEETs with the Labour offices, and to involve them in training or help them returning to education and includes the appointment of Roma mediators. Croatia is developing a NEETs tracking system in 2015 to address increases in the numbers of NEETs as part of a comprehensive human resources register.
Breaking down barriers between the key players of school to work transition (education, PES, employers) has been another important priority. In Belgium, supporting youth employment and stepping up the implementation of the Youth Guarantee is a key priority within the 2025 Strategy for Brussels, adopted in June 2015. With the support of the ESF, the strategy involves all the relevant ministers and is implemented in partnership between key governance levels, in order to build bridges between the employment, education and youth sectors. Partly inspired by the Youth Guarantee, Germany continued to establish youth employment agencies/local alliances to support young people in the transition from school to work –bringing the number to at least 186 by September 2014. They foster close cooperation between various local actors, including PES, schools and social welfare services. More model projects are planned with ESF financing from 2015 onwards stepping up also socio-pedagogical assistance and work opportunities for disadvantaged youth.
Some Member States dedicated efforts at supporting job creation and boosting labour market opportunities for young people. Croatia launched 11 new ALMP measures in 2014 under the ʻYoung and Creative’ package, which now includes employment and self-employment subsidies, training and specialisation subsidies, traineeships for work, community service and job preservation. The Employment Service of Slovenia launched the Work Trials programme in 2015, intended to allow unemployed persons aged up to 29 years to test their knowledge, skills and habits at a specific workplace.
Vocational rehabilitation is key for the participation of persons with disabilities in the labour market. Finland made changes to enable early access to vocational rehabilitation to prevent retirement on a disability pension. From October 2015 a rehabilitee should be able to receive a partial rehabilitation allowance from the Social Insurance Institution for those days of rehabilitation when a person works only part-time. Croatia introduced amendments to the Act on Vocational Rehabilitation and Employment of Persons with Disabilities in December 2014 to improve their professional rehabilitation and employment and the Act also provides for establishment of regional centres for vocational rehabilitation.
In many Member States and for particular groups there is a sizeable risk of long-term unemployment becoming entrenched and translating into higher structural unemployment. A number of Member States have launched new active measures targeting the long-term unemployed. Portugal launched in 2015 a scheme supporting 6 months traineeships for long-term unemployed older than 30 years. In Spain, a national activation programme which started at the end of 2014 is providing financial support to long-term unemployed who are not covered by any benefits, while reinforcing job search and job acceptance requirements and assigning an individual case handler to the 400.000 beneficiaries envisaged.
Finland started implementing in 2015 a reform of support to the long-term unemployed, providing a single point of contact to better coordinate employment services, benefits and social services for the long-term unemployed at municipal level. In France, the national action plan against long-term unemployment adopted in 2015 combines a reinforced of personalised, intensive counselling, aiming to reach 460.000 beneficiaries in 2017, an increased offer of subsidised contracts and vocational training and a new scheme of work-based training for older workers or those with lower qualifications, as well as better access to childcare and housing support.
Economic recovery and lower inflows to long-term unemployment and an improving budgetary situation open up opportunities for additional interventions. However, long-term unemployment is addressed by current reforms in less than half of the Member States. A Commission proposal for a Council Recommendation on the integration of the long-term unemployed into the labour market is being discussed by Member States.
2.3 Enhancing the functioning of labour markets
Member States’ action to modernise employment protection legislation continued particularly in countries with major imbalances and segmented labour markets. However the direction of reforms does only in some cases aims to los the gap between labour market insiders and outsiders. In Italy, a wide-ranging enabling law (the so-called Jobs Act) was adopted in late 2014 (with final implementing decrees adopted in September 2015), involving among other the simplification of contracts and labour law procedures and the reduction of the scope for reinstatement following unfair dismissals. The Work and Security Act passed in the Netherlands in 2014 introduces a cap on severance payments or damages for unfair dismissal, while increasing protection for temporary workers. A broad labour code reform was passed in Croatia, leading to lower costs, simplified procedures for individual and collective dismissals, easier access to temporary agency work and more flexible working time organisation. Collective dismissal procedures were also simplified in Latvia. In Bulgaria the Labour Code was amended to increase working time flexibility and regulate the possibility to sign daily labour contracts for short term seasonal agricultural work.
Despite a high degree of segmentation, a number of countries facilitated the access to fixed-term contracts (Czech Republic) or increased their duration or renewal possibilities (Croatia, Italy, Latvia and temporarily also in Portugal). A minority of countries reinforced regulations on fixed-term contracts (Poland), and more specifically on the use of temporary agency work (Slovenia, France, Denmark and Slovakia). The UK introduced a fee for employment tribunals, to contain the number of cases brought to court.
In line with action undertaken in previous years, enhancing the effectiveness of public employment services continued in a considerable number of Member States. Denmark and Latvia improved jobseekers' profiling and targeting of job search assistance and services, while Poland and Slovakia put a greater focus on services to vulnerable groups. Sweden and Lithuania improved the case handling of young people and school drop outs. Enhanced cooperation between different actors, in some cases linked to conditional allocation of funds across offices, was decided in Belgium, the Netherlands, Spain and Slovakia. As well as reorganisation of the Public Employment Service in Ireland, additional employment service capacity, primarily focussed on the long-term unemployed, has been contracted from private sector providers under the JobPath Programme.
Reform of social dialogue is ongoing in many Member States. The reforms touch upon the functioning and effectiveness of social dialogue. They are mostly linked to collective bargaining but also have an impact on workers’ representation. Germany, Slovakia and Portugal eased the criteria for the extension of sectorial collective agreements on wages, the latter thereby partly turning back the practice under the financial assistance programme. The unlimited validity of expired collective agreements was abolished in Croatia. In Portugal, the validity of expired and not renewed collective agreements was reduced in 2014 and the possibility of a negotiated suspension of collective agreements in firms in difficulties was introduced. The Italian social partners signed an inter-sectorial agreement that clarifies the criteria for the measurement of the representativeness of trade unions and sets the pace for broadening the scope of decentralised collective bargaining. New legislation on trade union activity was passed in Croatia in 2014. In France the government in 2015 brought in social dialogue reform to modernise employees’ representations and rationalise employers’ obligations for informing and consulting employees’ representatives. Annual collective bargaining is to be re-organised around prescribed main axes. In Germany in 2015 the 'Tarifeinheitsgesetz' was adopted, an act that ensures that in case there are overlapping and conflicting collective agreements in a company, only the agreement which was signed with the trade union with most members (in this company) shall be applicable. In the United Kingdom a new 2015 Trade Union Bill holds reforms for trade unions and industrial action.
The involvement of social partners in designing and implementing policies and reforms requires further monitoring. In the majority of Member States there is some form of involvement of social partners in preparing the National Reform Programmes. The quality and depth of this involvement and the extent to which social partners are in a position to influence the contents of the National Reform programmes (NRPs) varies significantly. Less Member States effectively involve social partners in the implementation of country-specific recommendations or related reforms and policies.
2.4 Ensuring fairness, combatting poverty and promoting equal opportunities
Efforts to contain or reduce poverty and increase labour market participation have included major overhauls of social benefit systems, support of ALMPs, and targeted measures for those at higher risk of poverty. Some Member States increased the amount of income support (Belgium, Estonia, Croatia, Sweden, Romania), while others improved the design of the measures by introducing tapering of benefits (Malta, Latvia) or in-work benefits (Estonia). A number of Member States are introducing or strengthening activating measures as part of their policy to better address working-age poverty (Austria, Bulgaria, Germany, Denmark, Netherlands). Various financial and non-financial incentives are also being introduced to facilitate a return to the labour market (Belgium, Finland, France, Latvia, Malta, Poland). Reforms of the social assistance and unemployment systems are planned or in progress in a number of countries (Belgium, Croatia, Greece, Ireland, Romania, Sweden).
Belgium continues the reform of the unemployment benefit system to ensure an appropriate balance between benefits and effective job search assistance and training opportunities. As part of its reform of the welfare system, Romania is set to introduce a minimum social insertion income, combining three existing means tested programmes, better targeting the beneficiaries and reducing the administrative costs. Greece has launched a pilot programme to introduce a minimum income scheme in the country. Ireland continued efforts to reduce the prevalence of low work intensity households through integrated service delivery (one-stop-shop) and linking benefit entitlements more closely with activation services.
Growing concerns about the effects of increasing numbers of children affected by poverty have seen many Member States step up investment towards children. Income support measures for families with children were strengthened or expanded in Bulgaria, Czech Republic Poland and Romania, while Belgium and Malta introduced supplements to child benefits for children growing up in low-income families. Support for parents' access to the labour market and incentives to work were enhanced in Hungary, Malta and the United Kingdom. Investment in education, and specifically in early childhood education and care (ECEC), has been sustained in several Member States, reflecting a growing awareness of the fundamental role of the pre-school years in shaping children's cognitive and social skills. Finland introduced compulsory pre-school education and Croatia introduced one year of compulsory pre-school education before the start of primary education. Austria provided additional public funding to improve education outcomes in ECEC, United Kingdom introduced 15 hours free childcare per week for 3 and 4 year olds and measures aimed at young disadvantaged children. Funding was also increased in some Member States for the expansion of childcare facilities (Belgium, Bulgaria, Czech Republic, Germany, Estonia, Poland, United Kingdom), after school options (Ireland), or all-day school places (Austria). Bulgaria continued to improve the quality of alternative care and support to children growing up outside of their family. Finland also adopted several measures to strengthen child protection in these situations.
Recent pension reforms have helped to contain the long-term increase of pension expenditure in most Member States 32 . Their impact on pension adequacy remains contingent on the ability of women and men to have longer and fuller careers 33 , which is not uniform across professional groups and genders. The great majority of Member States' reforms have focussed on raising the pensionable age and on restricting early retirement if reforms are not always flanked by active ageing policies. Some Member States have retained or re-introduced specific earlier retirement conditions for persons with lengthy careers or in arduous jobs. The restriction of access to early retirement is presenting governments and/or social partners with the challenge of finding alternative solutions to late-career problems of age management and health in the workplace and the labour market.
At present, the gender pension gap in the EU remains at 40%, reflecting the gender pay gap and the shorter and more interrupted average careers of women. The overall shift towards more earnings-related pensions means that pension systems will not be equipped to compensate for these imbalances. As part of the efforts to enable women attain longer working lives, almost all Member States (except Romania) have equalised pensionable ages for women and men or adopted future reforms to that effect, although in some cases they will be fully completed as late as 2040ies.
A great number of reforms have also changed the indexation of pension benefits to less generous uprating mechanisms. The impact on adequacy will depend on developments in wages and prices.
Health systems contribute to preserving and restoring good health of the EU's population. In addition to collective and individual welfare, this supports economic prosperity through improving labour market participation, labour productivity and reducing absence from work. Obviously, health systems have a cost: a large share of expenditure on health systems in the EU is borne by public means, hence they have to remain fiscally sustainable.
There is a need to assess the performance of health care and long-term care systems and to implement sound and ambitious reforms. These include ensuring a sustainable financing basis, encouraging the provision of and access to effective primary health care services, thus reducing the unnecessary use of specialist and hospital care, ensuring the cost-effective use of medicines, better public procurement, improving integration of care through up to date information channels (such as e-health), deploying methodologies to assess the relative effectiveness of health technologies and costs of care for decision-making purposes and improving health promotion and disease prevention.
Important health care reforms have been implemented in most Member States. The numerous structural reforms implemented include a restructuring of primary and secondary care, greater care coordination, more intensive and interoperable use of ICT and e-Health solutions (Bulgaria, Czech Republic, Croatia, Hungary, Malta, Poland, Portugal, Romania, Slovenia, Slovakia and the United Kingdom), a shift in the pharmaceutical policies toward price regulation and generic substitution, as well as the introduction of financial and non-financial incentives for both providers and users of health care services. In order to improve the delivery of health care services, several Member States (Bulgaria, the Czech Republic, Germany, Croatia, Ireland, Poland, Portugal, Sweden, and the United Kingdom) introduced policies aimed at optimising the use of treatments and the prescription patterns.
The ageing of the health workforce coupled with challenges to recruit or to retain health workers due to demanding working conditions and relatively low pay in some health care occupations are leading in many countries to health workforce shortages. To counteract this, some Member States (Belgium, the Czech Republic, Germany, Spain, Croatia, Ireland, Latvia, Poland, Sweden) adopted measures to facilitate the training and upskilling of health care professionals and to offer wage increases and support in order to increase the appeal of the health care sector.
Several Member States are in the process of adopting or implementing major reforms in the area of long-term care with the aim of ensuring a more efficient use of existing resources. Reform measures focus on further developing home care services and strengthening care integration.
Long-term care financing arrangements have been modified in a number of Member States (Austria, Belgium, Bulgaria, Hungary, Germany, Luxembourg). While some decided to increase public funding and to reduce private cost-sharing, others lowered existing eligibility thresholds for public support or introduced other measures for cost-containment.
A limited number of Member States have reported measures for preventing dependency which were mostly related to better prevention and early diagnosis of dementia (Austria, Bulgaria, Ireland). National governments put a stronger emphasis on improving service delivery by making care more patient-centred, by promoting the transfer from institutional care to community-based care, by developing and assuring new quality standards and by increasing staff levels.
Some Member States (Belgium, Czech Republic, Germany, Finland) improved the support provided to informal carers through new strategies, better opportunities for reconciling work and care responsibilities and through legal recognition of informal carers.
Considerable commitments were taken to improve access to affordable housing. Some Member States adopted plans for construction of housing or social housing (Czech Republic, France, Ireland, Portugal, Slovenia, and the United Kingdom). Bulgaria used the European Regional Development Fund to improve access to housing for people in vulnerable situations. Extending schemes to help first-home buyers were reported in Hungary and a mobility scheme for social housing tenants in the United Kingdom. The conditions of housing allowance, including eligibility criteria and thresholds were revised (Czech Republic, Finland) and rent controls/guarantees were put into place for social purposes (Belgium, Czech Republic, France, Netherlands).
Many programmes aimed at tackling over-indebtedness and evictions, such as the debt detection business cases in the Netherlands and the pilot projects helping evicted families in Slovenia. The eligibility threshold for insolvency protection was lowered in Latvia, while Cyprus offered subsidised mortgage interest payments for vulnerable households. Targeted efforts were also made to confront energy poverty (Belgium) and integrate social housing service provisions (Ireland).
Some measures aiming at facilitating the social inclusion of people at-risk, such as persons with disabilities, Roma, or persons from a migrant background have been implemented at national level. Estonia started to implement a Work Ability Reform that introduced a qualitative shift from evaluating the incapacity to work to focus instead on assessing an individual's ability to work and facilitate integration into the labour market and social life. Similarly, the Netherlands adopted a Participation Pact to boost participation in the labour market of people with disabilities, and unskilled people, both in the private and the public sectors.
Equal access to high quality and inclusive education is the first and most important step to social inclusion. Trends towards inclusive education of vulnerable children are evident. Belgium (Flanders) developed the new Act “M-Decree” that provides for reasonable accommodation in mainstream education. The Czech Republic approved the Educational Act containing 5 degrees of supported measures to improve conditions of school for inclusive education. Denmark set a target of 96% of students of public schools in mainstream education in 2015 and established the Centre for Inclusive Education and Special Needs Education.
Many persons with disabilities face severe forms of exclusion, i.e. live in institutions. However, trends towards transfer from institutions to community based care and independent living are evident in some countries and are being facilitated by the European Structural and Investment Funds. For example Finland decreased significantly the number of persons with intellectual disabilities living in long-term institutional care and replaced this care mainly by 24 hour services. The goal is to replace institutional care by individual housing and services by 2020
Measures to promote the integration of Roma have been undertaken in some Member States. In January 2015 Romania adopted a revised National Strategy for inclusion of Romanian citizens belonging to the Roma minority for 2014-2020 while Lithuania adopted an Action Plan for Roma integration into the Lithuanian society for 2015-2020. In 2015 the Czech Republic adopted a strategy for Roma integration up to 2020. Other countries such as Hungary, Slovakia and Poland revised their national Strategies and Action Plans, in particular to fulfil the ex-ante conditionality related to ESF Investment Priority 9.2.
In Slovakia, the number of assistant teachers for children with special needs, including children from socially disadvantaged environments, has been significantly increased for the school year 2014-2015 and a further increase is budgeted for 2015. A proposal for compulsory enrolment in ECEC for children from socially disadvantaged environments was made for Roma communities, without concrete plans for its implementation at this stage.
An increasing inflow of refugees is presenting governments and society at large with receiving and integrating an increasing number of people, with some Member States particularly affected. There have been decisions on integration packages as well as dissuading measures. In Austria an integration package focusses on language support and labour market integration, with most of the budget earmarked for labour market integration. The Public Employment Services started pilots to improve the labour market prospects for people entitled to asylum as of mid-2015. In Sweden the 2015-2018 introduction assignment which aims to favour a faster integration of newly arrived refugees and foreign born into the labour market has been augmented. To identify skills of new arrivals at an early stage the Government has set aside funds within existing frameworks for a pilot project for skills mapping of recently arrived migrants living in the Swedish Migration Board’s accommodation centres. In Germany, the Federal Employment Agency and the Federal Agency of Migration and Refugees launched an ESF-funded pilot project to promote a quick integration of refugees into the labour market, with model employment agencies for refugees set up in six German regions. On the other hand measures anticipated to have a dissuasive effect such as the replacement of cash payments by benefits in kind are being taken and refugees from regions identified as safe are subject to a speeded-up asylum procedure. In Denmark, dissuasive measures reduced special integration allowances below the existing cash benefits for participant in integration programs, the accrual principle for family benefits and child benefit for refugees was restored while a harmonization of eligibility rules for old age pension also no longer exempt refugees from the accrual principle. In the United Kingdom new restrictions on access to means-tested benefits have been introduced discouraging migrants going to the UK without job prospects. These effectively prevent newcomers from claiming means-tested benefits under Universal Credit without having worked in the UK first. The new restrictions follow on from earlier limits on claims for Jobseeker’s Allowance, Child Benefit and Child Tax Credit.
Member States must ensure that asylum seekers have effective access to the labour market at the latest within 9 months from the date when they apply for international protection 34 . Some Member States allow asylum seekers to integrate in the labour market earlier and some Member States are proposing to do so. As part of the EU migration agenda to help the Member States respond to the most immediate needs of asylum seekers, such as for housing, supplies and services, the Commission adopted a Communication on public procurement rules for refugee support measures. 35 Concretely and immediately, European Social Fund (ESF) investments can support vocational training, counselling, access to health and social services as well as campaigns to combat discrimination.
A first assessment of the macroeconomic impact of the refugee influx shows that if the short-term impact via higher public spending is relatively small, albeit more pronounced for some Member States, in the medium to long term, it has a positive effect on growth provided that labour market integration is successful 36 .
Annex 1 Scoreboard of key employment and social indicators with EU averages as reference points*

Source: Eurostat, EU LFS, National Accounts and EU-SILC (DG EMPL calculations)
For each indicator (except for real growth in GHDI as it is represented as a monetary value) the three columns refer to i) year on year change in absolute terms; ii) the difference from the EU (or Euro Area) average rates in the same year iii) the year on year change for the country relative to the year on year change at the EU or EA levels (indicating whether the country's situation is deteriorating/improving faster than the rest of the EU/EA reflecting the dynamics of socio-economic divergence/convergence). S1 stands for 1st semester and is based on quarterly seasonally adjusted data.
*indicates changes and difference to the EU that are not statistically significant, in further analysis in Chapter 2 they will be set to 0.
Annex 2 Scoreboard of key employment and social indicators with Eurozone averages as reference points

Annex 3 Scoreboard of key employment and social indicators with absolute values in three consecutive years

Source: Eurostat, EU LFS, National Accounts and EU-SILC (DG EMPL calculations)
Annex 4: Summary of the reading of the scoreboard of key employment and social indicators

Annex 5 Methodological note on the identification of trends and levels in the scoreboard
In mid-2015 the European Commission and Member States discussed ways of improving the analysis, reading and interpretation of the scoreboard of key employment and social indicators in view of the next version of the JER and in particular, the issue of developing a methodology for assessing MS performance on the basis of the scoreboard It was agreed that the methodology to be applied should be able to provide, for each indicator, a measure of the relative standing of each MS, according to its indicator value (score), within the distribution of the indicator values (scores) of the EU28. The methodology is to be applied to both year-levels (levels) as well as to one-year changes (changes) thus enabling a holistic assessment of MS performance.
To achieve this goal a commonly used and straightforward approach can be applied. This involves analysing, for each indicator, the distribution of levels and changes, respectively, and detecting the observations (Member States scores) that significantly deviate from the common trend - that is, in statistical terms, detecting the “outliers” of the distribution of the scores of the EU28 for that indicator.
In order for this approach to be applied, before proceeding with the analysis it is opportune to convert, for each indicator, the MS scores to standard scores (also known as z-scores), which have the advantage of providing a way to equate different metrics, thus allowing the same metric to be applied for all the indicators.
This is achieved by standardising raw values of both levels and changes, for each indicator, according to the formula:
This approach enables expressing for each Member State its raw indicator value in terms of how many standard deviations it deviates from the average. Then the performance of each MS can be assessed and classified on the basis of the resulting z-scores against a set of pre-defined thresholds, which can be set as standard deviation multiples. It should be noted that a comparable methodology has been already agreed and used in the past in the context of the LIME Assessment Framework 37 .
The most important issue within this approach is setting cut-off points. Given that no parametric assumption can be made about the distribution of the observed raw values for the employment indicators 38 , it is common to use a “rule of thumb” in selecting the thresholds. According to the analysis of the key indicators used in the scoreboard, and considering that the lower the unemployment and NEET indicators the better the performance, the proposal is to consider 39 :
1.Any score below -1 as a very good performance
2.Any score between -1 and -0.5 as a good performance
3.Any score between -0.5 and 0.5 as a neutral performance
4.Any score between 0.5 and 1 as a bad performance
5.Any score higher than 1 as a very bad performance 40
The present methodology suggested is to evaluate the performance for all indicators for each MS for both levels and changes. The outcome of this step will thus be, for each of the indicators, the evaluation of Member States scores for both levels and changes according to the five criteria, as shown in Table 1:
Table 1: Suggestion for z-scores threshold values
|
|
z-scores threshold values |
||||
|
-1.0 |
- 0.5 |
0 |
0.5 |
1.0 |
|
|
(lower than) |
(lower than) |
(between) |
(Higher than) |
(Higher than) |
|
|
Assessment |
|||||
|
Levels |
Very Low |
Low |
On average |
High |
Very High |
|
|
|
||||
|
Changes |
Much lower than average |
Lower than average |
On average |
Higher than average |
Much higher than average |
By combining the evaluation of levels and changes it is possible to classify the overall performance of a country according to each indicator within one of the following seven categories. The colour coding is reflected in Figures 3, 4, 5, 17 and 18.
|
Best performers |
scoring less than -1.0 levels and less than 1.0 in changes |
Member States with levels much better than the EU average and with the situation improving or not deteriorating much faster than the EU average |
|
Better than average |
scoring between -1.0 and -0.5 in levels and less than 1 in changes or scoring between -0.5 and 0.5 in levels and less than -1.0 in changes |
Member States with levels better than the EU average and with the situation improving or not deteriorating much faster than the EU average |
|
On average / neutral |
scoring between -0.5 and 0.5 in levels and between -1.0 and 1.0 in changes |
Member States with levels on average and with the situation not improving nor deteriorating much faster than the EU average |
|
Good but deteriorating |
scoring less than -0.5 in levels and more than 1 in changes, and presenting a change higher than zero 41 |
Member States with levels better or much better than the EU average but with the situation deteriorating much faster than the EU average |
|
Weak but improving |
scoring more than 0.5 in levels and less than -1.0 in changes |
Member States with levels worse or much worse than the EU average but with the situation improving much faster than the EU average |
|
To watch |
scoring between 0.5 and 1.0 in levels and more than -1.0 in changes or scoring between -0.5 and 0.5 in levels and more than 1.0 in changes |
This category groups two different cases: i) Member States with levels worse than the EU average and with the situation deteriorating or not improving sufficiently fast; ii) Member States with levels in line with the EU average but with the situation deteriorating much faster than the EU average |
|
Critical situations |
scoring more than 1.0 in levels and more than -1.0 in changes |
Member States with levels much worse than the EU average and with the situation deteriorating or not improving sufficiently fast |
As for the gross household disposable income (GHDI), which is only presented in changes, the following classification has been used (see Figure 14).
|
Best performers |
scoring more than 1.0 in changes |
Member States with changes much higher than the EU average |
|
Better than average |
scoring between 1.0 and 0.5 in changes |
Member States with changes higher than the EU average |
|
On average / neutral |
scoring between -0.5 and 0.5 in changes |
Member States with changes on average |
|
To watch |
scoring between -0.5 and -1.0 in changes |
Member States with changes lower than the EU average |
|
Critical situations |
scoring less than -1.0 in changes |
Member States with changes much lower than the EU average |
Confidence intervals computation for social indicators and their application in the methodology
EU-SILC is a sample survey, which means that only a small part of the population (the sample) is interviewed. From the results obtained on the sample, statistical theory allows then to estimate certain characteristics of the whole population with a margin of error that can be quantified. This means that when looking at indicators we should also look at the related accuracy measures; in the same way, when looking at a nominal change in the value of an indicator from one year to the next we should also take into account accuracy measures as it may occur that, given the inherent margin of statistical error, in reality there is no change in the value of that indicator.
EU-SILC is a complex survey involving different sampling design in different countries. For this reason, "to the book" standard methods for calculating accuracy measures are not directly applicable. Eurostat, with the substantial methodological support of the Net-SILC2 network of experts, has chosen to apply a "linearization" approach coupled with the “ultimate cluster” method for variance estimation. The estimates generated are then used to assess whether year-to-year changes or differences in levels relative to the EU average are statistically significant or not.
Cut-off points summary table
|
Very low |
Low |
On average |
High |
Very high |
||
|
UR |
Levels |
less than 4.9% |
less than 7.4% |
between 7.4% and 12.4% |
more than 12.4% |
more than 14.9% |
|
Changes |
less than -1.6pp |
less than -1.2pp |
between -1.2pp and -0.4pp |
more than -0.4pp |
more than 0.0 pp |
|
|
YUR |
Levels |
less than 11.0% |
less than 16.8% |
between 16.8% and 28.5% |
more than 28.5% |
more than 34.3% |
|
Changes |
less than -4.2pp |
less than -3.3pp |
between -3.3pp and -1.5pp |
more than -1.5pp |
more than -0.6pp |
|
|
NEET |
Levels |
less than 7.7% |
less than 10.0% |
between 10.0% and 14.5% |
more than 14.5% |
more than 16.8% |
|
Changes |
less than -1.3pp |
less than -0.9pp |
between -0.9pp and -0.1pp |
more than -0.1pp |
more than 0.4pp |
|
|
GHDI |
Changes |
less than -0.1% |
less than 0.6% |
between 0.6% and 2.0% |
more than 2.0% |
more than 2.7% |
|
AROP (18-64) |
Levels |
less than 12.2% |
less than 13.9% |
between 13.9% and 17.3% |
more than 17.3% |
more than 19.0% |
|
Changes |
less than -0.6pp |
less than -0.2pp |
between -0.2pp and 0.6pp |
more than 0.6pp |
more than 1.0 pp |
|
|
S80-S20 ratio |
Levels |
less than 3.8 |
less than 4.3 |
between 4.3% and 5.4 |
more than 5.4 |
more than 5.9 |
|
Changes |
less than -0.2 |
less than -0.1 |
between -0.1 and 0.2 |
more than 0.2 |
more than 0.3 |
Annex 6 Summary overview of Key Employment Challenges and particularly good labour market outcomes according to the Employment Performance Monitor (C=challenge; G=good labour market outcome) – adopted in June 2015 42

Annex 7: Summary overview of the ‘social trends to watch’ and Member States with statistically significant deterioration and improvement as identified by the Social Protection Committee
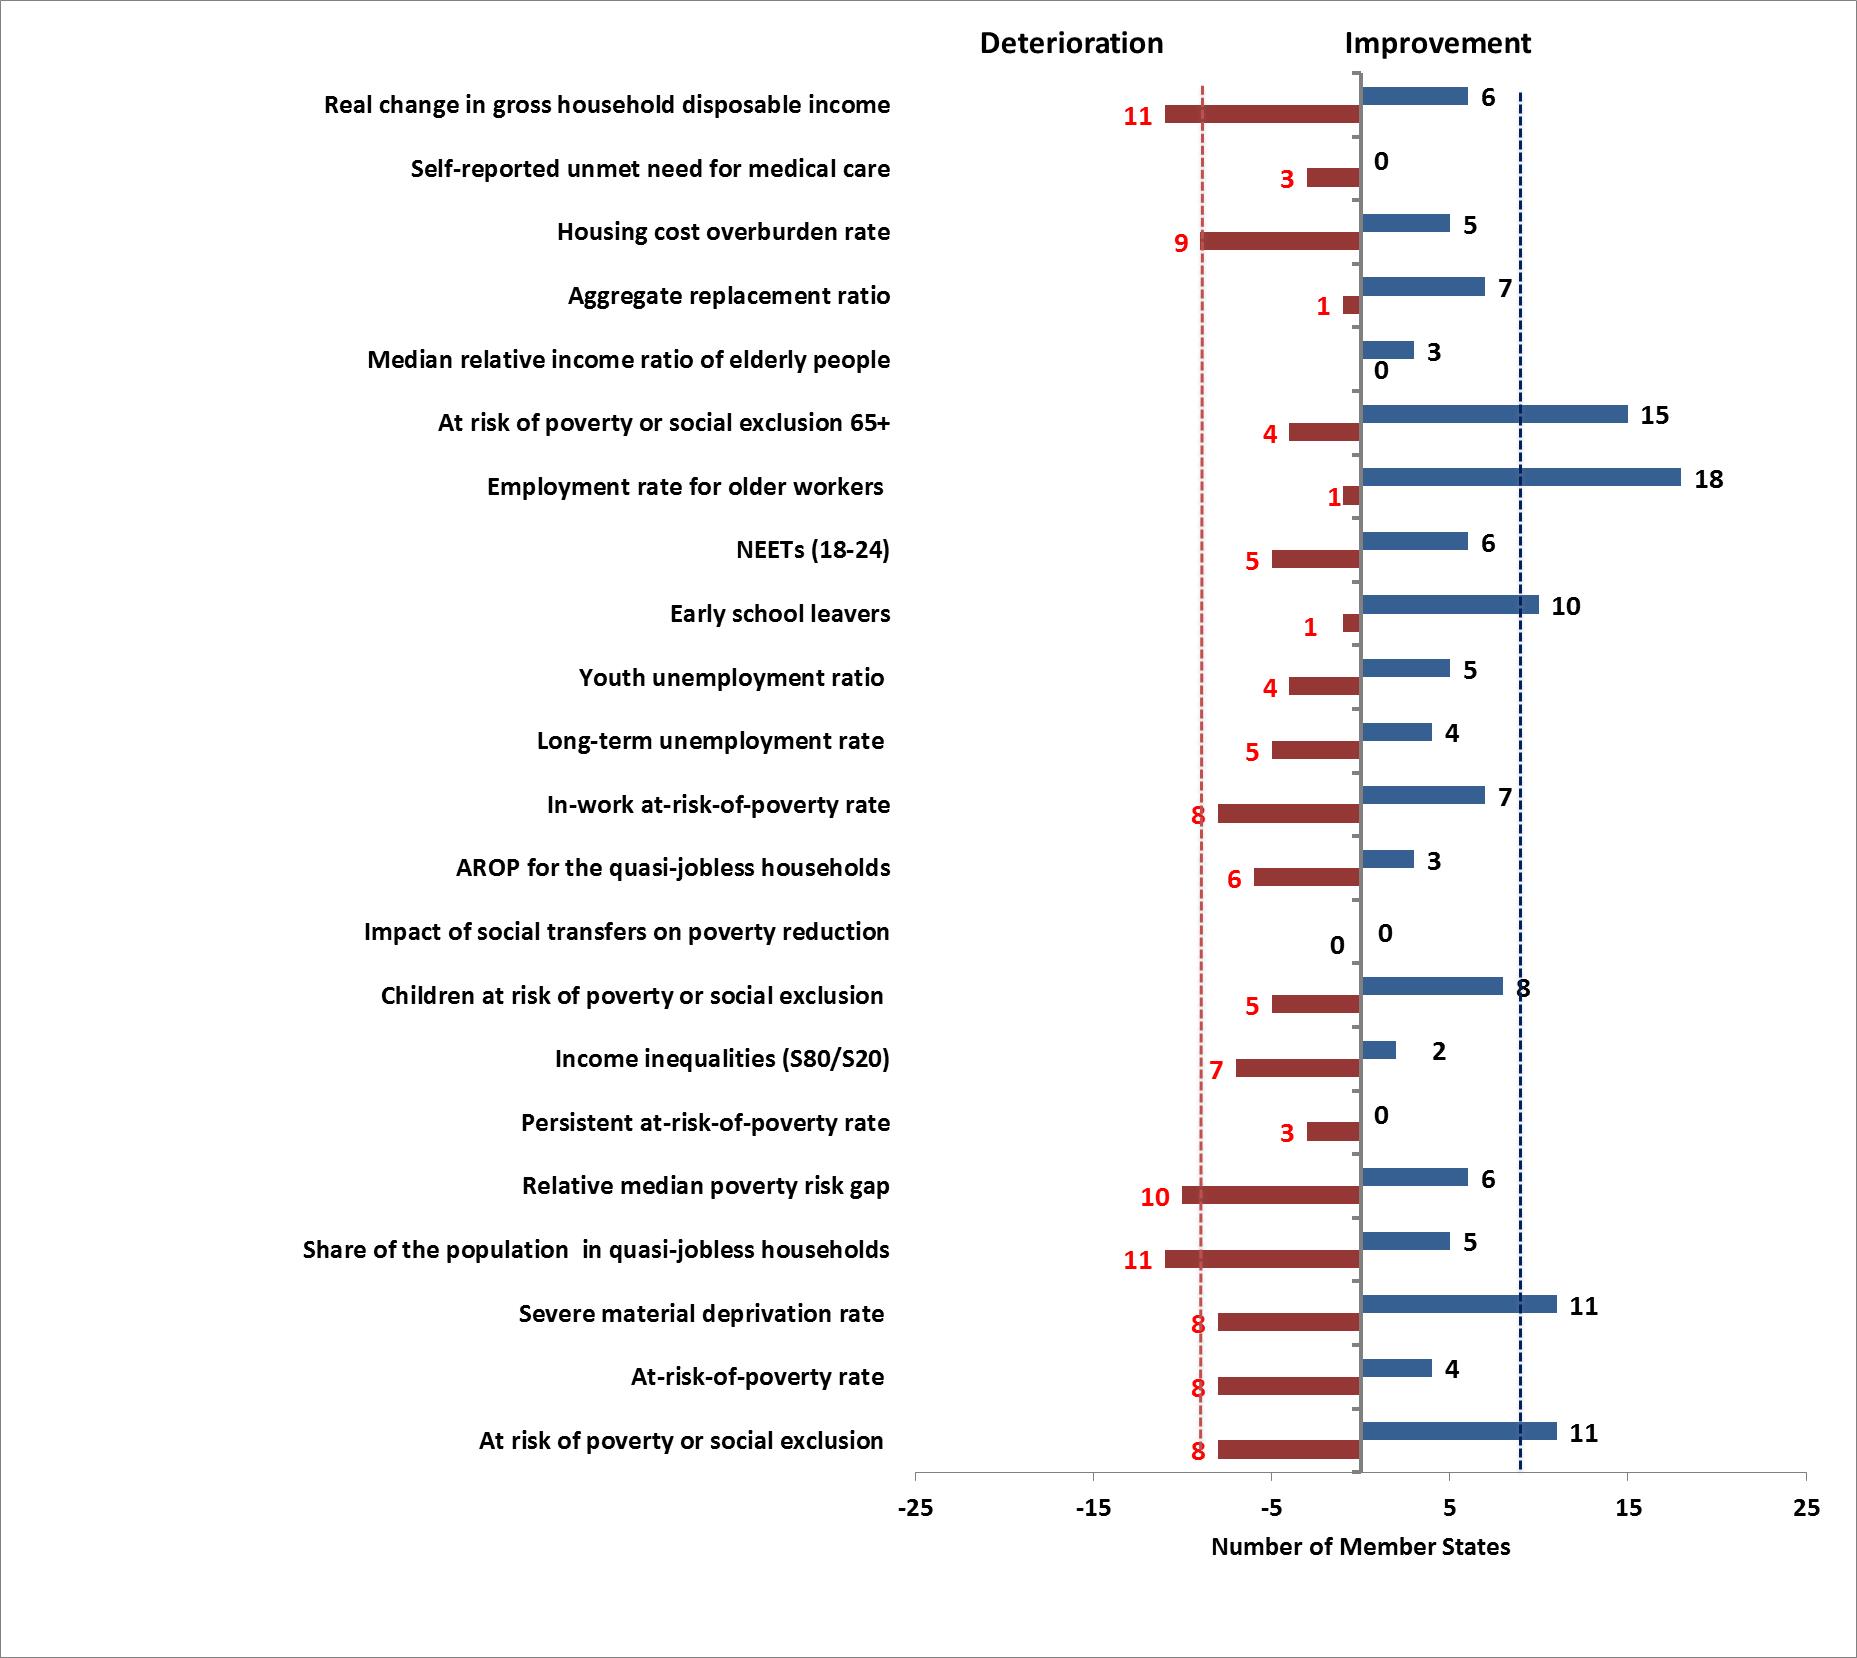

Note: The social trends to watch for 2012-2013, as adopted by the SPC on 23 February 2015 on the basis of the available data at that moment in time, identify deterioration in more than 1/3 of MSs and are highlighted in red in the table above (Source: Social Europe: Aiming for inclusive growth. Annual Report of the Social Protection Committee on the social situation in the European Union 2014)
Council Decision on guidelines for the employment policies of the Member States for 2015, Brussels, 21 September 2015, 11360/15
Available at: http://ec.europa.eu/priorities/economic-monetary-union/docs/5-presidents-report_en.pdf
COM (2015) 600 final, of 21.10.2015.
Cf. 2016 Alert Mechanism Report (AMR)
Please refer to the previous section for the detailed overview per indicator.
[2015 update when available]
OECD (2015) – In It Together: Why Less Inequality Benefits All
Eurofound (2015) - Developments in working life in Europe: EurWORK annual review 2014
See "Education and Training Monitor 2015" (http://ec.europa.eu/education/tools/et-monitor_en.htm)
"Preventing and Fighting Long-Term Unemployment", in: Employment and Social Developments in Europe 2015, European Commission.
"Supporting Skills Development and Matching in the EU", in: Employment and Social Developments in Europe 2015, European Commission.
According to the composite index of digital skills based on the Digital Competence Framework, https://ec.europa.eu/jrc/sites/default/files/lb-na-26035-enn.pdf .
Employment and Social Developments in Europe 2015, European Commission.
The tax wedge on labour is composed of personal income taxes plus employers' and employees' social security contributions.
See several Eurogroup statements, e.g. Eurogroup Statement, Structural reform agenda - thematic discussions on growth and jobs - Common principles for reforms reducing the tax burden on labour, Milan, 12 September 2014.
Data on GHDI extracted on 28th October 2015. Figures for 2014 are not available on that date for nine Member States (Bulgaria, Ireland, Greece, Croatia, Cyprus, Luxembourg, Malta, Poland and Romania).
Eurostat applies an equivalisation factor calculated according to the OECD-modified scale. It gives a weight of 1.0 to the first person aged 14 or more, a weight of 0.5 to other persons aged 14 or more and a weight of 0.3 to persons aged 0-13. Eurostat provides a detailed definition in http://ec.europa.eu/eurostat/statistics-explained/index.php/Glossary:Material_deprivation
People are considered severely materially deprived whenever they cannot afford at least 3 items (goods and services) out of a list of 10 items deemed important.
People living in households with very low work intensity are those aged 0-59 living in households where the adults (aged 18-59) work less than 20% of their total work potential during the past year.
The 2014 AROPE data is an estimate provided by Eurostat, on the basis of the data provided by most Member States.
More information on early results for material deprivation statistics could be obtained from the respective EUROSTAT publication available at: http://ec.europa.eu/eurostat/statistics-explained/index.php/Material_deprivation_statistics_-_early_results
Less than 60% of the national median household income after social transfers.
Based on EU-SILC survey data, confidence intervals have been computed around point estimates for at-risk-of-poverty and income inequality (S80-S20) indicators. The results of this computation have been embedded in the methodology for classifying Member States. Accordingly, in Figures 16 and 18 yearly changes not statistically different from zero are replaced by this value. Similarly, levels not statistically different from the (unweighted) EU average are replaced by this value. Detailed about the methodology can be found in Annex,
See Employment and Social Development in Europe 2013
The S80-S20 measures the ratio between the incomes of the 20% of the population with the highest incomes and the incomes of the 20% with lowest incomes, based on SILC data.
De Agostini and al (2015) The effect of tax-benefit changes on the income distribution in 2008-2014
People reporting that they did not go to the doctor even if they needed it because it is too expensive, waiting time is too long or because it is too far from where they live.
Commission proposal for a Council decision on guidelines for the employment policies of the Member States, 2 March 2015; Council Decision on guidelines for the employment policies of the Member States, 5 October 2015.
Exhaustive analysis of labour market developments and wages since 2008 can be found the ‘Labour market developments and wages in 2015’ Report, European Commission, DG Employment, Social Affairs and Inclusion, 2015.
Skills Governance in the EU Member States, Synthesis Report, October 2015 (forthcoming, link to be added later by C4)
Data for 2013, Education and Training Monitor 2015
The 2015 Ageing Report, http://ec.europa.eu/economy_finance/publications/european_economy/2015/pdf/ee3_en.pdf
The 2015 Pension Adequacy Report, http://ec.europa.eu/social/BlobServlet?docId=14529&langId=en
See Directive 2013/33/EU of the European Parliament and of the Council of 26 June 2013 laying down standards for the reception of applicants for international protection.
Communication from the Commission to the European Parliament and the Council on public procurement rules in connection with the current asylum crisis, COM(2015)454
European Economic Forecast Autumn 2015
European Commission (2008), “The LIME Assessment Framework (LAF): A methodological tool to compare, in the context of the Lisbon Strategy, the performance of EU Member States in terms of GDP and in terms of twenty policy areas affecting growth”, European Economy Occasional Papers n. 41/2008.
Both normality and T-shaped distribution tests were carried out resulting in the rejection of any distributional hypothesis.
Different cut-off points settings were discussed internally to the working group. This proposal reflects the outcomes of such process.
In case of normality, chosen cut-off points roughly corresponds to 15 %, 30%, 50%, 70% and 85% of cumulative distribution.
The latter condition prevents a Member State presenting "low" or "very low" level to be flagged as "deteriorating" when showing a change "much higher than average", but still decreasing.
http://data.consilium.europa.eu/doc/document/ST-9307-2015-INIT/en/pdf