 EUROPEAN COMMISSION
Brussels, 20.7.2016
SWD(2016) 244 final
COMMISSION STAFF WORKING DOCUMENT
Accompanying the document
COMMUNICATION FROM THE COMMISSION TO THE EUROPEAN PARLIAMENT, THE COUNCIL, THE EUROPEAN ECONOMIC AND SOCIAL COMMITTEE AND THE COMMITTEE OF THE REGIONS
A European Strategy for Low-Emission Mobility
{COM(2016) 501 final}
Table of Contents
1. General context and policy framework
2. Existing EU policies for sustainable transport
2.1. Low emission vehicles
2.2 Switching towards low emission alternative energy for transport
2.3 Efficiency of the transport system
2.4 Cross-cutting initiatives
2.4.1 Transport research and innovation
2.4.2 EU financing and co-operation instruments
2.4.3 Support to cities and local communities
2.5 Action in international aviation and maritime
2.5.1 International developments
2.5.2 EU level action in international aviation and maritime
2.6 Taxation
3. Developments under current trends and policies
3.1 Identifying the GHG emissions gap for transport
3.2 Key assumptions of the Reference Scenario
3.3 Reference Scenario main results
4. Pathways towards low-emission mobility
4.1 Policy measures
4.1.1 Moving towards zero-emission vehicles
4.1.2 Switching towards low emission alternative energy for transport
4.1.3 Efficiency of the transport system
4.1.4 Transport fuels in the EU ETS
4.1.5 Cross-cutting initiatives
4.2 Description of the pathways/scenarios
4.2.1 Central scenarios
4.2.2 More ambitious pathways/scenarios for low-emission mobility
4.3 Analysis of impacts of the pathways/scenarios
4.3.1 Moderation of energy demand
4.3.2 Energy security
4.3.3 Decarbonisation
4.3.4 Other environmental impacts
4.3.5 Research, innovation and competitiveness
4.3.6 Impacts on transport as a business
4.3.7 Economic impacts
4.3.8 Social impacts
5. Conclusions
ANNEX I: Historical developments in transport activity, energy use and emissions
ANNEX II: Analytical work on low-emission mobility
ANNEX III: Overview of policy measures
ANNEX IV: Models and model-based scenarios used in preparing the analytical work
Table of Figures
Figure 1: Passenger and freight transport projections (average growth rate per year)
Figure 2: Evolution of total final energy consumption and GHG emissions between 1995 and 2050
Figure 3: Evolution of final energy use in transport by type of fuel
28
Figure 4: Decomposition of CO2 emissions in the Reference scenario (2005-2030)
Figure 5: Energy savings relative to Reference scenario 2016, in Mtoe (left side) and change in energy intensity for 2010-2030 and 2010-2050, in % (right side)
Figure 6: Final energy demand in transport by fuel in 2030 (in % of total)
Figure 7: Alternative fuels and energy carriers in transport in 2030 (in % of total energy demand)
Figure 8: Share of electricity in road transport energy demand (in %) and total electricity demand in transport (in Mtoe)
Figure 9: Oil products used in transport (difference to REF2016, in Mtoe) and oil dependency (in %)
Figure 10: Decomposition of CO2 emissions for passenger transport for 2005-2030 (% change)
Figure 11: Decomposition of CO2 emissions for passenger transport for 2005-2030 (in Mt of CO2)
Figure 12: Decomposition of CO2 emissions for freight transport for 2005-2030 (% change)
Figure 13: Decomposition of CO2 emissions for freight transport for 2005-2030 (in Mt of CO2)
Figure 14: Evolution of well to wheel CO2 emissions for 2005-2030 and 2005-2050 (in %)
Figure 15: Evolution of NOx and PM2.5 emissions for 2010-2030 and 2010-2050 (growth rates, in %)
Figure 16: External costs of air pollution and noise for 2010-2030 and 2010-2050
Figure 17: Light duty vehicles by type of powertrain in 2030 and 2050 (in %)
Figure 18: Liquid and gaseous biofuels in 2030 and 2050 (in % of total liquid fuels and in Mtoe)
Figure 19: Gross average costs, average co-benefits and net average costs of emission reductions in the decarbonisation pathways/scenarios
Figure 20: External costs of congestion and accidents for 2010-2030 and 2010-2050
Figure 21: Share of transport energy demand by mode in 2014 (%)
Figure 22: Specific consumption of passenger cars (EU fleet average)
Figure 23: Share of transport energy demand by energy carrier in 2014 (%)
Figure 24: Share of transport energy demand by energy carrier in 2014, by mode (%)
Figure 25: Evolution of greenhouse gas emissions by sector (1990=100), EU28
Figure 26: Greenhouse gas emissions from transport by mode in 2013
Figure 27: Shares in EU transport CO2 emissions in 2015 (model estimates)
Figure 28: Domestic transport emissions and emissions from international aviation, EU28
Figure 29: Cabotage in the EU in 2014 by host country
Figure 30: Inter-linkages between models
Figure 31: EU28 Gross Inland Consumption (Mtoe, left; shares (%), right)
Figure 32: EU28 energy production (Mtoe)
Figure 33: Gas - production, net imports and demand (volumes expressed in bcm)
Figure 34: EU power generation (net) by fuel (Mtoe – left, shares – right)
Figure 35: Net power capacity investments by plant type (MWh – for five year period)
Figure 36: Decomposition of electricity generation costs and prices (€'2013 MWh)
Figure 37: Investment expenditures (5-year period) - demand side, million €'2013 (left, excluding transport) and supply side, million €'2013 (right)
Figure 38: Decoupling of EU energy use and intensity from GDP (2005=100)
Figure 39: Evolution of final energy demand by sector (Mtoe – left, shares – right)
Figure 40: Evolution of final energy demand by fuel (Mtoe – left, shares – right)
Figure 41: Industrial energy demand versus activity (value added)
Figure 42: Final energy demand in the residential sector
Figure 43: Trends in transport activity and energy consumption
Figure 44: Evolution of CO2 emissions (Mt) by sector
Figure 45: Non CO2 GHG emissions (Mt CO2 eq.)
Figure 46: Development of the EU28 emissions/removals in the LULUCF sector in Mt CO2 until 2050
Figure 47: Illustrative levelized cost of electricity (expressed in €'2013/MWh-net)
Figure 48: Evolution of activity of light duty vehicles by type and fuel
Figure 49: Projected evolution of energy system costs
Figure 50: Changes in the excise duty rates for diesel by Member State from 2025 onwards
Figure 51: Final energy demand in transport by fuel in 2050 (in % of total)
Figure 52: Alternative fuels/energy sources in transport in 2050 (in % of total energy demand)
1. General context and policy framework
Transport is the backbone of the economy, an enabler of growth and jobs, essential for the functioning of the single market and the free movement of goods and people. Market integration, economic growth and transport activity are strongly related.
The global transition towards a low-carbon economy has started, supported by the Paris Climate Agreement. Transport will need to play an important role in this transition. The transition towards a low-carbon economy also represents a major opportunity for jobs and growth in the transport sector, as markets for low-emission mobility grow globally.
This transition will be supported by a number of disruptive trends, such as digitalisation and new technologies. Transport is increasingly becoming an on-demand service as consumer needs and perceptions of mobility solutions evolve. Taken together, these trends also imply important competitiveness challenges and significant effort will be required from businesses and regulators to turn them into growth and employment opportunities for Europe. A forward looking and long-term policy approach with the aim of ensuring a regulatory and business environment that is conducive to meeting the competitiveness challenges that the transition to low-emission mobility implies is a vital precondition. The analysis carried out in this paper provides insights on the necessary tools to do this.
It is estimated that the transport industry at large accounts for 7% of the European gross value added and for 7.06% of total employment in the EU, corresponding to more than 15 million people in absolute terms (2014 figures).
Greenhouse gas emissions in transport did not show the same decline as those in other sectors, increasing until 2007 and only since reducing as a result of periods of higher oil prices, increased road vehicle efficiency and slower growth in activity due to the crisis. Transport emissions include both those in the EU Emissions Trading System (at present domestic and intra-EU aviation, and electricity consumed in the sector) and in sectors outside the EU ETS, where it accounts for around a third of emissions.
EU transport is responsible for 33% of final energy consumption (353 Mtoe) and 23% of total EU emissions (excluding international maritime). Aviation and maritime contribute an increasing share to the total transport emissions over time, going up from 19 to 23% during 1990-2014.
Today, transport still relies on oil for 94% of its energy needs. Europe imports around 87% of its crude oil and oil products from abroad, with a crude oil import bill estimated at around €187 billion in 2015, and additional costs to the environment.
Progress has been made with the EU share of renewable energy in transport reaching 5.9% in 2014 and the opening of first production facilities for advanced biofuels. However, the development of large-scale production capacity for advanced biofuels in the EU is likely to be slow, hampered by technological challenges and feedstock availability.
Transport also represents an environmental concern in terms of air pollution. Whilst significant progress has been made since 1990 in reducing the emissions of air pollutants from transport, it is still responsible for more than half of nitrogen oxide (NOx) emissions, and contributes significantly (around 15% or more) to the total emissions of other pollutants. Road transport represented the largest source of NOx emissions in 2013, accounting for 39% of total EU28 emissions, and an important source of particulate matter PM2.5 emissions (13%).
2. Existing EU policies for sustainable transport
Since 2007 overall emissions from transport have continuously decreased. This section discusses the most important EU policies for reducing greenhouse gas (GHG) emissions and other transport externalities, covering three main areas: (1) low emission vehicles; (2) switching towards low emission alternative energy for transport and (3) efficiency of the transport system.
Many of these policy measures were adopted in the context of the 2020 Energy and Climate Policy Framework and the 2011 Transport White Paper.
The 2020 Energy and Climate Policy Framework was agreed by the European Council in March 2007. It set three targets to be attained by 2020: 20% GHG emissions reduction compared to 1990, 20% of all EU primary energy to be provided by renewables, and a 20% improvement in energy efficiency. The transport sector plays a role in the implementation of these headline targets, and four main pieces of legislation have relevance for the EU transport sector:
(I)The revised Directive on the European
Emissions Trading
System (EU ETS Directive);
(II)The Effort-Sharing Decision (ESD) introducing national GHG reduction
targets
for non-ETS sectors (including transport) for all Member States;
(III)The
Renewable Energy
Directive (RED) laying down targets for the overall use of renewable energy and for its use in transport;
(IV)The Energy Efficiency Directive (EED) establishing a set of binding measures to help the EU reach its indicative 20% energy efficiency target (for the whole energy system, including transport).
New specific transport-related measures were also included to curb GHG emissions from road transport. The Fuel Quality Directive was revised to require a reduction in the GHG intensity of EU transport fuels and CO2 emissions performance standards for cars and vans were adopted, also contributing to energy efficiency improvements.
The 2011 Transport White Paper defined a long-term vision until 2050 for a transport sector that continues to serve the needs of the economy and of the citizens while meeting future constraints: oil scarcity, growing congestion and the need to cut CO2 and pollutant emissions in order to improve air quality particularly in cities. The White Paper covers four broad areas of intervention: internal market, innovation, infrastructure, international aspects. For each of these areas, a ten-year programme was defined with 40 specific action points, containing within each point a handful of specific initiatives of different nature, different time horizon and different economic/political relevance. An implementation report of the 2011 White Paper has been concluded in 2016.
2.1. Low emission vehicles
European Regulations set CO2 targets for new passenger cars and vans (collectively LDVs) as follows:
(I)2015 car target: New cars registered in the EU must not on average emit more than 130 grams of CO2 per kilometre (gCO2/km) by 2015 in the official test, corresponding to a fuel consumption of around 5.6 litres per 100 km (l/100 km) of petrol or 4.9 l/100 km of diesel. The average emissions of a new car sold in 2014 were 123.4 gCO2/km. Provisional data for 2015 indicate 119.6 gCO2/km.
(II)2017 light commercial vehicle target: New vans registered must not emit more than an average of 175 gCO2/km by 2017, corresponding to a fuel consumption of about 6.6 l/100 km of diesel. In 2014, the average van sold in the EU emitted 169.1 gCO2/km.
(III)2020 light commercial vehicle target: by 2020, the fleet average to be achieved by all new vans is 147 gCO2/km, which corresponds to around 5.5 l/100 km of diesel.
(IV)2021 car target: by 2021 the fleet average to be achieved by all new cars is 95 gCO2/km. This means a fuel consumption of around 4.1 l/100 km of petrol or 3.6 l/100 km of diesel.
An important complementary measure to help car manufacturers to meet their specific CO2 emission targets is the Car Labelling Directive. It requires EU Member States to ensure that relevant information is provided to consumers, including a label showing a car's fuel efficiency and CO2 emissions. It aims to raise consumer awareness on fuel use and CO2 emissions of new passenger cars which may influence consumers' choice in favour of cars that use less fuel and emit less CO2.
An evaluation of the existing Regulations setting standards for light duty vehicles identified that the Regulations have been largely effective and have delivered CO2 reductions at lower cost than originally foreseen. However, there are a number of areas where they could be improved, including to better take into account the gap between CO2 emissions and fuel consumption values measured during laboratory tests at type approval and those encountered in real use. They are being addressed by the Worldwide harmonized Light vehicles Test Procedure (WLTP) that is in the process of being put in place at EU level (see box: "More reliable fuel consumption and CO2 figures for consumers and regulators" in section 4.1.1).
In addition, there are significant discrepancies between the real-driving emissions of certain air pollutants and the values measured in the laboratory at test procedure. In particular the NOx emissions of diesel cars – which form a large share of the EU market – often drastically exceed the laboratory values in real driving. This has a significant negative impact on air quality, especially in urban areas.
The evaluation of the Car Labelling Directive shows that the Directive was successful in increasing consumer awareness of the fuel economy and CO2 emissions of new passenger cars. However, the report identified a number of issues that prevented the Directive from being more effective in stimulating the uptake of vehicles with lower fuel consumption and CO2 emissions.
For Heavy Duty Vehicles (HDVs), the first initiative to tackle GHG emissions in the EU was a strategy adopted in 2014. Despite the economic importance of fuel consumption, CO2 emissions from HDVs are currently neither measured nor reported. The strategy focuses on short-term action to certify, monitor and report HDV emissions - an essential first step towards reducing them. To support this, the Commission has developed a computer simulation tool, VECTO, to calculate fuel consumption and CO2 emissions from new vehicles (trucks and buses).
In addition, the Clean Vehicles Directive
mandates public procurers to consider fuel consumption, CO2, and pollutant emissions when purchasing road transport vehicles, giving them various options to do so. The conclusions of the evaluation of the Directive show that it is relevant, and that it resulted in a benefit/cost ratio of 1.2.
However it has had limited effectiveness and efficiency and as such reduced CO2 emissions much less than originally expected.
Heavy goods vehicles, buses and coaches in the EU must comply with certain rules on weights and dimensions for road safety reasons and to avoid damaging roads, bridges and tunnels. The impact assessment of the Directive estimated that these measures will contribute to 7 to 10% of GHG emissions reduction in 2030 compared to the baseline.
Tyres sold in the EU are subject to energy labelling requirements through Regulation (EC) No 1222/2009. Tyre labels help consumers choose vehicle tyres that are more fuel efficient, have better wet braking and are less noisy. As tyres account for 20 to 30% of a vehicle’s fuel consumption, choosing energy efficient tyres results in significant fuel cost savings.
2.2 Switching towards low emission alternative energy for transport
Europe is still heavily dependent on liquid fuels and therefore on imported oil for transport. While oil prices have recently reduced, long term prices are projected to remain high. Furthermore, the supply of oil is to a large degree sourced from politically unstable regions raising concerns relating to security of supply, future price volatility and the potential results of price shocks.
Policies have been adopted at EU level to reduce the GHG intensity of fuels, increase the supply of low emission alternative fuels including renewables, and introduce enabling infrastructure. In the future, as market penetration of electric vehicles is expected to grow the challenges that this may impose for the electricity network may need to be addressed.
The use of renewable energy is promoted by the Renewable Energy Directive (RED) requiring that the share of renewable energy in the EU is 20% of gross final energy consumption by 2020, reflected through national targets. It also contains a target for each Member State to have a 10% share of renewable energy in transport by 2020. This provision is complemented by Article 7a of the Fuel Quality Directive (FQD) obliging fuel suppliers to reduce the GHG intensity (gCO2/MJ) of fuels supplied by 6% in 2020 compared to 2010.
The 2015 renewables energy progress report indicated that achieving the target for renewable energy in transport is challenging but feasible, with some Member States making good progress. At EU level, the share of renewable energy in transport reached 5.9% in 2014. A mid-term evaluation of the RED indicated that in transport the mandatory target has been important for the deployment of renewable energy in the sector, mainly through implementation of national blending obligations. However, progress has been slow; the main reason has been policy uncertainty at the EU level regarding biofuels, low competitiveness of biofuels in terms of prices and the increasing awareness that certain biofuel production pathways may increase overall GHG emissions when emissions from indirect land use change (ILUC) are taken into account. In addition, there has been a lack of commercially available alternative, advanced biofuels.
There have been concerns about the sustainability of biofuels supplied in the EU, particularly with regards to their indirect impacts and potential to cause ILUC. In order to mitigate these impacts, both the RED and the FQD were amended by Directive 2015/1513/EU (the "ILUC Directive") which introduced a cap on the amount of food or feed based biofuels (7%) that can be counted towards the 2020 target for renewable energy in transport. Member States also have the option of applying this cap towards obligations to meet the FQD. The legislation introduced an indicative sub-target for ‘advanced’ biofuels that is to be set by Member States by April 2017, and increased the contribution that renewable electricity in transport makes to the RED targets.
For aviation, biofuels meeting the sustainability criteria of the RED are exempted from obligations under the EU ETS and aviation fuels can also contribute towards the FQD target. In addition, the European Advanced Biofuels Flightpath, launched in 2011 by the European Commission, aims to achieve 2 million tonnes of sustainable biofuels in aviation by 2020., However, due to the current price gap with conventional jet fuel demand for sustainable alternative fuels in aviation has so far been limited and there has been no regular production of aviation alternative fuels in Europe.
In January 2013, the European Commission adopted the European Alternative Fuels Strategy for all modes of transport indicating action was required on alternative fuels infrastructure, common technical specifications, consumer acceptance and technological development, including advanced biofuel production. The Directive on the deployment of alternative fuels infrastructure, part of the 2013 Strategy, requires Member States to submit to the Commission national policy frameworks for the market development of alternative fuels and their infrastructure by November 2016. It specifies the required coverage and the timing by which specific infrastructure in the different modes must be put in place, the development of harmonized EU-wide standards for recharging points for electric vehicles and refuelling points for natural gas (LNG, CNG) and hydrogen, and the provision of consistent and clear consumer information. The impact assessment showed that investing in a minimum recharging/refuelling network is the most efficient way to promote alternative fuel vehicles., The implementation of the Directive will also be a driver for the market uptake of natural gas and biogas vehicles and vessels in the EU. The level of ambition in Member States will be crucial for the deployment of alternative fuels in the EU.
What are the barriers to faster road transport electrification?
Recharging infrastructure and its integration within the electricity grid:
- Users need to be able to charge their vehicles anywhere in Europe. The three main challenges to solve are: (i) defining clear interoperability rules; (ii) ensuring pan-European coherent and equivalent service levels; (iii) ensuring harmonisation of data collection and accessibility to real time traffic information.
- Local grid connection and capacity. Smart charging and – in the longer term – vehicles to grid electricity supply need to be enabled and encouraged within the electricity system. Electricity storage needs to be fully enabled.
- Connection cost for high power capacity. Transparency with respect to distribution tariff design is needed in order to avoid discrimination against high power charging points.
- Availability of recharging points in private buildings. About 90% of electric vehicles are charged at home or at work. However, Directive 2014/94/EU does not mandate private recharging points although Member States should take measures to promote them.
- Clarify the business case for high power charging points given the current low number of electric vehicles.
Users awareness and acceptance to support electric vehicles' commercialisation:
- Lack of customer information and awareness of the benefits of electric vehicles.
- Lack of coordinated effort. It is crucial that: Member States are ambitious and propose supportive National Policy Frameworks, car manufacturer propose more vehicle models at affordable prices, car dealers actively propose electric propulsion powertrains to potential buyers.
- Electro-mobility is not fully considered in urban mobility policies. Actions are needed to: fully integrate electric vehicles in urban mobility policies (e.g. promote electric car-sharing, recharging points at train stations), to support the market uptake of electric buses and other electric vehicles through e.g. public procurement.
Technical development of batteries to meet higher range and lower vehicles cost:
- The improvement of the range of electric vehicles to 400–500 km will be a key success factor in the coming years. However, it is also important to develop short range (up to 150 km) low cost electric vehicles, including light electric vehicles such as two wheelers (scooters and motors), which can be very effective in city environments. To keep European competitiveness in this market, the deployment of European based battery "competence centres" (material, production and manufacturing) is critical.
Missing common technical specifications at the EU or global level:
- Common connector interfaces between electric vehicle and infrastructure have been set in Directive 2014/94/EU but the development of a common protocol for charging has not been addressed. Common interfaces for e-buses and for inductive charging are still to be developed.
- The work on smart charging standardisation, communication protocols and related test procedures needs to be completed and harmonization of rules for type approval of electric vehicles at United Nations Economic Commission for Europe (UNECE) needs to continue, including upgrading of current batteries to more efficient ones.
Adding new loads – such as electric vehicles – brings additional challenges to the electricity network that at certain times, and in certain segments, already operates at its limits. Efficiently integrating those new loads will only be possible if full use of flexibility is made, with charging done at high production times and during those periods when there is no network congestion. For this to happen, consumers need to have access to the technical tools to manage demand (smart meters) and have a financial incentive to shift demand. The Electricity Market Directive contains provisions for Member States to analyse the costs and benefits of the roll out of smart meters, and roll out those meters to at least 80% of all consumers by 2020 if the cost-benefit analysis is positive.
In addition, the European Commission is actively pursuing greater international cooperation and the global harmonisation of the technical requirements and tests for alternative propulsion vehicles, including electric vehicles. Global standards for motor vehicles are the responsibility of the World Forum for Harmonization of Vehicle Regulations, a permanent working party (WP.29) under the United Nations Economic Commission for Europe (UNECE). The resulting rules are not only applicable in the EU but also in some 60 other countries. This reduces development costs, avoids duplication of administrative procedures, improves industry's competitiveness and increases the attractiveness of the EU market as an investment destination. Work on a new Global Technical Regulation on the safety of electric vehicles is under way and the European Commission is one of the key sponsors of this project. In addition, work in the UNECE framework is also ongoing on the environmental aspects of electrified light duty vehicles. This includes the development of a number of technical elements for inclusion in the Worldwide harmonized Light vehicles Test Procedure (WLTP), such as the determination of the electric driving range.
2.3 Efficiency of the transport system
Acknowledging that an integrated system approach is required to put the transport sector on a sustainable path, several initiatives have been designed to address the overall efficiency of the sector, support multimodal integration, and address negative externalities – including CO2 emissions.
CO2 emissions are one of the main negative externalities caused by transport along with air pollution, congestion, noise, accidents, etc. The 2011 White Paper on Transport set a roadmap for gradually internalising external costs in the sector to move towards full internalisation in all modes by 2020. In monetary terms, currently the most important measure having the effect of internalising external costs in transport is the taxation of fuel, which represented around 1.4% of GDP in 2012 (about €188 billion). Infrastructure charging, regulated through the "Eurovignette" Directive, is another important measure in internalising transport externalities. According to the 2013 evaluation of EU road charging policies
, reducing air pollution has been achieved by Euro class-differentiation of network-wide tolls, more than through the use of vignette systems. However, the effect on decarbonisation has been limited so far, as tolls remain low compared to the overall costs of road transport and concern only a small portion of road traffic, and also because road transport is characterised by low price elasticity. However, according to a 2013 analysis by Ricardo-AEA improvement in the functioning of the Eurovignette and European Electronic Tolling System (EETS) system in the EU could lead to a decrease of 1.7% in CO2 emissions from the road sector in the EU.
Intelligent Transport Systems (ITS) can significantly contribute to a cleaner, safer and more efficient transport system. The ITS Action Plan suggested a number of targeted measures with the goal to create the momentum necessary to speed up market penetration of ITS applications and services in Europe. A legal framework was adopted to accelerate the deployment of ITS across Europe. The impact assessment for the Action Plan estimated that it could decrease fuel consumption and CO2 emissions by up to 4.1%, road congestion by 2.5% and accident costs by 7.2% compared to the baseline by 2020. The 2013 mid-term evaluation showed that large scale deployment must still take place, and without it these impacts will remain limited. Benefits are expected to be mainly generated from further implementation of the ITS Directive that entered into force in 2010. A number of measures adopted in this context put in place mechanisms to share real time road traffic data and travel data to reduce congestion and increase efficiency, as well as more sustainable behaviour through more accurate multimodal passengers travel information services. Better travel and traffic information would also result in modal shift from taxis to local public transport at airports and stations.
The Combined Transport Directive establishes common rules for promoting combined transport in an effort to curb the negative externalities of road transport, and thus contributing to reduced congestion and environmental pollution, road traffic safety, as well as better management of transport resources. According to its evaluation, it continues to be an effective tool to support modal shift. The shift from road to rail/road combined transport has saved in 2011 (compared to road only transport) 7.3 Mt of CO2, while the shift to inland waterways has saved 0.96 Mt of CO2. However, there are shortcomings in its transposition and implementation caused by somewhat ambiguous language, the diverging transposition and implementation at Member State level and outdated provisions.
The Energy Efficiency Directive contains several provisions of importance to energy demand reduction and management, as well as increased use of renewable electricity, including in the transport sector. A number of Member States have already envisaged actions in the transport sector (e.g. measures targeting the rail transport, promotion of modal shift and encouragement of use of public transport or cycling and walking; measures supporting the use of electric, hydrogen or more fuel-efficient cars, behaviour measures like driver training) in view of reaching their national energy efficiency targets by 2020. The majority of Member States have, however, excluded transport from the application of Article 7 of the Directive which requires that energy distributors or retail energy sales companies achieve 1.5% energy savings per year through the implementation of energy efficiency measures.
Other existing EU policies and measures to meet a range of different objectives for the transport sector have important co-benefits in terms of CO2 emissions reduction. They include:
Regulations providing for the market access to the international road freight and passenger market; by optimizing transport operations they can lead to reduced fuel consumption and carbon emissions. According to research by the Dutch Institute for Transport Policy
,
, increased market access could lead to a reduction of empty trips by up to 1.9% vehicle-km and a decrease in the EU CO2 emissions of up to 1.6% (as percent of total road transport CO2 emissions).
Regulation for the establishment and organization of international Rail Freight Corridors, aiming to boost rail freight in terms of volume, market share, quality and reliability; by shifting traffic from road to rail freight the Regulation was estimated to result in emissions reductions of 0.7 to 1.1 Mt CO2 by 2020 and contribute to reduction in air pollutants.
The River Information Services (RIS) Directive, establishing a framework for the deployment and use of harmonized RIS in the EU in order to support inland waterway transport and to facilitate interfaces with other transport modes. According to the evaluation of the RIS Directive, implementation by 2011 has brought annual benefits in terms of fuel and CO2 emissions savings of 1 to 2%; due to differences in the pace of RIS implementation, the full benefits have not yet materialized.
Directive establishing the initial qualification and periodic training requirements for EU drivers of certain road vehicles for the carriage of goods or passengers; its environmental impacts come from fuel and corresponding emission savings as a result of eco-driving courses, estimated at 2 to 4% reduction in fuel use and CO2 emissions.
Directive 2002/85/EC, requiring all heavy commercial vehicles to be equipped with speed limiters; the analysis showed that for the EU as a whole the introduction of speed limiters resulted in a reduction of the total CO2, NOX and PM emissions of heavy commercial vehicles of about 1% (between 0 and 2% as function of posted speed limit).
International cooperation is fundamental in the area of connected and automated driving. International cooperation with US and Japan on aspects related to security and harmonisation of standards is already taking place since 2009 and 2011, respectively. In addition, new rules for the approval of automated and connected vehicles as well as traffic rules are being developed in the framework of UNECE. Learning from collaboration with international partners represents a key asset for future progress; enhancing cooperation in the area of communications and spectrum, security and data protection is a must. Therefore, the C-ITS Platform recommended the Commission to enlarge cooperation on deployment practices at government level with countries like Canada, Australia, South Korea and others.
2.4 Cross-cutting initiatives
2.4.1 Transport research and innovation
The transition needed in the transport sector for its decarbonisation can only be achieved through extensive research and innovation. A major emphasis of the €6.4 billion transport research and innovation programme under Horizon 2020 is aimed at projects addressing energy use issues, both directly and indirectly. In 2014, for example, 57% of budget expenditures from the Transport Challenge calls were related to climate action, representing a clear over-achievement against the overall target set for mainstreaming of climate action in Horizon 2020 by 35%.
In addition, a number of key programmes have been established for transport decarbonisation, including to support the development of light and heavy duty electric vehicles (contractual public-private partnership on European Green Vehicle Initiative) and fuel cells (Fuel Cells and Hydrogen Joint Undertaking), to promote low carbon and non-polluting transport for cities (Horizon 2020 funding for urban mobility and smart cities), to facilitate the market uptake of liquefied natural gas (LNG) for heavy duty vehicles (LNG Blue Corridors project funded under the 7th Framework Programme ‘European Green car initiative’), to facilitate more efficient road use, rail innovation (Shift2Rail Joint Undertaking) and more efficient air transport (SESAR Joint Undertaking) and energy efficient aircrafts (Clean Sky 2 Joint Undertakings), with the JU's co-financed by the EU from Horizon 2020. These programmes are complemented by research and innovation activities related to key enabling technologies in the areas of new materials (e.g. lightweight materials, composites) and advanced manufacturing (e.g. additive manufacturing) contributing to development and production of new low-emission vehicles.
The SET-Plan promotes research and innovation efforts across Europe by supporting technologies with the greatest impact on the EU's transformation to a low-carbon energy system, including fuels and electricity supply to the transport sector, and a number of SET-Plan actions for research and innovation are of particular importance for promotion of electro-mobility and the use of renewable energy in transport.
2.4.2 EU financing and co-operation instruments
The Connecting Europe Facility (CEF) and the European Structural and Investment Funds (ESIF) are the main EU funding instruments during 2014–2020 for development of infrastructure, providing €24.04 billion and €70 billion respectively for the transport sector.
The Trans-European Transport Network (TEN-T) policy implementation and CEF mobilize investment in Europe to boost jobs and growth, contribute to the development of a connected digital single market and to a resilient Energy Union, while supporting the decarbonisation of the transport sector. The CEF call 2014 allocated 92% of the total envelope of €13 billion of grant co-financing, to environmentally friendly modes, innovative technologies and investment on multimodality and ITS, and about 82% for rail and inland navigation investment alone. Financing is also key for the development of alternative fuels: €225 million in EU funding was allocated to projects related to alternative fuels under the CEF call 2014.
Substantial funding for the TEN-T network comes from the European Structural and Investment Funds (ESIF) and from the European Investment Bank (EIB). Cohesion policy financial support is concentrated on cohesion countries and less-developed regions of the EU, where there are still significant needs for sizeable public investments into transport. It is expected that close to 20% of the overall cohesion policy envelope for 2014-2020 will go towards supporting transport investments, amounting to almost €70 billion. This includes an estimated €39 billion for supporting environmentally friendly modes, innovative technologies and investment on multimodality and ITS by Member States, of which €18.8 billion for rail. Sustainable urban mobility investments are supported with €12 billion, based on integrated urban strategies, of which €1.8 billion for walking & cycling. In addition, the transport sector will receive support, e.g. for research and innovation, technical development, and entrepreneurship, under the Smart Growth pillar of cohesion policy.
2.4.3 Support to cities and local communities
In December 2013, the European Commission adopted the Urban Mobility Package comprising of a Communication and Guidelines on Sustainable Urban Mobility Plans (SUMPs), and four Staff Working Documents on City Logistics, Access Regulation, Urban Road Safety and Urban Intelligent Transport Systems. The actions/initiatives announced in the Urban Mobility Package are currently under implementation and cover various non-binding measures that would help and encourage cities in designing and implementing ambitious measures through SUMPs, in particular to increase the share of public transport, cycling and walking. Improving urban mobility has a high potential to reduce the CO2 emissions from transport, as cities account for 23% of transport CO2 emissions, and especially high exceedances of air pollutants that are widespread over European urban areas. A study estimated that the potential CO2 emissions reductions of 21 policy measures found in SUMPs ranges between 15 and 18 Mt of CO2 for 2030, equivalent to 7-8.8% emissions reduction compared to 2010 if all measures were implemented in the whole of the EU.
The Partnerships under the Urban Agenda for the EU will offer a framework for cities, Member States and other stakeholders to exchange experiences and best practices for the urban mobility dimension, will involve cities in the design of policies and the delivery on the ground by establishing a new working method based on a multilevel and cross sectoral multilevel approach.
Through initiatives such as the Covenant of Mayors, the European Innovation Partnership on Smart Cities and Communities, CIVITAS or Urban Innovative Actions, the Commission supports cooperation of public and private actors:
The European Innovation Partnership on Smart Cities and Communities, launched in 2012, is Europe's main initiative to foster the roll-out of innovative integrated smart city solutions at the intersection of transport, energy and ICT at large scale. So far, over 4,000 partners from public authorities, companies, research and other organisations have signed up to the joint market place.
The Covenant of Mayors was launched in 2008 by the European Commission as a bottom-up initiative to endorse and support the efforts deployed by local authorities in the implementation of sustainable energy policies; over 55% of around 3,500 signatories' Sustainable Energy Action Plans analysed in 2015 included measures on transport,, mainstreaming sustainable mobility into local authorities' strategic planning.
The CIVITAS Initiative, launched in 2002, supports cities in testing new technologies and innovative concepts for better and more sustainable urban transport and for incorporating them into integrated and sustainable local transport strategies. So far more than 800 urban mobility measures have been implemented in 60 cities. The CIVITAS Forum network has today more than 250 cities.
The Urban Innovative Actions (UIA) initiative has been created to test new approaches to address the challenges faced by urban authorities. The second call will be launched in autumn 2016 and one of the topics supported is sustainable urban mobility.
Action by cities
The EU has an important role to play in supporting cities and local communities, but inevitably a lot of action will depend on the local level. Pioneering cities can offer not only inspiration for other city leaders, but also early lessons learnt about the initial introduction of the urban low-emission mobility measures.
Local incentives, such as taxes, subsidies or preferential treatments (e.g. possibility to drive on bus lanes), play a major role, including in the consumer's choice of the type of car purchased. For example, Amsterdam and Utrecht offer financial incentives for electric vehicles on top of what is paid by central government or provinces. Electric vehicles in Paris have been entitled to free parking since 1993, which was also immediately followed by the creation of public charging points. In the same spirit, the Rotterdam Electric Programme has supported the first 1,000 electric vehicle owners with an electric charging point.
There are systems of congestion charges in a number of cities. London is proposing an extra charge on the most polluting cars. A good practice example is Gothenburg's system applying to vehicles registered in and outside Sweden. It is designed to use a time-of day dependent cordon pricing, in combination with an investment package, to strengthen public transport multimodality and make traffic smoother.
Public transport fleets can be shifted from fossil-based engines to electricity or fuel cell, depending on the latest technologies available on the market. For example, Rome's entire bus system, which carries 945 million passengers per year, has been running all-electric buses since 1989. With over 23,000 bicycles covering the city, Paris has pioneered the public bicycle system, which offers an alternative way to move around the city.
Local authorities can also make sure that low-emission mobility is always taken into account in all infrastructure plans. Many cities aspire to move away from car-oriented planning. For example, Barcelona's new strategy will restrict traffic to a number of big roads, expected to reduce pollution, with the co-benefit of turning secondary streets into spaces for culture, leisure and the community. Greater Copenhagen's new network of cycle lanes offers people an easier time cycling to work or study. Such "cycle super highways" are continuous high-standard paved bicycle routes reserved for safe, direct and fast commuting by (electric) bicycles over longer distances (more than 5 km).
Local intelligent transport systems can be designed to ensure smoother road traffic flow and thereby reduce stop and start (especially for lorries), through adaptive traffic management and real-time traffic information. An intelligent transport system solution tested in Helmond included intersection control system with priority for a fleet of trucks, and speed advice for approaching the intersection. The City of Stuttgart partly finances the city's innovative car-pooling system, which is to a great extent a consequence of intensive use of information and communication technology. It has also implemented dynamic speed limits to reduce air pollution.
2.5 Action in international aviation and maritime
2.5.1 International developments
Aviation is one of the fastest-growing sources of GHG emissions. Direct emissions from aviation account for about 3% of the EU’s total GHG emissions and more than 2% of global GHG emissions. If the non-CO2 climate impacts of aviation are taken into account (e.g. contrails and cirrus cloud formation), the total climate impact of aviation is even larger. The large majority of these emissions come from international flights. The International Civil Aviation Organization (ICAO) projects that CO2 emissions could grow by 300-700% by 2050 in a business as usual scenario.
The EU has addressed aviation CO2 emissions through the EU ETS since 2012, while it is, at the same time, committed to develop a global measure to address international aviation emissions at ICAO. In the 38th General Assembly in 2013, ICAO member states agreed to work towards the achievement of the collective goal of keeping net CO2 emissions from international aviation at 2020 levels, and to develop a global market-based measure (GMBM) to be part of the ‘basket’ of measures to achieve this goal. In February 2016, ICAO's Committee on Aviation Environmental Protection (CAEP) agreed on a CO2 standard for aircraft, which should guide their development towards greater fuel efficiency. For large new aircraft the standard will apply as of 2020. Existing aircraft will have to apply the new standards by 2028 at the latest.
International maritime shipping is a large and growing source of GHG emissions and is not covered by the EU's emissions reduction target. International maritime transport accounts for about 2.1% of global GHG emissions and a further increase in the range of 50 to 250% by 2050 (1.1 to 3.4% per year) is projected in a business as usual scenario. Significant reduction (25–75%) of these emissions is technically feasible even with today's technologies, and is to a large extent cost effective due to reduced fuel bills.
Due to the nature of shipping, international shipping emissions are best addressed at the global level and the EU is supportive of the IMO’s work in this area. In 2011 IMO adopted the Energy Efficiency Design Index (EEDI), which sets compulsory energy efficiency standards for new ships, and the Ship Energy Efficiency Management Plan (SEEMP), a management tool for ship owners. These measures are expected to substantially dampen expected further emissions growth albeit not reducing emissions from today's levels.
Therefore, further measures are needed to reduce emissions from international shipping. It is expected that this year the IMO will adopt a mandatory international data collection system allowing access to fuel consumption and GHG emissions from ships. Also, the IMO will discuss this year the possible revision of the EEDI requirements and a work plan for establishing a GHG emissions reduction target for international shipping, to contribute towards the objective of the Paris Climate Agreement.
2.5.2 EU level action in international aviation and maritime
Aviation in the
EU ETS
. Since the start of 2012, emissions from all flights from, to and within the European Economic Area (EEA) - the 28 EU Member States, plus Iceland, Liechtenstein and Norway - have been included in the
EU Emissions Trading System
(EU ETS). These emissions form part of the EU's internal 20% and 40% greenhouse gas (GHG) emission reduction targets for 2020 and 2030 respectively. In view of the implementation by 2020 of an international agreement applying a single global market-based measure to international aviation emissions, the EU ETS’s application has been restricted to intra-EEA flights until 2016.,
The EU ETS is being implemented in its current intra-EEA scope in a satisfactory manner. Verified CO2 emissions from ETS aviation activities between airports amounted to 56.9 million tonnes of CO2 in 2015. Taking into account an annual allocation close to 39 million allowances, it can be concluded that the EU ETS contributes to more than 17 million tonnes of emission reductions annually, partly within the sector (i.e. by airlines reducing their emissions to avoid paying for additional units) or in other sectors (by airlines purchasing units from other sectors, which would accordingly have to reduce their emissions). Compliance rates are very high. Aircraft operators, including from third countries, representing more than 99% of the emissions covered by the EU ETS adequately report emissions and surrender the corresponding allowances.
Monitoring, reporting and verification (MRV) of shipping emissions. The European Commission adopted in 2013 a staged strategy for progressively including GHG emissions from maritime transport in the EU's policy for reducing its overall GHG emissions. As a first step, the European Union adopted in 2015 a Regulation establishing an EU-wide system for the monitoring, reporting and verification of CO2 emissions and other relevant information from EU-related maritime transport activities (MRV Regulation). Robust MRV is the basis for designing and implementing any measure reducing GHG emissions of ships and facilitates results-based monitoring of progress. It contributes to the removal of market barriers to cost-effective mitigation measures by providing comparable and reliable information on energy efficiency.
This MRV system will be applied from 2018 covering all voyages from and to EU ports by ships covered by the technical scope of the MRV Regulation and regardless of their flag. Annual data of emissions and ships' efficiency will be verified by independent verifiers before they are submitted to the Commission and subsequently published. MRV alone is expected to reduce emissions by 2% compared to business as usual. As highlighted in the 2013 strategy, a mandatory international scheme to collect data regarding the fuel consumption and energy efficiency of the shipping sector would be preferable; the Commission will review the MRV Regulation after the expected adoption of the global scheme by IMO in 2016 for which technical rules still need to be developed and for which reporting is expected to start in 2019.
2.6 Taxation
The Energy Taxation Directive (ETD) stipulates minimum rates for excise duties for unleaded petrol of €359 per 1000 litres and €330 per 1000 litres for diesel (gasoil) used in transport. Excise duty rates differ between Member States. For petrol, they range from just over the minimum to €766 per 1000 litres in the Netherlands. For diesel actual rates are generally lower and closer to the minimum, the highest rate reaching €674 in the United Kingdom.
In 2011, the European Commission proposed a revision of the Energy Taxation Directive, which distinguished a CO2-related component and an energy-related component in the excise duty. Applying this principle would have implied a minimum rate on diesel of €390 if the minimum rate on petrol would have been €359 per 1000 litres.
The analysis accompanying the Commission proposal showed that CO2-based taxation drives consumption away from fossil energy sources. As far as the motor fuel market is concerned, detailed modelling confirmed that removing the price advantage for diesel both in the EU minima and in national rates would have a rebalancing effect on the supply and demand on the fuel market.
Currently all EU Member States, except the UK, tax diesel at lower rates than petrol per litre. Taking into account that the energy and carbon content of a litre of diesel is higher than of a litre of petrol, all countries analysed tax petrol higher than diesel per unit of energy or carbon emissions.
From decarbonisation of transport perspective, the lower tax rate on diesel fuel is not justified, given the relative environmental costs associated with the use of diesel and petrol. Diesel has higher emissions of carbon and of harmful air pollutants, notably particulate matter and NOx, per litre of fuel used. Hence, from a decarbonisation of transport perspective, the level of tax needed to reflect these environmental costs should be higher for a litre of diesel than for a litre of petrol.
A proposal on passenger car taxation aimed to improve the functioning of the internal market by removing existing tax obstacles to the transfer of passenger cars from one Member State to another.
It also aimed to promote sustainability by restructuring the tax base of both registration taxes and annual circulation taxes, as well as by including elements directly related to carbon dioxide emissions of passenger cars. It would not have harmonized tax rates or obliged Member States to introduce new taxes, but only included an EU structure on car taxes.
The negotiations showed that the proposed abolition of the registration tax was too ambitious, as it represents a non-negligible source of revenues for the Member States. However, the incorporation of an adequate environmental element (e.g. CO2, air pollutants) in the registration and circulation taxes could be a possible option for unanimous support, as 24 Member States have already introduced such element (i.e. CO2 emissions, exhaust emissions, Euro standards, fuel consumption) into their national tax systems.
The European Commission has decided to withdraw
the proposal to revise the Energy Taxation Directive as well as the proposal for a Directive on passenger car related taxes. In the case of the Energy Taxation Directive, the draft compromise text was de facto void of all constituting elements of the original Commission proposal. There was no agreement in the Council even on the draft compromise text. For the directive on passenger car related taxes, no agreement was reached in the Council.
Favourable tax treatment of company cars creates significant losses of revenues but also significant social and environmental costs such as increased contributions to climate change, local air pollution, traffic congestion and road accidents. Advantageous company car taxation schemes tend to affect the choice of mode and driving habits. They also risk counteracting the incentives provided by energy and vehicle taxes (registration and circulation taxes) to reduce fuel consumption. A recent OECD Study and OECD Brief show that under-taxing company cars encourages company car owners to drive up to three times as much as people with private cars, with all consequences this may have for environment. A number of Member States subsidise the private use of company cars, in most cases by not differentiating between the use of a company car for business and private purposes. Concretely, eleven Member States have been identified as having poor performance in the design of their company cars taxation. Moreover, a small number of Member States allow partial deduction of the VAT charged on the purchase of company cars intended for private use by employees.
3. Developments under current trends and policies
3.1 Identifying the GHG emissions gap for transport
Building on the 2008 Climate and Energy package and in line with the cost-effective pathway described in the 2050 roadmaps
, in 2014 the European Council endorsed a binding EU target of an at least 40% domestic reduction in GHG emissions by 2030 compared to 1990. This target will be delivered collectively by the EU in the most cost-effective manner possible, with the reductions in the ETS and non-ETS sectors amounting to 43% and 30% by 2030 respectively compared to 2005. An EU target of at least 27% was agreed for the share of renewable energy consumed in the EU in 2030; this target is binding at EU level. An indicative target at the EU level of at least 27% was agreed for improving energy efficiency in 2030 compared to projections of future energy consumption based on a 2007 baseline. This will be reviewed by 2020, having in mind an EU level of 30%.
The reduction effort for the non-ETS sectors (transport, buildings, agriculture and waste management) is distributed between Member States through the Effort Sharing Regulation for the period 2021 to 2030. Transport needs to contribute to the 2030 targets and, in particular, to the 30% emissions reduction effort set for the non-ETS sectors.
The Commission has undertaken analysis exploring the impact of current trends, including the implementation of policies that were adopted at EU and Member State level by December 2014, in the so-called ‘EU Reference scenario 2016’. The projection shows that the declining trend in transport emissions is expected to continue, leading to 12% lower emissions in 2030 than in 2005.
Building on the EU Reference scenario 2016, two additional central scenarios (so-called ‘EUCO27’ and ‘EUCO30’) have been developed to reach all the 2030 targets agreed by the October 2014 European Council (see section 4) and the 2050 decarbonisation objectives, continuing and intensifying the current policy mix. The difference between the two scenarios lies in the level of ambition to be achieved for the energy efficiency goal (27% or 30% primary energy savings in 2030 compared to the 2007 baseline). These polices have been modelled in a stylised manner (see section 4). The central scenarios show emissions reductions of: 18-19% for transport, 38-43% for residential and tertiary (mainly buildings), 35-37% for industry and 29%-35% for non-CO2 sectors (mainly agriculture and waste) by 2030 relative to 2005. For transport, the emissions reductions are in line with the 2011 White Paper which established a goal of 20% by 2030 relative to 2008 levels (equivalent to 19% emissions reduction compared to 2005).
No sectoral target has been established for the transport sector. However, comparing developments under current trends and adopted policies (i.e. the EU Reference scenario 2016, achieving 12% emissions reduction in transport) with the central scenarios (18-19%), shows that additional policies could be needed, especially post-2020, in order to close the gap of 6-7 percentage points and provide a cost-effective transport contribution to the 2030 Climate and Energy policy framework (taking into account all targets agreed for 2030 and existing policy mix). Action would be needed on three key levers: low- and zero-emission vehicles, low emission alternative energy for transport, and efficiency of the transport system. However, if lower emissions reductions than currently set out in the two scenarios reflecting the EU’s 2030 targets (EUCO27 and EUCO30) were to take place in other non-ETS sectors (e.g. buildings, agriculture, small industry and waste), even higher emissions cuts will be required in the transport sector to reach the 30% emissions reduction effort set for the non-ETS sectors.
The expected gap shows that current transport policies need to be reinforced to ensure the achievement of the EU’s 2030 targets. The European Council recognised the need to reduce GHG emissions from transport and risks related to fossil fuel dependency, and therefore invited the Commission to further examine instruments and measures for a comprehensive and technology neutral approach for the promotion of emissions reduction and energy efficiency in transport, for electric transportation and for renewable energy sources in transport also after 2020. The European Council also recalled that a Member State can opt to include the transport sector within the framework of the ETS.
While reducing its energy use and GHG emissions, transport also needs to continue to meet society's needs, and reduce its other negative impacts. The analysis in section 4 shows that curbing GHG emissions from transport reduces the EU's dependence on fossil fuels and brings clear co-benefits leading to reductions of costs related to air pollution, accidents, congestion and noise pollution. While not demonstrated by modelling, it is clear that such developments result in more liveable cities, improve quality of life and contribute to maintaining the competiveness of EU industry.
The remaining part of section 3 provides more detail on the key assumptions and main results of the Reference scenario 2016. The two scenarios additionally developed to reach all the 2030 targets agreed by the October 2014 European Council (EUCO27 and EUCO30) are described further in section 4.
3.2 Key assumptions of the Reference Scenario
The Reference scenario is a projection, not a forecast; it has been developed building on a modelling framework including PRIMES (i.e. PRIMES-TREMOVE model for transport), GEM-E3, GAINS and other related models, and benefited from the comments of Member States experts. The projections build on a set of assumptions related to population growth, macroeconomic and oil price developments, technology improvements, and policies described below.
Demographic change is transforming the EU with inevitable consequences for the transport sector. In the Reference scenario, the population projections draw on the EUROPOP2013 (EUROpean POPulation Projections 2013) from Eurostat, which is also the basis for the 2015 Ageing Report. The key drivers for demographic change are: higher life expectancy, convergence in the fertility rates across Member States in the long term, and inward migration. The EU28 population is expected to grow by around 0.2% per year during 2010-2030 (0.1% for 2010-2050), to 516 million in 2030 (522 million by 2050). Elderly people, aged 65 or more, would account for 24% of the total population by 2030 (28% by 2050) as opposed to 18% today.
GDP projections mirror the joint work of DG ECFIN and the Economic Policy Committee, presented in the 2015 Ageing Report. The average EU GDP growth rate is projected to remain relatively low in the short to medium term at 1.2% per year for 2010-2020, down from 1.9% per year during 1995-2010. In the medium to long term the higher expected growth rates (1.4% per year for 2020-2030 and 1.5% per year for 2030-2050) are taking account of the catching up potential of countries with relatively low GDP per capita, assuming convergence to a total factor productivity growth rate of 1%.
Oil prices have fallen by more than 60 percent since mid-2014, to an average of around 40 $/barrel for Brent crude oil in the first four months of 2016.
The collapse of oil price has been driven by low demand and sustained oversupply, due in particular to tight oil from North America and to the decision of the Organization of Petroleum Exporting Countries (OPEC) countries not to cut their output to rebalance the market. The Reference scenario assumes a gradual adjustment process with reduced investments in upstream productive capacities by non-OPEC countries. Quota discipline is assumed to gradually improve among OPEC members. Thus, oil price is projected to reach 87 $/barrel in 2020 (in year 2013-prices). Beyond 2020, as a result of persistent demand growth in non-OECD countries driven by economic activity and the increased ownership of passenger cars, oil price would rise to 113 $/barrel by 2030 and 130 $/barrel by 2050.,
In terms of technological developments, battery costs for electric vehicles and plug-in hybrids are assumed to go down to 320-360 $/kWh by 2030 and 270-295 $/kWh by 2050; further improvements in the efficiency of both spark ignition gasoline and compression ignition diesel are assumed to take place. In addition, the market share of internal combustion engine (ICE) electric hybrids is expected to increase due to their lower fuel consumption compared to conventional ICE vehicles.
The key policies included in the Reference scenario 2016 that are relevant for transport decarbonisation are:
–The Renewable Energy Directive (Directive 2009/28/EC) and Fuel Quality Directive (
Directive 2009/30/EC
) including ILUC amendment (Directive 2015/1513/EU): achievement of the renewables legally binding transport target for 2020, taking into account the cap on the amount of food or feed based biofuels (7%).
–The EU Emissions Trading System (Directive 2003/87/EC and its amendments) is fully reflected in the modelling, including the linear reduction factor of 1.74% for stationary installations and the recently adopted Market Stability Reserve.
–The Effort Sharing Decision (Decision No 406/2009/EC) including achievement of the legally binding 2020 targets for non-ETS emissions at aggregated EU level.
–Implementation of the Energy Efficiency Directive (Directive 2001/27/EU).
–CO2 standards for cars and vans regulations (
Regulation (EC) No 443/2009
, amended by Regulation (EU) No 333/2014 and Regulation (EU) No 510/2011, amended by Regulation (EU) No 253/2014); CO2 standards for cars are assumed to be 95gCO2/km as of 2021 and for vans 147gCO2/km as of 2020 in line with current legislation. Standards are assumed constant after 2020/2021.
–The Directive on the deployment of alternative fuels infrastructure (
Directive 2009/30/EC
).
–The Energy Efficiency Design Index (EEDI) and the Ship Energy Efficiency Management Plan (SEEMP) for maritime transport.
–Relevant national policies for instance on fuel and vehicle taxation.
3.3 Reference Scenario main results
EU transport activity is expected to continue growing under current trends and adopted policies, albeit at a slower pace than in the past. Freight transport activity for inland modes is projected to increase by 35% between 2010 and 2030 (1.5% per year) and 58% for 2010-2050 (1.2% per year). Passenger traffic growth would be slightly lower than for freight at 22% by 2030 (1% per year) and 40% by 2050 (0.9% per year). The annual growth rates by mode, for passenger and freight transport, are provided in
Figure 1
.
Road transport would maintain its dominant role within the EU. The share of road transport in inland freight is expected to remain relatively stable by 2030 at 71% and only slightly decrease to 70% by 2050. For passenger transport, road modal share is projected to decrease by 4 percentage points by 2030 and by additional 3 percentage points by 2050. Passenger cars would still contribute 70% of passenger traffic by 2030 and about two thirds by 2050, despite growing at lower pace relative to other modes due to slowdown in car ownership increase which is close to saturation levels in many EU15 Member States.
Figure 1: Passenger and freight transport projections (average growth rate per year)


Source: EU Reference scenario 2016, PRIMES-TREMOVE transport model (ICCS-E3MLab)
Note: For aviation, domestic and international intra-EU activity is reported, to maintain the comparability with reported statistics.
Rail transport activity is projected to grow significantly faster than for road, driven in particular by the effective implementation of the TEN-T guidelines, supported by the CEF funding, leading to the completion of the TEN-T core network by 2030 and of the comprehensive network by 2050. Passenger rail activity goes up by 39% between 2010 and 2030 (76% for 2010-2050), increasing its modal share by 1 percentage point by 2030 and an additional percentage point by 2050. Rail freight activity grows by 47% by 2030 and 84% during 2010-2050, resulting in similar increases in modal share as for passenger rail.
Domestic and international intra-EU air transport would grow significantly (by 59% by 2030 and 118% by 2050) and increase its share in overall transport demand (by 3 percentage points by 2030 and by additional 2 percentage points by 2050). Overall, aviation activity including international extra-EU flights is projected to go up by 61% by 2030 and 125% by 2050, saturating European skies and airports.
Transport activity of freight inland navigation also benefits from the completion of the TEN-T core and comprehensive network and the recovery in the economic activity and would grow by 22% by 2030 (1% per year) and by 39% during 2010-2050 (0.8% per year).
International maritime transport activity is projected to continue growing strongly with rising demand for oil, coal, steel and other primary resources – which would be more distantly sourced – increasing by 37% by 2030 and by 71% during 2010-2050.
Transport accounts today for about one third of final energy consumption. In the context of growing activity, energy use in transport is projected to decrease by 5% between 2010 and 2030 and to slightly increase post-2030, resulting in levels of energy demand by 2050 similar to those observed in 2010 (see
Figure 2
). These developments are mainly driven by the implementation of the Regulations setting emission performance standards for new passenger cars and vans. LDVs are currently responsible for around 60% of total energy demand in transport but this share is projected to significantly decline over time, to 53% by 2030 and 51% by 2050. Heavy goods vehicles and aviation are projected to increase their share in final energy demand from 2010 onwards, continuing the historic trend from 1995. Energy demand by heavy goods vehicles would grow by 15% between 2010 and 2030 (24% for 2010-2050).
Bunker fuels for air and maritime transport are projected to increase significantly: by 17% by 2030 (33% for 2010-2050) and 24% by 2030 (42% for 2010-2050), respectively.
Figure 2: Evolution of total final energy consumption and GHG emissions between 1995 and 2050


Source: EU Reference scenario 2016, PRIMES model (ICCS-E3MLab)
Electricity use in transport is expected to increase steadily as a result of further rail electrification and the uptake of alternative powertrains in road transport; its share increases from 1% currently to 2% in 2030 and 4% in 2050. Battery electric and plug-in hybrid electric vehicles are expected to see faster growth beyond 2020, in particular in the segment of LDVs, driven by EU and national policies offering various incentives. The share of battery electric and plug-in hybrid electric vehicles in the total stock of LDVs would reach about 5% by 2030 and 12% by 2050. The uptake of hydrogen would be facilitated by the increased availability of refuelling infrastructure, but its use would remain limited in lack of policies adopted beyond the end of 2014. Fuel cells would represent about 2% of the light duty vehicle stock by 2050.
LNG becomes a candidate energy carrier for road freight and waterborne transport, especially in the medium to long term, driven by the implementation of the Directive on the deployment of alternative fuels infrastructure and the revised TEN-T guidelines which represent important drivers for the higher penetration of alternative fuels in the transport mix. In the Reference scenario, the share of LNG is projected to go up to 3% by 2030 (8% by 2050) for road freight and 4% by 2030 (7% by 2050) for inland navigation. LNG would provide about 4% of maritime bunker fuels by 2030 and 10% by 2050 – especially in the segment of short sea shipping.
Biofuels uptake is driven by the legally binding target of 10% renewable energy in transport (Renewables Directive), as amended by the ILUC Directive, and by the requirement for fuel suppliers to reduce the GHG intensity of road transport fuel by 6% (Fuel Quality Directive). Beyond 2020, biofuel levels in EU28 remain relatively stable at around 6%. Renewable energy in transport would represent about 11% in 2020, increasing to 14% by 2030 (21% by 2050).
In the Reference scenario, oil products would still represent about 90% of the EU transport sector needs in 2030 and 86% in 2050, despite the renewables policies and the deployment of alternative fuels infrastructure which support some substitution effects towards biofuels, electricity, hydrogen and natural gas (see
Figure 3
).
Figure 3: Evolution of final energy use in transport by type of fuel

Source: EU Reference scenario 2016, PRIMES-TREMOVE transport model (ICCS-E3MLab)
The declining trend in transport emissions is expected to continue, leading to 12% lower emissions by 2030 compared to 2005, and 11% by 2050. However, relative to 1990 levels, emissions would still be 13% higher by 2030 and 15% by 2050, owing to the fast rise in the transport emissions during the 1990s. The share of transport in total GHG emissions would continue increasing, going up from 23% currently (excluding international maritime) to 25% in 2030 and 32% in 2050, following a relatively lower decline of emissions from transport compared to power generation and other sectors (see
Figure 2
). Aviation would contribute an increasing share of transport emissions over time, increasing from 14% today to about 18% in 2030 and 20% in 2050. Maritime bunker fuel emissions are also projected to grow strongly, increasing by 22% during 2010-2030 (38% for 2010-2050).
The overall trend in transport emissions is determined by three broad components: transport activity levels (expressed in passenger or tonne-kilometres), the energy intensity of transport (defined as energy consumption per passenger or tonne-kilometre) and the carbon intensity of the energy used (given by the CO2 emissions divided by energy consumption). Following this approach, it has been evaluated how much the projected transport emissions will increase/decrease (in percentage terms or Mt of CO2) between 2005 and 2030 due to transport activity growth, improvements in energy intensity and carbon intensity (see
Figure 4
).,
Overall, CO2 emissions from passenger transport decrease by 16% (127 Mt of CO2) between 2005 and 2030 in the Reference scenario. The 16% decrease in CO2 emissions from passenger transport is due to transport activity growth (+24%, equivalent to 198 Mt of CO2), improvements in energy intensity (-35%, equivalent to 281 Mt of CO2) and in carbon intensity (-5%, equivalent to 44 Mt of CO2). The trend for the three components and their contribution to emissions is different by transport mode. Efficiency gains play a decisive role in reducing emissions in road transport, while in aviation they would not offset the activity growth leading to higher fuel use and emissions. The use of less CO2 intensive fuels contributes to a reduction of emissions for road and rail passenger transport with no effect on aviation by 2030.
For freight transport, the 2% (5 Mt of CO2) decrease in CO2 emissions between 2005 and 2030 is the result of transport activity growth (+27%, equivalent to 73 Mt of CO2), improvements in energy intensity (-21%, equivalent to 56 Mt of CO2) and in carbon intensity (-8%, equivalent to 22 Mt of CO2). The efficiency gains and the uptake of alternative fuels for road freight transport are just sufficient to offset the effects of activity growth. The electrification in rail has positive effects on emissions, despite the growth in traffic volumes. For inland navigation, efficiency gains and to some lower extent the uptake of LNG has significant positive effects on emissions reduction.
Figure 4: Decomposition of CO2 emissions in the Reference scenario (2005-2030)


Source: EC elaboration based on the EU Reference scenario 2016, PRIMES-TREMOVE transport model (ICCS-E3MLab)
Note: The figures report the changes in CO2 emissions due to the three broad components (transport activity levels, energy intensity of transport and carbon intensity of the energy used) in two ways: in levels and in relative terms compared to 2005. The size of each column bar, read on the left axis, represents the change in terms of CO2 emissions compared to 2005, expressed in Mt of CO2. The percentage changes reported above the column bars represent relative changes in these emissions compared to their respective 2005 levels. Provided that CO2 levels for 2005 corresponding to each transport mode are not comparable in size, the percentage changes reported in the figures are not directly comparable. The figures above include only tank to wheel emissions.
NOx emissions would drop by about 56% by 2030 (63% by 2050). The decline in particulate matter (PM2.5) would be less pronounced by 2030 at 51% (64% by 2050). Overall, external costs related to air pollutants would decrease by about 56% by 2030 (65% by 2050).
Congestion costs are projected to increase by about 24% by 2030 and 42% by 2050, relative to 2010. Congestion on the inter-urban network would be the result of growing freight transport activity along specific corridors, in particular where these corridors cross urban areas with heavy local traffic. Noise related external costs of transport would continue to increase, by about 18% during 2010-2030 (26% for 2010-2050), driven by the rise in traffic. Thanks to policies in place, external costs of accidents are projected to go down by about 47% by 2030 (-44% for 2010-2050) – but still remain high at €100 billion in 2050. Overall, external costs are projected to decrease by about 10% by 2030 and to increase post-2030; by 2050 they stabilise around levels observed in 2010.
4. Pathways towards low-emission mobility
In line with scientific findings reported by the International Panel on Climate Change (IPCC) in its fourth Assessment Report, the European Council stated in 2009 that the EU's objective, in the context of necessary reductions by developed countries as a group, is to reduce GHG emissions by 80-95% in 2050 compared to 1990. Such a reduction would be in line with the international objective to limit climate change to below two degrees.
The 2011 Transport White Paper concluded that, while deeper cuts can be achieved in other sectors of the economy, a reduction of at least 60% of GHGs by 2050 with respect to 1990 is required from the transport sector, including aviation. For maritime transport, the 2011 White Paper established the objective to reduce CO2 emission from maritime bunker fuels by 40% (50% if feasible) by 2050 compared to 2005 levels. In the White Paper, electrification was considered a strong driver for reductions of GHG emissions in the road transport sector to 2050. In the scenarios modelled, electrification was shown to significantly replace fossil fuels in new passenger cars and vans (collectively light duty vehicles (LDVs)). However, low emission alternative fuels (including advanced renewable fuels and sustainable biofuels) would remain necessary for aviation, heavy duty vehicles and shipping. Thus, the White Paper set the goal of halving the use of conventionally-fuelled cars in urban transport by 2030, phasing them out in cities by 2050 and achieving essentially CO2-free city logistics in major urban centres by 2030. For aviation, the objective is for the share of low-carbon sustainable fuels to reach 40% by 2050.
Section 3 showed that under current trends and adopted policies, the declining trend in emissions from transport is expected to continue until 2030 (12% reduction for 2005-2030) but greater efforts may be needed after 2020 to deliver the 2030 Climate and Energy policy framework, and reach the White Paper's 60% GHG goal for 2050. This section first identifies measures that could contribute to low-emission mobility and then sets out several stylised pathways/scenarios.
The modelling framework used for assessing these pathways/scenarios is described in Annex IV. The central model used for the analysis of the transport system is the PRIMES-TREMOVE Transport Model, developed and maintained by E3MLab/ICCS of National Technical University of Athens, complemented where relevant by other models (e.g. PRIMES energy system model, PRIMES biomass model).
4.1 Policy measures
The most important transport policies for low-emission mobility are briefly discussed below, according to three main pillars: moving towards zero-emission vehicles; low emission alternative energy for transport; efficiency of the transport system.
They are supported by other cross-cutting initiatives in the area of research and innovation, financing, and also by initiatives covering the urban dimension.
4.1.1 Moving towards zero-emission vehicles
Strong action on vehicle efficiency, accompanied by appropriate policies to support innovation, the deployment of recharging/refuelling infrastructure and alternative fuels and powertrains, are a prerequisite for the decarbonisation of the transport system. As acknowledged by the 2011 White Paper, this provides a very effective way of reducing costs and advancing the introduction of new technologies. Consequently, the stylised scenarios explore the impacts of potential future policies acting on this driver.
Tightening CO2 emission standards for passenger cars and light commercial vehicles beyond 2020 would be needed so that road transport contributes to the agreed 2030 climate targets and the longer term decarbonisation objectives. The effectiveness of the legislation is dependent on the establishment of CO2 values during type approval tests. As stated in section 2, it has become clear that there are weaknesses in the type-approval procedures underpinning the CO2 emission standards. They are being addressed by the Worldwide harmonized Light vehicles Test Procedure (WLTP) that is in the process of being put in place at EU level, as explained in the box below.
More reliable fuel consumption and CO2 figures for consumers and regulators
The official figures underpinning the CO2 emission limit values for the new passenger car and van fleets in the EU are produced from a laboratory test. In order to ensure the effectiveness of these limits, reductions achieved in the laboratory test must lead to commensurate reductions in real life. However, it is now generally acknowledged that there has been a large and growing divergence between the two.
The most important factor contributing to this divergence is the currently still applicable New European Driving Cycle (NEDC) test cycle. The NEDC driving pattern is outdated and unrealistic and the test procedure includes parameters (e.g. tyre conditioning, ambient temperature, wind speed at road load test), flexibilities and tolerances that are not sufficiently tightly defined.
Recognising these shortcomings, the European Commission has played a leading role in the development of the new Worldwide harmonized Light-vehicles Test Procedure (WLTP) within the framework of the United Nations Economic Commission for Europe (UNECE). This procedure brings significant improvements over the NEDC and will provide more realistic values. On 14 June 2016, the technical regulatory committee gathering Member States representatives (Technical Committee of Motor Vehicles) voted in favour of the Commission's draft Regulation to introduce the WLTP in the EU. If the European Parliament and the Council do not object to the current text, the new WLTP test will be mandatory for all new vehicle types from September 2017 and for all new vehicles from September 2018.
Moreover, a major overhaul of the so-called EU type approval framework for motor vehicles was proposed by the Commission in January 2016 and is currently being discussed by Member States and the European Parliament. The proposal for a new framework Regulation aims at strengthening the independence of vehicle testing and at introducing a more effective market surveillance system.
To complement these measures, further options could be explored to ensure that any remaining gap between laboratory and real world emissions is minimised and to avoid that it is growing over time. These options, whose feasibility will have to carefully assessed, could range from establishing specific rules for independent conformity of production and in-service testing to developing a complementary real-driving test procedure for CO2 emissions. In addition, monitoring systematically a sufficiently large set of real-world data (i.e. the actual on-road fuel consumption of the vehicle fleet) would allow a robust verification of the CO2 emissions determined at type approval. The technical basis for this could be so-called fuel consumption meters (FCM) which are already present in many car models.
To obtain further qualified views on potential methods to address this divergence, the Commission also asked for a timely opinion of the so-called Scientific Advice Mechanism. It is an instrument recently put in place to support European policy making with independent scientific evidence under the lead of several eminent scientists from across Europe.
Further work is being carried out to ensure the continued relevance and accuracy of the EU's vehicle emissions testing regime. This includes further work on the WLTP (Phases 2 and 3), which should cover the remainder of emission-related light duty vehicle testing, such as evaporative emissions. In addition, the Commission introduced a Real Driving Emissions (RDE) procedure to measure the NOx emissions of light duty diesel vehicles in real driving conditions. This new procedure utilises portable emissions measurement systems (PEMS) and may be further developed and refined. In parallel, in order to accelerate the positive effects on urban air pollution hotspots of the introduction of RDE tests, a voluntary mechanism to identify vehicles with significantly lower air quality related pollutant emissions, including NOx, may also be explored. In addition to providing consumers with more accurate information on cars' NOx emissions, such a mechanism would also support manufacturers who already supply cleaner vehicles.
With a view to accelerating the technological shift needed to achieve an ambitious long-term reduction in road transport emissions, zero- and low-emission vehicles may need to be deployed and gain significant market share by 2030. Options to incentivise them may also need to be considered, so to give a clear policy signal to industry to make the next step and to reinforce investment in alternative powertrain technology.
As a complementary demand-side measure, it needs to be considered how car labelling can be improved to better support consumers in their choice of more fuel-efficient and low emitting cars.
Regarding powertrain technology, accelerating the development and deployment of more efficient hybrid powertrains to reduce the fuel consumption of light duty vehicles without creating negative effects in terms of air pollutant emissions, also needs to be considered.
With respect to heavy duty vehicles, the development of the VECTO simulation tool and the implementation of the certification procedure using the VECTO output, briefly described in section 2, will support the envisaged Commission legislative proposal which would require fuel consumption and CO2 emissions from new HDVs to be reported and monitored. This is expected to close the existing "knowledge gap" on HDV emissions that prevents more ambitious actions to reduce them. This could contribute to a more transparent and competitive market and the adoption of the most energy-efficient technologies. Setting up an accurate and reliable monitoring and reporting system could provide fuel consumption and CO2 emissions data from new vehicles to underpin possible future legislation. In the meantime, preparatory work towards possible EU CO2 standards for HDVs has already started.
Public procurement has the potential to act as a catalyst for industrial and business innovation, and green growth. Adjusting the scope and methodology of vehicle procurement rules and guidance to emphasise CO2 and pollutant emissions could provide effective incentives for the procurement of cleaner vehicles. It would lead to increased demand i.e. a bigger domestic market that would result in falling prices for consumers due to economies of scale and would contribute to the worldwide competitiveness of the European industry. Cohesion policy could also support replacement and renewal of rolling stock and vehicles, primarily for collective transport modes (e.g. urban bus fleet, trams).
4.1.2 Switching towards low emission alternative energy for transport
Stronger integration of transport with the energy system and progressive change of the transport fuel mix is essential for low-transport mobility; consequently, the stylised scenarios explore the impacts of potential future policies acting on this driver. The Energy Union strategy acknowledged the need for: fostering the market uptake of alternatively fuelled vehicles/vessels and the deployment of related recharging/refuelling infrastructure; promoting electrification, especially of road and rail transport - making the EU a leader in electro-mobility technologies, as well as the importance of integration within urban mobility policies and the electricity grid.
ICT is also needed to support integration of transport with the energy system. To reap the potentials of digitalisation, setting the right standards, ensure interoperability and enable data exchange while at the same time addressing privacy and cyber-security issues, would be necessary.
Modelling shows that transport will need to contribute appropriately to achieving the targets within the 2030 Climate and Energy policy framework (see section 3). In addition to the requirement for an at least 40% domestic reduction in GHG emissions by 2030 compared to 1990, transport will need to contribute to the mandatory EU wide target of at least 27% renewable energy in 2030. Taking into account the constraints linked to food-based biofuels, innovation and support for the introduction of advanced renewable fuels into the EU market may be necessary.
The development of European Standards is an important element in the creation and expansion of the European market for biofuels. Standardisation work is ongoing within the European Committee of Standardisation (CEN) on E10+ petrol blend, high ethanol blend (E85), biomethane and recently work started on algal biofuels. CEN recently approved a standard for paraffinic diesel fuel and blends and B20-30 for use in captive fleets. Research work is ongoing on E20-25 and on using gasoline in diesel engines under the auspices of CEN.
Action to implement existing policies would also need to be taken. This includes the European Alternative Fuels Strategy, which adresses not only decarbonisation and air quality objectives but also security of energy supply and the competiveness of EU industry; it covers all modes of transport and aims at establishing a long-term policy framework to guide technological development and investments in the deployment of alternative fuels, and give confidence to consumers. Specific measures to implement the four priority fields of EU action of the strategy: 1) addressing the technological development, including advanced biofuels production; 2) addressing alternative fuels infrastructure and its integration to the energy system; 3) developing common technical specifications; 4) addressing consumer awareness, acceptance and market uptake, are presented in more detail in Annex III. For example, a methodology of price comparison of electricity and other conventional and alternative fuels may be developed by the European Commission, and a platform could promote the use of this methodology in Members States. The Commission set up an Alternative Fuels Observatory (EAFO) as the reference website for user information. In 2015, the Commission gave a mandate (M533) to CEN and European Committee for Electrotechnical Standardisation (CENELEC) to adopt European standards for alternative fuels infrastructure as set out in the Directive on the deployment of alternative fuels infrastructure. In addition, the Project Committee on fuel labelling CEN/TC 441 has started its work on fuel labelling for all fuels and its final adoption is expected by the end of this year. Work on the well to wheel analysis is undertaken by JRC in cooperation with EUCAR and CONCAWE.
The promotion of alternative fuels could also be pursued in urban areas, inter alia by integrating alternative fuels in Sustainable Urban Mobility Plans, using: access regulations (including planned and future air quality low emission zones) - as a mean of promoting alternatively fuelled vehicles in urban centres, developing a CO2 emissions and air pollutants methodology and targets to assess the deployment of alternative fuels in public transport within urban areas, support to cities through Horizon 2020 and Connecting Europe Facility.
The efficient integration of electric vehicles into the electricity system is a major challenge for grid stability and can only be managed successfully if charging can be shifted to times of low electricity demand and/or high supply. The electricity market design initiative (MDI) aims at enabling and rewarding consumers to manage their consumption (demand response) and hence – among others – allow for smart charging. This requires access to relevant technologies (smart meters) as well as competitive retail markets. The initiative may also reduce barriers to the self-generation and consumption of renewable electricity. This would facilitate consumers' ability to use electricity generated from their own solar panels for charging vehicles. Within the MDI also new provisions for storage may be envisaged, that aim at incentivising the use of batteries (including electric vehicles batteries) in the electricity system.
In the longer term, refuelling infrastructure for hydrogen and renewable fuels of non-biological origin (e.g. methane, methanol and ethanol) could provide an additional source of flexibility to the electricity grid. The refuelling stations would be able to store the energy in form of gas or liquids and absorb excess variable renewables generation, while providing refuelling capacity without adding load to the electricity grid during periods of low renewables generation. These fuels could also be used to generate electricity at times of peak pricing.
Measures for further rollout of recharging infrastructure, to support the electrification of transport would also be needed. Consideration may need to be given to facilitating the installation of additional vehicle charging infrastructure when constructing new buildings, as part of the review of the Energy Performance of Building Directive. In addition, facilitating access to existing sockets in private and public buildings is an extremely effective action at zero additional cost that could also be encouraged. Furthermore, it is crucial that these recharging points are interoperable, i.e. that users are able to find, charge and pay without barriers wherever in the EU.
4.1.3 Efficiency of the transport system
An integration of all transport modes is needed within the vision of a more efficient, sustainable, competitive, accessible, user- and citizen-friendly transport system.
A proper and acceptable policy mix to create an optimal and sustainable multimodal transport system is a prerequisite. Integration of ICT systems across different transport modes would foster seamless door-to-door mobility, integrated logistics and value added services using data from transport. Consequently, the stylised scenarios explore the impacts of potential future policies acting on this driver.
Providing correct price signals and reducing disparities in road charging policies across the EU is needed, and would contribute to the further internalisation of local externalities and elimination of discriminatory practices in the internal market. Differentiation of infrastructure charges for heavy goods vehicles according to CO2 emissions could additionally contribute to a faster uptake of more energy-efficient vehicles. The improvement in the functioning of the Eurovignette and Electronic Tolling System (EETS) system in the EU would have positive impacts on CO2 and air pollutant emissions from the road transport sector, achieved through better organisation of transport and reduced congestion.
Intelligent Transport Systems (ITS) make transport more efficient and safe and have important co-benefits such as reducing energy use and environmental impacts, reducing congestion, enhancing mobility, increasing service reliability, and supporting economic development. A Master plan for the deployment of cooperative ITS (involving communication between vehicles, between vehicles and infrastructure and/or infrastructure-to-infrastructure) is necessary to ensure coordinated investments, create the necessary economies of scale and ensure EU-wide interoperability and continuity of services. A recent cost-benefit analysis shows that this can have significant impact on fuel consumption (and associated CO2 and pollutant emissions), time saved in transport and safety. Setting technical and functional specifications on multimodal travel information services would provide enabling conditions for developing such services across the EU. These services could help travellers reduce their carbon footprint through optimised travel (choices) and support a shift to sustainable modes of transport.
Considering the expected increase in freight transport volumes in the years to come and the relatively low modal share of non-road modes at present, there is a need to handle any increase in road freight transport volumes by using energy efficient means of transport and by optimising their operation. Internal market reforms for road haulage, buses and coaches, and hired vehicles would increase efficiency of road transport and reduce fuel consumption. In addition, the adopted internal market reforms for other modes have significant potential for reducing greenhouse gas emissions, in particular by promoting the efficiency and competitiveness of greenhouse gas efficient modes, such as rail, inland waterways and maritime transport (4th railway package, Ports Service Regulation, NAIADES II programme), or by improvement in flight efficiency (Single European Sky 2+).
The EU’s Trans-European Transport Network (TEN-T) policy aims at the development of multimodal core-network corridors, promoting modal shift and sustainable infrastructure and equipment. The second generation of corridor work plans, currently in preparation under the supervision of each European Coordinator, would include the most complex elements of the corridor activity such as measuring the impact on climate change and the promotion of sustainability for instance in urban areas and nodes (e.g. ports). Shifting to sustainable modes like rail transport could also be supported by improving the attractiveness of rail freight corridors. Further simplification of administrative procedures through the use of digital technologies, in particular through the development of an EU maritime single window, the Digital Single Railway Area and the Digital Inland Waterway Area, could also increase the demand for short sea shipping and other sustainable transport modes. In addition, revising the rules for combined transport and improving implementation and enforcement would support shifting long distance road transport to rail, inland waterways or short sea shipping, thus reducing road congestion and greenhouse gas emissions.
Cohesion policy is uniquely suited to catalyse relevant activities in EU regions, while making sure that such action is embedded into the broader context of an integrated development strategy and in line with EU policy objectives. To ensure that transport investments are part of an overarching strategy for the balanced development of a multimodal, seamless door-to-door transport system, the existence of a comprehensive national and regional transport plan is a formal prerequisite for receiving cohesion policy support in the 2014-2020. These transport plans complement and reinforce the strategic framework provided by the TEN-T guidelines and the core network corridor work plans.
4.1.4 Transport fuels in the EU ETS
In its conclusions on the 2030 Climate and Energy Framework, the European Council recalled the possibility for a Member State to include its transport sector in the EU ETS, under current legislation, and on a voluntary basis. The Impact Assessment for the 2030 Climate and Energy Framework
discusses ETS scope expansion in section 7.8. Annex II summarises how road fuel inclusion would work technically, as well as the likely impacts of such inclusion. It would contribute towards reducing emissions in the road transport sector, but to a limited degree, and only once carbon prices were to rise significantly above the current level. Furthermore, impact on environmental integrity in the short term, and the potential implications for carbon price in the longer term, need to be carefully considered. The existing option of voluntary inclusion by individual Member States provides Member States (Article 24 of ETS Directive) who so wish with the flexibility they need to achieve ambitious non ETS targets.
4.1.5 Cross-cutting initiatives
Research, innovation (R&I) and competitiveness are paramount to accelerate the EU energy transition, to address the climate challenge and to reap its benefits in terms of jobs and growth that the Energy union can bring. There is now a need to determine how the transport system could adapt to the decarbonisation challenge while ensuring that increasing mobility needs are met.
Without a comprehensive strategy for research, innovation and competitiveness which brings together supply, demand and regulatory aspects, the EU risks losing its comparative advantage in low carbon solutions as early mover towards decarbonisation, both in terms of supply and innovation and deployment taking place in Europe.
A Communication on the Energy Union's research, innovation and competitiveness strategy, envisaged for November 2016, would provide further details, including on a strategic transport research and innovation agenda (STRIA) and its links with the SET-Plan, especially regarding electro-mobility and alternative fuels. STRIA foresees an integrated approach to Energy Union research, innovation and competitiveness that would focus on the following core priority areas: 1) connectivity and automation of transport; 2) electrification in all modes (e.g. hybrid lorries, hybrid planes, electrical ferries); 3) alternative fuels; 4) vehicle design and manufacturing; 5) transport infrastructure; 6) networks and traffic management systems; 7) smart transport and mobility services.
An important contribution to the reduction of aviation's environmental impacts may come from current research and development actions for innovative “green” technologies, including the development and market deployment of advanced biofuels and hybridisation. EU programmes have mainly covered the modernisation of air traffic management and the reduction of the impact on the environment (Clean Sky). The Single European Sky ATM Research project will contribute to fuel savings and a potential reduction of 50 million tonnes of CO2 emissions.
The wider application of grant funding from CEF, the European Structural and Investment Funds (ESIF) and other EU mechanisms pursuing decarbonisation objectives to privately financed projects ("blending") would help bolster the transport pipeline in more challenging and more sustainable modes of transport and is an effective way to maximise the impact of public resources.
Cross-funding schemes (e.g. the use of road charges, for instance, for the funding of rail projects), the setting of user funds (e.g. future revenues from infrastructure, like ports, airports and toll highways could contribute to such a fund) and revenues from the Eurovignette or the Emission Trading Scheme (e.g. under the so called Innovation and Modernisation Funds) deploying the user/polluter pays principle, may be considered as financing models that complement, in some cases, the available funding for infrastructure. Financial instruments that mitigate risk for private investors, such as demand risks related with the uncertainty on clean vehicles market penetration and risk associated with underlying green assets, are also essential to speed up the transition to low carbon technologies and are being developed in particular under the CEF and the ESIF. The inclusion of sustainable transport within the scope of the green bonds (e.g. the Climate Awareness Bonds, currently issued by the EIB), could be also considered, ensuring that investments supported under this new category respect stringent criteria on environment integrity.
At the TEN-T Days in Rotterdam (20-22 June 2016), an investor's conference has been organised that enabled to gather private investors, project promoters, the EIB and the Commission to stimulate private investments in transport. Dedicated meetings have been organised to liaise promoters of projects in the field of transport and investors – including the EIB. This exercise is part of an effort from the European Institutions to boost investments in transport through more efficient sources of financial support than grants. Projects which could be financed by private investors and/or the EIB – also thanks to the opportunities offered by the EFSI – are researched, identified and preliminarily discussed. An investment platform may be setup later this year, with a focus on sustainable transport, which would offer EFSI instruments for support to investments in, for instance, alternative fuels for buses.
Improving urban mobility has a high potential to reduce the CO2 emissions from transport and high exceedances of air pollutants that are widespread over European urban areas. Sustainable Urban Mobility Plans (SUMPs) help dealing with the complexity of urban mobility which could stimulate a shift towards cleaner and more sustainable transport modes such as public transport, cycling and walking. Effectiveness of such action also depends on specificities of the urban context and requires partnerships between EU institutions, national, regional and municipal authorities (for instance initiatives such as CIVITAS, the Covenant of Mayors, and the Smart Cities & Communities European Innovation Partnership). Synergies may be found e.g. by making SUMPs a pre-condition for receiving EU funding/increasing the co-financing rate and/or combining guidelines on urban access regulation schemes with a common definition of ultra-low emission vehicles, covering both conventional pollutants and CO2 emissions.
New societal developments and behaviour changes have large potential for improving mobility and contributing to decarbonisation, but also represent important question marks for the transport system and existing policy. Integrating the sharing economy and automated and connected vehicles in the existing transport institutional and technical set-up, and making full use of digitalisation, mobility as a service and the potential of active modes, would need to be part of the transport agenda.
4.2 Description of the pathways/scenarios
As indicated in the Impact Assessment accompanying the 2011 White Paper, the policy instruments identified according to the three main pillars: moving towards zero-emission vehicles, low emission alternative energy for transport and efficiency of the transport system are not mutually exclusive; the existence of multiple market failures and strong synergies among policies require the adoption of a combination of individual instruments that complement each other and create a comprehensive policy mix. None of these instruments alone would be capable of tackling in a satisfactory way the decarbonisation objective and only a well-designed policy mix can also maximise the co-benefits of decarbonisation (e.g. reduced congestion which improves productivity and creates more liveable cities). A holistic approach that comprises all elements considered so far is therefore needed.
The modelling exercise undertaken broadly covers the initiatives identified according to the three main pillars (sections 4.1.1-4.1.3), supported by cross-cutting initiatives (section 4.1.5). It provides stylised quantitative assessment of the effectiveness and efficiency of possible initiatives in the policy areas described above, giving illustrative evidence on their relative importance in terms of decarbonisation goal and other co-benefits, on the way they interact and on the intensity of the intervention that is necessary. The Commission has modelled the impact of the possible policy measures assuming a stylised specification – indicated in Annex IV – that does not necessarily correspond to what would actually be proposed at a later stage. As already explained, the precise specification of each policy measure will be done following a more specific analysis and an individual Impact Assessment. In addition, section 4.1.4 and Annex II summarises how road fuel inclusion into EU ETS would work technically, as well as the likely impacts of such inclusion.
The pathways/scenarios for the decarbonisation of transport were identified using a two-step approach. First, two central scenarios have been developed for the overall economy to reach, in addition to the 2020 targets, all the 2030 targets agreed by the October 2014 European Council and the 2050 decarbonisation objectives. The difference between the two central scenarios lies in the level of ambition to be achieved for the energy efficiency goal (27% or 30% primary energy savings in 2030 compared to the 2007 baseline). In order to ensure the consistency of the Commission's initiatives and accompanying analyses, the same central scenarios have been used in impact assessments accompanying proposals for the Effort Sharing Regulation for the period 2021 to 2030 and the revision of the Energy Efficiency Directive.
For transport, they include a cost-effective policy mix that would be needed under the three pillars discussed in sections 4.1.1-4.1.3 (i.e. low- and zero-emission vehicles; low emission alternative energy for transport; efficiency of the transport system) for achieving the 40% reduction in GHG emissions for the overall economy by 2030 and the 30% reduction of non-ETS emissions relative to 2005, while respecting the current policy mix.
In the second step, several more ambitious pathways/scenarios have been considered building on the central scenario reaching 30% energy efficiency. Consequently, all pathways/scenarios envisage action under the three pillars of sections 4.1.1-4.1.3 and have in common a certain number of initiatives. What differentiates them is the intensity of intervention that, depending on the pathway/scenario, is higher in one of the three fields (e.g. low- and zero-emission vehicles; low emission alternative energy for transport; efficiency of the transport system). The pathways/scenarios are also supported by cross-cutting initiatives. A short description of the pathways/scenarios is provided below, complemented by a more detailed description - including their underlining assumptions - in Annex IV.
4.2.1 Central scenarios
The central scenarios (so-called “EUCO27” and “EUCO30”) start from the EU Reference scenario 2016, the difference between them being the level of ambition assumed for the 2030 energy efficiency target (27% or 30%), and the corresponding measures to achieve it. Coordination policies are assumed which enable long term decarbonisation of the economy.
For transport, the European Council scenario with a 27% energy efficiency target for 2030 (EUCO27) considers in the area of low- and zero-emission vehicles: more stringent CO2 standards for cars and light commercial vehicles post-2020 (i.e. reaching 75 gCO2/km for cars and 120 gCO2/km for light commercial vehicles in 2030) and measures leading to improvements in the fuel efficiency of new conventional and hybrid heavy goods vehicles (i.e. 1.5% per year by 2030). The levels of the CO2 standards for light duty vehicles in this scenario and all other scenarios discussed below are defined in terms of current test-cycle. Additionally, under the second pillar identified in section 4.1.2 it assumes the development of infrastructure for alternative powertrains and promotion of alternative fuels for all relevant transport modes, notably renewable fuels that are needed to meet the overall 27% renewables target. In the area of efficiency of the transport system, it covers adopted internal market reforms that have significant potential for reducing greenhouse gas emissions, in particular by promoting the efficiency and competitiveness of greenhouse gas efficient modes, such as rail and waterborne transport (4th railway package, NAIADES II package, ports package), and measures providing correct price signals and gradually reducing disparities in road charging policies on the inter-urban network across the EU (see
Table 1
and Annex IV for a more detailed description).
The 30% energy efficiency central scenario (EUCO30) features all transport measures included in the EUCO27 scenario but considers more stringent CO2 standards for cars and light commercial vehicles post-2020 (i.e. reaching 70 gCO2/km for cars and 110 gCO2/km for light commercial vehicles in 2030). For improving the efficiency of the transport system, it additionally includes a differentiation of infrastructure charges for heavy goods vehicles according to CO2 emissions that could contribute to a faster uptake of more energy-efficient vehicles, plus the deployment of Collaborative Intelligent Transport Systems and eco-driving.
The central scenarios provide the required contribution from transport to achieve the 40% reduction in GHG emissions for the overall economy by 2030 and the 30% reduction of non-ETS emissions relative to 2005. Action would be needed on all three key areas: low- and zero-emission vehicles, low emission alternative energy for transport, and efficiency of the transport system to deliver these emission reductions.
4.2.2 More ambitious pathways/scenarios for low-emission mobility
Five more ambitious pathways in terms of emissions reduction have been established. They all have as a starting point the 30% energy efficiency central scenario (EUCO30), meaning that they include a common set of policy measures acting on the three pillars identified in sections 4.1.1-4.1.3. In addition, each of these pathways assumes additional action in a specific field (see
Table 1
and Annex IV for a more detailed description).
The first pathway/scenario (so-called “VEH”) depicts ambitious vehicle efficiency standards, acting in the low- and zero-emission vehicles area. It assumes very stringent CO2 standards for cars and light commercial vehicles (i.e. reaching 64 gCO2/km for cars and 106 gCO2/km for light commercial vehicles in 2030) as set out by the Commission in its statements during the trialogue discussions for the 2020 targets. It further assumes measures supporting faster improvements in the fuel efficiency of new conventional and hybrid heavy goods vehicles (i.e. 1.6% per year by 2030). These measures are complemented by promotion of public procurement that provides effective incentives to purchase cleaner vehicles. Because of strong focus on vehicle efficiency standards, this pathway also requires large scale deployment of recharging/refuelling infrastructure to support the development of electro-mobility.
The second pathway/scenario is further broken down into two variants, 'A' and 'B', both of which illustrate action on advanced renewable fuels (so-called “BIO-A” and “BIO-B”) and focus on the second pillar (i.e. switching towards low emission alternative energy for transport), supported by cross-cutting initiatives in the area of R&I. The BIO-A scenario includes specific measures (e.g. incorporation/blending obligations on fuel suppliers) for a broader uptake of advanced renewable fuels (including biomethane and biokerosene as well as renewable fuels of non-organic origin), while no additional support applies to food-based biofuels. The share of food-based biofuels in liquid and gaseous fuels is very gradually reduced during 2020-2030 and phased out by 2050. In scenario BIO-B the total level of biofuels is kept equal to that in the 30% energy efficiency central scenario (EUCO30), while reducing the contribution that food-based biofuels make to the overall share in liquid and gaseous fuels to 0% in 2030 and beyond. The BIO-B scenario, also includes specific measures (e.g. incorporation/blending obligations on the fuel suppliers) for the uptake of advanced renewable fuels (including biomethane and biokerosene as well as renewable fuels of non-organic origin).
The third pathway/scenario assume advanced research and innovation in electro-mobility (so-called “TECH”), focusing on the second pillar (i.e. switching towards low emission alternative energy for transport). The TECH scenario is designed to show the effect of policies that emphasise the rapid deployment of new powertrains, mainly supported by cross-cutting initiatives in the area of advanced research and innovation in electro-mobility.
The fourth and fifth pathways/scenarios focus on improving the efficiency of the transport system supported by cross-cutting initiatives to be undertaken by Member States for improving urban mobility, and measures in the field of taxation. The so-called “MOBI” scenario includes a more ambitious pathway than EUCO30 scenario for providing correct price signals and internalising local externalities on the inter-urban network, plus ambitious deployment of Collaborative Intelligent Transport Systems and measures promoting efficiency improvements and multimodality (e.g. review of the Combined Transport Directive, review of the Rail Freight Corridors Regulation, review of market access rules for road transport). In addition, is assumes soft measures supporting urban policies that curb pollutant emissions. The MOBI-TAX scenario covers all measures included in the MOBI scenario, plus an alignment of the EU minimum tax rates of petrol and gas oil used as motor fuels for removing the price advantage for diesel.
Table 1: Summary of pathways/scenarios for low-emission mobility
|
Scenarios
|
Main features
|
|
Central scenarios
|
|
European Council scenario with a 27% energy efficiency target for 2030 (EUCO27)
|
Reaching all the 2030 targets agreed by the October 2014 European Council with 27% primary energy consumption reduction by 2030. For transport, the main assumptions relate to:
•
More stringent CO2 standards for cars and light commercial vehicles post-2020; measures leading to improvements in the fuel efficiency of new conventional and hybrid heavy goods vehicles.
•
Development of infrastructure for alternative powertrains (including electricity, hydrogen and LNG) for all relevant transport modes; promotion of alternative fuels for all relevant modes driven by incentives for biofuels and CO2 standards for electrification; food-based biofuels respect the 7% cap of ILUC Directive in 2020 and their growth post-2020 is not going beyond the cap.
•
Measures improving efficiency/reducing emissions of all transport modes: measures adopted after the cut-off date of Reference scenario 2016 and a gradual approach towards the internalisation of local externalities on the inter-urban network.
|
|
30% energy efficiency central scenario (EUCO30)
|
As EUCO27 but with 30% primary energy consumption reduction by 2030. For transport, the main differences relative to EUCO27 relate to:
•More stringent CO2 standards for cars and light commercial vehicles relative to EUCO27.
•Modulation of infrastructure charges according to CO2 emissions for heavy goods vehicles.
•Deployment of Collaborative Intelligent Transport Systems and eco-driving.
|
|
More ambitious pathways/scenarios
|
|
Ambitious vehicle efficiency standards - (VEH scenario)
|
As EUCO30 scenario but additionally driven by:
•Very stringent CO2 standards for light duty vehicles (cars and light commercial vehicles), leading to faster deployment of more fuel efficient ICE vehicles and deployment of alternative powertrains;
•Measures leading to faster improvements in the fuel efficiency of new conventional and hybrid heavy goods vehicles;
•Promotion of public procurement that provides effective incentives for purchasing cleaner vehicles.
|
|
Action on advanced renewable fuels (BIO-A and BIO-B scenarios)
|
BIO-A scenario: as EUCO30 scenario but assuming action for a broader uptake of advanced renewable fuels and specific incentives for biokerosene and biomethane. No additional support applies to food-based biofuels; their share in liquid and gaseous fuels is very gradually reduced during 2020-2030 and is phased out by 2050.
BIO-B scenario: as EUCO30 scenario but assuming action for a broader uptake of advanced renewable fuels, and specific incentives for biokerosene and biomethane; the contribution food-based biofuels make to the overall share of biofuels in liquid and gaseous fuels is phased out from 2020 levels to 0% in 2030 and beyond.
|
|
Advanced research and innovation in electro-mobility (TECH scenario)
|
As EUCO30 scenario but assuming lower technology costs (e.g. for electric vehicle component costs and fuel cells) due to higher R&D investments.
|
|
Focus on efficiency of the transport system (MOBI scenario)
|
As EUCO30 scenario but additionally driven by a range of measures acting on transport demand and leading to improvements in energy efficiency and transport system efficiency, supported by other cross-cutting initiatives. Covering:
•Full internalisation of local externalities on the inter-urban network and modulation of infrastructure charges according to CO2 emissions;
•Ambitious deployment of Collaborative Intelligent Transport Systems;
•Measures promoting efficiency improvements and multimodality;
•Measures promoting urban policies that curb pollutant emissions.
|
|
Focus on efficiency of the transport system and fuel taxation (MOBI-TAX scenario)
|
As MOBI scenario but assuming measures in the field of fuel taxation (i.e. alignment of the EU minimum tax rates of petrol and gas oil used as motor fuels).
|
4.3 Analysis of impacts of the pathways/scenarios
4.3.1 Moderation of energy demand
The impacts of the decarbonisation pathways/scenarios are analysed in terms of energy efficiency (i.e. achievements in energy savings and improvements in energy intensity) and effects on the fuel mix. The effects of higher penetration of electric vehicles on power generation system are also briefly discussed.
Increasing energy efficiency
Energy demand in transport declines in all decarbonisation pathway/scenarios relative to the Reference scenario (REF2016), resulting in total savings of 16 to 29 Mtoe in 2030 (82 to 86 Mtoe in 2050). It has to be stressed that these savings are achieved despite the growth in transport activity in all scenarios and throughout the projection period. More than 80% of these savings originate from passenger transport, due to higher potential for improvements in energy efficiency and electrification in this segment, and policies promoting multimodality and the competitiveness of more sustainable transport modes (see
Table 2
).
EUCO27 and EUCO30 scenarios show energy savings in passenger transport of 14 to 17 Mtoe in 2030 relative to REF2016. Higher savings in EUCO30 are driven by more stringent CO2 standards for light duty vehicles (LDVs) post-2020, complemented by the deployment of Collaborative Intelligent Transport Systems (C-ITS) and enforcement of eco-driving. The highest savings are projected in VEH scenario (about 25 Mtoe) due to the most stringent vehicle efficiency standards (i.e. 64gCO2/km for cars and 97gCO2/km for vans in 2030) among scenarios, supported by public procurement that provides incentives to purchase cleaner and more fuel efficient vehicles. A large part of the benefit is attained after 2030 as the renewal of the fleet takes place only gradually over time.
Table 2: Energy savings of passenger and freight transport relative to Reference scenario 2016 (in Mtoe)
|
Energy savings (difference to REF2016 in Mtoe)
|
REF2016 *
|
EUCO27
|
EUCO30
|
|
|
2030
|
2050
|
2030
|
2050
|
2030
|
2050
|
|
Transport - total
|
341
|
355
|
-16
|
-82
|
-20
|
-83
|
|
Passenger transport
|
246
|
252
|
-14
|
-72
|
-17
|
-72
|
|
Freight transport
|
96
|
103
|
-2
|
-10
|
-3
|
-11
|
|
Energy savings (difference to REF2016 in Mtoe)
|
VEH
|
BIO-A
|
BIO-B
|
|
|
2030
|
2050
|
2030
|
2050
|
2030
|
2050
|
|
Transport - total
|
-29
|
-86
|
-21
|
-84
|
-22
|
-84
|
|
Passenger transport
|
-25
|
-72
|
-18
|
-72
|
-19
|
-72
|
|
Freight transport
|
-4
|
-13
|
-3
|
-11
|
-3
|
-11
|
|
Energy savings (difference to REF2016 in Mtoe)
|
TECH
|
MOBI
|
MOBI-TAX
|
|
|
2030
|
2050
|
2030
|
2050
|
2030
|
2050
|
|
Transport - total
|
-22
|
-86
|
-22
|
-84
|
-25
|
-85
|
|
Passenger transport
|
-19
|
-74
|
-19
|
-72
|
-20
|
-73
|
|
Freight transport
|
-3
|
-12
|
-4
|
-11
|
-5
|
-12
|
Source: PRIMES-TREMOVE transport model (ICCS-E3MLab)
Note: * For REF2016 energy demand for 2030 and 2050 is provided in Mtoe.
For freight transport, EUCO27 and EUCO30 would lead to about 2 to 3 Mtoe energy savings in 2030. Slightly higher savings in EUCO30 are driven by the modulation of infrastructure charges for heavy goods vehicles according to CO2 emissions, deployment of C-ITS and eco-driving. MOBI, VEH and MOBI-TAX scenarios result in higher savings (4 to 5 Mtoe), achieved however through different policy instruments. In VEH, measures leading to faster improvements in fuel efficiency of new conventional and hybrid heavy goods vehicles result in additional savings of almost 2 Mtoe in 2030 relative to EUCO30.
For both passenger and freight transport, MOBI scenario achieves additional savings to EUCO30 of about 2 Mtoe thanks to full internalisation of local externalities, more intensive measures promoting transport system efficiency improvements and multimodality, ambitious deployment of C-ITS and support for multimodal travel information. The alignment of the EU minimum tax rates of petrol and gas oil in MOBI-TAX, in addition to all measures assumed in MOBI, yields further energy savings in freight and passenger transport of about 2 Mtoe relative to MOBI scenario in 2030; for freight this is particularly effective because fuel costs including taxation represent almost 30% of the total road freight costs and their minimisation is among the main objectives of heavy goods vehicles manufacturers and fleet operators.
EUCO27 and EUCO30 scenarios are projected to result in significant improvements in energy intensity of passenger transport by 2030, of 34-35% compared to 2010, while VEH would deliver almost 37% reduction (see
Table 3
). The rather limited difference between VEH and EUCO30 by 2030 (2 percentage points), despite very stringent vehicle efficiency standards assumed in VEH, can be explained by the fact that standards apply only to new vehicles and by the renewal of the fleet which takes place only gradually over time. A large part of the benefit is attained after 2030.
Table 3: Change in energy intensity of passenger and freight transport for 2010-2030 and 2010-2050 (in %)
|
Energy intensity (% change to 2010)
|
REF2016
|
EUCO27
|
EUCO30
|
|
|
'10-'30
|
'10-'50
|
'10-'30
|
'10-'50
|
'10-'30
|
'10-'50
|
|
Passenger (toe/Mpkm)
|
-30.2%
|
-40.3%
|
-33.9%
|
-56.3%
|
-34.9%
|
-56.5%
|
|
Freight (toe/Mtkm)
|
-17.2%
|
-24.2%
|
-18.9%
|
-31.2%
|
-19.5%
|
-32.0%
|
|
Energy intensity (% change to 2010)
|
VEH
|
BIO-A
|
BIO-B
|
|
|
'10-'30
|
'10-'50
|
'10-'30
|
'10-'50
|
'10-'30
|
'10-'50
|
|
Passenger (toe/Mpkm)
|
-36.9%
|
-56.5%
|
-35.0%
|
-56.6%
|
-35.1%
|
-56.5%
|
|
Freight (toe/Mtkm)
|
-21.1%
|
-33.6%
|
-19.6%
|
-32.0%
|
-19.7%
|
-32.0%
|
|
Energy intensity (% change to 2010)
|
TECH
|
MOBI
|
MOBI-TAX
|
|
|
'10-'30
|
'10-'50
|
'10-'30
|
'10-'50
|
'10-'30
|
'10-'50
|
|
Passenger (toe/Mpkm)
|
-35.5%
|
-57.3%
|
-34.9%
|
-56.6%
|
-34.9%
|
-56.6%
|
|
Freight (toe/Mtkm)
|
-19.6%
|
-32.3%
|
-19.9%
|
-32.2%
|
-20.3%
|
-32.6%
|
Source: PRIMES-TREMOVE transport model (ICCS-E3MLab)
For freight transport, the highest improvements in energy intensity by 2030 are also expected in VEH scenario (about 21%) but large improvements relative to the REF2016 are already achieved in EUCO27 and EUCO30 (around 19-20%). A graphical illustration of energy savings of passenger and freight transport relative to REF2016 and of changes in energy intensity of passenger and freight transport is provided in
Figure 5
.
Figure 5: Energy savings relative to Reference scenario 2016, in Mtoe (left side) and change in energy intensity for 2010-2030 and 2010-2050, in % (right side)


Source: PRIMES-TREMOVE transport model (ICCS-E3MLab)
Impact on the fuel mix
Alternative fuels and energy carriers are projected to gain an increasing share in the energy used in transport in all decarbonisation pathways/scenarios, providing about 15-17% of energy demand by 2030 (see
Figure 6
). Alternative fuels are defined in line with the Directive 2014/94/EU. BIO-A shows the highest share of alternative fuels by 2030, due to strong incentives for the uptake of advanced renewable fuels, followed by VEH where very stringent CO2 standards for light duty vehicles supported by large scale deployment of recharging/refuelling infrastructure and incentives for public procurement that lead to faster development of electro-mobility play an important role. The TECH scenario shows a rather similar share to VEH, thanks to advanced research and innovation in electro-mobility (battery electric and fuel cell electric vehicles) that reduce the costs of these alternative powertrains and enable faster deployment. BIO-B results in a somewhat lower share of alternative fuels than BIO-A (around 16%), because of the complete phase out of food-based biofuels by 2030 assumed in this scenario. However, due to very strong incentives, it results in a higher share of advanced renewable fuels than BIO-A. Overall, the penetration of alternative fuels in the energy mix by 2030 is moderate due to the fact that additional measures relative to REF2016 are only assumed post-2020 and also because the renewal of the vehicle stock takes time.
The share of diesel use in transport goes down by 1 to 3 percentage points by 2030 relative to REF2016, while the share of gasoline by around 2 percentage points. The lowest share of diesel is visible in VEH scenario, due to very stringent vehicle efficiency standards, and also in MOBI-TAX which assumes higher taxation of diesel compared to the current levels. Jet fuels slightly increase their share (by about one percentage point), as air transport activity continues to grow strongly by 2030. In addition, no alternative fuel options are available in the short to medium term except for the BIO-A and BIO-B scenarios where strong incentives lead to uptake of biokerosene; thus these scenarios show the lowest increase in fossil jet fuels (0.3 percentage points) relative to REF2016.
By 2050, similar levels of alternative fuels (around 59-61% by 2050) are achieved in all pathways/scenarios due to the large scale electrification of the light duty vehicle fleet and the large scale deployment of advanced renewables fuels necessary for decarbonisation; this is accompanied by significant decline in the use of diesel, gasoline and jet fuels (see
Figure 51
, in Annex IV). The scale of electrification of the fleet is similar in all pathways/scenarios because the same CO2 standards for LDVs are assumed in the long term (i.e. 25gCO2/km for cars and 60gCO2/km for vans in 2050).
Figure 6: Final energy demand in transport by fuel in 2030 (in % of total)
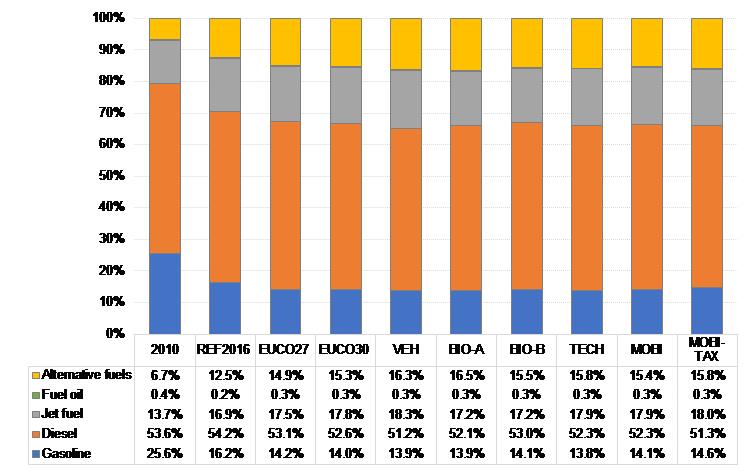
Source: PRIMES-TREMOVE transport model (ICCS-E3MLab)
Focusing on alternative fuels and energy carriers, electricity demand is projected to show the highest increase in 2030 relative to REF2016, gaining 0.9-2 percentage points in terms of energy use in transport (see
Figu
re 7
). VEH shows the largest uptake of electricity in 2030 (4.5% of energy demand in transport), followed by TECH (about 4%). However, significant increase relative to REF2016 is already achieved in EUCO27 and EUCO30 (0.9-1.2 percentage points increase in its share) due to stringent vehicle efficiency standards supported by the deployment of recharging infrastructure. Electricity would provide 3.2% of energy use in road transport in VEH and 2.6% in TECH scenario, and about 70% of energy use in rail in all decarbonisation pathways/scenarios by 2030. Hydrogen also shows an increasing share by 2030 relative to REF2016, gaining 0.2-0.5 percentage points in energy use in transport. The highest uptake takes place in TECH scenario where it provides about 0.5% of energy demand by 2030.
Figure 7: Alternative fuels and energy carriers in transport in 2030 (in % of total energy demand)

Source: PRIMES-TREMOVE transport model (ICCS-E3MLab)
Natural gas, in particular liquefied natural gas (LNG), would gain 0.8-1.3 additional percentage points in terms of share in energy demand by 2030, relative to REF2016. LNG is projected to provide about 6-8% of fuels used in heavy goods vehicles and about 4% of fuels used in inland navigation. This is due to the internalisation of local externalities that push for the use of less polluting fuels and to the NAIADES II package for inland navigation, supported by the availability of refuelling infrastructure, present in all pathways/scenarios. Measures promoting urban policies that curb pollutant emissions provide an additional incentive in MOBI and MOBI-TAX scenarios. Natural gas shows the highest increase in MOBI-TAX due to the rise in the diesel tax rates relative to current levels and the lowest increase in the BIO-A and BIO-B scenarios where the more prominent share of liquid and gaseous biofuels (including biomethane) leaves smaller space for other alternative fuels. Uptake of LNG would also take place in international shipping, especially in the short sea shipping segment, providing about 9% of overall bunker fuels by 2030. Compressed natural gas in public road transport slightly increases its share and would represent about 2-3% of energy use by 2030. Liquefied petroleum gas is projected to maintain a rather stable share (2.2-2.3% of energy demand), only 0.1-0.2 percentage points higher than in REF2016 across all scenarios by 2030.
Overall, the highest share of alternative fuels in transport energy demand by 2030 originates from liquid biofuels. Their share increases only slightly from about 6% in REF2016 to 6.2% in EUCO27 and EUCO30 scenarios in which the 27% renewables target is met in 2030. In the BIO-A scenario this share increases to 7.2% due to strong support for advanced renewable fuels while no additional support is provided for food-based biofuels. In the BIO-B scenario the share of liquid biofuels is similar to REF2016 because of the complete phase out of food-based biofuels by 2030. However, due to strong incentives for advanced renewable fuels, the share of these fuels is higher than in BIO-A. Other decarbonisation scenarios/pathways show similar share as EUCO30.
Gaseous biofuels (i.e. biomethane used in road freight, shipping) show somewhat higher share in energy demand by 2030 (about 0.2%) in all decarbonisation pathways/scenarios, except for BIO-A and BIO-B scenarios where they achieve a 0.6% share due to strong support for their uptake. Gaseous biofuels start from a very low base in the Reference scenario.
In terms of share in liquid and gaseous transport fuels, liquid and gaseous biofuels combined represent about 6.2% in REF2016 and 6.6% in EUCO27 and EUCO30 scenarios. However, the absolute amounts remain stable at around 21 Mtoe, the increased share in the EUCO scenarios reflecting the energy efficiency developments in transport. In the BIO-A scenario liquid and gaseous biofuels provide around 8% (25 Mtoe) of total liquid and gaseous transport fuels in 2030, while in BIO-B they remain close to their level in the EUCO scenarios at 21 Mtoe (6.9% of total liquid and gaseous transport fuels). Other decarbonisation scenarios/pathways show similar shares as EUCO30 also when expressed in terms of total liquid and gaseous transport fuels.
In the long term, to meet the very ambitious decarbonisation objectives by 2050, electricity and advanced renewable fuels (mostly advanced biofuels) gain significant market shares while the use of natural gas and liquefied petroleum gas goes down; hydrogen also grows significantly beyond post-2030 albeit maintaining a limited share (see
Figure 52
, in Annex IV). The share of biofuels in liquid and gaseous transport fuels reaches around 46% in all scenarios by 2050 (36-37% of total transport energy demand) - reflecting the crucial role of biofuels in transport decarbonisation – especially in modes that cannot be electrified.
Impact on the power generation system
The share of electricity in road transport energy demand increases in all decarbonisation pathways/ scenarios, to 2-3% by 2030 and 18-19% by 2050 (see
Figure 8
). Overall, developments in electro-mobility and further electrification of rail transport result in additional electricity demand of 3-6 Mtoe in 2030 and 29-30 Mtoe in 2050 relative to REF2016.
The additional electricity demand from transport in the decarbonisation pathways/scenarios is counterbalanced by a reduction of demand in sectors where energy efficiency has untapped potential (e.g. electricity consumption of appliances). In EUCO27 and EUCO30 scenarios, for which the entire energy system has been modelled, the total electricity demand is decreasing in 2030 perspective, compared to REF2016. Consequently, the possible negative impacts from a strong increase of electricity demand do not manifest themselves. For example, in EUCO30, where higher energy efficiency improvements take place in other demand sectors and policies affect the power generation sector (i.e. renewables policies and the EU ETS), electricity price would be roughly the same as in the Reference scenario by 2030, despite somewhat higher electricity demand in transport.
Smart charging of car batteries helps smoothing the load curve which in turn lowers prices of electricity. A study by Eurelectric confirms that the current power generation system could cope with the resulting increase in electricity demand of large-scale electrification of transport provided that smart charging systems are widely applied. On the other hand, uncoordinated recharging concentrated in evening hours and in certain residential areas could cause considerable demand hikes, cost problems and even a strain for the power system.
Figure 8: Share of electricity in road transport energy demand (in %) and total electricity demand in transport (in Mtoe)


Source: PRIMES-TREMOVE transport model (ICCS-E3MLab)
In order to accommodate high penetration of electric vehicles, the power sector needs to undergo considerable transformation and look into new business models. Transport electrification is the first challenge but transformation toward smart systems will also be required to accommodate more broadly conceived demand side response.
4.3.2 Energy security
By 2030, total oil products used in transport are projected to decrease by 26 to 41 Mtoe in 2030 (7-11%) relative to REF2016, thanks to policies supporting the energy efficiency improvements, the uptake of alternative fuels and the efficiency of the transport system. This is equivalent to a reduction of 51 to 67 Mtoe (13-17%) compared to 2010 levels (see
Tab
le 4
).
EUCO27 and EUCO30 show about 26 to 31 Mtoe decrease in the use of oil products relative to REF2016 (51 to 56 Mtoe of 2010 levels), while the highest reduction would be achieved in the VEH, MOBI-TAX and BIO-A scenarios by 2030 (see
Figure 9
). In VEH and MOBI-TAX energy savings and electro-mobility play a significant role in reducing the oil dependency in transport; in BIO-A the uptake of advanced renewable fuels is also an important contributing factor.
Oil dependency in the decarbonisation pathways/scenarios is expected to decrease by 3-4 percentage points relative to REF2016 or 8-9 percentage points compared to 2010 levels. However, transport sector will remain heavily dependent on oil by 2030: oil products would still represent 86-87% of the EU transport sector needs (see
Table 4
) – compared to 94% today – despite the significant reductions achieved in absolute levels. This shows that the uptake of alternative fuels and energy carriers takes time, in particular due to the gradual replacement of the vehicle stock. Nevertheless, to certain extent this also shows the limits of this indicator in reflecting properly the energy savings achieved thanks to energy efficiency improvements.
Table 4: Oil products used in transport
|
Oil products used in transport
|
REF2016 *
|
EUCO27
|
EUCO30
|
|
|
2030
|
2050
|
2030
|
2050
|
2030
|
2050
|
|
Total oil products (incl. bunker fuels)
|
|
|
|
|
|
|
|
- difference to REF2016 (in Mtoe)
|
365
|
368
|
-26
|
-196
|
-31
|
-196
|
|
- % change to REF2016
|
|
|
-7%
|
-53%
|
-8%
|
-53%
|
|
- difference to 2010 (in Mtoe)
|
|
|
-51
|
-218
|
-56
|
-218
|
|
- % change to 2010
|
|
|
-13%
|
-56%
|
-14%
|
-56%
|
|
Oil dependency in transport
|
|
|
|
|
|
|
|
- p.p. difference to REF2016
|
90%
|
86%
|
-3
|
-36
|
-3
|
-36
|
|
- p.p. difference to 2010
|
|
|
-8
|
-45
|
-8
|
-45
|
|
Oil products used in transport
|
VEH
|
BIO-A
|
BIO-B
|
|
|
2030
|
2050
|
2030
|
2050
|
2030
|
2050
|
|
Total oil products (incl. bunker fuels)
|
|
|
|
|
|
|
|
- difference to REF2016 (in Mtoe)
|
-41
|
-197
|
-35
|
-195
|
-32
|
-194
|
|
- % change to REF2016
|
-11%
|
-54%
|
-10%
|
-53%
|
-9%
|
-53%
|
|
- difference to 2010 (in Mtoe)
|
-67
|
-219
|
-61
|
-217
|
-58
|
-216
|
|
- % change to 2010
|
-17%
|
-56%
|
-16%
|
-56%
|
-15%
|
-55%
|
|
Oil dependency in transport
|
|
|
|
|
|
|
|
- p.p. difference to REF2016
|
-4
|
-36
|
-4
|
-35
|
-3
|
-35
|
|
- p.p. difference to 2010
|
-9
|
-45
|
-9
|
-44
|
-8
|
-44
|
|
Oil products used in transport
|
TECH
|
MOBI
|
MOBI-TAX
|
|
|
2030
|
2050
|
2030
|
2050
|
2030
|
2050
|
|
Total oil products (incl. bunker fuels)
|
|
|
|
|
|
|
|
- difference to REF2016 (in Mtoe)
|
-34
|
-200
|
-33
|
-196
|
-36
|
-198
|
|
- % change to REF2016
|
-9%
|
-54%
|
-9%
|
-53%
|
-10%
|
-54%
|
|
- difference to 2010 (in Mtoe)
|
-59
|
-222
|
-58
|
-218
|
-61
|
-220
|
|
- % change to 2010
|
-15%
|
-57%
|
-15%
|
-56%
|
-16%
|
-56%
|
|
Oil dependency in transport
|
|
|
|
|
|
|
|
- p.p. difference to REF2016
|
-3
|
-37
|
-3
|
-36
|
-3
|
-36
|
|
- p.p. difference to 2010
|
-8
|
-46
|
-8
|
-45
|
-8
|
-45
|
Source: PRIMES-TREMOVE transport model (ICCS-E3MLab). Note: * For REF2016 the total oil products (including bunker fuels) in Mtoe and the oil dependency in transport are reported for 2030 and 2050. In 2010, around 390 Mtoe oil products were used in transport (including bunker fuels) which represented about 95% of transport sector energy needs.
In the long term, significant reductions in oil products used in transport (194 to 200 Mtoe in 2050 relative to REF2016) and oil dependency are projected in all decarbonisation pathways/scenarios. By 2050, oil products would represent about 49-51% of the EU transport sector needs.
Decrease of oil use in transport is of key importance for the reduction of the fossil fuel import bill and reinforcing security of supply.
Figure 9: Oil products used in transport (difference to REF2016, in Mtoe) and oil dependency (in %)


Source: PRIMES-TREMOVE transport model (ICCS-E3MLab)
4.3.3 Decarbonisation
The contribution of pathways/scenarios to achieving low-emission mobility is assessed in terms of tank to wheel CO2 emissions. Additionally, the impacts on well to wheel CO2 emissions are provided. The role of transport activity, energy intensity and CO2 intensity in the tank to wheel CO2 emissions reductions is shown through a decomposition analysis.
CO2 emissions (tank to wheel)
As explained in section 4.2.1, the central scenarios (EUCO27 and EUCO30) have been developed to reach all the 2030 targets agreed by the October 2014 European Council, while also achieving 2020 GHG and renewables targets. These scenarios show cost-effective emissions reductions of: 18-19% for transport, 38-43% for residential and tertiary (mainly buildings), 35-37% for industry and 29-35% for non-CO2 sectors (mainly agriculture and waste) by 2030 relative to 2005. For transport, this outcome is in line with the 2011 White Paper which established a milestone of 20% emissions reduction by 2030 relative to 2008 levels, equivalent to 19% emissions reduction on 2005 levels, and with the 2050 decarbonisation objectives.
In EUCO27 and EUCO30 the highest emissions reductions are projected in passenger road transport (about 10-12% in 2030 and 74% in 2050 compared to the Reference scenario), driven by more stringent CO2 standards for light duty vehicles (see
Table 5
). This is equivalent to emissions cuts of about 30-32% by 2030 (around 81% by 2050) relative to 2005 (see
Table 25
, in Annex IV). CO2 emissions from road freight are also expected to go down (about 3-4% in 2030 relative to REF2016; 3-4% for 2005-2030), thanks to measures improving fuel efficiency of new conventional and hybrid heavy goods vehicles, higher uptake of LNG, plus road pricing and modulation of infrastructure charges according to CO2 emissions that lead to faster renewal of the fleet. Extensive hybridisation of the vehicle fleet and uptake of advanced renewable fuels, complemented by deployment of C-ITS and eco-driving, result in 51-52% emissions cuts in road freight by 2050 relative to 2005, despite growing transport activity (47-48% for 2005-2050).
Table 5: CO2 emissions reduction by mode relative to the EU Reference scenario 2016 in 2030 and 2050 (in %)
|
CO2 emissions (% change to REF2016)
|
REF2016 *
|
EUCO27
|
EUCO30
|
|
|
2030
|
2050
|
2030
|
2050
|
2030
|
2050
|
|
Transport - total
|
943
|
953
|
-6.3%
|
-62.6%
|
-7.8%
|
-62.6%
|
|
Passenger transport
|
682
|
679
|
-7.5%
|
-66.5%
|
-9.3%
|
-66.4%
|
|
Road
|
504
|
481
|
-9.8%
|
-73.6%
|
-12.4%
|
-73.9%
|
|
Rail
|
1
|
1
|
3.5%
|
-42.8%
|
3.4%
|
-42.9%
|
|
Aviation
|
173
|
193
|
-1.0%
|
-49.5%
|
-0.5%
|
-48.3%
|
|
Inland navigation
|
4
|
4
|
3.0%
|
-38.3%
|
2.8%
|
-38.4%
|
|
Freight transport
|
261
|
274
|
-3.0%
|
-52.9%
|
-3.8%
|
-53.5%
|
|
Road
|
242
|
257
|
-3.4%
|
-53.7%
|
-4.3%
|
-54.4%
|
|
Rail
|
6
|
3
|
0.5%
|
-43.1%
|
0.5%
|
-43.1%
|
|
Inland navigation
|
13
|
14
|
2.9%
|
-38.8%
|
2.9%
|
-38.8%
|
|
CO2 emissions (% change to REF2016)
|
VEH
|
BIO-A
|
BIO-B
|
|
|
2030
|
2050
|
2030
|
2050
|
2030
|
2050
|
|
Transport - total
|
-11.2%
|
-63.0%
|
-9.5%
|
-62.4%
|
-8.5%
|
-62.3%
|
|
Passenger transport
|
-13.3%
|
-66.3%
|
-10.8%
|
-65.8%
|
-10.0%
|
-65.7%
|
|
Road
|
-17.9%
|
-73.8%
|
-13.1%
|
-73.4%
|
-12.0%
|
-73.3%
|
|
Rail
|
3.4%
|
-42.9%
|
2.3%
|
-41.9%
|
4.4%
|
-41.7%
|
|
Aviation
|
-0.5%
|
-48.3%
|
-4.3%
|
-47.5%
|
-4.5%
|
-47.4%
|
|
Inland navigation
|
3.0%
|
-38.4%
|
1.9%
|
-36.9%
|
3.4%
|
-36.7%
|
|
Freight transport
|
-5.9%
|
-54.8%
|
-6.1%
|
-53.9%
|
-4.8%
|
-53.8%
|
|
Road
|
-6.5%
|
-55.8%
|
-6.7%
|
-55.0%
|
-5.4%
|
-54.8%
|
|
Rail
|
0.4%
|
-43.1%
|
-0.4%
|
-42.6%
|
1.1%
|
-42.4%
|
|
Inland navigation
|
2.8%
|
-38.8%
|
2.1%
|
-37.5%
|
3.8%
|
-37.4%
|
|
CO2 emissions (% change to REF2016)
|
TECH
|
MOBI
|
MOBI-TAX
|
|
|
2030
|
2050
|
2030
|
2050
|
2030
|
2050
|
|
Transport - total
|
-8.8%
|
-63.8%
|
-8.5%
|
-62.7%
|
-9.3%
|
-63.0%
|
|
Passenger transport
|
-10.6%
|
-67.8%
|
-9.8%
|
-66.4%
|
-10.3%
|
-66.5%
|
|
Road
|
-14.2%
|
-75.9%
|
-13.0%
|
-73.9%
|
-13.6%
|
-74.1%
|
|
Rail
|
3.3%
|
-43.0%
|
4.0%
|
-42.6%
|
3.8%
|
-43.4%
|
|
Aviation
|
-0.5%
|
-48.2%
|
-0.8%
|
-48.4%
|
-1.0%
|
-48.4%
|
|
Inland navigation
|
2.8%
|
-38.6%
|
3.6%
|
-38.2%
|
1.7%
|
-38.7%
|
|
Freight transport
|
-4.0%
|
-53.9%
|
-5.3%
|
-53.6%
|
-6.7%
|
-54.2%
|
|
Road
|
-4.5%
|
-54.8%
|
-5.9%
|
-54.5%
|
-7.4%
|
-55.1%
|
|
Rail
|
0.5%
|
-43.1%
|
1.1%
|
-42.9%
|
0.3%
|
-44.4%
|
|
Inland navigation
|
2.9%
|
-38.9%
|
4.3%
|
-38.9%
|
4.2%
|
-38.9%
|
Source: PRIMES-TREMOVE transport model (ICCS-E3MLab)
Note: * CO2 emissions levels in REF2016 for 2030 and 2050 are reported in million tonnes.
Air transport emissions would decrease by about 1% relative to REF2016 in 2030, thanks to higher ETS prices in EUCO27 (42 €/tCO2) and shifts towards rail in both EUCO27 and EUCO30, supported by specific measures (i.e. 4th railway package). However, relative to 2005, emissions are still expected to go up (14-15% by 2030) due to high growth (79-80%) in total air traffic (domestic, international intra-EU and extra-EU). By 2050, emissions are projected to decrease by 34-35% relative to 2005 driven by strong efficiency improvements and the uptake of advanced renewable fuels triggered by higher ETS prices. Yet, emissions reductions achieved in aviation would be the lowest among the inland modes due to strong increase in activity.
Rail and inland navigation show some low rise in emissions by 2030 compared to the Reference scenario because adopted internal market reforms increase their competitiveness and shift traffic away from road (i.e. transport activity of rail and inland navigation increases relative to REF2016). However, they are still expected to display the highest emissions reductions among modes over time (about 33% decrease for 2005-2030 for passenger rail, 18% for freight rail and 23% for freight inland navigation). In addition, they contribute a low share of transport emissions (below 3% of total emissions excluding maritime bunkers in 2030). Strong emissions reductions in these modes are expected to take place by 2050 compared to 2005 (80% for passenger rail, 76% for freight rail and 50% for inland navigation), facilitated by further electrification of rail and the uptake of LNG and advanced renewable fuels in inland navigation.
The more ambitious pathways/scenarios are expected to deliver some 9-11% emissions reductions in 2030 relative to REF2016 (see
Table 5
); this is equivalent to 20-22% cuts compared to 2005 level (see
Table 6
, and
Table 25
in Annex IV). The highest reduction would be achieved in VEH (about 11% relative to REF2016), driven by the most stringent CO2 emissions standards for light duty vehicles among scenarios and measures improving the fuel efficiency of new conventional and hybrid heavy goods vehicles, supported by incentives for public procurement. The BIO-A scenario shows around 10% decrease relative to REF2016 (about 21% for 2005-2030) due to strong incentives for the uptake of advanced renewable fuels while no additional support is provided to food-based biofuels. BIO-B results in somewhat lower emissions reductions (about 9% decrease relative to REF2016; 20% for 2005-2030) because the overall share of biofuels is lower in this scenario relative to BIO-A (i.e. due to the complete phase out of food-based biofuels by 2030). It should be noted, however, that the modelling assigns tank to wheel emissions of zero to all biofuels. Well to wheel CO2 emissions are discussed in a following section. MOBI and MOBI-TAX scenarios also show higher emissions reductions (about 9% relative to REF2016) than EUCO30, thanks to full internalisation of local externalities on the inter-urban network, more intensive policies promoting efficiency improvements in the transport system and multimodality (e.g. review of the Combined Transport Directive, review of the Rail Freight Corridors Regulation, review of market access rules for road transport) and alignment of the EU minimum tax rates of petrol and gas oil (in MOBI-TAX). TECH scenario achieves rather similar emissions reductions to MOBI, mostly as an effect of faster electrification of light duty vehicles fleet supported by advanced research and innovation in electro-mobility, which lowers the costs of alternative powertrains. Emissions from passenger and freight road transport in the more ambitious pathways/scenarios go down by 32-37% and 4-7% by 2030 relative to 2005, respectively (80-82% emission reductions for passenger road transport and 52-53% for road freight for 2005-2050).
Table 6: CO2 emissions reduction by mode for 2005-2030 and 2005-2050 relative to the Reference scenario 2016 (percentage points difference in growth rates)
|
CO2 emissions (p.p. difference to growth rates in REF2016)
|
REF2016 *
|
EUCO27
|
EUCO30
|
|
|
'05-'30
|
'05-'50
|
'05-'30
|
'05-'50
|
'05-'30
|
'05-'50
|
|
Transport - total
|
-12.3%
|
-11.4%
|
-5.5
|
-55.5
|
-6.8
|
-55.5
|
|
Passenger transport
|
-15.7%
|
-16.0%
|
-6.3
|
-55.8
|
-7.8
|
-55.7
|
|
Road
|
-22.7%
|
-26.2%
|
-7.6
|
-54.3
|
-9.6
|
-54.5
|
|
Rail
|
-35.0%
|
-65.2%
|
2.2
|
-14.9
|
2.2
|
-14.9
|
|
Aviation
|
15.3%
|
28.6%
|
-1.1
|
-63.7
|
-0.6
|
-62.1
|
|
Inland navigation
|
-14.7%
|
-10.5%
|
2.5
|
-34.2
|
2.4
|
-34.3
|
|
Freight transport
|
-1.9%
|
2.9%
|
-3.0
|
-54.4
|
-3.8
|
-55.0
|
|
Road
|
0.2%
|
6.3%
|
-3.5
|
-57.1
|
-4.3
|
-57.8
|
|
Rail
|
-18.3%
|
-57.8%
|
0.4
|
-18.2
|
0.4
|
-18.2
|
|
Inland navigation
|
-25.0%
|
-18.8%
|
2.2
|
-31.5
|
2.1
|
-31.6
|
|
CO2 emissions (p.p. difference to growth rates in REF2016)
|
VEH
|
BIO-A
|
BIO-B
|
|
|
'05-'30
|
'05-'50
|
'05-'30
|
'05-'50
|
'05-'30
|
'05-'50
|
|
Transport - total
|
-9.9
|
-55.9
|
-8.3
|
-55.3
|
-7.5
|
-55.2
|
|
Passenger transport
|
-11.2
|
-55.7
|
-9.1
|
-55.2
|
-8.4
|
-55.1
|
|
Road
|
-13.8
|
-54.5
|
-10.1
|
-54.2
|
-9.3
|
-54.1
|
|
Rail
|
2.2
|
-14.9
|
1.5
|
-14.6
|
2.9
|
-14.5
|
|
Aviation
|
-0.6
|
-62.1
|
-5.0
|
-61.1
|
-5.1
|
-60.9
|
|
Inland navigation
|
2.6
|
-34.3
|
1.6
|
-33.0
|
2.9
|
-32.8
|
|
Freight transport
|
-5.7
|
-56.4
|
-6.0
|
-55.5
|
-4.7
|
-55.3
|
|
Road
|
-6.5
|
-59.3
|
-6.7
|
-58.4
|
-5.4
|
-58.3
|
|
Rail
|
0.3
|
-18.2
|
-0.3
|
-18.0
|
0.9
|
-17.9
|
|
Inland navigation
|
2.1
|
-31.5
|
1.6
|
-30.5
|
2.9
|
-30.3
|
|
CO2 emissions (p.p. difference to growth rates in REF2016)
|
TECH
|
MOBI
|
MOBI-TAX
|
|
|
'05-'30
|
'05-'50
|
'05-'30
|
'05-'50
|
'05-'30
|
'05-'50
|
|
Transport - total
|
-7.7
|
-56.5
|
-7.5
|
-55.6
|
-8.2
|
-55.8
|
|
Passenger transport
|
-8.9
|
-56.9
|
-8.3
|
-55.8
|
-8.7
|
-55.9
|
|
Road
|
-11.0
|
-56.0
|
-10.0
|
-54.6
|
-10.5
|
-54.7
|
|
Rail
|
2.1
|
-15.0
|
2.6
|
-14.8
|
2.4
|
-15.1
|
|
Aviation
|
-0.5
|
-61.9
|
-1.0
|
-62.2
|
-1.2
|
-62.2
|
|
Inland navigation
|
2.4
|
-34.5
|
3.1
|
-34.2
|
1.5
|
-34.6
|
|
Freight transport
|
-4.0
|
-55.4
|
-5.2
|
-55.1
|
-6.5
|
-55.7
|
|
Road
|
-4.5
|
-58.2
|
-5.9
|
-57.9
|
-7.4
|
-58.6
|
|
Rail
|
0.4
|
-18.2
|
0.9
|
-18.1
|
0.2
|
-18.7
|
|
Inland navigation
|
2.1
|
-31.6
|
3.2
|
-31.6
|
3.2
|
-31.6
|
Source: PRIMES-TREMOVE transport model (ICCS-E3MLab)
Note: * For REF2016 emissions growth rates for 2005-2030 and 2005-2050 are reported.
Decomposition analysis of CO2 emissions
As explained in section 3.3, the overall trend in transport emissions is determined by three broad components: transport activity levels, the energy intensity of transport and the carbon intensity of the energy used. Following a decomposition analysis, it can be shown how much the projected transport emissions are expected to decrease in each pathway/scenario (in percentage terms or Mt of CO2) between 2005 and 2030 due to each component (see
Figure 10
to
Figure 13
).
Overall, CO2 emissions from passenger transport decrease by 22-27% (178-217 Mt of CO2) between 2005 and 2030 in the decarbonisation pathways/scenarios. The decrease in CO2 emissions is to a large extent due to improvements in energy intensity (-38% to -41%, equivalent to 308-331 Mt of CO2), while carbon intensity (-7% to -9%, equivalent to 55-68 Mt of CO2) play a more limited role by 2030 when compared to REF2016 (see
Figure 10
and
Figure 11
). Transport activity works in opposite direction, i.e. towards increasing emissions, but its impact is more limited in size in all decarbonisation pathways/scenarios (+22% to +23% for 2005-2030, equivalent to 176-186 Mt of CO2) compared to the REF2016 (+25%, equivalent to 198 Mt of CO2). Decreases in energy intensity originate both from the uptake of more fuel efficient powertrains and improvements in the transport system efficiency brought about the higher operational efficiency of transport modes and multimodality. Among scenarios, VEH and TECH show the highest contribution to emissions reductions coming from improvements in the energy intensity, thanks to the penetration of more efficient powertrains and electrification of the passenger cars fleet. In VEH and BIO-A, the higher electrification of the passenger car fleet and the strong uptake of advanced renewable fuels, respectively, result in the largest contribution to emissions reductions from improvements in the CO2 intensity among scenarios. BIO-B results in somewhat lower contribution to emissions reductions from improvements in the CO2 intensity, despite the very strong uptake of advanced renewable fuels, due to the lower overall share of biofuels in the fuel mix compared to BIO-A triggered by the complete phase out of food-based biofuels by 2030. In MOBI and MOBI-TAX, internalisation measures and intensive policies promoting efficiency improvements in the transport system and multimodality have an impact on emissions reductions both through lower transport activity and energy intensity improvements relative to REF2016.
Higher reductions in CO2 emissions from freight transport are achieved in all decarbonisation pathways/scenarios relative to REF2016 (see
Figure 12
and
Figure 13
). However, their contribution to the overall emissions reductions is more limited than that of passenger transport, both in relative terms and in levels (about 5-8% reduction in emissions for 2005-2030, equivalent to 13-22 Mt of CO2). Improvements in energy intensity provide the highest contribution to emissions reductions (-22% to -24% for 2005-2030, equivalent to 58-65 Mt of CO2) while carbon intensity improvements are more limited by 2030 (-9% to -11% for 2005-2030, equivalent to 24-30 Mt of CO2). Transport activity works in opposite direction, i.e. towards increasing emissions, but its impact is more limited in size in all decarbonisation pathways/scenarios (+23% to +26% for 2005-2030, equivalent to 62-69 Mt of CO2) compared to the Reference scenario (+27%, equivalent to 73 Mt of CO2).
Figure 10: Decomposition of CO2 emissions for passenger transport for 2005-2030 (% change)

Source: EC calculations based on PRIMES-TREMOVE transport model (ICCS-E3MLab)
Note: The figures report the changes in CO2 emissions due to the three broad components (transport activity levels, energy intensity of transport and carbon intensity of the energy used) in relative terms compared to 2005.
Figure 11: Decomposition of CO2 emissions for passenger transport for 2005-2030 (in Mt of CO2)

Source: EC calculations based on PRIMES-TREMOVE transport model (ICCS-E3MLab)
Note: The figures report the changes in CO2 emissions, in Mt of CO2, due to the three broad components (transport activity levels, energy intensity of transport and carbon intensity of the energy used) in relative terms compared to 2005.
Figure 12: Decomposition of CO2 emissions for freight transport for 2005-2030 (% change)

Source: EC calculations based on PRIMES-TREMOVE transport model (ICCS-E3MLab)
Note: The figures report the changes in CO2 emissions due to the three broad components (transport activity levels, energy intensity of transport and carbon intensity of the energy used) in relative terms compared to 2005.
Figure 13: Decomposition of CO2 emissions for freight transport for 2005-2030 (in Mt of CO2)

Source: EC calculations based on PRIMES-TREMOVE transport model (ICCS-E3MLab)
Note: The figures report the changes in CO2 emissions, in Mt of CO2, due to the three broad components (transport activity levels, energy intensity of transport and carbon intensity of the energy used) in relative terms compared to 2005.
VEH, BIO-A, MOBI and MOBI-TAX scenarios result in rather similar emissions reductions by 2030 but the drivers are different. While VEH scenario achieves the highest contribution to emissions reduction through improvements in energy intensity, in BIO-A the strong uptake of advanced renewable fuels has a larger impact on CO2 intensity, and in MOBI and MOBI-TAX internalisation measures, efficiency improvements in the transport system and higher taxation of diesel (in MOBI-TAX) have a dampening role on the transport activity. Nevertheless, energy intensity improvements also contribute additional emissions reductions in BIO-A, MOBI and MOBI-TAX (-22% for 2005-2030, equivalent to 59 Mt of CO2) relative to REF2016 (-21%, equivalent to 56 Mt of CO2). Similar to passenger transport, BIO-B results in somewhat lower contribution to emissions reductions, despite the very strong uptake of advanced renewable fuels, due to the lower overall share of biofuels in the fuel mix compared to BIO-A.
Overall, efficiency gains play a decisive role in further reducing emissions in road transport relative to REF2016. As expected, the highest reduction in emissions due to improvements in energy intensity is achieved in VEH for both passenger and road transport. However, the differences to the energy intensity contribution to emissions cuts in MOBI and MOBI-TAX is not very large. This is because measures intelligently managing transport demand and improving the efficiency of the system also result in energy intensity improvements. The use of less CO2 intensive fuels contributes to further reduction of emissions for road and rail passenger transport relative to REF2016 and only in the BIO-A and BIO-B scenarios to emissions reduction in aviation by 2030. The detailed results by transport mode are provided in Annex IV (see
Table 27
-
Table 28
).
Well to wheel CO2 emissions
Only EU emissions for the domestic production are covered by the quantified well to wheel emissions. Worldwide upstream emissions related to the sourcing of fossil fuels are not reflected in this modelling exercise. For biofuels, well to wheel CO2 emission factors reflect the energy use in the production process. Indirect land-use change (ILUC) emissions are not quantified.
On well to wheel basis, CO2 emissions go down by 17-20% during 2005-2030 (63-64% for 2005-2050) as the power generation sector continues its gradual decarbonisation pathway by 2050 (see
Figure 14
). Higher emissions reductions are achieved in road transport (21-25% by 2030 and 68-70% by 2050). The well to wheel emissions go down slightly less than tank to wheel emissions, which is attributed to a lower reduction rate of the carbon footprint of upstream technologies producing fuels for transport (e.g. biofuels, electricity, hydrogen, oil products). The power generation mix plays an important role here as the large scale electrification of transport needs to be accompanied by the decarbonisation of power generation. VEH scenario shows the highest reduction in the well to wheel emissions both in road transport and overall transport sector (about 25% and 20% respectively), but already 21-22% reductions in road transport emissions (17-18% in total transport emissions) are achieved in EUCO27 and EUCO30.
As explained, ILUC emissions are not quantified. Taking into account the effects of indirect land-use change over the life-cycle of biofuels may show that worldwide CO2 emissions are, in fact, lower if a higher share of advanced biofuels is used.
Figure 14: Evolution of well to wheel CO2 emissions for 2005-2030 and 2005-2050 (in %)


Source: PRIMES-TREMOVE transport model (ICCS-E3MLab)
4.3.4 Other environmental impacts
Transport related activities have significant impacts on air pollution and noise levels. The co-benefits of decarbonisation pathways/scenarios on the environment are illustrated below in terms of air pollution and external costs of air and noise pollution.
Impact on air pollution
NOx emissions would drop in the decarbonisation pathways/scenarios by similar percentages: 57-58% by 2030 (76% by 2050) relative to 2010, although through different channels. While in VEH the 58% reduction in NOx is mainly driven by the higher substitution of internal combustion engines for electric vehicles, in MOBI-TAX the higher taxation of diesel than current levels and policies intelligently managing transport demand, supported by cross-cutting initiatives in the urban area that aim to curb pollutant emissions, have similar impact on NOx emissions; this is despite lower CO2 emissions cuts achieved in MOBI-TAX relative to VEH scenario (see
Figure 15
). Regarding cross-cutting initiatives in the urban area, the intensity of measures is assumed to be low in the decarbonisation pathways/scenarios due to the limited EU competences in this field. However, Member States could consider ambitious reforms that lead to higher reductions in NOx emissions.
The higher use of LNG in lorries and shipping in all decarbonisation pathways/scenarios relative to REF2016 also contribute to lower NOx emissions. This is due to the internalisation of local externalities that push for the use of less polluting fuels and to the NAIADES II package for inland navigation, supported by the availability of refuelling infrastructure, present in all pathways/scenarios. Measures promoting urban policies that curb pollutant emissions and the higher diesel taxation provide an additional incentive for the uptake of LNG in MOBI and MOBI-TAX scenarios.
Figure 15: Evolution of NOx and PM2.5 emissions for 2010-2030 and 2010-2050 (growth rates, in %)


Source: PRIMES-TREMOVE transport model (ICCS-E3MLab)
The decline in particulate matter (PM2.5) would be less pronounced by 2030 at 53-56% but PM2.5 emissions would go down by around 81-82% by 2050 (see
Figure 15
). Highest emissions reductions are achieved in VEH scenario by 2030 (about 56%), due to the higher electrification of the vehicle fleet, while BIO-A, BIO-B, TECH, MOBI and MOBI-TAX show somewhat more limited impact (around 53-54% decrease by 2030). EUCO27 and EUCO30 scenarios are projected to achieve significant impacts by 2030 in terms of both NOx emissions (57% reduction) and PM2.5 emissions (53% decrease).
External costs of air and noise pollution
Overall, external costs related to air pollutants would by 2030 decrease in the decarbonisation pathways/scenarios by about 57-59% compared to 2010 due to reduced fuel consumption and increased use of alternative fuels and energy carriers in transport. The Reference scenario achieves already significant reduction (about 56%). However, they would still represent an important cost for the society (roughly €25-27 billion). By 2030, highest reductions in air pollutants costs are projected in the MOBI-TAX and VEH scenarios (see
Figure 16
). Similar reductions would be achieved in all decarbonisation pathways/scenarios (around 79%) by 2050. Reductions in air pollution are driven by policy measures limiting fossil fuels consumption but there are also second-order effects from the decrease in the transport activity relative to REF2016, due to higher costs of transport equipment (in VEH), fuels (in BIO-A and BIO-B) and measures managing transport demand (in MOBI and MOBI-TAX).
As highlighted in section 3.3, the increase in traffic would lead to further increase of noise related external costs by 2030 and 2050 in the Reference scenario (18% and 25% respectively). Transport measures for decarbonising the sector are expected to result in 5-11 percentage points decrease in 2030 (around 45 percentage points decrease in 2050) in noise-related external costs relative to REF2016. This is mainly thanks to the gradual substitution of internal combustion engines for electric vehicles in the VEH and TECH scenarios and due to a more limited increase in traffic in the MOBI and MOBI-TAX scenarios relative to REF2016. However, external costs of noise would still be 7-13% higher by 2030 relative to 2010 and would only significantly decline in the long term (about 20% reduction for 2010-2050).
Figure 16: External costs of air pollution and noise for 2010-2030 and 2010-2050


Source: PRIMES-TREMOVE transport model (ICCS-E3MLab)
4.3.5 Research, innovation and competitiveness
All decarbonisation pathways/scenarios support the penetration of new technologies related to internal combustion engines (ICE) and alternative powertrains through specific incentives, leading to further technology learning as technologies are deployed. The intensity of incentives is however different between pathways/scenarios.
Car manufacturers are assumed to comply with more stringent CO2 standards for light duty vehicles (LDVs) post-2020 in all decarbonisation pathways/scenarios, by marketing vehicles equipped with hybrid systems (that complement ICE) and electrically chargeable systems (i.e. battery electric, plug-in hybrid and fuel cell vehicles), which are becoming more appealing to consumers thanks to lower costs. The CO2 standards improve the predictability by the market actors and provide legal certainty about the technologies that comply with the policy objectives. This legal certainty enables strong effort by the manufacturers to improve the cost performance of advanced powertrains. In addition, the availability of recharging/refuelling infrastructure, facilitated by the implementation of the Directive 2014/94/EU, provides certainty to consumers towards new technologies.
As explained in sections 4.2.1 and 4.2.2, the least stringent CO2 standards for LDVs are assumed in EUCO27 and the most stringent ones in VEH scenario by 2030, with other decarbonisation pathways/scenarios having identical standards to EUCO30 and falling within this range. In addition, promotion of public procurement provides additional incentives for purchasing cleaner vehicles in VEH scenario. By 2030, electrically chargeable vehicles would represent 18% of the LDV vehicle stock in VEH scenario (i.e. about 17% battery electric and plug-in hybrid and 1% fuel cell vehicles), while EUCO27 and EUCO30 scenarios would be leading to shares in the range of 11-13% (i.e. around 10-12% battery electric and plug-in hybrid and 1% fuel cell vehicles).
In the TECH scenario, more intensive R&D investments along stringent CO2 standards (as stringent as in EUCO30) result in lower prices of alternative powertrains and consequently stronger market uptake (i.e. 15% share of electrically chargeable vehicles in the LDV vehicle stock) by 2030. Hybrid (petrol and diesel) non-rechargeable vehicles would provide a considerable share of the vehicle stock in all scenarios (around 21%).
Figure 17: Light duty vehicles by type of powertrain in 2030 and 2050 (in %)


Source: PRIMES-TREMOVE transport model (ICCS-E3MLab)
Note: The category “Hybrid” covers both diesel and gasoline hybrids; similarly, plug-in hybrids cover both diesel and gasoline plug-in hybrids.
By 2050, electrically chargeable vehicles are expected to represent about 68-72% of the LDV vehicle stock (i.e. around 63-64% battery electric and plug-in hybrid and 5-8% fuel cell vehicles). Their much higher share relative to 2030 can be explained by more stringent CO2 standards for light duty vehicles assumed over time in all decarbonisation pathways/scenarios, declining technology costs and the gradual renewal of the vehicle stock.
The share of ICE diesel vehicles goes down by 2-8 percentage points relative to REF2016 in 2030 and that of ICE gasoline vehicles by up to 5-6 percentage points, while the share of ICE gaseous vehicles (i.e. LPG and CNG) remains relatively stable compared to REF2016 levels. The most significant decreases in the shares of ICE diesel vehicles are driven by the uptake of alternative powertrains in the VEH scenario and by cross-cutting incentives that curb pollutant emissions in the urban area in the MOBI and MOBI-TAX scenarios (see
Figure 17
). By 2050, ICE diesel, gasoline and gaseous vehicles loose significant market shares in all decarbonisation pathways/scenarios.
Transport activity of ICE diesel and gasoline cars in urban transport activity is projected to go down significantly, from about 76% in 2005 to 33-40% by 2030 and around 6-7% by 2050, in line with the 2011 White Paper goal of halving the use of ‘conventionally-fuelled’ cars in urban transport by 2030 and phase them out in cities by 2050.
Advanced renewable fuels as a share of liquid and gaseous transport fuels would provide around 1.9% in REF2016 and all other decarbonisation pathways/scenarios in 2030 except for the BIO-A and BIO-B scenarios, where by design, they would achieve about 4% and 6.9% share respectively due to dedicated support measures. In absolute terms, advanced renewable fuels would provide around 12 Mtoe in BIO-A scenario, 21 Mtoe in BIO-B scenario and 6 Mtoe in all other scenarios/pathways. Their share in liquid and gaseous fuels would increase significantly by 2050 when they are projected to represent about 45-46% in the BIO-A and BIO-B scenarios, and 39-40% in all other decarbonisation pathways/scenarios. By comparison, the Reference scenario, which does not achieve the long-term decarbonisation objectives, shows only around a 2% share for advanced renewable fuels by 2050.
Seen from a different angle, the share of advanced renewable biofuels in total consumption of biofuels moderately increases by 2030 to around 30% in all pathways/scenarios, except for BIO-A and BIO-B scenarios. In BIO-A, the strong support for their uptake results in about half of total consumption of biofuels being provided by advanced renewable fuels. In BIO-B all consumption is from advanced renewable fuels. In all pathways/scenarios, advanced renewable fuels penetrate the transport fuels market in significant quantities after 2030. By 2050, advanced renewable fuels would represent over 85% of total consumption of biofuels in all decarbonisation pathways/scenarios, except for the BIO-A scenario where their share would go up to 99% and BIO-B where they represent 100%.
By design, through the implementation of specific incentives, both BIO-A and BIO-B scenarios achieve 0.6% share of biomethane (about 1.8-1.9 Mtoe) and 0.7% share of biokerosene (around 2.1 Mtoe) in all liquid and gaseous transport fuels by 2030. It is clear that without such a design, the overall demand of advanced renewable fuels would be fulfilled by fuels with lower cost (i.e. lingo-cellulosic ethanol and fungible biodiesel).
Figure 18: Liquid and gaseous biofuels in 2030 and 2050 (in % of total liquid fuels and in Mtoe)


Source: PRIMES-TREMOVE and PRIMES Biomass supply model (ICCS-E3MLab)
Note: 'Advanced renewable fuels' is used to cover fuels produced from feedstocks listed in Annex IX Part A and Annex IX Part B of the ILUC Directive.
The additional demand of advanced renewable fuels in the BIO-A and BIO-B scenarios is mainly covered by domestic production. The need to meet the additional demand for Annex IX (of the ILUC Directive) sourced feedstock implies higher investments in bio-refineries producing these types of biofuels and thus an increase in the investment expenditures as additional capacities have to be established in Europe.
The unit capital cost of such bio-refineries is higher than that of conventional ones. However, increased production of advanced renewable fuels drives a reduction in the unit capital costs of these installations over time, as a result of learning effects. In BIO-A scenario, additional yearly capacity of advanced production processes of 4 Mtoe for 2021-2030 and 44.8 Mtoe for 2021-2050 is required compared to REF2016, while in BIO-B 7.3 Mtoe for 2021-2030 and 49.5 Mtoe for 2021-2050. In EUCO30 and all other decarbonisation pathways/scenarios, no significant capacity increase takes place for 2021-2030 relative to REF2016 but additional yearly capacity of advanced production processes of 31.6 Mtoe would be needed for 2021-2050 relative to the Reference scenario.
The additional capacities to be established would lead to an average annual increase in capital costs of €0.8 billion for 2021-2030 (€8.2 billion for 2021-2050) compared to the Reference scenario in BIO-A scenario and €1.4 billion for 2021-2030 (€9.1 billion for 2021-2050) in BIO-B scenario. EUCO30 and all other decarbonisation pathways/scenarios result in lower average annual increases in capital costs of €0.1 billion for 2021-2030 (€6 billion for 2021-2050) relative to REF2016, due to the lower uptake of advanced renewable fuels in these scenarios.
4.3.6 Impacts on transport as a business
The impacts of the decarbonisation pathways/scenarios on the transport sector itself are analysed in terms of level of activity, modal shift and unit costs per user.
Transport activity
Passenger transport activity is expected to continue growing in all decarbonisation pathways/scenarios relative to 2010 (about 20-22% by 2030 and 38-39% by 2050). However, active policies in place for stimulating change in the transport system would put a brake on the expansion of passenger transport activity in the decarbonisation pathways/scenarios relative to the Reference scenario, activity going down by 0.2-1.4% in 2030 (see
Table 7
). MOBI and MOBI-TAX scenarios show the highest decrease in the passenger transport activity (0.9% and 1.4% by 2030, respectively) compared to REF2016, due to their strong focus on policies intelligently managing transport demand and taxation, supported by cross-cutting initiatives in the urban area. Advanced research and innovation in electro-mobility enables the decarbonisation of passenger transport with lower impact on transport activity in the TECH scenario (0.2% reduction in 2030 relative to REF2016), due to the uptake of electric propulsion vehicles at lower costs and limited impact on the unit cost of passenger transport.
Similarly, freight transport activity shows significant growth over time in all decarbonisation pathways/scenarios (around 33-35% for 2010-2030 and 56-57% for 2010-2050), driven by sustained economic activity growth. MOBI and MOBI-TAX scenarios display the highest decrease relative to REF2016 (0.9% and 1.6% in 2030, respectively) due to intensive measures optimising the efficiency of the transport system and leading to reductions in road freight activity. The impact is highest in MOBI-TAX, because fuel costs including taxation represent almost 30% of the total road freight costs.
Table 7: Change in passenger and freight transport activity relative to EU Reference scenario 2016
|
Transport activity (% change to REF2016)
|
REF2016 **
|
EUCO27
|
EUCO30
|
|
|
2030
|
2050
|
2030
|
2050
|
2030
|
2050
|
|
Passenger transport
|
7,880
|
9,053
|
-0.4%
|
-1.6%
|
-0.3%
|
-1.5%
|
|
Road
|
6,280
|
6,946
|
-1.1%
|
-2.4%
|
-1.1%
|
-2.3%
|
|
Rail
|
693
|
878
|
6.2%
|
8.2%
|
6.1%
|
8.1%
|
|
Aviation*
|
860
|
1,177
|
-0.7%
|
-5.1%
|
-0.3%
|
-4.8%
|
|
Inland navigation
|
46
|
52
|
4.2%
|
8.6%
|
4.1%
|
8.4%
|
|
Freight transport
|
3,457
|
4,051
|
-0.1%
|
-0.9%
|
0.0%
|
-0.9%
|
|
Road
|
2,446
|
2,835
|
-1.3%
|
-3.7%
|
-1.2%
|
-3.6%
|
|
Rail
|
580
|
724
|
2.5%
|
4.8%
|
2.6%
|
4.7%
|
|
Inland navigation
|
432
|
492
|
3.8%
|
6.5%
|
3.7%
|
6.4%
|
|
Transport activity (% change to REF2016)
|
VEH
|
BIO-A
|
BIO-B
|
|
|
2030
|
2050
|
2030
|
2050
|
2030
|
2050
|
|
Passenger transport
|
-0.4%
|
-1.5%
|
-0.4%
|
-1.5%
|
-0.5%
|
-1.5%
|
|
Road
|
-1.1%
|
-2.3%
|
-1.2%
|
-2.3%
|
-1.3%
|
-2.3%
|
|
Rail
|
6.1%
|
8.1%
|
6.2%
|
8.1%
|
6.3%
|
8.1%
|
|
Aviation*
|
-0.3%
|
-4.8%
|
-0.5%
|
-4.8%
|
-0.6%
|
-4.9%
|
|
Inland navigation
|
4.3%
|
8.4%
|
4.2%
|
8.6%
|
4.2%
|
8.6%
|
|
Freight transport
|
0.1%
|
-0.8%
|
-0.1%
|
-0.8%
|
-0.2%
|
-0.8%
|
|
Road
|
-1.1%
|
-3.4%
|
-1.5%
|
-3.5%
|
-1.6%
|
-3.5%
|
|
Rail
|
2.5%
|
4.8%
|
2.7%
|
4.8%
|
2.7%
|
4.8%
|
|
Inland navigation
|
3.5%
|
6.3%
|
3.7%
|
6.5%
|
3.8%
|
6.5%
|
|
Transport activity (% change to REF2016)
|
TECH
|
MOBI
|
MOBI-TAX
|
|
|
2030
|
2050
|
2030
|
2050
|
2030
|
2050
|
|
Passenger transport
|
-0.2%
|
-0.9%
|
-0.9%
|
-1.5%
|
-1.4%
|
-1.7%
|
|
Road
|
-0.9%
|
-1.4%
|
-1.9%
|
-2.3%
|
-2.5%
|
-2.6%
|
|
Rail
|
6.0%
|
7.6%
|
7.0%
|
8.7%
|
7.3%
|
8.8%
|
|
Aviation*
|
-0.2%
|
-4.6%
|
-0.5%
|
-4.9%
|
-0.6%
|
-4.9%
|
|
Inland navigation
|
4.1%
|
8.0%
|
5.0%
|
8.7%
|
4.0%
|
8.1%
|
|
Freight transport
|
0.0%
|
-0.8%
|
-0.9%
|
-0.8%
|
-1.6%
|
-1.3%
|
|
Road
|
-1.2%
|
-3.4%
|
-3.1%
|
-3.4%
|
-4.1%
|
-4.2%
|
|
Rail
|
2.6%
|
4.7%
|
3.6%
|
4.8%
|
3.9%
|
5.1%
|
|
Inland navigation
|
3.6%
|
6.3%
|
5.4%
|
6.3%
|
5.6%
|
6.4%
|
Source: PRIMES-TREMOVE transport model (ICCS-E3MLab)
Note: * For aviation, domestic and international intra-EU activity is reported to maintain the comparison with reported statistics; ** Transport activity levels in REF2016 are reported in billion passenger-kilometres for passenger transport and tonne-kilometres for freight transport.
Modal shift
The market shares of passenger and freight road transport decrease in all decarbonisation pathways/scenarios relative to REF2016 (0.6-0.9 percentage points in 2030 for passenger road transport and 0.9-1.8 percentage points for road freight), driven by measures internalising external costs but also by policies improving the competitiveness of rail and inland navigation (see
Table 8
).
Table 8: Change in the modal shares relative to the EU Reference scenario 2016 (in percentage points)
|
Modal share (p.p. difference to REF2016)
|
REF2016 **
|
EUCO27
|
EUCO30
|
|
|
2030
|
2050
|
2030
|
2050
|
2030
|
2050
|
|
Passenger transport
|
|
|
|
|
|
|
|
Road
|
79.7%
|
76.7%
|
-0.6
|
-0.6
|
-0.6
|
-0.6
|
|
Rail
|
8.8%
|
9.7%
|
0.6
|
1.0
|
0.6
|
0.9
|
|
Aviation*
|
10.9%
|
13.0%
|
0.0
|
-0.5
|
0.0
|
-0.4
|
|
Inland navigation
|
0.6%
|
0.6%
|
0.0
|
0.1
|
0.0
|
0.1
|
|
Freight transport
|
|
|
|
|
|
|
|
Road
|
70.7%
|
70.0%
|
-0.9
|
-1.9
|
-0.9
|
-1.9
|
|
Rail
|
16.8%
|
17.9%
|
0.4
|
1.0
|
0.4
|
1.0
|
|
Inland navigation
|
12.5%
|
12.2%
|
0.5
|
0.9
|
0.5
|
0.9
|
|
Modal share (p.p. difference to REF2016)
|
VEH
|
BIO-A
|
BIO-B
|
|
|
2030
|
2050
|
2030
|
2050
|
2030
|
2050
|
|
Passenger transport
|
|
|
|
|
|
|
|
Road
|
-0.6
|
-0.6
|
-0.6
|
-0.6
|
-0.6
|
-0.6
|
|
Rail
|
0.6
|
0.9
|
0.6
|
1.0
|
0.6
|
1.0
|
|
Aviation*
|
0.0
|
-0.4
|
0.0
|
-0.4
|
0.0
|
-0.4
|
|
Inland navigation
|
0.0
|
0.1
|
0.0
|
0.1
|
0.0
|
0.1
|
|
Freight transport
|
|
|
|
|
|
|
|
Road
|
-0.8
|
-1.9
|
-1.0
|
-1.9
|
-1.0
|
-1.9
|
|
Rail
|
0.4
|
1.0
|
0.5
|
1.0
|
0.5
|
1.0
|
|
Inland navigation
|
0.4
|
0.9
|
0.5
|
0.9
|
0.5
|
0.9
|
|
Modal share (p.p. difference to REF2016)
|
TECH
|
MOBI
|
MOBI-TAX
|
|
|
2030
|
2050
|
2030
|
2050
|
2030
|
2050
|
|
Passenger transport
|
|
|
|
|
|
|
|
Road
|
-0.6
|
-0.4
|
-0.8
|
-0.6
|
-0.9
|
-0.7
|
|
Rail
|
0.5
|
0.8
|
0.7
|
1.0
|
0.8
|
1.0
|
|
Aviation*
|
0.0
|
-0.5
|
0.0
|
-0.4
|
0.1
|
-0.4
|
|
Inland navigation
|
0.0
|
0.1
|
0.0
|
0.1
|
0.0
|
0.1
|
|
Freight transport
|
|
|
|
|
|
|
|
Road
|
-0.9
|
-1.9
|
-1.6
|
-1.9
|
-1.8
|
-2.1
|
|
Rail
|
0.4
|
1.0
|
0.8
|
1.0
|
0.9
|
1.1
|
|
Inland navigation
|
0.5
|
0.9
|
0.8
|
0.9
|
0.9
|
0.9
|
Source: PRIMES-TREMOVE transport model (ICCS-E3MLab)
Note: * For aviation, domestic and international intra-EU activity is reported to maintain the comparison with reported statistics; ** Modal shares in REF2016 for 2030 and 2050.
Passenger rail increases its modal share by 0.6-0.8 percentage points in 2030 relative to REF2016, and freight rail by 0.4-0.9 percentage points; freight inland navigation modal share goes up by 0.5-0.9 percentage points in 2030. The highest modal shift towards rail and inland navigation takes place in MOBI and MOBI-TAX. High-speed rail gains further shares, reaching 2.7-2.8% of passenger transport activity by 2030 and 3.6% by 2050 in MOBI and MOBI-TAX; it is projected to undertake 108 billion more passenger kilometres in 2030 and 218 billion more in 2050 relative to 2010.
Air transport modal share in the decarbonisation pathways/scenarios remains similar to REF2016 by 2030; post-2030 its modal share slightly decreases relative to REF2016, due to higher ETS prices which lead to lower growth in air transport activity.
Unit costs per user
The unit costs per passenger transported would increase in all decarbonisation pathway/scenarios (see
Table 9
), despite the decline in the fuel costs per km travelled driven by improvements in vehicle and transport system efficiency., EUCO27 and EUCO30 show moderate costs increases by 2030, of about 1.1-1.2% relative to the Reference scenario. MOBI and MOBI-TAX show the highest increases by 2030 (2.1% and 2.8%, respectively) due to a more ambitious pathway for internalising local externalities than in EUCO30, capital costs (i.e. transport equipment costs) related to public transport and the alignment of the EU minimum tax rates of petrol and gas oil (in MOBI-TAX). The cost increase in VEH scenario by 2030 (1.6%) is driven to large extent by the equipment costs for the electric propulsion vehicles while in BIO-A (1.3%) and BIO-B (1.5%) by the fuel costs related to the higher uptake of advanced biofuels. The increase in unit cost per passenger transported is higher in BIO-B relative to BIO-A due to the higher share of advanced renewable fuels in this scenario (6.9% in BIO-B versus 4% in BIO-A in total liquid and gaseous transport fuels in 2030). TECH scenario shows the lowest increase in unit costs per passenger transported, similar to EUCO27, due to lower increases in capital costs (i.e. transport equipment costs) as an effect of policies that enable the rapid deployment of new powertrains supported by advanced research and innovation in electro-mobility. By 2050, all decarbonisation pathways/ scenarios show relatively similar impacts on unit costs per passenger transported (3.7 to 4% increase relative to REF2016), except for TECH scenario which results in lower costs increases (around 2.6%).
Table 9: Unit cost of transport relative to Reference scenario 2016
|
Unit cost of transport relative to REF2016 (% change)
|
Unit cost for passenger transport
|
Unit cost for freight transport
|
|
|
2030
|
2050
|
2030
|
2050
|
|
REF2016 (in €/pkm or €/tkm)*
|
0.32
|
0.33
|
0.17
|
0.17
|
|
% change to REF2016
|
|
|
|
|
|
EUCO27
|
1.1%
|
3.8%
|
0.2%
|
2.2%
|
|
EUCO30
|
1.2%
|
3.7%
|
0.0%
|
2.0%
|
|
VEH
|
1.6%
|
3.7%
|
0.0%
|
1.6%
|
|
BIO-A
|
1.3%
|
3.7%
|
0.3%
|
1.8%
|
|
BIO-B
|
1.5%
|
3.7%
|
0.5%
|
1.9%
|
|
TECH
|
1.1%
|
2.6%
|
0.0%
|
1.9%
|
|
MOBI
|
2.1%
|
3.7%
|
1.8%
|
1.8%
|
|
MOBI-TAX
|
2.8%
|
4.0%
|
3.1%
|
2.8%
|
Source: PRIMES-TREMOVE transport model (ICCS-E3MLab)
Note: * Unit costs for passenger transport are expressed in euro per passenger-kilometres and for freight in euro per tonne-kilometres. Costs are expressed in 2013 prices. For REF2016 the levels of unit costs are provided for 2030 and 2050 for passenger and freight.
For freight transport, the drop in unit fuel costs outweighs the increase in unit capital costs and variable non-fuel costs (i.e. road charges) in most pathways/scenarios by 2030. As already explained, fuel costs play a more important role in total costs for freight, relative to passenger transport. The highest increases in unit cost for freight transport take place in the MOBI and MOBI-TAX scenarios (1.8% and 3.1% by 2030, respectively), similar to passenger transport. In BIO-A scenario the strong uptake of advanced renewable fuels results in about 0.3% increase relative to REF2016, while in BIO-B, where the share of advanced renewable fuels is even higher, in about 0.5% increase. By 2050, unit cost for freight goes up by about 1.6-2.2% relative to REF2016, only MOBI-TAX scenario showing higher increases (2.8% relative to REF2016).
4.3.7 Economic impacts
The economic impacts of the decarbonisation pathways/scenarios are assessed in terms of transport system costs, investments and transfer payments to the public budget. The scenarios are not directly comparable since they achieve different cumulative GHG emissions reductions in 2050. The net average costs per tonne of CO2 are hence shown, to provide a comparison between decarbonisation pathways/scenarios from this perspective. In addition, a qualitative assessment is provided for impacts on competitiveness.
Transport system costs
When assessing transport system costs for the decarbonisation pathways/scenarios, it needs to be taken into account that costs of already adopted policies as well as developments largely unrelated to policy (e.g. renewal of ageing vehicle stock, growing international fossil fuel prices, growing transport activity) are already covered in the Reference scenario 2016.
System costs are presented from the perspective of the transport sector, i.e. the costs for providing mobility services. They include:
capital costs related to transport equipment;
fuel costs (including fuel-related taxes like excise duties and value added taxes);
fixed operation costs (e.g. maintenance costs);
variable non-fuel operation costs (e.g. charges, registration taxes and other ownership taxes);
external costs (of congestion, air pollution, noise and accidents);
infrastructure costs for alternative fuels (i.e. for the recharging/refuelling of electric propulsion vehicles including fuel cell vehicles, for the refuelling of LNG lorries and bunkering of LNG vessels).
Transport system costs include transfer payments to the budget (i.e. excise duties, value added taxes, registration taxes and other ownership taxes, charges, payments for CO2 allowances in aviation under the EU Emission Trading Scheme, etc.), which are additional costs for the user although considered as a transfer from the point of view of society.
Transport system costs include the fuel costs paid by the transport users. In particular, prices of biofuels are calculated as to recover all costs incurred by the relevant industry (including capital costs, biomass feedstocks, etc.). Biofuel prices are influenced by strong learning effects in bio-refinery technologies in the model. In the case of electricity prices, they reflect the transformation of the power system to near zero carbon emissions; however they also reflect the benefits from the smoothing of the load curve enabled by recharging of batteries of the electric vehicles during the hours with low demand for electricity.
However, transport system costs do not include research and development costs. This is because there is a weak link between investment in research and development and technology outcomes, which does not allow for an easy quantification of total costs associated with the different pathways/scenarios. It can be assumed that these costs are passed through to consumers and reflected in the final prices of transport equipment. The transport system costs are calculated using private discount rates.
Transport system costs are calculated ex post, after the model is solved. As in the Reference scenario, for the calculation of the capital costs, the investment costs have been annualised following the equivalent annuity cost method with a discount rate of 10%.
In the period 2021-2030, the decarbonisation pathways/scenarios would lead to an average annual increase in transport system costs of €4 to 16 billion compared to the Reference scenario (see
T
able 10
). Expressed as share of GDP, this is equivalent to an average annual increase in system costs of 0.03 to 0.10 percentage points relative to REF2016 (see
Table 11
). Taking a longer term perspective (2021-2050), the average annual system costs would be €22 to 31 billion higher than in REF2016, equivalent to an average annual increase in system costs of 0.12 to 0.17 percentage points of GDP.
Table 10: Additional transport system costs for 2021-2030/2021-2050 compared to REF2016 (in billion €'2013)
|
Annual averages for 2021-2030 compared to REF2016 (bil. €'2013)
|
EUCO27
|
EUCO30
|
VEH
|
BIO-A
|
BIO-B
|
TECH
|
MOBI
|
MOBI-TAX
|
|
Total costs
|
4
|
4
|
8
|
5
|
6
|
4
|
10
|
16
|
|
Capital costs
|
19
|
23
|
35
|
22
|
22
|
22
|
18
|
15
|
|
Fuel costs (incl. taxation)
|
-19
|
-24
|
-33
|
-21
|
-19
|
-25
|
-26
|
-11
|
|
Fixed operation costs
|
2
|
3
|
7
|
3
|
3
|
5
|
0
|
-1
|
|
Variable non-fuel operation costs
|
6
|
6
|
5
|
5
|
5
|
6
|
29
|
25
|
|
External costs
|
-6
|
-6
|
-9
|
-7
|
-7
|
-6
|
-12
|
-15
|
|
Recharging/refuelling infrastructure
|
2
|
2
|
3
|
2
|
2
|
2
|
2
|
2
|
|
Annual averages for 2021-2050 compared to REF2016 (bil. €'2013)
|
EUCO27
|
EUCO30
|
VEH
|
BIO-A
|
BIO-B
|
TECH
|
MOBI
|
MOBI-TAX
|
|
Total costs
|
23
|
24
|
28
|
27
|
26
|
22
|
26
|
31
|
|
Capital costs
|
60
|
63
|
72
|
61
|
61
|
55
|
60
|
57
|
|
Fuel costs (incl. taxation)
|
-62
|
-67
|
-75
|
-59
|
-58
|
-70
|
-69
|
-55
|
|
Fixed operation costs
|
22
|
23
|
26
|
22
|
22
|
29
|
21
|
20
|
|
Variable non-fuel operation costs
|
14
|
14
|
14
|
13
|
12
|
16
|
31
|
27
|
|
External costs
|
-19
|
-19
|
-20
|
-20
|
-20
|
-18
|
-26
|
-28
|
|
Recharging/refuelling infrastructure
|
9
|
10
|
10
|
10
|
10
|
11
|
10
|
10
|
Source: PRIMES-TREMOVE transport model (ICCS-E3MLab)
The lowest costs in the 2021-2030 and 2021-2050 perspective are projected in the EUCO27, EUCO30 and TECH scenarios, showing an average annual increase in transport system costs of about €4 billion for 2021-2030 (€22 to 24 billion for 2021-2050) compared to the Reference scenario. The differences in transport system costs between scenarios are more pronounced in the 2021-2030 perspective, whereas in a longer term perspective the savings on fuel expenditures level out to larger extent the differences between higher capital costs, road charges and fuel taxes in VEH and MOBI, MOBI-TAX scenarios respectively. However, it should be stressed that total transport system costs between pathways/scenarios are not directly comparable because of the different cumulative emissions reductions achieved by 2050. In addition, as explained above, the TECH scenario shows the lowest costs because research and development is not covered by the transport system costs.
Looking at the costs structure, the highest average annual increase in capital costs compared to REF2016 would take place in VEH scenario (€35 billion for 2021-2030), driven by the most stringent CO2 standards for light duty vehicles among scenarios. BIO-A, BIO-B and TECH show moderate capital costs increases (€22 billion for 2021-2030), similar to EUCO30 scenario. MOBI and MOBI-TAX show significant increases in variable non-fuel operation costs, mainly due to road charges, but also result in the highest decreases in external costs among scenarios. The largest drop in fuel costs expenditures relative to the Reference scenario would take place in VEH scenario, due to higher fuel savings. MOBI-TAX shows the lowest overall decrease in fuel costs because of increases in excise duties which are also included under this heading. Also BIO-A and BIO-B scenarios show somewhat smaller decrease in fuels costs relative to REF2016 because of higher costs of advanced biofuels which are more widely used.
Table 11: Additional transport system costs for 2021-2030 and 2021-2050 compared to REF2016 (percentage points of GDP)
|
Annual averages for 2021-2030 compared to REF2016 (p.p. of GDP)
|
EUCO27
|
EUCO30
|
VEH
|
BIO-A
|
BIO-B
|
TECH
|
MOBI
|
MOBI-TAX
|
|
Total costs
|
0.03
|
0.03
|
0.05
|
0.03
|
0.04
|
0.03
|
0.07
|
0.10
|
|
Capital costs
|
0.12
|
0.15
|
0.23
|
0.14
|
0.14
|
0.14
|
0.11
|
0.10
|
|
Fuel costs (incl. taxation)
|
-0.12
|
-0.15
|
-0.21
|
-0.13
|
-0.12
|
-0.16
|
-0.17
|
-0.07
|
|
Fixed operation costs
|
0.01
|
0.02
|
0.05
|
0.02
|
0.02
|
0.03
|
0.00
|
-0.01
|
|
Variable non-fuel operation costs
|
0.04
|
0.04
|
0.03
|
0.03
|
0.03
|
0.04
|
0.18
|
0.16
|
|
External costs
|
-0.04
|
-0.04
|
-0.05
|
-0.04
|
-0.04
|
-0.04
|
-0.08
|
-0.09
|
|
Recharging/refuelling infrastructure
|
0.01
|
0.01
|
0.02
|
0.01
|
0.01
|
0.01
|
0.01
|
0.01
|
|
Annual averages for 2021-2050 compared to REF2016 (p.p. of GDP)
|
EUCO27
|
EUCO30
|
VEH
|
BIO-A
|
BIO-B
|
TECH
|
MOBI
|
MOBI-TAX
|
|
Total costs
|
0.13
|
0.13
|
0.15
|
0.14
|
0.14
|
0.12
|
0.14
|
0.17
|
|
Capital costs
|
0.33
|
0.35
|
0.39
|
0.34
|
0.33
|
0.30
|
0.33
|
0.31
|
|
Fuel costs (incl. taxation)
|
-0.34
|
-0.37
|
-0.41
|
-0.32
|
-0.32
|
-0.38
|
-0.38
|
-0.30
|
|
Fixed operation costs
|
0.12
|
0.13
|
0.14
|
0.12
|
0.12
|
0.16
|
0.11
|
0.11
|
|
Variable non-fuel operation costs
|
0.07
|
0.08
|
0.08
|
0.07
|
0.07
|
0.09
|
0.17
|
0.15
|
|
External costs
|
-0.10
|
-0.10
|
-0.11
|
-0.11
|
-0.11
|
-0.10
|
-0.14
|
-0.15
|
|
Recharging/refuelling infrastructure
|
0.05
|
0.05
|
0.06
|
0.05
|
0.05
|
0.06
|
0.05
|
0.05
|
Source: PRIMES-TREMOVE transport model (ICCS-E3MLab)
Transport system costs shown above do not include the welfare losses due to limitation in mobility (users’ disutility), which can be reflected through the compensating variation. This could provide an average annual increase in costs of €14 to 35 billion for 2021-2030 compared to the Reference scenario, with the lowest welfare losses due to the limitation in mobility taking place in TECH scenario and the highest in the MOBI-TAX scenario.
Investments
The transport investment costs cover capital expenditures on transport equipment and on recharging/refuelling infrastructure (i.e. for the recharging/refuelling of electric propulsion vehicles including fuel cell vehicles, for the refuelling of LNG lorries and bunkering of LNG vessels). Investment costs are not annualised.
In the period 2021-2030, the decarbonisation pathways/scenarios would lead to an average annual increase in investment expenditures of €24 to 49 billion (€55 to 69 billion for 2021-2050) compared to the Reference scenario (see
Table 12
). About €21 to 44 billion for 2021-2030 would take place in transport equipment and €3 to 5 billion in recharging/refuelling infrastructure. While the scale of the investment challenge requires significant efforts for their financing, such investment can also be expected to serve as stimulus for the European economy in terms of growth and job creation.
Table 12: Annual average investments by mode for 2021-2030/2021-2050 relative to REF2016 (in billion €'2013)
|
Annual averages - compared to REF2016 (bil. €'2013)
|
REF2016 *
|
EUCO27
|
EUCO30
|
|
|
'21-'30
|
'21-'50
|
'21-'30
|
'21-'50
|
'21-'30
|
'21-'50
|
|
Total investments
|
708
|
778
|
27
|
61
|
33
|
63
|
|
Investments in transport equipment
|
705
|
774
|
25
|
53
|
30
|
55
|
|
Road
|
597
|
640
|
21
|
51
|
26
|
53
|
|
Rail
|
28
|
40
|
3
|
3
|
3
|
3
|
|
Aviation
|
71
|
84
|
0
|
-2
|
0
|
-1
|
|
Inland navigation
|
10
|
10
|
1
|
1
|
1
|
1
|
|
Investments in recharging/refuelling infrastructure
|
3
|
4
|
3
|
8
|
3
|
8
|
|
Annual averages - compared to REF2016 (bil. €'2013)
|
VEH
|
BIO-A
|
BIO-B
|
|
|
'21-'30
|
'21-'50
|
'21-'30
|
'21-'50
|
'21-'30
|
'21-'50
|
|
Total investments
|
49
|
69
|
32
|
63
|
31
|
62
|
|
Investments in transport equipment
|
44
|
61
|
29
|
54
|
28
|
54
|
|
Road
|
40
|
59
|
25
|
52
|
24
|
52
|
|
Rail
|
3
|
3
|
3
|
3
|
3
|
3
|
|
Aviation
|
0
|
-1
|
0
|
-1
|
0
|
-2
|
|
Inland navigation
|
1
|
1
|
1
|
1
|
1
|
1
|
|
Investments in recharging/refuelling infrastructure
|
5
|
8
|
3
|
8
|
4
|
8
|
|
Annual averages - compared to REF2016 (bil. €'2013)
|
TECH
|
MOBI
|
MOBI-TAX
|
|
|
'21-'30
|
'21-'50
|
'21-'30
|
'21-'50
|
'21-'30
|
'21-'50
|
|
Total investments
|
32
|
55
|
27
|
61
|
24
|
59
|
|
Investments in transport equipment
|
29
|
46
|
24
|
53
|
21
|
51
|
|
Road
|
25
|
44
|
19
|
50
|
16
|
48
|
|
Rail
|
3
|
3
|
4
|
3
|
4
|
3
|
|
Aviation
|
0
|
-1
|
0
|
-1
|
-1
|
-2
|
|
Inland navigation
|
1
|
1
|
2
|
1
|
2
|
1
|
|
Investments in recharging/refuelling infrastructure
|
4
|
9
|
3
|
8
|
3
|
8
|
Source: PRIMES-TREMOVE transport model (ICCS-E3MLab)
Note: * For REF2016 average annual investments are provided in billion €'2013.
The highest increases in investments in transport equipment are expected in the VEH scenario, driven by very stringent CO2 standards, while the lowest investments would take place in the EUCO27, MOBI and MOBI-TAX scenarios where emissions reductions would be mainly achieved through internalisation measures and policies promoting efficiency improvements in the transport system and multimodality. Significant investments in all scenarios are expected to take place in road transport for the renewal of the vehicle fleet and the uptake of advanced powertrains. MOBI and MOBI-TAX show higher investments in rail and inland navigation relative to other scenarios, due to more intensive policies promoting multimodality and shifts towards more sustainable modes.
Similarly to transport equipment, VEH shows the highest rise in investments for recharging/refuelling infrastructure for 2021-2030. This is because of the higher share of electric propulsion vehicles projected in this scenario. In a longer term perspective, similar increase in investment expenditures for recharging/refuelling infrastructure take place in all pathways scenarios (€8 to 9 billion for 2021-2050).
Transfer payments to the budget
Part of the transport system costs which represent revenues for the public budget can be separated from the system costs (see
Table 13
). These transfers can be in principle recycled back to the economy.
Table 13: Annual average transfer payments to the budget relative to EU Reference scenario 2016 for 2021-2030 and 2021-2050 (in billion €'2013)
|
Additional transfer payments to the budget relative to REF2016 - annual averages for 2021-2030 (in bil. €’2013)
|
EUCO27
|
EUCO30
|
VEH
|
BIO-A
|
BIO-B
|
TECH
|
MOBI
|
MOBI-TAX
|
|
Total
|
-1
|
-4
|
-10
|
-4
|
-4
|
-5
|
21
|
38
|
|
Fuel taxes
|
-11
|
-14
|
-20
|
-14
|
-14
|
-15
|
-15
|
2
|
|
Charges
|
10
|
10
|
10
|
10
|
10
|
10
|
36
|
36
|
|
Other taxes
|
0
|
0
|
0
|
0
|
0
|
0
|
0
|
0
|
|
Additional transfer payments to the budget relative to REF2016 - annual averages for 2021-2050 (in bil. €’2013)
|
EUCO27
|
EUCO30
|
VEH
|
BIO-A
|
BIO-B
|
TECH
|
MOBI
|
MOBI-TAX
|
|
Total
|
-10
|
-13
|
-17
|
-13
|
-13
|
-16
|
5
|
21
|
|
Fuel taxes
|
-40
|
-43
|
-47
|
-43
|
-42
|
-46
|
-44
|
-27
|
|
Charges
|
29
|
29
|
29
|
29
|
29
|
29
|
48
|
47
|
|
Other taxes
|
1
|
1
|
1
|
1
|
1
|
2
|
1
|
1
|
Source: PRIMES-TREMOVE transport model (ICCS-E3MLab). Note: Other taxes include registration taxes and other ownership taxes.
MOBI and MOBI-TAX scenarios would generate substantial transfer payments to the public budget by 2030, on average €21 to 38 billion annually for 2021-2030 compared to the Reference scenario (see
Table 13
). In MOBI, toll revenues would outweigh the decrease in fuel tax revenues, triggered by fuel savings and the electrification of the vehicle fleet. The increase in diesel excise duties rates relative to current levels reinforces this effect in MOBI-TAX. While all other scenarios bring a decrease in fuel tax revenues (due to lower fuel consumption) compared to REF2016, MOBI-TAX scenario shows an increase in these revenues.
In EUCO27, EUCO30, BIO-A, BIO-B and TECH scenarios toll revenues (although moderate compared to MOBI and MOBI-TAX scenarios) also compensate to large extent the reduction in fuel tax revenues, while VEH scenario shows the highest drop in public budget revenues by 2030 (on average €10 billion annually for 2021-2030 compared to the Reference scenario). The picture is somewhat similar in the long term perspective, where full internalisation of external costs in the MOBI and MOBI-TAX scenarios and higher excise duties for diesel in MOBI-TAX would still generate positive impacts on the public budget. However, in other scenarios the impact would be negative due to large decreases in fuel tax revenues (on average €40 to 47 billion annually for 2021-2050 compared to the Reference scenario) driven by energy savings and large scale electrification of transport. In the long term, therefore, as fossil fuel use reduces, a budgetary neutral approach could lead Member States to either raise fuel taxes, broaden their scope, or gradually shift towards other forms of taxes and charges such as road pricing, including the internalisation of externalities.
Net average cost per tonne of CO2
As previously explained, total transport system costs between pathways/scenarios are not directly comparable because of the different cumulative emissions reductions achieved by 2050. One way of comparing the scenarios is by looking at the net average costs of emission reductions (costs per tonne of CO2 abated) of decarbonisation pathways/scenarios relative to the Reference scenario over the long term horizon (2015-2050).
In order to do so, the gains from the reduction in external costs in terms of improved air quality, reduced noise, increased safety and lower congestion levels (i.e. co-benefits of decarbonisation) have to be singled out from the total transport system costs and the two elements thus obtained have to be expressed in terms of €/tonne of CO2. The two components would therefore represent the “gross average costs” of achieving emissions reductions (i.e. the average cost of each scenario per tonne of CO2 avoided) and the “average co-benefits” (i.e. the average benefits of each scenario per tonne of CO2 avoided). Subtracting “average co-benefits” from “gross average costs” enables to identify the net average costs of emissions reductions. They are summarised in
Figure 19
. The gross average costs, average co-benefits and net average costs in this figure are indexed to the gross average costs of emission reductions in the EUCO27 scenario. For example, in the EUCO27 scenario average co-benefits are found to be 45% of the gross average costs, which implies that net average costs of emission reductions are only 55% of the gross average costs.
The transport system costs are end-user costs, calculated using private discount rates, of all policies in the transport sector, including on renewables, energy efficiency and transport demand management. These policies are not only related to transport decarbonisation but have multiple objectives like e.g. improving security of energy supply, improving the efficiency of the transport sector, reducing air pollution, etc. This is why the comparison presented in this section should be read together with the analysis of other benefits such as lower oil dependency, improved energy efficiency or lower air pollution presented in other sections. The transport system costs include taxation (e.g. in the price of fuels), as this is experienced by end-users. When dividing by avoided CO2 emissions, post-2050 reductions are not taken into account, nor are side benefits such as the decrease in the energy dependency quantified in any manner.
Figure 19: Gross average costs, average co-benefits and net average costs of emission reductions in the decarbonisation pathways/scenarios

Source: PRIMES-TREMOVE transport model (ICCS-E3MLab)
The lowest net average cost of emission reductions relative to EUCO27 would be achieved in TECH scenario; this outcome is due to the research and development costs which are not factored in the transport system costs. As already explained, there is a weak link between investment in research and development and technology outcomes, which does not allow for an easy quantification of total costs associated with the different pathways/scenarios. This pathway/scenario also incorporates higher degree of uncertainty associated with assumptions on technological development. In case the assumed technological breakthrough would not materialise, the outcome of this pathway/scenario would be the same as that of EUCO30. MOBI-TAX is projected to result in the highest net average costs of emission reductions relative to EUCO27, driven by the high gross average cost due to increases in diesel taxation relative to current levels. VEH scenario shows 10% higher net average costs of emission reductions than EUCO27, driven by the transport equipment costs which play an important role due to the very stringent CO2 standards for light duty vehicles and measures leading to fuel efficiency improvements for new conventional and hybrid heavy goods vehicles. The BIO-A scenario shows similar gross average costs for emissions reductions to VEH. While BIO-A has lower capital costs than VEH, it also achieves lower savings in fuel costs driven by price increases caused by blending of advanced biofuels. BIO-A leads to higher average co-benefits per tonne of CO2 abated that result in the net average cost of emission reductions being 6% higher than in the EUCO27 scenario (versus 10% for VEH). BIO-B scenario results in higher net average costs than BIO-A (8% higher compared to EUCO27) due to lower savings in fuel costs (i.e. as a result of price increases caused by higher blending rates for advanced biofuels than in BIO-A) but with higher average co-benefits. Both BIO-A and BIO-B scenarios assume phase out of food based biofuels by 2050 and 2030, respectively. Further analysis would be required for quantification of ILUC effects, beyond the scope of the current exercise.
MOBI scenario shows higher gross average costs for emission reductions than VEH, BIO-A and BIO-B but also higher average co-benefits which are partly compensating the gross average costs resulting in net average costs being 5% higher than those observed in the EUCO27 scenario. In fact, the highest average co-benefits among the decarbonisation pathways/scenarios relative to EUCO27 are achieved in MOBI and MOBI-TAX scenarios.
Competitiveness
The automotive value chain is one of the most advanced and specialised in Europe and a key pillar of the European economy. Transport decarbonisation will open up new business opportunities, but also has significant disruptive potential and is likely to reshape the existing value chain. In particular, the technological shift towards non-fossil fuels and alternative powertrains will have profound effects.
In 2015, 8% of the global vehicle fleet of around 1.2 billion vehicles used high blends of alternative fuels or electricity. Electric vehicles represented about 0.1% of the global vehicle fleet (1 million) at the end of 2015. In terms of sales, the USA, Japan and China were leading markets in 2012-2014 for electric vehicles. Many countries outside the EU set targets for alternatively fuelled vehicles, including electric vehicles, and put in place a range of policies with the aim of reducing environmental impacts and improving energy security.
Table 14: Summary of alternative transport fuel developments in seven countries and the EU
 Source: Ecofys and PwC (2016)
Currently, the market uptake of zero emission vehicles in the EU still suffers from limited alternative fuels infrastructure, relatively high sales prices and consumer scepticism as to their suitability for daily use. The highly uneven share of alternative fuel vehicles across EU Member States shows a clear link to national financial incentive schemes. As technology improves and prices come down, zero emission vehicles will be able to compete with conventional powertrains on a more equal footing, as shown in section 4.3.5, and the importance of such schemes can be expected to decline. However, in the short to medium term, financial and non-financial incentives may continue to play an important role for their market uptake and the Commission's focus could be on providing guidance to Member States to ensure coordination (e.g. via the Sustainable Transport Forum), competition neutrality and an efficient use of funds.
It is now increasingly clear that a shift from the internal combustion engine to alternative propulsion technologies is under way. In particular, electric propulsion technologies (plug-in hybrid, battery electric and fuel cell electric vehicles) have attracted very significant investment and a growing range of models is now available. Especially battery and fuel cell electric vehicles, the main two types of zero (tailpipe) emission vehicles, have important conceptual advantages over internal combustion ones. They are more energy efficient, they can result in lower or no CO2 emissions depending on the energy source and they cause no local pollution. As illustrated in sections 4.3.3 and 4.3.4, an increase in the market share of these vehicles would contribute towards low-emission mobility and would help solving air quality problems, especially relevant in urban areas.
From the perspective of global competitiveness, the shift to alternative propulsion technologies and zero emission vehicles is both a challenge and an opportunity. The EU is currently running an important trade surplus in road vehicles and EU manufacturers enjoy a strong position in important foreign markets such as China's. This contributes significantly to growth and employment in Europe, even though final assembly is increasingly done close to market. Significant effort would be required from the EU automotive industry in order to maintain a strong global position in a rapidly changing environment.
Alternative propulsion vehicles differ significantly from their internal combustion counterparts and this has profound implications for the automotive value chain. The traction battery is, for example, the single most important item in terms of the production value of a battery electric vehicle and the cost per kilowatt-hour is seen as a key competitiveness factor. At present, there is hardly any battery cell manufacturing capacity for electric vehicles in Europe and the necessary production know how and intellectual property is largely in foreign hands. Closing this capability gap looks like a precondition for maintaining a strong global market position from the current perspective. Motorised individual transport is an important and potentially growing market, but the focus is shifting to energy efficiency and pollution avoidance. This opens up considerable market potential for European companies. However, this potential can only be exploited and turned into growth and employment in Europe if the EU automotive industry adapts to a rapidly changing technology environment.
Against this backdrop, The work of the GEAR 2030 process in this area is therefore aimed at understanding better the ongoing changes and developing a holistic approach for the automotive value chain. Particular focus could be placed on zero emission vehicles and their value chain effects. The objective would be to devise measures that help develop the zero emission vehicle market in the EU so that larger production volumes drive down unit costs and the investment in zero emission technologies starts to pay off for EU manufacturers. The full range of relevant policy instruments to stimulate their development and market uptake, such as California's Zero-Emission Vehicle (ZEV) mandate, which requires that a certain percentage of new vehicle sales must be zero emission, could be assessed.
4.3.8 Social impacts
Social impacts are assessed by looking at the impact on congestion and safety and also by assessing the impacts of the decarbonisation pathways/scenarios on the households’ transport costs.
Impacts on congestion and safety
Two clear social benefits stemming from all scenarios are lower congestion levels and improved safety. The improvements in air quality and the reduction in noise levels have been discussed above. All four aspects constitute co-benefits discussed in the section on net average costs per tonne of CO2.
All decarbonisation pathways/scenarios are expected to result in somewhat lower congestion costs. This is thanks to internalisation measures and adopted internal market reforms (i.e. 4th railway package, NAIADES II package, ports package), included in EUCO27, EUCO30 and hence in all decarbonisation pathways/scenarios, that promote the efficiency and competitiveness of more sustainable modes and shift traffic away from road. Congestion costs would decrease by 1-3 percentage points during 2010-2030 (about 3-5 percentage points for 2010-2050) relative to growth rates in REF2016. The highest reductions would be achieved in MOBI and MOBI-TAX, thanks to full internalisation of local externalities on the inter-urban network, and intensive policies promoting efficiency improvements and multimodality. However, congestion costs are still projected to increase by about 21-23% by 2030 and 37-39% by 2050 relative to 2010 (see
Figure 20
).
Figure 20: External costs of congestion and accidents for 2010-2030 and 2010-2050


Source: PRIMES-TREMOVE transport model (ICCS-E3MLab)
Policies promoting more sustainable modes and multimodality are projected to reduce road transport activity levels and result in significant co-benefits in terms of improved road safety and reduction of fatalities and injuries. For 2010-2030, MOBI and MOBI-TAX scenarios would result in about 5 percentage points lower external costs of accidents relative to growth rates in REF2016 while other decarbonisation pathways/scenarios would show more moderate impacts (about 2 percentage points decrease for 2010-2030). The deployment of C-ITS is also projected to have positive effects on safety in EUCO30 relative to EUCO27, and especially in MOBI and MOBI-TAX scenarios where more ambitious deployment is assumed. Overall, by 2030 external costs of accidents would go down by 47-50% relative to 2010 (see
Figure 20
).
Additional welfare effects in the transport sector result particularly from modal shifts from motorised to non-motorised or collective forms of transport such as walking, cycling, public transport or a combination of these options. The most significant co-benefits of a modal shift towards active modes of transport arise from increased physical activity and may lead to lower levels of obesity, various physical and mental diseases and pre-mature mortality. Associated co-benefits would include reduced congestion and noise and air pollution to the general population. Secondary co-benefits may be located in employment and improvements in social cohesion.
Household transport costs
With respect to transport costs per household,
Table 15
shows that the share of private transport costs in the expenditures of an average EU household would slightly increase in all decarbonisation pathways/scenarios relative to REF2016.
Table 15: Private and public transport costs for 2021-2030/2021-2050 in REF2016 and alternative pathways/scenarios (in p.p. difference of households’ expenditures relative to REF2016)
|
Annual averages (p.p. of households' expenditures compared to REF2016)
|
REF2016 *
|
EUCO27
|
EUCO30
|
|
|
'21-'30
|
'21-'50
|
'21-'30
|
'21-'50
|
'21-'30
|
'21-'50
|
|
Total transport costs
|
13.4%
|
12.1%
|
0.1
|
0.3
|
0.1
|
0.3
|
|
Private transport
|
11.8%
|
10.6%
|
0.1
|
0.3
|
0.1
|
0.3
|
|
Purchase of transport equipment
|
4.7%
|
4.2%
|
0.2
|
0.4
|
0.2
|
0.4
|
|
Fuel costs (excl. taxes)
|
1.5%
|
1.4%
|
-0.1
|
-0.2
|
-0.1
|
-0.2
|
|
Fixed costs, taxes & charges
|
5.6%
|
5.0%
|
0.0
|
0.0
|
0.0
|
0.0
|
|
Public transport
|
1.6%
|
1.6%
|
0.0
|
0.0
|
0.0
|
0.0
|
|
Annual averages (p.p. of households' expenditures compared to REF2016)
|
VEH
|
BIO-A
|
BIO-B
|
|
|
'21-'30
|
'21-'50
|
'21-'30
|
'21-'50
|
'21-'30
|
'21-'50
|
|
Total transport costs
|
0.2
|
0.3
|
0.2
|
0.3
|
0.2
|
0.3
|
|
Private transport
|
0.2
|
0.3
|
0.1
|
0.3
|
0.1
|
0.3
|
|
Purchase of transport equipment
|
0.4
|
0.4
|
0.2
|
0.4
|
0.2
|
0.4
|
|
Fuel costs (excl. taxes)
|
-0.1
|
-0.2
|
-0.1
|
-0.2
|
-0.1
|
-0.1
|
|
Fixed costs, taxes & charges
|
0.0
|
0.0
|
0.0
|
0.0
|
0.0
|
0.0
|
|
Public transport
|
0.0
|
0.0
|
0.0
|
0.0
|
0.0
|
0.0
|
|
Annual averages (p.p. of households' expenditures compared to REF2016)
|
TECH
|
MOBI
|
MOBI-TAX
|
|
|
'21-'30
|
'21-'50
|
'21-'30
|
'21-'50
|
'21-'30
|
'21-'50
|
|
Total transport costs
|
0.1
|
0.2
|
0.2
|
0.3
|
0.3
|
0.4
|
|
Private transport
|
0.1
|
0.2
|
0.2
|
0.3
|
0.3
|
0.4
|
|
Purchase of transport equipment
|
0.2
|
0.3
|
0.2
|
0.4
|
0.2
|
0.4
|
|
Fuel costs (excl. taxes)
|
-0.1
|
-0.2
|
-0.1
|
-0.2
|
-0.1
|
-0.2
|
|
Fixed costs, taxes & charges
|
0.0
|
0.0
|
0.1
|
0.1
|
0.2
|
0.2
|
|
Public transport
|
0.0
|
0.0
|
0.0
|
0.0
|
0.0
|
0.0
|
Source: PRIMES-TREMOVE transport model (ICCS-E3MLab)
Note: * For REF2016 the shares of private and public transport costs in households’ expenditures are provided for 2021-2030 and 2021-2050 (annual averages).
In EUCO27, EUCO30, BIO-A, BIO-B and TECH scenarios the average annual increase for 2021-2030 would be limited (about 0.1 percentage point), due to the reduction in fuel costs which largely compensates the increase in expenditures related to the purchase of transport equipment. Also, the decrease in fuel taxation costs would fully compensate the additional toll costs which are marginal in these scenarios. The additional costs are higher in VEH and MOBI scenarios (0.2 percentage points for 2021-2030), due to transport equipment and toll costs, respectively. Highest rise in the share of private transport costs in the household expenditures would take place in the MOBI-TAX scenario (0.3 percentage points average annual increase for 2021-2030) due to fuel taxation and toll costs. In a long term perspective, for 2021-2050, the decarbonisation pathways/scenarios would result in 0.2-0.4 percentage points average annual increase of the private transport costs in household expenditures relative to REF2016.
The share of costs related to public transport services would remain almost unchanged in the decarbonisation pathways/scenarios relative to REF2016.
5. Conclusions
An efficient transport system is essential for the functioning of the single market and the free movement of goods and people. It is key for creating jobs and stimulating growth and investments. Low-emission mobility will be needed to support the shift to a low-carbon economy. This will also contribute towards reducing the dependency of transport on oil, diversifying its energy sources and increasing energy efficiency in line with the Energy Union strategy. The present document seeks to lay the analytical ground for relevant policy decisions to achieve these objectives.
Transport will need to contribute towards the 40% GHG emissions reduction target for 2030 and in particular to the 30% emissions reduction effort set for the non-Emission Trading Scheme sectors (i.e. transport, buildings, agriculture, small industry and waste).
The analysis first explores measures to provide a cost-effective transport contribution to the 2030 Climate and Energy policy framework in two central (so-called “EUCO”) scenarios. These scenarios have been developed to reach, in addition to the binding 2020 targets (on GHG and renewables), all the 2030 targets agreed by the October 2014 European Council, while respecting the current policy mix. The difference between the two central scenarios lies in the level of ambition to be achieved for the energy efficiency goal (27% or 30% primary energy savings in 2030 compared to the 2007 baseline). In order to ensure the consistency of the Commission's initiatives and accompanying analyses, the same central scenarios have been used in impact assessments accompanying proposals for the Effort Sharing Regulation for the period 2021 to 2030 and for the revision of the Energy Efficiency Directive. The analysis shows cost-effective emissions reductions of: 18-19% for transport, 38-43% for residential and tertiary (mainly buildings), 35-37% for industry and 29-35% for non-CO2 sectors (mainly agriculture and waste) by 2030 relative to 2005. For transport, this outcome is in line with the 2011 White Paper which established a milestone of 20% emissions reduction by 2030 relative to 2008 levels, equivalent to 19% emissions reduction compared to 2005 levels, and with the 2050 decarbonisation objectives.
No sectoral target has been established for the transport sector. However, comparing developments under current trends and adopted policies (i.e. the EU Reference scenario 2016, achieving 12% emissions reduction in transport) with the central scenarios (18-19%), shows that additional policies could be needed, especially post-2020, in order to close the gap of 6-7 percentage points and provide a cost-effective transport contribution to the 2030 Climate and Energy policy framework (taking into account all targets agreed for 2030 and respecting the current policy mix).
If lower emissions reductions than set out in the two scenarios reflecting the EU’s 2030 targets were to take place in other non-ETS sectors (e.g. buildings, agriculture, small industry and waste), even higher emissions reductions than 18-19% will be required in the transport sector to reach the 30% emissions reduction effort set for the non-ETS sectors. To demonstrate the impact of various options, the analysis shows the effects of a broad range of measures in some additional more ambitious pathways/scenarios, intensifying already existing EU policies. These scenarios provide stylised quantitative assessment on the relative importance and ambition of policies envisaged in terms of decarbonisation goals. These measures are not mutually exclusive and - as in the case of current policies - actions on all dimensions of low- and zero-emission vehicles, low emission alternative energy for transport, and efficiency of the transport system, as well as cross-cutting action on research and innovation, financing, and partnerships, are mutually reinforcing.
The central and more ambitious pathways/scenarios for decarbonising the transport sector would result in transport emissions reductions in the range of 18 to 22% by 2030 compared to 2005. The average annual net costs for the transport system associated with this change are projected to be €4 to 16 billion (0.03 to 0.10 percentage points of EU's GDP) for 2021-2030, on top of the Reference scenario.
As part of these costs, capital costs for transport equipment are estimated at €15 to 35 billion for 2021-2030 and costs for recharging and refuelling infrastructure at €2 to 3 billion annually in addition to those in the Reference scenario. Fuel costs savings would represent about €11 to 33 billion annually. Significant “co-benefits” in terms of air pollution, noise, congestion and safety are projected in all pathways/scenarios. They are quantified at €6 to 15 billion of benefits annually for 2021-2030 compared to the Reference scenario. While the scale of the investment challenge requires significant efforts for their financing, such investment can also be expected to serve as stimulus for the European economy in terms of growth and job creation.
The share of transport in the expenditures of an average EU household would only marginally increase in all pathways/scenarios relative to the Reference scenario (0.1-0.3 percentage points average annual increase for 2021-2030).
Impacts on transport activity are projected to be limited, while more sustainable transport modes would increase their shares in both passenger and freight transport (i.e. passenger rail increases its modal share by 0.6-0.8 percentage points in 2030 relative to the Reference scenario, freight rail by 0.4-0.9 percentage points and freight inland navigation by 0.5-0.9 percentage points).
The contribution of freight to the overall emissions reductions is more limited than that of passenger transport. The bulk of contribution in passenger transport would come from efficiency improvements by 2030, notably vehicle efficiency supported by the deployment of recharging/refuelling infrastructure and measures providing incentives for public procurement and multimodality. For freight, improvements in the efficiency of the transport system, pricing, and faster improvements in fuel efficiency of new heavy goods vehicles would all play an important role.
Oil products used in transport are projected to decrease by 51 to 67 Mtoe (13-17%) by 2030 compared to 2010 levels, thanks to policies supporting the move towards zero-emission vehicles, the uptake of low emission alternative energy for transport and higher efficiency of the transport system. Oil dependency would decrease by 8-9 percentage points compared to 2010 levels in all pathways/scenarios. Low emission alternative energy for transport increases its share in the energy demand under all decarbonisation pathways/scenarios, providing about 15-17% of energy demand in 2030 and around 59-61% by 2050 (i.e. due to large scale electrification of the light duty fleet and large scale deployment of advanced renewable fuels).
Liquid and gaseous biofuels would represent around 6.2 to 8% of liquid and gaseous transport fuels in 2030. Advanced renewable fuels would provide about a third of total biofuels by 2030, i.e. 1.9% of all transport fuels (liquid and gaseous) in pathways/scenarios that do not have specific incentives for advanced renewable fuels. Where there are specific incentives, the share of these fuels is higher. If moderate incentives for advanced renewable fuels are accompanied by a gradual decrease of food-based biofuels during 2020-2030 and their phase-out by 2050, advanced renewable fuels would achieve almost 50% share in total biofuels and 4% in all liquid and gaseous transport fuels in 2030. A scenario which assumes full phase out of food based biofuels by 2030 was also modelled, leading, by construction, to 100% share of advanced renewable fuels in total biofuels. In this case the projected advanced renewable fuels share in all liquid and gaseous transport fuels is 6.9%, this also being the scenario with stronger incentives for advanced biofuels. By 2050, advanced renewable fuels would represent over 85% of total consumption of biofuels in all decarbonisation pathways/scenarios, with scenarios including specific incentives for them showing 99-100% shares.
Electrically chargeable vehicles would provide some 11-18% of the light duty vehicle stock by 2030 (i.e. about 10-17% battery electric and plug-in hybrid and 1% fuel cell vehicles), with their share depending on the stringency of the CO2 standards and/or the intensity of R&D investment by the industry. Hybrid vehicles would provide a considerable share of the vehicle stock in all scenarios (around 21%). By 2050, electrically chargeable vehicles are expected to represent about 68-72% of the light duty vehicle stock (i.e. about 63-64% battery electric and plug-in hybrid and 5-8% fuel cell vehicles). This substantial increase is due to gradual strengthening of CO2 standards for light duty vehicles, declining technology costs, increasing technology performance and the time lag due to gradual renewal of the vehicle stock. Their large scale deployment is made possible by the availability of recharging/refuelling infrastructure, providing certainty to consumers towards new technologies.
The additional electricity demand from transport in the decarbonisation pathways/scenarios is counterbalanced by a reduction of demand in sectors where energy efficiency has still considerable potential (e.g. electricity consumption of appliances) in the 2030 perspective. Thus, in the central scenarios, total electricity demand is decreasing by 2030, compared to the Reference scenario.
All scenarios show substantial less air pollution (57-58% for NOx and 53-56% for particulate matter by 2030, relative to 2010) driven by gradual replacement of internal combustion engine vehicles with electrically chargeable vehicles and, in some pathways/scenarios, by support for multimodality, measures promoting urban policies that curb pollutant emissions and/or higher diesel taxation relative to current rates.
Stakeholders have repeatedly indicated the need for a balanced, stable and integrated approach to decarbonisation. The main messages of the high-level stakeholder conference on 18 June 2015 were that further and integrated action is needed in all modes, keeping technology neutrality and ensuring a clear signal for investments. In addition, the consultation and stock-taking on the 2011 White Paper showed that the aims and targets of that strategy are still valid, but it would benefit from smart adaptation, in particular to integrate new developments. The analysis carried out provides insights on the necessary tools to do this.
ANNEX I: Historical developments in transport activity, energy use and emissions
Transport and mobility
Transport is essential for the functioning of the single market, forming the heart of the supply chain and enabling the free movement of goods and people. Market integration, economic growth and transport activity are strongly related. In the EU, efficient transport connections have facilitated the creation and deepening of the internal market. Transport infrastructure investments boost economic growth, create wealth, enhance trade, geographical accessibility and the mobility of people. They are a highly effective engine of job creation.
Transport is a key ingredient for a high quality of life, making places accessible and bringing people together. About 13% of every household’s budget is spent on transport.
Transport sector is a growing sector: from 1995 to 2013, intra-EU
freight transport, measured in tonne-kilometres, has increased by 1.1% per year on average while the average annual growth of intra-EU passenger transport, measured in passenger-kilometres, was about 1%. This compares with an average GDP growth over the same period of 1.7%.
Besides its role as a facilitator, the transport industry in itself represents an important part of the economy: in the EU it directly employs around 11 million people and accounts for about 5% of the gross value added. It is estimated that the transport industry at large accounts for 7% of the European gross value added and for 7.06% of total employment in the EU, corresponding to more than 15 million people in absolute terms (2014 figures). Many European companies are world leaders in infrastructure, logistics, traffic management systems and manufacturing of transport equipment.
Transport and energy
However, the growth of transport activity raises concerns for its environmental sustainability. EU transport was responsible for 33% of final energy consumption (353 Mtoe) in 2014, while final energy consumption by households and industry represented respectively 25% and 26%. Adding maritime bunker fuels, energy used in transport totalled 394 Mtoe.
F
igure 21
provides an overview of total energy demand by mode of transport in the EU, covering domestic, intra-EU and intercontinental traffic.
Final energy consumption in transport decreased by -5% between 2005 and 2014. During 2005-2007, final energy consumption increased by 4% but has been decreasing quite rapidly since 2007 (-8% for 2007-2014). About 40% of the post-2007 reduction is estimated to be due to the economic crisis, with the stabilisation of passenger traffic and the decrease in freight traffic. However, the remaining 60% mostly originates from improvements in energy efficiency of passenger cars. Energy efficiency improvements for road freight have slowed down after 2007, driven by the fall in traffic and the less efficient operation of the vehicle fleet as shown by the lower load factors.
Figure 21: Share of transport energy demand by mode in 2014 (%)

Source: Eurostat
Findings from the Odyssee-Mure project show that the majority of transport energy efficiency measures undertaken at Member State level concern the passenger modes. The energy efficiency improvements seem to be mainly related to three sets of measures, i.e. measures concerning the energy and CO2 standards for new cars, measures addressing the renewal of car fleets, and measures addressing traffic management. In particular, the mandatory emission reduction targets for new cars and vans have led to significant improvements in the fuel economy of light duty vehicles sold on the European market. For example, the average emissions level of a new car sold in 2014 was 123.4 gCO2/km, below the 2015 target of 130 gCO2/km, according to data from the European Environment Agency (EEA). Provisional data for 2015 indicate 119.6 gCO2/km.
As a result of both EU and Member State level measures, the average specific fuel consumption of the EU passenger cars fleet went down from about 7.4 l/100km in 2005 to about 6.8 l/100km in 2013 according to the findings of the Odyssee-Mure project (see Figure 22).
For road freight, significant energy efficiency improvements took place between 2000 and 2007, driven by an increase in the efficiency of vehicles and more efficient management of freight transport (e.g. higher load factors and a shift to larger trucks). However, since 2008 despite continuous improvements in vehicle efficiency, empty running increased and trucks were less loaded.
Figure 22: Specific consumption of passenger cars (EU fleet average)

Source: Odyssee-Mure
Fuel use in transport
The currently dominant transport technologies are tightly linked to liquid fossil fuels. Liquid fuels, with their high energy density, are particularly suited for mobile applications and have displaced most alternatives. Today, transport relies on oil for 94% of its energy needs (see
Figure 23
). Europe imports around 87% of its crude oil and oil products from abroad, with a crude oil import bill estimated at around €187 billion in 2015, and additional costs to the environment.
Figure 23: Share of transport energy demand by energy carrier in 2014 (%)

Source: Eurostat
According to Eurostat, most energy consumed in air and waterborne transport was petroleum-based in 2014. While air transport relies only on kerosene, inland navigation uses few types of fuels, but all petroleum based. Road transport depended on oil products for 95% of its energy use and rail transport for 33%. Transport dependence on oil not only needs to be reduced, but the energy sources also need to be diversified.
Figure 24: Share of transport energy demand by energy carrier in 2014, by mode (%)


Source: Eurostat
Note: Biofuels also include biomethane for road transport. Inland navigation covers inland waterways and national maritime.
Air transport is most dependent on oil, with the main alternative energy source being biofuels. For road and waterborne applications some possible alternatives exist, such as biofuels and electricity and possibly for a transition period other fossil resources (e.g. LNG and GTL). However, in the long term, most fuels would need to be of non-fossil origin in order to secure a reduction in GHG emissions. The use of LNG in lorries and shipping can reduce emissions of various air pollutants (e.g. NOx) and in the case of shipping, can allow the sector to meet the requirements for decreasing the sulphur and nitrogen content in marine fuels used in the Emission Control Areas. In both cases the use of LNG can reduce greenhouse gas emissions, in particular when blended with liquid biomethane, provided methane emissions are minimised.
For international maritime shipping, LNG can play an important role as it is available in considerable amounts. With the exception of Norway, the take-up of LNG as ship fuel in Europe is still in an early stage, and key stakeholders typically identify three main barriers: the lack of adequate bunker facilities for LNG, the gaps in the legislative or regulatory framework, and the lack of harmonized standards. Most popular alternative is marine gas oil (MGO), but there is a variety of other alternative fuels including Ethyl/Methyl alcohols, some biofuels and hydrogen. Mainly for short sea shipping there is also some potential in hybridisation and electrification.
For road, many energy sources could be used for different types of vehicles, including vehicles powered by internal combustion engines, (plug-in) hybrids and electric vehicles (powered by batteries or fuel cells). For rail, the main alternative energy sources are electricity and biomass.
Renewable energy in the transport sector
According to Eurostat data, the EU share of renewable energy in transport reached 5.9% in 2014. Biodiesel remains the most widely used form of renewable energy in transport with 11.3 Mtoe in 2014, followed by bioethanol with 2.7 Mtoe.
A consumption of 1,549 ktoe of renewable electricity in transport was reported for 2014, the vast majority of it being consumed in non-road transport modes (i.e. rail).
EU biofuel consumption increased to 14.1 Mtoe in 2014, but still being below the peak levels registered in 2012. Consumption of biofuels that meet the EU sustainability criteria rose to 13.2 Mtoe, its highest level so far, representing 92.8% of EU biofuel consumption. The main difference between certified and not-certified biofuels is explained by Spain's failure to implement the legal framework in 2014 that would have officially certified its biofuel consumption.
The production of biofuels from non-land using feedstocks in the EU is increasing, the majority of which is produced from used cooking oil or waste animal fat. The share of food crop-based biofuels in the EU market is decreasing. However, the biofuel industry argues that double-counting provisions have so far only assisted the deployment of inexpensive conversion of used oils and waste fats.
A number of EU production facilities have already been producing advanced biofuels since 2009, often in conjunction with other bio-based products. Despite the important and continuous progress during the past 5 years, including the opening of commercial production facilities, the development of large-scale production capacity for advanced biofuels in the EU is still slow. It has been hampered by technological challenges and feedstock availability. The most viable business model will in most cases be based on an integrated bio-refinery approach that produces both biofuels and a range of other bio-based products.
Greenhouse gas emissions from transport
Emissions in transport did not show the same decline as those in other sectors (see
Figure 25
). Whereas in industry emissions started to decline as of the 1990s and in power generation they are below 1990 levels, in transport they kept increasing until 2007 (+32% for 1990-2007) and only since they have reduced as a result of past high oil prices, increased road vehicle efficiency and slower growth in activity as a result of the crisis. In 2014, GHG emissions from transport excluding international maritime represented about 23% of the total emissions, compared to 15% in 1990 - the base year for measuring progress in EU climate action, and 20% in 2000. Transport is therefore a sector with a significant role in energy and climate policy.
Figure 25: Evolution of greenhouse gas emissions by sector (1990=100), EU28

Note: * Transport includes international aviation but excludes international maritime; ** Other include fugitive emissions from fuels, waste management and indirect CO2 emissions
Source: EEA
Road is by far the main emitter of GHG from transport (see
Figure 26
). In 2014, it accounted for 72.8% of all GHG emissions from transport. Maritime and air transport follow with shares of 13% and 13.1% respectively. Rail transport contributed only 0.6% of GHG emissions.
Figure 26: Greenhouse gas emissions from transport by mode in 2013

Source: EEA
Historical data showing the split between the urban, inter-urban and intercontinental transport emissions is not available but model estimates indicate that about 23% of transport CO2 emissions originate from urban transport in 2015, 53% from inter-urban and 24% from intercontinental transport (see
Figure 27
).
Figure 27: Shares in EU transport CO2 emissions in 2015 (model estimates)

Source: EU Reference scenario 2016
Note: Estimates based on the PRIMES-TREMOVE model developed by ICCS- E3M-Lab
Transport is responsible for emissions both in the EU Emissions Trading System (EU ETS) as well as sectors outside the EU ETS.
Direct emissions from aviation account for about 3% of the EU’s total greenhouse gas emissions. The large majority of these emissions come from international flights. In 2008, the EU decided to include aviation activities in the EU ETS. These emissions now form part of the EU's internal 20% GHG emission reduction target for 2020.
Furthermore, and not often realised, most of the electricity consumed by transport is covered by the EU ETS - at present this is mainly rail but includes also trams, metro and trolleys. Around 66% of energy use in rail is electricity-based.
Figure 28: Domestic transport emissions and emissions from international aviation, EU28

Source: EEA
Transport is responsible for around a third of all emissions outside the ETS. The most important sector by far is road transport, responsible for around 94% of these non-ETS transport emissions. Almost three quarters of road transport emissions are due to cars and vans, and a quarter due to heavy duty vehicles.
Recent events have led some to question the reliability of emissions estimates from cars, due to the divergence between emissions as measured in the regulatory test-cycle and real driving emissions. However, total emissions from road transport are well known, as these are estimated based on total fuel sold. Projections about the future can be affected by the uncertain relationship of test-cycle emissions to real-world emissions. In general, projections do take into account that a test-cycle divergence exists.
Emissions from maritime transport related to the EU (ship voyages from and to EU ports) were estimated at about 195 Mt CO2 for 2005. After a decrease between 2008 and 2010 as consequence of the economic crises and the speed reductions (slow steaming), the emissions have been estimated by TNO to have remained at a more or less stable level by 2012 at 190 Mt CO2. However, maritime bunker fuels emissions based on fuel sold show a steep decline of 25% between 2008 and 2014, with emissions still being 16% lower by 2014 relative to 2005.
Pollutant emissions from transport
Whilst significant progress has been made since 1990 in reducing the emissions of air pollutants from transport despite the growth in activity within the sector, transport still makes an important contribution to air pollution. Transport is responsible for more than half of NOx emissions, and contributes significantly (around 15 % or more) to the total emissions of other pollutants (PM10, PM2.5, SOx and CO).
The range of policy measures undertaken in Europe to specifically address issues concerning air pollution has increased since 1990. Local and regional air quality management plans including initiatives such as low-emission zones in cities or congestion charges were set up in areas of high air pollution from transport. The different legal mechanisms for air quality management comprise: limit or target values for ambient concentrations of pollutants; limits on total emissions; and, for traffic in particular, regulation of emissions from the sector either by setting (EURO) emissions standards or fuel quality requirements.
Reductions achieved in the road transport sector are responsible for the vast majority of the overall reductions in transport. Nitrogen oxides (NOx) emissions from road transport decreased by 56% during 1990-2013 and particulate matter (PM2.5) emissions by 50%. Nevertheless, road transport represented the largest source of NOx emissions in 2013, accounting for 39% of total EU28 emissions, and an important source of PM2.5 emissions (13%). While emissions from road transport are mostly exhaust emissions arising from fuel combustion, non-exhaust releases also contribute (primary PM from tyre- and brake-wear, and road abrasion). The relative importance of the non-exhaust emissions has increased, as the introduction of vehicle particulate abatement technologies has reduced exhaust emissions.
In contrast, international aviation and shipping are the only transport sectors where emissions of air pollutants have actually increased since 1990 (except for SOx and PM from shipping). As emissions of pollutants from land-based sources decreases, there is a growing awareness of the increasingly important role of, in particular, the shipping sector.
Costs to society for local pollution are still very high at about 0.4% of GDP, according to a study by CE Delft
, and new evidence from OECD even shows much higher numbers (up to 6 times higher). Air quality in cities remains a fundamental challenge for public health.
Overall external costs of transport
External costs amount altogether to about 4% of GDP (lower estimates; the most important components being accidents, congestion, air pollution, climate change and noise).
The various modes of transport are responsible for externalities to a different extent. Most of the negative externalities come from road transport (climate change, local air and noise pollution, accidents and congestion). Aviation and maritime contribute to externalities related to climate change and pollution. Rail noise is a problem in certain parts of Europe; aviation also contributes to noise externality.
ANNEX II: Analytical work on low-emission mobility
Roadmap for moving to a competitive low carbon economy in 2050
The Roadmap to a low carbon economy showed that the 80% domestic reduction for the overall economy would be reached via different emission cuts in the various sectors. Transport would need to contribute with a 60% reduction, as a reflection of the fact that substituting oil is more costly in transport than in other sectors. The Roadmap concluded that the transition to a low-carbon society is feasible and affordable, but requires innovation and investments. To make the transition, the EU would need to invest an additional €270 billion (or on average 1.5% of its GDP annually) over the next 4 decades.
Energy Roadmap 2050
The Energy Roadmap 2050 set out four main routes to a more sustainable, competitive and secure energy system in 2050: energy efficiency, renewable energy, nuclear energy and carbon capture and storage. It combined these routes in different ways to create and analyse seven possible scenarios for 2050.
All scenarios showed that electricity would have to play a much greater role than now (almost doubling its share in final energy demand to 36-39% in 2050) and would have to contribute to the decarbonisation of transport and heating/cooling sectors. Electricity could provide around 65% of energy demand by passenger cars and light commercial vehicles by 2050. Efficient vehicles and incentives for behavioural change are also required. In transport, a mix of several alternative fuels will be needed to replace oil, with specific requirements for different modes. Biofuels may be the main option for aviation, long-distance road transport, and rail where it cannot be electrified. However, oil is likely to remain in the energy mix even in 2050 and will mainly fuel parts of long distance passenger and freight transport. The Energy Roadmap also showed that an increasingly important feature of the required technology shifts for the decarbonisation of the EU economy is the use of information and communication technologies (ICT) in energy and transport and for smart urban applications.
2011 White Paper on Transport
The 2011 White Paper on Transport defined a long-term vision until 2050 for a transport sector that continues to serve the needs of the economy and of the citizens while meeting future constraints: oil scarcity, growing congestion and the need to cut CO2 and pollutant emissions and improve air quality particularly in cities. To this aim, the White Paper put forward four broad areas of intervention: internal market, innovation, infrastructure, international aspects. For each of these areas, a ten-year programme was defined with 40 specific action points, containing a handful of specific initiatives. The strategy set in the White Paper is to a substantial degree based on low emission fuels, energy efficiency, better multimodality of transport and new technologies that should lead to optimised journeys.
The impact assessment accompanying the 2011 White Paper identified seven policy areas in which concrete policy measures could have a key role in stimulating the expected shift of the transport system to another paradigm (i.e. pricing, taxation, research and innovation, efficiency standards and flanking measures, internal market, infrastructure and transport planning). The impact assessment showed that isolated intervention in either one of the seven policy areas would not be capable of tackling at the same time and in a satisfactory way all the various problem drivers and all the elements of the specific policy objective (i.e. reducing GHG emissions, decreasing the oil dependency ratio, limiting the growth of congestion).
Following these considerations, three policy options have been designed to reach the 60% CO2 emissions reduction target by 2050. All three options envisaged action in all seven policy areas and had in common a certain number of initiatives. What distinguished them is the intensity of intervention that, depending on the option, was higher in some specific field and lower in others. More specifically, one option was designed to show the effect of policies that emphasise the rapid deployment of new powertrains, one option focused on the effect of policies that rely less on performance standards and on active technological deployment and more on managing mobility and on carbon pricing, and finally one option was designed as an intermediate approach. The impact assessment concluded that the intermediate approach is the preferred option since it offers the advantage of greater balance between system improvements and technological development. It would avoid the creation of a pervasive command and control approach to mobility, but it would not refrain from eliminating price distortions by internalising external cost of transport and by introducing smarter taxation.
The modelling results indicated that energy savings in the order of 45 to 90 Mtoe would be achieved by 2030 and 160 to 180 Mtoe by 2050 relative to the “no new policy” option. Over 55% by 2030 and 60% by 2050 of these energy savings originate from passenger transport.
Final consumption of oil in transport would decrease by 12 to 23% by 2030 and by about 70% by 2050, relative to the “no new policy” option. In the long term, this decline is compensated to certain extent by the rise in the electricity demand by the road and rail transport and the increased demand for biofuels, especially in aviation, inland navigation and long distance road freight, where electrification is not or less an option. Biofuels would represent less than 1% of energy demand in aviation and inland navigation by 2030 but reach about 40% of the energy consumption of the two modes by 2050. For long distance road freight, biofuels would provide about 11% of energy demand by 2030 and 37 to 41% by 2050, depending on the policy option. The role of biofuels in energy demand by passenger cars and light commercial vehicles would be more limited, at around 10% in 2030 and ranging between 15 and 25% by 2050. Electricity would provide about 1 to 4% of the energy demand by passenger cars and light commercial vehicles by 2030 and 20 to 60% by 2050.
As already explained, all policy options have been designed to reach the same 60% CO2 emissions reduction target by 2050 relative to 1990. However, the time profile of emissions reduction is different due to the various policy measures (and their timing) covered by each policy option. Thus, relative to the “no new policy” option, transport emissions would go down by 12 to 23% by 2030 and by about 70% by 2050.
All policy options would lead to reductions in nitrogen oxides emissions of about 7 to 21% by 2030 (40 to 50% by 2050) relative to the “no new policy” option; particulate matter emissions would be cut by 10 to 15% by 2030 (50 to 55% by 2050). In addition, external costs related to noise would be 4 to 18% lower by 2030 (32 to 46% lower by 2050) relative to the “no new policy” option. External costs related to congestion would be between +1% to -16% by 2030 (-3 to -26% by 2050) relative to the “no new policy” option. In particular, in the option designed to show the effect of policies that emphasise the rapid deployment of new powertrains the pricing signals are not sufficient to shift traffic away from road and congestion continues to pose a large burden on the competitiveness of European businesses and on the quality of life.
Active modal shift policies, which are projected to reduce road transport activity levels, would also contribute to improved road safety and to the reduction of death and injury, i.e. 0 to 4% reduction in external costs of accidents by 2030 and 2 to 27% cut by 2050 relative to the “no new policy” option. This improvement in road safety would benefit directly low income groups who experience a higher level of death and injury on roads than other groups. The large scale deployment of Intelligent Transport System is also expected to have positive effects on safety. The impacts on safety are lowest in the option designed to show the effect of policies that emphasise the rapid deployment of new powertrains.
Overall, the modelling results indicated that, compared to the “no new policy” option, the additional total costs for the transport sector would be between €640 billion and €1,193 billion by 2050, and €1,012 billion in the intermediate approach (i.e. preferred policy option), equivalent to an additional average yearly total costs relative to “no new policy” option of 0.2 to 0.4% of GDP (0.3% for the intermediate approach). The calculation of total costs – and therefore the comparison between options – does not include research and development costs and infrastructure costs referred to the upgrade and possible extension of the transport network.
In general terms, the modelling exercise showed that several policy instruments need to be used to put the transport system on a sustainable path, lowering CO2 emissions, oil dependency and congestion. It also showed that policy action has to be very ambitious to reach the objective.
2030 Climate and Energy Policy Framework
Although no sectoral target is included for transport, the impact assessment for the 2030 Climate and Energy policy framework showed that a cost-effective contribution from transport to the achievement of the 2030 targets, drawing on measures to be adopted by 2020, requires transport emissions being reduced by 17-20% below 2005 levels. This range is consistent with economy-wide energy efficiency improvements in the range of 27 to 30%.
Transport fuels in the EU ETS
In its conclusions on the 2030 Climate and Energy Framework, the European Council recalled the possibility for a Member State to including its transport sector in the EU ETS, under current legislation, and on a voluntary basis. Some stakeholders have called for including all road fuels in the EU under the EU ETS, while others have fiercely opposed this. The Impact Assessment for the 2030 Climate and Energy Framework discusses ETS scope expansion in chapter 7.8, as part of a mix of complementary policies. This section describes how road fuels inclusion would work technically, as well as the likely impacts of an inclusion.
Technical aspects of road fuels inclusion
In order to include the transport sector in the EU ETS, tax warehouse keepers would be required to surrender allowances for fuel sold to the transport sector. Tax warehouse keepers release fuels for sale on the market through excise duty points, at which point energy taxes become payable.
Including the road fuels sector through entities further downstream, such as individual vehicle owners, would likely put a large administrative burden on society, due to the large number of participants. At further upstream entities, such as refineries, it would be difficult to define the boundaries of the inclusion, as it is unclear at that stage to which sector the fuels or petrochemical feedstocks are destined.
As tax warehouse keepers already register transport fuel flows, the same information could be used for EU ETS inclusion. In many Member States, tax warehouse keepers register the amount of biofuels as well. This means that the additional administrative burden would reflect the additional associated activities in relation to participation in the monitoring, reporting and verification under the EU ETS, for the increased number of regulated entities. For fiscal reasons, monitoring requirements on tax warehouse keepers are strict, limiting the risks of fraud.
But while technically feasible, full inclusion of road fuels in the EU ETS would be a considerable undertaking. There are between 5,000 and 10,000 tax warehouse keepers for energy products in the EU, which means that the upper bound of this range represents a number similar to the around 11,000 stationary installations now covered by the EU ETS. It would be by far the largest scope expansion of EU ETS yet undertaken. Furthermore, while all tax warehouse keepers have administrative systems in place to track fuels, these systems are adapted to the needs of the taxation systems of different Member States. They may not currently distinguish fuels by CO2 content to the granularity necessary. Some level of harmonisation of regulation for tax warehouse keepers would therefore be required, especially if some subsectors (such as fuels for agricultural machinery) are exempted from EU ETS inclusion. Finally, a solution would need to be found to the issue of natural gas in transport, which does not pass through tax warehouse keepers.
Solving and implementing such issues would take time and require a broad political will and cooperation from Member States. For this reason, the EU wide inclusion of road fuels in EU ETS would be difficult in the short term. The EU ETS allows for opt-in of sectors at individual Member State level, and this could thus in principle also be done for transport. Such a voluntary approach at a smaller scale was mentioned by the European Council in its October 2014 Conclusion as a possible option. It would have the benefit that it would concern Member States already willing to adapt their legislation. Furthermore, technical learning could take place without posing significant risks to the integrity of the carbon market, as it's likely that only a small subset of total transport emissions would be involved.
Environmental impacts
The economic incentive provided by the carbon price would incentivise a fuel shift to lower carbon fuels, as well as more efficient transport. As a purely indicative example, we can use an estimate from the literature that the long-run price elasticity of fuel consumption by cars (as a function of elasticities of vehicle ownership, vehicle kilometres and fuel efficiency) is around -0.6 to -0.8. This suggests that an additional carbon price of around 10-40 €/tCO2, could, by raising retail fuel prices in the EU by around 2-7%, lower emissions by up to ~5% in the long term. In the short to medium term the effect could be more limited due to the low price elasticity of fuel consumption.
In other words, adding a carbon price to fuels would indeed reduce CO2 emissions in the road transport sector to some extent. It would also reduce air pollution. However, a relatively limited price incentive on fuels is insufficient on its own to significantly improve vehicle efficiency or drive technological change. Various market failures and cognitive biases, discussed elsewhere, prevent the level of impact required to ensure a full contribution to decarbonisation.
In the road transport sector, it is therefore typically deemed that price instruments should be deployed as complementary to vehicle standards, infrastructure deployment and R&D policies. It should also be noted that Member States could themselves decide to add a carbon price to their excise duties, attaining a reduction of emissions on their territory. Conversely, Member States with taxes well above the EU minimum could decide to compensate consumers for an EU-level price increase by lowering excise duties, thereby (partially) cancelling out the incentive.
On the other hand, if electrification of road transport would become a strong driver of reductions, it would lead to considerable increases in electricity demand, and thus increasing the emissions elsewhere in the ETS, in proportion to the carbon intensity of the additional electricity that is generated. As a result, the emissions of the transport and EU ETS sectors would become interlinked over the longer term and would interact in opposing directions. EU ETS prices would be affected as well. This would increase the economic logic to include emissions from both sectors under the EU ETS (so that within the EU ETS, increased electrification would not only lead to higher emissions from the power sector but also be linked to lower emissions from the transport sector).
Economic impacts, social and distributional issues
The economics of road fuels inclusion on the road transport sector would be similar to that of a carbon tax on fuels. The net economic and distributional impact would depend on the way the tax is recycled to consumers by the state. Economic impacts could be positive if taxes more harmful to growth were lowered.
Whether the carbon price is regressive or progressive will depend on the national context: while fuel costs can be a more important part of the consumption of lower-income households, higher income households tend to consume more transport fuels. Again, the distributional policies of the state determine the final impact. But choices made at EU level are important as well, for instance in relation to the distribution of the additional allowances to be auctioned for the transport sector. Diverging impacts between Member States for EU wide road fuels inclusion could be compensated by redistributing auctioning revenues, as is current practice in the EU ETS. Total EU wide additional auctioning revenues for EU wide road fuels inclusion would depend on the carbon price. They could amount to as much as €19 billion yearly by 2030, with a carbon price of around ~€25.
The emissions of EU road transport in 2013 were around 840 Mt. This compares to an overall EU ETS cap of over 2,084 Mt in 2013. Road transport emissions are projected to decrease in the future, but lowering available allowances to an even greater extent would create a significant new demand in the EU ETS for allowances, and thus reduce the surplus on the EU market. This in turn will result in a lower number of allowances in circulation, decreasing the number of allowances being placed in the Market Stability Reserve (MSR) and potentially resulting in a higher carbon price. The size of this additional demand, along with the adjustment of the cap, would determine the impact on the surplus, MSR and price. The impacts of the additional demand would need careful economic assessment: the resulting price increase would benefit sellers in the system but could disadvantage buyers with limited reduction options.
On the other hand, the impacts on the carbon price, if a limited number of small Member States decide to include road fuels in the EU ETS, is likely to be small. The small impacts on demand would in addition be counterbalanced by adjustments to the supply of allowances to be auctioned through the Market Stability Reserve.
Conclusion
Technically and politically, the EU-wide inclusion of road fuels in the EU ETS would be a significant undertaking. It would contribute towards reducing emissions in the road transport sector, but only to a limited degree and thus would only be a complementary measure to policies such as vehicle standards to improve vehicle emissions and infrastructure development. Impacts on environmental integrity in the short term, as well as on the carbon price would need to be carefully considered. On the other hand, in the longer term, it is clear that the emission profiles in transport and EU ETS sectors will interact through electrification, and that there could be a policy logic to putting them under the same cap.
The existing option of voluntary inclusion by specific Member States should not have a major impact on the EU ETS. It could provide Member States who so wish with additional flexibility on how to achieve non ETS targets, while allowing learning by doing both how to technically include transport in the ETS, and how it would impact both the ETS and transport emissions.
ANNEX III: Overview of policy measures
Further detail on the measures identified in sections 2 and 4 is provided below. They are presented according to the same main categories: low- and zero-emission vehicles; switching towards low-emission alternative energy for transport; efficiency of the transport system.
Low- and zero-emission vehicles
Car and Light Commercial Vehicle CO2 Regulations
As explained in section 2, Regulations have been put in place which set CO2 targets for new light commercial vehicles and passenger cars (collectively LDVs) by 2020/2021. The legislation requests the Commission to review the Regulations and if appropriate make proposals for CO2 emission targets for new cars and light commercial vehicles for the period beyond 2020, including possibly setting a 2025 target.
An extensive evaluation of the existing Regulations has been carried out as part of Regulatory Fitness and Performance Programme (REFIT). This identifies that while the Regulations have been largely effective and have delivered CO2 reductions at lower cost than originally foreseen, there are a number of areas where the Regulations could be improved. These include the test procedure (that measures the CO2 emissions) and the inclusion of energy using devices (e.g. car air conditioning) not included in the test procedure, the use of vehicle mass (weight) as the utility parameter (a way to differentiate between manufacturers' fleets), the upstream emissions from energy production and embedded emissions from vehicle manufacture.
The 2021 car target represents a reduction of 40% compared with the 2007 fleet average of 158.7 gCO2/km. The 2020 van target represents a reduction of 19% compared with the 2012 fleet average. This refers to the emission values established as part of the type approval process for new vehicles using the New European Driving Cycle (NEDC).
These percentage reductions in new vehicle emissions do not translate immediately into the same level of reduction in fleet emissions. The main reason for this time lag is the approximately 10-year life of vehicles. In addition, and as explained in box "More reliable fuel consumption and CO2 figures for consumers and regulators" in section 4.1.1, real world emissions are known to be higher than those measured in the test cycle. The available research indicates that real world CO2 emissions per kilometre driven have fallen since the introduction of the legislation, but that over time the gap has widened with significantly less impacts on overall GHG emissions in the new vehicle fleet in recent years.
There are a number of contributors to the observed gap. The main identified elements are:
ambient conditions which are not represented in the test;
ancillary energy consuming devices which are not activated during the test;
differing performance of CO2 reducing technology in test conditions, primarily because of the unrepresentativeness of the drive cycle;
exploitation of flexibilities in the measurement of CO2 in test conditions.
It is unlikely that the first of these has changed over the last decade, however there is strong evidence that the other three have all contributed to the increased divergence. Also electric vehicles can display a significant gap between energy consumption measured in the test cycle and in real driving.
In addition, for air pollutants, the discrepancies between real-driving emissions and emissions measured under the laboratory test procedure, in particular for diesel cars – which form a large share of the EU market, can be significant. In particular the NOx emissions of many diesel cars drastically exceed the values defined in the Euro emission standards. This has a significant negative impact on air quality, especially in urban areas.
Vehicle testing
The CO2 emission values of light duty vehicles are produced from type-approval tests that rely on the New European Driving Cycle (NEDC) test-cycle, which is outdated and insufficiently representative of real driving. To address this shortcoming, the European Commission is advancing rapidly on the introduction of the Worldwide harmonised Light vehicles Test Procedure (WLTP). On 14 June 2016, the technical regulatory committee gathering Member States representatives (Technical Committee of Motor Vehicles) voted in favour of the Commission's draft Regulation to introduce the WLTP in the EU. If the European Parliament and the Council do not object to the current text, the new WLTP test will become mandatory as from September 2017 for all new vehicle types (September 2018 for all new vehicles) and the new light duty vehicle efficiency requirements for the time after 2020 will be based on it.
The WLTP incorporates the following main improvements with respect to the NEDC:
The driving curve of the WLTP was designed on the basis of real driving data, while the NEDC was designed artificially on the "drawing board". Speeds and accelerations of typical driving are now properly represented.
The rules for the determination of the road loads have been significantly improved with respect to previously insufficiently defined areas and possible loopholes.
Test procedures for electric vehicles have been significantly improved and updated to technical progress.
As a result, the WLTP will provide significantly more realistic fuel consumption/CO2 values than the NEDC.
To strengthen the overall reliability of vehicle testing, the European Commission also proposed a major overhaul of the EU type-approval framework for motor vehicles. Under current rules, national authorities are solely responsible for certifying that a vehicle meets all requirements to be placed on the market and for policing manufacturers' compliance with EU law. The proposal for a new Regulation, adopted by the Commission on 27 January 2016, will make vehicle testing more independent, increase surveillance of vehicles already in circulation and introduce greater European oversight. Once the draft Regulation has been adopted by the European Parliament and Council, it will be directly applicable and will repeal and replace Directive 2007/46/EC.
Building on these initiatives, further work is being carried out to ensure the continued relevance and accuracy of the EU's vehicle emissions testing regime. This includes further work on the WLTP (Phases 2 and 3), which should cover all the rest of emission-related light duty vehicle testing, such as evaporative emissions. In addition, the Commission introduced a Real Driving Emissions (RDE) procedure to measure the NOx emissions of light duty diesel vehicles in real driving conditions which will be performed from 2017, but the second stage of this procedure will only become mandatory for all new vehicles in January 2021. This new procedure utilises portable emissions measurement systems (PEMS) and will be further developed and refined.
Car labelling
The car labelling Directive (Directive 1999/94/EC) requires EU Member States to ensure that relevant information is provided to consumers, including on fuel efficiency and CO2 emissions. It may influence consumers' choice in favour of cars which use less fuel and emit less CO2 and should also provide an incentive to manufacturers to reduce new car fuel consumption. The evaluation of the Car Labelling Directive shows that it was successful in increasing consumer awareness of the fuel economy and CO2 emissions of new passenger cars. However, the report identified a number of issues that prevented the Directive from being more effective in stimulating the uptake of vehicles with lower fuel consumption and CO2 emissions.
Heavy Duty Vehicle Strategy
About one quarter of road transport CO2 emissions (or some 5% of EU emissions) are estimated to be produced by Heavy Duty Vehicles (HDVs). The HDV strategy, adopted in May 2014, is the EU’s first initiative to tackle greenhouse gas emissions from trucks, buses and coaches. CO2 emissions from HDVs are currently neither measured nor reported. The strategy therefore focuses on short-term action to certify, report and monitor HDV emissions - an essential first step towards reducing them.
The development of the VECTO simulation tool and the implementation of the certification procedure using the VECTO output will support the envisaged Commission legislative proposals which would require fuel consumption and CO2 emissions from new HDVs to be certified, reported and monitored. This will contribute to a more transparent and competitive market and the adoption of the low-carbon technologies.
Weights & Dimensions
Heavy goods vehicles, buses and coaches in the EU must comply with certain rules on weights and dimensions for road safety reasons and to avoid damaging roads, bridges and tunnels. In 2015, Directive 96/53/EC has been amended by
Directive 2015/719/EU
which grants derogations on the maximal lengths to make heavy goods vehicles greener by improving their aerodynamic performance. This also provides the opportunity to make them safer by enabling vehicles to have a new driver cab profile that reduces blind spots in the driver's vision, including those under the windscreen. Derogations on weights are also allowed for vehicles powered by alternative fuels.
The Directive needs to be transposed by Member States in national legislation by May 2017. The impact assessment and its support studies estimated that these measures will considerably improve the aerodynamics of vehicles, saving approximately €5,000 per year in fuel costs for a typical long-distance lorry covering 100,000 km. This represents an improvement of 7 to 10 % of GHG emissions (or 7.8 tonnes of CO2) in 2030 compared to the baseline for the same long-distance lorry covering 100,000 km at speeds above 60 km/h, of which 5 to 8 % attributable to the rear aerodynamic devices, and 3 to 5 % to the new cabs. At the same time, the field of vision of the driver will be improved, helping to save the lives of 300 to 500 vulnerable road users such as pedestrians or cyclists every year.
Energy labelling of tyres
Tyres sold in the EU are subject to energy labelling requirements. Regulation (EC) No 1222/2009 provides information on fuel efficiency, wet grip and external rolling noise through clear pictograms. Tyre labels help consumers choose vehicle tyres that are more fuel efficient, have better wet braking and are less noisy. New tyres come with an energy label showing their energy efficiency class, ranging from efficiency class A (most efficient) to G (least efficient).
Tyres account for 20 to 30% of a vehicle’s fuel consumption; choosing energy efficient tyres results in fuel cost savings. Switching to the most energy efficient tyres can reduce fuel consumption by up to 9%. At a fuel price of €1.50 per litre, this would mean around €660 over the lifetime of the tyres (if it covers 65,000 km). The additional purchasing costs of energy efficient tyres thus may be compensated by the fuel savings, resulting in overall total savings over time.
Clean Vehicles Directive
Public procurement can be a powerful instrument for pushing the uptake of more energy efficient and clean, alternatively fuelled vehicles and kick-starting their large scale deployment in particular in captive fleets. Directive 2009/33/EC on the promotion of clean and energy-efficient road transport vehicles mandates public procurers to consider fuel consumption, CO2 and pollutant emissions when purchasing road transport vehicles, giving them various options to do so.
An evaluation of the Clean Vehicle Directive was completed in 2015. It is estimated that 53 to 475 thousand vehicles (or 0.4 to 3.5% of total vehicle purchases) were purchased annually under the Directive between 2012 and 2014, but for some segments the share can be significantly higher (e.g. buses, 17 to 75% of vehicle purchases). This translates into estimated annual CO2 emissions avoided of 54 to 676 thousand tonnes, which is however significantly less than the annual reduction of 1.9 million tonnes estimated in the 2007 impact assessment. In addition, it also resulted in significant reductions of operating costs and slightly lower air pollutant emissions. The Directive is estimated to have generated total benefits of €43 to 521 million and total costs of €35 to 431 million, resulting in a benefit: cost ratio of 1.2.
The conclusions of the evaluation show that the Directive is relevant, but has limited effectiveness and efficiency, and significantly lower impacts than estimated in the impact assessment. This can for an important part be attributed to the fact that the final Directive deviated significantly from the original proposal, as it included less harmonized monetization methodologies, introduced threshold values of the procurements the legislation applies to, and suffered from late transposition. While publicly procured vehicles represent a small share of the overall vehicle market when procurement thresholds are applied, the legislation remains a useful tool in stimulating the market for clean vehicles, as part of a more comprehensive approach to stimulate the market for clean and energy-efficient road transport vehicles. Particularly concerning specific vehicle segments (such as buses), the potential for stimulating the market for clean vehicles via public procurement is significant. In the framework of the Energy Union Package, a review has been announced for 2017.
Switching towards low emission alternative energy for transport
Fuel Quality Directive
The Fuel Quality Directive (FQD) , last amended by the ILUC Directive 2015/1513/EU, regulates aspects of fuel quality to address environmental and health concerns such as air pollutants from fuels while ensuring fuel and vehicle compatibility across Europe. It also contains binding sustainability criteria for biofuels and lays down the methodology for the calculation of the GHG intensity of biofuels.
Article 7a of the FQD requires fuels suppliers to reduce the GHG intensity (gCO2/MJ) of fuels supplied by 6% in 2020 compared to 2010. Article 7a mainly concerns road transport fuels but the recent amendment gives Member States the possibility to allow emission reductions in aviation to be taken into account.
Renewable Energy Directive
The use of renewable energy in transport is promoted by the Renewable Energy Directive 2009/28/EC (RED), amended by the ILUC Directive 2015/1513/EU, which requires 20% of energy in final energy consumption to be renewable in 2020 and has a transport sub-target requiring each Member State to have a 10% share of renewable energy in transport by 2020. The RED also provides a regulatory framework for biofuel sustainability to be applied across the EU, identical to that included in the Fuel Quality Directive.
The implementation of the Directive, including the design of the support schemes promoting renewable transport fuels, is the responsibility of Member States.
A mid-term evaluation study of the RED indicated that the objective of increasing the share of renewable energy in EU final energy consumption had been successfully met. Deployment of renewable energy across all sectors of the economy resulted in around 388 Mt of gross avoided CO2 emissions in 2013 and a reduction in the EU demand of fossil fuels of 116 Mtoe. Avoided imported fuel costs due to increased use of renewable energy amount to at least some €30 billion a year. Mandatory targets and adequate support schemes have contributed to driving down technology costs for renewable energy technologies.
In transport, the mandatory target has been important for the deployment of renewable energy in the sector, mainly through implementation of national blending obligations. Furthermore, EU-wide biofuel sustainability criteria, covering the 3rd largest world biofuel market with biofuel consumption of 0.7 Mboe/d, would not have been in place in the absence of the Directive.
Progress observed over the past five years towards the 2020 transport renewable energy target has been slow – a 5.4% share was achieved in 2013 and 5.9% in 2014. In 2014, Finland and Sweden were the only Member States to have already reached the 10% transport target (21.6% and 19.2% of renewables in transport respectively), while Austria was rather close to achieving it (8.9% share). Most of the EU Member States are around half-way to attain their 2020 objective. With less than 1% of energy from renewables in transport, Estonia (0.2%) and Spain (0.5%) are the worst performing Member States.
The main reason for the slow progress pace has been policy uncertainty at the EU level regarding biofuels policy, low competitiveness of biofuels in terms of prices alongside the increasing awareness that certain biofuel production pathways may increase overall greenhouse gas emissions when emissions from indirect land use change are taken into account. In addition, there has been a lack of commercially available alternative, second generation biofuels.
The 'ILUC' Directive
To address concerns about the indirect land use change (ILUC) impacts of biofuels, both the RED and the FQD Directives were amended by Directive 2015/1513/EU (so called "ILUC Directive”). The Directive introduced a cap on the amount of food or feed based biofuels (7%) that can be counted towards the 2020 target for renewable energy in transport. It also introduced an indicative sub-target for advanced biofuels to be set by Member States and contains a list of feedstock for biofuels that can be counted double towards the renewable energy target for transport. Incentives for the use of renewable electricity in transport were also scaled up through the extension of multiple counting.
European Alternative Fuels Strategy
In January 2013 the European Commission adopted a European Alternative Fuels Strategy to address the decarbonisation of the transport sector and air quality objectives, and also energy supply security and EU industry competitiveness. The initiative sets out a comprehensive strategy and an implementation roadmap, covering all modes of transport. It aims at establishing a long-term policy framework to guide technological development and investments in the deployment of these fuels and give confidence to consumers. The strategy advocated that there is no single fuel solution for the future of mobility and all main alternative fuel options must be pursued, with a focus on the needs of each transport mode (see
Table 16
).
Table 16: Modes and suitable alternative fuel types

Source: European Alternative Fuels Strategy
Each alternative fuel will have a different level of contribution towards the decarbonisation. Alternative fuel vehicles and vessels provide in most cases CO2 emission reductions on a well to wheel (WTW) basis (see
Table 17
).
Table 17: Overview of WTT, TTW and WTW GHG emissions of compact passenger vehicle applications,
|
Alternative fuels
|
WTT gCO₂/km
|
TTW gCO₂/km
|
WTW gCO₂/km
|
|
Conventional gasoline
|
29
|
156
|
185
|
|
Conventional diesel
|
25
|
120
|
145
|
|
BEV EU28 Mix*
|
78
|
0
|
78
|
|
PHEV EU28 Mix (Gasoline/Diesel)
|
38
|
75 / 68
|
111 / 105
|
|
FCEV Thermal gasification path EU28 Mix
|
62
|
0
|
62
|
|
FCEV Electrolysis path, EU28 electricity mix
|
125
|
0
|
125
|
|
Bio-diesel/B7
|
-101 to -22 / 14-19
|
125 / 181-184
|
44-103/137-140
|
|
E10/E20/E85
|
17 – 28 / 6-28 / -82 to 29
|
150 / 148 / 143
|
168-178/154-176/61-171
|
|
CNG (EU mix)
|
30
|
132
|
163
|
|
Biomethane
|
- 290 to -33
|
132
|
-158 to 99
|
|
HVO
|
-111 to -22
|
116
|
5-94
|
|
GTL
|
22 – 38
|
116
|
138-154
|
|
CTL
|
65 – 211
|
116
|
181 - 328
|
|
Wood
|
104 to -111
|
116
|
12
|
|
DME (natural gas/Coal /BTL)
|
38 / 218 / -104
|
117 / 117 / 117
|
137-154 / 334 / 12
|
|
LPG
|
17
|
142
|
160
|
Source: JEC study (2014)
Note: * With EU28 Mix data of 2013, BEV reaches a WTW of 64 gCO2/km instead of 78g/km (EU Mix 2009). Source: JRC recent work - to be published. WTT stands for well to tank, TTW for tank to wheel and WTW for well to wheel.
In waterborne transport, the use of LNG allows for about 20% less GHG emissions than bunker oil, a significant reduction of NOx, and nearly no sulphur emissions compared to heavy fuel oil (3.5% to 4.5% SOx) or particulate matter emissions. The use of LNG in maritime transport allows the sector to meet the requirements for decreasing the sulphur content in maritime fuels in the Sulphur Emission Control Areas. For road transport, the advantages of natural gas vehicles in terms of GHG emissions are also significant compared to petrol vehicles but less important against diesel vehicles. Nevertheless, it is expected that the new generation of advanced natural gas powertrains for either dual or single-fuel natural gas operation, or the higher use of biomethane blended with LNG, will increase significantly the GHG's emissions reduction from LNG vehicles including a reduction of the emissions of unburned methane. The use of LNG in road transport has also the advantage of low pollutant emission levels (mainly NOx) and particulate emissions close to zero. In addition, the evidence for fugitive emissions and methane leakages along the entire value chain would need to be considered.
Enhancing the share of renewables in alternative fuels will further reduce CO2 emissions. In this context, renewable electricity and advanced biofuels (including biokerosene and biomethane) are the most promising alternatives to increase the share of renewable energy in transport and for its decarbonisation.
The Strategy has indicated four priority fields for further EU action: 1) addressing alternative fuels infrastructure; 2) developing common technical specifications; 3) addressing consumer acceptance and 4) addressing the technological development, including advanced biofuels production. Priorities were set according to the stage of technological maturity and market development as well as future prospects of the different fuels, focussing on infrastructure, technical specifications, consumer information, coordination of public expenditures to reduce costs and improve impacts, and R&D.
Several measures to implement the European Alternative Fuels Strategy could be envisaged:
1)addressing technological development, including advanced biofuels production. Specific technology roadmaps for alternative fuels and electrification will be developed in the frame of the Strategic Transport Research and Innovation Agenda (STRIA). Other measures relate to e.g. electro-mobility - continue funding for research and demonstrations for vehicles through the European Green Vehicle Initiative (EGVI) but also deployment of infrastructure through Connecting Europe Facility and structural funds, facilitating the deployment of European based battery competence centres; natural gas - continue funding for research and demonstrations for vehicles through the EGVI but also deployment of infrastructure through Connecting Europe Facility and structural funds; hydrogen – Fuel Cells and Hydrogen Joint Undertaking to continue developing hydrogen transport solutions for increased performance and for reducing cost of vehicles and hydrogen production, developing a platform of EU industry to ensure EU industry competitiveness; biofuels - developing financial instruments to trigger the deployment of advanced biofuels production capacity in Europe for aviation, developing a framework for EU harmonised incentives for the aviation industry.
2)addressing alternative fuels infrastructure and its integration to the energy system, e.g. developing dedicated financial instruments for alternative fuels deployment (Connecting Europe Facility/European Fund for Strategic Investments); for electro-mobility – addressing the interoperability, the cost of connections of fast charging points and reinforcing local grids through smart grids, addressing the private charging points in buildings; for natural gas – support higher biomethane blending in natural gas used in transport and the uptake of LNG for shipping.
3)developing common technical specifications, e.g. standards for interfaces between vehicle and infrastructure; standardisation, protocols and test procedures for smart charging; harmonization of rules for homologation of vehicles (also to replace batteries in electric vehicles by higher capacity batteries coming into the market).
4)addressing consumer awareness, acceptance and market uptake, e.g. setting up together with the CEN/CENELEC a fuel compatibility labelling system to reassure confidence of users when using alternative fuels, developing a methodology of price comparison of alternative fuels and create a platform to promote the use of this methodology in Member States, setting up an Alternative Fuels Observatory (EAFO) as a reference website for user information.
Directive 2014/94/EU on the deployment of alternative fuels infrastructure, part of the 2013 Strategy, was adopted by the European Parliament and the Council on 29 September 2014. It requires Member States to submit to the Commission national policy frameworks for the market development of alternative fuels and their infrastructure by November 2016. In addition, it foresees the use of common technical specifications for recharging and refuelling stations and paves the way for setting up appropriate consumer information on alternative fuels, including a clear and sound price comparison methodology. The required coverage and the timing by which it must be put in place by the Member States are provided in
Table 18
.
The national policy frameworks will be assessed by the Commission and a report including their assessment will be published by November 2017.
Table 18: Deployment of alternative fuels infrastructure
|
|
Coverage
|
Timing
|
|
Electricity in urban/suburban and other densely populated areas
|
Appropriate number of publically accessible points
|
by end 2020
|
|
CNG in urban/suburban and other densely populated areas
|
Appropriate number of points
|
by end 2020
|
|
CNG along the TEN-T core network
|
Appropriate number of points
|
by end 2025
|
|
Electricity at shore-side
|
Ports of the TEN-T core network and other ports
|
by end 2025
|
|
Hydrogen in the Member States who choose to develop it
|
Appropriate number of points
|
by end 2025
|
|
LNG at maritime ports
|
Ports of the TEN-T core network
|
by end 2025
|
|
LNG at inland ports
|
Ports of the TEN-T core network
|
by end 2030
|
|
LNG for heavy-duty vehicles
|
Appropriate number of points along the TEN-T core network
|
by end 2025
|
The impact assessment accompanying the proposal for the Directive 2014/94/EU has indicated the lack of recharging/refuelling infrastructure, and the inability of market forces to fill this gap, as a fundamental barrier. A market failure in the provision of recharging/refuelling infrastructure affects particularly the deployment of three alternative transport fuels: electricity, hydrogen, and natural gas (LNG and CNG). The other main alternatives to oil – biofuels and liquefied petroleum gas (LPG) – are less concerned. The availability of recharging/refuelling infastructure is not only a technical prerequisite for the functioning of alternative fuel vehicles, but also one of the most critical components for consumer acceptance. Technological maturity of alternative fuel vehicles and vessels has been convincingly proven in large-size European projects, but those transport means remain disfunctional without at least a basic network of refuelling/recharging points. Without removing the ‘chicken and egg’ problem between vehicles and infrastructure, all other efforts to allow efficient market choices among technologies risk to remain ineffective.
The impact assessment also showed that investing in a minimum recharging/refuelling network is the most efficient way to promote alternative fuel vehicles. While infrastructure alone has no major direct impact, an intervention on the refuelling/recharging network can have a very large and positive effect in combination with other initiatives targeted at the introduction of cleaner vehicles. Mainly as a result of increased deployment of electric vehicles, including plug-in hybrids, oil consumption may decrease by 0.3 to 0.9% by 2020 relative to the baseline, while CO2 emissions would go down by 0.2 to 0.3% (2.5 to 3.2 Mt of CO2) and NOx emissions by 1.4 to 2%. Particulate matter emissions follow a similar pattern to NOx emissions. In addition, external costs of noise are reduced by about 0.1 to 0.2% during the same period. In the medium to long term perspective, about 0.9 to 1.3% CO2 emissions reduction (76 to 81 Mt of CO2) could be achieved by 2030, relative to the baseline, and 1.1 to 3.4% (138 to 158 Mt of CO2) by 2050. Overall, avoided fuel consumption over the lifetime of the alternative fuel cars, heavy duty vehicles and vessels whose uptake would be enabled by this minimum network would amount to €17.5-37.7 billion, while the energy security benefits would add €3.8-8.3 billion and the lower impact on the environment can be monetised to be around €8.9-12.5 billion.
In 2015 the European Commission published a report on the "State of the Art on Alternative Fuels Transport Systems in the European Union" based on the contribution of the Expert Group on Future Transport Fuels. The report covers electricity, hydrogen, liquid biofuels, natural gas (including biomethane), synthetic & paraffinic fuels and LPG. The analysis covers the availability, maturity of the technology, vehicles and infrastructure, production costs for fuels, vehicles and infrastructure, emissions and energy efficiency. It provides recommendations for consideration by: the Commission, the Council and the European Parliament, the Member States, the European Committee for Standardisation and the EU industry.
In addition, a study by CE Delft and TNO analyses the development of the LNG market for shipping in the EU. At present, LNG is available as a bunker fuel for maritime shipping at seven EU sea ports. Several other ports are preparing for LNG bunkering. There are currently about 100 LNG-fuelled ships in the world fleet (excluding LNG tankers), and this number is expected to double in the next few years. In this context, the study provides a qualitative analysis of the most important drivers and barriers with respect to the use of LNG as a bunker fuel. In addition, it provides a quantitative analysis of the economic feasibility of the use of LNG in ten ports and develops scenarios for the uptake of LNG as a bunker fuel by 2030.
The scenarios quantified in the study assume that by 2025 LNG bunkering facilities will be available in all TEN-T core ports because of the implementation of Directive 2014/94/EU, and that from 2020 onwards the Sulphur Directive will require ships sailing to any EU port to use low sulphur fuels or a scrubber with equivalent emissions. According to the study, LNG bunker demand in the central scenario could be between 0.4 and 2.8 million tonnes by 2030, leading to NOx emissions reductions of 350 to 2,300 tons, SOx reductions of 0.5 to 3.2 tons, PM emissions reductions of 0.4 to 2.6 tons and CO2 emissions reductions of 150 to 1,100 ktons relative to the baseline in 2030.
The main drivers of demand for LNG identified by the study are environmental regulations, especially the Sulphur Directive, and the price differential between LNG and other fuels. The following barriers are identified: the uncertainty about the availability of LNG in ports, the uncertainty about technical and safety standards, and the uncertainty about the second hand-price of LNG ships.
Other studies by DNV/GL and PWC and by PWC and MSL provide a comprehensive analysis of the EU framework on LNG-fuelled ships.
Electricity Market Directive
Directive 2009/72/EC contains provisions for Member States to analyse the costs and benefits of the roll out of smart meters (and to roll out those meters to at least 80% of all consumers by 2020 if benefits outweigh costs).
Integrating variable renewables to the electricity grid requires the demand to become increasingly flexible. This means that the electricity market design needs to encourage consumers to shift demand to high production times. For this to happen, the consumer needs to have access to the technical tools to manage demand (smart meters) and get a monetary incentive to shift demand, either directly (e.g. through dynamic electricity tariffs) or indirectly through demand response service providers (e.g. aggregators) who remunerate consumers for their flexibility.
Adding new loads – such as electric vehicles – bring additional challenges to the electricity network. Efficiently integrating those new loads will only be possible if the charging is done at high production times and during those periods when there is no network congestion. Under the ongoing market design initiative, the Commission is currently analysing options to strengthen the role of flexibility by accelerating the deployment of smart metering systems, encouraging the use of dynamic electricity pricing contracts, facilitating market access of aggregators and revisiting the structure of distribution network tariffs. Such strengthened rules are also aimed at providing a business case for smart charging.
Efficiency of the transport system
Road pricing and internalization
The internalisation of external costs generated by transport operations can be an efficient way of reducing the negative impacts of transport activity. CO2 emissions are one of the main negative externalities caused by transport along with air pollution, congestion, noise, accidents etc. The 2011 White Paper on Transport set a roadmap for gradually internalising external costs in the sector. The ultimate goal was to move towards full internalisation in all modes by 2020.
In monetary terms, currently the most important measure having the effect of internalising external costs in transport is the taxation of fuel. This is in line with the findings of the Commission’s report on taxation trends in Europe, which showed that while non-energy related environmental taxes on transport amounted to around 0.5% of GDP in 2012, taxes on transport fuels represented around 1.4% of GDP (about €188 billion in 2012).
Fuel taxes have multiple objectives and in most cases are not formally linked to CO2 emissions; only some Member States have an explicit CO2 tax in place. Nevertheless, fuel taxation is directly correlated to fuel consumption and CO2 emissions and therefore represents an appropriate instrument for internalising the climate change externality. If one were to consider the current fuel tax levels as internalising climate costs only (from exhaust CO2 emissions), then translating the minimum tax levels of the Energy Taxation Directive into a carbon price would result in €124.5 and €157 per tonne of CO2 for diesel and gasoline, respectively. Moreover, many Member States apply rates that are higher than the minimum levels stipulated in the EU law.
The amount of fuel taxes collected from transport (€188 billion) implies that CO2 emissions from road, rail and domestic navigation (857 Mt in 2012) are charged an average of €219 per tonne of CO2.
Besides fuel taxation, infrastructure charging is another important measure in internalising transport externalities. Directive 1999/62/EC (the "Eurovignette" Directive) provides a detailed legal framework for charging heavy goods vehicles (HGVs) for the use of roads. The main aim of the Directive is to eliminate distortions of competition between transport undertakings by achieving step-wise harmonisation of vehicle taxes and establishment of fair mechanisms of infrastructure charging. Nevertheless, by first allowing then making differentiation of infrastructure charges according to Euro classes mandatory, it did contribute to fleet renewal and thus to the reduction of emissions of air pollutants.
An evaluation of EU road charging policies took place in 2013.
According to the evaluation, reducing air pollution has been achieved by Euro class-differentiation of network-wide tolls. Fleet renewal due to tolls differentiated by Euro class was found to be significant in Germany, where the effects of road pricing were reinforced by government incentives to purchase Euro V trucks. The use of vignette systems has had less impact compared to distance-based tolls. In countries with tolls differentiated by Euro class, the share of vehicle-kilometres is proportionately higher for cleaner trucks compared to the fleet composition. Generally, the “mileage is cleaner than the fleet”, i.e. newer trucks tend to be used more, but this effect appears to be lower in countries with vignettes. Euro class-differentiated tolls also encourage greater use of cleaner vehicles engaged in international transport from non-tolled countries.
Some evidence was found of improvements to transport efficiency due to tolls, whereas vignettes have had no discernible effect. The introduction of the tolls in Germany and Austria coincided with a decrease in the average distance travelled by trucks. The fact that the cleanest vehicles have been most used indicates that differentiated road pricing (especially in the form of tolls) has had a positive impact on the use of the available vehicle fleet.
There has been limited use of congestion pricing, but where it has been introduced it has proved to be an effective instrument to reduce congestion. In the Czech Republic, a significantly higher toll rate for trucks on Friday afternoons on the network-wide toll led to a reduction in Friday afternoon peak traffic by 15%. In France, increasing toll rates during the weekend rush hour on several motorway sections resulted in a transfer to off-peak periods of 8-12% of traffic. Differentiated charges in France apply to passenger transport as well, which is thought to be able to adjust travel times more easily compared to freight. With regard to modal shift, while there has been some minor increase in the share of rail freight transport, no significant evidence was found on such effects of road charging in Germany. In Austria, there has been a clear modal shift in freight transport since 2004, when distance-based tolls were introduced for heavy goods vehicles. This however was only one of a handful of other (notably fiscal, financial and regulatory) measures in support of rail and combined transport.
The effect on decarbonisation has been limited so far, as tolls remain small compared to the overall costs of road transport, and because road transport is characterised by low price elasticity. Furthermore, tolls apply on a small portion of the network, and therefore concern only a small portion of road traffic.
Providing correct price signals and reducing disparities in road charging policies across the EU could decrease the negative environmental and health impacts of road transport, reduce congestion on TEN-T network and eliminate discriminatory practices in the internal market. Achieving wide-scale interoperability of electronic tolling services in the EU could reduce the setup and operation costs of electronic tolling, as well as facilitate cross-border movement of goods and people by reducing the cost and burden of compliance with the obligation to pay tolls.
The improvement in the functioning of the Eurovignette and European Electronic Tolling System (EETS) system in the EU is also expected to have positive impacts on CO2 and air pollutant emissions from the road transport sector. These positive impacts would be achieved through better organisation of transport, leading to a reduction in transport demand and consequently a reduced consumption of fuel. An analysis performed in 2013 by Ricardo-AEA estimated a maximum reduction in gasoline consumption of 2.3% compared to the baseline, and of 1.6% for diesel. These reductions in fuel consumption would translate into a decrease of 1.7% in CO2 emissions from the road sector in the EU. The modelling results do not take into account the potential of congestion charges to reduce fuel consumption and CO2 emissions which are linked to the stop-and-go traffic on congested links. Thus, depending on the way the tolls are designed they can send transport users price signals to better organise transport (e.g. avoiding single occupancy in passenger cars, consolidation of freight shipments during rush hours) and as a result further reduce CO2 emissions and air pollutants. In addition, possible differentiation of infrastructure charges for heavy goods vehicles according to CO2 emissions could contribute to a faster uptake of more energy-efficient vehicles - in a similar way the differentiation of infrastructure charges according to EURO classes contributed to fleet renewal and to the reduction of emissions of air pollutants.
Intelligent Transport Systems
Intelligent Transport Systems (ITS) can significantly contribute to a cleaner, safer and more efficient transport system. The ITS Action Plan suggested a number of targeted measures with the goal to create the momentum necessary to speed up market penetration of rather mature ITS applications and services in Europe. A new legal framework (Directive 2010/40/EU) was adopted to accelerate the deployment of ITS across Europe. It aims to establish interoperable and seamless ITS services while leaving Member States the freedom to decide which systems to invest in. Under this Directive the European Commission adopts specifications (i.e. functional, technical, organisational or services provisions) to address the compatibility, interoperability and continuity of ITS solutions across the EU.
One lesson learned from the mid-term evaluation of the ITS Action Plan related to the need to ensure that standards resulting from the standardisation efforts provide a sufficiently flexible environment and are technologically neutral. In order to ensure that they are appropriate for the needs of the industry and the latest technological development, stakeholders should actively participate in the standardisation process.
In road transport, Collaborative Intelligent Transport Systems (C-ITS) typically involve communication between vehicles (vehicle-to-vehicle, V2V), between vehicles and infrastructure (vehicle-to-infrastructure, V2I) and/or infrastructure-to-infrastructure (I2I). The benefits span a range of areas, including improving road safety, reducing congestion, optimising transport efficiency, enhancing mobility, increasing service reliability, reducing energy use and environmental impacts, and supporting economic development.
In the framework of the Energy Union Package, a master plan on the deployment of C-ITS has been announced for 2016. To support the shaping of this strategy, the Commission has set up a dedicated C-ITS Platform bringing together a wide range of stakeholders, with the aim to create a shared vision of options for overcoming issues which hamper the co-ordinated deployment of C-ITS and supporting their actual deployment. The final report and recommendations of the C-ITS Platform were finalized on 21 January 2016.
A Cost Benefit Analysis (CBA) study assessed the impacts of potential deployment scenarios. Estimates are that deployment of relatively mature technologies across Europe could by 2030 lead to annual reductions of: 1.2% in fuel consumption and CO2 emissions (respectively 2.4 Mtoe and 7.5 Mt of CO2, or €1.4 billion and €140 million), 2 billion hours spent in traffic (€10 billion), 7% in accidents (€3.4 billion), and 0.4-0.7% in pollutants emission (€33 million). It also estimates that this deployment can be very cost-effective (discounted cost-benefit ratio of 2.8 up to 2030). In addition, a high deployment scenario was designed to represent the impact of using the cellular network to provide V2I services; it showed annual reductions of: up to 2.5% in fuel consumption and 2.7% in CO2 emissions (respectively 5.3 Mtoe and 16.5 Mt of CO2), 2.6 billion hours spent in traffic, and 0.6-1.2% in pollutants emission.
Multimodal travel planning is a key element of Intelligent Transport Systems (ITS) deployment. With its vision of seamless door-to-door mobility, the 2011 Transport White Paper stresses further integration of the different transport modes to make mobility more efficient and user-friendly. Online information, electronic booking and payment systems integrating all means of transport should facilitate and promote multimodal travel.
The Commission Staff Working Document "Towards a Roadmap for delivering EU-wide multimodal travel information, planning and ticketing services" describes the challenges that need to be addressed, and a coherent approach to mobilize a series of instruments, in order to create a framework supporting more comprehensive travel information, planning and ticketing services to emerge in the EU, including notably: specifications for EU-wide multimodal travel information services and for real-time traffic information services (both also foreseen under the ITS Directive); and activities funded under Horizon 2020 ("Smart, green and integrated transport" Challenge) and Connecting Europe Facility.
There is a large travel demand for cross-border journeys within the EU. In 2013 there were 300 million cross border journeys made by EU-citizens requiring at least one night stay. If also including those trips made by tourists within the EU each year (600 million) and single day return trips, the overall figure would be even higher. It is estimated that 214 million cross-border trips are made into either train stations or airports every year by EU residents with around 50% of the last mile made by taxi or private car. If, through more comprehensive multimodal travel information, an estimated 10% of those last mile trips were shifted to sustainable modes, this would reduce the distance travelled by car by 163 million km.
According to the outcome of a pilot project that was commissioned in 2014 (All Ways Travelling), it was found that more effective network management and more efficient transport of people through more efficient journeys and optimized travel choices reduce travel time. Relative to the baseline this could lead to some 3% shift of vehicle-km for passenger cars at EU level, mainly towards rail and road public transport. In terms of environmental impacts, it would lead to about 13 Mt CO2 emissions saved, 18 ktons of NOx-equivalents (NOx, CO, HC) and 0.1 ktons of particulate matter saved per year.
Combined Transport Directive
Directive 92/106/EEC established common rules for promoting combined transport (CT) in the EU in an effort to curb the negative externalities of road transport. CT is a multimodal transport with intermodal load units (such as containers), and in which the road leg is limited and the major part of the route is carried out by rail, inland waterways or maritime transport. The objective of the CT Directive is to promote combined transport as an alternative to road transport, and thus contributing to road traffic safety, reduced congestion and environmental pollution, as well as better management of transport resources.
According to the REFIT evaluation of the Directive, in terms of impacts, it has been estimated that the shift from road to CT transport has brought along an annual saving of €2.1 billion (in 2011) in external costs, of which €607 million are attributed to air pollution and €366 to GHG emissions. The shift from road to rail/road CT has saved in 2011 (compared to road only transport) 7.3 Mt of CO2, while the shift to inland waterways has saved 0.96 Mt of CO2.
The CT Directive has considerably contributed to the development of the CT. The CT operations in the EU have quadrupled since 1992 and the CT Directive helped to shift a considerable amount of freight away from road. However, the general freight transport volumes have grown even more, and thus it has not been possible to considerably reduce the share of road transport.In addition, there are shortcomings in the transposition and implementation caused by somewhat ambiguous language of the Directive, the diverging transposition and implementation at Member State level and the outdated provisions.
The Energy Efficiency Directive
Directive 2012/27/EU contains several provisions of importance to energy demand reduction and management, as well as increased use of renewable electricity, including in transport sector. They include inter alia:
Achieving new savings of 1.5% of final energy sales annually;
The development of National Energy Efficiency Action Plans (every three years) – a framework for national strategies on energy efficiency measures in different sectors, including transport;
An obligation for public procurement for energy efficient products, services and buildings (covering also the purchase of electric vehicles);
Provisions supporting the rollout of smart meters for electricity by 2020;
Provisions for encouraging demand response;
Provisions related to the protection of the rights of consumers to access data.
Those actions should also support the transition of the energy system towards increased use of electric vehicles. A number of Member States have already envisaged actions in the transport sector in view of reaching their national energy efficiency targets by 2020. However, for the energy saving obligation, Member States were allowed to exclude the final energy consumption in transport from the baseline, a provision which was used by all but one Member State and resulted into a 33% lower baseline. Thus, use of the energy saving obligation in transport sector has been limited. Nevertheless, Member States proposed alternative measures targeting end-use in transport and the expected cumulative savings from these measures amount to 6% of all savings by 2020.
Urban Mobility / Smart Cities
The EU urban mobility policy is summed up in the 2013 Urban Mobility Package, comprising a Communication and Guidelines on Sustainable Urban Mobility Plans (SUMPs), and four Staff Working Documents on City Logistics, Access Regulation, Urban Road Safety and Urban ITS. The actions/initiatives announced in the Urban Mobility Package are currently under implementation and cover various non-binding measures that would help and encourage cities in designing and implementing ambitious measures through SUMPs.
A JRC study estimated that the potential CO2 emissions reductions of 21 policy measures found in SUMPs ranges between 15 and 18 Mt of CO2 for 2030, equivalent to 7 - 8.8% emissions reduction compared to 2010, if all measures were implemented in the whole of the EU. The effects of the measures were defined through their ability to: avoid unsustainable transport practices; shift from unsustainable to sustainable transport modes; improve the current behaviour in transport activities (see
Table 19
).
All in all, improving urban mobility has a high potential to reduce the CO2 emissions from transport and especially high exceedances of air pollutants that are widespread over European urban areas. The SUMP concept is a way for dealing with the complexity of urban mobility which can stimulate a shift towards cleaner and more sustainable transport modes, but its effectiveness will depend on the level of ambition of the measures adopted and the specificities of urban context.
Table 19: Potential CO2 reduction by measure for urban transport
|
Measure
|
Avoid
kt of CO2
|
Shift kt of CO2
|
Improve kt of CO2
|
Potential
CO2 reductions
in kt of CO2
|
|
Investment and maintenance, including safety, security and accessibility
|
255 - 319
|
204 - 256
|
255 - 319
|
713 - 894
|
|
Public transport coverage (line density, stop density, walking distances between stops) & public transport frequencies.
|
408 - 511
|
306 - 383
|
204 - 256
|
917 - 1 150
|
|
Interoperable ticketing and payment systems
|
153 - 192
|
255 - 319
|
64 - 80
|
471 - 591
|
|
Travel information provision systems
|
-
|
-
|
-
|
-
|
|
Taxi services (individual and collective)
|
204 - 256
|
170 - 213
|
204 - 256
|
578 - 724
|
|
Dedicated walking and cycling infrastructure investment and maintenance & Bike sharing schemes
|
306 - 383
|
408 - 511
|
68 - 85
|
781 - 979
|
|
Improvement of the efficiency of city logistics by the use of ICT
|
408 - 511
|
-
|
544 - 681
|
951 - 1 192
|
|
Measures to improve the energy efficiency and environmental performance of vehicles and/or use of alternative modes.
|
153 - 192
|
204 - 256
|
255 - 319
|
612 - 767
|
|
Corporate, school and personalised mobility plans (or workplace travel plans)
|
408 - 511
|
204 - 256
|
68 - 85
|
680 - 852
|
|
Car sharing & carpooling schemes.
|
255 - 319
|
(-17) - (-21)
|
204 - 256
|
442 - 554
|
|
Telecommunications
|
306 - 383
|
510 - 639
|
204 - 256
|
1 019 - 1 278
|
|
Multimodal connection platforms
|
102 - 128
|
204 - 256
|
-
|
306 - 383
|
|
Multimodal travel information provision
|
331 - 415
|
119 - 149
|
399 - 500
|
849 - 1 065
|
|
Park and Ride areas
|
204 - 256
|
102 - 128
|
204 - 256
|
510 - 639
|
|
Reallocation of road space to other modes of transport, e.g. dedicated bus lanes
|
306 - 383
|
408 - 511
|
272 - 341
|
985 - 1 235
|
|
Parking management
|
178 - 224
|
340 - 426
|
263 - 330
|
781 - 979
|
|
Dynamic traffic management measures
|
204 - 256
|
-
|
204 - 256
|
408 - 511
|
|
Low speed zones
|
153 - 192
|
255 - 319
|
68 - 85
|
476 - 596
|
|
Information and marketing campaigns
|
187 - 234
|
204 - 256
|
238 - 298
|
629 - 788
|
|
Promotion of eco-driving
|
204 - 256
|
(-102) - (-128)
|
51 - 64
|
153 - 192
|
|
Congestion charging zones (area and cordon charging)
|
815 - 1 022
|
408 - 511
|
272 - 341
|
1 495 - 1 874
|
|
Low emission zones
|
204 - 256
|
306 - 383
|
340 - 426
|
849 - 1 065
|
|
Totals
|
5 742 - 7 197
|
4 485 - 5 621
|
4 379 - 5 488
|
14 605 - 18 306
|
|
Source: Calculated from the scorings based on experts' opinions in the KONSULT, EC-FREIGHT, EPOMM and TransProd studies.
|
|
Note: * All negative values refer to an increase in car use because congestion and/or overall cost goes down. **- stands for not available
|
If done rightly, smart transport and mobility services offer unique opportunities for decarbonisation of the transport sector, particularly in an urban context. However, innovations are rolled out on the back of slowly changing infrastructures. Markets are fraught by uncertainties about user needs, acceptance and profitability. Better collaboration between public authorities, companies and research will help taking innovations from niche to mass market. This is the core objective of the European Innovation Partnership on Smart Cities and Communities and its action clusters, which form the backbone of the virtual marketplace with more than 4,000 participants registered. Among others, two initiatives were launched to establish dynamic market places for smart electro-mobility and smart mobility services, which are backed by 25 cities and 50 companies already and seeing rapid growth throughout 2016.
With urban and peri-urban transport often directly managed by local and regional authorities, Covenant of Mayors signatories have a powerful lever to act on decarbonising transport, whilst improving citizens' quality of life and contributing to the fight against climate change in general. Over 55% of signatories have included transport-related measures in the Sustainable Energy Action Plans (SEAPs). Based on the estimated GHG emission reduction declared in signatories' SEAPs, by 2020 the emissions in the transport sector could be reduced by 19% (36 MtCO2-eq) compared to the baseline year.,
Preparing such a pipeline of projects needs adequate assistance. The Commission has expanded the successful EIB ELENA facility to cover both energy and transport projects, enabling cities to plan large-scale proposals for roll out of innovative urban mobility action.
Road market functioning (market access rules) – road haulage
Regulation (EC) No 1072/2009 lays down the provisions to be complied with by undertakings that wish to operate on the international road haulage market and on national markets other than their own (cabotage). One of the objectives of the Regulation is to optimize transport operations by reducing the number of empty runs (trucks travelling unloaded). This potentially could lead to less fuel consumption and therefore to reduced carbon emissions.
Although empty running cannot be avoided completely, there is some scope in reducing the amount of empty running whenever a vehicle registered in one Member State drives between two points in another Member State, as shown in the report on the State of the Union Road Transport Market of 2014. Levels of empty running remain high in national transport activities. The rate of empty running for domestic hauliers carrying out national transport is close to 25%. However, in case of foreign trucks travelling national trips in a Member State other than the one in which they are registered, this rate stands at close to 50%.
The cabotage accounted for 2.3% of national transport activity in 2014; its share has roughly doubled between 2004 and 2014. The strong increase in cabotage activities is partly due to the lifting in 2009 and 2012 of special transitional restrictions on hauliers from most countries that joined the EU in 2004 and 2007, respectively.
Cabotage grew by 45% between 2010 and 2014 but overall still accounts for a relatively small share of total freight activities and it is mainly concentrated in some Member States, such as Germany, France, Italy, the UK, Sweden, Belgium, Spain, the Netherlands, Austria and Denmark (see
Figure 29
).
According to research by the Dutch Institute for Transport Policy
,
, increased market access could lead to an increase in the share of road cabotage at the EU level from 2.3% currently to 4.8%. This would result in a reduction of empty trips by up to 1.9% vehicle-km and a decrease in the EU CO2 emissions of up to 1.6% (as percent of total road transport CO2 emissions).
Figure 29: Cabotage in the EU in 2014 by host country

Source: Eurostat
An evaluation study of the Road Haulage market was concluded in November 2015.
It concluded that the relevance of Regulation (EC) No 1072/2009 to targeting environmental goals in a significant way is uncertain. However, the Eurostat data shows that the levels of empty running in the EU have reduced substantially after the cabotage restrictions on new Member States were lifted in 2009 and 2012 (from 25% in 2008 to 23% in 2014), and segments exposed to competition (cross-trade and bilateral international haulage) have much lower levels of empty running compared to market segments with restrictions (e.g. cabotage).
Road market functioning - use of commercial vehicles hired without drivers
Directive 2006/1/EC lays down provisions for the use of vehicles hired without drivers for the carriage of goods by road. Hired vehicles are not only newer, greener and cleaner but they are often also better serviced. When combining latest vehicle technologies and proper vehicle servicing, it is possible to decrease fuel costs by approximately €10,000 euro per vehicle per year, which translates into approximately 18 tonnes of CO2 emissions per vehicle per year. Besides reductions in CO2 emissions, external costs related to air pollution and noise from hired vehicles are significantly lower.
The Directive allows the use of hired vehicles for the purposes of cross-border transport operations between Member States under certain conditions. However, it also gives Member States the possibility to restrict the use of hired vehicles with a total permissible laden weight of more than 6 tonnes used for international transport operations or for own account operations. As a consequence of these restrictions, the efficiency of road transport sector is hampered and emissions are significantly higher than if operators were allowed to freely hire vehicles. The average age of hired or leased vehicles is 4-6 years below that of the overall fleet.
An internal ex-post evaluation study was concluded in March 2016. The evaluation found that the average age of the vehicle fleet in countries with restrictions on the use of hired vehicles is significantly higher than in countries without such restrictions. Hiring goods vehicles can reduce operating costs for companies by 10-15%. Moreover, they significantly increase the flexibility of the operators (e.g. to meet seasonal demand peaks).
Road market functioning - promoting bus/coach transport
Regulation (EC) No 1073/2009 lays down the provisions concerning access to the market for international passenger transport. The regulation applies to the international carriage of passengers by coach and bus within the Union by carriers for hire and reward or by own-account carriers established in a Member State. It also regulates the cabotage operations in the course of a regular international service.
An internal ex-post evaluation is ongoing and builds on the findings of an external fact finding study. The evaluation will amongst other provide an assessment of whether market opening led to the creation of an internal market and whether the objectives of fair competition and modal shifts are achieved. Preliminary results of the fact finding study confirm that access to the market for domestic regular coach services is restricted in some Member States in order to protect rail services and incumbent providers in the bus, coach and taxi sectors. Coach operators suffer from discriminatory access to terminals at national level. The market opening strategies adopted were inconsistent amongst Member States leading to divergent structures ranging from fully open markets to partially restricted. This created an uneven playing field for international services and conditions of unfair competition on national markets.
Eco-driving
Directive 2003/59/EC establishes the mandatory initial qualification and periodic training requirements for drivers who are nationals of Member States or who are working for an undertaking based in the European Union. The environmental impacts of the Directive come from fuel and corresponding emission savings as a result of eco-driving courses.
The evaluation of the Directive was completed in 2014. The assessment of its effects on a yearly potential reduction of fuel use ranges between 2 and 4%. The yearly reduction in direct costs linked to fuel savings is estimated to total between €4,032 million and €6,862 million, based on 2013 data.
Speed limiters
Limiting the vehicle speed of road vehicles by installing speed limitation devices constitutes a measure to improve road safety, and to reduce greenhouse gas emissions, pollutant emissions and traffic noise. Directive 92/6/EEC requires speed limitation devices to be installed on large heavy goods vehicles and buses (N3 and M3 vehicles). In 2002, the scope of the "Speed Limitation Directive" was extended by Directive 2002/85/EC, which obliges all heavy commercial vehicles (HCVs), so also N2 and M2 vehicles, to be equipped with speed limiters.
An evaluation was completed in 2013. The effects on emissions were estimated by comparing speed profiles. Both a lower average speed and a less dynamic speed profile lead to lower emissions. The final impacts on emissions depend on the changes in driving speeds, which depend on the way the EU Directive is implemented by the various EU Member States. Depending on the posted speed limits in Member States, the decrease in average speed on motorways was estimated to lie between 1% and 3% due to the implementation of the speed limiter.
The analysis showed that for the EU as a whole the introduction of speed limiters resulted in a reduction of the total CO2, NOX and particulate matter emissions of heavy goods vehicles of about 1% (between 0% and 2% in function of posted speed limit). This corresponds overall to a reduction of CO2 by 326 ktons, of NOx by 3 ktons and particulate matter of 0.049 ktons. The reduction can be decomposed into two components. The first one is a lower average velocity with a lower rolling resistance and air-drag. The second component is lower dynamics with less braking, which will decrease CO2 emission as well, but will primarily affect the pollutant emissions which are more dependent on dynamics.
Rail Freight Corridors
Regulation (EU) No 913/2010 lays down rules for the establishment and organization of international Rail Freight Corridors (RFCs). The general objective of the Regulation is to develop a European rail network for competitive freight, in order to boost rail freight in terms of volume, market share, quality and reliability. Nine initial corridors were designated in the Regulation. Six of the nine RFCs are operational since 2013, the remaining three become operational at the end of 2015.
The RFCs form the rail freight backbone of the multimodal Core Network Corridor of the EU. They are a key initiative of the Commission to achieve a truly Single European Rail Area for rail freight; the Commission is providing co-funding for their activities through the Connecting Europe Facility (CEF). The RFCs foster cooperation across borders both at the level of Member States and rail infrastructure managers and strengthen the involvement of users in the development of the European rail freight system, most importantly through Advisory Groups for Railway Undertakings and Terminals. The RFC concept aims at providing capacity of good quality for international freight trains by co-ordinating capacity planning, traffic and infrastructure management and setting up Corridor One-Stop-Shops as single contact points for the customers.
The impact assessment carried out in 2008 estimated for the ERIM network that the implementation of RFCs would lead to an increase of rail freight traffic of about 3.4 to 5.1% and a decrease in road freight transport of about 1.1 to 1.6% by 2020 relative to the baseline. In terms of emissions reduction, the impacts are estimated at 0.7 to 1.1 Mt CO2. In addition, the measure would result in 3.8 to 5.7 kt of NOx reduction, 0.08 to 0.1 kt of PM, and 1.1 to 1.6 kt of SO2 reduction.
An evaluation of the Regulation is ongoing and looks at the extent to which the expected impacts have materialised. The assessment will make use of the available annual corridor reports for 2013 and 2014. From these reports, two corridors report an annual increase of rail traffic between 2% and 3% in 2013 and 2014.
Fourth railway package
Rail is a vital part of the EU transport system, with a key role in addressing rising traffic demand, congestion, fuel security and decarbonisation but many European rail markets are still facing stagnation or decline. Therefore, in January 2013 the Commission put forward the Fourth Railway Package that proposes to open up domestic passenger markets to competition and to remove remaining legal, institutional and technical obstacles in order to foster performance of the railway sector and its competitiveness. The 'technical pillar' of the package was adopted in May 2016 and, in view of the provisional agreement on the 'market pillar' in April 2016 the legislative acts under this pillar may be adopted soon.
The package will contribute to completing the European Single Railway Area, result in improved efficiency of the rail transport system and foster modal shift. According to the impact assessment accompanying the package, passenger rail activity would increase by 3.8 to 16.4 billion passenger-kilometres (Gpkm) relative to the baseline by 2035,, of which 2.3 to 2.7 Gpkm will come from high speed rail. The expected modal shift would have an increasing positive effect on congestion levels of roads and is likely to reduce societal costs.
Since rail transport is among the most energy efficient modes, larger volumes of rail transport flows should also lead to a reduction in the overall energy consumption with positive impacts on GHG emissions. The impact on emissions will also depend on the degree of electrification of the rail system. According to the impact assessment, the package could achieve 0.3 to 1.1 Mt of CO2 emissions savings annually
by 2035, resulting in €15 to 63 million net present value (NPV) of CO2 emissions saved. The package would bring clear benefits to passengers in terms of improved services, increasing choice. Overall, it would lead to financial savings for citizens and companies by 2035, estimated to be in the order of €34 to 43 billion (net present value).
NAIADES II
Barges are amongst the most climate-friendly and energy efficient forms of transport but currently they only carry about 6% of European cargo each year. Inland waterway transport has also clear advantages as regards low congestion, low noise and accident levels. However, the potential of inland waterways is not sufficiently exploited. Even on the EU’s main waterway axes, the Rhine and the Danube, there is still a lot of spare capacity, contrary to the road and rail networks which are heavily congested.
The Commission’s response to this challenge is formulated in the NAIADES II Communication adopted in September 2013. The main areas of intervention of NAIADES II are quality infrastructure, quality through innovation, smooth functioning of the market, environmental quality through low emissions, skilled workforce and quality jobs, integration of inland waterways into the multimodal logistics chain. Interventions to make inland navigation more efficient under NAIADES II will attract more freight to energy efficient inland waterways. For instance, a macro analysis of the market potential in the continental cargo market
estimates that if only for the segment of intercontinental container cargo the untapped potential would be realised, the overall volumes transported in the EU by inland waterway transport would increase by 17%. Such increases can be captured by the sector without major investments. Free capacity is still available on the EU’s inland waterways. Even on the Rhine, the EU’s busiest river in the EU’s industrial heartland, transport density could be further increased by 100% without recourse to major infrastructure works. Combining this with actions to further improve the energy efficiency of inland navigation through digitalisation and the introduction of LNG renders NAIADES II an important contributor to the decarbonisation of transport. The NAIADES II package has been complemented at the end of 2014 by the proposal for a Regulation on requirements relating to emission limits and type-approval for internal combustion engines for non-road mobile machinery (NRMM Regulation).
The analytical document accompanying the 2013 package, showed that by 2030 CO2 emissions could be reduced by 0 to 11%, NOx emissions by 54 to 86% and PM emissions by 58 to 92% relative to the baseline. Overall, the lower emissions would lead to an external cost decrease, as compared to the baseline of €14 to 23 billion (28 to 45%). For inland waterways, both impact assessments accompanying the NAIADES II package and the NRMM Regulation draw on a study undertaken by Panteia in 2013. NAIADES II covers the period 2014-2020 and will be reviewed in 2017 with a view to renew the programme in 2019.
Accomplishing the internal market for inland waterway transport
Under NAIADES II, two legislative proposals have been adopted by the Commission to harmonise requirements for inland waterway vessels and recognise the professional qualifications in inland navigation. These proposals address the existing fragmentation of legal frameworks and the ensuing barriers to free movement of labour and inland waterway transport services. Both proposals will help to make inland waterway transport more attractive and efficient, contributing to the goals of NAIADES II.
Digital Inland Waterway Area
The Commission Communication on a Digital Single Market Strategy highlights the unprecedented opportunities digitalisation offers to economic sectors, such as transport. Digitalisation also supports decarbonisation by shifting freight transport from road to the water. The Digital Single Market Strategy announces the Digital Inland Waterway Area (DINA) as a platform to interconnect information systems on infrastructure, people, vessels, management and cargo components in inland waterway transport. The interconnected approach will make inland waterway transport more efficient and attractive by developing ITS enabled tools for supporting vessel management and operations and for cargo tracking and tracing, by linking workers-related data with vessel operations and by devising strategies for improved data collection through data reuse and smart monitoring-enabled vessels. This should result in increased use of energy-efficient inland waterways.
Regulation on digital tools related to work in inland navigation
In its 2016 proposal on the recognition of professional qualifications in inland navigation, the Commission has stated its intention to examine the possibility of introducing an electronic version of service record books and logbooks, as well as electronic professional cards incorporating Union certificate of qualifications. In doing so, the Commission will take existing technologies in other modes of transport into account, in particular road transport (tachograph). The digitalization of documents and other tools aimed at verifying compliance with work-related legislation in inland waterway transport has the objective to further reducing administrative burden whilst rendering the documents less prone to tampering. This should also result in increased use of energy-efficient inland waterways.
River Information Services
Directive 2005/44/EC on River Information Services (RIS) establishes a framework for the deployment and use of harmonized River Information Services in order to support safe, efficient and environmentally friendly inland waterway transport that smoothly interacts with other transport modes. An evaluation of the RIS Directive has been concluded in 2014. In terms of impacts, it was estimated that RIS implementation by 2011 has brought annual benefits in terms of fuel savings and GHG emissions of 1 to 2%. It resulted in reduced costs of €2.9 to 7.1 million per year for fuel savings, €4.1 to 8.2 million for air pollutant emissions and €0.5 to 1.0 million per year for GHG emissions, based on 2011 data. Increased safety benefits were estimated at €4 million. Due to differences in the pace of RIS implementation in Member States and corridors, key RIS technologies and services are not yet fully deployed. As a result, the benefits from the implementation of those technologies and services have not yet fully materialized.
Ports Policy
On 23 May 2013, the Commission adopted a strategy on maritime ports aimed at improving port operations and onward transport connections at 329 key seaports in the EU. As part of this strategy, the Commission proposed a Regulation on the provision of ports services and the transparency of public funds and port charges. The European Parliament and the Council reached an agreement on 27 June 2016 and the rules are expected to be finally adopted by the end of 2016. Ports make an important part of the short sea shipping costs.
By making port operations and connections more efficient, this strategy and these new rules will improve the attractiveness of short sea shipping as energy efficient alternative to road transport, hence reducing congestion and CO2 from transport. According to the impact assessment total inland transport will be reduced by 5,996 million tonne kilometres, of which 2,634 million will be shifted from road haulage trips over 300 km long.
Moreover, this strategy promotes the recourse to port charges to provide financial incentives for more environmental friendly and energy efficient shipping operations. The new regulation legally authorises port charges to integrate external costs and to vary them according to environmental and climate goals. The Commission has also undertaken to provide guidelines and promote a more consistent application of such environmental port charges at a European or regional level in order to maximise their effectiveness in stimulating investments in cleaner and more energy efficient shipping technologies. Such charging policy can in particular accelerate the deployment of LNG in shipping and on-shore supply of power.
Short Sea Shipping and the concept of Motorways of the sea
The 2001 Transport White Paper introduced the concept of Motorways of the Sea with a view to revive short sea shipping and thereby facilitate modal shift from land transport modes. The concept was supported by a range of funding schemes, in particular the TEN-T and Marco-Polo programmes. The Commission has commissioned a study with a view to assess how to further improve the competitiveness of short sea shipping. First results of this study call for further simplifying of administrative procedures, in particular through the development of an EU maritime single window, for improving cooperation between maritime stakeholders as well as with the rest of the logistics chain through the use of digital technologies, and increasing further the demand for short sea shipping services.
Aviation - Single European Sky 2+ and other initiatives
Based on the lessons learned during the implementation of the 2009 SES II-package and the need to address remaining overlaps in legislation, the European Commission proposed in June 2013 an interim update of the SES rules, called Single European Sky 2+ (SES2+), which envisaged better safety and oversight, better Air Traffic Management Performance, new business opportunities in support services and enabled industrial partnerships in Functional Airspace Blocks (FABs). The main objectives of the package were to improve performance of air navigation service providers (ANSP) in terms of efficiency and to improve the utilisation of ATM capacity.
The Single European Sky 2+ is currently pending adoption in the Council. Emissions from aviation accounted for 3.7% of total CO2 emissions in Europe in 2012 of which approximately 6% can be influenced by the European Air Navigation Services (ANS), i.e. 0.2% of the total emissions. Air pollutants (NOx) from aviation have also been increasing in the EU, from 1.5% in 1990 of total EU emissions to 6.3% in 2013. Any improvement in flight efficiency may result in corresponding reduction in emissions. The average en-route extension was 4.6% of the routes flown in 2011 and each 0.1% improvement in that extension reduces fuel burn by 30,000 tons, which translates to 92,000 tonnes of CO2 as well as a proportionate amount of reduction in NOx and particulate matter. Even if we assume that only the en-route part is affected and no improvements in the interfaces with airport terminal areas can be achieved, that would correspond to a potential 3% (instead of 4.6%) route extension and CO2 reductions of 2.76 Mt.
In addition, 92 European airports are currently participating in the Airport Carbon Accreditation programme, and 20 of these airports are carbon neutral.
A new EU Regulation on managing noise-related operating restrictions (Regulation (EU) No 598/2014) will ensure that best practices and evidence-based decision making on operating restrictions will be applied throughout Europe from June 2016. The EU is also adopting a new international noise standard to be applied to new types of large aircraft from 2017.
Carbon footprinting of transport services
Harmonized carbon footprinting enables companies and customers to objectively compare the GHG performance of different transport services. The development of harmonised methodologies will first be supported through H2020.
It is estimated that companies that measure and report their carbon footprint could reduce their CO2 emissions by 10 - 15% based on the results delivered by the Dutch "Lean & Green" programme.
Carbon footprinting creates a level playing field between the market players and more market transparency; informed decisions lead to decreases of pollutant emissions and increased demand for innovative technological.
Behavioural changes
Since the 2011 White Paper strategy some genuinely new societal developments have emerged.
Sharing economy in transport
Taxis and car-sharing are a form of collective transport carried out with light passenger vehicles (carrying up to 9 persons including the driver). As such they represent a viable alternative to low-occupancy passenger car transport. The idea of sharing things is not new, but the scale of it has - thanks to new IT technologies - pushed the concept of sharing to an entirely new dimension, leading to new disruptive business models. In particular, mobility has been a fast developing segment of the shared economy, making it a challenge for legislators to fully address all the issues related to it.
Within a short period of time car-sharing has become a major global industry. In 2014, car share programs were available in over 30 countries, and in hundreds of cities. The success of one-way car-sharing services is encouraging new companies to consider offering this service model (OEMs, rental or leasing companies, mobility solution providers). In particular, several car manufacturers have entered this market with good results, building substantial membership levels in only a few years. Some estimates predict that global car-sharing services revenue will grow from $1.1 billion in 2015 to $6.5 billion in 2024.
Studies conducted for the providers of such services highlight the benefits of higher efficiency, including less congestion and reduced need for passenger cars. At the same time, increased use of on-demand mobility by car may take away traffic from the traditional forms of collective public transport, which may result in an increase rather than a decrease of emissions. However, a recent case study by International Transport Forum (ITF) on the city of Lisbon, looking into various options, shows a potential CO2 emission reduction of 18 to 30% and up to 18% reduction in vehicle-kilometres driven. In addition, MOMO car sharing project has shown that the difference between the specific CO2 emissions of several car-sharing fleets in comparison to personal cars (new or existing vehicles) lies between 15 and 20% with the highest being almost 25%. This is because car-sharing vehicles are newer than most personal vehicles.
In addition, bike-sharing schemes (public rental bikes) have been significantly gaining in popularity in cities across the EU in the recent years. They have potential to bring about a positive modal share and reduce emissions by reducing the demand for car usage. Gradual introduction of electric bikes to the bike-sharing schemes further increases the number of users and the related benefits.
Currently these trends are taking place without intervention at EU level. In order to better understand rules governing taxi and similar services as well as market realities in the EU Member States, the Commission has launched a fact-finding study, which aims at identifying and quantifying trends and developments in these markets. It also looks into new and innovative services such as electronic platforms that link passenger service providers with passengers.
Automation and connected vehicles
New technologies have allowed for driver assistance and autonomous operations of vehicles and in the future could lead to the emergence of fully automated cars. This technological change is taking place very rapidly and vehicle technology is practically ready for deployment, while there is still a lack of harmonised framework conditions (legal, co-existence with conventional means of transport, social implications, required interoperable infrastructure and interfaces). The shift to automation concerns all modes of transport, with highest public attention currently aimed at aviation (drones or unmanned aerial vehicles) and road vehicles.
Concerning drones, the technology is already there, fully functional and offering a multitude of applications. The world market is forecast to more than double to €4 billion per year by 2022. Europe is expected to represent about 25% of the world market. In terms of jobs, for Europe, employment is estimated to increase to about 150,000 jobs by 2050 in manufacturing with additional jobs created in drone operator services employment.
With respect to autonomous cars, similar developments can be observed. Relevant vehicle technology is largely available or close to market readiness. Progress in achieving required framework conditions is expected to be more gradual: road infrastructure, legal and ethical issues, co-existence with conventional cars and appropriate use of interoperable communication and information technologies are needed. The introduction of cooperative ITS is partially a parallel trend. Full automation in certain areas (i.e. highways) could already be operational in the near future. Various companies and countries are running pilot projects for both passenger cars and trucks in anticipation of this substantial change.
Despite the existence of technologies, the legislative framework is lagging behind. This is mainly due to the fact that some issues are not fully resolved at the moment, in particular security, liability, privacy protection (especially in case of drones), employment (truck and bus drivers, pilots etc.) and safety. There will be a need for a drastic shift in the approach and management of risk in order to allow for autonomous vehicles to fully enter the transport market.
The High Level Group on the Competitiveness and Sustainable Growth of the Automotive Industry in the European Union (GEAR 2030) will assist the Commissions in setting up an EU-level action plan in order to facilitate the roll out of autonomous and automated vehicles, taking into account the ongoing work in the context of the Cooperative ITS platform and other consultations the Commission regularly holds with the automotive and telecom sector.
As to the net effects of autonomous and automated vehicles on CO2 emissions and energy consumption, significant uncertainties remain and further research is warranted. While the technical potential to make road transport more efficient is clearly there, this technology could also result in a demand increase by making long commutes less burdensome and by bringing down the cost of road freight. The net effect will, therefore, likely depend on the future transport policy mix.
Digitalisation and mobility as a service
Smartphones, apps, big data and internet give access to and enable processing huge amounts of data to offer better services to customers. Data can be collected through various means: ticketing systems, sensors attached to vehicles, traffic signals, surveys, social media and smartphones apps. Mobile broadband can make this data accessible at any place and time and also brings major opportunities for better passenger services, predictive maintenance, etc. However, it can also bring some challenges, such as spectrum interferences.
Continuous digitalisation has made it possible to treat mobility as a service (a mobility distribution model in which a customer’s major transportation needs are met by services integrating transportation infrastructures, transportation services, information and payment services, and others more). Key factors to support the growth of mobility as a service are good public transport, mobile broadband roaming policy and strong broadband connections. This approach represents increased use of ICT in transport and the removal of barriers between different transport modes and their users, also thanks to the new 'shared economy' solutions. The focus is not on the transport mode, but on mobility, which is seen as a traveller service with physical transportation products, rather than a transportation product with additional services. This concept has already been developed in Helsinki and is considered by other cities.
Increasing role of active modes in the urban transport mix
Walking and cycling are not new phenomena, but their importance in urban mobility has been gaining prominence in recent years and many observers see high potential for further expansion in new fields. The importance of walking as an inexpensive, emission-free, accessible for all form of mobility has been gaining recognition and pedestrian zones are being created or extended in various cities across Europe.
Likewise, cycling is more and more considered as a mode of transport with high potential to address many urban mobility challenges, also due to the technological and societal developments. The incorporation of IT technologies allowed for improvement and increased popularity of bike sharing schemes. Such programmes are already available in 800 cities across the world and have become a part of the landscape in many European cities. Electric power assisted cycles (or pedelecs) make cycling more attractive to people who live in hilly areas or who could find it difficult or tiring to ride a bicycle. Further technological developments increase the range of bicycle as a viable mode of transport and also make it an attractive mean for last-mile freight transportation. In addition, cycling is more positively perceived in the society than in the past making cycling fashionable and the growing number of cyclists on roads is having a snow-ball effect encouraging new people to use bicycles.
Research published by the VUB shows that up to 68% of freight within a 20 km radius of urban centres could be distributed by cargo bicycles. This offers big potential to reduce CO2 and air pollutant emissions in the very city centres with usually the highest density of population.
Finally, there is a growing evidence base on the benefits of walking and cycling in terms of lower congestion and pollution, as well as health benefits for the users.
A study for Copenhagen has estimated that cycling has better costs and benefits than both private and public transport.
Facilitation of walking is also an indispensable integral part of the efforts to promote public transport.
Besides, the bicycle sector has a potential to boost jobs and growth and support EU industry through new technology and services. It is estimated that cycling related manufacturing and services currently employ around 650,000 people and considering that EU based manufacturers are leaders in electric bike technologies there is a big potential for growth in the sector.
All these factors have convinced many local and national authorities to promote more active modes through infrastructure adjustments and various systems of incentives (e.g. kilometric reimbursement for bike use).
Withdrawn policy initiatives
The Commission has decided to withdraw the proposal to revise the Energy Taxation Directive as well as the proposal for a Directive on passenger car related taxes. In the case of the Energy Taxation Directive, the draft compromise text was de facto void of all constituting elements of the original Commission proposal. There was no agreement in the Council even on the draft compromise text. For the directive on passenger car related taxes, no agreement was reached in the Council.
The Revision of the Energy Taxation Directive
In March 2008 the European Council in its conclusions requested the review of the Energy Taxation Directive (ETD) to bring it more closely in line with the EU's energy and climate change policy.
It is in this context that the Commission presented its proposal for a revision of Directive 2003/96/EC, to allow Member States to make the best use of an existing instrument in the new policy framework. The proposal aimed at a more rational and targeted energy taxation that would contribute in a technology-neutral manner to cleaner and more efficient consumption of energy, therefore supporting sustainable growth. In a nutshell, the ETD revision:
proposed the rebalance of the charge between different fuels, including renewable energies, in an objective manner (based on energy content and on CO2 emissions);
was providing for a framework for CO2 taxation in the internal market and in that way put a price on CO2 emissions which are not covered by the EU Emission Trading System.
The Commission services carried out an impact assessment examining the impacts of possible options for the revision of the Energy Taxation Directive. The revision was expected to result, among others, in:
Better and more consistent price signals and more effective use of energy taxation both for environmental and fiscal purposes;
CO2 emissions reductions of up to 2%; this would have represented about 92 Mt CO2 of the reduction effort needed outside the ETS;
Removing the price advantage for diesel both in the EU minima and in national rates would have had a rebalancing effect on the supply and demand of the fuel market. Such neutral treatment of all transport fuels would have provided a technology neutral appraoch to all low carbon fuels and would have also encouraged energy efficiency.
The negotiations showed that due to a number of reasons (e.g. coverage of industries by the EU ETS, high energy prices for the industry, competitiveness issues) any changes to the tax treatment of industrial heating fuels by introducing a mandatory CO2 tax for such fuel uses have very limited probability of being agreed upon unanimously in the Council. On the contrary, the introduction of a CO2 tax on fuels used in transport is an option to be considered for the future. The discussions in the Council expedited the need for simplification and modernization of Energy Taxation Directive, as many technical and legal problems were reported.
The Proposal on Passenger Car taxation
The proposal on passenger car taxation aimed to improve the functioning of the internal market by removing existing tax obstacles to the transfer of passenger cars from one Member State to another. It also aimed to promote sustainability by restructuring the tax base of both registration taxes and annual circulation taxes, as well as by including elements directly related to carbon dioxide emissions of passenger cars. It would not have harmonized tax rates or oblige Member States to introduce new taxes, but only included an EU structure on car taxes.
The main benefits expected: i) the total abolition of registration tax over a ten-year transitional period, ii) the restructuring of both registration taxes and annual circulation tax bases to include a CO2 based element, and iii) the establishment of a registration tax refund system, would have represented a considerable improvement in the functioning of the internal market and an important contribution to achieving the Community's environmental objectives.
The negotiations showed that the proposed abolition of the registration tax was too ambitious, as it represents a non-negligible source of revenues for the Member States. However, the incorporation of an adequate environmental element (e.g. CO2, air pollutants) in the registration and circulation taxes could be a possible option for unanimous support, as 24 Member States have already introduced such element (CO2 emissions, exhaust emissions, Euro standards, fuel consumption) into their national tax systems.
The lack of political support in the Council for EU-level legislation on these matters does not mean, however, that fiscal policy is not an important driver of fuel use, vehicle use and modal shift. In addition, fuel and vehicle taxes can contribute towards a growth-friendly tax shift. They are therefore important for attaining national and EU-level goals. But other approaches to attain these objectives must be found. Whatever the future policy direction, it is clear that Member States will continue to have a central responsibility.
Transport research and innovation
Horizon 2020
Achieving the long term targets for reducing transport's GHG emissions and dependence on fossil fuels is extremely challenging. The paradigm shift needed in transport can only be achieved through extensive research and innovation. Therefore, a major emphasis of the €6.4 billion transport research and innovation programme under Horizon 2020 is aimed at projects addressing energy use issues, both directly and indirectly.
The four main priorities for transport research under Horizon 2020 are:
Making transport more sustainable: resource-efficient transport that respects the environment;
Making transport and transport systems seamless: better mobility, less congestion, greater safety and security;
Keeping transport competitive: European transport industry as a global leader;
Making transport research responsive: socio-economic research and forward-looking activities for policy-making.
In addition, a number of key programmes have been established for transport decarbonisation, including to support the development of light and heavy duty electric vehicles (contractual public-private partnership on European Green Vehicle Initiative) and fuel cells (Fuel Cells and Hydrogen Joint Undertaking), to promote low carbon and non-polluting transport for cities (Horizon 2020 funding for urban mobility and smart cities), to facilitate the market uptake of liquefied natural gas (LNG) for heavy duty vehicles (LNG Blue Corridors project funded under the 7th Framework Programme ‘European Green car initiative’), to facilitate more efficient road use, rail innovation (Shift2Rail Joint Undertaking) and more efficient air transport (SESAR Joint Undertaking) and energy efficient aircrafts (Clean Sky 2 Joint Undertakings), with the JU's co-financed by the EU from Horizon 2020. These programmes are complemented by research and innovation activities related to key enabling technologies in the areas of new materials (e.g. lightweight materials, composites) and advanced manufacturing (e.g. additive manufacturing) contributing to development and production of new low-emission vehicles. Other research projects, supported by Member States, are underway.,
Strategic Transport Research & Innovation Agenda (STRIA) and Strategic Energy Technology (SET) Plan
A Communication on "Research and innovation for Europe's future mobility" (Strategic Transport Technology Plan) described in 2012 issues related to transport R&I and presented ideas on how innovation could better serve the transport and mobility needs of European citizens and businesses whilst addressing larger societal challenges such as climate change and dependence on oil.
In the energy sector, the European Strategic Energy Technology Plan (SET-Plan) aims to accelerate the development and deployment of low-carbon technologies. It seeks to improve new technologies and bring down costs by coordinating research and helping to finance projects. The SET-Plan promotes research and innovation efforts across Europe by supporting technologies with the greatest impact on the EU's transformation to a low-carbon energy system, including in the transport sector. It promotes cooperation amongst EU and (H2020) associated countries, industry, research institutions, and the EU itself.
The new Integrated SET-Plan Communication, adopted on 15 September 2015, identified 10 areas of action, corresponding to the 4+2 Energy Union R&I priorities, where promotion of strengthened cooperation in R&I between the EU, Member States and stakeholders (research and industry) is necessary, in order to bring new, efficient and cost-competitive low-carbon technologies to the market faster and deliver the energy transition in a cost-competitive way. Sustainable transport within a diversified and integrated energy system, as part of the Energy Union R&I key priorities, is primarily being addressed under actions 7 and 8, aiming at strengthening European competitiveness in the battery sector (for e-mobility) and supporting market uptake of renewable fuels. The process to address these actions includes an agreement (among industrial and research stakeholders, Member States and the EC) on common strategic targets and objectives and at a second stage identification of priority actions, interested actors and instruments that will contribute to the achievement of the targets.
The Commission is also working on the Strategic Transport Research and Innovation Agenda (STRIA) as part of the upcoming Communication on Energy Union Integrated Strategy on Research, Innovation and Competitiveness (EURICS) in order to streamline the research and innovation efforts and focus them on the most pressing challenges and the most beneficial actions for transport.
Technology state of play of renewable fuels in transport
Renewable electricity: The share of renewable electricity is expected to increase significantly to 2020 and beyond. Given the move towards a low carbon electricity mix, both electrification of transport and the use of renewable hydrogen could contribute to the decarbonisation options of the transport sector.
According to a JRC study based on EEA data, around 79,000 electric vehicles (battery electric and plug-in hybrid electric M1 and N1 vehicles) were newly registered in the EU in 2014, up by 40 % compared to 2013 and 175% compared to 2012. The largest number of registrations in 2014 was recorded in France (more than 17,200 vehicles), the Netherlands (around 16,200 vehicles) and the UK (around 15,100 vehicles). Nevertheless, electric vehicles continue to constitute only a very small fraction of new registrations (0.7 %) and the market is fragmented according to the level of national support measures in place (see maps below). Currently, the amount of electricity used in non-road transport, e.g. in rail transport, is much more pronounced.


Map of electric vehicles (EV) registrations per EU member state. Left side: number of registrations (M1). Right side: EV (M1) as share of total car registrations. All figures are based on the sum of registrations 2010 to 2014. Note that the scale is optimised to show differences between MS (class size not uniform).
Advanced Biofuels:
Ethanol from lignocellulosics - This value chain is the one closest to achieving market deployment. There are two main reasons for this: the number of competing technologies and the technology breakthroughs achieved in the last years. However, fragmented fuel markets, lack of technical standards and lack of vehicle fleet for ethanol content higher than 10% hamper the market deployment.
Hydrogenated vegetable oils (HVO) - HVO is already at commercial scale and new plants are coming on stream from the key technology providers NESTE and UOP/Honeywell. HVO can be used as a drop-in fuel in high blends in diesel and kerosene.
Synthetic biofuels for diesel and kerosene replacement - Synthetic biofuels are still facing technical hurdles. The main reason is that the corresponding scale for first-of-a-kind-plants is larger than that of lignocellulosic ethanol (lignocellulosic ethanol plants are economically viable from a capacity range of about 100 to 120 ktons/y while synthetic biofuel plants are economically viable from a capacity range of about 175 to 250 ktons/y). Synthetic biofuels can be used for both road and air transport.
Biofuels from algae - Algae have strong potential to provide significant quantities of biomass if the current projects and technology advances will prove successful. Algae technologies are at the early stages of development, however, they are making significant advances. In a relatively short period of time the industry was able to move to large scale demonstration and all 3 projects supported under FP7 are on 10 ha area. Algae can produce a variety of biofuels and at present algal fuels produced from combined operations with waste water purification, is the preferred route. Such applications are expected to enter the market by 2020.
Pyrolysis oils - can be fed directly into a petroleum refinery after some upgrading and processed with oil thus eliminating the cost of building a dedicated plant.
Biofuels from microbial conversion - This value chain addresses various technologies that are at the early stages of development. However, they are very attractive since they are expected to have better efficiencies than current technologies.
Gaseous biofuels – Biomethane – Significant progress has been achieved directly by the industry but more demonstration and first-of-a-kind plants are needed to ensure the deployment of this value chain in the market.
Resources, enzymes and bacteria - Further scientific work is needed to improve the yields of biomass resources, improve the existing enzymes and develop new types of conversion bacteria and yeasts. This work is important also in the context of bio-based economies.
Hydrogen (renewable hydrogen can be produced from biomass or electricity) - Major car manufacturers have announced that fuel cell propelled cars are to be produced at commercial scale in the future; a few models are already available now. Currently, the use of hydrogen in transport is negligible. Some Member States have national strategies for the deployment of hydrogen infrastructure for the coming years, therefore some market uptake could still be expected.
Other alternative low carbon fuels are currently in the development phase. Fuel production from power to gas (methane) or power to liquid (methanol) is under development for application to heavy duty, maritime transport and aviation fuel.
Methanol for maritime transport - Several shipping companies and ship-engine manufacturers (MAN, Wartsila and Meyer Werft) are exploring the potential use of methanol (either bio or power to gas origin) in ferry operations. Stena is already operating a methanol powered ferry from Hamburg to Stockholm and Maersk is contracting another one. Tests have also been done with biodiesel but the preferred alternative fuel beyond LNG for the maritime sector appears to be methanol. In Nordic countries the MARINA project aims to reduce emissions and increase the use of alternative fuels in the marine sector. To do so, the project aims to create a network between key players in all the Nordic countries to identify policy and roadmap recommendations for Nordic policy and decision makers on how to increase the use of alternative fuels and reduce emissions from marine applications.
Low-carbon infrastructure planning, technical, regulatory and financing aspects
The way transport infrastructure is shaped has a decisive impact on the achievement of decarbonisation objectives in transport. The revised TEN-T guidelines set a range of binding standards for infrastructure development which are indispensable for clean fleets to operate throughout Europe, as well as for transport services to become safer and more energy efficient:
Multimodal infrastructure (including Intelligent Transport Systems) has been given increased importance. It is an enabler of seamless transport chains across modes and future-oriented logistics solutions. By stimulating the shift of long-distance freight traffic from road to rail and inland waterways, it plays a vital role in reducing the carbon footprint of transport.
Intelligent Transport Systems for all transport modes have become an integral part of TEN-T development: ITS for road, ERTMS for railways, SESAR in the air and RIS in the inland waterways sector help reducing accidents and using infrastructure as efficiently as possible. The former notably contributes to reducing congestion and, thereby, emissions.
Infrastructure equipment for innovative transport solutions – notably alternative fuel solutions (e-mobility charging, LNG and hydrogen terminals, etc.) or automated transport concepts – are key to ensure a sustainable transport system.
This new infrastructure approach contributes at the same time at reducing noise pollution from transport, at improving quality of freight and passengers' services and – through the vast potential for innovative infrastructure equipment – also at boosting Europe's competitiveness.
The Commission is currently preparing – under the supervision of each European Coordinator – the second generation of corridor work plans, further refining the initial analysis of the infrastructure needs and relevant projects, in particular to remove bottlenecks and complete cross border sections. The updated corridor work plan will especially include the most complex elements of the corridor activity such as measuring the impact on climate change and the promotion of sustainability for instance in urban areas and nodes (e.g. ports).
The efficient completion of this network may however be impacted by complex regulatory and administrative arrangements, which can contribute to increased costs, delay and uncertainty for infrastructure projects, and by the availability of funding and appropriate financial solutions. In particular, a number of measures would need to be considered to support the streamlining of procedures for TEN-T core network projects with a view to facilitate the completion of the core network. The Commission is currently running a study to take stock of good practices and identify ways to simplify procedures for projects of common interest of the core network.
Public support, from EU and Member States funding mechanisms, to drive investment into sustainable transport modes is essential, and the interaction within such funding mechanisms between infrastructure policies objectives and the EU climate change goals need to be clearly recognised. In alignment with the TEN-T policy, the CEF has a strong focus on decarbonisation reflected in the budgetary allocation priorities for the call for proposals agreed in the annual working programme. As a result, the CEF call 2014 allocated the large majority of funds, or 92% of the total envelope of €13 billion of grant co-financing, to environmentally friendly modes, innovative technologies and investment on multimodality and ITS, and about 82% for rail and inland navigation investment alone. This is in line with the share of funding per mode in the previous Multiannual Financial Framework 2007-2013. For the new programming period 2014-2020 European Structural and Investment Funds (ESIF) also provide substantial funding for the network industries, specifically supporting the shift towards a low-carbon economy including in multimodal urban transport. The wider application of grant funding from CEF, the European Structural and Investment Funds (ESIF) and other EU mechanisms pursuing decarbonisation objectives to primarily privately financed projects ("blending") would help bolster the transport pipeline in more challenging and more sustainable modes of transport and is an effective way to maximise the impact of public resources.
For high capital expenditure projects, as low-carbon transport infrastructure typically are, the availability (and cost) of capital and predictability of revenue stream have a strong influence on the economic viability of the project which in turn has an impact on the financial viability of the overall project. Cross-funding schemes (e.g. the use of road charges, for instance, for the funding of rail projects), the setting of user funds (e.g. future revenues from infrastructure, like ports, airports and toll highways could contribute to such a fund) and revenues from the Eurovignette or the Emission Trading Scheme (e.g. under the so called Innovation and Modernisation Funds) deploying the user/polluter pays principle, may be considered as financing models that complement, in some cases, the available funding for infrastructure.
Another key challenge is about directing private capital to a policy priority area where the market is not investing sufficiently in on its own. Financial instruments that mitigate risk for private investors, such as demand risks related to the uncertainty on clean vehicles market penetration and risk associated with underlying green assets, are also essential to speed up the transition to low carbon technologies and are been developed in particular under the CEF and the European Fund for Strategic Investment (ESFI). The inclusion of sustainable transport within the scope of the green bonds (e.g. the Climate Awareness Bonds, currently issued by the EIB), could be also considered, ensuring that investments supported under this new category respect stringent criteria on environment integrity.
ANNEX IV: Models and model-based scenarios used in preparing the analytical work
Description of analytical models used
The model suite used for this analytical work has a successful record of use in the Commission's transport, energy and climate policy impact assessments – it is the same model suite as used for the 2020 climate and energy package as well as for the 2030 climate and energy policy framework. The models and their linkages are briefly described in the following subsections.
The full model suite has been used for developing the EU Reference scenario 2016 and the two central scenarios presented in the following sections. For the more ambitious pathways/scenarios for decarbonising transport sector the PRIMES-TREMOVE Transport Model has been used, coupled when relevant with the PRIMES energy system model and/or the PRIMES biomass module.
The PRIMES-TREMOVE Transport Model can be used stand-alone or linked with the entire PRIMES energy system model and the PRIMES-Biomass model and cover:
Time horizon: 2005 to 2050 (5-year time steps).
Geography: individually all EU Member States.
Transport modes covered: private road passenger (cars, powered 2 wheelers), public road passenger (buses and coaches), road freight (heavy goods vehicles, light commercial vehicles), passenger rail (conventional rail, high-speed rail, metro), freight rail, passenger aviation (split into distance classes), freight and passenger inland navigation and short sea shipping, maritime bunkers (when linked with PRIMES or PRIMES Maritime model). Numerous classes of vehicles and transport means with tracking of technology vintages.
Regions/road types: no spatial resolution below country levels. For trip classes distinction between urban areas (distinguished into one metropolitan and other urban areas) and inter-urban areas (distinguished into motorways and other roads).
Time of day/trip types: off peak and peak time travelling relevant for congestion; passenger trips are distinguished into non-working, commuting and business trips; freight split into bulk, cargo and unitized.
Trip distances: stylized histogram of trip types according to distance, representing different agents' travelling habits per trip and region type.
Energy: all crude oil derived fuels (total and separated by the different grades), biofuels (bioethanol and biodiesel blends, bio-kerosene, bio-heavy oil and DME), CNG, LNG, LPG, electricity and hydrogen. Linkage to refuelling/recharging infrastructure by trip type.
Emissions: GHG emissions on a tank to wheel and well to wheel basis; pollutants emissions (CO, NOx, PM2.5, SOx).
Stock of vehicles: full dynamics of stock turnover for road (more refined) and non-road transport means.
Overview of model inter-linkages
The models are linked with each other in formally-defined ways to ensure consistency in the building of scenarios (i.e. for the EU Reference scenario 2016 and the two central scenarios), as shown graphically in
Figure 30
.
Figure 30: Inter-linkages between models

Source: ICCS-E3MLab
PRIMES
The PRIMES model is an EU energy system model which simulates energy consumption and the energy supply system. It is a partial equilibrium modelling system that simulates an energy market equilibrium in the European Union and each of its Member States. This includes consistent EU carbon price trajectories.
Decision making behaviour is forward looking and grounded in micro economic theory. The model also represents in an explicit and detailed way energy demand, supply and emission abatement technologies, and includes technology vintages.
The core model is complemented by a set of sub-modules, of which the transport sector module and the biomass supply module are described below separately in more detail. Industrial non-energy related CO2 emissions are covered by a sub-module so that total CO2 emissions can be projected. The model proceeds in five year steps and is for the years 2000 to 2010 calibrated to Eurostat data.
The PRIMES model is suitable for analysing the impacts of different sets of climate, energy and transport policies on the energy system as a whole, notably on the fuel mix, CO2 emissions, investment needs and energy purchases as well as overall system costs. It is also suitable for analysing the interaction of policies on combating climate change, promotion of energy efficiency and renewable energies. Through the formalised linkages with GAINS non-CO2 emission results and cost curves, it also covers total GHG emissions and total ESD sector emissions. It provides details on the Member State level, showing differential impacts across Member States.
The PRIMES model represents energy efficiency by simulating different measures with different techniques. These modelling techniques will affect the context and conditions under which stylized agents per sector, make their decisions on energy consumption.
PRIMES has been used for the analysis underpinning the Commission's proposal on the EU 2020 targets (including energy efficiency), the Low Carbon Economy and Energy 2050 Roadmaps as well as the 2030 policy framework for climate and energy.
PRIMES is a private model and has been developed and is maintained by E3MLab/ICCS of National Technical University of Athens in the context of a series of research programmes co-financed by the European Commission.
The model has been successfully peer reviewed, most recently in 2011.
PRIMES-TAPEM & PRIMES-TREMOVE
PRIMES-TAPEM, operated by ICCS/E3MLab is an econometric model for transport activity projections. It takes GEM-E3 projections (GDP, activity by sector, demographics and bilateral trade by product, and by country) as drivers, to produce transport activity projections to be fed into PRIMES-TREMOVE. The econometric exercise also includes fuel prices coming from PROMETHEUS, as well as transport network infrastructure (length of motorways and rail-ways), as drivers. The PRIMES-TAPEM model provides the transport activity projections for the Reference scenario.
The PRIMES-TREMOVE Transport Model projects the evolution of demand for passengers and freight transport by transport mode and transport mean. It is essentially a dynamic system of multi-agent choices under several constraints, which are not necessarily binding simultaneously. The model consists of two main modules, the transport demand allocation module and the technology choice and equipment operation module. The two modules interact with each other and are solved simultaneously.
The projection includes details for a large number of transport means, technologies and fuels, including conventional and alternative types, and their penetration in various transport market segments. It also includes details about greenhouse gas and air pollution emissions, as well as impacts on external costs of congestion, noise and accidents.
PRIMES-TREMOVE has been used for the 2011 White Paper on Transport, Low Carbon Economy and Energy 2050 Roadmaps as well as the 2030 policy framework for climate and energy.
The PRIMES-TREMOVE is a private model that has been developed and is maintained by E3MLab/ICCS of National Technical University of Athens, based on, but extending features of the open source TREMOVE model developed by the TREMOVE modelling community. Part of the model (e.g. the utility nested tree) was built following the TREMOVE model. Other parts, like the component on fuel consumption and emissions, follow the COPERT model.
In the transport field, PRIMES-TREMOVE is suitable for modelling soft measures (e.g. eco-driving, deployment of Intelligent Transport Systems, labelling), economic measures (e.g. subsidies and taxes on fuels, vehicles, emissions; ETS for transport when linked with PRIMES; pricing of congestion and other externalities such as air pollution, accidents and noise; measures supporting R&D), regulatory measures (e.g. CO2 emission performance standards for new passenger cars and new light commercial vehicles; EURO standards on road transport vehicles; technology standards for non-road transport technologies), infrastructure policies for alternative fuels (e.g. deployment of refuelling/recharging infrastructure for electricity, hydrogen, LNG, CNG). Used as a module which contributes to a broader PRIMES scenario, it can show how policies and trends in the field of transport contribute to economy wide trends in energy use and emissions. Using data disaggregated per Member State, it can show differentiated trends across Member States.
PRIMES Biomass Supply
The biomass system model is linked with the PRIMES energy system model for Europe and can be either solved as a satellite model through a closed-loop process or as a stand-alone model.
It is an economic supply model that computes the optimal use of biomass/waste resources and investment in secondary and final transformation, so as to meet a given demand of final biomass/waste energy products, projected to the future by the rest of the PRIMES model. The biomass supply model determines the consumer prices of the final biomass/waste products used for energy purposes and also the consumption of other energy products in the production, transportation and processing of the biomass/waste products.
The model also reflects the sustainability criteria currently in place and can be used for reflecting policies facilitating the use of renewable energy sources. After cross check of input data and draft results, results of the biomass supply model are used to ensure consistency between PRIMES, CAPRI and GLOBIOM bioenergy modelling.
The PRIMES biomass supply model is private and has been developed and is maintained by E3MLab/ICCS of National Technical University of Athens.
GAINS
The GAINS (Greenhouse gas and Air Pollution Information and Simulation) model is an integrated assessment model of air pollutant and greenhouse gas emissions and their interactions. GAINS brings together data on economic development, the structure, control potential and costs of emission sources and the formation and dispersion of pollutants in the atmosphere.
In addition to the projection and mitigation of greenhouse gas emissions at detailed sub-sectorial level, GAINS assesses air pollution impacts on human health from fine particulate matter and ground-level ozone, vegetation damage caused by ground-level ozone, the acidification of terrestrial and aquatic ecosystems and excess nitrogen deposition of soils.
Model uses include the projection of non-CO2 GHG emissions and air pollutant emissions for EU Reference scenario and policy scenarios, calibrated to UNFCCC emission data as historical data source. This allows for an assessment, per Member State, of the (technical) options and emission potential for non-CO2 emissions. Health and environmental co-benefits of climate and energy policies such as energy efficiency can also be assessed.
The GAINS model is accessible for expert users through a model interface and has been developed and is maintained by the International Institute of Applied Systems Analysis. The underlying algorithms are described in publicly available literature. The source code is not disclosed. GAINS and its predecessor RAINS have been peer reviewed multiple times, in 2004, 2009 and 2011.
GLOBIOM-G4M
The Global Biosphere Management Model (GLOBIOM) is a global recursive dynamic partial equilibrium model integrating the agricultural, bioenergy and forestry sectors with the aim to provide policy analysis on global issues concerning land use competition between the major land-based production sectors. Agricultural and forestry production as well as bioenergy production are modelled in a detailed way accounting for about 20 globally most important crops, a range of livestock production activities, forestry commodities as well as different energy transformation pathways.
GLOBIOM covers 28 (or 50) world regions. The disaggregation of the EU into individual countries has been performed only recently.
Model uses include the projection of emissions from land use, land use change and forestry (LULUCF) for EU Reference scenario and policy scenarios. For the forestry sector, emissions and removals are projected by the Global Forestry Model (G4M), a geographically explicit agent-based model that assesses afforestation-deforestation-forest management decisions. GLOBIOM-G4M is also used in the LULUCF impact assessment to assess the options (afforestation, deforestation, forest management, cropland and grassland management) and costs of enhancing the LULUCF sink for each Member State.
The GLOBIOM-G4M is a private model and has been developed and is maintained by the International Institute of Applied Systems Analysis.
GEM-E3
The GEM-E3 (World and Europe) model is an applied general equilibrium model, simultaneously representing the whole world economy, its major regions and the 28 EU Member States, linked through endogenous bilateral trade flows and environmental flows.
GEM-E3 aims at covering the interactions between the economy, the energy system and the environment. It is a comprehensive model of the economy, the productive sectors, consumption, price formation of commodities, labour and capital, investment and dynamic growth. The model is dynamic, recursive over time, driven by accumulation of capital and equipment. Technology progress is explicitly represented in the production function. It is updated regularly using the latest revisions of the GTAP database and Eurostat statistics for the EU Member States.
The GEM-E3 model has been developed and is maintained by E3MLab/ICCS of National Technical University of Athens, JRC-IPTS and others. It is documented in detail but the specific versions are private.
The model has been used by E3MLab/ICCS to provide the macro assumptions for the Reference scenario and for the policy scenarios. It has also been used by JRC-IPTS to assess macroeconomic impacts of target setting based on GDP per capita.
PROMETHEUS
PROMETHEUS is a fully stochastic world energy model used for assessing uncertainties and risks associated with the main energy aggregates including uncertainties associated with economic growth and resource endowment as well as the impact of policy actions. The model projects endogenously to the future the world energy prices, supply, demand and emissions for ten world regions.
World fossil fuel price trajectories are used as import price assumptions for EU Reference scenario and policy scenario modelling.
The Prometheus model is private and has been developed and is maintained by E3MLab/ICCS of National Technical University of Athens.
CAPRI
CAPRI is an open source economic partial equilibrium model developed by European Commission research funds. Operational since more than a decade, it supports decision making related to the Common Agricultural Policy and Environmental policy related to agriculture based on sound scientific quantitative analysis.
CAPRI is only viable due to its pan-European network of researchers which based on an open source approach tender together for projects, develop and maintain the model, apply it for policy impact assessment, write scientific publications and consult clients based on its results. It has been the basis of numerous peer reviewed publications. The model has been used to provide consistent agricultural activity projections for the EU Reference scenario 2016. It is also used in the LULUCF impact assessment.
The CAPRI model is an open source model which has been developed and is maintained by Eurocare GmbH, JRC, and other partners of the CAPRI network.
EU Reference scenario 2016
Scenario design, consultation process and quality assurance
Building an EU Reference scenario is a regular exercise by the Commission. It is coordinated by DGs ENER, CLIMA and MOVE in association with the JRC, and the involvement of other services via a specific inter-service group.
The EU Reference scenario 2016 (REF2016) has been developed building on a modelling framework including as core models PRIMES (PRIMES-TREMOVE for transport), GAINS and GLOBIOM-G4M and as supporting models GEM-E3, PROMETHEUS, PRIMES Biomass supply and CAPRI (see prior section for details).
For the REF2016, the model was calibrated on energy data up to year 2013 from Eurostat and other sources, and for agriculture and non-CO2 emission on data up to the year 2015.
Member States were consulted throughout the development process through a specific Reference scenario expert group which met three times during the development of REF2016. Member States provided information about adopted national policies via a specific questionnaire, key assumptions have been discussed and in each modelling step, draft Member State specific results were sent for consultation. Comments of Member States were addressed to the extent possible, keeping in mind the need for overall comparability and consistency of the results.
Quality of modelling results was assured by using state of the art modelling tools, detailed checks of assumptions and results by the coordinating Commission services as well as by the country specific comments by Member States.
REF2016 projects EU and Member States energy, transport and GHG emission-related developments up to 2050, given current global and EU market trends and adopted EU and Member States' energy, transport, climate and related relevant policies.
"Adopted policies" refer to those that have been cast in legislation in the EU or in MS (with a cut-off date end of 2014). Therefore, the binding 2020 targets are assumed to be reached in the projection. This concerns GHG emission reduction targets (both for the EU ETS as well as ESD sectors) as well as renewables (RES) targets, including RES in transport.
However, policies which are not yet legally implemented, e.g. those necessary to implement the 2030 energy and climate framework, are not part of REF2016. On this basis, REF2016 can help identify areas where the current policy framework falls short of reaching the EU's climate and energy objectives. Notably, REF2016 shows that current policy and market conditions will deliver neither the 2030 targets nor the long-term (2050) 80-95% GHG emission reduction objective.
REF2016 provides projections, not forecasts. Unlike forecasts, projections do not make predictions about what the future will be. They rather indicate what would happen if the assumptions which underpin the projection actually occur. Still, the scenario allows for a consistent approach in the assessment of energy and climate trends across the EU and its Member States.
The report " EU Reference Scenario 2016: Energy, transport and GHG emissions - Trends to 2050" describes the inputs and results in detail. This section summarises the main messages derived from it, especially those relevant for the Energy Union framework.
Main assumptions
The projections are based on a set of assumptions, including on population growth, macroeconomic and oil price developments, technology improvements, and policies.
Macroeconomic assumptions
In REF2016, the population projections draw on the European Population Projections (EUROPOP 2013) by Eurostat. The key drivers for demographic change are: higher life expectancy, convergence in the fertility rates across Member States in the long term, and inward migration. The EU28 population is expected to grow by 0.2% per year during 2010-2030 (0.1% for 2010-2050), to 516 million in 2030 (522 million by 2050). Elderly people, aged 65 or more, would account for 24% of the total population by 2030 (28% by 2050) as opposed to 18% today.
GDP projections mirror the joint work of DG ECFIN and the Economic Policy Committee, presented in the 2015 Ageing Report. The average EU GDP growth rate is projected to remain relatively low at 1.2% per year for 2010-2020, down from 1.9% per year during 1995-2010. In the medium to long term, higher expected growth rates (1.4% per year for 2020-2030 and 1.5% per year for 2030-2050) are taking account of the catching up potential of countries with relatively low GDP per capita, assuming convergence to a total factor productivity growth rate of 1% in the long run.
Sectoral activity projections are derived in a consistent way from these macroeconomic assumptions, using the macro-economic modelling tool GEM-E3 as well as econometric estimates for global demand for energy intensive industries.
Fossil fuel price assumptions
Oil prices have fallen by more than 60% since mid-2014, to an average of around 40 $/barrel for Brent crude oil in the first four months of 2016. The collapse of oil prices has been driven by low demand and sustained oversupply, due in particular to tight oil from North America and to the decision of the Organization of Petroleum Exporting Countries (OPEC) countries not to cut their output to rebalance the market. REF2016 considers a gradual adjustment process with reduced investments in upstream productive capacities by non-OPEC countries. Quota discipline is assumed to gradually improve among OPEC members. Thus, oil price is projected to reach 87 $/barrel in 2020 (in year 2013-prices). Beyond 2020, as a result of persistent demand growth in non-OECD countries driven by economic growth and the increasing number of passenger cars, oil price would rise to 113 $/barrel by 2030 and 130 $/barrel by 2050. This price trend resulting from PROMETHEUS modelling is in line with other reference sources such as the 2015 IEA World Energy Outlook.
No specific sensitivities were prepared with respect to oil and gas price developments. Still, it can be recalled that lower fossil fuel price assumptions tend to increase energy consumption and CO2 emissions not covered by the ETS. The magnitude of the change would depend on the price elasticities and on the share of taxation, like excise duties, in consumer prices. For instance, for transport, the changes would be limited (depending on the magnitude of the change in the oil price) due to the high share of excise duties in the consumer prices but they are still expected to lead to some higher energy consumption and CO2 emissions. They also tend to lead to lower overall energy system costs, as the increase in consumption is more than compensated by lower prices. Conversely, costs for emission mitigation could slightly increase. Different fossil price assumptions are unlikely to lead to significantly different impacts across Member States.
Techno-economic assumptions
In terms of technological developments, input assumptions are based on a wide range of sources, with estimates on technological costs across main types of energy equipment, from power generation to heating systems and appliances. In addition, it should be recalled that the PRIMES model (and other models where relevant) take into account technological progress.
In terms of technological developments relevant to the transport sector, battery costs for electric vehicles and plug-in hybrids are assumed to go down to 320-360 $/kWh by 2030 and 270-295 $/kWh by 2050; further improvements in the efficiency of both spark ignition gasoline and compression ignition diesel are assumed to take place. In addition, the market share of internal combustion engine (ICE) electric hybrids is expected to increase due to their lower fuel consumption compared to conventional ICE vehicles.
For the techno-economic assumptions in the projection of non-CO2 GHG emissions, see the detailed technical documentation. In general, technological progress in this domain is strongly linked to regulation; hence Reference scenario assumptions are conservative.
Technology assumptions are based on extensive literature review and have been peer-reviewed by the Commission services, notably the Joint Research Centre of the European Commission.
Specific policy assumptions
Following the above described policy modelling approach, the key policies included in the REF2016 are:
The EU Emissions Trading System (Directive 2003/87/EC and its amendments) is fully reflected in the modelling, including the linear reduction factor of 1.74% for stationary installations and the recently adopted Market Stability Reserve.
The Effort Sharing Decision (Decision 406/2009/EC) is assumed to be implemented, i.e. ESD GHG emission reductions at EU level in 2020 need to reach at least -10% compared to 2005 levels. It turned out that no specific policy incentives in addition to adopted EU and national policies were needed to achieve the EU level target. National ESD targets need not be achieved domestically given the existing flexibilities (e.g. transfers between Member States).
The Energy Efficiency Directive (EED) and the Energy Performance of Buildings Directive (EPBD) are reflected, including Member States' specific obligations as regards energy savings obligation and buildings codes.
Ecodesign and Energy Labelling Directives and Regulations are also reflected.
CO2 standards for cars and vans regulations (
Regulation (EC) No 443/2009
, amended by Regulation EU No 333/2014 and Regulation (EU) No 510/2011, amended by Regulation EU 253/2014); CO2 standards for cars are assumed to be 95gCO2/km as of 2021 and for vans 147gCO2/km in line with current legislation. Standards are assumed constant after 2020/2021.
The Renewable Energy Directive (Directive 2009/28/EC) and Fuel Quality Directive (Directive 2009/30/EC) including ILUC amendment (Directive 2015/1513/EU): achievement of the legally binding RES target for 2020 (including 10% RES in transport target) for each Member State, taking into account the use of flexibility mechanisms when relevant as well as of the cap on the amount of food or feed based biofuels (7%). Member States' specific renewable energy policies for the heating and cooling sector are also reflected where relevant.
Directive on the deployment of alternative fuels infrastructure (
Directive 2009/30/EC
).
The Waste Management Framework Directive (Directive 2008/98/EC) and in particular the Landfill Directive (Directive 1999/31/EC) which contribute to a significant reduction of emissions from waste.
The revised F-gas Regulation (Regulation 517/2014) strengthens existing measures and introduces a number of far-reaching changes, notably limiting the total amount of the most important F-gases that can be sold in the EU from 2015 onwards and phasing them down in steps to one-fifth of 2014 sales in 2030, and banning the use of F-gases in many new types of equipment where less harmful alternatives are widely available.
The impacts of the Reforms of the Common Agricultural Policy are taken into account, e.g. the milk quota abolition.
Energy Efficiency Design Index (EEDI) and the Ship Energy Efficiency Management Plan (SEEMP) for maritime transport.
Relevant national policies, for instance on the promotion of renewable energy, on fuel and vehicle taxation or national building codes, are taken into account.
Summary of main results of the EU Reference scenario 2016
Figure 31
below presents the projected evolution of EU Gross Inland Energy Consumption. After the 2005 peak, energy consumption is projected to steadily decline until 2040, where it stabilises. Oil still represents the largest share in the energy mix, mostly because of transport demand. Solid fuels see a significant reduction in their share of the energy mix, while the biggest increase is for renewable energy. Natural gas and nuclear energy keep relatively stable shares in the energy mix.
Figure 31: EU28 Gross Inland Consumption (Mtoe, left; shares (%), right)

Source: PRIMES
Energy security
EU energy production (
Figure 32
) is projected to continue to decrease from around 760 Mtoe in 2015 to around 660 Mtoe in 2050. The projected strong decline in EU domestic production for all fossil fuels (coal, oil and gas) coupled with a limited decline in nuclear energy production is partly compensated by an increase in domestic production of renewables. Biomass and biowaste will continue to dominate the fuel mix of EU domestic renewable production, although the share of solar and wind in the renewable mix will gradually increase from around 17% in 2015 to 36% in 2050.
Figure 32: EU28 energy production (Mtoe)

Source: PRIMES
EU's import dependency shows a slowly increasing trend over the projected period, from 53% in 2010 to 58% in 2050. Again RES deployment, energy efficiency improvements and nuclear production (which remains stable) counteracts the strong projected decrease in EU's fossil-fuel production.
Solid imports as well as crude oil and (refinery) feedstock decline throughout the projection period, while oil products imports slightly increase. Natural gas imports increase slightly in the long term reaching approximately 370 bcm net imports in 2050. Biomass remains mostly supplied domestically, although the combination of increased bioenergy demand and limited potential for additional EU domestic supply leads to some increases in biomass imports post-2020 (from 11% of biomass demand in 2020 to about 15% in 2030 and beyond).
Up to 2020, the consumption of gas (
Figure 33
) is expected to remain stable (at around 430 bcm in gross inland terms). Post 2020, a slight decrease in gross inland consumption of gas (412 bcm in 2030) is projected, as well as further reductions in indigenous production of gas. Net import dependency of natural gas registers an increase as domestic gas production continues its downward trend. The imported volumes of gas are projected to increase between 2015 and 2040 and then to stabilise in the long term, 15% above the 2010 net import level (from 309 bcm in 2010 to 369 bcm in 2050).
Figure 33: Gas - production, net imports and demand (volumes expressed in bcm)

Source: PRIMES
Internal energy market and investments
The EU power generation mix changes considerably over the projected period in favour of renewables (
Figure 34
). Before 2020, this occurs to the detriment of gas, driven by a strong RES policy to meet 2020 targets, very low coal prices compared to gas prices, and low CO2 prices. After 2020, the change is characterised by further RES deployment, but also a larger coal to gas shift, driven mainly in anticipation of increasing CO2 prices.
Gas therefore maintains its presence in the power generation mix in 2030 (at slightly higher levels in the long term compared to 2015). The share of solids/coal in power generation significantly declines, but not before 2020, to 15% in 2030.
Figure 34: EU power generation (net) by fuel (Mtoe – left, shares – right)

Source: PRIMES
Variable RES (solar and wind) reach around 19% of total net electricity generation in 2020, 25% in 2030 and 36% in 2050, demonstrating the growing need for flexibility in the power system. Wind onshore is expected to provide the largest contribution. Solar PV and biomass also increase over time. Hydro and geothermal remain roughly constant. The share of nuclear decreases gradually over the projected period despite some life time extensions and new built, from 27% in 2015 to 22% in 2030.
Investment expenditures for power supply (
Figure 35
) increase substantially until 2020 driven by RES targets and developments, but slow down thereafter, until 2030, before increasing again from 2030 onwards notably due to increasing ETS carbon prices reflecting the combination of reinstated scarcity in the carbon market with the help of the Market Stability Reserve and a continuously decreasing ETS cap based on the current linear factor. New power plant investment is dominated by RES, notably solar PV and wind onshore. Nuclear investment mostly takes place via lifetime extensions until 2030 and in the longer term via new built, such as projected in, for instance, the UK, Finland, Sweden, France, Poland, and other Central European Member States. New thermal plant investment is mainly taking place in gas-fired plants.
Figure 35: Net power capacity investments by plant type (MWh – for five year period)

Source: PRIMES
Average electricity prices (
Figure 36
) steadily increase up to 2030 by about 18% relative to 2010 levels, stabilising around 20% in the long-term. The structure of electricity costs changes over time, with the capital cost component (generation and grid costs) increasing significantly in the short term. From 2030, the fuel cost component remains stable despite the increase in fuel prices, due to a decreasing share of fossil-fuel combustion. Transmission and distribution costs increase significantly in the longer term post-2030, partly linked to the need to cater for the increased presence of RES in the power generation mix.
As a result of the modelling, carbon prices are projected to increase from around 8€/tCO2 in 2015 to 15€ in 2020, 23€ in 2025, 34€ in 2030 and 88€ in 2050, reflecting both the steadily decreasing cap and the stabilising effect of the Market Stability Reserve. However, the increase in electricity prices due to ETS remains limited despite the large increase in CO2 price, as the share of carbon-intensive power generation decreases.
Figure 36: Decomposition of electricity generation costs and prices (€'2013 MWh)

Source: PRIMES
Electricity prices for households and services are projected to increase moderately in the medium term and to decrease slightly in the long term. Prices for industry on the contrary are stable or decrease over time as energy intensive industry maintains an electricity demand profile compatible with base-load power generation and bears a small fraction of grid costs and taxes. Taxes apply mainly on prices for households and services.
REF2016 shows increasing volumes of electricity trade over time. The flow between regions increases from 17% in 2015 to 26% in 2020, 29% in 2030 and then stays almost stable for the remainder of the projection period reaching 30% in 2050. Main drivers are intermittent RES power generation and the resulting balancing requirements. Trade is facilitated by the assumed successful development of the ENTSO-E Ten-Year Network Development Plan 2014 as well as pan-European market coupling and sharing of reserves and flexibility across Member States.
Investment expenditures in demand sectors (
Figure 37
– left hand side) over the projected period will be higher than in the past. They notably peak in the short term up to 2020, particularly in the residential and tertiary sectors, as a result of energy efficiency polices. Post-2020 they slightly decline until 2030, before increasing again to 2050. On the supply side (
Figure 37
– right hand side), investments peak towards 2020, followed by a decrease notably explained by a decrease in power generation investments.
Figure 37: Investment expenditures (5-year period) - demand side, million €'2013 (left, excluding transport) and supply side, million €'2013 (right)

Source: PRIMES
Transport investments (expenditures related to the turnover of rolling stock) steadily increase over time but maintain a relatively stable share of GDP.
The relative weight of energy-related spending in households' expenditure increases in 2020 compared to 2015 (7.5% compared to 6.8%), stabilising until 2030 before decreasing again until 2050 (6.1%).
Moderation of energy demand
In 2020, primary energy consumption decreases by 18.4% (relative to the 2007 baseline, i.e. how the target is defined), more than the sum of national Member States' indicative energy efficiency targets but still falling slightly short of the 2020 indicative EU energy efficiency target of 20%. In 2030, energy consumption is projected to decrease (again relative to 2007 baseline projections) by 23.9%. Primary energy demand and GDP continue to decouple (
Figure 38
), which is consistent with the trends observed since 2005. Energy efficiency improvements are mainly driven by policy up to 2020 and by market/technology trends after 2020.
Figure 38: Decoupling of EU energy use and intensity from GDP (2005=100)

Source: Commission calculations based on PRIMES and GEM E3
The distribution of final energy consumption across sectors remains broadly similar to the current picture, all the way to 2050, with transport and the residential sector comprising the lion's share of final energy consumption (32% and 27% of final consumption, respectively, in 2030). Industry sees its share in final energy demand slightly decreasing, from 28% in 2005 to 23% in 2050, mostly due to improved energy efficiency in non-energy intensive industries. The tertiary (services and agriculture) sector keeps a stable share of about 17%.
Figure 39: Evolution of final energy demand by sector (Mtoe – left, shares – right)

Source: PRIMES
With regard to the fuel mix in final energy, there is a gradual penetration of electricity (from 22% in total final energy use in 2010 to 28% in 2050). This is because of growing electricity demand as compared to other final energy use and to some electrification of heating (heat pumps) and to a limited extent in the transport sector. The potential of gas demand developments in, e.g. the transport sector, are not fully reflected in the Reference scenario, suggesting that additional policy incentives would be needed to trigger further fuel switching in the transport sector.
Figure 40: Evolution of final energy demand by fuel (Mtoe – left, shares – right)

Source: PRIMES
Energy intensity of the industrial sectors remains approximately constant in the medium term, as additional energy demand is due to the increase in production activity. In the long term however energy demand decreases, even though activity in terms of value added progresses. This is due to the energy efficiency embedded in the new capital vintages which replace old equipment and structural changes towards higher value added and less energy-intensive production processes, such as in iron and steel or non-ferrous metals.
Figure 41: Industrial energy demand versus activity (value added)

Source: PRIMES
In the residential sector, energy demand remains below 2015 levels throughout the projection period. Energy demand decouples from income growth more than would be suggested by extrapolation of trends as the efficiency policies drive energy intensity improvements fast in the medium term; in the long term however the rate of improvements decreases due to the absence of additional policies.
Figure 42: Final energy demand in the residential sector

Source: PRIMES
The activity of the transport sector shows a significant growth (
Figure 43
), with the highest increase in 2010 to 2030, driven by developments in economic activity. Historically, the growth of final energy demand in the transport sector has shown strong correlation with the evolution of transport activity. However, a decoupling between energy consumption and transport activity has been recorded in the past years. The decoupling between energy consumption and activity is projected to continue and even to intensify in the future.
Figure 43: Trends in transport activity and energy consumption

Source: PRIMES and GEM-E3; For aviation, passenger transport activity includes domestic, international intra-EU and international extra-EU aviation.
Decarbonisation
CO2 emissions reduction
In REF2016, the binding energy and climate targets for 2020 will be met by assumption. However, current policy and market conditions will not deliver achievement of either the EU 2030 targets or the EU long-term 2050 decarbonisation goal.
Total CO2 emissions are projected to be 22% below 1990 levels by 2020. In 2030, CO2 emissions reduce (relative to 1990 levels) by 32%. Most of these emissions are energy related, and this part also determines the overall trends. Non-energy related CO2 emissions mainly relate to industrial processes, and remain rather stable. Land-use related CO2 emissions are discussed below in the LULUCF section.
Emission reductions in the ETS sectors are larger than those in sectors covered by the Effort Sharing Decision (ESD) as current legislation implies a continuation of the reduction of the ETS cap with 1.74% per year over the projected period leading to a carbon price driving long term emission reduction. In the ESD sectors, there are no further drivers beyond market forces (e.g. rising fossil fuel prices) and the continued impact of adopted policies such as CO2 standards for vehicles or energy performance standards for new building to further reduce energy and consequently emissions.
CO2 emissions can be decomposed in the components: GDP, energy intensity of GDP and carbon intensity of energy. The energy intensity of GDP component declines due to structural changes in the economy and increasing energy efficiency in all sectors. The decrease of carbon intensity of energy supply becomes an increasingly significant component over the period. This is mainly due to Renewable Energy policies in the short term and the ETS in the medium to long term.
On a sectoral level, CO2 emissions decrease in all sectors.
Figure 44
shows a steep decrease in power generation, whereas emissions in the field of transport decrease at much slower pace between 2010 and 2050, and the transport sector becomes the largest source of CO2 emissions after 2030. Non-energy and non-land use related CO2 emissions (e.g. industrial processes) reduce only slowly throughout the projection period; however, they only represent a small share of total CO2 emissions.
Figure 44: Evolution of CO2 emissions (Mt) by sector

Source: PRIMES
Renewable Energy
In 2020, the RES share in gross final energy consumption reaches 21% in 2020, while in 2030, it reaches 24%.
Renewable electricity is projected to increase (as a share of net power generation) from around 28% in 2015 to 36% in 2020, which implies an acceleration compared to observed trends today, in particular in a number of countries that are currently facing difficulties to meet their target. Further RES share increases are more limited until 2030 to reach 43%, as RES policies are phased out in the Reference scenario after 2020 and only most competitive RES technologies can emerge.
The RES share in heating and cooling increases from 17% in 2015 to 22% in 2020, reaching 25% in 2030. The use of RES in final demand for heating and cooling is the main driver of RES-H&C increase in the short term, but its contribution stagnates in the long term. In the long-term, RES in CHP and heat plants (e.g. district heating), as well some deployment of heat pumps, drive further increase of the RES-H&C share. Energy efficiency, implying lower demand for heat in all sectors, is also an important driver in the medium and long term.
The RES-T share reaches 11% in 2020. The development of bio-fuels is the main driver in the short term, but its contribution stagnates in the long term. The biofuel penetration is mainly driven by the legally binding target of 10% renewable energy in the transport sector (RES-T target). Projections also take into consideration specific MS mandatory blending, obligations and tax incentives, as well as the ILUC Directive. RES in electricity, combined with the relative increase of electricity use (albeit modest in share terms), is the main contributor to RES-T in the long term.
Non-CO2 emission reduction
Non-CO2 emissions (CH4, N2O and F-Gases), account currently (2013) for 18% of total EU GHG emissions (excluding LULUCF). They have decreased significantly (32%) between 1990 and 2013. They are expected to further decrease by 29% below 2005 levels in 2030 (-46% compared to 1990 levels), and to stagnate later on. CH4 emissions – which have the largest share in this aggregate - are projected to decrease above average (33% due to declining trends in fossil fuel production, improvements in gas distribution and waste management) and N2O emissions fall below average (17%) until 2030, both remaining flat thereafter. F-Gases would reduce by half between 2005 and 2030, largely driven by EU and Member State's policies (i.e. the 2014 F-gas regulation and mobile air conditioning directive). Except for a very minor fraction from some specific industries, non-CO2 emissions fall under the ESD.
Figure 45: Non CO2 GHG emissions (Mt CO2 eq.)

Source: GAINS
The non-CO2 emission trends and their drivers vary by sector.
Agriculture is responsible for about half of all non-CO2 emissions and is expected to increase its share in total non-CO2 until 2030. While the agricultural non-CO2 emissions have reduced by 22% between 1990 and 2013, they are projected to roughly stabilize at current levels as a result of different trends which compensate each other, such as decreasing herd sizes (both of dairy cows and of non-dairy cattle) but increasing milk yields. Slightly reduced use of mineral fertilizer through improved efficiency (2% less in 2030 than in 2005) leads to corresponding reductions in N2O emissions from soils. Improved manure management (e.g. through anaerobic digestion) also delivers minor emission reductions. The Common Agricultural Policy influences, inter alia, livestock numbers/intensities and the Nitrogen Directive and the Water Framework Directive impact on the use of fertilizer.
Waste is currently the second most important sector emitting non-CO2. There, a substantial reduction between 2005 and 2030 is expected (70%), strongly driven by environmental legislation, such as the Landfill directive and improvements in waste management as well as an update in inventory methodology of historic landfills that results in increased historic emissions and subsequent increased reductions of these emissions in the near to mid-term future. Also an increasing amount of CH4 is recovered and utilised, thereby impacting on these trends towards lower emissions. After 2030, however, a moderate increase is projected, reflecting trends in economic development.
CH4 and N2O emissions from the energy sector (incl. transport) are expected to decrease by 36% from 2005 to 2030, and further 26% between 2030 and 2050. The main reductions come from less coal-mining and crude oil production in the EU, together with reduced emissions from power generation with fossil fuels. On the other hand, transport is expected to generate an increasing share of energy sector non-CO2 emissions (N2O from road transport being the most important contributor), growing from 12% in 2005 to 15% in 2030 and 20% in 2050 within the energy aggregate.
Emissions from air conditioning and refrigeration decrease by half from 2005 until 2030, also thanks to existing legislation (i.e. the new 2014 F-gas Regulation and the Mobile Air Conditioning systems Directive).
Most of the non-CO2 emissions from industry – overall a minor non-CO2 sector - are covered by the EU ETS (production of adipic and nitric acid, and of aluminium). The resulting incentive in combination with relatively cheap abatement options and (previous) national legislation cut emissions quite rapidly, to, in 2030, only a fifth of those in 2005. For the period after 2030 slight increases are projected in line with economic trends.
Emissions from the wastewater sector and remaining other sectors are projected to increase moderately in line with economic development over the whole period covered.
LULUCF emissions and removals
The EU28 Land Use Land Use Change and Forestry (LULUCF) sector is at present a net carbon sink which has been sequestering annually on average more than 300 Mt CO2 over the past decade according to the UNFCCC inventory data. In the Reference scenario 2016, the LULUCF sink is expected to decline in the future to -288 Mt CO2 eq in 2030 from -299 Mt CO2 eq. in 2005 and decreases further after 2030. This decline is driven partly by the increase in timber demand (partially a result of the increase in bioenergy demand that is expected in order to reach the Renewable Energy targets in 2020. It is the result of changes in different land use activities of which changes in the forest sector are the most important.
Figure 46
shows the projection of the total EU28 LULUCF sink in the Reference scenario 2016 and the contribution from different land use activities.
At present, the carbon sink in managed forests (-373 Mt CO2 eq. in 2010), without applying any accounting rules, is the main contributor to the LULUCF sink. The forest management sink is driven by the balance of forest harvest and forest increment rates (accumulation of carbon in forest biomass as a result of growth of the trees with the age). Forest harvest is projected to increase over time from 516 million m3 in 2005 to 565 million m3 in 2030 due to growing demand for wood for material uses and energy production. As a consequence, the carbon sink in managed forests declines by 32% until 2030. This decline in the managed forests carbon sink is partially compensated by a rising carbon sink from afforestation and decreasing emissions from deforestation in line with past trends. Emissions from deforestation continue to decline from 63 Mt CO2 in 2005 to 20 Mt CO2 eq. in 2030. Carbon sequestration from afforested areas increases steadily to 99 Mt CO2 eq. by 2030, as new forests are continuously, though at slower rate, being established. In addition, young forests that were established over the last 20 years get into a phase of high biomass production.
Activities in the agricultural sector (cropland and grassland) have a smaller impact on the total LULUCF sink compared to the forest sector. Still, net carbon emissions from cropland are projected to decline by some 18% by 2030 compared to 2005 as soils converge towards soil carbon equilibrium over time. In addition, perennial crops (miscanthus, switchgrass and short rotation coppice) that typically sequester additional carbon in soil and biomass contribute to decreasing cropland emissions. By 2030, 0.9 Mha of perennial crops are expected to be cultivated. The grassland sink increases to around -19 Mt CO2 eq. in 2030 as land continues to be converted to grassland e.g. through cropland abandonment while at the same time the total grassland area slightly declines over time due to afforestation and the expansion of settlements.
Figure 46: Development of the EU28 emissions/removals in the LULUCF sector in Mt CO2 until 2050

Source: GLOBIOM-G4M
Research, innovation and competitiveness
REF2016 deals explicitly with the penetration of new technologies. The approach is in two steps. First, assumptions are made on techno-economic characteristics based on latest scientific evidence. Second, the model endogenously selects the most economically viable technologies at each point in time, leading to further technology learning as technologies are deployed.
The development of PVs starts from lower costs than in the previous Reference Scenario and has a positive learning curve throughout the projection period. This translates into significant deployment of solar PVs in REF2016, especially in Southern Europe.
Figure 47: Illustrative levelized cost of electricity (expressed in €'2013/MWh-net)

Source: PRIMES
There remains large uncertainty about the costs for offshore wind and there have been cost increases due to previously unforeseen difficulties and logistics. Surveys have identified significant potential of cost decrease due to economies of scale and possibilities of improvement in logistics, but these cost decreases are likely to occur only towards 2030. As such, offshore wind developments in REF2016 are more conservative than in past exercises.
The share of advanced biofuels in total consumption of biofuels moderately increases. Out of these, about half are projected to be related to innovative technologies and methods, such as forestry residues, or bio-waste.
Compared to the previous Reference scenario, the costs of nuclear investment have increased and also the costs for nuclear refurbishments have been revised upwards. Although lifetime extensions of nuclear power plants remain economically viable in most cases, investments in new built plants are lower compared to previous projections.
CCS uptake remains very slow all the way to 2050. The construction of power plants equipped with carbon capture technologies has been developing at a very slow pace, and been dependent on public support (e.g. EEPR and NER300). Political restrictions are also reflected. For these reasons, CCS costs are assumed higher than in previous Reference scenarios.
On the demand side, demand for electric appliances continues to increase. However, there is an uncoupling between appliance stock and energy consumption due to the technological progress facilitated by eco-design regulations.
Car manufacturers are expected to comply with the CO2 standards by marketing vehicles equipped with hybrid system, which are becoming more appealing to the consumers thanks to lower costs. Electrically chargeable vehicles emerge around 2020 and are kick-started by existing EU and national policies as well as by incentive schemes aiming to boost their penetration. The share of activity of total electric vehicles in the total activity of light duty vehicles reaches 15% in 2050 (
Figure 48
). Fuel cells would add an additional 2% by 2050. Other energy forms such as LPG and natural gas maintain a rather small share in the final energy demand of the transport sector.
Figure 48: Evolution of activity of light duty vehicles by type and fuel

Source: PRIMES-TREMOVE transport model
Energy system costs (
Figure 49
) increase up to 2020. Large investments are undertaken driven by current policies and measures. Overall, in 2020 energy system costs constitute 12.3% of the GDP, rising from 11.4% in 2010. Between 2020 and 2030 the share remains stable and decreases thereafter, as the system reaps benefits from the investments undertaken in the previous decade (notably via fuel savings). In this period, the share of energy system costs in GDP is gradually decreasing, reaching levels close to 2005 in 2050.
Figure 49: Projected evolution of energy system costs

Source: PRIMES; Energy system costs exclude ETS auction payments, given that they result in corresponding auction revenues.
Pathways/scenarios for decarbonising the transport sector
Central scenarios
Two central policy scenarios reflecting the 2030 targets and main elements of the 2030 climate and energy framework agreed by the European Council in 2014 have been developed, EUCO27 and EUCO30. This recognises that for the energy efficiency target a review will still be undertaken to set the level of ambition. These scenarios also aim to provide consistency across a number of impact assessments underpinning 2016 Energy Union policy proposals. Using two central scenarios increases the robustness of policy conclusions.
Both scenarios start from the EU Reference scenario 2016 and add the targets and policies described below. In addition, coordination policies are assumed which enable long term decarbonisation of the economy. Coordination policies replace the "enabling conditions" which have been modelled in 2030 framework impact assessment and the 2014 impact assessment on 2030 energy efficiency targets.
Table 20
summarises the policy assumptions in EUCO27 scenario that have been modelled.
Table 20: Policy assumptions in EUCO27 scenario
|
EUCO27
|
This scenario is designed to meet all 2030 targets set by the European Council:
At least 40% GHG reduction (wrt. 1990)
43% GHG emissions reduction in ETS sectors (wrt 2005)
30% GHG emissions reduction in Effort Sharing Decision sectors (wrt 2005)
At least 27% share of RES in final energy consumption
27% primary energy consumption reduction (i.e. achieving 1369 Mtoe in 2030) compared to PRIMES 2007 baseline (1887 Mtoe in 2030). This equals a reduction of primary energy consumption of 20% compared to 2005 primary energy consumption (1713 Mtoe in 2005).
Main policies and incentives additional to Reference:
Revised EU ETS
-Increase of ETS linear factor to 2.2% for 2021-30
-After 2030 cap trajectory to achieve -90% emission reduction in 2050 in line with Low Carbon Economy Roadmap
Renewables policies
-Renewables policies necessary to achieve 27% target, reflected by renewable (RES) values applied in electricity, heating & cooling and transport sectors.
Energy efficiency policies:
Residential and services sector
-Increasing energy efficiency of buildings via increasing the rate of renovation and depth of renovation. In this model, better implementation of Energy Performance of Buildings Directive, continuation of Art 7 of Energy Efficiency Directive (EED) and dedicated national policies are depicted by application of energy efficiency values.
-Financial instruments and other financing measures on the European level facilitating access to capital for investment in thermal renovation of buildings. This, together with further labelling policies for heating equipment is depicted by a reduction of behavioural discount rates for households from 12% to 11.5%.
-More stringent (than in Reference) eco-design standards banning the least efficient technologies.
Industry
-More stringent (than in Reference) eco-design standards for motors.
Transport
-CO2 standard for cars: 85gCO2/km in 2025; 75gCO2/km in 2030 and 25 gCO2/km in 2050.
-CO2 standards for vans: 135gCO2/km in 2025; 120gCO2/km in 2030 and 60gCO2/km in 2050.
-1.5% average annual energy efficiency improvements for new conventional and hybrid heavy goods vehicles for 2010-2030 and 0.7% for 2030-2050.
-Measures on management of transport demand:
orecently adopted measures for road freight, railways and inland navigation;
ogradual internalisation of transport local externalities as of 2025 and full internalisation by 2050 on the inter-urban network.
Non-CO2 policies
-In 2030 carbon values of €0.05 applied to non-CO2 GHG emissions in order to trigger cost-effective emission reductions in these sectors including in agriculture.
-After 2030 carbon values set at EU ETS carbon price level.
|
In the EUCO27 scenario, energy efficiency delivers a large part of GHG emissions reduction in the Effort Sharing Decision sectors. This reduction is complemented by cost-effective reductions in non-CO2 emissions – mostly in agriculture.
The EUCO30 scenario is constructed similarly to the EUCO27 scenario, but raises the ambition level of the specific energy efficiency policies in a cost effective way (see
Table 21
). It implements the European Council guidance of having in mind 30% for the review of the energy efficiency target. A relevant implication is that more ambitious energy efficiency policies deliver all necessary reductions in Effort Sharing Decision sectors, and no reductions in non-CO2 sectors such as agriculture beyond Reference take place.
Table 21: Policy assumptions in EUCO30 scenario
|
EUCO30
|
This scenario is designed to meet all 2030 targets set by the European Council:
At least 40% GHG reduction (wrt. 1990)
43% GHG emissions reduction in ETS sectors (wrt 2005)
30% GHG emissions reduction in Effort Sharing Decision sectors (wrt 2005)
27% share of RES in final energy consumption
30% primary energy consumption reduction (i.e. achieving 1322 Mtoe in 2030) compared to PRIMES 2007 baseline (1887 Mtoe in 2030). This equals a reduction of primary energy consumption of 23% compared to 2005 primary energy consumption (1713 Mtoe in 2005).
Main policies and incentives additional to Reference:
Revised EU ETS
-Increase of ETS linear factor to 2.2% for 2021-30
-After 2030 cap trajectory to achieve -90% emission reduction in 2050 in line with Low Carbon Economy Roadmap
Renewables policies
-Renewables policies necessary to achieve 27% target, reflected by renewable (RES) values applied in electricity, heating & cooling and transport sectors.
Energy efficiency policies:
Residential and services sector
-Further increasing energy efficiency of buildings via increasing the rate of renovation and depth of renovation. In this model, better implementation of EPBD and EED, continuation of Art 7 of EED and dedicated national policies are depicted by the application of energy efficiency values. Energy efficiency values are increased compared to EUCO27.
-Financial instruments and other financing measures on the European level facilitating access to capital for investment in thermal renovation of buildings. This, together with further labelling policies for heating equipment, is depicted by a reduction of behavioural discount rates for households from 12% to 11.5%.
-More stringent (than in EUCO27) eco-design standards banning the least efficient technologies.
-Policies facilitating the uptake of heat pumps.
Industry
-More stringent (compared to EUCO27) eco-design standards for motors.
Transport
-CO2 standard for cars: 80g CO2/km in 2025; 70g CO2/km in 2030 and 25 g CO2/km in 2050.
-CO2 standards for vans: 130g CO2/km in 2025; 110g CO2/km in 2030; 60g CO2/km in 2050.
-1.5% average annual energy efficiency improvements for new conventional and hybrid heavy goods vehicles for 2010-2030 and 0.7% for 2030-2050.
-Measures on management of transport demand:
orecently adopted measures for road freight, railways and inland navigation;
ogradual internalisation of transport local externalities as of 2025 and full internalisation by 2050 on the inter-urban network.
omodulation of infrastructure charges for heavy goods vehicles according to CO2 emissions leading to faster fleet renewal;
oeco-driving;
odeployment of Collaborative Intelligent Transport Systems.
Non-CO2 policies
-No policy incentive until 2030.
-After 2030 carbon values set at EU ETS carbon price level
|
Table 22
provides a summary of the transport related measures included in the EUCO27 and EUCO30 scenarios.
Table 22: Summary of transport related measures in the EUCO27 and EUCO30 scenarios
|
EUCO27 scenario
|
EUCO30 scenario
|
|
Low- and zero-emission vehicles
|
|
CO2 standards for cars: 85 gCO2/km in 2025; 75 gCO2/km in 2030 and 25 gCO2/km in 2050.
CO2 standards for vans: 135 gCO2/km in 2025; 120 gCO2/km in 2030 and 60 gCO2/km in 2050.
1.5% average yearly improvement in energy efficiency of new conventional and hybrid heavy goods vehicles for 2010-2030 and 0.7% for 2030-2050.
|
CO2 standards for cars: 80 gCO2/km in 2025; 70 gCO2/km in 2030 and 25 gCO2/km in 2050.
CO2 standards for vans: 130 gCO2/km in 2025; 110 gCO2/km in 2030 and 60 gCO2/km in 2050.
1.5% average yearly improvement in energy efficiency of new conventional and hybrid heavy goods vehicles for 2010-2030 and 0.7% for 2030-2050.
|
|
Low emission alternative fuels, infrastructure and alternative powertrains
|
|
Development of infrastructure for alternative powertrains (including electricity, hydrogen and LNG) for all relevant transport modes.
Alternative fuels for all relevant modes driven by incentives for biofuels and CO2 standards for electrification.
food-based biofuels respect the 7% cap of ILUC Directive in 2020 and their growth post-2020 is not going beyond the cap.
|
|
Efficiency of the transport system
|
|
Measures improving efficiency/reducing emissions of all transport modes: measures adopted after the cut-off date of Reference scenario 2016 (i.e. Directive on Weights & Dimensions, Fourth railway package, NAIADES II package and the Ports Package)
Gradual approach towards the internalisation of local externalities on the inter-urban network
|
Measures improving efficiency/reducing emissions of all transport modes: measures adopted after the cut-off date of Reference scenario 2016 (i.e. Directive on Weights & Dimensions, Fourth railway package, NAIADES II package, and the Ports Package)
Gradual approach towards the internalisation of local externalities on the inter-urban network plus modulation of infrastructure charges for heavy goods vehicles according to CO2 emissions.
Deployment of Cooperative Intelligent Transport Systems and eco-driving.
|
Coordination policies
In this modelling exercise, all scenarios (except the EU Reference scenario 2016) achieve decarbonisation in 2050 and hence assume an overall policy framework which enables this. Given that concrete policies will most likely have to be proposed in order to fulfil the necessary conditions in infrastructure, technology, market coordination, the elements of this framework which go beyond the drivers and policies specified in the policy scenarios are called coordination policies. Coordination policies replace the "enabling conditions" which have been modelled in the 2030 framework impact assessment (in decarbonisation scenarios) and the 2014 impact assessment on energy efficiency target.
In past modelling exercises, enabling conditions were present in all decarbonisation scenarios. Enabling conditions meant that because of good anticipation of future GHG emission reduction commitments, all conditions were met in infrastructure, technology learning, public acceptance and market coordination so as to enable the decarbonisation. In other words, enabling conditions enabled to maximize the effectiveness of policy instrument which aim at driving strong GHG emission cuts. These enabling conditions were fully costed in decarbonisation scenarios.
These assumptions have been revisited considering that concrete policies will most likely have to be proposed in order to fulfil the necessary conditions in infrastructure, technology, market coordination, etc. Consequently, in the central scenarios (and more ambitious pathways/scenarios) enabling conditions are replaced by coordination policies. These coordination policies are envisaged by the Commission for the period post-2020. Coordination policies are fully costed in the scenarios, as it was the case with enabling conditions. It would be important to make a distinction between:
coordination policies related to ongoing infrastructure developments that will enable a larger exploitation of cost-effective energy efficiency, renewables, greenhouse gas emissions abatement options after 2020;
coordination policies related to R&D and public acceptance that are expected to be needed to meet long term decarbonisation objectives, and have effects post 2030.
A summary of coordination policies relevant for transport is provided in
Table 23
.
Table 23: Summary of coordination policies relevant for transport
|
Enabling conditions in the 2030 Impact Assessment
|
New approach
|
|
Intelligent grids and metering (also for electric vehicles)
|
Coordination policy post 2020
(Partly accomplished in the EU Reference scenario 2016 - implementation of the 3rd Internal Energy Market package).
|
|
Battery technology development (for electric and plug-in hybrid vehicles) and fuel cells
|
EU Reference scenario 2016 has assumptions on battery technology development and fuel cells which are rather conservative, consistent with the logic of a Reference scenario, i.e. without additional policies stimulating R&D, infrastructure or purchase.
For the decarbonisation scenarios, increased R&D, expectations and learning effects lead to lower technology costs for electrification technology (for electric and plug-in hybrid vehicles) and fuel cells.
|
|
Recharging/refuelling infrastructure
|
Coordination policy post 2020
(based on the Directive on the deployment of alternative fuels infrastructure)
|
|
Market acceptance (of electrification)
|
To be part of coordination policies post 2020
(supported by the implementing measures following the Directive on the deployment of alternative fuels infrastructure)
|
|
Innovation in biofuels
|
Coordination policy with impacts post 2030
These are biomass related innovation and agriculture policies assumed to develop so as to allow the development of new generation bio-energy feedstock (basically lingo-cellulosic crops) at large scale. As a result, a new industry would emerge ranging from agriculture, industrial-scale collection and pre-treatment, bio-refineries with new conversion technologies, product standardization and commercialisation.
|
More ambitious pathways/scenarios for low-emission mobility
Several more ambitious pathways/scenarios were developed for the decarbonisation of the transport sector. They all have as starting point the EUCO30 scenario but include additional policy initiatives (see
Table 24
) in three work strands: low- and zero-emission vehicles, low-emission alternative energy for transport and efficiency of the transport system. These scenarios achieve more ambitious emissions reductions than EUCO30 and thus are not directly comparable in terms of achievements/costs to the central scenarios.
Table 24: Summary of measures included in the more ambitious pathways/scenarios
|
Scenario
|
Description
|
|
Low- and zero-emission vehicles
|
|
Ambitious vehicle efficiency standards (VEH scenario)
|
Same as EUCO30 scenario but with more ambitious vehicle efficiency standards, as set out by the Commission in its statements during the trialogue discussions for the 2020 targets:
-CO2 standards for cars – in 2025: 74gCO2/km; in 2030: 64gCO2/km and in 2050: 25gCO2/km (on current NEDC test-cycle).
-CO2 standards for light commercial vehicles – in 2025: 106gCO2/km; in 2030: 97gCO2/km and in 2050: 60gCO2/km (on current NEDC test-cycle).
-1.6% average yearly improvement in energy efficiency of new conventional and hybrid heavy goods vehicles for 2010-2030 and 0.9% for 2030-2050.
|
|
Low emission alternative energy for transport
|
|
Action on advanced renewable fuels (BIO-A and BIO-B scenarios)
|
BIO-A scenario: same as EUCO30 scenario but more ambitious on advanced renewable fuels. BIO-A scenario would explicitly limit food-based biofuels post-2020, very gradually reduce their share in the 2020-2030 perspective and further reduce their share to nearly zero in 2050 perspective. BIO-A scenario simulates a policy focussing on the promotion of advanced renewable fuels (e.g. through incorporation/blending obligations on the fuel suppliers), thereby leading to earlier deployment of production capacity and use of advanced biofuels. Specific incentives are assumed to promote the uptake of biokerosene and biomethane (used in waterborne transport and heavy-duty vehicles).
BIO-B scenario: same as EUCO30 scenario but with more ambitious policy on advanced renewable fuels and complete phase-out of food-based biofuels by 2030. The total level of biofuels is kept similar to EUCO30, while reducing the contribution that food-based biofuels make to the overall share in liquid and gaseous fuels to 0% in 2030 and beyond. Like in the BIO-A scenario, BIO-B would include specific measures (e.g. incorporation/blending obligations on the fuel suppliers in the EU) for the uptake of advanced renewable fuels and specific incentives are provided to promote the uptake of biomethane and biokerosene.
Concerning pollutant emissions, it is assumed that new vehicles meet EURO 6 and EURO VI requirements.
|
|
Advanced research and innovation in electro-mobility (TECH scenario)
|
Same policy assumptions for transport as EUCO30 scenario but assuming lower technology costs (e.g. for electric vehicle component costs and fuel cells) due to higher R&D investments.
|
|
Efficiency of the transport system
|
|
Focus on efficiency of the transport system (MOBI scenario)
|
Same as EUCO30 scenario but assuming: full internalisation of local externalities on the inter-urban network from 2025 onwards plus modulation of infrastructure charges for heavy goods vehicles according to CO2 emissions; higher deployment of Collaborative Intelligent Transport Systems and support for multimodal travel information; measures promoting efficiency improvements and multimodality (e.g. review of the Combined Transport Directive, review of the Rail Freight Corridors Regulation, review of market access rules for road transport).
Promotion of urban policies curbing pollutant emissions; reflected through air pollutants shadow values equal to the damage costs from the 2014 Handbook on external costs of transport.
|
|
Focus on efficiency of the transport system and fuel taxation (MOBI-TAX scenario)
|
Same as MOBI scenario but additionally reflecting the alignment of the EU minimum tax rates of petrol and gas oil used as motor fuels.
|
Details on the assumptions used for the transport-related measures in the central and more ambitious pathways/scenarios
CO2 standards for new cars and light commercial vehicles
The tightening of CO2 standards post-2020 is a key assumption, leading to improvements in energy efficiency and CO2 emissions reduction in transport. The CO2 standards assumed in the decarbonisation pathways/scenarios are provided in
Table 22
and
Table 24
.
Vehicle efficiency of new heavy duty vehicles
The improvements in specific fuel consumption of new conventional and hybrid heavy goods vehicles assumed in the decarbonisation pathways/scenarios are provided in
Table 22
and
Table 24
.
Advanced renewable fuels and food-based biofuels
All scenarios build on the Reference scenario, which reflects biofuel blending mandates currently in place at the Member States level. In all decarbonisation pathways/scenarios biofuel uptake is driven by policies necessary to achieve the 27% overall renewables target by 2030, reflected by renewable (RES) values applied in the transport sector. RES values also apply in electricity and heating & cooling sectors for achieving the 27% target. Food-based biofuels respect the 7% cap of ILUC Directive in 2020 and their growth post-2020 is not going beyond the cap. For aviation, higher EU ETS prices post-2030 drive the uptake of biokerosene in all decarbonisation pathways/scenarios.
In BIO-A scenario a stronger emphasis is placed on the promotion of advanced renewable fuels (e.g. via an increase of incorporation/blending obligations on the fuel suppliers) leading to an earlier deployment of these technologies. The share of advanced renewable fuels is gradually increasing after 2020 and reaches 4% of total liquid and gaseous fuels by 2030 which represents half of the total share of biofuels. Food-based biofuels respect the 7% cap of ILUC Directive over the entire time horizon. The share increases to 4.7% in 2020 but is assumed to gradually decline afterwards to nearly zero in 2050. Specific incentives are provided for the uptake of biokerosene and biomethane which would provide about 1.3% of total liquid and gaseous fuels in transport.
BIO-B scenario also assumes increased blending requirements for advanced renewable fuels post-2020 (e.g. incorporation/blending obligations on the fuel suppliers), leading to earlier deployment of biofuels production capacity and use of advanced biofuels. Furthermore, food-based biofuel use would be phased out, from 4.7% of liquid and gaseous fuels in transport in 2020 to 0% by 2030. The total level of biofuels is kept similar to EUCO30. All biofuels in 2030 are advanced renewable fuels in BIO-B. Similar to BIO-A, specific incentives are provided for the uptake of biokerosene and biomethane which would provide about 1.3% of total liquid and gaseous fuels in transport.
Advanced research and innovation in electro-mobility
For the decarbonisation pathways/scenarios, increased R&D, expectations and learning effects lead to lower technology costs for electrification technology (for electric and plug-in hybrid vehicles) and fuel cells. For an electric vehicle with a range of 250 km, costs in the EUCO27, EUCO30, VEH, BIO-A, BIO-B, MOBI and MOBI-TAX are €2,100 lower by 2030 than in the EU Reference scenario 2016 and €2,400 lower by 2050. For plug-in hybrid vehicles with electric autonomy of 50km, costs are €2,000 lower by 2030 and €1,500 by 2050, while for fuel cells vehicles they are €4,500 lower by 2030 and €5,400 by 2050.
Even lower technology costs (e.g. for electric vehicle component costs and fuel cells), due to higher R&D investments, are assumed in the TECH scenario. In this scenario, increased R&D expenditure is assumed to deliver reductions in technological components much earlier than in the other scenarios. Therefore, for electric vehicles, costs are €3,600 lower by 2030 than in the EU Reference scenario 2016 and €3,500 lower by 2050. For plug-in hybrid vehicles, costs are €2,200 lower by 2030 and €1,700 by 2050 while for fuel cells they are €12,000 lower by 2030 and €11,000 by 2050.
Recently adopted measures
Measures adopted after the cut-off date of EU Reference scenario 2016 (i.e. Directive on Weights & Dimensions, Fourth railway package, NAIADES II package, and the Ports Package) are assumed to apply in all scenarios. The input for modelling draws on the respective Impact Assessments.
Fair and efficient pricing for sustainable transport
-Gradual internalisation of the costs of infrastructure wear & tear, congestion, air pollution and noise in the pricing of road transport on the inter-urban network is assumed from 2025 onwards. For rail, internalisation of the costs of air pollution, noise and congestion is assumed from 2030 onwards; for inland waterways internalisation of the costs of air pollution is assumed from 2030 onwards. In scenarios EUCO27, EUCO30, VEH, BIO-A, BIO-B and TECH the levels of the charges are gradually increased from 2025/2030 to 2050, when they become equal to the values of the 2014 Handbook on external costs of transport.
-Full internalisation of local externalities is assumed in scenarios MOBI and MOBI-TAX, meaning that the charges are set equal to the values of the 2014 Handbook on external costs of transport from 2025 onwards for road transport (on the inter-urban network) and from 2030 onwards for rail and inland waterways.
-Modulation of the infrastructure charges according to CO2 emissions for heavy goods vehicles (HGVs) is assumed to apply in all scenarios except for EUCO27; it is assumed to apply on the inter-urban network from 2025 onwards. Starting from the average infrastructure charge in each Member State, a linear incremental variation is assumed for HGVs with higher emissions than average; a similar linear variation is assumed for HGVs with lower emissions than average (by HGVs category). The measure is assumed to apply similarly to the Euro class-differentiation of network-wide tolls and implies revenue neutrality.
Collaborative Intelligent Transport Systems (C-ITS)
Deployment of C-ITS in road transport has been assumed in all scenarios except for EUCO27.
-In scenarios EUCO30, VEH, BIO-A, BIO-B and TECH the input assumption for modelling draws on the central scenario of a Cost Benefit Analysis (CBA) study carried out by Ricardo-AEA.
-In scenarios MOBI and MOBI-TAX more ambitious deployment of C-ITS is assumed, designed to represent the impact of using the cellular network to provide vehicle-to-infrastructure (V2I) services. The input for modelling draws on a sensitivity developed by Ricardo-AEA within the same study.
Eco-driving
Promotion of eco-driving is assumed in all scenarios except for EUCO27; the input assumption used for modelling draw on "EU Transport GHG: Routes to 2050?" project.
It is assumed that virtually all drivers would be trained by 2050 (for road and rail). Savings from training decline to 2050 due to technology effects. No variation in the level of intensity of the measure is assumed between scenarios.
Promotion of public procurement through the revision of the Clean Vehicles Directive.
Using a conservative approach, it is assumed that starting from 2025 the level of vehicles purchased under the Directive (i.e. the upper estimate according to the evaluation study) resemble the best-performing vehicles in the market in terms of internalised external costs. Measure included in the VEH scenario.
Review of market access rules for road transport (road haulage).
For modelling purposes, it is assumed that the measures would lead to a share of empty vehicle-km in total vehicle-km for cabotage equal to that of domestic hauliers carrying out national transport from 2025 onwards. Increasing the load factors in PRIMES-TREMOVE model allows capturing rebound effects and possible modal shift due to e.g. lower unit costs relative to rail. Measure included in scenarios MOBI and MOBI-TAX.
Support for multimodal travel information
The input for modelling is based on a 2014 study
, showing that more effective network management and more efficient passenger transport through more efficient journeys and optimized travel choices reduce travel time. For modelling purpose, the measure is assumed to be implemented from 2025 onwards. Measure included in scenarios MOBI and MOBI-TAX.
Promoting intermodal transport
Drawing on a 2015 study, the main drivers are assumed to be the decrease in the operation costs for combined transport and time costs for rail, inland waterways and short sea shipping, leading to model shift away from road (mainly towards rail); implemented from 2025 onwards. Measure included in scenarios MOBI and MOBI-TAX.
Promotion of urban policies
Soft measures supporting urban policies that curb pollutant emissions are reflected through air pollutants shadow values equal to the damage costs from the 2014 Handbook on external costs of transport; implemented from 2025 onwards. Measure included in scenarios MOBI and MOBI-TAX.
Alignment of the EU minimum tax rates of petrol and gas oil used as motor fuels
The changes in the excise duty rates for diesel are assumed to be implemented from 2025 onwards and are provided in
Figure 50
. Measure included in scenario MOBI-TAX.
Figure 50: Changes in the excise duty rates for diesel by Member State from 2025 onwards
Additional results of the central and more ambitious pathways/scenarios
Impact on fuel mix
Alternative fuels and energy sources are projected to gain increasing share in the decarbonisation pathways/scenarios over time, providing about 59%-61% of energy demand by 2050, due to the large scale electrification of the fleet and the uptake of advanced renewable fuels (see
Figure 51
). Diesel, gasoline and jet fuels would lose significant market shares relative to REF2016 by 2050: 27-28 percentage points, 10-11 percentage points and 6 percentage points, respectively, in terms of total energy demand in transport.
Liquid and gaseous biofuels would provide a substantial share of alternative fuels by 2050 (about 36-38% of total energy demand), followed by electricity (around 16%) and hydrogen (some 3-4%). The share of electricity reflects the assumptions on the CO2 standards for LDV in the 2050 perspective. Gas would slightly decrease its share compared to 2030 (to about 2%) while LPG is expected to go back to levels similar to those in 2010. Electricity and hydrogen would provide about 40%-45% of energy demand by passenger cars while the role of biofuels would be more limited, ranging between 24% and 27%. Electricity is expected to provide around 85% of energy use in rail transport. Liquid and gaseous biofuels would represent around 42-45% of energy consumption in aviation, 44-45% in inland navigation and 45-48% in long distance road freight by 2050, where electrification is not or less an option.
Figure 51: Final energy demand in transport by fuel in 2050 (in % of total)

Source: PRIMES-TREMOVE transport model (ICCS-E3MLab)
Figure 52: Alternative fuels/energy sources in transport in 2050 (in % of total energy demand)

Source: PRIMES-TREMOVE transport model (ICCS-E3MLab)
CO2 emissions
As explained in section 4.3.4, CO2 emissions are expected to decrease by 18 to 22% by 2030 relative to 2005 (see
Table 25
).
Table 25: CO2 emissions reduction by mode for 2005-2030 and 2005-2050 (in %)
|
CO2 emissions (% change to 2005)
|
REF2016
|
EUCO27
|
EUCO30
|
|
|
'05-'30
|
'05-'50
|
'05-'30
|
'05-'50
|
'05-'30
|
'05-'50
|
|
Transport - total
|
-12.3%
|
-11.4%
|
-17.7%
|
-66.8%
|
-19.1%
|
-66.9%
|
|
Passenger transport
|
-15.7%
|
-16.0%
|
-22.0%
|
-71.9%
|
-23.5%
|
-71.8%
|
|
Road
|
-22.7%
|
-26.2%
|
-30.3%
|
-80.5%
|
-32.3%
|
-80.7%
|
|
Rail
|
-35.0%
|
-65.2%
|
-32.7%
|
-80.1%
|
-32.8%
|
-80.1%
|
|
Aviation
|
15.3%
|
28.6%
|
14.2%
|
-35.1%
|
14.7%
|
-33.5%
|
|
Inland navigation
|
-14.7%
|
-10.5%
|
-12.1%
|
-44.8%
|
-12.3%
|
-44.8%
|
|
Freight transport
|
-1.9%
|
2.9%
|
-4.9%
|
-51.5%
|
-5.7%
|
-52.1%
|
|
Road
|
0.2%
|
6.3%
|
-3.2%
|
-50.8%
|
-4.1%
|
-51.5%
|
|
Rail
|
-18.3%
|
-57.8%
|
-17.9%
|
-76.0%
|
-17.9%
|
-76.0%
|
|
Inland navigation
|
-25.0%
|
-18.8%
|
-22.8%
|
-50.3%
|
-22.9%
|
-50.3%
|
|
CO2 emissions (% change to 2005)
|
VEH
|
BIO-A
|
BIO-B
|
|
|
'05-'30
|
'05-'50
|
'05-'30
|
'05-'50
|
'05-'30
|
'05-'50
|
|
Transport - total
|
-22.1%
|
-67.2%
|
-20.6%
|
-66.6%
|
-19.7%
|
-66.5%
|
|
Passenger transport
|
-26.9%
|
-71.7%
|
-24.7%
|
-71.3%
|
-24.1%
|
-71.2%
|
|
Road
|
-36.6%
|
-80.7%
|
-32.9%
|
-80.4%
|
-32.0%
|
-80.3%
|
|
Rail
|
-32.8%
|
-80.1%
|
-33.5%
|
-79.8%
|
-32.1%
|
-79.7%
|
|
Aviation
|
14.7%
|
-33.5%
|
10.3%
|
-32.5%
|
10.2%
|
-32.3%
|
|
Inland navigation
|
-12.1%
|
-44.8%
|
-13.1%
|
-43.5%
|
-11.8%
|
-43.3%
|
|
Freight transport
|
-7.6%
|
-53.5%
|
-7.9%
|
-52.6%
|
-6.6%
|
-52.5%
|
|
Road
|
-6.2%
|
-53.0%
|
-6.5%
|
-52.1%
|
-5.2%
|
-52.0%
|
|
Rail
|
-18.0%
|
-76.0%
|
-18.7%
|
-75.7%
|
-17.5%
|
-75.7%
|
|
Inland navigation
|
-23.0%
|
-50.3%
|
-23.5%
|
-49.2%
|
-22.2%
|
-49.1%
|
|
CO2 emissions (% change to 2005)
|
TECH
|
MOBI
|
MOBI-TAX
|
|
|
'05-'30
|
'05-'50
|
'05-'30
|
'05-'50
|
'05-'30
|
'05-'50
|
|
Transport - total
|
-20.0%
|
-67.9%
|
-19.7%
|
-67.0%
|
-20.4%
|
-67.2%
|
|
Passenger transport
|
-24.6%
|
-72.9%
|
-23.9%
|
-71.8%
|
-24.4%
|
-71.9%
|
|
Road
|
-33.7%
|
-82.2%
|
-32.8%
|
-80.8%
|
-33.3%
|
-80.9%
|
|
Rail
|
-32.8%
|
-80.2%
|
-32.4%
|
-80.0%
|
-32.5%
|
-80.3%
|
|
Aviation
|
14.8%
|
-33.3%
|
14.3%
|
-33.6%
|
14.1%
|
-33.6%
|
|
Inland navigation
|
-12.3%
|
-45.0%
|
-11.6%
|
-44.7%
|
-13.2%
|
-45.2%
|
|
Freight transport
|
-5.9%
|
-52.5%
|
-7.1%
|
-52.2%
|
-8.4%
|
-52.8%
|
|
Road
|
-4.3%
|
-51.9%
|
-5.7%
|
-51.6%
|
-7.2%
|
-52.3%
|
|
Rail
|
-17.9%
|
-76.0%
|
-17.4%
|
-75.9%
|
-18.1%
|
-76.5%
|
|
Inland navigation
|
-22.9%
|
-50.3%
|
-21.8%
|
-50.3%
|
-21.9%
|
-50.4%
|
Source: PRIMES-TREMOVE transport model (ICCS-E3MLab)
Passenger road transport would provide a significant contribution to the emissions decline (30-37% by 2030 relative to 2005) while road freight would show lower reductions in the medium term (3-7% by 2030). In the long term, all scenarios achieve some 67-68% total emissions reductions relative to 2005, in line with the 2011 White Paper goal of cutting emissions by 60% compared to 1990 levels. Passenger road transport is expected to reduce emissions by about 80-82% compared to 2005 while road freight would show significant but more limited decline (about 51-53%).
Decomposition of CO2 emissions
As explained in section 3.3, the overall trend in transport emissions is determined by three broad components: transport activity levels, the energy intensity of transport and the carbon intensity of the energy used. Following this approach, it can be shown how much the projected transport emissions are expected to decrease in each pathway/scenario (in percentage terms or Mt of CO2) between 2005 and 2030 due to each component for each mode (see
Table 26
-
Table 28
).
Table 26: Decomposition of CO2 emissions for 2005-2030 by transport mode in the REF2016 (% change)
|
Decomposition analysis for 2005-2030 (% change)
|
REF2016
|
|
|
Change in emissions
|
Transport activity
|
Energy intensity
|
CO2 intensity
|
|
Passenger transport
|
-15.7%
|
24.5%
|
-34.7%
|
-5.4%
|
|
Road
|
-22.7%
|
15.6%
|
-31.9%
|
-6.5%
|
|
Rail
|
-35.0%
|
32.6%
|
-23.3%
|
-44.3%
|
|
Aviation
|
15.3%
|
63.2%
|
-47.9%
|
0.0%
|
|
Inland navigation
|
-14.7%
|
9.1%
|
-16.0%
|
-7.8%
|
|
Freight transport
|
-1.9%
|
27.3%
|
-20.9%
|
-8.4%
|
|
Road
|
0.2%
|
27.8%
|
-19.8%
|
-7.7%
|
|
Rail
|
-18.3%
|
30.1%
|
-19.2%
|
-29.3%
|
|
Inland navigation
|
-25.0%
|
19.9%
|
-36.9%
|
-8.0%
|
Source: EC calculations based on PRIMES-TREMOVE transport model (ICCS-E3MLab)
Note: The figures report the changes in CO2 emissions due to the three broad components (transport activity levels, energy intensity of transport and carbon intensity of the energy used) in relative terms compared to 2005.
Overall, efficiency gains play a decisive role in further reducing emissions in road transport relative to REF2016. As expected, the highest reduction in emissions due to improvements in energy intensity is achieved in VEH for both passenger and road transport. However, the differences to the energy intensity contribution to emissions cuts in MOBI and MOBI-TAX is not very large. This is because measures intelligently managing transport demand and improving the efficiency of the system also result in energy intensity improvements. The use of less CO2 intensive fuels contributes to further reduction of emissions for road and rail passenger transport relative to REF2016 and only in the BIO-A and BIO-B scenarios to emissions reduction in aviation by 2030.
Table 27: Decomposition of CO2 emissions for 2005-2030 by transport mode in the decarbonisation pathways/scenarios (% change)
|
Decomposition analysis for 2005-2030 (% change)
|
EUCO27
|
EUCO30
|
|
|
Change in emissions
|
Transport activity
|
Energy intensity
|
CO2 intensity
|
Change in emissions
|
Transport activity
|
Energy intensity
|
CO2 intensity
|
|
Passenger transport
|
-22.0%
|
23.0%
|
-38.1%
|
-6.9%
|
-23.5%
|
22.9%
|
-39.1%
|
-7.3%
|
|
Road
|
-30.3%
|
13.9%
|
-36.0%
|
-8.3%
|
-32.3%
|
13.8%
|
-37.3%
|
-8.9%
|
|
Rail
|
-32.7%
|
38.1%
|
-24.2%
|
-46.6%
|
-32.8%
|
38.0%
|
-24.2%
|
-46.6%
|
|
Aviation
|
14.2%
|
62.3%
|
-48.1%
|
0.0%
|
14.7%
|
62.8%
|
-48.1%
|
0.0%
|
|
Inland navigation
|
-12.1%
|
13.2%
|
-17.3%
|
-8.0%
|
-12.3%
|
13.1%
|
-17.4%
|
-8.0%
|
|
Freight transport
|
-4.9%
|
26.0%
|
-21.8%
|
-9.1%
|
-5.7%
|
26.0%
|
-22.5%
|
-9.2%
|
|
Road
|
-3.2%
|
26.0%
|
-20.7%
|
-8.5%
|
-4.1%
|
25.9%
|
-21.5%
|
-8.5%
|
|
Rail
|
-17.9%
|
32.5%
|
-20.1%
|
-30.2%
|
-17.9%
|
32.5%
|
-20.2%
|
-30.3%
|
|
Inland navigation
|
-22.8%
|
23.4%
|
-38.0%
|
-8.2%
|
-22.9%
|
23.3%
|
-38.0%
|
-8.2%
|
Table 28: Decomposition of CO2 emissions for 2005-2030 by transport mode in the decarbonisation pathways/scenarios (% change)
|
Decomposition analysis for 2005-2030 (% change)
|
VEH
|
BIO-A
|
|
|
Change in emissions
|
Transport activity
|
Energy intensity
|
CO2 intensity
|
Change in emissions
|
Transport activity
|
Energy intensity
|
CO2 intensity
|
|
Passenger transport
|
-26.9%
|
22.6%
|
-41.0%
|
-8.5%
|
-24.7%
|
22.5%
|
-39.0%
|
-8.3%
|
|
Road
|
-36.6%
|
13.3%
|
-39.6%
|
-10.3%
|
-32.9%
|
13.6%
|
-37.3%
|
-9.2%
|
|
Rail
|
-32.8%
|
38.0%
|
-24.2%
|
-46.6%
|
-33.5%
|
37.9%
|
-24.1%
|
-47.3%
|
|
Aviation
|
14.7%
|
62.8%
|
-48.1%
|
0.0%
|
10.3%
|
61.4%
|
-47.2%
|
-3.9%
|
|
Inland navigation
|
-12.1%
|
13.2%
|
-17.4%
|
-8.0%
|
-13.1%
|
13.0%
|
-17.3%
|
-8.7%
|
|
Freight transport
|
-7.6%
|
25.8%
|
-24.2%
|
-9.3%
|
-7.9%
|
25.4%
|
-22.3%
|
-11.1%
|
|
Road
|
-6.2%
|
25.8%
|
-23.4%
|
-8.7%
|
-6.5%
|
25.4%
|
-21.2%
|
-10.6%
|
|
Rail
|
-18.0%
|
32.4%
|
-20.1%
|
-30.3%
|
-18.7%
|
32.5%
|
-20.2%
|
-31.0%
|
|
Inland navigation
|
-23.0%
|
23.2%
|
-37.9%
|
-8.2%
|
-23.5%
|
23.3%
|
-37.8%
|
-9.0%
|
|
Decomposition analysis for 2005-2030 (% change)
|
BIO-B
|
TECH
|
|
|
Change in emissions
|
Transport activity
|
Energy intensity
|
CO2 intensity
|
Change in emissions
|
Transport activity
|
Energy intensity
|
CO2 intensity
|
|
Passenger transport
|
-24.1%
|
22.5%
|
-39.3%
|
-7.3%
|
-24.6%
|
22.9%
|
-39.6%
|
-7.9%
|
|
Road
|
-32.0%
|
13.6%
|
-37.6%
|
-8.0%
|
-33.7%
|
13.7%
|
-37.9%
|
-9.6%
|
|
Rail
|
-32.1%
|
38.3%
|
-24.3%
|
-46.1%
|
-32.8%
|
37.9%
|
-24.2%
|
-46.5%
|
|
Aviation
|
10.2%
|
61.2%
|
-47.2%
|
-3.9%
|
14.8%
|
62.9%
|
-48.1%
|
0.0%
|
|
Inland navigation
|
-11.8%
|
13.2%
|
-17.5%
|
-7.4%
|
-12.3%
|
13.1%
|
-17.3%
|
-8.0%
|
|
Freight transport
|
-6.6%
|
25.5%
|
-22.4%
|
-9.7%
|
-5.9%
|
26.0%
|
-22.6%
|
-9.2%
|
|
Road
|
-5.2%
|
25.4%
|
-21.4%
|
-9.2%
|
-4.3%
|
25.9%
|
-21.6%
|
-8.6%
|
|
Rail
|
-17.5%
|
32.7%
|
-20.3%
|
-29.8%
|
-17.9%
|
32.5%
|
-20.2%
|
-30.3%
|
|
Inland navigation
|
-22.2%
|
23.5%
|
-38.1%
|
-7.5%
|
-22.9%
|
23.3%
|
-38.0%
|
-8.2%
|
|
Decomposition analysis for 2005-2030 (% change)
|
MOBI
|
MOBI-TAX
|
|
|
Change in emissions
|
Transport activity
|
Energy intensity
|
CO2 intensity
|
Change in emissions
|
Transport activity
|
Energy intensity
|
CO2 intensity
|
|
Passenger transport
|
-23.9%
|
22.3%
|
-38.8%
|
-7.3%
|
-24.4%
|
21.8%
|
-38.7%
|
-7.4%
|
|
Road
|
-32.8%
|
13.0%
|
-36.9%
|
-8.9%
|
-33.3%
|
12.5%
|
-36.8%
|
-9.0%
|
|
Rail
|
-32.4%
|
38.8%
|
-24.3%
|
-46.9%
|
-32.5%
|
39.0%
|
-24.3%
|
-47.2%
|
|
Aviation
|
14.3%
|
62.4%
|
-48.1%
|
0.0%
|
14.1%
|
62.1%
|
-48.0%
|
0.0%
|
|
Inland navigation
|
-11.6%
|
13.9%
|
-17.5%
|
-8.0%
|
-13.2%
|
12.9%
|
-18.1%
|
-8.0%
|
|
Freight transport
|
-7.1%
|
24.2%
|
-22.1%
|
-9.1%
|
-8.4%
|
23.2%
|
-22.3%
|
-9.3%
|
|
Road
|
-5.7%
|
23.8%
|
-21.1%
|
-8.5%
|
-7.2%
|
22.7%
|
-21.2%
|
-8.7%
|
|
Rail
|
-17.4%
|
33.5%
|
-20.3%
|
-30.6%
|
-18.1%
|
33.6%
|
-20.6%
|
-31.2%
|
|
Inland navigation
|
-21.8%
|
25.0%
|
-38.5%
|
-8.3%
|
-21.9%
|
25.1%
|
-38.7%
|
-8.3%
|
Source: EC calculations based on PRIMES-TREMOVE transport model (ICCS-E3MLab)
Note: The figures report the changes in CO2 emissions due to the three broad components (transport activity levels, energy intensity of transport and carbon intensity of the energy used) in relative terms compared to 2005.
Transport activity and modal shares
Passenger and freight rail traffic activity shows sustained growth in both REF2016 and more ambitious pathways/scenarios (39-49% by 2030 for passenger rail and 47-53% for freight rail). This is supported by the completion of the core and comprehensive TEN-T network by 2030 and 2050, respectively, and measures increasing the competitiveness of the rail sector, i.e. 4th railway package, the review of the Combined Transport Directive and of the Rail Freight Corridors Regulation in MOBI and MOBI-TAX (see
Table 2
9
). Freight inland navigation activity also goes up in all scenarios (22-29% by 2030), driven by the completion of the TEN-T network, the adoption of the NAIADES II package and the ports package, and incentives for combined transport (see
Table 29
).
Table 29: Change in passenger and freight transport activity relative to 2010 (in %)
|
Transport activity (% change to 2010)
|
REF2016
|
EUCO27
|
EUCO30
|
|
|
'10-'30
|
'10-'50
|
'10-'30
|
'10-'50
|
'10-'30
|
'10-'50
|
|
Passenger transport
|
22.2%
|
40.4%
|
21.7%
|
38.1%
|
21.8%
|
38.2%
|
|
Road
|
16.9%
|
29.3%
|
15.7%
|
26.3%
|
15.7%
|
26.4%
|
|
Rail
|
38.8%
|
76.0%
|
47.5%
|
90.4%
|
47.3%
|
90.2%
|
|
Aviation*
|
59.5%
|
118.2%
|
58.3%
|
107.1%
|
59.0%
|
107.6%
|
|
Inland navigation
|
13.8%
|
28.3%
|
18.6%
|
39.3%
|
18.5%
|
39.0%
|
|
Freight transport
|
35.2%
|
58.4%
|
35.2%
|
57.0%
|
35.3%
|
57.1%
|
|
Road
|
35.2%
|
56.7%
|
33.4%
|
51.0%
|
33.5%
|
51.1%
|
|
Rail
|
47.4%
|
83.7%
|
51.1%
|
92.5%
|
51.1%
|
92.4%
|
|
Inland navigation
|
22.0%
|
39.2%
|
26.6%
|
48.2%
|
26.4%
|
48.1%
|
|
Transport activity (% change to 2010)
|
VEH
|
BIO-A
|
BIO-B
|
|
|
'10-'30
|
'10-'50
|
'10-'30
|
'10-'50
|
'10-'30
|
'10-'50
|
|
Passenger transport
|
21.7%
|
38.2%
|
21.6%
|
38.2%
|
21.5%
|
38.2%
|
|
Road
|
15.6%
|
26.4%
|
15.6%
|
26.4%
|
15.4%
|
26.4%
|
|
Rail
|
47.3%
|
90.2%
|
47.4%
|
90.3%
|
47.5%
|
90.3%
|
|
Aviation*
|
59.1%
|
107.6%
|
58.7%
|
107.6%
|
58.5%
|
107.5%
|
|
Inland navigation
|
18.7%
|
39.0%
|
18.5%
|
39.3%
|
18.6%
|
39.3%
|
|
Freight transport
|
35.4%
|
57.2%
|
35.0%
|
57.2%
|
34.9%
|
57.1%
|
|
Road
|
33.7%
|
51.4%
|
33.2%
|
51.2%
|
33.0%
|
51.2%
|
|
Rail
|
51.0%
|
92.5%
|
51.3%
|
92.6%
|
51.3%
|
92.6%
|
|
Inland navigation
|
26.2%
|
48.0%
|
26.5%
|
48.2%
|
26.6%
|
48.2%
|
|
Transport activity (% change to 2010)
|
TECH
|
MOBI
|
MOBI-TAX
|
|
|
'10-'30
|
'10-'50
|
'10-'30
|
'10-'50
|
'10-'30
|
'10-'50
|
|
Passenger transport
|
21.9%
|
39.1%
|
21.1%
|
38.3%
|
20.5%
|
38.0%
|
|
Road
|
15.9%
|
27.5%
|
14.7%
|
26.4%
|
14.0%
|
26.0%
|
|
Rail
|
47.1%
|
89.4%
|
48.6%
|
91.3%
|
48.9%
|
91.5%
|
|
Aviation*
|
59.1%
|
108.1%
|
58.7%
|
107.6%
|
58.5%
|
107.5%
|
|
Inland navigation
|
18.5%
|
38.6%
|
19.5%
|
39.4%
|
18.3%
|
38.7%
|
|
Freight transport
|
35.3%
|
57.2%
|
34.0%
|
57.2%
|
33.1%
|
56.4%
|
|
Road
|
33.5%
|
51.3%
|
31.0%
|
51.3%
|
29.6%
|
50.1%
|
|
Rail
|
51.1%
|
92.4%
|
52.7%
|
92.5%
|
53.1%
|
93.1%
|
|
Inland navigation
|
26.4%
|
48.0%
|
28.5%
|
48.0%
|
28.8%
|
48.1%
|
Source: PRIMES-TREMOVE transport model (ICCS-E3MLab)
Note: * For aviation, domestic and international intra-EU activity is reported to maintain the comparison with reported statistics.
As explained in section 4.3.1, road transport modal share for both passenger and freight decreases at the expense of rail and inland navigation. Rail passenger transport provides up to 9.6% of passenger transport activity by 2030 (10.7% in 2050) in MOBI-TAX scenario, while rail freight up to 17.7% of freight transport activity by 2030 (19% in 2050). Freight inland navigation also increases its share, up to 13.4% by 2030 (13.1% by 2050) in MOBI-TAX scenario. However, road transport still provides 78.8% of passenger transport in 2030 (76.1% in 2050) and 68.9% of freight transport (67.9% in 2050) even in the MOBI-TAX scenario.
Table 30: Modal shares in Reference scenario 2016 and alternative pathways/scenarios
|
Modal shares (in %)
|
REF2016
|
EUCO27
|
EUCO30
|
|
|
2030
|
2050
|
2030
|
2050
|
2030
|
2050
|
|
Passenger transport
|
100.0%
|
100.0%
|
100.0%
|
100.0%
|
100.0%
|
100.0%
|
|
Road
|
79.7%
|
76.7%
|
79.1%
|
76.2%
|
79.1%
|
76.2%
|
|
Rail
|
8.8%
|
9.7%
|
9.4%
|
10.7%
|
9.4%
|
10.6%
|
|
Aviation*
|
10.9%
|
13.0%
|
10.9%
|
12.5%
|
10.9%
|
12.6%
|
|
Inland navigation
|
0.6%
|
0.6%
|
0.6%
|
0.6%
|
0.6%
|
0.6%
|
|
Freight transport
|
100.0%
|
100.0%
|
100.0%
|
100.0%
|
100.0%
|
100.0%
|
|
Road
|
70.7%
|
70.0%
|
69.8%
|
68.0%
|
69.8%
|
68.1%
|
|
Rail
|
16.8%
|
17.9%
|
17.2%
|
18.9%
|
17.2%
|
18.9%
|
|
Inland navigation
|
12.5%
|
12.2%
|
13.0%
|
13.1%
|
12.9%
|
13.0%
|
|
Modal shares (in %)
|
VEH
|
BIO-A
|
BIO-B
|
|
|
2030
|
2050
|
2030
|
2050
|
2030
|
2050
|
|
Passenger transport
|
100.0%
|
100.0%
|
100.0%
|
100.0%
|
100.0%
|
100.0%
|
|
Road
|
79.1%
|
76.2%
|
79.1%
|
76.1%
|
79.1%
|
76.2%
|
|
Rail
|
9.4%
|
10.6%
|
9.4%
|
10.7%
|
9.4%
|
10.7%
|
|
Aviation*
|
10.9%
|
12.6%
|
10.9%
|
12.6%
|
10.9%
|
12.6%
|
|
Inland navigation
|
0.6%
|
0.6%
|
0.6%
|
0.6%
|
0.6%
|
0.6%
|
|
Freight transport
|
100.0%
|
100.0%
|
100.0%
|
100.0%
|
100.0%
|
100.0%
|
|
Road
|
69.9%
|
68.1%
|
69.8%
|
68.1%
|
69.7%
|
68.1%
|
|
Rail
|
17.2%
|
18.9%
|
17.3%
|
18.9%
|
17.3%
|
18.9%
|
|
Inland navigation
|
12.9%
|
13.0%
|
13.0%
|
13.0%
|
13.0%
|
13.1%
|
|
Modal shares (in %)
|
TECH
|
MOBI
|
MOBI-TAX
|
|
|
2030
|
2050
|
2030
|
2050
|
2030
|
2050
|
|
Passenger transport
|
100.0%
|
100.0%
|
100.0%
|
100.0%
|
100.0%
|
100.0%
|
|
Road
|
79.1%
|
76.3%
|
78.9%
|
76.1%
|
78.8%
|
76.1%
|
|
Rail
|
9.3%
|
10.5%
|
9.5%
|
10.7%
|
9.6%
|
10.7%
|
|
Aviation*
|
10.9%
|
12.5%
|
11.0%
|
12.6%
|
11.0%
|
12.6%
|
|
Inland navigation
|
0.6%
|
0.6%
|
0.6%
|
0.6%
|
0.6%
|
0.6%
|
|
Freight transport
|
100.0%
|
100.0%
|
100.0%
|
100.0%
|
100.0%
|
100.0%
|
|
Road
|
69.9%
|
68.1%
|
69.2%
|
68.1%
|
68.9%
|
67.9%
|
|
Rail
|
17.2%
|
18.9%
|
17.6%
|
18.9%
|
17.7%
|
19.0%
|
|
Inland navigation
|
12.9%
|
13.0%
|
13.3%
|
13.0%
|
13.4%
|
13.1%
|
Source: PRIMES-TREMOVE transport model (ICCS-E3MLab)
Note: * For aviation, domestic and international intra-EU activity is reported to maintain the comparison with reported statistics.

