EUROPEAN COMMISSION
Brussels, 27.2.2019
SWD(2019) 1026 final
COMMISSION STAFF WORKING DOCUMENT
Country Report Sweden 2019
Including an In-Depth Review on the prevention and correction of macroeconomic imbalances
Accompanying the document
COMMUNICATION FROM THE COMMISSION TO THE EUROPEAN PARLIAMENT, THE EUROPEAN COUNCIL, THE COUNCIL, THE EUROPEAN CENTRAL BANK AND THE EUROGROUP
2019 European Semester: Assessment of progress on structural reforms, prevention and correction of macroeconomic imbalances, and results of in-depth reviews under Regulation (EU) No 1176/2011
{COM(2019) 150 final}
Contents
Executive summary
1.Economic situation and outlook
2.Progress with country-specific recommendations
3.Overall findings regarding imbalances, risks and adjustment issues
4.Reform priorities
4.1.Public finances and taxation
4.2.Financial sector and housing market
4.3.Labour market, education and pillar policies
4.4. Competitiveness reforms and investment
Annex A: Overview Table
Annex B: Commission Debt Sustainability Analysis and fiscal risks
Annex C: Standard Tables
Annex D: Investment Guidance on Cohesion Policy Funding 2021-2027 for Sweden
References
LIST OF Tables
Table 1.1:Key economic and financial indicators – Sweden
Table 2.1:Summary table on CSR assessment
Table 3.1:MIP assessment matrix (*) — Sweden 2019
Table 4.2.1:Financial soundness indicators, all banks in Sweden
Table C.1:Financial market indicators
Table C.2:Headline Social Scoreboard indicators
Table C.3:Labour market and education indicators
Table C.4:Social inclusion and health indicators
Table C.5:Product market performance and policy indicators
Table C.6:Green growth
LIST OF Graphs
Graph 1.1:
Output gap, real GDP growth and its components
Graph 1.2:
Contributions to potential growth
Graph 1.3:
Labour shortages in the economy
Graph 1.4:
Relative change in working-age population due to increased inflows of asylum seekers between 2014 and 2017 in Europe
Graph 1.5:
Breakdown of rate of change of unit labour costs (ULC)
Graph 1.6:
Real Effective Exchange Rate based on unit labour costs
Graph 1.7:
Net international investment position
Graph 2.1:
Overall multiannual implementation of 2011-2018 CSRs to date
Graph 4.1.1:
Swedish fiscal rules and MTBF and EU average
Graph 4.1.2:
Impact of fiscal rules and MTBF on the cyclically-adjusted primary budget balance
Graph 4.1.3:
Swedish fiscal rules index and government gross debt
Graph 4.2.1:
House prices by market segment (nominal)
Graph 4.2.2:
Estimated house price valuation gaps based on different indicators
Graph 4.2.3:
Revenues from property taxes
Graph 4.2.4:
Housing starts, including net conversions, versus projected need
Graph 4.2.5:
Construction sentiment: overall confidence indicator and expectations component
Graph 4.2.6:
Labour and material cost evolution in new residential construction (total % rise between 2015-2018Q2; not annualised)
Graph 4.2.7:
Time on waiting list before obtaining primary tenancy in greater Stockholm (distribution by number of years)
Graph 4.2.8:
Household debt evolution (indexed, 2005=100)
Graph 4.2.9:
Share of new mortgage borrowers by debt-to-disposable-income ratio
Graph 4.2.10:
Amortisation rate for mortgages
Graph 4.2.11:
Year-on-year growth rate in mortgages and unsecured loans to households
Graph 4.2.12:
Household financial assets (*) and stock market index
Graph 4.2.13:
Breakdown of corporate debt by funding source
Graph 4.2.14:
Leverage indicators for non-financial corporations
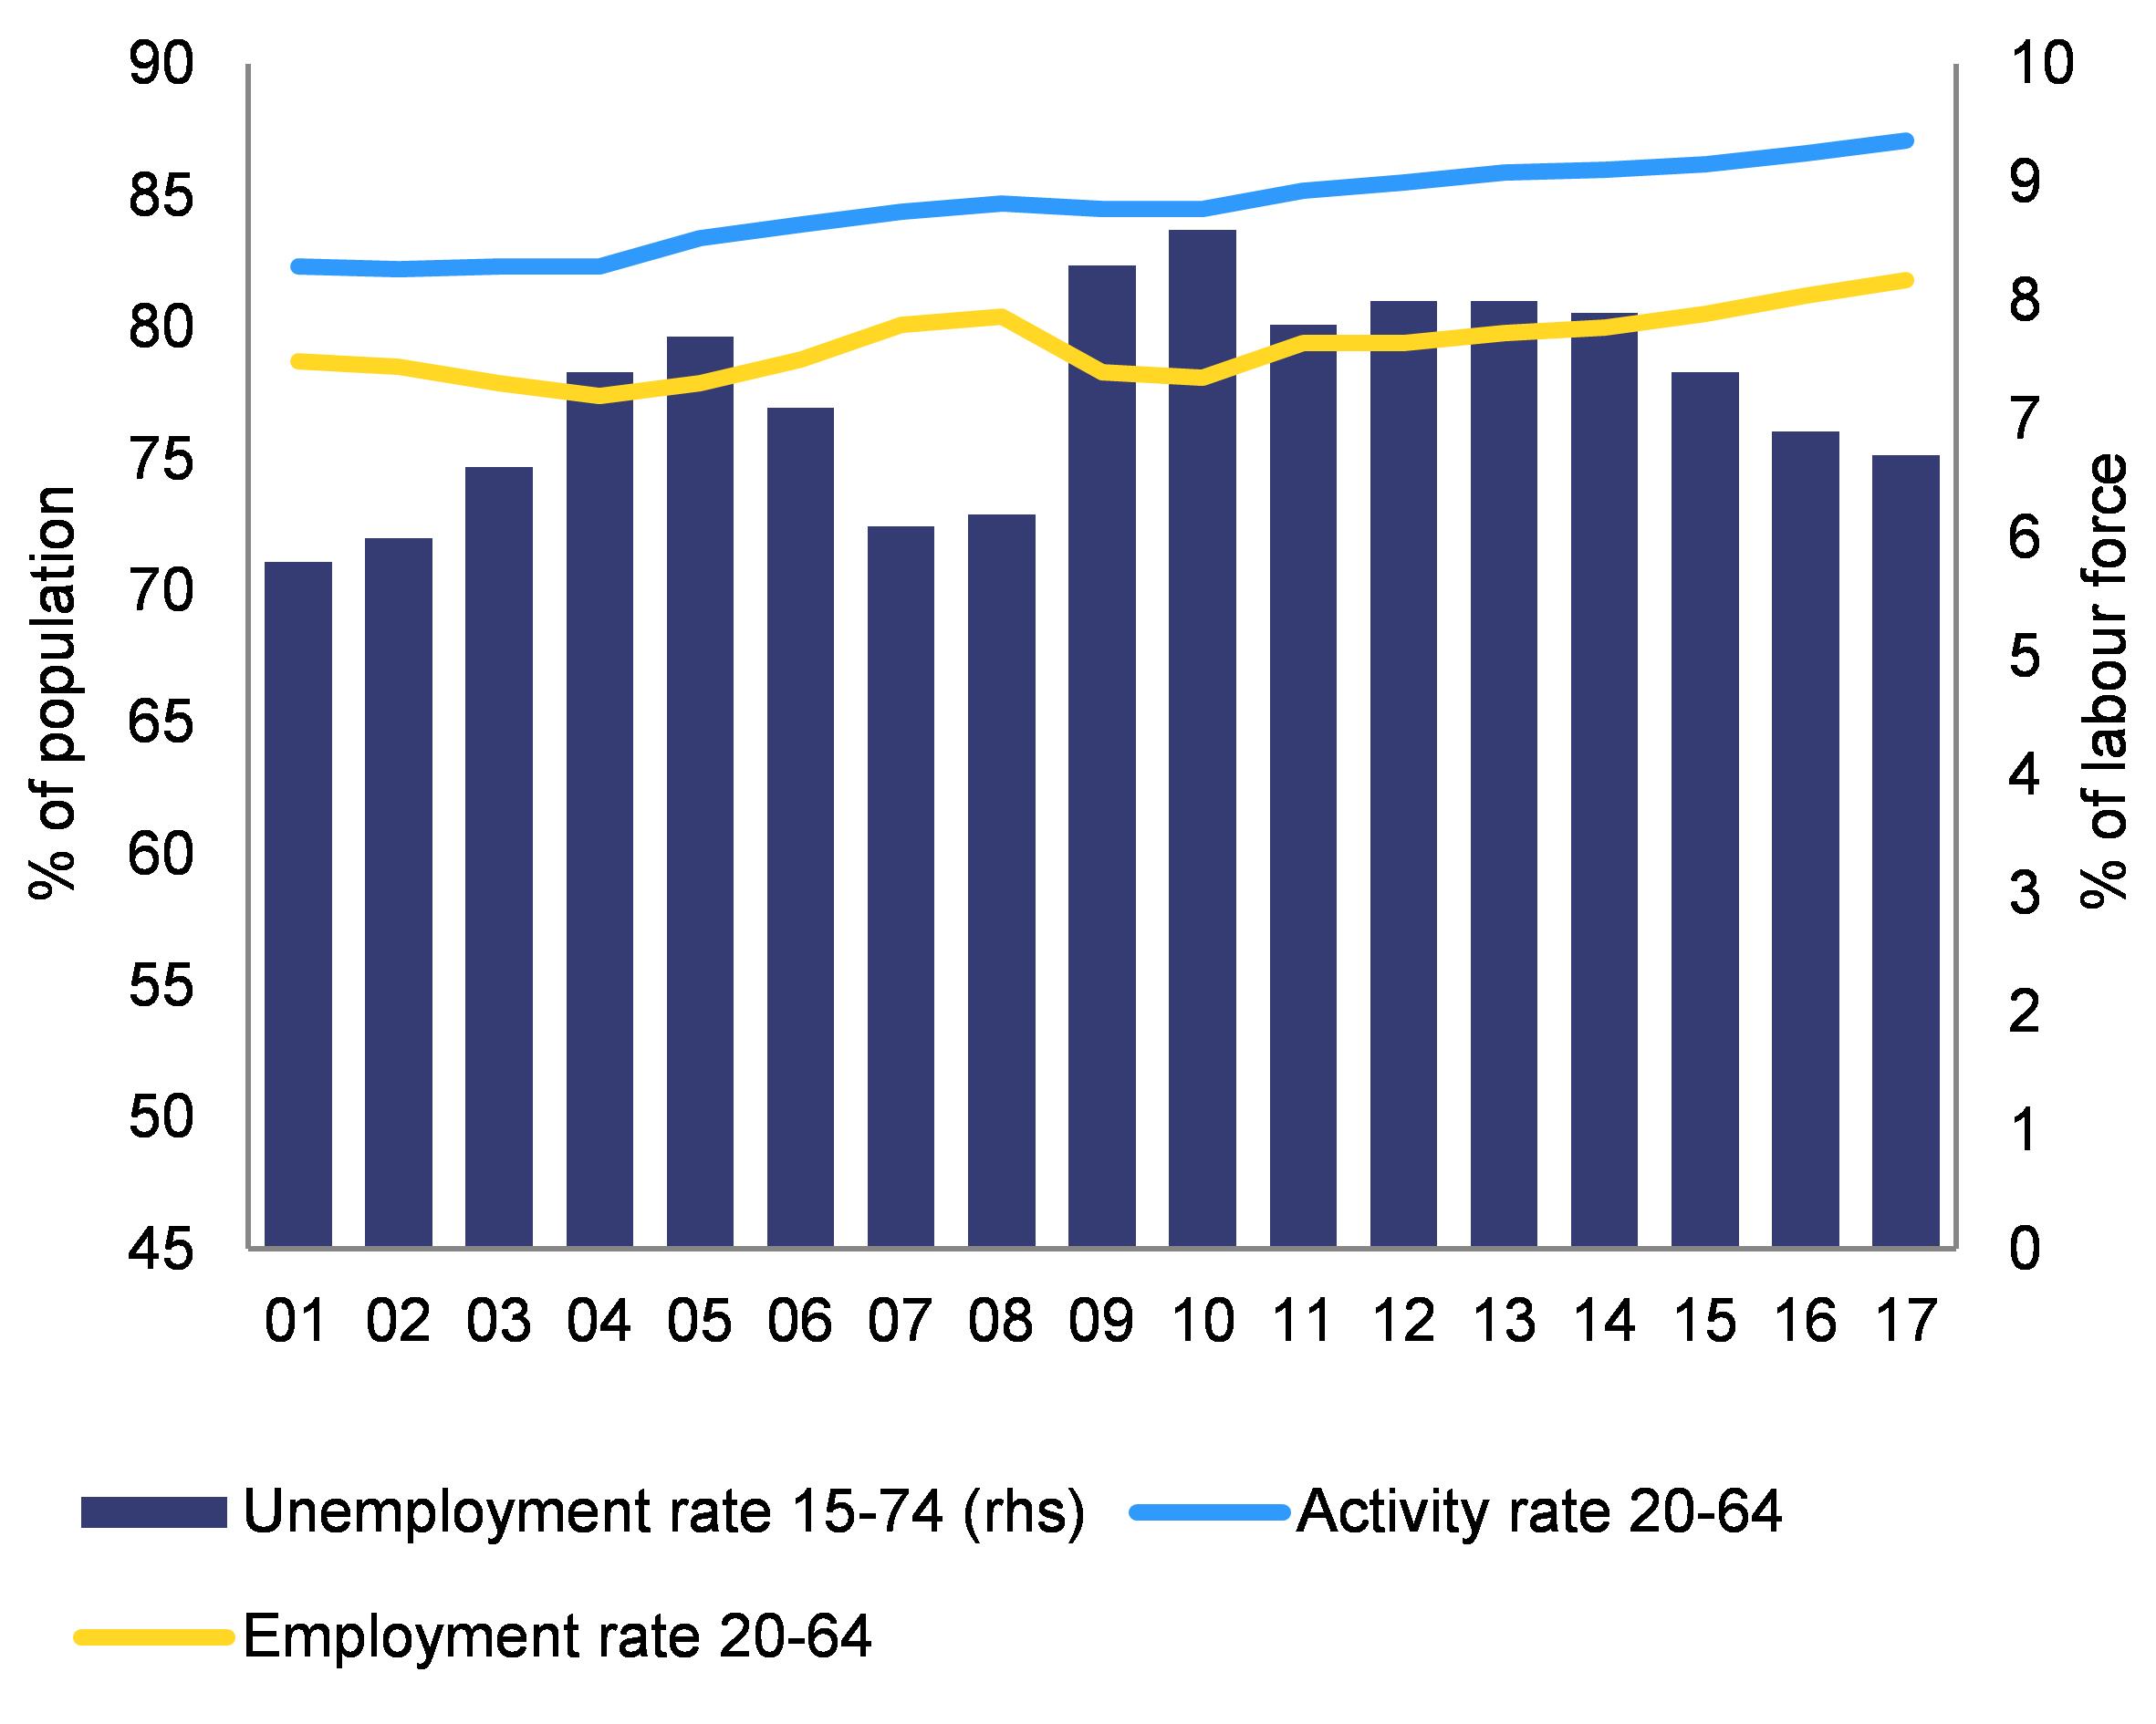
Graph 4.3.1:
Activity, employment and unemployment rates
Graph 4.3.2:
Unemployment rate by educational attainment
Graph 4.3.3:
Employment rate by citizenship
Graph 4.3.4:
At-risk-of-poverty or social exclusion rate and its components
Graph 4.3.5:
Proportion of low achievers in OECD PISA (2015)
Graph 4.3.6:
Proportion of graduates by programme orientation (2016)
Graph 4.4.1:
Cumulative export market share loss since 2007 for Sweden and selected peer countries
Graph 4.4.2:
Gross fixed capital formation (% of GDP)
46
LIST OF Boxes
Box 2.1: EU funds and programmes contribute to addressing structural challenges and to fostering growth and competitiveness in Sweden
Box 4.3.1: Monitoring performance in light of the European Pillar of Social Rights
38
Box 4.4.1: Investment challenges and reforms in Sweden
Executive summary
Sweden’s overall economic performance remains healthy, but mounting risks highlight the importance of addressing structural weaknesses. The housing shortage, long a key challenge, is the result of insufficient new housing construction compounded by demographic developments. Boosting construction in appropriate locations and market segments could help alleviate this. A more market-oriented rental housing sector could also help, and would underpin mobility and flexibility in the labour market. Tax incentives for property ownership and mortgage debt are aggravating the problems of growing household debt and overvalued house prices. Addressing these issues would make the Swedish economy more resilient and reduce risks posed by imbalances ().
Economic activity remains solid but is expected to moderate. According to the Commission’s winter 2019 interim forecast, real GDP grew by 2.1 % in 2017 and is set to have increased by 2.2 % in 2018. With the global economy slowing down and residential investment in Sweden starting to fall, economic activity is set to shift to a lower gear. Real GDP growth is expected to slow over the forecast period and reach 1.7 % in 2020. Over the longer run, potential growth is expected to remain below pre-crisis levels in light of continued modest productivity growth, in line with global developments.
Sweden’s external position continues to be strong. Growth in goods exports remained solid in 2018. Imports rose strongly, however, due to strong domestic demand resulting in a lower current account surplus. Exports of goods and services are likely to expand by around 3 % in 2019-2020 against the backdrop of trade tensions and as growth in Sweden’s main trading partners eases. The current account surplus is forecast to stabilise at around 3 % of GDP.
Investment growth is slowing as residential investment adjusts to lower levels. A fall in housing prices in the second half of 2017 is expected to reduce the construction of new housing, dampening growth in investment. In addition, investment in equipment is set to lose speed as trade-related uncertainty weighs on external demand and adds to already lacklustre business sentiment.
The labour market is performing well but faces challenges. Sweden has one of the highest employment rates in the EU (83.3 % in Q3 2018) and the Commission’s autumn 2018 forecast expects unemployment to level out at 6.2 % in 2019-2020. At the same time, labour shortages and skills mismatches, where the jobs available do not match the skills of the jobless, prevent unemployment from falling much further. A major challenge will be to successfully integrate non-EU migrants into the labour force in a way that will benefit growth in the long term.
The fiscal position is strong. In 2017, the general government overall surplus was 1.6 % of GDP. A smaller surplus of around 1 % of GDP is expected for 2018, and this should decline to 0.8 % of GDP in 2020 as the economy slows. Public debt is set to continue declining due to prudent fiscal management and a strengthened fiscal framework.
Monetary policy is normalising, due to inflation picking up somewhat from previous lows. Monetary policy has remained accommodative for years due to low inflation. After an increase in core inflation in 2018, the Riksbank began increasing its benchmark interest rate in late 2018 and has announced that further rate hikes could follow.
Strengthening investment () in new housing, education and skills could further enhance Sweden’s long-term growth potential. It would also be beneficial to maintain investment in transport infrastructure and innovation. The investment rate in Sweden has stood well above the EU average for the last decade; nevertheless, some parts of the economy could benefit from more investment. A structural undersupply remains in the housing market, despite a significant increase in new construction over the past 5 years. In the education system, demographic developments will lead to an increase in the number of pupils, while the country already faces a teacher shortage. Investment in education and skills will also be crucial to help boost productivity growth and address the skills mismatch in some parts of the labour market. Finally, there is a need to maintain investment in transport infrastructure and Research and Development at high levels to support long-term productivity growth and to fully exploit business potential. Annex D identifies key priorities for support by the European Regional Development Fund and the European Social Fund Plus over 2021-2027, building on the analysis of investment needs and challenges outlined in this report.
Sweden has made limited () progress in addressing the 2018 country-specific recommendation.
There has been some progress in the following area:
·Sweden is moving forward with policy steps to stimulate residential construction. This includes the gradual implementation of the ‘22-point plan’ for the housing sector, as well as measures to boost foreign competition in the construction sector (see Section 4.2.2).
There has been limited progress in the following area:
·In January 2019, the Swedish authorities announced that reforms will be prepared to make the rent-setting system more flexible. There are also plans to make deferred capital gains taxes on sold properties in the owner-occupancy market interest-free.
There has been no progress in the following areas:
·No progress has been made on reforming the favourable tax treatment of mortgage debt and home ownership.
Regarding progress towards its national targets under the Europe 2020 strategy, Sweden continues to perform well in the following indicators: employment rate, greenhouse gas emissions, share of renewable energy, tertiary education attainment and poverty risks. Areas where progress remains relatively weak are early school leaving, energy efficiency and Research and Development targets.
Sweden performs well on the indicators of the Social Scoreboard supporting the European Pillar of Social Rights. The employment rate is high, while the gender employment gap and the share of young people not in employment, education or training are at low levels. Positive outcomes, such as the level of digital skills and impact of social transfers on poverty reduction reflect an advanced welfare model with a strong social dialogue.
The main findings of the in-depth review contained in this report and the related policy challenges are as follows:
·While banks are healthy, some vulnerabilities are linked to their growing exposure to the real estate market. Banks remain profitable. The regulatory capital adequacy ratios are healthy, though they decreased at end 2018 due to changes in the calculation of banks’ risk-weighted assets. The major Swedish banks showed resilience in the 2018 stress test conducted by the European Banking Authority. The banks’ high level of lending to the real estate market remains a key risk and households remain vulnerable to an adjustment in the housing market and an increase in interest rates. Moreover, since Swedish banking groups are of systemic importance for all countries in the Nordic-Baltic financial market, any shock to the banking sector could have a wider impact on neighbouring countries.
·Household indebtedness has continued to rise from already high levels. Household debt grew by 5.5 % in 2018, reaching about 88 % of GDP and 186 % of disposable income, which is among the highest in the EU. This was driven mainly by higher mortgage borrowing linked to high house prices, coupled with structural distortions favouring mortgage-financed property purchases. Sweden has implemented several macro-prudential measures in recent years, including a strengthened repayment rule for high debt-to-income mortgages in force since March 2018, and a decision to raise the countercyclical capital buffer for banks from September 2019. However, the policy steps taken so far appear to have had limited overall impact on the growth of mortgage lending.
·While house prices declined in late 2017 and have since been broadly stable, this follows a long period of strong price rises, and valuations remain well above fundamentals. Key issues include tax incentives favouring home ownership and mortgage debt, and accommodative credit conditions coupled with still relatively low mortgage repayment rates. Despite a sharp rise in new construction, a shortage remains, particularly of affordable homes around major cities. This shortage is linked to structural inefficiencies, such as limited competition in the construction sector. The housing stock is not used efficiently. In the rental market, below-market rents create lock-in and ‘insider/outsider’ effects. In the owner-occupancy market, capital gains taxes reduce homeowner mobility. The housing shortage makes it harder for people to change jobs and can contribute to intergenerational inequality.
·The continued increase in household debt and bank residential mortgages are a growing risk to macroeconomic stability. Despite gradual policy action, mortgage debt continues to grow. With the housing market still appearing overvalued, even after the declines in autumn 2017, rising indebtedness means there is a growing risk of a disorderly correction. This could have an adverse impact on the economy and potentially the banking sector.
Other key structural issues analysed in this country report, which point to particular challenges facing the Swedish economy, are the following:
·Despite favourable economic conditions, some population groups have difficulties finding a job. Sweden is a top performer in the EU for high employment and low long-term unemployment rates. Challenges remain, however, such as the integration of low-skilled people and non-EU migrants into the labour market. This challenge is likely to remain in the coming years in the light of number and composition of the arrival of asylum seekers who arrived in late 2015. Efforts have been made to improve their employability for instance via the ‘Introduction job’ (Introduktionsjobb) programme.
·The educational performance gap between different social groups is large and widening. Despite recent measures, the education system does not appear to promote quality education for all. The integration of foreign-born migrant pupils warrants close monitoring. Another challenge is the growing shortage of teachers.
·The economy benefits from a favourable business environment, although specific barriers to investment and long-term growth remain. The country performs well in terms of efficient public administration, access to finance for small and medium-sized enterprises, and innovation and internationalisation by businesses. However, investment and innovation could benefit from a closer cooperation between academia and business.
1.
Economic situation and outlook
GDP growth
Economic activity remains solid. Real GDP grew by 2.1 % in 2017 and is expected to have increased by 2.2 % in 2018, according to the Commission’s winter 2019 interim forecast. Domestic demand was the main growth driver, benefiting from the continued accommodative monetary policy and growing employment, which is supporting consumption. The growth contribution of net exports was modest and imports remained strong (Graph 1.1).
|
Graph 1.1:Output gap, real GDP growth and its components (1)
|
|
|
|
Source: European Commission
|
After years of robust growth, GDP is forecast to moderate. With the global economy entering a lower-growth period and residential investment in Sweden starting to fall, economic activity is set to slow down. Real GDP growth is projected to slow to 1.3 % in 2019 before picking up somewhat to 1.7 % in 2020, close to the economy’s potential of around 2 %.
Residential investment, a key growth driver, is expected to adjust to lower levels. After a peak in mid-2017 house prices declined in the second half of the year and have remained largely unchanged. The decline had a negative impact on sentiment in the construction sector and new housing starts are expected to fall holding back investment growth. In addition, investment in equipment is set to lose speed as trade-related uncertainty weighs on external demand and adds to already lacklustre business sentiment. Overall, investment growth is forecast to slow markedly until 2020.
Public and private consumption growth is set to remain moderate. In 2018 private consumption was supported by high employment gains. Over 2019-2020, however, it is forecast to grow less as employment growth is set to slow given the already high level of labour force participation. Public consumption is projected to have increased by close to 1 % in 2018 due to municipalities having been given more resources to employ additional staff and to improve the delivery of welfare services and education. Assuming no policy change, public consumption is expected to grow at around the same pace in the coming years.
Potential growth
Potential growth has recovered but is expected to be below pre-crisis levels. In the wake of the crisis, recovery in potential output growth was mainly due to the rising contribution of labour thanks to increasing participation among the young, old, and foreign born (Graph 1.2). However, the labour contribution is expected to fall as migration levels taper off from their 2015 peak and also due to negative demographics. The contribution of total factor productivity is projected to remain modest and below pre-crisis levels, in line with global developments, weighing on potential growth while capital accumulation is expected to remain stable.
|
Graph 1.2:Contributions to potential growth (1) (2)
|
|
|
|
Source: European Commission (Autumn forecast 2018)
|
Inflation and monetary policy
Headline inflation is not yet firmly anchored but core inflation is set to increase gradually. In 2018, higher import prices resulting from the depreciation of the Swedish krona, surging energy prices and a pick-up in unprocessed food prices (due to unusually dry weather in 2018) pushed inflation above the Riksbank 2 % target in the second half of the year. As these temporary factors fade away, the harmonised consumer price index is expected to grow at 1.7 % in 2019 before edging down to 1.6 % in 2020. Core inflation (excluding food and energy) is set to increase from slightly above 1 % on average in 2018 to around 1.5 % in 2020.
With inflationary pressures rising, the Riksbank increased its repo rate in late 2018. Monetary policy has remained accommodative for years now, as low inflation prompted a postponement of rate hikes. The Riksbank had kept its repo rate unchanged at 0.5 % since February 2016. In December 2018, the Riksbank raised the repo rate by 0.25 percentage points and announced that subject to inflation prospects rate hikes of about 0.25 percentage points once or twice a year could be expected. Such a gradual increase would keep the real repo rate negative for the next two years. While in the past the low nominal interest rate environment was one factor behind the increase in household debt and house prices, a gradual reversal, with rising debt servicing costs, could have a dampening effect on credit growth and consumer spending (see Section 4.2.3).
Private indebtedness
Household debt continued to rise, increasing by 5.5 % year-on-year in December 2018. While this is a continued gradual slowdown from its peak growth rate of close to 8 % around mid-2016, it remains well above nominal income growth (see Section 4.2.3). Overall, household debt stood at 186 % of disposable income or about 88 % of GDP in Q3 2018, among the highest levels in the EU. Importantly, the distribution of debt among households is becoming increasingly uneven, with the fraction of new mortgage borrowers with very high debt-to-disposable income ratios above e.g. 600 % growing to 17.2 % in 2017 (vs. 16.4 % in 2016, and about 12 % in 2013).
Labour market
The Swedish labour market continues to perform well. Sweden has one of the highest employment rates in the EU (83.3 % in Q3 2018), and employment growth is set to remain solid. Unemployment has been below the EU average and is expected to level out at 6.2 % in 2019-2020 according to the Commission’s autumn 2018 forecast. Long-term unemployment remained low at 1.2 % in 2017. Youth unemployment continued to decline and the proportion of young people not in employment, education or training decreased to 6.2 % in 2017.
At the same time, labour shortages and skills mismatches prevent unemployment from falling much further. Labour force participation continued to increase in 2017 and 2018. However, labour shortages are rising despite the increase in labour supply. The Public Employment Service forecasts a continuing shortage of labour in the coming years in roughly 150 out of the 200 professions it covers. These professions include ones requiring higher levels of educations such as engineers, teachers, IT specialists and persons working in the health sector. Moreover, the employment rate of low-skilled people remains low, which indicates potential skills mismatches (Graph 1.3). Unemployment is therefore set to stabilise at around 6.2 % in 2019-2020.
|
Graph 1.3:Labour shortages in the economy (1)
|
|
|
|
Source: Public Employment Office
|
Migration is the main factor driving the growth of the labour force. In 2016 net migration to Sweden reached over 117 000, the highest on record. In 2017, however, it dropped to just below 99 000. This was linked to temporary border controls and the temporary migration act of 2016 which the new government intends to extend by two years (until the end of 2021) to examine the future migration policy in a parliamentary inquiry. The participation rate of migrants in the labour force increased by around 1.3 percentage points in 2017 (OECD, 2018d). The OECD estimates that refugee arrivals will have a positive effect on the labour force, with at least a 0.5 % increase cumulatively between 2017 and 2020. In addition, the net positive effect on the working-age population may reach at least 0.8 % cumulatively between 2017 and 2020 (Graph 1.4) (). Without migration, the labour force and ultimately potential GDP would be negatively affected. According to the International Monetary Fund (IMF) (Hilgenstock, 2018), a no-migration scenario in Sweden would lead to a decline in labour force participation of around six percentage points in 2015-2050.
|
Graph 1.4:Relative change in working-age population due to increased inflows of asylum seekers between 2014 and 2017 in Europe (1, 2)
|
|
|
|
Sources: Eurostat, OECD estimates
|
The successful integration of non-EU migrants into the labour force is key to ensuring benefits to long-term growth and fiscal sustainability. Migration helps maintain the population and labour force growth in the face of an ageing population since it tends to be concentrated among younger and economically active age groups. Half of those who immigrated between 2006 and 2017 have post-secondary education, which is higher than among migrants who immigrated before 2006 and people born in Sweden. Persons who immigrated in the last twelve years have a younger age structure than the population aged 25-64 years as a whole, which can partly explain the high level of education compared to the Swedish population (Statistics Sweden, 2018c). The Swedish authorities have identified finding jobs or training places for migrants as a key priority and have taken steps to reduce asymmetries in the labour market between foreign born and native born (see Section 4.3.1).
Inequality
Inequality and poverty levels are low. The incomes of the richest 20 % of the population were around 4.3 times higher than the incomes of the poorest 20 % in 2017. The distribution of market incomes is relatively equal, due to compressed wage distribution. In addition, taxes and transfers have an equalising effect, which is among the largest in the EU (58.5 % in 2016). The share of people at risk of poverty or social exclusion is lower than the EU average. The share of people in severe material deprivation and the share of people living in low work intensity households have not decreased despite rising employment.
Competitiveness
Contained wage growth has supported the economy’s competitiveness. In 2017, the industrial sector, exposed to foreign competition, agreed to a 2.2 % annual increase in wages for 2017-2019. Wage growth for the economy remained stable averaging around 2.4 % in 2017-2018 despite a tightening labour market and expectations of rising inflation. Unit labour costs (ULC) have broadly followed trends in labour productivity and are around the EU average (Graph 1.5), thus safeguarding competitiveness. Accordingly, the ULC-based real effective exchange rate depreciated during the same period (Graph 1.6). The new negotiation round for 2020-2023 is expected to result in moderate wage increases, which should preserve cost competitiveness. Conversely, nominal unit labour costs are expected to rise by 1.8 % in 2019 and 1.3 % in 2020.
|
Graph 1.5:Breakdown of rate of change of unit labour costs (ULC)
|
|
|
|
Source: European Commission
|
|
Graph 1.6:Real Effective Exchange Rate based on unit labour costs
|
|
|
|
Source: European Commission
|
External position
Despite continued current account surpluses, the net international investment position is only slightly positive. It is expected that the current account surplus will have declined from 3.6 % in 2017 to an estimated 3.2 % of GDP in 2018. The surplus largely reflects government and household savings as well as merchanting activities of multinational enterprises (). However, the net international investment position is only slightly positive, well below the sum of past current account surpluses. This is primarily due to persistent net portfolio investment in debt securities, especially of non-financial corporations, but may partly reflect valuation effects and measurement errors which suggest that the net international investment position could be underestimated (Graph 1.7) (European Commission, 2016a, pp. 13-14).
|
Graph 1.7:Net international investment position
|
|
|
|
Source: European Commission
|
Public finances
The fiscal position has remained strong. At the end of 2017, revenue collection, surprised on the upside, underpinned by solid economic growth. As a result, the general government headline surplus was 1.6 % of GDP in 2017, well above the budget initially planned for 2017, implying a structural surplus of 1.4 % of GDP. As revenues are forecast to have reverted to more normal performance, a smaller surplus of around 1 % of GDP is expected for 2018. The headline surplus should decline to 0.8 % of GDP in 2020, as the economy slows.
Public debt is expected to continue declining. Strong economic growth, primary budget surpluses and prudent fiscal management have brought about a decline in the general government gross debt in recent years. This trend is set to continue with the debt-to-GDP ratio projected to fall to 33.5 % in 2020, significantly below the reference value of 60 % of GDP agreed in the Treaty (see also Section 4.1).
|
|
|
Table 1.1:Key economic and financial indicators – Sweden (1), (2), (3)
|
|
|
|
Source: Eurostat and ECB as of 31-1-2019, where available; European Commission for forecast figures (Winter forecast 2019 for real GDP and HICP, Autumn forecast 2018 otherwise)
|
|
|
2.
Progress with country-specific recommendations
Since the start of the European Semester in 2011, 84 % of all country-specific recommendations addressed to Sweden have recorded at least ‘some progress’.() 16 % of these CSRs recorded 'limited' or 'no progress' (Graph 2.1). Substantial progress and full implementation have been achieved in several policy areas, in particular fiscal governance and research and innovation. Limited progress has been achieved in implementing housing market and household debt related CSRs.
|
Graph 2.1:Overall multiannual implementation of
2011-2018 CSRs to date (1)
|
|
|
|
Source: European Commission
|
Sweden has been able to preserve a sound fiscal position. This has ensured compliance with the medium-term budgetary objective and is keeping debt on a declining path well below the Treaty threshold.
For the labour market, the government achieved some progress in improving the employment situation of young people. In particular, it has adopted measures to strengthen apprenticeships and other types of work-based vocational education.
Since 2011, the country has received a recommendation each year related to its high and persistently rising household debt and house prices. The authorities have taken a number of policy steps to help rein in mortgage debt and house price growth and the associated risk to the broader economy and the financial system.
The focus has mainly been on macro-prudential measures and steps to tackle housing supply bottlenecks. Macro-prudential measures include a loan-to-value ceiling of 85 % for mortgages in 2010, raising banks’ risk weight floors for mortgages in 2013 and 2014, introducing a formal mortgage amortisation requirement in June 2016, followed by a strengthened amortisation rule for high-debt-to-income borrowers in March 2018 (see Section 4.2.3). Sweden also strengthened the legal mandate of the macro-prudential authority in February 2018. These steps have improved the resilience of the banking sector (see Section 4.2.1), but have not been able to rein in household debt growth (see Section 4.2.3). The authorities have also introduced measures to streamline building and planning regulations and have provided some budgetary support to municipalities to encourage more construction. While this has resulted in a significant pick-up in construction, the current level is still below anticipated demand, particularly in major cities (see Section 4.2.2).
Sweden has made limited () progress in addressing its 2018 country-specific recommendation (CSR). Some policy steps have been taken in response to the recommendation (which is relevant for the macroeconomic imbalance procedure (MIP), see Section 3). However, implementation has been uneven and key areas are left unaddressed. For the housing market, Sweden is moving forward with policy steps to promote more construction, including the gradual implementation of the ‘22-point plan’ for the housing sector, as well as measures to boost foreign competition in the construction sector (see Section 4.2.3). Additionally, in January 2019, the new government announced that reforms will be prepared to make the rent-setting system more flexible. There are also plans to make deferred capital gains taxes on sold properties in the owner-occupancy market interest-free. However, no progress has been made on reforming mortgage interest deductibility or recalibrating recurrent property taxes.
|
|
|
Table 2.1:Summary table on CSR assessment
|
|
|
|
Source: European Commission
|
|
|
|
Box 2.1: EU funds and programmes contribute to addressing structural challenges and to fostering growth and competitiveness in Sweden
Sweden continues to benefit from the European Structural and Investment Funds (ESI Funds) and can receive up to EUR 3.6 billion until 2020. This represents around 2.7 % of public investment
I
over 2014-2018. By 31 December 2018, around 64 % had been allocated to projects. This has helped more than 40 000 companies strengthen their competitive edge. Examples of project areas are internationalisation, business development, incubation and new entrepreneurship.
ESI Funds help address structural policy challenges. Programmes supported by ESI Funds are helping to create strong innovation environments, clusters and accessibility of research resources for industry. Sweden uses the ESI Funds to implement smart specialisation strategies in all eight regions by involving over 5 600 enterprises that will cooperate with research institutes to develop marketable products. EUR 400 million supports the transition to a low-carbon economy. The European Regional Development Fund (ERDF) in Sweden has proven to be a very good example of how to use the funds for integration of third-country nationals. The focus has been on helping migrants start businesses or get jobs in the business sector. Dedicated calls for proposals are used for the implementation. Several projects have been approved and are progressing well. Individuals also receive support from the ESI Funds. EUR 808 million from the European Social Fund (ESF) are used to strengthen their employability through skills development and training. Following the recent influx of refugees and immigrants to Sweden, the ESI Funds have helped local authorities and other actors to provide more individually-adapted training and employability support. More than 110 000 persons have benefited from different ESF-funded projects.
The Commission can provide tailor-made technical support upon a Member State’s request via the Structural Reform Support Programme to help Member States implement growth-sustaining reforms to address challenges identified in the European Semester process or other national reforms. Sweden, for example, has started receiving support for the implementation of the corporate-income-tax gap assessment methodology.
EU funding contributes to mobilisation of private investment. Financial instruments are implemented through one National fund-in-fund (EUR 23.1 million to stimulate more private venture capital funds in early stages, have closer collaboration with the private sector and avoid regional limitations), eight regional venture capital funds (EUR 74 million) and a new National ‘green fund’ for early stage investments in companies promoting the transition to a low-carbon economy (EUR 38.7 million). In addition, Sweden is advancing the take-up of the European Fund for Strategic Investments (EFSI). The European Investment Bank with EFSI backing, approved operations with an overall volume of EUR 2.7 billion, which is set to trigger a total of EUR 10.5 billion in additional private and public investments. So far, 35 projects
II
have been approved under the infrastructure and innovation window of the EFSI (EUR 2.4 billion in total financing, supporting EUR 9.2 billion in investments). Under the SME component, 11 agreements with intermediary banks have been approved (EUR 330 million, mobilising around EUR 1.2 billion of total investment). 9 398 SMEs and mid-cap companies are expected to benefit from this support. One notable example is ‘Handiscover’, a Swedish start-up dedicated to helping people with physical disabilities find and book suitable travel and accommodation. Handiscover secured a loan from Almi Företagspartner and is backed by the European Investment Fund.
Funding under Horizon 2020, the Connecting Europe Facility and other directly-managed EU funds is additional to the ESI Funds. By the end of 2018, Sweden has signed agreements for 57 projects under the Connecting Europe Facility with Swedish beneficiaries receiving EUR 298.1 million in funding, and investing a total of EUR 709.7 million in these projects. Horizon 2020 contributed another EUR 1.26 billion.
https://cohesiondata.ec.europa.eu/countries/SE
|
3.
Overall findings regarding imbalances, risks and adjustment issues
The 2019 Alert Mechanism Report concluded that a new in-depth review should be undertaken for Sweden to assess the persistence or unwinding of the imbalances (European Commission, 2018b). In winter 2018, Sweden was identified as having macroeconomic imbalances (European Commission, 2018i). The imbalances identified related in particular to elevated house prices coupled with a continued rise in household debt. This chapter summarises the findings of the analyses in the context of the MIP in-depth review that is contained in various sections in this report. ()
3.1.Imbalances and their gravity
Private-sector debt stands at 194 % of GDP, among the highest in Europe. Both households (88 % of GDP as of Q3 2018) and non-financial corporations (111 % of GDP as of Q3 2018) have high debt levels compared to other EU countries and are also above debt benchmarks developed by the European Commission. Household debt is a particular source of concern. Driven primarily by mortgage lending, it has risen rapidly and persistently, outpacing GDP growth for over two decades now. Although households own significant assets, these are generally illiquid and their value is exposed to market risks. Moreover, the distribution of debt across households is uneven, and there is a significant fraction of borrowers with large debt-to-income ratios, particularly among younger households and those buying properties in major cities (see ‘Household debt developments’ in Section 4.2.3).
Corporate debt, while elevated, is matched by high equity cushions and corporate savings levels. Despite the significant stock of debt, financial risks remain limited overall thanks to healthy financial positions, in particular a low degree of balance sheet leverage and strong profitability. Moreover, external funding exposure, while growing, remains limited: domestic loans, which have proved resilient during the crisis, still constitute the main funding source for non-financial corporations (see ‘Corporate debt developments’ in Section 4.2.3).
Growing household debt coupled with elevated house prices makes the Swedish economy vulnerable to shocks. Swedish house prices have risen steadily for almost two decades, although in autumn 2017 the market experienced a gradual decline followed by stabilisation over the course of 2018. Strong fundamentals, in particular robust disposable income and population growth, can explain part of Sweden’s historical house price growth, but several indicators such as price-to-income (affordability) and price-to-rent (dividend) ratios suggest that house prices are above their historical trend. Distortive taxation and structural supply-side inefficiencies in the housing market contribute to this overvaluation (see Section 4.2.2).
The banking sector is solid, but it could be vulnerable in the event of a potential abrupt fall in real estate prices. Banks’ assets have performed well so far and the sector has high profitability compared to its peers in other EU countries. However, banks rely to a large extent on international wholesale funding, giving rise to some degree of maturity mismatch. Risk weights generated by their internal models are low and might not fully reflect the underlying risks in banks’ exposure to household mortgages. Banks also have significant exposure to the commercial real estate sector. Consequently, in a severe housing market or commercial property slump, these vulnerabilities could have repercussions for the wider economy and the financial system. Due to the importance of Swedish banks in the region, other Nordic economies might also be affected (see Section 4.2.1).
3.2.Evolution, prospects, and policy responses
While overall private debt has roughly stabilised relative to GDP, household debt remains on an upward trajectory. It grew at 5.5 % year-on-year in nominal terms as of December 2018. This represents a continued gradual deceleration from its peak growth rate of about 8 % around mid-2017, but remains well above economic and income growth. The increase in mortgage lending is driven by the lagged effect of house price rises in prior years, coupled with structural factors favouring (mortgage-financed) property investment, notably mortgage interest tax deductibility, variable rates and long maturities for mortgages. In light of the structural nature of some of these drivers, it appears likely that household debt will continue to outpace income growth over the medium term.
The authorities have gradually taken some policy action to curb household debt growth. After first introducing a formal mortgage amortisation requirement in 2016, in March 2018 Sweden implemented a stricter amortisation rule specifically targeting borrowing at high-debt-to-income levels. In addition, the Swedish Parliament (Riksdag) strengthened the legal mandate of the macro-prudential authority, the Financial Supervisory Authority (Finansinspektionen). The new mandate came into force in February 2018 and allows the authority to respond in a more timely manner, using a wider range of potential measures, to the risks associated with growing household debt. The Financial Supervisory Authority has also further raised the counter-cyclical capital buffer requirement for banks to 2.5 %; this will come in force in September 2019.
So far, however, these measures have had a limited impact on household debt growth, and key policy gaps remain. Sweden has one of the highest tax incentives for home ownership in the EU, due to relatively low property taxes and high mortgage interest rate deductibility, while the design of capital gains tax limits a more efficient use of the housing stock. These tax incentives contribute to the problem of persistent household debt growth.
Following a period of post-crisis deleveraging, corporate debt growth has again picked up. Non-financial corporate debt relative to GDP fell by about 25 percentage points between 2009 and 2016. This has mostly been the result of ‘passive’ deleveraging, with positive net credit flows to firms being outweighed by growth and inflation. However, since early 2017, net corporate debt has again started outpacing economic growth, due to highly favourable credit conditions and overall still robust confidence levels among companies. Domestic bank loans remain the main funding source of firms, followed by international bond markets (see ‘Corporate debt developments’ in Section 4.2.3). While this allows for funding alternatives, a higher share of bond market financing could in some cases expose firms more to volatility and stress in the financial markets.
Swedish banking groups have a substantial and growing exposure to household mortgages, while being supported by sufficient capital buffers. The near-term risks of household debt service problems seem limited, given low debt service costs and sizeable household budget margins. However, stretched housing market valuations combined with high debt levels make the household sector vulnerable to shocks. If, for instance, mortgage interest rates were to rise significantly, or if incomes were hit due to an external shock to the economy, households could be forced to rapidly reduce consumption levels. Moreover, as Swedish banks are reliant on wholesale funding, a downturn in the housing market could result in a sudden rise in bank funding costs, thus amplifying the impact of any domestic housing market adjustment. Supervisors are mindful of such risks.
Following a long period of virtually uninterrupted strong growth, house prices fell in autumn 2017 and stabilised well below their peak. Real house prices have more than tripled over the past two decades, significantly outpacing income growth. Unlike most European countries, Sweden had no major adjustment in house prices around the 2008-2009 financial crisis. While the 2017 price declines were significant in absolute terms, real house prices have only moved back to roughly their end-2016 level. Valuation indicators continue to suggest that house prices remain high relative to fundamentals. Thus, the recent episode of market weakness should not detract from the broader concerns that Sweden’s elevated house prices contribute to macroeconomic stability risks.
Policy action focused on curbing housing demand via macro-prudential measures, combined with steps to stimulate new construction. Since 2010, Sweden has gradually introduced a number of macroprudential measures (see above), aimed at containing mortgage growth and thus housing demand. The authorities have also proceeded with the gradual implementation of the ‘22-point plan’ for the housing market and similar measures to stimulate more construction.
Some key structural distortions in the housing market have not yet been addressed. In particular, no policy action has been taken to reform the tax incentives for home ownership and mortgage debt (see above). Similarly, so far there have been no concrete policy steps to liberalise tight rental market regulations and revise the capital tax on owner-occupied homes, although in January 2019 the new government announced plans to introduce reforms in these areas, subject to preparatory inquiry work (see ‘Policy developments’ in Section 4.2.2). In addition, there remains scope to further tackle the lack of land available for development, complex planning and building regulations, limited incentives for municipalities to support new construction and limited competition in the construction sector (see ‘Supply-side issues’ in Section 4.2.2).
3.3.Overall assessment
Sweden faces sources of imbalances in the form of high private debt and overvalued house prices. The elevated private indebtedness, in particular of households, makes the economy vulnerable to macroeconomic shocks (see ‘Risks and policy response’ in Section 4.2.3). Such a shock could trigger deleveraging, potentially leading to harmful adjustment, with lower consumption and investment. Although house prices have stabilised well below their 2017 peak, they continue to appear overvalued. In the event of a large, disorderly downturn in the housing market, there is a risk of negative spillover effects acting on other Nordic countries through the financial system.
Policy measures to address these imbalances have so far been insufficient. The authorities have gradually taken some policy action to curb household debt growth in recent years, but this appears to have had limited impact on indebtedness growth. In addition, some key structural issues in the housing market have not been addressed. Overall, policy gaps remain for housing-related taxation, the functioning of housing supply and of the rental market.
|
|
|
Table 3.1:MIP assessment matrix (*) — Sweden 2019
|
|
|
|
|
|
(Continued on the next page)
|
|
Table (continued)
|
|
|
|
|
|
Source: European Commission
|
|
|
4.
Reform priorities
4.1.Public finances and taxation
Public finances remain strong. Sweden is set to have achieved a general government surplus of 1.6 % of GDP and a structural surplus of 1.4 % of GDP in 2017. The debt-to-GDP ratio is expected to decline below the new 35 % debt anchor by 2020. With prudent fiscal policy in place, Sweden faces low fiscal sustainability risks in the medium to long term.
4.1.1.
Fiscal framework
In 2019, revised rules came into force in Sweden to further strengthen its fiscal framework. The main improvements include the introduction of a new debt anchor and the strengthened mandate of the independent Fiscal Policy Council (Finanspolitiska rådet) to monitor fiscal rules and evaluate the official macro-forecasts (European Commission, 2018a).
Sweden adopted a fiscal framework already in 1997. In response to the economic crisis in the early 1990s, Sweden introduced a comprehensive fiscal framework, with broad political support, which substantially contributed to its effectiveness. The core elements included the introduction of numerical rules: (i) three-year expenditure ceilings binding for the next two years, (ii) a general government surplus target and (iii) a balanced-budget rule at the local level. In 2007 an independent Fiscal Policy Council was set-up to assess whether the government had achieved its fiscal and economic policy objectives, in particular long-term fiscal sustainability and consistency with the surplus target, the expenditure ceiling and the economy’s cyclical position.
The Swedish fiscal framework has performed well. Using the Fiscal Rules and the Medium-term Budgetary Framework (MTBF) indices (European Commission, 2018d), which focus exclusively on design elements, Sweden was well-above the EU-average for most of the last 15 years (Graph 4.1.1)(). More recently, however, national fiscal frameworks in the EU – and euro area in particular – have greatly improved due to EU legislative initiatives. While this pushed up the EU average, the number and quality of fiscal rules in Sweden were broadly unchanged and therefore the country appears to have lost ground relative to its peers. This will likely change as of 2019 when the recent reforms partly addressing some of the new EU requirements will take effect. By contrast, the Swedish medium-term framework remains strong as the expenditure ceilings are binding for the first two years of the policy horizon and not revised yearly as it is the case in most Member States.
|
Graph 4.1.1:Swedish fiscal rules and MTBF and EU average
|
|
|
|
Source: European Commission's Fiscal Governance Database.
|
Overall, the fiscal framework has been successful in maintaining budgetary discipline and long-term fiscal sustainability in Sweden. Based on the European Commission estimates for the budgetary impact of fiscal rules and MTBFs (European Commission, 2018e), the Swedish fiscal framework is deemed to have contributed by about five percentage points of potential GDP in the short-term and 10 percentage points in the long-term (Graph 4.1.2) to fiscal consolidation of the primary budget surplus in cyclically-adjusted terms(). Government debt started to decline following the introduction of the fiscal framework (Graph 4.1.3). From its peak in 1996, government debt had declined by about 25 percentage points of potential GDP by 2016, and the above estimates suggest that up to half of this decline can be attributed to the fiscal framework.
|
Graph 4.1.2:Impact of fiscal rules and MTBF on the cyclically-adjusted primary budget balance
|
|
|
|
Source: European Commission calculations based on European Commission (2018e).
|
|
Graph 4.1.3:Swedish fiscal rules index and government gross debt
|
|
|
|
Sources: European Commission's Fiscal Governance Database and Ameco
|
4.1.2.
Taxation developments
The general level of taxation remains above the EU average. The total tax burden is 44.4 % of GDP compared with the EU average 39.0 % of GDP. The overall labour tax burden is also high with the implicit tax rate at 40.4 % in 2017 above the EU average of 36.3 %. Low income earners at 50 % of the average wage face a particular high tax wedge, i.e. gap between labour costs and take-home pay.
The Riksdag rejected the 2019 caretaker government budget bill in favour of a slightly more expansionary proposal submitted by the opposition. The Swedish authorities estimate that the adopted 2019 budget implies a weakening of public finances by about SEK 29 billion in relation to 2018. Higher expenditure is included for defence, the police and the judiciary, while labour market policies and environmental policy are subject to some reductions. Income taxes will be cut in 2019: the basic income tax deduction for persons older than 65 is raised, and the earned income tax deduction is expanded in combination with an increase in the tax threshold for state income tax. As from 2020, the new government intends to abolish the five percent top income tax (värnskatt). Looking further ahead, it aims for a broad tax reform increasing Sweden's competitiveness and labour market participation rate through lowered income and corporate taxes.
Addressing tax incentives could help mitigate the build-up of household indebtedness. At present there are no concrete plans to revise rules regarding the mortgage interest deductibility or the recurrent property tax. Reforms in this area could contribute to a more favourable development of household debt (see Section 4.2) and would also have a favourable impact on income equality, particularly if the proceeds are used to reduce taxes on labour ().
4.1.3.
Debt sustainability analysis and fiscal risks
Sweden’s government debt is expected to continue declining over the medium term. Sound fiscal management and strong economic performance under the Commission’s baseline no-policy change scenario is projected to bring government debt close to 16 % of GDP in 2029 from 37.8 % of GDP in 2018, well below the 60 % of GDP Treaty reference value. The outlook for fiscal sustainability appears sound in the short, medium and long term (European Commission (2019a and Annex B).
Debt dynamics appear to be resilient to shocks. In all sensitivity test scenarios government debt remains on a downward trend. Debt-to-GDP at the end of the projections period (2029) in these scenarios is moderately higher than the baseline. In the worst case scenario, based on a shock to the exchange rate, gross public debt would reach 19 % of GDP in 2029.
Public expenditure on long-term care is projected to increase. Demographic changes imply that under current policies, spending on long-term care can be expected to increase significantly, from 3.2 % of GDP in 2016 (among the highest in the EU) to 4.9 % of GDP in 2070 (European Commission, 2018b). This corresponds to a 53 % increase, similar to the EU average. The share of the population that receives long-term care benefits is relatively high by EU standards, whereas the underlying level of need () is broadly in line with the EU average.
4.2.
Financial sector and housing market
4.2.1.Banking sector (*) ()
Overview
The Swedish banking sector is large and maintains strong profitability. The system’s total assets, including foreign banks activities, represent around 300 % of GDP. Bank profitability still ranks among the highest in Europe with returns on equity averaging 9 %, helped by low funding costs and high cost efficiency. Favourable economic conditions translate into sustained lending to non-financial corporations and supported income from transaction fees.
Banks remain healthy with high-quality assets. In 2018 the average non-performing loan ratio remained one of the lowest in the EU. Customers’ high repayment capacity and a strong reimbursement culture are among the main reasons for limited defaults and provide a potential shock-absorbing buffer to Swedish banks in the case of an economic slowdown.
Banks have a high exposure to the real estate sector. Almost 90 % of household lending consists of mortgages while commercial property, including tenant-owner associations, represents 55 % of lending to corporations. Developments on the real estate market therefore have a major impact on the financial position of banks (Finansinspektionen, 2018c).
Swedish banks rely to a large extent on wholesale funding. About 50 % of their loan book is funded by domestic deposits. The main additional funding source is the wholesale funding market, often accessed with covered bond issuances backed by residential mortgages.
New players have recently entered the Swedish mortgage markets. These are either loan brokers that connect borrowers with lenders, or non-bank lenders that grant mortgages to create and manage investment products on behalf of institutional investors. Although the volumes they are managing are small, they are competing with banks for mortgage customers and their importance could increase. This could be positive for financial stability if they use more stable funding sources than banks. However, the new business models remain untested in terms of sudden changes in economic conditions and could complicate macro-prudential policy (Sveriges Riksbank, 2018a).
The structure of the Swedish banking sector changed as Nordea relocated to Finland. In October 2018 the Nordea group moved its headquarter to Helsinki. Although the move has left Nordea’s business operations in Sweden largely unaffected, it had important implications for supervisory responsibilities (see ‘Key risks and policy responses’ below).
The calculation of banks’ risk-weighted assets, and with it Swedish banks’ capital ratios, has changed. The Financial Supervisory Authority (Finansinspektionen) revised the modalities for imposing a risk-weight-floor on residential mortgages for banks using internal risk models to be applied as of end 2018(). With this revision, the Authority intends to maintain a level playing field among banks in the domestic market for residential mortgages. Due largely to this change, the average Tier 1 ratio under the new rules will be substantially lower than the latest available official figure (22.6 % in Q2 2018, see Table 4.2.1). The revision brings the calculation of banks’ capital ratios closer to prevailing practices in most EU Member States. However, even following these changes, the capital ratios of Swedish banks would remain relatively high compared to the EU average of 16.2 % ().
|
|
|
Table 4.2.1:Financial soundness indicators, all banks in Sweden
|
|
|
Source: European Central Bank
|
|
|
The major Swedish banks showed resilience in the 2018 stress test conducted by the European Banking Authority (EBA). Banks would have the ability to withstand a severe recession combined with falling real estate prices used in the exercise. Such a scenario had a limited impact on bank capital as the Common Equity Tier 1 would be reduced between 2.7 and 3.3 percentage points (European Banking Authority, 2018).
Key risks and policy responses
Banks’ high exposure to the housing market is a key risk. Households remain vulnerable to an adjustment in the housing market and an increase in interest rates. Since about 70 % of household mortgages have been taken at variable interest rates, an increase would result in higher payments, lower consumption and potentially substantial repercussions for the overall economy and the financial system (see Section 4.2.3). This was also highlighted by the Riksbank (Sveriges Riksbank, 2018a) and the Financial Supervisory Authority (Finansinspektionen, 2018c).
A rise in interest rates could also result in higher funding costs and liquidity risks. Swedish banks rely on wholesale funding often held by international financial institutions. This reliance makes the system vulnerable because international wholesale funding is much more responsive to changes in interest rates compared to domestic deposits. Moreover, it can also quickly dry up should conditions of financial stress occur, creating a liquidity risk for Swedish banks (Finansinspektionen, 2018c).
Risks related to a strong commercial real estate market have become more prominent. Banks’ lending to the commercial real estate sector has increased sharply the past years, and a large proportion of their lending has commercial property as collateral. So far commercial real estate companies have benefited from rising real estate prices and rental income. A change in this trend – due to a cooling economy for example – could affect incomes, credit quality and (in an extreme scenario) even financial stability in the event of a sudden market correction (given the size of the commercial property market in Sweden and its historic sensitivity to macro-financial shocks) (Finansinspektionen, 2018c).
Nordea’s move has reduced the Swedish authorities’ control and oversight of the bank. While Nordea’s business operations in Sweden remain basically unchanged, the responsibility for the supervision and resolution has moved to the European Central Bank and Finnish supervisors (). Against this backdrop, in 2017 the Swedish government launched a comprehensive analysis of the implications of joining the Banking Union, whose results are expected in November 2019.
The current differences in banking rules/regulations across the Nordic-Baltic region have resulted in increased cooperation. Recent developments, such as those related to the risk weight floor for residential mortgages and the fact that large financial institutions often operate in other countries via branches, have made it apparent that there is a need of coordination between macro-prudential authorities. Supervisors from the various countries are aware of potential spillover risks in the event of acute financial systemic stress and that the existing differences in legal frameworks must be taken into account (). They are therefore already cooperating closely to enable an effective response when needed.
The Financial Supervisory Authority adopted additional macro-prudential measures to mitigate risks posed by increasing household indebtedness. A stricter amortisation requirement for new mortgage borrowers with high debt-to-income (DTI) levels came into force in March 2018. Under this requirement, households obtaining a mortgage with an overall debt level over 450 % of gross income (roughly equivalent to 630 % of after-tax disposable income) must amortise the mortgage principal by one percentage point per year. This applies on top of the already existing amortisation rule introduced in 2016. This brings the overall amortisation rate to a maximum of 3 % per year for households with very high DTI levels and loan-to-value rates higher than 70 %. From 2019 macro-prudential measures specifically applying to mortgages will apply also to new non-bank mortgage brokers. As of 19 September 2019, the countercyclical capital buffer for banks will also be raised from 2 to 2.5 % against the background of continued high credit growth and elevated systemic risk (Finansinspektionen, 2018d).
4.2.2.Housing market (*)
Housing market developments
Following a sharp adjustment in late 2017, house prices have broadly stabilised. After two decades of largely uninterrupted price growth, the housing market slowed notably in 2017, culminating in a nominal price fall in the autumn of close to 10 % on average. This decline was probably triggered by a sharp rise in new-built supply in specific market segments, notably high-end apartments in Stockholm (Sveriges Riksbank, 2018a; European Commission, 2018a). Since 2018, prices have broadly held steady (Graph 4.2.1). As of December 2018, they stood at about 7 % below their 2017 highs. Transaction volumes have overall remained weak compared to 2016 and early 2017, and have fallen somewhat over the course of 2018. The recent stabilisation and structural factors supporting house prices (see below) point to broadly steady prices in the near-term. However, the continued supply overhang in higher-priced Stockholm apartments represents a significant downside risk.
|
Graph 4.2.1:House prices by market segment (nominal)
|
|
|
|
Source: Valueguard HOX house price index
|
While house prices remain below their peak, valuation indicators still suggest that they are overvalued. Fundamental drivers, in particular strong population and income growth and increasing urbanisation, supported house price growth in previous years (European Commission, 2016a), but cannot fully explain the current high levels. Fundamental-model-based estimates suggest that the housing market is overvalued by around 12 % () as of end-2017 (Graph 4.2.2). Other valuation indicators like price-to-income and price-to-rent ratios (measures of affordability and return-on-investment of owner-occupied houses) point to a sizeable valuation gap of about 45 % and 65 % respectively above their long-term averages. These estimated valuation gaps are among the highest in the EU. While such indicators are inevitably subject to some modelling uncertainty, they do underscore that the Swedish housing market is vulnerable.
|
Graph 4.2.2:Estimated house price valuation gaps based on different indicators (1)
|
|
|
|
Source: European Commission calculations
|
The recent housing market weakness has only made a modest dent in a long-standing upwards house price trend. After bottoming out following the banking crisis in the early 1990s, house prices have grown steeply and persistently. In real terms, they have more than tripled, significantly outpacing income growth as well as house price rises in other EU countries (European Commission, 2018a). While the 2017 price declines were significant in absolute terms, real house prices have only moved back to roughly their end-2016 level. Thus, the recent market weakness should not detract from the broader concerns that Sweden’s elevated high house prices contribute to macroeconomic stability risks (see Sections 3, 4.2.1 and 4.2.3) and also have implications for social equality (see ‘Inequality’ in Section 1).
Demand-side issues
Not only low mortgage rates, but several structural features of the Swedish mortgage market have boosted housing demand. Monetary policy in Sweden has been highly accommodative. Although the Riksbank has raised the benchmark interest rate in December 2018, it remains negative, as it has been for over 3 years now (see Section 1). While low interest rates naturally act as a tailwind for the property market, in Sweden this effect has been magnified by a high share of variable-rate mortgages, long contract maturities and still generally low amortisation rates (see Section 4.2.3 for details). As a result, debt service costs relative to incomes have remained low, even as house prices and debt levels have continued to climb.
The Swedish tax system favours owner-occupied housing over other investments, particularly when financed by mortgage debt. Under the dual income tax system, returns from financial investments are normally taxed at a flat capital income rate of 30 %. However, imputed rents (the effective return to homeowners on their housing investment) are not taxed. Instead, property owners pay a local property fee (kommunal fastighetsavgift). This fee is capped at a low ceiling(), resulting in a highly favourable tax treatment of owner-occupied housing compared to other investments, and low overall tax revenues from property by international standards (Graph 4.2.3). Additionally, interest paid on mortgages is generally deductible at the 30 % capital income rate (), providing an effective subsidy for mortgage debt. This further favours (debt-financed) home ownership, both over other investment opportunities and over rental housing, for which the overall tax burden is considerably higher (Statens Offentliga Utredningar (SOU), 2014).
|
Graph 4.2.3:Revenues from property taxes
|
|
|
|
Source: OECD
|
Reforming the tax incentives for home ownership and mortgage debt could contribute to reducing inequality and benefit job creation. The impact of such tax reforms would be broadly progressive, as households benefiting the most from low recurrent property taxes and generous mortgage interest deductibility tend to be the higher-income ones (Finanspolitiska rådet, 2016). Moreover, the fiscal room created by such reforms could be used to ease the labour tax burden in an appropriately targeted way, thus facilitating job creation and further supporting social equality (European Commission, 2018a).
Supply-side issues
One of the key drivers of Sweden’s elevated house price level is a structural undersupply of dwellings. Following the early-1990s banking crisis, residential construction activity in Sweden was muted for a prolonged period, in spite of strong population growth and rapid house price rises (European Commission, 2018a). More recently, new housing construction has accelerated notably and annual housing starts more than tripled from their 2012 low to a recent peak of about 64 000 in 2017 (Graph 4.2.4). However, even after this strong upswing, new housing supply failed to reach projected near-term needs, estimated at about 90 000 new homes per year for 2018-2020. Additionally, some of the new construction appears to attract limited demand (Katinic, G., 2018), and may thus have little immediate effect on the broader housing shortage.
|
Graph 4.2.4:Housing starts, including net conversions, versus projected need
|
|
|
|
Source: Statistics Sweden (historical data until 2017); Boverket (estimates for 2018 and 2019, and projected need)
|
New housing construction slowed significantly in 2018, and appears set for further near-term falls. The late-2017 house price declines combined with an ongoing overhang of unsold new-built Stockholm apartments have had a notable impact on sentiment in the construction sector and expectations for future building activity (Graph 4.2.5). New housing starts fell significantly in 2018 — by an estimated 20 % across Sweden as a whole, and about 35 % in Stockholm — with further declines projected in 2019 (Graph 4.2.4). As a result, the recent housing market weakness may exacerbate the long-standing supply shortage even further. This underscores the importance of tackling remaining barriers to new housing construction.
|
Graph 4.2.5:Construction sentiment: overall confidence indicator and expectations component (1)
|
|
|
|
Source: National Institute of Economic Research (Konjunkturinstitutet); European Commission
|
Structural bottlenecks are constraining housing supply and raising construction costs. There is a lack of developable land, partly driven by the fact that a large share of buildable land is owned by municipalities, which can have financial incentives for making it available in a piecemeal fashion over time rather than when it is needed most (European Commission, 2015)(). Despite some recent reforms, zoning and building regulations overall remain relatively cumbersome and complex. In particular, the interpretation of building rules continues to vary between some municipalities (), creating a fragmented market that reduces efficiency and increases uncertainty for construction companies (European Commission, 2016). Additionally, the total time required to complete land acquisition and planning processes can be considerably longer than in other countries (Emanuelsson, 2015). This raises financial risks for construction projects and causes delays in new supply. Rigidities in the construction sector have weighed on productivity growth and restricted competition (), raising construction costs in Sweden to among the highest in the EU (European Commission, 2018a).
Increasing residential construction costs appear to be partially driven by building materials. Costs for new residential buildings in Sweden grew strongly in recent years, from an already high level (European Commission, 2018a). This further rise was mainly driven by building materials costs, for which Sweden has the highest increase in the EU since 2015 (Graph 4.2.6). Other factors contributing to high building costs are wide profit margins among developers (Konkurrensverket, 2018) and weak productivity growth in the construction sector (European Commission, 2018a).
|
Graph 4.2.6:Labour and material cost evolution in new residential construction (total % rise between 2015-2018Q2; not annualised)
|
|
|
|
Source: European Commission
|
Barriers to efficient usage of the housing stock
Sweden’s tightly regulated rental market can create lock-in and ‘insider-outsider’ effects. Sweden’s rental market has some of the strongest tenant protection rules in the EU (European Commission, 2017a). Rents are mostly set in collective-bargaining-style negotiations (), which tend to result in below-market rent levels in urban areas (European Commission, 2018a). This creates large demand/supply imbalances and long waiting lists to obtain rental accommodation (Graph 4.2.7). As a result, sitting tenants can have a strong financial incentive not to move, even if their accommodation is no longer fully suited to their needs () (Katinic, 2018). Conversely, new entrants, such as students, young households and recent immigrants, face difficulties in getting a foothold on the rental market, thus creating an insider/outsider effect. Indirectly, the latter also contributes to high house prices in the owner-occupier market, as no access to rental housing can push households to purchase their own home (Geng, 2018).
|
Graph 4.2.7:Time on waiting list before obtaining primary tenancy in greater Stockholm
(distribution by number of years)
|
|
|
|
Source: Stockholm Housing Agency (Bostadsförmedlingen)
|
The gap between negotiated rents and market rents has impaired rental housing supply, particularly in major cities. Below-market rent levels combined with high land prices create financial incentives to favour construction of owner-occupancy housing over rental apartments (). This situation also encourages conversion of rental units into owner-occupied homes, thus further aggravating the rental housing shortage. Historically, this has been particularly pronounced in major urban areas: for example, in Stockholm, for every new rental apartment built, three were converted into owner-occupied units over the 1990s and 2000s (Emanuelsson, 2015).
In addition, there are negative knock-on effects on labour mobility and social equality. The lock-in and insider/outsider effects in the rental market can prevent workers from moving to locations with the best job opportunities, thus hampering labour market dynamism. Furthermore, tight rental regulations combined with a shortage of affordable rental housing can exacerbate inequality and social problems. This particularly affects lower-income households, and can contribute to a relatively high degree of overcrowding among socially vulnerable groups (OECD, 2017b). While reform of Sweden’s rental market may also have significant redistributive and social consequences, this could be managed by a combination of tax measures and targeted subsidies (Donner et al., 2017).
The role of ‘social contracts’ in public housing policy is gradually growing. The need for affordable rental housing is linked to broader questions concerning optimal use of the available housing stock. Sweden does not have a designated social housing sector. Public housing companies () own around 20 % of the housing stock. Additionally, municipalities can offer ‘social contracts’ () to assist the most vulnerable groups in society. Although numbers are still low (roughly 30 500), such social contracts are gaining in importance, especially in urban areas.
Capital gains taxes on housing transactions can create lock-in effects in the owner-occupier market. Sweden applies a 22 % capital gains tax on property sales, even when a homeowner is selling to buy another property of similar value elsewhere (meaning no actual economic gain is realised). As house prices have increased significantly in Sweden, this means that households which have owned their home for a long time can face prohibitively high moving costs (). In practice, this tends to particularly affect elderly households living in large single-family houses and looking to relocate to a conveniently-located apartment. Reforming capital gains taxation to eliminate this lock-in effect could help free up underused family dwellings from the existing housing stock and improve overall supply-demand matching in the owner-occupier market.
Policy developments
Demand-side policy action in the housing market has been focused on using macro-prudential measures to curb mortgage lending. Since 2010, Sweden has gradually introduced a number of measures, including loan-to-value limits, adjusting banks’ risk-weight floors, and introducing a binding mortgage amortisation requirement in June 2016 (see Section 4.2.3 for details) to contain mortgage debt growth (and thus housing demand). A more stringent amortisation rule for borrowers with high debt-to-income ratios came in force in March 2018 (also discussed in Section 4.2.3).
The implementation of the ‘22-point plan’ for the housing market continues. The plan, originally proposed in June 2016, contains a range of measures — mostly rather incremental in nature — which aim to increase the land available for development, reduce construction costs, shorten planning process lead times and address some specific inefficiencies in the rental market. Some parts of the plan, particularly those which concern reducing costs and lead times for new construction, have been broadly completed. For other elements, including a review of building and planning regulations and measures to make more developable land available, public inquiries and other preparatory steps are still ongoing. More time is required before these proposals can be finalised, therefore, and it remains uncertain whether they will result in actionable conclusions and ultimately successful implementation.
Sweden is taking steps to boost participation of foreign companies in the construction industry. In June 2018, the National Board of Housing, Building and Planning (Boverket) finalised the first phase of an effort to facilitate entry of foreign construction firms in the Swedish market in order to promote competition and lower residential construction costs. It set up an online portal () with detailed English-language guidance for foreign developers, including translations of building regulations and practical information on the Swedish construction sector. The web portal will gradually be expanded further, and Boverket will also investigate additional obstacles encountered by foreign operators and which could be addressed by targeted policy measures.
The Swedish authorities intend to initiate inquiries into possible reforms to improve mobility in the housing market. As part of its policy statement in January 2019, the new government announced plans to introduce a more flexible rent-setting system for newly constructed housing, and to allow location to play a larger role in adjusting rents within the negotiation-based system for existing housing. Additionally, deferred capital gains taxes on sold properties in the owner-occupancy market could be made interest-free. Such reforms can potentially help address some of the barriers to efficient usage of Sweden’s housing stock (see above), and incentivise more rental housing construction. However, these plans are subject to significant preparatory inquiry work to assess feasibility and develop detailed implementation proposals. It therefore remains unclear what form these measures will ultimately take and how impactful they will be.
4.2.3.PRIVATE INDEBTEDNESS (*)
Household debt developments
Household indebtedness has continued to rise rapidly from an already elevated level. Swedish household debt has been on a persistent upward trajectory since the early 2000s, significantly outpacing debt growth in peer countries (Graph 4.2.8). In most economies with relatively high household indebtedness, debt growth tapered out after 2008, but in Sweden debt levels continued to grow apace. This pattern endured in 2018, with household debt climbing by 5.5 % in nominal terms. While this is a deceleration from its peak year-on-year increase of about 7.8 % in mid-2016, it remains one of the fastest growth rates in the EU. It also continues to outstrip household income and overall economic growth. Household debt also stands above fundamental and prudential benchmark levels, suggesting that Sweden’s household debt load is higher than can be justified by fundamental drivers, and above levels at which the risk of crisis becomes elevated.
|
Graph 4.2.8:Household debt evolution (indexed, 2005=100)
|
|
|
|
Source: European Commission
|
Debt levels vary considerably between different borrower subgroups. The aggregate debt level across all Swedish households (including those without any debt) stands at about 186 % of disposable income (as of Q3 2018) (). For households with a mortgage, the average debt-to-income (DTI) ratio is over 340 % (Blom et al., 2017. Among this group, those who took out their mortgages more recently generally have higher debt levels: the average DTI ratio for new borrowers in 2017 is estimated at 411 %. There are also significant regional differences in debt levels, with average DTI ratios highest for those living in major cities, notably Stockholm (Ölcer et al, 2017). Younger and lower-income households with a mortgage tend to face particularly high debt service costs relative to their incomes (Finansinspektionen, 2018b; European Commission, 2018a).
The share of new mortgage borrowers with particularly high debt-to-income ratios continues to rise. The share of newly-mortgaged households facing an overall debt burden over 450 % of their disposable income has roughly doubled since 2011, and is now approaching 40 % (Graph 4.2.9). Over one in six new borrowers has a debt-to-disposable-income ratio over 600 %. While mortgaged households, including those with high DTI ratios, generally have relatively healthy income surpluses at the current juncture (see subsection ‘Risks’ below), such high debt burdens can make them vulnerable to shocks.
|
Graph 4.2.9:Share of new mortgage borrowers by debt-to-disposable-income ratio
|
|
|
|
Source: Finansinspektionen
|
Drivers of household debt growth
Mortgage lending growth is linked to the long period of steep house price growth in Sweden. House price rises (see Section 4.2.1) and mortgage debt growth are mutually reinforcing: a strong housing market enables larger mortgage loans, as it increases the value of the underlying collateral, and growing mortgage debt levels raise demand for houses while supply is limited, thus putting upwards pressure on prices. Even when house prices remain broadly stable at a high level (as in 2018), overall mortgage debt still tends to increase (albeit at a slower rate). This is due to natural turnover in the housing market () and growth of the overall housing stock (Emanuelsson et al., 2018).
In Sweden, this dynamic is exacerbated by structural factors that lower debt service costs. As discussed in Section 4.2.2, there are strong tax incentives for purchasing owner-occupied housing, especially when financed with a mortgage. In addition, due to a combination of borrower preferences and institutional conditions(), mortgages are mostly variable-rate in Sweden. This reduces current debt service costs, but also shifts risks related to future rate rises to the household sector. Finally, Swedish mortgage contracts have long maturities compared to other EU countries, generally accompanied by low amortisation (i.e. capital repayment) requirements (Graph 4.2.10). This further amplifies the impact of low interest rates on debt service costs (European Commission, 2017a).
|
Graph 4.2.10:Amortisation rate for mortgages
|
|
|
|
Source: Finansinspektionen; European Commission calculations (based on Hypostat data on typical mortgage maturities for different EU countries)
|
The recent rapid increase in unsecured borrowing has limited impact on financial stability. Mortgage debt is over 80 % of total household borrowing, and has been the key driver of the persistent rise in overall household indebtedness. Unsecured borrowing and household loans with other collateral (e.g. cars) have historically grown comparatively slowly. However, since mid-2016, unsecured borrowing has accelerated (Graph 4.2.11) due in part to technological and institutional changes () and consumer credit banks offering increasingly competitive interest rates (Van Santen, 2017). Tighter mortgage regulations combined with rising house prices may also have shifted some borrowing towards unsecured loans (), although hard data on this is limited (Finansinspektionen, 2018a). Overall, unsecured borrowing remains under 5 % of GDP, similar to the EU average (European Commission, 2017a), with currently limited implications for financial stability.
|
Graph 4.2.11:Year-on-year growth rate in mortgages and unsecured loans to households
|
|
|
|
Source: Statistics Sweden, Riksbank (Financial Markets Statistics)
|
Risks and policy response
Growing household debt coupled with elevated house prices makes the Swedish economy vulnerable to shocks. If incomes were to fall due to an external shock to the economy, or if there was a sharp rise in mortgage risk premiums — triggered, for instance, by a renewed housing market downturn or by higher bank funding costs as perceptions about their riskiness worsen —highly-leveraged households may need to rapidly reduce consumption to meet their mortgage payments. This would reduce demand and increase uncertainty, potentially weighing on growth and employment and thus further impairing households’ debt service ability. At the same time, overall credit availability may shrink, as falling collateral values make banks more cautious about new lending. Ultimately, this could lead to a self-reinforcing deleveraging process with a significant broader macroeconomic impact, in line with historical developments in other countries facing similar imbalances (OECD, 2017a; Crowe et al., 2011).
Risks are partly mitigated by households’ robust payment ability and financial wealth. Households have relatively high income surpluses after mortgage service costs and day-to-day expenses, of roughly 40 % of disposable income on average (Finansinspektionen, 2018b). Households’ strong payment ability is also reflected in a very low share of non-performing household loans (see Section 4.2.1). Additionally, households have a high savings rate and significant financial wealth, estimated at roughly three times their liabilities.
However, this strong overall financial position would likely provide only limited cushioning in a disorderly deleveraging scenario. Income surpluses are high on average, but they are heavily skewed towards higher-income households (European Commission, 2018a). Moreover, they assume that households are able to reduce their spending to near-subsistence levels. Thus, although most households may be able to continue servicing their debt even in a downturn, this would likely require a very considerable consumption reduction with major macroeconomic knock-on effects. As for financial wealth, close to 50 % of non-housing assets owned by Swedish households are invested in pension fund or life insurance instruments, and can therefore only be accessed upon retirement. Moreover, most non-housing assets are exposed to market risks (Graph 4.2.12), and would likely fall in value in an economic downturn. Thus, rather than cushioning the impact of a housing market fall, this could further amplify it, by weighing on consumption via wealth effects.
|
Graph 4.2.12:Household financial assets (*) and stock market index
|
|
|
|
Source: Statistics Sweden
|
Sweden has mainly relied on macro-prudential measures to address the risks related to household debt growth. These include the introduction of a loan-to-value (LTV) ceiling of 85 % for mortgages in 2010, gradual increases in banks’ risk-weight floors for mortgages in 2013 and 2014, a formal mortgage amortisation requirement in 2016, and an enhanced overall macro-prudential framework in February 2018. Additionally, in September 2018, the macro-prudential authority decided to further raise the countercyclical capital buffer for banks from September 2019, as a broad measure to improve financial sector resilience (see Section 4.2.1). While welcome steps forward, these measures have not meaningfully curbed the continued growth in household debt (European Commission, 2018a).
In March 2018, a strengthened amortisation rule for new mortgage borrowers with high debt-to-income levels came into force (see Section 4.2.1). While there is insufficient data for a detailed impact assessment at this stage, the initial effect of this new measure seems to be rather muted, in line with ex ante analysis (European Commission, 2018a). There have likely been some changes in individual borrower behaviour, particularly in higher-priced segments of the housing market, but there appears to have been little immediate impact on overall house prices and household debt developments. Nevertheless, if house price growth resumes, this additional macro-prudential policy step is likely to become increasingly binding over time, and can thus help contain mortgage borrowing at excessive DTI levels.
Corporate debt developments
Following a period of post-crisis deleveraging, corporate debt growth has again picked up in recent years. After the financial crisis, Swedish non-financial corporations gradually reduced their consolidated corporate debt from a peak of 125 % of GDP in 2009 to just over 100 % by 2016 (Graph 4.2.13). This was mostly driven by ‘passive’ deleveraging, with net credit flows to Swedish firms positive, but outweighed by economic growth and inflation (European Commission, 2018a). However, since early 2017, net corporate debt has started outpacing economic growth again due to highly favourable credit conditions and overall still robust confidence levels among companies. As of Q3 2018, consolidated corporate debt stood at over 111 % of GDP — well above the EU average of about 80 %.
|
Graph 4.2.13:Breakdown of corporate debt by funding source
|
|
|
|
Source: Statistics Sweden
|
Domestic loans remain the main funding source for the corporate sector, followed by international bond markets. Domestic lending (mostly from banks) to firms has been broadly stable at about 60 % of GDP since the financial crisis (Graph 4.2.13). Larger corporations have further increased the use of the bond market as an additional funding source, with its contribution growing from 11 % of GDP pre-crisis to over 20 % in 2018. Lending from abroad contracted sharply around 2013, driven by a reduction in intra-group borrowing in response to tax reforms (European Commission, 2016a); since then, it has remained roughly flat at about 25% of GDP.
Overall, despite high corporate debt levels, firms generally seem to have a healthy financial position with limited risks of financial distress. Sweden’s corporate-debt-to-GDP ratio is high compared to other EU countries. However, other leverage indicators show that financial risks are overall limited. Firms have significant equity cushions, with a debt-to-equity ratio that is already at a quite low level (around 42 % as of Q2 2018, compared to about 60 % on average for EU countries) and continues to fall (Graph 4.2.14). In addition, gross corporate savings remain at a healthy 13 % of GDP, suggesting that the corporate sector is sufficiently profitable to be able to reduce its debt level quickly if needed. Overall, with the possible exception of the commercial real estate sector (to which banks have a concentrated exposure, see Section 4.2.1), Sweden ’s relatively high corporate debt level does not appear to raise financial stability concerns.
|
Graph 4.2.14:Leverage indicators for non-financial corporations
|
|
|
|
Source: European Commission
|
4.3.
Labour market, education and social policies
4.3.1.labour market and migration
Favourable economic conditions keep the Swedish labour market strong. Employment grew from an already high level of 81.8 % in 2017 during the first three quarters of 2018 and is likely to increase further, albeit more slowly. In parallel, unemployment has fallen but is now forecast to level out at around 6 % due to skills mismatch (Graph 4.3.1). An increasing number of workers do not have the qualifications required to fill open positions, where almost exclusively high-skilled labour is necessary. High entry wages and a compressed wage structure also imply challenges for those further from the labour market (OECD, 2017b; Calmfors et al, 2018). Despite those challenges, Sweden performs well on the indicators of the Social Scoreboard supporting the European Pillar of Social Rights (4.3.1).
|
Graph 4.3.1:Activity, employment and unemployment rates
|
|
|
|
Source: European Commission
|
Labour shortages are increasing in specific sectors and regions. Sweden has the third highest labour shortage index in the EU and employers perceive the lack of qualified staff as the main obstacle to growth. The number of vacancies has been growing since 2015 in all counties, but employment growth has been concentrated in the wider metropolitan areas, whereas local and regional labour markets risk being drained of qualified labour (Svenskt Näringsliv, 2018; Arbetsförmedlingen, 2018b).
People with low levels of skills face difficulties in finding employment. The disparity between the employment rates of low-, medium-, and high-skilled workers increased at the time of the financial crisis in 2008 and has remained high. In Q3-2018, the employment rate of the low-skilled was 64.8 % vs. 90.4 % for people aged 25-64 years with at least two years of tertiary education. What is more, their unemployment rate (age 25-64 years) at 15.9 % in Q3-2018) was 9.2 percentage points higher than in Q3 2008 (Graph 4.3.2). Meanwhile, unemployment fell for people with tertiary education and stood at 3.6%, 0.3 percentage points in Q3-2018. (Arbetsförmedlingen, 2018b). Persons with disabilities are also at a disadvantage. Their employment level is above the EU average, and the gap in the employment rate is more narrow (15.9 percentage points vs. 25.8 percentage points for the EU). However, their unemployment levels remain higher (9 % vs. 7 % for the population as a whole in 2017) (Statistics Sweden, 2017).
|
Graph 4.3.2:Unemployment rate by educational attainment
|
|
|
|
Source: European Commission
|
Securing adequate skills for an advanced economy like Sweden remains a challenge. Nine out of ten jobs in Sweden require basic digital skills and 77 % of 16-74 year olds have basic or above basic digital skills. However, labour shortages exist in areas such as cybersecurity, artificial intelligence, and high performance computing.
|
Box 4.3.1: Monitoring performance in light of the European Pillar of Social Rights
The European Pillar of Social Rights is designed as a compass for a renewed process of upward convergence towards better working and living conditions in the European Union. It sets out twenty essential principles and rights in the areas of equal opportunities and access to the labour market; fair working conditions; and social protection and inclusion.
Sweden performs well on most indicators of the Social Scoreboard supporting the European Pillar of Social Rights. The employment rate is among the highest and the gender employment gap is among the lowest in the EU. The share of young people not in education, employment or training is well below the EU average. The good overall results reflect Sweden's advanced welfare model with an active labour market policy, robust social protection system, and long-standing and well-established social dialogue. Yet the promotion of the labour market participation of the low skilled and foreign-born, and among them women, remains a policy challenge.
While Sweden’s early school leaving rate is relatively low, students born abroad are more likely to leave school early. Since 2014, the share of early leavers from education and training has been increasing, along with the rise of influence of socio-economic background on student educational performance. Tailor-made support to early school leavers does in part address this challenge.
Sweden implements policies to make the labour market more inclusive and encourage education and training. Focusing on the young and newly arrived, public employment services and the municipalities work closely together to address the specific needs of each individual job-seeker. This approach has also successfully been used in ESF projects where focus is on matching the needs of employers and young job-seekers (e.g. "UNGKOMP" and "Ung Framtid").
The European Pillar of Social Rights was proclaimed on 17 November 2017 by the European Parliament, the Council and the European Commission.
https://ec.europa.eu/commission/priorities/deeper-and-fairer-economic-and-monetary-union/european-pillar-social-rights/european-pillar-social-rights-20-principles_en
|
Long-term unemployment remains among the lowest in the EU. It was 1.2 % in 2017, well below the EU average of 3.4 %. The long-term unemployed, however, have not benefited from the general increase in employment. According to the Public Employment Service, their number might increase since people with low levels of education and migrants risk not being integrated in the labour market (Arbetsförmedlingen, 2018b).
Growth in the Swedish labour force is mainly due to immigration. Policies in this domain are primarily guided by humanitarian concerns. The number of asylum applications peaked in 2015 at 162 450. Since then numbers have fallen back to pre-2011 levels of roughly 25 000 people a year. The non-EU born now account for 12.4 % of the population, constituting the second highest share in the EU and well above the average of 7.2 %. Even though numbers have fallen, successful integration of non-EU born into society and the labour market remains an important challenge.
Foreign-born have been instrumental in filling vacancies but their employment rate remains low. In 2017, 75 000 out of the 94 000 newly created jobs went to foreign-born persons. In several sectors such as private services, education, care and health services, foreign-born represented 90 % of the job growth in 2017, and virtually all growth in industry, agriculture and forestry (Arbetsförmedlingen, 2018a). Their employment rate grew by more than one percentage point, which is nearly twice as high as the increase for native born. However, the employment rate of non-EU migrants remains markedly lower than those of Swedish nationals and citizens of other EU Member States (Graph 4.3.3).
Efforts to bring recently arrived non-EU migrants into work have born fruit. Most of the newly arrived migrants are eligible to join the introduction programme (etableringsprogrammet), which typically lasts for two years and combines language classes with job training and advice. The programme, combined with a good economy and the introduction of more jobs, has led to a shortening of the time needed to find work. Among the refugees received between 2008 and 2015, the employment rate one year after arrival increased by approximately eight percentage points between 2008 and 2015 (Statistics Sweden, 2016). The new government wants to increase its effectiveness and further boosting Swedish language skills of participants. Traineeship opportunities should also be included and the link between active participation and receiving allowances should be strengthened.
Foreign-born women get a particular focus as their employment rate is relatively low. Since 2017, the Public Employment Service specifically targets foreign-born women, and in March 2018 the government tasked the Agency for Economic and Regional Growth (Tillväxtverket) to facilitate foreign-born women's contacts and networking with employers. In 2018, the employment rate of this group remained well below that of native-born women (65.8 % vs. 85.2 %) and of foreign-born men (74.5 %) (Arbetsförmedlingen, 2018b).
|
Graph 4.3.3:Employment rate by citizenship
|
|
|
|
Source: European Commission
|
The government has taken several measures to make the labour market more inclusive and stimulate labour supply. The number of professions and participants covered by fast-tracks (snabbspår) continue to increase: 40 professions are now covered and since 2016, more than 7 500 people have had intensive training to quickly enter the labour market. During Q1-2018, an average of 1 350 persons participated every month, up from 1 200 in 2017. To encourage more women to participate, distance education is now possible in some fast-tracks. National fast-tracks are complemented with local job-tracks, directly addressing the needs of the local labour market. Another scheme, to be further implemented is the entry agreement (etableringsjobb), which aims at helping newly arrived migrants and long-term unemployed to become established in the labour market. The measure closely follows proposals of social partners. ()
Vocational education and training are being strengthened to meet the future needs of the labour market. The employability of vocational graduates in Sweden remains high. In 2017 87.3 % of them found employment within 3 years of graduation, which is well above the EU average of 74.8 %. However, the participation rate remains lower than the EU average (36.6 % vs 49.0 % of all pupils in upper secondary education). To make upper secondary vocational education and training more attractive, several measures have been taken, including the creation of an apprenticeship centre within the Swedish National Agency for Education, and national and regional coordinators to assist schools in their collaboration with local enterprises (Cedefop, 2018).
Participation in adult learning is high in Sweden. The high share of adult learning applies to all demographic groups (European Commission, 2018f). The percentage of adults in lifelong learning and training was 30.4 % in 2017, well above the 'Education and Training' target of 15 %. The share of low-qualified persons participating in lifelong training (20.5 %) and unemployed (45.3 %) is already well above EU average (4.3 % and 10.1 % respectively). Sweden continues to prioritise training for the low-skilled with a particular focus on strengthening regional cooperation to better meet labour market needs. The new government intends to use targeted forms of training and an increased allowance for these participants to support faster employment.
4.3.2.Social policies and healthcare
Poverty remains low but varies across groups. The share of people at risk of poverty or social exclusion (17.7 % in 2017) is below the EU average (22.5 %). However, educational and social backgrounds have a marked impact on the risk of poverty. Children of low-skilled parents and people with a migrant background have a higher risk than other groups. In-work poverty increased among single parents (from 15.7 % in 2016 to 21.1 % in 2017) and the low skilled have an in-work poverty rate of 12.8 %, substantially above the risk for medium- and high-skilled workers (6.6 % and 4.7 % respectively).
Sweden is advanced in the use of digital services, but certain groups risk exclusion. 98 % of Swedes are connected to the internet and a large majority are online every day. However, the group of non-users (more likely to be low-income households, elderly and/or people with intellectual disability) might face a risk of not getting appropriate services as businesses and institutions increasingly assume that everyone is online and develop services accordingly. One example is the fast transition towards a cashless society: 1.5 million out of roughly 8.2 million Swedes above the age of 15 years do not have a mobile BankID, which enables citizens to access online banking and public services.
|
Graph 4.3.4:At-risk-of-poverty or social exclusion rate and its components
|
|
|
|
Source: European Commission
|
Sweden has a well-performing health system, and remains among the Member States with the highest spending on health (approx. 10.9 % GDP). The share of public spending for health care is one of the highest in EU (with more than a quarter allocated to long-term care). Swedish people have the fifth-highest life expectancy in Europe and amenable mortality (i.e. ratio of deaths that could have been avoided through optimal quality health care) is below most other EU countries. More than 75 % of the population reports being in good health, compared to the EU average of 67 % (OECD, 2018b).
While overall the health care sector is accessible, waiting times are an issue and regional differences exist. Waiting times vary, explaining unmet health needs in less densely populated or remote regions (Isaksson et al. 2016). Sustained measures are being taken specifically to shorten queues. National guidelines and regional care programmes for different diagnoses have been put in place to tackle regional discrepancies in the quality of care. The difference between high- and low-income groups in terms of access to healthcare is among the lowest in the EU. However, many risk factors are more pronounced among low-income groups, such as overweight and obesity.
Despite a relatively high number of doctors and nurses, challenges persist in finding the best mix of medical staff. The number of doctors is above the EU average but the share of general practitioners (less than 20 %) is lower than in most EU countries (OECD, 2018b) and this has a negative impact on the continuity of care (). Coordination, especially with regard to person-centred care and IT systems, could be improved in order to make the most efficient use of staff resources (OECD, 2017c). To ensure an adequate level of nursing, both in terms of numbers and skills, the government has invested in education and provided resources to expand the workforce (SEK 3 billion).
The long-term care sector offers good coverage, but is not fully efficient. Sweden has comprehensive arrangements for the elderly and the dependent population, allocating more than a quarter of all health spending to long-term care. There is room to improve the flexibility of the system to better respond to people’s expectations and to ensure better coordination of person-centred care (OECD, 2017c).
4.3.3.Education
Basic skills of the younger generation have improved. According to the OECD’s 2015 Programme for International Student Assessment (PISA) survey, student performance improved significantly in mathematics and reading compared to 2012, and remained broadly stable in science. The proportion of low achievers is now close to the EU average in all three core subjects but still higher than in other Nordic countries (Graph 4.3.5). The negative trend in performance was also reversed in the 2015 Trends in International Mathematics and Science Study, an international survey of eighth-graders (aged 13-14) and in the 2016 Progress in International Reading Literacy Study of fourth-graders (age 10). The new government intends to extend primary school by one year to ten years and has also presented plans for a more comprehensive curriculum for fast learners.
|
Graph 4.3.5:Proportion of low achievers in OECD PISA (2015)
|
|
|
|
Source: OECD
|
Demographic developments are putting pressure on the school system. Between 2010 and 2016, the number of pupils in compulsory school increased by 16 %, from 886 000 to over 1 million. The trend is set to continue in the next decade due both to the large number of newly arrived students in recent years, and to an increase in the number of Swedish-born children. One in three children born in the next 10 years is expected to have a foreign-born mother and one in four students in upper secondary education to be foreign-born (Statistics Sweden, 2018b). It is therefore crucial that investment in school infrastructure evolves in line with the needs.
The growing teacher shortage is a major concern. Over 10 000 compulsory school teacher, one in ten, are due to retire in the next five years (Swedish Teachers’ Union, 2018). Due to demographic developments, 92 000 teachers and pre-school teachers would need to be examined, equivalent to 77 000 full-time positions, in the coming 5 years to meet the growing demand. By 2031, 227 000 teachers and pre-school teachers would be needed, however, based on current patterns, only about 145 000 will graduate, leading to a shortage of over 80 000 teachers. (National Agency for Education, 2017). As already more than one in ten new university students enters teacher training, other options to explore could include faster employment of teachers with a foreign qualification, employing retired teachers, and more effective use of distance education (Swedish Association of Local Authorities and Regions, 2018b).
A high and rising share of teachers is unqualified, despite increasingly strict requirements (). In 2017/2018, close to 30 % of teachers in compulsory schools and 20 % in upper secondary schools taught without a formal teacher training qualification (National Agency for Education, 2018a). Among those under the age of 29 the share was as high as 53 % (Swedish Teachers' Union, 2018). To address the challenge, bridging teacher education programmes target academics who already fulfil the requirement for a specific school subject. The new government intends to reform the teacher training education using higher entry requirements and additional resources.
Sweden is among the EU countries that in relative terms spend most on education, and expenditure has been rising. General government expenditure on education was among the highest in the EU in 2016, as a proportion both of GDP (6.6 %) and of total general government expenditure (13.4 %). Education expenditure, at constant prices, increased by 19 % in 2013-17. Expenditure per pupil increased most in compulsory schools, by 14 %, and in upper secondary schools, by 11 % (Statistics Sweden, 2018a).
The organisation and financing of education up to upper secondary level is decentralised, but a wide range of central government grants increases complexity. Funding follows the pupil and municipalities and independent school providers are required to account not only for the number of students enrolled but also their needs based on socio-economic background (). In 2017, the total central government investment in education was SEK 15 billion (EUR 1.46 billion). This represented about 15 % of school funding, allocated in the form of over 70 different grants. Merging the range of grants could be a way to improve efficiency and flexibility at local level (National Audit Office, 2017).
Sweden spends more on tertiary education than the EU average but the allocation per full-time student has continuously decreased. Total expenditure in this area corresponds to 1.5 % of GDP, with the largest proportion of funding (80 %) coming from public sources (Swedish Higher Education Authority, 2018) (). However, funding has been falling in relative terms, because since 1993 the budget allocation is linked to productivity developments in the private sector. The effect of the reduction is cumulative and has become considerable (). A government inquiry published on 1 February 2019 proposes a broader reform of the governance and financing of higher education (Statens Offentliga Utredningar (SOU), 2019:6).
The tertiary education attainment rate is at an all-time high and the employment rate of recent graduates is among the highest in the EU. In 2017, 91.7 % of graduates aged 20-34 were employed, above the EU average of 84.9 % (). Programmes in health and engineering, which guarantee practically full employment, are the most preferred options (). However, the proportion of graduates in the other science, technology, engineering and maths (STEM) fields — natural sciences, mathematics and statistics, and information and communications technology (ICT) — is at or below the EU average (Graph 4.3.6). Although the number of students graduating in STEM subjects increased by 130 % from 33 000 in 1996 to 77 000 in 2015, there is an unmet demand, in particular for engineers. Since a high proportion of international students study a STEM subject (), recruiting and retaining them could help bridge the gap between supply and demand. Increasing government grants for fee-paying foreign students and having private companies fund more study grants and offer work placements could attract more international students (Wikström et al, 2018 and Statens Offentliga Utredningar (SOU), 2018). To ensure that upper secondary school graduates are well equipped to study STEM options, a national digitisation strategy is being put in place.
|
Graph 4.3.6:Proportion of graduates by programme orientation (2016)
|
|
|
|
Source: European Commission
|
The National Digitisation Strategy for the school system aims to enable all children to develop adequate digital skills by 2022. Among 16-24 year-olds the proportion with at least basic digital skills is 89.5 %. The digitisation strategy for compulsory and upper secondary schools focuses on understanding digital tools and media, digitisation’s impact on society and individuals, ensuring critical and responsible behaviour, problem solving and translating ideas into action using digital technology, including programming (government, 2017). A revised curriculum entered into force on 1 July 2018. The Swedish National Agency for Education has carried out the first digital national tests with the aim of having all tests digitised by 2022 (European Commission, 2018c).
There is a large and increasing educational performance gap between foreign-born and native-born students. The transition between compulsory and upper secondary schooling continues to be a hurdle for many foreign-born students. At the end of compulsory schooling (at age 16), half of students who migrated after the age of seven do not qualify for an upper secondary ‘national programme’. This very high proportion compares to less than 9.2 % for native students. The figure jumps to 71.6 % among those who arrive in the last 4 years of compulsory schooling (National Agency for Education, 2018b). A higher proportion of recent migrants are older and those who migrated after the age of seven have increasingly come from countries with weaker school systems.
Socio-economic background has a growing impact on students’ performance (European Commission, 2018a). The place of residence and increased sorting of pupils between schools since the 1990s, have also contributed to growing inequalities. Other factors such as class size or teachers’ formal qualifications seem to be less important (Grönqvist et al., 2017).
Sweden’s early school leaving rate is relatively low but students born abroad are more likely to leave school early. The overall rate is below the EU average (7.7 % as compared with 10.6 % in 2017), but it has increased since 2014 and there is a growing difference between native-born students (6.2 %) and those born abroad (15.5 %). Since 1 January 2015, municipalities are required to keep records of people under the age of 20 who have not completed upper secondary school and are not in education or training, and to provide them with tailor-made support. Over 100 000 young people (58 % of them men and one-third newly arrived) were registered and eligible to benefit from such support in 2017/2018. The 'introductory programme' at upper secondary level is the most common measure offered by municipalities, designed to help students bridge the gap to the labour market or further education (National Agency for Education, 2018).
4.3.4.Investment needs
Looking across the labour market, education and social policies, it results that continued investments are important. To maintain Sweden’s productivity and long-term inclusive growth, priorities are addressing skills needs, education and training, and social inclusion. Skills shortages and mismatches are among the main obstacles to business investment, pointing to the need to invest more in training of unused and underused labour potential. Using the full labour potential also requires matching investment in the social integration of recently arrived migrants.
4.4.
Competitiveness reforms and investment
4.4.1.Productivity AND INVESTMENT
Productivity Developments
Productivity in Sweden has stagnated over the past decade. As discussed in Section 1, total factor productivity growth has remained well below rates seen in the pre-crisis period, thus weighing on the economy’s output potential. This may partly be an indication of diminishing returns on technological investments, combined with a slower pace of development in the information and communications technologies (ICT) sector since 2007. It is also linked to a structural compositional shift towards the labour-intensive services sector, which on average has lower productivity than the industrial sector.
Sweden has experienced a secular decline in export market share. Sweden’s share of world exports has been steadily falling since the 2000s, broadly in line with peer countries (Graph 4.4.1). The main driver for this is the integration of emerging economies into global supply chains, which has resulted in world trade outpacing export growth for many industrialised countries (European Commission, 2018a). Therefore, Sweden’s declining export market share does not suggest a competitiveness issue. Direct metrics of cost competitiveness confirm this: Sweden’s real effective exchange rate has depreciated by about 4 % over the past three years (mainly reflecting a weakening krona), and unit labour costs have evolved broadly in line with the euro area. Sweden also does well in terms of non-cost competitiveness, including via an attractive business environment (see Section 4.4.4) and strong research and innovation performance (discussed under the heading ‘Research, innovation and digitisation’ below).
|
Graph 4.4.1:Cumulative export market share loss since 2007 for Sweden and selected peer countries
|
|
|
|
Source: European Commission
|
Investment
Investment continued its upward trend in 2017 but stagnated in 2018. Particularly since 2013, the take-up of investment levels after the crisis was much faster in Sweden than in the EU as a whole (Graph 4.4.2). This was largely driven by higher investment in dwellings and ICT. Investment in intellectual property products, which accounts for a quarter of total investment (European Commission, 2018a), is still at a high level in Sweden. However, its share of total investment decreased from 28.0 % to 24.9 % in 2010-2017 (EU average: 19.3 % in 2017).
Investment and economic conditions for private companies are positive overall. According to a recent Eurobarometer survey (European Commission, 2018f), Sweden has the third highest share of companies that are able to make all the desired investments (Sweden: 35 %, EU average: 21 %), after Germany and Denmark and only 6 % of Swedish companies are not able to make any investment at all (EU average: 12 %). The generally good economic situation in Sweden seems to help companies in their investment decisions. 51 % of Swedish companies – as compared with 28 % in the EU – say that demand conditions were no obstacle to investment.
|
Graph 4.4.2:Gross fixed capital formation (% of GDP)
|
|
|
|
Source: European Commission
|
Most companies in Sweden report that they are able to invest according to their needs. In 2017, only 14 % of firms reported a too low amount of investment over the last three years. While replacement of existing buildings, machinery, equipment and information technology is still the most important investment purpose, the share of firms investing in new products or services is above the EU average and continues to increase. Some companies perceive a lack of available staff as a principal investment barrier – independent of sector or firm size (European Investment Bank, 2018).
Boosting investment in new housing, education and skills, and maintaining investment in transport infrastructure and R&D can further enhance the Swedish economy. Regarding housing investment, a structural undersupply of dwellings remains despite a significant increase in new construction (see Section 4.2). Moreover, building activity is set to slow in the wake of the late-2017 house price falls. Concerning the educational system, demographic developments will lead to an increase of the numbers of pupils, exacerbating the present shortage of teachers. Investing in education and skills will thus be key to help boost productivity growth and to address the skills mismatch experienced in some parts of the labour market (see Section 4.3). In addition, there is a need to maintain investment in transport infrastructure and R&D at high levels, as discussed below.
Investment in transport infrastructure
Sustained investment in transport infrastructure is set to continue for the next 10 years. The government has announced substantial funding for the upcoming ten-year period. An investment of SEK 700 billion (EUR 66 billion) has been committed through the national plan for infrastructure 2018-2029 adopted in June 2018. This is SEK 100 billion more than for the previous period. It contains major investments to develop the railway system and increase capacity, as well as multiplied investments in fairways and locks compared with the preceding plan (e.g. funds for the important deepening of the fairways at the Port of Gothenburg). These investments have the objective of reducing transport costs, increasing maritime safety and reducing emissions, since they promote the switch of goods transport from roads to railways and shipping.
Research, innovation and digitisation
Sweden remains one of Europe’s most innovative economies. Sweden has consistently been one of the top-performing countries in the European Innovation Scoreboard (), both in terms of R&D investment() and outcomes (European Commission, 2018a). Overall, the country benefits from an excellent science base, highly qualified human resources and internationally competitive and innovative large companies, both in the manufacturing and services sector.
Maintaining high levels of investment, favourable framework conditions and a broader innovation base are key to securing this leading position. Sweden’s innovation model has traditionally relied on a limited number of large globally active technology companies. The internationalisation of these companies against the backdrop of mergers and acquisitions has, however, led in some cases to headquarters moving abroad. Research and innovation activities of these companies have also become more internationally mobile. In this context, it is essential for Sweden to create an environment that nurtures the innovation potential of SMEs and start-ups.
The economy’s innovation capacity could be further improved by increased collaboration between academia and SMEs. The share of public R&D financed by the business sector (an important indicator of public-private cooperation) has declined since 2011, with Sweden now ranked below the EU average. While Sweden still performs well on the share of public-private co-publications, notably in engineering science, performance has considerably declined in this area too. Against this backdrop, there is room for boosting knowledge transfer via joint projects, a better matching of the specialisation of the public science base to that of the private sector, exchange of staff between firms and universities and for more university spinoffs to turn research results into new products and services (Tillväxtanalys, 2014)
There are emerging bottlenecks in the supply of high-skilled human resources. Ensuring a supply of specialist human capital is vital to support R&D investment as well as digitisation (see chapter 4.3). This concerns in particular science and engineering graduates, as well as workers with advanced digital skills.
Recent policy initiatives are addressing these key challenges. The Research Bill 2017-2020 provides additional financial resources to support both basic and applied research as well as human resources development, notably within higher education. The bill furthermore launches six new 10-year research programmes. Academia-business cooperation is promoted via Innovation Partnership Programmes ().
Sweden’s Smart Industry Strategy recognises the need to enhance digitisation of SMEs(). Swedish businesses are embracing digitisation and actively using digital technologies to improve efficiency, productivity and sales. However, SMEs overall somewhat lag behind large companies in this area. To develop innovation capacity in SMEs, the authorities promote projects that validate technology and business concepts, as well as some industry-specific innovation-enhancing measures, such as reducing the processing industry’s emissions of greenhouse gases.
|
Box 4.4.1: Investment challenges and reforms in Sweden
Macroeconomic perspective
Total investment as a % of GDP was above the EU average over the last decade. Both private and public investment have grown faster than GDP and the EU average. Private investment is set to grow at a lower but still robust pace, as residential investment adjusts to lower levels due to lagged effects of 2017 housing market weakness. Public investment in housing, healthcare and education infrastructure is set to remain overall robust in 2019.
Assessment of barriers to investment and ongoing reforms
Barriers to investment in Sweden are overall low (European Commission, 2018a). Some reforms were adopted in public procurement (see Section 4.4.3), research and innovation (see Section 4.4.1) and construction investment. However, scope remains for further measures, particularly on tackling barriers to construction (see Section 4.2.2).
Several institutions promote access to finance for early-stage companies and SMEs. For example, Norrlandsfonden, an independent trust fund, supports the development of companies in Norrbotten, Västerbotten, Västernorrland, Jämtland and Gävleborg (yearly lending volume of around SEK 300 million). ALMI Företagspartner AB provides loans and venture capital, while Saminvest, a fund set up by the government in 2016, makes private equity available and develops the market. It manages assets worth SEK 5 billion.
Selected barriers to investment and priority actions underway
1. Cooperation between academia and business could be further enhanced, particularly for SMEs. Initiatives such as the Innovation Partnership Programme (see Section 4.4.1) could, over time, help promote increased collaboration.
2. Construction investment has been held back by a number of interlinked structural barriers. Sweden has gradually implemented a range of policy steps to tackle these bottlenecks (e.g. streamlining planning processes), coupled with some budgetary support. This contributed to a significant pick-up in residential investment between 2013 and 2017, but some key structural bottlenecks remain (see Section 4.2.2).
|
4.4.2.
SINGLE MARKET INTEGRATION AND SERVICES SECTOR
Energy system
Sweden benefits from a dynamic and competitive energy wholesale market. This is supported by full liberalisation of the wholesale electricity market combined with good connectivity to both the Nordic market and other European countries. Sweden also has a well-functioning, albeit small gas market, which is supplied by one route from Denmark.
Market concentration of power generation is below the EU average and has been falling over the last decade, ensuring competitive pricing. Wholesale electricity prices are among the lowest in the EU. However, they are subject to unpredictable price swings driven by hydrological developments, due to the importance of hydropower in Sweden’s overall generation capacity.
The retail electricity market remains competitive due to a large number of suppliers. For a mature market (the Swedish electricity market was liberalised in 1996), consumers’ supplier switching rates are healthy, approaching 10 % per year in 2016 due to strong competition among suppliers, which limits their pricing power. As a result, retail electricity price developments tend to be mainly driven by wholesale prices and network charges. Smart meters also support competition and should also facilitate the uptake of new energy services, such as demand response aggregation.
Sweden is well above its 2020 target for renewables in gross final energy consumption. With a share of 53.8 % in 2016, Sweden is already outperforming its 2020 target of 49 %. The country intends to continue to mobilise investments to achieve the 2030 EU Renewable Energy Source target of 32 %.
Sweden submitted its draft integrated National Energy and Climate Plan in June 2018. In the Plan, to be adopted by 31 December 2019 in line with the Regulation on the Governance of the Energy Union and Climate Action (), Sweden will provide an overview of its investment needs until 2030 for the different dimensions of the Energy Union, including renewable energy, energy efficiency, security of supply, and climate mitigation and adaptation. The information provided, including in the draft plan submitted in June 2018, will further contribute to the identification and assessment of energy and climate-related investment needs for Sweden.
Climate Policy
Sweden’s climate policy has been successful and remains ambitious. Between 1990 and 2015 the country’s greenhouse gas (GHG) emissions fell by 25.1 %, while its GDP per capita increased by 29 %. It is fully on course to meet its EU 2020 and 2030 emission targets, and has set national targets that go well beyond these (). Sweden aims to achieve net zero emissions of GHG by 2045 and have negative emissions thereafter. This long-term objective will require significant additional efforts to reduce emissions in all main sectors of the economy.
These ambitions are enshrined in Sweden’s Climate Act, which includes regular monitoring and policy assessment provisions. The Riksdag adopted the Act in 2017, setting out the national climate policy framework. In addition to establishing specific emissions reduction goals, the Act requires the government to provide a climate report alongside its annual budget bill. This report assesses the need of additional policies and measures to achieve the long-term target. Every fourth year, the government presents a climate action plan specifying planned measures in more detail. The Act also establishes a Climate Policy Advisory Board (Klimatpolitiskt råd) that monitors the progress of Sweden’s climate policy independently of the government.
In order to meet its 2030 emissions reduction targets, Sweden is focusing on measures in the transport sector. Transport emissions account for a third of total GHG emissions and more than half of emissions in sectors outside the EU Emissions Trading System (ETS). Measures to cut GHG emissions in this sector include incentives for low-emission vehicles and fuels. For instance, in July 2018, a bonus/malus system was introduced that makes it more attractive to purchase new plug-in hybrids and electric cars. From 2020, municipalities can introduce three different kinds of low-emission zones, one of which only allows purely electric cars, fuel cell cars and low-emission gas cars. High standards are also set for heavy vehicles.
Environmental Taxation
Environmental tax revenues as a share of GDP have been falling since 2010 and are relatively low compared to other Member States. This decline is partially due to the intended behavioural impact of taxes, and an increased substitution to biofuels in the transport sector.
The recent phasing out of exemptions and reductions in tax rates for carbon and energy should increase environmental revenues. Discounts in the carbon tax on heating fuels in the non-ETS sectors have been progressively reduced, and ultimately largely abolished in 2018. Since 2017, taxes on petrol and diesel are subject to an annual increase of two percentage points on top of consumer price inflation. Substantial progress has also been made in reducing the ‘diesel differential’ (difference in price of diesel versus petrol) by gradually adjusting the respective excise tax rates. However, some tax exemptions remain in place for fossil fuel use, e.g. in motor vehicles, domestic shipping and aviation, agriculture, and various industrial sectors (OECD, 2018a).
4.4.3.REGIONAL DIMENSION AND INFRASTRUCTURE
Regional Differences
Sweden’s regions have high levels of prosperity, but recently growth has been concentrated in urban areas. GDP per head was above the EU average in all Swedish regions except North Middle Sweden (99 % of the EU average). However, there is a growing concentration of economic activity in larger city regions. The metropolitan areas account for 49 % of national GDP and 41 % of employment. Between 2000 and 2016, the three Swedish metropolitan areas Stockholm, Gothenburg and Malmö generated 62 % of national GDP growth, with Stockholm alone being responsible for 44 % (OECD, 2018c), thereby slightly widening regional divergence.
Regional development depends on the endowment of skills and sectoral specialisation. Regions with a more diversified tradable sector performed relatively well, whereas those with a manufacturing profile had a more subdued development (Tillväxtverket, 2018). In addition, regions with an initial high share of graduates attracted additional high-skilled indivuduals, further increasing economic performance (Tillväxtanalys, 2018). Because of this tendency towards agglomeration, middle-income regions risk falling behind in productivity and growth. Over 2010-2015 their investment rates were significantly below the Swedish average (18-20 % of GDP vs. 23 % for Sweden as a whole). This lower level has repercussions on infrastructure, R&D investments () and innovation performance (). Some commodity-based regions like the Northern Sparsely Populated Areas are particularly vulnerable to shifts in global demand and competition. They also face the problem of achieving critical mass for their specialisations and difficulties in connecting to markets.
Sweden has developed Smart Specialisation strategies to foster regional development. Eighteen out of 21 counties have already put in place Smart Specialisation strategies (Research and Innovation Strategies for Smart Specialisation). The aim is to mobilise stakeholders to identify priority areas with the greatest potential for innovation and growth based on the regions comparative advantage and existing assets and resources. Investments from the European Regional Development Fund already support these strategies within the current programming period, in particular within research and innovation with a special focus on SMEs. This support is expected to continue in the next period. In order to reach full effect, the Research and Innovation Strategies for Smart Specialisation system would profit from politically-anchored regional strategies and better coordination with national level priorities.
Transport Sector
Transport infrastructure could contribute to improved trade, mobility and regional cohesion. Among EU Member States, Swedish transport infrastructure ranks 13th in the Global Competitiveness Report (World Economic Forum, 2018) with railroad infrastructure at only 25th. The additional investment envisaged by the government (see Section 4.4.1) aims to upgrade the different transport modes (railway, road and ship), thereby facilitating interconnections across regions and fostering trade, labour mobility and economic integration. In addition, the intended shift of traffic from road to rail and maritime modes should reduce the environmental impact of transport.
The expansion of the high-speed rail network could support labour market connectivity and new residential developments. The national plan for infrastructure for 2018-2029 contains three routes for high-speed trains. The objective is to better connect Stockholm, Gothenburg and Malmö. Expansion is envisaged to take place at a pace allowed by the economy and in a cost-effective manner. In parallel, the National Negotiation on Housing and Infrastructure has agreed a framework with municipalities of the three metropolitan regions about central government co-financing of investments in public transport and cycling. In total, municipalities have committed to building 193 130 housing units, in particular between Uppsala and the county border with Stockholm.
Broadband
Sweden is among the best performers in providing access to ultrafast broadband, but reaching its 2020 target could be a challenge. End users have good accessibility in terms of both fixed and mobile broadband. The government’s target is that 95 % of all households and businesses will have access to broadband of at least 100 Mbit/s by 2020. Currently, coverage of this speed category is 73 % (European Commission, 2018c). However, the Swedish Post and Telecom Authority (Post- och Telestyrelsen) predicts that only 87-90 % will be covered by 2020. This is due to greater cost uncertainty associated with laying fibre optic cables in sparsely populated areas (Post- och Telestyrelsen, 2018). Although the Authority expects everyone to have access to at least 30 Mbit/s by 2020, it called on the public sector to facilitate investments in sparsely populated areas so that households and business there can benefit from digitisation and related business opportunities.
4.4.4. Institutional quality and governance
Business Environment
Sweden continues to have a high-quality and competitive business environment. The country stands out in public administration, access to finance, innovation and ability of SMEs to exploit international opportunities. The overall administrative burden for companies is low and SMEs appreciate the stability of the regulatory environment. As part of the national export strategy, coordination of export support services is offered at regional level to SMEs wishing to export their goods and services (European Commission, 2018g).
The ongoing digitisation of the public sector benefits Swedish businesses. Through the e-business portal www.verksamt.se over 45 different government agencies provide information, targeted support and enable e.g. company registrations and tax calculation. A new agency for digital government will develop, coordinate and support public sector digitisation at both central and local level. The agency was set up in September 2018 with a budget of SEK 98.5 million for 2019.
Companies have good access to finance. The 2018 survey on the access to finance of enterprises (SAFE) shows that access to finance is the most important concern for only 7 % of Swedish SMEs (2017: 9 %) (European Commission, 2018h). Venture capital is sufficiently available and several private and public funds are active on the market. Access to public financial support has further improved and fewer SMEs report difficulties (European Commission, 2018g).
Some specific challenges remain for Swedish companies. According to the 2018 survey on the access to finance of enterprises, the three most important issues for SMEs are customers, the availability of skilled labour (see chapter 4.3) and costs of production or labour. In addition, the slow processing times of work permit extensions for highly-skilled non-EU professionals also continues to pose a challenge (European Commission, 2018g).
The female entrepreneurship rate in Sweden is rather low. The currently good labour market conditions might contribute to a general lack of people wanting to start a business. While entrepreneurship framework conditions are good and entrepreneurs have a high status (European Commission, 2018g), women are underrepresented on private company boards and among entrepreneurs. Both the shares of Swedish women who are self-employed with employees (1.6 %) and the share of own-account workers (3.8 %) are among the lowest in the OECD. Fostering female entrepreneurship is crucial to levelling out differences (OECD, 2017b).
Public Procurement
The public procurement system is well functioning and its transparency has improved. The proportion of contract award notices without information on the contract value has significantly decreased after a number of years(). This should have a very positive impact on identifying possible unjustified modifications of contracts and on verifying the appropriateness of prices paid. However, problems remain in a few specific areas: in particular, professionalisation of public procurers in the municipalities could reduce the overall level of irregularities in public procurement.
Annex A: Overview Table
|
Commitments
|
Summary assessment ()
|
|
2018 country-specific recommendations (CSRs)
|
|
CSR 1: Address risks related to high household debt by gradually reducing the tax deductibility of mortgage interest payments or increasing recurrent property taxes. Stimulate residential construction where shortages are most pressing, in particular by removing structural obstacles to construction, and improve the efficiency of the housing market, including by introducing more flexibility in setting rental prices and revising the design of the capital gains tax.
|
Sweden has made Limited Progress in addressing CSR 1
|
|
·Address risks related to high household debt by gradually reducing the tax deductibility of mortgage interest payments or increasing recurrent property taxes.
|
·No Progress. No measures have been announced to adjust the relevant fiscal incentives.
|
|
·Stimulate residential construction where shortages are most pressing, in particular by removing structural obstacles to construction,
|
·Some Progress. Sweden is continuing with the gradual implementation of the ‘22-point plan’ to increase residential construction and improve the efficiency of the housing sector. The authorities have also proceeded with an initiative to raise participation of foreign firms in the Swedish construction sector, including by setting up an online portal with English-language info on Swedish building and planning regulations.
|
|
·and improve the efficiency of the housing market, including by introducing more flexibility in setting rental prices and revising the design of the capital gains tax.
|
·Limited Progress. In January 2019, the Swedish authorities announced that reforms will be prepared to make the rent-setting system more flexible. There are also plans to make deferred capital gains taxes on sold properties in the owner-occupancy market interest-free.
|
|
Europe 2020 (national targets and progress)
|
|
Employment rate target set in the 2014 NRP: well over 80 %.
|
Employment rate (%) in Q3 2018: 82.5 % (2016: 81.2%; 2015: 80.4 %; 2014: 80.0 %; 2013: 79.8 %)
The EU-wide target was met already before the crisis in 2007-2008 (80.4 % in 2008), before a drop in the indicator due to the 2008-2009 crisis. Since then progress has picked up and Swedish labour market performance remains solid with a continuously improving trend, and a level now back to pre-crisis record highs. Sweden has had the highest employment rate in the European Union for several years in a row.
|
|
R&D target: 4 % of GDP
|
In 2017, R&D intensity in Sweden was 3.33% of GDP composed of 71% private investment (2.35% of GDP) and 29% public investment (0.98% of GDP).
Limited progress towards the target. While public R&D intensity declined slightly over the 2010-2017 period, business expenditure on R&D as a percentage of GDP increased by 0.02 percentage points per year over the same period, resulting in a 0.12 pp increase in total R&D intensity. Sweden will reach its national target for 2020 only if the stagnation in public R&D intensity can be overcome and if the increase in business R&D intensity can be accelerated.
|
|
National greenhouse gas (GHG) emissions target:
-17 % in 2020 compared to 2005 (in non-ETS sectors)
|
Between 2005 and 2017, Sweden's GHG emissions in the non-ETS sectors fell by 25 %. They are projected to decline by 32 % overall by 2020, thus overachieving the national target by 15 percentage points.
|
|
2020 Renewable energy target: 49 % of final energy consumption
|
At 54,5 %, Sweden has already exceeded its 2020 target.
|
|
Sweden’s 2020 energy efficiency target is 43.4 Mtoe expressed in primary energy consumption and 30.3 Mtoe expressed in final energy consumption
|
Sweden's primary energy consumption in 2017 was of 46.1 Mtoe, a decrease compared to 46.9 Mtoe in 2016. Final energy consumption in 2017 reached 32.6 Mtoe, a slight increase compared to 2016.
More efforts are needed to meet the indicative national 2020 target.
|
|
Early school leaving target: below 7 %
|
Early leavers from education and training (share of the population aged 18-24 with at most lower secondary education and not in further education or training) in 2017: 7.7 % (2016: 7.4 %; 2015: 7 %; 2014: 6.7 %; 2013: 7.1 %).
The rate is above the 7 % target.
|
|
Tertiary education target: 45-50 %
|
Tertiary educational attainment (share of population 30-34 having successfully completed tertiary education) in 2017: 51.3 % (2016: 51 %; 2015: 50.2 %; 2014: 49.9 %; 2013: 48.3 %).
The target of 45-50 % has been achieved.
|
|
Target on the reduction of population at risk of poverty or social exclusion in number of persons:
Reducing to well under 14 % the number of people aged 20-64 who are not in the labour force (except full-time students), long-term unemployed or on long-term sick leave.
|
The corresponding indicator has reached 11.4 % in 2017, according to feedback from national authorities (2016: 12.0 %; 2015: 12.4 %; 2014: 12.6 %; 2013: 12.7 %).
The target has been reached and the trend remains good.
|
Annex B: Commission Debt Sustainability Analysis and fiscal risks
Annex C: Standard Tables
|
|
|
Table C.1:Financial market indicators
|
|
|
|
Source: European Commission (long-term interest rates); World Bank (gross external debt); Eurostat (private debt); European Central Bank (all other indicators).
|
|
|
|
|
|
Table C.2:Headline Social Scoreboard indicators
|
|
|
|
Source: Eurostat
|
|
|
|
|
|
Table C.3:Labour market and education indicators
|
|
|
|
Source: Eurostat, OECD
|
|
|
|
|
|
Table C.4:Social inclusion and health indicators
|
|
|
|
(6) Fixed broadband take up (33%), mobile broadband take up (22%), speed (33%) and affordability (11%), from the Digital Scoreboard.
Source: Eurostat, OECD
|
|
|
|
|
|
Table C.5:Product market performance and policy indicators
|
|
|
|
Source: European Commission; World Bank — Doing Business (for enforcing contracts and time to start a business); OECD (for the product market regulation indicators); SAFE (for outcome of SMEs' applications for bank loans).
|
|
|
|
|
|
Table C.6:Green growth
|
|
|
|
* European Commission and European Environment Agency
Source: European Commission and European Environment Agency (Share of GHG emissions covered by ETS); European Commission (Environmental taxes over labour taxes); Eurostat (all other indicators)
|
|
|
Annex D: Investment Guidance on Cohesion Policy Funding 2021-2027 for Sweden
Building on the Commission proposal for the next Multi-Annual Financial Framework for the period 2021-2027 of 2 May 2018 (COM (2018) 321), this Annex D() presents the preliminary Commission services views on priority investment areas and framework conditions for effective delivery for the 2021-2027 Cohesion Policy. These priority investment areas are derived from the broader context of investment bottlenecks, investment needs and regional disparities assessed in the report. This Annex provides the basis for a dialogue between Sweden and the Commission services in view of the programming of the cohesion policy funds (European Regional Development Fund and European Social Fund Plus).
|
Policy Objective 1: A Smarter Europe – Innovative and smart industrial transformation
|
|
In order to reach its ambitious national target for research and development expenditure of 4% of GDP and secure its position as European leader in innovation, Sweden needs to make a continuous effort to broaden the innovation base and maintain high level of investments in research and development. Regional differences in terms of innovation performance and competitiveness are accentuated. Investment needs() have therefore been identified to further enhance research and innovation capacities and the uptake of advanced technologies, and in particular to:
•encourage the development and implementation of tailor-made smart specialisation systems at regional (programme) and national level. Promote further international and regional cooperation to exchange knowledge and achieve critical mass for the specialisations; thereby particularly focusing on the 3 middle-income regions (Småland and the Islands, Central Norrland and North Middle Sweden) and the Northern Sparsely Populated Areas in order to support them to catch up and scale up their investments. Promote the coordination between the smart specialisation strategies and national Innovation Partnership Programmes and other relevant strategies (notably the EU strategy for the Baltic Sea Region) and other (non-) European countries;
•further encourage regional growth processes and promote research and innovation capacities, supporting existing cluster and network structures, strengthening the business competitiveness and the business uptake of advanced technologies; thereby contributing to diminishing the competitiveness and innovation gaps particularly in the middle-income regions and Northern Sparsely Populated Areas;
•strengthen links, cooperation and knowledge transfer between academia and business and promote a more active involvement of universities in projects. Support marketable and market-oriented research and development and raise business awareness of upcoming scientific developments. Support the establishment of living labs and test-beds and eco-systems that bring together the demand and supply side ensuring a better uptake of innovation in small and medium-sized enterprises;
·support pilot lines, early product validation, technology transfer and the building of capacities in the development and provision of key digital technologies, artificial intelligence, cybersecurity, high performance computing and in particular in the area of digital skills and deep tech.
|
|
The potential of Swedish small and medium-sized enterprises and innovative start-ups is not fully exploited, there is a low proportion of SMEs with new-to-market/new-to-firm innovations and the proportion of Swedish female entrepreneurs is among the lowest in the OECD area. Investment needs in research and innovation are identified to further enhance growth and competiveness of small and medium-sized enterprises, and in particular to:
•promote continuous Entrepreneurial Discovery Processes through strengthened entrepreneurial ecosystems and the sustained engagement of small and medium-sized enterprises in these processes; support Project Development Labs;
•encourage female entrepreneurship including in the Northern Sparsely Populated Areas in order to reach the full potential of the economy and support small and medium-sized enterprises that employ third-country nationals and other vulnerable groups for the cause of integration;
•promote the creation of new firms, growth of start-ups/scale-ups, accelerators, as well as new business models and increase the proportion of small and medium-sized enterprises with new-to-market and new-to-firm innovations by giving support to product, organisational and marketing innovations. Stimulate the uptake on enabling technologies, eco innovation and green- and blue-tech sector technology, as well as the acceleration of market access and internationalisation, especially in Northern Sparsely Populated Areas;
•support the development of regional, interregional, and international networks to disseminate knowledge, create partnerships, and promote further innovation and global value chains.
|
|
Despite the fact that Sweden is characterised by a highly skilled labour force, it lacks Informations and Communications Technology specialists. Employment in high-tech sectors is above EU level only in the three large-city-regions; the skills gap figures among the top barriers to growth for companies. Therefore, investment needs have been identified to develop skills for smart specialisation, industrial transition and entrepreneurship, in synergy with lifelong learning actions under Policy Objective 4; and in particular to:
•promote innovation management in small and medium-sized enterprises and support vocational education and training and reskilling in smart specialization areas within firms; building the necessary administrative capacity, including in smart cities in cooperation with peers in the Baltic Sea Region, with a particular attention to digital skills and the need to address industrial transition;
•promote skills development for higher education and research institutions to increase the commercial viability and market relevance and uptake of their research projects as well as their capacities to take part in interactive and open innovation processes, including across borders;
•strengthen the capacity of small and medium-sized enterprises to adapt to digital/technological transformation and increase their Informations and Communications Technology uptake, support the automation of work/processes;
•encourage the development of novel applications and the diffusion of digital and other key enabling technologies through extra-regional networks of digital innovation hubs and living labs.
|
|
Policy Objective 4: A more social Europe – Implementing the European Pillar of Social Rights
|
|
Sweden’s education system generally functions well but a sufficient response to current and future labour market needs must be ensured given increasing skills shortages, including as regards advanced digital skills. Investment needs have therefore been identified to improve the effectiveness and labour market relevance of education and training; to promote lifelong learning, notably flexible upskilling and reskilling, taking into account digital skills, better anticipate change and new skills requirements, facilitate career transitions and promote professional mobility, and in particular to:
•enhance the labour market relevance of higher education programmes, with synergies with the Erasmus programme;
•build flexible pathways between sectors of education and training and between education and work;
•build vocational education and training providers’ capacity to respond to the needs of employers and local innovation ecosystems, in synergy with actions under Policy Objective 1 and smart specialisation strategies;
•implement comprehensive lifelong learning strategies;
•upgrade adult population's basic skills and create new opportunities for low-skilled adults;
•support innovative policy actions and experimentation.
|
|
Differences in educational outcomes and employment between foreign-born and native students persist. Investment needs have therefore been identified to promote the socio-economic integration of third country nationals, including through inclusive education and training; to foster active inclusion and to improve employability of persons at a disadvantage, particularly through:
•measures to improve access to, and inclusiveness of, education and training, and basic skill attainment of all students;
•measures to prevent early school leaving;
•development and deployment of innovative and effective teaching methods and technologies that deliver high-quality educational content tailored to disadvantaged learners;
•integrated pathways to employment, notably for persons with disabilities;
•awareness-raising and engagement with local communities, civil society and social partners to fight discrimination;
•social innovation and social experimentation in the field.
|
|
Factors for effective delivery of Cohesion policy
|
|
•administrative capacity of authorities to support and implement smart specialisation strategies;
•broader use of financial instruments and/or contributions to Sweden's compartment under InvestEU for revenue-generating and cost-saving activities;
•build on the lessons learnt in North Middle Sweden during the implementation of the Commission pilot project on industrial transition, in particular about the impact of new technologies, decarbonisation and the promotion of inclusive growth;
•social dialogue and social partners' capacity.
|
References
Arbetsförmedlingen, Public Employment Service (2018a), ‘Arbetsmarknadsutsikterna våren 2018 Prognos för arbetsmarknaden 2018-2020’, Stockholm.
Arbetsförmedlingen, Public Employment Service (2018b), ‘Arbetsmarknadsutsikterna hösten 2018 Prognos för arbetsmarknaden 2018-2020’, Stockholm.
Blom, K. and van Santen, P. (2017), ‘The indebtedness of Swedish households: Update for 2017’, Sveriges Riksbank Economic Commentaries, No. 6, 2017, Sveriges Riksbank, Stockholm.
Calmfors, L.; Danielsson, P.; Ek, S.; Kolm, A-S.; Pekkarinen, T. and Skedinger, P. (2018), ‘Hur ska fler komma in på arbetsmarknaden?’, Dialogos förlag, Stockholm.
Cedefop (2018), ‘Developments in vocational education and training policy in 2015-18: Sweden’, Cedefop monitoring and analysis of VET policies.
Crowe C., Dell’Ariccia G., Igan D. and Rabanal P. (2011), ‘How to Deal with Real Estate Booms: Lessons from Country Experiences’, IMF Working Paper WP/11/91, International Monetary Fund Publications Services, Washington, D.C.
Donner, H., Englund, P. and Persson M. (2017), ‘Distributional effects of deregulating the Stockholm rental housing market’, Report to the Swedish Fiscal Policy Council 2017/1, Finanspolitiska Rådet, Stockholm.
Emanuelsson, R., Katinic G. and Spector E. (2018), ‘Developments in the housing market and their contribution to household debt’, Sveriges Riksbank Economic Commentaries, No. 14, 2018, Sveriges Riksbank, Stockholm.
Emanuelsson, R. (2015), ‘Supply of housing in Sweden’, Sveriges Riksbank Economic Review 2015:2, Sveriges Riksbank, Stockholm.
European Banking Authority (EBA) (2018), ‘2018 EU-wide Stress Test Results’, European Banking Authority, https://eba.europa.eu/-/eba-publishes-2018-eu-wide-stress-test-results
European Commission (2019a), ‘Fiscal Sustainability Report 2018’, European Economy Institutional Paper 94/2019, Publications Office of the European Union, Luxembourg.
European Commission (2019b), ‘Digital Scoreboard 2019’ (
https://ec.europa.eu/digital-single-market/en/digital-scoreboard
).
European Commission (2018a), ‘Country Report Sweden 2018’, Commission Staff Working Document (2018) 225, Publications Office of the European Union, Luxembourg.
European Commission (2018b), ‘Alert Mechanism Report 2019’, COM(2018) 758 final, Brussels.
European Commission (2018c), ‘Digital Economy and Society Index (DESI) 2018 Country Report — Sweden’, Publications Office of the European Union, Luxembourg. (
http://ec.europa.eu/information_society/newsroom/image/document/2018-20/se-desi_2018-country_profile_eng_B4415EB7-91D2-DCCF-0F42BEA92BA6B8E7_52239.pdf
).
European Commission (2018d), ‘What is Fiscal Governance?’, Publications Office of the European Union, Luxembourg. (
https://ec.europa.eu/info/business-economy-euro/indicators-statistics/economic-databases/fiscal-governance-eu-member-states/what-fiscal-governance_en#what-is-fiscal-governance
)
European Commission (2018e), ‘Report on Public Finances in EMU 2018’, European Economy, Institutional Papers, Publications Office of the European Union, Luxembourg.
European Commission (2018f), ‘Flash Eurobarometer 459 – Investment in the EU Member States’, Publications Office of the European Union, Luxembourg. (
https://data.europa.eu/euodp/data/dataset/S2159_459_ENG
)
European Commission (2018g), ‘2018 SBA Fact Sheet – Sweden’ (
https://ec.europa.eu/docsroom/documents/32581/attachments/28/translations/en/renditions/native
)
European Commission (2018h), Survey on the access to finance of enterprises (SAFE), Analytical Report 2018, Publications Office of the European Union, Luxembourg.
European Commission (2018i), ‘2018 European Semester: Assessment of progress on structural reforms, prevention and correction of macroeconomic imbalances, and results of in-depth reviews under Regulation (EU) No 1176/2011’, Communication from the Commission to the European Parliament, the Council, the European Central Bank and the Eurogroup, COM(2018) 120 final, 7 March 2018, Brussels.
European Commission (2018j), ‘Commission Decision of 17.7.2018 not to propose an implementing act to reject the draft national measure notified on 24 May 2018 by Sweden under Article 458 (4) of Regulation (EU) No 575/2013 of the European Parliament and of the Council‘, COM(2018) 4716 final, 2018, Brussels. (http://data.consilium.europa.eu/doc/document/ST-11456-2018-INIT/en/pdf)
European Commission (2017a), ‘Country Report Sweden 2017’, Commission Staff Working Document (2017) 92, Publications Office of the European Union, Luxembourg.
European Commission (2017b), ‘Regional Innovation Scoreboard 2017’, Publications Office of the European Union, Luxembourg.
European Commission (2016), ‘Country Report Sweden 2016’, Commission Staff Working Document (2016) 95, Publications Office of the European Union, Luxembourg.
European Commission (2015), ‘Country Report Sweden 2015’, Commission Staff Working Document (2015) 46, Publications Office of the European Union, Luxembourg.
European Investment Bank (2018), ‘EIB Group Survey on Investment and Investment Finance Country Overview: Sweden’, European Investment Bank, Luxembourg.
Finansinspektionen (2018a), ‘Swedish Consumption Loans 2018’, Ref. 18-11091, Finansinspektionen, Stockholm.
Finansinspektionen (2018b), ‘The Swedish Mortgage Market (2017)’, Ref. 18-3193, Finansinspektionen, Stockholm.
Finansinspektionen (2018c), ‘Stability in the Financial System’, Ref. 18-20866, Finansinspektionen, Stockholm.
Finansinspektionen (2018d), ‘Decision regarding the countercyclical buffer rate’, Ref. 18-18198, Finansinspektionen, Stockholm.
Finanspolitiska Rådet (2016), ‘Svensk finanspolitik’, Finanspolitiska rådets rapport 2016, Finanspolitiska Rådet, Stockholm.
Geng, N. (2018), ‘Fundamental Drivers of House Prices in Advanced Economies’, IMF Working Paper WP/18/164, International Monetary Fund Publications Services, Washington, D.C.
Grönqvist, H., Niknami S. (2017), ‘Ankomst och härkomst — en ESO-rapport om skolresultat och bakgrund’, Rapport till Expertgruppen för studier i offentlig ekonomi, 2017:3. (
http://eso.expertgrupp.se/wp-content/uploads/2014/12/ESO-2017_3.pdf
).
Hilgenstock B. and Kóczán Z. (2018), ‘Storm clouds ahead? Migration and labor force participation rates in Europe’, IMF Working Paper WP/18/148, International Monetary Fund Publications Services, Washington, D.C.
Holmberg, U., Janzén, H., Oscarius, L., van Santen, P. and Spector, E. (2015), ‘An analysis of the fixation period for Swedish mortgages’, Sveriges Riksbank Economic Commentaries, No. 7, 2015, Sveriges Riksbank, Stockholm.
Isaksson D.; Blomqvist P. and Winblad U. ‘Free establishment of primary health care providers: effects on geographical equity’. BMC Health Serv Res. 2016;16:28. (https://doi.org/10.1186/s12913-016-1259-z).
Katinic, G. (2018), ‘Perspectives on housing construction’, Sveriges Riksbank Economic Commentaries, No. 2, 2018, Sveriges Riksbank, Stockholm.
Konkurrensverket (2018), ‘Bättre konkurrens i bostadsbyggandet’, Konkurrensverkets rapportserie 2018:7, Stockholm.
National Agency for Education (NAE) (2017a), ‘Prognos över behovet av förskollärare och lärare’, 2018-02-02. (https://www.skolverket.se/publikationer?id=3876).
National Agency for Education (NAE) (2017b), ‘Redovisning av kommunernas aktivitetsansvar, första halvåret 2017’, Skolverket, Stockholm. (https://www.skolverket.se/skolutveckling/statistik/arkiverade-statistiknyheter/statistik/2017-11-23-redovisning-av-kommunernas-aktivitetsansvar-forsta-halvaret-2017).
National Agency for Education (NAE) (2018a), ‘Stora skillnader i lärarbehörighet mellan kommuner’, 2018-03-22. (
https://www.skolverket.se/om-oss/press/pressmeddelanden/pressmeddelanden/2018-03-22-stora-skillnader-i-lararbehorighet-mellan-kommuner
).
National Agency for Education (NAE) (2018b), ‘Slutbetyg i årskurs 9, våren 2018’, (
https://www.skolverket.se/skolutveckling/statistik/arkiverade-statistiknyheter/statistik/2018-09-27-slutbetyg-i-arskurs-9-varen-2018
).
National Agency for Education (NAE) (2018c), ‘Statistik om kommunernas aktivitetsansvar 2017/2018’, Skolverket, Stockholm. 2018-11-27 (
https://www.skolverket.se/skolutveckling/statistik/arkiverade-statistiknyheter/statistik/2018-11-27-statistik-om-kommunernas-aktivitetsansvar-2017-2018?utm_campaign=unspecified&utm_content=unspecified&utm_medium=email&utm_source=Skolverkets%20nyhetsbrev
).
National Agency for Education (NAE) (2017), ‘Prognos över behovet av förskollärare och lärare’, 2018-02-02. (https://www.skolverket.se/publikationer?id=3876).
National Audit Office (2017), ‘Riktade statsbidrag till skolan — nationella prioriteringar men lokala behov’ (RiR 2017:30), Stockholm. (
https://www.riksrevisionen.se/rapporter/granskningsrapporter/2017/riktade-statsbidrag-till-skolan---nationella-prioriteringar-men-lokala-behov.html
).
OECD (2018a), ‘Inventory of Support Measures for Fossil Fuels, 2018’, OECD Publishing, Paris.
https://stats.oecd.org/Index.aspx?DataSetCode=FFS_SWE
.
OECD/EU (2018b), ‘Health at a Glance: Europe 2018: State of Health in the EU Cycle’, OECD Publishing, Paris/EU, Brussels, (
https://doi.org/10.1787/health_glance_eur-2018-en
).
OECD (2018c), ‘Regions and Cities at a Glance 2018’, OECD Publishing, Paris,
https://www.oecd.org/governance/oecd-regions-and-cities-at-a-glance-26173212.htm
OECD (2018d), ‘International Migration Outlook 2018’, OECD Publishing, Paris, http://www.oecd.org/migration/international-migration-outlook-1999124x.htm
OECD (2017a), ‘Resilience in a time of high debt’, OECD Economic Outlook (Chapter 2), No. 2, 2017, OECD Publishing, Paris.
OECD (2017b), ‘OECD Economic Surveys: Sweden 2017’, OECD Publishing, Paris.
(
http://dx.doi.org/10.1787/eco_surveys-swe-2017-en
).
OECD (2017c), ‘State of Health in the EU, Sweden Country Health Profile’, OECD Publishing, Paris.
OECD (2016), ‘OECD Review of Policies to Improve the Effectiveness of Resource Use in Schools’ (School Resources Review), Country Background Review: Sweden, OECD Publishing, Paris. (
http://www.oecd.org/edu/CBR_OECD_SRR_SE-FINAL.pdf
).
Ölcer, D. and van Santen, P. (2017), ‘Household indebtedness: a regional perspective’, Sveriges Riksbank Economic Commentaries, No. 3, 2017, Sveriges Riksbank, Stockholm.
Post- och telestyrelsen (PTS) (2018), ‘Problems associated with laying fibre optic cable along roads are standing in the way of broadband expansion’ (press release), PTS Press Office, Stockholm.
Statistics Sweden (SCB) (2018a), ‘Kostnader för utbildningsväsendet 2013-2017’, (https://www.scb.se/hitta-statistik/statistik-efter-amne/utbildning-och-forskning/befolkningens-utbildning/kostnader-for-utbildningsvasendet/pong/publikationer/kostnader-for-utbildningsvasendet-2013-2017/).
Statistics Sweden (SCB) (2018b), ‘The future population of Sweden 2017-2070’. (
https://www.scb.se/en/finding-statistics/statistics-by-subject-area/population/population-projections/population-projections/pong/statistical-news/the-future-population-of-sweden-2018-2070/
).
Statistics Sweden (SCB) (2018c), ‘Equal share of persons born in Sweden and foreign born persons have post-secondary education’. (https://www.scb.se/en/finding-statistics/statistics-by-subject-area/education-and-research/education-of-the-population/educational-attainment-of-the-population/pong/statistical-news/educational-attainment-of-the-population-in-2017---educational-attainment-among-foreign-born-persons-2017/ ).
Statistics Sweden (SCB) (2017), ‘Information om utbildning och arbetsmarknad 2018:2’, Situationen på arbetsmarknaden för personer med funktionsnedsättning 2017, SCB, Stockholm.
Statistics Sweden (SCB) (2016), ‘Registerdata för integration’, Stockholm.
SOU (Statens Offentliga Utredningar) (2019), En långsiktig, samordnad och dialogbaserad styrning av högskolan, Betänkande av Styr- och resursutredningen (Strut), SOU 2019:6, Stockholm (https://www.regeringen.se/490b23/contentassets/b81affc4c0754122b1f7bbb24f23832c/en-langsiktig-samordnad-och-dialogbaserad-styrning-av-hogskolan-sou-20196)
SOU (Statens Offentliga Utredningar) (2018), ‘Increasing the Attractiveness of Sweden as a Knowledge Nation’, SOU 2018:78, (https://www.regeringen.se/rattsliga-dokument/statens-offentliga-utredningar/2018/10/sou-201878/).
SOU (Statens Offentliga Utredningar) (2017), ‘Styr och resursutredningen’, SOU 2017:5, Stockholm (
http://www.sou.gov.se/utredningen-om-styrning-for-starka-och-ansvarsfulla-larosaten/
).
SOU (Statens Offentliga Utredningar) (2014), ‘Vissa bostadsbeskattningsfrågor’, SOU 2014:1, Stockholm.
Sveriges Riksbank (2018a). ‘Financial Stability Report 2018:2’, Sveriges Riksbank, Stockholm
Sveriges Riksbank (2018b). ‘Financial Stability Report 2018:1’, Sveriges Riksbank, Stockholm
Svenskt Näringsliv (Confederation of Swedish Enterprise) (2018), ‘Rekryteringsenkäten 2018’, Stockholm.
Swedish Agency for Public Management (2016), ‘Central Government’s Steering of Municipalities’, Stockholm.
(
http://www.statskontoret.se/In-English/publications/2016---summaries-of-publications/central-governments-steering-of-municipalities-201624/
).
Swedish Association of Local Authorities and Regions (SALAR) (2018a), ‘Fokus på socioekonomisk resursfördelning i skola och förskola’. (
https://webbutik.skl.se/bilder/artiklar/pdf/7585-697-1.pdf?issuusl=ignore
).
Swedish Association of Local Authorities and Regions (SALAR) (2018b), ‘Skolans rekryteringsutmaningar — lokala strategier och exempel’. (
https://webbutik.skl.se/sv/artiklar/skolans-rekryteringsutmaningar-.html
).
Swedish Association of University Teachers and Researchers (SULF) (2018), ‘Systemfel i kunskapsfabriken – om urholkning av ersättningsbeloppen till högre utbildning’, Report from SULF, Stockholm.
Swedish IT and Telecom Industries (2017), ‘IT-komptensbristen, En rapport om den svenska digitala sektorns behov av spetskomptens’. (
https://www.itot.se/2017/11/it-kompetensbristen-en-rapport-om-den-svenska-digitala-sektorns-behov-av-spetskompetens/
).
Swedish Higher Education Authority (SHEA) (2018), ‘Universitet och högskolor: Årsrapport 2018’. (
http://www.uka.se/download/18.661e864c1639ebc31e7750/1527582917836/rapport-2018-05-30-arsrapport-2018.pdf
).
Swedish Teachers’ Union (2018), ‘Stora pensionsavgångar väntar i lärarkåren’. (
https://www.lararforbundet.se/artikelsidor/stora-pensionsavgaangar-vantar-i-lararkaaren/
).
Tillväxtanalys (2014), ‘Is R&D moving away from Sweden?’, Tillväxtanalys, Stockholm.
Tillväxtanalys (2018), ‘Regional agglomeration of skills and earnings – from convergence to divergence?’, Tillväxtanalys, Stockholm.
Van Santen, P. (2017), ‘Drivers and implications of the strong growth in consumption loans’, Sveriges Riksbank staff memo, Sveriges Riksbank, Stockholm.
Wikström, M.; Eklund, J. (2018), ‘Studiedestination Sverige - privat kapital för ökad kompetensförsörjning och konkurrenskraft?’ (
https://entreprenorskapsforum.se/wp-content/uploads/2018/09/FiFo_Internationalisering_webb.pdf
).
World Economic Forum (2018), ‘The Global Competitiveness Report 2018’, Cologny/Geneva.
-
(I)
Public investment is defined as gross fixed capital formation + investment grants + national expenditure on agriculture and fisheries.
-
(II)
Among which 19 are multi-country projects.