 EUROPEAN COMMISSION
Brussels,22.11.2017
SWD(2017) 661 final
COMMISSION STAFF WORKING DOCUMENT
FMT:BoldSTATISTICAL ANNEX/FMT
Accompanying the document
REPORT FROM THE COMMISSION TO THE EUROPEAN PARLIAMENT,
THE COUNCIL, THE EUROPEAN CENTRAL BANK
AND THE EUROPEAN ECONOMIC AND SOCIAL COMMITTEE
Alert Mechanism Report 2018
(prepared in accordance with Articles 3 and 4 of Regulation
(EU) No 1176/2011 on the prevention and correction of macroeconomic imbalances)
{COM(2017) 771 final}

|
|
European
Commission
|
|
|
Statistical Annex of
Alert Mechanism Report 2018
This document was prepared by the European Commission's Directorate-General Eurostat
|
Table of Contents
Background information
Statistical methodology improvements
Improving the quality framework and ongoing work
Chapter 1: Tables by year - Headline indicators
Table 1.1: MIP Scoreboard 2016
Table 1.2: MIP Scoreboard 2015
Table 1.3: MIP Scoreboard 2014
Table 1.4: MIP Scoreboard 2013
Table 1.5: MIP Scoreboard 2012
Table 1.6: MIP Scoreboard 2011
Table 1.7: MIP Scoreboard 2010
Table 1.8: MIP Scoreboard 2009
Table 1.9: MIP Scoreboard 2008
Table 1.10: MIP Scoreboard 2007
Chapter 2: Tables by year - Auxiliary indicators used in the economic reading of the MIP scoreboard
Table 2.1: Auxiliary indicators, 2016
Table 2.1 (continued): Auxiliary indicators, 2016
Table 2.2: Auxiliary indicators, 2015
Table 2.2 (continued): Auxiliary indicators, 2015
Table 2.3: Auxiliary indicators, 2014
Table 2.3 (continued): Auxiliary indicators, 2014
Table 2.4: Auxiliary indicators, 2013
Table 2.4 (continued): Auxiliary indicators, 2013
Table 2.5: Auxiliary indicators, 2012
Table 2.5 (continued): Auxiliary indicators, 2012
Table 2.6: Auxiliary indicators, 2011
Table 2.6 (continued): Auxiliary indicators, 2011
Table 2.7: Auxiliary indicators, 2010
Table 2.7 (continued): Auxiliary indicators, 2010
Table 2.8: Auxiliary indicators, 2009
Table 2.8 (continued): Auxiliary indicators, 2009
Table 2.9: Auxiliary indicators, 2008
Table 2.9 (continued): Auxiliary indicators, 2008
Table 2.10: Auxiliary indicators, 2007
Table 2.10 (continued): Auxiliary indicators, 2007
Chapter 3: Tables by indicator
44
Table 3.1: Current account balance, % of GDP (3 year average)
44
Table 3.2: Current account balance (% of GDP)
45
Table 3.3: Net International Investment Position (% of GDP)
46
Table 3.4: Real effective exchange rate - 42 trading partners, HICP deflator (3 year % change)
47
Table 3.5: Real effective exchange rate - 42 trading partners, HICP deflator (1 year % change)
48
Table 3.6: Export market share - % of world exports (5 year % change)
49
Table 3.7: Export market share - % of world exports (1 year % change)
50
Table 3.8: Nominal unit labour cost index, 2010=100 (3 year % change)
51
Table 3.9: Nominal unit labour cost index, 2010=100 (1 year % change)
52
Table 3.10: House price index (2015=100), deflated (1 year % change)
53
Table 3.11: Private sector credit flow, consolidated (% of GDP)
54
Table 3.12: Private sector debt, consolidated (% of GDP)
55
Table 3.13: General government gross debt (% of GDP)
56
Table 3.14: Unemployment rate (3 year average)
57
Table 3.15: Unemployment rate (%)
58
Table 3.16: Total financial sector liabilities, non-consolidated (1 year % change)
59
Table 3.17: Total financial sector liabilities, non-consolidated (Millions NC)
60
Table 3.18: Activity rate - % of total population aged 15-64 (3 year change in p.p.)
61
Table 3.19: Activity rate - % of total population aged 15-64
62
Table 3.20: Long-term unemployment rate - % of active population aged 15-74 (3 year change in p.p.)
63
Table 3.21: Long-term unemployment rate - % of active population aged 15-74
64
Table 3.22: Youth unemployment rate - % of active population aged 15-24 (3 year change in p.p.)
65
Table 3.23: Youth unemployment rate - % of active population aged 15-24
66
Table 3.24: Real GDP (1 year % change)
67
Table 3.25: Gross fixed capital formation (% of GDP)
68
Table 3.26: Gross domestic expenditure on R&D (% of GDP)
69
Table 3.27: Current plus capital account - Net lending-borrowing (% of GDP)
70
Table 3.28: Net external debt (% of GDP)
71
Table 3.29: Foreign direct investment in the reporting economy - flows (% of GDP)
72
Table 3.30: Foreign direct investment in the reporting economy - stocks (% of GDP)
73
Table 3.31: Net trade balance of energy products (% of GDP)
74
Table 3.32: Real effective exchange rate - Euro Area trading partners (3 year % change)
75
Table 3.33: Export performance against advanced economies (5 year % change)
76
Table 3.34: Terms of trade (5 year % change)
77
Table 3.35: Export market share, volume (1 year % change)
78
Table 3.36: Real labour productivity (1 year % change)
79
Table 3.37: Nominal unit labour cost index, 2010=100 (10 year % change)
80
Table 3.38: Unit labour cost performance relative to EA (10 year % change)
81
Table 3.39: House price index (2015=100) - nominal (3 year % change)
82
Table 3.40: Residential construction (% of GDP)
83
Table 3.41: Private sector debt, non-consolidated (% of GDP)
84
Table 3.42: Financial sector leverage (debt-to-equity), non-consolidated (%)
85
Table 3.43: Employment rate (1 year % change)
86
Table 3.44: Young people neither in employment nor in education and training - % of total population aged 15-24
87
Table 3.45: People at risk of poverty or social exclusion - % of total population
88
Table 3.46: People at risk of poverty after social transfers - % of total population
89
Table 3.47: Severely materially deprived people - % of total population
90
Table 3.48: People living in households with very low work intensity - % of total population aged 0-59
91
Chapter 4: Tables by Member States - Headline indicators
92
Table 4.1: The MIP scoreboard for Belgium
92
Table 4.2: The MIP scoreboard for Bulgaria
93
Table 4.3: The MIP scoreboard for Czech Republic
94
Table 4.4: The MIP scoreboard for Denmark
95
Table 4.5: The MIP scoreboard for Germany
96
Table 4.6: The MIP scoreboard for Estonia
97
Table 4.7: The MIP scoreboard for Ireland
98
Table 4.8: The MIP scoreboard for Greece
99
Table 4.9: The MIP scoreboard for Spain
100
Table 4.10: The MIP scoreboard for France
101
Table 4.11: The MIP scoreboard for Croatia
102
Table 4.12: The MIP scoreboard for Italy
103
Table 4.13: The MIP scoreboard for Cyprus
104
Table 4.14: The MIP scoreboard for Latvia
105
Table 4.15: The MIP scoreboard for Lithuania
106
Table 4.16: The MIP scoreboard for Luxembourg
107
Table 4.17: The MIP scoreboard for Hungary
108
Table 4.18: The MIP scoreboard for Malta
109
Table 4.19: The MIP scoreboard for Netherlands
110
Table 4.20: The MIP scoreboard for Austria
111
Table 4.21: The MIP scoreboard for Poland
112
Table 4.22: The MIP scoreboard for Portugal
113
Table 4.23: The MIP scoreboard for Romania
114
Table 4.24: The MIP scoreboard for Slovenia
115
Table 4.25: The MIP scoreboard for Slovakia
116
Table 4.26: The MIP scoreboard for Finland
117
Table 4.27: The MIP scoreboard for Sweden
118
Table 4.28: The MIP scoreboard for United Kingdom
119
Chapter 5: Tables by Member States - Auxiliary indicators used in the economic reading of the MIP scoreboard
120
Table 5.1: Auxiliary indicators for Belgium
120
Table 5.1 (continued): Auxiliary indicators for Belgium
121
Table 5.2: Auxiliary indicators for Bulgaria
122
Table 5.2 (continued): Auxiliary indicators for Bulgaria
123
Table 5.3: Auxiliary indicators for Czech Republic
124
Table 5.3 (continued): Auxiliary indicators for Czech Republic
125
Table 5.4: Auxiliary indicators for Denmark
126
Table 5.4 (continued): Auxiliary indicators for Denmark
127
Table 5.5: Auxiliary indicators for Germany
128
Table 5.5 (continued): Auxiliary indicators for Germany
129
Table 5.6: Auxiliary indicators for Estonia
130
Table 5.6 (continued): Auxiliary indicators for Estonia
131
Table 5.7: Auxiliary indicators for Ireland
132
Table 5.7 (continued): Auxiliary indicators for Ireland
133
Table 5.8: Auxiliary indicators for Greece
134
Table 5.8 (continued): Auxiliary indicators for Greece
135
Table 5.9: Auxiliary indicators for Spain
136
Table 5.9 (continued): Auxiliary indicators for Spain
137
Table 5.10: Auxiliary indicators for France
138
Table 5.10 (continued): Auxiliary indicators for France
139
Table 5.11: Auxiliary indicators for Croatia
140
Table 5.11 (continued): Auxiliary indicators for Croatia
141
Table 5.12: Auxiliary indicators for Italy
142
Table 5.12 (continued): Auxiliary indicators for Italy
143
Table 5.13: Auxiliary indicators for Cyprus
144
Table 5.13 (continued): Auxiliary indicators for Cyprus
145
Table 5.14: Auxiliary indicators for Latvia
146
Table 5.14 (continued): Auxiliary indicators for Latvia
147
Table 5.15: Auxiliary indicators for Lithuania
148
Table 5.15 (continued): Auxiliary indicators for Lithuania
149
Table 5.16: Auxiliary indicators for Luxembourg
150
Table 5.16 (continued): Auxiliary indicators for Luxembourg
151
Table 5.17: Auxiliary indicators for Hungary
152
Table 5.17 (continued): Auxiliary indicators for Hungary
153
Table 5.18: Auxiliary indicators for Malta
154
Table 5.18 (continued): Auxiliary indicators for Malta
155
Table 5.19: Auxiliary indicators for Netherlands
156
Table 5.19 (continued): Auxiliary indicators for Netherlands
157
Table 5.20: Auxiliary indicators for Austria
158
Table 5.20 (continued): Auxiliary indicators for Austria
159
Table 5.21: Auxiliary indicators for Poland
160
Table 5.21 (continued): Auxiliary indicators for Poland
161
Table 5.22: Auxiliary indicators for Portugal
162
Table 5.22 (continued): Auxiliary indicators for Portugal
163
Table 5.23: Auxiliary indicators for Romania
164
Table 5.23 (continued): Auxiliary indicators for Romania
165
Table 5.24: Auxiliary indicators for Slovenia
166
Table 5.24 (continued): Auxiliary indicators for Slovenia
167
Table 5.25: Auxiliary indicators for Slovakia
168
Table 5.25 (continued): Auxiliary indicators for Slovakia
169
Table 5.26: Auxiliary indicators for Finland
170
Table 5.26 (continued): Auxiliary indicators for Finland
171
Table 5.27: Auxiliary indicators for Sweden
172
Table 5.27 (continued): Auxiliary indicators for Sweden
173
Table 5.28: Auxiliary indicators for United Kingdom
174
Table 5.28 (continued): Auxiliary indicators for United Kingdom
175
Chapter 6: Tables by year - MIP Scoreboard (base indicators)
176
Table 6.1: MIP Scoreboard (base indicators) 2016
176
Table 6.2: MIP Scoreboard (base indicators) 2015
177
Table 6.3: MIP Scoreboard (base indicators) 2014
178
Table 6.4: MIP Scoreboard (base indicators) 2013
179
Table 6.5: MIP Scoreboard (base indicators) 2012
180
Table 6.6: MIP Scoreboard (base indicators) 2011
181
Table 6.7: MIP Scoreboard (base indicators) 2010
182
Table 6.8: MIP Scoreboard (base indicators) 2009
183
Table 6.9: MIP Scoreboard (base indicators) 2008
184
Table 6.10: MIP Scoreboard (base indicators) 2007
185
Background information
This Statistical Annex to the 2018 Alert Mechanism Report (AMR 2018) presents the Macroeconomic Imbalance Procedure (MIP) scoreboard indicators and auxiliary indicators used in the economic reading of the MIP scoreboard. The MIP scoreboard and auxiliary indicators are mainly compiled by Eurostat, from the data transmitted by Member States, following European legislation. The MIP scoreboard indicators are presented with their indicative thresholds (used in the AMR) while no threshold is applied to the auxiliary indicators.
The policy framework of the MIP relies on timely and high quality socio-economic and financial statistics. Since the publication of the first Statistical Annex in 2012, significant progress has been achieved towards enhancing the standards and methods used for the compilation of underlying data as well as strengthening the statistical quality assurance framework.
The MIP Scoreboard consists of fourteen scoreboard indicators measuring internal and external imbalances as well as social and labour market developments. The MIP scoreboard indicators for the last ten years are displayed in this statistical annex by year in chapter 1, and by country in chapter 4. Table 1 lists the MIP scoreboard indicators together with detailed information on their data sources.
The cut-off date for the data, that is the date on which the data were extracted from the Eurostat database for the preparation of this document, was 24th October 2017. For additional information about the data, please contact
ESTAT-MIP@ec.europa.eu
.
Table 1. MIP scoreboard indicators (AMR 2018)
|
Indicator
|
Unit
|
Data source
|
Statistical domain
|
|
Current account balance (% of GDP)
|
3 year average
|
Eurostat
|
BoP/NA
|
|
Net international investment position
|
% of GDP
|
Eurostat
|
BoP/NA
|
|
Real effective exchange rate (42 trading partners, HICP deflator)
|
3 year % change
|
DG ECFIN
|
|
|
Export market share (% of world exports)
|
5 year % change
|
Eurostat, IMF
|
BoP
|
|
Nominal unit labour cost index (2010=100)
|
3 year % change
|
Eurostat
|
NA
|
|
House price index (2015=100), deflated
|
1 year % change
|
Eurostat
|
Price statistics / NA
|
|
Private sector credit flow, consolidated
|
% of GDP
|
Eurostat
|
NA (FA)
|
|
Private sector debt, consolidated
|
% of GDP
|
Eurostat
|
NA (FA)
|
|
General government gross debt
|
% of GDP
|
Eurostat
|
EDP/GFS
|
|
Unemployment rate
|
3 year average
|
Eurostat
|
EU-LFS
|
|
Total financial sector liabilities, non-consolidated
|
1 year % change
|
Eurostat
|
NA (FA)
|
|
Activity rate (% of total population aged 15-64)
|
3 year change in p.p.
|
Eurostat
|
EU-LFS
|
|
Long-term unemployment rate (% of active population aged 15-74)
|
3 year change in p.p.
|
Eurostat
|
EU-LFS
|
|
Youth unemployment rate (% of active population aged 15-24)
|
3 year change in p.p.
|
Eurostat
|
EU-LFS
|
Note: NA- National Accounts; BoP – Balance of Payments; FA – Financial Accounts; GFS – Government Finance Statistics; and LFS – Labour Force Survey/Labour Market Statistics; p.p. – percentage points
Supplementing the MIP scoreboard indicators, a list of 28 auxiliary indicators (see Table 2) provides additional information on aspects linked to the general macroeconomic situation, nominal and real convergence inside and outside the European Union and the euro area, detailed data on external liabilities, including foreign direct investment and net external debt, and social statistics. The auxiliary indicators enhance the information base for understanding potential imbalances, as well as the adjustment capacity of the economy. The auxiliary indicators are also presented in this Statistical Annex by year (in Chapter 2) and by country (in Chapter 5).
Table 2. MIP auxiliary indicators (AMR 2018)
|
Indicator
|
Unit
|
Data source
|
Statistical domain
|
|
Real GDP
|
1 year % change
|
Eurostat
|
NA
|
|
Gross fixed capital formation
|
% of GDP
|
Eurostat
|
NA
|
|
Gross domestic expenditure on R&D
|
% of GDP
|
Eurostat
|
Business Statistics/ NA
|
|
Current plus capital account (Net lending-borrowing)
|
% of GDP
|
Eurostat
|
BoP/NA
|
|
Net external debt
|
% of GDP
|
Eurostat
|
BoP/ NA
|
|
Foreign direct investment in the reporting economy – net inward flows
|
% of GDP
|
Eurostat
|
BoP/NA
|
|
Foreign direct investment in the reporting economy - stocks
|
% of GDP
|
Eurostat
|
BoP/NA
|
|
Net trade balance of energy products
|
% of GDP
|
Eurostat
|
International Trade/ NA
|
|
Real effective exchange rates – euro area trading partners
|
3 year % change
|
DG ECFIN
|
|
|
Export performance against advanced economies
|
5 year % change
|
Eurostat/OECD
|
BoP
|
|
Terms of trade
|
5 year % change
|
Eurostat
|
NA
|
|
Export market share - in volume
|
1 year % change
|
Eurostat /IMF
|
|
|
Labour productivity
|
1 year % change
|
Eurostat
|
NA
|
|
Nominal unit labour cost index (2010=100)
|
10 year % change
|
Eurostat
|
NA
|
|
Unit labour cost performance relative to euro area
|
10 year % change
|
DG ECFIN
|
|
|
House price index (2015=100) - nominal
|
3 year % change
|
Eurostat
|
Price statistics / NA
|
|
Residential construction
|
% of GDP
|
Eurostat
|
NA
|
|
Private sector debt, non-consolidated
|
% of GDP
|
Eurostat
|
NA (FA)
|
|
Financial sector leverage, non-consolidated
|
% debt to equity
|
Eurostat
|
NA (FA)
|
|
Employment rate
|
1 year % change
|
Eurostat
|
NA
|
|
Activity rate
|
% of total population aged 15-64
|
Eurostat
|
EU-LFS
|
|
Long term unemployment rate
|
% of active population aged 15-74
|
Eurostat
|
EU-LFS
|
|
Youth unemployment rate
|
% of active population aged 15-24
|
Eurostat
|
EU-LFS
|
|
Young people neither in employment nor in education and training
|
% of total population aged 15-24
|
Eurostat
|
EU-LFS
|
|
People at risk of poverty or social exclusion
|
% of total population
|
Eurostat
|
EU-SILC
|
|
People at risk of poverty after social transfers
|
% of total population
|
Eurostat
|
EU-SILC
|
|
Severely materially deprived people
|
% of total population
|
Eurostat
|
EU-SILC
|
|
People living in households with very low work intensity
|
% of total population aged 0-59
|
Eurostat
|
EU-SILC
|
Note: NA- National Accounts; BoP – Balance of Payments; FA – Financial Accounts; LFS – Labour Force Survey/Labour Market Statistics; SILC – Statistics on Income and Living Conditions; p.p. – percentage points
In Chapter 3, the data are presented by indicator to allow easy comparisons of Member States for the 10-year time series. In addition, short descriptions of the indicators as well as detailed information on sources and methods employed for their compilation are provided.
Statistical methodology improvements
Since 2014, MIP indicators stemming from the National Accounts (NA) and Balance of Payments (BoP) and International Investment Position (IIP) domains are computed following the ESA 2010 and BPM6 statistical standards (the European System of Accounts 2010 and the Balance of Payments and International Investment Position Manual, sixth edition) that guarantee a high level of comparability across the European Union Member States. The successful implementation of these standards improved the quality of the MIP underlying data.
In particular, concerning indicators from the Balance of Payments and International Investment Position, the revision of international standards and changeover to BPM6 was translated into new data requirements via the adoption of
Commission Regulation (EU) No 555/2012
and ECB Guideline (ECB/2011/23). According to the legislation, Member States shall submit to the Commission (Eurostat) data following the BPM6 requirements from 2014 onwards only. The length of time series available for the computation of MIP indicators based on the BPM6 might then be limited.
However, in order to maintain comparability over time, the majority of countries have back-calculated the main BoP time series according to the new standards. As the transmission of back data by Member States is voluntary, a few data gaps remained for a minority of countries. In order to enlarge data coverage and support policy analysis, Eurostat has taken measures in close cooperation with Member States to improve the situation with regard to the availability of BoP/IIP back data, including through targeted grants. Moreover, Eurostat has complemented Member States' efforts by producing some estimates which were then approved by the concerned Member States. As a result, data coverage for the ten years timespan needed for this year's Statistical Annex (2007-2016) has improved substantially and coverage is almost complete, with just one 2007 value missing for the Export market shares indicator, due to its definition which requires a longer time series.
Following the adoption of the new statistical standards, some BoP series have been discontinued at national level. Therefore, values for the MIP auxiliary indicator on Net external debt could not be made available for the United Kingdom.
The implementation of the standards ensures conceptual consistency between National Accounts and Balance of Payments/ International Investment Position. However, in practice, differences in the different components of the accounts (the BoP/IIP and NA Rest of the world data) still persist.
Eurostat has further elaborated on the reconciliation of the Balance of Payments and the Rest of the World (RoW) account at national level. After the implementation of the BPM6 methodology in 2014, Eurostat has regularly assessed the state of consistency between Balance of Payments and National Accounts statistics, with a focus on the nonfinancial accounts. In order to maximize efforts at European level, Eurostat contributed to a Task Force on the Consistency between NA and BoP, which was established at the beginning of 2016 by the Committee for Monetary, Financial and Balance of Payments statistics (CMFB). The purpose of this Task Force is to determine the discrepancies between these two datasets, identify the reasons behind these discrepancies, and make recommendations for addressing them.
Additional changes in 2017
The introduction of ESA 2010 ensured the consistency of GDP compilation with the international standards for National Accounts, hence leading to a better comparability not only across European Union countries but also on a global basis. However, some challenges remain in relation to globalisation, for example the impact on GDP of the relocation of business of large multinational enterprises in small and open economies.
Moreover, a common harmonised European revision policy for National Accounts and balance of payments statistics covering benchmark and routine revisions has been recently agreed and its implementation has started on a voluntary basis. The policy includes differentiated guidelines regarding the timing and depth of revisions to quarterly and annual data. It aims at improving adherence to the twofold principle of alignment at national level between statistical domains and coordinated alignment at European Union level across the countries.
In the Balance of Payments domain, progress has been registered concerning the asymmetries in trade in goods and services. To address the problem of asymmetries in mirror trade data, Eurostat organized several workshops in the course of 2016 and 2017 with Member States. During these workshops, experts from Member States had the opportunity to exchange experiences, discuss bilaterally and decide on specific actions to resolve their corresponding trade asymmetries. Due to the implementation of methodological improvements in 2017, the IIP of Belgium has been revised backwards.
In the domain of Financial Accounts, most remaining derogations of countries were due to expire with the official data transmission at end-September 2017. However, these have a very limited impact on the subsector and instrument breakdowns of the MIP indicators based on Financial Accounts. Moreover, in Luxembourg improvements in sources and methods have permitted to enhance data quality by improving compliance with ESA 2010 for recent years, and resulting in large revisions. Furthermore, the length of the time series has been extended back to 2002.
Concerning House Prices, starting with the release of the first quarter 2017 data, the reference year of the House Price Index (HPI) series was changed from 2010 to 2015, as provided for in Regulation (EU) 2016/792. As a consequence, the deflated HPI was also re-referenced to 2015=100. Due to the change of the reference year, a small proportion of the published rates for the HPI were revised by plus or minus 0.1 percentage points.
From 2014 France started extending the Labour Force Survey to its overseas departments and regions (DROM) - Guadeloupe, Martinique, Guyane, La Réunion, and Mayotte. Due to the different situation of the labour market in these regions, breaks in the time series of the MIP indicators calculated on the LFS data occurred and back-calculations were needed in order to ensure a consistent time series. The transition is now complete and all LFS indicators are available for the last twelve years according to the extended geographical definition. Therefore, from 2017 all LFS indicators, including the change in activity rate and the change in long term unemployment rate, refer to France including its overseas departments and regions. The impact of this change is expected to be limited. As a measure of the impact, the 2015 long term unemployment rate indicator released in October 2016 was 0.6 pp; this value has been revised to 0.5 as a consequence of the inclusion of the DROM. Analogously the MIP activity rate indicator has been revised from 0.8 pp. to 1.00 pp.
General Government Gross Debt data notified for the years 2013 to 2016 have been released on 23rd October 2017 within the EDP notification. In the context of the notification of government deficit and debt, Eurostat expressed reservations on reported data of France, Belgium and Hungary. For more information on reservations and main revisions between the April 2017 and the October 2017 notifications please see the latest
EDP news release
.
Improving the quality framework and ongoing work
The credibility of the MIP and its smooth implementation depends critically on the availability and quality of the MIP underlying statistics. The statistics used in the procedure have to be fit for the purpose, reliable and comparable among Member States and in time. For that reason, the scoreboard indicators are regularly reviewed; the underlying statistical methodology and the statistical production processes are constantly improved. Statistics underlying the MIP indicators are based on European Union legislation and compiled by the European Statistical System (ESS) and in part by the European System of Central Banks (ESCB).
In 2016, the Economic and Financial Affairs Council (ECOFIN) recalled that the MIP must rely upon sound and harmonised official statistics and since 2011 it had emphasised the importance of close cooperation between the ESS and the ESCB in assessing the reliability of the statistics underlying the MIP and improving their quality. Following the invitation of the Council to take all necessary initiatives to assure a reliable procedure for the compilation of MIP indicators as well as a continuous improvement of the underlying statistical information, a Memorandum of Understanding was signed between Eurostat and the Directorate General Statistics of the European Central Bank in November 2016. The Memorandum of understanding mutually recognises the respective quality assurance frameworks and enables an even closer cooperation on the respective quality reports in the field of BoP/IIP and Financial Accounts.
The quality assurance framework, developed jointly by Eurostat and the Directorate General Statistics of the European Central Bank, follows a three-level structure. In this framework, the work performed in 2017 consisted of the following actions:
·Level 1: preparation of an annual ESS-ESCB quality assessment report on MIP statistics by Eurostat and the ECB towards the European Parliament and Council, policy makers and the public at large. It aims at assessing the reliability and comparability of MIP underlying statistics and at addressing actions to address most relevant quality issues; the third report has been prepared in 2017 and will be published on the CMFB
website
.
·Level 2: domain-specific quality reports produced by Eurostat and the ECB summarising the main findings for the euro area or the European Union Member States. These reports assess the underlying compilation process and its robustness, describe its legal basis and evaluate whether the statistics are in line with international statistical standards. The coverage of level 2 reports has been significantly improved in 2017; the following level 2 reports are currently available:
-Balance of Payments and International Investment Position statistics (
ECB
,
Eurostat
)
-Financial Accounts (
ECB
)
-Housing Price Indicators (
Eurostat
)
-Labour Force Survey (
Eurostat
)
Work towards harmonization of the existing Quality Reports on Balance of Payment/International Investment Position produced by the ESS and the ESCB taking into account MIP requirements is ongoing. In the area of National Accounts, after the adoption of an implementing act, an annual quality reporting by Member States started in 2017 and will progressively be extended by 2021; it also covers data underlying the MIP indicators.
In addition, the Commission (DG ECFIN), in its capacity as compiler of the Real Effective Exchange Rate (REER) indicator, publishes quality information on real effective exchange rate indicators on its website
.
·Level 3: development of condensed country specific self-assessment reports on the quality and statistical processes for statistics underlying the MIP indicators which are easily understandable by users. They should provide the basis for assuring the quality of the statistics and their comparability across countries. Member States are encouraged to publish such reports. In 2016 information for the statistical domains Balance of Payments and International Investment Position, Financial Accounts, Housing Price statistics and the Labour Force Survey were prepared for almost all countries. Updated versions of these national reports are being drafted and they will be published on the CMFB website when available.
Moreover, in the context of the Memorandum of Understanding, joint ECB-Eurostat visits are planned to the Member States. The focus will be on BoP and Financial Accounts. The first joint visits are envisaged to take place during the fourth quarter of 2017.
Chapter 1: Tables by year - Headline indicators
Table 1.1: MIP Scoreboard 2016

Table 1.2: MIP Scoreboard 2015

Table 1.3: MIP Scoreboard 2014

Table 1.4: MIP Scoreboard 2013

Table 1.5: MIP Scoreboard 2012

Table 1.6: MIP Scoreboard 2011

Table 1.7: MIP Scoreboard 2010

Table 1.8: MIP Scoreboard 2009

Table 1.9: MIP Scoreboard 2008

Table 1.10: MIP Scoreboard 2007

Chapter 2: Tables by year - Auxiliary indicators used in the economic reading of the MIP scoreboard
Table 2.1: Auxiliary indicators, 2016

Table 2.1 (continued): Auxiliary indicators, 2016

Table 2.2: Auxiliary indicators, 2015

Table 2.2 (continued): Auxiliary indicators, 2015

Table 2.3: Auxiliary indicators, 2014

Table 2.3 (continued): Auxiliary indicators, 2014

Table 2.4: Auxiliary indicators, 2013

Table 2.4 (continued): Auxiliary indicators, 2013

Table 2.5: Auxiliary indicators, 2012

Table 2.5 (continued): Auxiliary indicators, 2012

Table 2.6: Auxiliary indicators, 2011

Table 2.6 (continued): Auxiliary indicators, 2011

Table 2.7: Auxiliary indicators, 2010

Table 2.7 (continued): Auxiliary indicators, 2010

Table 2.8: Auxiliary indicators, 2009

Table 2.8 (continued): Auxiliary indicators, 2009

Table 2.9: Auxiliary indicators, 2008

Table 2.9 (continued): Auxiliary indicators, 2008

Table 2.10: Auxiliary indicators, 2007

Table 2.10 (continued): Auxiliary indicators, 2007

Chapter 3: Tables by indicator
Table 3.1: Current account balance, % of GDP (3 year average)

Table 3.2: Current account balance (% of GDP)

Table 3.3: Net International Investment Position (% of GDP)

Table 3.4: Real effective exchange rate - 42 trading partners, HICP deflator (3 year % change)

Table 3.5: Real effective exchange rate - 42 trading partners, HICP deflator (1 year % change)

Table 3.6: Export market share - % of world exports (5 year % change)

Table 3.7: Export market share - % of world exports (1 year % change)

Table 3.8: Nominal unit labour cost index, 2010=100 (3 year % change)

Table 3.9: Nominal unit labour cost index, 2010=100 (1 year % change)

Table 3.10: House price index (2015=100), deflated (1 year % change)

Table 3.11: Private sector credit flow, consolidated (% of GDP)

Table 3.12: Private sector debt, consolidated (% of GDP)

Table 3.13: General government gross debt (% of GDP)

Table 3.14: Unemployment rate (3 year average)

Table 3.15: Unemployment rate (%)

Table 3.16: Total financial sector liabilities, non-consolidated (1 year % change)

Table 3.17: Total financial sector liabilities, non-consolidated (Millions NC)

Table 3.18: Activity rate - % of total population aged 15-64 (3 year change in p.p.)

Table 3.19: Activity rate - % of total population aged 15-64

Table 3.20: Long-term unemployment rate - % of active population aged 15-74 (3 year change in p.p.)

Table 3.21: Long-term unemployment rate - % of active population aged 15-74

Table 3.22: Youth unemployment rate - % of active population aged 15-24 (3 year change in p.p.)

Table 3.23: Youth unemployment rate - % of active population aged 15-24

Table 3.24: Real GDP (1 year % change)

Table 3.25: Gross fixed capital formation (% of GDP)

Table 3.26: Gross domestic expenditure on R&D (% of GDP)

Table 3.27: Current plus capital account - Net lending-borrowing (% of GDP)

Table 3.28: Net external debt (% of GDP)

Table 3.29: Foreign direct investment in the reporting economy - flows (% of GDP)

Table 3.30: Foreign direct investment in the reporting economy - stocks (% of GDP)

Table 3.31: Net trade balance of energy products (% of GDP)

Table 3.32: Real effective exchange rate - Euro Area trading partners (3 year % change)

Table 3.33: Export performance against advanced economies (5 year % change)

Table 3.34: Terms of trade (5 year % change)

Table 3.35: Export market share, volume (1 year % change)

Table 3.36: Real labour productivity (1 year % change)

Table 3.37: Nominal unit labour cost index, 2010=100 (10 year % change)

Table 3.38: Unit labour cost performance relative to EA (10 year % change)

Table 3.39: House price index (2015=100) - nominal (3 year % change)

Table 3.40: Residential construction (% of GDP)

Table 3.41: Private sector debt, non-consolidated (% of GDP)

Table 3.42: Financial sector leverage (debt-to-equity), non-consolidated (%)

Table 3.43: Employment rate (1 year % change)

Table 3.44: Young people neither in employment nor in education and training - % of total population aged 15-24

Table 3.45: People at risk of poverty or social exclusion - % of total population

Table 3.46: People at risk of poverty after social transfers - % of total population

Table 3.47: Severely materially deprived people - % of total population

Table 3.48: People living in households with very low work intensity - % of total population aged 0-59

Chapter 4: Tables by Member States - Headline indicators
Table 4.1: The MIP scoreboard for Belgium

Table 4.2: The MIP scoreboard for Bulgaria

Table 4.3: The MIP scoreboard for Czech Republic

Table 4.4: The MIP scoreboard for Denmark

Table 4.5: The MIP scoreboard for Germany

Table 4.6: The MIP scoreboard for Estonia

Table 4.7: The MIP scoreboard for Ireland

Table 4.8: The MIP scoreboard for Greece

Table 4.9: The MIP scoreboard for Spain

Table 4.10: The MIP scoreboard for France

Table 4.11: The MIP scoreboard for Croatia

Table 4.12: The MIP scoreboard for Italy

Table 4.13: The MIP scoreboard for Cyprus

Table 4.14: The MIP scoreboard for Latvia

Table 4.15: The MIP scoreboard for Lithuania

Table 4.16: The MIP scoreboard for Luxembourg

Table 4.17: The MIP scoreboard for Hungary

Table 4.18: The MIP scoreboard for Malta

Table 4.19: The MIP scoreboard for Netherlands

Table 4.20: The MIP scoreboard for Austria

Table 4.21: The MIP scoreboard for Poland

Table 4.22: The MIP scoreboard for Portugal

Table 4.23: The MIP scoreboard for Romania

Table 4.24: The MIP scoreboard for Slovenia

Table 4.25: The MIP scoreboard for Slovakia

Table 4.26: The MIP scoreboard for Finland

Table 4.27: The MIP scoreboard for Sweden

Table 4.28: The MIP scoreboard for United Kingdom

Chapter 5: Tables by Member States - Auxiliary indicators used in the economic reading of the MIP scoreboard
Table 5.1: Auxiliary indicators for Belgium

Table 5.1 (continued): Auxiliary indicators for Belgium

Table 5.2: Auxiliary indicators for Bulgaria

Table 5.2 (continued): Auxiliary indicators for Bulgaria

Table 5.3: Auxiliary indicators for Czech Republic

Table 5.3 (continued): Auxiliary indicators for Czech Republic

Table 5.4: Auxiliary indicators for Denmark

Table 5.4 (continued): Auxiliary indicators for Denmark

Table 5.5: Auxiliary indicators for Germany

Table 5.5 (continued): Auxiliary indicators for Germany

Table 5.6: Auxiliary indicators for Estonia

Table 5.6 (continued): Auxiliary indicators for Estonia

Table 5.7: Auxiliary indicators for Ireland

Table 5.7 (continued): Auxiliary indicators for Ireland

Table 5.8: Auxiliary indicators for Greece

Table 5.8 (continued): Auxiliary indicators for Greece

Table 5.9: Auxiliary indicators for Spain

Table 5.9 (continued): Auxiliary indicators for Spain

Table 5.10: Auxiliary indicators for France

Table 5.10 (continued): Auxiliary indicators for France

Table 5.11: Auxiliary indicators for Croatia

Table 5.11 (continued): Auxiliary indicators for Croatia

Table 5.12: Auxiliary indicators for Italy

Table 5.12 (continued): Auxiliary indicators for Italy

Table 5.13: Auxiliary indicators for Cyprus

Table 5.13 (continued): Auxiliary indicators for Cyprus

Table 5.14: Auxiliary indicators for Latvia

Table 5.14 (continued): Auxiliary indicators for Latvia

Table 5.15: Auxiliary indicators for Lithuania

Table 5.15 (continued): Auxiliary indicators for Lithuania

Table 5.16: Auxiliary indicators for Luxembourg

Table 5.16 (continued): Auxiliary indicators for Luxembourg

Table 5.17: Auxiliary indicators for Hungary

Table 5.17 (continued): Auxiliary indicators for Hungary

Table 5.18: Auxiliary indicators for Malta

Table 5.18 (continued): Auxiliary indicators for Malta

Table 5.19: Auxiliary indicators for Netherlands

Table 5.19 (continued): Auxiliary indicators for Netherlands

Table 5.20: Auxiliary indicators for Austria

Table 5.20 (continued): Auxiliary indicators for Austria

Table 5.21: Auxiliary indicators for Poland

Table 5.21 (continued): Auxiliary indicators for Poland
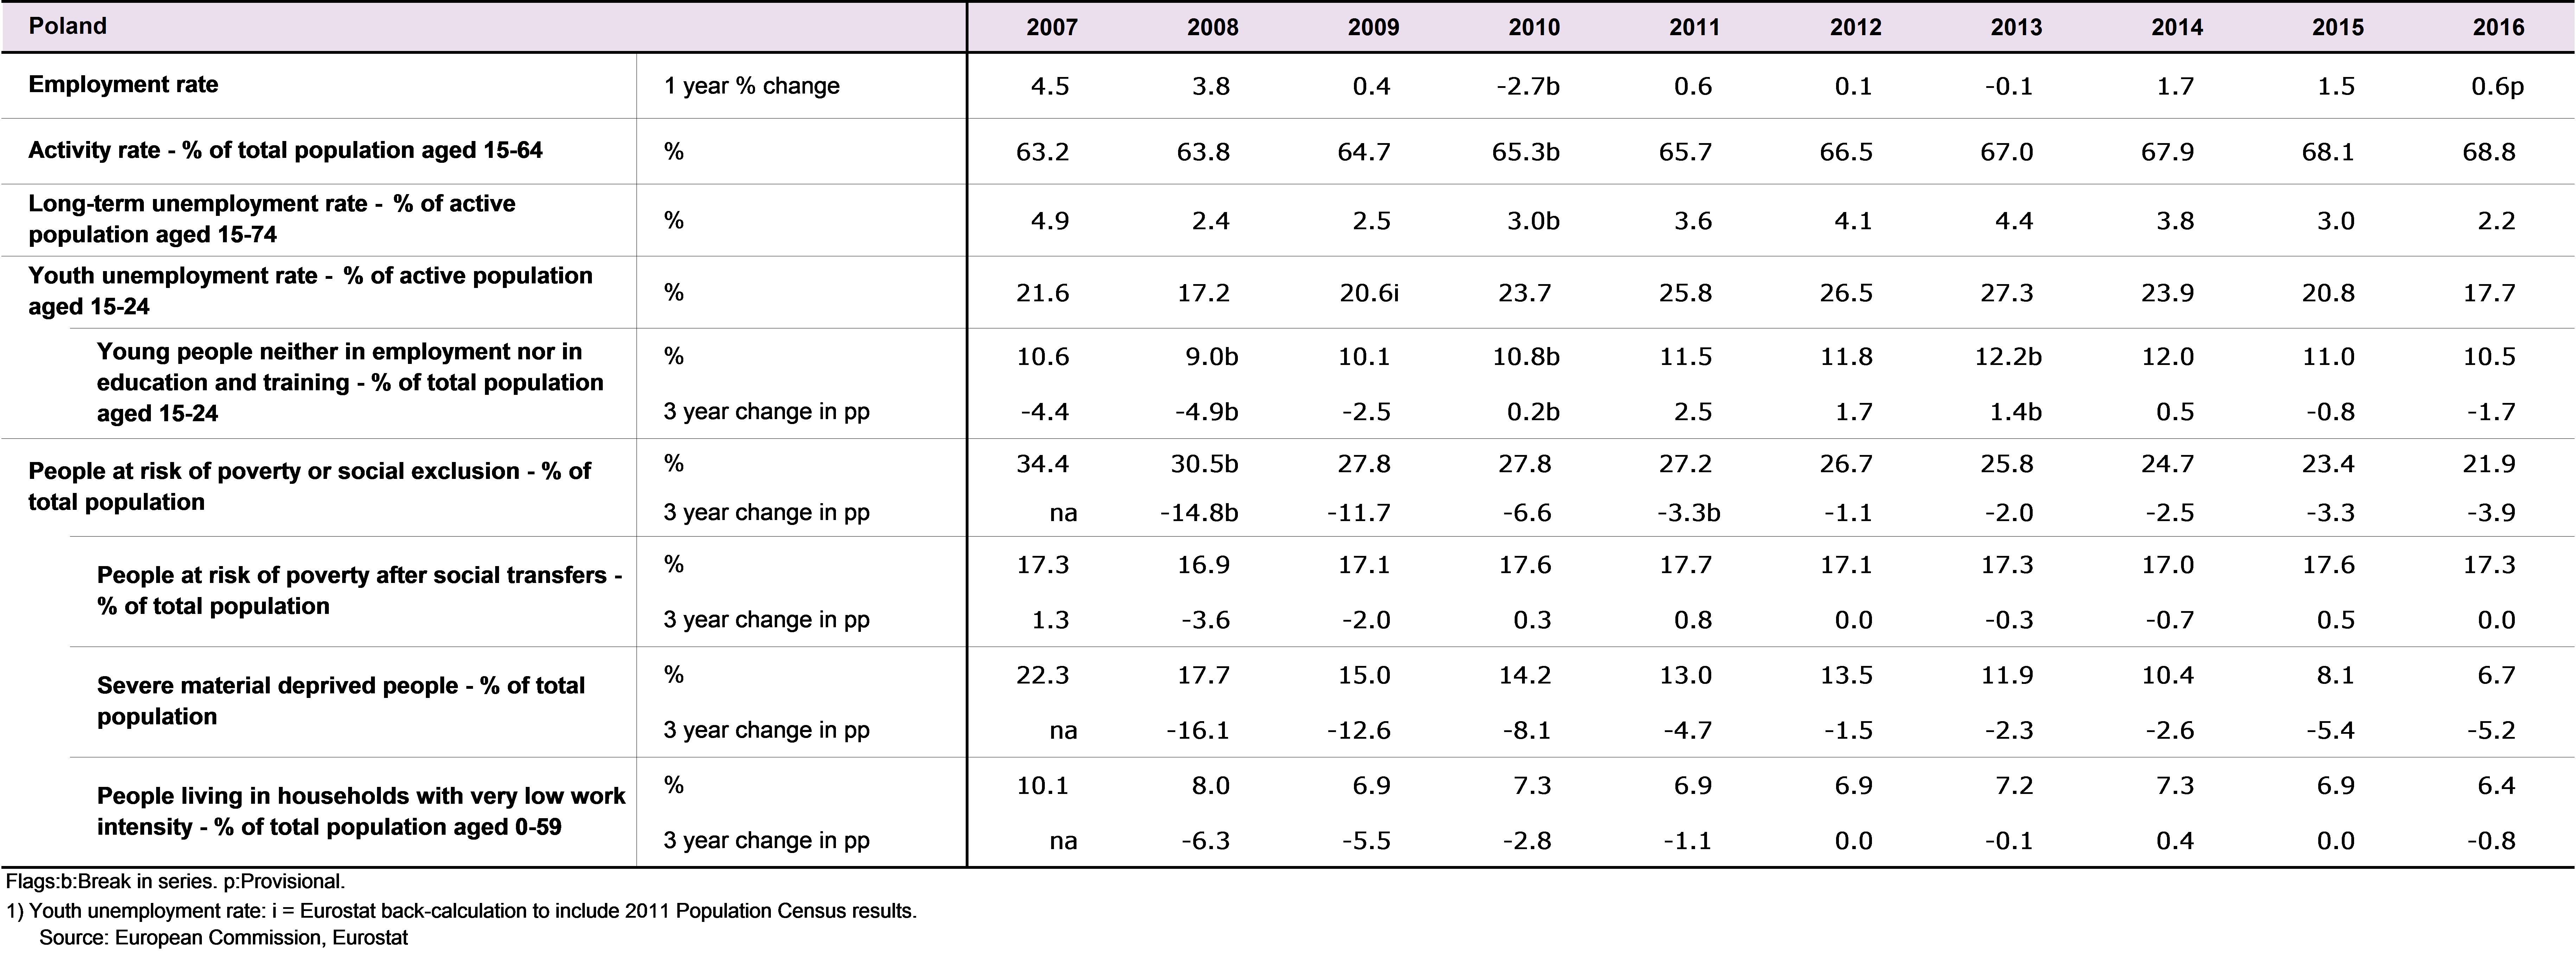
Table 5.22: Auxiliary indicators for Portugal

Table 5.22 (continued): Auxiliary indicators for Portugal

Table 5.23: Auxiliary indicators for Romania

Table 5.23 (continued): Auxiliary indicators for Romania

Table 5.24: Auxiliary indicators for Slovenia

Table 5.24 (continued): Auxiliary indicators for Slovenia

Table 5.25: Auxiliary indicators for Slovakia

Table 5.25 (continued): Auxiliary indicators for Slovakia

Table 5.26: Auxiliary indicators for Finland

Table 5.26 (continued): Auxiliary indicators for Finland

Table 5.27: Auxiliary indicators for Sweden

Table 5.27 (continued): Auxiliary indicators for Sweden

Table 5.28: Auxiliary indicators for United Kingdom

Table 5.28 (continued): Auxiliary indicators for United Kingdom

Chapter 6: Tables by year - MIP Scoreboard (base indicators)
Table 6.1: MIP Scoreboard (base indicators) 2016

Table 6.2: MIP Scoreboard (base indicators) 2015

Table 6.3: MIP Scoreboard (base indicators) 2014

Table 6.4: MIP Scoreboard (base indicators) 2013

Table 6.5: MIP Scoreboard (base indicators) 2012

Table 6.6: MIP Scoreboard (base indicators) 2011

Table 6.7: MIP Scoreboard (base indicators) 2010

Table 6.8: MIP Scoreboard (base indicators) 2009

Table 6.9: MIP Scoreboard (base indicators) 2008

Table 6.10: MIP Scoreboard (base indicators) 2007


