 EUROPEAN COMMISSION
Brussels, 17.11.2021
SWD(2021) 331 final
COMMISSION STAFF WORKING DOCUMENT
IMPACT ASSESSMENT
Accompanying the document
Proposal for a regulation of the European Parliament and of the Council
on shipments of waste and amending Regulations (EU) No 1257/2013 and (EU) No 2020/1056
{COM(2021) 709 final} - {SEC(2021) 402 final} - {SWD(2021) 330 final} - {SWD(2021) 332 final}
Table of contents
Annex 1: Procedural information
Annex 2: Stakeholder consultation
Annex 3: In depth analysis of the public consultations outcome
Annex 4: Who is affected and how – overview of costs and benefits
Annex 5: Analytical methods
1.Datasets
2.Supporting study
3.Analysis of impacts
1.1.Baseline
1.2.Modelling economic impacts
1.2.1.
Modelling economic impacts for measures on intra-EU shipments of waste (objective 1)
1.2.2.
Modelling economic impact for measures linked to the export of waste (objective 2)
1.3.Modelling environmental impacts
i)
General approach pursued to evaluate the environmental impacts of measures linked to the export of waste
ii)
Methodology and modelling used to evaluate the environmental impact of the differences of treatment of “rejects” in the EU and in third countries
iii)
Methodology and modelling used to evaluate the environmental impact of the shipping of waste to third countries
iv)
Results of the modelling of quantifications of environmental impact linked to the treatment of rejects and to the shipping of waste to third countries, for measures 2c and 2d, as well as discarded measures on banning exports of waste
1.4.Modelling social impacts
Annex 6: Summary of the Evaluation
Annex 7: Facts, figures and trends in waste Shipments
1.Key figures on the waste treatment sector in the EU
2.Key figures on shipments of waste within the EU and outside the EU
3.Exports outside the EU
4.Key figures on capacity for the EU industry to process additional volume of waste
Annex 8: Problem drivers
Annex 9: Detailed description of measures
Annex 10: Moving to a mandatory use of electronic means to interchange data
Annex 11: International legal context applicable to measures with an impact on export of waste
Annex 12: Impacts of measures
1.Rating of measures and options
2.Impacts of measures on Commission resources
Annex 13: The relationship between the WSR and the EU Regulation on Ship Recycling
Annex 14: How the Preferred option achieves the objectives for this review
8.1.1 Objective 1: Facilitate shipments within the EU, in particular to align the WSR with circular economy objectives
8.1.2 Objective 2: Guarantee that waste exported outside the EU is managed in an environmentally sound manner
8.1.3 Objective 3: Better address illegal shipments of waste within the EU as well as illegal exports to third countries
Annex 1: Procedural information
1.Lead DG, Decide Planning/CWP references
The impact assessment has been coordinated by the European Commission's Directorate-General (DG) for Environment supported by an inter-service steering group (ISG) involving representatives of DG Internal Market, Industry, Entrepreneurship and SMEs, DG Taxation and Customs Union, DG Justice and Consumers, DG Health and Food Safety, DG Climate Action, DG Trade, DG Mobility and Transport, DG Migration and Home Affairs, DG International Cooperation and Development, the European Anti-Fraud Office, the Joint Research Centre, the Legal Service and the Secretariat-General. The group steered and monitored the impact assessment’s development and ensured that it met the necessary standards for quality, impartiality and usefulness.
It was included as PLAN/2019/5394 in the DECIDE/Agenda Planning database.
2.Organisation and timing
The inception impact assessment was published on 11 March 2020 and feedback on this inception impact assessment was received until 8 April 2020. Feedback from 81 stakeholders, including Member States competent authorities was received.
The stakeholder consultation strategy was prepared and made publicly available on 7 May 2020. It set a number or consultation activities comprising a public consultation and targeted consultation in the form of interviews and surveys. While a detailed consultation synopsis is provided in Annex 2, a brief explanation of consultation activities follows here.
The open public consultation started on 7 May 2020 and ended on 30 July 2020. To maximise the response rate, a link to the questionnaires was placed on the Consultations page within the EUROPA Website,
and several organisations were also contacted directly and asked to help disseminate the link to the questionnaire. The public consultation triggered 295 responses. 11 interviews were carried out among Member States and other stakeholders. A workshop, gathering around 90 participants, was held on 23 and 24 September 2020 to actively involve Member State competent authorities and stakeholders. Finally, a number of ad hoc contributions was received (more details in Annex 2).
The inter-service group met at the inception and interim stages of the impact assessment work and provided guidance and comments on draft reports. During the inception phase of the study, the inter-service group was consulted to provide input to the problem definition of the study. It met on 18 September 2020 ahead of the stakeholder workshop, as well as on 3rd and 22 February 2021 to discuss the draft staff working document on the impact assessment of the WSR. Several comments were sent by different DGs, which were taken into account in the development of the version of the impact assessment report submitted to the RSB for the meeting of 7 April 2021.
A Europa webpage was set up to provide information on the review process
.
3.Consultation of the RSB
An upstream online meeting with the Regulatory Scrutiny Board (RSB) was held on 24 March 2020. The resulting advice was taken into account in the subsequent work and in drafting the impact assessment report, which was sent on 5 March 2021 to the RSB. A meeting was held on 7 April 2021 with the Board to present and discuss the draft impact assessment report. The negative opinion of the Board was received on 9 April 2021 and a revised version of the report taking into account the elements brought forward in this opinion, was submitted to the Board on 7 May 2021. The positive opinion of the Board was received on 4 June 2021 and taken into consideration in the final report.
The table below presents the points listed in Section C “What to improve” of the RSB opinions and how these have been addressed. The first table presents the points from the negative opinion while the second table presents the futher points of improvement suggested in the positive opinion.
Table A-1: Points to imprve from negative RSB opinion 9 April 2021
|
What to improve
|
Response
|
|
(1) The report should strengthen the analysis of the most significant problems, bringing in selected evidence from the annex. It should not consider profit-maximising behaviour by economic agents active in waste shipment as a problem driver. The reinforced problem analysis should permit a clearer link to be established with the various proposed measures and a strengthened intervention logic.
|
To clarify the links between the problems (including their drivers and consequences), objectives, policy options and measures, the charts in sections 2 and 6 have been amended and are now aligned with each other. Additional information and key evidence on the problem drivers were included into section 2 of the main report (from Annex 8) to support this logic.
|
|
|
With regard to the role of profit-maximisation in driving the unsustainable treatment of waste exported outside the EU, the report was modified in order to clarify that the actual drivers in this respect are the lack of internalisation of environmental costs in some third countries and the insufficient clarity in the current regulation. The attractive prices obtained by EU-based traders for exporting waste are indeed to a large extent due to the lack of internalisation of environmental costs in third countries. The new formulation is better aligned with the objective of the review to improve the management of waste in these countries.
|
|
(2) The report should restructure the options in a clearer way. This could be done either by:
a) turning the various measures into (sets of) options that would be structured around the three main problems, or
b) keeping the current two ‘high level’ options, while adding the preferred set of measures as an alternative option upfront, making it an integral part of the impact analysis.
The report should clarify in the options which measures are complementary and which are exclusive, what trade-offs they contain, and what the fundamental policy choices for the policy makers are.
|
In addition to the baseline, section 6.3 of the report now presents three options with different combinations of measures. In this manner the report integrates the preferred option upfront, as a distinct option, as suggested in the opinion by the RSB. The report also explains better in section 6.1 and in the chart in section 6 where the measures would complement each other and where they are alternatives to other measures.
|
|
(3) The report should better justify the expected increase of waste exports under the baseline scenario, taking into account recent declining trends and the increasing reluctance of third countries to import waste.
|
A linear regression model based on the trends in the export of waste outside the EU in the last 15 years, was used to project the export of waste outside the EU in the baseline scenario until 2030. The export of waste depends on a large number of factors (waste generation growth, prices of commodities on the international market, demand for domestic waste in the EU, import rules in third countries) so these figures should be considered indicative. The reluctance of some third countries to import waste is one important factor explaining the recent past declines observed for certain waste streams, but it will not necessarily lead to a continuous downwards trend of exports. It is likely to lead to shifts of exports to other countries (like has been the case lately with Turkey becoming one of the main importers of plastic waste since enhanced import restrictions in South East Asia). Data recently published by Eurostat for 2020 indicates that export of waste has gone up compared to 2019.
|
|
(4) Each option should be impact assessed and compared against the standard assessment criteria (effectiveness, efficiency, coherence). The report should be clearer about the foreseen impacts on waste shipping operators, on supply chains and on the treatment sector.
It should specify the impacts across Member States and on SMEs. Trade-offs between business concerns and environmental objectives should be made more transparent. The report should further clarify the impacts on public authorities and how effective enforcement will be ensured. The proportionality of the preferred option should be assessed in light of the scale of the problem and the expected costs and benefits.
|
New elements were included in Annex 12, which provide an analysis of the impacts of the different measures contained in each policy option, against the standard assessment criteria. These elements are used to support the comparison of each policy option in section 7.2. (“how do the options compare”), which has also been completely rewritten and includes now a more in-depth comparison of the impact of the different options.
Additional elements were included in section 8 to strengthen the analysis of the proportionality of the preferred option, as well as its impact on SMEs. Overall, these changes allow for a deeper analysis of the impact of the “preferred option”.
|
|
(5) The report should clarify stakeholders’ positions on the preferred option and explain how concerns have been addressed.
|
For each of the measures assessed in section 7.1, the stakeholders’ views have been clarified. Section 8 also includes new elements on how the concerns of stakeholders have been accommodated in the preferred option.
|
Table A-2: Points to improve from positive RSB opinion 4 June 2021
|
What to improve
|
Response
|
|
(1) The report should introduce an overview table summarising how the different options compare against all assessment criteria, drawing on the annex. It should better justify the scores given to the measures’ impacts. The applied scoring method in annex seems to favour measures with some impacts across the assessment criteria over measures that very 2 effectively target only one criterion. The report should explain to what extent this is appropriate.
|
Table 9 was introduced in section 7.2 of the main report. It presents an overview of how options compare . It is based on the table in Annex 12 but provides an overall assessment of each option.
Further explanations were provided in the report on how the scoring takes into account the different criteria.
|
|
(2) The report should better argue why the combination of measures in the preferred option is optimal. Under the applied scoring method, it seems possible to construct a combination of measures that would yield a higher average score.
|
Additional explanations were provided on why the combination of measures in the preferred option is optimal. It is important to consider that the policy options were constructed as internally consistent packages of measures and this was clarified in the text.
|
|
(3) The baseline is based on estimates of waste exports that cannot capture the potential increased reluctance of third countries to receive waste. The report should better take into account these uncertainties in the baseline estimates in the impact analysis.
|
Indeed there are some uncertainties in the baselines estimates that are clearly explained in the report. To address this, the methodology considers the effect of any export related measure on the actual 2019 data as well as on theforecasted 2030 data. Considering 2019 data is useful to demonstrate the effect of the measures on consolidated data, while projecting those effects on forecasted numbers gives an insight in the possible range of effects in the near future.
|
|
(4) The trade-offs between business concerns and environmental objectives could be more clearly presented. The report should explain whether any mitigating or transitional measures were considered to address the recycling of waste whose treatment pose particular challenges, such as plastic and textile waste.
|
Different concerns were expressed by different stakeholders, but often no data or other evidence was presented. The additional research conducted by the study team and the Commission services could also not retrieve evidence to underpin some of these concerns.
Specifically on plastic waste and textile waste and the concern about the current lack of recycling capacity in the Union that will need to be bridged, the proposal contains a transitional period for the entry into force of the export related measures that was extended from two to three years following stakeholder consultation.
|
4.Evidence, sources and quality
The impact assessment was supported by a study that provided support on stakeholder consultation. This study was initiated end of December 2019 and was performed by a consortium led by Trinomics
. The study was completed in June 2021 and published on […]
. Stakeholder consultation and targeted data collection were an important element of the exercise (see Annex 2). A workshop was held to actively involve Member State competent authorities and stakeholders.
List of main publications:
Reports:
Yamaguchi, S (2021), “International trade and circular economy – policy alignment”, OECD Trade and Environment Working Papers, OECD Publishing, Paris, -
https://doi.org/10.1787/18166881
;
Commission SWD Evaluation of Regulation (EC) No 1013 /2006 of the European Parliament and of the Council of 14 June 2006 on shipments of waste (2020), available at
https://ec.europa.eu/environment/waste/shipments/pdf/SWD_2020_26_F1_SWD_EVALUATION_EN_V4_P1_1064541.pdf
;
Interpol report (2020), available at
https://www.interpol.int/News-and-Events/News/2020/INTERPOL-report-alerts-to-sharp-rise-in-plastic-waste-crime
;
Kaza, S., Yao, L., Bhada-Tata, P., & Van Woerden, F. (2018). What a waste 2.0: A global snapshot of solid waste management to 2050. Urban Development Series. Washington, DC: World Bank, availabel at: https://doi.org/10.1596/978-1-4648-1329-0;
Open burning of waste a global health disaster (2016) Regions of Climate Action, available at: https://regions20.org/wp-content/uploads/2016/08/OPEN-BURNING-OF-WASTE-A-GLOBAL-HEALTH-DISASTER_R20-Research-Paper_Final_29.05.2017.pdf;
The report on the 8th round of mutual evaluations on “The practical implementation and operation of the European polices on preventing and combating Environmental Crime” (2019), available at
https://data.consilium.europa.eu/doc/document/ST-14065-2019-INIT/en/pdf
;
Waste Mismanagement in Developing Countries: A Review of Global Issues. Int. J. Environ. Res. Public Health (2019), 16, 1060, available at
https://www.mdpi.com/1660-4601/16/6/1060
WasteForce project Alert report (2019), available at
https://wasteforceproject.eu/wp-content/uploads/2019/02/WasteForce-Waste-Crime-Alert-1.pdf
Waste Management Outlook for West Asia UNEP (2019), available at:
http://hdl.handle.net/20.500.11822/31205
Waste Management Outlook for Africa, UNEP (2018), available at:
http://hdl.handle.net/20.500.11822/25514
Waste Management Outlook for Asia, UNEP (2017), available at:
http://hdl.handle.net/20.500.11822/27289
Basel Convention National Reports (2018), available at
http://www.basel.int/Countries/NationalReporting/NationalReports/BC2019Reports/tabid/8645/Default.aspx
Method of Calculation in the Member States of the Financial Guarantee and Equivalent Insurance pursuant to Art. 6 of Regulation (EC) No 1013/2006 on shipments of waste (2016), available at:
https://ec.europa.eu/environment/waste/shipments/pdf/Calculation%20of%20financial%20guarantee.pdf
The Global Waste Management Outlook by UNEP and ISWA (2015), available at:
https://www.uncclearn.org/wp-content/uploads/library/unep23092015.pdf
Studies:
Trinomics and Wood (2021) revision of WSR [to be published]
Study for the Environmental European Agency “Expanding the knowledge base on intra-EU waste movements in a circular economy” (2021) Project reference: ENV/HSR/20/001-1[to be published]
Contributions to the further development of the EC Waste Shipment Regulation (report by Ramboll on behalf of the German Environment Agency), published in 2021 and available at:
https://www.umweltbundesamt.de/sites/default/files/medien/5750/publikationen/2021-01-21_texte_13-2021_ec_waste_shipment.pdf
Mapping the risk of serious and organised crime infiltrating legitimate businesses (Final Report) (2021), available at:
https://op.europa.eu/en/publication-detail/-/publication/ab3534a2-87a0-11eb-ac4c-01aa75ed71a1/language-en
George Bishop, David Styles, Piet N.L. Lens, Recycling of European plastic is a pathway for plastic debris in the ocean, Environment International, Volume 142, 2020, 105893, available at:
https://doi.org/10.1016/j.envint.2020.105893
Cotta, B. What goes around, comes around? Access and allocation problems in Global North–South waste trade. International Environmental Agreements 20, 255–269 (2020), available at:
https://doi.org/10.1007/s10784-020-09479-3
Study on investment needs in the waste sector and on the financing of municipal waste management in Member States (Eunomia, COWI) (2019), available at:
https://op.europa.eu/en/publication-detail/-/publication/4d5f8355-bcad-11e9-9d01-01aa75ed71a1
Study to support the implementation of reporting obligations resulting from the new waste legislation adopted in 2018 (Eunomia)
https://op.europa.eu/en/publication-detail/-/publication/3d72ef00-bcac-11e9-9d01-01aa75ed71a1
;
IMPEL (2017) “
A survey of practitioners’ views about the implementation challenges with EU environmental legislation, their underlying reasons and ways to improvement: 2017
”, available at:
https://www.impel.eu/wp-content/uploads/2018/04/FR-2017-27-Implementation-Challenge-follow-up.pdf
;
IMPEL (2017) “
A survey of practitioners’ views about the implementation challenges with EU environmental legislation, their underlying reasons and ways to improvement: 2017
”, available at:
https://www.impel.eu/wp-content/uploads/2018/04/FR-2017-27-Implementation-Challenge-follow-up.pdf
;
The efficient functioning of waste markets in the European Union - Legislative and Policy options (2015), available at:
https://ec.europa.eu/environment/waste/studies/pdf/waste_market_study.pdf
;
Rucevska I., Nellemann C., Isarin N., Yang W., Liu N., Yu K., Sandnæs S., Olley K., McCann H., Devia L., Bisschop L., Soesilo D., Schoolmeester T., Henriksen, R., Nilsen, R. (2015) Waste Crime – Waste Risks: Gaps in Meeting the Global Waste Challenge. A UNEP Rapid Response Assessment. United Nations Environment Programme and GRID-Arendal, Nairobi and Arendal,
www.grida.no
;
Feasibility Study for the establishment of an Electronic Data Interchange for Waste Shipment (2014), available at:
electronic_data_exchange_waste_shipment_regulation.pdf (europa.eu)
;
Wiedinmyer, C., Yokelson, R., Gullet, B.K. (2014). Global Emissions of Trace Gases, Particulate Matter, and Hazardous Air Pollutants from Open Burning of Domestic Waste. Environ. Sci. Technol. 48, 16, 9523–9530, available at:
https://pubs.acs.org/doi/pdf/10.1021/es502250z
.
Other publications:
EU paper recyclers ‘in crisis’ as China waste import ban bites, available at
https://www.euractiv.com/section/circular-economy/news/eu-paper-recyclers-in-crisis-as-china-waste-import-ban-bites/
Manfredi S, Tonini D and Christensen T, (2010) ‘Environmental assessment of different management options for individual waste fractions by means of life-cycle assessment modelling’,
55 (11
), 995-1004 ;
Christensen T, (2009) ‘Environmental assessment of solid waste landfilling technologies by means of LCA-modelling’; Waste management,
29, (1
), 32-43
EuRIC:
https://www.euric-aisbl.eu/position-papers/item/335-euric-unveils-metal-recycling-brochure
EUROFER :
https://www.eurofer.eu/assets/publications/position-papers/contribution-of-the-waste-shipment-regulation-to-eu-ambitions-on-circularity-and-climate/20200728_EUROFER-Input-WSRConsultation_Paper_Final.pdf
Annex 2: Stakeholder consultation
1.
This synopsis report summarises the results of all of the consultation activities undertaken as part of the project “Exploration of potential policy responses to the review of the Waste Shipment Regulation.”
2.
The method of consultation was outlined in the inception impact assessment ‘Waste shipments – revision of EU rules’. The consultation addressed interviews with relevant stakeholders, an online public consultation and a one-day online workshop split over two mornings. All consultation was handled online as a result of restrictions resulting from COVID-19.
Objectives
The objectives of the consultation were:
·To gather views on the scope of the impact assessment process, in particular to ensure that the correct objectives were being targeted.
·To gather views with regard to the options and measures under consideration to address the objectives identified.
·To gather further evidence to substantiate the analysis of the options and measures.
Stakeholders
Relevant stakeholders to be addressed as part of the impact assessment were identified as:
·Member States and their authorities responsible for waste shipments and waste management. This included members of the European Union Network for the Implementation and Enforcement of Environmental Law (IMPEL);
·The Waste Shipment Correspondents;
·Industrial/economic actors, including small and medium sized enterprises, within sectors involved in waste shipments and/or the implementation of the Regulation;
·Civil society, including environmental Non-Governmental Organisations and citizens' initiatives;
·International organisations relevant to the matter of waste shipment, e.g. those involved in the implementation of multi-lateral environmental agreements;
·Academia, research and innovation organisations and institutes; and
·Citizens.
3.Methods for engagement of stakeholders
The methods to be applied according to the consultation strategy were identified as:
1.Public consultation through an online questionnaire, including expert consultation as part of the same exercise, using the Commission consultation’s website;
2.Targeted consultations including:
oA stakeholders’ workshop; and
oInterviews.
3.Feedback received on the evaluation roadmap.
Public consultation
A 12-week public consultation related to the Waste Shipment Regulation (WSR) Impact Assessment was held between 7 May and 30 July 2020. The public consultation was split into two main sections. The first section contained general questions on the policy objectives of the review of the WSR and how to pursue them. The second section asked for more detailed views from stakeholders with a more in-depth knowledge of the WSR. The questionnaire was hosted on the EU Survey tool.
The consultation elicited 295 responses. As part of the initial screening of responses a number of stakeholders were re-categorised as a result of the nature of their organisation. This led to some business association being categorised as such and not as NGOs as originally registered, environmental organisations being re-categorized as NGOs or public authorities and those in the ‘other category’ being redistributed to their correct delineation.
An in-depth analysis of the public consultation is provided in Annex 3.
Campaign responses
No official campaigns took part in the public consultation. It was clear in some cases that both business and NGO stakeholders had separately coordinated some of the responses to the open questions within their respective groups leading to the same wording being used.
Position papers
As part of the consultation process stakeholders were invited to submit additional information including position papers. The information submitted was reviewed in order to identify position papers. More than 65 separate submissions were received, some of these included documents that were submitted multiple times by different stakeholders or by the same stakeholder at different points in IA process. When this situation arose, the position paper was logged and reviewed only once. An overview of the position papers received is presented in the table below.
Table B.1
Overview of position papers received
|
Author
|
Title
|
|
AFNOR
|
Quality standards for sorted plastic waste — Main element — Complementary element
|
|
Bra Servizi
|
Contribution to the public consultation
|
|
ERAMET
|
Contribution to the public consultation
|
|
APRA, ACEA, CLEPA, COCIR, Conseil Europeen de Remanufacture, DIGITALEUROPE, EuroCommerce, Eurometaux
|
Towards a circular vision for the revision of the Waste Shipment Regulation
|
|
Fortum
|
Fortum calls for stronger enforcement and improvements of the Waste Shipment Regulation, WSR
|
|
Confederation of Danish Industry
|
The Waste Shipment Regulation is a barrier to circular economy in the EU
|
|
EVOA
|
Consultatie WSR 2020
|
|
Land Brandenburg
|
Stellungnahme im Rahmen der öffentlichen Konsultation zur Abfallverbringungsverordnung
|
|
CEWEP
|
Open letter to the Commissioner
|
|
NL
|
Waste Shipment Regulation Impact Assessment – Public Consultation - non-paper NL
|
|
European Environmental Bureau (EEB)
|
Additional paper to the consultation on Waste shipment regulation:
|
|
NABU
|
Wie können Plastikmüllexporte reguliert werden?
|
|
NRK Recycling
|
NRK Recycling visie ten aanzien van de aanpassing van de EVOA
|
|
IKEA
|
Response to the European Commission’s public consultation on the Waste Shipment Regulation Impact Assessment [Inter IKEA & Ingka Group]
|
|
DIGITALEUROPE
|
A Circular Economy Card for the Waste Shipment Regulation
|
|
VCI
|
Public consultation by the EU on the revision of the Waste Shipment Regulation (EG) Nr. 1013/2006
|
|
WIEN ENERGIE
|
Contribution to the public consultation
|
|
Cerame-Unie
|
Waste Shipment Regulation revision
Cerame-Unie’s answer to the public consultation
|
|
EERA
|
A requirement for a Circular Economy within the EU.
|
|
NATO
|
The industrial demilitarization of ammunition
|
|
CEMBUREAU
|
Waste Shipment Regulation Public Consultation
|
|
WPT
|
Open letter as part of the EU WSR Survey
|
|
Borealis
|
Contribution to the public consultation
|
|
EURIC
|
EURIC Position on the revision of the Waste Shipment Regulation
|
|
AVR
|
How a Waste Recycling Energy Plant can boost Climate and Circular Economy
|
|
RDF Industry Group secretariat
|
RE: Public Consultation on the Waste Shipment Regulation Impact Assessment
|
|
UNESID
|
UNESID’S feedback on the EU waste shipment rules
|
|
HWE
|
Contribution to the public consultation
|
|
ERP
|
Recommendations for the revision of the European Union rules on waste shipment
|
|
SUEZ
|
SUEZ recommendations on the Waste Shipment Regulation
|
|
CEFIC
|
Explanatory note based on Cefic position paper on Waste Shipment Regulation to support our reply to the public consultation
|
|
EK
|
Confederation of Finnish Industries views on “Waste shipments – review and assessment of revision of EU rules”
|
|
Belgium
|
Additional responses from Belgium as regards the Public Consultation on the Review of the Waste Shipment Regulation
|
|
EBRA
|
EBRA draft contribution to the Public Consultation regarding the Waste Shipment Regulation Impact Assessment.
|
|
Euromines
|
Euromines – Public Consultation on the Waste Shipment Regulation
|
|
Czechia
|
Waste Shipment Regulation Impact Assessment – Public Consultation - Additional comments of the Ministry of the Environment of the Czech Republic
|
|
ECGA
|
ECGA Position Paper – Public Consultation on the Waste Shipment Regulation
|
|
ACE
|
Shipment of waste in and outside Europe
|
|
Dutch Waste Management Association
|
Contribution to the public consultation
|
|
Derichebourg environnement
|
Waste Shipment Regulation Impact Assessment – Public Consultation position paper
|
|
Neste
|
Neste Reply to Waste Shipment Regulation – Public Consultation on the review of EU rules
|
|
Plastics Europe
|
PlasticsEurope response to the public consultation on the revision of the Waste Shipment Regulation (Regulation (EC) No 1013/2006)
|
|
PolyStyreneLoop
|
Feedback on Impact Assessment of Waste Shipment Regulation - Regulation 1013/2006
|
|
Eurofer
|
The contribution of the Waste Shipment Regulation to EU ambitions on circularity and climate
|
|
rreuse
|
RREUSE feedback: Waste Shipment Regulation – Public Consultation
|
|
Eurochambres
|
EUROCHAMBRES Position on the Revision of the EU rules on Waste Shipment
|
|
Polyeco
|
Waste Shipment Regulation Impact Assessment – Public Consultation
|
|
Ferver
|
Position of FERVER on the revision of the Waste Shipment Regulation
|
|
BDE
|
BDE's additional remarks to the Public consultation by the EU on the revision of the Waste Shipment Regulation (EG) Nr. 1013/2006
|
|
Rethink Plastic
|
Public Consultation on the Revision of the Waste Shipment Regulation - Submission from the Rethink Plastic alliance, supported by the Basel Action Network and GAIA
|
|
FEAD
|
FEAD additional comments to the EC questionnaire on the revision of the WSR
|
|
ESWET
|
Time to ensure sustainable waste shipments in Europe
|
|
Basel Action Network (BAN)
|
Comments for the Public Consultation on the Revision of the
European Union Waste Shipment Regulation by the Basel Action Network (BAN)
|
|
ETRMA
|
ETRMA contribution to the inception impact assessment on
Waste Shipments (WSR) – revision of the EU rules
|
|
Germany
|
German Comments related to the impact assessment of the Commission regarding Regulation (EC) No 1013/2006 on shipments of waste (WSR)
|
Targeted consultations
Targeted consultation took the form of a stakeholder workshop, interviews and attendance at an external workshop hosted by the Impel network. Details on each of these are presented below.
Stakeholders’ workshop
A stakeholder workshop was organised over two consecutive mornings on 23rd and 24th September 2020. The workshops have gathered more than 200 participants from 88 organisations on Day One and 90 on Day Two including representatives from Member States’ competent authorities, industry, NGOs, EU services, academia and international organisations. Attendees were provided with:
i.
a background paper in advance of the workshop; and
ii.
presentations at the workshop itself that were further explained by the consultants assisting the Commission in the assessment process.
The agenda was split across two mornings, with the first morning dedicated to examination of objectives concerned with the intra-EU shipment of waste and the second that considered extra-EU shipments of waste and enforcement.
Day One attendees were comprised of:
-
29 Member State representatives, including government ministries and competent authorities.
-
21 Company / business organisations.
-
11 Waste treatment associations.
-
8 Environmental NGOs.
-
6 recycling / materials trade associations.
-
3 individual waste treatment companies.
-
3 individual non-waste treatment / recycling companies.
-
2 recycling / materials trade companies.
-
5 other organisations (comprised of European Institution bodies and international bodies).
Day Two attendees were comprised of:
-
31 Member State representatives, including government ministries and competent authorities.
-
24 Company / business organisations.
-
10 Waste treatment associations.
-
8 Environmental NGOs.
-
4 recycling / materials trade associations.
-
3 individual waste treatment companies.
-
3 individual non-waste treatment / recycling companies.
-
2 recycling / materials trade companies.
-
5 other organisations (comprised of European Institution bodies and international bodies).
As a result of restrictions stemming from Covid-19 the meeting was hosted virtually on WebEx and included the use of Sli.do to pose questions to attendees and to run polls.
A workshop report was produced by Wood that was shared for comment by attendees. The workshop report was subsequently updated by the consultants and shared with participants.
Interviews
In April and May 2020 interviews were organised with selected stakeholders primarily comprising stakeholders involved in both waste management and those involved in the generation and shipping of waste. Eleven one-to-one interviews were held with regard to the scope of the objectives and evidence gathering with regard to the impacts of options.
IMPEL Workshop
The consultants and European Commission attended a virtual workshop hosted by IMPEL in May 2020 where the scope of the impact assessment was presented and IMPEL members were invited to comment and to provide further input following the meeting.
4.Feedback received on the inception impact assessment
The inception impact assessment was published on 11 March 2020 with feedback invited until 8 April 2020. A total of 81 stakeholders provided feedback on the evaluation roadmap during the consultation period. The key feedback is summarised in the table below, organised per evaluation criteria.
|
Overview of key issues raised Roadmap feedback
|
|
·Simplification of the waste shipment Regulation – with several comments referring to the overly burdensome nature of administrative procedures for shipments of waste
|
|
·Lack of harmonisation in implementation – with respondents highlighting the impact of different approaches undertaken by competent authorities in their application of the Regulation, in particular concerning the categorization of waste materials.
|
|
·The circular economy – with respondents generally pointing to the need for the waste shipment Regulation to provide greater support to the circular economy work within the EU, including with regard to the issues highlighted above (the need to simplify shipments to enable speedier shipments contributing to the circular economy to take place and harmonising the categorization of waste, in particular concerning end of waste criteria.
|
|
·Concerning extra-EU shipments of waste – A number of responses indicating support for a blanket export ban or a targeted restriction for certain wastes (in particular plastic).
|
|
·Resourcing of inspections and enforcement – With a number of responses highlighting that inspection and enforcement shortcomings stem from lack of resources.
|
|
·Other issues not specifically addressed in the inception impact assessment – including in relation to introduction of a common language for shipment documentation, shipments of waste for research and links with other EU waste objectives, in particular with regard to recycling targets.
|
The opinions raised and evidence provided in this feedback are used in the study directly, with a number of the respondents providing further materials as part of the other consultation activities undertaken.
5.Use of the information gathered
All of the information gathered as part of the data collection exercise, both through the consultation streams highlighted in this synopsis report, as well as literature review and evidence gathering by the team of consultants was combined. This formed the basis for the examination of all data sources against each of objectives, noting relevant sources of evidence that are then quoted in the main body of the study. Data was analysed to identify contradictory or supportive statements and evidence to reach the conclusions contained in the final evaluative study. In this context, all widely supported views are entirely considered in the final report, with less widely supported views identified as such.
Annex 3: In depth analysis of the public consultations outcome
1.Introduction
The analysis in this Annex was drawn from the exploratory study in support of this impact assessment and does not necessarily use the same presentation of measures as eventually chosen in the sections of the present report. The study based itself on the presentation of objectives and measures in the questionnaire for the public consultation. In the subsequent process of developing this impact assessment, thinking developed further and resulted in an advanced presentation of objectives, options and underlying measures. This annex does however provide an in depth insight in stakeholders views on the various objectives and potential policy options for this review.
2.Public Consultation Results
Overview of respondents
A 12-week public consultation related to the Waste Shipment Regulation (WSR) Impact Assessment was held between 7 May and 30 July 2020. The public consultation was split into two main sections. The first section contained general questions on the policy objectives of the review of the WSR and how to pursue them. The second section asked for more detailed views from stakeholders with a more in-depth knowledge of the WSR. The questionnaire was hosted on the EU Survey tool.
The consultation elicited a total of 295 responses. As part of the initial screening of responses a number of stakeholders were re-categorised as a result of the nature of their organisation. This led to some business associations being categorised as such and not as NGOs as originally registered, environmental organisations being re-categorized as NGOs or public authorities and those in the ‘other category’ being redistributed to their correct delineation.
The consequent breakdown of stakeholder responses by respondent type is provided below.
Table C.1 - Type of respondents involved in the consultation
|
Type of respondent
|
Number of respondents
|
Percentage of respondents
|
|
Company/business organisation
|
116
|
39%
|
|
Business association
|
77
|
26%
|
|
EU citizen
|
47
|
16%
|
|
Public authority
|
36
|
12%
|
|
Environmental non-governmental organisation (NGO)
|
17
|
6%
|
|
Trade union
|
1
|
>0%
|
|
Academic/research institution
|
1
|
>0%
|
|
Total
|
295
|
100%
|
Responses were received from respondents in most Member States. The majority of these were received from Belgium (64), followed by Germany (45), Italy (38) and France (25). A detailed overview of the responses received by country is shown in the table below.
Table C.2 - Responses received by country
|
Type of respondent
|
Number of respondents
|
Percentage of respondents
|
|
Belgium
|
64
|
22%
|
|
Germany
|
45
|
15%
|
|
Italy
|
38
|
13%
|
|
France
|
25
|
8%
|
|
Netherlands
|
18
|
6%
|
|
Spain
|
14
|
5%
|
|
Austria
|
12
|
4%
|
|
Sweden
|
10
|
3%
|
|
Portugal
|
8
|
3%
|
|
United Kingdom
|
7
|
2%
|
|
Finland
|
5
|
2%
|
|
Greece
|
5
|
2%
|
|
Romania
|
5
|
2%
|
|
Bulgaria
|
4
|
1%
|
|
Lithuania
|
4
|
1%
|
|
Luxembourg
|
4
|
1%
|
|
Ireland
|
3
|
1%
|
|
Norway
|
3
|
1%
|
|
Poland
|
3
|
1%
|
|
Denmark
|
2
|
1%
|
|
Hungary
|
2
|
1%
|
|
Malta
|
2
|
1%
|
|
Slovakia
|
2
|
1%
|
|
Slovenia
|
2
|
1%
|
|
United States
|
2
|
1%
|
|
Andorra
|
1
|
>0%
|
|
Czechia
|
1
|
>0%
|
|
Estonia
|
1
|
>0%
|
|
French Guiana
|
1
|
>0%
|
|
Indonesia
|
1
|
>0%
|
|
Switzerland
|
1
|
>0%
|
|
Grand Total
|
295
|
100%
|
The section below provides an overview of headline results from the online survey carried out so far, per specific objective under the study.
Section 1 – General public
Section 1 of the questionnaire addressed the three main objectives being addressed, with a number of questions being addressed against each objective. A summary of the responses is provided in the following section.
·First policy objective: the WSR should support the transition to a circular economy in the EU more effectively
Questions under the first objective addressed five main sub-objectives that are addressed in the order in which the questions were posed in the questionnaire.
Firstly, the link with the circular economy was addressed as shown in
Figure C.1
below.
Figure C.1 - Responses to the statement ‘a review of the Waste Shipment Regulation should seek to more effectively support the transition to a circular economy

The vast majority of respondents agreed or strongly agreed with the need for the WSR to support the transition more effectively to a circular economy.
Secondly, stakeholders were asked whether the review of the Regulation should seek to make the movement of waste easier within the EU when destined for preparation for reuse or recycling.
As for the statement on the circular economy, a vast majority of respondents either agree or strongly agree with the statement.
Figure C.2 - Responses to the statement that a review of the Waste Shipment Regulation should seek to make the movement of waste easier within the EU when destined for preparation for reuse or for recycling

Thirdly, stakeholders were asked whether a review of the WSR should seek to make movements more difficult within the EU when destined for incineration with energy recovery. In contrast to the first two statements, a majority of stakeholders either strongly disagreed or disagreed with the statement as shown in Figure C.2 below.
Figure C.3 - Responses to the statement ‘A review of the Waste Shipment Regulation should seek to make the movement of waste more difficult within the EU when destined for incineration with energy recovery’

It should be noted that there is a general split in the stakeholders in responding to this statement. Company and Business Organisations and Business Associations represent the stakeholder groups most opposed to the statement. Conversely, NGOs and most EU citizens that responded either agree or strongly agree with the statement. Public authorities show split views on this matter. There are also a significant number of stakeholders of all categories that stated they had no opinion.
Fourthly, stakeholders were asked whether the WSR should seek to make the movement of waste more difficult or even impossible within the EU when destined for disposal (e.g. incineration without energy recovery, landfilling). The results are shown in
Figure C.4
below, with a split in opinion – the majority of respondents indicating that they agree or strongly agree with the statement, but still with a large number of mainly industry related stakeholders disagreeing or disagreeing strongly with the statement.
Figure C.4 - Responses to the statement A review of the Waste Shipment Regulation should seek to make the movement of waste more difficult or even impossible within the EU when destined for disposal (e.g. incineration without energy recovery, landfilling)

Finally, under the first objective, stakeholders were asked whether the review of the Regulation should seek to improve the efficiency of the procedures and administration for both competent authorities and companies shipping waste between Member States. As shown in below, the vast majority of stakeholders strongly agreed with the statement, with the remainder or respondents agreeing with the statement.
Figure C.5 - Responses to the statement ‘A review of the Waste Shipment Regulation should seek to improve the efficiency of the procedures and administration for both competent authorities and companies shipping waste between Member States’

·Second policy objective: Restrict the export of EU waste to third countries
The second policy objective against which stakeholders were provided with a number of statements to indicate their level of agreement concerned the restriction of export of EU waste the third countries. Stakeholders were posed with six statements against different restriction scenarios. The results of the consultation of stakeholders against these statements are provided below.
The first statement concerned whether the review should seek to keep the current EU rules on export of waste unchanged but increase their enforcement. The responses are summarised below.
Figure C.6 - Responses to the statement A review of the Waste Shipment Regulation should seek to keep the current EU rules on export of waste unchanged but increase their enforcement

A split in responses by stakeholder type is notable. NGOs and some industry stakeholders – notably those involved in the processing of wastes as secondary raw materials, disagreed with the statement that the current rules should be maintained and their enforcement increased. The industry stakeholders concerned frequently noted in their later responses to other questions the need for the WSR to more effectively support the circular economy and the need to simplify the WSR to this effect that could account for some of the level of disagreement in this stakeholder category. However, a majority of stakeholders agreed or strongly agreed with the statement.
Next, stakeholders were asked whether, regarding export of waste to non-EU OECD countries the EU should ban the export of waste to such countries.
Figure C.7 - Responses to the statement Regarding export of waste to non-EU OECD countries ban the export of waste to non-EU OECD countries

Here, a reversal in the trend from the previous statement can be seen, which is unsurprising given that those that had requested to maintain the present system are unlikely to support the kind of change envisaged by this statement. NGOs and citizens almost universally agreed or strongly agreed with the statement. It also likely reflects the fact that member countries of the OECD are generally perceived to apply waste treatment measures more akin to those of the EU than non-OECD countries.
Thirdly, stakeholders were asked to which extent they agreed with the statement ‘Regarding export of waste to non-EU OECD countries the EU should ban the export of waste to non-EU OECD countries, unless there is clear evidence that it will be processed in an environmentally sound manner’. In contrast to the previous statement, this statement includes a proviso concerning environmentally sound management of wastes in the country of destination. This important qualifier results in a generally higher level of support compared to the previous statement as shown in
Figure C.
below.
Figure C.8 - Responses to the statement ‘Regarding export of waste to non-EU OECD countries Ban the export of waste to non-EU OECD countries, unless there is clear evidence that it will be processed in an environmentally sound manner

Next, stakeholders were asked their opinion with regard to the statement ‘Regarding export of waste to non-OECD countries the EU should only ban the export of waste to developing countries’. The responses to this statement are provided below.
Figure C.9 - Responses to the statement ‘Regarding export of waste to non-OECD countries the EU should only ban the export of waste to developing countries’

Here there was a large split in opinion. As per statement two under this objective, NGOs and citizens nearly universally agreed or strongly agreed with the statement. Those industry representatives that agreed or strongly agreed with the statement were generally involved in waste treatment, with those industries more involved in the manufacturing of products and often subject to extended producer responsibility requirements more likely to disagree or strongly disagree with the statement.
The insertion of the same qualifier as for the OECD statements addressed earlier was then added to this non-OECD statement, with the new statement asking stakeholders the extent to which they agreed that regarding export of waste to non-OECD countries the EU should ban the export of waste to developing countries, unless there is clear evidence that it will be processed in an environmentally sound manner. The results of this statement are shown below.
Figure C.10 - Responses to the statement ‘Regarding export of waste to non-OECD countries only ban the export of waste to developing countries, unless there is clear evidence that it will be processed in an environmentally sound manner’

The largest group of stakeholders either agreed or strongly agreed with the statement, with a large number of industry stakeholders that had opposed a general ban being more supportive of a ban in cases where ESM of processing was not apparent.
Finally, stakeholders were asked their opinions with regard to the statement that the EU should only restrict the export of certain wastes to developing countries. Interestingly, proportionally stakeholders were slightly more supportive of the previous statement concerning ESM than a targeted restriction of certain wastes to developing countries as shown below.
Figure C.11 - Responses to the statement ‘Regarding export of waste to non-OECD countries only Restrict the export of certain wastes to developing countries’

·
·Third policy objective: Strengthen the enforcement of the Waste Shipment Regulation’s provisions
The final objective that the general public was asked to provide its opinion concerned that of strengthening the enforcement of the WSR’s provisions. To this effect, stakeholders were asked to provide their opinion against two statements.
The first statement concerned whether the review should seek to strengthen the enforcement of the Waste Shipment Regulation’s provisions in general. The responses were almost overwhelmingly in agreement with the statement as shown below.
Figure C.12 - Responses to the statement ‘A review of the Waste Shipment Regulation should seek to Strengthen the enforcement of the Waste Shipment Regulation’s provisions’

Secondly, stakeholders were asked whether a review of the Waste Shipment Regulation should seek to improve the coordination at EU level of enforcement efforts by Member States against illegal shipment, for example by establishing a dedicated forum or body.
Figure C.13 - Responses to the statement ‘a review of the Waste Shipment Regulation should seek to improve the coordination at EU level of enforcement efforts by Member States against illegal shipment, for example by establishing a dedicated forum or body’

Once again, stakeholders overwhelmingly agreed or strongly agreed with this statement.
·Additional policy objectives and measures identified in the general public section of the consultation
Following completion of the sections concerning the three main objectives identified by the Commission in respect to the revision of the WSR, the general public section of the questionnaire posed two final questions in an open box format.
The first question asked what policy objectives in addition to those previously addressed the review of the WSR should pursue. Over 100 responses were provided to this question, with responses focussing on the following general themes:
-Simplifying waste codes currently in use under the Regulation – nine responses
-Enforcing the proximity principle and address waste management as close to the place of its generation as possible – 13 responses
-Addressing plastic wastes more effectively – two responses
-Increasing extended producer’s responsibility– one response
-Prohibiting shipping for incineration – one response
-Reducing waste generation in the first place – four responses
-Improving consistency of implementation in the EU – 23 responses
-Greater support in relation to pre-consented facilities – three responses
-Banning shipments for disposal – three responses
-Creating a registry of approved importers and exporters – three responses
-Simplifying shipment procedures – 27 responses
-Allowing the market to operate freely and regulate itself – 10 for procedures responses
-Providing a single language (English) – two responses
-Creating an EU wide single market for waste – 23 responses
-Defining a single financial guarantee value for shipments subject to financial guarantees – one response
-Distinguishing between wastes and secondary raw materials – 17 responses
-Defining end of waste at the EU level – eight responses.
The second question asked what measures in addition to those already listed the review of the WSR should include. The following new points were raised (beyond those addressed in response to the previous question):
-Apply fines to public authorities that fail to process notifications according to the timings laid down in the Regulation
-All waste to energy facilities in the EU should receive pre-consented status to reduce administrative burden.
-EU inspection of non-EU countries on environmental and social grounds and to identify the destination of recycling residues.
-Review hazardous waste requirements specifically for waste products that are to be recycled or refurbished or parts harvested. Look at two levels of hazardous classification, those that are hazardous in their primary state and those that are hazardous following an industrial process.
-Provide for notifications to have longer validity.
-Provide a list of pre-consented facilities for recycling and recovery (within EU)
-Establish uniform and, unambiguous definitions for Li-ion batteries at EU level: harmonise classification of undamaged Li-ion batteries as non-hazardous and avoid an unnecessary notification process for that waste product category.
-To assign a specific status to EFTA countries in order to encompass these countries with the EU countries and not with OECD countries.
-Limit the export of hazardous waste out of the country where the waste is collected unless that material could not be treated and recycled locally. This principle should concern all shipments, including intra EU.
-The enforcement of the regulation should be supported by clearly defining the consequences in cases of breach and of attempt to circumvent the prohibition of exports and by providing for EU harmonised penal, administrative and/or customs sanctions in case of non-compliance. Effective deterrence would require fines and periodic penalty payments, for natural and legal persons, imposed either at national or EU level, to be established in the WSR.
-The review should also favour the creation of an EU level body, as a one stop shop to contact in case of evidence of irregular waste management.
Section 2 – Expert stakeholder questionnaire
The expert section of the questionnaire was structured similarly to the general public section, albeit under each of the three main objectives more specific objectives and measures were presented to stakeholders upon which stakeholders were able to state their preference. Despite the fact that the section was targeted at experts, nothing prevented non-experts from answering the questionnaire and whilst the total number of respondents was smaller than in Section 1, all stakeholder groups except trade unions had at least one representative that answered at least part of section 2, with business organisations, companies, NGOs and public authorities comprising the majority of those that responded.
Challenge 1 - Ensuring a smoother functioning of the EU internal market for waste and supporting the transition to a circular economy
Set of measures 1a – Align shipments with the waste hierarchy and existing EU legislation
The results of the public consultation suggest that stakeholders have the greatest support for the following measures, and consider them as the most likely to be effective and proportionate in simplifying and reducing the administrative burden imposed by the WSR in its present form:
·Simplifying notification procedures for intra-EU shipments of waste destined for reuse or recycling, and more in particular improving and harmonising the current provisions in relation to pre-consented facilities
·Narrowing the grounds for objections to shipments of waste for preparation for reuse or recycling.
Whilst the other measures listed have received some support and are generally considered likely to be effective and proportionate, the limitation of shipments of waste for energy recovery is generally opposed by most business stakeholders.
Figure C.14 shows the breakdown of support for each sub-measure by stakeholder group. It shows the number of respondents who claimed that they either fully support or support the measure to a large extent. It is clear that there seems to be a preference for the three sub-measures outlined above across stakeholder groups.
Companies and business associations have a preference for the three options outlined above and seem be against considering options to limit shipments of waste to energy recovery and considering options to limit further or prohibit (with limited exemptions) shipments for disposal between Member States. Public authorities on the other hand seem to prefer sub-option 1a2 on simplifying notification procedures for intra-EU shipments of waste destined for reuse or recycling and determining contamination levels at the EU level in the context of classifying waste as hazardous or mixed. NGOs also support these two measures, as well as considering options to limit shipments of waste to energy recovery and considering options to limit or further prohibit shipments of waste.
Figure C.14 - Support for measures under 1a

Note: Blank and do not know responses removed.
Regarding estimated impacts of the measures, the first two sub-measures received great support from stakeholders (over 75%), whereas considering options to limits shipments of waste to energy recovery and limiting shipments for disposal between MS were considered ineffective by 51% and 37% of respondents, respectively.
Set of measure 1b – simplification and reduction of administrative burden for intra-EU shipments of waste
For this set of measures, the results from the consultation suggest that there is a strong call for the development of an Electronic Data Interchange (EDI) system to facilitate electronic notification and movement procedures for waste shipments, better monitoring of waste flows and to allow a smooth sharing of information between public authorities. In fact, 99% of companies, 97% of business associations, 100% of citizens and 100% of public authorities who replied to this question were in full support or in large support of the measure. A detailed breakdown regarding support for this measure is shown in Figure C.15 below.
Figure C.15 - Support for measures under 1b
Note: Blank and do not know responses removed.
Regarding expected impacts of this measure, the majority of respondents (over 80% for all three sub-measures) deemed this would be effective and proportionate.
Set of measures 1c – harmonisation of interpretation, application and enforcement across Member States
Stakeholders are most supportive of the following measures to create more coherence of EU legislation effectively and proportionately:
·Provide further guidance to clarify links between the different types of classifications of waste, specifically in the WFD, customs HS codes, Basel convention and OECD decision). (Supported by 100% of citizens, 85% of companies, 88% of business associations, 80% of NGOs and 74% of Public Authorities.)
·Establish structured exchange of information and experience between MS and at EU level, e.g. by creating a platform for MSs to share information.
·Introduce the principle of mutual recognition of national classification in the WSR, to clarify whether a commodity is waste or not in case of shipments, including as regards the application of end-of-waste criteria.
Figure C.16 - Support for measures under 1c

Note: Blank and do not know responses removed.
Whilst nearly all other measures listed received some support and were considered effective and proportionate (by >50% of stakeholders), the defining of rules to decide whether a commodity is classified as waste or not, or as hazardous or non-hazardous was generally not favoured or viewed as effective by stakeholders, especially by NGOs and public authorities who were against this measure.
Set of measures 1d – Provide more relevant delegations to the Commission to adapt the Regulation over time to technical and policy progress.
This set of measures would involve providing more relevant delegations to the Commission to adapt the Regulation over time to technical and policy progress. The results of the public consultation suggest that the majority of stakeholders support the objective of this measure. However, few were fully in favour of providing more relevant delegations to the Commission to adapt the Regulation over time to allow technical and policy progress. Most stakeholders believed it to be proportionate and effective.
In particular, 27% of companies supported the measure fully, 26% to a large extent and 27% only to some extent. Full support of this measure was even lower for business associations with only 14% supporting the measure fully, 32% to a large extent and 30% only to some extent. Similar values were obtained for citizens and NGOs with 0% who claimed they do not support the policy measure at all. For public authorities, 30% supported the measure fully or to a large extent, and 47% supported the measures only to some extent.
Regarding expected impacts, the majority of respondents reported that they expected it either to effective and proportionate (58%), or effective and disproportionate (33%).
Challenge 2 – Better guarantee waste shipped across borders are managed in an environmentally sound manner
Set of measures 2a – stop exporting EU waste outside of the EU
The sub-measures which received most support were work on the Basel Convention, for example considering the inclusion of additional waste streams in the Convention or reinforcing the Convention with regards to Environmentally Sound Management or even Circular Economy aspects like lifecycle approach policy and reviewing the current OECD framework governing transboundary movements of waste, specifically for EU exports to other OECD countries. These were mostly supported by NGOs, Public Authorities and Citizens. Business associations and Companies tended not to be in favour of measure 2a. With the greatest support from business associations on the option to maintain the current rules on both hazardous and green listed waste exports to third countries and focus on stronger enforcement measures (64% of respondents) and for companies on work on the Basel Convention, for example considering the inclusion of additional waste streams in the Convention or reinforcing the Convention with regards to Environmentally Sound Management or even Circular Economy aspects like lifecycle approach policy (59% support from respondents.)
Figure C.17 - Support for measures under 2a

Note: Blank and do not know responses removed.
An overview of expected impacts with regards to effectiveness and proportionality of measures is shown in Figure C.18 below.
Figure C.18 - Views on expected impacts for measures under 2a

Note: Blank and do not know responses removed.
Set of measures 2b – verify ESM in destination countries
Regarding sub-measures under measure 2b, aimed a verifying ESM in destination countries, the one which received most support from all stakeholders except citizens was to clarify what the EU considers as the environmentally sound management of waste, by including additional provisions on this point in the regulation or in implementing acts. The other two sub-measures also received significant support, especially from citizens, NGOs and public authorities. Details are outlined in the graph below.
Figure C.19 - Support for measures under 2b

Note: Blank and do not know responses removed.
Regarding effectiveness of these measures, the majority of stakeholders deemed the first option to be effective and proportionate (80%), whereas for the second and third option this dropped to 49% and 61% respectively. In fact, for the latter two options many respondents seemed to expect that the measures would be ineffective, with 15% believing this for the option on the establishment of an EU agency to inspect and certify that waste management facilities in 3rd countries processing waste imported from the EU comply with EU requirements on the environmentally sound management” of waste, and 18% believing the option of introducing a guidance document outlining more detailed and stricter conditions governing the export of waste outside the EU to be ineffective.
Set of measures 2c
Sub-measures under measure 2C received support mostly from citizens, business associations, public authorities and companies. NGOs seemed to be generally against these measures.
Figure C.20 - Support for sub-measures under Measure 2c

Note: Blank and do not know responses removed.
Regarding expected impacts on effectiveness for the measure, the majority of respondents deemed the measure to be effective and proportionate, with 78% claiming this for the first sub-measure and 84% claiming this for the second measure.
Challenge 3 – Better prevent and address illegal shipments of waste
Measure 3a – Further strengthen provisions on enforcement and inspections
Stakeholders seemed to be mostly in favour of measures to further strengthen provisions on enforcement and inspections. Generally, public authorities, NGOs and citizens seemed to be more in favour with these compared to business associations and companies. A detailed breakdown regarding support for these sub-measures is shown in the table below.
Figure C.21 - Support for measures under 3a

Note: Blank and do not know responses removed.
Regarding expected impacts on effectiveness for the measure, the majority of respondents deemed the measure to be effective and proportionate, with 78% claiming this for the first sub-measure, 81% claiming this for the second measure and 72% for the third measure.
Set of measures 3b – Increase the priority of addressing illegal shipments of waste and strengthen EU and global cooperation
Stakeholders seemed to be mostly in favour of measures to increase the priority of addressing illegal shipments of waste and strengthen EU and global cooperation. A detailed breakdown regarding support for these sub-measures is shown in the Figure below.
Figure C.22 - Support for sub-measures under Measure 3b

Note: Blank and do not know responses removed.
Regarding expected impacts on effectiveness for the measure, the majority of respondents deemed the measure to be effective and proportionate, with 85% claiming this for the first sub-measure and 74% claiming this for the second measure.
Annex 4: Who is affected and how – overview of costs and benefits
1.Practical implications of the initiative
Who is affected and how?
Section 2.3 of the impact assessment report contains information on who is affected by this initiative and how.
2.Summary of costs and benefits
Tables I and II present the costs and benefits identified and assessed for the preferred option.
|
I. Overview of Benefits (total for all provisions) – Preferred Option
|
|
Description
|
Amount
|
Comments
|
|
Direct benefits
|
|
Additional revenue versus cost linked to measures on export of waste
|
200-510 million euro in 2019 and
1.6 and 4.0 billion euro in 2030
|
Waste management sector
|
|
Reduced administrative costs due to EDI
|
950 000 euro per year,
450 000 euro per year
|
Competent authorities,
Waste traders
|
|
Reduced maintenance costs of current national electronic systems
|
50 000 euro per year
|
For each competent authority that decides to replace their current national electronic system and use the EU level system directly
|
|
Reduced administrative costs
|
3-yr default consent validity leads to 1/3 of notifications for pre-consent facilities per year
|
Competent authorities,
Waste traders
|
|
Reduced administrative fees
|
Notification fees divided by 3
|
Waste traders
|
|
Reduced delays to receive consent
|
Not quantified
|
Waste traders
|
|
Reduced delays during shipments
|
150 000 euro per delay
|
Waste traders (mainly due to storage costs)
|
|
Indirect benefits
|
|
Reduced transport externalities and GHG emissions
|
266-666 million euro in 2019 and
275-687 million euro in 2030
|
Citizens
|
|
Additional EU jobs
|
9000-23000 jobs in the EU
|
Citizens
|
|
Reduced environmental externalities of mismanaged waste and health risks in third countries
|
Not quantified
|
Citizens
|
|
Promote recycling
|
Not quantified
|
Recycling sector
|
|
Discourage incineration and landfill
|
Not quantified
|
Citizens
|
|
Clarify used goods versus waste, end of waste criteria, and contamination thresholds
|
Not quantified
|
Waste management sector
|
|
Avoided clean-up and repatriation costs
|
Not quantified
|
Member States,
waste management sector
|
|
More legitimate income
|
Not quantified
|
Waste management sector
|
|
Increased tax revenue
|
Not quantified
|
Member States
|
|
II. Overview of costs – Preferred option
|
|
|
Citizens/Consumers
|
Businesses
|
Administrations
|
|
|
One-off
|
Recurrent
|
One-off
|
Recurrent
|
One-off
|
Recurrent
|
|
Setting up and running of a system for Electronic Data Interchange (EDI)
|
|
|
|
|
|
Maintenance: 50k – 80k euro
|
20k euro per year following years
|
|
Measure directed to exporting companies to ensure sustainable management of waste by facilities in third countries (auditing)
|
Direct costs
|
|
|
30k euro
|
5k euro/year overhead+ 1k-2k euro/audit
|
|
|
|
|
Indirect costs
|
|
|
|
|
|
|
|
New framework for export of waste outside the OECD
|
Direct costs
|
|
|
|
|
|
|
|
|
Indirect costs
|
|
|
Possible economic losses for companies that currently export waste
|
|
|
|
|
Enforcement cooperation
|
Direct costs
|
|
|
|
|
|
Resource needs for inspection, investigation and prosecution
|
|
|
Indirect costs
|
|
|
|
|
|
|
Annex 5: Analytical methods
1.Datasets
The analysis of policy options, particularly those relating to changes in waste flows, has required the analysis of several datasets. There is no single source of information on waste movements both within the EU and between the EU and third countries. The Wood-Trinomics study has made use of data extracted from the following sources:
Notifiable waste: According to the WSR, all hazardous waste as well as some non-hazardous but problematic waste streams and other kinds of waste defined in the regulation, must be notified to the authorities before being shipped across borders. Based on annual reports from Member States, Eurostat maintains a relevant dataset (env_wasship), which has been used to examine the impacts of policy options on changes in the tonnage of notified waste shipped. It has not been possible to determine a monetised value of notifiable wastes given the widespread variation in the types of waste materials addressed by this group of materials.
Other wastes: Not all wastes that are transported across boundaries are subject to notification. To determine the impacts of policy options on non-notifiable wastes that are not addressed specifically by waste shipment data, information from the European international trade in goods statistics, Comext, was used. Comext is Eurostat's reference database for detailed statistics on international trade in goods. It provides trade data for the EU and its individual Member States as well as for a significant number of non-EU countries. Comext includes information on the volume of materials traded by the EU but also their value, which is expressed in two ways: the taxable amount or invoice value and the statistical value. Data is captured in two different ways within Comext.
-Extrastat: data on trade in goods with non-EU countries collected by customs authorities and based on the records of trade transactions in customs declarations. The dataset on trade with third parties is considered particularly robust as it is based on all reported customs movements.
-Intrastat: data about the movement of goods (i.e. dispatches and arrivals) between EU member states collected directly from traders once a month.
A challenge with using the CN codes to identify waste shipments is that the CN categorisation does not correspond one-to-one with the Basel Codes, the ELoW and the Commission Notice on the ELoW as referred to above. For the purpose of determining the main wastes exported from the EU to third countries for this impact assessment, a re-categorization of CN codes was done (see Appendix to this Annex) to ensure greater consistency between the categorisation of wastes under the WSR and CN codes for the following wastes that are the main waste flows modelled:
2.Supporting study
One source for the assessment of impacts was the study which the Commission procured in support to the impact assessment
. The study assesses the measures proposed to achieve the desired objectives. These were assessed in terms of economic, environmental and social impacts in line with better regulation guidelines.
In this study, research was undertaken through literature review, an open public consultation, targeted interviews with a number of stakeholders from Member States, industry and non-governmental organisations, and a stakeholder workshop.
More details on how the economic, environmental and social impacts were assessed is provided below for the measures grouped under each of the three objectives.
This study is also subject to the following limitations.
·The assessment model is a simplification, i.e. it does not examine possible changes in waste flow at the individual ELoW code level.
·Some stakeholder opinions seem to be in contrast to available evidence.
·Determining the impacts of export restrictions from the EU is not straightforward, as possible impacts of action at the EU level are likely to intermingle with impacts of actions taken by third countries.
·Some analysis has been undertaken at the EU27 level and not at the Member State level, which may increase the margin of error in results.
3.Analysis of impacts
The economic, environmental and social impacts of the proposed measures were assessed in line with the better regulation guidelines. Additional assumptions and details on the assessment of the measures under the three objectives are presented below.
1.1.Baseline
Table E.1: Forecast of tonnes of exports of wastes to OECD countries for the period 2019-2030

Table E.2: Forecast of tonnes of exports of wastes to non-OECD countries for the period 2019-2030

1.2.Modelling economic impacts
1.2.1.
Modelling economic impacts for measures on intra-EU shipments of waste (objective 1)
The proposed measures on intra-EU shipments of waste, under objective 1, are intended to ensure a smooth functioning of the internal market and facilitate the recycling of waste. They will impact the number of notifications that would be destined for a pre-consented facility, the consent validity period of notifications, the amounts required for the financial guarantees. The effect of changes in both the nature of waste shipments and the procedures applied to those shipments have been assessed by considering the additional costs of applying new controls as well as the potential savings to be made by simplifying existing measures.
The following data and assumptions have been used in this section.
Administrative costs have been calculated based on the existing administrative burden that either stems from the present WSR and would be reduced (for example in relation to the simplification or digitisation of notification procedures) or would be added to new types of shipments to improve their level of control (for example in relation to an additional simplified procedure for wastes that are currently not subject to such a provision).
Administrative savings expected from a completely electronic system were estimated by using the standard cost model. Trinomics and Wood (2021) asked companies and Member States’ competent authorities, to provide data on the number of notification procedures they handle and the staff time spent on notifications that are paper-based or electronic (prepare and submit for operators and verify and issue a consent or objections for competent authorities). From this information, the average number of hours spent on paper-based versus electronic notifications was calculated as detailed in the table below. On (EU) average, working with electronic systems saves almost 50% of time per notification compared to handling procedure in paper format. The savings from the introduction of EDI were estimated based on the costs per notification of paper-based versus electronic systems. Two different methods were used. The first is based on the cost per notification and the number of annual EU-27 notifications (extrapolated from the 15 Member States for which competent authorities provided data) and the second on the number of notifications estimated based on the number of shipments expected given the amounts of waste transported. The two methods estimate a saving of between 950,000 and 3.2 million euro per year for competent authorities and between 450 and 950 thousand euro per year for notifiers, compared to the current situation.
In addition, savings were calculated for the measure which would mandate a validity period of three years for notifications. Given the current typical period is one year, for a certain number of cases that are eligible under this measure, this would divide by three the number of yearly notifications and hence the related costs for competent authorities and exporters. These costs cover the time saved for staff handling these notifications but also the administrative fees that operators would save by only having to file a notification every three years instead of each year.
Table E.3: Average time spent on notification requests
|
Type of notification
|
Target group
|
Tariff € per hour
|
Time (hour)
|
Cost per notification
|
|
Paper based assessment
|
Member State competent authorities
|
20
|
19.5
|
330
|
|
Electronic assessment
|
Member State competent authorities
|
20
|
10.8
|
216
|
|
Paper based submission
|
Operators
|
20
|
24
|
480
|
|
Electronic submission
|
Operators
|
20
|
16
|
320
|
Further, the economic benefits of increasing the amount of pre-consented facilities was estimated on the basis of the shorter delays that could be expected with this measure and the consequent positive impact on storage costs for operators waiting to ship the waste to its destination.
As regards the impacts on Member States of restricting shipments for disposal, the following ratios per Member State were taken into account.
Note: Data has been conditionally formatted to show the largest exporters (blue) and importers (red).
|
Country
|
Net exports - D1, D5, D12
|
Net exports - D10
|
Net exports - D-other
|
|
Belgium
|
17 306
|
86 951
|
9 945
|
|
Bulgaria
|
0
|
1 177
|
128
|
|
Czechia
|
0
|
0
|
0
|
|
Denmark
|
3 637
|
2 706
|
79
|
|
Germany
|
-12 883
|
30 309
|
110 331
|
|
Estonia
|
0
|
0
|
1
|
|
Ireland
|
0
|
0
|
0
|
|
Greece
|
0
|
0
|
0
|
|
Spain
|
335
|
3 790
|
579
|
|
France
|
-13 372
|
21 934
|
27 863
|
|
Croatia
|
358
|
10 843
|
1 701
|
|
Italy
|
412 757
|
243 764
|
57 104
|
|
Cyprus
|
0
|
25
|
0
|
|
Latvia
|
0
|
0
|
0
|
|
Lithuania
|
0
|
689
|
0
|
|
Luxembourg
|
221 469
|
-443
|
35 168
|
|
Hungary
|
0
|
59
|
0
|
|
Malta
|
0
|
0
|
0
|
|
Netherlands
|
-87
|
-7 433
|
-17
|
|
Austria
|
3 224
|
19 091
|
21
|
|
Poland
|
3 413
|
0
|
0
|
|
Portugal
|
-46 111
|
1 381
|
0
|
|
Romania
|
0
|
0
|
0
|
|
Slovenia
|
0
|
0
|
0
|
|
Slovakia
|
0
|
0
|
0
|
|
Finland
|
-167
|
6 093
|
222
|
|
Sweden
|
1 682
|
1 645
|
2 211
|
Source: Trinomics-Wood study.
As regards the impacts on Member States of restricting shipments for recovery, other than reuse or recycling, the following ratios per Member State were taken into account.
Note: Data has been conditionally formatted to show the largest exports (blue) and importers (red).
|
Country
|
Net exports - R1
|
Net exports - R2 - R10
|
Net exports - R-other
|
|
Belgium
|
288 621
|
2 249 806
|
661 820
|
|
Bulgaria
|
-27 442
|
-1 932
|
-1 141
|
|
Czechia
|
0
|
0
|
0
|
|
Denmark
|
-70 863
|
-33 030
|
33 416
|
|
Germany
|
104 697
|
1 817 533
|
-52 081
|
|
Estonia
|
-66 885
|
-13 627
|
-29 845
|
|
Ireland
|
0
|
0
|
0
|
|
Greece
|
-10 210
|
-10 755
|
-127
|
|
Spain
|
-5 669
|
-233 891
|
-46 838
|
|
France
|
4 609
|
281 454
|
-94 776
|
|
Croatia
|
-4 584
|
71 696
|
25
|
|
Italy
|
408 931
|
-97 880
|
122 074
|
|
Cyprus
|
0
|
-16 196
|
0
|
|
Latvia
|
2
|
70
|
-754
|
|
Lithuania
|
983
|
13 996
|
-2 893
|
|
Luxembourg
|
-31 160
|
112 291
|
75 337
|
|
Hungary
|
-73 930
|
-88 022
|
-18 145
|
|
Malta
|
0
|
0
|
0
|
|
Netherlands
|
-476 195
|
-3 654 529
|
-637 374
|
|
Austria
|
121 125
|
65 282
|
-22 454
|
|
Poland
|
4 983
|
-240 015
|
0
|
|
Portugal
|
-22 766
|
10 964
|
-182
|
|
Romania
|
-3 800
|
-8 497
|
0
|
|
Slovenia
|
-51 789
|
-25 178
|
0
|
|
Slovakia
|
-213 481
|
-12 811
|
-620
|
|
Finland
|
146 890
|
78 388
|
33 754
|
|
Sweden
|
-176 180
|
19 485
|
-5 680
|
Source: Trinomics-Wood study.
1.2.2.
Modelling economic impact for measures linked to the export of waste (objective 2)
To assess the measures on export, under objective 2, the model used in the support study considers a selected number of wastes – namely plastics, glass, paper and cardboard, textiles, non-ferrous metals and ferrous metals. Those waste streams where selected because they represent the largest proportion of recoverable and recyclable wastes that are currently sent from the EU to third countries.
The volume and values of such exports are declared in Comext (i.e. total weight and euro value declared for plastic/metal/paper/etc. waste exported to third countries). This report assumes that this is the current revenue that economic operators generate by exporting this waste from the EU to a third country.
To assess the net impact of the different measures, we need to evaluate:
1.the volume and value of the waste which would stay and be processed in the EU (so the loss in export value)
2.the net value generated by treating this waste in the EU (so the gain in value), which is calculated from the revenues generated in the EU from the sale of the secondary materials resulting from this treatment minus the costs for treating this waste in the EU and the difference in the costs of transport between shipping to a third country and transporting within the EU to a recycling facility.
Volume of the waste which would stay and be processed in the EU
The support study estimated the amounts of waste for the baseline and for the different proposed measures for the period 2020-2030. The 2030 horizon reflects the target dates of other related legislation including the Waste Framework Directive, Packaging and Packaging Waste Directive and the Plastics Strategy. The report estimates:
-The amounts exported from the EU in the baseline scenario where no change would be made to the WSR. These projections are based on a linear regression analysis with a 95% confidence interval, which extrapolates trends observed for the export of waste in the last decade (2010-2020) to predict the evolution up to 2030.
-The amounts no longer exported from the EU in the different measures and hence the amounts that are expected to stay in the EU to undergo treatment, with the aim of reintroducing them in the economy as secondary raw materials. Each measure might lead to different levels of reduction of export and will also affect differently the types of waste currently exported
. The value of the waste retained in the EU was calculated based on the projected quantities factored with the current prices of secondary materials (or high quality waste) across the entire timeline.
Projecting future levels of export is challenging, because it depends on a large number of factors which cannot be predicted accurately with a ten years horizon. These include the evolution of the volume of waste generated in the EU, economic growth, the prices of waste commodities on the international market, or decisions taken by third on their own regime applying to import of waste. Specifically, the amount of waste retained in the EU would have an impact on prices but this was not possible to estimate. Therefore, the impact of each measure is first calculated on the basis of the actual figures for export for 2019 and then on the basis of the projected amounts until 2030.
Top five destination countries (by value in euro) of EU ferrous metals, glass and plastic waste in 2019
|
Ferrous metals
|
Glass
|
Plastic
|
|
Turkey
|
2,377,293,768
|
United Kingdom
|
12,603,311
|
Malaysia
|
69,787,797
|
|
India
|
524,361,713
|
Switzerland
|
4,065,966
|
United Kingdom
|
68,930,1616
|
|
Egypt
|
258,865,963
|
United States
|
3,430,311
|
Hong Kong
|
54,050,463
|
|
Pakistan
|
196,197,852
|
Russian Federation
|
1,671,670
|
Turkey
|
38,977,721
|
|
United Kingdom
|
155,291,965
|
Norway
|
1,441,023
|
India
|
24,964,910
|
Top five destination countries (by value in euro) of EU non-ferrous metals, paper and cardboard and textiles waste in 2019
|
Non-ferrous metals
|
Paper and cardboard
|
Textiles
|
|
China
|
1,201,145,329
|
India
|
105,702,397
|
Russian Federation
|
101,188,599
|
|
United States
|
1,038,977,703
|
China
|
101,092,850
|
Ukraine
|
91,376,796
|
|
Switzerland
|
894,900,583
|
Indonesia
|
90,853,422
|
Cameroon
|
67,463,632
|
|
United Kingdom
|
691,576,729
|
Turkey
|
58,840,348
|
Tunisia
|
49,657,500
|
|
India
|
433,825,216
|
Vietnam
|
53,567,696
|
United Arab Emirates
|
41,720,2828
|
Value generated by the treatment of the waste retained in the EU
The value generated by the treatment of waste retained in the EU was calculated based on the costs of treatment in the EU and the revenues that will be generated from the sale of the secondary materials resulting from this treatment. The calculations assume that most of the retained waste will be recycled if possible, while the non-recyclable rejects will recovered by incineration to produce energy and heat. The differences in transport costs between shipping waste outside the EU and retaining this waste was also factored in.
Costs linked to collection and sorting of waste in the EU
Collection costs are assumed to be the same in the comparison of the measures to the baseline since collection is taking place both when wastes are shipped outside the EU and when they are retained in the EU.
Sorting costs are assumed largely comparable between waste for export and for treatment within the EU. Indeed, unsorted waste cannot be exported (to non-OECD countries) or requires prior controls (to OECD countries). This approach of not accounting for additional sorting costs for waste retained in the EU, might result in an underestimation of the costs of sorting waste retained in the EU because in some instances further or more thorough sorting might take place, compared to a when waste is exported outside the EU. This extra-cost is assumed to remain limited and does not compromise the overall calculation of the costs of dealing with waste in the EU.
Costs linked to treatment of waste in the EU
The costs for treating waste within the EU are estimated based on the capital expenditure when there are currently capacity gaps in specific streams and operational costs for the treatment of the additional waste compared to the baseline. Based on the recycling targets set by EU waste legislation and on the assumption of self-sufficiency, the COWI and Eunomia study
estimated that by 2027, additional capacity will be required for municipal solid waste, bio-waste, plastics, and textiles, while there will be some potential overcapacity for incineration and mechanical biological treatment facilities.
The additional treatment costs per tonne have been calculated on an annual basis using calculations included in studies performed by the JRC, COWI and Eunomia and the European reference model on municipal solid waste and are provided in the table below. The equivalent treatment costs outside the EU are unknown and would vary from country to country. To solve this uncertainty, the methodology used to calculate the impacts of the measures versus the baseline is based on the difference between the prices of secondary materials that can be sold on the EU market versus the price declared by exporters in Comext.
Table E.4: Treatment cost per tonne for the selected waste types
|
Waste type
|
Treatment cost per tonne
|
|
Plastic
|
121.9
|
|
Textiles
|
650
|
|
Non-ferrous metals
|
1181.5
|
|
Ferrous metals
|
138.63
|
|
Other
|
13
|
Values of secondary materials retained in the EU
The projected values for the treated/processed waste were calculated both based on the Comext data on value and with data from market surveys and recent studies, which are often more specific to certain waste streams than Comext data. This provides a range of cost/benefit estimates. The first set of data is based on average Comext prices for the different waste streams concerned, multiplied by the total weight of wastes which would be retained in the EU. The prices might however be underestimated as Comext prices provide an average for waste of different qualities, which can be much lower than prices of secondary raw materials. The second set of data is based on the prices of secondary raw materials, or if those are not available, on the prices of high-quality waste which should approach market prices for secondary materials. These are provided in the table below. To this second set, the rejection rates were applied so that the value will not be for the full amounts expected to be retained in the EU but only for the proportion of this waste that can be practically transformed into secondary materials, i.e. excluding rejects that cannot be recycled. This second set of data was not calculated for non-ferrous metals since the prices of the different non-ferrous metals are not comparable and the volumes are not available for each non-ferrous metal separately.
Table E.5: prices for secondary raw material derived from the selected waste types
|
Waste type
|
Secondary material prices per tonne
|
|
Ferrous metals
|
500
|
|
Glass
|
147
|
|
Paper and cardboard
|
274
|
|
Plastic
|
743
|
|
Textiles
|
584
|
In that respect, secondary raw materials are expected to have a higher value than waste so that secondary raw material prices should normally be higher than the waste prices declared in Comext. This assumption can be distorted in the global value chain as the cost of treatment and disposal is likely to be lower in third countries than in the EU because of lower labour costs and/or lower environmental standards. The price obtained for an export may therefore be higher than the value of secondary raw materials obtained after treatment in the EU, again because of the different labour conditions and more stringent – and often more sophisticated – treatment conditions within the EU as compared to many receiving third countries.
Savings from energy production
Residues of recycling within the EU are assumed to be incinerated with energy recovery, as far as it concerns combustible fractions (plastics, paper, and textiles). The JRC quantified the KWh and MJ per tonne of each reject treated in EU (these calculations were also used for the purpose of assessing environmental impacts of treatment of rejects in third countries).
Table E.6: energy production from waste
|
|
LHVwet (MJ/t)
|
Electricity (kWh/t)
|
Heat (MJ/t)
|
|
1 t glass (inert)*
|
0
|
0
|
0
|
|
1 t paper/cardboard
|
11090
|
484
|
4436
|
|
1 t plastic
|
34210
|
1492
|
13684
|
|
1 t wood
|
15580
|
679
|
6232
|
|
1 t textiles
|
18400
|
802
|
7360
|
It was then further calculated how much energy can be potentially produced from total annual reject in the various scenarios. The economic savings were calculated by multiplying these quantities with the average electricity (0.1254 euro/kWh) and derived heat price (0.0315 euro/kWH).
Table E.7a

Table E.7b

Table E.7c

Table E.7.d

Table E.7e

Savings from transport costs
Based on available data, the study report estimated that on average, compared to the costs of shipping wastes to third countries, shipping waste within the EU would bring a cost saving of €24 per tonne of waste. These costs were therefore deducted from the costs linked to the treatment of waste in the EU.
Net value generated by treating waste in the EU which is currently exported outside the OECD, as consequence of some proposed measures on export
By taking the projected volumes detailed in the baseline and applying the expected effect of the measure (i.e. retention of 20% or 50% of waste exported outside the OECD), the amounts of waste retained in the EU were calculated, with the results as presented further in Table E.8 and Table E.9.
The projected value for the treated/processed waste were calculated with both methods as exaplained above (the Comext data on value and data from market surveys and recent studies). This is presented in the Table E.10, Table E.11, Table E.12 and Table E.13 below.
The net value generated by treating this waste in the EU is then calculated from:
·the revenues generated in the EU from the sale of the secondary materials resulting from this treatment minus (tables E.12 and E.13);
·the costs for treating this waste in the EU (table E.4);
·the difference in the costs of transport between shipping to a third country and transporting within the EU to a recycling facility (24 euro/tonne);
·the value of energy produced with the recycling rejects (tables E.7d and E.7e).
The results of these calculations (which are used to provide an assessment of the impact of the measure) are detailed in the tables E.14 and E.15 below.
Table E.8: Amounts (tonnes) retained in the EU if 20% of current waste exported to non-OECD countries is retained in the EU

Table E.9: Amounts (tonnes) retained in the EU if 50% of current waste exported to non-OECD countries is retained in the EU

Table E.10: Value (EUR) based on Comext data if 20% of current waste exported to non-OECD countries is retained in the EU

Table E.11: Value (EUR) based on Comext data if 50% of current waste exported to non-OECD countries is retained in the EU

Table E.12: Value (EUR) based on market data if 20% of current waste exported to non-OECD countries is retained in the EU

Table E.13: Value (EUR) based on market data if 50% of current waste exported to non-OECD countries is retained in the EU

Table E.14: EUR value comparison of the baseline with 20% of wastes formerly exported to non-OECD retained in the EU

Table E.15: EUR value comparison of the baseline with 50% of wastes formerly exported to non-OECD retained in the EU

1.3.Modelling environmental impacts
i)
General approach pursued to evaluate the environmental impacts of measures linked to the export of waste
The first environmental impact of the proposed measure is the environmental benefits resulting from the treatment of wastes in the EU in comparison to the treatment of this waste in the third countries, especially outside the OECD.
This is firstly linked to the general conditions under which waste management occurs in the EU, compared to third countries. The EU has a comprehensive policy governing collection, sorting and treatment of waste, designed to ensure high levels of recycling and reducing pollution from waste treatment operations. This is enshrined in the EU legislation on waste as well as the EU legislation on the industrial emission Directive and the associated BREFs. It is also commonly considered that developed countries have well-functioning systems of collection and waste management, while in developing countries collection is generally undertaken only in urban areas, and waste is often disposed in illegal dump sites or burnt. It is for example estimated that 1.1 billion tonnes, or 41 %, of the total waste generated worldwide is disposed of through unregulated burning every year, notably in China, Turkey, Pakistan, Brazil, and Mexico. The challenges faced by these countries in managing their domestic waste are also preventing them from ensuring a fully sustainable management of waste imported from abroad. For instance, it has been estimated 46% of European post-consumer plastic destined for recycling was exported in 2017, with 3% of it ending up as plastic debris in the ocean, where this constitutes a major source of marine pollution. Using the baseline scenario, this would mean that for the period 2021-2030 more than half-a-million 524 436 tonnes of plastic waste would be entering the ocean because of EU plastic waste being exported to third countries.
Based on the World Bank projections on the increase of waste generation until 2050, it is expected that third countries will be increasingly exposed to environmental pressures and public health challenges in relation to waste collection and treatment. There is therefore a high risk that the current environmental difficulties linked to the treatment of imported waste in developing countries will become more pressing in the future. Moreover, the import of waste in some instances deter these countries from putting in place efficient collection and treatment systems for their domestic waste, as the industry which could take on these wastes rely instead on (already collected and sorted) imported waste as feedstock. There are therefore substantial benefits from a waste management perspective to treat waste in the EU, rather than in many 3rd countries currently importing waste from the EU.
A very important criterion to assess the differences in the treatment of waste in the EU and in third countries is to compare the conditions under which residual waste (“rejects”) are treated. Detailed calculations on this point have been performed to provide for a quantification of the differences in impacts linked to treatment of these rejects, for the different measures proposed. The data and methodology for such calculations are presented in subsection (ii) below.
Another important environmental benefit linked to the treatment of waste in the EU relates to the nature of the re-processing of waste materials in the EU, compared to 3rd countries. The processing activities of the same waste will generate less greenhouse gases and other pollutants in the EU than in third countries. This is especially the case for industrial activities such as the processing of ferrous metal and non-ferrous metal scrap into new materials, for which energy forms a significant input. Taking as a reference the CO2 equivalent intensity of the national electricity grids, it can be considered that the energy used in similar processing facilities for ferrous metal scrap in the EU would generate lower net CO2-eq. emissions than in the major importing countries of the EU ferrous metal wastes, with an average difference of ~300 g CO2-eq/kWh. This, assuming that ferrous metal waste reprocessing needs an input of ca. 437.5 kWh/tonne scrap (375-500 kWh/tonne scrap depending on the output alloy quality) and that 1.5 million tonnes ferrous scrap could be processed in the EU (in a scenario where 50% of the waste exported to non-OECD countries is retained in the EU) in 2030, corresponds to an additional GHG savings of about 0.2 million tonnes CO2-eq per year (monetized this means saving the equivalent of 11 million euro per year in EU ETS allowances, using 2026-2030 price estimates as a reference). Under a 20 % retention scenario in 2030, this would amount to 0.6 million tonnes of ferrous scrap processed, saving 40 160 t CO2-eq per year, which in monetary terms would be about 2.3 million euro. Yet, it should be borne in mind that this figure underestimates the total GHG benefits, as it accounts only for the decreased footprint of the electricity grid in the EU compared to production outside of the EU, while EU facilities would also have a better control of the direct environmental emissions and thus the total GHG emissions within the EU would be even lower.
Table E.16: GHG equivalent intensity of electricity production of the major countries importing EU ferrous metal waste

The retention of waste in the EU should also lead to higher volume of waste recycled in the EU, which brings with it additional environmental gains.
Higher volume of recyclates would therefore be produced in the EU, which could ensure a steady supply of high quality secondary materials in the EU internal market. This is particular important for the transition of the EU to a circular economy, as currently only 12% of raw materials used by EU’s industry come from recycling. The replacement of primary materials by secondary materials in production process can result in significant GHG savings per kg of production. According to the European Recycling Industries’ Confederation (EURIC), using recycled steel to make new steel reduces air pollution by 86%, water use by 40%, and water pollution by 76%. By using aluminium scrap, CO2 emissions can be reduced by 92% compared to raw aluminium, while recycling aluminium saves 95% of the energy needed for primary production and one tonne of recycled aluminium saves up to 14,000 kWh of energy, and 7.6 cubic meters of landfill. By using copper scrap, CO2 emissions are reduced by 65% and recycling copper saves 85% of the energy needed for primary production.
The production of primary glass fibres in the EU results in 2.1 kg CO2-eq/kg, while in the rest of the world it is estimated to generate 2.5 kg CO2-eq/kg. Meanwhile, producing glass from 100% recycled glass materials incurs a carbon-footprint of 1.2 kg CO2-eq/kg. The use of secondary raw materials also reduces the need for extraction of virgin materials, and its associated environmental costs. For instance, use of 1 tonne of steel scrap saves around 1.5t of CO2 emissions as compared to using raw iron ore
and one tonne of recycled aluminium saves up to 8 tonnes of bauxite. It should be stressed that the retention of waste in the EU would also have an impact in the choice of secondary vs primary materials in 3rd countries which are currently importing waste from the EU. In a number of importing countries (Turkey, India for example), the reliance on the import of waste from the EU has reduced their dependence on primary materials, for example for the production of steel. A reduction of supply of waste from the EU could, at least in the short term, affect their production system and force them to use more virgin materials instead of the imported waste. There is however a prospect that a number of those countries could also take this opportunity to better maximize and valorize their domestic waste to replace imported waste in the medium term.
The reduction in export waste would also represent environmental gains linked to the GHG and other transport-related emissions (primarily particulate matter and sulfur/nitrogen oxides) which would be avoided due to ending the shipping of waste to 3rd countries. Detailed calculations on this point have been performed to provide for a quantification of the differences in these emissions, for the different measures proposed. The data and methodology for such calculations are presented in subsection (iii) below.
ii)
Methodology and modelling used to evaluate the environmental impact of the differences of treatment of “rejects” in the EU and in third countries
Rejects are the fraction of the waste which does not get recycled or reprocessed into secondary materials, because it is not valuable enough, or has a low quality or contains hazardous/contaminated substances. Their treatment presents particular challenges and can produce important environmental nuisances, if not performed in an environmentally sound manner.
For the modelling of the difference in treatment in rejects in the EU and in third countries, the first step was to consider the rejection rates for the different wastes per material during the recycling process. For the purpose of this report, it is assumed that the quantity of rejects during a recycling process in the EU is the same as the quantity of rejects during a recycling process outside the EU. This is a conservative approach as in reality it is likely that these rejects rates are higher in third countries, but specific data are not available. The calculations are therefore likely to underestimate the environmental impact of the recycling of waste outside the EU and should be considered as minimum levels. Taking into the account data presented in different studies
rejection rates per material are based on EU average losses. Consequently, the following average rejection rates were taken as a basis for the calculation of this study: 30 % for plastics, 10 % for textiles, 8 % for glass, 10% for paper and cardboard, and 19% for ferrous/non-ferrous metals.
The second step in the modelling was to identify the most likely treatment methods applied to these rejects in the EU and in third countries. It was assumed that energy recovery represents the conventional treatment method in the EU for rejects from recycling of plastic, paper and textile waste (combustible waste) and that rejects from glass and metal waste recycling (inert waste) are instead deposited in engineered landfills. For third countries, it was assumed that these rejects are either deposited in open dumps (uncontrolled landfills) or open burnt. Although it is impossible to present precise amounts of waste subject to open burning or open dumping in third countries, it is assumed, based on available literature, that 60% of the residues of the non-inert waste is sent to open dumping, while 40% is subject to open burning. This ratio is applied consistently across all the wastes, regardless of the nature of the material, taking into account that dump sites contain a mix of heterogeneous waste materials. In the absence of a specific dataset, the impact of textile waste has been approximated as a mix of plastic (15%) and paper/cardboard (85%) based on the assumption that ca. 15% of the textile is composed of biological fibres while the rest is synthetic. The impact of open dumping and burning of metals has been approximated with that of glass, both being inert materials, in the absence of specific datasets. Regarding the impact of landfilling and incineration of rejects from recycling in the EU, it must be stressed that on top of the environmental emissions relating to the treatment itself, these also include the downstream environmental savings obtained through energy recovery (i.e. electricity and heat).
The third step was to allocate levels of GHG emissions for the different waste treatment techniques identified above (energy recovery and engineered landfills for the EU; 60% open dumping and 40% open burning for third countries). For this purpose, the latest Ecoinvent 3.7 database
was used to describe the open dump and open burning activities for individual waste materials (plastic, glass and similar inert, and paper/cardboard), while datasets for the EU conventional engineered landfills and incinerators with energy recovery were taken from literature The chemical composition of the waste materials investigated was based on the analyses provided in dedicated scientific literature. Assumptions for energy recovery and savings by EU incinerators were based on recent studies, conforming to the Product Environmental Footprint method. Modelling and impact calculations were facilitated with the waste LCA-tool EASETECH
. The calculations resulting in the differences between treatment in the EU and treatment in third countries were expressed in quantities of GHG emissions (expressed in kg CO2-eq) and overall environmental externalities (i.e. monetised emissions, expressed in EUR/tonne
).
To this end, the following indicators have been used:
1)the global warming impact assessed using the IPCC metric (expressed in tonnes CO2-eq.; 100y time horizon for integration of radiative forces) and reflecting the climate effect of GHG emissions (100y time horizon), and
2)the environmental externalities reflecting the monetized environmental emissions (to soil, water, and air) cost expressed in euro. The monetised emissions (external costs) are used for two reasons: to provide an aggregated picture of the environmental impact and because they allow comparing external costs (i.e. environmental emissions not internalized by the market) with financial costs. To associate a cost to the environmental emissions, we relied on the CE Delft Environmental Prices Handbook, using the central values. It should be noted that littering and associated effects are here not quantified or monetised due to lack of price information.
The calculation of the net costs or benefits of managing rejects in the EU in comparison to third countries has been performed for the most commonly exported waste streams, as shown below, with the savings presented in positive numbers.
Table E.17 considers the emissions resulting from the treatment of rejects per tonne in third countries.
Table E.17: Third country environmental impacts from treatment of rejects per tonne
Externalities include all environmental emissions. Savings are shown as positive numbers, with burdens shown as negative numbers.
|
Waste material
|
GHG emission (kg CO2-eq./t)
|
Externalities (EUR/t)
|
Amount sent to engineered landfill %
|
Amount sent to incineration %
|
|
Glass (inert)
|
-129*
|
-13*
|
60
|
40
|
|
Ferrous metals (inert)
|
-129*
|
-13*
|
60
|
40
|
|
Non-ferrous metals (inert)
|
-129*
|
-13*
|
60
|
40
|
|
Paper/cardboard
|
-1345
|
-240
|
60
|
40
|
|
Plastic
|
-1105
|
-377
|
60
|
40
|
|
Textile
|
-1309
|
-308
|
60
|
40
|
*The figures for glass, ferrous and non ferrous are identical as we assumed for all of them the same dataset representing open dump/open burning of glass inert material (no datasets available for metals).
Table E.18 considers the emissions resulting from the treatment of rejects per tonne in the EU.
Table E.18: EU environmental impacts from the treatment of rejects per tonne
Externalities include all environmental emissions. Savings are shown as positive numbers, with burdens shown as negative numbers.
|
Waste material
|
GHG emission (kg CO2-eq./t)
|
Externalities (EUR/t)
|
Amount sent to engineered landfill %
|
Amount sent to incineration %
|
|
Glass (inert)
|
0
|
0
|
100
|
0
|
|
Ferrous metals (inert)
|
0
|
0
|
100
|
0
|
|
Non-ferrous metals (inert)
|
0
|
0
|
100
|
0
|
|
Paper/cardboard
|
492
|
-29
|
0
|
100
|
|
Plastic
|
-1067
|
17
|
0
|
100
|
|
Textile
|
391
|
-23
|
0
|
100
|
By considering tables E.17 and E.18, a calculation of the net costs or benefits of managing rejects in the EU in comparison to third countries has been performed. Savings in this table are shown as positive numbers, with burdens shown as negative numbers which notably concerns GHG emissions from plastic waste because the CO2 emitted is of fossil origin. It should be noticed that positive numbers reflect the environmental savings as the energy recovery carries larger benefits than the direct emissions from the stack. This is typically the case for the GHG emissions from incineration of mostly biogenic material such as paper/cardboard and textiles where the CO2 emitted is of biogenic origin (non-fossil).
Table E.19 Figures applied to assess the environmental impacts resulting from waste treatment of “rejects” in third countries in comparison to the EU (GHG emissions expressed in kg CO2-eq. per tonne treated and overall environmental externalities expressed in euro per tonne treated).
Savings are shown as positive numbers, with burdens shown as negative numbers.
|
Waste material
|
GHG emission (kg CO2-eq./t)*
|
Externalities (EUR/t)*
|
|
Glass (inert)
|
129
|
13
|
|
Ferrous metals (inert)
|
129
|
13
|
|
Non-ferrous metals (inert)
|
129
|
13
|
|
Paper/cardboard
|
1837
|
211
|
|
Plastic
|
38
|
394
|
|
Textile
|
1701
|
285
|
* The results are derived by subtracting the value in Table E.18 to the corresponding values in Table E.17 (e.g. for glass GHG: 0 – (-129) = 129; etc.).
While little difference is foreseen for the inert waste (metals and glass), the highest savings are estimated for paper/cardboard, textile and plastic waste. For paper/cardboard and textile this is due to avoiding their uncontrolled degradation and consequent methane emissions in open dumps or burning in third countries, while having controlled management in EU (e.g. incineration with energy recovery). For plastic waste, the GHG savings are mainly related to avoiding open burning in third countries because open dumping of plastic is per se not a source of GHGs (but rather of other environmental issues, e.g. littering and water/soil pollution). It should be noticed that plastic incineration at EU level from one side incurs high energy recovery (therefore avoiding production of electricity and heat from fossil and conventional sources) but at the same time is inevitably a net source of CO2 (1 tonne of plastic incinerated emits ca. 2.6 t CO2-eq. given a fossil carbon content of 719 kg). Therefore, from a strict GHG perspective the savings would be associated to avoiding open burning practices in third countries, but much more environmental savings are expected (on top of GHGs, notably reduced littering to soil/ocean and related toxicity effects harming ecosystem and human health) that overall translates in reduced externalities.
iii)
Methodology and modelling used to evaluate the environmental impact of the shipping of waste to third countries
A calculation has been performed of the emissions of GHG and air pollutants linked to the shipping of waste to third countries, taking account of the distance travelled by materials
. In order to determine average ship emissions, a general breakdown of use of the two main fuel types was applied, showing that heavy fuel oil
represented by far the largest quantity of fuel used in comparison to bunker fuel. The difference in expected emissions was based on the size of vessel, generally described according to the twenty-foot equivalent unit (TEU) container. The average size of a vessel is deemed to be between 2525 and 7553 TEU. The average transfer time is 17 days to Africa, 28 days to the Far East. Under these assumptions, it was estimated that the environmental externalities (i.e. damage; accounting for monetised GHGs and air emissions only from shipping, as stressed earlier) per tonne of material shipped in respect ranges between 41 EUR/tonne with a destination to the Near East
and 132 EUR/tonne to the Far East, when the average size of container ship is below 8000 TEU. The results are presented in table E.20 below. Additional information on these calculations can be found in the study supporting this report.
Table E.20: Environment damage determined in euro per tonne of material shipped in respect to GHG and air emissions by destination

iv)
Results of the modelling of quantifications of environmental impact linked to the treatment of rejects and to the shipping of waste to third countries, for measures 2c and 2d, as well as discarded measures on banning exports of waste
The tables below present the results of calculations for measure 2c) (Establish a new framework for the export of green-listed waste from the EU to a non-OECD country, according to which such export is only authorised to those countries that notify the EU of their willingness to import green-listed waste and demonstrate their ability to treat it sustainably, in accordance with criteria set out in the WSR), but it must be noted that calculations for measure 2c) under a 20% waste retention scenario are also valid for measure 2d) (Require that the export of green-listed waste outside the OECD is subject to the “prior written notification and consent” procedure).
Table E.21: Environmental transport externalities avoided under measure 2c) with regard to different percentages of retention of EU waste that would normally have been exported to non-OECD third countries in euro value

Table E.22: Environmental transport externalities avoided forecast for 20% retained within EU
Table E.23a+b: GHG emissions avoided in tonnes of CO2-eq under measure 2c)*

*Note that the savings reported here do not include the GHG savings associated with cleaner recycling processes in the EU compared to third countries, due to data limitations. While some figures are reported in the text above, e.g. for ferrous metals and glass, they have not been included in the overall calculations herein reported.
 Table E.24a+b: Change in external costs resulting from the management of rejected wastes in third countries moving to the EU under measure 2c) in EUR*
*Note that the savings reported here do not include the GHG savings associated with cleaner recycling processes in the EU compared to third countries, due to data limitations. While some figures are reported in the text above, e.g. for ferrous metals and glass, they have not been included in the overall calculations herein reported.
Conclusions:
·This measure would reduce the negative externalities linked to the mismanagement of waste in non-OECD countries and result in higher amounts of waste recycled in the EU, which would be processed into secondary raw materials and enter the circular economy.
·The treatment of rejects from the waste retained in the EU would result in savings of GHG emissions, compared to their treatment in a third country outside the OECD, for an estimated amount between 207 000 tonnes CO2-eq (under a 20% retention scenario) and 517 000 tonnes CO2-eq per year (under a 50% retention scenario) for the period 2019-2030. The savings are particularly important for paper/cardboard, textile and plastic waste. In monetary terms, this represents savings of 674 million euro for the whole period of 2019-2030 in a 20% retention scenario or 56 million euro per year. Under a 50% retention scenario, the total amount for the same period would be around 1.7 billion euro or 140 million euro per year.
·The environmental benefits expected in avoiding transport related externalities for the period 2019-2030 are expected to amount to a total value of around 2.6 billion euro under a 20% retention scenario, which equals to around 215 million euro savings per year. Under a 50% retention scenario value would amount to 537 million euro per year.
Ban all exports:
Similar calculations were made as regards the discarded measures to ban all exports of waste from the EU to third countries and from the EU to non-OECD countries outside the EU, as a means of providing additional basis for the impact assessment as a whole.
Table E.25: Environmental transport externalities avoided under a total ban of export of the EU waste in EUR

Table E.26: GHG emissions avoided in tonnes of CO2-eq under a total ban*

*Note that the savings reported here do not include the GHG savings associated with cleaner recycling processes in the EU compared to third countries, due to data limitations. While some figures are reported in the text above, e.g. for ferrous metals and glass, they have not been included in the overall calculations herein reported.
Table E.27: Change in external costs resulting from the management of rejected wastes in third countries moving to the EU under a total ban in EUR*

*Note that the savings reported here do not include the GHG savings associated with cleaner recycling processes in the EU compared to third countries, due to data limitations. While some figures are reported in the text above, e.g. for ferrous metals and glass, they have not been included in the overall calculations herein reported.
Conclusions:
·A total export ban would directly affect the EU by retaining 100% of otherwise exported waste for treatment within the EU.
·Based on this 100 % waste retention scenario, environmental benefits linked to avoiding transport related externalities are expected to amount to a total value of around 22 billion euro until 2030, with the savings ranging from 1.6 billion euro starting in 2019 to 2 billion euro in 2030.
·Relating to managing waste that is rejected from recycling in the EU, in comparison to third countries, considerable green-house-gas (GHG) savings in tonnes of CO2-eq are expected. Within the period 2019-2030 the overall amount of saved emissions linked solely to the treatment of rejects for the waste retained in the EU would be more than 24 million tonnes CO2-eq in total or an average of around 2 million tonnes CO2-eq per year. This would result in average savings of external environmental costs would amount to around 440 million euro per year or around 5.3 billion euro benefits for the whole period.
Ban export of all waste to third countries outside the OECD
Table E.28: Environmental transport externalities avoided under a ban of export of EU to non-OECD third countries waste in EUR

Table E.29: Emissions avoided in tonnes of CO2-eq under a ban of export of EU to non-OECD third countries*

*Note that the savings reported here do not include the GHG savings associated with cleaner recycling processes in the EU compared to third countries, due to data limitations. While some figures are reported in the text above, e.g. for ferrous metals and glass, they have not been included in the overall calculations herein reported.
Table E.30: Change in external costs resulting from the management of rejected wastes in non-OECD third countries moving to the EU under in EUR*

*Note that the savings reported here do not include the GHG savings associated with cleaner recycling processes in the EU compared to third countries, due to data limitations. While some figures are reported in the text above, e.g. for ferrous metals and glass, they have not been included in the overall calculations herein reported.
Conclusions:
·Currently, 46% of all waste exported from the EU is shipped to third non-OECD countries, amounting to around 12 million tonnes. These amounts would no longer cause environmental impacts in these third countries.
·Assuming that 50% of the currently exported waste is retained in the EU (and 50% is diverted to third OECD countries), the environmental benefits are expected in avoiding transport related externalities with a total value reaching 3.1 billion euro until 2030 with an average savings of 260 million euro. Under a 75 % retention scenario for the same period, this increases to around 6.2 billion euro and a saving of around 518 million euro per year.
·Relating to managing waste that is rejected from recycling in the EU, and projecting until 2030,the average green-house-gas (GHG) savings would be 964 000 tonnes of CO2-eq per year with a total amount of 11.5 million in tonnes of CO2-eq for the whole period 2019-2030 under a 75% waste retention scenario. Taking a 50% scenario (and thus 50% being diverted to third OECD countries), the total amount of GHG savings would be 7.7 million tonnes of CO2-eq with an average of 643 000 tonnes of CO2-eq per year for the same period.
·The calculated total benefits in monetary terms, in relation to the management of the additional volume of retained waste would amount to 140 million euro per year with a total of around 1.7 billion euro for the whole period of 2019-2030 in a 50% retention scenario. Under a 75% retention scenario, the total amount for the same period would be around 2.5 billion euro, with an average of 210 million euro per year.
1.4.Modelling social impacts
In order to calculate the employment impacts of retaining wastes within the EU an assessment of existing data has been undertaken in the study supporting this report, taking into account full time equivalent (FTE) employment related to waste management per tonne within the EU for different categories of waste as demonstrated in the table E.3.
Table E.29: Calculation of full time equivalent (FTE) employment related to waste management within the EU for certain categories of waste

It was difficult to calculate the total social impacts of a reduction in export of waste from the EU, including both employment and impacts on standards of living, for people living in the third countries which would be affected by this reduction. It can be assumed that, on the short term, the impact on the employment in the third countries is likely to be higher in FTE than the benefits expected for the EU in term of job creation, due to the existence of more efficient waste management and automated systems in the EU in comparison to a majority of the third countries to which waste is exported. The medium term impact on employment in third countries will depend on how the workers concerned will be able to find other employment possibilities in the waste sector, especially if waste imported from the EU is replaced in the facilities dealing with it with waste collected domestically or imported from other countries than EU Member States.
Table E.30a: Calculated FTE created within the EU, in case of waste retained from export overall (reference year 2019)
|
|
Waste retention in %
|
|
Waste type
|
75%
|
50%
|
20%
|
100%
|
|
Ferrous metals
|
25.570
|
17.046
|
6.819
|
34.093
|
|
Glass
|
1.556
|
1.037
|
415
|
2.074
|
|
Non-ferrous metals
|
15.210
|
10.140
|
4.056
|
20.280
|
|
Paper and cardboard
|
5.302
|
3.535
|
1.414
|
7.070
|
|
Plastic
|
12.556
|
8.371
|
3.348
|
16.742
|
|
Textiles
|
5.572
|
3.715
|
1.486
|
7.430
|
|
Total (FTE)
|
65.766
|
43.844
|
17.538
|
87.688
|
Table E.31b: Calculated FTE created within the EU, in case of waste retained from export to non-OECD (reference year 2019)
|
|
|
|
|
|
|
Waste retention in %
|
|
Waste type
|
75%
|
50%
|
20%
|
|
Ferrous metals
|
6.521
|
4.347
|
1.739
|
|
Glass
|
293
|
195
|
78
|
|
Non-ferrous metals
|
9.660
|
6.440
|
2.576
|
|
Paper and cardboard
|
4.177
|
2.784
|
1.114
|
|
Plastic
|
8.296
|
5.531
|
2.212
|
|
Textiles
|
4.999
|
3.333
|
1.333
|
|
Total (FTE)
|
33.945
|
22.630
|
9.052
|
Appendix to Annex 5: List of CN codes used in the determination of waste flows
|
Eurostat present CN-code
|
Description of CN-code (label)
|
Type of waste for the purpose of this study
|
|
26201100
|
Hard zinc spelter
|
Non-ferrous metal wastes
|
|
39151000
|
Waste, parings and scrap, of polymers of ethylene
|
Plastic wastes
|
|
39152000
|
Waste, parings and scrap, of polymers of styrene
|
Plastic wastes
|
|
39153000
|
Waste, parings and scrap, of polymers of vinyl chloride
|
Plastic wastes
|
|
39159011
|
Waste, parings and scrap, of polymers of propylene
|
Plastic wastes
|
|
39159013
|
Parings and scrap, of acrylic polymers
|
Plastic wastes
|
|
39159018
|
Waste, parings and scrap, of addition polymerization products (excl. that of polymers of ethylene, styrene and vinyl chloride and propylene)
|
Plastic wastes
|
|
39159019
|
parings and scrap, of addition polymerization products (excl. that of acrylic polymers, polymers of ethylene, styrene and vinyl chloride and propylene)
|
Plastic wastes
|
|
39159080
|
Waste, parings and scrap, of plastics (excl. that of polymers of ethylene, styrene, vinyl chloride and propylene)
|
Plastic wastes
|
|
39159090
|
Waste, parings and scrap, of plastics (excl. that of addition polymerization products)
|
Plastic wastes
|
|
39159091
|
Parings and scrap, of epoxide resins
|
Plastic wastes
|
|
39159093
|
Parings and scrap, of cellulose and its chemical derivatives
|
Plastic wastes
|
|
39159099
|
Parings and scrap, of plastics (excl. that of addition polymerization products, epoxide resins, cellulose and its chemical derivatives)
|
Plastic wastes
|
|
41152000
|
Parings and other waste of leather or of composition leather, not suitable for the manufacture of leather articles; leather dust, powder and flour
|
Textile wastes
|
|
47071000
|
Recovered "waste and scrap" paper or paperboard of unbleached kraft paper, corrugated paper or corrugated paperboard
|
Paper and cardboard wastes
|
|
47072000
|
Recovered "waste and scrap" paper or paperboard made mainly of bleached chemical pulp, not coloured in the mass
|
Paper and cardboard wastes
|
|
47073010
|
Old and unsold newspapers and magazines, telephone directories, brochures and printed advertising material
|
Paper and cardboard wastes
|
|
47073090
|
Waste and scrap of paper or paperboard made mainly of mechanical pulp (excl. old and unsold newspapers and magazines, telephone directories, brochures and printed advertising material)
|
Paper and cardboard wastes
|
|
47079010
|
Unsorted, recovered "waste and scrap" paper or paperboard (excl. paper wool)
|
Paper and cardboard wastes
|
|
47079090
|
Sorted, recovered "waste and scrap" paper or paperboard (excl. waste and scrap of unbleached kraft paper or kraft paperboard, or of corrugated paper or corrugated paperboard, that of paper or paperboard made mainly of bleached chemical pulp not coloured in the mass, that of paper or paperboard made mainly of mechanical pulp, and paper wool)
|
Paper and cardboard wastes
|
|
50030000
|
Silk waste, incl. cocoons unsuitable for reeling, yarn waste and garnetted stock
|
Textile wastes
|
|
50031000
|
Silk waste, incl. cocoons unsuitable for reeling, yarn waste and garnetted stock, neither carded nor combed
|
Textile wastes
|
|
50039000
|
Silk waste, incl. cocoons unsuitable for reeling, yarn waste and garnetted stock, carded or combed
|
Textile wastes
|
|
51031010
|
Noils of wool or of fine animal hair - not carbonised
|
Textile wastes
|
|
51031010
|
Noils of wool or of fine animal hair - carbonised
|
Textile wastes
|
|
51032000
|
Waste of wool or of fine animal hair, incl. yarn waste (excl. noils and garnetted stock)
|
Textile wastes
|
|
51032010
|
Yarn waste of wool of fine animal hair
|
Textile wastes
|
|
51032091
|
Waste of wool or of fine animal hair, non-carbonised (excl. yarn waste, noils and garnetted stock)
|
Textile wastes
|
|
51032099
|
Waste of wool of fine animal hair, carbonised (excl. yarn waste, noils and garnetted stock)
|
Textile wastes
|
|
51033000
|
Waste of coarse animal hair, incl. yarn waste (excl. garnetted stock, waste of hair or bristles used in the manufacture of brooms and brushes, and of horsehair from the mane or tail)
|
Textile wastes
|
|
52021000
|
Cotton yarn waste, incl. thread waste
|
Textile wastes
|
|
52029100
|
Garnetted stock of cotton
|
Textile wastes
|
|
52029900
|
Cotton waste (excl. yarn waste, thread waste and garnetted stock)
|
Textile wastes
|
|
53013000
|
Flax tow and waste, incl. yarn waste and garnetted stock
|
Textile wastes
|
|
53013010
|
Flax tow
|
Textile wastes
|
|
53013090
|
Flax waste, incl. yarn waste and garnetted stock
|
Textile wastes
|
|
55051010
|
Waste of staple fibres of nylon or other polyamides, incl. noils, yarn waste and garnetted stock
|
Textile wastes
|
|
55051030
|
Waste of staple fibres of polyesters, incl. noils, yarn waste and garnetted stock
|
Textile wastes
|
|
55051050
|
Waste of acrylic or modacrylic staple fibres, incl. noils, yarn waste and garnetted stock
|
Textile wastes
|
|
55051070
|
Waste of polypropylene staple fibres, incl. noils, yarn waste and garnetted stock
|
Textile wastes
|
|
55051090
|
Waste of synthetic staple fibres, incl. noils, yarn waste and garnetted stock (excl. that of polypropylene, acrylic, modacrlyic, polyester, nylon and other polyamide staple fibres)
|
Textile wastes
|
|
55052000
|
Waste of artificial staple fibres, incl. noils, yarn waste and garnetted stock
|
Textile wastes
|
|
63090000
|
Worn clothing and clothing accessories, blankets and travelling rugs, household linen and articles for interior furnishing, of all types of textile materials, incl. all types of footwear and headgear, showing signs of appreciable wear and presented in bulk or in bales, sacks or similar packings (excl. carpets, other floor coverings and tapestries)
|
Textile wastes
|
|
63101000
|
Used or new rags, scrap twine, cordage, rope and cables and worn-out articles thereof, of textile materials, sorted
|
Textile wastes
|
|
63101010
|
Used or new rags, scrap twine, cordage, rope and cables and worn-out articles thereof, of wool or fine or coarse animal hair, sorted
|
Textile wastes
|
|
63101030
|
Used or new rags, scrap twine, cordage, rope and cables and worn-out articles thereof, of flax or cotton, sorted
|
Textile wastes
|
|
63101090
|
Used or new rags, scrap twine, cordage, rope and cables and worn-out articles thereof, of textile materials, sorted (excl. flax, cotton, wool or fine or coarse animal hair)
|
Textile wastes
|
|
63109000
|
Used or new rags, scrap twine, cordage, rope and cables and worn-out articles thereof, of textile materials (excl. sorted)
|
Textile wastes
|
|
70010010
|
Cullet and other waste and scrap of glass (excl. glass in the form of powder, granules or flakes)
|
Glass wastes
|
|
70010091
|
Cullet and other waste and scrap of glass; glass in the mass - optical glass
|
Glass wastes
|
|
70010099
|
Cullet and other waste and scrap of glass; glass in the mass - other
|
Glass wastes
|
|
71123000
|
Ash containing Precious metal or Precious-metal compounds
|
Non-ferrous metal wastes
|
|
71129100
|
Waste and scrap of gold, incl. metal clad with gold, and other waste and scrap containing gold or gold compounds, of a kind used principally for the recovery of Precious metal (excl. ash containing gold or gold compounds, waste and scrap of gold melted down into unworked blocks, ingots, or similar forms, and sweepings and ash containing Precious metals)
|
Non-ferrous metal wastes
|
|
71129200
|
Waste and scrap of platinum, incl. metal clad with platinum, and other waste and scrap containing platinum or platinum compounds, of a kind used principally for the recovery of Precious metal (excl. ash containing platinum or platinum compounds, waste and scrap of platinum melted down into unworked blocks, ingots, or similar forms, and sweepings and ash containing Precious metals)
|
Non-ferrous metal wastes
|
|
71129900
|
Waste and scrap of silver, incl. metal clad with silver, and other waste and scrap containing silver or silver compounds, of a kind used principally for the recovery of Precious metal (excl. ash, and waste and scrap of Precious metals melted down into unworked blocks, ingots or similar forms)
|
Non-ferrous metal wastes
|
|
72041000
|
Waste and scrap, of cast iron (excl. radioactive)
|
Ferrous metal wastes
|
|
72042110
|
Waste and scrap of stainless steel, containing by weight >= 8% nickel (excl. radioactive, and waste and scrap from batteries and electric accumulators)
|
Ferrous metal wastes
|
|
72042190
|
Waste and scrap of stainless steel (not containing >= 8% nickel, radioactive, or waste and scrap from batteries and electric accumulators)
|
Ferrous metal wastes
|
|
72042900
|
Waste and scrap of alloy steel (excl. stainless steel, and waste and scrap, radioactive, or waste and scrap from batteries and electric accumulators)
|
Ferrous metal wastes
|
|
72043000
|
Waste and scrap of tinned iron or steel (excl. radioactive, and waste and scrap of batteries and electric accumulators)
|
Ferrous metal wastes
|
|
72044110
|
Turnings, shavings, chips, milling waste, sawdust and filings, of iron or steel, whether or not in bundles (excl. such items of cast iron, alloy steel or tinned iron or steel)
|
Ferrous metal wastes
|
|
72044191
|
Trimmings and stampings, of iron or steel, in bundles (excl. such items of cast iron, alloy steel or tinned iron or steel)
|
Ferrous metal wastes
|
|
72044199
|
Trimmings and stampings, of iron or steel, not in bundles (excl. such items of cast iron, alloy steel or tinned iron or steel)
|
Ferrous metal wastes
|
|
72044910
|
Waste and scrap of iron or steel, fragmentised "shredded" (excl. slag, scale and other waste of the production of iron and steel; radioactive waste and scrap; fragments of pigs, blocks or other primary forms of pig iron or spiegeleisen; waste and scrap of cast iron, alloy steel or tinned iron or steel; turnings, shavings, chips, milling waste, sawdust, filings, trimmings and stampings; waste and scrap of primary cells, primary batteries and electric accumulators)
|
Ferrous metal wastes
|
|
72044930
|
Waste and scrap of iron or steel, not fragmentised "shredded", in bundles (excl. slag, scale and other waste of the production of iron and steel; radioactive waste and scrap; fragments of pigs, blocks or other primary forms of pig iron or spiegeleisen; waste and scrap of cast iron, alloy steel or tinned iron or steel; turnings, shavings, chips, milling waste, sawdust, filings, trimmings and stampings; waste and scrap of primary cells, primary batteries and electric accumulators)
|
Ferrous metal wastes
|
|
72044990
|
Waste and scrap of iron or steel, not fragmentised "shredded", not in bundles (excl. slag, scale and other waste of the production of iron and steel; radioactive waste and scrap; fragments of pigs, blocks or other primary forms of pig iron or spiegeleisen; waste and scrap of cast iron, alloy steel or tinned iron or steel; turnings, shavings, chips, milling waste, sawdust, filings, trimmings and stampings; waste and scrap of primary cells, primary batteries and electric accumulators)
|
Ferrous metal wastes
|
|
72045000
|
Remelting scrap ingots of iron or steel (excl. Products whose chemical composition conform//or ferro-alloys)
|
Ferrous metal wastes
|
|
74040010
|
'Waste and scrap, of refined copper (excl. ingots or other similar unwrought shapes, of remelted refined copper waste and scrap, ashes and residues containing refined copper, and waste and scrap of primary cells, primary batteries and electric accumulators)
|
Non-ferrous metal wastes
|
|
74040091
|
Waste and scrap, of copper-zinc base alloys "brass" (excl. ingots or other similar unwrought shapes, of remelted waste and scrap of copper-zinc alloys, ashes and residues containing copper-zinc alloys and waste and scrap of primary cells, primary batteries and electric accumulators)
|
Non-ferrous metal wastes
|
|
74040099
|
Waste and scrap, of copper alloys (excl. of copper-zinc alloys, ingots or other similar unwrought shapes, of remelted waste and scrap of copper alloys, ashes and residues containing copper alloys, and waste and scrap of primary cells, primary batteries and electric accumulators)
|
Non-ferrous metal wastes
|
|
75030010
|
Waste and scrap, of non-alloy nickel (excl. ingots or other similar unwrought shapes, of remelted non-alloy nickel waste and scrap, ashes and residues containing non-alloy nickel, waste and scrap of primary cells, primary batteries and electric accumulators)
|
Non-ferrous metal wastes
|
|
75030090
|
Waste and scrap, of nickel alloys (excl. ingots or other similar unwrought shapes, of remelted nickel alloys waste and scrap, ashes and residues containing nickel alloys)
|
Non-ferrous metal wastes
|
|
76020011
|
Turnings, shavings, chips, milling waste, sawdust and filings, of aluminium; waste of coloured, coated or bonded sheets and foil, of a thickness "excl. any backing" of <= 0,2 mm, of aluminium
|
Non-ferrous metal wastes
|
|
76020019
|
Waste of aluminium, incl. faulty workpieces and workpieces which have become unusable in the course of production or processing (excl. slag, scale and other waste from the production of iron or steel, containing recyclable aluminium in the form of silicates, ingots and other primary forms, of smelted waste or scrap, of aluminium, ash or the residues of the production of aluminium, and waste in heading 7602.00.11)
|
Non-ferrous metal wastes
|
|
76020090
|
Scrap of aluminium (excl. slags, scale and the like from iron and steel production, containing recoverable aluminium in the form of silicates, ingots or other similar unwrought shapes, of remelted waste and scrap, of aluminium, and ashes and residues from aluminium production)
|
Non-ferrous metal wastes
|
|
78020000
|
Lead waste and scrap (excl. ashes and residues from lead production "heading No 2620", and ingots or other similar unwrought shapes, of remelted waste and scrap, of lead "heading No 7801" and waste and scrap of primary cells, primary batteries et electric accumulators)
|
Non-ferrous metal wastes
|
|
79020000
|
Zinc waste and scrap (excl. ash and residues from zinc production "heading 2620", ingots and other similar unwrought shapes, of remelted waste and scrap, of zinc "heading 7901" and waste and scrap of primary cells, primary batteries and electric accumulators)
|
Non-ferrous metal wastes
|
|
79031000
|
Zinc dust
|
Non-ferrous metal wastes
|
|
79039000
|
Zinc powders and flakes (excl. grains of zinc, and spangles of heading 8308, and zinc dust)
|
Non-ferrous metal wastes
|
|
80020000
|
Tin waste and scrap (excl. ash and residues from the manufacture of tin of heading 2620, and ingots and similar unwrought tin produced from melted tin waste and scrap of heading 8001)
|
Non-ferrous metal wastes
|
|
81019700
|
Tungsten waste and scrap (excl. ash and residues containing tungsten)
|
Non-ferrous metal wastes
|
|
81029700
|
Molybdenum waste and scrap (excl. ash and residues containing molybdenum)
|
Non-ferrous metal wastes
|
|
81033000
|
Tantalum waste and scrap (excl. ash and residues containing tantalum)
|
Non-ferrous metal wastes
|
|
81042000
|
Magnesium waste and scrap (excl. ash and residues containing magnesium, and raspings, turnings and granules graded according to size)
|
Non-ferrous metal wastes
|
|
81053000
|
Cobalt waste and scrap (excl. ash and residues containing cobalt)
|
Non-ferrous metal wastes
|
|
81060010
|
Unwrought bismuth; bismuth powders; bismuth waste and scrap (excl. ash and residues containing bismuth)
|
Non-ferrous metal wastes
|
|
81073000
|
Cadmium waste and scrap (excl. ashes and residues containing cadmium)
|
Non-ferrous metal wastes
|
|
81083000
|
Titanium waste and scrap (excl. ash and residues containing titanium)
|
Non-ferrous metal wastes
|
|
81093000
|
Zirconium waste and scrap (excl. ash and residues containing zirconium)
|
Non-ferrous metal wastes
|
|
81102000
|
Antimony waste and scrap (excl. ash and residues containing antimony)
|
Non-ferrous metal wastes
|
|
81110019
|
Manganese waste and scrap (excl. ash and residues containing manganese)
|
Non-ferrous metal wastes
|
|
81121300
|
Beryllium waste and scrap (excl. ashes and residues containing beryllium)
|
Non-ferrous metal wastes
|
|
81122200
|
Chromium waste and scrap (excl. ash and residues containing chromium and chromium alloys containing > 10% by weight of nickel)
|
Non-ferrous metal wastes
|
|
81123040
|
Germanium waste and scrap (excl. ashes and residues containing germanium)
|
Non-ferrous metal wastes
|
|
81124010
|
Unwrought vanadium; vanadium powders; vanadium waste and scrap (excl. ash and residues containing vanadium)
|
Non-ferrous metal wastes
|
|
81125200
|
Thallium waste and scrap (excl. ashes and residues containing thallium)
|
Non-ferrous metal wastes
|
|
81129210
|
Unwrought hafnium "celtium"; hafnium powders; hafnium waste and scrap (excl. ash and residues containing hafnium)
|
Non-ferrous metal wastes
|
|
81129221
|
Niobium "columbium", rhenium, gallium, indium, vanadium and germanium waste and scrap (excl. ashes and residues containing these metals)
|
Non-ferrous metal wastes
|
|
81129239
|
Niobium "columbium" and rhenium waste and scrap (excl. ash and residues containing these metals)
|
Non-ferrous metal wastes
|
|
81129250
|
Gallium and indium waste and scrap (excl. ashes and residues containing these metals)
|
Non-ferrous metal wastes
|
|
81129291
|
Unwrought vanadium; vanadium powders (excl. ash and residues containing vanadium)
|
Non-ferrous metal wastes
|
|
81130040
|
Waste and scrap of cermets (excl. ashes and residues containing cermets)
|
Non-ferrous metal wastes
|
Annex 6: Summary of the Evaluation
The Waste Shipment Regulation has been evaluated under five criteria, namely the Regulation's effectiveness, efficiency, relevance, coherence and EU added value. Commission Regulation (EC) 1418/2007 adopted pursuant art. 37(1) of the WSR, was also taken into consideration.
1.Findings
1.1 Effectiveness
The WSR has established a robust legal framework, which has been implemented by the Member States and generally led to a better control of shipments of waste and the environmentally sound management of shipped wastes at national and EU level.
However, various challenges remain:
·First, different levels and manners of applying and enforcing the WSR, often combined with diverging interpretations of its provisions, result in suboptimal implementation throughout the EU. One concrete example relates to end-of-waste criteria and their different interpretations across Member States. This results in delays in and burdens on shipments of wastes across the EU, despite the fact that in many cases waste flows are of good quality and are sent for proper recovery.
·Second, illegal shipments of waste and illegal treatment of legally shipped waste remain a considerable problem. This is the case especially for export of wastes outside the EU, in particular to developing countries. There are also illegal shipments of wastes within the EU, linked to activities of organised criminal networks. The persistence of illegal waste shipments is inter alia due to the fact that competent authorities in Member States often lack comparable resources and that Member States do not cooperate sufficiently. Illegal shipments find the path of least resistance to get through or leave Europe. The difficulties for competent authorities of the EU Member States to verify that waste exported outside the EU is managed in an environmentally sound management in the importing countries is a particular challenge.
Sustained and improved enforcement efforts are vital in this context, including through targeted inspections and controls, deterrent penalties, and by tackling understaffing. These issues are under the responsibility of Member States in the first place. In recent years, important EU initiatives have nevertheless been taken in this field, such as the revision of the WSR in 2016 (which aimed at reinforcing inspections on illegal shipments of waste) and the strengthening of EU policy and actions against environmental crime. Despite this, there still is ample scope to reinforce an EU integrated approach to combat illegal shipments of waste.
·Finally, while Regulation (EC) No 1418/2007 regulating exports of non-hazardous wastes to non-EU, non-OECD countries has contributed to the achievement of the WSR’s evironmental objectives, in its current from it suffers from a slow and very resource intensive update mechanism.
1.2 Efficiency
It is difficult to provide a comprehensive quantitative evaluation of the costs and benefits of the WSR. Little or no data is available.
Costs can typically be attributed to certain actors and have a more or less immediate effect, while benefits are typically societal, much broader, and difficult to attribute to the regulation.
This is also why business often consider costs being more significant than benefits: they bear the costs and do not seem to get direct benefits. Nonetheless, in general stakeholders agree benefits outweigh costs.
Costs linked to the implementation of the WSR were identified at different levels, notably at public authority, company and societal level. For Member States, resources for inspection and law enforcement infrastructure represent the main share of the costs together with the costs for dealing with illegal shipments. Costs for companies are linked to administrative requirements, direct financial costs and dispute settlement costs. Different interpretations of whether and how a material is classified as waste often lead to costly delays in waste shipments.
Most of the direct costs linked to the WSR are of procedural and administrative nature. The main obstacles are the complex and time-consuming - often paper-based – notification procedures.
The lack of common interpretation of WSR provisions also leads to delays in shipments. These delays can e.g. lead to additional storage costs for waste whilst decisions are pending, as well as to shipments being rerouted to destinations where they would be treated in a less environmentally sound manner than initially planned.
Another major cost - mostly for Member State competent authorities - concerns the taking back of illegal waste shipments.
Benefits are mainly societal. The most important societal benefits stem from better environmental protection. Job creation in the waste treatment sector can also be counted as a benefit.
For Member States, but also for companies, the WSR represents a tool for monitoring waste shipments. For companies the enhanced legal clarity, compared to the absence of the Regulation, is a benefit.
In general, public bodies are of the view that the costs involved in the implementation of the WSR are justified by its benefits, while business operators often feel the opposite. The business sector generally believes that the costs stemming from the Regulation are high. This is especially the case for SMEs, which feel that costs and administrative burdens linked to the Regulation’s implementation are not proportionate to their activity and revenues. Additionally, they face a higher risk of mishandling administrative procedures, which increases the chances of getting their shipment classified as illegal.
The lack of substantial data means that it is difficult to draw conclusions on the cost-benefit ratio of the WSR at different levels (i.e. local, national and EU). However, interviews with businesses suggest that some local authorities require more stringent insurance documents as well as a fee for providing advice on how to fill them in. Moreover, there have been cases where (local) authorities do not have the required knowledge to determine whether a shipment is legal or not. This has entailed higher costs for economic operators in terms of delay and repatriation costs.
1.3 Relevance
Relevance of the WSR for environmental and health protection
The WSR is relevant to protect the environment and human health within the EU, as well in as neighbouring states and third countries, inter alia by reducing the risks associated with shipments of hazardous waste and of waste for disposal. Illegal shipments and environmentally unsound management of shipped waste still occur though.
The WSR and circular economy
Promoting the transition towards a circular economy and protecting the environment and human health in Europe have emerged as pillars of the EU policy for sustainable development. A specific milestone was the adoption of the Circular Economy Action Plan in 2015. The WSR was developed much earlier and focussed on the protection of the environment and human health; it was not specifically designed to promote the transition towards a circular economy. The creation of a safe and yet dynamic market for secondary raw materials in the EU is a key enabler for a European circular economy, which requires smooth cross-border circulation throughout the EU for waste streams destined for recycling. The procedures and administrative burdens linked to the WSR sometimes act as a disincentive to the circulation of these waste streams within the EU.
Relevance of the WSR in terms of the Basel Convention and the OECD Decision
The WSR is definitely relevant to international agreements such as the Basel Convention and the OECD Decision. It has encouraged their implementation throughout the European Union in a way tailored to the EU waste management situation.
1.4 Coherence
Synergies as a result of the interaction of the WSR with other legislation
There are synergies between the WSR and other pieces of EU waste legislation, especially the Waste Framework Directive and Directives covering specific waste streams. The ELV Directive, Batteries Directive, the Packaging and Packaging Waste Directive and the WEEE Directive all contain specific provisions on transboundary movement of the waste streams in question that refer to the WSR. Since the WSR’s adoption, waste shipments of these streams, especially within the EU, have increased.
Weaknesses, contradictions and inconsistencies of the interaction of the WSR with other legislation and policy objectives
Despite the synergies that do exist, several challenges remain. Illegal shipments and waste shipments organised by illegal operators still occur in the area of the waste stream legislation mentioned above.
The codes used in the Basel Convention, the OECD, the EU List of Waste and those applied for customs purposes are all different. Work is ongoing to align some of the codes. Nevertheless, the varying classification as “waste” or “non-waste”, or as “hazardous” or “non-hazardous” waste and the interpretation of related definitions in different Member States make shipments of certain waste streams difficult. Other inconsistencies are related to animal by-products and to the interface between waste, chemicals and products legislation.
In 2018, an important part of EU waste legislation was substantially amended to enhance its contribution to a circular economy (e.g. more ambitious recycling rates). The WSR itself, however, does not clearly reflect the need to favour recycling (and preparation for re-use) over other recovery operations (like incineration), so that in this respect it is not fully aligned with the rest of EU waste legislation.
Another challenge is the link between the WSR provisions on the export of waste outside the EU and the methodology used to calculate recycling rates in other pieces of EU waste legislation. The WSR provisions that set the conditions in that respect are not sufficiently prescriptive to ensure that recycling actually happens properly in the destination countries.
Yet another inconsistency relates to the EU customs legislation. Different interpretations of classification codes used in EU customs legislation versus those applied under the WSR leadto some delays for shipments in view of difficulties by customs and waste administrations to make sure that both customs and waste legislation are properly complied with.
The WSR and the EU internal market
In its current form, the WSR is not fully facilitating the creation and promotion of a market for secondary materials, partly because of different interpretations across Member States, and also because the current Regulation was not crafted with this explicit objective in mind.
The multiplication of import restrictions by third countries will only reinforce the need for the EU internal market to be more oriented towards facilitating high quality recycling.
Internal coherence of the WSR
No major problems were identified as regards the internal coherence of the articles of the WSR itself, nor with respect to the coherence of the WSR with Regulation (EC) No 1418/2007.
Coherence of the WSR with Member State internal strategies and with Article 33
The WSR appears to be by and large coherent with Member State internal policies and strategies. However, the interpretation of the Regulation in each country varies, even at subnational level.
Coherence of the WSR with the Basel Convention and OECD decision C(2001)107
In general, the WSR is coherent with these overarching international instruments. However, there are a few differences, such as:
·Differences in the waste classification systems
·Financial guarantees (more detailed in WSR)
·Differences in the requirements for green-listed waste (as compared to the Basel Convention)
·Differences in the time for competent authorities to respond to notifications (compared to the Basel Convention)
In addition, the way in which the Basel Convention and the OECD Decision are implemented in the EU through the WSR limits the EU’s ability to adopt rules which would apply to intra-EU shipments only.
1.5 EU Added Value
The WSR has provided for greater consistency of approaches across Member States and has offered useful extra detail and legal clarity compared to the Basel Convention and the OECD Decision. Throughout the consultation, Member States underlined the importance of the WSR being implemented consistently throughout the EU.
While circular economy objectives are currently not an explicit part of the WSR, the Regulation is a key instrument to promote it within the EU. If the WSR were to make a greater contribution to the circular economy, while continuing to reduce negative impacts on the environment and public health, this would significantly increase its EU added value.
EU added value of regulation (EC) No 1418/2007
Regulation 1418/2007 provides useful information on waste import regimes in third countries that would otherwise be more dispersed. This information helps to reduce EU exports of (non-hazardous) waste that is not wanted in those countries. However, the formal process of updating the information takes significant time and is resource intensive. This means that it can become out of date, the clearest recent example being the Chinese rules on plastic and other waste imported. Improving the timeliness of the data collection would impose substantial additional administrative burdens on the Commission, in what is already a time-consuming task. Future work on the WSR could however look into different ways of providing up-to-date information.
What would be the most likely consequences of stopping EU action?
The likely result would be that cross-border waste shipments would only be controlled by the Basel Convention, the OECD Decision and agreements between individual Member States. Negative consequences would stem from the lack of consistency and detail on the applicable rules. This would lead to an increase in environmental risks, slower progress towards the goals of the waste hierarchy and the circular economy (due to even higher barriers to the movement of waste to, adequate recycling facilities in other Member States) and potential distortions in the waste market (due to the lack of a level playing field). The legal clarity and certainty, for example the right to return illegal waste shipments (both within the EU and from outside the EU) would also be become less well defined without EU level action.
Lessons learnt
The Regulation has contributed to more harmonised and detailed implementation of international instruments such as the Basel Convention. Through that, it has performed well on its environmental objectives as it has resulted in better protection of human health and the environment. However, a number of challenges clearly remain.
A range of factors is perceived among public and private stakeholders to have negatively influenced the implementation of the WSR. These factors include:
·Lack of consistent implementation of the Regulation across the EU: over the years, a number of provisions have been implemented in different ways;
·Administrative burden related to procedures;
·Lack of harmonisation in enforcement: differences in enforcement levels and practices seem to exist throughout Member States.
The lack of a common interpretation of relevant provisions and procedures leads to disputes between Member States, as well as between Member States and third countries. These range from different quality levels to divergence in waste classification.
Competent authorities mainly call for adjusting the legislation, rather than substantially restructuring it: more guidance and deeper harmonisation of how the WSR is implemented is considered a higher priority than introducing fundamental changes to the legislation itself.
Time is a key element for business operators. Easier and faster notification and pre-consent processes (including a fast-track system) would be greatly beneficial to economic operators. Moreover, harmonising national approaches on dealing with the procedures and enforcement would help in solving inefficiencies.
The need to look into the provisions on the export of waste outside the EU was also highlighted, in view of the challenges linked to controlling that they managed properly in the importing countries.
Further suggestions made during the evaluation were the necessity for increased cooperation between competent authorities, a harmonised application of procedures, including related timeframes and clear enforcement deadlines.
In general, identified good practices are linked to better integrating technological tools and streamlining of outdated procedures (e.g. use of paper). The increasing inter-operability of different national electronic systems contributes to the set of technological good practices. On the other hand, bad practices can arise from the inability of such systems to communicate with each other. For example, certain Member States are already establishing an electronic data exchange as a means of reducing administrative burden – but a standardised and coordinated system across Europe would contribute to harmonisation and has the potential to increase efficiency while also reducing the likelihood of administrative errors, allowing for more resources to be redirected into inspections for illegal shipments.
If the WSR would enable better a circular economy approach, while continuing to reduce negative impacts of waste shipments on the environment and public health, this would significantly increase its EU added value. There is a strong call to better connect the objectives of the WSR to those of the EU’s ongoing transition to a circular economy and to ensure that it facilitates the most “circular” waste treatment option.
Annex 7: Facts, figures and trends in waste Shipments
The figures in this Annex are drawn from Eurostat data and the preparatory study for this Impact Assessment by Trinomics and Wood. It should be noted here that the predictions on the export of waste until 2030 in this Annex are based on a linear regression analysis that has its limitations as regards forecasting how exports will evolve in the near future.
1.Key figures on the waste treatment sector in the EU
The turnover of the waste management sector is over EUR 165 billion, divided between collection accounting for 64 billion EUR, treatment and disposal 40 billion EUR and materials recovery 61 billion EUR.
Data from ESTAT on economic activities in the waste management sector (collection, treatment, recovery, and disposal of waste) shows that micro and small companies dominate the sector, as illustrated in the figure below.
Figure G.1 – Number of enterprises
Source: Eurostat, sbs_sc_ind_r2
The structure per country is extremely heterogeneous regarding the size and the number of companies, which indicates different approaches at national level.
In terms of turnover, medium and large companies dominate the waste management sector as illustrated in the figure below. The largest companies that dominate the market in terms of turnover are likely to be those most involved in the shipment of waste within and outside the EU.
Figure G.2 – Turnover in waste management
2.Key figures on shipments of waste within the EU and outside the EU
General data on shipments of “green-listed” waste in the EU and outside the EU
The shipments of “green-listed” waste within the EU represents around 50 million tonnes.
The figure below shows the share of the intra- and extra-EU shipments of waste by weight for the most important waste streams traded within and outside the EU - ferrous metals, non-ferrous metal, paper and cardboard, textiles, plastics and glass. Intra-EU shipments comprise the largest quantity by volume of nearly all waste types, except for textiles where the split shows slightly larger amounts towards extra-EU destinations compared to intra-EU. Ferrous metal shipments dominate the market by weight, followed by paper and cardboard and non-ferrous metals.
Figure G.3 – Share of intra- and extra-EU shipments per Member State
The economic profile and geographical position of a Member State influence the intensity of waste export by intra- and extra-EU destination. Some Member States are generally relying more than others, on exports of wastes (be it to other EU Member States or outside the EU). DE is by far the largest exporter of waste by volume, reflecting that industrialised countries are important actors in the shipment of waste. BE and NL are among the largest exporters of waste to third countries, largely due to their port infrastructure. Together with DE, these countries receive considerable amounts of waste from other Member States, and then export it outside the EU. For instance, these three countries received 40% of all plastic waste shipped from other Member States in 2019. Due to their geographical conditions and limited treatment capacity, Member States such as IE, CY, MT are dependent on exports outside the EU. IT and FR also rely more than other Member States on exports due to insufficient domestic capacity.
Additional data per type of “green-listed” waste is presented in the box below.
Box G.1
|
Summary of the information on the intra-EU shipments per waste material
·Ferrous metals: IT, BE, ES and LU appear to be the overall countries of destination for ferrous metal wastes from other EU Member States. DE, FR and FR appear to rely more heavily on exports to other Member States of their ferrous metal wastes. Imports into Italy are reported (industry interview) as being relatively high due to the high use of electric arc furnaces in iron and steel production in Italy. These are capable of using a much higher proportion of waste material than blast furnaces (which are more common in German steel making plants). Germany appears to have the largest number of shipments by waste moving into and out of the country. Germany produced over 40M t of crude steel in 2019 (25% of crude steel production in the EU). With net exports of just under 3.5M t, German exports of ferrous metal waste represent just under 10% of total production. When compared with FR, that accounts for 14.5M t of crude steel production in 2019, net exports as a percentage of production in FR are 30% of total production. A similar proportion to FR is found in CZ;
·Paper and cardboard: AT, DE, ES, HU and NL appear to be the overall countries of destination for paper and cardboard wastes from other EU Member States. CZ, DK, FR and PL appear to rely more heavily on exports to other Member States of their paper and cardboard wastes;
·Non-ferrous metals: When considering the significant volume of shipments originating from or entering DE, the balance of imports versus exports is relatively small. DK, FR and NL are the largest Member States by volume that export more non-ferrous metal waste than they import, whereas AT, ES and IT show increasing trends of net volumes imported increasing over time;
·Plastic waste: Some Member States (FR, DE and SE) consistently rely on exports whilst others appear to be expanding their imports (most notably CZ, and RO);
·Textile waste: Some Member States (AT, BE, DE, FI, FR, PT and SE) consistently rely on exports, whilst others are generally net importers of textiles waste (most notably BG, ES, HU, IT, LT, NL, PL and RO);
·Glass waste: Some Member States (BE, HU, EL, HU, NL, RO, SE and SI) consistently rely on exports, whilst others appear either to be expanding their imports of glass waste overall (most notably CZ) or are large destinations for glass waste overall (DE and PT).
|
General data on shipments of “notified” waste
The table below presents data on the shipments of “notified” waste (i.e. hazardous and other waste, which are difficult to recover). In 2017, these shipments amounted to around 25 million tonnes for EU28, of which hazardous waste represent around 8 million tonnes and other types of waste (including mixed municipal waste, refused derived fuels or waste from the construction/demolition sector) around 17 million tonnes. While shipments of hazardous waste have remained relatively stable, the shipments of other “notified” waste have been increasing considerably since 2001. The shipments of notified waste takes place mostly within the EU and, to a small extent, EFTA countries.
Figure G.4 - Shipments of hazardous and other notified waste waste from EU28
3.Exports outside the EU
Turkey is presently the largest destination for waste exported from the EU, with a volume of around 11.4 million tonnes shipped in 2019. This was almost three times as much as in 2004. The second largest destination is India, which received almost 2.9 million tonnes of waste from the EU in 2019, followed by the United Kingdom (1.9 million tonnes), Switzerland (1.6 million tonnes) and Norway (1.5 million tonnes).
In contrast to exports, EU imports of waste from non-EU countries have fallen both in the long and short term. In 2019, these imports stood at 16.7 million tonnes in 2019, down 2% on 2018 and 6% in 2004. The waste imported from non-EU countries amounted to approximately €12.8 billion in 2019
.
Figure G.5 - Exports and imports of the main categories of waste from/to the European Union (source: Eurostat)

Export to countries members of the OECD vs export outside the OECD
The table below provides an overview of the shares of (i) export of waste from the EU to countries members of the OECD and (ii) waste exported from the EU to non-OECD member countries (in volume, based on 2018/2019 average values, extracted from the Comext database).
Table G.1 shares of export of waste to OECD vs non-OECD
|
Waste type
|
OECD
|
Non-OECD
|
|
Ferrous metal
|
74.44%
|
25.56%
|
|
Glass
|
80.39%
|
19.61%
|
|
Non-ferrous metals
|
28.92%
|
71.08%
|
|
Paper & cardboard
|
15.54%
|
84.46%
|
|
Plastic
|
28.66%
|
70.34%
|
|
Textiles
|
6.48%
|
93.52%
|
It should also be noted that the export of hazardous waste from the EU goes exclusively to countries members of the OECD, as it is prohibited to export such waste to non-OECD countries.
Ferrous metal waste
Ferrous metal waste is by far the largest category of waste exported in terms of tonnes and value, with over 15 million tonnes being exported in 2019, representing a value of approximately 4 billion euro. Approximately 94% of all third country exports end up in one of the top ten countries. Despite some fluctuation in volume, exports of ferrous metal wastes have generally remained somewhat stable over the period 2004 to 2019.
The destination of ferrous metal wastes shows a relatively stable pattern in terms of destination countries with Turkey the country of destination for a significant proportion of ferrous metal waste from the EU. This is keeping with global import data on ferrous metal wastes where it is clear that Turkey imports 2.5 times more ferrous metal waste from the rest of the world than the second largest importer - India
. Examining third country destinations of EU ferrous metal wastes for the last four full reporting years under Comext the data in Tables 2(a) and (b) has been extracted.
Despite the large tonnage of ferrous metal scrap exported to third countries, a significantly larger volume of such wastes is shipped between EU Member States (see figure G.6). Whilst patterns vary by Member State, it is apparent that the internal market for EU ferrous metal scrap remains an important destination for wastes generated within the EU.
Table G.2(a) top ten destination countries of EU ferrous metal wastes for the period 2016-2019 (by weight)

Table G.2(b) top ten destination countries of EU ferrous metal wastes for the period 2016-2019 (in euro value)

Figure G.6 - Shipments of ferrous metal waste from EU Member States split by intra- and extra-EU destination for 2019
The expectation using a linear regression forecast is that exports will likely rise gradually to 2030 as demonstrated in Figure G.7 below.
Figure G.7 - Baseline forecast of ferrous metal waste exports in tonnes from the EU to third countries for the period 2004-2030
The total value of ferrous metal waste exports to third countries shows a similar growth as exports by weight as shown in Figure G.8 below.
Figure G.8 - Baseline forecast of ferrous metal waste exports values in total euro from the EU to third countries for the period 2004-2030
The prediction of price per tonne of ferrous metals shows a generally similar pattern of stability as shown in Figure G.9 below.
Figure G.9 - Baseline forecast of ferrous metal waste EUR/ tonne value for exports to third countries for the period 2004-2030
Paper and cardboard waste
Paper and cardboard waste exports are the seconde largest category of waste exported outside the EU in volume. Around 7 million tonnes of paper and cardboard waste were exported in 2019, representing a value of approximately 500 million euro. They have shown a general trend of a small decline in exports from the EU to third countries over the period 2010 to 2019.
The top 10 destination third countries of paper and cardboard waste from the EU are shown in the Table below. Third country export destinations are dominated by East and South Asia, with India, China and Indonesia as significant importers of EU paper and cardboard waste. Approximately 91% of all paper and cardboard waste goes to the top ten countries.
Table G.3(a) Top ten destination countries of EU paper and cardboard wastes for the period 2016-2019 (by weight)

Table G.3(b) Top ten destination countries of EU paper and cardboard wastes for the period 2016-2019 (in EUR value)

As shown in figure G.10, for some Member States shipments of paper and cardboard waste are almost exclusively made to other EU Member States – this is the case for larger exporters such as AT, CZ, DK, PL, SE and SK. DE and FR, whilst exporting two of the top three volumes of paper and cardboard waste of all Member States in 2019, export a majority of those wastes intra-EU. NL and IT are largely dependent on exports to third countries whilst, IE and ES almost entirely dependent on third country exports.
Figure G.10 - Shipments of paper and cardboard waste from EU Member States split by intra- and extra-EU destination for 2019
The export tonnage has been predicted to stabilise, with exports in 2030 remaining slightly higher than in 2019 as shown in Figure G.11 below.
Figure G.11 - Baseline forecast of paper waste exports in tonnes from the EU to third countries for the period 2004-2030
The total Euro value of paper waste exports from the EU to third countries has shown a similar fluctuation to total tonnage over the period (see Figure G.12). The total value is expected to climb to 2030.
Figure G.12 Baseline forecast of paper waste exports values in total euro value from the EU to third countries for the period 2004-2030
The change in euro/ tonne value is shown in Figure G.13 below with the forecast value expected to remain fairly constant over the period to 2030.
Figure G.13 Baseline forecast of paper waste euro/ tonne value for exports to third countries for the period 2004-2030
Plastic waste
Exports of plastic waste have decreased between 2017 and 2019, largely driven by third countries’ bans to the import of plastic wastes, most notably in China. It was a major destination of EU plastic waste prior to 2019. In 2019, 1.5 million tonnes of plastic waste were exported, whereas a decade ago the export had grown to an amount of 2.5 tonnes exported annually. The ban of imports of plastic waste by China has led to a general reduction in total exports as well as increase to specific countries (Malaysia and Turkey especially). Approximately 86% of all exports from the EU end up in one of the top ten countries.
Table G.4(a) Top 10 third-country destinations of EU plastic waste for the years 2016-2019 (by weight)
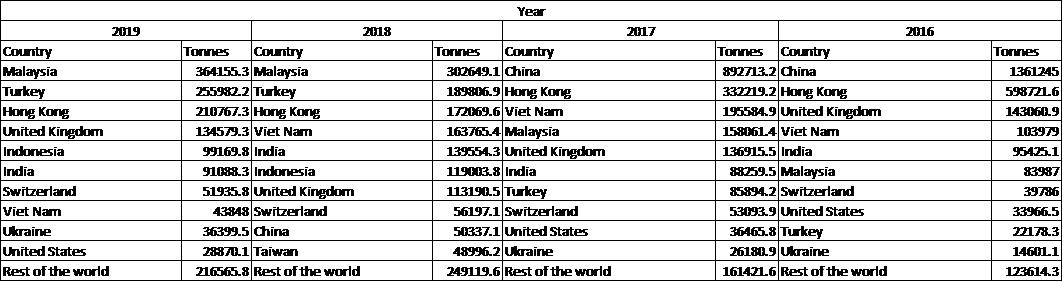
Table G.4(b) Top 10 third-country destinations of EU plastic waste for the years 2016-2019 (in euro value)

Germany is by far the country shipping the largest volume of plastic waste outside its borders. For some countries, the important volume of exported waste can be explained by the presence of large sea ports in their territory (Belgium, the Netherlands). For Belgium, Germany and the Netherlands approximately half of the plastic waste shipped goes to other Member States and the other half is exported to third countries. For France, more than 75% of shipments are made to other EU Member States.
Figure G.14 - Shipments of plastic waste from EU Member States split by intra- and extra-EU destination for 2019
Using a linear regression with a 95% confidence rate the prediction is that plastic exports will likely stabilise in comparison to the dramatic drops seen since 2016, with a gradual rise seen to the period to 2030, as shown in Figure G.15 below.
Figure G.15 --- Baseline forecast of plastic exports in tonnes from the EU to third countries for the period 2004-2030
An examination of the total economic value of the plastic waste exported shows a similar picture, as shown in G.16 below.
Figure G.16 - Baseline forecast of plastic exports values in euro from the EU to third countries for the period 2004-2030

Furthermore, the fluctuation of the value of plastic waste is an important aspect of the baseline and has been plotted in Figure G.17 below that generally shows a relatively stable value moving forward to 2030.
Figure G.17 - Baseline forecast of the EUR/tonne value of plastic waste exports from the EU to 2030
Non-ferrous metal waste (including precious metals)
Non-ferrous metal wastes for the purpose of this study comprise a large number of different non-ferrous metal waste types. As a general trend for all of these wastes combined, exports from the EU to third countries have been gradually increasing from 1 million tonnes in 2004 to almost 2 million tonnes in 2019, with an overall value of 6 billion euro. Non-ferrous metal scraps are the most valuable types of waste exported in such volums from the EU.
However, the underlying trend masks a large degree of variation in the quantities of different non-ferrous metals being exported as shown in the Figure below.
Figure G.18 - Exports of non-ferrous metal wastes from the EU to third countries by combined nomenclature code for the period 2004-2019
As can be seen in the above figure, aluminium scrap (76020090) waste and scrap of copper alloys (74040099), waste and scrap of copper-zinc base alloys (74040091), waste aluminium (76020019) and waste and scrap of refined copper (74040010) are by far the largest non-ferrous metals exported in terms of tonnage.
The total Euro value of exports of non-ferrous metal wastes shows a large degree of stability over the last sixteen years. The third country destinations of non-ferrous metal wastes from the EU are the most consistent of all of the non-hazardous wastes addressed in this study, as shown in the table below.
Table G.5(a) Top ten destination third countries of non-ferrous metal wastes exported from the EU (by volume)

China, India and the UK are the largest destination countries, with the top ten destination countries covering 85% of all EU exports of non-ferrous metal wastes, the remaining 15% being other countries around the world.
In examining the top ten destination countries of EU non-ferrous metal waste by value the list changes somewhat, indicating that for some countries the value of waste per tonne shipped (for example to India, Pakistan and Turkey) is less than for others such as the United States and Switzerland.
Table G.5(b) Top ten destination third countries of non-ferrous metal wastes exported from the EU (in EUR value)

73% of non-ferrous metal waste shipments are made intra-EU, meaning that a large majority of non-ferrous metal wastes are not exported to third countries. However, the percentages of export vary by Member State as shown in the Figure below for the year 2019. Proportionally, Ireland, Spain, Sweden and Belgium export the largest proportion of their transboundary shipments to third countries. However, of these countries Sweden and Belgium still export more non-ferrous metal wastes to other Member States than to third countries.
Figure G.19 - Exports of non-ferrous metal waste from EU Member States split by intra- and extra-EU destination for 2019
Non-ferrous metal wastes comprise a large number of different non-ferrous metal waste types. As a general trend for all of these wastes combined, exports from the EU to third countries have been gradually increasing. This is shown in Figure G.20 below.
Figure G.20 - Baseline forecast of non-ferrous metal waste exports in tonnes from the EU to third countries for the period 2004-2030
However, the underlying trend masks a large degree of variation in the quantities of different non-ferrous metals being exported as shown in Figure G.21. As can be seen in this figure, aluminium scrap (76020090) waste and scrap of copper alloys (74040099), waste and scrap of copper-zinc base alloys (74040091), waste aluminium (76020019) and waste and scrap of refined copper (74040010) are by far the largest non-ferrous metals exported in terms of tonnage.
Figure G.21 - Exports of non-ferrous metal wastes from the EU to third countries by combined nomenclature code for the period 2004-2019
The total Euro value of exports of non-ferrous metal wastes shows a large degree of stability over the last sixteen, that is predicted to continue to rise slowly for the next ten years as shown in G.22 below.
Figure G.22 - Baseline forecast of total euro value of non-ferrous metal exports from the EU to third countries for the period 2010-2030
The variety of non-ferrous metals included in this category, particularly as a result of precious metals also being grouped together with other non-ferrous wastes, means that a EUR/tonne value offers little value. To demonstrate the large variability in prices the values for the last nine years for each non-ferrous metal type have been extracted and are included in Figure G.23 below.
Figure G.23 - EUR/tonne value of non-ferrous metal wastes for the period 2010-2019 split by CN code
Gold wastes (71129100) and hafnium wastes (81129210) are, by far, the most valuable non-ferrous metals exported by the EU in terms of EUR/tonne. However as the volumes of gold waste exported are generally small (a maximum of 1192 tonnes was exported in a single year in 2019 taking into account exports over the last decade), and hafnium waste even smaller (a maximum of 53.8 tonnes was recorded in 2016), they represent overall a small volume of waste by tonnage (0.06% of EU total non-ferrous metal waste exports in 2019) whilst representing, in the case of gold, 13.5% of the total euro value of all non-ferrous metal exports in 2019.
Textile wastes
Exports of textile wastes by volume have seen a steady climb over the period 2010-2019, with 1.5 million tonnes of textile waste being exported in 2019, representing a value of around 1.1 billion euro.
Textile wastes from the EU are made to a far more diverse set of countries than the other specific wastes considered in this study, as shown in the Tables below.
Table G.6(a) Top ten destination countries of EU textile wastes for the period 2016-2019 (by volume)

Table G.6(b) Top ten destination countries of EU textile wastes for the period 2016-2019 (in EUR value)

Whilst the names of the top 10 countries are relatively stable, these top 10 countries address between 55 and 58% of all exports, indicating that the waste market for EU textile waste is subject to a broad geographic spread.
As can be seen in the Figure below, DE, FR, BE, NL, IT, PL and ES represent the greatest exporters of textile waste. Proportionally, BE, ES, IT, LT and PT are heavily reliant on export of textile wastes to third countries in comparison to intra-EU shipments.
Figure G.24 - Shipments of textile waste from EU Member States split by intra- and extra-EU destination for 2019
Exports of textile wastes by volume have seen a steady climb over the period 2010-2019, with an expectation that the trend will continue to 2030 as shown in Figure G.25 below.
Figure G.25 - Baseline forecast of textile waste exports in tonnes from the EU to third countries for the period 2004-2030
Textile wastes are generally a high value waste. In keeping with the trend of total tonnes of exports, the total euro value of textile waste exports has risen since 2004 and is expected to maintain a similar trajectory to 2030 as shown in Figure G.26 below.
Figure G.26 - Baseline forecast of textile waste exports values in total EUR from the EU to third countries for the period 2004-2030
In keeping with the trends in terms of total tonnage and euro value of textile wastes being exported to third countries, the EUR/tonne value of textile wastes as shown in Figure G.27 shows an increase, albeit more gradual than the two former metrics, between 2010 and 2019 that is forecast to continue to 2030, albeit the 2030 value would be somewhat commensurate with the peak in value in 2014.
Figure G.27 - Baseline forecast of textile waste euro / tonne value for exports to third countries for the period 2004-2030
Glass waste
The volume of waste glass exported from the EU to third countries was relatively stable for the first half of the last decade, but increased in more recent years. In 2019, around 350 000 tonnes of glass waste was exported, representing a value of over 40 miliion euro.
The nature of the types of waste glass exported has a significant impact of the value per tonne. Waste glass cullet is the least expensive type of waste glass exported, whilst optical glass is the most expensive. Allocating a single EUR/tonne glass value is, therefore, a poor marker of reflecting the value of waste exports.
Table G.7(a) Top ten third country destinations for waste glass for the years 2016-2019 (by volume)

Table G.7(b) Top ten third country destinations for waste glass for the years 2016-2019 (in EUR value)

Since its departure from the EU, the UK is by far the largest destination of glass exported from the EU. Equal to almost all of the other countries of destination put together. Glass waste is notable for the limited quantities of waste shipped beyond continental Europe in comparison to other wastes considered in this study. This is confirmed by an examination of the split of exports of glass waste by Member State split by intra- and extra-EU destination for 2019 as shown in the Figure below.
Figure G.28 - Exports of waste glass from EU Member States split by intra- and extra EU destination for 2019
Over time, the trend as shown in the Figure below is expected to occur.
Figure G.29 - Baseline forecast of glass waste exports in tonnes from the EU to third countries 20042030
Similarly, the total euro value of waste glass exported to third countries has seen an increase over the last few years as shown in Figure G.30 below.
Figure G.30 - Baseline forecast of glass waste exports in euro from the EU to third countries for the period 2004-2030
The nature of the types of waste glass exported has a significant impact of the value per tonne. Waste glass cullet is the least expensive type of waste glass exported, whilst optical glass is the most expensive. Allocating a single EUR/tonne glass value is, therefore, a poor marker of reflecting the value of waste exports and has not been included in this report accordingly.
Hazardous waste
Total generation of hazardous waste by the EU-27 has risen from 80.7 million tonnes in 2004 to 94.6 million tonnes in 2016. The volume of hazardous waste shipped outside the Member State where they are generated represent around 7 million tonnes (see table below). Out of these 7 millions of tonnes, the large majority is shipped to another Member State, while the volume of waste shipped outside the EU represents around 0.7 million tonnes. Hazardous waste exported outside the EU are shipped mostly to EFTA countries, and the rest to other countries located in the OECD. It is banned to export such waste outside the OECD.
Compared to the general situation where hazardous waste are mostly managed in the country where they are generated, the Outermost Regions represent a particular situation, as their capacity to manage hazardous wastes generated is limited and exports often are a necessity.
Tbale G.8 Shipments of hazardous waste from EU Member States to EU and non-EU countries

Figure G.31 - Export of Hazardous Waste outside the EU (all treatments), 2001-2017 in tonnes

Not all hazardous waste generated is shipped across borders. In fact, the volumes shipped within the EU represent a relatively small percentage of hazardous waste generated. The exception to this is in relation to the Outermost Regions where the capacity to manage hazardous wastes generated is limited and exports are a necessity.
Using linear regression, a comparison of the data that forms the abovementioned figure and the data reported under Article 51(1) of the WSR as shown in Figure G.32 below shows that whilst approximately 9% of EU hazardous waste generated within the EU was shipped to another Member State in 2010, by 2030 that value is expected to be less than 8%.
Figure G.32 - Baseline comparison of EU hazardous waste generation with EU hazardous waste shipped within the EU to 2030
Figure G.33 below shows that, in most Member States, hazardous waste are treated domestically, but that a few Member States depend on export for a large share of this waste, i.e. more than 20% for Austria, Belgium, Denmark, Greece, Malta, Slovenia, and even 60% for Ireland and 80% for Luxembourg.
Figure G.33 – Shipment of hazardous waste out of eachMember State

Mixed municipal waste
Regarding mixed municipal waste, as per hazardous wastes above, the volume of waste varies across the EU-27. Taking data from Eurostat env_wasmun, volumes of municipal waste generation for each Member State from 2009-2018 are shown in Figure G.34 below.
Figure G.34 - Generation of municipal waste by EU Member State for the period 2009-2018
In keeping with a general trend of larger economies, levels of affluence and sizes of population generating larger volumes of municipal waste the figure above demonstrates that these trends are true for the EU-27.
Examining trends in generation of municipal waste for the EU-27 for the period up to 2030, the general trend using a linear regression with a 95% confidence interval indicates a generally downward trend in municipal waste generation in the years to come as shown in G.35 below.
Figure G.35 - Baseline prediction of municipal waste generation for the EU-27 to 2030
The quantity of notified mixed municipal waste subject to shipments across EU borders represents a small proportion of municipal waste generated. However, the EEA report identified specific countries that rely more significantly on exports for the treatment of residual municipal waste (e.g. Ireland and Slovenia). As shown in Figure G.36 below that uses data from reporting under Article 51(1) of the WSR and held by Eurostat for the period 2010-2018 and applies a linear regression with 95% confidence to predict changes to 2030.
Figure G.36 - Baseline prediction of shipments of municipal waste for the EU-27 to 2030
Furthermore, mixed municipal waste represents a relatively small proportion of all waste subject to the notification procedure within the EU. Figure G.37 below provides this comparison, alongside other types of waste that are likely to be derived from municipal waste types (191210 combustible waste (refuse derived fuel) and 191212 other wastes (including mixing of materials) from mechanical treatment of wastes) indicating that 2014 has the highest reported proportion of municipal waste subject to the notification procedure compared to all such wastes, with the forecast using a linear regression for 2030 indicating that the proportion may rise to approximately 17% of all wastes subject to the notification procedure by that time.
Figure G.37 - Baseline forecast of wastes subject to notification separate by hazardous wastes, 200301 wastes, 191210 wastes, 191212 wastes and all other notifiable wastes for the EU-27 for the period 2010-2030
4.Key figures on capacity for the EU industry to process additional volume of waste
The information below compiles data on the amount of recycled materials currently used by the EU industry, for the waste streams that are the most commonly exported outside the EU.
Ferrous metal
The EU is the second largest producer of steel in the world after China. It has 500 production sites located in 23 EU countries. Their output is over 177 million tonnes of steel a year, accounting for 11% of global output and steel accounts for over 90% of all ferrous metals currently exported outside the EU Approximately 56%
, (or 90 million tonnes) of this production was generated through the processing of steel scrap. This share has been steadily increasing in the last years. Steel scrap is key for the steel sector to meet its reduction targets for GHG emissions, as it replaces iron ore and coal whose extraction and processing is CO2 intensive and it is used mainly in electric arc furnaces which emit less GHG emissions than blast furnaces. There are therefore strong incentives for the steel sector in the EU to use more steel scrap in the future. This suggests that the EU market, notably for the steel material accounting for more than 90% of all ferrous metals currently exported outside the EU, has a high potential to absorb additional scrap.
Non-ferrous metals
Aluminium and copper represent the large majority of the non-ferrous metals exported outside the EU.
The EU aluminum industry produces currently about 4 million tonnes of aluminium through the processing of scrap. This represents twice the volume of aluminium produced from raw materials sourced in the EU. It is also important to note that the EU industry also relies heavily on the import of raw materials (bauxite) for its production: the EU is a net importer of raw materials with 4.6 million tonnes, originating mostly from Russia, the Middle East or Africa.
According to the information provided by the European Aluminium industry, current recycling capacity in Europe is 12 million tonnes. It includes both the refining (29%) and remelting (71%) capacity, for post-consumer and pre-consumer scrap. There are about 220 recycling plants in Europe, many of which are SMEs and family-owned businesses. There are also large companies, such as Norsk Hydro, Hindalco’s subsidiary Novelis, AMAG Austria Metall, and TRIMET Aluminium, operating aluminium recycling facilities
.
In 2018, the EU28 industry used approximately 2 million tonnes of scrap for its production of copper. This represents around 50% of the feedstock used, the rest being supplied by domestic mining and import of primary copper. This is higher than share of copper scrap used for the overall production at the global level, which is of 32%.
Europe’s copper industry comprises three sectors: miners, producers and semi-fabricators. There are around 500 companies with an estimated turnover of about 45 billion euro and around 50 000 people employed.
Paper and cardboard
According to CEPI, the overall EU production capacity for paper and cardboard in 2019 was 101.5 million tonnes. With an operating rate of 88%, the sector produced around 90 million tonnes of paper and cardboard in the EU. The average use of recycled content was 55%, representing 49 million tonnes in 2019.
A study on investment needs in the waste sector published in 2019, identified paper and cardboard among waste materials where the recycling capacity is sufficient to meet the municipal and packaging waste targets, as recovered secondary materials can directly substitute for primary materials in existing production facilities. Nevertheless, the paper industry plans to invest in the period 2021-2023 to increase its EU production from paper waste by 2 million tonnes. This is driven by the expansion of the paper/cardboard packaging sector (mainly to replace plastic packaging), which uses more recycled materials than the traditional “paper for publication” sector.
The pulp and paper industry provides more than 180 000 jobs in Europe directly. It has a turnover of 90 billion EUR.
Plastic
In 2019, the EU produced around 58 million tonnes of plastics. 9.4 million tonnes of plastic waste were collected for recycling, out of which around 2 million tonnes were exported outside the EU. This suggests that around 7.5 million tonnes of waste were recycled in the EU.
The study on investment needs in the waste sector mentioned above, estimates that an additional capacity of around 3 million tonnes would need to be established at the EU level to recycle all waste generated on its territory and stop exporting it.
These figures include the UK, which exported 0.5 million tonnes of plastic waste in 2019 and was, together with Germany, the top exporter of plastic waste among EU Member States. Therefore, the figure of 3 million tonnes of additional capacity needed to treat all plastic waste produced in the EU should be lower for EU27.
The same study indicates that stakeholders suggest that the tendency to export plastic waste prevents the expansion of domestic capacity, as new recycling facilities would face uncertainty about having enough plastic waste to process. However, since 2016, exports of plastic waste outside the EU have gone down considerably.
According to recent data from the plastics recycling industry, plastics recycling in Europe (EU27 + UK and Norway) represents 8.5 million tonnes of installed recycling capacity, with a turnover of 3 billion EUR, 600 companies and 20.000 employees. This compares to a figure of about 6.6 million tonnes of installed recycling capacity in 2017 reported in the study on investment needs in the waste sector, indicating that recycling capacity is growing.
In a 2019 report, the Bureau of International Recycling observes new trends as large European waste collectors have been taking over many recycling companies in order to process their own collected plastic waste. In addition, these companies have been looking to collaborate with the plastics industry to bring new circular products into the market. Meanwhile, European recycling companies have been investing heavily in washing and extrusion lines. Higher retention of plastic waste inside the EU would incentivise these changes.
Over 1.6 million people are working in around 50 000 SMEs in the plastic converting sector, with a turnover of 260 billion euro annually. Packaging, building and automotive sectors represent the largest end-use markets.
Textile
In 2017, the EU produced 7.4 kg of textiles per person while it consumed nearly 26 kg per person. The EU is a net importer of textiles (mainly finished products from Asia)
. According to Euratex (2020), the European textile industry employs 1.66 million people. The industry is dominated by micro-companies and SME’s with only 0.2% of textile companies having more than 250 employees. About 67% of companies in the sector are concerned with the production of clothing and the remaining 33% with the production of other textiles and semi-manufactures.
The typical process for treating textile waste in the EU is reproduced below.
Figure G.38 – Textile waste treatment process in the EU

There is limited data on the overall treatment of textile waste in the EU, and notably the current capacity for recycling in the EU. This is largely because there is currently no requirement at the EU level for reporting on the separate collection and treatment of all post-consumer textiles. This is also the case at national level in most Member States with only France having comprehensive reporting obligations and an Extended Producer Responsibility scheme for textile waste.
The second-hand market represents an important outlet for used textile, including textile waste, which is prepared for reuse and put back on the market. The information available indicates that less than 1% of textile waste is recycled into new fibres for clothing (“textile-to-textile” recycling) as technologies for processing textiles to recycled fibres are only starting to emerge. A large share of unsorted collected textiles is sent for sorting in Eastern European countries then exported again for reuse or recycling in Africa and Asia
. Another important share of textile waste is recycled for the production of insulation or padding material (e.g. for vehicle manufacture).
As of today, only three EU Member States have developed concrete targets for the collection and treatment of used textiles: France, the Netherlands and Sweden. The EPR policy in France has contributed to a 150 % increase in the collection rate of post‐consumer textiles since 2007, reaching about 38% of all textile waste generated in France in 2019. About 60 % of the collected textile is reused, although only 4% is considered for high‐value reuse on Western markets. About 30% is recycled, mainly in south‐east Asia; and 8 % is incinerated, most often in waste-for-energy facilities.
The obligation at EU level to ensure the separate collection of textile waste from 2025 will lead to an increase in textile waste available for treatment in the EU. The upcoming EU Textile strategy and growing awareness by the textile industry of the need for circularity should also encourage the development of new solutions for the treatment of textile waste in the EU.
There is a great potential for technological development on textile material recycling and integration into new products. The study on investment needs in the waste sector indicates that investments amounting to 300 million EUR would be needed by 2027 and a further 300 million EUE by 2035 to treat the additionally collected textile waste.
There are different initiatives taken to boost the recycling capacity. EURATEX intends to establish 5 EU recycling hubs near textile and apparel districts to make raw materials by collecting, sorting, processing and recycling post-production and post-consumption textile wastes. Chemical recycling potential is being trialled mainly in the Nordic countries, in particular regarding the environmental perspectives for mixed textile recycling. Siptex is a large scale sorting and recycling facility that uses infrared light to sort textiles by fibre composition and colour. Chemical recycling is also innovating. For example, OnceMore technology by Södra, recycles blended polycotton post-consumer textiles to produce viscose and incinerate the polyester for energy recovery while Re:newcell technology dissolves used cotton and other natural fibres into a new, biodegradable raw material, re:newcell pulp that can be turned into textile fibre.
Glass
The EU is the world's biggest producer of glass with a market share of around one third of total world production. The industry is known for the quality of its products, its capacity for technological innovation, and its skilled labour force. In 2019, the EU glass production reached a volume of 37.2 million tonnes
where the container glass was the largest segment with production of 22 million tonnes. Flat glass production amounted to 10 million tonnes
. Average recycled content of glass containers produced in Europe is of 52% for unspecified colour, 80% for green glass, 50% for brown glass, and 40 % for flint glass
.
The study on investment needs in the waste sector, concludes that the existing capacity of recycling plants for glass is sufficient in the EU.
Annex 8: Problem drivers
This Annex provides additional information relating to the drivers of the problems identified in section 2.2 of the impact assessment report.
Problem 1: obstacles to the good functioning of the EU internal waste market in support of the transition to a circular economy
The main factors explaining why the EU internal waste market is not sufficiently supporting the transition to a circular economy relate to (i) the way in which the “notification procedure” is applied across the EU, (ii) the insufficient use of tools designed to facilitate shipment of waste for recovery within the EU, (iii) the absence of provisions favouring shipments of waste destined for re-use and recycling over other forms of recovery, or deterring shipments for disposal operations and (iv) the important differences on how Member States implement the provisions of the WSR relating to intra-EU shipments of waste.
ØThe notification procedure generates considerable time and resources for operators and authorities
Economic operators consider the notification as too lengthy and costly and an obstacle to the good functioning of the EU market for waste. One important reason is that this procedure was designed and is still implemented via a paper-based approach by many Member States. The handling of this extensive paper work results in long delays as the various documents required to authorise a shipments are sent by post. The procedural delays set in the WSR are often passed (for example in case a competent authority requests additional information, suspending the procedure until this information arrives by post). It can take several months for an operator to obtain the consent from all the necessary competent authorities for one notification.
The financial guarantee should cover the costs of transport, treatment and storage in case the shipment operation could not be completed as initially foreseen, or would be deemed illegal. Stakeholders have raised a number of concerns with regard to the financial guarantee requirement.
Stakeholders criticise that the amounts of such guarantees are excessively high, rarely used and that the levels applied in the different Member States for these guarantees vary widely. Indeed, from the document compiled by the European Commission in 2016, it is apparent that some countries do not indicate how they will calculate the necessary financial guarantee. Many countries use a formula that multiplies the weight of waste being shipped by a cost element composed of transport, treatment and storage but some countries specify these costs upfront (with considerable variation) while some expect the exporter to provide offers for such service. Some countries set different costs for hazardous and non-hazardous waste while some don’t. This leads to a different financial burden for exporters shipping from a country that sets very high levels of guarantee versus one shipping from a country that sets lower levels of guarantee. In addition, large amounts of money are blocked in bank accounts, but are rarely used. In practice, the financial guarantee is only needed in less than 0.1% of occurring shipments.
The first plea by some private stakeholders is to abolish the regime for these guarantees altogether, as they claim that it constitutes a heavy financial burden on them, with very limited cases where a guarantee was actually used. However, the international legal framework on waste shipments requires such a financial guarantee and there is a good case for this (the guarantee was globally agreed as a key element in the control on shipments of hazardous waste exactly as a guarantee in case events happen that cause unexpected storage or treatment costs)
The second point brought up by some stakeholders and competent authorities is that in rare cases the amount provided through the guarantee was not sufficient to cover the costs that it should cover (shipping back waste to the exporting country). In this case the notifier would be the first in line to compensate these costs.
The third concern brought forward by many is the fact that there are very different approaches in different Member States to calculate the amount for the financial guarantee. The proposed measures aims to address this problem, which can be addressed at EU level by agreeing on a common methodology to establish the amount of the financial guarantee. This would enhance the harmonisation and predictability for companies to budget the obligation to provide a financial guarantee for shipments subject to the notification procedure.
Other aspects of the notification procedure are also seen as too strict and not proportionate to the aims that it seeks to achieve. Finally, as for other provisions, the application of the procedure is subject to different interpretations by the Member States, which make it even more burdensome.
It is worth noting the specific situation of the EU’s outermost regions, which face difficulties in relation to shipments of waste as a result of them being separated from the European Continent by thousands of kilometres. In its Communication of 2017, the Commission identified that waste management can be particularly challenging because of limited infrastructure for waste treatment, lack of economies of scale for waste collection, treatment and recycling. This situation is aggravated in some cases by a growing population and seasonal tourism peaks generating large amounts of waste. As a result, several outermost regions send waste to their mainland, which is costly and in case transit countries are involved is also complicated and burdensome due to administrative problems mentioned.
ØThe tools designed to simplify shipments of waste within the EU are not fully used
The WSR contains specific provisions to simplify the notification procedure for the shipment within the EU of waste destined for recovery in facilities to which a “preconsent” has been issued by the competent authorities (so-called “pre-consented” facilities). In this simplified notification procedure, the various deadlines for the instruction of the procedure are considerably shorter. However, there are currently only 331 pre-consented facilities in 15 Member States.
The limited use of this produre is due to the fact that the WSR does not provide for harmonised criteria to grant a pre-consented status to a facility. Member States have their own criteria for the recognition of these facilities. As a result, there is often no recognition by Member States of pre-consented facilities authorised in other Member States, so that a Member State will not apply the simplified procedure to a pre-consented facility in another Member State, which deprives the procedure of all its interest. Another reason is that many Member States do not wish to pre-consent facilities in their territory.
In addition, operators complained that the shorter deadlines to issue a consent foreseen in the WSR for pre-consented facilities are not respected in practice. The fact that the status of pre-consented facilities is often awarded for a limited amount of time is also mentioned as reasons why this tool is currently underused. Finally, public authorities have reported that there is a considerable burden to issue a preconsent status. Since companies often request a consent period of one year (as opposed to the maximum three year period), this higher burden returns annually.
The “general notification” foreseen in Article 13 is another tool designed to simplify the notification procedure. It foresees that, rather than issuing one notification per shipment, operators shipping the same types of waste to a certain facility can submit a “general notification” covering several shipments of waste, which considerably alleviate the burdens linked to the notification procedure. This procedure is widely used by Member States and economic operators. When it is used to ship waste to “pre-consented facilities”, it has a potential to substantially reduce the burden linked to the notification procedure.
ØThe WSR does not explicitly encourage shipment for re-use or recycling and does not deter shipments for disposal operations
The WSR contains provisions which allows Member States to object to shipments of waste destined for disposal or for recovery. However, these provisions do not distinguish between different types of recovery operations and, most notably, do not establish any “preferential regime” for recycling or re-use operations, which are at the top of the waste hierarchy. Similarly, they do not distinguish between different disposal operations and especially do not deter specifically the shipment of waste destined for landfilling. In addition, these provisions only apply to waste subject to the notification procedure, but not to green-listed waste. These are by far the most important in terms of volume when it comes to shipments within the EU and can currently be shipped without any possibility for objection.
Waste management operators highlighted that the shipment of waste to another Member State for operations other than recycling is justified in many cases, notably for waste which cannot be recycled. Other stakeholders and some Member States have on the other hand stressed that the WSR could be clarified to better address waste shipments with undesired impacts, for example negative environmental impacts linked to the treatment of the shipped waste, or because the import of this waste can also disrupt domestic waste management planning in the country of destination (i.e the recovery facilities prefer to import waste of better quality rather than use waste generated in the country of destination, which act as a disincentive to improve waste management there and does not allow the importing country to implement its waste management plans and comply with EU legislation targets).
Around 60% of notified waste currently shipped between Member States is not destined for recycling. Intra-EU shipments of waste have in some cases generated criticisms in the countries of destination, because some waste treatment facilities (notably waste to energy and cement kilns) prefer to treat imported waste over the domestic one. This reduces the incentives to separately collect and sort domestic waste, as it cannot find appropriate treatment facilities, and can thus jeopardise national waste management policies in these “importing” countries.
Indeed, the EEA’s work on intra-EU waste movements found that many Member States have recently put in place various restrictions to the import of waste for energy recovery. Some Member States (e.g. BE, BG, FR and FI) have restrictions that are designed to allow the import of waste for recovery only if capacity is still available after the recovery of domestic waste. Other Member States indicated that they wish to adopt similar measures but that the provisions of the WSR are not sufficiently clear on this point to allow them to do so.One specific issue that has been mentioned by many stakeholders (both public and private) is the limited possibilities in the current WSR to ship relatively small, but yet sufficient amounts of waste to conduct trials or test in innovative recycling and other treatment technologies that are developed in line with circular economy policies. At the moment a maximum of 25 kg of waste for laboratory tests is exempted from the notification procedure.
ØThe diverging interpretations by the Member States of many provisions of the WSR and their lack of clarity undermine the functioning of the internal market for waste
There are many instances where Member States are implementing the provisions of EU law in different ways, which results in a fragmentation of the internal market for economic operators. It is common for Member States to have diverging views on whether a commodity is waste or not, or whether the waste should be subject to the notification procedure or not. One recurring issue in that respect are the different thresholds for impurities applied by Member States to consider if a shipment contains mixed waste, or not. These differences are an important source of confusion and hamper legal clarity for economic operators active on the EU market.
Beyond the classification of waste, the different ways of applying the WSR by Member States extend to many areas, notably the different steps, documents and delays linked to the notification procedure, as well as in relation to the inspection of shipments. The WFD indicates the obligation for carriers of waste to be registered in one Member State, under the conditions set out in that Member State (or even by an administrative region in one Member State). This is also mentioned as an obstacle to a good functioning of the EU market for waste shipment, due to a lack of mutual recognition between Member States of these registrations. Carriers have to register in multiple Member States in order to be able to ship waste across the EU.
In some instances, the provisions in the WSR lack clarity, which also hampers its proper implementation. This is the case for example for the definition of some specific materials or goods excluded from the scope of the WSR, such as animal-byproducts, demilitarized ammunition and end-of-life vessels. The delimitation of what is covered by the WSR and what is covered by other EU legislations is not clear enough. At the moment a number of wastes are excluded from the scope of the WSR. It is however not clear in all of the cases where the dividing line between different legal frameworks is drawn. An example of this is how shipments of animal by-products (that may be waste or not), are currently covered by the WSR. By clarifying this, the room for interpretation in each Member States would become smaller, this reducing the chance that disputes delay shipments of these materials on the ground.
Problem 2: mismanagement of EU generated waste in third countries
The first driver for the considerable volume of waste exported outside the EU is of an economic nature: it is often more profitable for waste operators in the EU to ship waste abroad than treating them in the EU. Operators in third countries are able to offer higher prices for waste generated and collected in the EU than operators based in the EU. This is due to the lower labour costs and environmental standards in third countries. The cost linked to the transport of waste is also low because most of it is operated by container vessels which travel back from Europe to Asia after delivery of goods to Europe, and have an interest in filling in containers with waste rather than travelling with empty ones.
The lack of demand in the EU for such wastes or the recycled materials after their treatment, is mentioned by exporters as the reason for the substantial volume of export to third countries. In turn, these exports led to a lack of investment and capacity for treatment facilities in the EU, especially for plastic or paper waste, with the consequence that exporting these waste had become in the 2000/2010’s the default option for its treatment. A study by COWI and Eunomia from 2019, indicates that “the existing tendency to export plastic waste is reported to be preventing the expansion of domestic capacity, since there is uncertainty that the new recycling facilities will have enough plastic waste to process”. Indeed, in the context of this initiative’s consultation process, EuRIC confirmed that the EU mostly lacks capacity for treating its plastics and textiles waste, in particular for LDPE (packaging) and for some streams of technical plastics.
Further, the Confederation of European Paper Industries (CEPI) explained that the EU’s paper market was balanced before China started importing large quantities of paper waste, which provided an outlet for lower quality and ill-sorted paper waste. Recycling companies did not invest in additional capacity anymore because competing demand from China was so strong. After China set a stricter conditions on the import of waste in 2017, there was an oversupply of paper in the EU market and the lack of end-markets for recovered paper resulted in a 300% decrease in price over two years. CEPI is confident that EU market will regain equilibrium around 2022-2024 as several paper recycling facilities are in the pipeline, totalling more than five million tonnes of capacity. This will eventually absorb the additional paper waste and could help increase the current level of about half of paper production in the EU coming from recycled paper.
Similarly, there is a large untapped potential for the recycling of plastic. This is partly due to the necessity to ensure separate collection of different types of plastic for their recycling. EuRIC also points to the challenges associated with increasing recycling capacity: the lack of recycled content targets to drive demand, of financial resources, of market and fiscal-based incentives and some implementation issues on strict separate collection, control of illegal shipments, as well as design for recyclability and poor links between waste and chemicals legislation.
Another important driver for the mismanagement of waste exported from the EU is that it is very challenging to verify that this waste is managed in an environmentally sound manner in the countries of destination. About half of this waste is destined to countries outside the OECD, where environmental and public health rules are lower than the EU. As indicated above, the WSR requires that the Member State of export, as well as the companies exporting the waste from the EU, ensure that the waste is managed without endangering human health and in an environmentally sound manner during the shipment and the treatment stages. One important reason is that the treatment of some waste streams results in a residual fraction of these waste being either (i) landfilled or incinerated in conditions which do not ensure a sufficient protection of the environment and public health, or (ii) being discharged in the open environment. For other waste streams (metal scrap notably), their reprocessing into secondary materials also generates greenhouse gas emissions and the emissions of other pollutants at levels which are more important than if these waste were treated in the EU with a similar technology.
In practice, the implementation of these provisions has proved to be a very difficult task as there are no clear criteria defining the environmental sound management of waste.
A specific instrument in this regard is Regulation (EC) 1418/2007, whereby it should be noted that the main purpose of this Regulation is not to verify ESM at destination. It is an important source of information on the various legal frameworks in place in third countries. However, many third countries do not respond to the Commission requests, the responses are not always very clear and third countries’ import rules change regularly, while the Regulation is not frequently updated.
Overall, the legal framework set up by the WSR to ensure the sound management of waste exported from the EU does not function properly, especially for non-OECD countries.
Finally, a specific driver for the problems posed by the export of waste outside the EU is the difficulty to distinguish between waste and used goods or equipment. This is especially relevant for electronic and electrical equipment, vehicles, batteries or tyres. As the Waste Shipment Regulation only regulates waste, it is challenging to see how it could be extended to cover non-waste or near-end-of-life commodities. There have been attempts to set out criteria for a distinction between waste and used equipment in the case of some particular commodities. The implementation of these criteria remains challenging in practice, notably when this guidance is not legally binding (as is the case for end-of-life vehicles), and this only covers a few commodities. This issue is also relevant for the question of illegal shipment presented below.
Problem 3: illegal shipments of waste
The main drivers for the high levels of illegal shipment of waste are (i) their economic profitability, (ii) non comparable resources and insufficient coordination at national and EU level,, (iii) the lack of deterrent sanctions, and (iv) the lack of traceability of some waste shipments.
Like for any illegal activities, waste trafficking thrives because the waste sector presents interesting economic opportunities for criminal actors. Illegal shipments of waste represent a way to reduce the costs linked to the respect of the rules on waste transport and waste management. This opportunity is used by criminal networks which offer a cheaper way of dealing with this waste and which derive substantial benefits from it. Furthermore, a recent study
shows that, compared to previous estimates, there has been a growth in the revenue estimates of the EU illicit waste market for both hazardous and non-hazardous waste. According to the study, the annual revenues derived from the illicit waste market in the EU range between €4 and €15 billion (mid-point figure of €9.5 billion). The study also indicates that the illegal shipment of plastic waste, end-of-life vehicles and e-waste are expected to increase, and the overall size of the illicit waste market is also expected to further grow in the context of a Chinese ban on waste imports from foreign countries.
The reasons for ineffective coordination in investigating the illegal trafficking at the national level, associated with the second driver, are pointed out in a report
following evaluation missions carried out in all Member States by a team of experts from the Commission and Member States and representatives of the Council. The report concluded that “the numbers of inspectors and of inspections actually performed, including physical inspections, is frequently insufficient” and “a lack of human resources results in a low number of checks (especially ad hoc checks and combined environmental and financial investigations, etc.) and of specific investigations”.
Indeed, considerable variations between Member States’ enforcement systems exist. In a few Member States well-functioning enforcement structures seem to exist with sufficient capacity and well-equipped inspectors, while in other Member States there is a lack of information, knowledge, prioritisation and a central strategy seems to be lacking.
There is also insufficient coordination at national and EU levels to address waste trafficking in a strategic manner. At the national level, the involvement of multiple actors – environmental inspectorates, customs, police services, environmental agencies, etc. – creates challenges to coordination and cooperation. At the EU level, the only official forum where these issues are debated is the waste shipment correspondents meeting which typically convenes once a year. However, experience shows that enforcement issues only feature as a minor point on the agenda of these meetings. Moreover, the group of correspondents seems to be limited in its capability to serve as a body to really steer cooperation against illegal waste shipments across the EU from an operational point of view. From an operational point of view, cooperation between enforcement agencies of different EU and non-EU Member States is quite developed under the umbrella of IMPEL. But IMPEL is not an official EU body and works on the basis of voluntary participation. The effort and capability at EU level to investigate illegal shipments of waste (both within the EU and outside the EU) remain insufficient to match the scale of the problem, despite its transboundary nature.
The penalties/sanctions against illegal waste shipment are also generally not deterrent enough to prevent their continuation. The provisions in EU law on this point are limited, the levels of penalties are highly variable between Member States and the practice which prevails in many of them is to impose financial penalties of a limited amount.
Finally, the lack of traceability on waste transport is also encouraging illegal shipments of waste. Multiple operators can get involved in waste shipments operations, notably brokers or intermediaries who are distinct from the companies which collected the waste in the EU and the ones treating them in the importing countries. This creates opportunities for criminal actors to set up opaque operations where the real organisers of the shipments are difficult to identify. This problem is particularly acute for “green-listed” waste which are subject to less stringent documentation requirements and control than “notified” waste.
Annex 9: Detailed description of measures
This Annex provides detailed information on the measures presented in section 6 of the impact assessment report. The first part focusses on the measures per objective that were further assessed in section 7 of the report. Part 2 of this Annex presents information on the discarded measures, as some of them were strongly supported by the public or certain stakeholders.
Part 1
Objective 1: Facilitate shipments within the EU, in particular to align the WSR with circular economy objectives
|
Objective 1
|
Measures
|
|
|
|
Specific objective 1.1: Reduce administrative burden for intra-EU shipments of waste
|
a.Improve the regime of “pre-consented facilities”
b.Streamline the notification procedures
c.Clarify the scope of the Regulation
d.Set up a mandatory EU-wide electronic data interchange
e.Streamline the financial guarantee system by harmonising the calculation of the amount required for these guarantees
f.Ensure mutual recognition at EU level of carriers of hazardous waste registered in one Member State
|
|
Specific objective 1.2: Increase the amount of waste shipped for treatment higher up the waste hierarchy
|
g.Align the WSR provisions with the waste hierarchy
|
|
Specific objective 1.3: Harmonise the interpretation and the application of the WSR across Member States
|
h.Issue guidance on current problematic issues
i.Ensure alignments with the provisions on end-of-waste and byproducts in the Waste Framework Directive
j.Task the Commission to set thresholds for contamination of wastes through delegated/implementing acts to determine if they should be subject to the notification procedure or not
k.Establish mutual recognition of national end-of-waste criteria for the purpose of waste shipments
l.Establish mutual recognition of national decision in relation to the hazardousness nature of wastes for the purposes of waste shipments
|
Specific objective 1.1: Simplification and reduction of administrative burden for intra-EU shipments of waste
1a) Improve the regime of “pre-consented facilities” (Article 14)
This measure would streamline the procedure as foreseen in the OECD Decision and implemented in Art. 14 of the WSR, by:
·Providing harmonised conditions/requirements that need to be fulfilled in order for a recovery facility to be preconsented by a Member State.
·Requiring mutual recognition by all Member States, i.e. all Member States involved in a shipment have to follow the Article 14 procedure if the shipment is destined to a facility pre-consented by any Member State.
·Making a three year consent period for shipments to pre-consented facilities the default, instead of leaving it up to the notifier to indicate a consent period up to three years as is currently the case. The prerogative for competent authorities to limit any consent in time or attach specific conditions to a consent, would be preserved.
1b) Streamline the notification procedures:
The streamlining of the notification procedure contains measures which are not necessary linked to the EDI system (measure 1d), and could be developed independently. They were proposed by economic operators or Member States, which extensively work with the notification procedure and have often suggested very specific ways to improve it. These include:
·the wider recognition of the “tacit consent” procedure, or
·adapt the scope and amount of waste exempted from the notification procedure, in order to allow for laboratory test and trials in the framework of research and development, that support innovation in waste treatment. One proposal from France was to increase to 150kg. Other proposals consider waste streams with higher specific weight like metals scrap, and put forward 1 tonne. Any increase from the current 25 kg in Art. 3(4) would enhance the flexibility for testing, with of course a larger amount allowing more flexibility but also a higher risk of creating a loophole, even more so for an unlimited amount unless proper controls are put in place which would likely counter the objective of the measure which is to facilitate such shipments to laboratories or pilot facilities. It is therefore proposed to increase the exempted quantity to 150kg, or
·Language requirements: use of English as default language in addition to the national languages concerned for the documents (notably the contract (art. 5) and information to be provided.
Other changes aimed at rationalising some of the procedural delays are proposed under the assumption that EDI will be in place. This will allow these procedural delays to be modified as EDI will allow immediate availability of uploaded information.
·expand the regime of “tacit consent” to include the consents of all competent authorities, i.e. from Member States of dispatch and destination in addition to the transit countries as is currently the case.
·streamline the delays for handling notification requests, which would become electronic following the introduction of the EDI, with a view to shortening them overall.
1c) Clarify the scope of the WSR with regard to waste that is covered by other legislation:
Waste streams where a clarification is due include the following:
·animal-byproducts,
·demilitarized ammunition,
·end-of-life vessels to ensure compliance with the EU obligations stemming from the entry into force of the “Basel ban amendement” in December 2019. The clarification would make it clear that vessels which become waste in the EU are subject to the export prohibition outside the OECD laid out in Article 36 of the WSR, while other vessels covered by Regulation 1257/2013 (“Ship recycling regulation”) would remain subject to Regulation 1257/2013. A more detailed rationale is provided in Annex 13.
1d) Set up a mandatory EU-wide electronic data interchange (EDI)
Under this measure, the WSR would make it mandatory to issue and interchange documents and information linked to the implementation of the procedures and requirements under this Regulation exclusively via electronic means. This obligation would apply two years from the entry into force of the revised WSR.
To this end, the WSR would first set up an IT system operated by the EC where these documents and information could be submitted and exchanged between Member States.
The WSR would make it mandatory for Member States to ensure that they are interconnected with this information system. The WSR would also set out the conditions (e.g. interconnectivity, architecture, security) allowing competent authorities and economic actors subject to the provisions of the WSR to issue and interchange these documents and information via that system, either via existing electronic solutions or directly via a user access.
The Commission would be empowered to adopt detailed provisions on the functioning of the EDI via delegated or implementing acts.
More specific information on this measure is provided in Annex 10.
1e) Streamline the financial guarantee system by harmonising the calculation method of the amount required for these guarantees.
Under this measure, the Commission would be empowered through the WSR to adopt a harmonised method for the calculation of the required amount under the financial guarantee or equivalent insurance (implementing act). This measure could build on existing transparency efforts where the Commission compiled the different calculation methods of different countries.
1f) Ensure mutual recognition at EU level of carriers of waste registered in one Member State
The WSR would set out the principle that, when a company is duly registered in one Member State to carry out the transportation of waste, it is authorised to transport waste across borders in all EU Member States.
Specific objective 1.2: Better align the rules on waste shipment with the waste hierarchy
1g) Align the WSR provisions with the waste hierarchy
This measure would prohibit the shipment of waste destined for disposal operations, such as landfills or incineration without energy recovery, except in limited and well-justified circumstances (notably for outermost regions or islands or for shipments to landfills in a neighbouring country where this is the nearest-by best option). Such provisions would replace the current Art. 11 of the WSR.
Further, Article 12 would be amended to limit the grounds for a Member State to object to shipment of waste destined for reuse or recycling from/into another Member State, and clarify the possibility for Member States to limit shipments destined to other forms of recovery, like energy recovery, to their territory. This would clarify the grounds for destination countries to plan and limit imports in order to implement their national waste management plans and strategies.
Specific objective 1.3: harmonisation of interpretation, application and enforcement across Member States
1h) Issue guidance on current problematic issues
The Commission would issue guidance documents on the following topics.
·The application of Art. 11 and 12 of the WSR to ensure alignment with the waste hierarchy.
·The application of common contamination thresholds to determine acceptable levels of contamination or impurities, or to define a mixture of waste as opposed to a waste classified under Annex III or IIIA of the WSR.
·The classification of waste under various coding systems according to different pieces of legislation (notably differences between classification of waste under the EU list of waste based on the WFD, customs HS code, Basel Convention and the OECD Decision), which interrelate and can be applied in a synergetic manner.
The WSR would include a delegation to the Commission to adopt guidance on the issues mentioned above. This measure is an alternative to measure 1j.
1i) Ensure alignment with the provision on end-of-waste and byproducts in the Waste Framework Directive
This measure would amend Article 28(1) of the WSR, which aims to settle disputes between Member State on the classification of waste or non-waste, to add an explicit reference to the relevant provisions in Articles 5 and 6 of the Waste Framework Directive on criteria for the definition of byproducts and end of waste, at EU wide, national or subnational levels. This would ensure that these criteria are also respected with regard to the definition of what is waste and not waste for the purpose of waste shipments.
1j) Task the Commission to set thresholds for contamination of wastes to determine if they should be subject to the notification procedure or not through delegated/implementing acts
This measure would empower the Commission to adopt delegated or implementing acts to determine, for certain wastes, acceptable levels of contamination or impurities to classify that waste as “green-listed” under Annex III or IIIA of the WSR.
1k) Establish mutual recognition of national end-of-waste criteria for the purpose of waste shipments.
Under this measure, the WSR would set out the principle that, if a Member State has defined criteria for the determination of end-of-waste status for a specific commodity, and, on that basis, has classified a specific commodity as non-waste for the purpose of shipping this commodity to another Member State, the commodity in question would have to be recognised as non-waste by all EU Member States involved in its shipment. The criteria used by the Member State to classify a commodity as end-of-waste would have to comply with the EU end-of-waste criteria in the waste framework Directive.
This measure would be different from the current regime in the WSR, whereby in case of dispute over waste classification between Member States, the solution is always that the commodity in question will be classified as a waste. The measure could foresee that it could be either the view of the country of dispatch which prevails, or the view of the country of destination.
1l) Establish mutual recognition of national decision in relation to the hazardousness/contaminated nature of wastes for the purpose of waste shipments.
Under this measure, the WSR would set out the principle that, if a Member State has classified a specific waste as not being subject to the notification procedure (because this waste is not hazardous or does not meet other conditions for notified waste, for example is contaminated), this decision should be recognised by all EU Member States involved in the shipment of this waste.
This measure would reverse the current current logic in the WSR
, whereby in case of dispute over waste classification between Member States on whether the waste should be notified or not, the solution is that the commodity in question will be classified as a notified waste. The measure could foresee that it could be either the view of the country of dispatch which prevails, or the view of the country of destination.
Objective 2: Guarantee that waste exported outside the EU is managed in environmental sound manner
|
Objective 2
|
Measures
|
|
Specific objectives
2.1: Stop the export of the waste from the EU where it will not be managed in an environmentally sound manner
2.2: Improve waste management in third countries
|
a.Specify obligations for exporters and public authorities to ensure and verify that waste exported to third countries are managed in an environmentally sound manner.
b.Task the Commission, via implementing or delegated acts, to set out criteria to differentiate between used goods and waste, for specific waste streams for which export to third countries raises particular challenges
c.Establish a new framework for the export of green-listed waste from the EU to a non-OECD country, according to which such export is only authorised to those countries that notify the EU of their willingness to import green-listed waste and demonstrate their ability to treat it sustainably, in accordance with criteria set out in the WSR.
d.Require that the export of green-listed waste outside the OECD is subject to the notification procedure
e.Set up a specific procedure to monitor export of waste to OECD countries and mitigate environmental problems that might be caused by such exports
|
The Regulation already contains strict rules on the export of waste, notably to countries outside the OECD. Despite this, the export of waste from the EU does not take place in conditions ensuring their sustainable treatment in the countries of destination. This is the case especially for “green-listed” waste.
To address that problem, various measures are proposed with respect to the export of waste out of the EU, ranging from a complete export ban to more targeted measures. A complementary measure relates to the reinforcement of the control of the management in third countries of waste exported from the EU, possibly through allocating this task to an existing or new EU agency.
2a) Specify detailed obligations for exporters and public authorities to ensure and verify that waste exported to third countries are managed in an environmentally sound manner
This measure aims to strengthen and render more operational the obligation currently laid down in the WSR to verify that waste exported to third countries is managed in an environmentally sound manner (i.e. in accordance with human health and environmental protection standards broadly equivalent to EU legislation). It introduces provisions in the WSR to require that companies exporting waste outside the EU set out and implement independent auditing/traceability schemes (possibly through their Producer Responsibility Organisation), to ensure that the waste is sustainably managed. These schemes would apply to the whole supply chain of these exports (i.e. transport of waste; treament in facilities located in the destination countries, including treatment of residual waste from recycling facilities). The schemes would be based on criteria designed to ensure that the waste in question is managed in environmentally sound manner, according to rules/standards which are broadly equivalent to EU standards. These criteria would be defined in an Annex to the WSR, which could be modified through delegated or implementing acts.
Under these criteria, exporting companies should be able to demonstrate that the facilities dealing with imported waste:
·Hold an official licence/permit to import and treat this waste;
·Have the required processes, organisation and infrastructure to treat this waste, and insurances covering potential risks and liabilities;
·Provide adequate information on their waste treatment methods, including how they deal with residual waste (ie the fraction of the waste which is not recycled/reprocessed), notably through downstream traceability;
·Have taken adequate measures to address soil, water and air pollution, as well as other nuisances (odour, noise);
·Have taken the required safety measures for their staff;
·Have taken measures designed to save energy and limit the emissions of greenhouse gases;
·Are able to provide records of their activities and their commercial transactions upon request;
·Are regularly subject to inspection/control by the public competent authorities and have not been convicted of illegal activities linked to waste shipment or waste management activities.
Exporting companies would need to use independent third party audits/certification to check that the facilities dealing with their waste in third countries comply with these criteria. When performing the assessment of the facilities against the criteria mentioned above, the independent audit/certification bodies would need to use the relevant EU legislation and available best practices as a reference (especially requirements from the Industrial Emissions Directive and the EU Best Available Techniques reference documents (BREFs) relevant for waste treatment and industrial production). Every year, exporting companies would be required to publish information on how they are complying with this obligation (without disclosing confidential commercial information). Furthermore, to reduce administrative burden and costs for SMEs, exporting companies that have already commissioned or carried out an audit for a given facility would be also required to share those audits with other exporting companies, under fair commercial conditions.
Such audits would be required for any facility where waste exported from the EU is treated, including when this facility is located in a country belonging to the OECD. The obligation under the WSR to ensure that EU-exported waste is managed properly applies to the export of all waste, including those exported to OECD countries. The OECD Decision that regulates shipments of waste for recovery within the OECD area, states that waste exported to another OECD country “shall be destined for recovery operations within a recovery facility which will recover the wastes in an environmentally sound manner according to national laws, regulations and practices to which the facility is subject”. The OECD Decision does not contain any element or criterion specifying how to implement this requirement, notably on the definition of what constitutes an “environmentally sound manner” for the recovery of waste. There is therefore currently no means to verify that this obligation is properly implemented. Exports of waste from the EU to countries belonging to the OECD have increased considerably over the last few years. In the absence of common criteria defining the conditions under which waste shall be recovered in the relevant facilities, there is a risk that waste exported from the EU to countries belonging to the OECD is mismanaged. In this context, it is vital to ensure the ESM of all waste exported from the EU that facilities located in these countries are also subject to the proposed obligation to be subject to audit by EU exporting companies. Having said this, in some cases such assurance may be achieved on country level through international agreements concluded between the Union and a third country to which the OECD Decision applies, with a view to recognise that its facilities will manage waste in an environmentally sound manner, in accordance with the criteria laid down in the new Regulation. In those cases, the auditing obligations on natural and legal persons which intend to export waste to that third country can be alleviated.
This measure would also include a requirement for national competent authorities in the EU Member States to check that EU exporting companies comply with their obligations to verify that waste are dealt with according to ESM principles in destination countries and for the Commission to assist and oversee the EU Member States in this task.
It would be complementary to other measures under objective 2
which are defined at a country level and would determine which type of waste can be exported to which country. This measure would allow to go beyond the general information provided by an importing country on its waste management practices, to obtain concrete reassurance on how the exported waste are treated in facilities under his jurisdiction. The obligation is directed in the first place towards the companies exporting waste, thereby stressing their responsibility in engaging in a sustainable business, while other measures under objective 2 relate primarily to the responsibility of the competent authorities of the countries of export and import. This being said, the public authorities in the Member States also have the responsibility to check that exporting companies are correctly implementing their obligations, which is an essential prerequisite for the success of the proposed measure.
The measure would become effective three years after the entry into force of the revision of the WSR. This would allow companies exporting waste, and in particular companies exporting from outermost regions, to prepare properly for the new regime.
2b) Task the Commission, via implementing or delegated acts, to set out criteria to differentiate between used goods and waste, for specific waste streams for which export to third countries raises particular challenges
This measure would allow to define legally-binding and enforceable criteria to differentiate between used goods and waste, for the purpose of the shipments of waste. This would clarify the legal regime applying to some commodities which are exported as used goods while they should be treated as waste. This would help enforcement authorities to enforce the provisions of the WSR, especially in relation to the export of waste outside the EU, where this point has proved problematic. The decisions by the Commission would be taken for specific commodities, with a selection based on specific problems experienced in the distinction between waste and used goods. This procedure would not impact existing EU legal acts which already lay out criteria for such distinction for specific waste streamns (like waste electronic and electrical equipment (WEEE), for which such criteria are defined in Annex VI of Directive 2012/19/EU).
2c) Establish a new framework for the export of green-listed waste from the EU to a non-OECD country, according to which such export is only authorised to those countries that notify the EU of their willingness to import green-listed waste and demonstrate their ability to treat it sustainably, in accordance with criteria set out in the WSR.
Under this measure, the WSR would establish a procedure that provides that export of waste to non-OECD countries would only be authorised to those countries that notify the Commission that they wish to import one or more green-listed waste from the EU and demonstrate their overall ability as a country to deal with them sustainably based on criteria set in the WSR. This measure would build on and complement the obligation currently laid down in the WSR
to verify that waste exported to third countries is managed in an environmentally sound manner (i.e. in accordance with human health and environmental protection standards broadly equivalent to EU legislation).
The criteria would include the following items.
·The domestic legislation on management and import of the waste in question.
·The list of facilities licensed to manage the waste in question.
·The status of its compliance with reporting obligations under the Basel Convention and other relevant Multilateral Environmental Agreements (notably the UN Framework Convention on Climate Change, the Paris Agreement, the Stockholm Convention on Persistent Organic Pollutants, and the Minamata Convention on Mercury).
·How the technical guidelines on the environmentally sound management of waste adopted under the Basel Convention are taken into consideration in its waste management regime.
·Information on its enforcement and control strategy to ensure that waste is managed sustainably in its territory.
The Commission would assess this information and then decide whether the criteria for sustainable management of the waste are met. In adopting such decisions, the Commission would follow a risk-based approach and reserve its right to request additional information linked to the environmentally sound management of the waste concerned to the third country in question.
If the Commission comes to the conclusion that these countries comply with the criteria, the Commission would include them in a list of countries authorised to import waste from the EU, which would be regularly updated through a delegated/implementing act.
The inclusion of a country in the list of countries authorised to import waste from the EU could be reviewed at any time by the Commission, if information becomes available which indicates that the waste in question is not managed in an environmentally sound manner. In that case, the Commission would invite the third country in question to provide information demonstrating that the waste is properly managed. If this information is not provided to the Commission, or is not sufficient to demonstrate that the waste in question is properly managed, the Commission could remove this country from the list of countries authorised to import waste from the EU. This measure would replace the procedure foreseen in Article 37(2) and repeal Regulation 1418/2007.
To ensure sufficient time for the transition to this new regime, it would become effective three years after the entry into force of the revision of the WSR.
2d) Require that the export of green-listed waste outside the OECD is subject to the notification procedure
Under this measure, all export of green-listed waste outside the OECD would be subject to the notification procedure, which implies that the competent authorities of the countries of export, transit and destination would have to give their consent to the shipments of waste, before the shipments can take place. This would extend the notification procedure to waste (green-listed waste), which are currently not subject to this mechanism, which stems from the Basel Convention and only applies to a certain category of waste (hazardous waste and “other waste” listed in Annex II of the Convention).
2e) Set up a specific procedure to monitor export of waste to OECD countries and mitigate environmental problems that might be caused by such exports
Under this measure, the Commission would be tasked to monitor the levels of export of waste from the EU to OECD countries, and the Commission would be empowered to launch a process towards a given country if the following criteria are met:
·The country imports significant amounts of one or more categories of waste from the EU, or such imports have considerably increased within a short period of time;
·There is a lack of information available to the EU and its Member States demonstrating that the country concerned has the ability to deal with this waste sustainably.
This process would include the gathering of data and dialogue with the third country concerned. Ultimately, this process could lead to a decision by the Commission (via a delegated or implementing act) to suspend the authorisation to export one or more categories of waste to this country if the information compiled in this process shows that these exports create serious environmental challenges in the country of destination.
Objective 3: Better address illegal shipments of waste within the EU as well as illegal exports to third countries.
|
Objective 3
|
Measures
|
|
Specific objective 3.1: Further strengthen the WSR’s provisions on enforcement and inspections
|
a.Complement existing provisions on inspection plans
b.Issue guidance on efficient inspections and enforcement practices
c.Empower the Commission (through OLAF) to carry out transnational investigative and coordination actions against waste trafficking in the EU
d.Reinforce existing provisions on penalties
e.Improve traceability of shipments of green-listed waste
|
|
Specific objective 3.2: Strengthen cooperation within the Member States, across the EU and with international partners
|
f.Facilitate cooperation between enforcement authorities at the national level
g.Creation of a dedicated group at the EU level with the task to facilitate and improve cooperation on enforcement of the WSR
|
Specific objective 3.1: Further strengthen the WSR’s provisions on enforcement and inspections
3a) Complement existing provisions on inspection plans:
Under the WSR, Member States shall ensure that inspection plans for waste shipments are established. It is of fundamental importance that this requirement is well implemented throughout the Union if we are to effectively prevent illegal waste shipments. To this end, this new measure would complement the existing provisions of the WSR by requiring Member States to notify their inspections plans to the Commission, which would be tasked to assess these plans, with a view to providing further support to Member States and facilitatating the development of a harmnonised approach for inspections across the EU. To this end, the Commission would draw up reports, based on the review of the inspection plans notified by the Member States, providing recommendations on how to plan effective waste shipment inspections (including on prioritization of inspections, on arrangements for enforcement cooperation and coordination between the relevant authorities involved in inspections, etc.).
3b) Issue guidance on efficient inspections and enforcement practices
This measure would involve providing a delegation to the Commission to adopt non-binding guidance related to enforcement practices, and inspection prioritisation and cooperation.
3c) Empower the Commission (through the European Anti-Fraud Office (OLAF)) to carry out transnational investigative and coordination actions against waste trafficking in the EU
OLAF leads, coordinates and supports the work of national authorities (coordination cases) in accordance with Regulation (EU, Euratom) No 883/2013 (in the area of the protection of the EU financial interests) and Regulation (EC) No 515/97 (in the areas of customs controls and agricultural legislation). Currently, OLAF typically acts in cases where some irregularity has been found concerning a shipment that involves at least one Member State (as country of origin, dispatch or transit). If the involvement of the Basel Convention Secretariat (BCS) of the United Nations has not been requested by the country of origin or if it fails to solve the issue, OLAF can open a so-called coordination case under Regulation (EC) No 515/1997. Under this regulation, OLAF can intervene to play a role coordinating the exchange of information between the EU and non-EU customs authorities involved in order to establish the nature of the waste, the shipment’s route, and whether it is illegal under EU rules. The objective is to support the repatriation of the containers in partnership with the competent authorities in the Member States and the non-EU countries involved. However, OLAF's current mandate under Regulation (EC) No 515/1997 is limited to certain instances. In particular, OLAF does not have a legal basis in relation to purely intra-EU movements of waste. This new measure would entitle the Commission (through its anti fraud office, OLAF) to carry out investigative and coordinating actions in respect of illegal waste shipments within the EU (intra-EU) and towards third countries to assist the Member States in enforcing the provisions of the WSR. It would enable OLAF to deploy its entire tool box related to coordination (coordinate authorities across countries, disciplines and sectors, and relying on a wide network of partners in the EU and beyond and use analytical capacities) and investigative powers, including forensic capacities and ability to conduct investigative missions. OLAF would conduct any such investigation to collect evidence in complex cross-border cases to facilitate and prepare an adequate administrative or criminal follow-up by national authorities. OLAF’s involvement would add value to the activities of the Member States, would support a more coordinated approach and contribute to an equivalent level of enforcement of the WSR across the EU. OLAF’s actions would complement, not replace, the powers of the national competent authorities to initiate and conduct their own investigations. However, OLAF would be able to initiate enforcement actions and reinforce the capacity of Member States that do not have sufficient enforcement capacities.
3d) Reinforce existing provisions on penalties
Under the WSR, Member States shall establish effective, proportionate and dissuasive penalties for infringements of the Regulation. However, there is a significant variation in the types and levels of penalties provided for in the Member States’ national legislation, reflecting diverging interpretations of the notion of “effective, proportionate and dissuasive” penalties. Consequently, in a situation in which there are different regulatory frameworks, illegal actors are likely to operate under the jurisdiction of the one that has the least stringent rules and sanctions. Therefore, the purpose of this new measure would be to complement the existing WSR provisions on penalties by introducing a list of common, non-exhaustive and indicative criteria for determining the types and levels of penalties to be imposed in case of infringements, including also a non-exhaustive list of the main types of santions. The overall objective of this measure would be to reduce divergent interpretations of the notion of “effective, proportionate and dissuasive” penalties and to make the application of penalties more consistent across the EU. Building on existing examples in other areas of EU law, as well as on the relevant CJEU case-law, the proposed criteria would include the following: (a) the nature, gravity and duration of the infringement; (b) where appropriate, the intentional or negligent character of the infringement; (c) the financial strength of the natural or legal person held responsible (as indicated for example by the total turnover of the legal person held responsible or the annual income of the natural person held responsible); (d) the economic benefits derived from the infringement by the natural or legal person held responsible, insofar as it can be determined; (e) the environmental damage caused by the infringement, insofar as it can be determined; (f) any action taken by the natural or legal person held responsible to mitigate or remedy the damage caused; (g) the level of cooperation of the natural or legal person held responsible with the competent authority; (f) previous infringements by the natural or legal person held responsible; and (h) any other aggravating or mitigating factor applicable to the circumstances of the case. Enforcement authorities would be required to take these criteria into account when deciding whether to impose penalties, and what the level of penalty should be. Furthermore, this measure would also include a non-exhaustive list of the main types of sanctions to be imposed in case of infringements, including the following: (a) fines; (b) confiscation of revenues gained by the natural or legal person from a transaction related to the infringement; (c) suspension or revocation of authorisation to carry out activities related to management and shipment of waste insofar as these activities fall under the scope of this Regulation; and (d) exclusion from public procurement processes.
This measure would also be consistent with the evaluation report on the Environmental Crime Directive which identified room for improvement regarding the sanctions regime for environmental crimes, noting in particular that more could be done to standardize the level of sanctions across the Member States.
3e) Improve traceability of shipments of green-listed waste:
The traceability of the shipments of waste should be improved with the development and mandatory use of an electronic system to interchange data and information on waste shipment (see measure 1d above). This system should allow all relevant authorities to access and exchange real-time data on shipment of waste. Its interconnexion with electronic tools managed by other authorities/agencies (notably customs) should permit a better control of such shipments. The WSR will set out an obligation to use the EDI system for the documentation accompanying the shipments of “green-listed” waste (form in Annex VII). This will include notably the obligation to keep record of these forms, which could be made available to the competent authorities, even after the shipment is completed. This should allow to keep better track of these shipments, as the Annex VII form currently does not need to be kept after the completion of the shipment, which has proved problematic as this deprived investigators of means to trace it back to its exporters.
In addition, the WSR would, as a new measure, require that all brokers/intermediaries who want to ship waste within or from the EU are specifically registered in all of the EU Member States where they carry out commercial activities linked to the shipment of waste.
Specific Objective 3.2: Strengthen cooperation within the Member States, across the EU and with international partners
3f) Facilitate cooperation between enforcement authorities at the national level
The objective of this measure would be to introduce a provision with a view to ensuring that all competent authorities involved in implementation of the WSR have effective mechanisms to enable them to cooperate and coordinate domestically concerning the development and implementation of enforcement policies and activities to combat illegal shipments of waste.
3g) Creation of a dedicated group at the EU level with the task to facilitate and improve cooperation on enforcement of the WSR
Under this measure, the WSR would establish a “waste shipment enforcement group”, with the mandate to facilitate and improve cooperation and coordination on enforcement policy and practice in the Member States, focusing in particular on issues relating to illegal shipments of waste within the EU as well as illegal shipments outside the EU, in particular exports to third countries. It would guide the Member States’ authorities in their actions to enforce the WSR, by sharing best practices, intelligence, and ongoing activities and facilitate joint actions between EU Member States. The group would bring together all bodies relevant for the enforcement of the WSR, including customs authorities, police and other relevant national inspection authorities, as well as representatives from relevant European and international law enforcement networks such as IMPEL, Europol, Eurojust, ENPE, EUJFE, Interpol and WCO. The group would meet at least twice a year under the chairmanship of the Commission. This group could be modelled e.g. on the basis of the Enforcement Group established under the EU legislation on wildlife trafficking.
Part 2: Discarded measures
Financial guarantees (discarded measures):
Remove the financial guarantee system
The possibility to abolish the regime for the financial guarantees was discarded as this is required by the international legal framework, the Basel Convention, on waste shipments. The regime is also based on the principle that cost incurred by illegal or irregular operations should be borne by the notifier.
Allow the financial guarantee system via a national fund or via an EU fund
To address the rare cases when the financial guarantee is either not sufficient or not set-up, some stakeholders suggested to set up an EU-level fund to cover these cases.Since this provision stems from the Basel Convention, this measure would provide an additional possibility to the current regime for financial guarantees or equivalent insurance and not replace it. The coverage of the costs concerned could be taken up through a national or EU-wide fund.
The fund would collect fees from exporters for each notification request or shipment, possibly taking into account certain criteria to determine the value of the fee (e.g. amount and nature of waste or risk assessment). If the contributions were refunded to notifiers once the shipment is concluded with no incidents as is currently the case, the fund would be rather similar to the current system of the financial guarantee. The costs for managing a national fund would fall on each Member State, both in terms of resources and financial responsibility. Member States with more than one competent authority may also have to create a coordinating body or set up specific coordination mechanisms among themselves. An EU-wide fund would be managed the Commission.
There are a few (and rather sophisticated) examples that address the issues of risk-sharing and risk-reduction in the EU such as the Banking Union, where pooling of risks is done through an institution that monitors the risks of bankruptcies and NextGenerationEU through which the EU will now fund itself on markets in order to finance the additional EU spending (beyond the EU budget). But these are clearly examples where the amount of money and risk at stake is far beyond the levels of the current funds needed for waste shipments. Therefore, the possibility of a EU managed fund is considered too complex and disproportionate for the issue at stake.
According to Trinomics and Wood (2021), the value of the financial guarantee could be calculated by assuming the fines imposed on illegal cases could be a gauge for the costs of those shipments. Using the example of Belgium, which in the period of 2013-2015 reported 644 cases of illegal shipment, a fee of 40,000 euro per notification (similar to the current levels of fines imposed) could be considered. Combined with the number of notification dossiers where a guarantee was required in those same years, a fund fed by such a fee would amount to around 53 million euro per year, whereas the total value of financial guarantees reported by the Belgian competent authorities revolves around 52 million euro. No real overall savings seem to be expected from allowing a national fund to cover the required guarantees.
Such a fund could also collect fees or fines to cover the costs of illegal shipments for which responsibility cannot be attributed and costs claimed to a registered entity. If the contributions are not reimbursed, they could feed a growing fund to cover costs based on past experience. After that, the contributions could be reduced to maintain the fund based on needs (e.g. in case of shipments that cannot be completed as intended, or in case of an illegal shipments that is stopped). However, certain waste management treatment companies have indicated their resistance against such fee pooling, because stakeholders, namely in the waste management treatment sector, have indicated their reluctance to share financial responsibility with those actors that do not comply with the rules, and in particular or with free- riders not notifying waste shipments would benefit from the contributing to the fund set-up by legitimate complying operators.
The second issue concerning the rare cases where the funds are not sufficient or a notifier does not exist, could be solved by setting very high level for the guarantee. However, it is unclear how the fees could be set to cover “all risks”. Very high levels of fees would increase the burden of notified waste shipments, which would go against the first concern raised by many stakeholders, that they are already heavily burdened by the current requirements to provide a financial guarantee.
The set up of a fund would also not solve the issue of the the diverging levels of guarantees set by different competent authorities, unless it was set-up at EU level together with a harmonised calculation methodology (see measure 1e). If they are, These national funds would also not solve the problem of the diverging levels of guarantees set by different competent authorities.
Introduce an additional new procedure for certain shipments of certain hazardous waste destined to certified facilities (discarded measure)
Some stakeholders suggested to introduce an additional procedure that would not require a prior consent for certain waste streams that are currently subject to the prior notification and consent procedure, like hazardous waste, that move from and to certified facilities. This certification would be based on applicable standards or certification schemes and would require a regular audit of the involved companies and would remove the necessity for a prior notification procedure. The objective would be to speed up shipments of high quality waste and ultimately facilitate and increase recycling activities in the EU.
This measure was discarded because not applying the notification procedure for hazardous waste shipments would not be in line with the Basel Convention. Hazardous waste are subject to the notification procedure in order to ensure the protection of environment and public health against its damaging effects when treated in an uncontrolled manner. Derogating from this procedure for hazardous waste would present risks for the protection of the environment. Therefore, any derogation to the notification procedure would have to be duly justified (for example via the use of the specific procedure for this purpose laid down in Article 11 of the Basel Convention). In alternative the provisions in the Basel Convention would need to be adjusted.
Further, an additional procedure would add more complexity to the WSR framework, potentially leading to additional confusion as to which is the applicable procedure for which shipment. Such a procedure would be difficult to design in such a way that it would be applicable to a wide variety of waste streams. Therefore, only WEEE and certain treatment facilities, possibly certified in the near future, would be expected to benefit from such additional procedure. The reduction in the number of notifications, is unlikely to be significant.
Based on data from Trinomics and Wood (2021), it can be assumed that under such a new procedure a certain percentage of the total waste currently shipped would no longer require prior informed consent or would require lighter notification requirements. This could result in between 18 876 – 56 629 fewer shipments for recycling being subject to notification. Applying an average of 56.6 shipments per notification, this would reduce between 333-1 000 notifications per year or 1.8% - 5.4% of total notifications processed. There is a lack of data on the average shipment notification costs for hazardous waste intended for recovery, however these figures represent a relatively small economic savings for both business operators and Member State competent authorities.
Apply stricter rules to shipments destined to recovery operations other than reuse and recycling
This measure would subject shipments of all waste destined for incineration with energy recovery (R1) and other non-recycling recovery (like backfilling) to the prior notification and consent procedure and provide more tools for competent authorities to object to such shipment, e.g. in cases where the waste is recyclable and better treatment options as regards the waste hierarchy are reasonably feasible.
This measure was discarded as it is likely that it would not be compatible with the OECD Decision, which provides for the international framework for shipments to recovery between OECD members but does not distinguish between recovery operations.
Ban all exports of waste from the EU to third countries
This measure would involve the establishment of a complete ban on all export of waste from the EU without any exemption. This would prevent any waste to be exported to countries outside the EU, including OECD member countries.
This measure was discarded as it likely that it would be incompatible with the EU’s international obligations under the GATT and the OECD Decision (see for a more detailed analysis in Annex 11). In addition, this measure is not proportionate as the same environmental objectives can be achieved through other less restrictive remedies, e.g. a system that provides for checks that the third country importing the waste has the capacity to receive and treat the waste in a sustainable manner (see measures 2c, 2d and 2e) and that specific facilities carry out proper treatment (see measure 2a).
Nevertheless, this measure was assessed because it reflects in the strictest sense the language used in the Green Deal on the export of waste and correspond to expectations by certain stakeholders and the public opinion (as shown in the results of the public consultation). It is very likely that these proposals will resurface during the discussions on the legislative proposal with the co-legislators. We therefore believe a full assessment will support the decision-making process.
This option would mean that 100% of waste currently exported will be retained in the EU. This represents, taking into account as for other measures the most commonly categories of waste exported outside the EU, 26.4 million tonnes, exported for a value of 12.3 billion euro in 2019. Taking projections until 2030, the volume would be around 34 million tonnes with a value of 17.1 billion euro. The measure was assessed with the methodology explained in Annex 5. Based on projections until 2030, this amount would be 34.3 million tonnes with an overall value of 17.1 billion euro. With the same methodology as explained in measure 2c, this measure compares to the baseline as detailed in the table below.
Table I.1 – Economic impact if 100% of waste currently exported is retained in the EU

The collectors and sorters would probably see their sale prices go down significantly due to the huge increase in quantities of waste, for which they have would to find new outlets in the EU. This could put their business model at risk, at least in the short term. Similarly, the income of operators involved in shipments would also be reduced.
Recyclers in the EU would be able to buy these wastes at a lower price with benefits in terms of economies of scale and investment in recycling technologies, but on the conditions that substantial new recycling capacity is being made available to manage this additional waste. This is likely to take more than a few years in view of the volume of waste concerned and investments needed. The costs of such management would also likely be shared with Member States that would need to invest considerably in their own waste management facilities to manage these wastes.
Producers of waste would be required to pay a higher price for the management of their wastes within the EU in comparison to the costs charged by third countries.
The EU steel industry would see its financial contribution to the Emission Trading System decrease by around 1 billion euro/year.
This measure is expected to deliver important environmental benefits as it would ensure that all waste generated in the EU are managed in the EU, on the basis of standards, practices and technologies that are more modern and sustainable than in many other third countries where waste is currently exported. With the methodology explained in Annex 5, the total environmental benefits linked to (i) a better treatment of rejects and to (ii) avoiding emissions linked to transporting the waste would be 1.9 billion euro in 2019 and 2.6 billion euro in 2030. These values represent minimum amounts of the overall environmental gains linked to this measure, as many others could not be quantified and should be taken into consideration as well. This focuses however on the switch from treatment in third countries to treatment of waste in the EU but does not include the fact that the measure will probably not lead to improvement in waste management in third countries.
Further, a higher potential amount of secondary raw materials would be produced from recycling within the EU, so minimizing the EU dependency on the import of primary materials. However, it is expected that a share of this waste would not immediately be recycled in the EU in the absence of sufficient capacity for this, but would be diverted to other waste treatment options, like incineration or landfilling. In addition, this measure would not provide any incentive for improving waste management in third countries which are currently importing waste from the EU and treating it domestically. There is a risk that waste exported from the EU is replaced by waste from other exporting countries without any incentive to move to more sustainable management practices.
In addition to the social impacts explained in measure 2c, the estimates show that this measure could lead to the additional creation of around 88 000 jobs in the EU waste treatment and industrial sector processing waste (ferrous and non-ferrous metals and to some extent plastic recycling).
Ban export of all waste outside the OECD
Under this measure, the Regulation would prohibit the export of waste to countries that are not members of the OECD, without any exemption. This would avoid that waste are shipped to the most vulnerable third countries and be less extensive than the measure 2c).
This measure was discarded as it likely that it would be incompatible with the EU’s international obligations under the GATT (see for a more detailed analysis in Annex 11). In addition, this measure is not proportionate as the same environmental objectives can be achieved through other less restrictive remedies, e.g. a system that provides for checks that the third country importing the waste has the capacity to receive and treat the waste in a sustainable manner (see measures 2c and 2d) and that specific facilities carry out proper treatment (see measure 2a).
For the assessment of this measure’s economic, environmental and social impacts, the same methodology as for a full ban was applied. Currently, 46% of all waste exported from the EU is shipped to third non-OECD countries, amounting to around 12 million tonnes per year. Taking the hypothesis that a larger share of the current exports to non-OECD countries would be retained in the EU, the measure could lead to a reduction of export ranging from 50% to 75% of the level of export outside the OECD.
The volume of waste retained in the EU under this measure could amount to a volume ranging between 6.0 and 9.1 million tonnes, with a value on export ranging between 1.3 and 2.0 billion euro. Taking projections until 2030, the volume would be between 5.7 and 8.6 million tonnes and the value between 2.1 and 3.1 billion euro. This measure compares to the baseline as detailed in the table below.
Table I.2 – Economic impact if 50% of waste currently exported to non-OECD countries is retained in the EU (EUR)

Table I.3 – Economic impact if 75% of waste currently exported to non-OECD countries is retained in the EU (EUR)

The collectors and sorters would probably see their sale prices lower due to the increased quantities of waste going to OECD countries where prices for waste may be less advantageous that for waste shipped to non-OECD countries.
Recyclers would be able to buy these wastes at a lower price with benefits in terms of economies of scale and investment in recycling technologies while recycling capacity would have to be increased to manage this additional waste. New investments and time will be needed before adequate capacity is available to deal with all the surplus of waste retained in the EU. The costs of such management would also likely be shared with Member States that would need to invest in their own waste management facilities to manage these wastes.
Producers of waste would be required to pay a higher price for the management of their wastes within the EU in comparison to the costs charged by third countries.
The EU steel industry would see its financial contribution to the Emission Trading System decrease by around 91 to 176 million euro/year.
The environmental impacts of this measure relates closely to the amounts of waste that would no longer be exported outside the OECD and treated in the EU or OECD countries outside the EU. This implies that until 2030 large amounts of waste would be retained within the EU, and also with a substantial share possibly diverted from non-OECD to third OECD countries, potentially increasing pressure on the waste management systems in the latter.
The total environmental benefits linked to (i) a better treatment of rejects and to (ii) avoiding emissions linked to transporting the waste, under a scenario where 50% of waste exported outside non-OECD would be retained in the EU would amount to 408 million euro in 2019 and 2030. Taking a scenario of 75% retained within the EU, the environmental benefits would reach 558 million euro in 2019 and 743 million euro in 2030. These values represent minimum amounts of the overall environmental gains linked to this measure, as many others could not be quantified and should be taken into consideration as well.
It is estimated that this measure could lead to the additional creation of between 23 000 and 34000 jobs in the EU waste treatment and industrial sector processing waste (notably ferrous and non-ferrous industry).
Establish a new mechanism governing the export of waste outside the EU, which would operate a distinction between processed and unprocessed waste
Under this measure, the WSR would introduce new control mechanisms for the export of waste outside the EU, which would be different depending on whether the waste concerned is processed or unprocessed. For unprocessed waste, based on the assumption that its treatment would represent particular environmental challenges, the WSR could introduce new, specific procedures designed to ensure, prior to export, that it will be managed in an environmentally sound manner in the countries of destination. On the other hand, for waste which has already undergone some pre-treatment process in the EU and is exported outside the EU afterwards, a lighter procedure would apply for their export, as the waste would likely be of better quality and value and not undergo too many treatment operations in the countries of destination.
This measure is not assessed in details as it is not coherent with the current legal regime in the Basel Convention and the WSR which operate two fundamental distinctions:
·Between waste and non-waste, with the consequence that any commodity classified as waste should be subject to a particular regime when shipped across borders, as well as;
·between notified waste (hazardous waste or waste which present particular challenges for their treatment) and green-listed waste.
The proposed measure does not fit with this distinction, but adds new categories of waste which risk rendering the legal framework applying to the shipment of waste more complex and confusing. This is even more so as there is no agreed criterion which would allow to draw a clear line between “processed” and “unprocessed” waste. It seems therefore very difficult to establish new rules on such an unclear basis. The proposed measure does not either take into account the fact that even “processed” waste remains waste and would be subject to further processing operations in the countries of destination. These operations can generate negative environmental externalities (for example linked to the emissions of GHG or air pollutants, or to the treatment of residual waste generated during the processing activities), which would also need to be mitigated to ensure an environmentally sound management of this waste. Finally, the current legal framework already makes it clear that waste, when processed into a commodity which complies with “end-of-waste” criteria, becomes a product and is not subject any longer to the WSR. That solution should address the issue that this proposed measure seeks to solve.
Task a dedicated Agency (or similar body) at the EU level to monitor export of waste as well as their treatment in third countries
Under this measure, the WSR would allocate specific monitoring tasks to an existing EU body or agency, for the purpose of checking that the treatment of waste exported from the EU to third countries takes place in accordance with environmentally sound management rules. Another option under this measure would be to create a dedicated new body at EU level with this specific mandate. This body would notably be tasked with inspecting waste management facilities in third countries. This would complement other existing measures, notably measure 2a) which requires exporting companies to ensure that their waste is dealt with in an ESM manner.
Pursuing the creation of a dedicated body at the EU level, would require new financial and human resources and political backing from the Member States. It is unlikely that there will be sufficient financial resources and political support to create a specific body. Allocating these tasks to an existing body/agency appears difficult as well, as there is currently no EU body with a relevant mandate and appropriate expertise which would be required to monitor the export and treatment of waste in third countries.
Creating an entirely new one to centralise monitoring of waste export and treatment in destination countries would contribute to ensuring the environmentally sound management of waste in third countries. Therefore, the measure has potential to reduce environmental impacts of waste export outside the EU. The extent of the impact is dependent on the volumes of waste concerned. Further information on the volumes of waste concerned are presented against specific objective 2.1 above. This measure is not expected to have major social impacts, but would contribute, alongside with other measures, to curb illegal exports of waste and their associated detrimental impacts in third countries on public health of workers in the waste sector and local communities leaving near areas where waste is dumped or burnt.
Nevertheless, this measure is considered disproportionate as similar objectives could be achieved with measures 2a and 2c, which together establish a framework for the export of green-listed waste and specify obligations for exporters and public authorities to ensure and verify that waste exported to third countries is managed in an environmentally sound manner.
There are precedents in other fields where EU agencies or bodies assume such inspection missions in third countries (notably for products imported to the EU market, such as for food safety purposes or to ensure that fisheries products do not stem from illegal fishing). The idea of creating an EU waste implementation agency was envisioned some years ago but not pursued further, partly due to lack of support of Member States.
Annex 10: Moving to a mandatory use of electronic means to interchange data
The WSR will define the core conditions under which electronic data interchange (EDI) between systems must be used in the EU to ensure interconnectivity, transparency and security. Existing or future national or subnational systems will need to operate along with an EU-level system. This EU-level system will serve two purposes:
·The first one acts as a hub for interchange of WSR data between WSR EU parties operating their own system (this component is further called WSR-hub);
·The second implements the management of the lifecycle for the Notifications and Movements by EU parties which have no system (this component is further called EU-WSR).
The EU level components will be developed by the Commission. Work started several years ago and is ongoing to build the EDI. Parts were done in close consultation with the Member States and stakeholders involved. Some Member States already have their own electronic systems in place, and it is widely supported as a principle that these should interconnect with each other and any EU level system that would be established. A prototype, based in the existing IMSOC platform has already been tested with a group of users, both from the side of competent authorities and industry, who were able to make suggestions on its improvement. And also, real life usage of an advanced production version of the prototype has been started by a number of competent authorities. Therefore, the Commisison expects that the development of the EU-wide EDI should be finalised within 18 months after adoption of the revised WSR. The specifications for developing the EU wide EDI will be provided through implementing acts that detail aspects such as:
·Data model for the information to be exchanged (mostly based on the agreed data model in correspondent guidelines n°11)
·Definition of messages for exchanging data and metadata
·Workflows defining the sequences of messages for each business case (choreography)
·Detailed security requirements for exchanging and storing data
·Technical specification for web services supporting the exchange of messages
After this period, the use of EDI would become mandatory, thus realising the shift from a paper-based procedural framework to EDI.
The EDI would allow interchange of structured data and documents as opposed to scanned or copied documents. This would allow to produce better and more consistent statistics on amount of waste shipped, number of shipments and notification dossiers, etc.
The EDI would be designed to circulate all data and documents via the EU WSR hub and to act as a storage of the data and documents.
This would allow for key advantages and efficiency gains, both as regards to statistics/reports and giving a posteriori central access, when appropriate, to documentation, e.g. during inspections, in a single window paradigm (ie. a one stop shop where relevant information can be provided to users like inspectors or customs).
For the Customs, relevant EU legislation is advancing in that direction already (eg. the EU Customs Single Window (CERTEX))
It should be noted that the Commission will have to receive a specific mandate to manage the data that move through the EU components via the EDI, where appropriate, and without shifting responsibilities from Member States to Commission services.
The proposed amendment includes a transition period during which the use of the EDI will not be mandatory. This transition period would apply to both the national and the EU systems, but would still allow for the voluntary use of electronic means in agreement with all the involved actors.
The Commission’s Prototype and its evolution to a full fledged system:
The Commission has developed a prototype of the EDI, as a proof of concept that reflects the core conditions mentioned above and which intends to gradually build towards the full-fledged EUlevel components to ensure EU wide EDI.
It has been tested by a number of actors including waste shipment operators, competent. The prototype system is based on the following technical specifications:
Parties :
•EU WSR parties: companies and operators involved in waste shipments, Competent Authorities
•Other EU parties: EU customs, Inspectors, police,…
•non-EU Parties.
Identifiers (for EU) :
•CA numbers for CAs,
•EORI for private operators,
•Customs number for Customs offices.
•Inspectors don’t need a number since they are not referred in the notification and movement documentation. The system grants them access based on their role (transport inspection or facility inspection) and their country.
To be robust and efficient, an EU-wide unified and unambiguous way of identifying operators must be anchored. EDI will perform inefficiently if operators (or even authorities) are not clearly and uniquely identified. In that case systems will not be able to automate processes and will require inefficient processes to complement the automated process, e.g. manual input or corrections. One example is the case where operators would be identified by their names, that can be spelled differently in different places. An EU-wide identifying scheme like EORI or equivalent would remediate this.
For similar reasons, it is important to impose conditions to have a robust identifying scheme for the notification numbers. Every competent authority of dispatch must ensure that the number they assign to notifications is unique and only used once in their country. Furthermore, at EU level, the number of the notification is always accompanied by the ISO2 code of the country. Rather than imposing a “format” for notification numbers, clear conditions are to be laid down to ensure exact identification.
Information exchange :
•EU Parties are identified in electronic exchange by using their “identifier”,
•In a first stage, EU Parties exchange unstructured information (like PDF files) and will later support exchange of fully structured electronic information, with clearly defined data types for all information that can be exchanged,
•EU Parties exchange electronic information via a process-oriented workflow, clearly defining which information is to be submitted for every step of the workflow,
•EU WSR parties exchange electronic information with other EU WSR parties via the WSR- hub (except for operators having a privileged communication channel with a Competent Authority – see later section “Architecture”),
•EU WSR parties exchange electronic information with non-EU parties via the WSR-hub,
•EU WSR parties exchange electronic information with EU Customs via the WSR-hub when the connection with the EU Customs single window becomes operational,
EU parties exchange electronic information with eFTI platforms via the WSR-hub when the connection with the eFTI network becomes operational.
Interdependency
The location of the party in the network (like IP address, address within a service provider, etc.) and the type of the connection of the party (via EU WSR or via WSR-hub) must not be provided to enable the interchange.
For exchanging with a party via the WSR-hub, the identifier of the party is the only information to be provided.
This implies that every party must decide and announce the identifier that they will use to participate in the EDI. For CAs, identifiers are already existing.
Security
The Commission’s components are operated under a corporate security plan drafted following the ITSRM² methodology and covering system availability, data confidentiality & integrity, business continuity and disaster recovery. The plan includes the description of the authentication and authorization mechanisms that are used when using the components. The components also record logging and auditing info of every event happening when using them. The EC establishes and publishes a privacy statement for the use of the system. The EC also notifies the system to its Data Protection Officer.
Signatures are either digital signatures or sign-in-the-system signatures.
Service level
The EC will establish a user Help-desk for the 2 components, available during working days, working hours. The EC will also establish online users instructions for the use of the EU-WSR and technical specifications for the connection and exchange info/docs via the WSR-hub.
Structured data
When structured data will be supported, each field of information, which is part of an electronic document or belong to the metadata of an electronic document, will have a clearly defined type and format. Structured data must be fit for handling by IT systems (for querying, analysing, storing, etc. purposes) and can also be displayed in a human-readable manner.
Architecture
CAs having their system define which types of operators must exclusively and mandatorily use their system, prior to exchange with other parties via the WSR-hub component.
For example, notifiers may be required to exclusively use the national system of the CA of dispatch for submitting their notification. Then, the CA will validate (if it is compliant) the notification in the national system and finally will connect to the WSR-hub for exchanging the notification with the other CAs. In another example, a treatment facility may be required to exclusively use the national system of the CA of destination, to sign that a shipment has been received. Then, the CA connects to the WSR-hub to share the signed movement document with the CA of dispatch.
To exchange with other parties than those specific cases above, one of the two EC components must be used, when at least one of those other parties requires to be reached that way.
Protocol
Sending info:
When sending information to other parties via the WSR-hub, the system of the sending party must push the information to the hub for the recipient parties. To specify the recipient parties, the pushed information must contain their identifiers.
Retrieving info:
When retrieving information from other parties via the WSR-hub, the system of the interested party must pull the information from the hub. To allow some efficiency for the pull, the WSR-hub will provide the following functionalities when providing the identifier:
·lookup functionalities (allowing parties to poll at their preferred frequency and verify if there is new info available for them),
·download functionalities (allowing parties to get information, previously identified as necessary at the lookup times)
Transfer characteristics:
Systems transferring info via the WSR-hub do not exchange digital certificates between them. They use SSL encryption to protect data during transfer to and from the WSR-hub. That creates a channel, uniquely encrypted, so that the party and the WSR-hub have a private and secure communication link.
Process oriented workflow
In the revised reg., the electronic template should be able to support the info and signatures of all involved parties and avoid having separate documents, signed by each Competent Authority.
This mainly applies for block 20 where only the decision of one CA can be put.
The electronic version of the notification will support one common part for all parties (mainly blocks 1 to 16 for notif + attachments) and, below, the info and signature for every involved parties. Such that it is not possible that there exists several versions of the common part which may contain (even only slightly) different data. The info and signatures of the parties are submitted, in the adequate steps in the workflow, without providing the common part.
Automation of procedures
The EC and national systems will be able to automate actions and workflow transition when clearly defined conditions are met. For example, consent is automatically given when all relevant conditions are satisfied (pre-permitted/certified,…).
Connections with other networks
The EC establishes specifications for connection by non-EU parties. Connections for non-EU parties are possible only via the WSR-hub. The WSR-hub acts in a transparent manner for EU parties when they interchange information/documents with the connected non-EU parties. This means the information interchange is independent of whether that party has its own system or is using the EU WSR components. To exchange with a non-EU party, the only thing EU parties need to provide is the “identifier” of that non-EU party (not its system’s location in the world, neither the protocol the system uses…)
The Commission’s components also establish a connection to the EU Customs Single Window system for the interchange of info/docs with EU national customs. That connection operates in a transparent manner for EU parties, i.e. the information/documents provided by the EU parties are automatically made available, to the legitimate custom(s) and at the legitimate time, without an additional action by the EU party. Note that the timing for having that connection operational may not match with the timing when EDI use becomes mandatory.
The Commission’s components also establish a connection with EFTI platforms for the interchange of info/docs with the freight transport parties. That connection operates in a transparent manner for EU parties, i.e. the information/documents provided by the EU parties are automatically made available, to the legitimate transport actor(s) and at the legitimate time, without an additional action by the EU party. Note that the timing for having that connection operational may not match with the timing when EDI use becomes mandatory.
“Only once” principle
The EC and the national systems respect the “only once” principle as much as possible. This means that once data is made available to one party, it does not need to be sent again to be made available later to another party. For example, if a notification has been made available for one CA and another CA is also entitled to access it, there is no need for the sender to send it again, the Commission’s components shall make it available automatically to that other CA. In another example: if a cross-border movement document has been announced and made available for access by carriers, it should not be sent again to be made available for Customs, the Commission’s components shall make it available automatically for the customs entitled to access it. Data already sent are also reused (without being resent) for reporting purposes.
Annex 11: International legal context applicable to measures with an impact on export of waste
The Basel Convention regulates the transboundary movemenents of hazardous waste, listed in Annex VIII of the Convention and of other specific waste streams, listed in Annex II of the Convention. In its Article 4(11), the Convention states that “Nothing in this Convention shall prevent a Party from imposing additional requirements that are consistent with the provisions of this Convention, and are in accordance with the rules of international law, in order better to protect human health and the environment”. The measures proposed would affect primarily export of “green-listed” waste, which are not subject to the control mechanisms under the Basel Convention. In addition, the purpose of these new measures would be to ensure the environmentally sound management of the waste exported from the EU, which corresponds to the overall objective of the Basel Convention.
The OECD Decision sets out a specific regime governing the transboundary movement of waste for recovery between OECD members. The OECD Decision contains provisions relating to the transboundary movements of “amber-listed” and “green-listed” waste. A measure which would lead to a prohibiton of exporting waste destined to recovery operations from the EU to all OECD countries would not be consistent with the overall purpose and procedures laid down in the OECD Decision. It is likely that it would be considered as discrimating against other OECD member countries. The OECD Decision however recognises in its Preamble that “Member countries may, within their jurisdiction, impose requirements consistent with this Decision and in accordance with the rules of international law, in order to better protect human health and the environment”. The OECD Decision also contains provisions for “specific national controls”, which state that “This Decision does not prejudice the right of a Member country to control, on an exceptional basis, certain wastes differently, in conformity with domestic legislation and the rules of international law, in order to protect human health and the environment.” This provisions leaves a clear margin of manoeuvre to OECD members to take specific measures on the export of waste to another OECD Member if the purpose of this measure is to protect human health and the environment and is adopted on an exceptional basis.
The General Agreement on Tariffs and Trade (GATT) also applies to the trade in waste. For example, a general export ban on waste destined for recovery would be a trade restriction prohibited under Art. XI GATT and therefore would need to be justified under Article XX GATT. In particular, it would need to be demonstrated that the measure pursues one of the policy grounds set out under Article XX, and, under the chapeau of Article XX, that the measure is not applied “in a manner which would constitute a means of arbitrary or unjustifiable discrimination between countries where the same conditions prevail, or a disguised restriction on international trade”. Two exceptions under Article XX(b) and XX(g) are of particular relevance here. They indicate that measures need to be necessary either to protect human, animal or plant life or health, or relate to the conservation of exhaustible natural resources, respectively. This requires demonstrating that the restriction genuinely pursues an environmental objective and that no other less trade restrictive measure was available to achieve the stated objectives. Examples of where these exceptions have been applied are included on the WTO website
.
Annex 12: Impacts of measures
This Annex provides a detailed analysis of the economic, environmental and social impacts of all proposed measures and their combination in the different options. The assessment is perfomed against the standard evaluation criteria (effectiveness, efficiency, proportionality, coherence), and reflects the findings in section 7.1 of the impact assessment report. The analysis also includes specific information on the impact of the proposed measures on the Commission resources.
1.Rating of measures and options
The table below presents a rating for each measure under each of the three general objectives. Each measure is rated on its effectiveness (by considering the economic, environmental and social impacts) as well as on its efficiency to meet the relevant objective(s). For each of these elements, each measure is rated on a scale of 1-2, where 2 is the highest positive impact and 0 no impact. The ratings for each of these elements are then added to obtain an overall rating for each measure, presented in the left-hand column. By rating the measures in this manner, all criteria are taken into account in a balanced approach. Aso, the proportionality of each measure is indicated ( +, neutral or - ) taking into account the considerations whether a measure is 1) necessary to achieve the problem/objective satisfactorily; 2) limited to aspects that Member States cannot achieve satisfactorily on their own while still leaving a scope for Member States to take national decisions; 3) not causing unjustified financial or administrative cost for different actors involved in the waste shipment and management activities.
Objective 1: Facilitate shipments within the EU, in particular to align the WSR with circular economy objectives
|
Measures
|
Economic impact
|
Environmental impact
|
Social impact
|
Efficiency and Proportionality
|
|
1a) Improve the regime of “pre-consented” facilities
|
Reduce delays in receiving consent
Reduce delays during shipments
Harmonise interpretation and application: 2
|
More waste to optimal waste treatment: 1
Increase waste shipped for treatment higher up the waste hierarchy: 2
|
Extra jobs in recycling: 1
|
Efficiency:
Yearly admin costs for pre-consent facilities notifications divided by 3
Notification fees divided by 3
Reduce admin burden: 1
Some costs to pre-consent the facilities compensated by benefits: 1
Proportionality: +
|
|
Overall rating 5.5
|
Rating: 2
|
Rating: 1.5
|
Rating: 1
|
Rating: 1
|
|
Conclusion: The overall impacts demonstrate that this measure is proportionate and consistently responds to the need to ensure optimal treatment of waste within the EU leading to a more effective, efficient and traceable regime of waste shipment. Same effect would not be achieved individually by Member States as the measure concerns harmonisation of conditions/requirements.
|
|
1b) Streamline the notification procedure
|
Reduce delays during shipment: one delay estimated at 150k euro
Harmonise interpretation and application: 1
|
Better monitoring of waste shipment;
Development of innovative solutions
More waste to optimal waste treatment: 1
|
Extra jobs in recycling: 1
|
Efficiency:
Reduce admin burden: 1
Proportionality: +
|
|
Overall rating 4
|
Rating: 1
|
Rating: 1
|
Rating: 1
|
Rating: 1
|
|
Conclusion: This measure proposes an harmonized approach which leads to a more effective, efficient enforcement of the waste shipment procedures. The implementation of this measure is necessary and proportionate as it relates with the harmonization aspects where Member States would not be able to achieve the same effect satisfactorily on their own. It also directly addresses the economic concerns expressed by stakeholders, regarding the costs associated with the delays of shipments.
|
|
1c) Clarify the scope of the WSR
|
Reduce delays during shipment: one delay estimated at 150k euro
Harmonise interpretation and application: 2
|
Proper use of the applicable controls to ensure ESM: 1
|
|
Efficiency:
Reduce admin burden: 1
Proportionality: +
|
|
Overall rating: 3
|
Rating: 1
|
Rating: 1
|
Rating: 0
|
Rating: 1
|
|
Conclusion: The implementation of this measure is related to the would harmonise interpretation and application of the and proportionate as it is related to the aspects where Member States cannot achieve the same effect satisfactorily on their own.
|
|
1d) Set up a mandatory EU-wide electronic data interchange (EDI)
|
950 000 euro per year saved for competent authorities to handle notifications;
450 000 euro per year saved for companies submitting notifications
Development and maintenance costs for competent authorities: 50 000 - 80 000 euro for the first year; 20 000 euro per year once the system has been refined
Training costs
Harmonise interpretation and application: 2
|
Better monitoring of waste flows: 2
Increase waste shipped for treatment higher up the waste hierarchy: 1
|
New skills gained in
competent authorities and Commission
|
Efficiency:
Cost to implement EDI compensated abundantly by benefits for all actors: 2 Reduce admin burden: 2
Proportionality: +
|
|
Overall rating 6.5
|
Rating: 2
|
Rating: 1.5
|
Rating: 1
|
Rating: 2
|
|
Conclusion: The implementation costs of this measure overweights the benefits for all actors active in the waste shipment process. In a proportionate and harmonized manner, it strengthens the coherence of Regulation with the overarching the EU policy objectives established in the European Green Deal - digital and green transition.
|
|
1e) Streamline the financial guarantee system by harmonising the calculation of the amount required under the guarantee
|
Uniform amounts calculated across the EU
Simplified method to determine the amount
Harmonise interpretation and application: 2
|
|
|
Efficiency:
Reduce admin burden: 2
Increased predictability for budgeting of guarantees: 1
Proportionality: +
|
|
Overall rating 3.5
|
Rating: 2
|
Rating: 0
|
Rating: 0
|
Rating: 1.5
|
|
Conclusion: Similarly to measure 1b), this measure proposes an EU level harmonisation which leads to a more effective, efficient enforcement of the waste shipment procedures, which cannot be coherenly achieved by Member States acting on thei own.
|
|
1f) Ensure mutual recognition at EU level of carriers of hazardous waste registered in one Member State
|
Harmonise interpretation and application: 1
|
|
|
Efficiency:
Reduce admin burden: 1
Proportionality: neutral
|
|
Overall rating 2
|
Rating: 1
|
Rating: 0
|
Rating: 0
|
Rating: 1
|
|
Conclusion: Although it would contribute to a higher level of harmonisation at the EU, the minimum scale of impacts shows that this measure is not satisfactory enough to achieve the objective of mutual recognition. It risks lacking effectiveness to ensure a common national interpretation and a level playing field for all economic operators in the waste management sector.
|
|
1g) Align the WSR provisions with the waste hierarchy
|
Positive for recycling sector
Negative for incineration and landfills sector
Harmonise interpretation and application: 2
|
Waste shipped to optimal waste treatment: 2
Increase waste shipped for treatment higher up the waste hierarchy: 2
|
Extra jobs in recycling: 1
|
Efficiency: 0
Proportionality: neutral
|
|
Overall rating 5
|
Rating: 2
|
Rating: 2
|
Rating: 1
|
Rating: 0
|
|
Conclusion: The measure ensures a high coherence with the overarching EU circular economy objectives and waste legislation, notably the Waste Framework Directive, and implies high long term economic, environmental and social benefits. No major implications for proportionality or efficiency.
|
|
1h) Issue guidance on current problematic issues
|
Harmonise interpretation and application: 1
|
|
|
Efficiency:
Efforts to develop and adopt guidance unlikely to be compensated by benefits: 0
Proportionality: neutral
|
|
Overall rating 2
|
Rating: 1
|
Rating: 0
|
Rating: 0
|
Rating: 0
|
|
Conclusion: Compared to the other measures, the nature of this measure does not prove to be effective and efficient to achieve the foreseen objectives satisfactorily. Due to non-legally binding form it would not be sufficient to eliminate problematic issues.
|
|
1i) Ensure alignment with the provisions on end-of-waste and byproducts in the Waste Framework Directive
|
Harmonise interpretation and application: 2
|
Accelerate the formation of sustainable market of secondary materials: 1
|
|
Efficiency:
Reduce admin burden: 1
Proportionality: +
|
|
Overall rating 4
|
Rating: 2
|
Rating: 1
|
Rating: 0
|
Rating: 1
|
|
Conclusion: As in the case of 1g), this measure ensures a better coherence with the overarching EU circular economy objectives and waste legislation, notably Waste Framework Directive. It contributes to the efficiency and proportionality.
|
|
|
|
Measures
|
Economic impact
|
Environmental impact
|
Social impact
|
Efficiency and Proportionality
|
|
1j) Task the Commission to set thresholds for contamination of wastes through delegated/implementing acts to determine if they should be subject to the notification procedure or not
|
Harmonise interpretation and application: 2
|
More waste directed to optimal treatment: 1
Increase waste shipped for treatment higher up the waste hierarchy: 1
|
|
Efficiency:
Reduce admin burden: 1
Costs compensated by benefits: 1
Proportionality: +
|
|
Overall rating 4
|
Rating: 2
|
Rating: 1
|
Rating: 0
|
Rating: 1
|
|
Conclusion: In a clear and efficient legal form, this measure best corresponds to the objective to eliminate uncertainty in interpreting the contamination level of waste. It would proportionately and substantially reduce the application incohherences and administrative burden for both waste operators and national competent authorities which are often the obstacles to have undelayed shipments within the EU.
|
|
1k) Establish mutual recognition of national end-of-waste criteria for the purpose of waste shipments
|
Harmonise interpretation and application: 2
|
|
|
Efficiency: 0
Proportionality: neutral
|
|
Overall rating 2
|
Rating: 2
|
Rating: 0
|
Rating: 0
|
Rating: 0
|
|
Conclusion: The measure is not satisfactory enough to achieve the objective of mutual recognition. It risks lacking efficiency to ensure a common national interpretation and a level playing field for the economic operators in the waste management sector and has no meaningful positive environmental nor social benefits.
|
|
1l) Establish mutual recognition of national decisions in relation to the hazardousness nature of wastes for the purpose of waste shipments
|
Harmonise interpretation and application: 2
|
|
|
Efficiency: 0
Proportionality: neutral
|
|
Overall rating 2
|
Rating: 2
|
Rating: 0
|
Rating: 0
|
Rating: 0
|
|
Conclusion: As in the case of 1k), the measure is not satisfactory enough to achieve the objective of mutual recognition. It risks lacking efficiency to ensure a common national interpretation and a level playing field for the economic operators in the waste management sector and has no meaningful positive environmental nor social benefits.
|
Objective 2: Guarantee that waste exported outside the EU is managed in environmental sound manner
|
Measures
|
Economic impact
|
Environmental impact
|
Social impact
|
Efficiency and Proportionality
|
|
2a) Specify obligations for exporters and public authorities to ensure and verify that waste exported to third countries is managed in an environmentally sound manner
|
One off costs for companies exporting waste of around 30000 euro for setting up of audit schemes and yearly costs of around 5000 for maintaining these audit schemes. Plus, recurring costs of around 1000 to 2000 euro per audit of individual facilities. However, not all these costs are expected to arise at each exporting company. SMEs could rely on audit schemes established and operated by major exporting companies which would be required to share their audits more widely under fair commercial conditions.
|
Stop export if not ESM: 2
Improve waste management in third countries: 2
|
Benefits in third countries with reduction of adverse effects of mismanagement of waste on public health of workers and local populations: 2
|
Efficiency:
Costs compensated by benefits: 1
Proportionality: +
|
|
Overall rating 5
|
Rating: 0
|
Rating: 2
|
Rating: 2
|
Rating: 1
|
|
Conclusion: This measure would add clear and stringent provisions requiring the transparency evidence for transportation and management of waste. Compared to the measure 2d), this measure is more coherent and efficient, leading to substantial environmental and social impacts, as it would establish concrete and universal requirements for the key operators active across all the supply chain of waste.
|
|
2b) Task the Commission to set out criteria to differentiate between used goods and waste, for specific waste streams for which export to third countries raises particular challenges
|
Gains linked to an increase in treatment of waste in the EU: 1
|
More waste treated in an ESM: 1
|
Benefits in third countries with reduction of adverse effects of mismanagement of waste and non-reusable used goods on public health of workers and local populations: 2
|
Efficiency:
No additional costs: 1
Proportionality: +
|
|
Overall rating 5
|
Rating: 1
|
Rating: 1
|
Rating: 2
|
Rating: 1
|
|
Conclusions: This measure is indispensable to ensure clarity in qualifying items for the shipment purposes. Acting individually, Member States could not achieve the same effect satisfactorily in an efficient, harmonized and proportionate manner due to currently existing different interpretation of the rules.
|
|
2c) Establish a new framework in which non-OECD countries have to notify the EU of their willingness to import green-listed waste and demonstrate their ability to treat it sustainably according to set criteria
|
Benefits: 200-510 million euro in 2019 and
1.6 and 4.0 billion euro in 2030
Savings for steel industry linked to reduced ETS contribution (36-116 million euro/year)
Economic losses for companies currently exporting waste to countries no longer authorised to import waste from the EU
|
Benefits with contribution to improving standards for waste management in third countries
Multiple Environmental benefits linked to treatment of waste in the EU with a minimum of value of 266-666 million euro in 2019 and 275-687 million euro in 2030
|
Benefits in third countries with reduction of adverse effects of mismanagement of waste on public health of workers and local populations
Benefits: creation of between 9000 and 23000 jobs in the EU
|
Efficiency:
Costs compensated by benefits: 1
Proportionality: +
|
|
Overall rating 7
|
Rating: 2
|
Rating: 2
|
Rating: 2
|
Rating: 1
|
|
Conclusion: In a coherent and proportionate manner with EU circular economy objectives, this measure is expected to deliver the widest range of environmental benefits, ranging from the halt of the undesired waste export, causing environmental and health challenges in the destination countries which are presently unable to comply with the high waste management standards, to diversion of wastes from these non-OECD third countries to those that do comply with the criteria.
|
|
2d) Require that the export of green-listed waste outside the OECD is subject to the notification procedure
|
Benefits 200 million euro in 2019 and 1.6 billion euro in 2030
to be compared with important costs linked to notification procedure for operators and public authorities
Savings for steel industry linked to reduced ETS contribution (36 million euro/year)
Gains linked to an increase in treatment of waste in the EU: 1
|
Better control/monitoring of exported waste, avoided environmental externalities (transport and substandard treatment), comparable to lower retention scenario in 2c: between 266-275 million euro in 2019-2030
More waste treated in an ESM: 1
|
Benefits in third countries with reduction of adverse effects of mismanagement of waste on public health of workers and local populations
Potential benefits:
creation of approximately 9 000 jobs in the EU
|
Efficiency:
Increased admin burden: 0
Proportionality: neutral
|
|
Overall rating 4
|
Rating: 1
|
Rating: 1
|
Rating: 2
|
Rating: 0
|
|
Conclusion: Compared to the measure 2c), the extent of impacts reveal that this measure is less efficient and effective as it would just partially mitigate the environmental challenges linked to the export outside the OECD. No major implications on efficiency or proportionality.
|
|
2e) Set up a specific procedure to monitor export of waste to OECD countries and mitigate environmental problems that might be caused by such exports
|
Limited impact as would mostly only concern specific waste streams destined to specific OECD countries
|
Preventive action possible to mitigate environmental negative impact of waste exported to one OECD country
More waste treated in an ESM: 1
|
Benefits in third countries with reduction of adverse effects of mismanagement of waste on public health of workers and local populations: 2
|
Efficiency:
Costs compensated by benefits: 1
Proportionality: +
|
|
Overall rating 5
|
Rating: 1
|
Rating: 1
|
Rating: 2
|
Rating: 1
|
|
Conclusion: The impacts of this measure respond to what is necessary to achieve for the objective satisfactorily and in an efficient and proportionate manner. It is based on a preventive approach which allows to benefit in terms of a timely response towards a mismanagement of waste leading to adverse social consequences.
|
Objective 3: Better address illegal shipments of waste within and outside the EU
|
Measures
|
Economic impact
|
Environmental impact
|
Social impact
|
Efficiency and Proportionality
|
|
3a) Improve provisions on inspections and enforcement and its follow-up
|
Financial benefits for Member States and industry (e.g. avoided clean-up and repatriation costs, more income to legitimate businesses and more tax revenues): 2
|
Siginficant reduction of adverse effects of illegal activities: 2
|
Improved human health (e.g. respiratory problems, injuries etc.)
|
Efficiency: 0
Proportionality: +
|
|
Overall rating 5
|
Rating: 2
|
Rating: 2
|
Rating: 1
|
Rating: 0
|
|
Conclusion: This measure ensures a balanced and proportionate level of intervention, appropriately taking into account the subsidiarity aspects role of Member States in the areas of enforcement and inspection in the most effective form.
|
|
3b) Issue guidance on efficient inspections and enforcement practices
|
Positive economic impact for the legitimate actors: 1
|
|
|
Efficiency: 0
Proportionality: -
|
|
Overall rating 2
|
Rating: 1
|
Rating: 0
|
Rating: 0
|
Rating: 0
|
|
Conclusion: Compared to the measure 3a), the nature of this measure does not prove to be effective to achieve the foreseen objectives satisfactorily. Due to non-legally binding form, it would not be sufficient to ensure efficiency in the area of inspections and enforcement.
|
|
3c) Empower the Commission (through OLAF) to carry out transnational investigative and coordinating actions against waste trafficking in the EU
|
Financial benefits for Member States and industry (e.g. avoided clean-up and repatriation costs, more income to legitimate businesses and more tax revenues): 2
|
Siginficant reduction of adverse effects of illegal activities: 2
More waste treated in an ESM: 1
|
Reduced tax evasion through organised crime: 1
Extra jobs in recycling: 1
|
Efficiency:
No additional costs: 1
Proportionality: +
|
|
Overall rating 5.5
|
Rating: 2
|
Rating: 1.5
|
Rating: 1
|
Rating: 1
|
|
3d) Reinforce existing provisions on infringments and penalties
|
Increased prosecution, resulting in reducing illegal activities competing with legal waste sector: 2
|
Siginficant reduction of adverse effects of illegal activities: 2
More waste treated in an ESM: 1
|
Extra jobs in recycling: 1
|
Efficiency:
No additional costs: 1
Proportionality: +
|
|
Overall rating 5.5
|
Rating: 2
|
Rating: 1.5
|
Rating: 1
|
Rating: 1
|
|
3e) Improve traceability of shipments of green-listed waste
|
Financial benefits for Member States and industry (e.g. avoided clean-up and repatriation costs, more income to legitimate businesses and more tax revenues): 2
|
Siginficant reduction of adverse effects of illegal activities: 2
More waste treated in an ESM: 1
|
Extra jobs in recycling: 1
|
Efficiency:
No additional costs: 1
Proportionality: +
|
|
Overall rating 5.5
|
Rating: 2
|
Rating: 1.5
|
Rating: 1
|
Rating: 1
|
|
Conclusion: Measures 3c, 3d, 3e provide the balanced approach and efficiency necessary for intervention at the EU, regional and national level. They are in compliance with the principles of proportionality and subsidiarity. Compared to the baseline, these measures will contribute to better efficiency, effectiveness and coherence. Neither of measures is foreseen to deliver negative implications.
|
|
3f) Facilitate cooperation between enforcement authorities at the national level
|
Better use of resources to enforce WSR: 1
|
Reduction of adverse effects of illegal activities: 1
More waste treated in an ESM: 1
|
More robust enforcement networks within Member States: 1
|
Efficiency:
No additional costs: 1
Proportionality: +
|
|
Overall rating 4
|
Rating: 1
|
Rating: 1
|
Rating: 1
|
Rating: 1
|
|
Conclusion: Balanced distribution of economic, environmental and social impacts shows that this measure builds upon all-encompassing approach what makes it effective enough to contribute to Objective 3 in a coherent and proportionate manner.
|
|
3g) Creation of a dedicated group at the EU level with the task to facilitate and improve cooperation on enforcement of the WSR
|
Improved prioritisation of enforcement efforts will lead to better use of resources: 1
Positive economic impact for the legitimate actors: 2
|
Reduction of adverse effects of illegal activities: 1
More waste treated in an ESM: 1
|
Extra jobs in recycling: 1
|
Efficiency:
No additional costs: 1
Proportionality: +
|
|
Overall rating 4.5
|
Rating: 1.5
|
Rating: 1
|
Rating: 1
|
Rating: 1
|
|
Conclusion: A broad spectrum of positive impacts are associated with the measure aiming to establish a constructive EU level forum/platform exclusively dedicated for the illegal shipments. It would ensure the EU level coordination which would not be achieved by Member States individually acting on their own.
|
2.Impacts of measures on Commission resources
A number of the proposed measures would imply a need for resources in the Commission to develop and publish secondary legislative acts to implement further this measure. The table below provides an overview of the estimates in that regard, for those measures where relevant. The preferred measures are underlined.
|
Measure
|
Estimated FTE needed
|
|
1d) Set up a mandatory EU-wide electronic data interchange (EDI)
|
One-off staff need of 0.2 FTE for 18 months is estimated to be required to prepare and adopt secondary legislation to specify the aspects of the EDI system that are too detailed or technical to be included in the Regulation itself. The in-house technical development of the EDI system itself is already planned in the relevant budget line of DG ENV.
|
|
1e) Streamline the financial guarantee system by harmonising the calculation methodology of the amount required under the guarantee.
|
0.2 FTE for one year is estimated to be required for the development and adoption of such an act.
|
|
1h) Issue guidance on current problematic issues
|
0.2 FTE for at least 2 years is estimated to be required for the development and adoption
|
|
1j) Task the Commission to set thresholds for contamination of wastes to determine if they should be subject to the notification procedure or not through delegated/implementing acts
|
This will be most likely a recurring effort depending on the waste streams that require specific thresholds and 0.2 FTE is estimated annually to be required for the development and adoption of such acts.
|
|
2b) Task the Commission, via implementing or delegated acts, to set out criteria to differentiate between used goods and waste, for specific waste streams for which export to third countries raises particular challenges
|
This is expected to be a recurring effort depending on the specific material streams or product groups that require criteria to differentiate between used goods and waste and 0.2 FTE is estimated annually to be required for the development and adoption of such acts.
|
|
2c) Establish a new framework for the export of green-listed waste from the EU to a non-OECD country
|
The implementation of this procedure (assessment of notifications from third countries and establishment and update of a list of non-OECD countries authorised to import green-listed waste from the EU) would require additional resources for the European Commission. In the first years after entry into force of the WSR, all the preparatory work would have to be conducted to inform third countries of the new provision; provide details about the information and format to be used to notify a country’s willingness to import waste, and develop and follow the adoption of an implementing act. It is estimated that this would require support from external experts in the amount of 500 000 euro per year in additional to a full time equivalent position for an administrator (equivalent to an amount of 150 000 euro per year) to supervise all this work and then maintain the implementing act up to date. The required staff is higher than for other secondary acts presented in this report, due to the expected extensive preparation that would be required. However, this procedure would replace the procedure linked to Regulation 1418/2007, which currently has a considerable cost (approximately 0.5 FTE per year at a cost of 75 000 EUR per year, plus consultancy support ) to ensure its implementation and update.
|
|
2e) Set up a specific procedure to monitor export of waste to OECD countries and mitigate environmental problems that might be caused by such exports
|
The monitoring of export of waste by the Commission, and the possibility to launch specific procedures towards a specific country, would require resources from the Commission, which are estimated to amount to 0.1 FTE/year.
|
|
3a) Complement existing provisions on inspection plans
|
The creation of an obligation for the Commission to assess the inspection plans submitted by the Member States will have human resource implications for the Commission (0.2 FTE)
|
|
3b) Issue guidance on efficient inspections and enforcement practices
|
0.2 FTE is estimated to be required for the development and adoption the act to implement this measure.
|
|
3c) Empower the Commission (through OLAF) to carry out transnational investigations and coordinating actions against waste trafficking in the EU
|
Investigative and coordinating actions in OLAF will require resources. 1 additional FTE is estimated to be required for this task.
|
|
3g) Creation of a dedicated group at the EU level with the task to facilitate and improve cooperation on enforcement of the WSR
|
The management of this dedicated enforcement group would require an additional 0.5 FTE administrator (equivalent to 75 000 euro/year). In addition, it is estimated that the costs for organising meetings of this group twice a year would amount to a total of 40 000 euro/year (20 000 per meeting).
|
Annex 13: The relationship between the WSR and the EU Regulation on Ship Recycling
Ships sent for recycling usually contain hazardous materials and may therefore be considered as a shipment of hazardous waste, which falls under the scope of the Basel Convention. Indeed, Parties to the Basel Convention noted that a ship may become waste as defined in Article 2 of the Convention while at the same time being defined as a ship under other international rules. Due to their content of hazardous materials, when ships are waste, they have to be considered as hazardous wastes.
In 1995, Parties to the Basel Convention adopted the so-called “Ban Amendment” which prohibits exports of all hazardous wastes covered by the Basel Convention that are intended for final disposal, reuse, recycling and recovery from Parties and other States which are members of the OECD and the EU and from Liechtenstein to all other countries. The Ban Amendment entered into force at the international level on 5 December 2019.
The Ban Amendment has been implemented into EU law through the Waste Shipment Regulation (WSR), which includes a similar ban on the export of hazardous waste to countries outside the OECD. Nevertheless, end-of-life ships are excluded from the scope of application of the Waste Shipment Regulation in so far as they are covered by the Ship Recycling Regulation.
The Ship Recycling Regulation (SRR) applies to large commercial ships flying the flag of a Member State of the European Union (hereafter referred to as ‘EU flagged ships’). Contrary to the Ban Amendment, the SRR theoretically allows for export of EU flagged ships for recycling to countries outside the OECD, as long as such transport takes place to facilities included on the so-called ‘European List of ship recycling facilities’ (hereafter referred to as the ‘EU list’). Nevertheless, since no facilities from non-OECD countries are included on the current EU list, in practice, it is at present impossible to export EU flagged ships for recycling to non-OECD countries in conformity with the SRR. On that basis, there are currently no inconsistencies between the regime of the Basel Convention, as amended by the Ban Amendment, and that of the SRR, as neither allows the export of EU flagged ships for recycling to non-OECD countries.
However, in the event of a future inclusion of a non-OECD facility on the EU list, the regime of the SRR would allow exports of EU flagged ships for recycling to the concerned non-OECD country, whereas the Ban Amendment generally prohibits such exports (except under an agreement or arrangement under Article 11 of the Basel Convention), thus leading to incompatible legal regimes as such. As parties to the Basel Convention, both the EU and its Member States would be obliged to comply with their obligations flowing from international law, not only in fact but also in law.
Therefore, in order to satisfy this obligation and to ensure strict legal compatibility of the EU legal regime applicable for export of EU flagged ships going for recycling with obligations stemming from the international entry into force of the Basel Ban Amendment, it is necessary to modify the WSR to ensure that its provisions implementing the Ban Amendment are made applicable with respect to those EU flagged ships covered by the SRR that have become waste in the EU.
The effect of the proposed change will be that those EU flagged vessels that have become waste within the EU will then be legally bound by the Ban Amendment and therefore cannot get recycled in facilities included in the EU list which are located outside the OECD. However, in all other respects, the regime established by the SRR will continue to be applicable to these vessels meaning that they will not be bound by the rest of the provisions of the WSR. This is necessary in order to avoid confusion, overlaps and administrative burden.
At the same time, those EU flagged ships that have become waste outside the EU will continue to be fully exempted from the regime established by the WSR and will only remain subject to the SRR meaning that they can still get recycled in facilities included in the EU list which are located outside the OECD.
In this respect, it is also important to note that a certain proportion of the EU-flagged fleet reportedly operates solely outside European waters. Furthermore, a decision to recycle a ship is often taken while the ship is in international waters outside the jurisdiction of a Member State. In such cases, applying the export prohibition under the WSR has in the past proved to be very difficult or impossible to enforce. Moreover, commercial ships leaving European ports and waters usually optimise their last voyage by delivering goods to third countries prior to going for dismantling. If the shipowner does not declare the intention to dismantle a ship when leaving an EU port, the relevant authorities can in general not intervene. The WSR establishes rights and obligations for the exporting state, the importing state and, if applicable, the transit states. The port states are, however, not necessarily informed of the shipowner’s intention to recycle a ship. Finally, it is also not uncommon for a ship to be sold to another operator under the pretence that the ship will continue trading only for it to be transferred to a ship dismantling facility.
In view of the above, it is justified to continue to keep those EU flagged ships that have become waste outside the EU subject to the SRR regime and allow them to get legally dismantled in recycling facilities included in the EU list which are located in non-OECD countries.
Finally, it is important to note that the rules of the WSR implementing the Ban Amendment export prohibition (Article 36) shall only apply to EU flagged end-of life ships if they contain hazardous substances listed in Annex V to the Regulation (e.g. asbestos, PCBs etc). As noted above, this is most often the case in practice. However, in the event if an EU flagged end-of life ship does not contain any of these hazardous substances then it is not to be considered as hazardous waste falling under the export prohibition. Therefore, these “non-hazardous” EU flagged ships that have become waste within the EU will not be legally bound by the Ban Amendment and can get recycled in facilities included in the EU list which are located outside the OECD.
Annex 14: How the Preferred option achieves the objectives for this review
8.1.1 Objective 1: Facilitate shipments within the EU, in particular to align the WSR with circular economy objectives
The setting up of a mandatory interchange of data via electronic means (measure 1d) is key in modernising the WSR and improving the conditions under which waste are shipped within the EU. This structural change is vital for the success of a number of other measures designed to streamline the notification procedure and facilitate the shipments of waste for recovery to pre-consented facilities. It will improve the traceability of waste shipment, thereby contributing to tackling illegal shipments (link with objective 3), and will also facilitate the monitoring of waste shipments and the reporting of key data and obligations under the WSR.
The improvement of the current regime of “pre-consented” facilities (measure 1a) will in addition reduce administrative burden and delays for companies shipping waste for recovery and for competent authorities authorising these shipments. This will be an essential tool to ensure a smooth functioning of the market for high quality waste in the EU. The possibility for the Commission, in consultation with stakeholders and Member States, to adopt a common methodology for the calculation of financial guarantees that need to be constituted for the shipment of “notified” waste will also reduce disparities between Member States and simplify the regime for economic operators (measure 1e).
The measures 1b and 1c designed to streamline the notification procedure and clarify the scope of WSR will result in lower administrative burdens and costs linked to delays generated by recurring disputes on different interpretations throughout the Union. The possibility for the Commission to adopt harmonised provisions on thresholds for contaminated waste (as in measure 1j) will also contribute to ensure a proper level playing field all across the EU for the shipment of waste. The explicit recognition in the WSR of the criteria agreed in the Waste Framework Directive on the definition of end-of-waste (measure 1i) should avoid recurring disputes on the status of commodities (waste or non-waste) shipped between EU Member States.
Finally, to better align the rules on waste shipment with the waste hierarchy, measure 1g would on the one hand limit the possibility to object to shipments of waste to another Member State for recovery in exceptional circumstances; it will on the other hand allow objections to be raised by a Member State to shipments of waste destined to other forms of recovery than recycling, if these shipment jeopardise its waste management strategy. This measure would also prohibit shipments of waste for disposal (landfilling and incineration without energy recovery) to another Member State, except in well-defined circumstances. This will help achieving the ambitious targets set out in the EU waste legislation and the transition of the European economy to a more circular model.
8.1.2 Objective 2: Guarantee that waste exported outside the EU is managed in an environmentally sound manner
The new framework governing the export of waste to non-OECD countries (as proposed in measure 2c), provides the best potential for the EU to stop exporting its waste challenges to vulnerable third countries. It will render operational the obligation that the EU only exports its waste outside the OECD to countries willing to do so, and demonstrating their ability to treat it sustainably. This should lead to a reduction of export from the EU, while respecting international law, allowing a continuation of export of some waste outside the OECD in well-defined conditions and providing incentives for the improvement of waste management in third countries. The Commission could contribute to complementary efforts in non-OECD countries to treat waste sustainably through its international cooperation.
In order to avoid that this measure leads to the re-routing of waste to countries in the OECD which might not have the ability to treat it in a sustainable manner, it is completed with provisions tasking the Commission to monitor the export of waste to OECD countries and launch a specific procedure towards one OECD country to mitigate environmental problems that might be caused by such exports (measure 2e).
In addition to the measures above (which are based on a general assessment of the ability of countries to deal with waste exported by the EU), companies exporting waste outside the EU would have the duty to audit facilities where they are sending this waste, to verify that they are managed in an environmentally sound manner (measure 2a). This would make sure that economic actors are also taking concrete actions to ensure the sustainability of these exports and are made accountable for them, as well as ensure that ESM is monitored at facilities level. The Member States and the Commission would be tasked to ensure that the exporting companies properly fulfil their duties in that respect.
Finally, in order to address the serious problem linked to the export of waste falsely presented as “used goods”, the Commission would be tasked to develop specific binding criteria to differentiate between waste and used goods, for specific commodities for which this is a particular problem (measure 2b).
8.1.3 Objective 3: Better address illegal shipments of waste within the EU as well as illegal exports to third countries
To better address illegal shipments of waste, it is proposed first to reinforce the provisions of the WSR relating to inspection plans (measure 3a) to reduce divergent interpretations of the notion of “effective, proportionate and dissuasive” penalties, making the application of penalties more consistent and deterrent across the EU (measure 3d).
This should provide a more robust legal framework for enforcement authorities in their efforts to carry out their activities, prioritise actions against serious infringements and impose deterrent sanctions, which take account of the economic gains generated by illegal activities linked to waste shipment. In addition, improving the traceability of shipments of green-listed waste (measure 3e), which are currently very difficult to track and represent an important share of illegal shipments, would also render enforcement efforts more efficient.
These measures are complemented by measures designed to improve cooperation against illegal shipments at national, EU and international levels. To this end, the Commission (through its anti-fraud office OLAF) would be empowered to carry out transnational investigations against waste trafficking in the EU (measure 3c), thereby helping Member States working together on these problems. The WSR would also require that Member States set up mechanisms to ensure domestic internal coordination against illegal shipments of waste (measure 3f), as is the case for other areas of EU legislation. Finally, a dedicated group at the EU level will be created which would gather enforcement agencies from the Member States, EU and international bodies, with the task of facilitating and improving enforcement cooperation (measure 3g) at the EU and international levels.


