 EUROPEAN COMMISSION
Strasbourg, 8.3.2016
SWD(2016) 51 final
COMMISSION STAFF WORKING DOCUMENT
Key economic, employment and social trends behind a European Pillar of Social Rights
Accompanying the document
Communication from the Commission to the European Parliament, the Council, the European Economic and Social Committee and the Committee of the Regions
Launching a consultation on a European Pillar of Social Rights
{COM(2016) 127 final}
{SWD(2016) 50 final}
Table of Contents
1. Introduction
2. Welfare in Europe: An overview
2.1. Diverse welfare models and levels of social expenditure
2.2. A redistributive and cushioning role
2.3. The role of social partners
3. Long-term trends, societal transformations and changing needs
3.1. An ageing continent
3.2. More female workers and changing family structures
3.3. A more diverse population and workforce
3.4. Rising levels of education
4.
The impact of the crisis: a halt to convergence
4.1. Divergences in employment
4.2. Recent trends in income inequalities
4.3. Poverty and social exclusion
4.4. Sustainability of public finances, financing public services and the turn to social innovation
5. The new world of work, jobs and skills
5.1. Technological change and sectoral shifts
5.2. Changing work conditions
28
5.3. Skills for changing occupations
6. Specific challenges and requirements of the euro area
1. Introduction
This Staff Working Document presents a selection of key economic, employment and social trends of relevance to the discussion on the establishment of a European Pillar of Social Rights. The Pillar is targeted at the euro area, but other Member States would be allowed to join in if they wanted to.
The discussion on the Pillar is an opportunity to review trends in the world of work and in society,
to take stock of the impact of the worst economic and social crisis in decades, and also to look ahead and consider long-term trends that are very much relevant beyond the crisis. Such stocktaking should take account of the wide diversity of situations and challenges across European countries,
of the particular needs of the euro area and also of the commonalities of European approaches from a global perspective.
An important aspect of the consultation being launched today is to make sure that the principles to be eventually outlined in the Pillar should be applicable not only for today's but also for tomorrow's realities. This is why, in addition to the analysis presented here, a dedicated work stream for the consultation is foreseen to discuss the future of work and welfare systems.
This Staff Working Document highlights four trends in particular.
First, the crisis has had far-reaching social consequences, which may hamper opportunities for future growth and economic performance across Europe. The recovery is slowly firming up in both the EU and the euro area, but productivity growth remains low, affecting competitiveness and living standards in many countries. Unemployment is decreasing steadily, but long-term unemployment as well as
the share of of young people not in education, employment or training (NEET) remain high. Moreover, even though Europe has one of the most comprehensive welfare systems, around a quarter of the population in the EU – 122 million people – are at risk of poverty or social exclusion,
with children being among the most vulnerable.
The crisis has aggravated well-known challenges in a number of Member States. These include the segmentation of labour markets between categories of workers, as well as between jobseekers and those in work, and the persistence of job vacancies in certain sectors and regions in spite of high unemployment, as a result of large skills mismatches.
Second, the current pace and extent of change in the world of work are further transforming employment conditions. Global production patterns and the organisation of work across borders were already affecting the European economy and its labour markets long before the financial crisis.
New ways of working, together with technological change and the digitisation of the economy, offer new opportunities, increase possibilities for self-employment and new types of activities, and
make career patterns more diverse, yet also create new risks of "grey zones" in terms of labour rights and access to welfare.
These trends are being magnified by what is now referred to as the Fourth Industrial Revolution,
a paradigm shift in how economic value is created, and working lives are structured. The opportunities perceived in terms of job creation go hand in hand with revived concerns about the substitution effect and 'hollowing out' of a growing number of occupations caused by automation. Skills and access
to life-long learning matter more than ever in light of the changing work realities.
Third, demographic trends suggest that Europe's capacity to grow will increasingly rely on its ability to boost productivity, which means moving towards high-end sectors, and on making the most of Europe's human capital, by mobilising Europe's workforce. This includes women, whose employment rate is catching up but remains below that of men in most countries, and also Europe's youth and older workers.
This also involves addressing obstacles to the participation of people underrepresented in the labour market, such as third country nationals.
Demographic trends also put pressures on the financial sustainability of welfare systems and question their ability to adjust to new family structures and societal trends, such as the tendency of people to live more individual lives. Over the years, welfare systems have extended their role towards providing services, incentivising labour market participation and generally investing in people's employability. Social services have also been geared towards child development and the needs of dual-earner families and have facilitated the labour force participation of women. Yet, the capacity of social protection systems to provide adequate financial assistance and prevent poverty while supporting the labour market integration of beneficiaries remains a challenge in several countries.
Fourth, divergence in employment and social performances may weigh heavily on the performance of the euro area. During the crisis, the adjustment capacity of several Member States of the euro area showed severe limitations. This has increased employment and social disparities, and tested
the resilience and stability of the euro area as a whole. In recent years, euro area Member States have agreed on stricter coordination of economic and fiscal policies, but such deeper integration within the Economic and Monetary Union also necessarily includes a social dimension.
As highlighted in the Five Presidents' Report on Completing Europe's Economic and Monetary Union, in a single currency area, there is a need to build up the shock absorption capacity and labour market adjustment mechanisms of Member States. Enhancing convergence towards robust labour market institutions and social infrastructure can facilitate resilience, social cohesion and macro-economic adjustment within the euro area and beyond.
Looking ahead, the challenges are significant. Peoples' working lives are expected to be longer and less linear: they will likely be marked by numerous transitions in jobs and professions, as well as by changing needs, with life-cycle and work-cycle pressures requiring career interruptions or breaks for caring responsibilities, or for seeking access to re-skilling opportunities. The notion of work is becoming increasingly fluid and blurred, with ongoing, rapid technology-driven transformations presenting both challenges and opportunities. The capacity of welfare systems to ensure equity and enable upwards mobility is being tested, and a lot of efforts is still required to invest in Europe's skills and human capital.
Although the benefits of policy interventions in all these fields may take time to materialise, the costs associated with a lack of concerted action will no doubt be felt even more acutely.
2. Welfare in Europe: an overview
European welfare States fulfil the key objectives of protecting against life's risks, poverty alleviation, intra- and inter-generational redistribution, as well as macroeconomic stabilisation. There is a very wide diversity of welfare and labour market institutions across Europe, including in the organisation of social dialogue, which remains a building block of the European social model and of a well-functioning social market economy. In recent years, social protection systems played their role in cushioning the impact of the economic and financial crisis, but their efficiency and financial sustainability have been put to a test.
2.1. Diverse welfare models and levels of social expenditure
European welfare states developed primarily in the second half of the 20th century during a period of solid economic growth, to reconcile the often competing dynamics of solidarity and competitiveness, labour and capital, equity and efficiency. Their key objectives have been pursued mainly through regulation, fiscal redistribution, the provision of public goods and collective insurance against individual and socio-economic risks.
Instruments have been developed to insure against life-course and labour market risks; to reduce poverty and income inequality; to encourage children and family protection; to promote labour force participation; and to improve population health and skills.
The weight attributed to the different functions varies substantially across countries, as do their coverage and generosity
and their performance in terms of efficiency and equity.
The differences between Europe’s social and welfare models have led to a number of categorisations,
taking into account the level of income support for those outside the labour market, the effects of welfare policies on social mobility, and the differences in welfare providers (i.e. public or private).
Beyond such classifications, models have tended to converge in this century to reflect evolving societal needs. However, for illustrative purposes, it is possible to categorise national welfare systems across clusters, mostly following Europe’s geographical regions:
The "Nordic" cluster features the highest levels of social protection expenditures, universal welfare provision and trade union density. Intervention in labour markets is characterised by
a mix of active labour market policies to promote integration in gainful employment. Social partners play a leading role in wage setting and working conditions. Social insurances include a combination of general provisions, income-related benefits and in-kind benefits.
The "Continental Western European" cluster relies extensively on insurance-based unemployment benefits and old-age pensions, traditionally aimed at managing income fluctuation across the life cycle. In spite of declining membership, trade unions remain strong as regulations extend the coverage of collective bargaining to non-unionised workers.
The "Anglo-Saxon" cluster features relatively large social assistance of the last resort,
with limited transfers oriented at people of working age. Activation measures are important as are schemes conditioning access to benefits to regular employment. This model is characterised by relatively weak trade unions and decentralised wage bargaining.
The "Mediterranean" cluster is highly state-centred. Social spending may tend to be biased towards old-age pensions and often allows for a high segmentation of entitlements and status. The cluster is characterised by a relatively homogeneous wage structure obtained through collective bargaining.
The "Baltic, Central and South Eastern European" cluster is characterised by more limited welfare provisions
based on state-centred welfare spending, but also on family for providing support, with relatively fragmented bargaining systems.
Over the past decades, the role of welfare states has been extended by more actively providing services, incentivising labour market participation and generally investing in people's employability. Family-friendly social services geared towards the needs of dual-earner families have facilitated labour force participation of women and child development. Childcare and long-term care for elderly citizens have grown in importance, as has the need for good quality preventive and curative healthcare. Early retirement policies have been phased out and replaced by initiatives aimed at promoting longer and healthier working lives. Emphasis has also been increasingly put on the inclusion of residents with a migrant background, which is even more necessary in the light of recent flows of migrants and refugees.
As a result of these differences, levels of social expenditure vary significantly across Europe. Countries such as Denmark, France, Finland and Greece spend more than 30% of GDP (not including education) on social expenditure whereas Estonia, Latvia, Lithuania and Romania spend less than 15% (Figure 1).
Figure 1: Spending on social protection, EU-28, % of GDP, 2013

Note: data for Greece and Poland, and the EA18 and EU 28 are from 2012
Source: Eurostat
Old age and survivors pensions enjoy the largest share (44%) of total social expenditure, followed by public expenditure on health care and sickness benefits (28%) (Figure 2). Expenditures related to unemployment displayed the largest variation over the last decade: they fell between 2005 and 2007, and increased steeply as a result of the crisis between 2008 and 2009, to contract slightly afterwards, including during the second dip of the recession (2012-13).
Figure 2: Structure of social protection expenditure, EU-28, % of total expenditure, 2012

Source: Eurostat, Expenditure: main results
2.2. A redistributive and cushioning role
The 2008 economic and financial crisis confirmed the role played by social expenditure – unemployment benefits in particular – as an automatic stabiliser, contributing to the resilience of the economy and society. In order to ensure effective macroeconomic stabilisation, effective social spending and support to the active age population are essential.
Overall, while social spending had played a significant role in the first phase of the crisis, by sustaining incomes of households affected by unemployment or wage reductions in most countries in 2008/2009, this contribution lessened from 2010 onwards. This is partly the result of an increasing share of long-term unemployed having lost access to insurance-based benefits.
In particular, a number of Southern European countries and Baltic States, where the crisis hit hardest and initial conditions were more fragile than in other parts of Europe, had to tighten eligibility conditions for cash benefits, freeze indexation and limit in-kind benefits/social services.
Beyond the level of spending, the distributional and stabilisation effects of social expenditure is heavily influenced by its composition, notably the design of benefits and related indexation mechanisms.
Figure 3: Overall social protection expenditure, real growth trends in the EU, 2001-2012
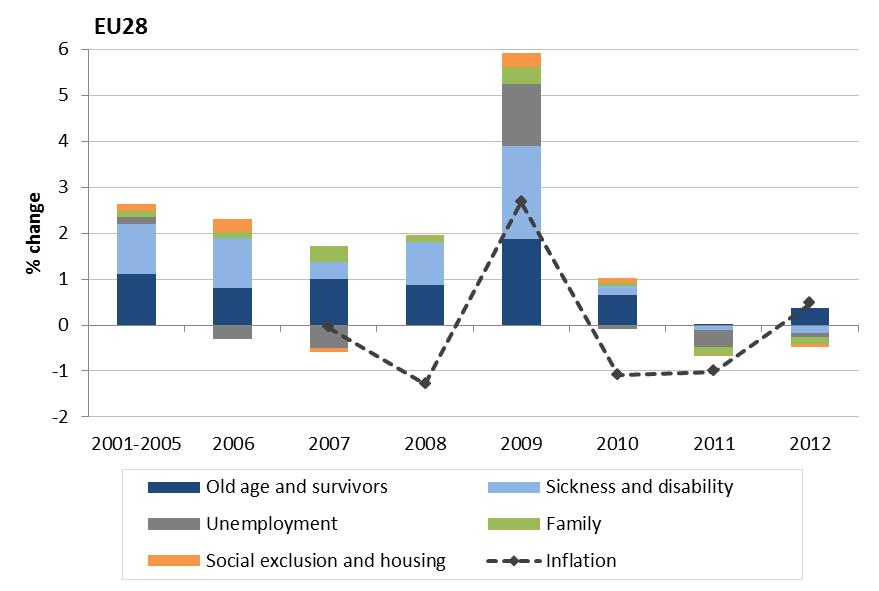
Source: European Commission (2016), Employment and Social Developments Report 2015
In some cases, the lack of integrated benefits and services reduces their effectiveness in addressing poverty and supporting labour market integration. Access to essential services such as transport, energy and financial services is also an issue in several EU countries, while the lack of adequate housing and housing insecurity is a large concern across the EU.
The consequences of Europe's ageing societies, the need for more effective lifelong activation and protection policies, and the growing pressures on the sustainability of public finances all call for better performing welfare systems. In addition to their social protection function, efficient welfare systems with appropriate levels and mixes of social expenditure contribute to economic growth in a two-fold and mutually reinforcing manner.
First, better integrated employment and social services and active labour market policies can ease access to the labour market, provide adequate incentives to work, support skills and employability, and provide support for professional transitions. In practice, the capacity of unemployment, minimum income and disability benefits to provide adequate financial assistance and prevent poverty while supporting the labour market integration of beneficiaries remains a challenge in several countries.
Second, investment in human capital and enabling services, such as childcare, lifelong learning and retraining, allow more people to be part of the labour force and to develop their skills base throughout their life, to move society up the value and innovation chain, and thereby contribute to economic growth. This includes good quality primary and secondary education, apprenticeships for young adults, smooth transitions from education to work, as well as training and lifelong learning programmes for adults and older workers to update their skills. This, in turn, allows for better employment opportunities, longer working lives and consequently better pension prospects.
Enabling services also include universal and good quality early childhood education that promotes cognitive development and social integration, preventing the inter-generational transfer of poverty,
as well as robust safety nets that support life and work-related transitions.
An adequate balance between a social protection function and a social investment function of welfare systems is essential to build resilient economies. Investment in education, health and childcare facilities may have an important role in supporting higher levels of male and female labour market participation over the life-cycle, higher productivity and earnings.
Examples show that
well-functioning welfare states open to reforms and adjustments can create an environment for growth and investment.
2.3. The role of social partners
Social dialogue is a building block of the European social model and of a well-functioning social market economy. It contributes to devising arrangements that better serve the employment and skills needs of both employees and companies, and to building shared understanding and mutual trust,
which are essential for addressing social challenges and modernising economies.
Industrial relations cover a wide range of domains but typically include issues related to remuneration. Collective bargaining varies significantly between Member States and can take place at national, sectorial, regional or company level. Further differences are related to the degree of employee coverage and whether social partners are involved in the administration of unemployment benefits, social security or public healthcare (Figure 4).
Figure 4: Typology of welfare States and industrial relations
|
Broad geographic region
|
Northern Europe
|
Continental Western Europe
|
UK, Ireland
|
Southern Europe
|
Central and South Eastern Europe, CY, MT
|
|
Main characteristics
|
Organised corporatism
|
Corporatism, Social partnership
|
Liberal pluralism (Anglo-Saxon)
|
State centred
|
Fragmented / state-centred
|
|
Employee representation at company level
|
Union based, high coverage
|
Dual system, high coverage
|
Union based, limited coverage
|
Union based, high coverage
|
Union based limited coverage
|
|
Main level of bargaining
|
Sector
|
Sector
|
Company
|
Sector
|
Company
|
|
Bargaining style
|
Integrating
|
Integrating
|
Conflict oriented
|
Conflict oriented
|
Acquiescent
|
|
Role of state in IR
|
Limited (mediator)
|
Shadow of hierarchy
|
Non-intervention
|
Frequent intervention
|
Organiser of transition
|
|
Role of Social Partners in public policy
|
Institutionalised
|
Institutionalised
|
Rare, event driven
|
Not on a regular basis
|
Not on a regular basis
|
Source: Adapted from European Commission (2016), Employment and Social Developments Report 2015, and European Commission (2008)
3. Long-term trends, societal transformations and changing needs
Profound long-term changes are taking place in the world of work and society. In particular, demographic ageing, as well as the need for adequate activation and protection policies along the life cycle, call for a renewed attention to the effectiveness and efficiency of European welfare states.
At the same time, the labour market participation of women is progressing and family structures are changing, while the workforce is getting more diverse. Moreover, levels of education are increasing, but challenges remain, and inequalities remain persistent.
3.1. An ageing continent
In the future, Europe’s population will be slightly larger but significantly older. The size of the age group 65+ is expected to increase from 96 million (2015) to 148 million (2060) while the population of working age (20-65) is projected to decrease from 306 million to 269 million.
The share of those aged 20-65 will become substantially smaller by 2060, declining from 60% to 51% of the population, while the share of 65+ will become much larger, rising from 18% to 28%. The group over 80 years old will be as numerous as children under 15 years of age (Figures 5 and 6).
This demographic shift is the result of a lower number of births, increasing life expectancy and the larger birth cohorts of the 1960s (the so-called baby-boom generation) entering retirement age.
The so-called demographic "old-age dependency ratio" of people aged 65 or above relative to those aged 15-64 is projected to increase from 27.8% (in 2013) to 50.1% in the EU as a whole by 2060.
Figure 6: Age structure, EU28, 2013 – 2060
Figure 5: Absolute change in population age
structure, EU28, actual (2000-2014), medium
scenario (2015 -2060) in millions


Source: Eurostat
Source: Eurostat, Europop 2013
This implies that the EU would move from having four working-age people for every person aged over 65 years to about two working-age persons. This will pose substantial challenges to labour markets, the financial sustainability of welfare systems, health and elderly care and pension systems.
This risk needs to be addressed now. Under alternative scenario assumptions, total labour supply could almost stabilise between 2013 and 2023. Yet, it is expected to decline by 19 million people
(-8.2%) in the EU between 2023 and 2060 as larger cohorts retire and are replaced by smaller ones of younger workers and labour migrants from third countries.
Increases in the employment rate as well as increases in productivity would compensate the reduction in working age population.
But for this to happen, it is essential to invest in people's skills and support their employability.
Older workers have been remaining in the workforce or entering the workplace in increasing numbers, although the current employment rate of 52% among those aged 55-65 remains much lower than
the overall employment rate (Figure 8 below).
Evidence suggests that it is also this age group that is most at risk of having obsolete skills and least likely to receive training (Figure 7).
In recent decades, Member States have taken a variety of reforms to manage pension expenditure and safeguard the financial sustainability and adequacy of pension systems. Considering the future outlook, pension adequacy will depend, to a much higher degree than before, on the amount and length of pension contributions resulting from the career average wage level and the length of the working career. Low earnings, long career breaks and early retirement can therefore be identified as key risk factors for pension adequacy in the future. Expenditure projections based on the legislation adopted by end of 2014 assume higher effective retirement ages and employment rates for older workers and show that, even under such assumptions, several Member States could still experience a significant increase in their spending.
Due to high levels of long-term unemployment and atypical career paths, poverty among future pensioners, particularly women, is at risk of increasing. In general, older people (aged 65 and more) are not currently more at risk of poverty than other age groups. In most EU countries, older people seem so far to have been better protected against the social impact of the recession and public finance crisis than other age groups. The share of older people with incomes below the at-risk-of-poverty threshold has actually declined from 2009 to 2012. However, for older people, the risk of severe material deprivation has increased slightly over this period. Pension systems, and in particular public pension schemes, have continued to ensure that oldest people in the majority of EU countries are protected against the risk of poverty and deprivation. While pensions are the main income source of older Europeans, living standards in old age also depend on other factors, such as private assets, notably home ownership, access to other benefits and services, and employment opportunities.
Figure 7: Participation rate in training and education by age in EU, %, 2002-2014

Source: Eurostat
At the same time, European health systems are facing growing common challenges: intensifying health and long-term care demands linked to demographic ageing and the resulting rise of chronic diseases and multi-morbidity; shortages and uneven distribution of health professionals;
health inequalities and inequities in access to healthcare.
Ageing and medical innovation have increased health expenditure in the EU during most of the second half of the 20th century, and estimates expect public spending on health and long-term care to rise by 2060. There is a pressing need for more efficiently managed healthcare
to transform resources into health outcomes (i.e. longer and healthier life expectancy, amenable mortality rates, etc.).
Equally important is to ensure a balance between preventive and curative care, improving health security, reducing inequalities in access to quality care, and addressing growing needs for long-term care services and mitigating dependencies.
3.2. More female workers and changing family structures
Labour market participation of women has been steadily growing, which, together with growing participation of older workers, has at least partially offset the decline in workforce in many countries. Female workforce participation has consistently gone up, from 56.1% in 2005 to 59.6% in 2014.
Cross-country variation in the EU, however, is still considerable and women have on average an employment rate of 11.5 percentage points lower than men. The employment gap is much bigger when full-time equivalent is considered.
Figure 8: Employment rates of women and men (age group 15-64), and older adults (age group 55-65),
EU28, %, 2003-2014

Source: Eurostat
Data suggests that, although employment tends to increase with parental age, young mothers and particularly single mothers are more likely to engage in part-time work. As a result, not only are they more likely to face diminished employment opportunities over their life-time, they are also more likely to rely on a lower income, with further implications for long-term inequality and human capital for themselves and their offspring.
Due to discontinued employment patterns and fewer hours worked, the gender earnings gap during active years has reached 41% and leads to a very wide gender gap in pensions. Older women are much more at risk of poverty and social exclusion than older men, and no mitigating trends have been observed in recent years.
Moreover, while women are more likely than men to have a higher education degree, they remain underrepresented in the science, technology, mathematics and engineering sectors (STEM) and over-represented in fields of study that are linked to traditional gender roles. Women also represent the biggest untapped source of entrepreneurial potential, as only 29 % of today's entrepreneurs are women.
The increase in female labour market participation, the fact that it remains well below that of men, particularly for mothers, as well as the growing numbers of single-parent families over past decades, has triggered a review of entitlements and work-life balance policies.
Yet, gender inequalities in the labour market continue to be exacerbated by a lack of adequate work-life balance arrangements - such as leaves, flexible working patterns and access to formal care services. Moreover, lack of paid leave arrangements for fathers relative to mothers, or insufficient incentives to make use of them, can further reinforce gender differences between work and care.
3.3. A more diverse population and workforce
At the beginning of 2014, there were 34.1 million foreign citizens residing in the EU Member States. Of these, 14.3 million citizens were nationals from another EU Member State and 19.8 million were non-EU citizens. (Figure 9). 7% of the total population of the EU is thus from foreign origin,
of which 40% are citizens of another EU Member State.
Figure 9: Breakdown of EU28 population

Source: Eurostat, LFS
The growing diversity of immigration flows on origin and type has challenged the capacity of host countries to respond effectively to the different integration needs of the various migrant groups.
The EU's diverse workforce is characterised by limited integration in terms of educational attainment and participation in the labour force. In 2014, on average, some 10% of Europe's labour force was unemployed, while the rate was significantly higher among third-country nationals (17.0%). Employment rates of third country nationals (56%) are indeed below EU average (69.2%).
Recent intakes of asylum seekers and refugees reinforce these existing integration challenges in
the short and medium term.
At EU level, the employment rate of people with disabilities is 47.9% compared to 71.5% of persons without disabilities. While part of this difference is due to the fact that people with disabilities might be unable to enter employment, part of it also has to do with the lack of adequate support measures to enable people with disabilities to enter the labour market.
3.4. Rising levels of education
Skills and human capital are widely considered the backbone of economic prosperity and social
well-being in the 21st century. Over the years, Europe has achieved high levels of education. Participation rates in early childhood education have been rising, while numbers of early leavers from education and training have been decreasing over the past decades (Figures 10 and 11).
Figure 11: Early leavers from education and training EU-28, 2002-2015
Figure 10: Participation in early childhood education,
(from 4 years to compulsory school age),
EU-28, 2002-2012


Source: Eurostat
Source: Eurostat
Nonetheless, significant challenges persist. Formal childcare has positive consequences for children,
in particular those from disadvantaged backgrounds, whereas lack of or limited formal childcare options can have negative consequences for female career development. As most parents combine various reconciliation instruments between family and work lives, childcare arrangements are related to parents’ preferences and norms, the children age, and labour market opportunities for parents.
Despite steadily decreasing trends, there are still more than 4.4 million early school leavers across Europe
, and about 60% of these are either inactive or unemployed. Underachievement in mathematics, reading and science, in particular among pupils from disadvantaged backgrounds, underlines persisting vulnerabilities in European societies. Early school leaving represents a loss of potential that has effects on both social and economic scale such as reduced social cohesion and lower financial incomes. In the long run, early school leaving has negative effects on social development and economic growth, which is very much based on qualified labour force. The reduction of the rate of early school leaving on European scale would supply the European economy with a substantial number of young people with qualifications who have better employment prospects.
The share of the population aged 30-34 that have completed tertiary or equivalent education stands at 37.9% (2015), but the transition from school to work remains difficult, as shown by the employability rate of graduates, which is stagnant across the EU and still below its 2008 peak.
Education attainment rates vary considerably across Member States; yet most countries face similar challenges in terms of broadening access to higher education. Specific challenges concern the inclusion of students from disadvantaged socio-economic backgrounds or geographical locations, from ethnic groups and people with a disability. Additional priorities include reducing drop-out rates and the time it takes to complete a degree; and improving the quality of higher education and making it more relevant to labour market transformations.
3.5. Persistent inequalities
The distribution of outcomes and opportunities is closely intertwined. Unequal opportunities affect individual capacities to earn income; wealth inequalities affect individuals' educational and labour market choices and performance.
The overall income distribution in the EU is generally more equal than in other major economies,
such as the USA or Japan. There is a broad trend toward rising inequality and declining labour income share over recent decades in Europe, as well as in most other industrialised countries, but the developments vary across countries, and inequalities increased to a lesser extent in Europe than in the USA (figure 12). In many advanced economies, there is increasing concentration of income at the very top of the distribution.
Figure 12: Long term trends in income inequalities (mid-1980s to 2013 or latest available) (Gini Index)

Source : OECD (2015). Note: inequality of household disposable income. "Little change" in inequality refers to changes of less than 1.5 percentage points. Data year for 2013 or latest year (2013 for FI, HU, NL and the United States, 2009 for Japan, and 2012 for the other countries).
Since 2000, in Europe, inequalities have generally increased less in countries with higher levels of inequalities and more in countries with lower levels of inequalities. This trend was relatively smoothed during the crisis: overall inequality in the EU has been nearly constant, though some of the countries most affected by the crisis such as Cyprus, Italy and Spain have registered increases in inequalities (Figure13).
Figure 13: Trends in income inequalities (2000-2007 and 2008-2013) (Gini Index)


Source: Eurostat
Available evidence points to a number of key causal factors that may potentially explain these trends. These factors include: increasing technological change; changes in labour market institutions such as declining bargaining power of workers; globalisation of financial and trade flows; polarisation on the labour market; the changing nature of employment relationships; financial deepening; privatisation of state-owned enterprises; changes in the size and structure of families. On the contrary, higher levels of education have been contributing to curb the increase in income inequalities.Tax and benefit systems also generally play a central role in reducing income inequalities. Minimum wages can also help prevent growing in-work poverty and are an important factor in ensuring decent job quality, while they should also preserve the incentives to seek work and not discourage hiring for those at the bottom end of the wage distribution.
The labour income share has typically fallen alongside an increase in market income inequality. Intergenerational income mobility also appears to be lower in countries with higher income inequality. In addition, inequality of opportunities such as unequal access to education, health care and finance can be pervasive and exacerbate income inequality.
Over the last decades, access to education and educational attainment have improved for the vast majority of the population, thereby improving opportunities for all (see section 3.4), but socio-economic status remains one of the main determinants for the development of basic skills (figure 14). In most EU Member States, foreign-born students are under-performing their native peers.
Early school leaving is double among young people born outside of the EU compared to native born. Educational inequalities are also due to stereotypes.
Figure 14: Gap in achievement in mathematics by socio-economic status, PISA 2012

Source: OECD (PISA 2012)
Inequalities do not only worsen individual chances, they are also detrimental to growth.
A main transmission mechanism between inequality and growth is human-capital investment,
as people in disadvantaged households have lower access to quality education. Analysis by the OECD shows that widening income inequality can lead to larger gaps in educational outcomes and weaker social mobility.
At an early stage in life, unequal access to childcare, education and health
are the main barriers to equal opportunities. They are later reflected in terms of labour market participation and productivity and are often reinforced by gaps in access to life long-learning.
Early intervention has the potential to mitigate the impact of socio-economic background on the future skills of children and their future academic and labour market outcomes. Children who attend
pre-primary education are more likely to be successful at school when they get to 15 and in the years beyond.
While in Europe pre-primary education programmes are expanding (with more than 80% of the 4 years old are enrolled), significant differences remain as regards participation in early education and care according to family incomes. Furthermore, catching up later in life can be impaired by gaps in access to life-long learning. Participation in adult education and training is four times lower among low qualified people compared to people with tertiary education.
In addition, sizeable gaps in health status exist within and between Member States (see Chart 15). Throughout the EU, people with lower education, a lower socio economic status or lower income tend to have shorter life expectancy and suffer from a higher incidence of most types of health problems. Inequalities in health status are related and compounded by inequalities in access to health care,
by income level, as well as by regional disparities.
Figure 15: Development of life expectancy at 65 by socio-economic status in France and the United Kingdom


Source: European Commission (2016), ESDE 2015
Territorial disparities affect the capacity of individuals to access essential public goods, such as education and health care, as well as business and employment opportunities. People living in larger cities generally have a lower risk of poverty or social exclusion, but there are exceptions and significant differences across countries. Regional disparities in GDP per head (in purchasing power standards) have shrunk substantially between 2000 and 2009, but the crisis put a halt to this convergence process. In addition, regional disparities in unemployment and employment rates have increased significantly since 2008, while there is also wide regional variation in educational outcomes across the EU (Figure 16). On the contrary, there are also parallel trends towards increase in tertiary attainment and a decline in early school leaving in the vast majority of regions, thus narrowing regional dispersion. Such trends should contribute to reducing inequalities in the longer term.
Figure 16: Regional dispersion of GDP per head, employment, and unemployment (2000-2014) and in early school leaving and tertiary education (2007-2014)


Source: European Commission (2016)
4.
The impact of the crisis: a halt to convergence
The economic and financial crisis has accentuated pre-existing imbalances, leading to very high unemployment, especially long-term and youth unemployment, and increased poverty and inequality in many parts of Europe. Despite some renewed convergence in employment and unemployment since 2013, large differences persist. Long-term unemployment and very long-term unemployment now make up a very large share of the unemployed. The deterioration of unemployment has exacerbated the conditions of Europeans at risk of poverty or social exclusion, which now count for almost
a quarter of EU citizens. Reduction in inequality has also stopped with the crisis.
4.1. Divergences in employment
A key feature of EU membership has been the long-term increase in wealth and welfare levels of its poorer Member States. The economic and financial crisis, however, has generally decelerated such a convergence process and even put some Member States on a divergent track.
The impact of the crisis on employment in the euro area (EA) Southern and Eastern Member States, as well as on Ireland, has been significant. The gap in employment rates between the Central and Northern euro area Member States and the Southern and Eastern ones has doubled from 5 pp in 2007 to 11 pp in 2015.
Figure 17: Employment rates, EU28 and groups of countries, 2000-2015, % of age group 15-64

Source: Eurostat.
Note: 2015 based on three first quarters.
Europe is currently faced with the challenge of high unemployment, particularly long-term unemployment, while having still over 1.8 unfilled job vacancies.
Indeed, unemployment in Europe has been for a long time structurally higher than that of other developed economies, such as Japan and the United States.
While the three decades preceding the crisis saw overall convergence in the EU, the crisis produced a dramatic rise in unemployment. Unemployment in 2014 remained above pre-crisis levels in all EU Member States except Germany, where it is much lower, and in Poland and Malta, where it is now close to 2008 levels.
Since 2008, the heterogeneity of unemployment rates has increased significantly between EU Member States. This is especially true in Southern and Eastern European Member States of the euro area and in Ireland, where it more than doubled from 2008 to2014 (Figure 18). In contrast, in Northern and Central Member States of the euro area, unemployment rates remained largely stable, leading to a difference of more than 10 pp. in 2014 compared to the other group. This represents a substantial increase compared to 2007, when the difference was 0.5 pp. Germany is the euro area Member State with the lowest unemployment rate, currently at 5.0%, while rates in Greece stand at 26.5% (2015). The difference between the weakest and strongest performer within the euro area increased threefold during the crisis.
Figure 18: Total unemployment, annual average, %, 2000-2015

Source: Eurostat.
Note: 2015 based on three first quarters.
The strong rise in youth unemployment began in 2007, rising from 15.9% in 2007 to 22.2% in 2014.
In the euro area, it rose from 15.6% to 23.7% (Figure 19). Deteriorating conditions are not limited to unemployment: the proportion of people not in employment, education or training (NEET) reached 16.6% in 2014, against 14.2% in 2008.
The annual cost of the NEETs in terms of loss of human capital has been estimated at about 1.2%
of EU GDP (EUR 153 billion).
Recent data show modest but encouraging developments, with youth unemployment decreasing, employment increasing slightly, NEET rates decreasing and participation in education increasing. Yet, youth unemployment remains very high and there are still very considerable differences across Member States. The youth unemployment rate ranges from less than 10% in countries little affected by unemployment (e.g. Austria and Germany), to more than half of the active population aged 15-24 in Greece and Spain, where it has almost tripled since 2008.
Figure 19: Youth unemployment, in %, 2015

Source: Eurostat.
Austria, Estonia, United Kingdom, Italy and Greece data are from 2014
Levels of long-term unemployment reached record highs during and in the aftermath of the crisis:
in 2008, 2.6% of active people were affected but the number almost doubled in the subsequent years, as shown in Figure 20 (5.1% the labour force and about 50% of total unemployment in 2014). For the very long-term unemployed, the rate rose from 1.5% in 2008 to 3.1% in 2014. Only recently, during 2015, have numbers started to decline. One in five long-term unemployed has never worked, and three quarters of them are below 35 years of age. Third country nationals and low-skilled workers are among the most affected by long-term unemployment.
The crisis revealed very wide differences in the capacity of labour markets to absorb shocks. On the one hand, Sweden and Luxembourg preserved their traditionally low levels of long-term unemployment since the crisis – respectively, 1.5% and 1.7% in 2014 – and Germany even reduced it (2.2% in 2014). On the other hand, long-term unemployment substantially worsened in Greece (19.5% in 2014), Spain (12.9% in 2014) and Croatia (10.1% in 2014). In the euro area, long-term unemployment rose from 3.3% in 2008 to 8.2% in 2014, with alarmingly high rates among the youth. This creates a vicious cycle, as being unemployed for a long time leads to low employment opportunities, skills erosion and lower earning potential, increasing the lifetime risk of poverty and social exclusion.
Figure 20: Long-term unemployment and youth long-term unemployment, %, 2000-2014

Source: Eurostat
4.2. Recent trends in income inequalities
Market income inequalities
among European households increased in twelve EU countries between 2008 and 2012, as a result of both increased unemployment and increased earnings polarisation for those in employment. Unemployment, in particular, has shown to be a key driver of rising inequality in overall incomes during the crisis.
Following the worsening of unemployment from 2008 onwards, the share of households with no income from work increased, especially in Ireland, Spain, Lithuania and Greece. The increased polarisation of household market incomes can also be explained in part by the respective shares of job-rich and job-poor households. Before the recession, the share of adults living in very high work intensity households was increasing with growing labour market participation of women as second earners. During the crisis, this trend reversed, with an increase in lower job intensity households and reductions in the number of high work intensity households due to unemployment and part-time work.
With regard to inequalities in disposable income after social transfers, European divergences have widened.
While disposable income inequality has increased in 10 Member States between 2008 and 2012, notably in Spain, Hungary and Denmark, inequality has fallen in seven others, notably in Latvia, Portugal, Belgium and the Netherlands.
The impact of social policy on inequality can be illustrated by comparing market income inequalities with inequalities of disposable income after transfers. The comparison shows the role of tax and transfer systems in reducing market income inequality. The result clearly is a decrease of inequality after redistribution (Figure 21) and may be considered as a way of assessing the effectiveness of welfare systems. It also shows the importance of redistribution contributing to resilience during times of crisis.
Figure 21: Market income versus disposable household income, level of inequality, selected EU Member States, 2012 (Gini index)

Source: Eurostat, European Commission (2015), ESDE 2014.
Note: Income data are not available for all EU Member States
A longer-term view suggests that in the euro area South and Ireland, where initial conditions in terms of income distribution were more unequal, disposable household inequalities fell between 2005 and 2008, and they have consistently intensified since 2011. In the euro area East, inequality was slightly reduced until 2012, but has since started to rise again. In the euro area North, inequalities grew until 2008, but have remained more or less stable since.
Figure 22: Disposable household income, level of inequality, 2005-2014 (Gini coefficient)

Source: Eurostat
4.3. Poverty and social exclusion
The deterioration of unemployment has exacerbated the conditions of Europeans at risk of poverty or social exclusion, i.e. people with an income below 60% of the national median income, and of those suffering from severe material deprivation, or living in households with low work intensity.
This affects almost a quarter of EU citizens, in particular in Romania, Bulgaria, Greece, Latvia, and Hungary (see Figure 23). Child poverty is higher than the average, especially among young children (less than 6 years old) in Romania, Bulgaria, Hungary, Spain and the United Kingdom.
This perpetuates structural impediments to equitable access to opportunities and well-being, and suggests ineffectiveness of social expenditure targeting the most vulnerable groups of the population.
Figure 23: People at risk of poverty by country, disaggregated by gender and age, 2014, % of population

Source: Eurostat
Older people are, at present, better protected against poverty. However, there remain clear differences between men and women across much of the EU. Women above age 65 face a substantially higher risk of poverty or social exclusion than their male counterparts. For the EU as a whole, gender differences in the incidence of poverty amount to more than four percentage points for women between age 65 and 74, and increases to over six percentage points above age 75 (Figure 24).
Figure 24: Differences between women and men (pp) in at-risk of poverty and/or social exclusion (AROPE) rate, 2014

Source: Eurostat. Calculated as AROPE rate for women – AROPE rate for men (pps)
Older women are more vulnerable to poverty because of lower average pension income across Member States (60% of the average pension of men in 2012), as well as lower likelihood to be covered by pensions.
Women's lower pay, greater concentration in part-time work, lower statutory retirement age, and gaps in their careers, often due to caring responsibilities, lead to lower pension contributions and, ultimately, lower pension entitlements. Moreover, family-friendly policies mitigating gender inequalities in pension entitlements, by allowing workers to continue to build up pension contributions during caring periods, are present to varying extent across Member States.
In 2014, 70% of the EU population lived in owner-occupied dwellings, 19% were renting accommodation at market price and 11% were tenants in reduced-rent or free accommodation (Eurostat data). Limited access to affordable housing can be an obstacle to labour market adjustment and job uptake. Faced with growing demand, particularly cities have a limited capacity to supply additional affordable and quality housing. New investments, particularly in new construction, slowed down during the crisis due to the adjustment in house prices from elevated pre-crisis levels and existing zoning regulations. Mortgages lending activity also decreased considerably. Growing financial difficulties for people on low and middle incomes have resulted in more frequent arrears in rental and mortgage payments and a rise in evictions and foreclosures. Restricting access to housing assistance and creating barriers to access to affordable social housing by the most vulnerable people increases the risk for homelessness. Housing assistance also performs an automatic stabilisation function, as it grows or remains constant while market incomes decline.
There is wide outcome heterogeneity among Members States in the effectiveness of social spending. Evidence suggests that, on average, only half or less of the poor are lifted out of poverty by social transfers. Overall spending may be relatively large, for instance as in the case of the welfare states of Southern Europe, but social assistance coverage of the poor is relatively low. In contrast, welfare states in other countries that spend less on social protection seem to achieve a better coverage of the poorest 20 percent of the population.
Figure 25: Social protection expenditure and reduction of inequality and poverty in EU Member States


Source: Eurostat, ESSPROS and EU-SILC, DG EMPL calculations.
4.4. Sustainability of public finances, financing public services and the turn to social innovation
The onset of the crisis considerably worsened the fiscal position of Member States, especially within the euro area. However, since 2010, significant efforts have improved the fiscal outlook with deficit reduction and stabilisation of debt levels. From 2007 to 2009, fiscal deficits in the EU increased from 0.9% of GDP to 6.7%, and started then a downward trend reaching 3% in 2014. There has been an increase of EU's public debt by about 30 percentage points of GDP between 2007 and 2014 that peaked at almost 89% of GDP, but a slightly downward trend is visible since 2015.
Over the years, Member States have been pursuing redistribution and anti-poverty policies,
to preserve social inclusion and counter the impact of the crisis, especially at its onset,
leading to a large increase in expenditure on social support measures. Social protection benefits (pensions, health and disability, unemployment, family, social exclusion and housing) were the main contributing factors to the stabilisation of household incomes. As a consequence of rising unemployment, in the Southern Member States of the euro area and Ireland, expenditure on social support measures increased much more significantly than in the EU as a whole or in Northern countries of the euro area, putting additional pressure on public finances which were already much affected by the crisis.
In the context of mounting fiscal constraints for the financing of essential welfare and public services, novel models to supply social services in a targeted and cost-effective way have emerged, under the umbrella of "social innovation",
mobilising innovation not only for generating economic benefits, but also for meeting social challenges, and, importantly, anticipating problems. Meeting social challenges calls for innovative solutions at all levels. Private corporations, entrepreneurs and civil society have, for instance, combined resources into new and hybrid ventures where service providers and beneficiaries work together. Public authorities have engaged more thoroughly in the policy evaluation and experimentation, building on best practices elsewhere.
5. The new world of work, jobs and skills
5.1. Technological change and sectoral shifts
EU labour markets have been undergoing structural transformations in recent decades and more particularly since the mid-1990s. This trend accelerated during the crisis. Growing innovation, trade, and global value chains, propelled by digital technologies, have put a premium on service-related jobs and thus on high, non-routine and interpersonal skills. Such effects of technology on employment are likely to affect as much as 42% of existing occupations in the US by 2035.
In other words, almost half of existing professions may be partly if not entirely computerised and automated in the medium term. Similar estimates seem to plausible in the European case, as illustrated in Figure 32.
Figure 32: Share of jobs at risk of automatisation (%)

Source: Bruegel calculations based on Frey & Osborne (2013), ILO, EU Labour Force Survey
* Data not available for Cyprus
Such developments are related to the ability to accurately translate a task into a series of codified steps that can be automated which explains the higher job vulnerability of routine tasks. These transformations will thus particularly affect production lines in the manufacturing sector, a particularly relevant point for Europe's industrial core, but they may also affect specific high-skilled occupations.
For instance, "hollowing out" effects are already tangible in higher-skill professions such as journalism, accounting, tax and management consultancy, legal and other advisory, eventually even education (Figure 26). At the same time, new activities and sources of jobs are likely to emerge.
Figure 26: "Winners" and "losers" among professions. Cumulative growth rate of distribution of population by occupation

Source: Eurostat
These changes have provided opportunities for increased productivity in knowledge-intensive sectors, leading to additional labour re-allocation and employment growth in certain sectors. Manual work –
in particular in manufacturing and agriculture – has in part been losing ground in recent years, which is more than the effect of the crisis and certainly also reflects the process of automation (Figure 27).
But skills mismatches and limits to up-skilling remain significant barriers to a smooth re-allocation of labour across and within sectors.
Figure 27: Change in total employment by sector in EU28, 2010-14, absolute numbers

Source: OECD, 2015
By 2020,
more job losses are predicted in administration, manufacturing, management, agriculture, than additional jobs gains in science, engineering, transportation, and logistics (Figure 28).
The welfare gains and losses of such industrial and labour market developments are still unclear, depending on how smooth the re-allocation of labour across sectors may be.
Figure 28: Expected impact of technology (thousands of jobs gained/lost) by 2020, France, Germany, Italy and the UK

Source: World Economic Forum (2016), Future of Work Report. Based on Survey of CHROs of largest employers by industry. Focus countries: France, Germany, Italy, UK.
5.2. Changing work conditions
Structural changes in employment have been reflected in the increase in temporary types of employment contracts across Member States. At the same time, transitions from unemployment to self-employment have decreased and the share of self-employed has slightly receded during the last decade.
Decentralised, self-organised forms of work can increase workers' autonomy and boost business development, but it may also blur the notion of work and limit awareness of or access to rights, such as unclear information requirements for employers, new challenges for health and safety at work and in the organisation of social dialogue. New forms of flexible employment thus put the question of the nature, volume or duration of work, the capacity to identify the employers as well as the associated level of social protection, notably in terms sickness, unemployment and pension benefits.
There is still a sizeable employment protection "gap",
i.e. a large difference in protection levels between types of contracts, in many countries, which has led to some form of labour market duality.
A wide gap is hindering the conversion of temporary into permanent contracts, perpetuating the segmentation of labour markets (Figures 29 and 30). However, several recent crisis-induced reforms have sought to address this,
and such reforms may take time to produce their effect.
Figure 29: Change in permanent, temporary employment and self-employment, EU 28

Source: Eurostat
Figure 30: Share of temporary contracts and transitions from temporary to permanent

Source: Eurostat. Data on transitions for BG, EL, PT, HR refer to 2012, for AT to 2014. Data on transitions are not available for IE and SE.
Existing regulations do not always fit well with new business models and the new realities of the workplace. The current labour law acquis unevenly covers changing employment patterns, resulting in precarious working conditions, risks of circumvention or abuses, and potentially hindering innovation as well as skilling opportunities. Flexibility in conditions of employment may offer more opportunities for workers, including in part-time work, self-employment and entrepreneurship, but it may also expose them to greater insecurity and vulnerability. For instance, independent and temporary workers are generally unable to access the same level of benefits enjoyed by company workers when it comes to unemployment benefits, health insurance, pensions, maternity leave, to mention some, or would access them only at very high costs.
Figure 31: Part-time workers in % of total employment

Source: Eurostat.
The tension between emerging types of occupation and business models and existing contractual arrangements poses questions on the definition of workers, statistically, economically and legally.
For instance, the distinction between "worker" and "self-employed", and between "self-employed" and "entrepreneur" is sometimes blurred. The case of the collaborative economy is particularly illustrative as it is based on a business model which allows individuals to capitalise on their own assets such as cars or houses, while these companies provide tasks rather than fully-fledged services, making it hard to account for work and workers under current standards. In addition, it is still unclear how to account for the value generated by work – and employment – produced by car- or house-sharing, to mention a few, which raises the question of who is eligible to social benefits and under which conditions.
This situation shows the need to reconsider the identity and responsibilities of the employer in triangular relationships with the employee and the customer, and raises the question of the definitions of contracts and relationships, and their impact on undeclared labour. At the same time, collaborative economy platforms create jobs and new opportunities for (self-)employment by lowering entry barriers to service provision and to new forms of employment or activities as an alternative to traditional employment, including for those at the margins of society. They may also offer opportunities for
on-the-side earning which supplements family income. Online platforms can also facilitate the keeping of records for administrative and tax purposes.
The fundamentals on which the concept of 'flexicurity' is based, namely flexible and reliable contractual arrangements, comprehensive lifelong learning strategies, active labour market policies and modern social security systems, are particularly pertinent in view of the aforementioned trends, but would need to rediscovered in a new light. The presence of dual labour markets in several Member States has aggravated the position of young generations. Tackling this duality by reviewing contractual arrangements is a priority for many countries, as well as investment in skills. This offers workers the human capital they need to be secure and to be able to manage the adaptation challenges that will be increasingly required in the future world of work; and it offers employers the security that they will be able to find and retain the skills they need for growth and innovation.
5.3. Skills for changing occupations
Prioritising skills acquisition and retention is essential to building more resilient economic structures and to boosting job creation in the knowledge economy. Gains from improving educational standards have been shown to lead to average increases in GDP.
To be effective, however, education and training need to provide quality outputs and respond to the fast-changing needs of the economy and society. Research shows that the skills most in demand in advanced economies are “non-routine and interpersonal”
while most Europeans are still trained in more traditional “routine and manual” skills.
The employment share of non-routine jobs, such as design-related occupations, grew from 28% to 38% between 1995 and 2010, whereas traditional routine jobs fell from 53% to 41%. A targeted investment in human capital, which addresses the skills shortage while anticipating future developments in the job market, is particularly relevant for low-skilled workers who have been most strongly affected by the crisis, and typically would need some retraining to take up work again.
This challenge is compounded by the fact that some contract types do not encourage investment in lifelong learning. In effect, access to in-work training remains highly dependent on the type of contract: almost one in two employees on permanent contracts received training compared to 32% of employees with fixed-term contracts and 19% of self-employed.
For people out of work, only 9.5% of the unemployed participate in education and training,
even though these opportunities provide the best chances of return to employment, particularly from situations of long-term unemployment. Individuals doing undeclared work are most vulnerable from this perspective.
A significant explanation for the polarisation and mismatches in employment are gaps and divergence in skills levels, particularly ICT-related skills.
There seems to be a generally positive relationship between employment and the ICT intensity of industries, with the notable exception of jobs in high-routine occupations, where ICT seemingly displaces workers. It is not coincidental, therefore, that from the mid-1990s to 2010, the demand for ICT-related skills vis-à-vis routine skills has become polarised in the EU: the former increased by 20%, while the latter decreased by 20%.
At present, just half of the EU labour force considers that their level of computer and/or internet skills is sufficient if they were to look for a job or change job within a year. On average 14% of Europeans have low level computer skills, 25% have medium level skills and 27% have high level skills. At the same time, 30% of Europeans have low level internet skills, 32% have medium level skills and 11% have high level skills.
Low digital and internet skills constitute significant challenges to be addressed given that up to 90% of jobs, across all sectors, increasingly require ICT literacy.
Figure 33: Evolution of employment in occupational groups defined by problem-solving skills

Source: OECD Skills Outlook
If skill levels largely determine access to opportunities, they also explain a sizeable part of the employment-wage gap. Permanent employment – associated with high skill levels – remains the best paid, the most secure and the fastest growing in Europe. During and immediately after the economic and financial crisis, employment only grew in jobs accounting for the lowest and highest job-wage quintile (Figure 34).
Figure 34: Net Employment Change (in thousands) by job-wage quintile, EU27, 1998-2014

Source: European Commission (2016), Employment and Social Developments in Europe (ESDE) 2015
Avoiding lower employment and job polarisation hinges on the provision of skills that fit the demands of evolving labour markets, and this puts a premium on “non-routine and interpersonal” abilities and problem-solving in technology-rich environments. at present, many Europeans tend to be "overqualified but under-skilled".
The provision of effective training throughout one's educational and professional development from job entry level to retirement, are unevenly distributed – both within and among Member States. In only a third of Member States, more than 10% of all working, unemployed and inactive adults participate in adult education and training annually (Figure 35).
Figure 35: Participation in adult education and training by labour status, %, 2014

Source: Eurostat
6. Specific challenges and requirements of the euro area
Economic performance depends in sizeable measure on the effectiveness of employment and social systems and on the functioning of labour markets. This is particularly true for a currency union,
where there is one monetary policy and fiscal stabilisation instruments are constrained.
Given the strong interdependence and possibilities of spill-overs between economies, the lack of convergence in socio-economic performances to support more resilient economic structures may hamper the functioning and stability of the euro area. While the crisis and its aftermath triggered large differences in socio-economic situations across the euro area,
in the Member States most affected by the crisis, the convergence process had already stalled ahead of the sovereign debt crisis, together with the building-up of imbalances. The crisis revealed and accentuated a number of pre-existing weaknesses, which had not been tackled.
In particular, before 2008, in several countries, domestic demand booms and foreign capital inflows led to the expansion of non-tradable (less productive) sectors of the economy, rather than to the financing of sustainable growth enhancing investments. The global financial crisis brought a reassessment of credit risks in line with the potential growth prospects of individual countries, the lack of growth enhancing structural reforms, and the uncertainties of an incomplete EMU. The sudden stop of foreign capital inflows was accompanied by a drop of domestic credit, income and consumption. This reversal in the direction of these flows was a major driver of the recessions in some Member States in the East and South of the euro area. The decline in consumption (imports) occurred initially through an increase of unemployment rather than through an adjustment of real wages (lower incomes). Thus, the divergences in unemployment rates accumulated during the crisis derive from current account imbalances built up before 2008 (Figure 36).
Figure 36: Current account balances crisis hit countries vs. surplus countries, 2000-2015

Source: Eurostat. Estimates for 2015
In several countries, rigidities have contributed to wage increases above productivity levels in the years preceding the crisis (while in other Member States unit labour costs developed significantly below the euro average) and it took some time for wages to start to adjust once the crisis had hit. In the meantime, the current accounts reversals (i.e. the reversal of capital inflows) had exerted their disruptive effects on unemployment (Figure 37).
Figure 37: Nominal unit labour cost, EA north vs. EA south+Ireland, 2000 to 2013

Source: Eurostat. Note: Estimates for 2015.
As is shown in the literature, the labour market response to shocks may occur through "price" adjustment, i.e. through changes in wages/labour costs, and "quantity" adjustment, i.e. through changes in the total number of hours worked (i.e. either the number of people employed or in the average hours worked), and/or ensuing geographical and occupational labour mobility. This is all the more relevant in a currency union.
Enhancing convergence between national employment and social performances within the euro area, including along the principles of flexicurity,
should go hand-in-hand with a greater capacity to adjust in case of adverse shocks.
Significant reforms to allow smoother transitions on the labour market have already taken place across the euro area, notably in those countries long characterised by rigid job protection legislation and a significant regulatory gap between open-ended and the so-called atypical contracts.
While time may be needed for the effects of those reforms to materialise, changes in policy fields such as unemployment benefits, employment services and active labour market policies, as well as access to skills and vocation training, can also strengthen resilience and convergence towards the best performing labour markets in euro area.
Since 2008 in particular, reforms to reduce stringent employment protection legislation for permanent contracts and/or increase protection for temporary workers have attempted to reduce labour market segmentation, especially in the Southern euro area Member States. The 'employment protection gap' between open-ended and temporary labour contracts, however, remains significant in many countries.
Greater labour mobility can also be an important instrument to cushion the impact of economic shocks, help address unemployment disparities between the Member States, contribute to a more efficient allocation of human resources, assist the reduction of skills mismatches and also lessen budgetary pressures. As underlined by optimum currency areas theory, labour mobility can also contribute to support the function of stabilisation. At the same time, national concerns about a possible drain of productive labour and the reinforcement of labour market segmentation should not be discarded.
More responsive labour markets increase the sensitivity of employment to the economic cycle, since more jobs can be created in an upswing, and, symmetrically, more lost in a contraction. This also increases the importance of both re-training for new types of jobs as well as adequate social protection during labour transitions. It also emphasises the importance of the portability of social rights and benefits so that workers are able to seamlessly carry all their pension, health care and other rights from one employer to another, regardless of the geographical location of this employer.
Social protection systems provide for the major component of automatic stabilisation of the economy in bad economic times, since expenditure generally increases (partly compensating for the decline in market incomes) and tax revenues decline. This stabilisation function is mainly fulfilled by unemployment benefits, means-tested benefits (such as social exclusion or housing benefits), as well as for pension or health care expenditure, since those generally continue to grow or remain constant while market incomes decline.

