EUROPEAN COMMISSION
Brussels, 26.2.2020
SWD(2020) 509 final
COMMISSION STAFF WORKING DOCUMENT
Country Report France 2020
Accompanying the document
COMMUNICATION FROM THE COMMISSION TO THE EUROPEAN PARLIAMENT, THE EUROPEAN COUNCIL, THE COUNCIL, THE EUROPEAN CENTRAL BANK AND THE EUROGROUP
2020 European Semester: Assessment of progress on structural reforms, prevention and correction of macroeconomic imbalances, and results of in-depth reviews under Regulation (EU) No 1176/2011
{COM(2020) 150 final}
Contents
Executive summary
1.Economic situation and outlook
2.Progress with country-specific recommendations
3.Summary of the main findings from the MIP in-depth review
4.Reform priorities
4.1.Public finances and taxation*
4.2.Financial sector*
4.3.Labour market, education and social policies*
4.4. Competitiveness reforms and Investment*
4.5.Environmental sustainability
Annex A: Overview Table
Annex B: Debt Sustainability Assessment
Annex C: Standard Tables
Annex D: Investment guidance on Just Transition Fund 2021-2027 for France
Annex E: Progress towards the Sustainable Development Goals (SDGs)
References
LIST OF Tables
Table 1.1:Key economic and financial indicators
Table 2.1:Assessment of 2019 CSR implementation (*)
Table 3.1:Outward spill-over heat map
Table 3.2:MIP Assessment Matrix (*)
Table 4.2.1:Financial soundness indicators - all banks in France
Table 4.5.1:Total greenhouse gas emissions per capita (*), tons of CO2 equivalent
Table C.1:Financial market indicators
Table C.2:Headline Social Scoreboard indicators
Table C.3:Labour market and education indicators
Table C.4:Social inclusion and health indicators
Table C.5:Product market performance and policy indicators
Table C.6:Green Growth
Table E.1:Indicators measuring France’s progress towards the SDGs
LIST OF Graphs
Graph 1.1:
Contributions to GDP growth (2012-2021)
Graph 1.2:
Potential GDP growth breakdown
Graph 1.3:
Breakdown of unit labour cost rate of change
Graph 1.4:
Share of market services in export value added (2014)
Graph 1.5:
Export shares (% of national exports) by quality level
Graph 1.6:
Breakdown of the current account
Graph 1.7:
Non-financial corporation consolidated debt
Graph 1.8:
Interest burden evolution
Graph 1.9:
Housing market - Overvaluation gaps
Graph 2.1:
Overall multiannual implementation of 2011-2019 CSRs to date
17
Graph 4.1.1:
Fiscal effort and public debt
Graph 4.1.2:
Public debt in France and in the euro area
Graph 4.1.3:
Public debt projections in France
Graph 4.1.4:
French fiscal rules and MTBF indices vs EU average
Graph 4.1.5:
Structural Balance targets versus outturns
Graph 4.1.6:
Environmental taxes as percentage of total revenues from taxes and social contributions in France and the EU
Graph 4.1.7:
Environmental tax revenues as percentage of GDP in France and the EU
Graph 4.2.1:
Annual growth rate of loans
Graph 4.3.1:
Employment by type (thousand), year-on-year changes
Graph 4.3.2:
Long term evolution of labour market indicators
Graph 4.3.3:
Share of temporary employees and transition rates from temporary to permanent contracts (age group 15-64)
Graph 4.3.4:
Evolution of the task content of jobs (skills) in France, 2000-2018
Graph 4.4.1:
Labour productivity growth per sector
Graph 4.4.2:
Average share of 'zombie firms' between 2010 and 2015
Graph 4.4.3:
Investment levels by sector (% of GDP)
Graph 4.4.4:
Contribution of intangible capital growth to productivity growth (2015), by asset
Graph 4.4.5:
Turnover and employment of multinationals abroad, by country of origin (to rest of the world)
Graph 4.4.6:
Business churn rates (%) of active companies in selected business services sectors for France and the EU
Graph 4.4.7:
Regional competitiveness index
Graph 4.4.8:
Greenhouse gas emissions per NUTS2 regions
Graph 4.5.1:
Targets and emissions under the effort sharing legislation (% change from 2005)
Graph 4.5.2:
Greenhouse gas emissions by sector with projections
Graph 4.5.3:
Capital investment needs for 2021-2027 in the waste sector (€ mn). Top 6 EU.
LIST OF Boxes
Box 2.1: EU funds and programmes to address structural challenges and to foster growth and competitiveness in France
Box 3.2: Euro-area spillovers
Box 4.1.3: Assessing the redistributive impact of some measures favourable to households’ disposable income
Box 4.3.4: Monitoring performance under the European Pillar of Social Rights
Box 4.4.5: Investment challenges and reforms
Box 4.4.6: The Investment Plan for Europe and InvestEU
Box 4.4.7: Impact of business environment reforms
Box 4.5.8: Energy renovation of buildings
Executive summary
France has sustained its reform efforts yet further measures are needed to continue improving the performance of the French economy (
). Some structural challenges persist, in particular high government debt and high unemployment. France has also experienced a productivity slowdown that calls for continued investment in skills and swift progress implementing the recent vocational education and training reform, as well as measures to improve the business environment. At the same time, expenditure control will be important to bring debt on a sustained downward path. The pension system reform is planned for adoption by the end of the year 2020.
Economic growth moderated in 2019 and is expected to remain close to potential in the near future. Gross Domestic Product (GDP) growth has decreased since its peak in 2017 and reached 1.2% in 2019 (
). It is expected to remain close to its potential growth rate in 2020 and 2021, at 1.1% and 1.2% respectively. French domestic demand is set to be resilient in 2020 and 2021, following a temporary decrease at the end of 2019. Consumer spending would benefit from purchasing power gains registered since the end of 2018 resulting from lower unemployment and inflation, higher wages and supportive fiscal measures. Investment growth is expected to ease – down from high levels – but remain robust overall following favourable financing conditions. In line with domestic demand, import growth is set to gain momentum. By contrast, the weakening the international environment is expected to weigh on exporters compared to the particularly dynamic years of 2017 and 2018.
Labour market conditions are improving but unemployment remains high, particularly for disadvantaged groups. Despite the slowdown in economic activity since the beginning of 2018, the unemployment rate declined further and reached 8.4% in Q42019. The situation for young people has also improved. However, those with low skills and those with a migrant background face difficulties in integrating in the labour market. Reforms are ongoing to increase their employment prospects. Finally, some sectors appear to face emerging skills shortages and mismatches.
France’s competitiveness continues to show mixed results. After falling for many years, export market shares have recently stabilised, but losses have not recovered. The current account remained broadly stable and the net international investment position marginally improved. In terms of cost competitiveness, the cost of labour (measured as unit labour costs) has grown more moderately than in other euro area and EU countries, with developments in wages remaining contained in a context of sluggish productivity growth. In terms of non-cost competitiveness, French exports of goods are of overall medium to high quality. France maintains the highest quality in aeronautics, cosmetics and beverages.
After a temporary rebound to 3.1% of GDP in 2019, the deficit is set to decline to 2.2% of GDP in 2020. The breach of the 3% of GDP deficit threshold in 2019 is minor and temporary, due to the one-off impact of changes to the employment and competitiveness tax credit (CICE) into a permanent cut in employers’ social contributions. The measures adopted at the end of 2018 in response to the ‘Gilets jaunes’ movement, aimed to improve households’ disposable income, entailed a net deficit-increasing impact of around 0.3% of GDP in 2019. Further measures taking effect in 2020 were adopted in April 2019. These measures include a permanent cut in personal income tax (worth €5bn, i.e. 0.2% of GDP), the reindexation of pensions below €2,000 per month, and an increase in minimum pensions (both amounting to €1.5 bn, or 0.1% of GDP).
High government debt is set to rise slightly. After stabilising in 2018, the government debt ratio is set to rise by 0.5 pps. in 2019, to reach 98.9% of GDP. In 2020, government debt is forecast to remain at 98.9% of GDP, before rising further to 99.2% in 2021, which would widen the gap with the euro area average. While risks to the financing of debt remain limited in the short term thanks to favourable conditions for the State and a large and diversified investors base, the high debt level limits the scope to respond to adverse shocks.
Reforms and targeted investment in skills, digital infrastructure and research and innovation have the potential to unlock productivity gains in the economy. According to the French National Productivity Board, the weak productivity growth of French businesses can be explained in part by factors common to most EU countries. Country-specific factors such as France’s comparatively low skilled workforce, low uptake of information and communication technologies and suboptimal innovation performance also play a role. The implementation of several investment plans as well as the ongoing reform efforts will contribute to addressing these challenges. The full impact of these measures on productivity will take time to materialise. Moreover, the performance in research and innovation is still hampered by the complexity of the research and innovation ecosystem. Continued efforts are crucial to improve the impact and efficiency of public support for research and innovation and reinforcing the links between science and business.
Overall, France has made some progress in addressing the 2019 country-specific recommendations.
There has been substantial progress in implementing measures to facilitate firms’ growth (PACTE Law in 2019).
There has been some progress in:
·addressing skills shortages and mismatches
·focusing investment to ensure the move towards cleaner energy;
·improving the digital infrastructure; and
·continuing efforts to simplify the tax system.
There has been limited progress in:
·reforming the pension system;
·labour market integration and ensuring equal opportunities;
·improving research and innovation performance; and
·reducing regulatory restrictions.
There has been no progress in further detailing and implementing the specific measures outlined in the Public Action 2022 programme.
France performs relatively well on the employment and social indicators highlighted in the Social Scoreboard that underpins the European Pillar of Social Rights. Poverty and inequality are below the EU average and overall the social protection system is effective. Access to healthcare and childcare services is also comparatively good. However, the unemployment rate remains above the EU average, despite several years of decline. Labour market integration remains more difficult for disadvantaged groups. On the quality of jobs, the incidence of in-work poverty is low, but the segmentation of the labour market into different levels of job security and social protection represents a persisting challenge.
Regarding progress in reaching the national targets under the Europe 2020 strategy, France has reached the targets for reducing early school leaving and increasing tertiary educational attainment. By contrast, additional efforts are needed to meet the targets on reducing poverty, investing in R&D, using renewable energy and improving energy efficiency.
France performs very well in terms of the United Nations Sustainable Development Goals (
). Progress can be observed in all SDG goals over the past five years and in particular in ‘Responsible consumption and production’ (SDG 13). At the same time, significant deviation can be observed in indicators linked to government debt (Partnership for the goals - SDG 17).
The main findings of the in-depth review contained in this report and the related policy challenges are as follows:
·While recent competitiveness developments are positive, several vulnerabilities remain. Cost-competitiveness has improved recently as France benefited from moderate growth in the cost of labour compared to most euro area or EU countries. This came about because of the combined effect of a moderate increase in real wages and low labour productivity growth. Recent reforms aimed to improve the business environment and improve business competitiveness, while further measures to increase the performance of the innovation ecosystem are warranted.
·No fiscal consolidation is planned in the short term. The structural deficit remains high and it will be difficult to reduce high government debt, which stands close to 100% of GDP, in the absence of fiscal consolidation. While the tax burden has been cut by almost one percentage point, cuts in government spending are proving much slower to accomplish. A quantification of overall savings and macroeconomic impacts of the Public Action 2022 is still missing.
·Private debt is high and on the rise.. The level of debt for both households and non-financial corporations is high and has continued increasing, contrary to other EU Member States with high levels of private debt. The French authorities will carry out an assessment of the rules adopted to mitigate risks to the financial system as a whole (macroprudential measures) in 2020.
·Although the situation is improving, the French labour market continues to face structural problems. These include persistent high unemployment, emerging skills mismatches and entrenched labour market segmentation. Recent reforms on vocational education and training aim at addressing these structural problems in the labour market. Their implementation requires close monitoring and assessment.
Other key structural issues analysed in this report, which point to challenges for France’s economy, are as follows:
·France is rolling out an investment plan to address its environmental sustainability challenges. The Great plan for investment supports moves towards a greener economy focusing on energy efficiency of buildings and incentives to switch to less polluting vehicles. However, based on current policies, France would miss its 2030 GHG reduction target for the non-ETS sectors by a significant margin, according to national projections. Simulations show that a budgetary-neutral public investment stimulus in France would increase domestic GPD and result in positive spillovers in the rest of the euro area.
·The Commission’s proposal for a Just Transition Mechanism under the next multi-annual financial framework for 2021-2027 includes a Just Transition Fund, a dedicated scheme under InvestEU, and a new government loan facility with the EIB. It is designed to ensure that the transition towards EU climate neutrality is fair by helping the most affected regions in France to address the social and economic consequences. Key priorities for support by the Just Transition Fund, set up as part of the Just Transition Mechanism, are identified in Annex D, building on the analysis of the transition challenges outlined in this report.
·The carbon tax increase has been suspended since 2019 following social unrest. Carefully designed supporting measures could facilitate the acceptance of future environmental taxes. In the context of social fairness, a citizens' climate convention has been given the mandate to define measures to achieve climate targets by spring 2020.
·Increased efforts are needed to cut greenhouse gas emissions in the residential sector. The residential sector is the second largest emitter of greenhouse gas emissions after transport. Public and private investment need to prioritise actions to make progress in improving energy efficiency of buildings as required by the 2019 climate and energy law, which plans to decrease the number of thermal sieves.
·The business environment is improving but difficulties remain for businesses wanting to scale up, which weighs on their capacity to export. High taxes on production also affect business competitiveness. France has a relatively low number of high-growth businesses. The PACTE law (Plan d’action pour la croissance et la transformation des entreprises) addresses some of the barriers to business creation and growth. France stands out for its level of taxes on production (3.2 % of GDP), one of the highest in the EU. Under the ‘Pacte Productif’, the French authorities announced a review of taxes on production and improvements for business competitiveness and environmental sustainability.
·The level of restrictive rules is higher in France than in other EU countries, particularly in some services, which could restrict competition. Redesigning requirements on the access and exercise of professions to stimulate innovation, competition and professional mobility, would have a positive economic impact. Additional restrictions have been imposed on retail services that could be detrimental to retailers and affect other businesses.
·Some groups experience more difficulties in accessing the labour market. In particular, the low-skilled people with a migrant background and non-EU born women have persistently lower employment rates. The more difficult integration on the labour market is reflected in a significantly higher risk of poverty.
·The French education system is experiencing persisting socioeconomic inequalities. According to the OECD Programme for International Student Assessment scores, the educational performance of 15-year olds in France is above the EU average. However, the link between socio-economic status and performance remained among the strongest in the EU, while having a migrant background also impacts negatively education outcomes. Comprehensive reforms are being implemented, including a number of measures to reduce inequalities starting from early childhood (lowering the age of compulsory education and halving class size in disadvantaged schools).
·Access to social housing remains a challenge. Although facing an increasing demand, the supply of new social housing continues to decline. Unmet demand for social housing is of particular concern for vulnerable groups such as single parent households that are more at risk of poverty. The ‘Housing First’ strategy rolled out by the government represents a positive step, yet remains limited in scope.
·Socio-economic gaps across French Regions are significant. Indicators point to a major economic gap between some regions (including the Ile-de-France region) and the rest of the country. The outermost regions experience specific vulnerabilities in education, healthcare and access to the labour market of vulnerable groups.
1.
Economic situation and outlook
GDP growth
GDP growth in France continued moderating in 2019. It decreased to 1.2% in 2019, after registering 1.7% in 2018 and 2.3% in 2017 (
). Private consumption picked up mildly, despite significant gains in purchasing power. The latter has been lifted by rising wages, falling unemployment and inflation and supportive fiscal measures. Corporate investment remained buoyant despite the slowdown of economic activity and public investment accelerated significantly, notably local investment. Following a downturn in 2018, household investment growth increased moderately in 2019. After a strong contribution to GDP growth in 2018, net exports slightly weighed on GDP growth in 2019. Import growth rose, while export growth decreased as external demand lost momentum.
|
Graph 1.1:Contributions to GDP growth (2012-2021)
|
|
|
|
Source: European Commission, 2020a
|
GDP growth is set to decrease slightly in 2020, before recovering in 2021. Following a decrease at the end of 2019 due to temporary factors such as strikes against the pension reform, economic activity is set to rebound, supported by a resilient domestic demand. Private consumption growth is forecast to increase somewhat in 2020 and remain broadly stable in 2021, boosted by gains in purchasing power already registered in 2019. Higher consumer spending is expected to partially compensate for the slowdown in investment over the next few years. Corporate investment is set to decelerate, but to remain dynamic, supported by favourable financing conditions. Public investment is set to weaken due to local elections in the first quarter of 2020. In addition, net exports are set to weigh slightly on growth. GDP growth is expected to reach 1.1% in 2020 and 1.2% in 2021 (see Graph 1.1 and European Commission, 2020a).
Risks to economic growth are balanced. Negative risks mainly stem from the external side, while domestic risks are tilted to the upside. Persistent uncertainties on the international front (including trade policies and the threat that the U.S. may impose several duties on French exports) could weigh on French exports and investment (European Commission 2019a). Conversely, the expected rebound in the first half of 2020 could prove more robust with higher stockpiling. Private consumption could also be more dynamic than expected as the saving rate and consumer confidence remain high.
Potential growth
GDP growth is set to remain close to its potential, which is estimated at 1.1% in 2019. According to the Commission’s estimates, the output gap turned positive in 2018. It is set to slightly increase in 2019, reaching 0.7% of potential GDP, and remain broadly stable in 2020 and 2021.
Potential growth has been improving slowly since 2015. The growth rate of potential GDP decreased on average from 1.8% from 2000 to 2008 to just 1.0% between 2009 and 2019, reaching an all-time low of 0.8% in 2015. Since then, it has been gradually recovering and is expected to reach 1.3% in 2021. This slowdown has been observed in most major euro area economies. In France, as in other European economies, there has been a gradual decrease in the contribution of total factor productivity over the 2000s, combined with a drop in the contribution of capital accumulation following the 2008 financial crisis (see Graph 1.2). The contribution of total factor productivity has improved since 2010, but remains contained. Common global factors partly explain the slowdown in total factor productivity. For example, the increasing share of services in the economy or the slowdown in technological progress. However, France has room to increase its performance with respect to its specific factors to lift the contribution of total factor productivity in the medium-term. For example, this includes skills, competition or innovation (see Section 4.4.1). On capital accumulation, according to the Commission’s estimates, the investment ratio dropped from around 24% of potential output in 2008 to around 21% in 2015. A recovery has been observed since then, and now the investment ratio benefits from a sharp rise in investment over the past few years. The contribution of capital accumulation to potential growth remains nevertheless below pre-crisis levels.
|
Graph 1.2:Potential GDP growth breakdown
|
|
|
|
Source: European Commission, 2019 autumn forecast
|
Inflation
Inflation is set to remain broadly stable in 2020 and 2021. Inflation (based on the HICP indicator) dropped to 1.3% in 2019, from 2.1% in 2018, due to lower oil prices and lower tax increases (
). It is forecast to decrease marginally to 1.2% in 2020, before going back to 1.3% 2021. Core inflation is set to increase slightly, in line with the services component.
Labour market
The labour market continues to improve, but challenges remain (see Section 4.3). The unemployment rate declined slowly from 10.4% in 2015 to 8.4% in Q4-2019 and is now more than 2 percentage points above the EU average (6.3% in Q4-2019). The employment rate stood at 71.4% in Q3-2019 and overall job creation remained dynamic in 2019. Job creation is subsequently forecast to slow down gradually, as the decline in GDP growth is set to spread to the labour market and the impact of some employment enhancing measures is set to fade away gradually (
). Overall, the labour market appears to be tightening. The gap between the unemployment rate and its structural level (NAWRU) has been gradually closing since 2015. Business surveys also report an increase in difficulties hiring workers since the start of the recovery (Dares, 2016). Rising unfilled vacancies (
) and shortages in some professions and sectors, despite a high level of unemployment, can also suggest a skills mismatch. Between 2015 and 2018, nominal (non-price adjusted) wages rose at a moderate pace while real (adjusted for price) wages grew broadly in line with productivity. Consistent with labour market tightening, the mild pick-up in nominal wage growth observed since 2015 is expected to continue in 2019 and is set to stabilise after that.
Regional disparities
Regional disparities have been steadily increasing in metropolitan France during the last decade. Two regions had a GDP per head above the EU average in 2017, namely Île-de-France at 177% of the EU average and Rhône-Alpes at 104% (
). At the other end of the spectrum, Picardie and Lorraine were at 75% of the EU average. In metropolitan France, divergences are growing between the capital and the poorest regions. The growth rate of GDP per head is the highest in the capital region, while it is generally lower for poorer regions. Disparities in GDP per head are linked to regional differences observed in the labour market (see Section 4.4.5).
In the outermost regions, several vulnerabilities persist. GDP per head as a percentage of the EU average is relatively lower in the outermost regions compared to metropolitan France. The unemployment rate is also much higher in those regions (see Section 4.4.5).
Social developments
While the French social protection system is overall effective in reducing poverty and inequality, the share of people at risk of poverty slightly increased in 2018 (see Section 4.3) (
). France is characterised by relatively low inequality in equivalised household disposable income, and a tax and benefit system effective in reducing poverty. In 2018, the share of income received by the top 20% of households was 4.2 times higher than that of the bottom 20%. This ratio has been gradually decreasing from the peak of 4.6 in 2011. The relative share of income of the top 20% of households in France is lower than the EU average of 5.2. Overall, the French social protection system appears to be effective in terms of reducing poverty and inequality in disposable income. Social transfers reduced the risk of poverty by 44.4% in 2018 (
), more than 10 percentage points above the EU average. The share of population at-risk-of-poverty and social exclusion (17.4%) also stood well below the EU average in 2018 (21.9%). However, contrary to the EU average and peer countries, the share of people at-risk-of-poverty slightly increased in 2018, driven by a marked rise in the rate of severe material deprivation rate (up by 0.6 percentage points compared to 2017, reaching 4.7% in 2018).
Competitiveness
Export market shares have broadly stabilised since 2013 after declining in the 2000s. Over the five years to 2018, export market shares remained flat in both the goods and services sectors. In the goods sector, the improvement in 2015 and 2016 was followed by a deterioration in 2017 and 2018. The evolution is more volatile in the services sector, with a deterioration in 2015 and 2017 followed by an improvement in 2016 and 2018. Moderate unit labour cost growth in aggregate since 2013 might have helped to stabilise the export market shares. Nevertheless, the relatively high level of taxes on production (see Section 4.1), the structure of the French production processes relying more on high unit labour cost sectors and the decline in average quality of exported goods might have limited the improvement of market shares. Overall, export market shares are forecast not to improve in the next few years.
|
Graph 1.3:Breakdown of unit labour cost rate of change
|
|
|
|
Source: European Commission, 2019 autumn forecast
|
Growth in unit labour cost was moderate in the past few years. Nominal unit labour costs have grown by 2.4% over the three years to 2018, which is below the EU average. On a year-on-year basis, the increase in unit labour cost growth observed in 2018 is mostly explained by a decrease in labour productivity growth, which is set to continue decreasing in 2019 (see Graph 1.3). Despite a slowdown in economic activity, job creation remained dynamic in 2018 and 2019. Following a temporary decrease in 2019 due to a statistical artefact (
), growth in unit labour cost is forecast to recover in 2020 and 2021. In 2020, employers’ are forecast to benefit fully from additional reductions in employers’ social contributions for workers close to the minimum wage level. This is expected to help contain the growth in unit labour cost. In 2021, wages are set to accelerate slightly, as labour productivity gradually picks up.
|
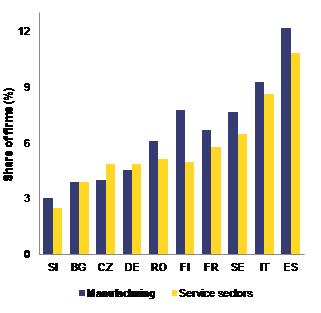
Graph 1.4:Share of market services in export value added (2014)
|
|
|
|
Source: Commission's calculation based on World Input-Output Database
|
The important role services play in France continues to weigh on cost-competitiveness. The content of domestic services in total exports in France increased from 37% in 2000 to 40% in 2014. In 2014, it was higher than in major competitor countries (30%, 32% and 33% in Germany, Spain and Italy, respectively) (see Graph 1.4) (
). While the average labour costs converged in recent years with those of main competitors, labour costs in services remained among the highest in the EU. Taking into account both the fragmentation of production processes and the evolution of sectoral unit labour costs, Cézar and Cartellier (Banque de France, 2019a) show that domestic services sectors contribute particularly to the increase in the adjusted unit labour cost (
). In this regard, the evolution of domestic and foreign unit labour costs in the services sector had a higher impact on the labour costs of the aggregate exporting sector in France than in its neighbouring countries.
|
Graph 1.5:Export shares (% of national exports) by quality level
|
|
|
|
Source: European Commission
|
On non-cost competitiveness, the composition of French exports shifted towards medium quality goods compared to the early 2000s. According to Burton and Kizior (forthcoming), in non-price component of exports (proxy for ‘quality’), France ranks 11th among 37 countries (OECD and EU countries), which suggests an overall medium-high quality of the French exports. The share of high quality products on total exports is lower than in Germany and Italy, but higher than in Spain. In contrast to these neighbouring countries, French export shares in high quality products decreased markedly between 2003 and 2016 (see Graph 1.5). Consequently, the share of middle and low quality products in total exports increased, underpinning exposure to relatively price elastic demand, and more intense competition, notably from emerging economies. Survey studies also support the perception of medium quality French products being often overpriced (Rexecode, 2019).
External position
The small current account deficit has been and is set to remain broadly stable. In 2018, net borrowing by corporations and the public sector was higher than households’ net lending. As a result, the current account posted a small deficit of -0.6% of GDP (
), broadly in line with its 2017 level (see Graph 1.6). According to balance of payments data, the trade deficit remained broadly stable in 2018, at around -1% of GDP (
). The trade deficit in goods deteriorated in 2018 due mainly to higher oil prices. This deterioration was compensated by an improvement of the trade surplus in services. According to the Commission 2019 autumn forecast, the overall trade deficit is set to improve slightly in 2019 on the back of lower oil prices. It is expected to deteriorate slightly in 2020 as imports are forecast to accelerate, and to remain stable in 2021. France has a significant primary income surplus, supported by direct investment revenues (see Section 4.4.1), which improved further in 2018. However, this improvement was offset by a deterioration in the secondary income deficit. In particular, the public administration current transfers deficit (including payments to the EU and to international organisations) worsened in 2018. The current account deficit is set to broadly follow the evolution of the trade deficit, and despite a temporary improvement in 2019, there should be little change going forward.
The net international investment position remains negative. It went from -16.6% of GDP in 2017 to -16.4% of GDP in 2018, benefiting from positive valuation effects linked to fluctuations in market prices and exchange rate (
). However, the readings of France’s net international investment position deteriorates, reaching -33% of GDP in 2018, if account is taken of those components that are considered more likely to default (
) (European Commission 2019b). Net direct investments account for most of the net international investment position on the asset side and increased markedly in 2018, driven by a significant growth in French foreign direct investments due to some major mergers and acquisitions. By contrast, portfolio investments deteriorated in 2018. General government still accounts for most of the negative net international investment position (almost -50% of GDP), while the private sector shows a strong position (close to 50% of GDP). Monetary and financial institutions, excluding the central bank, held a negative position in 2012, which has continued deteriorating since then.
|
Graph 1.6:Breakdown of the current account
|
|
|
|
Source: Eurostat (balance of payment)
|
France’s external position indicators stand below the levels suggested by the fundamentals, without raising prudential concerns. The current account and net international investment position remain below the levels predicted by fundamentals, which are surpluses of 0.3% of GDP (
) and 6% of GDP, respectively. However according to the Commission’s estimates, the current account level in 2018 is close to the cyclically-adjusted one and seems broadly in line to stabilise the net international investment position at its current level over the next 10 years. Furthermore, the net international investment position level does not raise prudential concerns (
).
Private debt
Private debt continued to increase in 2018, reaching 148.9% of GDP (
). In the current environment of low interest rates, both households and non-financial corporations have been contributing to the increasing private debt ratio in France. In particular, non-financial corporations have been leveraging further, namely from 86.9% of GDP in 2017 to 88.9% in 2018. Households’ debt also continued rising (at one of the highest rates in the EU), reaching 60% of GDP in 2018 from 58.5% in 2017. By contrast, private debt in the euro area as a whole has been falling in every year since 2009.
|
Graph 1.7:Non-financial corporation consolidated debt
|
|
|
|
Source: European Commission, Eurostat
|
Non-financial corporations have been leveraging further despite recording a debt ratio already above the level suggested by the country’s fundamentals. Among the countries with a positive non-financial corporations debt gap relative to a prudent indicative threshold, France is one of the few cases where deleveraging did not take place in 2018. The debt of non-financial corporations reached 88.9% of GDP in 2018, which according to Commission estimates is 22 percentage points above what fundamentals would suggest. It is also above a level that justifies prudential concerns (see Graph 1.7) (
). Positive net credit flows continued increasing in 2019. However, the share of non-financial corporations’ interest payments on their total value added continued to decline in 2018 to 5.1%. This was due to low and falling interest rates, reaching their lowest level in decades despite being 78% higher than in the euro area (see Graph 1.8). The proportion of short-term debt on total debt in non-financial corporations has decreased slowly since the crisis, from around 34% to around 30% in 2018. This acts as a mitigating risk factor. To reduce the risks associated with high private debt of non-financial corporations, the High Council for Financial Stability (Haut Conseil de Stabilité Financière) introduced macroprudential instruments (see Section 4.2).
Household debt continued rising but the level is still in line with the fundamentals. Household debt-to-GDP has been increasing steadily over the last decade and is now above the prudential thresholds estimated by the Commission (
). However, at 60% of GDP, the level of household debt in 2018 is estimated to be close to the fundamentals according to the Commission’s estimates. Household debt has increased more than the fundamentals-based benchmark, and it will surpass it if trends do not change. Consumer spending loans marginally increased in 2018 up to 7.3% of GDP, but the mortgage stock in percentage of GDP increased by 1.6 percentage points in 2018, reaching 44.1% of GDP in 2018. While French households’ interest payments, as a share of their gross disposable income, is at historical lows and in line with other euro area countries, the share of household income devoted to debt repayment has continued increasing. For example, the share of households with a debt-service-to-income ratio above 33% has increased by 5 percentage points since 2015 (Haut Conseil de Stabilité Financière, 2019a). Supporting this aggregate finding, the households credit observatory (Observatoire des Crédits aux Ménages) noted that in 2018, out of all the borrowers, 50% of respondents classified the repayment of their debt as a high burden despite the cut in interest rates (the burden remains nevertheless bearable for the majority of them).
|
Graph 1.8:Interest burden evolution
|
|
|
|
Source: Eurostat
|
Housing
While real house price growth has been very contained in France since 2011, some indicators continue to suggest risks of overvaluation. This is due to the significant growth in the 2000s, which has yet to be undone (see Graph 1.9). The European Systemic Risk Board has identified medium-term vulnerabilities in the housing market in France as a source of systemic risk to financial stability, which could have negative effects on the real economy (European Systemic Risk Board, 2019). However, the High Council for Financial Stability has not found evidence of possible risks associated with a potential fall in property prices (Haut Conseil de Stabilité financière, 2019a). The reason being that 94.6% of outstanding loans at the end of 2018 are set at a fixed interest rate (Autorité de contrôle prudentiel, 2018), which limits the impact of a potential rise in interest rates. Two additional sources that limit potential vulnerabilities from macroeconomic shocks are (i) the high social protection in France, and (ii) the double-selection procedure of borrowers, where these are evaluated by lenders as well as mutual guarantee societies. Despite this, the High Council for Financial Stability pointed out that credit standards have loosened across the board, with increasing maturities, loan-to-value and debt service-to-income ratios (Haut Conseil de Stabilité Financière, 2019a and 2019b). French authorities have taken several macroprudential measures to address the growing vulnerabilities, including in the residential real estate market (see Section 4.2).
|
Graph 1.9:Housing market - Overvaluation gaps
|
|
|
|
Source: European Commission
|
Public finances
The public deficit dropped to 2.5% of GDP in 2018; looking forward, little structural improvement is envisaged. According to the Commission 2019 autumn forecast, the general government deficit is set to rise to 3.1% of GDP in 2019. This is due to the one-off deficit-increasing impact of 0.9% of GDP mainly stemming from the replacement of the tax credit for employment and competitiveness (Crédit d’Impôt pour la Compétitivité et l’Emploi) by a permanent cut in social contributions. As this effect fades away in 2020, the general government deficit is forecast to decline to 2.2% of GDP. However, the structural deficit is not expected to register any material improvement in 2019 and 2020. In 2020, the deficit-increasing measures adopted after the Broad National Debate (Grand débat national) (see Section 4.1) are set to be partially offset mainly by the projected decline in interest payments and by postponing the cut in the corporate income tax rate for large companies. At unchanged policies, the deficit is projected to remain at 2.2% of GDP in 2021.
The public debt-to-GDP ratio will increase further, to about 99% of GDP, by 2021. The public debt-to-GDP ratio has hovered around 98.4% in 2017 and 2018. However, according to the Commission 2019 autumn forecast, it is expected to increase by 0.5 percentage points of GDP in 2019. It is then projected to rise further, to 99.2% in 2021, due to persistently high structural deficits (see Section 4.1).
Sustainable Development Goals
Overall, France performs very well in achieving the Sustainable Development Goals. According to Eurostat’s Sustainable Development Goals (SDGs) indicators (see Annex E), France performs better than the EU average in nearly all the indicators related to inequalities for SDG 1 - No poverty, SDG 5 - Gender equality, and SDG 10 - Reduced inequalities. France has been making progress in all the goals over the past five years. In particular, ‘Responsible consumption and production’ (SDG 12) and ‘Peace and justice’ (SDG 16). However, basic education indicators (Underachievement in reading, maths and science, SDG 4 - Quality education) are on a persistent deviation (short and long term). Lower performances can also be observed in SDG 8 - Decent Work and Economic Growth and SDG 17 - Partnerships for the goals.
|
|
|
Table 1.1:Key economic and financial indicators
|
|
|
|
Source: Eurostat and ECB as of 4-2-2020, where available; European Commission for forecast figures (Winter forecast 2020 for real GDP and HICP, Autumn forecast 2019 otherwise)
|
|
|
2.
Progress with country-specific recommendations
Since the start of the European Semester in 2011, 59% of all country-specific recommendations (CSRs) addressed to France have recorded at least “some progress” while 27% of these CSRs recorded “limited progress” or “no progress” (see Graph 2.1). Major reforms have been adopted in the field of vocational education and the training system, the functioning of the labour market and business environment.
|
Graph 2.1:Overall multiannual implementation of 2011-2019 CSRs to date
|
|
|
|
Source: European Commission
|
On public finances, despite the reduction over the years, in a low interest rates environment, public deficit remains high and public debt keeps on the rise. Efforts have been made to control public spending dynamics at all levels of public administration. However, significant tax cuts carried out in parallel have hampered a faster fiscal consolidation, which is now on the back burner until the end of the presidential term and beyond. Although falling, in 2018, the level of general government expenditure, at 56% of GDP, remained the highest in the euro area and the EU as a whole (47% and 45.8%, respectively). So far, the contribution of the spending review in the framework of the broader Public action 2022 programme lacks proper quantification and as such its macroeconomic impact cannot be assessed (see Section 4.1). In turn, the reform of the pension system, originally envisaged for 2019, has been put off and is now planned for adoption by the end of 2020. According to the information available, the main objectives of the reform appear in line with the CSRs addressed to France.
Action has been taken to improve the functioning of the labour market and reform of the vocational education and training system. The functioning of the labour market has been reformed in 2016 and 2017 to incentivise hiring on permanent contracts and revise collective bargaining and social dialogue. An important reform of the vocational education and training system has been implemented since 2018. It addresses major challenges such as the need to increase access to training for low skilled and improve the labour market relevance and quality provided by the vocational education and training system. However, the most vulnerable categories of workers (young, low-qualified workers, and people with a migrant background) are at a disadvantage in terms of labour market access. Specific initiatives to increase their employment opportunities are being implemented while persisting difficulties and inequalities continue to affect people with a migrant background (See Section 4.3).
Efforts to improve the business environment are mixed. France has implemented a range of reforms covering measures to facilitate firms’ growth (PACTE Law in 2019), simplification of the taxation system (ESSOC Law in 2018) and reducing restrictions in the services sector (‘Macron Law’ in 2015). However, the level of regulatory restrictions in services remains high and barriers to entry (see Section 4.4) leading to low competition persist. In addition, limited progress has been made to address the high level of taxes on production (see Section 4.1) weighing on companies.
There is also room to improve investment-related economic policy. France has made some progressed in focusing investment to ensure the energy transition and to improve its digital infrastructure. However, there is a need to simplify the overall research and innovation ecosystem. Recent evaluations of the R&D tax incentive (CIR) point to a limited impact of the instrument on innovation and productivity (see Section 4.4). The assessment of this CSR does not take into account the contribution of the EU 2021-2027 cohesion policy funds ().
In 2019, France has made some progress (
) in addressing the country specific recommendations (see Table 2.1). Substantial progress has been made in implementing the measures to foster the growth of firms. Some progress has been made in addressing skills shortages and mismatches, focusing investment to ensure the energy transition, improving the digital infrastructure and continuing the simplification of the tax system. Limited progress has been made in reforming the pension system, fostering integration on the labour market and ensuring equal opportunities, improving the research and innovation performance and reducing regulatory restrictions. There has been no progress in further specifying and implementing concrete measures of Public action 2022 programme.
Upon request from a Member State, the Commission can provide tailor-made expertise via the Structural Reform Support Programme (SRSP) to help design and implement growth-enhancing reforms. Since 2017, such support is being provided to France through the progressive deployment of seven projects. The Commission is providing the authorities with support to foster the development of a strategic department, to improve digital interoperability in pensions’ payments, to design and evaluate innovative interventions for specific diseases (HIV and hepatitis C), to facilitate the implementation of France's housing policy and to raise awareness about the issue of financial mis-selling.
|
|
|
Table 2.1:Assessment of 2019 CSR implementation (*)
|
|
|
|
Source: European Commission
(*) The assessment of CSR 3 does not take into account the contribution of the EU 2021-2027 cohesion policy funds. The regulatory framework underpinning the programming of the 2021-2027 EU cohesion policy funds has not yet been adopted by the co-legislators, pending inter alia an agreement on the multiannual financial framework (MFF)
|
|
|
|
Box 2.1: EU funds and programmes to address structural challenges and to foster growth and competitiveness in France
France is benefiting from EU support. The financial allocation from the EU Cohesion policy funds (
I
) for France amounts to €28.5 billion in the current Multiannual Financial Framework, equivalent to around 0.2% of the GDP annually. By the end of 2019, some €25.9 billion (around 91% of the total amount planned) were allocated to specific projects, while €11.9 billion were reported as spent by the selected projects (
II
), showing a level of implementation above the EU average.
While bringing about a more harmonious development through reducing economic, social and territorial disparities, EU Cohesion policy funding also supports structural challenges in France. The Cohesion policy programmes have allocated €4 billion for smart growth, €3.5 billion for sustainable growth and sustainable transport and €6.7 billion for inclusive growth. In 2019, following a performance review (
III
) €1.4 billon have been made available for France within performing priorities.
EU Cohesion policy funding is contributing to transformations of the French economy by promoting growth and employment via investments, among others, in research, technological development and innovation, competitiveness of enterprises, sustainable transport, employment, labour mobility, skills and social inclusion. By 2019, investments driven by the European Regional Development Fund (ERDF) have already led to connect to high speed broadband more than one million households, over 1,600 new researchers have been recruited, and support was already decided for 162,000 enterprises including 48,500 start-ups, generating 36,880 new jobs. The European Social Fund (ESF) supported the labour market integration of job seekers including through access to training and counselling. By 2019, the social inclusion of 900 000 persons was supported. European structural and investment (ESI) funds contributed to the reduction of greenhouse gas emissions by four million tons of CO2. As an example, the COMPETITIV´eko project is promoting cross-border cooperation and knowledge exchange between SMEs, business clusters, technological centres and economic development agencies in the Basque Country and Navarre in Spain, and Nouvelle Aquitaine in France. Aimed at boosting the competitiveness of companies with few resources, it focuses on areas within the regions’ smart specialisation strategies. This will enable each region to develop its own competitive advantages where common interests exist.
Agricultural and fisheries funds and other EU programmes also contribute to addressing investment needs. The European Agricultural Fund for Rural Development support for €16.6 billon including national co-financing, mainly to support agri-environmental and climate type of measures, which aim to improve biodiversity, water quality and soil protection. The European Maritime and Fisheries Fund contributed to the tune of €774 million. France also benefits from other programmes, such as the Connecting Europe Facility, which allocated EU funding of €1.9 billion to specific projects on strategic transport networks, and Horizon 2020, which allocated €5.1 billion (benefiting to 1,129 SMEs for a total of €719 million).
EU funding contributes to mobilise private investment. By allocating about €650 million as loans, guarantees and equity, European and Structural Investment Funds supported programmes alone mobilised additional capital (
IV
). These are expected to leverage additional private investment of about €890 million.
EU funds already invest in line with the Sustainable Development Goals (SDGs). In France European Structural and Investment Funds support 14 out of the 17 SDGs and up to 98% of the spending is contributing to these goals.
|
3.
Summary of the main findings from the MIP in-depth review
The 2020 Alert Mechanism report concluded that a new in-depth review should be carried out for France to assess the persistence or unwinding of the imbalances (European Commission, 2019b). In February 2019, France was identified as having macroeconomic imbalances (European Commission, 2019). In particular, these related to high public debt and weak competitiveness dynamics, in a context of low productivity growth. This chapter summarises the findings of the analyses in the context of the macroeconomic imbalance procedure (MIP) in-depth review that is contained in various sections in this report* (
).
Imbalances and their gravity
Developments on French competitiveness continue to be mixed. In recent years, export market shares remained flat after years of losses. Comparing export performance against other advanced economies (
), France’s total export market shares fell slightly over the last five years. The current account balance has been recording only small deficits for a number of years, yet remaining below values implied by fundamentals, which would suggest a marginally positive reading. The net international investment position (NIIP) remained broadly constant, reaching -16.4% of GDP in 2018, when fundamentals would point to something slightly positive.
General government debt is high. In 2018, the French general government debt-to-GDP ratio remained stable at a high level, namely at 98.4% of GDP. However, according to the Commission 2019 autumn forecast, France’s public debt is set to have risen to almost 99% of GDP in 2019 and to increase further in the next two years. This means that the recent economic expansion has not been accompanied by fiscal consolidation.
Private debt is also high and increasing more or less continuously since the early 2000s. In particular, it reached almost 149% of GDP in 2018. Both households and non-financial corporations contributed to this ratio.
Competitiveness and productivity weight on France's economic growth, which in turns impacts debt burdens and deleveraging. Cost competitiveness has been a concern and non-cost competitiveness has also been dampened. Low productivity growth has also affected France, while the relevance of exports to GDP increased less than in the rest of the euro area.
The large size of the French economy can be a source of cross border spillovers to other EU Member States. France is an important trade and financial partner for many EU Member States and in particular to neighbouring countries (see Table 3.1). Box 3.1 provides a quantitative estimate of how an increase of public investment in France can have positive effects on its own domestic GDP and relevant spillovers to other Member States.
Evolution, prospects and policy responses
Fiscal consolidation is on hold. The 2020 budgetary plan does not outline any fiscal consolidation progress for 2020. The reform to unify the different pension schemes currently co-existing, originally announced for 2019, has been postponed, and the impact of actions aimed at achieving meaningful expenditure savings and efficiency gains across all sub-sectors of government under the Public action 2022 programme, have not yet been specified. Macro prudential instruments to limit banks’ exposure to highly indebted large non-financial corporations and to increase banks’ capital buffers to make them more resilient to periods of stress have been introduced.
Cost competitiveness has remained broadly stable over the past year, although some indicators measuring the evolution over a longer period have to be closely monitored. In 2018 alone, unit labour costs increased by 1%, resulting from the combined effect of a moderate increase in real wages and the low labour productivity growth. Growth in nominal unit labour costs, based on the three-year indicator up to 2018 was more contained than in the rest of the EU average despite having accelerated slightly, reaching 2.4%. The real effective exchange rate (REER) appreciated by 4.5% between 2015 and 2018, reflecting much of the euro appreciation after the marked 2015 depreciation. However, in 2019 some nominal depreciation was again observed (as in other euro area countries). In terms of non-price competitiveness, while French exports of goods are overall of medium-high quality, France continued to maintain the highest quality in the sectors in which it specialises, such as aeronautics, cosmetics and beverages.
Several initiatives have been adopted to improve the business environment. The PACTE law (Loi relative à la croissance et la transformation des entreprises) was adopted in May 2019 to foster the growth of firms. Measures were announced in some specific services sectors to increase competition and moderate prices. The services in which measures have been already adopted include the sale of automotive spare parts, driving schools and health insurance. Efforts to streamline the tax system are ongoing (Loi pour un Etat au service d’une société de confiance, ESSOC’). In terms of innovation performance, diagnostics of the R&D tax credit (Crédit Impot Recherche) were proposed but they need to be extended to include the macroeconomic impact. On digitalisation, the French government unlocked €3.3 bn to boost additional private investment in rolling out ultra-fast broadband across the country.
|
|
|
Table 3.1:Outward spill-over heat map
|
|
|
|
Source: IMF, OECD, TiVa, BIS and Commission services
|
|
|
Adopted and announced labour market reforms are going in the right direction, but their benefits will take time to fully materialise. Reforms aim to increase the labour participation of specific groups and to increase the overall skills of the labour force. In this regard, French workers earning close to the minimum wage have been supported by a significant increase in their in-work benefits (prime d’activité). The unemployment benefit reform, implemented since November 2019, modifies eligibility criteria and introduces specific sectoral incentives and disincentives for employers if they use short-term contracts. To improve the efficiency of social benefits, the government is planning to merge different ones into a universal activity income (Revenu universel d’activité). The link between training, labour market and needs of firms has also been improved, with firms being able to have their own learning centres for apprenticeships (See Section 4.3).
Overall assessment
France is characterised by high indebtedness and still weak, although stable competitiveness, in a context of low productivity growth. Despite stable export market shares and a continuing small current account deficit, low productivity growth still weighs on French competitiveness. France’s general government debt remains high and is set to rise somewhat further in the following two years. Risks stemming from high public debt are compounded by high and increasing private debt.
France has introduced ambitious reforms while public expenditure remains high. France has taken further ambitious measures, notably in the areas of business environment, labour market and apprenticeship and vocational education. These reforms will take time to fully materialise and will require close monitoring. As for public finances, fiscal consolidation efforts have been put on hold and the current budgetary strategy does not guarantee a reduction of the high public debt.
|
|
|
Table 3.2:MIP Assessment Matrix (*)
|
|
|
|
|
|
(Continued on the next page)
|
|
Table (continued)
|
|
|
|
|
|
Source: European Commission
|
|
|
|
Box 3.2: Euro-area spillovers
Simulations with the European Commission’s QUEST model (
V
) illustrate the size of the potential domestic impact and potential spillovers to other euro-area countries. Following the 2019 Country-specific recommendations on investment-related policy measures, the Commission QUEST model is used for a standardised simulation exercise to assess the potential theoretical domestic and cross-border impact resulting from a public investment package. The standardised scenario displayed in this box is based on an increase in the public investment level in France by 1% of current GDP over 10 years(
VI
) under the working hypothesis that this increase in public investment is financed by an increase in the consumption tax by 1% of current GDP, assuming ex-ante budget neutrality. Given that public investment has positive output effects, the ex-ante budget neutrality imposed in the simulation turns into an ex-post improvement in the government primary balance, mainly linked to positive tax base effects. Monetary policy is assumed to remain constrained at the zero bound for 6 quarters, after which the constraint is phased out gradually.
A sustained increase in public investment would have a positive domestic impact on GDP and cross-border spillovers. The simulation suggests a positive impact on the level of French real GDP of around 0.6% in the first year, increasing gradually to reach a cumulative impact of 1.6% after 10 years (see table below). This positive impact originates from the positive effect of public investment on productivity. In addition, the expected impact on the real GDP of the rest of the euro area would approximately amount to 0.3%, representing an initial spillover of half the domestic impact. This spillover effect is driven by an increased external demand and by higher domestic demand originating from the temporary decline in the real interest rate.(
VII
) The GDP spillover to the rest of the euro area weakens once the real interest effect has vanished, but it remains positive also in the longer term. While this standardised exercise assumes a domestic impact of a national public investment program, the overall impact on the euro area could be potentially higher in the case of a coordinated investment program at the euro area level.

Note: Results in % or pps (Trade balance and government debt) deviation from baseline.
Source: European Commission
|
4.
Reform priorities
4.1.Public finances and taxation*
Deficit developments
After a temporary rebound in 2019, the French general government deficit is set to stabilise at 2.2% of GDP until 2021. In 2018, the general government deficit decreased to 2.5% of GDP. However, the structural deficit remained high (at 2.7% of GDP), confirming no structural improvement since 2015 and considerably far from France’s medium-term objective of -0.4% of GDP (see Graph 4.1.1). The headline deficit is set to pick up to 3.1% of GDP in 2019. The increase above the 3% threshold is however small and temporary, due to the one-off impact of the transformation of the tax credit for employment and competitiveness (CICE) into a permanent reduction in employers’ social contributions, with no impact on the structural deficit. According to the Commission 2019 autumn forecast, public deficit is projected to decline to 2.2% of GDP in 2020, mainly due to the fading of this one-off impact, and to remain at that level in 2021.
|
Graph 4.1.1:Fiscal effort and public debt
|
|
|
|
Source: European Commission. Ameco database
|
Fiscal consolidation has been put on hold and public debt remains on the rise. The consolidation strategy over the current presidential term was outlined in the multiannual public finances programming law for 2018-2022. However, since its initial adoption in 2018, consolidation targets have been progressively back-loaded. While the objective to reduce the tax burden by one percentage point by the end of the presidential term is almost already achieved, reducing government expenditure is proving much slower. As a result, the original objectives of cutting the deficit by more than 2 percentage points and reducing debt by more than 5 percentage points by 2022 have been considerably scaled down. The 2020 draft budgetary plan does not outline any progress in terms of fiscal consolidation in 2020. Moreover, the underlying reduction of the expenditure-to-GDP ratio is, largely, due to the planned decline in public debt servicing costs. This is broadly confirmed by the Commission 2019 autumn forecast, which projects only a slight improvement in the structural balance, of 0.1 pps., in 2020 (
), and no structural effort in 2021. This is insufficient to put public debt on a steady downward trend.
New measures, mainly tax cuts, aimed at further enhancing household’s purchasing power are envisaged for 2020 (see Box 4.1.1). The measures adopted at the end of 2018 in response to the ‘Gilets jaunes’ movement, aimed to improve households’ purchasing power, entailed a net deficit-increasing impact of around 0.3% of GDP in 2019. Additional measures taking effect in 2020 were adopted in response to this movement and following the conclusion of the broad national debate (Grand Débat National) in April 2019. These include a permanent €5 bn reduction in personal income tax (0.2% of GDP), reviewing the indexation of pensions below €2,000 per month, and the increase in minimum pensions (together reaching €1.5 bn, or 0.1% of GDP).
The fiscal strategy on the spending side relies on control of public expenditure dynamics and growth-friendly spending programmes. After the unprecedented decline in real terms by 0.3 pps.in 2018, according to the 2020 draft budgetary plan, public expenditure in nominal terms, net of tax credits, is set to rise by 2.1% and 1.8% in 2019 and 2020, respectively. These imply increases in real terms of 1.1% and 0.6% in the same years. The government has given high priority to programmes aimed to promote long-term growth. Under the current five-year great investment plan (Grand Plan d'Investissement), the priorities are to (i) accelerate ecological transition, (ii) create a skill-based society, (iii) foster competitiveness and innovation, and (iv) achieve the digital transformation of the public sector (See Section 4.4).
Social protection and healthcare represent more than half of total public expenditure. At 56% in 2018, the ratio of public expenditure over GDP in France remains the highest in the EU. Social protection remains the biggest ticket item, accounting for almost 43% of total government expenditure in 2018. Expenditure on healthcare and education, key to increase human capital, represented 14.5% and 9.1% of total public spending, respectively. In turn, expenditure on general public services and on economic affairs amounted to 11.0% and 10.2% of the total, respectively. The latter includes, among others, expenditure on transport, energy, on general economic, commercial and labour affairs and on research and development.
Debt sustainability analysis and fiscal risks (
)
Despite general government debt stabilising in 2018, it is projected to rise further until 2021. The public debt ratio, at 98.4% of GDP, remained broadly stable in 2018 compared with 2017. However, according to the Commission 2019 autumn forecast, the public debt ratio is set to rise by 0.5 pps. in 2019. In 2020, public debt is forecast to remain at 98.9% of GDP, before rising again to 99.2% in 2021. Upward revisions to the deficit, also due to the measures put forward by the government in response to the ‘Gilets jaunes’ movement at the end of 2018 and in April 2019 after the broad national debate (Grand Débat National) entailed deficit-increasing effects for 2019 and 2020 that have prevented public debt from entering a declining trend. Therefore, public debt is set to remain at high levels, widening the gap with the euro area, where overall public debt is projected to decline by almost 6 pps to 84.1% of GDP between 2018 and 2021 (see Graph 4.1.2). Such a divergent trend is explained by the persistent French primary deficits projected over the forecast horizon, as opposed to primary surpluses for the euro area average.
|
Graph 4.1.2:Public debt in France and in the euro area
|
|
|
|
Source: Ameco database, European Commission 2019 autumn forecast.
|
In spite of the high public debt ratio, no material short-term sustainability challenges are observed. Short-term sustainability risks are assessed by the indicator S0 (
). For France, the overall S0 indicator flags no significant risk. However, the short-term fiscal sub-index indicates high risk, with some increasing vulnerabilities with respect to previous years, linked to the persistent, relatively high cyclically-adjusted deficits and the increase of already high public debt. In any case, the overall absence of any material short-term risk remains confirmed by the ‘AA stable’ rating given by the three major rating agencies to French government debt. Short-term risks are mitigated by the diversification of the investors’ base and the long average maturity of total outstanding debt, that has increased to around 8.2 years in 2019. In turn, the share of non-resident holders of government debt securities, which is evenly distributed between euro area and non-euro area residents, has slightly increased to around 55% in 2019.
Medium-term sustainability risks remain high. According to the debt sustainability analysis baseline scenario, at unchanged policies, the public debt ratio is projected to fall by some 2 pps. until 2030, the last projection year, when public debt would stand at 96.8% of GDP. This decline is due to an increasingly larger debt-reducing snowball effect (e.g. the difference between the implicit interest rate on government debt and the nominal growth rate of the economy) that more than offsets the projected high primary deficits, aggravated by the increase in age-related expenditure over the projection period (see Annex B). The S1 sustainability indicator (
), which measures sustainability risks over the medium term, indicates a high medium-term risk, mainly due to insufficient fiscal effort to reduce public debt to 60% of GDP.
An improvement in the structural primary balance is required to progressively reduce public debt. The S1 sustainability indicator shows a sustainability gap of 3.9 pps. of GDP. Most of the required adjustment (3.4 pps.) relative to the baseline scenario is attributable to the debt ratio’s distance from the 60% reference value and 0.4 pps. to the projected increase in age-related public spending. The sustainability gap has reduced by more than 1 point with respect to 2019 spring’s projections due to more favourable interest rate assumptions, which more than offset the effect from lower projected nominal growth and higher primary deficits. Under these conditions, a marginal improvement in the structural primary balance is enough to stabilise the public debt ratio. However, public debt projections are particularly sensitive to interest rate and growth assumptions. Adverse assumptions on these two variables would lead to significantly higher debt ratios after 10 years (see Graph 4.1.3).
|
Graph 4.1.3:Public debt projections in France
|
|
|
|
Source: European Commission. 2019 DSM
|
France is deemed to be at medium fiscal sustainability risk when assessed over the next 50 years. The long-term fiscal sustainability indicator S2 (
) shows that an improvement of the structural primary balance of only 0.2% of GDP would be required to stabilise the debt-to-GDP ratio over the long-term. This low value is due to the favourable demographics that help mitigate sustainability risks. Age-related expenditure is projected to decrease by 1.9 pps. of GDP over the next 50 years. This is due to the projected decline in public pension expenditure by 2.2 pps. of GDP, whereas healthcare and long-term care spending are projected to rise only moderately, by 0.3 pps. and 0.5 pps. of GDP, respectively. The projected healthcare expenditure stands below the EU average increase of 0.9 pps. of GDP. Despite the low S2 indicator, the implied fiscal adjustment might lead to debt stabilising at high levels, for which this indicator should be taken with some caution for high-debt countries. Moreover, the vulnerabilities linked to the high debt burden as captured by the debt sustainability risk assessment suggest that French public debt might be facing a medium sustainability risk over the long term. More adverse scenarios involving more dynamic healthcare and long-term care spending would imply a significant increase in sustainability gaps.
The healthcare reform is not projected to entail any material impact on overall fiscal sustainability. The 2022 my health plan (Ma Santé 2022) to improve access to healthcare will require €3 bn of investment on restructuring of care, digital health, training and hospital investment, accompanied by an increase in current expenditure growth standard ONDAM (Objectif National de Dépenses d'Assurance Maladie) from the originally planned 2.3% to 2.5% in 2019. The impact on the fiscal sustainability of the French health system is likely to be small, around one point of GDP total higher expenditure by 2070. However, given the scale of investment, the impact on current healthcare expenditure might be larger than planned.
Pensions
The pension reform, originally announced for 2019, has been put off and is expected to be adopted in 2020. This reform intends to introduce a universal points-based system, replacing the current 42 co-existing pension regimes. According to announcements, the new system aims to calculate the pension rights over the whole career for all categories of workers. It also aims to introduce a single definition for the labour revenues to be used to calculate pension contributions. This would include bonuses for the public sector and the special regimes, which should be gradually phased out. A minimum pension would be guaranteed at 85% of the minimum wage (Salaire minimum interprofessionnel de croissance, SMIC) for those with full careers, currently at around €1,000. Solidarity points are planned to compensate for certain situations such as sickness, unemployment or maternity, among others. While the minimum legal retirement age is set to remain at 62, the new system could include incentives to work longer. New entrants into the labour market in 2022 would contribute directly to the new system and the first generation concerned by the reform should be those born in 1975. For those already in the current system, only the years contributed after 2025 would be calculated under the new system. The draft law was sent to parliament on the 24 of January. Its adoption is planned for 2020 for implementation as of 1 January 2022.
Social partners would be responsible for guaranteeing the financial equilibrium of the pension system. Following some social unrest in response to the reform, the government engaged in new broad consultations with social partners and stakeholders to gather the broadest consensus possible. According to announcements, the return to balance of the pension system should be reached in 2027. To this end, social partners have been entrusted to propose a path back to balance in spring 2020. Under the new pension system, social partners, subject to parliamentary control, would be in charge of evaluating the value of the points to calculate pension benefits and, more generally, of guaranteeing the financial balance of the system. The new indexation framework, possibly linked to wage developments, could be more favourable to pensioners than the current one linked to inflation.
Healthcare
There is room for efficiency gains in the healthcare sector. Traditional inefficiencies in the French health system, such as concentration on hospital care and a low share of generics in pharmaceutical sales, have been improving in recent years, but still lags behind most Member States. Total spending was estimated at 11.3% of GDP in 2017, the highest in the EU along with Germany. Still, in terms of per capita spending, adjusted for differences in purchasing power, France stands 6th highest in the EU. Even if the annual objective for spending growth in healthcare (Objectif National de Dépenses d’Assurance Maladie, ONDAM) has been met since 2010, the ONDAM target was increased three times since 2017 and made less demanding for 2018-2020. In particular, the target was set at 2.1%, 2.3% and 2.5% in 2017, 2018 and 2019, respectively. The ONDAM is set at 2.45% for 2020, compared to an initial target of 2.3% (
). The share of healthcare prevention expenditure has traditionally been among the lowest in the EU (1.86% in France in 2017 compared with 3.1% in the EU).
France is experimenting new payment methods for more efficient and effective primary and hospital healthcare. The new methods entail greater financial incentives for quality and care coordination between the providers, giving less weight to activity-based payments and discouraging an overprovision of care. An extension of the new methods is foreseen from 2020 onwards.
Fiscal framework
The French fiscal framework has improved since the early 1990s. This development was gradual as reflected by the dynamics of two fiscal governance-related indices developed and maintained by the European Commission, the fiscal rules and the medium-term budgetary framework indices (see Graph 4.1.4). In line with EU legislative initiatives, the France’s fiscal rules index considerably improved during 2011-2014. Medium-term fiscal policy-making has become significantly stronger since 2006. However, some areas such as the link between the annual budget and the multiannual budgetary targets, the involvement of the national independent fiscal institution in preparing medium-term budgetary plans and the level of detail in the medium-term plans lag behind. In its September 2019 report on the implementation of the 2001 Organic Law on Finance Laws, the French National Assembly made at least five recommendations related to multiannual budgetary planning to address issues in the budgetary calendar and the annual and public finances programming bills.
Despite the improvement of the overall fiscal framework, its implementation does not seem to have been effective. In particular, its medium-term budgetary dimension does not seem to have been an anchor for annual budgets.Moreover, the reputational cost for not meeting medium-term plans is low. French medium-term budgetary plans have been volatile: targets set in the public finances programming bills and in the successive stability programmes lost their initial ambition, both in nominal and structural terms. The annual finance bills have systematically loosened the structural balance targets for the following year. In particular, in its two latest opinions the High Council for Public Finance (Haut Conseil des finances publiques, HCFP) underlined that the distance to the targets for 2018 and 2019 set in the latest programming bill is at 0.4 pp of GDP. The opinion of the HCFP on the draft settlement bill for 2019 will confirm whether the threshold of 0.5 pp was reached and if the correction mechanism is triggered for the first time. The headline and structural balance outturns have been at the bottom end of the medium-term targets, leaving little room for manoeuvre to accommodate fiscal risks.
|
Graph 4.1.4:French fiscal rules and MTBF indices vs EU average
|
|
|
|
Source: European Commission
|
Public action 2022
Measures are being taken to improve the quality of services and the modernisation of the administration. Over the first two years of implementing the Public action 2022 programme, launched in October 2017, the government has followed up on the objective to overhaul the public administration in the medium to longer term. Some of the measures proposed by an ad hoc committee of experts (Comité Action Publique 2022) (
) have been fully or partially addressed. Each ministry regularly updated and continued to implement the 2018 internal transformation plans. The government has also engaged in a series of reforms to increase the efficiency, transparency and accessibility to public services. Areas of intervention include reforming the civil service to improve human resources management, streamlining internal expenditure controls and procedures, simplifying rules, rationalising and relocating services at the central and local level and accelerating the deployment of IT solutions across the board. The reform strategy was further promoted, in June and November 2019 in the conclusions of the inter-ministerial committee of public transformation (Comité interministériel de la transformation publique, CITP) (
), which reflect the results of the broad national debate concluded in spring.
|
Graph 4.1.5:Structural Balance targets versus outturns
|
|
|
|
Source: European Commission
|
Although efficiency gains can be expected from its implementation, the contribution of Public action 2022 programme to the objective of reducing public spending remains unclear. Together with improving the quality of public services and modernising the public administration, support to cutting public spending by more than 3 percentage points of GDP over the presidential term is one of the three overarching objectives of the programme. However, how this last objective is to be met is not at all clear and its fulfilment appears incidental. Namely, the programme does not quantify upfront the expected savings and macroeconomic impacts. Yet, as of 2018, it formally and fully replaces annual spending reviews. Despite strong commitment at the highest political level and a regular, well-structured monitoring of progress in the reforms, comprehensive scrutiny of the implications of the programme on the size and composition of public expenditure is lacking. Moreover, in cases where information on potential savings is available for some of the measures envisaged, these savings are limited and their trajectory over time is not specified in sufficient detail. At the same time, some of the measures or reforms undertaken might actually imply an increase in spending, at least in the initial phase. Overall, it is still not possible to single out the specific contribution of the Public action 2022 programme to France’s fiscal consolidation strategy.
Green budgeting
France stands out among other EU Member States for the steps taken to develop green budgeting and assessing the consistency between budgetary tools and environmental objectives. In December 2017, France launched the Paris Collaborative on Green Budgeting, together with the OECD and Mexico, which aimed at steering discussions and the search for solutions to align national fiscal frameworks with climate and environmental goals. In May 2019, France established the High Council for Climate (Haut Conseil pour le Climat), an independent body reporting to the French Prime Minister and providing advice to the government on climate issues. A further step was taken in 2019, with the publication of a new ‘yellow book’, which is an annex to the draft budgetary law for 2020. The annex replaces three previous annexes to the draft budget and aims to align the definitions and methodologies adopted so far for presenting separately expenditure on climate, energy and the environment. As such, it is an important first attempt to provide information on the green content of the budget in a comprehensive and consistent way. The annex maps expenditures beyond the ones explicitly budgeted for environmental purposes, providing a broader scope to the exercise and a more realistic overview of budgetary compliance with environmental commitments and goals. Overall, environmental expenditure in the 2020 draft budget amounts to more than €16 bn (0.7% of GDP).
The government announced its intention to prepare a ‘green budget’ as of the presentation of the draft budget law for 2021. In September 2019, the General council for the environment and sustainable development (Conseil général de l'environnement et du développement durable, CGEDD) and the General inspectorate of finance (Inspection Générale des Finances, IGF) published a report commissioned by the government that aimed at developing a new methodology to identify green ticket items within the budget (CGEDD, 2019). This methodology, different from the one used in the annex to the draft budget for 2020, is a further step forward and, despite some inherent limitations requiring further research, it could represent the reference for a well-established green budgeting practice. It introduces a specific way to classify and assess across several environmental dimensions the impact of budgetary actions within different policy programmes. Based on this methodology and data from last year’s draft budget law, the IGF-CGEDD report identifies overall environmental revenues for about €35 bn (1.5% of GDP) in 2017 (
) and €55 bn (2.3% of GDP) of non-neutral environmental expenditures (
) in the draft budget for 2019. Following the publication of the report, the government launched a broad public consultation to address unresolved methodological issues and create the broadest consensus possible regarding the approach to follow to prepare a green budget next year. Developments in this area will continue to be closely monitored, including France’s compliance with its broader sustainability objectives (see Section 4.5).
General tax structure
The overall tax-to-GDP ratio remains the highest in the EU (46.5% in 2018 vs. 39.2% in EU on average). More than half of total tax revenues come from labour taxation (23.9% of GDP in 2018 vs. 19.6% in EU on average) and revenues from capital taxes (
) are slightly higher in a cross-country comparison (10.8% of GDP in 2018 vs. 8.5% in EU on average (
)). Revenues from environmental taxes are close to the EU average, leaving some scope to be used more extensively. France also stands out because of its high level of taxes on production.
Complexity of the tax system
France continues to take steps to address the complexity of its tax system (European Commission, 2019d). The withholding tax on personal income was implemented in 2019. First results of the ESSOC law (Loi pour un Etat au service d’une société de confiance) show that companies are slowly taking advantage of the new support available to facilitate their tax compliance and secure the tax treatment of their operations. Since the adoption of the law, 27 tax partnerships have been successfully concluded with multinationals and medium-sized companies worth a total turnover of €280 bn with positive feedback from those companies. Nearly 1600 SMEs have been approached and 54 started using the support offer. French authorities plan to increase their efforts to reach out to a more substantial number of SMEs. Support was also made available to resolve a few conflicts between groups resident in France and foreign tax administrations.
The 2020 Budget Law suppresses 18 low yield taxes and phases out several tax expenditures benefiting to businesses. In particular, reduced rates on energy products (
) (Taxe intérieure de consommation sur les produits énergétique, TICPE) as well as employers’ social contributions in specific sectors (construction, cleaning services and aviation) are planned to be eliminated in 2020 (
). In response to a recurrent recommendation of the Court of Auditors, the Government announced an evaluation programme of 70 tax expenditures for 2020-2023.
Corporate taxation
The corporate income tax rate is decreasing for all firms in 2020. The government stands by its objective to reach a 25% tax rate by 2022. The statutory corporate income tax rate has been lowered from 31% to 28% for firms with turnover below €250 mn and from 33.3% to 31% for the remaining firms. A 28% rate for the first €500,000 profits also applies. The debt equity bias remained the highest in the EU at 3.8 pp in 2018 (
).
Other taxes on production continue to weigh on businesses (European Commission, 2019d). Taxes on production stood at 3.2% of GDP in 2017, above Italy (1.6%), Spain (1%) or Germany (0.4%) (OECD, 2019a). The French Economic Council (Conseil d’Analyse Economique, CAE) warned on their negative impact (Conseil d’Analyse Economique, 2019a), since such taxes distort companies’ decisions (production method, investment choice, pricing etc.) which may be detrimental to productivity and competitiveness. According to CAE, removing the tax on turnover (Contribution sociale de la solidarité des sociétés, C3S) should be a priority. This tax, established in 1970, contributes to the financing of the social security system. A tax on turnover has a "cascade" effect since each successive turnover includes the taxes of all previous turnovers. Since 2014, this tax has undergone several reforms that have increased its eligibility threshold (turnover) from €760,000 in 2014 to €19 million in 2016 resulting in a revenue reduction of around 30% since 2013. In its current design, the French Parliament estimated that only 20,000 very large and international companies are eligible to the tax compared to 296,000 in 2014.
However, removing such taxes has proven to be particularly sensitive given budgetary constraints and diverging objectives. Among other functions, the C3S ensures a minimum contribution from multinational enterprises, which tend to face a low effective tax rate. Ongoing negotiations at OECD/G20 aim to find an agreement on a minimum effective taxation for corporate income by end of 2020. If a global solution is found, it may help discussions on a possible phase out of the C3S. French authorities have planned to decrease taxes on production with the “Productive Pact” (Pacte Productif) (see Section 4.4.4). Cuts could be offset by a decrease of harmful environmental tax expenditures.
Taxes on capital
While it is too early to assess the impact of the reform of capital taxation (
) on investment, first results point to an increase in the attractiveness of France. Researchers (France Stratégie 2019a, IPP2019a) consider it is too early to conclude whether the reform is bearing fruit on investment, as not enough data will be available until 2021. At the same time, the study underlined that in the year the reform was announced (2017), the number of wealthy households leaving France fell sharply to 376, the lowest since 2004 (
). The Monitoring Committee on capital tax reforms concluded that in 2018 the real estate wealth tax (Impôt sur la fortune immobilière, IFI) collected 29.5% of what the wealth tax (Impôt sur la fortune, ISF) would have collected in 2018, a cost of €3.1 billion to the budget. The ISF taxpayers have gained €6,500 on average per year.
These reforms seem to have improved foreign investors’ perception of France. Foreign investments in SMEs have increased: capital investment funds invested €18.7 billion in 2018, against €16.5 billion in 2017, in SMEs, with a share of foreign investors of 48% in 2018, compared to 31% in 2017.
The flat tax on dividend income has created a gap between capital and labour taxation and decreased dividends taxation. Dividend income is 6.4 p.p. less taxed than labour income for earners above €162,000 per year in 2018 (IPP, 2019b). Such gap is expected to widen with the decrease of the corporate income tax rate and reach 10.1 p.p. in 2022. Establishing anti-abuse rules may help to limit distorsionary effects, such as requalifying labour income into capital income. Empirical studies in France (IPP, 2019b), the United States (Yagan, 2015) and Sweden (Alstadsæter, 2017) showed that lower taxes on dividends had little effect on investments, but increased dividend distribution. Accordingly, in 2018, dividends paid to French tax residents progressed by 60% to reach 2012 levels, last year before the suppression of the flat tax.
The housing tax on the main home will be abolished for all households and the financing of local authorities is reformed. In 2020, the housing tax will be entirely cut for 80% of households. The 20% richest households will cease to pay it in 2023, with a gradual decrease as of 2021. From 2021, the revenues from the immovable property tax part of the territorial authorities (départments) will be transferred to the local authorities (communes) and a part of VAT revenues will be allocated to the ‘départments’ to compensate for the transfer.
Taxes on labour
Important tax reforms seek decreasing the high tax wedge on labour for average-wage earners. Sizeable employer social contributions make up the lion’s share of the tax wedge on labour for average income earners (the tax wedge amounts to 47.6% in 2018 vs. 42.8% in EU on average). To consolidate the decrease of the tax burden on labour, the tax credit for employment and competitiveness (CICE) has been replaced in 2019 by a permanent reduction in employers’ social security contributions. Moreover, in 2019 the government also introduced an exemption of employees’ social security contributions and of income tax (
) on overtime hours. As of 1 January 2020, it will also reduce personal income taxes for households in the first two tax bands by 0.2% of GDP. These measures should boost households' purchasing power.
Taxes on environment
There is scope to use more environmental taxation while taking into account social fairness and acceptability concerns. In 2018, environmental taxes were close to the EU28 average as a percentage of GDP and lower as a percentage of total taxation. France abandoned increasing the carbon component of the tax on motor fuels (TICPE) as of 1 January 2019, following the ‘Gilets jaunes’ movement (see Section 4.5).
|
Graph 4.1.6:Environmental taxes as percentage of total revenues from taxes and social contributions in France and the EU
|
|
|
|
|
|
Source: Eurostat
|
|
Graph 4.1.7:Environmental tax revenues as percentage of GDP in France and the EU
|
|
|
|
|
|
Source: Eurostat
|
|
Box 4.1.3: Assessing the redistributive impact of some measures favourable to households’ disposable income
Several measures aiming at improving households’ disposable income have been announced or implemented since mid-2017. This box aims at assessing the redistributive impact of some measures announced in December 2018 and in April 2019 following the social unrests at the end of 2018. To this end, the European Commission’s Joint Research Centre simulated four measures, using the microsimulation model EUROMOD (
VIII
) based on EU-SILC data (
IX
): (1) an increase in the in-work benefit activity premium which targets vulnerable working households; (2) a cancellation of the increase of the social tax CSG by 1.7 percentage points for pensions below €2,000 per month and subject to the normal rate of CSG ; (3) the re-indexation of pensions below €2,000 per month in 2020; (4) a targeted decrease in income tax for middle-income brackets. The first two measures were announced in December 2018 and implemented at the beginning of 2019. The remaining two were announced in April 2019, included in the 2020 DBP, and are set to enter into force in 2020. Other measures, such as the tax exemption (both income tax and social contributions) of overtime work income for employees or a tax-free bonus also aimed at increasing households’ disposable income are not assessed here.

Based on the EUROMOD simulations, those four reforms increase households’ equivalised disposable income by 0.9% on average (
X
). The first reform mostly benefit the lower middle-income households, while the last one mostly benefit the upper middle-income households, where the shares of taxpayers are higher (Graph 1). The second reform has a neutral impact on the most vulnerable households, as they were not subject to the increase of CSG in the first place. Finally, the third reform benefits all households with a pension below €2,000 per month. Overall, the equivalised disposable income of the 2nd and 3rd deciles is estimated to increase by 1.6% and 1.4%, compared to 0.6% and 0.2% for the upper deciles.
In terms of income redistribution, these measures are assessed to reduce poverty and have a slight progressive impact. The overall package is assessed to reduce the at-risk-of-poverty rate (below 60% of equivalised mean disposable income) by around 1 percentage point. This decrease is almost entirely due to the increase in the activity premium. The progressive impact of the first three reforms is only partly offset by the regressive impact of the reduction in income tax.
|
4.2.
Financial sector*
Banking
The French banking sector presents stable solvency, funding and credit quality ratios. The French banking sector presents stable solvency, funding and credit quality ratios. Return-on-equity remained at a similar level to previous exercises, at 6.5% at the end of 2018 (see Table 4.2.1). This was a little higher than the euro area average (5.7%) but lower than the typical cost of capital. As of June 2019, the capital adequacy ratio was slightly rising at 18.3% (v. 18.1% in the euro area), the non-performing loan ratio reached a new low at 2.6% (v. 3.4% in the euro area), and the loan-to-deposit ratio slightly increased to reach 106.7% (v. 97.2% in the euro area). Like in some other Member States, Basel III reforms are expected, once fully implemented, to lead to a significant increase in capital requirements (European Banking Authority, 2019).
The share of hard-to-value Level 2 and Level 3 assets does not seem to raise serious concern. Assets held for trading are classified in three levels depending on the progressive complexity to value them. Accounting rules (IFRS 13) oblige banks to report gross positions, which might be partly hedged against each other, and are therefore of very limited explanatory power compared to net positions. Gross level 2 and level 3 assets amount respectively to 17.2% and 0.9% of total assets of those French banks with such level 2 and 3 assets in their portfolio. In Germany, these figures read 18.7% and 1.6%, respectively. Given their complexity, those assets are rather concentrated in the bigger banks. The European Banking Authority stress tested the 48 biggest European banks’ Level 2 and 3 assets’ net positions in 2018. For 31 tested banks the impact on Common Tier 1 capital levels would be less than 20bp, 10 banks would see their CET1 ratio fall by 20-40bp, and only 7 banks would face a capital impact ranging from 73 to 40bp.
French banks face several challenges. Like their euro area peers, an abrupt increase in interest rates or, on the contrary, a persistent low interest rate environment, represents one of the most significant challenges. French banks are also confronted with more country-specific risks, like the growing private debt of both non-financial corporations (particularly large ones) and households and the significant exposure to the Italian private sector via the large retail subsidiaries held in Italy. Fierce competition leads to ever lower average interest rates on housing loans (1.27% for long-term fixed-rate housing loans in September 2019). If such a limited profitability from new credit flows were to persist, banks’ capacity to retain earnings could be affected. Some tax distortions also persist, such as the exoneration of the Livret A. State ownership in the financial sector (namely in La Banque Postale, CNP Assurances, CDC, Dexia, etc.) remains non-negligible (
) and could generate spill-over between the sovereign and the financial sector.
|
Graph 4.2.1:Annual growth rate of loans
|
|
|
|
Source: ECB BSI
|
Household debt associated with deteriorating lending standards is increasing. The year-on-year growth rate of loans to households corrected for sales and securitisation reached 6% in September 2019 (see Graph 4.2.1), above nominal GDP growth. Credit standards have loosened across the board, with increasing maturities, loan-to-value and debt service-to-income ratios (Haut Conseil de Stabilité Financière, 2019a and 2019b). The European Systemic Risk Board (ESRB) issued a warning to France on 23 September 2019, inviting the national authorities to consider the need for additional pre-emptive actions such as explicit guidelines for credit standards (see Section 1 for additional details of households’ debt).
|
|
|
Table 4.2.1:Financial soundness indicators - all banks in France
|
|
|
|
Source: ECB - CBD2 - Consolidated Banking data; own calculations
|
|
|
Vulnerabilities in the residential real estate sector are mitigated by a number of factors. French borrowers are little exposed to interest rate risk due to the high proportion of fixed-rate loans. Real estate prices show little sign of overvaluation once financing conditions are taken into account. Even if prices were to fall, the use of a guarantee scheme for most housing loans makes the value of the collateral less crucial. The potential wealth effect of a price correction is estimated to be weaker in France than elsewhere because there is no possibility to withdraw cash or equity from house revaluations (see Section 1 for additional details on the French housing market).
Lending to non-financial corporations has accelerated and continued to grow at a much faster rate than the GDP. The year-on-year growth of loans to euro area non-financial corporations corrected for sales and securitisation reached 8.3% in August 2019 (v 3.3% in the euro area), a level not seen since February 2009 (see Graph 4.2.1). It is also one of the highest growth rates in the EU (see Section 1 for additional details on the debt of non-financial corporations).
French authorities have implemented several macroprudential measures to address some of these vulnerabilities. On 13 January 2020 the French High Council for Financial Stability (Haut Conseil de stabilité financière, HCSF) decided to maintain unchanged the counter-cyclical capital buffer (CCyB) rate, at 0.5%. The decision to raise the CCyB rate from 0.25% to 0.5% was approved in the HCSF meeting of April 2019 and will enter into force as of 2 April 2020. It is expected to enhance the banking sector’s resilience, helping it to absorb unexpected losses while continuing to provide credit to the real economy.
French authorities tightened the exposure limit of systemically important credit institutions to large and highly indebted non-financial corporations. The tightening (from 25% to 5%) to large and highly indebted non-financial corporations established in France, has been in force since July 2018 (introduced under Article 458 of the Capital Requirements Regulation) and is due to expire by the end of June 2020. This measure aimed first at preserving the resilience of the credit institutions vis-à-vis the potential default of highly indebted private non-financial corporations. In addition, it aimed at improving the market discipline by sending a clear preventive signal to the private non-financial sector to anticipate and avoid excessive imbalances in the future especially from the perspective of an increase in interest rates, while equally incentivising to limit their indebtedness.
Macroprudential policy was implemented in response to the growing vulnerabilities in the residential real estate market. In response to the growing medium term vulnerabilities on the residential real estate market, the HCSF decided on 12 December 2019 to activate a non-binding borrower-based measure consisting in a debt-service to income ratio limit of 33% combined with a cap of 25 years on the initial maturity of the loan, with a margin of tolerance of 15%. In case the (non-binding) recommendation would not be sufficiently effective, the HCSF stands ready to activate other measures. The first review of the effectiveness of the borrower-based measure is likely to take place in June 2020, based on the latest available data.
Insurance
Changes to the regulatory environment might impact the life insurance sector. The PACTE law (“Loi relative à la croissance et la transformation des entreprises”) introduced several important new provisions. One aims at remedying the shortcomings that hindered the development of the euro-growth (“euro-croissance”) contract to make it more attractive (European Commission, 2019d). In particular, the guarantee is now only ensured at maturity, which should allow insurers to invest in “riskier” and more profitable assets. As a result of this reform, the Ministry of Finance expects the outstanding amount of these contracts to reach €20 bn by the end of 2021. Another important measure introduced by the PACTE Law is the reform of the “épargne retraite”, which becomes the pension product of reference. It now offers significant tax incentives, product portability and flexibility of exit options at maturity, and its success might negatively impact long-term life insurance products. Still, life insurance continues to be attractive for shorter maturities (typically 8 years) or to transmit capital in case of death (due to specific related tax advantages).
4.3.
Labour market, education and social policies*
Labour market developments
Labour market conditions continue to improve, despite entrenched segmentation and untapped employment for older and low skilled workers. Net job creation, driven by the private sector, continued to shift progressively from temporary to permanent contracts and slowed down only recently (see Graph 4.3.1). However, segmentation remains high and the number of interim contracts has stabilised recently at a high level after three years of continuous growth (Ministère du travail, 2019a). Both the activity and the employment rate have been increasing at a steady but moderate pace since 2016 and reached 77.7% and 71.4% respectively in Q3 2019), slightly below the EU average of 78.8% and 74.1%. In spite of the recent slowdown in economic growth in 2019, data suggest that, for some categories, there is still potential for employment growth. In 2018, the employment rate of senior workers (55-64), at 52.1%, was well below the EU average of 58.7% (the gap is particularly high for older men - 11.4 p.p.). The employment rate of low-skilled workers at 52.2% is also well below the EU average of 56.1%.
|
Graph 4.3.1:Employment by type (thousand), year-on-year changes
|
|
|
|
Source: Eurostat, LFS (lfsq egaps, lfsq etgaed) Employment (thousand), total, ages 20-64, non-seasonally adjusted data,
|
Unemployment remains well above the EU average, especially for some categories, although decreasing. In Q4 2019, the unemployment rate stood at 8.4% (the EU average was at 6.3%). The situation of young people is slowly improving: the youth unemployment rate decreased to 18.9% in Q4 2019, still significantly higher than the 14.2% EU level, while the employment rate of recent graduates (20-34) increased to 77.7% in Q3 2019. Overall, despite positive developments, some groups remain at a strong disadvantage on the labour market, in particular people with low educational attainment and people with a migrant background. Differences in unemployment rates between these groups and the rest of the population are higher in France than in peer countries (IMF, 2019). Moreover, in spite of a declining early school-leaving rate, the share of young people not in education, employment or training (NEET) has remained broadly stable over the long term (see Graph 4.3.2). Reducing the share of NEET would lead to progress on Sustainable Development Goal 4 on Quality education.
|
Graph 4.3.2:Long term evolution of labour market indicators
|
|
|
|
Source: Eurostat
|
The segmentation of the labour market remains high, but recent developments are positive. While the share of temporary workers is above the EU average, transition rates from temporary to permanent contracts remain among the lowest in the EU (12.1% in 2018 – three-year average), even if slowly increasing in recent years (see Graph 4.3.3). Temporary employees (20-64) as a percentage of the total employees have increased from 13.2% in 2009 to 15.5% in 2018, driven by an increasing number of individuals working on very short-term contracts. Recent data suggest that this trend may be reversing, as the share of part-time and fixed-term contracts has declined somewhat in 2018 (Insee, 2019a). However, in parallel, the share of self-employed firms without employees also increased from 6% in 2009 to 8.5% in 2018.
|
Graph 4.3.3:Share of temporary employees and transition rates from temporary to permanent contracts (age group 15-64)
|
|
|
|
Source: Eurostat
|
The skills required in the labour market are increasing as in other advanced economies. While there is a progressive increase in the share of high-skilled occupations in total employment (from 40.6% in 2009 to 46.6% in 2018), low-and, to a larger extent, middle-skilled (routine) employment is declining. At the same time, the qualification level of the working-age population is improving, therefore reducing the gap between qualification level of employees and their expected skill level. Several national and international forecasts confirm a strengthening in the trend towards higher qualification (
). Still, the pace at which the workforce is upskilling appears insufficient to address the steady increase of demand for high-skilled workers, leading to risks of overall under-qualification (see Graph 4.3.4).
Changes in the structure of labour demand along with a tightening labour market are contributing to skill mismatches (
). Differences in the labour market outcomes for the various skill groups are among the highest in the EU. The slight increase in skill mismatches over the last decade is mostly due to lower activity rates of low-skilled workers. This points to a substitution effect for job vacancies by more qualified workers in the low-to-middle segment of the labour market. The structural decline in middle-skilled (routine) employment is pushing many middle-skilled workers to compete with low-qualified workers for low-skilled jobs. This phenomenon was particularly marked at the peak of the financial crisis. This confirms the need to support the activation and access to employment of the less qualified as well as the upskilling of middle-skilled workers.
|
Graph 4.3.4:Evolution of the task content of jobs (skills) in France, 2000-2018
|
|
|
|
Source: European Commission
|
The minimum wage continued to evolve according to its indexation formula, with no ad hoc hikes since 2013. In January 2020, the minimum wage increased by 1.2%, according to its indexation formula and in line with inflation (with the exception of tobacco). A 2019 expert report on monitoring minimum wage developments reiterated its proposal to revise the minimum wage automatic indexation formula, beyond the need to avoid ad-hoc hikes (Groupe d'experts sur le SMIC, 2019). Over recent years, the cost of labour at proximity of the minimum wage has been significantly contained by reductions of social contributions for employers. Such reductions are now permanent, with further reductions for workers earning up to 1.6 times the minimum wage applied since 2019. The experts’ report also simulated the effects of alternative discretionary increases of the minimum wage instead of the increase of the activity premium (prime d’activité) which took place in 2019. The simulation concludes that the increase of the activity premium had better effects for in-work poverty as well as on incentives for people not in employment to start work. In recent months, the increased visibility of the activity premium and its streamlined application process contributed to an increase in the number of beneficiaries.
The implementation of recent labour market reforms has had an impact on social dialogue. New rules mean that for companies employing more than 11 people, social dialogue is affected by the establishment of a company single instance (Comité social et économique, CSE) as of 1 January 2020. Both employers and trade unions signalled that implementing these new rules might be delayed, due to the lack of resources. Moreover, the Défenseur des Droits published a report (jointly with the International Labour Organisation) on self-reported discriminations by trade unions’ representatives in the workplace. The report detailed some of the challenges to decentralise social dialogue at the firm level (Défenseur des droits, 2019). Also at the national level, some elements of the recent reforms have led social partners to have a reduced role, for instance in the management of the vocational training systems (Opérateurs de Compétences and France competences).
France is one of the top performers in gender equality (European Institute for Gender Equality, 2019). That said, gaps persist both in terms of pay and employment rates (see Box 4.3.1). Women constitute the vast majority (72%) of involuntary part-time workers and those from a migrant background are at a much higher disadvantage. First results of the ‘Equality gender index’ show that 17% of companies (above 250 employees) must take measures to address the gender gaps, including unequal pay (Ministère du Travail, 2019b). Importantly, pay wage gaps have lifetime impacts, as evidenced by the current gap in pension levels between men and women standing at almost 40%. The announced pension reform is also aiming to address this gap (See Section 4.1).
Persisting difficulties and inequalities are affecting people with a migrant background. The employment rate of French born with migrant background remained broadly stable in 2018 (61.5%), well below that of people with a native background (77.4%). People with a migrant background are overrepresented in urban deprived neighbourhoods (Quartiers prioritaires de la ville, QPV), where they represent more than 50% of the working-age population. Disparities persist even within the QPV: 38.1% of young people with a migrant background are not in education, employment or training (versus 30% for non-immigrant young people). Recent studies show persistence of discrimination on the labour market for those born in France with a migrant background depending on their country of origin (Insee, 2019b). For migrants with less than five years of residence, the employment rate was only 35.6% in 2014, but it increased to 38.1% in 2018. Gender disparities are also considerable: only 25.2% of recently arrived women are at work, against 51.3% of men.
Despite improvements, the situation of non-EU born people in France also remains difficult. Non-EU born people have a higher propensity to be self-employed and higher exposure to long-term unemployment, partly because of persisting challenges to their participation in the labour market. The gap in employment relative to natives remains well above the EU average (15.6 pp, against 9.4 pp in the EU), in particular for women (22.7 pp against 13.3 pp EU average). In 2018, 1 non EU-born woman out of 10 declared having never worked due to childcare related issues, against less than 1 woman out of 70 in the overall population. 78.8% of non-EU born women declared not to be using formal childcare services compared with 64% for the overall population. Reducing this gap would have an important impact on several outcomes, as the working status of mothers has a positive effect on child poverty and on intergenerational mobility for those born in France by foreign parents (OECD, 2018a). A revised integration contract is in place since March 2019 for people not born in the EU arriving in France, which puts more emphasis on labour market integration and has doubled the hours of language training.
The simultaneous reforms of public employment services (PES), unemployment insurance and active labour market policies are being implemented. A new tripartite collective convention was signed in December 2019 between the State, the agency managing the unemployment insurance (Union nationale interprofessionnelle pour l’emploi dans l’industrie et le commerce, UNEDIC) and the main PES (Pôle Emploi). This convention provides additional staff and resources for upgrading the performance of ‘Pôle emploi’. It also aims to improve the assessment and guidance methodology for job seekers and implements a new type of guidance services tailored to those who alternate periods of work and unemployment or work part-time while relying on unemployment insurance to complement their income. The aim of this convention is also to improve the services delivered by the PES to jobseekers, in order to address the growing skills shortages at company level. Finally, investment in artifical intelligence is provided by the State in order to equip the PES with better matching services based on jobseekers’ skills and company’s needs. This improvement of matching services is necessary to accompany concomitant reforms of passive and active labour market support and will need to be monitored.
The unemployment benefit system is also undergoing a progressive overhaul as of November 2019. The system has been reformed by imposing stricter eligibility requirements, revising rules to calculate and cumulate benefits, and reducing benefits for high-salary workers (gross monthly salary above €4,500) (European Commission, 2019d). According to UNEDIC’s estimates (Unedic, 2019), half of the 2.65 million people receiving unemployment benefits could lose out due to the new rules. In its impact assessment, UNEDIC did not examine the effect of the reform on the behaviour of the unemployed (including self-employed and employees that resigned). This will require close monitoring in the future.
The reform of the unemployment benefit system also aims at supporting better quality employment. The objective is to discourage employers from hiring workers on very short-term contracts. The reform introduces a €10 tax on traditional short-term fixed contracts (CDD d'usage, CDDU) and phasing-in the experience rating for employers’ contributions (bonus malus) in 7 sectors (
) out of 38, as of 2021 (DG Trésor, 2019a). Consequently, the rate of unemployment insurance contributions due by companies with at least 11 employees in these sectors will be adjusted upwards or downwards according to the rate of termination of employment contracts attributable to the employer. Unemployment insurance contribution rates will vary (currently 4.05%) between 3% (for good performers) and 5.05% (for bad performers). A new experimental renewable short-term contract (CDD multi-remplacement), based on the ‘Freedom to choose one’s professional career’ law, may allow companies affected by the experience rating mechanism to reduce their unemployment insurance contribution rate. Concerns have been raised by employers regarding the complexity of this reform that will affect all companies (from the 7 sectors) with more than 11 employees. In light of experience of taxing very short-term contracts, contained in the previous 2014 UNEDIC convention, a high degree of complexity may fail to influence companies’ recruitment practices.
As labour market conditions improve, active labour market policies are being refocused on people most in need. The volume of subsidised jobs is rapidly falling, in parallel to strengthening training and monitoring to improve employability. The available tools for social and labour market integration of most disadvantaged people through economic activity (Insertion par l’Activité économique) are being scaled up, with the aim of activating minimum income for the beneficiaries. Based on the Borello’s report, a new Fund for Work Inclusion (Fonds d’inclusion dans l’emploi) was created in 2018 to efficienctly manage the financing of subsidised jobs (Borello, 2018).
Several measures are under way to support employment, notably in the most deprived areas. These measures include pilot recruitment subsidies targeted toward most deprived urban areas (Emplois francs scheme) to be rolled out progressively in 2020. Other measures include innovative local initiatives aimed at tackling long-term unemployment (Territoires Zéro Chomeurs de Longue Durée). Preliminary assessments point to the need to fine-tune the pilot.
A reform of the governance of the social protection system linked to the unemployment benefit and active labour market policy reforms has been announced. A new service (Service public de l’insertion) will be set up to improve the coordination between Pôle Emploi and social services to ensure joint guidance for job seekers. A plan to merge various benefits (activity premium, minimum income, housing subsidies) into one universal activity income (Revenu universel d’activité) is also underway. The scope of the new measure is still under discussion in the context of a public consultation that will end beginning of 2020. This reform should strengthen the job-first approach and tackle the low uptake of some of social benefits (estimated at approximately 35 % for the minimum income).
4.3.2 Education and skills
Employers’ surveys show that a lack of skills is the main barrier to hiring. Despite continued high levels of unemployment, the job vacancy rate has seen a steady increase in all sectors since 2016, to reach 1.3% in the second quarter of 2019 (Insee, 2019c). Lack of suitable skilled workers is consistently reported as the main barrier to recruitment by 29% of companies in the service sector, 36% in the industry sector and up to 55% in the construction sector (Insee, 2019d). The most sought after recruitment profiles, such as care-related jobs, IT specialists and engineers, coincide with the sectors having most difficulties in recruiting (Pôle Emploi, 2019). This is reflected also for example in the number of ICT graduates, which account only for 3% of total graduates. Having said that, the share of science, technology, engineering, and mathematics (STEM) tertiary graduates slightly declined from 27.7% in 2010 to 25.7% in 2017 compared to an EU average of 25.8% (). In this context, the government announced a revision of the list of occupations under strain for 2020 (not updated since 2011) to better target the recruitment of non-EU nationals. An evaluation of the previous list shows that it did not have negative impacts on the wages and employment perspectives of French-born workers in the professions concerned (Signorelli, 2019).
The number of apprentices continues to increase, supported by ongoing reforms. Higher education accounts for 75% of the increase and represents now over 40% of all apprenticeships, compared to 14% in 2000. Following the repeal of the prior approval to open an apprenticeship centre, more than 500 requests for opening new learning centres (on top of already existing 965) were submitted, including companies opening their own internal apprenticeship hubs. The impact of these new apprenticeship centres and their sustainability is yet to be assessed.
School-based and work-based apprenticeship schemes are seeking to become better aligned with labour market needs. In particular, the effectiveness of apprenticeships in ensuring labour market integration and quality jobs has improved between 2017 and 2018 (Ministère de l’éducation, 2019a). Previous contact with a company is the main factor for recruitment (23% of apprentices start working in the company which trained them) although it is highly dependent on the business cycle (Couppié, Gasquet, 2018). As apprenticeships are set to increase, potential challenges include tackling signs of discrimination that have been observed (Cereq, 2017) and ensuring employability. Developing preparatory classes for apprenticeship to reduce the dropout rate and increasing financial incentives is a step in the right direction. On school-based vocational education, the first cycle of the reformed professional secondary school started in September 2019, based on a more gradual specialisation and increased guidance. Other measures support pathways of secondary vocational education and training (VET) graduates into vocational higher education. Moreover, the initiative ‘Campuses for Jobs and Qualifications’ is now being relaunched for 2020, improving on the previous generation of labelled structures.
The 2018-2022 Skills Investment Plan is gaining pace. Some €1.5 bn have been allocated in 2018 to enable 826,000 people to start a training course. The plan continued into 2019 (€2.9 bn) and is set to rise to €3.1 bn in 2021. So far, 450,000 additional trainings courses have been provided. On top of innovative programmes launched under the plan (e.g. training courses on digital and sectors experiencing shortages), regional Skills Investment Plans (€7 bn) have been allocated in all regions to better tailor the training offer to regional labour market needs. Good coordination between the State and the regions is critical for its successful rollout.
The revamped individual learning account started in November 2019. Increased rights for people without qualifications or with disabilities, if successfully implemented, could rebalance access to training, which has so far mostly benefited higher-skilled people (OECD, 2019b). For people working part-time, from 50% of the legal duration and up to 100% of the working time, the account is funded up to €500 per year of work. So far, participation of the unemployed in vocational training is comparatively low (16.4% in 2018). Free professional guidance (through the Conseil en evolution professionnelle) will be rolled out at regional level through a network of existing providers, but the actual adequacy and uptake remains to be seen. The impact of the professional guidance on the use of the personal training account, particularly for more vulnerable users needs to be assessed. Trade unions have pointed to potential negative risks implied by the conversion of the learning credits from hours to euros, due to divergences in the cost of training between sectors. The ‘Freedom to choose one’s professional career’ law changed the rules on company training plans by creating a major role in steering and forecasting. In the case of professional transition, a new role will fall under the newly established sectoral skills operators (Opérateurs de Compétences, OPCO). This is particularly important, as smaller companies have limited resources and capabilities to set up a medium-term skills and recruitment strategy.
The 2018 OECD Programme for International Student Assessment (PISA) shows that the French educational system combines overall good outcomes with persisting socioeconomic and territorial inequalities. The performance of 15-year olds in the 2018 PISA has remained stable and the proportions of low-achievers in all three areas tested (reading, mathematics and science) were just below EU averages. France remains one of the EU Member States where the link between socio-economic status and performance in PISA is the strongest. Students from advantaged backgrounds outperformed those from disadvantaged backgrounds in reading by 107 score points, equivalent to more than 2.5 grades (a difference significantly higher than the EU average difference of 95 points). Differences between students from urban and rural areas were large too (83 points, equivalent to 2 grades). The average difference in reading performance between students with or without a migrant background in France was 52 points in favour of the latter and shrank to 13 points after accounting for students’ and schools’ socio-economic profile (nearly 50% of the students with a migrant background are disadvantaged).
A comprehensive approach is needed to reduce educational and socioeconomic inequalities. Recent measures link educational measures to measures on housing, urban policies and poverty alleviation. Halving class sizes in the first two grades was extended to all disadvantaged schools in September 2019, benefiting 300 000 children (20% of the total). A first evaluation found positive results in terms of class atmosphere and performance, while pointing to the need to adjust teaching practices. Full implementation may require further investment in infrastructure. However, 70% of disadvantaged pupils are not enrolled in targeted schools and will therefore not benefit from the measure (Cour des Comptes, 2018a). The ‘law to promote trust in the educational system’ (Pour une Ecole de la Confiance) lowers the age of compulsory education to three, mainly targeting those territories where pre-primary education lacks infrastructure and staff. It also extends the age of compulsory education or training from 16 to 18. The education budget will continue to rise in 2020, in particular for (pre-) primary education.
The teaching profession is facing challenges (European Commission, 2019f). According to the OECD Teaching and Learning International Survey 2018, 65.8% of French teachers reports that content, pedagogy and classroom practice in some or all subjects taught were included in their initial education, against 73% at EU-23 level, which might lead to question the comprehensiveness of their initial education (OECD, 2019c). French teachers also report an above-average need for professional development in teaching students with special needs (33.7% vs 21.0%) and individualised learning (23.7% vs 13.2%) (OECD, 2019c). Statutory salaries of primary school teachers remain below the OECD average (OECD, 2019d). However, after several years of stagnation or decline, the statutory salary of elementary school teachers (PE in ISCED 1) in 2016/2017 has returned to its 2004/2005 level. It has continued to increase since then (by 3 percentage points in 2017/2018). The number of positions filled in the first public decree in 2018 is slightly lower than in 2017, although the additional competitive examination organised in some academies will limit the decrease. However, the proportion of filled positions at the second level is clearly improving. Schools are tackling this problem by hiring contractual teachers, possibly at the expense of quality. Low salaries and limited autonomy affect school leadership in primary education. Social partners call for making the organisation of teachers’ work more collective and alleviating the tasks of school heads’. Comparatively small proportions of teachers reported having undertaken continuing professional development (CPD). Reasons include lack of incentives and relevant offers. French authorities are planning measures to better adapt the offer of training courses to staffs’ needs and to increase participation in CPD (Ministère de l’Education nationale, 2019b).
Teachers in disadvantaged schools tend to have less qualifications than teachers in advantaged schools (OECD, 2018b). The qualifications gap of science teachers in disadvantaged schools is wide, with only 26% of science teachers in schools in the lowest socio-economic quartile being fully certified, against 94% in the top quartile. Lower secondary school directors frequently report that quality of teaching is hindered by (i) shortages of qualified teachers; (ii) shortages of teachers able to deal with pupils from socioeconomic disadvantaged background; and (iii) insufficient time with students (OECD, 2019c). Recent reforms increased salaries for teachers working in disadvantaged schools and targeted recruitment to enable schools to better address local needs and to assign the most experienced teachers to areas of greatest need.
4.3.3 Social policies
The French social system performs comparatively well and the level of income inequalities is significantly lower than the EU average. In 2018, the income share of the top 20% of households is 4.23 times higher (
) than the share of the bottom 20%, significantly below the EU average of 5.17. The income share of the poorest 40% of the population amounted to 22.5% of total income in 2018, above the EU average of 21%. Social transfers reduced the risk of poverty (
) by 44.4% in 2018, more than 10 percentage points above the EU average.
Some indicators pointed to a slight deterioration of the social situation. The share of people at risk of poverty or social exclusion has slightly increased over 2017-2018 from 17% to 17.4% between 2017 and 2018, contrary to the declining EU trend (from 22.4% to 21.9%). The share of people in a situation of material and social deprivation (
) indicator reached 12.5%, almost on par with the EU average (12.8%).
In particular, single parent households often ran by women, face higher risk of poverty or social exclusion. The share of households with dependent children at risk of poverty remained stable at 32.1% in 2018. However, the situation for low-work intensity households with dependent children worsened in 2018 (at-risk-of-poverty rate of 56.1%, up from 51.8% in 2017). This evolution translates on the number of children (0-18 years) at risk of poverty or social exclusion, which increased from 22.1% to 22.9%. This risk is higher in low-skilled and low-work intensity households, which is a concern as the proportion of children living in such low-skilled households with very low work intensity increased from 24.7% in 2017 to 29.1% in 2018.
A recent study shows that fiscal and social measures included in the Budget 2018 and 2019 will mostly benefit the low-middle class. The cumulated effect of the 2018 and 2019 fiscal reforms will increase by 0.8% the disposable income of households between the 9th and the 24th centile, and up to 2.2% at the level of the 39th centile. The first decile of income, which includes a high share of unemployed, will not benefit from the measures, such as the increase of the activity premium or the tax exemption of overtime hours. Moreover, this segment will be negatively affected by the under-indexation of housing and family benefits (IPP, 2019c). However, this segment benefits from an increase of €50 because of the chèque énergie. On average, the loss induced by the under-reevaluation of both types of benefits and the increase of the chèque énergie balance out.
The socioeconomic situation of non-EU born is worsening. Their risk of poverty or social exclusion increased from 33.4% in 2017 to 37.4% in 2018, while it was only 15.4% for people born in France. Similarly, exposure to severe material deprivation remains significantly higher for non-EU born, 13.21% (versus 3.6% for natives). The situation of non-EU born women is even more worrying as their risk of poverty or social exclusion increased from 34.8% (2017) to 38.4% (2018). Following the same trend, the risk of in-work poverty for non-EU born (18-64) increased from 16.9% to 19.6%. In 2018, the risk of in-work poverty for people born in France was only 6%.
The national strategy to prevent and fight poverty is being implemented. Since January 2019, €20 mn have been allocated to guide and support homeless families in their social reintegration and €125 mn to emergency housing facilities, guidance for families and assistance to homeless children. Some 30,000 additional places in formal childcare will be created by 2022, in addition to 300 new childcare services to support the labour market integration of parents in most deprived areas. The Pact seeking to insert individuals through economic activity (Pacte d’ambition pour l’insertion par l’activité économique) was presented in September 2019. The Pact aims to increase the number of places for in work-based inclusion structures by 100,000. These initiatives contribute to the achievement of the Sustainable Development Goal 1 – No poverty.
Over the last three years, the housing cost overburden declined on average, but overcrowding increased. The share of rent in poor households’ disposable income has slightly increased in 2018 (from 30.2% to 31.2%). The housing cost overburden for households at risk of poverty remained high but stable, at 20.3%, while it was only 4.3% for the overall population. The housing overcrowding rate grew from 7.5% to 8.2% for the overall population and from 24.4% to 25.9% for households at risk of poverty.
Unmet demand for social housing remains an issue. In 2018, 2.1 million households were on the social housing waiting list for renting social dwellings, of which 400,000 were already social housing tenants. Budget cuts led to lower investment and a reduced number of new units of social housing from 105,000 in 2017 to 98,000 in 2018 (Union Sociale pour l’habitat, 2019a).
The objective of the 2017 equality and citizenship law (Egalité et Citoyenneté), to have 25% of social housing attributed to individuals in the first income quartile is yet to be achieved. In 2017, around 50% of social housing applicants were below the poverty treshold, with an over-representation of single-parents households among applicants (Union Sociale pour l’habitat, 2019b). Access to social housing for most vulnerable groups remains particularly limited (Caritas Europa, 2019). This is a concern, as social housing plays an important role in shielding tenants from poverty. Among applicants, at least 5% are in a precarious housing and 2% are homeless (Fondation Abbé Pierre, 2019a). Their situation is particularly worrying in the context of an overall increase of the number of evictions, mostly due to unpaid rent (Fondation Abbé Pierre, 2019b). The lack of infrastructures may imply additional costs in the long run, as the emergency public support to homeless people costs significantly more than social housing (Pleace, 2015, Fondation Abbé Pierre, 2019a).
Under its housing first plan (le logement d’abord) (2018-2022), the government supports access to housing for most vulnerable groups. This plan involves a shift from emergency housing towards increased investment in favour of social housing infrastructures targeting lowest income households (Prêt locatif Aide d’intégration, PLAI). However, the PLAI goal of 40 000 a year set by the government remains modest, particularly if the rent level is not sufficiently capped to remain affordable for the lowest income households. (European Commission, 2019g)
The French population enjoys good health. Life expectancy at birth was 82.7 years in 2017 (the third highest in the EU countries). Mortality from treatable causes (
) is among the lowest in the EU indicating that the health system is effective in saving the lives of people with acute conditions. However, certain risk factors are highly prevalent among adults such as high alcohol consumption (on average, a French adult drank 11.7 litres of pure alcohol in 2017, as compared to 9.9 litres in the EU). Achieving progress in this area would contribute to Sustainable Development Goal 3 – Good health and well-being.
There is a lack of practising doctors in some areas. Following a methodology defined in 2017, about 18% of the population live in an ‘uder-equipped area’, i.e. areas where access to a general practitioner is limited (and where the arrival of new doctors is therefore subsidised), among which 8% live in the least favourable areas. Based on data from December 2015, isolated rural territories were primarily affected and 46% of people in those areas lived more than 30 minutes away from an emergency service. The 2020 Health finance law simplifies financial incentives schemes to boost practice opening in underserved areas. Broadening the duties of community pharmacists and nurses could help to tackle the lack of medical professionals. The Health Strategy ‘Ma Santé 2022’ supported the creation of 450 professional territorial health communities (Communautés professionnelles territoriales de santé, CPTS). Local hospitals have been reorganised to provide care in cooperation with local multidisciplinary centres and private doctors. The objective is to increase their number to 1,000 across France by 2022.
|
Box 4.3.4: Monitoring performance under the European Pillar of Social Rights
The European Pillar of Social Rights is a compass for a renewed process of upward convergence towards better working and living conditions in the EU. It sets out 20 essential principles and rights in equal opportunities and access to the labour market; fair working conditions; and social protection and inclusion.
Overall, France performs relatively well on the employment and social indicators highlighted by the Social Scoreboard supporting the European Pillar of Social Rights. Poverty and inequality are below the EU average and the social protection system is overall effective. Access to healthcare and childcare services is also good. However, despite the solid economic expansion, labour market conditions are improving only at a slow pace. The unemployment rate is now broadly stable and above the EU average. Labour market integration remains more difficult for young people, low-skilled workers and people from a migrant background. Onns job quality, the incidence of in-work poverty is low, but labour market segmentation remains a challenge.
Integration of people with a migrant background remains a challenge. The employment rate of non-EU born people, at 57.5%, is 15.5 pps. lower than that of natives. The gap is particularly high between native and non-EU born women (22.7 pps.). Challenges affect both first and second generations. People with a migrant background are overrepresented in deprived urban neighbourhoods, where they constitute more than 50% of the working-age population. Even within these areas, young people with a migrant background experience higher unemployment and inactivity rates than natives. Recent studies point to discrimination on the labour market for second-generations people, depending on their country of origin. The integration of second generations may also be hampered by persisting educational inequalities. In France, the impact of the socio-economic background on educational outcomes is indeed much above the EU average. As pupils with a migrant background have a higher probability to come from a lower socio-economic background, educational inequalities may also hamper the integration of second generations people.
France is one of the best performers in the EU in terms of gender equality. France ranks third in the EU on the Gender Equality Index, with an increase by 9.4 points since 2005 (+ 2 points since 2015). Reflecting its fast pace of progress towards gender equality, France’s ranking improved by four places between 2005 and 2017. To further address the challenge of work-related inequalities between men and women, in September 2018 France introduced an obligation for companies to publish a multi-dimensional equality scoreboard and to take remedial actions in deficient areas. Strictness of obligations varies depending on the size of the company. A first assessment shows that 17% of companies above 250 employees shall take measures to address company-specific gender gaps, including unequal pay. As of 1 March 2020, this obligation will be extended to companies between 50 and 249 employees with SME-specific arrangements.
|
4.4. Competitiveness reforms and Investment*
4.4.1.Productivity trends*
The level of labour productivity is high in France, but its growth has slowed down as in other major economies. Similarly to other countries, this slowdown could be partly explained by an increasing share of the services sector in which productivity gains are less dynamic than in the industry sector (Bauer et al, 2020). In 2017, the aggregate labour productivity growth was 1.9% but 3.1% if services are excluded. That said, as sectoral shifts in employment from industry to services have decelerated since the 2000s, the main factor behind the recent productivity slowdown has been the fall in productivity gains within sectors (Conseil National de Productivité, 2019) (see Graph 4.4.1).
|
Graph 4.4.1:Labour productivity growth per sector
|
|
|
|
Source: European Commission
|
The labour productivity gap between the most productive and the least productive firms widened over the last decade, suggesting weak diffusion of best practices and technology. Differences in revenue-based productivity were magnified in the advanced economies both in manufacturing and in services. However, in France, the increase in productivity dispersion in services was larger than in peer countries (OECD, Multiprod project). According to the National Productivity Board (Conseil National de Productivité, 2019), this is particularly the case in less knowledge intensive services. This finding might signal weak diffusion of best practices and technology from leading firms to other companies, as well as weak business dynamics, which may lead to an inefficient allocation of resources and lower productivity growth.
Apart from the factors common to all advanced economies, the French National Productivity Board identified weaknesses in skills and technology adoption to explain weak productivity growth. The National Productivity Board report concluded that the major factors explaining the weak productivity growth of the French firms were the low skills of the workforce compared to the OECD average, skills mismatches (see Section 4.3) and the low performance due to low uptake of information and communication technologies (Guillou et al, 2018). More broadly, weak innovation performance is also cited as a hindering factor, including insufficient business innovation, a low degree of automation and digitalisation, and the lack of coordination between public and private research and development (see section Research, development, and innovation).
Weak business dynamism in services and regulatory barriers may have slowed productivity growth. Entry rates declined in services between 2008 and 2017. The level of entry rate is far below the EU average and one of the lowest in the EU for firms with at least 10 employees. Weak business dynamism may be linked to high regulatory barriers. On non- manufacturing regulation, Cette et al. 2018 found that if France were to reduce the level of regulatory barriers to the level of the least regulated OECD countries, total factor productivity could increase by 5% in the long term.
France exhibits a sizeable share of ‘zombie firms’ (
) that may help to explain persistently low productivity growth (see Graph 4.4.2). The share of ‘zombie firms’ has increased since the crisis and it is not declining. In addition, the productivity gap between healthy and ‘zombie firms’ decreases as the zombie share increases. In France, ‘zombie firms’ have a strong negative impact on the productivity level, while slightly positive impact on employment by creating low productivity jobs (Bauer et al, 2020). However, according to a recent study (France Stratégie, 2019b), the potential misallocation of resources due to ‘zombie firms’ may be mitigated in some cases by their status (affiliates of large groups) and the effectiveness of French solvency law.
|
Graph 4.4.2:Average share of 'zombie firms' between 2010 and 2015
|
|
|
|
Source: European Commission, Bauer et al., 2020
|
4.4.2.investment*
Productivity and non-price competitiveness challenges as well as energy transition could be addressed by targeted investments. Sluggish productivity growth and relative deterioration of non-cost competitiveness of French exports (see Section 1) appear to be in contrast with the high level of investment in France. Additional, more efficient or repurposed investments in research and development, innovation, digitalisation and skills could be relevant to address competitiveness and productivity challenges in the long term. Indeed, expected benefits include design of new innovative products, access to new markets, better quality of exported goods and services, enhanced participation in global value chains, and improved management. Energy transition requires investments to mitigate climatic evolutions and stimulate sustainable and inclusive growth.
France is characterised by a high and stable level of investment compared to other EU countries. Public investment reached €79.7 bn in 2018 (the highest level in the EU) corresponding to 3.4% of GDP, above the EU average of 2.7%. Most public investments are made by local administration, similarly to the EU average. Corporations and households investment levels in term of GDP are also above the other main countries of the euro area, with the exception of German households (6.0% GDP for France, 6.5% for Germany) (see Graph 4.4.3).
|
Graph 4.4.3:Investment levels by sector (% of GDP)
|
|
|
|
Source: Eurostat 2018
|
Private investment continues to be dynamic with a positive outlook. French firms’ investment rate increased gradually over time to reach above 24% during 2018. The share of firms investing was 84% according to the 2019 European Investment Bank investment survey (EIB, 2019), down from 88% in 2018. The investment outlook for 2019 is positive, with more firms expecting to increase rather than decrease investment in France, which is more optimistic than the EU average. This finding is applicable for all sectors and firm sizes (it was not the case for the construction sector in 2018).
High investment by French firms in intangible assets appears to contribute to productivity growth. France invests more in intangible assets compared to other EU countries, notably in software and databases and organisational capital, which represent 12% and 7% of total investment (
) in 2017, respectively. Moreover, total investment in intangibles grows faster than in other comparable Member States and accelerated further after the crisis. Non-national account intangibles (i.e. design, brand, organisational capital, training) have a strong impact on productivity growth in the services sector (Bauer et al., 2020). France could leverage productivity gains in this domain, particularly via branding, an asset where it is lagging behind compared to other leaders in intangible assets investment (see Graph 4.4.4).
|
Graph 4.4.4:Contribution of intangible capital growth to productivity growth (2015), by asset
|
|
|
|
Source: European Commission
|
Outward foreign direct investment in France is also relatively higher than in other large EU economies. The stock of French foreign direct investment abroad accounted for 53% of GDP in 2017, compared to 41% in Germany and Spain and 27% in Italy. Moreover, between 2013 and 2017, this stock increased significantly faster than in neighbouring countries (
). In terms of employment, French multinational companies employed more workers as a share of total domestic employment than in neighbouring countries, and the gap has become wider over the last years (see Graph 4.4.5). In 2016, this share represented 23% in France, compared to 14% in Germany, 10%, 8% and 4% in the United Kingdom, Italy and Spain, respectively. In terms of total turnover, French multinationals are still lagging behind Germany, although their foreign turnover has been growing faster than in other large EU economies over the last decade, especially in the aftermath of the crisis. In net terms, the French multinationals produce high investment revenues accounting for 1.8% of GDP in 2018, against 1.9% in Germany, and only 0.8% and 0.5% in Spain and Italy, respectively. While inward foreign direct investments are important in assessing a country’s attractiveness, this report analyses the outward foreign direct investment given that French investment revenues partly compensate for the trade deficit in goods, bringing the current account close to balance.
|
Graph 4.4.5:Turnover and employment of multinationals abroad, by country of origin (to rest of the world)
|
|
|
|
Source: OECD-AMNE Outward activity of multinationals
|
On sectoral composition, a large part of the French foreign direct investment abroad concerns services. In 2016, French multinationals made about 46% of their turnover in services and 40% in manufacturing, which is comparable to Germany and Italy (OECD-AMNE). The services sectors involved are mostly wholesale and retail trade, finance and insurance, and information and communication technology services.
|
Box 4.4.5: Investment challenges and reforms
Section 1. Macroeconomic perspective
Total investment in France is high, stable and above the euro area average in 2018 (22.9% of GDP compared to 20.8%) (see Section 4.4.2). Public investment reached 3.4% of GDP and corporations and households investment levels are high with 14.0% and 6.0% of GDP respectively. The investment rate of firms increases gradually over time to reach above 24% during 2018. Compared to other EU countries France invests more in intangible assets notably in software, database and organisational capital. Investment growth is expected to ease down from high levels but remains robust overall following favourable financing conditions.
Section 2. Assessment of barriers to investment and ongoing reforms
Barriers to investment are overall moderate in France
Firms continue to face a relatively heavy and complex regulatory framework, and legislative instability weighs on business perception. Nevertheless, several reforms are being implemented (e.g. PACTE or ESSOC laws) to ease the administrative burden and foster firms’ growth. The labour market and unemployment benefit reforms may as well address obstacles to invest (EIB, 2019). Public support for R&D is characterised by complexity and low levels of efficiency, which may hamper the growth prospects of small and young firms and the development of new research activities. Conditions for professionals to access some regulated activities and a number of regulations and tariffs are not conducive to investment.
Selected barriers to investment and priority actions underway
1.Lack of suitable skilled workforce remains a barrier for investment for 62% of firms in France. This share has decreased compared to last year and remains lower than the EU average (72%). The lack of staff with the right skills is highly prevalent in the construction sector and affect more SMEs than large enterprises. Recent reforms of the vocational education and training system (See Section 4.3) go in the right direction and should contribute to a better alignment with labour market needs.
2.The labour regulations are often cited (albeit in diminution) by investors as an obstacle (EIB, 2019). The French Government has already made significant efforts to reforming both the labour market regulations and the unemployment benefit system. The former aimed at reducing uncertainty concerning the dismissal procedures and associated costs (See Section 4.3). It also aimed at reinforcing the social dialogue between employers and employees. The reform of unemployment benefits may have short-term impact on the quality of employment and guidance of the unemployed. Combined with the apprenticeship and vocational training reforms, this package of measures will take time to fully materialise and be assessed.
|
|
Box 4.4.6: The Investment Plan for Europe and InvestEU
The EU supports investment in France also via the European Fund for Strategic Investments (EFSI). By December 2019 total financing under the EFSI amounted to €15 bn, intended to trigger €77.8 bn in additional investment, making France the biggest recipient country in terms of volume of the Fund (11th in percentage of GDP). France has managed to strongly mobilise the EFSI for its priorities: innovation, ecological transition and digitalisation.
Some 138 infrastructure and innovation projects were financed by the European Investment Bank (EIB) with the support of the EFSI, representing a total funding of around €12.1 bn and is expected to generate €56 bn of total investments. As part of the SME financing part of the plan, the European Investment Fund (EIF) has developed several tools in France: equipment loans, innovation loans, capital investments in SMEs. The EIF has also signed 63 agreements with commercial banks for a total amount of €2.9 bn, which should generate approximately €20.5 bn of investments. In total, 239,955 SMEs and mid-size companies that should benefit from better access to financing.
Examples of projects supported by EFSI
Energy efficiency of buildings: Bordeaux Métropole Énergies
A €37.5 mn loan supports Bordeaux Métropole Énergies to improve the insulation and modernise the ventilation and heating systems of Bordeaux Métropole's residential and commercial buildings. This is part of Bordeaux's ambition to become a positive energy metropolis by 2050. The works financed by the EFSI help reduce the energy bill and increase building’s property value.
Sustainable investment in SMEs: Eiffel Essentiel
By guaranteeing the European Investment Bank’s €80 mn investment in the Eiffel Essentiel fund, the European Fund for Strategic Investments is helping companies in the clean energy, health, and sustainable agriculture sector to access to funding essential for their development. Eiffel Essentiel wishes to support some 20 SMEs operating in these sectors that need a stable shareholder to deploy their full potential.
Artificial Intelligence: Prophesee
A loan of €20 mn supports the growth of Prophesee, a pioneering French company in artificial intelligence, specialising in the design of neuromorphic vision sensors and artificial intelligence algorithms. With this loan, the company will continue its research and development on innovative technologies for autonomous cars, health and the Internet of things.
InvestEU - the next EU investment programme for 2021-2027
The InvestEU programme will build on the successful model of the Investment Plan for Europe and bring together, under one roof the main European investment tools. The policy-driven model will finance four main areas, all relevant for France: (i) sustainable infrastructure (sustainable energy and digital connectivity), (ii) research, innovation, and digitisation (research to market and digitisation of industry are highly relevant for France), (iii) small businesses, and (iv) social investment and skills.
Beyond the EIB group, national promotional banks will have direct access to the InvestEU guarantee. At this stage, the Caisse des Dépôts and BPI France applied for a ‘pillar assessment’ (audit to ensure compliance with the rules and procedures for managing EU funds) to become implementing (and potentially advisory) partners in France. InvestEU will also feature a Member State compartment where Member States may add to the EU guarantee’s provisioning by voluntarily channelling some of their cohesion policy funds. They will benefit from the EU guarantee and its high credit rating, giving national and regional investments more firepower.
|
In 2016, compared to other EU countries, France employed relatively more staff abroad compared to its domestic employment both in manufacturing (58% in France against 35% in Germany) and services (21% in France against 10% in Germany).
On geographical composition, the main destinations for French foreign direct investment are high-income countries. It includes Germany, Spain, Italy, and North America. While European and OECD countries remain the main destination of French and German foreign direct investment, central and eastern Europe accounts for relatively less for French foreign direct investment.
The differences between France and Germany in employment and geographical composition of foreign direct investment could reflect different strategies. A possible explanation is that, contrary to Germany, which seems to have delocalised intermediate stages of production, French firms have chosen a multi-site delocalisation strategy, implying relatively less fragmented value chains (Buigues and Lacoste, 2016). This strategy yields significant investment revenues and partly substitutes domestic production (DG Trésor, 2019b). In particular, 56% of French automobile sector turnover is made abroad. Both market- and factor-seeking relocation strategies have a negative impact on the trade deficit (INSEE, 2019e). Other factors may have played a role: distance to developing markets, cultural factors, relative labour endowments, and to a lesser extent national differences in taxation (Blonigen and Pinger, 2014).
The Great plan for investment (Grand plan d’investissement) sets down the public investments strategy for 2018-2022, focussing on energy transition, skills, innovation, and digitalisation. The plan, with an allocation of €57 bn, aims at addressing contemporary challenges divided into four main areas: (i) the ecological transition (€20 bn, of which €9 bn for energy renovation of buildings), (ii) skills (€15 bn), (iii) competitiveness through innovation (€1 bn), and (iv) the digitalisation of public services (€9 bn). Financing sources are the historical Investment for the Future Programme (Programme d’Investissement d’Avenir) (€10bn), budget credits (€39 bn), and financial instruments managed by the Deposit Bank (Caisse des Dépôts) and the Investment Public Bank (Banque Publique d’Investissement, BPI France) (€9 bn). After two years of implementation, actions targeting the green transition (bonus to buy clean cars and incentive for the energy renovation of buildings) have exceeded initial expectations and required additional funding (see Section 4.5). The plan also fuels actions that could boost productivity such as the Investment Plan in Skills (Plan d’Investissement dans les compétences) and the France Ultrafast Broadband plan (France Très Haut Débit) (see Digital economy section). Digital infrastructure and R&D investment would contribute in achieving Sustainable Development Goal 9 - Industry, Innovation and Infrastructure.
Research, development, and innovation
French research and development (R&D) investment as share of GDP is still below the 3% target for 2020. Total R&D intensity remained stable in 2018 at 2.20% GDP, above the EU average of 2.12%. However it decreased from 2015 where it stood at 2.25%. Public R&D spending (
) for 2017 and for 2018 (0.73% of GDP) were almost the same as in 2007. Business sector R&D spending for 2017 and 2018 (1.44% GDP) were the same as in 2012. As mentioned in last year’s country report (European Commission, 2019d), France is not on track to meet its R&D intensity target of 3% for 2020.
Despite the multitude of initiatives to incentivise innovation (
), France is still stagnating on a global scale compared to the most innovative countries. France remains the 16th most innovative country in the world according to the World Intellectual Property Organisation’s Global Innovation Index and ranks 11th in the 2019 European Innovation Scoreboard and is positioned as a strong innovator behind the group of innovation leaders (European Commission, 2019h). However, France scores particularly well on foreign doctorate students, lifelong learning, venture capital investment and innovators (
).
The Innovation and Industry Fund (Fonds pour l’Innovation et l’Industrie) was not operational in 2018 due to a complex funding mechanism (Cour des Comptes, 2019). The Court of Auditors recommended that the Government replace the fund (amounting to €10 bn) with a support package for innovation integrated under the State’s budget. Overall, France would benefit from a more efficient and concerted innovation strategy (Chouat et al., 2019) and the upcoming multiannual research programme law could help in this respect.
Closer links between public research and businesses could be improved by promoting entrepreneurship in researchers’ careers. The status of researchers in France suffers from not being an attractive career (Berta et al., 2019). Low wages compared to other OECD countries, precarious contracts and complex administrative procedures are impeding factors (
). The poor results of Technology Transfer Acceleration Offices (Sociétés d’Accéleration de Transfert de Technologies) led the Court of Auditors to request the closure of the underperforming ones (Cour des Comptes, 2018b). The Action Plan for Business Growth and Transformation (Loi relative à la croissance et la transformation des entreprises, PACTE law) included measures to improve researchers’ mobility between the public and private sectors, to simplify access by private firms to public research results and to reinforce the use of the industrial property protection. It is however too early to assess their impact.
Despite the highest number of graduates in science and engineering in Europe and the good quality of its researchers, France struggles to increase the efficiency of its public research system. France tops the ranking in the EU for new graduates in science and engineering (in 2017, 22.2‰ of the population aged 25-34, which has been increasing since 2016 and is well above EU average of 15.7 (
)). The number of international co-publications has steadily increased since 2007 (58.4% of total number of publications in 2018) but French scientific publications only rank in 11th position (9.9% of scientific publications of the country within the top 10% most cited scientific publications worldwide, below the EU average of 10.3% in 2016 (
)). Six years after its creation, the Strategic Research Council (Conseil Stratégique de la Recherche) has yet to identify research priorities as required by its mandate. While the National Institute of Research in Digital Sciences fully coordinates all actions in the artificial intelligence sector, the coordination of other research actions and the strategic planning are widely dispersed. Following a government decision, a draft law on a multiannual research programme is planned for 2020 to give visibility to laboratories, boost research projects in strategic areas and foster research partnerships (Vidal, 2019).
The evaluation of tax incentives for research, development and innovation delivered mixed results. The most important R&D tax credit scheme in France is the ‘Crédit d’Impôt Recherche’. It is one of the most generous tax credit scheme among OECD countries (€5.6 bn, 0.24% of GDP in 2018). This R&D tax credit alone accounts for about 60% of the total financial public support to business R&D in France. The contrast between the large amount of public support and its overall low impact has been questioned by several observers (Salies 2017, European Commission, 2019d). The evaluations recently published by the National Commission for the Evaluation of Innovation Policies (Commission Nationale d’Evaluation des Politiques d'Innovation) also showed additionality effects around 1 to boost private R&D spending but no clear conclusion could be drawn on the impact on innovation (France Stratégie, 2019c). Additional impact studies, focused on macroeconomic issues, are ongoing. Referring to a recommendation of the Court of Auditors, the government announced in the 2020 budgetary plan a reduction of the R&D tax credit contribution to the operating costs linked to research from 50% to 43% of staff cost, leading to a potential saving of €230 mn per year.
Digital economy
Digital connectivity is significantly improving though remaining low in rural areas. French households are almost fully covered by fixed broadband (almost 100% coverage, above the EU average of 97%). The situation concerning higher performance networks is also improving with 36% of French households making use of fast broadband, however below the EU average of 41%. The coverage of ultrafast broadband technologies in rural areas stands at 10% of households, which is five times lower than in urban areas. A very significant share of overall next generation access lines are ultrafast, and progress year-on-year is substantial (growth rate >15%), while ultrafast subscriptions have almost doubled in two years. Yet, the access to ultrafast broadband in rural areas is low and well below the EU average. As for 5G, France has made progress both on the creation of trial platforms and on the regulatory side. Further steps, such as the spectrum award procedure, are planned for 2020.
France is implementing the Ultrafast Broadband plan (France Très Haut Débit) to cover the national territory with very-high speed broadband. It aims to speed up the roll-out of fibre network and connect all households with 30Mbps (and above) by 2022. The plan started in 2013 and an estimated €20 bn in total will be invested (of which €3.3 bn of public investments to compensate for the lack of private initiative in some parts of the country). According to the National Agency in charge of digital (Agence Nationale de la Cohésion des Territoires) supervising the execution, the plan is on track in spite of some difficulties to find qualified workers.
Some challenges remain companies’ integrating digital technologies. Despite improving, the percentage of companies having high levels of digital intensity in France (24%) remains below the EU average (26%). E-commerce uptake levels by French enterprises are still below the EU average (16% vs 18%) and vary significantly according to company size: only 15% of SMEs sell online compared to nearly 45% of large companies (European Commission, 2020c). The initiative ‘France Num’ is being implemented to tackle this challenge.
The lack of information and communication technologies (ICT) specialists may constitute one of the barriers for integrating digital technologies in companies, which may hamper productivity growth. The share of companies employing ICT specialists is lower in France (17.4%) compared to the EU average (20.3%). ICT specialists are among the most in demand and the sector predicts major difficulties in recruiting these specialists (See Section 4.3).
Implementation of the artificial intelligence strategy is ongoing. At the end of 2018, the Interdisciplinary Institutes of Artificial Intelligence (3IA) initiative was launched to train and attract artificial intelligence talents and to develop a network of centres of academic excellence in artificial intelligence and dedicated funding for hiring professors and support Ph.Ds. France has also recently acquired a new super-computer, which has the ambition to become one of the fastest in the world. France is part of the European High Performance Computing Joint Undertaking. France cybersecurity strategy dates back to 2015, but continues working in promoting the central role of the EU for cybersecurity.
In early 2019, the Investment Public Bank (BPI France) launched the landmark ‘deeptech generation plan’ (Plan Génération Deeptech). With €1.3 bn in funding over 5 years (2019-2023) the plan will support disruptive innovation. In addition, €800 mn (from the Investment for the Future Programme and the Innovation and industry Fund) will support the creation of start-ups and €550 mn over five years will support the Technology Transfer Acceleration Offices (Sociétés d’Accélération du Transfert des Technologies) and the creation of incubators and accelerators in the territories. BPI France will contribute to funding the ecosystem and launching projects (Banque Publique d'Investissement, 2019).
Digital public services are being rolled-out. Alongside the development of the digital platform FranceConnect, artificial intelligence solutions are being explored to improve public employment services, increase tax control efficiency and create an online labour law repository. In addition, the digitisation of health services has become a cornerstone in the government’s strategy for transforming the health system and making it more efficient while preserving its accessibility for all. About 12% of the population used e-health services such as online consultations in 2017, compared to an EU average of 18%.
4.4.3.Competition and single market integration*
France has taken initiatives to ease the regulatory framework for services. The law for growth, activity and equality of economic chances (Loi pour la croissance, l'activité et l'égalité des chances économiques) adopted in 2015 and implemented in 2016 has eased some restrictions for legal professions and architects. The law has given new powers to the competition authority, allowing significant progress in the regulation of the professions.
However, the level of regulatory restrictions remains high in services. The OECD’s 2018 economy-wide product market regulation indicator (OECD, 2019e) places France as the 6th most restrictive country out of 34 advanced economies. France stands above the OECD average for accountants, lawyers and architects. These results are broadly in line with the Commission’s 2016 restrictiveness indicator (European Commission, 2016). Regulatory restrictions of professions, in particular limitations of legal forms, multidisciplinary activities, voting requirements, shareholding requirements, reserved activities, and advertising restrictions (e.g. pharmacists, medical biologists) may limit access of professionals and firms to capital, reduce economies of scale and scope, and restrict competition.
These restrictions have a negative impact on business dynamism, competitiveness and the supply of professional services at the expense of the final user. For accounting, legal, architectural, real estate and travel agencies activities, business churn rates are lower in France than in the EU (see Graph 4.4.6). It suggests a relatively low dynamism and competition within regulated professional services. By contrast, a higher churn rate can be observed in the engineering sector, which is not considered a regulated profession in France. Further simplification of business regulations and opening up of regulated professions could boost productivity growth and increase GDP per capita (OECD, 2019a). The National Productivity Board also highlighted the high level of product market regulations as one of the factors behind the slowdown in productivity through the impact of a lower competition on innovation (see Section 4.4.1). Redesigning requirements on the access to and exercise of professions to stimulate innovation, competition and mobility would have a positive economic impact.
|
Graph 4.4.6:Business churn rates (%) of active companies in selected business services sectors for France and the EU
|
|
|
|
Source: Eurostat 2017
|
In March 2019, measures were announced to increase competition and moderate prices in specific sectors. Some measures were related to automotive spare parts sales and driving schools (both adopted in November 2019 through the ‘Loi d’Orientation des Mobilités’). The measures of the French rail reform (Loi pour un nouveau pacte ferroviaire) adopted in 2018, aiming at opening competition in the regional passenger transport, entered into force at the end of 2019.
The French retail sector also shows high restrictiveness levels. According to the Commission’s Retail Restrictiveness Indicator (European Commission, 2018d), France is the most restrictive Member State regarding operational restrictions. Also, the 2018 OECD Product Market Regulation sector indicator for retail ranked France among the most restrictive EU members of the OECD.
The retail regulatory environment has become more restrictive following the adoption of recent laws. The ELAN law (Evolution du logement, de l'aménagement et du numérique) introduced restrictions on opening large retail shops in France. On the other hand, the ELAN law has facilitated the establishment of commercial establishments below 2,500m2 by granting exemptions from the authorisation obligation. The EGalim law on the food sector limited retailers’ freedom to offer food promotions and raised to 10% the sale-at-loss threshold. The French Competition Authority expressed reservations regarding the suitability of the EGalim law (Autorité de la Concurrence, 2018). In addition, the PACTE law, reforming the business environment, restricted the period of sales. The cumulative effect of these measures might hamper market access and retail activities, which could be detrimental to retailers and affect other economic operators. The complexity of many of these measures might also create legal uncertainty.
France’s overall enforcement of EU single market rules is declining. The number of infringement cases has been increasing together with its overall compliance deficit. However, improvements have been made in reducing delays in turning EU directives into national law. The decline in enforcement may increase legal uncertainty for economic operators, reduce their incentives to invest and undermine the competitiveness of the Member States’ economies.
Despite several decades of liberalisation, the market concentration in the electricity sector remains high both on the production and the supply sides. The wholesale market liquidity is quite low, as most of the incumbent production is sold either through a regulated mechanism (access to nuclear-produced electricity) or directly from its supply subsidiary. France could benefit from reforming the electricity sector, while limiting the risk of price rises for the most vulnerable consumers. Reforms in the sector would lead to progress on Sustainable Development Goal 7 – Affordable and clean energy. In addition, further support for electricity interconnectors under development with Spain, will contribute to greater integration of the internal EU energy market, while introducing more competition and facilitating the deployment of renewable energy
4.4.4.business and regulatory enviroNment*
The business environment is improving, including for SMEs. Several composite indicators of business environment show that France is improving. The 2019 Global Competitiveness Index, ranks France 15th out of 141 countries (+2 from 2018) (World Economic Forum, 2019). France’s score remained stable in the 2019 World Bank’s Ease of Doing Business index (still ranked 32nd). However, Ernst&Young’s attractiveness survey showed promising results in 2019, with France remaining the number one destination for foreign investment in Europe for manufacturing (EY, 2020). For SMEs, the quality of business environment is at the EU average. France’s Small Business Act profile is mostly aligned with the EU average on all aspects except the single market and, to a lesser extent, internationalisation, where its performance is lower than the EU average (European Commission, 2019i). Many of the Small Business Act dimensions have been on an upward trend, highlighting the country’s progress.
Business creation is dynamic, but businesses have difficulties scaling up. Nearly 700,000 new businesses were set up in 2018 (+17% compared to 2017). While very small enterprises are numerous, the share of large SMEs (50-250 workers) or mid-sized companies (250-5000 workers) is lower in France than in Germany or the UK (
).
The French tech start-up ecosystem attracts record investments. In 2018, French tech start-ups raised significant funding totalling €3.6 bn, then in the first semester of 2019 only, funding reached €2.4 bn, possibly leading to a record year with nearly €5 bn projected (CB insights, 2019). According to the French authorities, institutional investors committed to invest €2 bn in venture capital to boost scaling-up of fast growing firms and €3 bn in financial market assets to support the entire French technological sector. Among numerous initiatives, French Tech (
) plays a major role in building an ecosystem for start-ups to scale-up.
|
Box 4.4.7: Impact of business environment reforms
|
|
Business environment reforms in France have important domestic and cross-border effects. The objective of the PACTE law (‘Plan d’Action pour la Croissance et la Transformation des Entreprises’) adopted in May 2019 is to remove obstacles to firms’ growth, creating economic effects through different channels, including higher productivity, lower labour and capital costs, and better allocation of production factors. This box illustrates the potential domestic and cross-border effects from the implementation of three specific measures of the PACTE law.
There are several measures analysed in this box. These include (i) the reform of firm size threshold, (ii) the elimination of the forfait social (employers’ contributions) for companies with fewer than 250 employees, and (iii) the insolvency law reform. In line with previous quantitative estimates (
XI
), measure (i) reduces the labour costs for employers, measure (ii) increases the net disposable income of workers, and measures (ii) and (iii) increase the long-term productivity. In total, the PACTE law as implemented in the scenario entails a labour cost and labour tax reduction by 1.3% of GDP, plus a gradually materialising productivity gain by 0.8%.
|
|
|
Simulations with the QUEST model (
XII
) indicate that these three measures generate a positive response of GDP and lead to positive economic effects to the rest of the euro area. French real GDP in levels raises by around 0.4% after 5 years and by 0.7% after 10 years compared to the no-reform baseline. GDP effects are strongly frontloaded, given that the labour cost and labour tax reductions are assumed to fully materialise already on impact. This translates into an increase of real GDP in the rest of the euro area by 0.1, i.e. around one quarter of the impact in France, and weaken relative to the impact in France over the medium term. Assuming that the euro area continues to operate at the zero bound on interest rates at least in the shorter term (2 years) strengthens positive spill over to the rest of the euro area. This comes from the idea that higher demand in France in response to higher disposable income (labour tax reduction) is not met by monetary tightening, which would otherwise dampen domestic demand in other euro area countries.
|
|
|
However, high growth enterprises are still relatively few, except in Ile-de France. France shows a poor demography for high growth enterprises (
). France lags behind the EU average for the number share (8.6%) and employment share (4.2%) and these firms are also smaller on average (71 employees) (Flachenecker et al., 2020). Entrepreneurial skills and venture capital seed investment seem to be the weaknesses of the French ecosystem of high growth enterprises compared to the EU. Regional disparities are very pronounced: Ile-de-France concentrates around 30% of French high growth enterprises (see Section 4.4.5).
To support firm’s growth, France is implementing the ‘Action Plan for Business Growth and Transformation’ (PACTE). Under this law, a number of obligations have been removed in order to facilitate businesses’ creation and growth. In particular, the number of regulatory size-related thresholds, that may have impeded firms to grow in the past, has been reduced and a five-year transitional period has been introduced to give firms time to adjust when they cross the thresholds. While most of the measures entered into force in 2019, the measures regarding regulatory size-related thresholds entered into force on 1 January 2020. Among other provisions targeting business creation and growth, it will be possible to set up companies online through a single platform as of 2021 and a digital general registry should be put in place in 2022. By December 2019, 73% of the measures were in force. Box 4.4.3 shows the positive potential economic domestic and cross-border effects from the implementation of three specific measures of this law.
France pursues its efforts to reduce the administrative burden for businesses. In parallel to reducing the regulations, the government aims at transforming public action and better measuring its impact (Circulars of 18 February, 5 June and 3 October 2019). Nearly all the implementing acts of the ESSOC law (Etat au service d’une société de confiance), which aims at improving the relationship between businesses and administration, are in force. In spite of those efforts, according to the 2019 administrative complexity barometer issued by the French Directorate for public transformation, the level of complexity perceived by businesses has slightly increased from 35% in 2017 to 38% in 2019. However, the three procedures which were found as particularly complex in 2017 are now considered as less complex, namely, bidding for and executing a public procurement contract, complying with environmental regulations, and applying for a building consent. Despite this, according to the survey’s respondents, the level of complexity for setting up a business has increased.
French companies’ internationalisation remains weak. The total number of companies exporting to foreign markets stayed low at 125,283 in 2018 (132,000 in 2000, 360,000 in Germany and 240,000 in Italy in 2018). The recent reform of public support to business internationalisation aims at providing better regional support for businesses and boosting the number of exporting companies to 200,000 by 2022. The creation in 2018 of a single helpdesk (Team France Export, operational since summer 2019) has led to a new offer of single contact point for support to exports at regional level (guichet unique de l’exportation).
To foster the growth potential, competitiveness and sustainability of its productive firms, France announced a ‘pact for a productive economy’ (Pacte productif). The measures will relate to decarbonisation, skills, breakthrough technology, competitiveness, including the reduction of taxes on production (see Section 4.1) and administrative simplification for the development of new industrial sites. In addition, industrial SMEs are benefitting from an extra depreciation scheme for their investments made for digitalisation and robotisation in 2019 and 2020.
4.4.5.Regional Disparities
The capital region of Ile-de-France stands out by its economic performance. Ile-de-France stands at 177% of the EU average for GDP per head, while the second region Rhône-Alpes is at 104% (
). The same pattern is found for labour productivity where Ile-de-France is at 155% of EU average and the second region is again Rhône-Alpes with 111%. On average, productivity has increased slightly faster in the most productive regions, thereby fuelling internal divergence. In term of competitiveness (see Graph 4.4.7), Ile-de-France is the region with the highest regional index (91). About 30% of the French high growth enterprises are found in this region, corresponding to a share of 11% of total regional firms, similar to EU average. This share is below the EU average in all other French regions (Flachenecker et al., 2020). Venture capital is also concentrated in the region Ile-de-France (around 70% of total venture capital invested). In term of education, the capital region is also leading in the share of population with tertiary education (50%), against 27% in Haute-Normandie, for instance. The economic attractiveness of the capital region enhances risks of an increasing divergence relatively to the rest of the national territory. Measures aiming at decreasing inequalities between regions may lead to achieve SDG 10 - Reduced inequalities.
Outside the capital region, disparities also occur between metropolitan regions. Ile-de-France excluded, GDP per head varies between 104% (Rhône-Alpes) and 75% (Picardie and Lorraine) of the EU average. GDP per head growth also varies across regions, where it is even negative in Champagne-Ardennes (contraction of 0.5% per year between 2010 and 2017). Out of the 27 French NUTS2 regions, only nine have their GDP per head growing faster than the EU average. It implies that two third of the regions, both metropolitan and outermost are drifting away from the EU average.
To a large extent, disparities in terms of GDP per head are linked to the regional differences observed in the labour market. The unemployment rate varies across regions, with Nord-Pas de Calais and Languedoc-Roussillon at 11.8% and 11.4%, respectively. The share of the long-term unemployed amongst the unemployed is sizeable in former industrial heartlands in metropolitan France such as Nord-Pas de Calais (49.9%) and Lorraine (48.2%). This northeast part of the country is characterised by significant fragilities such as deindustrialisation, net migration, access to employment, level of education/qualification and income.
Disparities between regions are also found in terms of competitiveness and investment. Midi-Pyrénées, the French region that invests the most in innovation, Rhône-Alpes, and Alsace show good competitiveness (see Graph 4.4.7). At the other end of the spectrum, Champagne-Ardenne is in the group of the 40% less competitive EU regions while Corse is in the bottom 30%. Surprisingly, several metropolitan regions stand below the EU average and are still in industrial transition or rural areas. Major differences between regions can also be noted in R&D investment. Only one region (Midi-Pyrénées) invests more than 3% of its regional GDP in R&D (4.75% in 2016) and only seven metropolitan regions exceed 2%.
|
Graph 4.4.7:Regional competitiveness index
|
|
|
|
Source: European Commission
|
Government at local level plays an important role in public investment and growth-friendly spending (
). However, their importance has slightly decreased in recent years. In 2007, local governments carried out around two thirds of public investment but the share decreased to 63% in 2018. As for growth friendly public spending, the share of different levels of local government was more than 40% of the total in 2007, while it was 35% in 2017.
The French regions show major disparities in greenhouse gas emissions and the production of renewable energy (
) (see Graph 4.4.8). These can be partially explained by the presence of a large city in the region (Paris, Lyon, Marseille) or significant industrial activities (Northeast). In the new French region Auvergne-Rhône-Alpes, which produces the largest quantity of renewable energy (more than 28,000 GWh), the production of renewable energy represents between 20 and 40% of the regional consumption while standing below 5% for Ile-de-France.
|
Graph 4.4.8:Greenhouse gas emissions per NUTS2 regions
|
|
|
|
Source: Service de l'Observation et des Statistiques (2013)
|
The outermost regions exhibit particular vulnerabilities in terms of education and employment. Outermost regions stand on the low side of the spectrum of GDP per head and productivity among French regions. GDP per head in Guyane has decreased from 52% of the European average in 2010 to 49% in 2017, but it increased in Mayotte at the fast pace of 4.9% per year over the same period, reaching only 34% of the European average. Unemployment is also higher than in mainland France, at more than 20% in Guadeloupe and La Réunion, and peaking at 35% in Mayotte. Young people are particularly affected (42% in La Réunion and 32% in Guyane) and continue to face difficult conditions. Early school leaving rate is at 21.3% in 2018 (8.9% for the French average), the ‘not in employment, education or training’ (NEET) rate is at 26% (11.1% for the French average), and the share of young people (30-34) having low or no qualifications is at 27.9% (against 13.3% for the French average). The remoteness and insularity of these regions limit mobility as a way to improve labour market prospects. Long-term unemployment (≥1 year) represented a large share of unemployment in 2018 (with peaks of 81.8% in Mayotte, 71.3% in Guadeloupe and 61.2% in La Réunion).
Healthcare is also a challenge in the outermost regions. Life expectancy in most of the outermost regions is shorter than in metropolitan France, particularly for women in Mayotte (76 years in 2018), but also in Guyane (83.3 years) and in Martinique (84.7 years) while overall it is 85.3 years for French women. The infant mortality rate between 2015 and 2017 was 9.15‰ in Guyane and 7.26 ‰ in Martinique, as compared to 3.7 ‰ in metropolitan France. Healthcare in outermost regions, which at times is understaffed, is mainly concentrated on hospitals, mirroring weak primary care structures. Together with shortages in certain specialised medical professions, it generates long waiting times, weakens access to care, and requires costly evacuations to metropolitan France for the most severe cases. Several reports, including from the parliament, point to the lack of data and a need for evaluation to better adapt health policies to the specific challenges of overseas territories.
The outermost regions present some potential for economic development in certain sectors. This is particularly the case in the growing tourism industry, which represents on average 10% of their GDP but also in the blue and green economy. For instance, Guyane produces 40% of its consumption from renewable energy, the highest share in France.
4.5.
Environmental sustainability
France is committed to fight climate change and address sustainability matters. In parallel to global commitments (i.e. the 2015 Paris Agreement), France has developed internal governance structures to bring external commitments into domestic legislation. The National Low Carbon Strategy (Stratégie Nationale Bas Carbone, SNBC), France’s roadmap for reducing its emissions, and the Multiannual Energy Planning (Programmation pluriannuelle de l’énergie, PPE), setting action priorities in the energy field for the decade to come, are the main tools for steering the French energy policy. The draft integrated National Energy and Climate Plan (NECP) builds on both documents, still at the stage of government proposals to be adopted by the Parliament at the time of submission. The guiding objectives of the draft NECP are to decarbonise the energy system and to achieve carbon neutrality by 2050.
However, France’s ambitious commitments to reach carbon neutrality by 2050 require a leap forward. Measures that need to be taken to achieve the ambitious objectives imply costs which do not equally affect all groups in society. If not adequately anticipated and addressed, such inequalities may fuel social discontent, as it has been the case with the ‘Gilets jaunes’ protests. For this reason, the implementation of the low carbon strategy has to be designed carefully to ensure economic efficiency and take into account social fairness.
|
|
|
Table 4.5.1:Total greenhouse gas emissions per capita (*), tons of CO2 equivalent
|
|
|
|
Source:
|
|
|
The required transformative policies involve lasting behavioural change of the population at large. In France, the combined transport, building and agriculture sectors account for 64% of greenhouse gas emissions (see Table 4.5.1). Decarbonising these sectors requires households to be fully involved. In this regard, France was among the first in the EU to adopt a trajectory for the gradual increase in carbon tax.
|
Graph 4.5.1:Targets and emissions under the effort sharing legislation (% change from 2005)
|
|
|
|
Source: European Commission
|
France is taking additional steps to improve transparency in terms of the environmental impact of its policies. In particular, the 2020 budgetary law has brought additional information and transparency regarding the incidence of taxes and subsidies on France’s environmental footprint (green budgeting), placing the country as a leader in the area, in line with other top EU Member States and international initiatives.
Sustainability targets: current situation
France is on track to reach its 2020 greenhouse gas emissions target; however, a change of scale is necessary to achieve the renewable energy and energy efficiency targets. France is on track to reach its 2020 greenhouse gas emissions targets (-14% compared to 1990). However, without additional measures to fill the gaps, there is a major risk to miss the renewable energy (16.3% in 2017 for an intermediary target of 18.6%) and energy efficiency targets (
). The French national contribution for renewable energy proposed in the draft NECP is 32% of gross final energy consumption in 2030. This is slightly below the share of 33% that results from the formula in Annex II of the Governance Regulation, a situation which would also require an indicative trajectory in the final plan that reaches all reference points in accordance with the national contribution in the final plan.
Without additional measures, France risks missing its 2030 emission targets, mainly due to transport, building and agriculture sectors. Greenhouse gas emissions have decreased by 103 Mte CO2 between 1990 and 2018, but France is still above the trajectory set by the SNBC to reach -40% by 2030. It was revised in February 2018 confirming that emissions have not sufficiently decreased between 2015 and 2018 to comply with the 1st carbon budget (i.e. the upper limit of the total greenhouse gases emissions in a given period) that was exceeded by 62 Mte CO2 according to the Atmospheric Pollution Centre (Centre Interprofessionnel Technique d’Etudes de la Pollution Atmosphérique). The annual decrease of emissions by 1.1% on average was below the trajectory of 1.9%. Additional measures (Graph 4.5.1) are referring to the 2nd and 3rd periods (2019-2023 and 2024-2028). The projected underperformance mainly comes from sectors not covered by the EU Emissions Trading System (ETS) such as transport, buildings, and agriculture (see Graph 4.5.2). In France, these sectors weigh more heavily on national emissions (64%) than the EU average (47%) and depend mainly on private investors decisions, and households in particular.
France is committed to reach carbon neutrality (understood as ‘zero net emissions’) by 2050. Efforts to be made over the next three decades will have to be multiplied by four: emissions will have to approach 300 Mte CO2 in 2030 (almost a reduction by 200 Mte CO2 in 10 years) and 100 Mte CO2 in 2050 (France Stratégie, 2019d). France’s strong engagement in climate change mitigation will help it to reach Sustainable Development Goal 13 - Climate action.
The Paris Climate Agreement employment impact is positive yet modest for France, but the implications for reskilling and upskilling policies are significant. Studies project a 0.4% increase in employment in respect of the baseline scenario, with variations between sectors (European Commission, 2019j). The lack of skills for core green jobs is already recognised as a major bottleneck for the growth of the green economy (Cedefop, 2018), with upgrading of qualifications required at a faster rate than in the economy overall. At the same time, the greening of the overall economy creates skills needs across sectors, to be matched by adaptation of existing and future jobs. As such, the transition to a greener economy provides opportunities and needs for upskilling and reskilling of the current workforce, strengthening both the top and middle skill segments of the labour market.
|
Graph 4.5.2:Greenhouse gas emissions by sector with projections
|
|
|
|
Source: European Environment Agency
|
Several agro-ecology public and private initiatives are planned or already being implemented to comply with environmental and climate targets. To stop the current destocking of carbon from agricultural soils and to reverse that trend, a national plan is being implemented in line with the international initiative ‘4 per 1000’. This initiative was launched at the COP21 with the aspiration to increase global soil organic matter stocks by 4‰ per year through the implementation of agricultural and forestry practices adapted to local environmental, social and economic conditions. Furthermore, programmes such as ‘Ambition Bio’, ‘Ecophyto’ and the certification of low carbon farms also contribute to the mitigation and adaptation to the effects of climate change by encouraging farmers to use innovative and environmentally friendly farming practices and systems. However, it is too early to assess the impact of these initiatives. They could contribute to achieving of Sustainable Development Goals 2 - Zero hunger and 15 - Life on land.
Investment needs for sustainability
Substantial investment is needed to reach the ambitious climate targets. The Institute for Climate Economics (I4CE) estimates that by 2023, an additional €15 to 18 bn of investments per year in housing (energy efficiency), renewable energy and clean transports are necessary to put France on a downward trajectory towards carbon neutrality (I4CE, 2019a). Based on the national objectives set by the national low carbon strategy (SNBC) and the multiannual energy planification (PPE), investment needs in the same sectors are estimated at about €46 bn per year during the 2nd carbon budget period (2019-2023) and €64 bn per year during the 3rd period (2024-2028). These estimates mean doubling the current investments. These figures do not include needs in agriculture and industry. Investment needs may be revised upwards when taking into account adaptation to climate change and increased occurrence of extreme events. The European Environmental Agency estimates that the losses incurred in France from extreme events from 1980 to 2017 amount to €62 bn.
In parallel, France is preparing to reduce its reliance on nuclear energy, which will require additional investments. The Energy and Climate law adopted in November 2019 sets the part of nuclear energy in the electricity production to reach 50% by 2035 (currently above 70%). Existing nuclear power plants are undergoing a renovation plan (Grand Carénage) for their long-term operation with an estimated cost of €48 bn for 2014-2025. In January 2019, France announced the permanent shut down of 4 to 6 nuclear reactors by 2028 and 14 reactors by 2035. As agreed in September 2019 with the historical electricity provider ‘Electricité de France’ (EDF), the French government would compensate the utility for the early closure of Fessenheim (planned in 2020). On the new construction of nuclear power plants, the government will conduct a work program with the industry to examine the questions of cost of new nuclear capacity, its advantages and disadvantages compared to other low-carbon means of production or the industrial capacity to build new reactors.
Both climate-friendly and climate-unfriendly investments have been increasing. Climate-friendly investments have been increasing since 2011, from €35.8 bn in 2011 to €45.7 bn in 2018 thanks to a strengthened regulatory framework, a higher carbon price signal, and low interest rates (I4CE, 2019a). At the same time, investments unfavourable to the climate have been increasing mainly fuelled by the purchase of thermic vehicles (€63.2 bn in 2018). In total, fossil fuels investments reached €67 bn in 2018. Public authorities are responsible for only 8% of fossil fuels investments, the main bulk being undertaken by the private sector (56% by households and 36% by businesses).
A tailored regulatory framework could unlock private investments. Public authorities have a major role to play in setting an appropriate regulatory framework to channel private investments and financial flows towards low carbon projects. Further reflection on the appropriate trajectory for the shadow price of carbon could help channel public and private investments by taking into account their externalities through the recognition of an increasing value of carbon. However, this reflection should take into account the potential impact of the carbon tax on firms’ competitiveness and its social impact on households (Conseil d’Analyse Economique, 2019b).
France faces also substantial investment needs to tackle the other environmental Sustainable Development Goals. Water quality and affordability are good in France (SDG 6) but investment needs for water supply and sanitation are estimated at €4.2 bn by 2030, particularly to develop wastewater treatment. Concerning the circular economy (SDG 12), France performs well in the use of circular material. A law on anti-waste and the promotion of circular economy (Loi anti-gaspillage pour une économie circulaire) is expected to be promulgated early 2020. With a recycling rate of 43% in 2017, France is not considered to be at risk of missing the European target of recycling 50 % of all municipal waste by 2020 (Commissariat Général au Développement Durable, 2016). Investments needed to reach EU recycling targets for municipal (65% by 2035) and
|
Box 4.5.8: Energy renovation of buildings
Final energy consumption fell by around 3.8% between 2012 and 2018 (-1.7% in climate-corrected terms), compared with a target of a 12.6% decrease between 2012 and 2023 in the 2018-2023 Multiannual Energy Plan adopted by France in 2017. Therefore, achieving the French energy efficiency targets for 2020 (i.e. about a 7.5% decrease of final energy consumption in 2020 compared to 2012) requires to strengthen efforts. The building and tertiary sectors represent 42% of final energy consumption. The building sector is the second largest emitter of greenhouse gas emissions after transport (respectively 23% and 40% of national emissions). The objectives set in the climate plan of July 2017 (500,000 renovations per year, including 150,000 thermal sieves) were not met in 2018 (estimates vary between 300,000 and 400,000). It is therefore necessary to change scale in terms of investments to achieve the required ‘massification’ of renovations. According to the French Institute for Climate Economics (I4CE), an additional €2 bn to €8 bn per year are required to renovate 500,000 buildings per year up to a ‘low consumption’ label.
The residential sector is the main market segment where increased efforts are most needed. For the tertiary sector, regulatory measures in place for buildings above 1000 m2 should allow achieving the ambitious energy savings targets by 2030, 2040 and 2050 (respectively -40%, -50% and -60% compared to 2010). Underpinned by a fully internalised economic logic, the renovation of commercial buildings is currently the main driver for renovation in France.
The residential sector counts 30 million primary residences: 8 million shared properties, 5 million social housings and 17 million individual houses. Some 7 to 8 million homes fall into the energy F and G classes (‘thermal sieves’), of which 1.5 million are inhabited by households in situation of energy poverty. The government created an observatory in September 2019 to centralise data and enable reliable monitoring.
Main pitfalls identified for deployment of investments include:
-The economic interest is not fully adopted by individuals (especially for deep renovations).
-Households who would most benefit from substantial renovations are usually those with limited resources.
-Available support schemes are scattered among various actors and hard to mobilise at once.
-Solutions are heterogeneous, suppliers numerous, and reported abuses have affected the level of trust.
-For rental property, asymmetric incentives between the landlords (who finance the investment) and the tenant (who stands to gain from the investment).
The government has focused its actions on the following:
-Priority to low and middle-income households, through the substitution of a tax credit by a premium, conditional to the level of income.
-Enhanced coordination by the constitution of a network of best practice and advisory services (Ease, accompany, inform on energy renovation, ‘Faciliter, accompagner, informer pour la renovation énergétique’, FAIRE), addressed to both customers and suppliers; financing is granted on a result-based basis for acts listed in the frame of the advisory services.
-Budget increase and pooling of budget resources into a single vehicle (Accompaying service for energy renovation, ‘Service d’accompagnement à la rénovation énergétique’, the SARE programme) endowed with €200 mn over three years, compared to €60 mn in the previous period. It is coupled with a progressive shift from State budget (value-added tax reduction, tax credit) to off-balance sheet sources such as the energy savings certificates scheme.
-Restore confidence in energetic renovation works, by strengthening controls and sanctions for companies that realise aggressive door-to-door selling for insulation and heat systems replacements.
Other challenges identified include:
-Deployment of banking solutions. Until their simplification in 2019, current zero-rate loans for energy efficiency limited to €30,000 per house unit were hardly sold in the market, in a context of low interest rates. The instrument is not compatible with broader renovation investments needs (like extension and aesthetic works), nor it can be blended with standard mortgages into a single product, guaranteed by a material underlying asset (the property). Nevertheless, those loans are often joined with a loan for broader renovation investments and a guarantee fund was set up in 2019 for lower income households.
-Support to alternative financing solutions. Energy service companies offer long-term financing for energy efficiency investments, and are remunerated by energy savings from the beneficiaries. Their business model is particularly adapted to clients with strong balance-sheet records such as public authorities and corporates. However, current accounting rules applicable to investments in public buildings’ renovation limits the access to and deployment of this market segment.
-Delayed restrictions for the rental of classes F and G homes, from 2023 for the less performing buildings (more than 500 or 600 kWh final energy/m²year), and energetic renovation obligation for all F and G buildings as of 2028. However, the implementation of increased constraints from 2021 by the Energy and Climate Law is to be noted.
|
packaging waste (70% by 2030) are estimated at €3.3 bn for 2021-2027, the highest absolute level in the EU (Eunomia, 2019) (see Graph 4.5.3). On biodiversity (SDG 15) France estimated the total costs of conservation and management of the Natura 2000 network for 2014-2020 at €1.4 bn (priority action framework). This figure is likely to be reassessed upwards for 2021-2027.
The agricultural part of the Great plan for investment (€5 bn) aims to transform the agricultural sector. The agriculture sector is important in France but has experienced a deterioration of its trade balance in recent years (albeit recovering in 2018). The plan supports the transformation and modernisation of farms to ensure sustainable and inclusive growth. In addition to co-financing by the European Agricultural Fund for Rural Development (EAFRD), a new scheme of loans backed by free public guarantees was put in place with the support of the Juncker Plan. Regarding innovation, more than €23 mn of national funds were mobilised to support the development of solutions contributing to reduced use of phytosanitary products. In line with societal expectations, the inter-professional organisations show increased interest in environmental and societal issues such as animal welfare and reducing the use of phytosanitary products. In 2018, organic crops represented 7.0% of the utilised agricultural area (in line with the EU average) and are increasing year-on-year.
In 2021-2027, the new Just Transition Fund will be set up to help ensure that the transition towards EU climate neutrality is fair by helping the most affected regions to address the social and economic consequences. France is the 7th lowest EU country in terms of greenhouse gas emission per capita. However, with 482 million tons of CO2 equivalent in 2017, France is the third emitter of CO2 in absolute terms. The NUTS3 regions (départements) with the highest greenhouse gas emission intensities are Bouches-du-Rhône in region Provence-Alpes-Côte d’Azur (energy, chemical and steel industry) and Nord in Hauts-de-France (steel industry). These industrial sectors are an important source of employment in the two regions as they provide for more than 150,000 jobs. Given the likely socioeconomic impact of the transition, the Just Transition Fund could focus its intervention on these regions. In both cases, the support should promote economic diversification and reskilling and increase the attractiveness of the regions for investments in line with the corresponding smart specialisation strategies (RIS3), which identify the sectors and activities with most potential
|
Graph 4.5.3:Capital investment needs for 2021-2027 in the waste sector (€ mn). Top 6 EU.
|
|
|
|
Source: European Commission
|
Sustainable policies: governance and transparency
France has launched a promising ‘green budgeting’ exercise to bring coherence with its climate commitments (see Section 4.1). Public spending identified as favourable to climate mitigation in the 2019 budget plan reached between €20 bn (I4CE, 2019b) and €33 to 36 bn (CGEDD 2019), whereas unfavourable spending is estimated between €17 and 25 bn, depending on the perimeter and expenditure category. In general, the ‘greening’ assessment of national budget needs to be translated into meaningful measures and further developed in the future, in order to analyse the impact of the entire budget (both expenditure and revenues) on climate mitigation and environmental long-term goals, once methodological tools will be stabilised.
The evaluation of existing policy measures should be systematised and strengthened. For instance, in the building sector, the main policy instruments for energy efficiency (the tax credit in favour of energy transition, CITE, which has been turned into a bonus scheme in 2020, and the energy savings certificates, CEE) lack rigorous assessment of their impact on the effective reduction of energy demand.
Challenges for environmental taxation
Efforts to increase the carbon tax have been suspended since 2019 following the social unrest. In 2014, France established a carbon tax as a part of its tax on fuels (TICPE). The carbon tax, initially set at €7/tCO2 was supposed to increase progressively to reach €100 by 2030. The increase has been stopped following the social unrest and stands currently at its 2018 value (€44.6).
Social fairness and accompanying measures are key to facilitate the acceptance of environmental taxation. A report from the Court of Auditors (Conseil des Prélèvements Obligatoires, 2019) calls to reinstate the planned carbon tax increase to meet France’s environmental objectives. Phasing out exemption or reduced rates on energy taxes granted to specific sectors would broaden the base, therefore helping to improve the effectiveness of the policy and increasing its acceptance. Compensation measures, in particular for the population groups that are the most exposed to costs induced by these policies, would also support acceptance. Energy-related spending (covering heating, electricity and transport needs) represent on average 16% of the available income for the bottom quintile households, while this share goes down to only 4.5% for the 20% highest income households. The living area has also an impact on energy poverty, as transport expenses tend to grow with urban sprawling. The report also underlines that the main purpose of the carbon tax should not be to raise revenues, but rather to change behaviours. French authorities have also opened a debate with the civil society (
), which could contribute to the reflection on a fairer and more effective environmental taxation. Addressing these challenges would contribute to progress on Sustainable Development Goal 10 - Reduced inequalities.
Removal of harmful fuel subsidies must be pursued. Specific tax measures such as tax reductions or exemptions largely contribute to the attractiveness of fossil energies. As pointed by the I4CE report on the draft budget 2020, most of the unfavourable spending take the form of tax spending (€16 bn out of 17) (I4CE, 2019b). Four tax measures alone imply that 25% of national greenhouse gases emissions are little or not taxed: (i) exemptions of excise duties on kerosene, (ii) reduced excise rates for heavy-load vehicles, (iii) non-road diesel and (iv) road diesel compared to gasoline.
Recently, France has implemented a gradual phase out of reduced rates for non-road diesel to be finalised by 2022 and a c€ 2 increase in fuel tax charged to road hauliers. The maximum ‘malus’ applied to new privately used vehicles from €12,500 to €20,000, to strengthen the market signal towards cleaner vehicles. France is among the Member States willing to open a debate at EU level on the taxation of kerosene for planes and marine fuel for boats.
Annex A: Overview Table
|
Commitments
|
Summary assessment (
)
|
|
2019 country specific recommendations (CRSs)
CSR 1: Ensure that the nominal growth rate of net primary expenditure does not exceed 1,2 % in 2020, corresponding to an annual structural adjustment of 0,6 % of GDP. Use windfalls gains to accelerate the reduction of the general government debt ratio. Achieve expenditure savings and efficiency gains across all sub-sectors of the government, including by fully specifying and monitoring the implementation of the concrete measures needed in the context of Public Action 2022. Reform the pension system to progressively unify the rules of the different pension regimes, with the view to enhance their fairness and sustainability.
Ensure that the nominal growth rate of net primary expenditure does not exceed 1,2 % in 2020, corresponding to an annual structural adjustment of 0,6 % of GDP.
Use windfalls gains to accelerate the reduction of the general government debt ratio.
Achieve expenditure savings and efficiency gains across all sub-sectors of the government, including by fully specifying and monitoring the implementation of the concrete measures needed in the context of Public Action 2022.
Reform the pension system to progressively unify the rules of the different pension regimes, with the view to enhance their fairness and sustainability.
|
France has made limited progress in addressing CSR 1 (this overall assessment of CSR1 does not include a compliance assessment of compliance with the Stability and Growth Pact) :
The compliance assessment with the Stability and Growth Pact will be included in Spring when final data for 2019 will be available.
The compliance assessment with the Stability and Growth Pact will be included in Spring when final data for 2019 will be available.
No progress. Although efficiency gains can be expected from its implementation, the contribution of ‘Public Action 2022’ to the objective of reducing public spending by more than 3 percentage points of GDP over the presidential term is not at all specified. The programme does not envisage either an upfront or a concurrent quantification of the expected savings and macroeconomic impacts. Although it formally and fully replaces annual spending reviews as of 2018, the implications of this programme on the size and composition of public spending is lacking. Moreover, when information on potential savings is available, the savings are limited and their trajectory over time is not mentioned in any detail. That said, some of the measures under Public Action 2022 might actually imply an increase in spending.
Limited progress. The pension reform, originally announced for 2019, has been postponed. The draft law was sent to the parliament in February and its adoption is now planned in 2020 for implementation as of 1 January 2022 This reform intends to introduce a universal point-based system, replacing the currently co-existing 42 pension regimes. According to announcements, the new system aims to calculate the pension rights over the whole career for all categories of workers. The government has engaged in a broad consultation with social partners and stakeholders to gather the broadest consensus possible. The first generation concerned by the reform would be those born in 1975. For those already in the current system, only the years contributed to after 2025 would be calculated under the new system. Social partners would be responsible for guaranteeing the financial balance of the pension system. The return to balance of the pension system should be reached in 2027.
|
CSR 2: Foster labour market integration for all job seekers, ensure equal opportunities with a particular focus on vulnerable groups including people with a migrant background and address skills shortages and mismatches.
Foster labour market integration for all job seekers, ensure equal opportunities with a particular focus on vulnerable groups including people with a migrant background
and address skills shortages and mismatches.
|
France has made limited progress in addressing CSR 2.
Limited progress has been made to foster labour market integration and ensure equal opportunities. On labour market integration, a number of measures have been announced or formally adopted. Their scope remains however limited and their deployment or actual effects have yet to be assessed. The Public Employment Service (Pôle Emploi) strategy was renewed and signed in January 2020. It provides additional guidance means in favour of job seekers, and ensure a better match with employers’ recruitment needs. Limited measures and additional means have been provided to ensure equal opportunities. Their level of ambition still appear limited considering the significant challenges faced by vulnerable groups in terms of both educational outcomes and integration into the labour market. Halving the class size in the first two grades to all disadvantaged schools implemented in September 2019 will not benefit an estimated 70% of disadvantaged pupils, as it has not been rolled out in targeted schools. Measures specifically targeting migrants have been rolled out since March 2019 through the reform of the national integration programme for newcomers, but its actual implementation remains to be seen.
Some progress has been made in addressing skills shortages and mismatches in particular by implementing initial vocational education and training (VET) system reforms and improved access to lifelong learning. Access to lifelong learning through a revised, euro-based, personal training account granting increased rights to low-qualified and part-time workers is being enabled by the launching web-based application since November 2019. Free-of-charge targeted guidance, through the ‘Conseil en evolution professionnelle’, should be delivered at regional level. The quality and effect of the guidance on the use of the personal training account, particularly for more vulnerable people, needs further assessment. Limited progress has also been made addressing skills shortages. The main measures to address sectoral and macro-economic skills shortages are just at a preliminary stage, without any meaningful results for time being. For instance, several skills intelligence and forecasting exercises are being announced but have yet to be carried out.
|
|
CSR 3: Focus investment-related economic policy on research and innovation (while improving the efficiency of public support schemes, including knowledge transfer schemes), renewable energy, energy efficiency and interconnections with the rest of the Union, and on digital infrastructure, taking into account territorial disparities.
Focus investment-related economic policy on research and innovation (while improving the efficiency of public support schemes, including knowledge transfer schemes),
renewable energy, energy efficiency and interconnections with the rest of the Union,
and on digital infrastructure, taking into account territorial disparities.
|
France has made some progress in addressing CSR 3.
Limited progress. Some evaluations of the R&D tax incentive (Crédit d'Impôt Recherche) have been carried out and point to a limited impact on innovation. Additional impact studies, focused on macroeconomic aspects, are on-going. The Innovation and Industry Fund is not yet operational as pointed by the Court of Auditors. More incentives for researchers working in the public sector to collaborate with industry have been proposed in the PACTE Law. Overall, the R&D&I system in France remains very complex with numerous funding tools and structures.
Some progress. France has been at the forefront in adopting commitments to fight climate change. France is likely to achieve its 2020 target to reduce greenhouse gas emissions, but is projected to miss its target on renewables. However, additional investment needs were properly quantified and planned through the Pluriannual programming energy law. Regarding energy interconnections, new electricity interconnectors are under development between France and Spain.
Some progress. The main policy tool to address regional disparities in digital infrastructure is the plan French ultrafast broadband Plan (France Très Haut Débit). It aims at covering the whole territory with ultrafast broadband (fiber-to-the-home for 2022) by fostering private investment and compensating the lack of projects in remote areas with public investment (for a total of €3.3 bn in public spending).
|
|
CRR 4: Continue to simplify the tax system, in particular by limiting the use of tax expenditures, further removing inefficient taxes and reducing taxes on production. Reduce regulatory restrictions, in particular in the services sector, and fully implement the measures to foster the growth of firms.
Continue to simplify the tax system, in particular by limiting the use of tax expenditures, further removing inefficient taxes and reducing taxes on production.
Reduce regulatory restrictions, in particular in the services sector,
and fully implement the measures to foster the growth of firms.
|
France has made Some progress in addressing CSR4.
Some progress has been made in simplifying the tax system, in particular by implementing successfully the ESSOC law and withholding personal income tax. The 2020 Budgetary Plan builds on previous efforts to eliminate low taxes and phase out or cut several tax expenditures. In addition, French authorities have also announced an evaluation programme of 70 tax expenditures for 2020-2023. However, no progress has been made to reduce taxes on production factors, despite having been repeatedly identified as being a risk bearing on France's competitiveness.
Limited progress. On reducing regulatory restrictions, progress has been limited: regulatory restrictions were lifted in some areas but strengthened in others. Some competition-enhancing measures were adopted for the sale of automotive parts and driving schools under the LOM law and for complementary health insurance. Competition-enhancing measures were announced for other sectors (real estate property management (syndics), medical analysis laboratories, on-line sale of medicines, fintechs). The retail sector has been hit by additional restrictions on the period of sales (PACTE law), on promotion of food products (EGalim law), and on establishment of large shops (ELAN law).
Substantial progress. The implementation of the PACTE law is well advanced. At the beginning of December 2019, 100 out of 137 measures were already implemented. The key measure to foster firms’ growth (rationalisation of size-related regulatory thresholds and transition period) took effect on 1 January 2020.
|
|
Europe 2020 (national targets and progress)
|
|
|
Employment rate target: 75 % of population aged 20 to 64
|
The employment rate for workers aged 20-64 was 71.3% in 2018, up from 70.6% since 2017.
It has stabilised in the third quarter of 2019 with a 71.7% employment rate in metropolitan France in the third quarter. However, the 75% target remains out of reach at this stage, in spite of continued job creations in the private sector.
|
|
R&D target: 3.0 % of GDP
|
R&D intensity in 2018(
) was at 2, 20% up from 2, 02% in 2007 and at 2.19% in 2017, a decrease from 2016, where it stood at 2.24 (EU average is 2.11%)
Public R&D intensity (
) has been stable the last two years and stood, at 0.73% in 2018 and at 0.73% in 2017, however with a decrease from 0.78% recorded for 2016 (EU average is 0.69%)
Business R&D intensity (
) has increased since 2007 where it stood at 1. 28% and since 2012, has remained rather stable, from 2016 (1.43%), 2017 (1.42%) and 1.44% in 2018 (EU average is 1.41%)
|
|
National greenhouse gas (GHG) emissions target:
-14 % in 2020 compared with 2005 (in sectors not included in the EU emissions trading scheme)
|
Based on the latest national projections and existing measures, non-ETS emissions will fall by 13 % between 2005 and 2020.
The -14 % target is therefore expected to be just missed, by a margin of one percentage point.
|
|
Renewable energy target: 23 %, with a share of renewable energy in all modes of transport equal to 10.5%
|
In 2018, according to Eurostat data, the share of renewable energy in gross final energy consumption reached 16.6%, which is below the interim target of 18.6% set in the national renewable energy action plan (NREAP) presented in 2009 to pave the way towards its 2020 objective of 23%.
The tenders organised under the ("complément de remunération") scheme equivalent to a feed-in-premium (implemented since 1 January 2016 should help France in achieving its 2020 target.
On renewable energy share in heating & cooling, the national renewable energy action plan projects a share of 33 % for in 2020. However, since 2010, actual deployment has constantly been below the planned trajectory (in 2018, the share of renewables in heating and cooling reached 21.8%). Moreover, the spread between the anticipated share and the effective share has increased. According to the EUreference scenario 2016, France is projected to miss its anticipated 2020 value, despite several measures to promote renewables in the heating and cooling sector.
In transport, according to the plan, the expected national share of renewable energy in the transport sector is 10.5 % by 2020. Since 2010, France has been on track to meet its planned trajectory. If the current trend is maintained (9.1 % in 2017), France is projected to be almost in line in with its 2020 projections. Due to a major diesel fuelled car market, France is by far the top European biodiesel consumer. France owns a structured biodiesel industry with some of the main European producers.
|
|
Energy efficiency target: 219.9 million tons of oil equivalent (Mtoe) for the primary energy consumption and 131.4 Mtoe for the final energy consumption
|
Since 2005, France has decreased its primary energy consumption by 8 % to reach 239.5 million tons of oil equivalent (Mtoe) in 2017 and its final energy consumption has also decreased by 7% to reach 148.9 Mtoe in 2017, whereas GDP increased by 15.2% over the same period. These figures - together with primary energy intensity that decreased by a 1.7 % annual average rate since 2005 – reflects the general decoupling between economic growth and energy consumption.
However, even if France has reduced the gap towards its indicative national 2020 targets for energy efficiency, the rapid and thorough implementation of the energy transition for green growth Act of 2015 is required to further tap into the significant potential for energy demand reductions in areas such as the building sector. Additional efforts should be envisaged to accelerate the energy renovation of residential buildings and development of demand-side response.
|
|
Early school/training leaving target: 9.5 %
|
The French early school leaving rate remained stable at 8.9 % in 2018 from 8.9 % in 2017, remaining under the Europe 2020 target.
Despite an early school leaving rate below the EU average, significant regional disparities remain. There are still too many young people who leave education with at most a lower secondary level diploma, particularly in the outermost regions, where the labour market prospects have not significantly improved, in respect of metropolitan France.
|
|
Tertiary education target: 50 % of population aged 17-33.
|
The French tertiary education attainment rate for the population aged 30-34 years was 46.2% in 2018, further increasing from 44.3% in 2017. This is above the EU tertiary education target of 40%.
Women (51.2%) are consistently outperforming men (41.0%) in the attainment rate.
|
|
Target for reducing the number of people at risk of poverty or social exclusion target: -1 900 000 in cumulative terms since 2007.
|
The number of people at-risk-of-poverty or social exclusion decreased in cumulative terms from 2008 of 106,000 units, marking a regression in respect of previous years’ improvements.
|
Annex B: Debt Sustainability Assessment
Annex C: Standard Tables
|
|
|
Table C.1:Financial market indicators
|
|
|
|
Source: European Commission (long-term interest rates); World Bank (gross external debt); Eurostat (private debt); ECB (all other indicators).
|
|
|
|
|
|
Table C.2:Headline Social Scoreboard indicators
|
|
|
|
Source: Eurostat
|
|
|
|
|
|
Table C.3:Labour market and education indicators
|
|
|
|
Source: Eurostat, OECD
|
|
|
|
|
|
Table C.4:Social inclusion and health indicators
|
|
|
|
Source: Eurostat, OECD
|
|
|
|
|
|
Table C.5:Product market performance and policy indicators
|
|
|
|
Source: European Commission; World Bank — Doing Business (for enforcing contracts and time to start a business); OECD (for the product market regulation indicators); SAFE (for outcome of SMEs' applications for bank loans).
|
|
|
|
|
|
Table C.6:Green Growth
|
|
|
|
Source: European Commission and European Environment Agency (Share of GHG emissions covered by ETS); European Commission (Environmental taxes over labour taxes and GDP); Eurostat (all other indicators).
|
|
|
Annex D: Investment guidance on Just Transition Fund 2021-2027 for France
Building on the Commission proposal, this Annex (
) presents the preliminary Commission services’ views on priority investment areas and framework conditions for effective delivery for the 2021-2027 Just Transition Fund investments in France. These priority investment areas are derived from the broader analysis of territories facing serious socio-economic challenges deriving from the transition process towards a climate-neutral economy of the Union by 2050 in France, assessed in the report. This Annex provides the basis for a dialogue between France and the Commission services as well as the relevant guidance for the Member States in preparing their territorial just transition plans, which will form the basis for programming the Just Transition Fund. The Just Transition Fund investments complement those under Cohesion Policy funding for which guidance in the form of Annex D was given in the 2019 Country Report for France ().
In France, the regions (départements) with the highest GHG emission intensities are Bouches-du-Rhône, which is part of the region Provence-Alpes-Côte d’Azur, and Nord, which is part of the region Hauts-de-France. The high intensities are caused mostly by energy, chemical and steel industries in Bouches-du-Rhône; the steel industry is also present in Nord. These industrial sectors are an important source of employment in the two regions as they provide for almost 153,000 jobs.
Following France’s commitment to reach carbon neutrality by 2050, the carbon intensity of the industry in the two regions highlights the scale of the decarbonisation challenge, suggesting that several sectors would be likely to undergo substantial restructuring in their industrial processes, with a likely significant socio-economic impact. Based on this preliminary assessment, it appears warranted that the Just Transition Fund concentrates its intervention on these regions.
In order to tackle these transition challenges, investments needs have been identified to diversify the regional economy and alleviate the socio-economic costs of the transition. The smart specialisation strategies () of these regions provide an important framework to set priorities for innovation in support of economic transformation.. In addition, Hauts-de-France is funding the digitalisation of local SMEs in the framework of the European Commission pilot action “Regions in Industrial Transition”. The Just Transition Fund could complement these efforts by targeting its actions in particular on:
•investments in the creation of new firms, including through business incubators and consulting services;
•investments in the deployment of technology and infrastructures for affordable clean energy, in greenhouse gas emission reduction, energy efficiency and renewable energy;
•investments in research and innovation activities and fostering the transfer of advanced technologies;
•upskilling and reskilling of workers.
Industrial sites in the départments of Bouches-du-Rhône and Nord, performing activities listed in Annex I to Directive 2003/87/EC, employ a substantial number of workers and their activity is at risk due to their high greenhouse gas emissions. Support to investments to reduce the emissions could be considered, provided that they achieve a substantial reduction of emissions (going substantially below the relevant benchmarks used for free allocation under Directive 2003/87/EC) and on the condition that the investments are compatible with the European Green Deal.
Annex E: Sustainable Development Goals
Assessment of France’s short-term progress towards the SDGs ()
Table E.1 shows the data for France and the EU28 for the indicators included in the EU SDG indicator set used by Eurostat for
monitoring progress towards the SDGs in an EU context
(). As the short-term trend at EU-level is assessed over a 5-year period, both the value at the beginning of the period and the latest available value is presented. The indicators are regularly updated on the
SDI dedicated section
of the Eurostat website.
|
|
|
Table E.1:Indicators measuring France’s progress towards the SDGs
|
|
|
|
|
|
(Continued on the next page)
|
|
Table (continued)
|
|
|
|
|
|
|
|
(Continued on the next page)
|
|
Table (continued)
|
|
|
|
|
|
|
|
(Continued on the next page)
|
|
Table (continued)
|
|
|
|
|
|
|
|
(Continued on the next page)
|
|
Table (continued)
|
|
|
|
|
|
Source: Eurostat
|
References
Alstadsæter A., Jacob M. and Michaely R. (2017), Do dividend taxes affect corporate investment? Journal of Public Economics 151, 74–83.
Autorité de la concurrence (2018), Avis 18-A-14 du 23 novembre 2018 relatif au relèvement du seuil de revente à perte et à l’encadrement des promotions pour les denrées et certains produits alimentaires.
Autorité de contrôle prudentiel (ACPR, 2018), Enquête annuelle sur le financement de l’habitat en 2017.
Banque de France (2019a), Compétitivité prix et hors-prix : Leçons des chaînes de valeur mondiales, Cézar R. et Cartellier F., Le Bulletin de la Banque de France n°224.
Banque de France (2019b), Le recours croissant des grands groupes français à l’endettement : une stratégie de financement qui montre ses limites, Le Bulletin de la Banque de France n°226/4.
Banque Publique d'Investissement (2019) Génération Deeptech: Bpifrance présente son Plan Deeptech, accompagné d’un référentiel dédié, pour démultiplier ses actions de soutien à l’innovation de rupture en France, Communiqué de presse, Bpifrance – 30 January 2019.
Bauer, P., Fedotenkov, I., Genty, A., Hallak, I., Harasztosi, P., Martinez Turegano D., Nguyen D., Preziosi, N., Rincon-Aznar, A., Sanchez Martinez, M. (2020), Productivity in Europe – Trends and drivers in a service-based economy, JRC Technical Report, European Commission.
Berta, Ph, Maugain, Ph., Tunon de Lara, M. (2019), Loi de programmation pluriannuelle de la recherche : Groupe de travail 2, Attractivité des emplois et des carrières scientifiques.
Blonigen and Piger (2014), Determinants of foreign direct investment, Canadian Journal of Economics vol. 47, issue 3, 775-812.
Borello, J-M (2018), Donnons-nous les moyens de l’inclusion, Rapport à la Ministre du Travail.
Buigues and Lacoste (2016), Les stratégies d’internationalisation des entreprises françaises et des entreprises allemandes : deux modèles d’entrée opposés, Annales des Mines – Gérer et comprendre n°124.
Burton and Kizior (forthcoming), Measuring quality of French exports, European Economy, Economic Brief.
Caritas Europa (2019), Country report 2019 France: access to services by vulnerable groups: barriers, obstacles and good practices.
CB Insights (2019), Tech Funding Trends in France Q2 2019. Cedefop (2018), Skills for green jobs: an update.
Cedefop (2018), France - 2018 Skills forecast.
CEREQ (2017), Mesure et analyse des discriminations d'accès à l'apprentissage.
Cette G., Lopez J. and Mairesse J. (2018), Rent creation and sharing: New measures and impacts on TFP, NBER working paper series, n°24426.
CGEDD (2019) Green budgeting: proposition de méthode pour une budgétisation environnementale, CGEDD (conseil général de l'environnement et du développement durable).
Chouat, F., Marey-Semper, I., Vernay, D. (2019) Loi de programmation pluriannuelle de la recherche : Groupe de travail 3, Recherche partenariale et innovation.
Commissariat Général au Développement Durable (2016), Indicateurs nationaux de la transition écologique vers un développement durable 2015-2020: premier état des lieux, Etudes et documents No 142, mars 2016.
Conseil d’Analyse Economique (2019a), Taxes on Production: The Good, the Bad and the Ugly, Les notes du conseil d’analyse économique, no 53, June 2019.
Conseil d’Analyse Economique (2019b), Pour le climat : une taxe juste, pas juste une taxe, Les notes du conseil d’analyse économique, no 50, Mars 2019.
Conseil des Prélèvements obligatoires (2019), La Fiscalité environnementale au défi de l’urgence climatique, September 2019.
Conseil National de Productivité (2019), Productivité et compétitivité : où en est la France dans la zone euro ?, Premier rapport du Conseil National de Productivité.
Couppié, T. & Gasquet, C. (2018). Comment l’apprentissage favorise-t-il l’insertion professionnelle des CAP-BEP ?. Formation emploi, 142(2), 35-56.
Cour des Comptes (2018a), L’éducation prioritaire – Rapport d’évaluation d’une politique publique
Cour des Comptes (2018b), Les outils du PIA consacrés à la valorisation de la recherche publique, Rapport publique thématique.
Cour des Comptes (2019), Le budget de l’Etat en 2018.
Coutinho, L., Turrini, A. and Zeugner S. (2018), Methodologies for the Assessment of Current Account Benchmarks, European Commission, Discussion paper 086.
Défenseur des droits (2019), 12ème baromètre de la perception des discriminations dans l’emploi (Edition consacrée aux discriminations syndicales, September 2019.
DG Trésor (2019a), Le développement des contrats de très courte durée en France, Trésor-Éco n° 238.
DG Trésor (2019b), Spécialisation productive et compétitivité de l’économie française, Trésor-éco n°248.
European Banking Authority (2019), Basel III reforms: Impact study and key recommendations, 2019.
Eunomia (2019), Study on investment needs in the waste sector and on the financing of municipal waste management in Member States, Eunomia, COWI, June 2019.
European Investment Bank (2019), EIB group survey on investment and investment finance, 2019.
European Commission (2016), Staff Working Document on reform recommendations for regulation in professional services, SWD (2016) 436 final.
European Commission (2017), Benchmarks for the assessment of private debt, European Commission note to LIME, October 2017.
European Commission (2018a), Envisaged revision of selected auxiliary indicators of the MIP scoreboard, Technical note.
European Commission (2018b), Fundamentals-based private debt benchmarks: enhance sample and robustness checks, European Commission note to LIME, June 2018.
European Commission (2018c), The 2018 Ageing Report: Economic and Budgetary Projections for the EU Member States (2016-2070), Economic and Financial Affairs, Institutional papers 079.
European Commission (2018d), A European retail sector fit for the 21st century, COM(2018) 219 final.
European Commission (2019a), European Economic Forecast, Autumn 2019, ECFIN institutional paper 115.
European Commission (2019b), Alert Mechanism Report 2020.
European Commission (2019c), 2019 European Semester: Assessment of progress on structural reforms, prevention and correction of macroeconomic imbalances, and results of in-depth reviews under Regulation (EU) No 1176/2011.
European Commission (2019d), Country Report France 2019, COM(2019) 150 final.
European Commission (2019e), Labour market and wage developments in Europe (Annual review 2019).
European Commission (2019f), Education and Training Monitor 2019 - France.
European Commission (2019g), European Social Policy Network, Report on national strategies to fight homelessness and housing exclusion (France), p. 13.
European Commission (2019h), European Innovation Scoreboard 2019.
European Commission (2019i), 2019 Small Business Act fact sheet – France.
European Commission (2019j), Employment and Social Developments in Europe 2019.
European Commission (2020a), Winter interim forecast, European Economy Institutional Paper 121, February 2020.
European Commission (2020b), 2019 Debt Sustainability Monitor, Institutional Paper 120, January 2020.
European Commission (2020c), Digital Agenda Scoreboard (
https://digital-agenda-data.eu/datasets/digital_agenda_scoreboard_key_indicators/visualizations
)
European Institute for Gender Equality (2019), Gender Equality Index 2019.
European Systemic Risk Board (2019), Warning of the European Systemic Risk Board of 27 June 2019 on medium-term vulnerabilities in the residential real estate sector in France, ESRB/2019/12.
EY (2020), Baromètre 2020 de l’attractivité industrielle en France.
Flachenecker, F., Gavigan, J., P., Goenaga, X., Pasi, G., Preziosi, N., Stamenov, B., Testa, G., (2020). High Growth Enterprises: demographics, financing & policy measures. JRC Technical Report. European Commission.
Fondation Abbé Pierre (2019a), 24e Rapport sur l’Etat du Mal-Logement en France, p. 163.
Fondation Abbé Pierre (2019b), Dossier de Presse : fin de la trêve des expulsions locatives, Paris, p. 3.
France Stratégie (2019a), Comité d’évaluation des réformes de la fiscalité du capital (Premier rapport), Octobre 2019
France Stratégie (2019b), Les procédures de défaillance à l’épreuve des entreprises zombie, Note d’analyse n°82, Octobre 2019.
France Stratégie (2019c). L’impact du crédit d’impôt recherche, Commission nationale d’évaluation des politiques d’innovation.
France Stratégie (2019d), La valeur de l’action pour le climat, rapport de la commission présidée par Alain Quinet, France Stratégie, février 2019.
Groupe d'experts sur le SMIC (2019), Rapport annuel, 28 Novembre 2019.
Guillou S., Lallement R., Mini C. (2018), L’investissement des entreprises françaises est-il efficace ?, Les notes de la Fabrique, France Stratégie et La Fabrique de l’Industrie.
Haut Conseil de Stabilité Financière (2019a), Diagnostic des risques dans le secteur d’immobilier résidentiel, Note du 17/10/19
Haut Conseil de Stabilité Financière (2019b), Communiqué de presse. 12/12/2019.
I4CE (2019a), Panorama des financements climat, édition 2019, I4CE (Institute for Climate Economics).
I4CE (2019b), Une évaluation climat à 360° du budget de l’Etat, Octobre 2019, I4CE (Institute for Climate.
IMF (2019), France Article IV Staff Report.
INSEE (2018), Tableaux de l'économie française, Collection Insee Références Édition 2018.
INSEE (2019a), INSEE Premiere n°1740, Mars 2019.
INSEE (2019b), Le Rôle des origines dans la persistance des inégalités d’emploi et de salaire, INSEE Reference.
INSEE (2019c), Note de Conjoncture, Décembre 2019
INSEE (2019d), Eclairage Barrières à l'embauche déclarées dans les enquêtes de conjoncture, Note de Conjoncture juin 2019.
INSEE (2019e), INSEE Premiere n°1783, Novembre 2019.
IPP (2019a), Quelles leçons tirer des réformes de la fiscalité des revenus du capital ?, Note IPP n°46
IPP (2019b) L. Bach, A. Bozio, B. Fabre, A. Guillouzouic, C. Leroy and C. Malgouyres (2019), Évaluation d’impact de la fiscalité des dividendes, Rapport IPP n°25 - Octobre 2019.
IPP (2019c), Budget 2019 : quels effets pour les ménages ?, Janvier 2019.
Ministère de l’Education Nationale et de la Jeunesse (2019a), Le diplôme et la conjoncture économique demeurent déterminants dans l'insertion des apprentis, Note d'information de la DEPP, n° 19.11 (avril 2019).
Ministère de l’Education Nationale et de la Jeunesse (2019b), Formation continue – Schema directeur de la formation continue des personnels de l’éducation nationale 2019-2022
Ministère des Solidarités et de la Santé (2018), Stratégie nationale de prévention et de lutte contre la pauvreté,
https://solidarites-sante.gouv.fr/IMG/pdf/strategie_pauvrete_vfhd.pdf
, retrieved the 28 October 2019, p. 11.
Ministère du Travail, DARES (2016), Enquête Offre d’emploi et recrutement (Ofer) : édition 2016.
Ministère du Travail, DARES (2019a), L’emploi intérimaire au deuxième trimestre 2019.
Ministère du Travail (2019b), Dossier de presse, Index de l’Égalité professionnelle femmes-hommes (Septembre 2019).
OECD (2018a), Catching up? Country Studies on Intergenerational Mobility and Children of Immigrants.
OECD (2018b), Effective Teacher Policies: Insights from PISA
OECD (2019a), Economic Survey of France.
OECD (2019b), Individual Learning Accounts: Panacea or Pandora's Box?, OECD Publishing, Paris.
OECD (2019c), TALIS 2018 Results.
OECD (2019e), 2018 Update of the OECD PMR Indicators and Database - Policy Insights for OECD Countries, OECD Economics Department Working Papers.
Pleace, N. (2015) At what cost? An estimation of the financial costs of single homelessness in the UK. London: Crisis.
Pôle Emploi (2019), Enquête Besoins de main d’œuvre 2019.
Rexecode (2019), La compétitivité française en 2018, Document de travail n°71, Juin 2019.
Salies, E. (2017). Etude d'impact du crédit d'impôt recherche, une revue de la littérature, L’Observatoire français des conjonctures économiques (OFCE).
Signorelli S. (2019), Do skilled migrants compete with native workers? PSE Working Paper, 2019.
Turrini, A. and Zeugner, S. (2019), Benchmarks for net international investment positions, Journal of International Money and Finance.
Unedic (2019), Étude d’impact de la réforme de l’Assurance chômage 2019.
Union sociale pour l’habitat (2019a), Les locataires hlm et les demandeurs.
Union Sociale pour l’habitat (2019b), Les HLM, un modèle Français : les HLM en chiffres, Paris.
Vidal, F. (2019) Lettre de mission du Ministère de l'Enseignement Supérieur, de la Recherche et de l'Innovation.
World Economic Forum (2019), The Global Competitiveness Report 2019.
Yagan D. (2015), Capital tax reform and the real economy: The effects of the 2003 dividend tax cut, American Economic Review 105(12), 3531–63.
-
(I)
()European Regional Development Fund, European Social Fund, Youth Employment Initiative, including national co-financing.
-
(II)
()
https://cohesiondata.ec.europa.eu/countries/FR
. Note: for the programs for which data were not reported by the regulatory deadline of 31.01.2020, the previously reported data were used.
-
(III)
()The performance review is regulated by Article 22 of Regulation (EU) No 1303/2013, whereby 5-7% of overall resources allocated are released to performing priority axes of the operational programmes, the amount includes national co-financing.
-
(IV)
()Member States’ reporting on financial instruments based on Article 46 of Regulation No 1303/2013, cut-off date 31/01/2020.
-
(V)
()Detailed information on the QUEST model and applications is available at:
http://ec.europa.eu/economy_finance/research/macroeconomic_models_en.htm
. In this simulation, monetary policy rates in the euro area are assumed to remain unchanged during the first two years.
-
(VI)
()For a purpose of illustration, the Grand Plan d'Investissement aims at mobilising €57 bn of investments in France in 2018-2022, for sustaining the environmental transition (€21 bn), enhancing skills (€15 bn), improving innovation (€14 bn), and digitalising public services (€8 bn). The € 57 bn investment plan amounts to around 2.5% of GDP over 5 years.
-
(VII)
()Rest of the euro area inflation increases temporarily due to higher demand and a euro depreciation, whereas nominal rates are initially stuck at the zero bound.
-
(VIII)
()EUROMOD simulates benefit entitlement and tax liabilities according to the rules applicable in each Member State.
-
(IX)
()Statistiques sur les Ressources et les Conditions de Vie (2016).
-
(X)
()Equivalised disposable income thresholds in EUROMOD are somewhat higher than those reported by INSEE. They are based on two different surveys: European Union statistics on income and living conditions (EU-SILC) for EUROMOD and Enquête revenus fiscaux et sociaux (ERFS) for INSEE.
-
(XI)
()The scenario is in line with the DG Tresor study (Trésor-Eco. n226 – Quel effet macroéconomique du PACTE?).
-
(XII)
()Detailed information on the QUEST model and its applications are available at
http://ec.europa.eu/economy_finance/research/macroeconomic_models_en.htm
. In this simulation, monetary policy rates in the euro area are assumed to remain at the zero bound for the first two years.