EUROPEAN COMMISSION
Brussels, 26.2.2020
SWD(2020) 520 final
COMMISSION STAFF WORKING DOCUMENT
Country Report Poland 2020
Accompanying the document
COMMUNICATION FROM THE COMMISSION TO THE EUROPEAN PARLIAMENT, THE EUROPEAN COUNCIL, THE COUNCIL, THE EUROPEAN CENTRAL BANK AND THE EUROGROUP
2020 European Semester: Assessment of progress on structural reforms, prevention and correction of macroeconomic imbalances, and results of in-depth reviews under Regulation (EU) No 1176/2011
{COM(2020) 150 final}
Contents
Executive summary
1.Economic situation and outlook
2.Progress with country-specific recommendations
3.Reform priorities
3.1.Public finances and taxation
3.2.Financial sector22
3.3.Labour market, education and social policies24
3.4. Competitiveness, reforms and investments32
3.5. Environmental sustainability41
Annex A: Overview Table46
Annex B: Commission debt sustainability analysis and fiscal risks52
Annex C: Standard Tables53
Annex D: Investment guidance on Just Transition Fund 2021-2027 for Poland59
Annex E: Progress towards the Sustainable Development Goals61
References66
LIST OF Tables
Table 1.1:Key economic and financial indicators - Poland
Table 2.1:Assessment of implementation of 2019 country-specific recommendations
Table 3.2.1:Banking sector financial stability indicators
Table C.1:Financial market indicators
Table C.2:Headline Social Scoreboard indicators
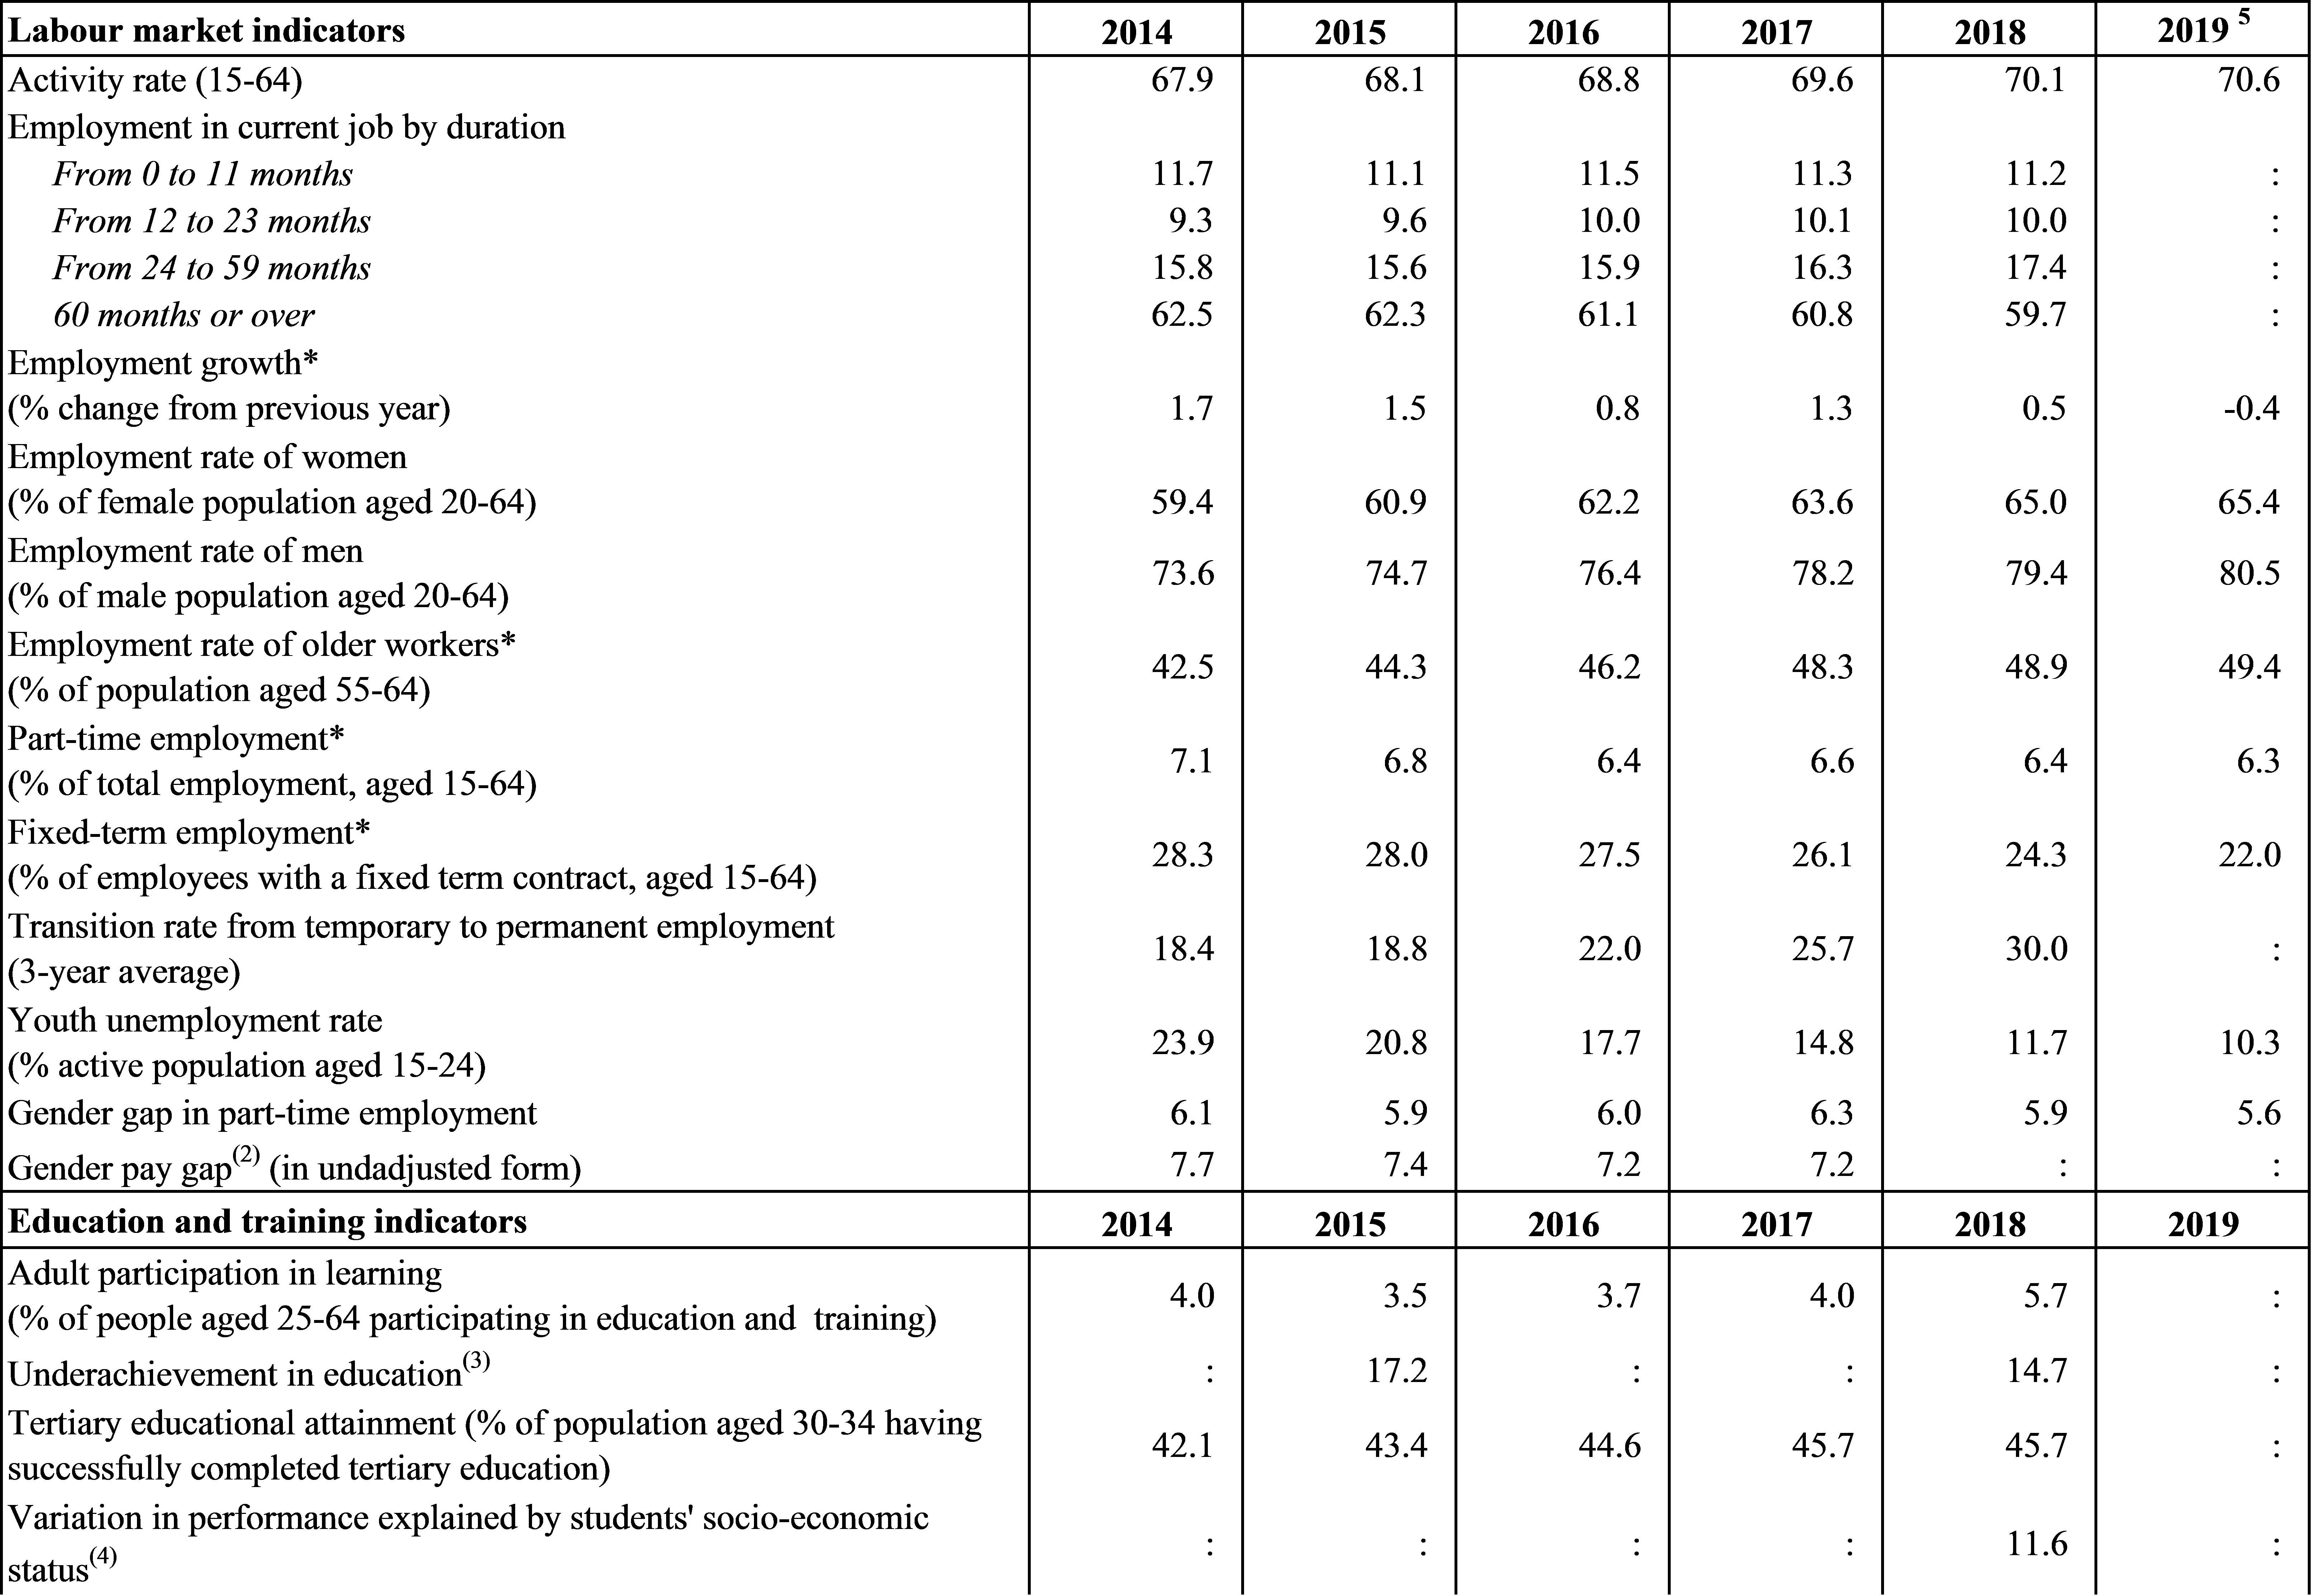
Table C.3:Labour market and education indicators
Table C.4:Social inclusion and health indicators
Table C.5:Product market performance and policy indicators57
Table C.6:Green growth58
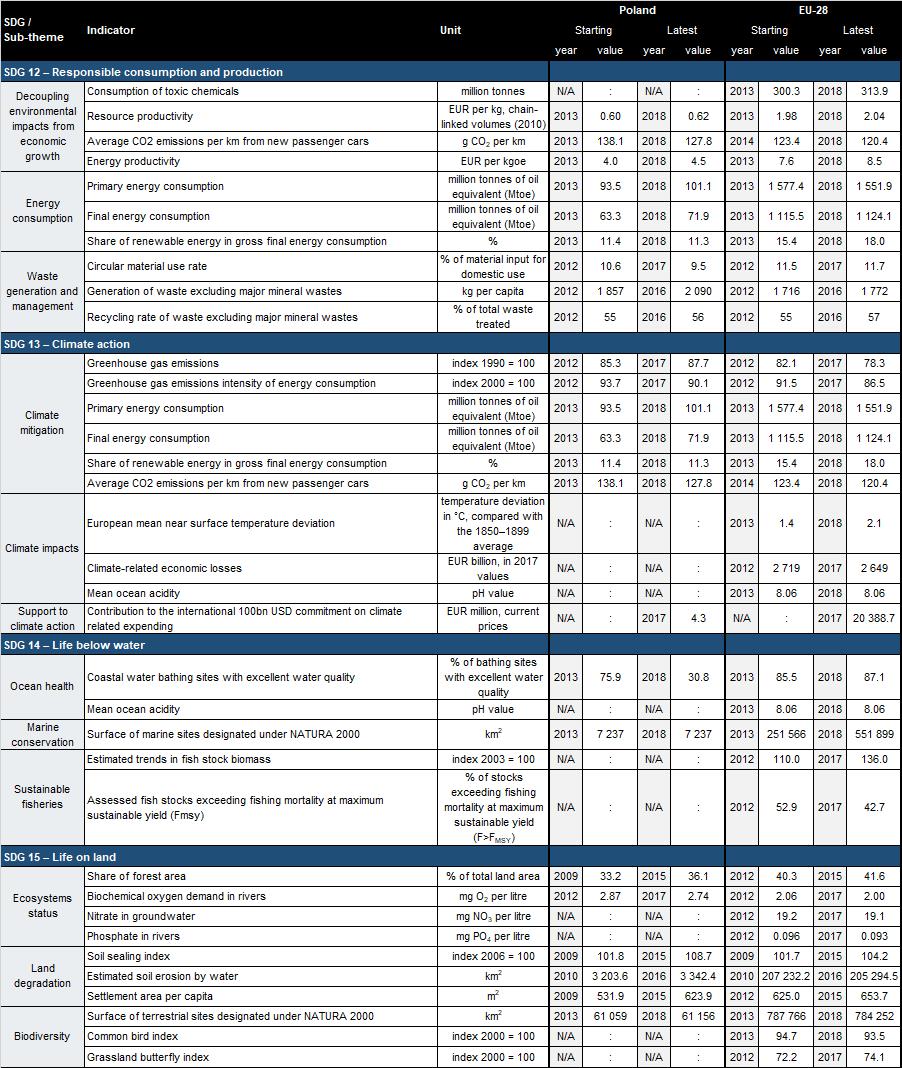
Table E.1:Indicators measuring Poland’s progress towards the SDGs61
LIST OF Graphs
Graph 1.1:
Real GDP per capita, 2008-2018
Graph 1.2:
Consumer confidence
Graph 1.3:
Labour productivity in market services
Graph 1.4:
Employment, wages and unemployment rate
Graph 1.5:
Gini coefficient of equivalised disposable income, 2008-2018
Graph 1.6:
Index of concentration of goods exports, 2018
Graph 2.1:
Overall multiannual implementation of 2011-2019 CSRs to date
Graph 3.1.1:
General government revenue and expenditure change, fiscal deficit, 2010-2021
Graph 3.1.2:
Tax revenue dynamics
Graph 3.1.3:
Time to comply with tax obligations for a medium-sized company, 2010-2019
Graph 3.1.4:
Medium-term public debt scenarios
Graph 3.3.1:
Employment rate in Poland, 2018
Graph 3.3.2:
Differences in employment rates between Poland and EU, 2019 (p.p.)
Graph 3.3.3:
Working time flexibility for care and inactivity due to family or caring responsibilities, 2018
Graph 3.4.1:
Investment rates
Graph 3.4.2:
Freight transport performance in billion tonne-kilometers (tkm)
Graph 3.5.1:
Greenhouse gas emissions per capita in ten EU countries with the highest emissions in 2017
Graph 3.5.2:
Indigenous production of hard coal
Graph 3.5.3:
Share of solid fossil fuels in final residential energy consumption (%)
LIST OF Boxes
Box 2.1: EU funds and programmes to address structural challenges and to foster growth and competitiveness in Poland
Box 3.3.1: Monitoring performance in light of the European Pillar of Social Rights
Box 3.4.1: Investment challenges and reforms in Poland
Box 3.5.1: Coal Regions in Transition
Executive summary
Slowing but still very solid economic growth creates a good basis for reforms addressing socio-economic challenges (). The Polish economy is successfully catching up. Economic conditions remain favourable despite an outlook of slower growth. Employment is high and the unemployment rate has stabilised at record lows. The short-term situation of public finances appears safe. An ageing population, a falling number of people at working age and the subpar quality of certain key public services such as health and long-term care constitute important challenges. Key long-term challenges include ensuring a gradual shift towards a knowledge-based economy producing advanced products and services. The Polish economy is energy-intensive and highly dependent on fossil fuels. In this respect, limiting greenhouse gas emissions by decarbonising power generation and reducing energy intensity are key. The transition to a low-carbon economy will have a significant impact on society, mainly in affected regions.
Economic growth stayed strong in 2019. Household consumption remained the main driver of GDP growth estimated at 4.0% in 2019. The favourable labour market situation and to some extent increased social transfers and lowered personal income taxes supported this. Private and public investment, including the projects supported by EU funds, also contributed positively to growth. Export performance remained generally favourable, especially against the backdrop of weakened global and EU trade.
Future growth potential will be determined by trends in capital accumulation, skills and migration. A significant inflow of labour migrants from outside the EU has helped to sustain strong growth. Given the increased share of migrants in the total work force and the large number of Polish citizens who have moved to other EU countries, future migration trends are expected to have a substantial impact on growth. Increasing labour participation of certain groups of people will be also important. While gains in skills are likely to have played an important role in driving growth in the past, maintaining positive trends is an important challenge. Capital accumulation, including infrastructure and, machinery, but also non-tangible capital including patented innovation is another important factor with the potential to boost productivity and growth. Perceptions of macroeconomic stability and the quality of Poland’s policies, institutions, and regulatory environment (including the legislative process, in particular public consultations) are expected to be increasingly important in determining investment trends.
Overall, Poland is well integrated economically with the EU and the world, and its economy is well balanced internally and externally. Poland’s current account has remained close to balance and its net foreign debt continued to fall during 2019. Exports remain highly diversified and are gradually shifting towards higher-value-added products and services. Public and private debt remains low in comparison with the EU average.
Economic growth prospects depend on investment in several policy areas. Decarbonising power generation, improving the energy efficiency of buildings and investing in more sustainable transport can put the economy on a more environmentally sustainable development path. Investment in innovation will help Poland produce more advanced products and services. Expanding broadband network will allow for equal access to the internet. Investment in social inclusion, healthcare, childcare and long-term care can improve social cohesion and increase employment.
Poland has made limited () progress in addressing the 2019 country-specific recommendations.
Some progress was observed in strengthening Poland’s capacity for innovation.
There has been limited progress in the following areas:
·Improving the efficiency of public spending;
·Increasing labour force participation;
·Focusing investment-related economic policy on innovation, transport, digital and energy infrastructure, healthcare and cleaner energy.
There has been no progress in the following areas:
·Increasing the effective retirement age;
·Reforming preferential pension schemes;
·Strengthening the role of consultations of social partners and public consultations in the legislative process.
Poland performs relatively well in several areas covered by the European Pillar of Social Rights. In recent years, Poland has made substantial progress in improving labour market outcomes and reducing the share of people at risk of poverty. However, challenges remain notably as regards access to healthcare (as highlighted for instance by data on self-reported unmet need for medical care), the gender employment gap and very low availability of childcare.
Progress in reaching the national targets under the Europe 2020 strategy is mixed. Poland performed best on the employment rate (72.2% in 2018 vs the 71% target), tertiary education attainment (45.7% in 2018 vs 45% target) and poverty reduction (the population at risk of poverty declined by 4.5 million vs the target of 1.5 million). Progress remains limited in R&D investment (1.2% of GDP in 2018 vs 1.7% target) and the share of people leaving early the education system (4.8% in 2018 vs 4.5% target). Reaching the Europe 2020 targets related to energy and climate will be very challenging. In 2018 primary energy consumption reached 101 Mtoe and final energy consumption 72 Mtoe, i.e. both exceeded the 2020 target levels. In 2018, Poland achieved a renewables share of 11.2%, against the 2017-18 indicative trajectory of 12.3%. Emissions from the sectors outside of the EU Emissions Trading System have already increased by 21% from 2005 levels, overshooting Poland’s commitment to limit the increase of these emissions to 14% by 2020.
Poland made overall a significant progress with regard to the United Nations’ SDGs. Poland is above the EU average concerning the majority of the indicators pertaining to SDG 1 (no poverty), SDG 4 (quality of education) and SDG 10 (reduced inequalities). Despite significant progress, Poland remains below the EU average with respect to SDG 3 (good health and well-being), SDG 8 (decent work and economic growth), SDG 9 (industry, innovation and infrastructure). The key challenge for Poland with respect to meeting sustainable development objectives concerns SDG 13 (climate action) ().
The key structural issues for Poland’s economy analysed in this report are the following:
·The short term outlook for public finances remains favourable but long-term risks remain. The fiscal deficit is estimated to have increased in 2019, reversing the gradual decline seen in previous years. By contrast, high nominal GDP growth ensured a further decline in the ratio of public debt to GDP. Several changes in taxation were implemented during 2019. Some of them have the potential to simplify tax compliance, but others work in the opposite direction. In a longer term, risks to fiscal sustainability risks are likely to emerge, in particular due to the population ageing.
·Work to reform the budgetary system continues. The expenditure rule remains the cornerstone of the fiscal framework. However, its functioning was weakened by the circumvention of the rule in some recent expenditure programmes. Poland remains the only Member State without an independent fiscal council. The work on reforming the budgetary system has continued and given the complexity it is expected to take several years. It has the potential to increase the efficiency and effectiveness of spending, a crucial challenge considering the increase in public expenditure, which is difficult to reverse as well as expected expenditure pressures, e.g. due to the ageing population.
·The condition of the banking sector remains favourable. Overall, the sector remains well capitalised and resilient. The solvency of most banks remains strong amid prudent regulatory measures. Lending, including residential property financing, has been rising in line with fundamentals. The share of non-performing loans is limited, which keeps risks contained. In turn, following legal actions, the risks related to the remaining stock of foreign-currency denominated mortgages have increased and may require additional capital for some banks. The gradual implementation of the workplace pension scheme might provide support to the development of the capital market.
·Large state ownership in the financial sector increases the importance of independent financial supervision. The state controls close to 40% of the banking sector, as well as the biggest insurance company. This increases the importance of a strong, independent financial supervisor, with appropriate powers.
·Employment rates reached all-time highs, but certain barriers hinder labour market participation for some groups. The unemployment rate stabilised at around 3.5%, a record low. Labour shortages have hampered firms’ growth in many sectors. The future labour supply in part depends on trends in the return migration of Poles living in other EU countries and on the integration of non-EU migrants currently living and working in Poland. Women, older people, persons with disabilities, and those with lower qualifications participate in the labour market much less than in many other EU countries. This is due to several factors, such as limited access to childcare and long-term care, underdeveloped public transport outside large cities, and a low statutory retirement age. Unreformed special pension regimes and a lack of flexibility in working time arrangements are among the factors limiting the labour market flexibility. The share of temporary employment contracts remains high, but has been consistently declining in recent years.
·Skill development has the potential to support productivity and labour market participation. Lower secondary schools, recently abolished due to a reform of the school system, have proven good at fostering basic skills in students, with Polish 15-year-olds being among the best in the EU in 2018. Early school leaving has been among the lowest in the EU. Concerns remain as regards the quality of higher education, average teachers’ skills related to attractiveness of the teaching profession, the labour market relevance of vocational education, development of transversal skills and equal opportunities following the abolition of lower secondary schools. Adults rarely engage in training and other forms of learning. There remain questions on the effectiveness of labour market policies, including measures focusing on acquiring and upgrading skills.
·Poverty and inequality have declined in many dimensions, but certain challenges remain. The share of people at risk of poverty and social exclusion has declined in recent years. Income inequality continued to decline in 2018, following a reduction in previous years. This reduction is to some extent due to favourable labour market trends, including the relatively fast growth of lower wages. The changes to the child benefit introduced in mid-2019 diminished its inequality-reducing impact. Future pensions are expected to be significantly lower in relation to wages, than the ones currently paid. This implies risks for rising old age poverty, amplified by an underdeveloped long-term care system. Given low statutory retirement age, the key challenge lies in encouraging labour market participation beyond this age. Social services remain underdeveloped, including for persons with disabilities.
·Low public expenditure and its suboptimal allocation created problems in the operation of the healthcare system and access to it. Low pay may limit the attractiveness of practising medical professions in Poland. The number of practising doctors and nurses relative to the population remains among the lowest in the EU. Public health expenditure has been among the lowest in the EU for many years. Key challenges regarding the allocation of resources include the underdevelopment of primary care, placing a burden on hospitals.
·Recent policy measures aim to strengthen innovation. Poland took various measures to enhance the economy’s innovative capacity, including changes in higher education, in the organisation of research institutes and the functioning of various tax and subsidy measures. Inputs measured by R&D expenditure have continued rising, while staying well below the EU average. It remains to be seen to what extent these measures will translate into better science-business co-operation and innovation outcomes.
·Various factors act to limit investment activity. Labour shortages are an important investment barrier. While overall the business environment remains favourable, some regulatory deficiencies weigh on confidence and certainty. Business uncertainty remains high concerning some key laws, such as those related to tax and social security systems or energy policies. Some of important laws were passed or proposed using fast-track legislative procedures, without proper social partner and public consultations. A clear risk of a serious breach of the rule of law in Poland continues to exist and may negatively impact the investment climate. The important role played by state-owned and state-controlled companies in some sectors make it essential to ensure a level playing field for private competitors.
·Infrastructure development is progressing, but sizeable investment needs remain. The domestic energy generation infrastructure is ageing and not up to the task of moving to a climate neutral economy. Its renewal is set to require significant investment in the years to come. The capacity and quality of road transport infrastructure have improved, contributing to high growth in road transport, but also to the associated greenhouse gas emissions. In turn, the share of rail in transport services is declining, being hindered by lagging modernisation projects. This also affects the seaports´ inland connections. Despite investments in urban mobility, many people have no direct access to public transport. Improvement in road safety has stalled. There has been significant progress in ultrafast and mobile broadband take-up, although Poland is still far from its connectivity targets.
·Curbing greenhouse gas emissions by decarbonising power generation and heating, and reducing energy intensity are key challenges. Poland faces a risk of missing its 2020 climate and energy targets. Given the difficult starting point, developing a coherent long-term vision for improving the environmental sustainability of Poland’s economy is particularly important. In the absence of coordinated action, greenhouse gas emissions have been increasing since 2014, increasing the future scale and cost of the decarbonisation. The large role of coal in electricity generation, the poor energy efficiency of buildings and fast growing emissions from transport modes represent priority areas for intervention and investment due to not only the climate impact concerns but also environmental pressures of air pollution and water scarcity.
·The transition to a climate neutral economy is an opportunity to modernise the economy, while addressing developmental challenges and citizens’ needs. Continued investment in a carbon-intensive infrastructure poses the risk of stranded assets and competitive disadvantage due to the growing cost of carbon. The future growth of the industry depends on the ability to deploy innovative, technologies aligned with the circular economy model and power sector decarbonisation. The Commission’s proposal for the Just Transition Mechanism under the next multi-annual financial framework for the period 2021-2027 includes a Just Transition Fund, a dedicated just transition scheme under InvestEU, and a new public sector loan facility with EIB. It is designed to ensure that the transition towards EU climate neutrality is fair by helping the most affected regions in Poland to address the social and economic consequences. Key priorities for support by the Just Transition Fund are identified in Annex D, building on the analysis of the transition challenges outlined in this report.
1.
Economic situation and outlook
GDP growth
Economic growth remained strong in 2019. Estimated at 4.0% in 2019, GDP growth slowed from peaks of around 5% annually in the period 2017-2018. Nevertheless, Poland was still among the fastest growing EU Member States. Domestic demand remained the main growth driver and export performance stayed relatively favourable compared to several other EU economies. Nonetheless, weakening global trade affected the performance of Polish exports.
|
Graph 1.1:Real GDP per capita, 2008-2018
|
|
|
|
Source: Eurostat
|
Private consumption contributed the most to growth for the fifth consecutive year. After rising by 4.2% in 2018, private consumption expanded by an estimated 4% in 2019. Several factors contributed. First, labour market conditions remained favourable and were accompanied by high wage growth. Second, tax and benefit measures increased disposable incomes, especially for middle- and high-income households. Third, consumer confidence remained close to multiannual highs in 2019, in particular supported by a favourable view on the labour market situation (Graph 1.2). Finally, spending was also supported by easy access to credit.
Investment kept rising in 2019. Public investment, the key force behind the solid investment expansion in 2018, continued to rise in 2019, yet at a much slower pace. By contrast, private investment growth strengthened in 2019, after several years of weakness. EU funds supported both public and private investments (see Section 3.4.1).
|
Graph 1.2:Consumer confidence
|
|
|
|
Source: ECFIN (BCS)
|
Growth is projected to fall below its potential in 2020 and 2021 (). Private consumption is forecast to continue rising, though at gradually slower rates, thanks to higher consumer confidence driven by favourable labour market conditions and – in early 2020 – also due to changes in personal income tax. Public investment expenditure is expected to increase in 2020, as some previously delayed EU-funded projects should be implemented. Private investment growth is expected to weaken, given the uncertainty on the demand outlook, especially in foreign markets, limiting export growth.
Potential growth
Productivity gains and inflow of foreign workers helped keep potential growth high. The capital accumulation contribution to potential growth increased from the lows of 2016-2017, but remained limited by historical comparison. Productivity gains played the largest role and Poland has continued to catch up in productivity with more developed EU Member States. However, part of the apparent increase in the contribution of total factor productivity to potential growth may be explained by under-reporting of migrant workers in official statistics.
Given the negative demographic outlook, the integration of migrant workers becomes an increasingly important challenge. The working-age population is projected to continue declining in the decades to come. Future growth potential will be increasingly dependent on the successful integration of foreign workers, who already play an important role. Full utilisation of migrants’ skills and competences is an important step for future growth (Section 3.3).
Capital accumulation could contribute more to potential growth. Difficult access to skilled labour increases the incentives to gradually replacing workers by machines in certain tasks to improve labour productivity. New investment may also be needed to move towards a cleaner economy, in particular in the energy sector. The investment outlook remains dependent on perceptions of macroeconomic stability and quality of institutions, including the policy and regulatory environment (Section 3.4).
|
Graph 1.3:Labour productivity in market services
|
|
|
|
Source: Eurostat
|
There is room for faster growth of labour productivity. Starting from very low levels compared to the EU average, labour productivity in Poland has been growing at one of the fastest rates in the EU for the last several years. This growth was broad-based, and visible in both the manufacturing and services sectors (Graph 1.3). Despite this robust performance, there remains substantial room for further catch-up. In 2018, labour productivity was still equivalent to only around 63% of the EU average when controlling for differences in purchasing power. Capital investment and skills upgrading have the potential to continue strengthening productivity growth.
Labour market
With unemployment stabilising at record lows, wage growth remained strong. Total employment gains, as captured by the labour force survey, moderated from 1.4% in 2017 to 0.4% in 2018 and are estimated to essentially have come to a halt in 2019 (Graph 1.4). Constrained labour supply was a key factor behind this deceleration, but increased uncertainty on the demand outlook also affected firms’ hiring intentions. Wages continued to grow at a rate of close to 8%, broadly stable since late 2017. The unemployment rate has stabilised at around 3.5%, a multiannual low and amongst the lowest rates in the EU.
|
Graph 1.4:Employment, wages and unemployment rate
|
|
|
|
Source: Eurostat
|
Firms still face significant labour shortages. While the share of firms indicating lack of skilled labour as a factor hampering their activity declined in 2019 from the highs reached in late 2018, it still remains very high in historical terms. Even with the expected slowdown in economic activity, employers' competition for talent is likely to remain strong in the coming years. Employment rates are particularly low for the less skilled and for women. In addition, while being flexible overall, some institutional settings hinder the functioning of the labour market (see Section 3.3).
Workers from outside the EU play an important role in the labour market. Existing data enable estimates of the number of migrant workers to a limited extent only. This also implies that employment dynamics based on the labour force survey data do not account for changes in the foreign workforce in Poland. In the first three quarters of 2019, the number of foreigners covered by social insurance continued to rise, although more slowly than in 2018. As of September 2019, over 4% of insured were foreigners. In 2018, for the fourth consecutive year, Poland issued the highest number of first residence permits for work-related reasons in the EU. During 2015-2018, Poland accounted for more than half of such permits issued in the whole EU. The vast majority of these permits were for stays of below one year.
Poverty and inequality
Poverty continued to decline. The rate of people at risk of poverty or social exclusion (AROPE) declined from 19.5% in 2017 to 18.9% in 2018, well below the EU average (21.9%), especially driven by a decrease in severe material deprivation (from 5.9% to 4.7%). At the same time, the persistency of poverty, which measure the percentage of people that remained at risk of poverty in at least two of the preceding three years, increased slightly (from 9.1% to 10.5%). Recent reforms focused on increasing social transfers, but social services remain underdeveloped, hampering effective social inclusion (see Section 3.3).
Income inequality declined further in 2017 before stabilising in 2018. The ratio of the total income received by the 20% of the population with the highest incomes to that received by the 20% of the population with the lowest income (S80/S20 income quintile share ratio) also declined in 2018 to 4.25, below the EU average of 5.17. This placed Poland in the middle of the ranking of EU countries in terms of measured inequality levels (see also Graph 1.5). The improvement recorded in Poland can be explained by a combination of growth of employment and wages and, in particular, solid income gains by households in the bottom half of the income distribution. The income of the poorest 40% amounted to 22.6% of the overall income in 2018, on the rise (from 22.1% in 2017) and well above the EU average (21.1%) and the pre-crisis level in Poland (20.9% in 2009).
|
Graph 1.5:Gini coefficient of equivalised disposable income, 2008-2018
|
|
|
|
Source: Eurostat and Statistics Poland
|
The role of social benefits in reducing inequalities likely decreased in 2019, while progress with equality of opportunities is questionable. The tax and benefit system contributed to lowering income inequality in 2016-2017, in particular due to the introduction of the partially means-tested child benefit, but changes to the child benefit introduced in mid-2019 lowered its inequality-reducing impact (Myck et al., 2019). The additional pension lump-sum bonus paid to all pensioners in 2019 strengthened the role of pension in reducing inequality. At the same time, future pensions, in relation to wages, are expected to be significantly lower than the ones currently paid (see Section 3.1). Changes to the organisation of the school system introduced in 2017, whereby pupils are tracked earlier into the vocational and general streams pose a challenge in ensuring equal opportunities, especially for children living in rural areas (European Commission, 2019b). The share of pupils in non-public, fee-paying schools has continued to rise. Access to childcare remains a major challenge. Despite improvements, the enrolment in formal childcare (for children less than 3 years old) stood at 10.9% (EU: 35.1%). In addition, enrolment in early childhood education and care for older children (from 3 years to compulsory school age) was also very low at 59.4%, below the EU average of 86.8% (Section 3.3). Substantial differences to healthcare access also remain visible.
External position
Exports increased faster than global demand. Poland has continued to gain shares in global export markets for both goods and services. The surplus in services trade has continued to grow thanks to the solid performance in sectors such as transport, computer, information services, and other business services.
High diversification of exports and cost-competitiveness helped limit the negative impact of weakening global trade. Poland is increasingly integrated into global value chains, especially in the manufacturing sector. In 2015, Poland had the highest share of domestic value added embodied in foreign manufacturing exports among all EU Member States (). Also, a long-term gradual shift towards higher value added products continues. This is visible for instance in a faster rise in the unit value of intermediate and capital goods exports than in Germany (European Commission, 2019b). At the same time, Poland remains cost-competitive and has a high degree of exports diversification relative to several EU Member States, including neighbouring countries such as Slovakia and Czechia (Graph 1.6). This can partly explain the less severe impact of negative trends in global trade and weaker growth in Germany, the key export destination of Poland.
The current account was close to balance in 2019. The current account has fluctuated close to a balanced position since 2015. In 2019 there was a surplus of 0.6% of GDP, compared to the deficit of 1% in 2018 (based on 12-month moving sums calculated for November 2019).. The balance in trade of goods increased from -1% to 0.2% of GDP on the back of weakening domestic demand and relatively strong export performance. Trends in other major components have been maintained. The primary income balance remained negative at around 3.7 of GDP in 2019, while the surplus in trade in services continued to rise to 4.7% of GDP in 2019 Q3.
|
Graph 1.6:Index of concentration of goods exports, 2018
|
|
|
|
Source: United Nations Conference on Trade and Development (UNCTAD)
|
Poland's negative net international investment position (NIIP) continued to narrow during 2019. The NIIP was -51.3% of GDP at the end of the third quarter of 2019, compared to ‑69% of GDP in 2014. Hence, a gradual improvement has continued since 2015 and even accelerated, mainly as a result of the accumulated stock of net foreign direct investments, which has stabilised at around 36-37% of GDP since 2017. The relative stability of direct investments limits the risks associated with a negative NIIP. In addition, the recent faster improvement in NIIP was associated with risk reduction: the NIIP component excluding non-defaultable instruments went up from ‑19% of GDP in mid-2018 to ‑14% of GDP in mid-2019.
Inflation and monetary policy
Wage pressures transmitted into higher prices of services and a temporary food price hike led to an inflation spike in the second half of 2019. Inflation measured by the harmonised index of consumer prices (HICP) rose gradually during 2019, with divergent trends in its components. Unprocessed food price inflation spiked in the middle of the year to above 10%. Inflation pressures increased gradually in the services sectors, in part due to the transmission of wage increases. By contrast, energy price inflation declined strongly turning negative in the second half of 2019 due to base effects, low global oil prices and administrative controls on electricity prices for households. HICP inflation increased to 2.1% in 2019, reaching even 3.0% in December. Going forward, overall HICP inflation is expected to temporarily go above 3% in early 2020 and to subsequently stay close to 2.5% until the end of 2021. Services price inflation is projected to continue rising at a fast pace, given wage pressures.
The National Bank of Poland has kept interest rates unchanged since March 2015. The forward guidance from the Monetary Policy Council indicates unchanged interest rates in 2020 and beyond. The Council statements indicate a prevailing view that the acceleration of inflation in the second half of 2019 was largely driven by temporary factors beyond the control of monetary policy (especially supply-side induced food price hikes), while slowing economic growth should help keep inflation close to the 2.5% target over the coming quarters. The November 2019 inflation projection of the NBP expected inflation to peak at around 3.5% in early 2020, subsequently fall to 2.5% by mid-2020 and stay around this level until the end of 2021. This is broadly similar to the path implied by the Commission’s Winter forecast (see above). The Polish zloty exchange rate against the main currencies was stable in 2019. After a slight weakening in August and September 2019 (in particular against Swiss franc), the zloty returned to the levels seen in the first half of the year.
Indebtedness, financial sector and markets
Private indebtedness remained low. Polish households and non-financial companies are still among the least indebted in the EU, with total debt stock equivalent to about three quarters of GDP. Loans to the private sector increased by 5% per year in the fourth quarter of 2019, in line with the long-term trend and nominal GDP growth.
The banking sector as a whole has remained in a good condition. The solid capital buffers, stable profitability and liquidity and sound asset quality of Polish banks limit risks to financial stability. While differences between banks are visible, the sector's profitability remained stable and strong in 2019. The uncertainty concerning the remaining stock of foreign currency-denominated mortgage loans increased for banks after the European Court of Justice’s ruling in October 2019, which implied that foreign-currency denominated mortgages could require additional capital (see Section 3.2).
The housing loan market is expanding, but currently it does not pose a significant systemic risk. The outstanding stock of housing loans in relation to GDP remains one of the lowest in the EU. A large share of real estate transactions continues to be paid outright rather than financed by mortgage loans, and such purchases may often be treated as investment given low deposit interest rates. The growth in the value of housing loans strengthened during 2019, to around 6.6%, mainly reflecting a weakening of the zloty exchange rate relative to the Swiss franc, a currency in which some 23% of outstanding loans are denominated. Mortgage loans in zloty have been rising at the steady pace of some 10-13% since 2015. Nearly all mortgages issued in Poland are subject to variable interest rates, which could place substantial financial pressure to households in the event of interest rate increases. Nevertheless, risks are limited so far, as the share of new loans with high loan-to-value has been reduced and the share of non-performing loans is limited (see Section 3.2).
House prices continued to rise fast in 2019, but risks of overheating are limited. According to Statistics Poland data, prices of residential premises in the third quarter 2019, compared to the corresponding quarter of 2018, increased by 9.0% (of which on the primary market by 6.7% and on the secondary market by 10.9%). House prices increased by around 6.5% annually (National Bank of Poland data) in the secondary market in the largest cities and by around 12% if the index is corrected for real estate quality changes. Despite dynamic price growth in recent years, there is no evidence of house price overvaluation. In 2019, deflated house prices grew faster than real wages. However, the opposite was observed for several years before and, hence, real estate remains affordable in historical and EU-wide comparison. In 2018, the average price of a 100 m2 dwelling was equivalent to 9.8 years of average disposable income per capita, close to the EU average.
Stock market performance remained subdued. The main index of the Warsaw Stock Exchange stayed broadly stable during the first half of 2019, before declining in the third quarter. During 2019 as a whole the index declined by 6.4%, in contrast to the Stoxx Europe 600 Index’s 23% gain in 2019. The Warsaw Stock Exchange performance was also weaker than in other markets in the region.
Public finances
Fiscal expansion in 2019 led to an increased headline deficit, breaking the long-trend declining trend. Fast economic growth with rising wages and the ongoing shift of employment towards contracts subject to higher social security contributions explain the strong growth of revenues from personal and corporate income tax and social security contributions in 2019. Personal income tax (PIT) revenues declined at the end of the year due to the lowering of the tax burden (Section 3.1). The dynamics of indirect tax revenues slowed visibly (Section 3.1). The key component of the fiscal stimulus in 2019 was on the expenditure side, in particular new social transfers. A combination of these factors explains an increase in the headline fiscal deficit to an estimated 1% of GDP, up from 0.2% in 2018.
The structural deficit also increased in 2019 and fiscal challenges are visible in the medium term. When adjusting for the effects of the economic cycle and excluding one-off and temporary measures, the fiscal balance improved until 2018 though much more gradually than in the case of the headline balance. In 2018, Poland was close to reaching the medium-term objective of ‑1% of GDP (). According to the Commission’s Autumn 2019 forecast, the structural balance is projected to have declined in 2019 and is not expected to reach the medium-term objective until 2021. The rising share of public expenditure that is difficult to adjust creates challenges in the medium- and long-term perspective given the expenditure pressures likely to arise in certain areas, such as healthcare, human capital and infrastructure investment, and areas impacted by future steps to support the decarbonisation of the economy.
The general government debt continues to fall. Fast nominal economic growth and the low headline deficit helped to lower the general government debt-to-GDP ratio from 49% at the end of 2018 to an estimated 47% at the end of 2019. A further decline in public debt is projected, down to around 44% of GDP at the end of 2021.
Progress towards sustainable development
Poland made overall a significant progress with regard to the United Nations’ Sustainable Development Goals (SDGs). In the environmental dimension, Poland’s energy-intensive economy faces various challenges to move closer to climate neutrality, as reflected long and increasing distance from targets of SDG 13. While Poland performs above the EU average on energy import dependency (despite an increase in short and long-term), primary and final energy consumptions are above the EU average and are moving away from sustainable development objectives. Poland is lagging behind the EU average concerning affordable and clean energy (SDG 7). Improving air quality in Polish cities remains a priority (SDG 11). In turn, concerning the labour market and social dimension, Poland has improved in various areas and performs relatively well, however further steps are needed to achieve sustainable development objectives. Poland stands above the EU average in terms of indicators related to poverty measures (SDG 1), quality of education (SDG 4) and reduced inequalities (SDG 10). Good health and well-being showed some progress over the long term. In turn, Poland is lagging behind the EU average in SDG 5 (gender equality) both in terms of education and employment, and the gender pay and employment gaps are hardly improving.
|
|
|
Table 1.1:Key economic and financial indicators - Poland
|
|
|
|
Source: Eurostat and ECB as of 4-2-2020, where available; European Commission for forecast figures (Winter forecast 2020 for real GDP and HICP, Autumn forecast 2019 otherwise)
|
|
|
2.
Progress with country-specific recommendations
Since the start of the European Semester in 2011, 42% of all country-specific recommendations addressed to Poland have recorded at least ‘some progress' (see Graph 2.1). Substantial progress was achieved in the fields of product markets, with ambitious reforms of access to professional services, and of public finance, with the introduction and successful functioning of the expenditure rule. Some progress was achieved concerning labour market reforms thanks to the implementation of measures targeted at increasing labour market participation and addressing labour market segmentation. Also, some progress was observed in research and innovation thanks to tax reliefs and measures to facilitate the financing of R&D activities. Limited progress was observed in a number of areas, including life-long learning, enforcing contracts or removing obstacles to infrastructure investment. No progress was achieved in reforming special pension regimes, in establishing an independent fiscal council, limiting the use of reduced value added tax (VAT) rates, as well as improving the regulatory environment by safeguarding effective consultations in the legislative process.
In the area of public finance Poland achieved noticeable progress mainly in lowering its headline deficit and improving tax collection. Poland corrected its fiscal deficit and consequently the excessive deficit procedure was closed in 2015. Tax compliance has markedly improved in recent years. The recently implemented new VAT matrix has limited the complexity of the system of reduced VAT rates. However, it did not address the issue of the high foregone revenue resulting from the extensive use of reduced VAT rates. Poland continued the reform of the budget system. At the same time, it remains the only EU member state without a fully-fledged fiscal council. In addition, recent expenditure was implemented in manner that circumvented the expenditure rule. The reversal of the 2012 reform to gradually increase the statutory pension age will reduce the adequacy of pensions in the future and is a risk for the sustainability of public finances. Some of the limited measures to reform special pension arrangements for the uniformed services were reversed in 2019. No effective actions to reform the special pension arrangements for miners and farmers have been undertaken.
|
Graph 2.1:Overall multiannual implementation of 2011-2019 CSRs to date
|
|
|
|
Source: European Commission
|
Although labour market participation increased in recent years it remains, however, below the EU average reflecting insufficient policy measures. The low activity rate of specific groups such as older workers and women persists. Access to early childhood education and care has improved, but still constitutes a major challenge for children below 3. The provision of long-term care services remain very limited as well. Several actions adopted during 2015-2017 helped to reduce labour market segmentation, but the share of open-ended contracts in total employment remains low. The intentions of the recent reforms to improve labour market relevance of vocational education and the quality of higher education are commendable, however, their scope is limited and the full effects remain to be seen. The Integrated Skills Strategy is currently being prepared, but so far coordination of adult learning policy remains inefficient.
Poland has achieved mixed results as regards enhancing the innovative capacity of the economy and the regulatory environment. The country has taken measures to support its research institutions through a comprehensive Higher Education reform that started in 2018. Some measures were taken with respect to strengthening science-business links, including the creation of the Łukasiewicz Network, the introduction of the industrial doctorates programmes and the inclusion of external stakeholders in university councils. In 2016-2019, Poland has diversified and increased the effectiveness of R&D tax incentives by increasing the deducible amounts. Concerning the regulatory environment, the introduction of the 2013-2015 reform allowed substantial progress to be made in liberalisation of the access to professional services. Regarding contract enforcement, most of the provisions of the late payments regulation enter into force in 2020. The new Building Code, simplifying the requirements for construction permits, was adopted by the Sejm. Some measures have been taken to improve the legislative process for the draft laws put forward by the government, but the insufficient scope of the public consultations has not been addressed (see Section 3.4).
Overall, Poland has made limited () progress in addressing the 2019 CSRs. Limited progress was achieved in addressing the recommendation on public finance. The reform of the budgetary process continued in 2019, but the full implementation is still to materialise. There was no progress in increasing the effective retirement age and reforming the preferential pension schemes. Limited progress was observed in increasing labour force participation, as access to childcare continued to improve, but no major actions were taken to remove remaining obstacles to more permanent types of employment. Limited progress was also achieved regarding the quality of education and skills as the higher education reform progresses, but the school system reorganisation has led to worse working and learning conditions in many schools. With a launch of the Łukasiewicz Research Network and measures to support research institutions through the implementation of the Act on Higher Education some progress was registered in the field of strengthening the innovative capacity of the economy. Overall, limited progress was observed in strengthening investment-related policies. Various measures have been taken in innovation (via dedicated measures of the National Strategy of Regional Development 2030), transport (via the Strategy of Sustainable Transport Development until 2030 and dedicated measures of the National Strategy of Regional Development 2030), digital infrastructure (a new broadband fund set up), energy infrastructure transboundary gas and electricity infrastructure development), healthcare (via dedicated measures of the National Strategy of Regional Development 2030) and cleaner energy (e.g. an auction schedule of 2.5 GW onshore wind in total and new subsidy system for rooftop photovoltaics). No progress was observed in improving the regulatory environment, as some crucial laws are still being fast tracked with insufficient social partner and public consultations.
Upon Member State’s request, the Commission can provide tailor-made expertise via the Structural Reform Support Programme to help design and implement growth-enhancing reforms. Since 2017, such support has been provided to Poland for 34 projects. In 2019 several projects have been delivered on the ground. The Commission, for example, provided the authorities with support to develop a plan to improve inclusive education, set up policies for energy poverty reduction that will contribute to the reduction of carbon emissions, and draft a Capital Market Development Strategy. In 2019, work started on developing methodologies for estimating excise and corporate income tax gaps and for the digitalisation of construction planning.
|
|
|
Table 2.1:Assessment of implementation of 2019 country-specific recommendations
|
|
|
|
|
|
Box 2.1: EU funds and programmes to address structural challenges and to foster growth and competitiveness in Poland
Poland is the country benefiting most from EU support in absolute numbers. The financial allocation from the EU Cohesion policy funds (
I
) for Poland amounts to €90.6 billion in the current Multiannual Financial Framework, equivalent to around 2.7% of the GDP annually. By the end of 2019, some €84 billion (around 93% of the total amount planned) were allocated to specific projects (
II
), while €37 billion were reported by beneficiaries as spent, showing a level of project implementation in line with the EU average.
EU Cohesion policy funding play a significant role in addressing structural challenges in Poland. The Cohesion Policy programmes in Poland have allocated EU funding of €18 billion for smart growth (i.e. investment in knowledge and innovation), €40 billion for sustainable growth and transport, which encompasses investments in a more resource efficient, greener and more competitive economy and €16 billion for inclusive growth (i.e. investments in high-employment economy and social and territorial cohesion). In 2019 following a performance review (
III
) €5.4 billion have been made available within performing priorities in Poland.
EU Cohesion policy funding contributes to major transformations of the Polish economy. The European Regional Development Fund, the Cohesion Fund and the European Social Fund are promoting growth and employment via investments. By the end of 2018, 482 km of roads belonging to the Trans-European Transport Networks (TEN-T) were built. Over 10,000 enterprises, including 278 start-ups, received support. Investments contributed to the estimated annual reduction of greenhouse gas emissions by over 100,000 tons of CO2 and over 120,000 people gained access to improved wastewater treatment. Almost 800,000 unemployed and inactive people were supported with activation measures and nearly 70,000 students participated in vocational traineeships in companies. Over 44,000 new places in childcare and preschools were created and more than 200,000 people at risk of poverty or social exclusion benefitted from social or healthcare services.
Agricultural and fisheries funds and other EU programmes also contribute to addressing investment needs. The European Agricultural Fund for Rural Development makes available in total €13.6 billion and the European Maritime and Fisheries Fund in total €710 million (including the national co-financing for both). Poland benefits also from other EU programmes, such as the Connecting Europe Facility, which allocated EU funding of €3.9 billion to specific projects related on strategic transport networks and Horizon 2020, which allocated EU funding of €478 million (including supporting 250 SMEs with about €120 million).
EU funding contributes to mobilisation of important private investment. By the end of 2018, programmes supported by the European Structural and Investment Funds (
IV
) supported programmes alone mobilised additional capital by committing about €3.7 billion in the form of loans, guarantees and equity (
V
), which is 4.6% of all decided allocations of the European Structural and Investment Funds.
EU funds already invest substantial amounts on actions in line with the Sustainable Development Goals (SDGs). In Poland European Structural and Investment Funds support 13 out the 17 SDGs and up to 95% of the expenditure is contributing to those.
|
3.
Reform priorities
3.1.Public finances and taxation
Tax system
Tax burden in Poland continued raising, yet it remained lower than in the EU. At 35.2%, the 2018 tax-to-GDP ratio in Poland was higher than 34.1% observed in 2017. Still, it was below the EU average of 39.2%. This difference is explained mainly by labour taxation.
The gradual decline in the nominal fiscal deficit reversed in 2019. Poland was the only EU Member State that weathered the financial crisis of 2008-2010 without a recession. This came at a cost of, inter alia, a high increase in the headline fiscal deficit. Since then, between 2010 and 2018, the country has carried out a substantial fiscal consolidation, cutting its deficit by over 7 percentage points and bringing its public finances close to balance in 2018. This trend is estimated to have reversed in 2019, due to a set of new tax and social policies reducing direct tax income and increasing social spending (Graph 3.1.1).
|
Graph 3.1.1:General government revenue and expenditure change, fiscal deficit, 2010-2021
|
|
|
|
Source: European Commission
|
Public expenditure is likely to increase. The ratio of expenditure to GDP has constantly declined over recent years, from 44% in 2011 to 41% in 2017. It grew slightly in 2018. Social spending was the biggest expenditure item that – as a share of GDP – grew from some 14% in 2011 to 15% in 2018, following the implementation of new social policies. It is estimated to have further increased in 2019, reflecting the removal of means testing in the universal child allowance scheme and the payment of an additional benefit to pensioners. On top of this, the wage bill of a part of public administration which had been frozen for a number of years until 2015 has since gradually increased, with a significant rise in 2019 and, especially, 2020. Also teachers – representing close to one fifth of the general government wage bill – will see their remuneration gradually rise between 2018 and 2020. These developments, difficult to reverse, will raise the ratio of public spending to GDP to some 42% in the near future.
Poland continued its efforts to increase tax compliance and to combat fraud. In 2019, the split payment scheme became compulsory for some types of transactions covering certain fraud-prone goods and services, including the electronic, coal, steel and building industries. In addition, a new tool, the ‘white list of taxpayers’, was put in place to enforce verification of potential business partners and to diminish the risk of being involved in fraudulent transactions. These changes were complemented by the introduction in 2020 of mandatory online cash registers for certain taxpayers. Moreover, to enforce existing and newly introduced tax requirements, a series of fines were implemented. In the area of the corporate income tax, several changes to increase compliance were introduced, including an automatic exchange of information on cross-border tax schemes.
Maintaining the recent remarkable pace of revenue growth will be challenging. In recent years, public revenue growth was reaching double-digit values. The strong economic environment but also several tax reforms contributed to this (European Commission, 2019b). Tax collection has systematically improved, initially for value added tax (VAT) and then for direct taxes. For instance, the 2019 study on the VAT gap, i.e. the difference between VAT revenue expected and actually collected, showed that in 2017 Poland reduced its VAT gap by around one third, to below 14% (CASE and IAS, 2019), approaching the EU average of 11%. This may indicate that further large collection gains are less likely, as recent tax revenue developments suggest (Graph 3.1.1). In view of expected economic slowdown (Section 1), the strong procyclicality of VAT revenue in Poland is another risk factor weighing on the medium-term prospect for VAT revenue growth (European Commission, 2019b).
|
Graph 3.1.2:Tax revenue dynamics
|
|
|
|
Source: Ministry of Finance
|
Measures aimed at reducing direct taxes will likely reduce revenue. In 2019, Poland decreased the corporate income tax (CIT) rate for small and medium enterprises (SMEs) and start-ups. In 2020, this was followed by a significant increase in an annual turnover threshold to qualify as a ‘small’ taxpayer. In addition, a tax incentive to support innovation was implemented (European Commission, 2019b). Overall, these reforms have a limited budgetary impact, while aiming to boost activity and innovation. In turn, recently implemented changes to the PIT come at a high cost. With a stated objective to reduce the tax wedge, in 2019, the first PIT rate was lowered from 18% to 17% and tax-deductible costs were raised. In addition, a special PIT exemption for young taxpayers was introduced. The above changes will have a negative budgetary impact of some 0.5% of GDP yearly. It will be only marginally compensated by an introduction of a special levy on high-income earners.
Labour taxation complexity has increased. Following recent changes, the default PIT system includes two tax rates of 17% and 32%. In most common situation, employed taxpayers are entitled to deduct one of four lump sums of tax-deductible costs. They can also benefit from a tax-free allowance that declines as their revenue increases. High-income earners have no right to this allowance, while since 2019 a special levy of 4% applies to those whose taxable income is over 1 million złoty. Since 2019, young taxpayers enjoy the right to a special exemption that ends abruptly when they reach 26 years of age. On top, some 0.6 million self-employed use their right to pay a flat PIT rate of 19%, while farmers, in general, do not pay PIT. Some other solutions exist also in specific cases, such as the right to pay a flat tax amount set by the tax authorities independently of the income level.
The labour tax wedge depends strongly on the type of labour contract. In 2018, the labour tax wedge in Poland was slightly lower than the OECD average (OECD, 2019e), with lower differences between low and high income earners than in the OECD. Considering the design of PIT, the tax wedge is driven by social security contributions, particularly at the lower end of income distribution. In Poland, the share of civil, i.e. non-standard, labour contracts is high. In 2018, some 1.1 million people concluded a civil contract without having a standard labour contract elsewhere (Statistics Poland, 2019b). More than 90% of those people worked on the ‘mandate contract’, which offers the possibility not to pay social security contributions for revenue higher than the minimum wage. The remainder, working on a ‘contract of specified work’ did not need to pay social security contributions. Simultaneously, self-employed workers benefit from a significant discretion in determining the level of their social security contributions. This is likely to reduce the adequacy of future pensions.
Several measures aimed to improve the collection of social security contributions. In 2018, the payment of contributions was simplified and the collection of unpaid contributions was strengthened. In addition, the authorities have now more tools and powers to control social security expenditure, for instance for sickness allowances. However, these changes did not target the issue of differentiation in terms of contributions.
Poland took action to reduce tax uncertainty and complexity in the area of VAT, but the cost of compliance remains high. In 2019, the compound and error-prone system of assigning VAT rates to products and services was reviewed and simplified and will become fully applicable in the first half of 2020. A number of ambiguities were removed. This has thus the potential to reduce uncertainty and time needed to comply with tax obligations. In recent years, as estimated by the World Bank (2019a), this time has increased significantly for a model company operating in Poland and has remained significantly above the levels observed in the region (Graph 3.1.3) (). Nevertheless, the reform did not tackle the issue of high foregone revenue due to the application of reduced rates, estimated to be one of the third highest in the EU in 2017 (CASE and IAS, 2019).
|
Graph 3.1.3:Time to comply with tax obligations for a medium-sized company, 2010-2019
|
|
|
|
Source: World Bank
|
Environmental taxes are hardly used as a tool to drive environmentally friendly behaviour. Poland collects relatively high environmental taxes, as compared to other EU countries (European Commission, 2019e). Yet, they do not appear to encourage environmentally oriented behaviour. Most of environmental taxes are energy-related, but there are exemptions, for instance for energy-intensive industries. In addition, in 2019 the excise duties on energy were lowered and energy prices administratively controlled, with the state compensating energy producers for potential losses. Conversely, a tax on plastic bags was modified to more effectively reduce their use.
The outgoing parliament did not modernise the tax framework law. The reform was prepared over several years by a dedicated experts’ tax force and was subject to extensive public consultations. It was intended to set a new, more taxpayer oriented, tax framework. It is currently unclear if and when work will be resumed.
Fiscal framework
The fiscal framework has been weakened as some expenditure increases circumvent existing rules. In recent years, the design of the Polish fiscal framework has remained unchanged. Numerical fiscal rules, defining allowable level of deficit, debt and expenditure at various government levels, appear to be its strongest element. Particularly the stabilising expenditure rule that covers nearly the entire general government sector fulfils an important role in preventing policymakers from overspending. The rule defines a nominal expenditure level of a set of entities and funds specified in the law. Though, several new expenditure items (e.g. the exceptional additional pension payment, development of local bus connections, support for adults with disabilities) are channelled through newly created funds that do not fall under the rule. As a result, their implementation did not trigger savings in other areas. While this practice strongly weakens its role, the rule remains a crucial tool limiting an unsustainable increase in expenditure.
Work is continuing to reform the budget system. Poland – supported by EU funds and in line with Council recommendations – is carrying out a reform to address several weaknesses in the budget system. They include amongst others: complex and outdated budget classifications; suboptimal recording of information; lack of genuine medium-term planning, and a lack of direct leverage of spending reviews on the budget process, all of which hamper the efficient and effective management of funds and clear accountability for them (European Commission, 2019b; Wiczewski, 2020). The ambitious goal of the reform is to achieve a coherent budgeting process that goes beyond one-year planning. The reform appears important in light of the limited room for additional major revenue increases, longer-term expenditure pressures and inefficiencies in spending management. Given the complexity of the reform, its implementation will take several years. Its final completion date has not been announced.
Debt sustainability analysis and fiscal risks
In the short term, fiscal sustainability analysis indicates low risk. Following strong nominal GDP growth and relatively low fiscal deficits over recent years, the general government debt-to-GDP ratio continued to decline to around an estimated 47% in 2019. Following the Commission autumn 2019 forecast, it is expected to continue to gradually decline to some 44% in 2021. The 2019 debt sustainability analysis (European Commission, 2020a) points to a low fiscal sustainability risk in the short run. The structural balance had been gradually improving until 2018, but did not reach the MTO of -1% of GDP. It is estimated to have worsened in 2019, following the implementation of a social and tax package.
No major medium-term risks to fiscal sustainability have been identified. In the medium run, the S1 fiscal sustainability indicator points to a low risk given that the debt-to-GDP ratio is expected to gradually decline in the different scenarios (see Annex B and Graph 3.1.4). Consequently, no fiscal adjustment relative to the baseline ‘no-policy change’ fiscal scenario is warranted to keep the debt-to-GDP ratio below the reference value of 60% by 2030.
Fiscal sustainability risks are likely to emerge in the pension system. By design, the Polish pension system based on a defined contribution is balanced. It assumes that the accumulated capital will be paid over the whole expected period of retirement. Those fulfilling certain criteria will qualify for a minimum pension benefit, currently about €260. In theory, the system does not require public funds’ support, except for topping up minimum pension payments for those who did not accumulate sufficient capital. However, since 2019 all pensioners are receiving an extra monthly benefit equivalent to one month minimum pension, weighing on public finances. Given an expected fast population ageing and relatively low statutory and effective retirement age in Poland, a significant drop in pension adequacy is expected. According to a scenario analysed by the Economic Policy Committee and the European Commission (European Commission, 2018b), after 2060 around one third of pensioners are projected to receive only the minimum pension benefit that would, in turn, fall to some 20% of the then average wage. This might be unsustainable from the social point of view. Also, with the share of pensioners in the population of voters expected to increase strongly, this might lead to political pressure to increase pensions and thus increase fiscal sustainability risks.
|
Graph 3.1.4:Medium-term public debt scenarios
|
|
|
|
Source: European Commission
|
A change to the pension system proposed recently does not tackle adequacy risks. In 2019, the government adopted a draft bill to overhaul the pension system. The current second pension pillar is set to be phased out. Assets managed there will be transferred to the state-managed general pension system (first pillar), or to the privately managed third pillar. Those who opt for the transfer to the third pension pillar will be subject to a conversion fee of 15% of asset value. In turn, these assets will become private property that is inheritable, in contrast to assets transferred to the first pension pillar. Under national rules, the conversion fee will support the public revenue. The measure, however, may not address the risk related to future pension adequacy or pension system sustainability.
3.2.
Financial sector
The banking sector remains resilient to shocks with safe levels of accumulated capital and low leverage. In recent years, the consolidation in the sector has continued and the share of the state has increased. Solvency levels remained high in 2019, while total assets kept growing at 8.7% per year. The sector’s aggregate profitability was also robust due to moderate lending growth and decreasing costs. Risks related to the legacy portfolio of foreign-currency mortgages, following the ruling of the European Court of Justice(), could imply the need to provide additional capital.
|
|
|
Table 3.2.1:Banking sector financial stability indicators
|
|
|
|
Source: European Central Bank
|
|
|
The solvency of most banks remains strong amid prudent regulatory measures. Capital endowment of most banks enabled them to comply with existing prudential requirements as well as requirements on capital buffers. At the end of June 2019, four banks did not meet capital ratios standards, including two small commercial banks and two cooperative banks (with aggregate share in banking sector assets of 1.5%). Compared to regional peers capital adequacy ratios were affected by higher risk weights imposed by the Polish regulator and more stringent regulatory minimum capital requirements (). Moreover, a further capital requirement on the banks’ exposure to foreign-currency mortgages has been applied.
Preventive policies () applied to residential property financing contribute to low risks. Households’ mortgage-related debt is predominantly denominated in Polish złoty. Virtually all mortgage loans are based on variable interest rates implying risks if interest rates increase. According to the central bank’s stress tests, these risks are nevertheless manageable (NBP, 2019a). The ratio of non-performing loans in the housing loan segment is low, at 2.4% and 3% on average, in the case of discontinued legacy mortgages denominated in foreign currencies. These loans represent about 5.5% of the sector’s balance sheet and amortise at 8% each year. With an overall non-performing loans ratio of 6.2% in mid-2019 credit risks remain contained.
Foreign-currency denominated mortgages could require additional capital. In 2019 the authorities dropped plans to set up a relief fund for foreign-currency loan borrowers or apply a systemic conversion of the loan book denominated in Swiss francs. Instead, efforts focused on assisting struggling borrowers, including those with loans in national currency. This has eased pressure on banks. However, risks of legal action by borrowers have considerably increased following the ruling of the Court of Justice of the EU. According to the supervisor, the ruling did not mean an automatic reconversion into złoty of all Swiss franc denominated and indexed loans. However, the question of whether additional reserves need to be created remains open.
The profitability of most banks remained strong. Business growth and improving quality of loan books have helped banks to achieve a stable return on investment (Table 3.2.1). However, differences between lenders are visible with some credit institutions recording losses. Banks continue to struggle with persistently low interest rates, intense competition and costly contributions towards the deposit guarantee fund, the resolution fund, as well as the special levy on financial institutions. As in previous years, to preserve profitability, banks aim to provide higher yielding consumer loans segment and for further decreasing interest rates on term deposits. As in most EU member states, Polish banks continue to cut costs by decreasing the number of employees and branches. Despite the cost burden, the banks' cost-to-income ratio was 57.5% as of June 2019, unchanged from the year before and comparable to regional peers. Going forward, the main risk are possible court cases by Swiss franc borrowers (see above).
The banks’ funding structure remains unchanged. The banking system is primarily funded by stable – mainly households – deposits. Non-financial sector deposits grew by 10.2% per year and funded over 60% of banks assets. Notwithstanding the fact that Poland has one of the most developed capital markets in the region, banks reliance on the wholesale market remains limited. Market funding is slowly rising driven by increased issuances of covered bonds. Going forward, the share of debt issuance aiming to satisfy requirements for ‘bail-in-able liabilities’ (minimum required eligible liabilities, MREL) is bound to rise. However, meeting these targets is likely to be challenging for the Polish banking sector.
The ownership structure of the Polish banking sector continues to change. For a number of foreign parent banks the main factor in considering selling their Polish business were challenges in their own core business profitability and equity position. In addition, declining returns of Polish subsidiaries, uncertainty related to foreign-currency mortgages, the increasing role of state-controlled banks and concerns about the rule of law situation may have negatively impacted the investment climate. Therefore, the consolidation in the sector is bound to continue, possibly leading to the emergence of a market with a small number of universal players and some specialised lenders.
The state’s share in the system is increasing, underlining the role of strong and independent supervision. State ownership (direct and indirect) until recently was limited to the biggest bank and some smaller players. It now accounts for about 40% of total assets including the two major systemically important banks on top of the biggest insurance group. The tight interconnection between the sovereign and the financial system poses particular supervisory challenges, such as: paying close attention to the governance structure, and ensuring that politics are kept at arms’ length from commercial decisions. In addition, given the weight of state control in the system and the size of the state-controlled banks, the supervision authority also needs to focus on preserving competition and a level playing field. Lastly, it remains essential that the rights of minority shareholders be preserved.
Bank lending segments developed in line with underlying fundamentals, with sound fundamentals indicating further growth. Mortgages, representing some 70% of households’ debt, grew by 7.5% per year in June 2019. The lucrative consumer-lending segment remained dynamic with annual growth of 9.1%, exceeding GDP growth. Small and medium enterprises remain cash rich and reluctant to borrow from the banking system. This loan segment grew by 3.9% per year (June 2019), whereas bigger corporates increased their loans by 11%. Low private indebtedness and a housing market without major imbalances (see Section 1) combined with banks’ own funds levels and ample liquidity well beyond the required regulatory minimum allow for future loan growth.
The new employee’ capital plans might support the development of the capital market. So far, the capital market lacks traction in both equity and fixed income segments. These plans are private long-term saving plans aimed at increasing current households’ savings, supporting incomes at retirement, and boosting the capital markets, by increasing invested capital by planned 0.7% of GDP each year. The implementation started mid-2019 with the biggest employers and will gradually involve smaller firms. Once fully implemented in 2021, authorities expect the scheme to cover around 8.6 million employees (with an assumption of a participation rate of 75%; however, at the end of 2019 it reached only around 44% in large companies). These plans are to be funded by employees, employers and the state budget in the form of a subsidy. Each participant may withdraw its funds at any time or opt out from making further contributions.
A new strategy aims at developing the Polish capital market. The main goal of the recently adopted strategy is to improve access to finance for companies (especially SMEs) by increasing the attractiveness of the Polish capital market. To achieve this goal, the strategy aims to overcome about 20 barriers preventing access to finance to firms and to further develop a competitive infrastructure that allows for a more agile market development and innovation. The document – for which the European Commission provided technical support – lists 90 proposals. In addition to access to finance, it looks at improving financial literacy, creating a savings culture and improving trust and governance at Polish firms, including state-owned enterprises.
3.3.
Labour market, education and social policies
Labour market
The labour market performs well on the back of strong economic growth, but some challenges remain. The employment rate of people aged 20-64 has continued to rise reaching around 73% in the third quarter of 2019, an all-time high. However, regional differences are significant. Warsaw has an employment rate (20-64) of 82.5%, much higher than in Warmińsko-Mazurskie Voivodship (66.7%). The shrinking pool of people being able to meet labour market demand weighs on employment growth, which is estimated to have practically come to a halt in 2019. The activity rate has been steadily rising, while the unemployment rate stabilised below 3.5% in 2019, among the lowest in the EU. Both long-term and youth unemployment rates have declined to record lows in 2019 to below 1% and 10.1%, respectively. At the same time, significant differences across regions remain.
|
Graph 3.3.1:Employment rate in Poland, 2018
|
|
|
|
Source: Eurostat
|
Labour shortages in Poland persist. Almost half of the firms in the industry and construction sectors reported labour shortages as a factor limiting production in 2019 according to the Business and Consumer Surveys of the European Commission (), among the highest shares in the EU. Reported labour shortages were also relatively high in services (28.5%), a sector that accounts for close to 60% of total employment. The shortages would be significantly higher without substantial inflows of migrant workers, mainly from Ukraine (see Section 1). An important long-term trend is the changing characteristics of jobs in Poland in-line with ongoing technological development. An increasing share involves non-routine cognitive tasks, requiring high skills (Hardy et al., 2018), which may lead to some mismatches in the labour market in the future.
Employees with permanent contracts account for a low, but increasing share of total employment. In 2018, 60.6% of those in employment had a permanent contract, 1.5 percentage points more than in the previous year. Among employees, the share of temporary contracts has continued to fall, yet remained at 20.8% in Q3 2019, among the highest in the EU. Self-employment, at a share of 17.6% of total employment, remains also significant (Q3-2019, age group 20-64).
Employment rates differ between population groups. Employment rates for young men and high-skilled people are well above the EU averages. In contrast, older people and women in particular experience substantially lower employment rates than their peers in most other EU Member States (Graph 3.3.2). The share of the low skilled in the population is low but their employment rate at 42% is the third lowest in the EU. The employment rate of people with disabilities also remained low, hardly improving in recent years (). Measures to increase labour market participation of under-represented groups would contribute to advancing towards SDGs 5 and 10.
|
Box 3.3.1: Monitoring performance in light of the European Pillar of Social Rights
The European Pillar of Social Rights is a compass for a renewed process of upward convergence towards better working and living conditions in the European Union. It sets out twenty essential principles and rights in the areas of equal opportunities and access to the labour market; fair working conditions; and social protection and inclusion.
The Social Scoreboard supporting the European Pillar of Social Rights points to a number of employment and social challenges in Poland, but also positive outcomes. The good performance of the labour market is reflected in a continued increase in the employment rate, though remaining slightly below the EU average, and the decrease in the unemployment and long-term unemployment rates over recent years. Poverty has been steadily decreasing, however the share of people experiencing persistent poverty increased. However, the gender employment gap remains high and the enrolment in childcare (age 0-3) is still very low.
Despite some improvement, Poland still scores below the EU average on digital skills. Nearly half of the adult population aged 16-74 lacks basic digital skills. Polish enterprises show low investments when it comes to up-skilling the workforce: in 2018, only 13% provided training to their personnel to develop their ICT skills (compared to an EU average of 23%). To address those issues, the Ministry of Digital Affairs is working on the Digital Competence Development Program 2030, with sets of actions and targets for further enhancing and developing digital skills.
Poland made positive steps towards improving the social and economic inclusion of persons with disabilities. In 2018, a governmental programme Accessibility+ was adopted and the developments so far have been very positive. Thanks to this programme, actions are being implemented aiming at the permanent inclusion of the accessibility issue into all public policies. In September 2019, a law on accessibility entered into force. It obliges public entities to ensure accessibility standards and foresees sanctions for not respecting them. Also, in the framework of the programme direct investments are made in the existing public utility buildings and multi‑family housing stock, space, modes of transport, internet websites and universal services with a view to ensuring their accessibility.
|
|
Graph 3.3.2:Differences in employment rates between Poland and EU, 2019 (p.p.)
|
|
|
|
Source: Eurostat
|
Poland has a low, albeit improving women’s employment rate. Although in 2018 the employment rate increased more for women than for men, the gender employment gap remained high at 14.4 percentage points, and is indicated as to be watched by the Social Scoreboard. The gap is particularly high for older workers (55-64), at 20.7 percentage points (above the EU average of 13). The lower women’s employment rate is linked to their lower retirement age, care responsibilities in relation to children, to persons with disabilities and to other family members in the context of underdeveloped social services. Women’s inactivity due to looking after children and incapacitated adults has been growing since 2015 and reached 6.7% of all women aged 15-64 in 2018, 2 percentage points above the EU average, and the employment impact of parenthood for women doubled since 2015, reaching 12.5 percentage points. Rates of enrolment in formal childcare (for children less than 3 years old) remained very low, at 10.9% in 2018, below the EU average of 35.1%. In addition, enrolment in early childhood education and care for older children (from 3 years to compulsory school age) was also very low at 59.4%, below the EU average of 86.8%. Due to existing shortages, investment needs in childcare are still significant. Working arrangements are perceived as highly rigid by employees with caring responsibilities and flexibility is rarely used, which also constrains women’s labour market participation (Graph 3.3.3).
|
Graph 3.3.3:Working time flexibility for care and inactivity due to family or caring responsibilities, 2018
|
|
|
|
Source: Eurostat
|
Certain factors hinder the functioning of the labour market. In 2018, part-time employment was only used by 6.2% of employed persons in Poland, compared with the EU average of 18.5%. The underdeveloped rental housing market and public transport, particularly in the rural areas, also have a negative impact on the functioning of the labour market (Section 3.4.4). The social insurance implications of a transition from the farmers' special pension regime to the general social security regime can discourage to leave the agricultural sector.
The minimum wage increased significantly in 2020. The minimum wage was raised by 15.6% for 2020, far exceeding predicted growth of average wages and the proposals by social partners. This is affecting a significant share of workers – in 2018, around 10% of employees were earning between 80 and 105% of the minimum wage(). The higher minimum wage might create a barrier for employment of some low-skilled people, due to their low productivity.
Active labour market policies do not reach groups that could be activated. Despite a significant reduction in the unemployment rate in the last years, the active labour market policies (ALMPs) have changed little and fail to reach the unemployed who are not registered with the local labour offices. This is broadly due to a lack of trust in the offices’ support and efficiency, and because of legal constraints, as various groups are not eligible for assistance, including full-time students, people receiving disability or old-age pensions, even if they retired early, farmers and their household members. There are also questions concerning the effectiveness of the process of matching potential workers with work places. The Labour Fund, financed mainly by payroll taxes, is increasingly spent on actions not targeted at jobseekers. Consequently, ALMPs’ financing is heavily dependent on the European Social Fund (22% of the total expenditure in 2018). ALMPs are also weakly integrated with social policies, conducted at a lower level of regional administration (gmina), and with health policies.
The quality of social dialogue has deteriorated, in particular in relation to legislative processes with no or short consultations. Social partners report that the quality of consultations in the Social Dialogue Council has been deteriorating in recent years, in particular due to government eschewing consultation of some key laws and providing excessively short deadlines for comments (Section 3.4). Social partners lack the necessary capacity to fully play their role in social dialogue processes. The number of trade union members remains low. In addition, Poland has a very low coverage of collective bargaining, which takes place mainly at the company level, while collective agreements at sectoral level are rare.
Education and skills
Basic skills of 15-year old students were among the best in the EU in 2018. The results of Polish students in the OECD Programme for International Student Assessment (PISA) 2018 improved in all three testing areas (reading, mathematics and science) compared to 2015 (OECD, 2019d). Poland’s lower secondary school pupils ranked third in the EU in students' proficiency in science and mathematics, and scored significantly above the EU average in reading. The proportion of low-achievers in all three areas combined has decreased to only 7% (EU average was 13%). The proportion of top performers in all areas tested has increased to levels above the EU average. The results became also more equitable. Skill development has the potential to support productivity and labour market participation and further contribute towards advancing towards SDG 4.
Gaps remain in the provision of early childhood education and care, in particular in rural areas, contributing to regional disparities. Participation in pre-school education of children aged four and above is close to the EU average, while the rate continues to be low for younger children, in particular for 3 year-olds.. Despite a legal entitlement for children aged 3-5, not all of them could get a place (NIK, 2019b). The problem concerns mainly rural areas, where the coverage for this age group was only 67% in 2018 (Statistics Poland, 2018b). The lowest participation rates in rural areas were in Zachodniopomorskie (46%), Warmińsko-Mazurskie (49%), Podlaskie (51%) and Lubuskie (52%) (Statistics Poland, 2018b). The same regions were affected by a relatively high rate of early leavers from education and training (Eurostat). In 2018, the average rate for Poland was at 4.8%, one of the lowest in the EU, while Zachodniopomorskie, Warmińsko-Mazurskie and Lubuskie were close to the EU average of 10.6%.
The changes in the school system absorb substantial resources and affect working and learning conditions. The closure of lower secondary schools led to a double cohort of students entering upper secondary schools in 2019 (European Commission, 2017). Large cities experienced shortages in available places in general secondary schools. Learning conditions in 34% of the controlled schools have worsened (NIK, 2019c). Primary and secondary schools often operate to a shift schedule. The proportion of teachers working in more than one school increased significantly between 2016 and 2018 (NIK, 2019c). Local governments claim that the actual costs incurred in the period when the reform was implemented significantly exceed the allocated ministerial subvention, which affected in particular cities with powiat rights (cities with a status of a county) and urban communes (NIK, 2019c). Overall, the expenditure on education incurred by local governments has been increasing faster than the corresponding ministerial subventions received (Statistics Poland, 2018b).
Changes in the school system may increase inequality of opportunities. Some key issues include an earlier channelling of pupils into either the general or the vocational stream and large swings in the size of school cohorts making it more difficult to find a place at a school of first choice. The share of pupils in non-public primary schools has continued to increase. Increased household expenditure on private tutoring has been also observed (CBOS, 2018). Experts argue that the new core curriculum is outdated and too heavy (Marczewski, 2019b). The homework burden on pupils is judged excessive (RPO, 2019). All this deepens the challenges in terms of equality of opportunities, support for the development of transversal skills and educational performance of pupils from disadvantaged socio-economic background. In addition, the school system is not fully adapted to meet the needs of an increasing number of students born abroad. The additional educational support for them is limited and there is no relevant methodological guidance at national level, including for preparatory classes organised by schools. The focus on improving inclusive education has been upheld, as reflected in 2019 National Reform Programme but stakeholders’ concerns over individualised teaching persist. .
Shortages of teachers have increased recently and the attractiveness of the profession remains low. Teachers' salaries are low in comparison with average wages of tertiary graduates, in particular for new and kindergarten teachers. The pay rises introduced in 2019 failed to put a definite end to teachers’ strikes launched in April 2019. Large urban areas face difficulties in ensuring a sufficient number of teachers. Shortages of teachers increased in particular in subjects such as foreign languages, mathematics, ICT and science, as well as in early childhood education and care. The organisational implications of the school system change (see above) did not increase the attractiveness of the profession. PISA results showed that the proportion of students agreeing that their teacher shows enjoyment in teaching is among the lowest in the OECD (59% vs 74% average), while students scored higher when they perceived their teacher as more enthusiastic (OECD, 2019d). Some measures have been taken to improve the quality of initial teacher education, and opportunities for continuing professional development. Their effectiveness and impact on teachers’ skills will need to be monitored.
The vocational education and training reform is being implemented, but its impact on improving labour market relevance cannot be assessed yet. The structure and scope of the core curricula for initial vocational education were modified. Teachers are now obliged to follow compulsory periodical practical training in enterprises. Some incentives for employers to get involved in vocational education and training have been proposed but they are limited in scope and scale. Work-based learning opportunities for students remain insufficient. Only 15% of students were enrolled in combined school and work-based programmes in 2017-2018. In 2018, 78% of recent graduates of initial vocational education and training were employed, in line with the EU average of 79%, while the situation on the labour market was particularly favourable.
The 2018 higher education reform is now being implemented, modifying evaluation, management and financing models. New quality assurance institutions have been set up, such as the Council of Scientific Excellence and the Science Evaluation Committee. Higher education institutions are introducing changes in their organisation, including implementation of new statutes, staff reorganisation and setting up scientific councils. The first full assessment will only be possible after the first full cycle of scientific evaluation and after the first students to follow the new higher education curriculum have graduated. However, there are preliminary indications that the 2018 reform may not be fully effective in improving the quality of teaching. The new law is unclear about requirements for lecturers as for initial pedagogical training and the support for continuing professional development. Academic staff underperforming in scientific publishing can be moved to didactic posts, created in accordance with the new legislation (Żylicz, 2019). Due to lack of specific guidance on the evaluation of doctoral schools, the effectiveness of the process of establishing them is also questionable (id.). The internationalisation of higher education remains limited in Poland (European Commission, 2019b). Although the proportion of international or foreign students increased to 4% in 2017, it is still below OECD average (OECD, 2019a). Experts argue that the current measures are not sufficient to boost international staff mobility (Kosmalska, 2019).
The proportion of young people choosing tertiary education remains high, while higher education funding remains low. The proportion of people choosing higher education has declined slightly over the past few years. According to PISA (OECD, 2019d), socioeconomic status strongly affects students’ expectations of completing tertiary education. Still, as of 2018, 46% of the population aged 30-34 had tertiary education, well above the EU average of 41%. Women choose and complete higher education more often than men. The 19 percentage points difference between women and men in higher educational attainment in that age group is one of the highest in the EU. The expenditure per full time student is still well below the EU average (in PPS): €7,000 vs €10,817.
Participation in adult learning has slightly improved, but its up-take remains limited. In 2018, only 5.7% of adults aged 25-64 had a formal or non-formal learning experience in the last four weeks (EU average: 11.1%). Only 1% of those with low educational attainment were adult learners, compared to the EU average of 4.3%. Progress in coordination of adult learning policies has been limited so far. The implementation of the National Qualification Framework has been delayed and hence its take-up by employers and employees remains limited. In January 2019, the government adopted the general part of the Integrated Skills Strategy. Its implementation plan is to be developed based on cooperation with the OECD. In parallel, the line ministries are working on development plans for specific skills, such as the Digital Competence Development Program 2030.
Social policy and inclusion
The share of the population at risk of poverty was declining until 2017, with signs of stabilisation or increase in 2018. The share of population at risk of poverty or social exclusion rate (AROPE) has been decreasing continuously in Poland since EU accession and was at 18.9% in 2017-2018, well below the EU average. However, quite large differences exist between regions. In eastern Poland the AROPE rate is high at 27%. This is almost twice as high as the best performing region in Poland, which is the Mazowieckie Voivodship with 14.3%. The share of the population facing material and social deprivation also declined in 2018, in line with the EU-wide trend (). The persistent poverty rate () increased slightly from 9.1% in 2017 to 10.5% in 2018. This indicates an increased share of people experiencing poverty risks for long periods with no improvements in their status. Household budget survey data indicate an increase in incidence of all material poverty indicators in 2018.
Targeting of social transfers is weak. The minimum income support adequacy was below the EU average in 2017 and coverage just above (). The biggest increase in extreme poverty reported by the household budget survey concerns people/families living on allowances (other than pensions and disability pensions) signalling the weaknesses in the social security system. The benefit under 500+ Programme was made universal in mid-2019 while its nominal value remained unchanged for 4 years. Ensuring universal access to social protection remains a challenge. Workers on some civil law contracts do not have formal access to unemployment benefits, maternity benefits, old age/survivors pensions and invalidity benefits.
Social services remain underdeveloped. Recent main government initiatives in social policy focused on increasing social transfers with less focus on enabling social services(), despite growing needs. Poland lacks a strategy on how to ensure equal access to quality, affordable and sustainable community-based social services with measurable objectives and underlying national funding. The law on Centres for Social Services adopted in 2019 aims at creating integrated social services, but its impact is uncertain due to the lack of national financing and possible over-reliance on European funds, which cannot guarantee the sustainability of the reform. In addition, the model adopted in the law allows municipalities to decide, while not infringing the rules of provision of social services resulting from other acts, what set of services the centres will offer, and for whom and at what price, exacerbating the risk of further fragmentation of service provision between municipalities. It remains to be seen if the potential of NGOs – important provider of social services until now – can be developed in this model. No progress is observed in implementing effective coordination between social and health services. In addition, cooperation between local employment services and social services remains limited. This hampers synchronised interventions for the long-term unemployed and inactive. A new model will be difficult to implement without ensuring decent working conditions, including pay, for social workers and other staff of the system.
The situation of persons with disabilities and their carers has not improved. The cash benefits were slightly increased but no steps were taken to encourage persons with disabilities and their carers to take up work. The provision of care and special care services remains insufficient (MRPiPS, 2019). The Polish law on social assistance does not include personal assistance or respite care among the benefits it lays down provisions on. The Solidarity Fund for Support of Persons with Disabilities, which was established in 2018 to remedy the situation, is being reformed and the funding could potentially be spent for other purposes.
Long-term care continues to be provided mostly by informal carers, often family members who lack adequate institutional support. Residents of long-term care facilities in Poland face a higher risk for patient safety events, including healthcare-associated infections (HAIs) and pressure ulcers than on average in the OECD (OECD, 2019c). The number of long-term care workers per 100 individuals aged 65 and over is very low (one in Poland against five on average in OECD28; OECD, 2019b). Similarly, public expenditure on long-term care at 0.5% of GDP in 2016 is very low comparing to the EU average (1.6%) (European Commission, 2018b). A comprehensive strategic approach based on the analysis of needs of persons requiring long-term care and their carers as well as the definition of financing sources would be a first step in addressing current and future demographic challenges.
Health
Health outcomes improved over the last 10 years, but areas for improvement exist. Life expectancy at birth remains 3.3 years below the EU average, with a gap between the highest and the lowest educated by 9.2 years and differences between regions reaching 3.5 years for men and 2.5 years for women (Eurostat 2018 data). The preventable mortality rate decreased by about 10% between 2011 and 2016, which however still exceeds the EU average by more than one third. At the same time, preventive care spending in Poland amounts to less than half the EU average in nominal terms (€34 compared to €89 per person). Behavioural risk factors that individuals can modify, such as diet, tobacco smoking and drinking alcohol account for almost half of all deaths in Poland. Mortality rates from prostate, breast and colorectal cancers have all increased over the same period, highlighting challenges in the provision of screening services. Although the introduction in 2015 of a fast-track pathway for cancer patients has improved access to earlier detection and care, late stage diagnosis and long waiting times for diagnostic examinations are still a concern. Through the National Oncology Strategy, 2020-30 cancer care quality should be improved; however the impact remains to be seen.
Access to health care remains a challenge. In 2018, the share of the Polish population reporting unmet needs for medical examinations due to either costs, distance or waiting times increased slightly to 4.2%, well above the EU average of 2%. This rate is much higher for low-income groups. In 2018, the average waiting time for specialist services was 3.4 months with the longest average waiting times reported for endocrinology (11 months) and dental services (8.5 months). Towards the end of 2019, Poland has been implementing e-health projects to improve access to healthcare, such as Patient Internet Account (PIA), ), national e-prescription service and e-referrals pilot. E-prescriptions are expected to be mandatory from January 2020 and e-referrals as of 2021.
The health system is underfunded and lacks a long-term strategic framework. The lack of a long-term development vision adversely affects the functioning of the system, investment decisions and allocations of resources. In 2017, total health expenditure per person amounted to €1,507 (adjusted for differences in purchasing power), among the lowest in the EU. On average over the last 15 years, public health expenditure (4.6% of GDP) accounted for around 70% of total health expenditure. Out-of-pocket spending accounted for 23% of all health spending, a share higher than the EU average (16%), with the bulk of it on outpatient medicines (OECD/European Observatory on Health Systems and Policies, 2019; NIK, 2019a). In 2017, approximately 9% of households reported that on some occasions, they were unable to purchase prescribed or recommended medicines (Statistics Poland, 2018a).
There is scope for more efficient use of resources in the hospital sector. In 2017, over one third (34%) of health expenditure was spent on inpatient care, representing one of the highest shares in the EU. The number of hospital beds is high, with 6.6 beds per 1,000 population in 2017 compared to an EU average of 5.0, but they are unevenly distributed across the country and have low occupancy rates (66% compared to 77.5% in the EU, Eurostat data). The hospital network, introduced in October 2017, encompassed 600 out of over 900 hospitals and was supposed to shorten waiting times and provide comprehensive treatment. This has not been achieved and the financial situation of hospitals has worsened. The debt carried by hospitals was PLN 14 billion in June 2019.
Many medical procedures currently performed in hospitals could be done outside hospitals at lower costs. Certain diagnostics, specialist care and rehabilitation procedures are unnecessarily carried out in hospitals for reasons related to financial incentives built into the health system. Factors limiting accessibility, such as long waiting times, make some patients use the emergency wards, even if not strictly needed, thus overloading them. Numerous programmes to improve care coordination are being piloted, including for oncology patients and new programmes. Poland started the procedure of including Daily Homes of Medical Care services in the National Health Fund contracting. New primary healthcare solutions have been tested since July 2018, within a pilot Primary Health Care PLUS project with a view to introducing changes to the health system. Community Centres for Mental Health have been piloted since 2018 with a view to ensuring availability of services all across the country. It is important that lessons learnt from these pilots are used to develop the services and roll them out to the rest of the country.
Poland faces a significant shortage of medical practitioners and staff. In order to reach the EU average almost 50,000 additional doctors and 100,000 nurses more are needed (from the current levels of approximately 90,000 doctors and 225,000 nurses, according to calculations based on Eurostat data). There is a significant number of Polish trained doctors working in other countries and the number of physicians increased by less than one thousand on average per year, although the number of certificates that allow doctors to take up employment abroad is diminishing. The nursing staff is ageing fast. Nurses aged 50 and older accounted for 60% of the overall number, including 27% who were 60+. Conversely, nurses aged up to 31 accounted for only 7%. The average age of nurses increased is approximately 52 years (). This poses prospective risks to the access to and quality of care. In addition, an uneven distribution of healthcare workforce across the country exacerbates the challenge posed by gaps in coverage and access to healthcare.
3.4. Competitiveness, reforms and investments
3.4.1.Investment and productivity challenges
Investment and productivity developments
Investment remains relatively weak in Poland. The investment recovery observed in 2018 helped lift the investment to GDP ratio from around 17% in 2017 to just above 18% in 2018 and the first three quarters of 2019. This is well below the EU average (Graph 3.4.1). Public expenditure were the key driver of the investment recovery in 2018, while in early 2019 private investment recorded stronger gains. However, given the projected economic slow-down (see Section 1) and the upcoming changes in light of the ongoing negotiations for EU Funds between 2021 and 2027, the outlook for the investment recovery is uncertain.
|
Graph 3.4.1:Investment rates
|
|
|
|
Source: Eurostat
|
Private investment scored a long-awaited recovery in 2018 and early 2019. The private investment-to-GDP ratio has been relatively low for many years, especially in comparison with other catching-up EU countries (see European Commission, 2017, 2018a, 2019b). It fell from 15.6% in 2015 to 13.5% of GDP in 2018. Since the beginning of 2019, private investment started to recover with a year-on-year increase of 14.1% (Q3 2019). Its revival in early 2019 can be interpreted as the realisation of previously delayed investment decisions given a prolonged period of high capacity utilisation. Against the background of remaining investment barriers (see European Commission, 2018a, 2019b, Box 3.5.1) and the worsened forecast for international demand the outlook for private investment remains uncertain. This has been confirmed by some recent surveys, indicating that only 16% of entrepreneurs plan to increase investment in the near future (NBP, 2019b).
Swings in public investment trends, mainly related to EU funds utilisation, have a large impact on overall investment activity. Public investment has been relatively large in Poland as a share of GDP. In 2018, the ratio of public investment to GDP amounted to 4.7%, which was markedly above the EU average (2.9%) and most regional peers, thanks to a substantial degree contribution of the EU funds. This implies that public investment trends have a bearing on Poland’s overall investment performance. Since 2016, EU funds for the 2014-2020 budget period have increasingly supported public investment, expected to reach a peak in 2019-2020. In the medium term, however, the role of the EU funds in public investment is set to diminish, as the funds allocated to Poland will likely be lower when compared to previous period. This implies that in order to maintain or increase investment rates additional private or public means would need to be mobilised.
The European Fund for Strategic Investments and the national development bank support investment in Poland. Since 2015, total financing under this instrument in Poland has reached around €3.9 billion and is set to trigger €21 billion in additional investments. €3.7 billion has gone to infrastructure and innovation projects. More specifically, the rail operator has received EU funding under the Investment Plan for Europe worth around €47.5 million. In addition, €212 million were allocated to financing small and medium enterprises (SMEs). In total, almost 75,200 SMEs and mid-cap companies are expected to benefit from improved access to finance. By the end of 2020, all EU financial instruments are set to come under the roof of the new InvestEU programme. InvestEU will focus on areas relevant to Poland: sustainable infrastructure, research and innovation, digitalisation, social investment and skills. The Bank Gospodarstwa Krajowego (BGK), the national promotional and development bank, supports economic growth by providing finance for infrastructure projects. It also aims to promote entrepreneurship and develop micro companies and SMEs by offering guarantees and surety instruments. BGK is also active in stimulating cooperation between enterprises, the public sector, and financial institutions.
Labour productivity has been increasing strongly, but underlying weaknesses in productivity drivers remain. Labour productivity growth has been among the fastest in the EU for several years (Section 1). It was accompanied by strong wage growth, gradually closing the still considerable gap in wage levels with the EU average. Poland has one of the largest productivity gaps between large and small firms. Coupled with the relatively high share of small firms, this contributed to still-lagging productivity levels compared to the EU average (see Bauer et al., 2020). Thus, in addition to capital investment needs (Section 1), productivity gains can be achieved by unleashing the firms’ potential to grow. This involves addressing challenges in the business regulatory environment (see Box 3.5.1), the availability of skilled workforce, and the effective diffusion of innovations across the economy.
Innovation
Poland is taking measures to enhance the economy’s innovative capacity, but a significant rise in innovative outputs is still to materialise. Poland continues to be a moderate innovator in the 2019 European Innovation Scoreboard (European Commission, 2019d). The total R&D expenditure remains low 1.2% of GDP vs the EU average of 2.1% in 2018, with regional disparities persisting. Although business expenditure on R&D has more than quadrupled in the past ten years, it remains below the EU average (). In terms of output, no significant results can yet be observed. This is reflected in a sluggish increase in patenting activity and in the share of high-tech exports in recent years, as shown in statistics from the European Patent Office (). However, the extended R&D tax relief, whose uptake has rapidly grown, the ‘Innovation Box’ () and the introduction of a new simplified joint-stock company have the potential to support innovative enterprises. The development of venture capital markets remains crucial to facilitate the growth of innovative firms. Measures to enhance the economy’s innovative capacity would lead to further progress towards SDG 9.
Polish companies, particularly small ones, show a slow uptake of digital technologies. Less than 8% of small enterprises are highly digitalised compared to 50% of large companies (European Commission, 2020b). The use of robots is rather limited, with, on average, 7.5% of enterprises using them in 2019. To a certain extent, the limited take-up of digital technologies may be driven by firms’ difficulties in hiring specialists, despite a high share of graduates in science, engineering and computing (see section 3.3). Micro and small companies also have limited access to specialised ICT training due to personnel availability and cost and wage-related concerns. Under the national Industry 4.0 strategy, the government launched workshops to help acquaint SMEs with the practical use of digital solutions, like artificial intelligence, high performance computing and 3D printing.
Poland is introducing measures to improve its scientific performance. The 2018 Act on Higher Education and Science is under implementation, with implementing legal acts being prepared and adopted. The new evaluation criteria for scientific organisations emphasise the importance of international cooperation and the internationalisation of science. The first edition of the 'Excellence Initiative – Research University' programme was completed in October 2019, with the selection of 10 universities to be reinforced in their research activities. A new configuration of the university councils, including external stakeholders, may positively affect universities' social and economic impact. Doctoral training has been re-organised with the creation of a single doctoral school within higher education institutions. In 2019, the Ministry of Science and Higher Education initiated a reform of the Polish Academy of Science, envisaging, among others, increased prerogatives for the President of the Academy on the supervision of the Academy’s institutes, an external review of the Academy’s Institutes and the introduction of minimum wage levels for researchers.
The potential of cooperation between science and business remains underexploited. Cooperation between enterprises and scientific institutes is hardly improving, as confirmed by recent data on joint publications by business, science and public research financed by the private sector (European Commission, 2019a). In 2019, the Łukasiewicz Research Network, comprising 38 research institutes and the Łukasiewicz Centre, was established with the main goal of ensuring excellence of research and development and transfer of knowledge to the economy. It aims to support scientific excellence and the commercialisation of research activities. The Centre acts as an umbrella unit for the Network, ensuring coherence between the institutes' research agendas and State-level strategies. The role of technology transfer centres in the process of innovation diffusion remains limited (European Commission, 2017b; Łobacz, 2018).
3.4.2.Regulatory and institutional environment
Business regulatory environment
Despite the overall favourable conditions for doing business in Poland, uncertainty drags on the business sentiment. Polish entrepreneurs have been benefitting from the demand-driven supportive economic cycle, broadly unrestricted access to labour market and finance. However, the companies’ perception of the business environment has been deteriorating, as indicated by various business organisations’ surveys (Konfederacja Lewiatan, 2019). One of the identified key factors weighing on business sentiment is uncertainty stemming from the instability of the regulatory and institutional setting, including the ease of paying taxes (NBP, 2019c). For instance, the retail sector has been facing significant regulatory changes, either already introduced (ban on Sunday trade) or being pending (the retail turnover tax). The regulatory burden is also reflected in Poland’s score in the recent international doing business rankings. In the 2020 World Bank Doing Business Report, Poland fell seven places, broadly due to more burdensome procedures for transferring and registering property and paying taxes (World Bank, 2019b). In turn, the Global Competitiveness Index results are pointing to weaknesses in the general institutional set-up, with some low scores regarding governmental regulation and the efficiency of legal framework, as well as policy stability by the government (WEF, 2019).
On top of the regulatory overhaul of 2018, the government has put forward new measures aimed at improving the regulatory environment. The impact of the 2018 law, the so-called ‘Constitution for Business’ (see European Commission, 2019b), can so far be assessed as mixed. The government is introducing new changes, including some relief in social security contributions, reduction of the required minimum period for storing employee files, as well as lengthening payment deadlines for VAT on imports. Additionally, in 2020 the late payments regulation entered into force, introducing legally binding deadlines for payments, which is set to help address arrears and support enterprises’ financial liquidity. In addition to these improvements for existing companies, there are other measures to incentivise the creation of new businesses, such as introduction of a new simple public limited liability company with a minimum capital of 1 złoty (circa €0.2).
The new procurement law aims to address key weaknesses in public procurement in Poland. The public procurement system suffers from a low number of companies competing in tender procedures, resulting in a high share of sole offers. The new public procurement law adopted in autumn 2019, to enter into force as of 2021 addresses these challenges. It facilitates companies’ participation in public procurement and it generally regulates much broader part of purchasing cycle than the choice of contractors. The law introduces public procurement policy implementation mechanisms. Among others, it imposes a price revision mechanism in long-term contracts, introduces partial payments for longer contracts and precludes abusive clauses. These changes were long-awaited by market participants and are to serve creating better conditions for increasing companies’ interest in public procurement contracts, including small and medium companies.
Market functioning
Poland’s integration in the European Single Market is a key element for its growth success. Poland continues gaining world market shares and is profiting significantly from foreign-direct investment, being well integrated in the European supply chains. While Poland continues improving the timely transposition of the EU law, the number of incorrectly transposed directives and ongoing infringements have both increased during 2019. (see European Commission, 2020d). An improved application of related rules and standards offers the opportunity to strengthen further the benefits of the Single Market for Poland and the other Member States.
Electricity market regulations contribute to market distortions. Despite increasing imports from Germany, Czechia and Slovakia, the internal electricity grid is not sufficiently developed to take full advantage of the interconnectivity. Furthermore, through regulatory measures, Poland restricts full use of the interconnectors with Lithuania and Sweden. Regulatory changes introduced on the verge of 2018 and 2019 implementing government’s intention to freeze the electricity prices (see European Commission, 2019b) affected energy market fundamentals such as profitability, revenues and growth potential of suppliers. The resulting energy prices distortions may also reduce the effectiveness of energy efficiency policies, reduce the incentives for renewables and may negatively affect public finances, especially if potentially accumulated losses concern state-controlled energy incumbents.
On the gas market, the dominant position of the state-owned company disturbs the market. In 2018, the market share of PGNIG continued to grow from 80% to more than 82%. This change was due to a significant drop in gas purchases from other EU Member States by the large (industrial) final customers (ERO, 2019) and the increase in long-term contracts between PGNIG and energy-intensive industries (PGNIG, 2019). Limiting competition in the gas market and dominance of long-term contracts may lead to an increase in gas prices for households and industrial consumers, reduction in the gas sector investments, and impeding decarbonisation of the economy and the future role of renewable gases in Poland.
Yet another major change in the governance framework for state-owned enterprises is taking place in Poland. With the government formed after the 2019 elections, a new States Assets Ministry was created. This Ministry is set to supervise all state-owned and state-controlled enterprises, including financial and energy sector companies. This marks a significant change to the previous arrangements following the 2017 governance law, when key supervision responsibilities were delegated to line ministries (e.g. the Ministry of Energy) and the former Ministry of Treasury was liquidated (European Commission, 2018a). The creation of the new ministry with centralised supervision is a step towards compliance with OECD guidelines. However, it remains to be seen if this will help to improve compliance with other crucial guidelines, including the introduction of accountable ownership rationale review procedures, or standardised board appointment procedures.
The increased role of state ownership in the economy reinforces the need to strengthen independent oversight and regulators. The role of state-owned enterprises in the economy and in particular in key sectors like finance and energy has increased in recent years (Section 3.2 and European Commission, 2019b). This underlines the importance of a strong and independent supervision for the financial sector (see Section 3.2) as well as strong and independent regulators e.g. for the energy sector (see Section 3.4.2).
Quality of institutions
The insufficient scope of consultations of legislative proposals remains a key concern. Since 2019, the head of the government’s standing committee has the power to block a government legislative proposal in the event that public consultations have not been conducted. In addition, the Centre for Strategic Analyses (Centrum Analiz Strategicznych), a new body in the chancellery of the prime minister, was created to, inter alia, improve the quality of government’s draft laws. This is likely to improve the legislative process, but as part of the chancellery, the independence of the centre raises concerns. By contrast, public consultations are still not required for draft laws tabled by members of parliament, affecting the overall quality of laws (European Commission, 2018a, 2019b). While this path was less frequently used in 2018 and 2019, it remains a source of uncertainty for citizens and businesses, which can be illustrated by the proposal to remove the cap on the payment of social security contributions ().
The risk of a serious breach of the rule of law in Poland continues to exist with potentially negative consequences for investors’ trust. As stressed by international stakeholders (see e.g. ECB, 2019; OECD, 2019f), a persistent threat to the rule of law puts at risk the effective functioning of the justice system and overall institutional stability, distorts mutual trust and subsequently impairs the investment climate and sustainability of long-term growth. Over the course of 2019, the Court of Justice of the European Union issued final rulings confirming that the initial Polish legislation concerning the lowering of the retirement age of judges was in violation of EU law regarding judicial independence (), and a preliminary ruling as regards the independence of the Disciplinary Chamber of the Polish Supreme Court (). The Commission also decided to refer Poland to the Court of Justice concerning the new disciplinary regime for judges, which introduced the risk of undermining judicial independence. The Commission further decided to ask the Court of Justice to impose interim measures by ordering Poland to suspend the functioning of the Disciplinary Chamber of the Supreme Court (). On 23 January 2020, the Sejm adopted a law concerning the functioning of the judiciary, which according to the European Commission for Democracy through Law (‘Venice Commission’), raises concerns as regards judicial independence (). The procedure under Article 7(1) TEU is still on-going ().
3.4.3.infrastructuRE Development
Domestic energy generation infrastructure is ageing, while demand is increasing. In 2018, the gross domestic electricity production dropped while consumption increased (ERO, 2019). With the average age of the coal-fired power plants of around 30-40 years (Euracoal, 2019) and increasing demand, Poland is confronted with considerable investment needs as regards electricity generation capacity. About 25% of the current national energy electricity capacity is to be withdrawn in the next decade, with the largest share (94%) being hard coal and lignite-fired units (ERO, 2019). In 2018, the share of natural gas in Gross Inland Consumption (without electricity and derived heat) was 15,2 %, lower than EU average of 23,6 %. Gas distribution network is underdeveloped in some areas.
Crucial cross-border gas and electricity projects are progressing well. Poland is engaged in several gas projects in the region. The development of gas interconnectors with Lithuania and Slovakia is advancing, although with delays. Moreover, Poland has decided to expand the capacity of the liquefied natural gas (LNG) terminal in Świnoujście and to construct a second LNG terminal in Gdansk, which could allow serve gas demand from neighbouring countries. Poland is committed to achieving the synchronisation of the electricity grids of the Baltic States with the continental European grid by the end of 2025. This entails building a high-voltage submarine cable with Lithuania and internal grid reinforcement to ensure its full functionality. The implementation of the synchronisation project is progressing.
Developing nuclear power generation has been chosen as one of the strategies to cater for growing electricity demand. According to the National Energy and Climate Plan (NECP) (), nuclear power is to enhance energy diversification and help reduce the share of coal in electricity production in the long term. Compliance of the future updates of the Polish Nuclear Power Programme with the EURATOM and EU legal framework is vital in the context of nuclear power capacity development in Poland.
High growth in road transport affects the share of rail in transport of both goods and passengers. The modernisation of railway lines is lagging behind the development of high-speed roads. The unsatisfactory technical condition of the rail infrastructure, capacity bottlenecks and lengthy track works result in frequent traffic disturbances and operational limitations in terms of speed, train length and maximum axle load (). This has an adverse impact on rail freight competitiveness. (UTK, 2019; Pieriegud, 2019). As a result, between 2005 and 2018, rail freight transport in Poland increased only by 19% compared to 215% growth in road transport (see Graph 3.4.2) (Statistics Poland, 2019c). In most connections, passenger rail is not an attractive alternative to private cars due to the low frequency of operations and insufficient integration with other transport modes (Rosa, 2018; Moskwik and Krupa, 2019; Komornicki, 2019; Gadziński and Goras, 2019).
|
Graph 3.4.2:Freight transport performance in billion tonne-kilometers (tkm)
|
|
|
|
Source: European Commission, Statistics Poland
|
Underdeveloped inland connections inhibit the development of Polish seaports. The main barriers stem, first, from uncompleted modernisation of the Baltic-Adriatic Core Network Corridor and Rail Freight Corridor. The upgrade of railway access to the Gdańsk, Gdynia, Szczecin and Świnoujście seaports is critical for increasing the volume of goods transported from seaports by rail. Relevant investments are to be completed by 2022. Second, existing road connections to Gdynia and Szczecin ports do not correspond to the heavy goods vehicle standards (NIK, 2018; Pieriegud, 2019). The lack of comprehensive planning for intermodal and maritime transport reduces the efficiency of investment in these sectors. Third, the capacity and number of intermodal terminals for cargo transhipment appears limited, and the digitalisation of intermodal services is not progressing at a satisfactory pace (Bocheński, 2018; Pieriegud, 2019).
Despite substantial investments in urban mobility, nearly half of the inhabitants of urbanised areas have no direct access to public transport. The fast development of areas surrounding towns and cities in the past years has boosted the commuting demand to levels that are not met by existing public transportation. A 2-km average distance to the nearest public transport hampers its use and lowers the mobility of those inhabitants that cannot use cars (Gadziński and Goras, 2019). Heavy reliance on individual transport increases carbon and non-carbon emissions, worsens road safety and creates congestions, which, together with underdeveloped infrastructure for cycling and walking, degrades the quality of life in cities (Gadziński and Goras, 2019; Komornicki, 2019). Most Polish cities have adopted sustainable urban mobility plans, but implementation is lacking (Gadziński and Goras, 2019). Urban transport investment projects often produce conflicting results and are not aligned with certain municipal policies, such as environmental, health and land use planning policies. Nor are they complemented with operational measures to reduce motorised traffic.
Poland has improved its road safety in recent years, but progress has stalled. In 2018, Poland reported 75 road fatalities per million inhabitants against the EU average of 49. At 29%, the share of pedestrians killed is also significantly higher than the EU average of 21%. Although between 2010 and 2016 Poland reduced road deaths by 23%, in the following two years it only fell by 5% and preliminary figures for 2019 show even a slight year-on-year increase (POBR, 2020). The key factors behind these adverse developments in road safety are speeding, lack of protection of vulnerable road users and infrastructure shortcomings. To enhance road safety, Poland has focused on education campaigns, while speed limits are poorly enforced and the infrastructure protecting vulnerable road users remains underdeveloped. Since October 2019, Poland has been one of six beneficiary countries of the new EU Road Safety Exchange programme, held in twinning arrangements with France and Austria.
Poland has made considerable progress in ultrafast and mobile broadband take-up, but is still far from its connectivity targets. Poland committed to providing connectivity of 30 Mbps or more for all citizens by 2020, as well as access to a gigabit range of internet speeds under the Gigabit Society targets for 2025. While progressing, Poland is still far from these commitments, as currently only 66% of Polish households have access to at least 30 Mbps and less than 30% are covered by gigabit speed network (European Commission, 2020b). The main progress obstacles are related to the geographical conditions raising the cost of network deployment. The Polish authorities have also set up a new broadband fund to support the development of fast networks. Regarding 5G deployment, the country is developing the conditions to auction 5G-pioneer spectrum bands (700 MHz, 3.6 GHz and 26 GHz), although effective implementation of 5G will require close monitoring by all relevant parties.
3.4.4.REGIONAL DISPARITIES
Polish regions are catching up quickly with more developed regions in the EU, but disparities remain. Since Poland’s accession to the EU in 2004, all the Polish regions have developed faster than the EU as a whole. Still, the pace of observed convergence with the EU average was unequal, with wealthier Polish regions catching up faster than the less developed ones. Even more pronounced disparities, not only in the catch-up process but also in other spheres, are visible at sub-regional level and between urban and rural areas, creating policy challenges (European Commission, 2019b).
The transport infrastructure has a bearing on local development and disparities. The road infrastructure in Poland has improved significantly since the EU accession (European Commission, 2018a, 2019b). This, in turn, improved the connectivity of many areas with centres of economic activity and facilitated their development. At the same time, there remain poorly connected peripheral areas, in particular at the borders between regions or close to the country’s borders. This is partly due to the fact that road investment does not necessarily prioritise territories that are not easily accessible by road. Moreover, the connections of the newly developed motorways and expressways with the secondary road network are not always sufficient to eliminate the isolation of peripheral areas (Komornicki, 2019).
Public transport demonstrates noticeable weaknesses. Between 2008 and 2018, the length of regional and sub-urban bus lines in Poland decreased by more than 50% (Statistics Poland, 2010, 2019c). Moreover, bus frequency is often inadequate, fares are perceived as high and coordination between authorities organising rural public transport is suboptimal (Gadziński and Goras, 2019). At the same time, the number of kilometres of railways has also shrunk, though to a smaller extent (). While in recent years the number of rail passengers has increased, this growth was contained by delays to several railway investment projects. All these factors reduce the availability and quality of public transport services and may restrict access to jobs and public services for those who cannot use individual transport (World Bank, 2019c).
Disparities in access to public services, in particular healthcare, are becoming a pressing concern. The number of medical staff and availability of health services and infrastructure differs between regions, influencing access to health care. For instance, in 2018, the number of doctors per 10,000 inhabitants ranged from 15 in the Wielkopolskie region to 27 in the Zachodnio-pomorskie and the Mazowieckie regions. Mental health services are insufficient and are mainly available in the big cities; for example out of five clinics in the Zachodniopomorskie region, three are located in the city of Szczecin. Similar challenges are visible in other health-related domains, including geriatrics. Although the number of specialists has increased somewhat in recent years and geriatric centres have been created in all regions, their number varies from 2 in the Świętokrzyskie region to 17 in the Śląskie region and is not sufficient to cover the needs of the ageing society.
Developing the administrative capacity of local governments is key for efficiently and effectively delivering public investment. Local governments manage around half of the total public investment expenditure in Poland. The ultimate outcomes of public investment correlate strongly with the quality of governance. This holds particularly at local government level (OECD, 2013). Considering the current labour market situation and an expected decrease in EU cohesion funds for Poland over the next years, developing and preserving the relevant administrative capacity of local governments is vital for the effective and efficient implementation of public investment projects.
The coal sector plays an important socio-economic role in some Polish regions. Poland is the second largest producer of coal (hard coal and lignite combined) in the EU. Six out of forty-one coal-mining regions in the EU are located in Poland and over 112,000 people remain employed in coal mining and the coal-based energy sectors (Dias et al., 2018). These regions face region-specific challenges resulting from a transition from coal-based economy (see section 3.5 and Box 3.5.1).
|
Box 3.4.1: Investment challenges and reforms in Poland
Macroeconomic perspective
Following the 2018 recovery, investment continued to rise in 2019. While public investment growth slowed in comparison to 2018, the growth in private investment strengthened in 2019. Still, investment in Poland relative to GDP is significantly lower that observed in regional peer countries. EU funds are a major factor supporting investment in Poland. Thus, the outlook for investment performance is affected by uncertainty over the outcome of the ongoing negotiations of the new EU budget period and the forecast economic slow-down.
Assessment of barriers to investment and ongoing reforms
While the business environment in Poland is in general favourable, several factors hold back investment and productivity growth. Burdensome compliance with certain legal and administrative requirements and uncertainty regarding the frequently changing regulatory environment hamper private investment. Insufficient administrative capacity can have negative impact on public investment spending. In terms of human capital, investment barriers include labour shortages, in particularly of skilled labour, and still-low labour force participation.
The major barriers to investment that impact Poland’s investment climate include:
1. An unstable regulatory environment. Frequent changes to key laws including those related to taxation, social security contributions, energy policies and other economic areas increase the cost of compliance and add uncertainty for businesses (Section 3.1). The use of fast-track legislative process and insufficient consultations concerning draft laws have an impact on the quality of certain regulations (Section 3.4.2).
2. Labour supply shortages. The unavailability of adequately skilled labour affects several sectors. While in the longer term it may provide a stimulus to increase capital intensity, in the short term it is more likely to act as a barrier to investments enhancing production capacity. Demographic trends and uncertainty around future labour migration policy aggravate the outlook (Section 3.3).
|
3.5. Environmental sustainability
Climate and energy transition
Curbing greenhouse gas emissions through decarbonising power generation and reducing energy intensity are key challenges for Poland. Developing a coherent long-term vision for improving the environmental sustainability of Poland’s development model is of crucial importance given the difficult starting point (). Greenhouse gas emissions have increased slightly in recent years, especially in the transport sector. This puts Poland in the group of EU Member States with the highest emissions per capita (Graph 3.5.1). Energy supply and use are jointly responsible for the highest share of national greenhouse gas emissions. Around 90% of electricity is still generated in conventional power plants, mainly using domestic hard coal and lignite. Solid fossil fuels also play a large role in household energy consumption, especially in heating, while the energy efficiency of buildings remains poor. Due to a surge in passenger and freight road traffic in recent years, emissions from the transport sector have been growing continuously.
|
Graph 3.5.1:Greenhouse gas emissions per capita in ten EU countries with the highest emissions in 2017
|
|
|
|
Source: Eurostat
|
Growing emissions push up the magnitude of decarbonisation to be achieved in the future. The total emissions have been increasing gradually since 2014 contrary to the general downward trend in the EU. In recent years, emissions have grown substantially in the building and transport sectors, in contrast to declining emissions in the energy sector. The implementation of the low-carbon mobility measures has been progressing slowly, while a strategic approach to reducing emissions and improving efficiency of the manufacturing industry in line with the circular economy model is missing in the National Energy and Climate Plan.
Improving Poland’s environmental sustainability will require a broad political consensus around a coherent set of decisive policy measures. Given the growing understanding of environmental externalities and the urgency of resolute action to slow down climate change, the price of greenhouse gas emissions and environmental pollutions are expected to continue rising. This will challenge the future competitiveness of the Polish economy. The necessary low-carbon transition will require substantial public and private investment in various sectors to improve their environmental sustainability, but this may present a chance to boost growth, competitiveness and innovation.
Tackling the social implications of the low-carbon transition by targeted policy measures is key. In recent years, poverty and inequality levels have gone down in Poland, including energy poverty. Efforts to decarbonise the Polish energy sector may temporarily raise electricity and heating costs and thus increasing the risk of inequality and poverty, unless complemented by effective and targeted policy responses. In addition, the gradual disappearance of certain jobs (e.g. in coal mining) and the creation of jobs in other sectors, as well as the divergence in capacity across the population to withstand severe weather events (e.g. droughts, heatwaves or water shortages), all call for a rethinking of social assistance, education and training and other climate change adaptation policies (see Section 3.3). The lessons learnt from the social implications and policy measures adopted to respond to the major downsizing of the hard coalmining industry in the 1990s (entailing the disappearance of some 60% of jobs) can be valuable in this context (Witajewski-Baltvilks et al. 2018; see Graph 3.5.2). This also highlights the importance of re-prioritising public expenditure (see Section 3.1).
|
Graph 3.5.2:Indigenous production of hard coal
|
|
|
|
Source: Eurostat
|
Support from local, national and EU budgets is key for the low-carbon transition to be successful and socially just. Based on the experience of EU Cohesion Policy Funds, Smart Specialisation Strategies and the EU Coal Regions in Transition Initiative, formulating comprehensive territorial transformation strategies by the affected territories is needed to foster a far-reaching change. Close partnership of central authorities with regional and local actors is essential, including also citizens’ associations, NGOs, trade unions as well as representatives of business and science to ensure that the public support addresses specific territorial challenges and local citizens’ needs (see Annex D and Box 3.5.1).
Reaching the Europe 2020 targets related to energy and climate will be very challenging. Substantial developments within a short timeframe would be required within the areas of greenhouse gas emissions reductions, renewable energy and energy efficiency given that Poland is below its indicative trajectory for the corresponding targets under the EU’s 2020 energy and climate framework. Emissions from the sectors outside of the EU Emissions Trading System have already increased by 21% from 2005 levels, overshooting Poland’s commitment to limit the increase of these emissions to 14% by 2020. This growth in emissions offsets any emissions reductions achieved in the sectors in the EU Emissions Trading System.
Energy sector
A clear energy decarbonisation strategy to foster investment and the energy transition in Poland is lacking. The economic viability of recently built and still envisaged coal-based power plants is jeopardised by the rapidly falling cost of generating electricity from renewable resources together with the growing cost associated with maintaining a fossil fuel-based power sector. Most of the new electricity power plants built in 2019-2020 is based on coal (). The sunk costs of these undertakings, mostly carried out by state-owned enterprises, add up to the costs of achieving a low-carbon energy generation. In addition, a number of measures introduced and subsequently modified in the course of 2018 to control electricity prices have dented market signals. This adds to the uncertainty about the long-term vision for the electricity generation sector, particularly in the light of rising demand for electricity.
Past regulatory changes have negatively affected the development of wind projects, but the situation has recently improved. The share of renewables in gross final energy consumption stood at 11.3% in 2018 and is below the 2017-18 trajectory towards the 2020 target of 15%. In its National Energy and Climate Plan, Poland has proposed a level of 21-23% for the corresponding 2030 target, below the level of 25% recommended by the Commission. (). The recent regulatory changes related to on-shore wind farms can give a new impetus to this segment, especially following the successful auctions for supply of renewable energy in 2018 and 2019. The new support schemes for consumers who produce renewable energy also improves the outlook for renewables, including solar energy, hardly existing until recently. Still, the time needed to construct wind farms makes achieving the 2020 renewable target difficult. Also, strict rules on minimal distance between wind farms and buildings will continue to limit the development of new onshore wind capacities.
The modernisation of the energy sector in the next decade warrants substantial investment needs. In the 2040 outlook, the National Energy and Climate Plan estimates the investment needs in the domestic fuel and energy sector at around €246 billion from 2016 to 2040. Energy-related investment needs in non-energy sectors (industry, households, services, transport and agriculture) are estimated at €206 billion from 2016 to 2040. Projected capital expenditure on generation and network projects varies depending on future demand scenarios. Part of the funding can come from the auctioning of emissions allowances in the EU’s emission trading system as well as from the Modernisation Fund dedicated to supporting modernisation of the energy sector in lower-income Member States. On the back of the higher carbon price, auction revenues distributed to Member States doubled in 2018 to around €1.2 billion. However, in recent years, only slightly more than 50% of this amount was used for climate- and energy-related purposes.
Well-functioning electricity and gas markets can lower the costs and burdens of the transition towards cleaner energy. Key ingredients are a stable and sound regulatory framework as well as sufficiently developed infrastructure, including interconnectors with other EU Member States. Some progress has been made recently, and Poland has been importing increasing amounts of electricity from neighbouring countries, where prices are on average lower due to a less carbon-intensive electricity mix. Still, there remain certain obstacles to more extensive utilisation of electricity interconnectors with Germany, Lithuania and Sweden. The regulatory intervention to stabilise electricity prices during 2019 had an impact on energy market fundamentals such as profitability, revenues and growth potential of suppliers. Such a distortion of price signals may limit the effectiveness of energy efficiency policies and market competition and discourage investments. Indeed, on the wholesale electricity market, the market share of the three largest entities continued to rise in 2018. Certain regulatory measures, e.g. related to gas storage obligation for importers, have strengthened the dominant position of the state-owned company in the gas market, crowding out competitors and decreasing the transparency of gas prices.
Other sectors
The reliance on solid fossil fuels for domestic heating weighs on air quality, translating into health problems and costs. The energy consumption increasing since 2014, and the highest share of solid fossil fuels in residential energy consumption in the EU (Graph 3.5.3) not only make reaching the 2020 energy efficiency targets challenging (Annex A), but also further exacerbate the problem. In 2016, approximately 45 thousand premature deaths were attributable to air pollution exposure, among highest values in the EU (EEAa, 2019). Emissions of air pollutants can be curbed by switching to cleaner energy sources. Several local governments have already taken action to ban the use of most polluting fuels for heating, the measure with the largest potential to improve the situation in the short term (Ministry of Environment, 2019). In the longer term, thermal modernisation of buildings as well as investments in district heating play a key role. Public support schemes for this face the challenge of ensuring that substantial investments done by households in single- or multifamily buildings and by heat distribution sector do not put them at a disadvantage in the future, when the heating of buildings will have to be fully decarbonised. The volume of investments required, including the public support, and associated social implications call for a careful policy design in this area. Launched in 2018, a 10-year Clean Air Programme is still strongly underused.
The low-carbon transition is also a challenge for sectors such as transport or energy-intensive industries. The transport sector remains a growing source of concern as sectoral emissions and energy consumption have increased in recent years. The transport sector is also the second largest contributor to the air pollution problem in Poland. The transport policy thus faces the challenge of ensuring improvements in connectivity, in particular green public transport options, while lowering greenhouse gas emissions and the associated pollution (see Section 3.4.3). At the same time, the uncertainty regarding the technologies and regulations on low-emissions vehicles already seems to have had an impact on the demand for new cars in Europe and on the automotive industry, an important sector in Poland. The industrial emissions of greenhouse gases have been broadly stable over the last decade despite fast growth in industrial output, which was driven mainly by an intensified exploitation of the installed capacities (Błocka and Śniegocki, 2019). The continued growth of the industry will thus increasingly depend on the ability to deploy innovative and clean technologies, spanning production efficiency, product design and material recovery (Bukowski, 2019).
|
Graph 3.5.3:Share of solid fossil fuels in final residential energy consumption (%)
|
|
|
|
Source: Eurostat
|
Recent legislative changes aim at increasing recycling of waste and strengthening enforcement of waste management rules. The market of residual waste has been opened up to competition by abandoning the strict rules on installations for treating and disposing of municipal waste. Moreover, starting in 2021, mixed waste from the municipalities that have not set up separate collection schemes will not be accepted for incineration. The law has also introduced powerful incentives for households to separate recyclable waste as the cost of mixed waste disposal is to be two to four times higher than that for separated waste. Lastly, environmental inspectorates will be able to carry out ad-hoc inspections without prior notice and impose financial penalties.
Poland’s freshwater resources are limited, and they are intensely used. Water use intensity in Poland is roughly twice the OECD average, while at around 1,600 m3 the aggregated average fresh water availability is low compared to the EU as a whole (). Industry is a major user of freshwater, and electricity production alone accounts for over half of freshwater use. As of 2017, energy production and agriculture is no longer exempted from water use fees. Inadequate treatment of municipal and industrial wastewater and agricultural production are the major sources of water pollution. In addition, river ecosystems are under increasing pressure from the development of infrastructure serving navigation and energy production. The continuation of major infrastructure plans related to the construction of cascades of dams serving navigation purposes on the Oder and Vistula rivers risk compromising the natural capacities of aquatic ecosystems and further degradation of water resources.
River basis management of has not yet incorporated the projected impacts of climate change. The entire territory of Poland is subject to flood risks related to climate change and anthropogenic influence. These risks are expected to increase in the future due to climate change. In particular, flash flooding events are likely to increase (EEA, 2019b). Innovative approaches to managing flood risks related to spatial planning, use of economic instruments and systematic consideration of nature-based solutions would contribute to reducing investment needs in conventional infrastructure.
|
Box 3.5.1: Coal Regions in Transition
Polish coal regions face various transformation challenges. While the transition from coal to other sectors has progressed substantially over the last years (see graph 3.5.2), it will keep directly affecting coal regions communities in the coming years. This applies particularly, but not only, to Silesia, Wielkopolskie (the Konin sub-region), Lower Silesia (the Bogatynia/Turoszów mines and Walbrzych former mine area) and the Bełchatów area. Transition challenges faced by these regions depend on the specific local circumstances and on the stage of the transformation from a coal-based economy. These challenges mainly relate to the creation of new jobs, reskilling and upskilling and new business opportunities, as well as to the rehabilitation of former mining sites and land restauration. Further support to affected territories from national and EU budgets based on integrated national and local strategies will be required for the smooth transition to a climate neutral economy. Therefore, measures aimed at building the administrative capacity of local governments are decisive for the successful delivery of related public policies and investments.
Konin, a sub region starting the transition, has to deal with strong dependence on the coal sector and related environmental challenges. Although the proportion of workers directly employed in coal mining is low (some 2,000 jobs), the coal-related activities are crucial for the local community. Lignite extraction and coal power generation account for almost 6,000 direct jobs. This represents 8.5% of all employees in the sub-region, which is already facing a high unemployment rate (11.4% in Konin powiat versus 3.7% in the Wielkopolskie Region). Power generation and coal extraction are one of the biggest tax sources for local communes. However, open-pit lignite mines cause environmental problems, such as prolonged drought and lowering of the groundwater level. Moreover, lignite electricity generation is the source of energy with the greatest climate impact (Szpor and Kiewra, 2018). Lignite resources in this area are expected to be fully used up in the next decade. This may add to an economic slowdown of the region. Some projects are being prepared by local stakeholders and supported by the Coal Regions in Transition Initiative, aiming at offering alternative job opportunities in renewable energy production and hydrogen technologies. Successful energy transition of the region also depends on attracting new investors.
The Silesia region, currently in transition, is challenged by the impact of coal mine closures on jobs, depopulation and post-industrial area degradation. Silesia is the biggest mining region in the EU, with the highest coal production and the greatest coal sector employment (around 78,000 direct jobs). Since the early 90s, the region has been going through restructuring. Of 70 mines in the early 1990s, only 18 remain and the share of the sector’s gross value added in the region dropped from nearly 25% in 2000 to 13% in 2016. The region, however, remains strongly dependent on coal. Mining remunerations are on average significantly higher than for comparable positions in other industries (Szpor and Kiewra, 2018) and has the highest rates of employment in coal-based power generation in the EU (over 1,500 jobs). Around 18% of the territory in Silesia is degraded due to the coal sector’s activities. In the context of the transition, 4.6% of its inhabitants left Silesia between 2000 and 2017. These challenges are being addressed and wide range of projects to support business, revitalisation and air quality improvement has been designed. Examples of projects aiming to create start-ups and the internationalisation of SMEs are the “Ksennon-business accelerator” and “Inter Silesia”, set up with the help of the Coal Regions in Transition Initiative.
The Wałbrzych sub-region, impacted by an unfinished transition, suffers from low levels of economic development, social issues and degradation of infrastructure. The coal-mining sector dominated in the Wałbrzych sub-region until the end of coal extraction in 1998. Since then, the unemployment, poverty and depopulation (number of inhabitants declining by 4% since 2005 overall and by 10% in the city of Walbrzych) have been above the averages for the Lower Silesia region (Wrocław University of Economics, 2018). The GDP per capita in the sub-region reaches only 50% of the EU-28 average, while the average for Lower Silesia was 77% in 2017 (Eurostat). The level of investment is low and the region seems rather unattractive to foreign investors. The transport infrastructure is underdeveloped. Another significant problem is land reclamation and revitalization of degraded areas. The Wałbrzych sub-region also faces degradation of existing infrastructure due to geological problems stemming from dense underground mining structures. This sub-region has started preparation of projects within the Coal Regions in Transition Initiative, such as the construction of a water production plant for the Wałbrzych agglomeration, using post-mining water intake and the construction of a plant for the use of geothermal heat from these waters.
|
Annex A: Overview Table
|
Commitments
|
Summary assessment ()
|
|
2019 country-specific recommendations (CSRs)
|
|
CSR 1: Ensure that the nominal growth rate of net primary government expenditure does not exceed 4.4% in 2020, corresponding to an annual structural adjustment of 0.6% of GDP. Take further steps to improve the efficiency of public spending, including by improving the budgetary system.
|
Poland has made limited progress in addressing CSR1 (this overall assessment of CSR 1 does not include an assessment of compliance with the Stability and Growth Pact):
|
|
Ensure that the nominal growth rate of net primary government expenditure does not exceed 4.4% in 2020, corresponding to an annual structural adjustment of 0.6% of GDP.
|
The compliance assessment with the Stability and Growth Pact will be included in spring when final data for 2019 will be available.
|
|
Take further steps to improve the efficiency of public spending, including by improving the budgetary system.
|
Limited progress has been made in improving the efficiency of public spending: works to reform the budget system initiated in 2016 were continued in 2019. The main effort focuses currently on multiannual budget planning, modernisation of the Standard Chart of Accounts and efficiency of spending (spending reviews). The overall reform will be time-consuming and its final implementation date has not yet been communicated.
|
|
CSR 2: Ensure the adequacy of future pension benefits and the sustainability of the pension system by taking measures to increase the effective retirement age and by reforming the preferential pension schemes. Take steps to increase labour market participation, including by improving access to childcare and long-term care, and remove remaining obstacles to more permanent types of employment. Foster quality education and skills relevant to the labour market, especially through adult learning.
|
Poland has made Limited Progress in addressing CSR 2
|
|
Ensure the adequacy of future pension benefits and the sustainability of the pension system by taking measures to increase the effective retirement age and by reforming the preferential pension schemes.
|
No Progress. Preferential pension schemes were not reformed. Poland did not take any new targeted action aiming at the increase of the effective retirement age.
|
|
Take steps to increase labour market participation, including by improving access to childcare and long-term care, and remove remaining obstacles to more permanent types of employment.
|
Limited Progress. Labour market participation increased, although for certain groups it is still below EU average. Access to childcare increased but still constitutes a major challenge for the age group 0-3. Access to long-term care still remains very limited, as this is mainly provided within families. Poland did not undertake major actions removing the remaining obstacles to more permanent types of employment.
|
|
Foster quality education and skills relevant to the labour market, especially through adult learning.
|
Limited Progress. Overall, Poland has made limited progress regarding the quality of education. The latest school system reorganisation has led to worse working and learning conditions in many schools, which were aggravated due to the double cohort of students who entered secondary schools in 2019. Although the 2018 PISA results showed Polish 15 year-olds performing very well in basic skills, the latest reorganisation of school education has changed the previous system, including the phase-out of lower secondary schools (gymnasia). Shorter common general education period and earlier channelling of pupils is likely to increase the risk of educational inequalities, in particular between urban and rural areas. Since school resources remain limited, all this is very likely to affect the quality of educational outcomes and students' performance in basic skills. The new law of 25/07/2019 on teacher education aims to improve the quality of initial teacher education. No measures have been taken to improve the quality and relevance of continued professional development opportunities. Despite increases by almost 15% in 2019, teachers' salaries are low in comparison with those of other tertiary educated workers in Poland, which makes teaching careers less attractive, contributing to shortages and negative selection. The level of enthusiasm of teaching staff is among the lowest in the EU, as reflected in the 2018 PISA results. The 2018 reform of higher education progresses steadily. The reform has changed the funding mode, management and evaluation of higher education institutions. New quality assurance institutions focusing on scientific outputs have been created. It is uncertain whether the reform will contribute to improving the quality of teaching, the pedagogical preparation and the continued professional development of lecturers.
|
|
CSR 3: Strengthen the innovative capacity of the economy, including by supporting research institutions and their closer collaboration with business. Focus investment-related economic policy on innovation [Focus investment-related economic policy on] transport, notably on its sustainability [Focus investment-related economic policy on] digital [infrastructure] [Focus investment-related economic policy on] energy infrastructure [Focus investment-related economic policy on] healthcare [Focus investment-related economic policy on] cleaner energy, taking into account regional disparities Improve the regulatory environment, in particular by strengthening the role of consultations of social partners and public consultations in the legislative process.
|
Poland has made Limited Progress in addressing CSR 3
|
|
Strengthen the innovative capacity of the economy, including by supporting research institutions and their closer collaboration with business.
|
Some Progress. Poland has taken measures to support its research institutions through the implementation of the Act on Higher Education, encompassing, among others, the selection of research-intensive universities and their increased funding, the reform of the evaluation criteria for research organisations in a way that encourages international cooperation, a new system for doctoral schools and a re-configuration of the university council which, through the inclusion of external stakeholders, places more emphasis on universities' socio-economic impact. Polish research institutions can be further strengthened through the current reform of the Polish Academy of Science, the consolidation of the Łukasiewicz Research Network and the setting up of the Virtual Research Institute in the area of medical biotechnology - oncology. Science-business links can be enhanced through the research commercialisation potential of the Łukasiewicz Network, as well as through the ‘School for Innovators’ pilot-project run by the Centre for Citizenship Education with the aim of developing students' entrepreneurial skills and the continuation of the industrial doctorate programme. Poland is supporting the business sector in its transition to the industry 4.0 through the 'Industry for the Future' platform, which is organising a series of workshops for entrepreneurs.
|
|
Focus investment-related economic policy on innovation
|
Limited Progress. The National Strategy of Regional Development 2030 adopted in September 2019 includes investment activities in the field of innovation. This is a significant, albeit insufficient measure as it mostly focuses on strengthening cohesion and reducing inter-regional disparities, including in innovation. Innovation diffusion and reducing regional disparities are important policy goals, but supporting the advanced regions is also equally important, given that they have the greatest potential for creating breakthrough innovations. The regional approach outlined in the National Strategy of Regional Development 2030 needs to be balanced by a national investment strategy in innovation. The diversification and increased attractiveness of R&D tax incentives can strengthen the innovative potential of the Polish economy.
|
|
[Focus investment-related economic policy on] transport, notably on its sustainability
|
Limited Progress. The information provided so far is lacking in sufficient level of detail. Some key documents have been referred to. However, there is no description of the ongoing or planned activities. In particular, it has not been explained how the investments undertaken and the accompanying regulatory, operational, financial or fiscal actions will increase the role and share of sustainable modes of transport. This concerns in particular:
- shifting freight traffic from road to rail;
- boosting the competitiveness of railways against road transport in passenger traffic;
- reconstruction of the public transport services in rural areas;
- transfer of passenger traffic in urban areas from individual to public transport and sustainable forms of mobility.
|
|
[Focus investment-related economic policy on] digital [infrastructure]
|
Some Progress. In 2019, Poland adopted a set of measures to support demand and supply for fast and ultrafast networks, mainly by amending broadband legislation (Ustawa o wspieraniu rozwoju usług i sieci telekomunikacyjnych – the Telecommunications Networks and Services Development Support Act) which includes, among others, setting up a new broadband fund. These measures address the country-specific recommendation for 2019. However, a fair amount of work on their practical implementation in order to fully address the country-specific recommendation is not scheduled until 2020 and 2021.
|
|
[Focus investment-related economic policy on] energy infrastructure
|
Some progress. Crucial transboundary gas and electricity infrastructure investments are progressing well with small delays registered in the development of the gas interconnectors with Lithuania and Slovakia. The internal electricity network requires significant investments for it to be sufficiently developed.
|
|
[Focus investment-related economic policy on] healthcare
|
Limited Progress. The National Strategy of Regional Development 2030 was adopted in September 2019. It includes investment activities related to the health care system. The Partnership Agreement and the Operational Programmes for 2021-2027 Programming Period are being drafted.
|
|
[Focus investment-related economic policy on] cleaner energy, taking into account regional disparities
|
Limited progress. Regarding electricity generation, the recent regulatory changes and support schemes have given a new impetus to on-shore wind investments and stronger role of prosumers in the years to come. However, most of the new and planned investments in electricity generation in 2019-2020 are based on coal and gas sources. Consequently, achieving the 2020 renewable target is likely to be difficult. Following the upward trend in energy consumption since 2014, Poland was not on track in 2018 to reach the 2020 energy efficiency targets. There is a limited progress in decarbonisation of heating sources in buildings and improvements of buildings energy efficiency to enable their cleaner operation, especially during winter. Additional efforts in this respect will have positive impact on the air quality, as well.
|
|
Improve the regulatory environment, in particular by strengthening the role of consultations of social partners and public consultations in the legislative process.
|
No Progress. The lack of public consultation on the alternative legislative tracks (e.g. draft law proposals submitted by the Members of Parliament) has not been addressed. These alternative legislative paths allow de facto omission of public consultations, affect the overall quality of laws and remain a source of substantial uncertainty for citizens and businesses.
|
|
Europe 2020 (national targets and progress)
|
|
Employment rate target set in the NRP: 71%
|
In 2018, the employment rate in Poland reached 72.2%, thereby achieving the national target.
|
|
R&D target set in the NRP: 1.7% of GDP for 2020
|
Poland has not reached its R&D target. In 2018, R&D was 1.21 % of GDP, a 24.6% increase in relation to the previous year (1.03 % of GDP). The intensity of business expenditure on R&D (0.8% of GDP) grew by 19.6% annually in the period 2010-2018 and is double the intensity of the public expenditure on R&D (0.4%). In spite of this growth, BERD in Poland continues to be below the EU average (1.4% of GDP).
|
|
National greenhouse gas (GHG) emissions target:
+14% in 2020 compared with 2005 (in sectors not included in the EU Emissions Trading System)
|
According to estimates, greenhouse gas emissions in sectors not covered by the EU Emissions Trading System increased by 21 % between 2005 and 2018 overshooting the ceiling of +12%.
In 2020, the emissions’ increase is projected to level at +14% from 2005 levels; however, this implies an intensified effort to reduce emissions in the next two years to meet this target.
|
|
2020 renewable energy target: 15%
|
Poland is at risk of missing its 2020 target. With 11.16% (provisional Eurostat 2018 data), it is below the indicative trajectory (12.3%) leading to the 15% target.
|
|
Energy efficiency, 2020 energy consumption targets:
Poland's 2020 energy efficiency target is set at 96.4 Mtoe of primary energy consumption (corresponding to 71.6 Mtoe of final energy consumption)
|
In 2018 primary energy consumption reached 100.9 Mtoe and final energy consumption 71.8 Mtoe, i.e. both exceeded the 2020 target levels. This is a consequence of an upward trend in energy consumption since 2014. If the trend continues, Poland risks not meeting its energy efficiency target.
|
|
Early school/training leaving target: 4.5%.
|
The rate at each students leave school/training early reached 4.8% (a decrease of 0.2 pp compared to 2017), well below the EU average.
|
|
Tertiary education target: 45% of population aged 30-34.
|
Poland is among the EU countries with a high level of tertiary educational attainment. The share of the population aged 30-34 who have successfully completed tertiary studies have been increasing for the past few years. The rate was 45.7 % in 2018 (the same as in 2017); therefore the national target was met.
|
|
Target for reducing the number of people at risk of poverty or social exclusion, expressed as an absolute number of people: 1,500,000.
|
Poland has achieved the target since 2012. By 2018 the number of people at risk of poverty or social exclusion declined by 4.5 million.
|
Annex B: Commission debt sustainability analysis and fiscal risks
Annex C: Standard Tables
|
|
|
Table C.1:Financial market indicators
|
|
|
|
Source: European Commission (long-term interest rates); World Bank (gross external debt); Eurostat (private debt); ECB (all other indicators).
|
|
|
|
|
|
Table C.2:Headline Social Scoreboard indicators
|
|
|
|
Source: Eurostat
|
|
|
|
|
|
Table C.3:Labour market and education indicators
|
|
|
|
Source: Eurostat, OECD
|
|
|
|
|
|
Table C.4:Social inclusion and health indicators
|
|
|
|
Source: Eurostat, OECD
|
|
|
|
|
|
Table C.5:Product market performance and policy indicators
|
|
|
|
Source: European Commission; World Bank — Doing Business (for enforcing contracts and time to start a business); OECD (for the product market regulation indicators); SAFE (for outcome of SMEs' applications for bank loans).
|
|
|
|
|
|
Table C.6:Green growth
|
|
|
|
Source: European Commission and European Environment Agency (Share of GHG emissions covered by ETS); European Commission (Environmental taxes over labour taxes and GDP); Eurostat (all other indicators).
|
|
|
Annex D: Investment guidance on Just Transition Fund 2021-2027 for Poland
Building on the Commission proposal, this Annex () presents the preliminary Commission services’ views on priority investment areas and framework conditions for effective delivery for the 2021-2027 Just Transition Fund investments in Poland. These priority investment areas stem from the broader analysis of territories facing serious socio-economic challenges deriving from the transition process towards a climate-neutral economy of the Union by 2050 in Poland, assessed in the report. This Annex provides the basis for a dialogue between Poland and the Commission services as well as the relevant guidance for the Member States in preparing their territorial just transition plans (), which will form the basis for programming the Just Transition Fund. The Just Transition Fund investments complement those under Cohesion Policy funding for which guidance in the form of Annex D was given in the 2019 Country Report for Poland ().
The transition process will likely impact all coal mining regions in Poland, namely Silesia, Wielkopolska, Lower Silesia, Łódzkie, Lubelskie and Malopolska. For Silesia ,Wielkopolska and Wałbrzych, there are on-going transition planning efforts, triggered under the Coal Regions in Transition Initiative. Priority investment areas are identified in those regions in the present Annex. Against this background; smart specialization strategies provide an important framework to set priorities for innovation in support of economic transformation.
|
Silesia, the biggest mining region, extracts coal in 18 mines, located in the following NUTS level 3 regions: Katowice; Bielsko – Biała, Tychy, Rybnik, Gliwice, Bytom, Sosnowiec. Despite moving away from coal production since the 1990s, there is a strong dependence on the coal mining sector in the local economy, with almost half of the number of coal miners in the EU represented by 78,000 direct jobs. The significant number of coal mining entities is strongly visible in the high GVA share of the coal industry. Moving away from coal extraction would require additional efforts on towards economic diversification, reskilling and upskilling, counteracting depopulation and on revitalization. Based on this preliminary assessment, it appears warranted that the Just Transition Fund concentrates its intervention on these territories.
In order to tackle these transition challenges, priority investment needs have been identified for diversifying and making the regional economy more modern and competitive. Key actions of the Just Transition Fund could target in particular:
·productive investments in SMEs, including start-ups, leading to economic diversification and reconversion;
·investments in the creation of new firms, including through business incubators and consulting services;
·investments in research and innovation activities and fostering the transfer of advanced technologies;
·investments in regeneration and decontamination of sites, land restoration and repurposing projects;
·investments in the deployment of technology and infrastructures for affordable clean energy, in greenhouse gas emission reduction, energy efficiency and renewable energy;
·investments in enhancing the circular economy, including through waste prevention, reduction, resource efficiency, reuse, repair and recycling;
·upskilling and reskilling of workers;
·technical assistance.
The territories of Katowice, Bielsko – Biała, Tychy, Rybnik, Gliwice, Bytom, Sosnowiec could experience job losses, which realistically might not be entirely offset by the creation and development of SMEs. Exceptionally, and where necessary for the implementation of the territorial just transition plan, support to productive investments in large enterprises could therefore be considered.
|
|
In the region of Wielkopolska (Konin ‘NUTS 3 level region’), 6,000 people are employed in lignite extraction and power generation activities. Moving away from lignite extraction could require measures aimed to create new jobs in areas other than mining and lignite-based power generation. Furthermore, open-pit lignite mines create environmental challenges, such as lowering of groundwater and droughts. Based on this preliminary assessment, it appears warranted that the Just Transition Fund also intervenes in this territory.
In order to tackle these transition challenges, investment needs have also been identified for alleviating the socio-economic costs of the transition. Key actions of the Just Transition Fund could target in particular:
·productive investments in SMEs, including start-ups, leading to economic diversification and reconversion;
·investments in the creation of new firms, including through business incubators and consulting services;
·investment in research and innovation activities and fostering the transfer of advanced technologies;
·investment in land restoration and repurposing projects;
·upskilling and reskilling of workers;
·job-search assistance to jobseekers;
·technical assistance.
The territory of Konin is expected to suffer from substantial job losses, which might not be entirely offset by the creation and development of SMEs. Exceptionally, and where necessary for the implementation of the territorial just transition plan, support to productive investments in large enterprises could therefore be considered.
|
|
In Lower Silesia, NUTS level 3 region Wałbrzych relied heavily in the past on the coal extraction industry, but due to an unfinished economic transition, suffers from low levels of economic development, the highest unemployment rate in Lower Silesia, social issues and degradation of infrastructure. Poverty and depopulation, low GDP/capita, geological and water problems related to underground mining structures, prevent the efficient development of the area.
In order to tackle these transition challenges, priority investment needs for alleviating the socio-economic costs of the transition have therefore been identified, through actions targeting in particular:
·investments in regeneration and decontamination of sites, land restoration and repurposing projects;
·investments in the deployment of technology and infrastructures for affordable clean energy, in greenhouse gas reduction emission, energy efficiency and renewable energy;
·investments in the creation of new firms, including through business incubators and consulting services;
·investments in enhancing the circular economy, including through waste prevention, reduction, resource efficiency, reuse, repair and recycling;
·upskilling and reskilling of workers;
·job-search assistance to jobseekers;
·active inclusion of jobseekers;
·technical assistance.
|
Annex E: Progress towards the Sustainable Development Goals
Assessment of Poland’s short-term progress towards the SDGs ()
Table E.1 shows the data for Poland and the EU-28 for the indicators included in the EU SDG indicator set used by Eurostat for
monitoring progress towards the SDGs in an EU context
(). As the short-term trend at EU-level is assessed over a 5-year period, both the value at the beginning of the period and the latest available value is presented. The indicators are regularly updated on the
SDI dedicated section
of the Eurostat website.
|
|
|
Table E.1:Indicators measuring Poland’s progress towards the SDGs
|
|
|
|
|
|
(Continued on the next page)
|
|
Table (continued)
|
|
|
|
|
|
|
|
(Continued on the next page)
|
|
Table (continued)
|
|
|
|
|
|
|
|
(Continued on the next page)
|
|
Table (continued)
|
|
|
|
|
|
|
|
(Continued on the next page)
|
|
Table (continued)
|
|
|
|
|
|
Source: Eurostat
|
|
|
References
Bauer, P. et al. (2020), Productivity in Europe: Trends and Drivers in a Service-Based Economy, Joint Research Centre Technical Report, Brussels, Belgium, forthcoming.
Błocka, M. and A. Śniegocki (2019), U progu zmian: Polska polityka przemysłowa wobec niskoemisyjnej transformacji, Wise Europa (
http://wise-europa.eu/wp-content/uploads/2019/05/U-progu-zmian.-Polska-polityka-przemyslowa-wobec-nieskoemisyjnej-transpormacji-WiseEuropa.pdf
).
Bocheński, T. (2018), Rozmieszczenie i charakterystyka terminali kontenerowych w Polsce oraz propozycje lokalizacji nowych obiektów, Problemy Transportu i Logistyki 1(41), 17-27.
Bukowski, M. (2019), A new chapter: Shifting Poland towards net-zero economy, WiseEuropa – Warsaw Institute for Economic and European Studies, Warsaw.
CASE and IAS (2019), Study and Reports on the VAT Gap in the EU-28 Member States: 2018 Final Report, TAXUD/2015/CC/131, Center for Social and Economic Research and Institute for Advanced Studies, Warsaw.
CBOS (2018), Komunikat z badan. Wydatki rodziców na edukację dzieci w roku szkolnym 2018/2019, Centrum Badania Opinii Społecznej (
https://www.cbos.pl/SPISKOM.POL/2018/K_144_18.PDF
).
Chief Chamber of Nurses and Midwives, Liczba pielęgniarek i położnych wg przedziałów wiekowych na podstawie daty urodzenia stan na 2018-12-31 (
https://nipip.pl/liczba-pielegniarek-poloznych-
wg-przedzialow-wiekowych-podstawie-daty-urodzenia/
).
Dias, A. D. et al. (2018coal), EU coal regions: opportunities and challenges ahead, Publications Office of the European Union, Luxembourg.
ECB (2019), Strengthening the Rule of Law – a central bank perspective (https://ec.europa.eu/info/sites/info/files/stakeholder_contribution_on_rule_of_law_-_european_central_bank.pdf).
EEA (2019a), Air quality in Europe – 2019 report, European Environment Agency Report No. 10/2019, Pubblications Office of the European Union, Luxembourg.
EEA (2019b), Flood risk in Europe: the long-term outlook.
ERO (2019), National Report of the President of the Energy Regulatory Office 2019 (
https://www.ure.gov.pl/download/2/478/NationalReport2019.pdf
).
Euracoal (2019), Poland Country Profile (
https://euracoal.eu/info/country-profiles/poland/
).
European Commission (2017a), Country Report Poland 2017, SWD(2017) 86 final.
European Commission (2017b), Horizon 2020 Policy Support Facility Peer Review of Poland’s Higher Education and Science System, Publications Office of the European Union, Luxembourg.
European Commission (2018a), Country Report Poland 2018, SWD(2018) 219 final.
European Commission (2018b), The 2018 Ageing Report: Economic and Budgetary Projections for the EU Member States (2016-2070), European Economy Institutional Paper No. 79, Publications Office of the European Union, Luxembourg.
European Commission (2019a), Bibliometric indicators based on Science-Metrix data, Directorate General for Research and Innovation, unpublished.
European Commission (2019b), Country Report Poland 2019, SWD(2019) 1020 final.
European Commission (2019c), European Economic Forecast Autumn 2019, European Economy Institutional Paper 115, Publications Office of the European Union, Luxembourg.
European Commission (2019d), European Innovation Scoreboard 2019, Publications Office of the European Union, Luxembourg.
European Commission (2019e), Taxation Trends in the European Union, 2019 Edition, Publications Office of the European Union, Luxembourg.
European Commission (2019f), The Single Market Scoreboard 2019 (
https://ec.europa.eu/internal_market/scoreboard/index_en.htm
).
European Commission (2020a), Debt sustainability assessments, forthcoming.
European Commission (2020b), Digital Agenda Scoreboard 2020 (
https://digital-agenda-data.eu/datasets/digital_agenda_scoreboard_key_indicators/visualizations
).
European Commission (2020c), Joint Employment Report, forthcoming.
European Commission (2020d), The Single Market Scoreboard 2020, forthcoming.
Gadziński, J. and E. Goras (2019), Raport o stanie polskich miast: Transport i mobilność miejska, Obserwatorium Polityki Miejskiej (IRMiR), Warsaw.
Hardy, W., R. Keister, and P. Lewandowski (2018), Educational Upgrading, Structural Change and the Task Composition of Jobs in Europe, Economics of Transition, 26(2): 201-231.
Iammarino, S., A. Rodriguez-Pose, and M. Storper (2017), Why Regional Development matters for Europe’s Economic Future, Directorate-General for Regional and Urban Policy Working Papers, WP 07/2017.
Komornicki, T. (2019), Polska sprawiedliwa komunikacyjnie, Fundacja im. Stefana Batorego, Warsaw.
Konfederacja Lewiatan (2019), Barometr Lewiatana, October 2019.
Kosmalska, J. (2019), Umiedzynarodowienie w jednej trzeciej, Forum Akademickie (https://forumakademickie.pl/news/umiedzynarodowienie-w-jednej-trzeciej).
Łobacz, K. (2018), Knowledge Transfer at Universities: Can Technology Transfer Offices, Business Incubators and Science and Technology Parks in Poland Provide Good Support Services?, European Journal of Service Management, 28/1, 4/2018:181-190.
Marczewski, P. (2019), Dziel, rządź, ignoruj. Polska szkoła po czterech latach braku polityki edukacyjnej PiS, Fundacja im. Stefana Batorego (
http://www.batory.org.pl/publikacje/artykuly_17/forumidei_obywatele
).
Ministry of Environment (2019), Uchwała nr 34 Rady Ministrów z dnia 29 kwietnia 2019 r. w sprawie przyjęcia Krajowego programu ograniczania zanieczyszczenia powietrza (
http://monitorpolski.gov.pl/mp/2019/572/1
).
Moskwik, K. and K. Krupa (2019), Kolej na regiony! Perspektywa rozwoju i wyzwania rynku – raport, Warsaw.
MRPiPS (2019), Program „Usługi opiekuńcze dla osób niepełnosprawnych” – edycja 2019, Ministerstwo Rodziny, Pracy i Polityki Społecznej, Warsaw.
Myck, M., M. Najsztub, and M. Oczkowska (2019), Implications of Social and Material Deprivation for Changes in Health of Older People, Journal of Ageing & Health 00(0): 1-15.
NBP (2019a), Raport o stabilności systemu finansowego, czerwiec 2019 r., Narodowy Bank Polski, Warsaw.
NBP (2019b), Szybki Monitoring NBP: Analiza sytuacji sektora przedsiębiorstw, No. 04/19 (październik 2019 r.), Narodowy Bank Polski, Warsaw.
NBP (2019c), Szybki Monitoring NBP: Analiza sytuacji sektora przedsiębiorstw, No. 10/19 (październik 2019 r.), Narodowy Bank Polski, Warsaw.
NIK (2018), Informacja o wynikach kontroli - Infrastruktura dostępowa do portów morskich, Warsaw.
NIK (2019a), Raport: System Ochrony Zdrowia w Polsce – Stan Obecny i Pożądane Kierunki Zmian, Najwyższa Izba Kontroli (https://www.nik.gov.pl/plik/id,20223,vp,22913.pdf)
NIK (2019b), Zapewnienie przez gminy opieki przedszkolnej, Najwyższa Izba Kontroli (
https://www.nik.gov.pl/plik/id,20496,vp,23123.pdf
).
NIK (2019c), Zmiany w systemie oświaty, Najwyższa Izba Kontroli (
https://www.nik.gov.pl/plik/id,20331,vp,22954.pdf
).
OECD (2013), Investing Together: Working Effectively Across Levels of Government, OECD Multi-level Governance Studies, OECD Publishing, Paris.
OECD (2019a), Education at a Glance 2019. OECD Indicators, OECD Publishing, Paris.
OECD (2019b), Ensuring an Adequate Long-Term Care Workforce.
OECD (2019c), Health at a Glance 2019: OECD Indicators, OECD Publishing, Paris.
OECD (2019d), PISA 2018 Results (Volume I): What Students Know and Can Do, OECD Publishing, Paris.
OECD (2019h), Taxing Wages 2019, OECD Publishing, Paris.
OECD (2019i), Strengthening the rule of law: making the case (https://ec.europa.eu/info/sites/info/files/stakeholder_contribution_on_rule_of_law_-_oecd.pdf).
OECD/European Observatory on Health Systems and Policies (2019), Poland: Country Health Profile 2019, State of Health in the EU, OECD Publishing, Paris/European Observatory on Health Systems and Policies, Brussels.
Paczyński, W. (2020), Pension system in Poland: a selective review, mimeo.
POBR (2020), Accident Data (Preliminary and Final Figures), Polskie Obserwatorium Bezpieczeństwa Ruchu Drogowego (http://www.obserwatoriumbrd.pl/en/road_safety_statistics/statistical_data/statistical_data).
PGNiG (2019), Directors’ Report on the operations of PGNiG S.A. and the PGNiG Group in 2018 (
http://en.pgnig.pl/documents/1910852/2301619/Directors+Report+on+the+operations+of+PGNiG+S.A.+and+the+PGNiG+Group+in+2018.pdf/355057fc-7395-4468-9f9d-36f7e7567a8b
).
Pieriegud, J. (2019), Analysis of the potential of the development of rail container transport market in Poland, Publications Office of the European Union, Luxembourg.
Rosa, G. (2018), Konkurencyjność kolejowych przewozów pasażerskich w świetle zachowań komunikacyjnych Polaków, Handel Wewnętrzny 4(375), 301-315 (tom I).
RPO (2019), RPO o ogromnej liczbie prac domowych: potrzebna interwencja resortu edukacji, 28.01.2019, Rzecznik Praw Obywatelskich,
https://www.rpo.gov.pl/pl/content/rpo-do-men-ws-ogromnej-liczby-prac-domowych
.
Statistics Poland (2010), Transport – activity results in 2009, Główny Urząd Statystyczny, Warsaw.
Statistics Poland (2018a), Education in 2017/18 school year, Warsaw, Gdańsk, (
https://stat.gov.pl/obszary-tematyczne/edukacja/edukacja/oswiata-i-wychowanie-w-roku-szkolnym-20172018,1,13.html
).
Statistics Poland (2018b), Local Data Bank (
https://bdl.stat.gov.pl/BDL/pomoc/stanzasilenia?active=1
).
Statistics Poland (2019a), Business tendency in manufacturing, construction, trade and services 2000-2019, Warsaw.
Statistics Poland (2019b), Pracujący w gospodarce narodowej w 2018 r., Informacje Statystyczne, Główny Urząd Statystyczny, Warsaw.
Statistics Poland (2019c), Transport – activity results in 2018, Główny Urząd Statystyczny, Warsaw, Szczecin.
Szpor, A., and D. Kiewra (2018), Transformacja węglowa w subregionie konińskim, IBS Research Report 06/2018.
UTK (2019), Zwiększenie roli kolei w równoważeniu transportu towarów w Polsce. Wyzwania, propozycje, dobre praktyki, Warsaw.
WEF (2019), The Global Competitiveness Report 2019, World Economic Forum (http://www3.weforum.org/docs/WEF_TheGlobalCompetitivenessReport2019.pdf).
Wiczewski, B. (2020), Budget system in Poland: challenges and steps to tackle them, mimeo.
Witajewski-Baltvilks et al. (2018), Managing coal sector transition under the ambitious emission reduction scenario in Poland: focus on labour, Institute for Structural Research (IBS) Report 04/2018, October 2018.
Wrocław University of Economics (2018), Strategia rozwoju społeczno-gospodarczego południowej i zachodniej części województwa dolnośląskiego na lata 2020–2030, obejmująca swoim zasięgiem subregiony wałbrzyski i jeleniogórski (NUTS 3) – Strategia Rozwoju Sudety 2030, Centrum Badawczo-Rozwojowe Samorządu Terytorialnego, Wrocław.
World Bank (2019a), Doing Business 2019: Training for Reform, World Bank Group, Washington, DC.
World Bank (2019b), Doing Business 2020: Economy Profile Poland (
https://www.doingbusiness.org/content/dam/doingBusiness/country/p/poland/POL.pdf
).
World Bank (2019c), Poland Catching-Up Regions Three: Rural Public Transport in Zachodniopomorskie, World Bank Group, Washington, DC.
Żylicz, M. (2019) Przewodniczący punktuje środowisko, Forum Akademickie (
https://prenumeruj.forumakademickie.pl/fa/2019/07-08/kronika-wydarzen/przewodniczacy-punktuje-srodowisko
).
-
(I)
()The European Regional Development Fund, Cohesion Fund, European Social Fund, Youth Employment Initiative (YEI), including national co-financing.
-
(II)
()https://cohesiondata.ec.europa.eu/countries/PL
-
(III)
()The performance review is regulated by Article 22 of the Regulation (EU) No 1303/2013, whereby 5-7% of overall resources allocated are released to performing priority axes of the operational programmes, the amount includes national co-financing.
-
(IV)
()The European Regional Development Fund, Cohesion Fund, European Social Fund, European Agricultural Fund for Rural Development and European Maritime and Fisheries Fund.
-
(V)
()Member States’ reporting on financial instruments based on Article 46 of Regulation No 1303/2013, cut-off date 31/12/2018.