ISSN 1977-091X
Official Journal
of the European Union
C 348

English edition
Information and Notices
Volume 61
28 September 2018
|
ISSN 1977-091X |
||
|
Official Journal of the European Union |
C 348 |
|
|
|
||
|
English edition |
Information and Notices |
Volume 61 |
|
Contents |
page |
|
|
|
IV Notices |
|
|
|
NOTICES FROM EUROPEAN UNION INSTITUTIONS, BODIES, OFFICES AND AGENCIES |
|
|
|
European Commission |
|
|
2018/C 348/01 |
||
|
2018/C 348/02 |
|
EN |
|
IV Notices
NOTICES FROM EUROPEAN UNION INSTITUTIONS, BODIES, OFFICES AND AGENCIES
European Commission
|
28.9.2018 |
EN |
Official Journal of the European Union |
C 348/1 |
COMMUNICATION FROM THE COMMISSION TO THE EUROPEAN PARLIAMENT, THE COUNCIL AND THE COURT OF AUDITORS
Consolidated annual accounts of the European Union 2017
(2018/C 348/01)
CONTENTS
| FOREWORD | 2 |
| EUROPEAN UNION POLITICAL FRAMEWORK, GOVERNANCE AND ACCOUNTABILITY | 4 |
| NOTE ACCOMPANYING THE CONSOLIDATED ACCOUNTS | 9 |
| HIGHLIGHTS OF THE FINANCIAL YEAR 2017 | 10 |
| CONSOLIDATED FINANCIAL STATEMENTS AND EXPLANATORY NOTES | 12 |
| BALANCE SHEET | 13 |
| STATEMENT OF FINANCIAL PERFORMANCE | 14 |
| CASHFLOW STATEMENT | 15 |
| STATEMENT OF CHANGES IN NET ASSETS | 16 |
| NOTES TO THE FINANCIAL STATEMENTS | 17 |
| FINANCIAL STATEMENT DISCUSSION AND ANALYSIS | 92 |
| BUDGETARY IMPLEMENTATION REPORTS AND EXPLANATORY NOTES | 109 |
| GLOSSARY | 166 |
| LIST OF ABBREVIATIONS | 170 |
FOREWORD
It is my pleasure to present the 2017 annual accounts of the European Union. They provide a complete overview of the EU finances and the implementation of the EU budget for the last year, including information on contingent liabilities, financial commitments and other obligations of the Union. Reflecting the multiannual nature of the Union's activities, they offer explanations of the key financial figures and their evolution. The consolidated annual accounts of the European Union are part of the Commission’s Integrated Financial Reporting Package and form an essential part of our highly developed system of financial accountability.
While 2016 was a year of doubt for the European project, not least with the decision of the United Kingdom to leave the Union, 2017 was a year of renewed hope and perspective.
The 60th anniversary of the Treaty of Rome provided the backdrop to a period of deep reflection on the future of Europe. We took the opportunity to reaffirm our commitment to the values of the Union and to define the priorities for the Union of 27.
In 2017, the European Union focused on making the economic recovery sustainable. Growth rates for the EU and the euro area beat expectations to reach a 10-year high of 2,4 %. Nevertheless, the EU had to tackle a series of challenges related to competitiveness, migration or security, and address some major natural disasters.
The EU budget is a unique asset for the Union that translates ambitions into tangible results on the ground. It complements national budgets by delivering European added value in areas where a coordinated response is the most efficient and effective way to deliver on our priorities.
2017 was the fourth year of the implementation of the current Multiannual Financial Framework; all the financial programmes are now fully operational. At the same time, with many unexpected challenges, the importance of a flexible approach to budget implementation was once more confirmed. The MFF mid-term revision has provided additional means to respond to unforeseen circumstances.
The 2017 adopted budget focused on two main policy priorities for Europe: supporting the ongoing recovery of the European economy and tackling the migration and refugee crisis. It ensured the implementation of the ongoing programmes on the one hand, and provided for financial support to address the new challenges on the other.
Nearly half of the funds — EUR 83,2 billion in commitments — stimulated growth, employment and competitiveness. This included funding for research and innovation under Horizon 2020, for education under Erasmus+, for small and medium sized enterprises under the COSME programme, and for infrastructure under the Connecting Europe Facility (CEF). Moreover, the European Fund for Strategic Investments (EFSI) provided for the implementation of the Investment Plan for Europe, and the convergence among Member States and among regions was fostered through the European Structural and Investment Funds (ESIF).
The European Fund for Strategic Investments has already triggered more than EUR 287 billion in new investment and has helped creating more than 300 000 jobs. In December 2017, the European Parliament and Council decided to increase and extend the fund to catalyse investments of up to EUR 500 billion by 2020. The EFSI guarantee fund, which the Commission established to provide a liquidity cushion to cover guarantee calls by the EIB group for its investments, has reached EUR 3,5 billion at end 2017.
EUR 54 billion was allocated to programmes aiming to strengthen economic, social and territorial cohesion, including the European Regional Development Fund, the Cohesion Fund, and the European Social Fund. The Youth Employment Initiative, which implementation accelerated in 2017, focuses on decreasing youth unemployment throughout the Union. By the end of 2017 the total eligible cost of operations selected for support reached nearly EUR 7 billion. Member States declare that 1,7 million young people have already benefitted from the assistance provided by the Initiative.
Moreover, the EU budget served as an instrument of solidarity with e.g. EUR 1,2 billion mobilised under the EU Solidarity Fund, the highest sum ever provided in a single instalment, following the earthquakes of 2016 and 2017 in the Italian regions of Abruzzo, Lazio, Marche and Umbria.
EUR 58,6 billion were devoted to the promotion of sustainable growth and the preservation of Europe's natural resources. Programmes included the pillars of the Common Agricultural Policy (CAP) of market support measures and rural development, fisheries, and activities in the fields of climate and environment under the Programme for the Environment and Climate Action (LIFE).
The EU budget also continued to underpin the comprehensive European response to the migration crisis and the management of Europe’s external borders. The Asylum, Migration and Integration Fund (AMIF) promoted the efficient management of migration flows and the development of a common Union approach to asylum and migration. The total of payments executed in 2017 amounted to EUR 576,2 million, almost a double of the 2016 figure. Financed by the EU budget, the European Border and Coast Guard Agency with its extended mandate has significantly strengthened its presence at the EU’s external borders with the aim of supporting the Member States in their border management activities and jointly implementing an integrated border management at EU level.
The EU budget also allowed the Union to play a strong role beyond Europe during a period of turbulence in Europe’s neighbourhood. Last but not least, it contributed to the response to global challenges such as climate change by integrating mitigation and adaptation actions into all major EU spending programmes, with the total budget contribution to climate mainstreaming estimated at 20,3 % for 2017.
An optimal performance of the Union’s budget has been a priority for the Juncker Commission from day one. We strongly support the increasing emphasis of the European Parliament, the Member States and the European Court of Auditors not only on how programmes are managed, but also on whether they are delivering results in the areas that really matter for Europe’s citizens.
The Commission will continue playing its role, along with the budgetary authority, to harness the potential of the EU budget to invest in growth, create jobs and tackle our common challenges.
Günther H. Oettinger
Commissioner for Budget and Human Resources, European Commission
EUROPEAN UNION POLITICAL FRAMEWORK, GOVERNANCE AND ACCOUNTABILITY
The European Union (EU) is a Union within which 28 (1) European countries (the Member States) confer competences to attain objectives they have in common. The Union is founded on the values of respect for human dignity, freedom, democracy, equality, the rule of law and respect for human rights, including the rights of persons belonging to minorities. These values are common to the Member States in a society in which pluralism, non-discrimination, tolerance, justice, solidarity and equality between women and men prevail.
1. POLITICAL FRAMEWORK
EU Treaties
The overarching objectives and principles that guide the Union and the European Institutions are defined in the Treaties. The Union and the EU institutions may only act within the limits of the competences conferred by the Treaties so as to attain the objectives set out therein and must do this in accordance with the principles (2) of subsidiarity and proportionality. To attain its objectives and carry out its policies, the Union provides itself with the necessary financial means. The Commission is responsible for implementing the objectives in cooperation with the Member States and in accordance with the principle of sound financial management.
The EU pursues the objectives established in the Treaty with a number of tools, one of which is the EU budget. Others are, for example, proposing legislation or pursuing policy strategies.
Europe 2020 strategy
The Europe 2020 strategy agreed in 2010 by the Heads of State or Government of EU Member States defines a 10 year jobs and growth strategy at EU level for the EU (3). The strategy put forward three mutually reinforcing priorities of smart, sustainable and inclusive growth with five EU headline targets. Its success depends on all the actors of the Union, acting collectively.
The EU budget is only one of the EU levers contributing to the delivery of the Europe 2020 objectives. A wide range of actions at national, EU and international levels are being mobilised to deliver concrete results in relation to the Europe 2020 strategy.
Commission political priorities
The Commission's political priorities are defined in the political guidelines set by the President of the Commission, providing a roadmap for the Commission's action that is fully consistent and compatible with Europe 2020 as the EU's long-term growth strategy.
10 PRIORITIES
|
|
||||
|
|
||||
|
|
||||
|
|
||||
|
|
2030 Agenda for Sustainable Development (4)
Sustainable development has long been at the heart of the European project. The EU Treaties give recognition to its economic, social and environmental dimensions which should be addressed together. The EU is committed to development that meets the needs of the present without compromising the ability of future generations to meet their own needs. The EU budget plays an essential role in many sustainability challenges from youth unemployment to ageing populations, climate change, pollution, sustainable energy and migration. Under the current Commission sustainable development is mainstreamed in key cross-cutting projects as well as in sectoral policies and initiatives.
Multiannual Financial Framework and spending programmes
The policies supported by the EU budget are implemented in accordance with the Multiannual Financial Framework (MFF) and corresponding sectorial legislation defining spending programmes.
The Multiannual Financial Framework translates the EU’s political priorities into financial terms over a period long enough to be effective and to provide a coherent long-term vision for beneficiaries of EU funds and co-financing national authorities. It sets maximum annual amounts (ceilings) for EU expenditure as a whole and for the main categories of expenditure (headings). The sum of the ceilings of all headings gives the total ceiling of commitment appropriations. The Multiannual Financial Framework is adopted by unanimity indicating the agreement of all Member States to the objectives and the level of spending (maximum level of budget commitments and payments), with the consent of the European Parliament. The Commission is responsible for managing and implementing the EU budget and programmes adopted by the Parliament and the Council. Most of the actual implementation and spending (about 75 %) is done by national and local authorities but the Commission is responsible for supervising it. The Commission handles the budget under the watchful eye of the European Court of Auditors. Both institutions aim to ensure sound financial management.
Interinstitutional agreement
The Multiannual Financial Framework is complemented by the interinstitutional agreement (5) which is a political agreement between the European Parliament, the Council and the Commission. The purpose of this agreement, adopted in 2013 in accordance with Article 295 of the TFEU, is to implement budgetary discipline, improve the functioning of the annual budgetary procedure and cooperation between the institutions on budgetary matters as well as to ensure sound financial management.
Annual budget
The annual budget is prepared by the Commission and usually agreed by mid-December by the European Parliament and the Council, based on the procedure of Art. 314 TFEU. According to the principle of budget equilibrium, total revenue must equal total expenditure (payment appropriations) for a given financial year.
The main sources of funding of the EU are own resources revenues which are complemented by other revenues. There are three types of own resources: traditional own resources (such as custom duties and sugar levies), the own resource based on value added tax (VAT) and the own resource based on gross national income (GNI). Other revenues arising from the activities of the EU (e.g. competition fines) normally represent less than 10 % of total revenue. The overall amount of own resources needed to finance the budget is determined by total expenditure less other revenue. The total amount of own resources cannot exceed 1,20 % of the sum of gross national income (GNI) of the Member States.
The EU's operational expenditure covers the various headings of the Multiannual Financial Framework and takes different forms, depending on how the money is paid out and managed. The EU budget is implemented in three management modes:
Shared management: under this method of budget implementation, tasks are delegated to Member States. About 75 % of the expenditure falls under this management mode covering such areas as agricultural spending and structural actions.
Direct management: this is where the budget is implemented directly by the Commission services.
Indirect management: this refers to cases where the Commission confers tasks of implementation of the budget to third parties, such as the EU regulatory agencies or international organisations.
Financial Regulation
The Financial Regulation (FR) applicable to the general budget is a central act in the regulatory architecture of the EU’s finances defining EU financial rules applicable to the EU budget.
2. GOVERNANCE AND ACCOUNTABILITY IN THE EU
2.1. INSTITUTIONAL STRUCTURE
The organisational governance of the EU consists of institutions, agencies and other EU bodies which are listed in note 9 of the notes to the consolidated financial statements. The European Investment Bank (EIB) and the European Investment Fund (EIF) are not included in the scope of the Financial Regulation. The main institutions, in the sense of being responsible for drafting policies and taking decisions, are the European Parliament, the European Council, the Council and the Commission.
The Commission is the executive of the EU and promotes its general interest. It does this by proposing legislation; implementing EU policies; overseeing the correct implementation of the Treaties and European law; managing the EU budget; and by representing the Union outside Europe.
The Commission's internal functioning is based on a number of key principles underpinning good governance: clear roles and responsibilities, a strong commitment to performance management and compliance with the legal framework, clear accountability mechanisms, a high quality and inclusive regulatory framework, openness and transparency, and high standards of ethical behaviour.
2.2. THE COMMISSION'S GOVERNANCE STRUCTURE
The European Commission has a unique governance system, with a clear distinction between political and administrative oversight structures and well-defined lines of responsibility and financial accountability (6). The system is based on the Treaties and the structure has evolved to adapt to a changing environment and to remain in line with best practice as set out in relevant international standards (7).
|
— |
The College of Commissioners assumes collegial political responsibility for the work of the Commission. Operational implementation of the budget is delegated to Directors-General and Heads of Service who lead the administrative structure of the Commission (8). |
|
— |
The College delegates financial management tasks to the Directors-General or Heads of Service who thereby become Authorising Officers by Delegation (AOD). These tasks can further be delegated to Directors, Heads of Unit and others, who thereby become Authorising Officers by Sub-Delegation. The responsibility of the Authorising Officers covers the entire management process, from determining what needs to be done to achieve the policy objectives set by the institution to managing the activities from both an operational and budgetary standpoint. |
In the Commission, the roles and responsibilities in financial management are thus clearly defined and applied. This is a decentralised approach with clear responsibilities with the aim of creating an administrative culture that encourages civil servants to take responsibility for activities over which they have control and to give them control over the activities for which they are responsible.
Within the context of the Commission's Strategic Planning and Programming cycle, each authorising officer is required to prepare an ‘annual activity report’ (AAR) on the activities and policy achievements and results of the year where he/she declares that resources have been used based on the principles of sound financial management and that he/she has set in place control procedures which provide the necessary guarantee concerning the legality and regularity of the underlying transactions. At Commission level these results are adopted and published in an aggregated form in the Annual Management and Performance Report for the EU budget and sent to the European Parliament and the Council. This is the main instrument through which the College of Commissioners takes political responsibility for the management of the budget.
The Accounting Officer of the Commission is centrally responsible for the treasury management, recovery procedures, laying down accounting rules based on International Public Sector Accounting Standards and methods, validating accounting systems and the preparation of the Commission's and consolidated annual accounts of the EU. Furthermore, the Accounting Officer is required to sign the annual accounts declaring that they present fairly, in all material aspects, the financial position, the results of the operations and the cash flows. The annual accounts are adopted by the College of Commissioners. The Accounting Officer is an independent function and bears a major responsibility as regards financial reporting in the Commission. The Internal Auditor of the Commission is likewise a centralised and independent function and provides independent advice, opinions and recommendations on the quality and functioning of internal control systems inside the Commission, EU agencies and other autonomous bodies.
The Audit Progress Committee follows-up implementation of audits, in particular of the Internal Audit Service but also on the basis of European Court of Auditors audits, and assesses internal audit quality, so as to gain a more general view of the control systems of the Commission.
The Corporate Management Board plays a role in the corporate governance of the Commission by providing oversight and strategic orientations on major corporate management issues, including in relation to the management of financial and human resources. Chaired by the Secretary-General, it brings together on a regular basis Directors-General and Cabinets responsible for budget, human resources and IT to ensure that the necessary organisational and technical structures are in place in the Commission to deliver on the political priorities of the President in an efficient and effective manner.
2.3. PERFORMANCE FRAMEWORK
Implementing robust performance frameworks is essential for ensuring a strong focus on results, EU added value and sound management of EU programmes. The performance framework of the EU budget is highly specified, scoring higher than any Organisation for Economic Co-operation and Development (OECD) country in the standard index of performance budgeting frameworks. The EU budget performance framework reports on several types and levels of strategic goals, objectives and targets, including the Europe 2020 strategy and other political priorities. It must also take account of the complementarity and mainstreaming of policies and programmes and the key role of the Member States in implementing the EU Budget.
|
— |
Objectives, indicators and targets are strongly featured in the programmes' legal basis and every year the Commission reports on them through the Programme Statements that accompany the draft budget. They provide all of the key information that is necessary for careful programme scrutiny and performance measurement: this includes 7-year financial commitments; programme performance baselines (starting points for policy action); end-goals (to be achieved at the end of the multi-annual programming period); and intermediate milestones. |
|
— |
To ensure resources are allocated to priorities and that every action brings high performance and added value, the Commission implements its EU Budget Focused on Results initiative. Building on the 2014–2020 performance framework, it promotes a better balance between compliance and performance. |
|
— |
The Annual Management and Performance Report for the EU budget provides a comprehensive overview on the performance, management and protection of the EU budget. It explains how the EU budget supports the European Union’s political priorities, the results achieved with the EU budget, and the role the Commission plays in ensuring and promoting the highest standards of budgetary and financial management. |
|
— |
The European Court of Auditors takes a systematic and thorough approach to assessing the qualitative aspects of budgeting, including the performance dimension, as a normal part of its annual reporting and through special reports. |
All of these elements place the budget authority in a strong position to take performance into account as a significant factor in deciding on the next annual budget.
2.4. FINANCIAL REPORTING
The main element of EU financial reporting is the Integrated Financial Reporting Package of the EU which comprises the consolidated annual accounts of the EU, the Annual Management and Performance Report for the budget and the Report on the follow-up to the discharge. The Integrated Financial Reporting Package provides the public with a comprehensive view of the financial and operational situation of the EU each year.
The consolidated annual accounts of the EU provide financial information on the activities of the institutions, agencies and other bodies of the EU from both an accrual accounting and budgetary perspective. These accounts do not comprise the annual accounts of Member States.
The consolidated annual accounts of the EU consist of two separate but linked parts:
|
a) |
the consolidated financial statements; and |
|
b) |
the reports on implementation of the budget, which provide an aggregated record of budget implementation. |
In addition, the consolidated annual accounts of the EU are accompanied by a Financial Statement Discussion and Analysis (FSDA) which summarises significant changes and trends in the financial statements and explains significant risks and uncertainties the EU has faced and needs to address in future.
Reporting and Accountability in the Commission:
|
Integrated Financial Reporting Package |
Consolidated Annual Accounts of the EU Annual Management and Performance Report for the budget Report on the follow up to the discharge |
|
Other reports |
General Report on the activities of the EU Annual Activity Reports of the Directorates-General Report on Budgetary and Financial Management |
2.5. EXTERNAL AUDIT AND DISCHARGE PROCEDURE
External audit
The European Court of Auditors (the Court) is the external auditor of the EU institutions (and bodies). The Court's mission is to contribute to improving EU financial management, promote accountability and transparency, and act as the independent guardian of the financial interests of the citizens of the EU. The Court’s role as the EU’s independent external auditor is to check that EU funds are correctly accounted for, are raised and spent in accordance with the relevant rules and regulations and have achieved value for money.
The EU’s annual accounts and its sound financial management are audited by the Court, which, as part of its activities, draws up for the European Parliament and the Council:
|
(1) |
an annual report on the activities financed from the general budget, detailing its observations on the annual accounts and underlying transactions; |
|
(2) |
an opinion, based on its audits and given in the annual report in the form of a statement of assurance, on (i) the reliability of the accounts and (ii) the legality and regularity of the underlying transactions involving both revenue collected and payments to final beneficiaries; and |
|
(3) |
special reports covering specific areas. |
Discharge
The final step of a budget lifecycle is the discharge procedure for a given financial year. It represents the political dimension of the external control of budget implementation and is the decision by which the ‘Discharge Authority’ (i.e. the European Parliament, acting on a Council recommendation) ‘releases’ the Commission (and other EU bodies) from its responsibility for the management of a given budget. This decision is based on an examination of the EU consolidated annual accounts and a set of Commission reports (the Annual Management and Performance Report, the report on the follow-up to the previous year's discharge and the annual report to the discharge authority on internal audits carried out) as well as on the European Court of Auditors' Annual Report, audit opinion (the ‘Statement of Assurance’) and Special Reports. It also takes account of the Commission written replies to questions and further information requests as well as hearings of the Budget Commissioner and Commissioners responsible for the main spending areas before the European Parliament's Budgetary Control Committee (CONT).
The outcome of the discharge procedure may be threefold: granting, postponement or refusal of the discharge. The final discharge reports also include specific requests addressed to the Commission by both the European Parliament and the Council. These requests are subject to a follow up report in which the Commission outlines the concrete actions it has already taken or intends to take.
NOTE ACCOMPANYING THE CONSOLIDATED ACCOUNTS
The consolidated annual accounts of the European Union for the year 2017 have been prepared on the basis of the information presented by the institutions and bodies under Article 148(2) of the Financial Regulation applicable to the general budget of the European Union. I hereby declare that they were prepared in accordance with Title IX of this Financial Regulation and with the accounting principles, rules and methods set out in the notes to the financial statements.
I have obtained from the accounting officers of these institutions and bodies, who certified its reliability, all the information necessary for the production of the accounts that show the European Union's assets and liabilities and the budgetary implementation.
I hereby certify that based on this information, and on such checks as I deemed necessary to sign off the accounts of the European Commission, I have a reasonable assurance that the accounts present fairly, in all material aspects, the financial position, the results of the operations and the cashflows of the European Union.
[signed]
Rosa ALDEA BUSQUETS
Accounting Officer of the Commission
22 June 2018
HIGHLIGHTS OF THE FINANCIAL YEAR 2017
Implementation of the 2017 Union budget
The 2017 adopted budget focused on two main policy priorities for Europe: supporting the ongoing recovery of the European economy and addressing the security and humanitarian challenges in our neighbourhood. Increased funding went to investments in growth, jobs and competitiveness in the European Union as well as to securing the necessary resources to protect the external borders of the EU, to reinforce security inside and outside the Union, to provide support for the reception and integration of refugees, and to address the root causes of migration in the countries of origin and transit.
The implementation of the EU budget in 2017 totalled EUR 171,1 billion in commitment appropriations, and EUR 137,4 billion in payment appropriations.
Nearly half of the funds — EUR 83,3 billion in commitments — stimulated growth, employment and competitiveness. This included funding for research and innovation under Horizon 2020, education under Erasmus+, small and medium sized enterprises under the COSME programme, the Connecting Europe Facility (CEF), the guarantee fund for the European Fund for Strategic Investments (EFSI) which is the vehicle behind the Investment Plan for Europe, and to foster convergence among Member States and among regions through the European Structural and Investment Funds (ESIF). Moreover, the EU budget support to European farmers amounted to EUR 44,7 billion in payments.
The budget was also used to reinforce the external borders of the Union and address the refugee crisis and irregular migration by funding stronger tools to prevent migrant smuggling and address the long-term drivers of migration in cooperation with countries of origin and transit, stronger policies for legal migration, including resettlement for persons in need of protection, and instruments to support Member States with respect to the integration of refugees inside the EU.
The United Kingdom's withdrawal from the European Union
Background
On 23 June 2016 a majority of the citizens of the United Kingdom who voted in the referendum on membership of the European Union voted to leave the EU. On 29 March 2017 the United Kingdom formally notified the European Council of its intention to leave the EU and the European Atomic Energy Community (Euratom). In doing so it triggered Article 50 of the Treaty on European Union, which sets out the procedure for a Member State to withdraw from the Union.
The negotiation process
At a special meeting of the European Council on 29 April 2017 the leaders of the other 27 Member States adopted political guidelines on the orderly withdrawal of the United Kingdom from the EU. These defined the framework for the negotiations and set out the EU’s overall positions and principles. Four days later the Commission sent a Recommendation to the Council to open Article 50 negotiations with the United Kingdom, including draft negotiating directives.
On 22 May the Council adopted a Decision authorising the opening of negotiations with the United Kingdom and formally nominating the Commission as the EU’s negotiator. It also adopted the first set of negotiating directives. These provided for a clear structure and a united EU approach to the negotiations.
The EU is represented by Michel Barnier, who was appointed as Chief Negotiator by the European Commission. Within the European Commission, a Task Force under the authority of Michel Barnier coordinates the work on all of the strategic, operational, legal and financial issues related to the negotiations. The Commission reports back to the Council throughout the negotiations, and also keeps the European Parliament closely and regularly informed.
The first phase of negotiations
The first phase of the talks began on 19 June 2017. It set out to provide as much clarity and legal certainty as possible and to settle the disentanglement of the United Kingdom from the EU.
Six negotiating rounds were held during 2017. Negotiations focused on three priority issues: protecting citizens’ rights; the framework for addressing the unique circumstances in Ireland and Northern Ireland; and the financial settlement to ensure that both the EU and the United Kingdom respect their financial obligations undertaken before the withdrawal. In addition, the negotiations covered other separation issues.
On 8 December 2017 the European Commission recommended to the European Council to conclude that sufficient progress had been made in the first phase of the Article 50 negotiations with the United Kingdom. The Commission’s assessment was based on a Joint Report agreed by the negotiators of the Commission and the UK government. In this Joint Report, the UK agreed to pay all its obligations under the current Multiannual Financial Framework (MFF) and previous financial perspectives as if it were still a Member State, including its share of the Union's liabilities and contingent liabilities.
On 15 December the European Council confirmed that sufficient progress had been achieved, and the leaders adopted guidelines to move to the second phase of negotiations, on possible transitional arrangements and the future relationship between the EU and the United Kingdom.
The next phase of negotiations
On 20 December 2017 the European Commission sent a Recommendation to the Council to begin discussions on the next phase of negotiations, including draft negotiating directives. These supplement the negotiating directives from May 2017 and set out additional details on possible transitional arrangements.
The Recommendation also recalls the need to translate into legal terms the results of the first phase of the negotiations, as outlined in the Commission’s Communication and the Joint Report. In line with the European Council’s guidelines of 15 December, the additional negotiating directives on transitional arrangements were adopted on 29 January 2018.
On 19 March 2018 the Commission published a draft of the Withdrawal Agreement that outlined the progress made in the negotiation round with the UK of 16-19 March 2018. In the financial settlement part of the Withdrawal Agreement, the EU and the UK translated the progress achieved in the first phase of negotiations (presented in the Joint Report) into a legal text.
Following the publication of the draft Withdrawal Agreement, on 23 March 2018 the European Council issued further guidelines with a view to the opening of negotiations on the overall understanding of the framework for the future EU-UK relationship. Negotiations should be completed by autumn 2018 in order to allow enough time before 29 March 2019 for the Withdrawal Agreement to be concluded by the Council, after obtaining the consent of the European Parliament, and to be approved by the United Kingdom in accordance with its own procedures.
Financial settlement and the 2017 EU annual accounts
With regard to the financial settlement, it was stated in the Joint Report, confirmed by the publication of the draft Withdrawal Agreement on 19 March, that the UK would pay all its obligations under the current MFF and previous financial perspectives as if it were still a Member State. More specifically, the draft withdrawal agreement states that the United Kingdom shall in particular be liable to the Union for its share of:
|
— |
The budgetary commitments of the Union budget and of the budgets of the Union decentralised agencies outstanding on 31 December 2020 — see Article 133 of the Withdrawal Agreement; |
|
— |
The financing of the Union's liabilities incurred until 31 December 2020, with certain exceptions — see Article 135; |
|
— |
The contingent financial liabilities of the Union arising from financial operations decided/approved before the withdrawal date — see Article 136; and |
|
— |
The payments required to discharge the contingent liabilities of the Union that become due related to legal cases concerning financial interests of the Union (provided that the facts forming the subject matter of those cases occurred no later than 31 December 2020) — see Article 140. |
This is the most recent information available at the time of preparation of these accounts. Based on this current situation, there is no impact on the consolidated EU annual accounts at 31 December 2017 resulting from the withdrawal process.
It is also noted that the Commission has proposed on 2 May 2018 its proposal for the next MFF starting in 2021 which is prepared on the basis that the UK will no longer be a Member State.
CONSOLIDATED FINANCIAL STATEMENTS AND EXPLANATORY NOTES (1)
CONTENTS
| BALANCE SHEET | 13 |
| STATEMENT OF FINANCIAL PERFORMANCE | 14 |
| CASHFLOW STATEMENT | 15 |
| STATEMENT OF CHANGES IN NET ASSETS | 16 |
| NOTES TO THE FINANCIAL STATEMENTS | 17 |
|
1. |
SIGNIFICANT ACCOUNTING POLICIES | 17 |
|
2. |
NOTES TO THE BALANCE SHEET | 29 |
|
3. |
NOTES TO THE STATEMENT OF FINANCIAL PERFORMANCE | 58 |
|
4. |
CONTINGENT LIABILITIES AND ASSETS | 66 |
|
5. |
BUDGETARY AND LEGAL COMMITMENTS | 70 |
|
6. |
FINANCIAL RISK MANAGEMENT | 74 |
|
7. |
RELATED PARTY DISCLOSURES | 86 |
|
8. |
EVENTS AFTER THE BALANCE SHEET DATE | 88 |
|
9. |
SCOPE OF CONSOLIDATION | 88 |
BALANCE SHEET
|
EUR millions |
|||
|
|
Note |
31.12.2017 |
31.12.2016 |
|
NON-CURRENT ASSETS |
|
|
|
|
Intangible assets |
2.1 |
405 |
381 |
|
Property, plant and equipment |
2.2 |
10 745 |
10 068 |
|
Investments accounted for using the equity method |
2.3 |
581 |
528 |
|
Financial assets |
2.4 |
59 980 |
62 247 |
|
Pre-financing |
2.5 |
25 022 |
21 901 |
|
Exchange receivables and non-exchange recoverables |
2.6 |
611 |
717 |
|
|
|
97 344 |
95 842 |
|
CURRENT ASSETS |
|
|
|
|
Financial assets |
2.4 |
8 655 |
3 673 |
|
Pre-financing |
2.5 |
24 005 |
23 569 |
|
Exchange receivables and non-exchange recoverables |
2.6 |
11 755 |
10 905 |
|
Inventories |
2.7 |
295 |
165 |
|
Cash and cash equivalents |
2.8 |
24 111 |
28 585 |
|
|
|
68 821 |
66 897 |
|
TOTAL ASSETS |
|
166 165 |
162 739 |
|
NON-CURRENT LIABILITIES |
|
|
|
|
Pension and other employee benefits |
2.9 |
(73 122 ) |
(67 231 ) |
|
Provisions |
2.10 |
(2 880 ) |
(1 936 ) |
|
Financial liabilities |
2.11 |
(50 063 ) |
(55 067 ) |
|
|
|
(126 065 ) |
(124 234 ) |
|
CURRENT LIABILITIES |
|
|
|
|
Provisions |
2.10 |
(659) |
(675) |
|
Financial liabilities |
2.11 |
(6 850 ) |
(2 284 ) |
|
Payables |
2.12 |
(39 048 ) |
(40 005 ) |
|
Accrued charges and deferred income |
2.13 |
(63 902 ) |
(67 580 ) |
|
|
|
(110 459 ) |
(110 544 ) |
|
TOTAL LIABILITIES |
|
(236 524 ) |
(234 778 ) |
|
NET ASSETS |
|
(70 359 ) |
(72 040 ) |
|
Reserves |
2.14 |
4 876 |
4 841 |
|
Amounts to be called from Member States (2) |
2.15 |
(75 234 ) |
(76 881 ) |
|
NET ASSETS |
|
(70 359 ) |
(72 040 ) |
STATEMENT OF FINANCIAL PERFORMANCE
|
EUR millions |
|||
|
|
Note |
2017 |
2016 |
|
REVENUE |
|
|
|
|
Revenue from non-exchange transactions |
|
|
|
|
GNI resources |
3.1 |
78 620 |
95 578 |
|
Traditional own resources |
3.2 |
20 520 |
20 439 |
|
VAT resources |
3.3 |
16 947 |
15 859 |
|
Fines |
3.4 |
4 664 |
3 858 |
|
Recovery of expenses |
3.5 |
1 879 |
1 947 |
|
Other |
3.6 |
10 376 |
5 740 |
|
|
|
133 006 |
143 422 |
|
|
|
|
|
|
Revenue from exchange transactions |
|
|
|
|
Financial revenue |
3.7 |
1 845 |
1 769 |
|
Other |
3.8 |
1 332 |
998 |
|
|
|
3 177 |
2 767 |
|
Total Revenue |
|
136 183 |
146 189 |
|
EXPENSES |
|
|
|
|
Implemented by Member States |
3.9 |
|
|
|
European Agricultural Guarantee Fund |
|
(44 289 ) |
(44 152 ) |
|
European Agricultural Fund for Rural Development and other rural development instruments |
|
(11 359 ) |
(12 604 ) |
|
European Regional Development Fund and Cohesion Fund |
|
(17 650 ) |
(35 045 ) |
|
European Social Fund |
|
(7 353 ) |
(9 366 ) |
|
Other |
|
(1 253 ) |
(1 606 ) |
|
Implemented by the Commission, executive agencies and trust funds |
3.10 |
(15 738 ) |
(15 610 ) |
|
Implemented by other EU agencies and bodies |
3.11 |
(2 667 ) |
(2 547 ) |
|
Implemented by third countries and international organisations |
3.11 |
(4 115 ) |
(3 258 ) |
|
Implemented by other entities |
3.11 |
(1 478 ) |
(2 035 ) |
|
Staff and pension costs |
3.12 |
(10 002 ) |
(9 776 ) |
|
Changes in employee benefits actuarial assumptions |
3.13 |
(3 544 ) |
(1 068 ) |
|
Finance costs |
3.14 |
(1 896 ) |
(1 904 ) |
|
Other expenses |
3.15 |
(6 756 ) |
(5 486 ) |
|
Total Expenses |
|
(128 101 ) |
(144 456 ) |
|
ECONOMIC RESULT OF THE YEAR |
|
8 082 |
1 733 |
CASHFLOW STATEMENT
|
EUR millions |
||
|
|
2017 |
2016 |
|
Economic result of the year |
8 082 |
1 733 |
|
Operating activities |
|
|
|
Amortisation |
99 |
88 |
|
Depreciation |
888 |
575 |
|
(Increase)/decrease in loans |
497 |
1 774 |
|
(Increase)/decrease in pre-financing |
(3 557 ) |
(314) |
|
(Increase)/decrease in exchange receivables and non-exchange recoverables |
(745) |
(1 297 ) |
|
(Increase)/decrease in inventories |
(130) |
(26) |
|
Increase/(decrease) in pension and other employee benefits |
5 891 |
3 417 |
|
Increase/(decrease) in provisions |
928 |
581 |
|
Increase/(decrease) in financial liabilities |
(438) |
(2 351 ) |
|
Increase/(decrease) in payables |
(957) |
7 813 |
|
Increase/(decrease) in accrued charges and deferred income |
(3 678 ) |
(821) |
|
Prior year budgetary surplus taken as non-cash revenue |
(6 405 ) |
(1 349 ) |
|
Other non-cash movements |
3 |
18 |
|
Investing activities |
|
|
|
(Increase)/decrease in intangible assets and property, plant and equipment |
(1 687 ) |
(2 073 ) |
|
(Increase)/decrease in investments accounted for using the equity method |
(53) |
(31) |
|
(Increase)/decrease in available for sale financial assets |
(3 190 ) |
(822) |
|
(Increase)/decrease in financial assets at fair value through surplus or deficit |
(22) |
(0) |
|
NET CASHFLOW |
(4 474 ) |
6 914 |
|
Net increase/(decrease) in cash and cash equivalents |
(4 474 ) |
6 914 |
|
Cash and cash equivalents at the beginning of the year |
28 585 |
21 671 |
|
Cash and cash equivalents at year-end |
24 111 |
28 585 |
STATEMENT OF CHANGES IN NET ASSETS
|
EUR millions |
||||
|
|
Amounts to be called from Member States Accumulated Surplus/(Deficit) |
Other reserves |
Fair value reserve |
Net Assets |
|
BALANCE AS AT 31.12.2015 |
(77 124 ) |
4 390 |
292 |
(72 442 ) |
|
Movement in Guarantee Fund reserve |
(82) |
82 |
— |
— |
|
Fair value movements |
— |
— |
33 |
33 |
|
Other |
(59) |
44 |
— |
(15) |
|
2015 budget result credited to Member States |
(1 349 ) |
— |
— |
(1 349 ) |
|
Economic result of the year |
1 733 |
— |
— |
1 733 |
|
BALANCE AS AT 31.12.2016 |
(76 881 ) |
4 516 |
325 |
(72 040 ) |
|
Movement in Guarantee Fund reserve |
(20) |
20 |
— |
— |
|
Fair value movements |
— |
— |
(2) |
(2) |
|
Other |
(11) |
62 |
(46) |
5 |
|
2016 budget result credited to Member States |
(6 405 ) |
— |
— |
(6 405 ) |
|
Economic result of the year |
8 082 |
— |
— |
8 082 |
|
BALANCE AS AT 31.12.2017 |
(75 234 ) |
4 598 |
278 |
(70 359 ) |
NOTES TO THE FINANCIAL STATEMENTS
1. SIGNIFICANT ACCOUNTING POLICIES
1.1. LEGAL BASIS AND ACCOUNTING RULES
The accounts of the EU are kept in accordance with Regulation (EU, Euratom) No 966/2012 of the European Parliament and of the Council of 25 October 2012 on the financial rules applicable to the general budget of the Union and repealing Council Regulation (EC, Euratom) No 1605/2002 (OJ L 298, 26 October 2012, p. 1) hereinafter referred to as the ‘Financial Regulation’ and Commission Delegated Regulation (EU) No 1268/2012 of 29 October 2012 (OJ L 362, 31 December 2012, p. 1) laying down detailed rules of application of this Financial Regulation.
In accordance with article 143 of the Financial Regulation, the EU prepares its financial statements on the basis of accrual-based accounting rules that are based on International Public Sector Accounting Standards (IPSAS). These accounting rules, adopted by the Accounting Officer of the Commission, have to be applied by all the institutions and EU bodies falling within the scope of consolidation in order to establish a uniform set of rules for accounting, valuation and presentation of the accounts with a view to harmonising the process for drawing up the financial statements and consolidation.
Application of new and amended European Union accounting rules (EAR)
Amendments to EAR which are effective for annual periods beginning on or after 1 January 2017
The following amendments have been adopted by the Accounting Officer of the Commission:
|
— |
Amendments to EAR 1 ‘Financial Statements’; and |
|
— |
Amendments to EAR 14 ‘Accounting Policies, Changes in Accounting Estimates and Errors’. |
These amendments stem from the recent changes to IPSAS 1 ‘Presentation of Financial Statements’ and IPSAS 3 ‘Accounting Policies, Changes in Accounting Estimates and Errors’, proposing improvements to ensure consistency among IPSAS standards. Consequently, the related EARs have been updated and the main changes relate to the description of qualitative characteristics of financial reporting and updates to the hierarchy of sources to be used in the selection and application of accounting policies.
The adoption of these amendments has had no impact on the EU annual accounts 2017.
New and revised EARs adopted but not yet effective at 31 December 2017
The EU has not applied the following new and revised EARs, which have been adopted by the Accounting Officer of the Commission, but which are not yet effective:
|
— |
Revision to EAR 12 ‘Employee Benefits’ (effective for annual periods beginning on or after 1 January 2018): The EAR 12 has been revised in line with the new IPSAS 39 ‘Employee Benefits’. The main change is that any gain or loss resulting from changes in the actuarial assumptions is to be recognised directly in net assets, in contrast with the current requirement to recognise them in surplus or deficit. |
The EU is currently analysing the impact and practical consequences of applying this revised EAR. However, no significant impact is expected on the consolidated financial statements, except for the recognition of the actuarial assumptions in the net assets instead of the statement of financial performance.
|
— |
New EAR 20 ‘Public Sector Combinations’ (effective for annual periods beginning on or after 1 January 2019): The EAR 20, which is based on the IPSAS 40 ‘Public Sector Combinations’, establishes the classification of a public sector combination into two different types depending on whether the transaction takes place under common control or not: (i) amalgamation, in which the transaction is based on the carrying amounts of the entity combined with the EU; and (ii) acquisition, in which the transaction is based on the acquisition date fair values of the entity acquired by the EU. Both have distinct requirements and levels of disclosure, in order to provide a better understanding of its effects to users of the financial statements of the EU. |
The impact on the EU financial statements in the year of initial application will depend on whether in that period the EU would enter into a public sector combination transaction.
1.2. ACCOUNTING PRINCIPLES
The objective of financial statements is to provide information about the financial position, performance and cashflows of an entity that is useful to a wide range of users. For the EU as a public sector entity, the objectives are more specifically to provide information useful for decision making, and to demonstrate the accountability of the entity for the resources entrusted to it. It is with these goals in mind that the present document has been drawn up.
The overall considerations (or accounting principles) to be followed when preparing the financial statements are laid down in EU accounting rule 1 ‘Financial Statements’ and are the same as those described in IPSAS 1: fair presentation, accrual basis, going concern, consistency of presentation, materiality, aggregation, offsetting and comparative information. The qualitative characteristics of financial reporting are relevance, faithful representation (reliability), understandability, timeliness, comparability and verifiability.
1.3. CONSOLIDATION
Scope of consolidation
The consolidated financial statements of the EU comprise all significant controlled entities (i.e. the EU institutions (including the Commission) and the EU agencies), associates and joint ventures. The complete list of consolidated entities can be found in note 9 of the EU financial statements. It now comprises 52 controlled entities and 1 associate. Entities that fall under the consolidation scope, but which are immaterial to the EU consolidated financial statements as a whole, need not be consolidated or accounted for using equity method where to do so would result in excessive time or cost to the EU. Those entities are referred to as ‘Minor entities’ and are separately listed in note 9. In 2017, 7 entities have been classified as minor entities.
Controlled entities
The decision to include an entity in the scope of consolidation is based on the control concept. Controlled entities are all entities for which the EU is exposed, or has right, to variable benefits from its involvement and has the ability to affect the nature and amount of those benefits through its power over the other entity. This power must be presently exercisable and must relate to the relevant activities of the entity. Controlled entities are fully consolidated. The consolidation begins at the first date on which control exists, and ends when such control no longer exists.
The most common indicators of control within the EU are: creation of the entity through founding treaties or secondary legislation, financing of the entity from the EU budget, the existence of voting rights in the governing bodies, audit by the European Court of Auditors and discharge by the European Parliament. An individual assessment for each entity is made in order to decide whether one or all of the criteria listed above are sufficient to result in control.
Under this approach, the EU's institutions (except the European Central Bank) and agencies (excluding the agencies of the former 2nd pillar) are considered as under the exclusive control of the EU and are therefore included in the consolidation scope. Furthermore the European Coal and Steel Community (ECSC) in Liquidation is also considered as a controlled entity.
All material ‘inter-entity transactions and balances’ between EU controlled entities are eliminated, while unrealised gains and losses on such transactions are not material and so have not been eliminated.
Joint Arrangements
A joint arrangement is an agreement over which the EU and one or more parties have joint control. Joint control is contractually agreed sharing of control over an arrangement, which exists only when decisions about the relevant activities require the unanimous consent of parties sharing control. Joint agreements can be either joint operations or joint ventures. In case a joint arrangement is structured through a separate vehicle and parties to the joint arrangement have rights to the net assets of the arrangement, this joint arrangement classifies as a joint venture. Participations in joint ventures are accounted for using the equity method (see note 1.5.4). In case the parties have rights to the assets, and obligations for the liabilities, related to the arrangement, this joint arrangement is classified as a joint operation. In relation to its interest in joint operations, the EU recognises in its financial statements: its assets and liabilities, revenue and expense, as well as its share of assets, liabilities, revenue and expense held or incurred jointly.
Associates
Associates are entities over which the EU has, directly or indirectly, significant influence but not control. It is presumed that significant influence exists if the EU holds directly or indirectly 20 % or more of the voting rights. Participations in associates are accounted for using the equity method (see note 1.5.4).
Non-consolidated entities the funds of which are managed by the Commission
The funds of the Joint Sickness Insurance Scheme for staff of the EU, the European Development Fund and the Participants Guarantee Fund are managed by the Commission on their behalf. However, since these entities are not controlled by the EU, they are not consolidated in its financial statements.
1.4. BASIS OF PREPARATION
Financial statements are presented annually. The accounting year begins on 1 January and ends on 31 December.
1.4.1. Currency and basis for conversion
Functional and reporting currency
The financial statements are presented in millions of euros, unless stated otherwise, the euro being the EU's functional and reporting currency.
Transactions and balances
Foreign currency transactions are translated into euros using the exchange rates prevailing at the dates of the transactions. Foreign exchange gains and losses resulting from the settlement of foreign currency transactions and from the re-translation at year-end exchange rates of monetary assets and liabilities denominated in foreign currencies are recognised in the statement of financial performance. Translation differences on non-monetary financial instruments classified as available for sale financial assets are included in the fair value reserve.
Different conversion methods apply to property, plant and equipment and intangible assets, which retain their value in euros at the rate that applied at the date when they were purchased.
Year-end balances of monetary assets and liabilities denominated in foreign currencies are converted into euros on the basis of the European Central Bank (ECB) exchange rates applying on 31 December:
Euro exchange rates
|
Currency |
31.12.2017 |
31.12.2016 |
Currency |
31.12.2017 |
31.12.2016 |
|
BGN |
1,9558 |
1,9558 |
PLN |
4,177 |
4,4103 |
|
CZK |
25,5350 |
27,0210 |
RON |
4,6585 |
4,5390 |
|
DKK |
7,4449 |
7,4344 |
SEK |
9,8438 |
9,5525 |
|
GBP |
0,8872 |
0,8562 |
CHF |
1,1702 |
1,0739 |
|
HRK |
7,4400 |
7,5597 |
JPY |
135,01 |
123,4000 |
|
HUF |
310,3300 |
309,8300 |
USD |
1,1993 |
1,0541 |
1.4.2. Use of estimates
In accordance with IPSAS and generally accepted accounting principles, the financial statements necessarily include amounts based on estimates and assumptions by management based on the most reliable information available. Significant estimates include, but are not limited to: amounts for employee benefit liabilities, provisions, financial risk on inventories and accounts receivable, accrued revenue and charges, contingent assets and liabilities, degree of impairment of intangible assets and property, plant and equipment and amounts disclosed in the notes concerning financial instruments. Actual results could differ from those estimates. Changes in estimates are reflected in the period in which they become known.
1.5. BALANCE SHEET
1.5.1. Intangible assets
Acquired computer software licences are stated at historical cost less accumulated amortisation and impairment losses. The assets are amortised on a straight-line basis over their estimated useful lives (3-11 years). The estimated useful lives of intangible assets depend on their specific economic lifetime or legal lifetime determined by an agreement. Internally developed intangible assets are capitalised when the relevant criteria of the EU accounting rules are met and the expenses relate solely to the development phase of the asset. The costs capitalisable include all directly attributable costs necessary to create, produce, and prepare the asset to be capable of operating in the manner intended by management. Costs associated with research activities, non-capitalisable development costs and maintenance costs are recognised as expenses as incurred.
1.5.2. Property, plant and equipment
All property, plant and equipment are stated at historical cost less accumulated depreciation and impairment losses. Cost includes expenditure that is directly attributable to the acquisition, construction or transfer of the asset.
Subsequent costs are included in the asset’s carrying amount or recognised as a separate asset, as appropriate, only when it is probable that future economic benefits or service potential associated with the item will flow to the EU and its cost can be measured reliably. Repairs and maintenance costs are charged to the statement of financial performance during the financial period in which they are incurred.
Land and works of art are not depreciated as they are deemed to have an indefinite useful life. Assets under construction are not depreciated as these assets are not yet available for use. Depreciation on other assets is calculated using the straight-line method to allocate their cost less their residual values over their estimated useful lives, as follows:
|
Type of asset |
Straight line depreciation rate |
|
Buildings |
4 % to 10 % |
|
Space assets |
8 % to 25 % |
|
Plant and equipment |
10 % to 25 % |
|
Furniture and vehicles |
10 % to 25 % |
|
Computer hardware |
25 % to 33 % |
|
Other |
10 % to 33 % |
Gains or losses on disposals are determined by comparing proceeds less selling expenses with the carrying amount of the disposed asset and are included in the statement of financial performance.
Leases
Leases of tangible assets, where the EU has substantially all the risks and rewards of ownership, are classified as finance leases. Finance leases are capitalised at the inception of the lease’s commencement at the lower of the fair value of the leased asset and the present value of the minimum lease payments. The interest element of the finance lease payment is charged to expenditure over the period of the lease at a constant periodic rate in relation to the balance outstanding. The rental obligations, net of finance charges, are included in financial liabilities (non-current and current). The interest element of the finance cost is charged to the statement of financial performance over the lease period so as to produce a constant periodic interest rate on the remaining balance of the liability for each period. The assets held under finance leases are depreciated over the shorter of the asset's useful life and the lease term.
Leases where the lessor retains a significant portion of the risks and rewards inherent to ownership are classified as operating leases. Operating lease payments are recognised as an expense in the statement of financial performance on a straight-line basis over the lease term.
1.5.3. Impairment of non-financial assets
Assets that have an indefinite useful life are not subject to amortisation/depreciation and are tested annually for impairment. Assets that are subject to amortisation/depreciation are reviewed for impairment whenever events or changes in circumstances indicate that the carrying amount may not be recoverable. An impairment loss is recognised for the amount by which the asset’s carrying amount exceeds its recoverable (service) amount. The recoverable (service) amount is the higher of an asset’s fair value less costs to sell and its value in use.
Intangible assets and property, plant and equipment residual values and useful lives are reviewed, and adjusted if appropriate, at least once per year. An asset’s carrying amount is written down immediately to its recoverable (service) amount if the asset’s carrying amount is greater than its estimated recoverable (service) amount. If the reasons for impairments recognised in previous years no longer apply, the impairment losses are reversed accordingly.
1.5.4. Investments accounted for using the equity method
Participations in associates and joint ventures
Investments accounted for using the equity method are initially recognised at cost. The EU's interest in these investments is recognised in the statement of financial performance, and its share in the movements in reserves is recognised in the fair value reserve in net assets. The initial cost together with all movements (further contributions, share of economic results and reserve movements, impairments, and dividends) give the book value of the investment in the financial statements at the balance sheet date. Distributions received from the investment reduce the carrying amount of the asset.
If the EU's share of deficits of an investment accounted for using the equity method equals or exceeds its interest in the investment, the EU discontinues recognising its share of further losses (‘unrecognised losses’). After the EU's interest is reduced to zero, additional losses are provided for and a liability is recognised, only to the extent that the EU has incurred legal or constructive obligation or made payments on behalf of the entity.
If there are indications of impairment, a write-down to the lower recoverable amount is necessary. The recoverable amount is determined as described under note 1.5.3. If the reason for impairment ceases to apply at a later date, the impairment loss is reversed to the carrying amount that would have been determined had no impairment loss been recognised.
In cases where the EU holds 20 % or more of an investment capital fund, it does not seek to exert significant influence. Such funds are therefore treated as financial instruments and categorised as available for sale financial assets.
Associates and joint ventures classified as minor entities are not accounted for under the equity method. EU contributions to those entities are accounted for as an expense of the period.
1.5.5. Financial assets
Classification
The EU classifies their financial assets in the following categories: financial assets at fair value through surplus or deficit; loans and receivables; held-to-maturity investments; and available for sale financial assets. The classification of financial instruments is determined at initial recognition and re-evaluated at each balance sheet date.
(i) Financial assets at fair value through surplus or deficit
A financial asset is classified in this category if acquired principally for the purpose of selling in the short term. Derivatives are also categorised in this category. Assets in this category are classified as current assets if they are expected to be realised within 12 months of the balance sheet date.
(ii) Loans and receivables
Loans and receivables are non-derivative financial assets with fixed or determinable payments that are not quoted in an active market. They arise when the EU provides money, goods or services directly to a debtor with no intention of trading the receivable, or in case the EU is subrogated to the rights of the original lender following a payment made by the EU under a guarantee contract. Payments due within 12 months of the balance sheet date are classified as current assets. Payments due after 12 months from the balance sheet date are classified as non-current assets. Loans and receivables include term deposits with the original maturity above three months.
(iii) Held-to-maturity investments
Held-to-maturity investments are non-derivative financial assets with fixed or determinable payments and fixed maturities that the EU has the positive intention and ability to hold to maturity. During this financial year, the EU did not hold any investments in this category.
(iv) Available for sale financial assets
Available for sale financial assets are non-derivatives that are either designated in this category or not classified in any of the other categories. They are classified as either current or non-current assets, depending on the period of time the EU expects to hold them. Investments in entities that are neither consolidated nor accounted for using the equity method and other equity-type investments (e.g. Risk Capital Operations) are also classified as available for sale financial assets.
Initial recognition and measurement
Purchases and sales of financial assets at fair value through surplus or deficit, held-to-maturity and available for sale are recognised on trade-date — the date on which the EU commits to purchase or sell the asset. Cash equivalents and loans are recognised when cash is advanced to the borrowers. Financial instruments are initially recognised at fair value. For all financial assets not carried at fair value through surplus or deficit transactions costs are added to the fair value at initial recognition. Financial assets carried at fair value through surplus or deficit are initially recognised at fair value and transaction costs are expensed in the statement of financial performance.
The fair value of a financial asset on initial recognition is normally the transaction price (i.e. the fair value of the consideration received), unless the fair value of that instrument is evidenced by comparison with other observable current market transactions in the same instrument or based on a valuation technique whose variables include only data from observable markets (e.g. in case of some derivative contracts). However, when a long-term loan that carries no interest or an interest below market conditions is granted, its fair value can be estimated as the present value of all future cash receipts discounted using the prevailing market rate of interest for a similar instrument with a similar credit rating.
Loans granted are measured at their nominal amount, which is considered to be the fair value of the loan. The reasoning for this is as follows:
|
— |
The ‘market environment’ for EU lending is very specific and different from the capital market used to issue commercial or government bonds. As lenders in these markets have the opportunity to choose alternative investments, the opportunity possibility is factored into market prices. However, this opportunity for alternative investments does not exist for the EU which is not allowed to invest money on the capital markets; it only borrows funds for the purpose of lending at the same rate. This means that there is no alternative lending or investment option available to the EU for the sums borrowed. Thus, there is no opportunity cost and therefore no basis of comparison with market rates. In fact, the EU lending operation itself represents the market. Essentially, since the opportunity cost ‘option’ is not applicable, the market price does not fairly reflect the substance of the EU lending transactions. Therefore, it is not appropriate to determine the fair value of EU lending with reference to commercial or government bonds. |
|
— |
Furthermore as there is no active market or similar transactions to compare with, the interest rate to be used by the EU for fair valuing its lending operations under the EFSM, BOP and other such loans, should be the interest rate charged. |
|
— |
In addition, for these loans, there are compensating effects between loans and borrowings due to their back-to-back character. Thus, the effective interest for the loan equals the effective interest rate for the related borrowings. The transaction costs incurred by the EU and then recharged to the beneficiary of the loan are directly recognised in the statement of financial performance. |
Financial instruments are derecognised when the rights to receive cashflows from the investments have expired or the EU has transferred substantially all risks and rewards of ownership to another party.
Subsequent measurement
|
a) |
Financial assets at fair value through surplus or deficit are subsequently carried at fair value. Gains and losses arising from changes in the fair value of the ‘financial instruments at fair value through surplus or deficit’ category are included in the statement of financial performance in the period in which they arise. |
|
b) |
Loans and receivables are carried at amortised cost using the effective interest method. In the case of loans granted on borrowed funds, the same effective interest rate is applied to both the loans and borrowings since these loans have the characteristics of ‘back-to-back operations’ and the differences between the loan and the borrowing conditions and amounts are not material. The transaction costs incurred by the EU and then recharged to the beneficiary of the loan are directly recognised in the statement of financial performance. |
|
c) |
Held to maturity assets are carried at amortised cost using the effective interest method. The EU currently holds no held to maturity investments. |
|
d) |
Available for sale financial assets are subsequently carried at fair value. Gains and losses arising from changes in the fair value of available for sale financial assets are recognised in the fair value reserve, except for translation differences on monetary assets which are recognised in the statement of financial performance. When assets classified as available for sale financial assets are derecognised or impaired, the cumulative fair value adjustments previously recognised in the fair value reserve are recognised in the statement of financial performance. Interest on available for sale financial assets calculated using the effective interest method is recognised in the statement of financial performance. Dividends on available for sale equity instruments are recognised when the EU's right to receive payment is established. |
The fair values of quoted investments in active markets are based on current bid prices. If the market for a financial asset is not active (and for unlisted securities and over-the–counter derivatives), the EU establishes a fair value by using valuation techniques. These include the use of recent arm’s length transactions, reference to other instruments that are substantially the same, discounted cashflow analysis, option pricing models and other valuation techniques commonly used by market participants.
Investments in Venture Capital Funds, classified as available for sale financial assets, which do not have a quoted market price in an active market are valued at the attributable net asset value, which is considered as an equivalent of their fair value.
In cases where the fair value of investments in equity instruments that do not have a quoted market price in an active market cannot be reliably measured, these investments are valued at cost less impairment losses.
Impairment of financial assets
The EU assesses at each balance sheet date whether there is objective evidence that a financial asset is impaired. A financial asset is impaired and impairment losses are incurred if, and only if, there is objective evidence of impairment as a result of one or more events that occurred after the initial recognition of the asset and that loss event (or events) has an impact on the estimated future cashflows of the financial asset that can be reliably estimated.
(a) Assets carried at amortised cost
If there is objective evidence that an impairment loss on loans and receivables or held-to-maturity investments carried at amortised cost has been incurred, the amount of the loss is measured as the difference between the asset’s carrying amount and the present value of estimated future cashflows (excluding future credit losses that have not been incurred) discounted at the financial asset’s original effective interest rate. The carrying amount of the asset is reduced and the amount of the loss is recognised in the statement of financial performance. If a loan or held-to-maturity investment has a variable interest rate, the discount rate for measuring any impairment loss is the current effective interest rate determined under the contract. The calculation of the present value of the estimated future cashflows of a collateralised financial asset reflects the cashflows that may result from foreclosure less costs for obtaining and selling the collateral, whether or not foreclosure is probable. If, in a subsequent period, the amount of the impairment loss decreases and the decrease can be related objectively to an event occurring after the impairment was recognised, the previously recognised impairment loss is reversed through the statement of financial performance.
(b) Assets carried at fair value
In the case of equity investments classified as available for sale financial assets, a significant or permanent (prolonged) decline in the fair value of the security below its cost is considered in determining whether the securities are impaired. If any such evidence exists for available for sale financial assets, the cumulative loss — measured as the difference between the acquisition cost and the current fair value, less any impairment loss on that financial asset previously recognised in the statement of financial performance — is removed from reserves and recognised in the statement of financial performance. Impairment losses recognised in the statement of financial performance on equity instruments are not reversed through the statement of financial performance. If, in a subsequent period, the fair value of a debt instrument classified as available for sale financial asset increases and the increase can be objectively related to an event occurring after the impairment loss was recognised, the impairment loss is reversed through the statement of financial performance.
1.5.6. Inventories
Inventories are stated at the lower of cost and net realisable value. Cost is determined using the first-in, first-out (FIFO) method. The cost of finished goods and work in progress comprises raw materials, direct labour, other directly attributable costs and related production overheads (based on normal operating capacity). Net realisable value is the estimated selling price in the ordinary course of business, less the costs of completion and selling expenses. When inventories are held for distribution at no charge or for a nominal charge, they are measured at the lower of cost and current replacement cost. Current replacement cost is the cost the EU would incur to acquire the asset on the reporting date.
1.5.7. Pre-financing amounts
Pre-financing is a payment intended to provide the beneficiary with a cash advance, i.e. a float. It may be split into a number of payments over a period defined in the particular contract, decision, agreement or basic legal act. The float or advance is either used for the purpose for which it was provided during the period defined in the agreement or it is repaid. If the beneficiary does not incur eligible expenditure, they have the obligation to return the pre-financing advance to the EU. The amount of the pre-financing may be reduced (wholly or partially) by the acceptance of eligible costs (which are recognised as expenses).
Pre-financing is, on subsequent balance sheet dates, measured at the amount initially recognised on the balance sheet less eligible expenses (including estimated amounts where necessary) incurred during the period.
Interest on pre-financing is recognised as it is earned in accordance with the provisions of the relevant agreement. An estimate of the accrued interest revenue, based on the most reliable information, is made at the year-end and included on the balance sheet.
Other advances to Member States which originate from reimbursement by the EU of amounts paid as advances by the Member States to their beneficiaries (including ‘financial instruments under shared management’) are recognised as assets and presented under the pre-financing heading. Other advances to Member States are subsequently measured at the amount initially recognised on the balance sheet less a best estimate of the eligible expenses incurred by final beneficiaries, calculated on the basis of reasonable and supportable assumptions.
The EU contributions to the trust funds of the European Development Fund or other unconsolidated entities are also classified as pre-financing since their purpose is to give a float to the trust fund to allow it to finance specific actions defined under the trust fund's objectives. The EU contributions to trust funds are measured at the initial amount of the EU contribution less eligible expenses, including estimated amounts where necessary, incurred by the trust fund during the reporting period and allocated to the EU contribution in accordance with the underlying agreement.
1.5.8. Exchange receivables and non-exchange recoverables
As the EU accounting rules require a separate presentation of exchange and non-exchange transactions, for the purpose of drawing up the accounts, receivables are defined as stemming from exchange transactions and recoverables are defined as stemming from non-exchange transactions, i.e. when the EU receives value from another entity without directly giving approximately equal value in exchange (for example recoverables from Member States related to own resources).
Receivables from exchange transactions meet the definition of financial instruments and are thus classified as loans and receivables and measured accordingly (see note 1.5.5). The financial instruments notes disclosures concerning receivables from exchange transactions include accrued revenue and deferred charges from exchange transactions as they are not material.
Recoverables from non-exchange transactions are carried at original amount (adjusted for interest and penalties) less write-down for impairment. A write-down for impairment of recoverables from non-exchange transactions is established when there is objective evidence that the EU will not be able to collect all amounts due according to the original terms of recoverables from non-exchange transactions. The amount of the write-down is the difference between the asset’s carrying amount and the recoverable amount. The amount of the write-down is recognised in the statement of financial performance. A general write-down, based on past experience, is also made for outstanding recovery orders not already subject to a specific write-down. See note 1.5.14 concerning the treatment of accrued revenue at year-end. Amounts displayed and disclosed as recoverables from non-exchanges transactions are not financial instruments as they do not arise from a contract that would give rise to a financial liability or equity instrument. However, in the notes to the financial statements recoverables from non-exchange transactions are disclosed together with receivables from exchange transactions where appropriate.
1.5.9. Cash and cash equivalents
Cash and cash equivalents are financial instruments and include cash at hand, deposits held at call or at short notice with banks and other short-term highly liquid investments with original maturities of three months or less.
1.5.10. Pension and other employee benefits
Pension obligations
The EU operates defined benefit pension plans. Whilst staff contribute from their salaries one third of the expected cost of these benefits, the liability is not funded. The liability recognised in the balance sheet in respect of defined benefit pension plans is the present value of the defined benefit obligation at the balance sheet date less the fair value of any plan assets. The defined benefit obligation is calculated by actuaries using the projected unit credit method. The present value of the defined benefit obligation is determined by discounting the estimated future cash outflows using interest rates of government bonds that are denominated in the currency in which the benefits will be paid, and that have terms to maturity approximating to the terms of the related pension liability.
Actuarial gains and losses arising from experience adjustments and changes in actuarial assumptions are recognised immediately in the statement of financial performance. Past-service costs are recognised immediately in statement of financial performance, unless the changes to the pension plan are conditional on the employees remaining in service for a specified period of time (the vesting period). In this case, the past-service costs are amortised on a straight-line basis over the vesting period.
Post-employment sickness benefits
The EU provides health benefits to its employees through the reimbursement of medical expenses. A separate fund has been created for its day-to-day administration. Both current employees, pensioners, widowers and their relatives benefit from the system. The benefits granted to the ‘inactives’ (pensioners, orphans, etc.) are classified as ‘Post-Employment Employee Benefits’. Given the nature of these benefits, an actuarial calculation is required. The liability in the balance sheet is determined on a similar basis as that for the pension obligations (see above).
1.5.11. Provisions
Provisions are recognised when the EU has a present legal or constructive obligation towards third parties as a result of past events, it is more likely than not that an outflow of resources will be required to settle the obligation, and the amount can be reliably estimated. Provisions are not recognised for future operating losses. The amount of the provision is the best estimate of the expenses expected to be required to settle the present obligation at the reporting date. Where the provision involves a large number of items, the obligation is estimated by weighting all possible outcomes by their associated probabilities (‘expected value’ method).
1.5.12. Financial liabilities
Financial liabilities are classified as financial liabilities at fair value through surplus or deficit, financial liabilities carried at amortised cost or as financial guarantee liabilities.
Borrowings are composed of borrowings from credit institutions and debts evidenced by certificates. They are recognised initially at fair value, being their issue proceeds (fair value of consideration received) net of transaction costs incurred, then subsequently carried at amortised cost using the effective interest method; any difference between proceeds, net of transaction costs, and the redemption value is recognised in the statement of financial performance over the period of the borrowings using the effective interest method. In the case of loans granted on borrowed funds, the effective interest method may not be applied to loans and borrowings, based on materiality considerations. The transaction costs incurred by the EU and then recharged to the beneficiary of the loan are directly recognised in the statement of financial performance.
Financial liabilities categorised at fair value through surplus or deficit include derivatives which fair value is negative. They follow the same accounting treatment as financial assets at fair value through surplus or deficit, see note 1.5.5.
Financial guarantee liabilities are initially recognised at fair value, being the premium received. Subsequently, financial guarantee liabilities are measured at the higher of the best estimate of the expenses expected to be required to settle the financial guarantee liability and the amount initially recognised less, when appropriate, cumulative amortisation. The EU recognises a financial guarantee liability when it receives consideration for granting of the guarantee, that is at market terms, or when the fair value of the guarantee can be measured reliably. In case no active market for a directly equivalent guarantee contract exists, the EU discloses the guarantee given as a contingent liability (see note 1.7.2) or — when it is more likely than not that an outflow of resources will be required to settle the obligation — the EU recognises a provision (see note 1.5.11).
Financial liabilities are classified as non-current liabilities, except for maturities less than 12 months after the balance sheet date.
EU trust funds that are considered as part of the Commission's operational activities are accounted for in the Commission accounts and further consolidated in the EU annual accounts. Therefore, contributions from other donors to the EU trust funds fulfil the criteria of revenues from non-exchange transactions under conditions and they are presented as financial liabilities until the conditions attached to the contributions transferred are met, i.e. eligible costs are incurred by the trust fund. The trust fund is required to finance specific projects and return remaining funds at the time of winding-up. At the balance sheet date the outstanding contribution liabilities are measured at contributions received less the expenses incurred by the trust fund, including estimated amounts when necessary. For reporting purposes the net expenses are allocated to the contributions of other donors in proportion to net contributions paid as at 31 December. This allocation of contributions is only indicative. When the trust fund is wound up the actual split of remaining resources will be decided by the trust fund board.
1.5.13. Payables
A significant amount of the payables of the EU are unpaid cost claims from beneficiaries of grants or other EU funding (non-exchange transactions). They are recorded as payables for the requested amount when the cost claim is received. Upon verification and acceptance of the eligible costs, the payables are valued at the accepted and eligible amount.
Payables arising from the purchase of goods and services are recognised at invoice reception for the original amount and corresponding expenses are entered in the accounts when the supplies or services are delivered and accepted by the EU.
1.5.14. Accrued and deferred revenue and charges
Transactions and events are recognised in the financial statements in the period to which they relate. At year-end, if an invoice is not yet issued but the service has been rendered, the supplies have been delivered by the EU or a contractual agreement exists (e.g. by reference to a treaty), an accrued revenue will be recognised in the financial statements. In addition, at year-end, if an invoice is issued but the services have not yet been rendered or the goods supplied have not yet been delivered, the revenue will be deferred and recognised in the subsequent accounting period.
Expenses are also accounted for in the period to which they relate. At the end of the accounting period, accrued expenses are recognised based on an estimated amount of the transfer obligation of the period. The calculation of accrued expenses is done in accordance with detailed operational and practical guidelines issued by the Commission which aim at ensuring that the financial statements provide a faithful representation of the economic and other phenomena they purport to represent. By analogy, if payment has been made in advance for services or goods that have not yet been received, the expense will be deferred and recognised in the subsequent accounting period.
1.6. STATEMENT OF FINANCIAL PERFORMANCE
1.6.1. Revenue
REVENUE FROM NON-EXCHANGE TRANSACTIONS
The vast majority of the EU's revenue relates to non-exchange transactions:
GNI based resources and VAT resources
Revenue is recognised for the period for which the Commission sends out a call for funds to the Member States claiming their contribution. They are measured at their ‘called amount’. As VAT and GNI resources are based on estimates of the data for the budgetary year concerned, they may be revised as changes occur until the final data are issued by the Member States. The effect of a change in estimate is included when determining the net surplus or deficit for the period in which the change occurred.
Traditional own resources
Recoverables from non-exchange transactions and related revenues are recognised when the relevant monthly ‘A’ statements (including duties collected and amounts due that are guaranteed and not contested) are received from the Member States. At the reporting date, revenue collected by the Member States for the period but not yet paid to the Commission is estimated and recognised as accrued revenue. The quarterly ‘B’ statements (including duties neither collected nor guaranteed, as well as guaranteed amounts that have been contested by the debtor) received from the Member States are recognised as revenue less the collection costs to which they are entitled. In addition, a value reduction is recognised for the amount of the estimated recovery gap.
Fines
Revenue from fines is recognised when the EU's decision imposing a fine has been taken and it is officially notified to the addressee. If there are doubts about the undertaking's solvency, a value reduction on the entitlement is recognised. After the decision to impose a fine, the debtors have two months from the date of notification:
|
a) |
either to accept the decision, in which case they must pay the fine within the time limit laid down and the amount is definitively collected by the EU; |
|
b) |
or not to accept the decision, in which case they lodge an appeal under EU law. |
However, even if appealed, the fine must be paid within the time limit of three months laid down as the appeal does not have suspensory effect (Article 278 of the EU Treaty) or, under certain circumstances and subject to the agreement of the Commission's Accounting Officer, the debtor may present a bank guarantee for the amount instead.
If the undertaking appeals against the decision, and has already provisionally paid the fine, the amount is disclosed as a contingent liability. However, since an appeal against an EU decision by the addressee does not have suspensory effect, the cash received is used to clear the recoverable. If a guarantee is received instead of payment, the fine remains as a recoverable. If it appears probable that the General Court may not rule in favour of the EU, a provision is recognised to cover this risk. If a guarantee had been given instead, then the recoverable outstanding is written-down as required. The accumulated interest received by the Commission on the bank accounts where received payments are deposited is recognised as revenue, and any contingent liability is increased accordingly.
Since 2010, all provisionally cashed fines are managed by the Commission in a specifically created fund (BUFI) and invested in financial instruments.
REVENUE FROM EXCHANGE TRANSACTIONS
Revenue from the sale of goods and services is recognised when the significant risk and rewards of ownership of the goods are transferred to the purchaser. Revenue associated with a transaction involving the provision of services is recognised by reference to the stage of completion of the transaction at the reporting date.
Interest revenue and expense
Interest revenue and expense are recognised in the statement of financial performance using the effective interest method. This is a method of calculating the amortised cost of a financial asset or a financial liability and of allocating the interest revenue or interest expense over the relevant period. When calculating the effective interest rate, the EU estimates cashflows considering all contractual terms of the financial instrument (for example prepayment options) but does not consider future credit losses. The calculation includes all fees and points paid or received between parties to the contract that are an integral part of the effective interest rate, transaction costs and all other premiums or discounts.
Once a financial asset or a group of similar financial assets has been written down as a result of an impairment loss, interest revenue is recognised using the rate of interest to discount the future cashflows for the purpose of measuring the impairment loss.
Revenue from dividends
Revenue from dividends and similar distributions is recognised when the right to receive payment is established.
1.6.2. Expenses
Expenses from non-exchange transactions account for the majority of the EU's expenses. They relate to transfers to beneficiaries and can be of three types: entitlements, transfers under agreement and discretionary grants, contributions and donations.
Transfers are recognised as expenses in the period during which the events giving rise to the transfer occurred, as long as the nature of the transfer is allowed by regulation (Financial Regulation, Staff Regulations, or other regulation) or an agreement has been signed authorising the transfer; any eligibility criteria have been met by the beneficiary; and a reasonable estimate of the amount can be made.
When a request for payment or cost claim is received and meets the recognition criteria, it is recognised as an expense for the eligible amount. At year-end, incurred eligible expenses due to the beneficiaries but not yet reported are estimated and recorded as accrued expenses.
Expenses from exchange transactions arising from the purchase of goods and services are recognised when the supplies are delivered and accepted by the EU. They are valued at original invoice amount. Furthermore, at the balance sheet date expenses related to the service delivered during the period for which an invoice has not yet been received or accepted are estimated and recognised in the statement of financial performance.
1.7. CONTINGENT ASSETS AND LIABILITIES
1.7.1. Contingent assets
A contingent asset is a possible asset that arises from past events and of which the existence will be confirmed only by the occurrence or non-occurrence of one or more uncertain future events not wholly within the control of the EU. A contingent asset is disclosed when an inflow of economic benefits or service potential is probable.
1.7.2. Contingent liabilities
A contingent liability is a possible obligation that arises from past events and of which the existence will be confirmed only by the occurrence or non-occurrence of one or more uncertain future events not wholly within the control of the EU; or a present obligation that arises from past events but is not recognised because: it is not probable that an outflow of resources embodying economic benefits or service potential will be required to settle the obligation or in the rare circumstances where the amount of the obligation cannot be measured with sufficient reliability.
1.8. CASHFLOW STATEMENT
Cashflow information is used to provide a basis for assessing the ability of the EU to generate cash and cash equivalents, and its needs to utilise those cashflows.
The cashflow statement is prepared using the indirect method. This means that the economic result for the financial year is adjusted for the effects of transactions of a non-cash nature, any deferrals or accruals of past or future operating cash receipts or payments, and items of revenue or expense associated with investing cashflows.
Cashflows arising from transactions in a foreign currency are recorded in the EU’s reporting currency (Euro), by applying to the foreign currency amount the exchange rate between the euro and the foreign currency at the date of the cashflow.
The cashflow statement reports cashflows during the period classified by operating and investing activities (the EU does not have financing activities).
Operating activities are the activities of the EU that are not investing activities. These are the majority of the activities performed. Loans granted to beneficiaries (and the related borrowings, when applicable) are not considered as investing (or financing) activities as they are part of the general objectives and thus daily operations of the EU.
Investing activities are the acquisition and disposal of intangible assets and property, plant and equipment and of other investments which are not included in cash equivalents. Investing activities do not include loans granted to beneficiaries. The objective is to show the real investments made by the EU.
2. NOTES TO THE BALANCE SHEET
ASSETS
2.1. INTANGIBLE ASSETS
|
EUR millions |
|
|
Gross carrying amount at 31.12.2016 |
820 |
|
Additions |
105 |
|
Disposals |
(1) |
|
Transfer between asset categories |
4 |
|
Other changes |
12 |
|
Gross carrying amount at 31.12.2017 |
940 |
|
Accumulated amortisation at 31.12.2016 |
(439) |
|
Amortisation charge for the year |
(96) |
|
Amortisation written back |
(3) |
|
Disposals |
4 |
|
Transfer between asset categories |
(2) |
|
Other changes |
0 |
|
Accumulated amortisation at 31.12.2017 |
(535) |
|
Net carrying amount at 31.12.2017 |
405 |
|
Net carrying amount at 31.12.2016 |
381 |
The above amounts relate primarily to computer software.
2.2. PROPERTY, PLANT AND EQUIPMENT
The Space assets category covers operational fixed assets related to the two EU space programmes: the Global Navigation Satellite Systems (GNSS), i.e. Galileo and EGNOS, and the Copernicus European Earth observation programme, while assets of the space systems which are not yet operational are included under the Assets under construction heading.
For Galileo, four new satellites have been added in 2017 to the operational constellation bringing it up to 18 satellites. The Galileo operational fixed assets amounted to EUR 2 276 million at 31 December 2017, net of depreciation (2016: EUR 2 146 million). The remaining assets under construction totalling EUR 1 026 million (2016: EUR 756 million) include the four satellites launched in December 2017 for which the in-orbit testing had not yet been completed at the balance sheet date. The development of the Galileo system will continue until the system reaches its full operational capacity. When completed, the Galileo constellation will comprise 24 operational satellites and 6 spares.
Regarding Copernicus, a new satellite (Sentinel 2B) became operational in 2017, in addition to other four Copernicus operational satellites, increasing the total value of Copernicus operational fixed assets to EUR 1 140 million (2016: EUR 1 073 million), net of accumulated depreciation. Another EUR 1 443 million related to Copernicus satellites is recognised as assets under construction (2016: EUR 1 133 million).
Fixed assets related to the European Geostationary Navigation Overlay System (EGNOS) ground infrastructure of EUR 67 million (2016: EUR 83 million) are also included under the Space assets heading. In addition, EGNOS assets under construction amount to EUR 52 million (2016: EUR 21 million).
The assets related to the EU space programmes are being built with the assistance of the European Space Agency (ESA).
Property, plant and equipment
|
EUR millions |
|||||||||
|
|
Land and Buildings |
Space assets |
Plant and Equipment |
Furniture and Vehicles |
Computer Hardware |
Other |
Finance leases |
Assets under construction |
Total |
|
Gross carrying amount at 31.12.2016 |
5 297 |
3 603 |
583 |
269 |
658 |
298 |
2 783 |
2 292 |
15 783 |
|
Additions |
84 |
0 |
27 |
14 |
62 |
17 |
9 |
1 417 |
1 630 |
|
Disposals |
(24) |
(1) |
(17) |
(19) |
(49) |
(8) |
— |
(0) |
(119) |
|
Transfer between asset categories |
98 |
641 |
2 |
1 |
1 |
1 |
(5) |
(743) |
(5) |
|
Other changes |
1 |
21 |
1 |
1 |
3 |
2 |
— |
(44) |
(14) |
|
Gross carrying amount at 31.12.2017 |
5 456 |
4 264 |
597 |
266 |
675 |
309 |
2 787 |
2 920 |
17 273 |
|
Accumulated depreciation at 31.12.2016 |
(2 865 ) |
(301) |
(474) |
(186) |
(535) |
(203) |
(1 150 ) |
|
(5 715 ) |
|
Depreciation charge for the year |
(182) |
(480) |
(44) |
(20) |
(64) |
(30) |
(97) |
|
(917) |
|
Depreciation written back |
— |
— |
9 |
2 |
18 |
1 |
— |
|
29 |
|
Disposals |
13 |
1 |
8 |
16 |
32 |
7 |
— |
|
78 |
|
Transfer between asset categories |
0 |
0 |
(0) |
(0) |
(1) |
(0) |
3 |
|
2 |
|
Other changes |
(1) |
(1) |
(1) |
(1) |
(2) |
(0) |
— |
|
(6) |
|
Accumulated depreciation at 31.12.2017 |
(3 035 ) |
(780) |
(502) |
(188) |
(553) |
(226) |
(1 244 ) |
|
(6 528 ) |
|
NET CARRYING AMOUNT AT 31.12.2017 |
2 422 |
3 484 |
95 |
78 |
122 |
83 |
1 543 |
2 920 |
10 745 |
|
NET CARRYING AMOUNT AT 31.12.2016 |
2 432 |
3 302 |
109 |
83 |
122 |
95 |
1 633 |
2 292 |
10 068 |
2.3. INVESTMENTS ACCOUNTED FOR USING THE EQUITY METHOD
The participation of the EU, represented by the Commission, in the European Investment Fund (EIF) is treated as an associate using the equity method of accounting. The EIF is the EU's financial institution specialising in providing risk capital and guarantees to Small and Medium-sized Entities (SMEs). The EIF is located in Luxembourg and operates as a private-public partnership, whose members are the European Investment Bank (EIB), the EU and a group of financial institutions. At 31 December 2017 the EU held 29,7 % of ownership interests in the EIF (2016: 28,1 %) and 29,7 % of the voting rights (2016: 28,1 %). In accordance with its statutes, the EIF is required to allocate to a statutory reserve at least 20 % of its annual net result until the aggregate reserve amounts to 10 % of subscribed capital. This reserve is not available for distribution.
|
EUR millions |
|
|
|
European Investment Fund |
|
Participation at 31.12.2016 |
528 |
|
Contributions |
44 |
|
Dividends received |
(7) |
|
Share of net result |
21 |
|
Share in the net assets |
(6) |
|
Participation at 31.12.2017 |
581 |
The following carrying amounts are attributable to the EU based on its percentage of participation:
|
EUR millions |
||
|
|
31.12.2017 |
31.12.2016 |
|
|
Total EIF |
Total EIF |
|
Assets |
2 488 |
2 301 |
|
Liabilities |
(532) |
(423) |
|
Revenue |
263 |
240 |
|
Expenses |
(153) |
(118) |
|
Surplus/(deficit) |
110 |
122 |
Reconciliation of the above summarised financial information to the carrying amount of the interest held in the EIF is as follows:
|
EUR millions |
||
|
|
31.12.2017 |
31.12.2016 |
|
Net assets of the associate |
1 956 |
1 878 |
|
EC ownership interests in EIF |
29.7 % |
28.1 % |
|
Carrying amount |
581 |
528 |
The EU, represented by the Commission, has paid in 20 % of its subscribed shares in the EIF capital at 31 December 2017, the amount uncalled being as follows:
|
EUR millions |
||
|
|
Total EIF capital |
EU subscription |
|
Total share capital |
4 500 |
1 337 |
|
Paid-in |
(900) |
(267) |
|
Uncalled |
3 600 |
1 070 |
2.4. FINANCIAL ASSETS
|
EUR millions |
|||
|
|
Note |
31.12.2017 |
31.12.2016 |
|
Non-current financial assets |
|
|
|
|
Available for sale financial assets |
2.4.1 |
11 758 |
9 131 |
|
Financial assets at fair value through surplus or deficit |
2.4.2 |
16 |
— |
|
Loans |
2.4.3 |
48 205 |
53 116 |
|
|
|
59 980 |
62 247 |
|
Current financial assets |
|
|
|
|
Available for sale financial assets |
2.4.1 |
1 873 |
1 311 |
|
Financial assets at fair value through surplus or deficit |
2.4.2 |
6 |
0 |
|
Loans |
2.4.3 |
6 776 |
2 361 |
|
|
|
8 655 |
3 673 |
|
Total |
|
68 635 |
65 920 |
2.4.1. Available for sale financial assets
|
EUR millions |
||
|
|
31.12.2017 |
31.12.2016 |
|
BUFI investments |
2 158 |
2 013 |
|
ECSC in Liquidation |
1 658 |
1 685 |
|
European Bank for Reconstruction and Development |
188 |
188 |
|
|
4 004 |
3 886 |
|
Guarantee Funds for budgetary guarantees: |
|
|
|
EFSI Guarantee Fund |
3 414 |
948 |
|
Guarantee Fund for external actions |
2 199 |
2 069 |
|
|
5 613 |
3 017 |
|
Financial Instruments financed by the EU budget: |
|
|
|
Horizon 2020 |
1 730 |
1 213 |
|
Risk Sharing Finance Facility |
665 |
719 |
|
ETF Start up |
483 |
476 |
|
Connecting Europe Facility |
482 |
483 |
|
European Fund for South East Europe |
119 |
118 |
|
Risk Capital Operations |
113 |
132 |
|
Other |
422 |
398 |
|
|
4 014 |
3 539 |
|
Total |
13 632 |
10 442 |
|
Non-current |
11 758 |
9 131 |
|
Current |
1 873 |
1 311 |
Out of the total of EUR 13 632 million, the EU holds available for sale financial assets in the form of debt securities (e.g. bonds) of EUR 12 048 million, equity instruments of EUR 1 333 million and investments in the EIB Unitary Fund (money market fund) of EUR 251 million. The debt securities and units in the EIB Unitary Fund are mainly used to temporarily invest the amounts allocated to the EU guarantee and risk-sharing instruments until they are used to satisfy the guarantee calls.
BUFI investments
Provisionally cashed fines related to competition cases are allocated to a dedicated fund (BUFI Fund — ‘Budget Fines’ Fund) and invested by the Commission in debt instruments categorised as available for sale financial assets.
ECSC in Liquidation
Regarding the European Coal and Steel Community (ECSC) in liquidation, all available for sale financial assets are debt securities denominated in EUR and quoted in an active market.
European Bank for Reconstruction and Development
The EU holds a financial investment in the capital of the European Bank for Reconstruction and Development (EBRD), in which at 31 December 2017 the number of shares held were 90 044 (2016: 90 044 shares), representing 3 % of the total subscribed share capital. The EU subscribed for a total amount of EUR 900 million of share capital, out of which EUR 713 million is currently uncalled. According to the Agreement establishing EBRD, the shareholders have some contractual restrictions such as the fact that the shares are not transferable and their redemption is capped at the maximum of the original purchase cost.
The EU measures the investment in EBRD at fair value. The original purchase cost is considered to be the best estimate of the fair value, in particular due to contractual restrictions referred to above. Although EBRD's shares are not quoted in any stock exchange market, there are recent transactions in the investee's equity (issuance of capital at par value), indicating that the cost is the best estimate of the fair value in this situation.
GUARANTEE FUNDS FOR BUDGETARY GUARANTEES
EFSI Guarantee Fund
Pursuant to the EFSI Regulation, the EFSI Guarantee Fund has been established to provide a liquidity cushion against potential losses incurred by the EIB in relation to its financing and investment operations eligible for the EFSI EU guarantee under the EFSI Agreement — see note 4.1.1. The EFSI Guarantee Fund is financed by contributions from the EU budget. It is also endowed by returns on guarantee fund resources invested, revenues received by the EU as remuneration for the guarantee under the EFSI Agreement, and amounts recovered by the EIB from defaulting debtors in respect of previous guarantee calls. The fund is managed by the Commission, which is authorised to invest the assets of the EFSI Guarantee Fund on the financial markets in accordance with the principle of sound financial management following appropriate prudential rules. The EFSI Guarantee Fund started its operations in April 2016. In accordance with the EFSI Regulation, as amended in December 2017 (Regulation (EU 2017/2396), it will be progressively provisioned and shall gradually reach EUR 9,1 billion, i.e. 35 % of the total EU EFSI guarantee obligations.
Guarantee Fund for external actions
The Guarantee Fund for external actions covers loans guaranteed by the EU budget, in particular EIB lending operations outside the EU financed from the EIB's own resources and loans under macro-financial assistance (MFA) and Euratom loans outside the EU — see note 4.1.1. It is a long-term instrument (non-current part: EUR 2 078 million) managed by the EIB and intended to cover any defaulting loans guaranteed by the EU. The Fund is endowed by payments from the EU budget, the proceeds from interest on investments made from the Fund's assets, and sums recovered from defaulting debtors for whom the Fund has had to activate its guarantee. The Fund should be maintained at a target amount corresponding to 9 % of the guaranteed loans outstanding at year-end. The difference between the target amount and the value of the Fund's assets at year-end shall be covered from the EU budget in year n+2, while any surplus is paid back to the EU budget.
FINANCIAL INSTRUMENTS FINANCED BY THE EU BUDGET
For an overview of all financial instruments financed by the budget see the Financial Statement Discussion and Analysis.
Horizon 2020
Under the EU Regulation establishing Horizon 2020 — the Framework Programme for Research and Innovation (2014-2020), new financial instruments have been established in order to enhance access to finance to entities engaged in research and innovation (R&I). These instruments are: the InnovFin Loan and Guarantee Service for R&I under which the Commission shares the financial risk related to a portfolio of new financing operations entered into by the EIB; the InnovFin SME Guarantee including the SME Initiative Uncapped Guarantee Instrument (SIUGI) — guarantee facilities managed by the EIF providing guarantees and counter-guarantees to the financial intermediaries for the new portfolios of loans (under SIUGI the Commission shares the financial risk related to the guarantee given with Member States, EIF and EIB); and the InnovFin Equity Facility for R&I providing for investments in venture capital funds and managed by the EIF.
Risk-Sharing Finance Facility
The Risk-Sharing Finance Facility (RSFF) is managed by the EIB and the Commission's investment portfolio is used to provision financial risk for loans and guarantees given by the EIB to eligible research projects. In total, an EU budget of up to EUR 1 billion was allocated to the RSFF under the 2007-2013 MFF. Under the 2014-2020 MFF, there are no new budget contributions foreseen for the RSFF. The EU overall risk is limited to the amount it contributes to the Facility.
ETF Start up
These are equity instruments that were financed by the Growth & Employment programme, the MAP programme, the CIP programme and the Technology Transfer Pilot Project, under the trusteeship of the EIF, supporting the creation and financing of Start-Up SMEs by investing in suitable specialised venture capital funds.
Connecting Europe Facility
Pursuant to Regulation (EU) No 1316/2013, the Connecting Europe Facility (CEF) debt instrument has been established with the objective to facilitate infrastructure projects’ access to financing in the sectors of transport, telecommunications and energy. It is managed by the EIB under an agreement with the EU. The CEF debt financial instrument is the continuity of the Loan Guarantee Instrument for TEN-T projects (LGTT) and of the pilot phase of the Project Bond Initiative (PBI). The LGTT and the PBI Portfolio were merged into the CEF financial instrument with effect from 1 January 2016. It offers risk-sharing for debt financing in the form of senior and subordinated debt or guarantee as well as support for project bonds.
2.4.2. Financial assets at fair value through surplus or deficit
|
EUR millions |
||||
|
Type of derivative |
31.12.2017 |
31.12.2016 |
||
|
Notional amount |
Fair value |
Notional amount |
Fair value |
|
|
Foreign currency forward contract |
634 |
6 |
50 |
0 |
|
EFSI guarantee on equity portfolio |
258 |
16 |
— |
— |
|
Total |
892 |
23 |
50 |
0 |
|
Non-current |
258 |
16 |
— |
— |
|
Current |
634 |
6 |
50 |
0 |
The EU enters into foreign currency forward contracts in order to hedge the foreign currency risk related to USD denominated debt securities held in the EFSI Guarantee Fund. Under the foreign currency forward contracts, the EU shall deliver the contractually agreed notional amount in foreign currency (‘pay leg’), as presented in the table above, and will receive the notional amount in EUR (‘receive leg’) at the maturity date. Such derivative contracts are measured at fair value at the balance sheet date and classified as either financial assets or financial liabilities at fair value through surplus or deficit depending on whether their fair value is positive or negative. At 31 December 2017, there was only one foreign currency forward contract active, resulting in positive fair value of EUR 6 million (FV hierarchy level 2), thus recognised under financial assets at fair value through surplus or deficit.
The EFSI EU guarantee given to the EIB Group in relation to the portfolios of equity investments is classified as a derivative financial instrument and accounted for as a financial asset or financial liability at fair value through surplus or deficit (FV hierarchy level 3), see note 4.1.1. At 31 December 2017 the amount of the underlying equity investments disbursed by the EIB and EIF amounted to EUR 258 million and the fair value of the EFSI EU guarantee on the EFSI equity portfolios totalled EUR 16 million.
Fair value hierarchy of financial assets measured at fair value
|
EUR millions |
||
|
|
31.12.2017 |
31.12.2016 |
|
Level 1: Quoted prices in active markets |
11 983 |
8 910 |
|
Level 2: Observable inputs other than quoted prices |
510 |
231 |
|
Level 3: Valuation techniques with inputs not based on observable market data |
1 161 |
1 302 |
|
Total |
13 654 |
10 442 |
During the period there were no transfers between level 1 and level 2.
Reconciliation of financial assets measured using valuation techniques with inputs not based on observable market data (level 3)
|
EUR millions |
|
|
Opening balance at 31.12.2016 |
1 302 |
|
Purchases and sales |
39 |
|
Gains or losses for the period in financial income or finance costs |
(21) |
|
Gains or losses in net assets |
30 |
|
Transfers into level 3 |
— |
|
Transfers out of level 3 |
(188) |
|
Other |
— |
|
Closing balance at 31.12.2017 |
1 161 |
2.4.3. Loans
|
EUR millions |
|||
|
|
Note |
31.12.2017 |
31.12.2016 |
|
Loans for financial assistance |
2.4.3.1 |
54 844 |
55 134 |
|
Other loans |
2.4.3.2 |
137 |
343 |
|
Total |
|
54 981 |
55 477 |
|
Non-current |
|
48 205 |
53 116 |
|
Current |
|
6 776 |
2 361 |
2.4.3.1. Loans for financial assistance
|
EUR millions |
||||||
|
|
EFSM |
BOP |
MFA |
Euratom |
ECSC in Liquidation |
Total |
|
Total at 31.12.2016 |
47 456 |
4 272 |
2 964 |
252 |
191 |
55 134 |
|
New loans |
— |
— |
1 013 |
50 |
— |
1 063 |
|
Repayments |
— |
(1 150 ) |
(58) |
(51) |
(76) |
(1 335 ) |
|
Exchange differences |
— |
— |
— |
(1) |
(7) |
(8) |
|
Changes in carrying amount |
0 |
(8) |
5 |
0 |
(8) |
(11) |
|
Impairment |
— |
— |
— |
— |
— |
— |
|
Total at 31.12.2017 |
47 456 |
3 114 |
3 924 |
250 |
100 |
54 844 |
|
Non-current |
42 300 |
1 700 |
3 846 |
203 |
96 |
48 144 |
|
Current |
5 156 |
1 414 |
78 |
47 |
5 |
6 700 |
Nominal value of loans for financial assistance at 31 December 2017, including ECSC in Liquidation loans, total EUR 54 093 million (2016: EUR 54 373 million). The change in carrying amount corresponds to the change in accrued interests.
EFSM enables the granting of financial assistance to a Member State in difficulties or seriously threatened with severe difficulties caused by exceptional circumstances beyond its control. The assistance may take the form of a loan or credit line. The ECOFIN Council conclusions of 9 May 2010 restrict the facility to EUR 60 billion but the legal limit restricts the outstanding amount of loans or credit lines to the margin available under the own resources ceiling. Borrowings related to loans disbursed under the EFSM are guaranteed by the EU budget. It is not foreseen that the EFSM will engage in new financing programmes or enter into new loan facility agreements.
The BOP facility, a policy-based financial instrument, provides medium-term financial assistance to Member States of the EU that have not adopted the Euro. It enables the granting of loans to Member States who are experiencing, or are seriously threatened with, difficulties in their balance of payments or capital movements. The maximum outstanding amount of loans granted under the instrument is limited to EUR 50 billion. Borrowings related to these BOP loans are guaranteed by the EU budget.
MFA is a policy-based financial instrument of untied and undesignated balance of payment and/or budget support to partner countries currently following an IMF programme. It takes the form of medium/long term loans or grants or an appropriate combination of both and generally complements financing provided in the context of an IMF-supported adjustment and reform program. These loans are guaranteed by the Guarantee Fund for external actions. In 2017, new loan disbursements under MFA totalled EUR 1 013 million, of which EUR 600 million has been provided to Ukraine, EUR 300 million to Tunisia, EUR 100 million to Jordan and EUR 13 million to Georgia. At 31 December 2017, another EUR 460 million relating to a loan facility agreement under MFA were granted to Tunisia (EUR 300 million), to Jordan (EUR 100 million) and to Moldavia (EUR 60 million) but not yet disbursed — see note 4.1.2. The remaining EUR 600 million available under the MFA loan facility agreement to Ukraine has not been requested by Ukraine within the availability period which ended in January 2018.
The European Atomic Energy Community (Euratom, represented by the Commission) lends money to both Member States and non-Member States, and to entities of both, to finance projects relating to energy installations. At 31 December 2017, loans of EUR 250 million were granted for projects in Ukraine but not yet disbursed — see note 4.1.2. Guarantees from third-parties of EUR 250 million (2016: EUR 252 million) have been received covering Euratom loans.
ECSC in Liquidation loans are not loans for financial assistance but promissory notes in order to keep the cash flows in parallel with the borrowings. However, similar to the loans for financial assistance, they were granted on borrowed funds in accordance with articles 54 and 56 of the ECSC Treaty for project financing.
Loans effective interest rates (expressed as a range of interest rates)
|
|
31.12.2017 |
31.12.2016 |
|
Macro Financial Assistance (MFA) |
0 % — 4,54 % |
0 % — 4,54 % |
|
Euratom |
0,08 % — 5,76 % |
0 % — 5,76 % |
|
Balance of Payment (BOP) |
2,88 % — 3,38 % |
2,37 % — 3,37 % |
|
European Financial Stability Mechanism (EFSM) |
0,62 % — 3,75 % |
0,62 % — 3,75 % |
|
ECSC in Liquidation |
5,23 % — 5,81 % |
5,23 % — 5,81 % |
2.4.3.2. Other loans
|
EUR millions |
||
|
|
31.12.2017 |
31.12.2016 |
|
Loans with special conditions |
78 |
93 |
|
ECSC in liquidation housing loans |
4 |
5 |
|
Term deposits between 3 and 12 months |
55 |
245 |
|
Total |
137 |
343 |
|
Non-current |
61 |
77 |
|
Current |
76 |
266 |
Nominal value of other loans at 31 December 2017 total EUR 561 million (2016: EUR 673 million).
Loans with special conditions are granted at preferential rates as part of co-operation with non-Member States.
Impairment on other loans
|
EUR millions |
||||||
|
|
31.12.2016 |
Additions |
Reversals |
Write-off |
Other |
31.12.2017 |
|
Loans with special conditions |
7 |
0 |
— |
— |
— |
8 |
|
Subrogated loans |
332 |
100 |
(0) |
— |
— |
432 |
|
Total |
339 |
101 |
(0) |
— |
— |
440 |
Subrogated loans are defaulted loans which were granted by the EIB and guaranteed by EU budget, for which all rights have been subrogated to the EU following the payment from the Guarantee Fund for external actions. These loans are fully impaired for an amount of EUR 432 million (2016: EUR 332 million). Guarantee calls, which occurred in 2017, were partially covered by financial provisions made in previous years. Under an agreement between the EU and the EIB, recovery proceedings are undertaken by the EIB on behalf of the EU with an aim to recover any sums due.
2.5. PRE-FINANCING
|
EUR millions |
|||
|
|
Note |
31.12.2017 |
31.12.2016 |
|
Non-current pre-financing |
|
|
|
|
Pre-financing |
2.5.1 |
21 939 |
20 219 |
|
Other advances to Member States |
2.5.2 |
3 018 |
1 651 |
|
Contribution to Trust Funds |
|
64 |
31 |
|
|
|
25 022 |
21 901 |
|
Current pre-financing |
|
|
|
|
Pre-financing |
2.5.1 |
22 361 |
21 386 |
|
Other advances to Member States |
2.5.2 |
1 645 |
2 183 |
|
|
|
24 005 |
23 569 |
|
Total |
|
49 027 |
45 470 |
The level of pre-financing amounts in the various programmes must be sufficient to ensure the necessary funding for the beneficiary to start the project, while also safeguarding the financial interests of the EU and taking into consideration legal, operational and cost-effectiveness constraints. All these elements have been given due consideration by the Commission in an effort to improve the follow-up of pre-financing.
2.5.1. Pre-financing
|
EUR millions |
||||||
|
|
Gross amount |
Cleared via cut-off |
Net amount at 31.12.2017 |
Gross amount |
Cleared via cut-off |
Net amount at 31.12.2016 |
|
Shared management |
|
|
|
|
|
|
|
EAFRD & other rural development instruments |
3 735 |
— |
3 735 |
3 955 |
— |
3 955 |
|
ERDF & CF |
20 561 |
(5 678 ) |
14 883 |
19 858 |
(4 727 ) |
15 131 |
|
ESF |
6 792 |
(1 182 ) |
5 610 |
6 477 |
(617) |
5 860 |
|
Other |
5 037 |
(2 267 ) |
2 770 |
4 219 |
(2 393 ) |
1 826 |
|
|
36 125 |
(9 127 ) |
26 998 |
34 509 |
(7 737 ) |
26 772 |
|
Direct Management |
|
|
|
|
|
|
|
Implemented by: |
|
|
|
|
|
|
|
Commission |
12 165 |
(8 331 ) |
3 834 |
12 424 |
(8 843 ) |
3 581 |
|
EU executive agencies |
13 843 |
(8 749 ) |
5 094 |
13 136 |
(8 348 ) |
4 788 |
|
Trust funds |
440 |
(212) |
228 |
142 |
(82) |
60 |
|
|
26 447 |
(17 292 ) |
9 155 |
25 701 |
(17 273 ) |
8 429 |
|
Indirect Management |
|
|
|
|
|
|
|
Implemented by: |
|
|
|
|
|
|
|
Other EU agencies & bodies |
723 |
(148) |
575 |
616 |
(157) |
459 |
|
Third countries |
1 586 |
(956) |
630 |
1 861 |
(1 135 ) |
726 |
|
International organisations |
9 000 |
(5 879 ) |
3 121 |
7 230 |
(4 432 ) |
2 797 |
|
Other entities |
7 753 |
(3 933 ) |
3 820 |
6 498 |
(4 077 ) |
2 422 |
|
|
19 062 |
(10 916 ) |
8 146 |
16 206 |
(9 801 ) |
6 404 |
|
Total |
81 635 |
(37 335 ) |
44 300 |
76 416 |
(34 811 ) |
41 605 |
|
Non-current |
21 939 |
— |
21 939 |
20 219 |
— |
20 219 |
|
Current |
59 696 |
(37 335 ) |
22 361 |
56 197 |
(34 811 ) |
21 386 |
Pre-financing represents money paid out, and thus implementation of payment appropriations. As explained in note 1.5.7, these are advances and so not yet expensed. Thus while pre-financing reduces outstanding RAL (see note 5.1) it represents expenses still to be recognised in the statement of financial performance.
The closure of the programming period 2007-2013 and the gradual set-up of programs under the period 2014-2020 strongly influence the amounts on the balance sheet: pre-financing related to the old programs is decreasing due to the acceptance of costs as programmes are closed, while further pre-financing has been paid out concerning the new programming period.
For shared management this transition between programming periods also explains the movement between current and non-current balances. Concerning the programming period 2014-2020, the initial pre-financing paid is booked as non-current, while the annual pre-financing is booked as current.
The increase of EUR 0,9 billion in other shared management concerns EUSF (European Union Solidarity Fund), mainly to support reconstruction works after the earthquakes in the Italian regions of Abruzzo, Lazio, Marche and Umbria.
For direct management, the pre-financing amounts relate mainly to Horizon 2020 and the Connecting Europe Facility.
The pre-financing under indirect management covers mainly internal policies programmes like Erasmus, Galileo and EGNOS, but also instruments related to external relations like ENI (European Neighbourhood Instrument), DCI (Development Cooperation Instrument) and humanitarian aid.
Guarantees received in respect of pre-financing
These are guarantees that the Commission requests from beneficiaries that are not Member States in certain cases when paying out advance payments (pre-financing). There are two values to disclose for this type of guarantee, the ‘nominal’ and the ‘on-going’ values. For the nominal value, the generating event is linked to the existence of the guarantee. For the on-going value, the guarantee’s generating event is the pre-financing payment and/or subsequent clearings. At 31 December 2017 the nominal value of guarantees received in respect of pre-financing amounted to EUR 620 million while the on-going value of those guarantees was EUR 462 million (2016: EUR 683 million and EUR 496 million respectively).
Certain pre-financing amounts paid out under the 7th Research Framework Programme for research and technological development (FP7) and under Horizon 2020 are effectively covered by a Participants Guarantee Fund (PGF). The PGF is a mutual benefit instrument set up to cover the risks relating to non-payment of amounts by the beneficiaries during the implementation of the indirect actions of FP7 and Horizon 2020. All participants of indirect actions receiving a grant from the EU contribute 5 % of the total amount received to the PGF's capital.
At 31 December 2017 pre-financing amounts covered by the PGF totalled EUR 1,9 billion (2016: EUR 1,8 billion). The EU (represented by the Commission) acts as an executive agent of the participants of the PGF, but the fund is owned by the participants.
At year-end, the PGF had total assets of EUR 1 997 million (2016: EUR 1 951 million). The assets of the PGF also include financial assets that are managed by the Directorate-General for Economic and Financial Affairs of the Commission. As the PGF is a separate entity the assets of the fund are not consolidated in these EU annual accounts.
2.5.2. Other advances to Member States
|
EUR millions |
||
|
|
31.12.2017 |
31.12.2016 |
|
Advances to Member States for financial instruments under shared management |
2 768 |
2 534 |
|
Aid Schemes |
1 895 |
1 300 |
|
Total |
4 663 |
3 834 |
|
Non-current |
3 018 |
1 651 |
|
Current |
1 645 |
2 183 |
Advances to Member States for financial instruments under shared management
Under the framework of the European Structural and Investment Funds (ESIF) programmes, it is possible to make advance payments from the EU budget to Member States so as to allow them to contribute to financial instruments (i.e. loans, equity investments or guarantees). These financial instruments are set up and managed under the responsibility of the Member States, not the Commission. Nevertheless, monies that are unused by these instruments at year-end are the property of the EU (as with all pre-financing) and are thus treated as an asset on the EU’s balance sheet.
2014-2020 Period:
Under cohesion policy the Member States have contributed an amount of EUR 3 714 million, of which it is estimated that EUR 2 760 million was still to be implemented at 31 December 2017. This includes the contribution of the Member States to the SME Initiative, an instrument aimed at stimulating additional lending by the banking sector to SMEs (EUR 966 million paid, out of which EUR 315 million is estimated as not yet implemented).
For rural development, EUR 8 million remained unused at year-end.
2007-2013 Period:
All amounts related to the cohesion policy are considered to have been either implemented or re-allocated to other measures, therefore no assets remain on the balance sheet at 31 December 2017. It should be noted that the actual implementation by the various instruments will be reviewed as part of the closure process of the programmes.
Aid Schemes
Similar to the above, advances paid by the Member States for various aid schemes (state aid, market measures of EAGF or investment measures of EAFRD) that were not used at year-end are recorded as assets on the EU's balance sheet. The Commission has estimated the value of these advances based on information provided by the Member States; the resulting amounts are included under the Aid Schemes sub-heading above.
2014-2020 Period:
The unused amounts at year end were estimated at EUR 680 million for cohesion policy and EUR 904 million for agricultural policy.
2007-2013 Period:
It is estimated that EUR 311 million (2016: EUR 461 million) representing advances paid in the context of the agricultural policy remained unused at the end of 2017.
2.6. EXCHANGE RECEIVABLES AND NON-EXCHANGE RECOVERABLES
|
EUR millions |
|||
|
|
Note |
31.12.2017 |
31.12.2016 |
|
Non-current |
|
|
|
|
Recoverables from non-exchange transactions |
2.6.1 |
594 |
700 |
|
Receivables from exchange transactions |
2.6.2 |
17 |
16 |
|
|
|
611 |
717 |
|
Current |
|
|
|
|
Recoverables from non-exchange transactions |
2.6.1 |
11 065 |
10 347 |
|
Receivables from exchange transactions |
2.6.2 |
689 |
558 |
|
|
|
11 755 |
10 905 |
|
Total |
|
12 366 |
11 621 |
2.6.1. Recoverables from non-exchange transactions
|
EUR millions |
|||
|
|
Note |
31.12.2017 |
31.12.2016 |
|
Non-current |
|
|
|
|
Member States |
2.6.1.1 |
594 |
700 |
|
|
|
594 |
700 |
|
Current |
|
|
|
|
Member States |
2.6.1.1 |
6 190 |
8 162 |
|
Competition fines |
2.6.1.2 |
4 225 |
1 808 |
|
Accrued income and deferred charges |
2.6.1.3 |
570 |
329 |
|
Other recoverables |
|
81 |
47 |
|
|
|
11 065 |
10 347 |
|
Total |
|
11 659 |
11 047 |
2.6.1.1. Recoverables from Member States
|
EUR millions |
||
|
|
31.12.2017 |
31.12.2016 |
|
TOR established in the A account |
3 113 |
3 261 |
|
TOR established in the separate account |
1 617 |
1 437 |
|
Own resources to be received |
46 |
1 764 |
|
Impairment |
(997) |
(753) |
|
Other |
56 |
36 |
|
Own resources recoverables |
3 836 |
5 745 |
|
European Agricultural Guarantee Fund (EAGF) |
2 280 |
2 606 |
|
European Agricultural Fund for Rural Development (EAFRD) |
955 |
924 |
|
Temporary Rural Development Instrument (TRDI) |
16 |
30 |
|
Special Accession Programme for Agriculture and Rural Development (SAPARD) |
136 |
167 |
|
Impairment |
(804) |
(999) |
|
EAGF and rural development recoverables |
2 583 |
2 729 |
|
Pre-financing recovery expected |
182 |
293 |
|
VAT paid and recoverable |
64 |
41 |
|
Other recoverables from Member States |
120 |
55 |
|
Total |
6 784 |
8 863 |
|
Non-current |
594 |
700 |
|
Current |
6 190 |
8 162 |
The non-current amounts due from Member States relate to non-executed conformity clearance decisions for the European Agricultural Guarantee Fund (EAGF) and the European Agricultural Fund for Rural Development (EAFRD) to be implemented in annual instalments and/or deferrals. The amounts under other recoverables also include amounts from fines imposed on Member States for infringements of EU law (EUR 24 million).
Own resources recoverables
Traditional own resources (TOR), composed of customs duties and sugar levies, are collected by Member States on behalf of the Commission. Member States establish TOR and communicate the amounts of the entitlements established to the Commission by means of monthly ‘A account’ statements. Established entitlements that have not been included in the ‘A accounts’, because they have not been recovered by Member States and no security has been provided (or if security has been provided but are anyway contested), are shown in the ‘separate account’. These entitlements are subject to impairment on the basis of information provided every year by the Member States.
On 31 December 2016 there were ratified own resources adjustments related to the new provisions introduced by the Own Resources Decision (ORD) 2014 concerning 2014, 2015 and 2016 and they were receivable on 1 January 2017. The remaining amounts relate to the amending budget no 6/2017 adopted on 30 November 2017. The amounts were to be received on the first working day of January 2018.
On 8 March 2018, the European Commission sent a letter of formal notice (Infringement No 2018/2008) to the United Kingdom because it refuses to make customs duties available to the EU budget, as required by EU law. A 2017 OLAF report found that importers in the United Kingdom evaded a large amount of customs duties by using fictitious and false invoices and incorrect customs value declarations at importation. The Commission calculates that the infringement of EU legislation by the United Kingdom resulted, during the period November 2011 until December 2017, in losses to the EU budget amounting to EUR 2,2 billion (net, i.e. after deducting the collection costs to be retained by the UK from the gross amount of EUR 2,7 billion). Late interest will also be due on this amount. The amounts in question are not included in these 2017 accounts as they will only be recognised once the revenue recognition criteria are met, in accordance with the EU accounting rules.
EAGF and Rural Development recoverables
This item primarily covers the amounts owed by Member States at 31 December 2017, as declared and certified by the Member States at 15 October 2017. An estimation is made for the recoverables arising after this declaration and up to 31 December 2017. The Commission also estimates a write-down for the amounts owed by beneficiaries that are unlikely to be recovered. The fact that such an adjustment is made does not mean that the Commission is waiving future recovery of these amounts. A deduction of 20 % is also included in the adjustment, and corresponds to what Member States are allowed to retain to cover administrative costs.
2.6.1.2. Recoverables from competition fines
|
EUR millions |
||
|
|
31.12.2017 |
31.12.2016 |
|
Recoverable from fines gross amount |
7 679 |
6 510 |
|
Less amounts cashed |
(3 282 ) |
(4 524 ) |
|
Less amounts written down |
(172) |
(178) |
|
Total |
4 225 |
1 808 |
|
Non-current |
— |
— |
|
Current |
4 225 |
1 808 |
The recoverables of EUR 4 225 million refer to competition fines which were not cashed at year end (EUR 4 397 million) less amounts written-down (EUR 172 million). The amounts cashed mainly relate to cash receipts from companies that have nevertheless initiated an appeal or still have the option to appeal against the fine decisions at EU courts. A contingent liability is disclosed for the possibility to pay back these amounts to the companies (see note 4.1.4).
Fined companies who have launched or are planning to launch an appeal have an option to either make provisional payments or to provide bank guarantees to the Commission.
It should be noted that EUR 942 million of the fines not cashed at year end were due for payment after 31 December 2017. For some of the fines not cashed at year end, the Commission has accepted guarantees totalling EUR 3 124 million (2016: EUR 1 012 million). After 31 December 2017, the Commission has accepted additional guarantees of EUR 880 million.
The amounts written down reflect the Commission's case by case assessment on fines amounts not cashed or not covered with a guarantee, which the Commission expects to not recover.
The increase in the competition fines recoverables mainly concerns one significant fine (EUR 2 424 million) where the companies concerned covered the fine with Commission accepted bank guarantees i.e. the fine would not be cashed until the final court settlement.
2.6.1.3. Accrued income and deferred charges
|
EUR millions |
||
|
|
31.12.2017 |
31.12.2016 |
|
Financial corrections |
1 |
9 |
|
Other accrued income |
327 |
64 |
|
Deferred charges relating to non-exchange transactions |
241 |
256 |
|
Total |
570 |
329 |
|
Non-current |
— |
— |
|
Current |
570 |
329 |
The other accrued income includes EUR 271 million that the Commission expects to recover from the Member States in the area of cohesion. The recovery will be made as a result of the examination and acceptance of the annual accounts submitted by the Member States on 15 February 2018. This procedure for the acceptance of Member States' annual accounts has been introduced for the first time in the cohesion area for the programming period 2014-2020.
2.6.2. Receivables from exchange transactions
|
EUR millions |
||
|
|
31.12.2017 |
31.12.2016 |
|
Non-current |
|
|
|
Other receivables |
17 |
16 |
|
|
17 |
16 |
|
Current |
|
|
|
Customers |
241 |
246 |
|
Impairment on receivables from customers |
(141) |
(128) |
|
Deferred charges relating to exchange transactions |
259 |
250 |
|
Other |
331 |
191 |
|
|
689 |
558 |
|
Total |
707 |
574 |
The impairment on receivables from customers disclosed above includes EUR 68 million of impairment determined on an individual basis.
2.7. INVENTORIES
|
EUR millions |
||
|
|
31.12.2017 |
31.12.2016 |
|
Scientific materials |
45 |
54 |
|
Other |
250 |
111 |
|
Total |
295 |
165 |
2.8. CASH AND CASH EQUIVALENTS
|
EUR millions |
|||
|
|
Note |
31.12.2017 |
31.12.2016 |
|
Accounts with Treasuries and Central Banks |
|
20 078 |
24 566 |
|
Current accounts |
|
152 |
127 |
|
Imprest accounts |
|
5 |
5 |
|
Transfers (cash in transit) |
|
0 |
— |
|
Bank accounts for budget implementation |
2.8.1 |
20 236 |
24 698 |
|
Cash belonging to financial instruments |
2.8.2 |
1 608 |
1 390 |
|
Cash relating to fines |
2.8.3 |
1 234 |
1 325 |
|
Cash relating to other institutions, agencies and bodies |
|
999 |
1 006 |
|
Cash relating to trust funds |
|
34 |
167 |
|
Total |
|
24 111 |
28 585 |
2.8.1. Bank accounts for budget implementation and other term deposits
This heading covers the funds which the Commission keeps in its bank accounts in each Member State and EFTA country (treasury or central bank), as well as in commercial bank current accounts, imprest accounts and petty cash. The treasury balance at the end of 2017 is due to the following main elements:
|
— |
As regards own resources, the end of year treasury balance includes a total net amount of EUR 8,9 billion to be returned to Member States in early 2018 as a result of an amending budget adopted late in 2017. |
|
— |
The additional amount of fines imposed by the Commission for breach of competition rules of EUR 0,5 billion definitively cashed late in 2017 is also part of the year-end treasury balance. |
|
— |
The treasury balance also includes assigned revenue payment appropriations of EUR 8,4 billion. |
2.8.2. Cash belonging to financial instruments
Amounts shown under this heading primarily concern cash equivalents managed by fiduciaries on behalf of the Commission for the purpose of implementing particular financial instrument programmes funded by the EU budget (see note 2.4.1). The cash belonging to financial instruments can only be used in the programme concerned.
2.8.3. Cash relating to fines
This is cash received in connection with fines issued by the Commission for which the case is still open. These amounts are kept in specific deposit accounts that are not used for any other activities. Where an appeal has been lodged or when it is unknown if an appeal will be made by the other party, the underlying amount is shown as contingent liability in note 4.1.4.
Since 2010, all new provisionally cashed fines are managed by the Commission in the BUFI fund and invested in financial instruments categorised as available for sale (see note 2.4.1).
LIABILITIES
2.9. PENSION AND OTHER EMPLOYEE BENEFITS
Net employee benefit scheme liability
|
EUR millions |
|||||
|
|
Pension Scheme of European Officials |
Other retirement benefit schemes |
Joint Sickness Insurance Scheme |
31.12.2017 Total |
31.12.2016 Total |
|
Defined Benefit Obligation |
63 951 |
1 854 |
7 756 |
73 560 |
67 664 |
|
Plan assets |
N/A |
(137) |
(301) |
(438) |
(432) |
|
Net liability |
63 951 |
1 717 |
7 455 |
73 122 |
67 231 |
The increase in the total employee benefits liability is primarily due to an increase in the net liability of the Pension Scheme of European Officials. This increase is mainly due to: the fact that additional benefit rights gained by scheme members exceeded benefit payments out of the scheme, updated actuarial assumptions, and a data quality review, partially offset by the increase in the discount rate.
2.9.1. Pension Scheme of European Officials
This defined benefit obligation represents the present value of expected future payments that the EU is required to make so as to settle the pension obligations resulting from employee service in the current and prior periods. The scheme is ongoing, and as such, all payments required to be made from the scheme on an annual basis are included in the EU budget each year.
In accordance with Article 83 of the Staff Regulations, the payment of the benefits provided for in the staff pension scheme constitutes a charge to the EU's budget. The scheme is unfunded, but the Member States guarantee the payment of these benefits collectively. A compulsory pension contribution is deducted from the basic salaries of active members, currently 9,8 %. These contributions are treated as budget revenue of the year and contribute to the funding of EU expenditure in general, see also note 3.6.
The liabilities of the pension scheme were assessed on the basis of the number of staff and retired staff at 31 December 2017 and on the rules of the Staff Regulations applicable at this date. This valuation was carried out in accordance with the methodology of IPSAS 25 (and therefore also EU accounting rule 12). As was already noted in the 2016 annual accounts, the relevant Commission services continued to work during 2017 to strengthen data collection methods and thus the underlying data quality. Improvements have been achieved and are reflected in the total employee benefits liability amount. This work is ongoing.
In 2018 the updated EU accounting rule 12 based on IPSAS 39 will be applicable. The impact of any changes will be thus reflected in the 2018 accounts.
2.9.2. Other retirement benefit schemes
This refers to the liability relating to the pension obligations towards Members and former Members of the Commission, the Court of Justice (and General Court) and the Court of Auditors, the Secretaries General of the Council, the Ombudsman, the European Data Protection Supervisor, and the European Union Civil Service Tribunal. Also included under this heading is a liability relating to the pensions of Members of the European Parliament.
2.9.3. Joint Sickness Insurance Scheme
In addition to the above retirement benefit schemes, a valuation is made for the estimated liability that the EU has regarding the Joint Sickness Insurance Scheme in relation to healthcare costs which must be paid during employees' post-activity periods (net of their contributions). The calculation of this liability, based on EU accounting rule (EAR) 12, takes account of the full active service period. The update of EAR 12 effective from 2018 onwards will reflect IPSAS 39 and may revise this method.
Movement in present value of employee benefits defined benefit obligation
The present value of the defined benefit obligation is the discounted, without deducting any plan assets, expected future payments required to settle the obligation resulting from employee service in the current and prior periods.
An analysis of the current year movement in the defined benefit obligation is shown below:
|
EUR millions |
||||
|
|
Pension Scheme of European Officials |
Other retirement benefit schemes |
Joint Sickness Insurance Scheme |
Total |
|
Present value as at 31.12.2016 |
58 746 |
1 882 |
7 036 |
67 664 |
|
Current Service Cost |
2 637 |
87 |
266 |
2 990 |
|
Interest cost |
1 148 |
29 |
134 |
1 311 |
|
Net Actuarial (gains) and losses |
3 616 |
(86) |
394 |
3 924 |
|
Contributions from members |
— |
— |
21 |
21 |
|
Benefits paid |
(1 417 ) |
(61) |
(94) |
(1 572 ) |
|
Liability increase/(decrease) due to taxes on pensions |
(778) |
1 |
— |
(777) |
|
Present value as at 31.12.2017 |
63 951 |
1 854 |
7 756 |
73 560 |
Current service costs are the increase in the present value of the defined benefit obligation arising from current members' service in the current period.
Interest costs are the increase during the period in the present value of the defined benefit obligation because the benefits are one period closer to settlement.
Net Actuarial gains and losses comprise:
|
— |
Experience adjustments (the effects of differences between the previous actuarial assumptions for 2017 and what has actually occurred in 2017); and |
|
— |
Effects of changes in actuarial assumptions, either financial (such as projected salary increases) or demographic (such as mortality rates). These assumptions are updated regularly to reflect changes in the underlying conditions. |
Benefits (for example, pensions or medical cost re-imbursements) are paid during the year according to the rules of the scheme. These benefits paid lead to a decrease in the defined benefit obligation as they are no longer to be paid in the future.
Actuarial assumptions — employee benefits
The principle actuarial assumptions used in the valuation of the two main employee benefit schemes of the EU are shown below:
|
|
Pension Scheme of European Officials |
Joint Sickness Insurance Scheme |
|
2017 |
|
|
|
Nominal discount rate |
1,9 % |
2,0 % |
|
Expected inflation rate |
1,5 % |
1,6 % |
|
Real discount rate |
0,4 % |
0,4 % |
|
Expected rate of salary increases |
1,8 % |
1,7 % |
|
Medical cost trend rates |
N/A |
3,0 % |
|
Retirement age |
63/64/66 |
63/64/66 |
|
2016 |
|
|
|
Nominal discount rate |
1,7 % |
1,9 % |
|
Expected inflation rate |
1,4 % |
1,5 % |
|
Real discount rate |
0,3 % |
0,4 % |
|
Expected rate of salary increases |
1,2 % |
1,1 % |
|
Medical cost trend rates |
N/A |
3,0 % |
|
Retirement age |
63/64/66 |
63/64/66 |
Mortality rates are based on the EU Civil Servants Life Table — EULT 2018 (2016: International Civil Servants Life Table — ICSLT 2013).
The nominal discount rate is determined as the value of the Euro zero-coupon yield (with a maturity of 20 years as of December 2017 for the Pension Scheme of European Officials (PSEO), and 25 years for the Joint Sickness Insurance Scheme). The inflation rate used is the expected inflation rate over the equivalent period. It must be determined empirically, based on prospective values as expressed by index-linked bonds on the European financial markets. The real discount rate is calculated from the nominal discount rate and the expected long-term inflation rate.
Movement in present value of plan assets
|
EUR millions |
|||
|
|
Other retirement benefit schemes |
Joint Sickness Insurance Scheme |
Total |
|
Present value as at 31.12.2016 |
139 |
293 |
432 |
|
Net movement in plan assets |
(2) |
8 |
6 |
|
Present value as at 31.12.2017 |
137 |
301 |
438 |
5 year trend
|
EUR millions |
|||||
|
|
2013 |
2014 |
2015 |
2016 |
2017 |
|
Employee benefits liability |
46 818 |
58 616 |
63 814 |
67 231 |
73 122 |
The significant increase in the employee benefits liability over the five years can largely be explained by a reduction in the real discount rate used to discount the future cash flows. This reduction is linked to the underlying economic conditions, particularly the fall in interest rates. For the main PSEO scheme, for example, the real discount rate fell from 1,8 % at the end of 2013 to 0,4 % at the end of 2017.
Amounts recognised in the Statement of Financial Performance
|
EUR millions |
||||
|
|
Pension Scheme of European Officials |
Other retirement benefit schemes |
Joint Sickness Insurance Scheme |
Total |
|
2017 |
|
|
|
|
|
Current service cost |
2 360 |
89 |
266 |
2 715 |
|
Interest cost |
1 027 |
29 |
134 |
1 190 |
|
Past service cost |
— |
— |
— |
— |
|
Change in plan assets |
— |
(15) |
(81) |
(96) |
|
Staff and pension costs |
3 387 |
103 |
318 |
3 808 |
|
Actuarial gains and losses |
3 236 |
(86) |
394 |
3 544 |
|
Total recognised |
6 623 |
17 |
712 |
7 353 |
Joint Sickness Insurance Scheme sensitivity
A one percentage point change in assumed medical cost trend rates would have the following effects:
|
EUR millions |
||
|
|
One percentage point increase |
One percentage point decrease |
|
The aggregate of the current service cost and interest cost components of net periodic post-employment medical costs |
166 |
(141) |
|
The accumulated post-employment benefit obligation for medical costs |
2 538 |
(1 867 ) |
2.10. PROVISIONS
|
EUR millions |
|||||||
|
|
Amount at 31.12.2016 |
Additional provisions |
Unused amounts reversed |
Amounts used |
Transfer between categories |
Change in estimation |
Amount at 31.12.2017 |
|
Legal cases: |
|
|
|
|
|
|
|
|
Agriculture |
149 |
49 |
(26) |
(122) |
— |
— |
49 |
|
Cohesion |
217 |
2 |
— |
(198) |
— |
— |
20 |
|
Other |
102 |
21 |
(3) |
(2) |
— |
3 |
120 |
|
Nuclear site dismantlement |
1 113 |
— |
— |
(32) |
— |
853 |
1 934 |
|
Financial |
880 |
378 |
(46) |
(94) |
— |
(3) |
1 115 |
|
Fines |
23 |
7 |
(4) |
— |
— |
— |
27 |
|
Other |
127 |
191 |
(39) |
(8) |
— |
1 |
272 |
|
Total |
2 611 |
648 |
(118) |
(456) |
— |
853 |
3 538 |
|
Non-current |
1 936 |
440 |
(30) |
(128) |
(194) |
856 |
2 880 |
|
Current |
675 |
208 |
(88) |
(328) |
194 |
(3) |
659 |
Provisions are amounts, arising from past events, that will probably have to be paid by the EU budget in the future.
Legal cases
This is the estimate of amounts that will probably have to be paid out after the year-end in relation to a number of on-going legal cases.
Nuclear site dismantlement
In 2017 the basis for the provision was updated as per the ‘JRC Decommissioning & Waste Management Programme Strategy (D&WMP) — Updated in 2017’. The review of the strategy, along with budget and staff needs, has been conducted together with the independent D&WMP Expert Group. It is a follow up of the comments raised by the Review of the JRC D&WM Programme made by external experts in 2012 and the recommendations raised by the 2015 JRC Internal Audit on Decommissioning. It represents the best available estimate of the budget and staff needed to complete the decommissioning of the JRC sites of Ispra, Geel, Karlsruhe and Petten.
In accordance with the EU accounting rules, this provision is indexed for inflation and then discounted to its net present value (using the Euro swap curve). At 31 December 2017, this resulted in a provision of EUR 1 934 million, split between amounts expected to be used in 2018 (EUR 30 million) and afterwards (EUR 1 904 million). The increase of EUR 821 million compared to 31 December 2016 is mainly due to the extended timeframe (currently around 40 years, previously around 20 years).
It must be noted that major uncertainties, inherent to the long term planning of nuclear decommissioning, could affect this estimate which could significantly increase in the future. The main sources of uncertainty are related to the end state of the decommissioned site, nuclear materials, waste management and disposal aspects, incomplete or lacking definition of national regulatory frames, complicated and time consuming licensing process and future developments of the decommissioning industrial market.
Financial provisions
These concern mainly provisions which represent the estimated losses that will be incurred in relation to the guarantees given under different financial instruments, where entrusted entities are empowered to issue guarantees in their own name but on behalf of and at the risk of the EU. The financial risk of the EU linked to the guarantees is capped and financial assets are gradually provisioned to cover for the future guarantee calls. This heading also includes provisions for outstanding loans to Syria issued by the EIB under its external lending mandate and thus guaranteed by the EU via the Guarantee Fund for external actions. Non-current financial provisions are discounted to their net present value.
The increase of the financial provision relates to the increase of the volume of guaranteed operations under H2020 and COSME financial instruments.
2.11. FINANCIAL LIABILITIES
|
EUR millions |
|||
|
|
Note |
31.12.2017 |
31.12.2016 |
|
Non-current financial liabilities |
|
|
|
|
Financial liabilities at amortised cost |
2.11.1 |
50 061 |
55 067 |
|
Financial liabilities at fair value through surplus or deficit |
2.11.2 |
2 |
— |
|
|
|
50 063 |
55 067 |
|
Current financial liabilities |
|
|
|
|
Financial liabilities at amortised cost |
2.11.1 |
6 850 |
2 283 |
|
Financial liabilities at fair value through surplus or deficit |
2.11.2 |
— |
1 |
|
|
|
6 850 |
2 284 |
|
Total |
|
56 913 |
57 351 |
2.11.1. Financial liabilities at amortised cost
|
EUR millions |
|||
|
|
Note |
31.12.2017 |
31.12.2016 |
|
Borrowings for financial assistance |
2.11.1.1 |
54 841 |
55 128 |
|
Other financial liabilities |
2.11.1.2 |
2 070 |
2 222 |
|
Total |
|
56 911 |
57 350 |
|
Non-Current |
|
50 061 |
55 067 |
|
Current |
|
6 850 |
2 283 |
2.11.1.1. Borrowings for financial assistance
|
EUR millions |
||||||
|
|
EFSM |
BOP |
MFA |
Euratom |
ECSC in Liquiddation |
Total |
|
Total at 31.12.2016 |
47 456 |
4 272 |
2 964 |
252 |
184 |
55 128 |
|
New borrowings |
— |
— |
1 013 |
50 |
— |
1 063 |
|
Repayments |
— |
(1 150 ) |
(58) |
(52) |
(76) |
(1 336 ) |
|
Exchange differences |
— |
— |
— |
(1) |
(7) |
(8) |
|
Changes in carrying amounts |
0 |
(8) |
5 |
— |
(4) |
(7) |
|
Total at 31.12.2017 |
47 456 |
3 114 |
3 924 |
250 |
97 |
54 841 |
|
Non-current |
42 300 |
1 700 |
3 846 |
203 |
93 |
48 141 |
|
Current |
5 156 |
1 414 |
78 |
47 |
5 |
6 700 |
Borrowings mainly include debts evidenced by certificates amounting to EUR 54 674 million (2016: EUR 54 951 million). The changes in carrying amount correspond to the change in accrued interests.
Aside from ECSC in liquidation, the repayment of the above borrowings are ultimately guaranteed by the EU budget — see note 4.1.2, and by extension each Member State.
Borrowings effective interest rates (expressed as a range of interest rates)
|
|
31.12.2017 |
31.12.2016 |
|
Macro Financial Assistance (MFA) |
0 % — 4,54 % |
0 % — 4,54 % |
|
Euratom |
0 % — 5,68 % |
0 % — 5,68 % |
|
Balance of Payment (BOP) |
2,88 % — 3,38 % |
2,37 % — 3,37 % |
|
European Financial Stability Mechanism (EFSM) |
0,62 % — 3,75 % |
0,62 % — 3,75 % |
|
ECSC in Liquidation |
6,91 % — 8,97 % |
6,92 % — 9,78 % |
2.11.1.2. Other financial liabilities
|
EUR millions |
||
|
|
31.12.2017 |
31.12.2016 |
|
Non-current |
|
|
|
Finance lease liabilities |
1 456 |
1 545 |
|
Buildings paid for in instalments |
305 |
329 |
|
Other |
159 |
160 |
|
|
1 920 |
2 034 |
|
Current |
|
|
|
Finance lease liabilities |
89 |
84 |
|
Buildings paid for in instalments |
24 |
22 |
|
Fines to be reimbursed |
13 |
25 |
|
Other |
24 |
58 |
|
|
150 |
189 |
|
Total |
2 070 |
2 222 |
Finance lease liabilities
|
EUR millions |
||||
|
Description |
Future amounts to be paid |
|||
|
< 1 year |
1-5 years |
> 5 years |
Total Liability |
|
|
Land and buildings |
85 |
424 |
1 023 |
1 532 |
|
Other tangible assets |
4 |
9 |
— |
13 |
|
Total at 31.12.2017 |
89 |
433 |
1 023 |
1 545 |
|
Interest element |
69 |
249 |
247 |
565 |
|
Total future minimum lease payments at 31.12.2017 |
158 |
682 |
1 271 |
2 111 |
|
Total future minimum lease payments at 31.12.2016 |
156 |
678 |
1 439 |
2 274 |
The lease and building related amounts above will have to be funded by future budgets.
2.11.2. Financial liabilities at fair value through surplus or deficit
|
EUR millions |
||||
|
Type of derivative |
31.12.2017 |
31.12.2016 |
||
|
Notional amount |
Fair value |
Notional amount |
Fair value |
|
|
Foreign currency forward contract |
— |
— |
101 |
1 |
|
FX option (put spread) |
9 |
2 |
— |
— |
|
Total |
9 |
2 |
101 |
1 |
|
Non-Current |
9 |
2 |
— |
— |
|
Current |
— |
— |
101 |
1 |
As at 31 December 2017 the EU holds a derivative financial instrument (Foreign exchange option — put spread type of option) in which it covers the devaluation of the foreign exchange currency (UHA) related to loans given by financial institutions to the SMEs in Ukraine so as to enhance the access to financing, as well as the attractiveness of the loan conditions in Ukraine. Under the terms of the contract, the EU provides its partners with an option to call, for each eligible loan, up to a maximum of 30 %, for an EU contribution in the case of devaluation the ratio UHA/EUR.
At 31 December 2017 all financial liabilities at fair value through surplus or deficit are categorised into level 2 of the fair value hierarchy (valuation based on observable inputs other than quoted prices).
2.11.3. Financial guarantee liabilities
The EFSI guarantee on the debt portfolio disbursed by the EIB under the EFSI Innovation and Infrastructure window (IIW) is classified as a financial guarantee liability. At 31 December 2017 the EFSI financial guarantee liability totals EUR zero, as the revenues to be received under the guarantee exceed expected losses (see note 4.1.1).
2.12. PAYABLES
|
EUR millions |
||||||
|
|
Gross Amount |
Adjustments |
Net Amount at 31.12.2017 |
Gross Amount |
Adjustments |
Net Amount at 31.12.2016 |
|
Cost claims & invoices received from: |
|
|
|
|
|
|
|
Member States: |
|
|
|
|
|
|
|
EAFRD & other rural development instruments |
481 |
— |
481 |
500 |
(34) |
467 |
|
ERDF & CF |
12 602 |
(883) |
11 719 |
10 663 |
(793) |
9 871 |
|
ESF |
4 183 |
(264) |
3 919 |
4 145 |
(95) |
4 050 |
|
Other |
746 |
(280) |
466 |
793 |
(47) |
747 |
|
Private and public entities |
1 563 |
(144) |
1 419 |
1 677 |
(169) |
1 507 |
|
Total cost claims & invoices received |
19 574 |
(1 571 ) |
18 004 |
17 779 |
(1 138 ) |
16 641 |
|
EAGF |
11 534 |
N/A |
11 534 |
12 193 |
N/A |
12 193 |
|
Own Resources Payables |
8 836 |
N/A |
8 836 |
10 441 |
N/A |
10 441 |
|
Sundry Payables |
341 |
N/A |
341 |
364 |
N/A |
364 |
|
Other |
333 |
N/A |
333 |
364 |
N/A |
364 |
|
Total |
40 618 |
(1 571 ) |
39 048 |
41 142 |
(1 138 ) |
40 005 |
Payables include invoices and cost claims received but not yet paid at year end. They are initially recognised at the time of the reception of the invoices / cost claims for the requested amounts. The payables are subsequently adjusted to reflect only the amounts accepted following review of costs, and the amounts estimated to be eligible, following the cut-off procedure. The amounts estimated to be non-eligible are included in the column ‘Adjustments’; the largest amounts concern the structural actions.
In the 2014-2020 programming period, the Common Provisions Regulation (CPR) applicable to the Structural Funds (ERDF and ESF), Cohesion Fund and to the European Maritime and Fisheries Fund (EMFF) foresees that the EU budget is protected by means of a systematic retention of 10 % of the interim payments made. By February following the end of the CPR accounting year (1 July — 30 June), the control cycle is complete both through management verifications by the managing authorities and audits by the audit authorities. The Commission examines the assurance documents and the accounts provided by the relevant authorities in the Member States. The payment / recovery of the final balance is made only after this assessment is finalised and the accounts are accepted. The amount retained according to this provision at end 2017 totalled EUR 3,1 billion. A part of this amount (EUR 0,6 billion) is estimated as being non-eligible on the basis of the information provided by the Member States in their accounts and is also included in the column ‘Adjustments’.
The final component of the adjustments to the payables is represented by the amounts corresponding to other advances to Member States (see note 2.5.2) still to pay at year end (EUR 0,3 billion).
Concerning cohesion policy (ERDF, CF, ESF) the claims related to the period 2007-2013 remain significant at EUR 10 billion, as the Commission is checking the final cost claims submitted by the Member States. At the same time, claims related to period 2014-2020 increased to EUR 5 billion following progress in the implementation of the programmes.
Requests for pre-financing
In addition to the above amounts, EUR 0,5 billion of requests for pre-financing have been received and were not yet paid at year-end. According to the EU accounting rules, these amounts are not booked as payables.
Own Resources Payables
Own resources payables refer to Member States contributions to the EU budget to be reimbursed at year-end following the amending budget no 6/2017. Amending budgets are implemented according to Article 10(3) of Regulation no 609/2014. The significant amount on 31 December 2017 is due to the adoption of amending budget no 6/2017 on 30 November 2017. According to this legal provision, the resulting amounts were returned to the Member States on the first working day of January 2018.
2.13. ACCRUED CHARGES AND DEFERRED INCOME
|
EUR millions |
||
|
|
31.12.2017 |
31.12.2016 |
|
Accrued charges |
63 588 |
66 800 |
|
Deferred income |
111 |
638 |
|
Other |
203 |
143 |
|
Total |
63 902 |
67 580 |
The split of accrued charges is as follows:
|
EUR millions |
||
|
|
31.12.2017 |
31.12.2016 |
|
EAGF |
33 303 |
33 033 |
|
EAFRD and other rural development instruments |
17 464 |
17 024 |
|
ERDF and CF |
4 249 |
7 157 |
|
ESF |
2 870 |
3 473 |
|
Other |
5 702 |
6 112 |
|
Total |
63 588 |
66 800 |
The biggest movement concerns cohesion policy, a decrease of EUR 2,9 billion for ERDF & CF and EUR 0,6 billion for ESF. This is due to the decreasing accruals for the former programming period 2007-2013 as the programmes have entered the closure phase.
NET ASSETS
2.14. RESERVES
|
EUR millions |
|||
|
|
Note |
31.12.2017 |
31.12.2016 |
|
Fair value reserve |
2.14.1 |
278 |
325 |
|
Guarantee Fund reserve |
2.14.2 |
2 663 |
2 643 |
|
Other reserves |
2.14.3 |
1 935 |
1 873 |
|
Total |
|
4 876 |
4 841 |
2.14.1. Fair value reserve
In accordance with the EU accounting rules, the adjustment to fair value of available for sale financial assets is accounted for through the fair value reserve.
Movements of the fair value reserve during the period
|
EUR millions |
||
|
|
2017 |
2016 |
|
Included in fair value reserve |
(8) |
34 |
|
Included in the statement of financial performance |
6 |
— |
|
Total |
(2) |
34 |
2.14.2. Guarantee Fund reserve
This reserve reflects the 9 % target amount of the outstanding amounts guaranteed by the EU budget under the EIB external lending mandate, that is required to be kept as assets in the Guarantee Fund for external actions (see note 2.4.1).
2.14.3. Other reserves
The amount relates primarily to the reserves of the ECSC in liquidation (EUR 1 515 million) for the assets of the Research Fund for Coal and Steel, which were created in the context of the winding-up of the ECSC.
2.15. AMOUNTS TO BE CALLED FROM MEMBER STATES
|
EUR millions |
|
|
Amounts to be called from Member States at 31.12.2016 |
76 881 |
|
Return of 2016 budget surplus to Member States |
6 405 |
|
Movement in Guarantee Fund reserve |
20 |
|
Other reserve movements |
11 |
|
Economic result of the year |
(8 082 ) |
|
Total amounts to be called from Member States at 31.12.2017 |
75 234 |
This amount represents that part of the expenses incurred by the EU up to 31 December that must be funded by future budgets. Many expenses are recognised under accrual accounting rules in the year N although they may be actually paid in year N+1 (or later) and therefore funded using the budget of year N+1 (or later). The inclusion in the accounts of these liabilities coupled with the fact that the corresponding amounts are financed from future budgets, results in liabilities greatly exceeding assets at the year-end. The most significant amounts to be highlighted concern the EAGF activities and employee benefit liabilities.
It should also be noted that the above has no effect on the budget result — budget revenue should always equal or exceed budget expenditure and any excess of revenue is returned to Member States.
3. NOTES TO THE STATEMENT OF FINANCIAL PERFORMANCE
REVENUE
REVENUE FROM NON-EXCHANGE TRANSACTIONS: OWN RESOURCES
3.1. GNI RESOURCES
Own resources revenue is the primary element of the EU's operating revenue. GNI (gross national income) revenue amounts to EUR 78 620 million for 2017 (2016: EUR 95 578 million) and is the most significant of the three categories of own resources. A uniform percentage is levied on the GNI of each Member State. The GNI revenue balances revenue and expenditure i.e. funds the part of the budget that is not covered by other sources of income. The decrease of GNI revenue is explained mainly by the substantial reduction of payment appropriations and the relatively high budget surplus from the previous financial year (EUR 6 405 million). Both elements reduced the requested Member States' GNI contribution in 2017, as this contribution is a balancing figure.
3.2. TRADITIONAL OWN RESOURCES
|
EUR millions |
||
|
|
2017 |
2016 |
|
Customs duties |
20 475 |
20 301 |
|
Sugar levies |
45 |
138 |
|
Total |
20 520 |
20 439 |
Traditional own resources comprise custom duties and sugar levies. Member States retain, by way of collection costs, 20 % of traditional own resources, and the above amounts are shown net of this deduction.
3.3. VAT RESOURCES
The VAT resource is levied on Member States’ VAT bases, which are notionally harmonised in accordance with EU rules for this purpose. The VAT contribution is calculated applying a uniform rate of call of 0,3 % to the base of each Member State. For the period 2014-2020, the Council Decision 2014/335/EU, Euratom, foresees a reduced rate of call of 0,15 % for Germany, the Netherlands and Sweden.
REVENUE FROM NON-EXCHANGE TRANSACTIONS: TRANSFERS
3.4. FINES
These revenues of EUR 4 664 million (2016: EUR 3 858 million) relate to fines the Commission has imposed on companies for breaches of EU competition rules and to fines the Commission has imposed on Member States for infringements of EU law. The Commission recognises revenues from fines when it adopts the decision to impose a fine and it officially notifies the addressee. The fine amounts in 2017 are mainly competition fines (EUR 4 568 million). The biggest cases concern breaches of EU antitrust rules, i.e. a fine imposed on Alphabet Inc. and Google Inc. for abusing market dominance as a search engine (EUR 2 424 million), a fine on Scania for participating in a cartel in the trucks sector (EUR 881 million) and fines on 11 air cargo carriers for a price fixing cartel (EUR 776 million).
3.5. RECOVERY OF EXPENSES
|
EUR millions |
||
|
|
2017 |
2016 |
|
Shared management |
1 775 |
1 876 |
|
Direct management |
81 |
56 |
|
Indirect management |
23 |
15 |
|
Total |
1 879 |
1 947 |
This heading mainly represents the recovery orders issued by the Commission that are cashed or offset against (i.e. deducted from) subsequent payments recorded in the Commission's accounting system, made so as to recover expenditure previously paid out from the general budget. Recoveries are based on controls, audits or eligibility analysis and therefore, these actions are an important consideration in implementing the EU budget. These operations protect the EU budget from expenditure incurred in breach of law and are particularly important since the audit results of the European Court of Auditors have found a material level of error in payments made from the EU budget — see the Court's annual report including the statement of assurance on the legality and regularity of the underlying transactions.
Recovery orders issued by Member States to beneficiaries of EAGF expenditure, as well as the variation of accrued income estimations from the previous year-end to the current, are also included.
The amounts included in the above table represent revenue incurred through the issuance of recovery orders. For this reason, these figures cannot and do not show the full extent of the measures taken to protect the EU budget, particularly for cohesion policy where specific mechanisms are in place to ensure the correction of ineligible expenditure, most of which do not involve the issuance of a recovery order. Not included are amounts recovered through offsetting with expenses, amounts recovered by way of withdrawals and recoveries of pre-financing amounts.
Shared management recoveries make up the bulk of the total:
Agriculture: EAGF and rural development
In the framework of the EAGF and the EAFRD, amounts accounted for as revenue of the year under this heading are financial corrections of the year and reimbursements declared by Member States and recovered during the year, as well as the net increase in the outstanding amounts declared by Member States to be recovered at year-end concerning fraud and irregularities.
Cohesion policy
The main amounts related to cohesion policy include recovery orders issued by the Commission to recover undue expenditure made in previous years and deductions from expenditure less the decrease in accrued income at year-end.
3.6. OTHER REVENUE FROM NON-EXCHANGE TRANSACTIONS
|
EUR millions |
||
|
|
2017 |
2016 |
|
Budgetary adjustments |
5 806 |
1 956 |
|
Contributions from third countries |
1 269 |
953 |
|
Staff taxes and contributions |
1 218 |
1 189 |
|
Contributions from Member States for external aid |
988 |
732 |
|
Transfer of assets |
208 |
147 |
|
Adjustment of provisions |
29 |
14 |
|
Agricultural levies |
4 |
5 |
|
Other |
854 |
744 |
|
Total |
10 376 |
5 740 |
The budgetary adjustments include the budget surplus from 2016 (EUR 6 405 million). The budget surplus of the previous year is brought forward to the next year and constitutes a revenue for 2017.
Contributions from third countries are contributions from EFTA countries and accession countries.
Staff taxes and contributions revenue arises primarily from deductions from staff salaries and is made up of two significant amounts — staff pension contributions and taxes on income.
Contributions from Member States for external aid are mainly the amounts received to set up the Facility for Refugees in Turkey.
Transfer of assets revenue relates mainly to the transfer of satellites under the Copernicus programme (former GMES programme) from the European Space Agency (ESA) to the Commission (see note 2.2). This transfer is a non-exchange transaction according to the EU accounting rules and will occur in future periods for the remaining Copernicus satellites currently under construction.
Agricultural levies concern milk levies which are a market management tool aimed at penalising milk producers who exceed their reference quantities. As it is not linked to prior payments by the Commission, it is in practice considered as revenue for a specific purpose.
The 2017 amount of other revenue from non-exchange transactions includes an amount of EUR 300 million called from the EDF, representing its contribution to the EFSD guarantee fund which will be established in 2018 under the Regulation (EU) 2017/1601.
REVENUE FROM EXCHANGE TRANSACTIONS
3.7. FINANCIAL REVENUE
|
EUR millions |
||
|
|
2017 |
2016 |
|
Interest on: |
|
|
|
Loans |
1 379 |
1 446 |
|
Late payments |
217 |
108 |
|
Other |
41 |
38 |
|
Premium on financial guarantee liability (EFSI) |
61 |
16 |
|
Financial revenue from financial assets or liabilities at fair value through surplus or deficit |
57 |
0 |
|
Realised gains on available for sale financial assets |
38 |
35 |
|
Dividends |
23 |
13 |
|
Other |
28 |
112 |
|
Total |
1 845 |
1 769 |
Interest revenue on loans relate mainly to loans granted for financial assistance (see note 2.4.3).
Interest revenue on late payments stem mainly from fines and own resources contributions due and not paid on time.
3.8. OTHER REVENUE FROM EXCHANGE TRANSACTIONS
|
EUR millions |
||
|
|
2017 |
2016 |
|
Fee revenue for rendering of services (agencies) |
557 |
267 |
|
Foreign exchange gains |
281 |
331 |
|
Fee and premium revenue related to financial instruments |
51 |
48 |
|
Property, plant and equipment related revenue |
43 |
17 |
|
Sales of goods |
42 |
46 |
|
Share of net result of EIF |
21 |
2 |
|
Other |
338 |
288 |
|
Total |
1 332 |
998 |
Fee revenue for rendering of services mainly include marketing authorisation fees charged by the European Medicines Agency and trade mark fees collected by the European Union Intellectual Property Office.
EXPENSES
3.9. SHARED MANAGEMENT
|
EUR millions |
||
|
Implemented by Member States |
2017 |
2016 |
|
European Agricultural Guarantee Fund |
44 289 |
44 152 |
|
European Agricultural Fund for Rural Development and other rural development instruments |
11 359 |
12 604 |
|
European Regional Development Fund and Cohesion Fund |
17 650 |
35 045 |
|
European Social Fund |
7 353 |
9 366 |
|
Other |
1 253 |
1 606 |
|
Total |
81 905 |
102 772 |
The transition from the former programming period 2007-2013 to the current programming period 2014-2020 explains the reduction of expenses of EUR 17,4 billion for the cohesion area: the costs declared for the period 2007-2013 decreased substantially (EUR 28,6 billion) as the implementation has finished and the programmes have entered the closure phase. At the same time the costs declared for the period 2014-2020 increased but only by EUR 11,2 billion as the programmes are now advancing.
Other expenses mainly includes: Asylum and Migration (EUR 485 million), Fund for European Aid to the Most Deprived (EUR 378 million) and Internal Security (EUR 226 million).
3.10. DIRECT MANAGEMENT
|
EUR millions |
||
|
|
2017 |
2016 |
|
Implemented by the Commission |
8 831 |
9 254 |
|
Implemented by EU Executive Agencies |
6 699 |
6 259 |
|
Implemented by Trust funds |
208 |
97 |
|
Total |
15 738 |
15 610 |
These amounts mainly concern the implementation of Research Policy (EUR 7,2 billion), Networks Programmes (EUR 1,3 billion), Development Co-operation Instruments (EUR 1,3 billion), European Neighbourhood Policy (EUR 1,2 billion) and Humanitarian Aid (EUR 0,7 billion).
3.11. INDIRECT MANAGEMENT
|
EUR millions |
||
|
|
2017 |
2016 |
|
Implemented by other EU agencies & bodies |
2 667 |
2 547 |
|
Implemented by third countries |
1 101 |
876 |
|
Implemented by international organisations |
3 014 |
2 382 |
|
Implemented by other entities |
1 478 |
2 035 |
|
Total |
8 260 |
7 840 |
Of the indirect management expenses, EUR 4,2 billion relates to external actions (mainly the areas of pre-accession, humanitarian aid, international co-operation and neighbourhood). A further EUR 3,6 billion is related to increasing Europe's competitiveness (in areas such as research, satellite navigation systems and education).
3.12. STAFF AND PENSION COSTS
|
EUR millions |
||
|
|
2017 |
2016 |
|
Staff costs |
6 193 |
6 074 |
|
Pension costs |
3 808 |
3 702 |
|
Total |
10 002 |
9 776 |
Pension costs represent elements of the movements that have arisen following the actuarial valuation of the employee benefits liabilities other than actuarial assumptions. They do not therefore represent actual pension payments of the year, which are significantly lower.
3.13. CHANGES IN EMPLOYEE BENEFITS ACTUARIAL ASSUMPTIONS
The actuarial loss of net EUR 3 544 million shown under this heading relates to the employee benefits liabilities recognised on the balance sheet (see note 2.9).
3.14. FINANCE COSTS
|
EUR millions |
||
|
|
2017 |
2016 |
|
Interest expenses: |
|
|
|
Borrowings |
1 373 |
1 440 |
|
Other |
22 |
57 |
|
Impairment losses on loans and receivables |
324 |
184 |
|
Finance leases |
81 |
67 |
|
Impairment losses on available for sale financial assets |
39 |
40 |
|
Loss on financial assets or liabilities at fair value through surplus or deficit |
12 |
1 |
|
Realised loss on available for sale financial assets |
2 |
0 |
|
Other |
42 |
116 |
|
Total |
1 896 |
1 904 |
The amount of interest expense on borrowings corresponds mainly to interest income on loans for financial assistance (back-to-back transactions).
The impairment losses on loans and receivables includes an amount of EUR 243 million related to the traditional own resources (see note 2.6.1.1).
3.15. OTHER EXPENSES
|
EUR millions |
||
|
|
2017 |
2016 |
|
Administrative and IT expenses |
2 521 |
2 455 |
|
Property, plant and equipment related expenses |
1 423 |
1 021 |
|
Adjustment of provisions |
1 377 |
685 |
|
Foreign exchange losses |
446 |
505 |
|
Operating lease expenses |
414 |
383 |
|
Reduction of fines by the Court of Justice |
67 |
18 |
|
Other |
509 |
419 |
|
Total |
6 756 |
5 486 |
The increase in expenses related to provisions is due mainly to the change in estimation for the nuclear site dismantlement provision (see note 2.10).
Expenses relating to research and development are included in administrative and IT expenses and are as follows:
|
EUR millions |
||
|
|
2017 |
2016 |
|
Research costs |
376 |
344 |
|
Non-capitalised development costs |
81 |
88 |
|
Total |
456 |
431 |
3.16. SEGMENT REPORTING BY MULTIANNUAL FINANCIAL FRAMEWORK HEADING (MFF)
|
EUR millions |
|||||||
|
|
Smart and inclusive growth |
Sustainable growth |
Security and citizenship |
Global Europe |
Administration |
Not assigned to MFF heading (3) |
Total |
|
GNI resources |
— |
— |
— |
— |
— |
78 620 |
78 620 |
|
Traditional own resources |
— |
— |
— |
— |
— |
20 520 |
20 520 |
|
VAT |
— |
— |
— |
— |
— |
16 947 |
16 947 |
|
Fines |
— |
— |
— |
— |
— |
4 664 |
4 664 |
|
Recovery of expenses |
357 |
1 488 |
5 |
28 |
0 |
0 |
1 879 |
|
Other |
1 172 |
244 |
43 |
414 |
4 827 |
3 676 |
10 376 |
|
Revenue from non-exchange transactions |
1 529 |
1 732 |
48 |
443 |
4 827 |
124 428 |
133 006 |
|
Financial revenue |
147 |
(4) |
0 |
17 |
1 |
1 684 |
1 845 |
|
Other |
196 |
(12) |
(6) |
10 |
338 |
805 |
1 332 |
|
Revenue from exchange transactions |
343 |
(15) |
(6) |
27 |
338 |
2 489 |
3 177 |
|
Total revenue |
1 873 |
1 716 |
42 |
470 |
5 166 |
126 917 |
136 183 |
|
Expenses implemented by Member States: |
|
|
|
|
|
|
|
|
EAGF |
— |
(44 289 ) |
— |
— |
— |
— |
(44 289 ) |
|
EAFRD & other rural development instruments |
— |
(11 359 ) |
— |
— |
— |
— |
(11 359 ) |
|
ERDF & CF |
(17 650 ) |
— |
— |
— |
— |
— |
(17 650 ) |
|
ESF |
(7 353 ) |
— |
— |
— |
— |
— |
(7 353 ) |
|
Other |
(439) |
74 |
(897) |
9 |
— |
0 |
(1 253 ) |
|
Implemented by the EC, executive agencies and trust funds |
(9 809 ) |
(525) |
(1 080 ) |
(4 337 ) |
(12) |
25 |
(15 738 ) |
|
Implemented by other EU agencies and bodies |
(2 530 ) |
(121) |
(754) |
(24) |
— |
762 |
(2 667 ) |
|
Implemented by third countries and int. org. |
(434) |
0 |
(177) |
(3 504 ) |
— |
— |
(4 115 ) |
|
Implemented by other entities |
(819) |
15 |
1 |
(675) |
(0) |
— |
(1 478 ) |
|
Staff and Pension costs |
(1 638 ) |
(360) |
(426) |
(615) |
(5 977 ) |
(986) |
(10 002 ) |
|
Changes in employee benefits actuarial assumptions |
— |
— |
— |
— |
(3 544 ) |
— |
(3 544 ) |
|
Finance costs |
(88) |
(16) |
(0) |
(18) |
(106) |
(1 668 ) |
(1 896 ) |
|
Other expenses |
(2 453 ) |
(88) |
(196) |
(113) |
(3 386 ) |
(521) |
(6 756 ) |
|
Total expenses |
(43 213 ) |
(56 669 ) |
(3 528 ) |
(9 277 ) |
(13 025 ) |
(2 389 ) |
(128 101 ) |
|
Economic result of the year |
(41 341 ) |
(54 953 ) |
(3 486 ) |
(8 807 ) |
(7 859 ) |
124 528 |
8 082 |
The display of revenue and expenses by MFF heading is based on estimation as not all commitments are linked to an MFF heading.
4. CONTINGENT LIABILITIES AND ASSETS
4.1. CONTINGENT LIABILITIES
Contingent liabilities are possible future payment obligations for the EU that may arise due to past events or legally binding commitments taken but which will depend on future events not wholly under the control of the EU. They relate mainly to financial guarantees given (on loans and financial assistance programmes) and to legal risks. All contingent liabilities, except those relating to fines and guarantees covered by funds (see note 2.4.1), would be financed, should they fall due, by the EU budget (and thus the EU Member States) in the years to come.
4.1.1. Budgetary guarantees
|
EUR millions |
||||||
|
|
31.12.2017 |
31.12.2016 |
||||
|
Ceiling |
Signed |
Disbursed |
Ceiling |
Signed |
Disbursed |
|
|
EIB external lending mandate guarantees |
37 479 |
28 950 |
19 972 |
40 645 |
30 161 |
21 145 |
|
EFSI guarantee |
16 000 |
13 473 |
10 128 |
16 000 |
11 245 |
4 392 |
|
Total |
53 479 |
42 423 |
30 100 |
56 645 |
41 406 |
25 537 |
The above table shows the extent of the exposure of the EU budget to possible future payments linked to guarantees given to the EIB group. Disbursed amounts represent the amounts already given to final beneficiaries, while signed amounts include these disbursed monies plus agreements already signed with beneficiaries but not yet disbursed. The ceiling represents the total guarantee that the EU budget, and thus its Member States, have committed to cover.
EIB external lending mandate guarantees
The EU budget guarantees loans signed and granted by the EIB from the EIB's own resources to third countries. At 31 December 2017 the amount of loans outstanding and covered by the EU guarantee totalled EUR 19 972 million (2016: 21 145 million). The EU budget guarantees:
|
— |
EUR 18 583 million (2016: EUR 19 481 million) via the Guarantee Fund for external actions (see note 2.4.1), and |
|
— |
EUR 1 389 million (2016: EUR 1 664 million) directly for loans granted to Member States before accession. |
In addition to the EUR 19 972 million disclosed above as disbursed, the EU guarantees a further EUR 258 million of outstanding loans to Syria for which provisions have been made.
The EU external lending mandate guarantee relating to loans granted by the EIB is limited to 65 % of the outstanding balances for agreements signed after 2007 (mandates 2007-2013 and 2014-2020). For agreements before 2007 the EU guarantee is limited to a percentage of the ceiling of the credit lines authorised, in most cases 65 % but also 70 %, 75 % or 100 %. Where the ceiling is not reached, the EU guarantee covers the full amount.
To disclose the maximum exposure faced by the EU at 31 December 2017, however, one must also include loans authorised to be signed but not yet signed (EUR 8 529 million) and loans signed but not disbursed (EUR 8 978 million).
In March 2018 Decision (EU) 2018/412 was adopted by the European Parliament and the Council allowing for an increase of the ceiling of the EIB financing operations under the EU guarantee. This will be reflected in an updated guarantee agreement with the EIB and when amended, the EU maximum exposure would increase by EUR 3,4 billion.
European Fund for Strategic Investments (EFSI) guarantee
EFSI is an initiative that aims to increase the risk bearing capacity of the EIB Group by enabling the EIB to extend its investments in the EU. The objective of EFSI is to support additional investments in the EU and access to finance for small companies. EFSI is not a separate legal entity or an investment fund in the strict sense. The EFSI risk reserve offers protection to the EIB against potential losses for underlying operations. It is composed of an allocation of EUR 5 billion of EIB's own capital and an EU budget guarantee of up to EUR 16 billion (‘EFSI EU guarantee’). The EFSI EU guarantee is provided to the EIB under an agreement between the EU and the EIB, hereafter referred to as ‘EFSI Agreement’.
The amounts related to the EFSI contingent liabilities, including the guarantee ceiling, as disclosed in this note are based on the EFSI Agreement in force at 31 December 2017. However, it should be noted that the amended EFSI Regulation (Regulation EU 2017/2396), as adopted in December 2017, enabled an increase of the EFSI EU Guarantee up to EUR 26 billion. The EFSI Agreement has been amended accordingly in March 2018.
The EFSI operations are conducted within two windows: the Infrastructure and Innovation Window (IIW) implemented by the EIB (EFSI EU guarantee of EUR 13 billion) and the SME Window (SMEW) implemented by the EIF (EFSI EU guarantee of EUR 3 billion), both of which have a debt portfolio and an equity portfolio. The EIF acts under an agreement with the EIB on the basis of an EIB guarantee which itself is counter-guaranteed by the EFSI EU Guarantee under the EFSI Agreement.
For the purpose of the use of the EFSI EU guarantee the implementation of EFSI is supervised by a steering board acting by consensus and composed of four members, of which three are appointed by the Commission and one by the EIB. Under the amended EFSI Regulation, the EFSI steering board will be composed of five members, including one non-voting member appointed by the European Parliament, while the decisions shall be taken by consensus, and — if the consensus cannot be achieved — by the unanimous vote among its voting members. The EFSI steering board does not take investment decisions.
The EU and the EIB have distinct roles within EFSI. EFSI is established within the EIB who finances the operations (debt and equity investments) and, to do this, borrows the necessary funds on the capital markets. Regarding the IIW, the EIB takes the investment decisions independently and manages the operations in accordance with its rules and procedures. The same applies to the SMEW operations managed by the EIF.
In order to ensure that investments made under EFSI remain focused on the specific objective of addressing the market failures which hinder investment in the EU and that they are eligible for the protection of the EU guarantee, a dedicated governance structure has been put in place. The Investment Committee of independent experts examines each project proposed by the EIB under the IIW regarding its eligibility for the EU guarantee coverage. Once an operation is confirmed to be eligible as EFSI guaranteed operation, the decision to continue with the project and its management is then subject to the normal EIB project cycle and governance process. Regarding SMEW, the role of the Investment Committee is limited to the consultation on the description of the SMEW Products, which are being approved by the EFSI Steering Board and EFSI Managing Director.
The role of the EU relates to the provision of the EU budget guarantee for part of the potential losses that the EIB may suffer from its investments in debt and equity instruments. Consequently, the EU does not intervene in the selection and management of EFSI operations, does not invest money in the EFSI operations and is not a direct contractual party to the underlying instruments. As the control criteria and accounting requirements for consolidation under the EU accounting rules (and IPSAS) are not met, the related guaranteed assets are not accounted for in the consolidated annual accounts of the EU.
The EU guarantee granted to the EIB Group under EFSI is, in accordance with the EU accounting rules, accounted for as a financial guarantee liability in respect of the IIW debt portfolio, as a financial provision for the SMEW debt portfolio and as a derivative (financial asset or liability at fair value through surplus or deficit) for both equity portfolios. In addition, a contingent liability related to the EFSI guarantee given is disclosed in this note.
Under the EFSI IIW debt portfolio, the EU guarantee covers the first loss piece of a portfolio of financing operations entered into by the EIB, which are mainly standard loans and guarantees. The EU guarantee is called when the debtor fails to make a payment when due or in the case of a debt restructuring. The EU guarantee is remunerated in proportion to the risk taken by the EU and this happens in the form of a distribution, between the EIB and the EU, of the risk-related revenues received by EIB from the guaranteed operations. The EU revenues should first cover the losses incurred on the guaranteed operations. The EU guarantee is therefore accounted for as financial guarantee liability and measured, at initial recognition, at fair value, being the net present value of the premiums receivable (the EU revenues). At subsequent balance sheet dates, the financial guarantee liability is measured at the higher of the expected losses and the amount initially recognised less, when appropriate, the accumulated amortisation of the revenue. The financial guarantee liability is presented net of the EU revenues still to be received — zero at 31 December 2017 — see note 2.11.3.
Under the EFSI IIW equity portfolio, which consists of direct equity or quasi equity participations or subordinated loans, the EIB invests pari-passu at its own risk and also at the risk of the EU. Consequently, the EU guarantee covers — for the part of the equity investments guaranteed by the EU — the negative value adjustments (unrealised losses) at each balance sheet date, the realised losses at dis-investment and the EIB funding costs. In cases where the value of an investment, which was previously subject to a negative value adjustment, increases at subsequent reporting dates, the amount up to the original cost of the investment is reimbursed by the EIB to the EU. At the time of the dis-investment, the EU is also entitled to gains on the investment exceeding the original cost. The EU guarantee is remunerated by revenues received by the EIB from the guaranteed operations, including interests, dividends and realised gains. The settlement between the EU and the EIB happens annually net of losses and revenues.
Under EFSI SMEW equity portfolio, the EU guarantees equity investments in venture capital and private equity funds, funded by the EIB and originated and managed by the EIF. The EU guarantee is provided on a portfolio basis for two portfolios: sub-window 1 and sub-window 2. The EFSI guarantee is called to cover impairment and realised losses from the guaranteed investments and the EIB funding costs. The EU is entitled to the remuneration for the risk taken in form of dividends and realised gains from the guaranteed equity operations. Under the sub-window 2, the EU Horizon 2020 programme also partially invests in the same equity portfolio (the H2020 investment funded by the EU is accounted for as an AFS financial asset in the EU accounts) and bears first losses from the investments, while further losses are covered by the EU Guarantee and the EIF.
The EFSI guarantee on the EFSI equity portfolio is classified as a derivative financial instrument and accounted for as a financial asset or financial liability at fair value through surplus or deficit. At 31 December 2017 the fair value of the EFSI EU guarantee on the EFSI equity portfolio amounted to EUR 16 million — see note 2.4.2.
The contingent liability above includes operations of the COSME, H2020, CCS and EaSI programmes for the part covered by the EFSI EU guarantee under SMEW debt portfolio.
EU guarantee payments would be made by the EFSI Guarantee Fund — see note 2.4.1. At the end of 2017 the assets of the guarantee fund totalled EUR 3,5 billion (2016: EUR 1 billion), while another EUR 2,6 billion (2016: EUR 2,4 billion) have been committed but not yet paid and is included in the amount disclosed as RAL in note 5.1.
4.1.2. Guarantees relating to financial assistance (borrowing and lending activities)
|
EUR millions |
||||||
|
|
31.12.2017 |
31.12.2016 |
||||
|
Drawn |
Undrawn |
Total |
Drawn |
Undrawn |
Total |
|
|
EFSM |
47 456 |
— |
47 456 |
47 456 |
— |
47 456 |
|
BOP |
3 114 |
— |
3 114 |
4 272 |
— |
4 272 |
|
MFA |
3 924 |
460 |
4 384 |
2 964 |
1 313 |
4 277 |
|
Euratom |
250 |
250 |
500 |
252 |
300 |
552 |
|
Total |
54 744 |
710 |
55 454 |
54 944 |
1 613 |
56 557 |
The EU budget guarantees the borrowings of the Commission taken to finance lending to Member and non-Member States in the back-to-back transactions. These borrowings are already recognised as liabilities on the EU balance sheet — see note 2.11.1. However, should there be a default on the back-to-back-loans given out with these borrowings, the EU budget, based on Article 14 of Council Regulation 609/2014, would have to bear the full cost of the amount defaulted:
|
— |
Borrowings related to loans disbursed under the EFSM are guaranteed solely by the EU budget; |
|
— |
Borrowings related to BOP loans are guaranteed solely by the EU budget; |
|
— |
MFA loans are firstly guaranteed by the Guarantee Fund for external actions (see note 2.4.1) and then by the EU budget; and |
|
— |
Guarantees from third-parties are the first cover for the entire amounts of the outstanding Euratom loans. The Guarantee Fund would cover the external lending amounts should the third party guarantees not provide for them. |
ECSC in Liquidation loans granted on borrowed funds are not covered by an EU budgetary guarantee. Instead, they are covered by financial assets of the ECSC in Liquidation — see note 2.4.1.
4.1.3. Guarantees given for EU financial instruments
|
EUR millions |
||
|
|
31.12.2017 |
31.12.2016 |
|
Horizon 2020 |
1 297 |
921 |
|
Risk Sharing Finance Facility |
654 |
711 |
|
Connecting Europe Facility |
490 |
465 |
|
Other |
32 |
3 |
|
Total |
2 473 |
2 101 |
As mentioned in Article 140(3) FR, the budgetary expenditure linked to a financial instrument and the financial liability of the EU shall in no case exceed the amount of the relevant budgetary commitment made for it, thus excluding contingent liabilities for the budget. In practise it means that these liabilities have a counter-part on the asset side of the balance sheet or are covered by the outstanding budgetary commitments not yet expensed. The contingent liabilities above are shown net of financial provisions made for these instruments — see note 2.10.
4.1.4. Legal cases
|
EUR millions |
||
|
|
31.12.2017 |
31.12.2016 |
|
Fines |
3 242 |
1 834 |
|
Agriculture |
1 737 |
1 711 |
|
Cohesion |
3 |
3 |
|
Other |
481 |
600 |
|
Total |
5 463 |
4 148 |
Fines
These amounts mainly concern fines imposed by the Commission for infringement of competition rules that have been provisionally paid by fined companies and where either an appeal has been lodged or where it is unknown if an appeal will be made. The contingent liability will be maintained until a decision by the Court of Justice on the case is final or until the expiry of the period for appeal. Interest earned on provisional payments is included in the economic result of the year and also as a contingent liability to reflect the uncertainty of the Commission’s title to these amounts.
Should the EU lose any of these cases relating to fines imposed, there would be no charge to the EU budget since the fines have been provisionally paid and this cash is held either in specific bank accounts (see note 2.8) or in the BUFI fund set up for this purpose (see note 2.4.1). The amount of fines are only recognised as budgetary revenue when they are definitive (Article 83 FR).
Agriculture
These are contingent liabilities towards the Member States connected with EAGF conformity decisions, rural development and pre-accession financial corrections pending judgement of the Court of Justice. The determination of the final amount of the liability and the year in which the effect of successful appeals will be charged to the budget will depend on the length of the procedure before the Court.
Cohesion
These are contingent liabilities towards the Member States in connection with actions under cohesion policy awaiting the oral hearing date or pending judgement of the Court of Justice.
Other legal cases
This heading relates to actions for damages currently being brought against the EU, other legal disputes and the estimated legal costs. It should be noted that in an action for damages under Article 288 EC the applicant must demonstrate a sufficiently serious breach by the institution of a rule of law intended to confer rights on individuals, real harm suffered by the applicant, and a direct causal link between the unlawful act and the harm.
4.2. CONTINGENT ASSETS
|
EUR millions |
||
|
|
31.12.2017 |
31.12.2016 |
|
Guarantees received: |
|
|
|
Performance guarantees |
352 |
369 |
|
Other guarantees |
22 |
28 |
|
Other contingent assets |
34 |
34 |
|
Total |
409 |
431 |
Performance guarantees are requested to ensure that beneficiaries of EU funding meet the obligations of their contracts with the EU.
5. BUDGETARY AND LEGAL COMMITMENTS
This note provides information on the budgetary process and future funding needs and not on liabilities existing as at 31 December 2017.
The multiannual financial framework (MFF) agreed by the Member States defines the programmes and sets out the heading ceilings for commitment appropriations and the total for payment appropriations within which the EU may enter into budgetary and legal commitments, and ultimately make payments for a period of 7 years — see table 1.1 in the notes to the budgetary implementation reports.
The MFF ceilings were adopted by the Council (Member States), with the consent of the European Parliament, and Article 16 of Regulation 1306/2013 on the financing of the CAP makes a direct link between the annual ceiling of EAGF expenditure and the MFF Regulation. The European Parliament and the Council also adopted the respective basic acts for the EAGF expenditure that set out the expenditure per Member State for the entire period 2014-2020.
Legal commitments correspond to programmes, projects, agreements or contracts signed, thus legally binding the EU. A legal commitment is the act whereby the authorising officer enters or establishes an obligation (for the EU) which results in a charge (Article 85 FR).
A budgetary commitment is in principle made before the legal commitment, but for some multiannual programmes/projects it is the reverse, the relevant budgetary commitments being made in annual instalments, over several years, when the basic act so provides for. For example, for cohesion, Article 76 of the Common Provisions Regulation (CPR) (Regulation (EU) No 1303/2013) provides that the decision of the Commission adopting a programme shall constitute a legal commitment within the meaning of the Financial Regulation but that the budget commitments of the Union in respect of each programme shall be made in annual instalments for each Fund during the period between 1 January 2014 and 31 December 2020. Other legal bases may contain similar provisions. For this reason, there may be amounts that the EU has legally committed to pay, but where the budgetary commitment has not yet been made — see notes 5.2 and 5.3 below.
If the budgetary commitment has been made but the subsequent payments are not yet made, the amount of outstanding commitments is called ‘Reste à Liquider’ (RAL). This can represent programmes or projects, often multiannual, signed but which are not yet (fully) implemented. They represent payment obligations for future years. As the financial statements are prepared on an accrual basis, whereas the budgetary implementation reports are prepared on a cash basis, part of the overall amounts unpaid (RAL) has already been expensed and is recognised as a liability on the balance sheet (see notes 2.12 and 2.13). The calculation of these expenses is made based either on cost claims/invoices received or on the estimated implementation of a programme or project where no claims have been notified yet to the EU — see note 5.1 below. Once the payments relating to the RAL are made after 31 December 2017, the liability on the balance sheet is derecognised. The part of the RAL not expensed yet is not included under liabilities but is instead disclosed below.
The disclosures below thus represent amounts at 31 December 2017 that the EU has committed to pay based on the fulfilment of the contractual agreements and which are therefore intended to be funded by future EU budgets.
|
EUR millions |
|||
|
|
Note |
31.12.2017 |
31.12.2016 |
|
Outstanding budgetary commitments not yet expensed |
5.1 |
221 391 |
189 881 |
|
Shared management legal commitments under the current MFF pending implementation |
5.2 |
211 688 |
276 351 |
|
Significant legal commitments in other areas |
5.3 |
20 030 |
22 275 |
|
Total |
|
453 109 |
488 507 |
5.1. OUTSTANDING BUDGETARY COMMITMENTS NOT YET EXPENSED
|
EUR millions |
||
|
|
31.12.2017 |
31.12.2016 |
|
Outstanding budgetary commitments not yet expensed |
221 391 |
189 881 |
The amount disclosed above is the budgetary RAL (‘Reste à Liquider’) of EUR 267 258 million (see table 4.4 in the notes to the budgetary implementation reports), less related amounts that have been included as liabilities on the balance sheet and as expenses in the statement of financial performance. The budgetary RAL is an amount representing the open commitments for which payments and/or de-commitments have not yet been made. As explained above, this is the normal consequence of the existence of multiannual programmes.
It should be noted that outstanding pre-financing advances at 31 December 2017 totalled EUR 49 billion (see note 2.5). This represents budgetary commitments that have been paid, decreasing the RAL, but where the amounts paid are still considered as belonging to the EU and not to the beneficiary until the contractual commitments are fulfilled. They are thus like the RAL disclosed above, not yet expensed.
5.2. SHARED MANAGEMENT LEGAL COMMITMENTS UNDER THE CURRENT MFF PENDING IMPLEMENTATION
|
EUR millions |
||||||
|
Funds |
Financial framework 2014-2020 (A) |
Legal commitments concluded (B) |
Budget commitments (C) |
Decommitments (D) |
Budget available under MFF (=A-C) |
Legal commitments less budget commitments (=B-C+D) |
|
European Regional Development Fund and Cohesion Fund |
262 058 |
262 058 |
140 302 |
— |
121 756 |
121 756 |
|
European Social Fund |
91 991 |
91 991 |
51 813 |
— |
40 178 |
40 178 |
|
Fund for European Aid to the most Deprived |
3 814 |
3 814 |
2 114 |
— |
1 699 |
1 699 |
|
HEADING 1B: COHESION POLICY FUNDS |
357 862 |
357 862 |
194 229 |
— |
163 633 |
163 633 |
|
European Agricultural Fund for Rural Development |
99 343 |
99 343 |
56 401 |
— |
42 942 |
42 942 |
|
European Maritime and Fisheries Fund |
5 749 |
5 749 |
3 210 |
— |
2 539 |
2 539 |
|
HEADING 2: NATURAL RESOURCES |
105 093 |
105 093 |
59 611 |
— |
45 482 |
45 482 |
|
Asylum and Migration Fund |
5 391 |
4 233 |
2 794 |
— |
2 597 |
1 439 |
|
Internal Security Fund |
2 812 |
2 635 |
1 500 |
— |
1 311 |
1 134 |
|
HEADING 3: SECURITY & CITIZENSHIP |
8 202 |
6 868 |
4 294 |
— |
3 908 |
2 573 |
|
Total |
471 157 |
469 822 |
258 134 |
— |
213 023 |
211 688 |
These are legal obligations that the EU has committed to paying when adopting the operational programmes related to shared management. The decision of the Commission adopting an operational programme shall constitute a financing decision within the meaning of Article 84 FR and once notified to the Member State concerned, a legal commitment within the meaning of that Regulation.
Article 76 of the CPR for European Structural and Investment Funds (ESIF) states:
‘The budget commitments of the Union in respect of each programme shall be made in annual instalments for each Fund during the period between 1 January 2014 and 31 December 2020. The budget commitments relating to the performance reserve in each programme shall be made separately from the remaining allocation to the programme.’
The table above starts with the total MFF (column A) and shows the legal commitments for which budget commitments have not yet been made and, for information, the maximum commitments in relation to the ceilings foreseen in the MFF 2014-2020, headings 1B, 2 and 3. These legal commitments thus represent the outstanding amounts that the EU will commit budgetarily and then pay after 31 December 2017. Column B shows the legal commitments concluded by the Commission at year-end and column C shows the budget commitments made relating to these legal commitments at year-end. At 31 December 2017 no decommitments (column D) have been made.
5.3. SIGNIFICANT LEGAL COMMITMENTS IN OTHER AREAS
|
EUR millions |
||
|
|
31.12.2017 |
31.12.2016 |
|
Connecting Europe Facility |
12 676 |
13 799 |
|
Copernicus |
1 841 |
2 393 |
|
ITER |
1 496 |
1 891 |
|
Galileo |
253 |
523 |
|
Fisheries agreements |
133 |
247 |
|
Operating lease commitments |
2 577 |
2 419 |
|
Other contractual commitments |
1 054 |
1 003 |
|
Total |
20 030 |
22 275 |
These amounts reflect the long-term legal commitments that were not yet covered by commitment appropriations in the budget at year-end. These binding obligations will be budgeted in annual instalments in future years and paid.
Certain important programmes (see below) may be implemented by annual instalments according to Article 85(4) FR. This allows the EU to make legal commitments (sign grant agreements, delegation agreements and procurement contracts) in excess of the available commitment appropriations of a given year. Therefore a substantial amount of the overall allocation for the current MFF may be already committed. This applies in particular for the programmes described below:
Connecting Europe Facility (CEF)
The CEF provides financial assistance to trans-European networks in order to support projects of common interest in the sectors of transport, telecommunications and energy infrastructures. The legal commitments for the CEF programme cover a period running from 2014 until 2020 for the CEF Transport and up to 2021 for CEF Energy. The legal basis of these commitments is Regulation (EU) No 1316/2013 of the EP and of the Council of 11 December 2013 establishing the Connecting Europe Facility, amending Regulation (EU) No 913/2010 and repealing Regulations (EC) No 680/2007 and (EC) No 67/2010 Text with EEA relevance (OJ L 348, 20 December 2013) which foresees the use of the annual instalment in its article 19.
Copernicus
Copernicus is the European Earth observation programme — see also note 2.2. These commitments are made for the period until 2020. Based on Regulation (EU) 377/2014 of the EP and Council of 3 April 2014 (OJ L 122/44 of 24 April 2014) the Commission signed delegation agreements with the European Space Agency (ESA), EUMETSAT and the European Centre for Medium Range weather forecasts. Article 8 of Regulation 377/2014 authorises the use of annual instalments.
ITER — International Thermonuclear Experimental Reactor
These commitments are intended to cover future funding needs of the ITER facilities up to 2021. The EU (Euratom) contribution to ITER International is given through the Fusion for Energy Agency, including also the contributions from Member States and from Switzerland. These commitments are made on the basis of Council decision (Euratom) 791/2013 of 13 December 2013 amending decision (Euratom) 198/2007 establishing the European Joint Undertaking for ITER and the Development of Fusion Energy which authorises the use of annual instalments. ITER was created to manage and to encourage the exploitation of the ITER facilities, to promote public understanding and acceptance of fusion energy, and to undertake any other activities that are necessary to achieve its purpose. ITER involves the EU, China, India, Russia, South Korea, Japan and the USA.
Galileo
These are amounts committed to the Galileo programme developing a European Global Navigation Satellite System — see also note 2.2. These commitments are made for the period until 2020. Based on Regulation (EU) 1285/2013 of the EP and Council of 11 December 2013 (OJ L 347/1 of 20 December 2013) the Commission signed a delegation agreement with ESA. Article 9 of Regulation (EU) 1285/2013 authorises the use of annual instalments.
Fisheries agreements
These are commitments entered into up to 2020 with third countries for operations under international fisheries agreements. These commitments are made based on Council decisions for each third country (e.g. Council decision (EU) 1894/2015 of 5 October 2015 on the conclusion of the Protocol between the European Union and the Republic of Cape Verde setting out the fishing opportunities and the financial contribution provided for in the Fisheries Partnership Agreement between the European Community and the Republic of Cape Verde; OJ L 277, 22 October 2015). These are specific international treaties which imply multiannual rights and obligations.
Operating lease commitments
Minimum amounts committed to be paid according to the underlying contracts during the remaining term of these lease contracts are as follows:
|
EUR millions |
||||
|
|
Minimum lease payments |
|||
|
|
< 1 year |
1-5 years |
> 5 years |
Total |
|
Buildings |
374 |
1 106 |
1 078 |
2 558 |
|
IT materials and other equipment |
7 |
13 |
0 |
21 |
|
Total |
380 |
1 120 |
1 078 |
2 577 |
Other contractual commitments
The amounts included under this disclosure correspond to amounts committed to be paid during the term of the contracts. The most significant amount included here relates to building contracts of the European Parliament (EUR 175 million).
6. FINANCIAL RISK MANAGEMENT
The following disclosures with regard to the financial risk management of the EU relate to:
|
— |
Borrowing and lending activities for financial assistance carried out by the Commission through: EFSM, BOP, MFA, and Euratom actions and for loans from borrowed funds of the ECSC in Liquidation; |
|
— |
The treasury operations carried out by the Commission in order to implement the EU budget, including the receipt of fines; |
|
— |
Assets held in funds for budgetary guarantees: The Guarantee Fund for external actions and the EFSI Guarantee Fund; and |
|
— |
Financial instruments financed by the EU budget. |
6.1. TYPES OF RISK
Market risk is the risk that the fair value or future cash flows of a financial instrument will fluctuate, because of variations in market prices. Market risk embodies not only the potential for loss, but also the potential for gain. It comprises currency risk, interest rate risk and other price risk (the EU has no significant other price risk).
|
— |
Currency risk is the risk that the EU's operations or its investments' value will be affected by changes in exchange rates. This risk arises from the change in price of one currency against another. |
|
— |
Interest rate risk is the possibility of a reduction in the value of a security, especially a bond, resulting from an increase in interest rates. In general, higher interest rates will lead to lower prices of fixed rate bonds, and vice versa. |
Credit risk is the risk of loss due to a debtor's/borrower's non-payment of a loan or other line of credit (either the principal or interest or both) or other failure to meet a contractual obligation. The default events include a delay in repayments, restructuring of borrower repayments and bankruptcy.
Liquidity risk is the risk that arises from the difficulty in selling an asset; for example, the risk that a given security or asset cannot be traded quickly enough in the market to prevent a loss or meet an obligation.
6.2. RISK MANAGEMENT POLICIES
The implementation of the EU budget relies increasingly on the use of operational programme financial instruments. The basic concept behind this approach, in contrast to the traditional method of budget implementation by giving grants and subsidies, is that for each euro spent from the budget via financial instruments, the final beneficiary receives more than EUR 1 as financial support due to the leverage effect. This use of the EU budget maximises the impact of the funds available. For more information on the amounts concerned, see note 2.4.1.
Common to most financial instruments is the fact that the implementation is delegated to either the EIB group (including EIF) or to other financial institutions based on an agreement between the Commission and the financial institution. Agreements signed with these financial institutions include strict conditions and obligations on the intermediaries so as to ensure that EU monies are properly managed and properly reported on. Once a financial contribution to one of the instruments has been committed, the funds are transferred to a specifically created bank account of the financial institution (i.e. a fiduciary account). The financial institution may, depending on the instrument in question, use the funds on this fiduciary account to provide loans, issue debt instruments, invest in equity instruments or cover the guarantee calls. Proceeds from financial instruments have, as a general rule, to be reimbursed to the EU budget.
The risk as regards these financial instruments is limited to a ceiling as indicated in the underlying agreements, which is the budgeted amount foreseen for the instrument. As the Commission often bears the ‘first loss piece’ and since instruments are intended to finance riskier beneficiaries (who have difficulties in obtaining funding from commercial lenders), it is therefore likely that some losses to the EU budget will occur.
Measurement of financial instruments
The following classes of financial assets and liabilities are not measured at fair value: cash and cash equivalents, loans, exchange receivables and non-exchange recoverables, borrowings and other financial liabilities measured at amortised cost. The carrying amount of those financial assets and liabilities is considered as a reasonable approximation of their fair value.
Borrowing and lending activities for financial assistance
The borrowing and lending transactions, as well as related treasury management, are carried out by the EU according to the respective Council and EP Regulation, Council Decisions, and, if applicable, internal guidelines. Written procedure manuals covering specific areas such as borrowings, loans and treasury management have been developed and are used by the relevant operational units. As a general rule, there are no activities to compensate interest rate variations or foreign currency variations (‘hedging’ activities) carried-out as lending operations are generally financed by ‘back-to-back’ borrowings, which thus do not generate open interest rate or currency positions. The application of the ‘back-to-back’ character is checked regularly.
Treasury
The rules and principles for the management of the Commission's treasury operations are laid down in the Council Regulation 609/2014 (as amended by Council Regulation 804/2016) and in the Financial Regulation and its rules of application.
As a result of the above regulations, the following main principles apply:
|
— |
Own resources are paid by the Member States into accounts opened for this purpose in the name of the Commission with the Treasury or national central bank. The Commission may draw on the above accounts solely to cover its cash requirements. |
|
— |
Own resources are paid by Member States in their own national currencies, while the Commission's payments are mostly denominated in EUR. |
|
— |
Bank accounts opened in the name of the Commission may not be overdrawn. This restriction does not apply to the Commission's own resource accounts in case of a default on loans contracted or guaranteed pursuant to EU Council regulations and decisions and under certain conditions in case the cash resource requirements are in excess of the assets of the accounts. |
|
— |
Funds held in bank accounts denominated in currencies other than EUR are either used for payments in the same currencies or periodically converted in EUR. |
In addition to the own resources accounts, other bank accounts are opened by the Commission, with central banks and commercial banks, for the purpose of executing payments and receiving receipts other than the Member State contributions to the budget.
Treasury and payment operations are highly automated and rely on modern information systems. Specific procedures are applied to guarantee system security and to ensure segregation of duties in line with the Financial Regulation, the Commission’s internal control standards, and audit principles.
A written set of guidelines and procedures regulates the management of the Commission's treasury and payment operations with the objective of limiting operational and financial risk and ensuring an adequate level of control. They cover different areas of operation (for example: payment execution and cash management, cashflow forecasting, business continuity, etc.), and compliance with the guidelines and procedures is checked regularly. Additionally, information is exchanged between Directorate General for the Budget and Directorate-General for Economic and Financial Affairs on risk management and best practices.
Fines
Provisionally cashed fines: deposits
Amounts received before 2010 remain in bank accounts with banks specifically selected for the deposit of provisionally cashed fines. The selection of banks is conducted in compliance with tender procedures defined by the Financial Regulation. Placement of funds with specific banks is determined by the internal risk management policy defining the credit rating requirements and the amount of funds which could be placed in proportion to the counterparty equity. Financial and operational risks are identified and evaluated and compliance with internal policies and procedures is checked regularly.
Provisionally cashed fines: BUFI portfolio
Fines imposed and provisionally cashed from 2010 onwards are invested in a specifically created portfolio, BUFI. The main objectives of the portfolio are the reduction of risks associated with financial markets and the equal treatment of all fined entities by offering a guaranteed return calculated on the same basis. The asset management for provisionally cashed fines is carried out by the Commission in accordance with internal asset management guidelines. Procedural manuals covering specific areas such as treasury management have been developed and are used by the relevant operational units. Financial and operational risks are identified and evaluated and compliance with internal guidelines and procedures is checked regularly.
The objectives of the asset management activities are to invest the fines provisionally paid to the Commission in such a way as to:
|
— |
ensure that the funds are easily available when needed, while |
|
— |
aiming at delivering, under normal circumstances, a return which on average is in line with the return of the BUFI Benchmark minus costs incurred, while preserving the nominal amount of the fines. |
Investments are restricted essentially to the following categories: term deposits with Member States' Central Banks, sovereign debt agencies, fully state-owned or state-guaranteed banks or supranational institutions, and bonds, bills and Certificates of Deposit issued by either sovereign or supranational institutions.
Financial guarantees
Significant amounts of guarantees issued by financial institutions are held by the Commission in relation to the fines it imposes on companies breaching EU competition rules (see note 2.6.1.2). These guarantees are provided by fined companies as an alternative to making provisional payments. The guarantees are managed in compliance with the internal risk management policy. Financial and operational risks are identified and evaluated and compliance with internal policies and procedures is checked regularly.
Guarantee Fund for external actions
The rules and principles for the asset management of the Guarantee Fund are laid out in the Convention between the Commission and the EIB dated 25 November 1994 and the subsequent amendments dated 17/23 September 1996, 8 May 2002, 25 February 2008 and 9 November 2010. This Guarantee Fund operates only in euros. It exclusively invests in this currency in order to avoid any foreign currency risk. Management of the assets is based upon the traditional rules of prudence adhered to for financial activities. It is required to pay particular attention to reducing the risks and to ensuring that the managed assets can be sold or transferred without significant delay, taking into account the commitments covered.
EFSI Guarantee Fund
The EFSI Guarantee Fund was established by Regulation (EU) 2015/1017 of the EP and of the Council of 25 June 2015 (amended by Regulation (EU) 2017/2396 of 13 December 2017). The rules and principles for the asset management of the Fund are laid out in the Commission Decision C(2016)165 of 21 January 2016. The managed assets shall provide sufficient liquidity in relation to the potential guarantee calls, while still aiming at optimising the return and risk level that is compatible with maintaining a high degree of security and stability.
6.3. CURRENCY RISK
Financial instruments exposure of the EU to currency risk at year end — net position
|
EUR millions |
|||||||
|
|
31.12.2017 |
||||||
|
USD |
GBP |
DKK |
SEK |
EUR |
Other |
Total |
|
|
Financial assets |
|
|
|
|
|
|
|
|
Available for sale financial assets |
680 |
57 |
17 |
56 |
12 806 |
16 |
13 632 |
|
Financial assets at fair value through surplus or deficit |
(632) |
— |
— |
— |
655 |
— |
23 |
|
Loans (4) |
6 |
0 |
— |
— |
123 |
7 |
137 |
|
Receivables and recoverables |
15 |
549 |
63 |
86 |
11 591 |
62 |
12 366 |
|
Cash and cash equivalents |
49 |
3 180 |
27 |
693 |
18 468 |
1 694 |
24 111 |
|
|
118 |
3 787 |
107 |
835 |
43 642 |
1 779 |
50 268 |
|
Financial liabilities |
|
|
|
|
|
|
|
|
Financial liabilities at fair value through surplus or deficit |
— |
— |
— |
— |
— |
(2) |
(2) |
|
Payables |
(4) |
(2) |
(0) |
(1) |
(39 029 ) |
(12) |
(39 048 ) |
|
|
(4) |
(2) |
(0) |
(1) |
(39 029 ) |
(14) |
(39 050 ) |
|
Total |
114 |
3 785 |
107 |
834 |
4 613 |
1 765 |
11 218 |
|
EUR millions |
|||||||
|
|
31.12.2016 |
||||||
|
USD |
GBP |
DKK |
SEK |
EUR |
Other |
Total |
|
|
Financial assets |
|
|
|
|
|
|
|
|
Available for sale financial assets |
228 |
58 |
14 |
42 |
10 080 |
21 |
10 442 |
|
Financial assets at fair value through surplus or deficit |
(49) |
— |
— |
— |
50 |
— |
0 |
|
Loans (4) |
4 |
0 |
— |
— |
329 |
10 |
343 |
|
Receivables and recoverables |
1 |
593 |
51 |
81 |
10 888 |
8 |
11 622 |
|
Cash and cash equivalents |
39 |
2 394 |
428 |
1 220 |
22 387 |
2 117 |
28 585 |
|
|
222 |
3 045 |
493 |
1 342 |
43 734 |
2 156 |
50 993 |
|
Financial liabilities |
|
|
|
|
|
|
|
|
Financial liabilities at fair value through surplus or deficit |
(100) |
— |
— |
— |
100 |
— |
(1) |
|
Payables |
(1) |
(5) |
(0) |
(0) |
(39 983 ) |
(16) |
(40 005 ) |
|
|
(101) |
(5) |
(0) |
(0) |
(39 883 ) |
(16) |
(40 005 ) |
|
Total |
121 |
3 040 |
493 |
1 342 |
3 851 |
2 140 |
10 987 |
If the EUR had strengthened against other currencies by 10 %, then it would have had the following impact:
|
EUR millions |
||||
|
|
Economic result |
|||
|
USD |
GBP |
DKK |
SEK |
|
|
2017 |
(5) |
(339) |
(8) |
(71) |
|
2016 |
(4) |
(272) |
(43) |
(118) |
|
EUR millions |
||||
|
|
Net assets |
|||
|
USD |
GBP |
DKK |
SEK |
|
|
31.12.2017 |
(5) |
(5) |
(2) |
(5) |
|
31.12.2016 |
(7) |
(5) |
(1) |
(4) |
If the EUR had weakened against these currencies by 10 %, then it would have had the following impact:
|
EUR millions |
||||
|
|
Economic result |
|||
|
USD |
GBP |
DKK |
SEK |
|
|
2017 |
6 |
414 |
10 |
87 |
|
2016 |
5 |
332 |
53 |
145 |
|
EUR millions |
||||
|
|
Net assets |
|||
|
USD |
GBP |
DKK |
SEK |
|
|
31.12.2017 |
7 |
6 |
2 |
6 |
|
31.12.2016 |
9 |
6 |
2 |
5 |
Borrowing and lending activities for financial assistance
Most financial assets and liabilities are in EUR, so in these cases the EU has no foreign currency risk. However, the EU does give loans in USD through the financial instrument Euratom, which are financed by borrowings with an equivalent amount in USD (back-to-back operation). At the balance sheet date, the EU has no foreign currency risk with regard to Euratom.
Treasury
Own resources paid by Member States in currencies other than EUR are kept on the own resources accounts, in accordance with Council Regulation 609/2014 (as amended by Council regulation 804/2016). They are converted into EUR when they are needed to cover for the execution of payments. The procedures applied for the management of these funds are laid down by the above referred regulation. In a limited number of cases, these funds are directly used for payments to be executed in the same currencies.
A number of accounts in EU currencies other than EUR, and in USD and CHF, are held by the Commission with commercial banks, for the purpose of executing payments denominated in these same currencies. These accounts are replenished depending on the amount of payments to be executed, as a consequence their balances do not represent exposure to currency risk.
When miscellaneous receipts (other than own resources) are received in currencies other than EUR, they are either transferred to Commission's accounts held in the same currencies, if they are needed to cover the execution of payments, or converted into EUR and transferred to accounts held in EUR. Imprest accounts held in currencies other than EUR are replenished depending on the estimated short term local payments needs in the same currencies. Balances on these accounts are kept within their respective ceilings.
Fines
Provisionally cashed fines (deposits and BUFI portfolio) and bank guarantees
Since all fines are imposed and paid in EUR, there is no foreign currency risk.
Guarantee Fund for external actions
The financial assets of this fund are in EUR so there is no currency risk. The loans subrogated to the EU as result of calls on the Fund following payment defaults by a loan beneficiary are carried out in their original currency and therefore expose the EU to currency risk. There are no activities to compensate foreign currency variations (‘hedging’ activities) due to uncertainty relating to the loans repayment timing.
EFSI Guarantee Fund
The EFSI Guarantee Fund currently operates in both EUR and USD. In December 2016 the first investments in USD denominated fixed-rate debt securities (US Treasuries) were undertaken with a view to improve returns and diversify market risk through exposure to the US market. Currency risk is managed through entering into derivative contracts (foreign exchange forward contracts) hedging the market value of the USD investments portfolio. The limit for maximum unhedged foreign exchange exposure is set at 1 % of the total portfolio value within the benchmark and annual strategy allocations. Thus, upward or downward movements in the USD investments' market value above or below the 1 % limit would trigger a rebalancing trade (a new forward contract with the same or opposite direction), adjusting or reversing the hedged position accordingly. Readjustment of the hedge may also be prompted by movements of the EUR/USD exchange rate.
6.4. INTEREST RATE RISK
The following table illustrates the interest rate sensitivity of available for sale financial assets assuming a possible change in interest rates of +/- 100 basis points (1 %).
|
EUR millions |
||
|
|
Increase (+) / decrease (-) in basis points |
Effect on net assets |
|
31.12.2017: Available for sale financial assets |
+100 |
(359) |
|
-100 |
382 |
|
|
31.12.2016: Available for sale financial assets |
+100 |
(291) |
|
-100 |
313 |
|
Borrowing and lending activities for financial assistance
Due to the nature of its borrowing and lending activities, the EU has significant interest-bearing assets and liabilities. However, the interest rate risks that arise from borrowings are offset by equivalent loans in terms and conditions (back-to-back).
Treasury
The Commission's treasury does not borrow money; so as a consequence, it is not exposed to interest rate risk. Interest is however calculated on balances held on the different bank accounts. The Commission has therefore put in place measures to ensure that interest earned on its bank accounts regularly reflects market interest rates, as well as their possible fluctuation.
Accounts opened with Member States Treasuries for own resources receipts are non-interest bearing and free of charges. Accounts held with national central banks may be remunerated at the official rates applied by each institution. As some of the remunerations applied to these accounts may currently be negative, cash management procedures are in place to minimise balances kept on these accounts.
In addition, own resources accounts are protected from any impact of negative interest in accordance with Council Regulation 609/2014 and as amended by Council Regulation 804/2016.
Overnight balances held on commercial bank accounts earn interest on a daily basis. This is based on variable market rates to which a contractual margin (positive or negative) is applied. The rates applied by commercial banks are in general contractually floored at zero. As a result no risk exists that the Commission earns interest at rates lower than market rates.
Fines
Provisionally cashed fines (deposits, BUFI portfolio) and bank guarantees
The provisionally cashed fines are invested in a portfolio of money market instruments and long term bonds with an average duration of 2,6 years.
Guarantee Fund for external actions
The budget provisioned in the Guarantee Fund is invested in a portfolio of money market instruments and long term bonds with a total average portfolio duration of 2,93 years.
EFSI Guarantee Fund
The budget provisioned in the EFSI Guarantee Fund is invested in a portfolio of money market instruments and long term bonds with a total average portfolio duration of 3,5 years.
6.5. CREDIT RISK
The amounts that represent the EU's exposure to credit risk at the end of the reporting period are the carrying amounts of the financial instruments as disclosed in note 2.
Analysis of the age of financial assets that are not impaired
|
EUR millions |
|||||
|
|
Total |
Neither past due nor impaired |
Past due but not impaired |
||
|
< 1 year |
1-5 years |
> 5 years |
|||
|
Loans |
54 981 |
54 980 |
0 |
— |
— |
|
Receivables and recoverables |
12 366 |
8 905 |
2 894 |
359 |
208 |
|
Financial assets at fair value through surplus or deficit |
23 |
23 |
— |
— |
— |
|
Total at 31.12.2017 |
67 369 |
63 908 |
2 894 |
359 |
208 |
|
Loans |
55 477 |
55 476 |
1 |
— |
— |
|
Receivables and recoverables |
11 622 |
10 310 |
130 |
909 |
273 |
|
Financial assets at fair value through surplus or deficit |
0 |
0 |
— |
— |
— |
|
Total at 31.12.2016 |
67 099 |
65 786 |
131 |
909 |
273 |
Receivables and recoverables between 1 and 5 years include recoverables related to competition fines of EUR 278 million (2016: EUR 870 million) that are to a large extent covered by bank guarantees and the Commission has thus low exposure to a credit risk. These guarantees are provided by fined companies as an alternative to making provisional payments.
Credit quality of financial assets that are neither past due nor impaired
|
EUR millions |
|||||
|
|
31.12.2017 |
||||
|
AFS (5) |
Financial assets at FVSD (6) |
Loans & Receivables (7) |
Cash |
Total |
|
|
Counterparties with external credit rating |
|
|
|
|
|
|
Prime and high grade |
8 068 |
16 |
3 132 |
19 261 |
30 477 |
|
Upper medium grade |
1 794 |
— |
23 879 |
3 977 |
29 650 |
|
Lower medium grade |
2 186 |
— |
28 041 |
463 |
30 691 |
|
Non-investment grade |
— |
— |
4 087 |
389 |
4 476 |
|
|
12 048 |
16 |
59 139 |
24 090 |
95 293 |
|
Counterparties without external credit rating |
|
|
|
|
|
|
Group 1 |
— |
6 |
4 745 |
21 |
4 772 |
|
Group 2 |
— |
— |
1 |
— |
1 |
|
|
— |
6 |
4 746 |
21 |
4 773 |
|
Total |
12 048 |
23 |
63 885 |
24 111 |
100 067 |
|
EUR millions |
|||||
|
|
31.12.2016 |
||||
|
|
AFS (5) |
Financial assets at FVSD (6) |
Loans & Receivables (7) |
Cash |
Total |
|
Counterparties with external credit rating |
|
|
|
|
|
|
Prime and high grade |
6 451 |
— |
3 386 |
21 990 |
31 828 |
|
Upper medium grade |
1 412 |
— |
23 826 |
5 325 |
30 563 |
|
Lower medium grade |
1 056 |
— |
4 532 |
492 |
6 081 |
|
Non-investment grade |
— |
— |
27 724 |
744 |
28 468 |
|
|
8 920 |
— |
59 469 |
28 552 |
96 941 |
|
Counterparties without external credit rating |
|
|
|
|
|
|
Group 1 |
— |
0 |
6 238 |
33 |
6 272 |
|
Group 2 |
— |
— |
79 |
— |
79 |
|
|
— |
0 |
6 317 |
33 |
6 351 |
|
Total |
8 920 |
0 |
65 786 |
28 585 |
103 292 |
Not included in the above table are available for sale financial assets in the form of equity instruments without external credit rating. The four risk categories mentioned above are in principle based on the rating categories of external rating agencies and correspond to:
|
— |
Prime and high grade: Moody P-1, Aaa — Aa3; S&P A-1+, A-1, AAA — AA -; Fitch F1+, F1, AAA — AA- and equivalent |
|
— |
Upper medium grade: Moody P-2, A1 — A3; S&P A-2, A+ — A-; Fitch F2, A+ — A- and equivalent |
|
— |
Lower medium grade: Moody P-3, Baa1 — Baa3, S&P A-3, BBB+ — BBB-; Fitch F-3, BBBB+ — BBB- and equivalent |
|
— |
Non-investment grade: Moody not prime, Ba1 — C; S&P B, C, BB+ — D; Fitch B, C, BB+ — D and equivalent |
The EU uses these external agencies rating categories as a reference point notably for financial instruments and commercial banks, but may, after making its own analysis of individual cases, keep amounts in one of the above risk categories even though one or more of the above mentioned rating agencies may have downgraded the corresponding counterparty. As regards non-rated counterparties, group 1 relates to debtors without defaults in the past and group 2 relates to debtors with defaults in the past.
The amounts displayed above under loans and receivables categorised in non-investment grade relate primarily to financial support loans disbursed by the Commission to Member States in financial difficulties and recoverables against certain Members States based on own resources regulations or other legal basis. The amount under cash relates to own resources bank accounts opened in the Treasury or in the central banks of Member States to hold the own resources contributions as foreseen in the above referred regulation. The Commission may draw on these accounts solely to cover cash requirements arising from execution of the budget.
Borrowing and lending activities for financial assistance
Exposure to credit risk is managed firstly by obtaining country guarantees in the case of Euratom, then through the Guarantee Fund for external actions (MFA & Euratom), then by the possibility of drawing the necessary funds from the Commission's own resources accounts with the Member States and ultimately through the Budget of the EU.
The Own Resources legislation fixes the ceiling for own resources payments at 1,20 % of Member States' GNI and during 2017 0,76 % was actually used to cover payment appropriations. This means that at 31 December 2017 there existed an available margin of 0,44 % to cover these guarantees. To this end, the EU is entitled to call upon all the Member States to ensure compliance with the EU's legal obligation towards its lenders.
Treasury
Most of the Commission's treasury resources are kept, in accordance with Council Regulation 609/2014 (as amended by Council Regulation 804/2016) on own resources, in the accounts opened by Member States for the payment of their contributions (own resources). All such accounts are held with Member States' treasuries or national central banks. These institutions carry the lowest credit (or counterparty) risk for the Commission as the exposure is with its Member States. For the part of the Commission's treasury resources kept with commercial banks, in order to cover the execution of payments, replenishment of these accounts is made on a just-in-time basis and is automatically managed by the treasury cash management system. Minimum cash levels, which take into account the average amount of daily payments executed from it, are kept on each account. As a consequence the total amount kept overnight on these accounts remains constantly at low levels (overall less than EUR 80 million on average, spread over 21 accounts) and so ensure the Commission's risk exposure is limited. These amounts should be viewed with regard to the daily overall treasury balances which fluctuated in 2017 between EUR 4 billion and EUR 40 billion, and with an overall amount of payments made from Commission accounts in 2017 that exceeds EUR 134 billion.
In addition, specific guidelines are applied for the selection of commercial banks in order to further minimise counterparty risk to which the Commission is exposed:
|
— |
All commercial banks are selected by call for tenders. The minimum short term credit rating required for admission to the tendering procedures is Moody's P-1 or equivalent. A lower level may be accepted in specific and duly justified circumstances. |
|
— |
The credit ratings of the commercial banks where the Commission has accounts are monitored on a daily basis. |
|
— |
In delegations outside the EU, imprest accounts are held with local banks selected by a simplified tendering procedure. Rating requirements depend on the local situation and may significantly differ from one country to another. In order to limit risk exposure, balances on these accounts are kept at the lowest possible levels (taking into account operational needs), they are regularly replenished, and the applied ceilings are reviewed on a yearly basis. |
Fines
Provisionally cashed fines: deposits
Banks holding deposits for the fines provisionally cashed before 2010 are selected by tender procedure in compliance with the risk management policy which defines the credit rating requirements and the amount of funds which could be placed in proportion to the counterparty equity.
For commercial banks that have been specifically selected for the deposit of provisionally cashed fines, a minimum long-term rating A (S&P or equivalent) and a minimum short term rating A-1 (S&P or equivalent) is required as a general rule. Specific measures are applied in case banks in this group are subject to downgrade. In addition, the amount deposited with each bank is limited to a certain percentage of its own funds, which varies depending on the rating level of each institution. The calculation of such limits also takes into account the amount of outstanding guarantees issued to the Commission by the same institution. The compliance of outstanding deposits with the applicable policy requirements is reviewed regularly.
Provisionally cashed fines: BUFI portfolio
For sovereign debt investments from provisionally cashed fines imposed as from 2010, the Commission takes on the exposure to credit risk. The highest concentration of exposure is towards France, which represents 26 % of the portfolio. The five countries with the highest exposure (France, Italy, Spain, Germany and Belgium) represent altogether 72 % of the investment portfolio. The weighted average credit rating of the portfolio is A- (S&P or equivalent).
Financial guarantees
The risk management policy applied for the acceptance of such guarantees ensures a high credit quality for the Commission. The compliance of the outstanding guarantees with the applicable policy requirements is reviewed regularly.
Guarantee Fund for external actions
The treasury portfolio’s agreed asset management guidelines and/or investment strategy define certain limits and restrictions in order to limit the exposure to credit risk of the portfolio. Such limits and restrictions include eligibility criteria, absolute credit limits in nominal terms depending on issuer category, relative concentration limits depending on issuer category and concentration limits per issue. All investments are rated at least as investment grade.
EFSI Guarantee Fund
The asset management guidelines, risk and investment strategies define certain limits and restrictions in order to limit the exposure to credit risk of the portfolio which is generally limited to investment grade. The weighted average credit rating of the portfolio is A- (S&P or equivalent).
As the sole counterparty for all outstanding currency forwards as of 31 December 2017 is the Bank for International Settlements (BIS), no credit enhancements, such as collateral, netting agreements, or guarantees are put in place as of this date. The maximum exposure to credit risk for foreign exchange derivatives having a positive fair value at the end of the reporting period is equal to the carrying amount on the balance sheet.
6.6. LIQUIDITY RISK
Maturity analysis of financial liabilities by remaining contractual maturity
|
EUR millions |
||||
|
|
< 1 year |
1-5 years |
> 5 years |
Total |
|
Borrowings |
(6 700 ) |
(14 862 ) |
(33 279 ) |
(54 841 ) |
|
Payables |
(39 048 ) |
— |
— |
(39 048 ) |
|
Other |
(150) |
(665) |
(1 255 ) |
(2 070 ) |
|
Total at 31.12.2017 |
(45 898 ) |
(15 527 ) |
(34 534 ) |
(95 959 ) |
|
Borrowings |
(2 094 ) |
(18 084 ) |
(34 950 ) |
(55 128 ) |
|
Payables |
(40 005 ) |
— |
— |
(40 005 ) |
|
Other |
(189) |
(637) |
(1 397 ) |
(2 222 ) |
|
Total at 31.12.2016 |
(42 288 ) |
(18 721 ) |
(36 346 ) |
(97 355 ) |
Financial liabilities at fair value through surplus or deficit
|
EUR millions |
||||
|
|
< 1 year |
1-5 years |
> 5 years |
Total |
|
Derivative pay leg |
(634) |
(2) |
— |
(635) |
|
Derivative receive leg |
638 |
— |
— |
638 |
|
Net cash flows at 31.12.2017 |
5 |
(2) |
— |
3 |
|
Derivative pay leg |
(150) |
— |
— |
(150) |
|
Derivative receive leg |
149 |
— |
— |
149 |
|
Net cash flow at 31.12.2016 |
(1) |
— |
— |
(1) |
Borrowing and lending activities for financial assistance
The liquidity risk that arises from borrowings is generally offset by equivalent loans in terms and conditions (back-to-back operations). For MFA and Euratom, the Guarantee Fund for external actions serves as a liquidity reserve (or safety net) in case of payment default and payment delays of borrowers. For BOP, the Council Regulation 431/2009 provides for a procedure allowing sufficient time to mobilise funds through the Commission's own resources accounts with the Member States. For EFSM, the Council Regulation 407/2010 provides for a similar procedure.
Treasury
EU budget principles ensure that overall cash resources for a given year are always sufficient for the execution of all payments. In fact, the total Member States contributions equal the amount of payment appropriations for the budgetary year. Member States’ contributions, however, are received in twelve monthly instalments throughout the year, while payments are subject to certain seasonality. Moreover, in accordance with the Council Regulation 609/2014 (on the methods and procedure for making available own resources amended by Council Regulation 804/2016), Member States contributions relating to (amending) budgets approved after the 16th of a given month (N) only become available in month N+2, while the related payment appropriations are immediately available. In order to ensure that available treasury resources are always sufficient to cover the payments to be executed in any given month, procedures regarding regular cash forecasting are in place, and own resources or additional funding can be called up in advance from Member States if needed, up to certain limits and under certain conditions. Seasonality of expenditure and overall budgetary restrictions in recent years have resulted in the need for increased monitoring of the rhythm of payments over the year. In addition to the above, in the context of the Commission's daily treasury operations, automated cash management tools ensure that sufficient liquidity is available on each of the Commission's bank accounts, on a daily basis.
Fines
Provisionally cashed fines: BUFI portfolio
The fund is managed according to the principle that the assets shall have a sufficient degree of liquidity and mobilisation in relation to the relevant commitments. The portfolio is composed of mostly highly liquid securities that can be sold to meet unexpected cash outflows. In addition the share of deposits, securities maturing within 1 year and floating rate notes is 38 %.
Guarantee Fund for external actions
The fund is managed according to the principle that the assets shall have a sufficient degree of liquidity and mobilisation in relation to the relevant commitments. The fund must maintain a minimum of EUR 100 million in a short-term portfolio with a maturity of less than twelve months which is to be invested in monetary instruments. As at 31 December 2017, these investments, including cash, amounted to EUR 244 million. Furthermore, a minimum of 20 % of the fund's nominal value shall comprise monetary instruments, fixed-rate bonds with a remaining maturity of no more than one year, and floating-rate bonds. As at 31 December 2017, this ratio stood at 23 %.
EFSI Guarantee Fund
The Guarantee Fund is managed according to the principle that the assets shall have a sufficient degree of liquidity and mobilisation in relation to the relevant commitments. The portfolio is composed of highly liquid assets that can be sold to meet unexpected cash outflows, including the most liquid USD-denominated securities — US Treasuries standing at 16 % of the total investment portfolio as of the reporting date.
The settlement of derivative contracts is gross and is based on their contractual maturity. Obligations are honoured via sales of USD-denominated assets and/or a swap transaction, whereby it is possible that a cash outflow arises due to foreign exchange differences.
No liquidity management is necessary with regard to collateral/margin requirements as the current hedging counterparty accepts to operate with the Commission without any requirements for collateral/margin calls.
Other financial instruments — foreign exchange option
During the year ended 31 December 2017, the EU entered into a derivative contract (foreign exchange option) covering the devaluation of foreign exchange currency related to loans given by financial institutions (see note 2.11.2). As for the other financial instruments financed by the EU Budget, the amount for which the EU is liable under this option cannot exceed the amount committed, being the liquidity risk mitigated by that fact.
7. RELATED PARTY DISCLOSURES
7.1. RELATED PARTIES
The related parties of the EU are the EU consolidated entities, associates and the key management personnel of these entities. Transactions between these entities take place as part of the normal operations of the EU and as this is the case, no specific disclosure requirements are necessary for these transactions in accordance with the EU accounting rules.
7.2. KEY MANAGEMENT ENTITLEMENTS
For the purposes of presenting information on related party transactions concerning the key management of the EU, such persons are shown here under five categories:
Category 1: the Presidents of the European Council, the Commission and the Court of Justice of the European Union
Category 2: the Vice-president of the Commission and High Representative of the EU for Foreign Affairs and Security Policy and the other Vice-presidents of the Commission
Category 3: the Secretary-General of the Council, the Members of the Commission, the Judges and Advocates General of the Court of Justice of the European Union, the President and Members of the General Court, the President and Members of the European Civil Service Tribunal, the Ombudsman and the European Data Protection Supervisor
Category 4: the President and Members of the European Court of Auditors
Category 5: the highest ranking civil servants of the Institutions and Agencies
A summary of their entitlements is given below — further information can be found in the Staff Regulations published on the Europa website which is the official document describing the rights and obligations of all officials of the EU. Key management personnel have not received any preferential loans from the EU.
KEY MANAGEMENT FINANCIAL ENTITLEMENTS
|
EUR |
|||||
|
Entitlement (per employee) |
Category 1 |
Category 2 |
Category 3 |
Category 4 |
Category 5 |
|
Basic salary (per month) |
27 436,90 |
24 852,26 - |
19 881,81 - |
21 472,36 - |
12 641,93 - |
|
|
|
25 846,36 |
22 367,04 |
22 864,09 |
19 881,81 |
|
|
|
|
|
|
|
|
Residential/Expatriation allowance |
15 % |
15 % |
15 % |
15 % |
0-4 %-16 % |
|
|
|
|
|
|
|
|
Family allowances: |
|
|
|
|
|
|
Household (% salary) |
2 % + 184,55 |
2 % + 184,55 |
2 % + 184,55 |
2 % + 184,55 |
2 % + 184,55 |
|
Dependent child |
403,25 |
403,25 |
403,25 |
403,25 |
403,25 |
|
Pre-school |
98,51 |
98,51 |
98,51 |
98,51 |
98,51 |
|
Education, or |
273,6 |
273,6 |
273,6 |
273,6 |
273,6 |
|
Education outside place of work |
547,2 |
547,2 |
547,2 |
547,2 |
547,2 |
|
Presiding judges allowance |
N/A |
N/A |
627,76 |
N/A |
N/A |
|
|
|
|
|
|
|
|
Representation allowance |
1 486,84 |
955,58 |
627,76 |
N/A |
N/A |
|
|
|
|
|
|
|
|
Annual travel costs |
N/A |
N/A |
N/A |
N/A |
N/A |
|
|
|
|
|
|
|
|
Transfers to Member State: |
|
|
|
|
|
|
Education allowance (8) |
Yes |
Yes |
Yes |
Yes |
Yes |
|
% of salary (8) |
5 % |
5 % |
5 % |
5 % |
5 % |
|
% of salary with no cc |
max 25 % |
max 25 % |
max 25 % |
max 25 % |
max 25 % |
|
Representation expenses |
Reimbursed |
Reimbursed |
Reimbursed |
N/A |
N/A |
|
|
|
|
|
|
|
|
Taking up duty: |
|
|
|
|
|
|
Installation expenses |
54 873,80 |
48 969,98 - |
39 763,62 - |
42 944,71 - |
Reimbursed |
|
|
|
50 928,78 |
44 734,07 |
45 728,19 |
|
|
Family travel expenses |
Reimbursed |
Reimbursed |
Reimbursed |
Reimbursed |
Reimbursed |
|
Moving expenses |
Reimbursed |
Reimbursed |
Reimbursed |
Reimbursed |
Reimbursed |
|
Leaving office: |
|
|
|
|
|
|
Resettlement expenses |
27 436,90 |
24 852,26 - |
19 881,81 - |
21 472,36 - |
Reimbursed |
|
|
|
25 846,36 |
22 367,04 |
22 864,09 |
|
|
Family travel expenses |
Reimbursed |
Reimbursed |
Reimbursed |
Reimbursed |
Reimbursed |
|
Moving expenses |
Reimbursed |
Reimbursed |
Reimbursed |
Reimbursed |
Reimbursed |
|
Transition (% salary) (9) |
40 % — 65 % |
40 % — 65 % |
40 % — 65 % |
40 % — 65 % |
N/A |
|
Sickness insurance |
Covered |
Covered |
Covered |
Covered |
Covered |
|
Pension (% salary, before tax) |
Max 70 % |
Max 70 % |
Max 70 % |
Max 70 % |
Max 70 % |
|
|
|
|
|
|
|
|
Deductions: |
|
|
|
|
|
|
Tax on salary |
8 % — 45 % |
8 % — 45 % |
8 % — 45 % |
8 % — 45 % |
8 % — 45 % |
|
Sickness insurance (% salary) |
1,7 % |
1,7 % |
1,7 % |
1,7 % |
1,7 % |
|
Special levy on salary |
7 % |
7 % |
7 % |
7 % |
6-7 % |
|
Pension deduction |
N/A |
N/A |
N/A |
N/A |
9,8 % |
|
Number of persons at year-end |
3 |
6 |
93 |
28 |
112 |
8. EVENTS AFTER THE BALANCE SHEET DATE
At the date of signing of these accounts no material issues had come to the attention of or were reported to the Accounting Officer of the Commission that would require separate disclosure under this section. As explained in note 4.1.1, the EFSI Agreement has been amended in March 2018 following the amended Regulation EU 2017/2396.
The accounts and related notes were prepared using the most recently available information and this is reflected in the information presented.
9. SCOPE OF CONSOLIDATION
A. CONTROLLED ENTITIES (52)
1. Institutions and consultative bodies (11)
European Parliament
European Council
European Commission
European Court of Auditors
Court of Justice of the European Union
European External Action Service
European Data Protection Supervisor
European Economic and Social Committee
European Ombudsman
Committee of the Regions
Council of the European Union
2. EU Agencies (39)
2.1. Executive Agencies (6)
Education, Audiovisual & Culture Executive Agency
Consumers, Health, Agriculture and Food Executive Agency
Research Executive Agency
Executive Agency for Small and Medium-sized Enterprises
Innovation & Networks Executive Agency
European Research Council Executive Agency
2.2. Decentralised Agencies (33)
European Maritime Safety Agency
European Medicines Agency
European GNSS Supervisory Authority
European Chemicals Agency
Fusion for Energy (European Joint Undertaking for ITER and the Development of Fusion Energy)
Eurojust
European Institute for Gender Equality
European Agency for Safety and Health at Work
European Centre for Disease Prevention and Control
European Environment Agency
European Centre for the Development of Vocational training
European Agency for Cooperation of Energy Regulators
European Banking Authority
European Asylum Support Office
Office for the Body of European Regulators for Electronic Communication
European Agency Border and Coast Guard Agency (Frontex)
EU-LISA (European Agency for the operational management of large-scale IT systems in the area of freedom, security and justice)
European Food Safety Authority
European Railway Agency
Community Plant Variety Office
European Fisheries Control Agency
European Monitoring Centre for Drugs and Drug Addiction
European Union Intellectual Property Office
European Police Office (EUROPOL)
European Aviation Safety Agency
European Network and Information Security Agency
European Union Agency for Fundamental Rights
European Insurance and Occupational Pensions Authority
Translation Centre for the Bodies of the European Union
European Securities and Markets Authority
European Training Foundation
European Foundation for the Improvement of Living and Working Conditions
European Union Agency for Law Enforcement Training (CEPOL)
3. Other controlled entities (2)
European Coal and Steel Community (in liquidation)
European Institute of Innovation and Technology
B. ASSOCIATES (1)
European Investment Fund
MINOR ENTITIES
The entities listed below have not been consolidated using the equity method into the 2017 EU consolidated financial statements on the basis of immateriality:
Bio Based Industries Joint Undertaking
Bio Based Industries is a Public-Private Partnership (PPP) between the EU and the Bio-based Industries Consortium (BIC). The BBI is dedicated to realising the European bio economy potential, turning biological residues and wastes into greener everyday products through innovative technologies and bio refineries, which are at the heart of the bio economy.
Clean Sky Joint Undertaking
Clean Sky is the largest European research programme developing innovative, cutting-edge technology aimed at reducing CO2, gas emissions and noise levels produced by aircraft. Funded by the EU’s Horizon 2020 programme, Clean Sky contributes to strengthening European aero-industry collaboration, global leadership and competitiveness.
Innovative Medicines Initiative Joint Undertaking (IMI)
IMI is Europe's largest public-private initiative aiming to speed up the development of better and safer medicines for patients. IMI is a joint undertaking between the European Union and a pharmaceutical industry association.
Electronic Components and Systems for European Leadership (ECSEL) Joint Undertaking (amalgamation of the former ARTEMIS & ENIAC JUs)
ECSEL is a PPP in electronic components and systems, bridging the gap between research and exploitation, aligning strategies to increase European and national investments, and building an advanced ecosystem.
Fuel Cells Hydrogen Joint Undertaking (FCH)
FCH is a PPP supporting research, technological development and demonstration (RTD) activities in fuel cell and hydrogen energy technologies in Europe. Its aim is to accelerate the market introduction of these technologies, realising their potential as an instrument in achieving a carbon-lean energy system.
Single European Sky ATM Research Joint Undertaking (SESAR)
SESAR is a PPP responsible for the modernisation of the European air traffic management (ATM) system by coordinating and concentrating all ATM relevant research and innovation efforts in the EU.
Shift2Rail Joint Undertaking
Shift2Rail is the first European rail joint technology initiative to seek focused research and innovation (R&I) and market-driven solutions by accelerating the integration of new and advanced technologies into innovative rail product solutions.
The annual accounts of the above entities are publicly available on their respective websites.
FINANCIAL STATEMENT DISCUSSION AND ANALYSIS
FINANCIAL YEAR 2017 (9)
CONTENTS
|
1. |
CONSOLIDATED FINANCIAL STATEMENTS OF THE EU: FINANCIAL SITUATION 2017 |
93 |
|
1.1. |
REVENUE | 93 |
|
1.2. |
EXPENSES | 93 |
|
1.3. |
ASSETS | 94 |
|
1.4. |
LIABILITIES | 102 |
|
2. |
PROTECTION OF THE EU BUDGET | 103 |
|
3. |
MANAGEMENT OF RISKS AND UNCERTAINTIES OF EU BUDGET IMPLEMENTATION | 105 |
|
3.1. |
MACRO-ECONOMIC ENVIRONMENT | 105 |
|
3.2. |
BUDGETARY CONTINGENT LIABILITIES FOR FINANCIAL ASSISTANCE | 106 |
|
3.3. |
CONTINGENT LIABILITIES RELATING TO BUDGETARY GUARANTEES | 107 |
|
3.4. |
BOOST FOR JOBS, GROWTH AND INVESTMENT | 107 |
|
3.5. |
NEW ENTRANTS' RESERVE (NER) 300 | 108 |
The objective of this Financial Statement Discussion and Analysis (FSDA) is to assist readers to understand the financial position, financial performance and cash flows presented in the consolidated financial statements of the EU. The information presented in this FSDA has not been audited.
1. CONSOLIDATED FINANCIAL STATEMENTS OF THE EU: FINANCIAL SITUATION 2017
1.1. REVENUE
The consolidated revenue of the EU incorporates amounts related to exchange transactions and non-exchange transactions, the latter being the most significant.
The table below provides an overview of the main categories of non-exchange transactions.
Five year trend of revenue from main non-exchange transactions (in EUR millions)

In 2017 the consolidated revenue fell 7 %, to EUR 136,2 billion, when compared to the previous year, mainly due to the following:
|
— |
a decrease of EUR 17 billion in the GNI resources, or 18 % when compared to previous year. This effect can be seen in the above table and primarily reflects the impact of the reduction of payment appropriations for the 2017 budget. The GNI resource is used to finance the part of the budget not covered by any other source of revenue; and |
|
— |
the decrease above was partially compensated by ‘other revenue’ for non-exchange transactions which includes the impact of the budget surplus from 2016, presented under the budgetary adjustment line, to the amount of EUR 6,4 billion. This budget surplus was large due to the under-implementation of programmes in 2016, as explained in the note 2.2 of the budgetary implementation report of 2016. This is a mechanism that indirectly refunds the Member States as it deducts the amount of own resources of the following year (in this case reduced for the financial year of 2017), for that reason the budget surplus is recognised as revenue. |
1.2. EXPENSES
The main component of expenses recognised in the consolidated financial statements is transfer payments under the shared management mode, which includes the following funds: (i) European Agricultural Guarantee Fund (EAGF); (ii) EAFRD and other rural development instruments; (iii) ERDF & CF; and (iv) European Social Fund (ESF).
These funds made up almost 63 % of total expenses in the year ended in 31 December 2017 — the split can be found in the chart below.
Relative weight of the main expenses implemented by the Member States for the financial year of 2017

Expenses incurred under direct management represent the budget implementation by the Commission, executive agencies and by trust funds. Under indirect management the budget is implemented by EU agencies, EU bodies, third countries, international organisations and other entities.
Overall, the expenses incurred under direct and indirect management made up about 19 % of total expenses (EUR 24 billion) and remained stable compared to the previous financial year.
The EU recognises future payment obligations as expenses even if they are not yet shown in the cash-based budgetary accounts. The important amounts are shown under payables and accrued charges for agriculture and rural development and under pension and employee benefits liabilities relating to pension rights acquired by Commissioners, MEPs and staff.
The amount of the consolidated expenses decreased by 11 %, to EUR 128,1 billion, when compared with 2016, mainly resulting from the following effects:
|
— |
expenses under the ERDF & CF decreased by circa 50 %, or by the amount of EUR 17,4 billion, due to fewer expenses incurred relating to the previous programming period (2007-2013); and |
|
— |
for the same reason, expenses under European Agricultural Fund for Rural Development (EAFRD) and other rural development instruments also decreased by EUR 1,2 billion. |
1.3. ASSETS
The most significant items on the asset side of the balance sheet relate to financial assets (loans, available for sale financial assets, cash) and pre-financing amounts, which make up circa 85 % of the assets of the EU.
Composition of the consolidated assets of the EU
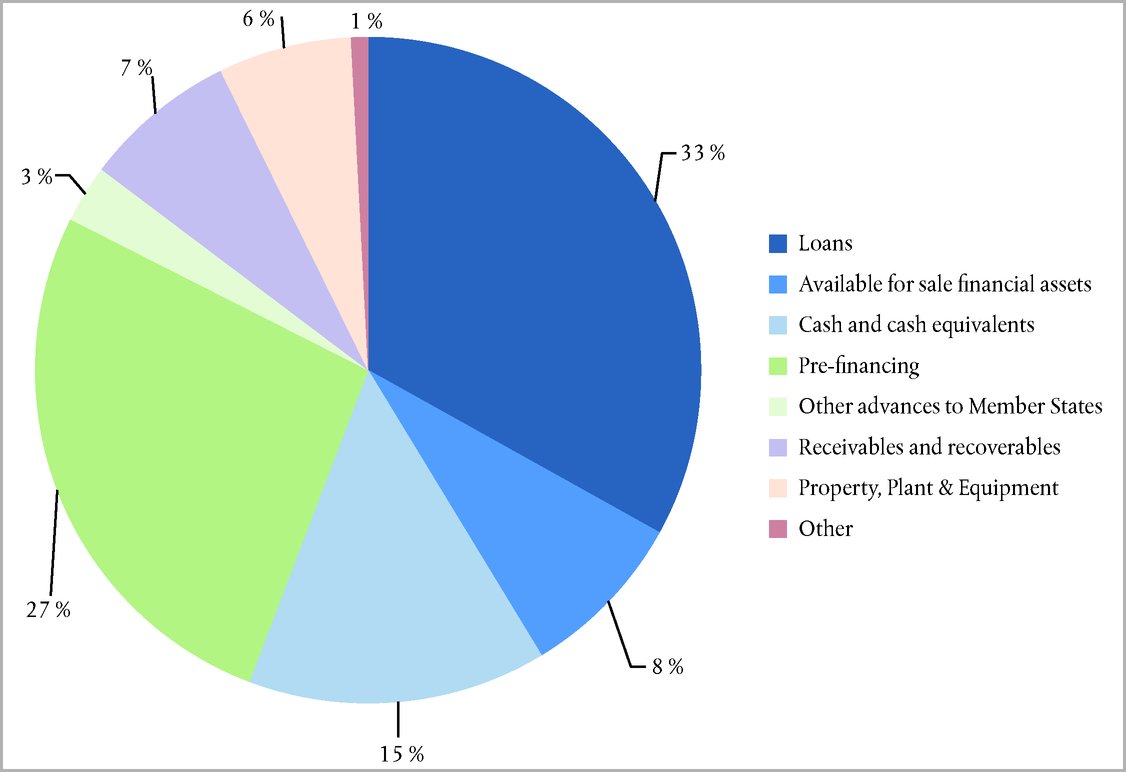
As at 31 December 2017 the total assets were EUR 166,2 billion, reflecting an increase of approximately 2 %. The key changes were:
|
— |
an increase of EUR 3,6 billion in pre-financing stemming from small increases in most policy areas; |
|
— |
an increase of EUR 2,5 billion in financial instruments relating to the endowment of the Guarantee Fund for EFSI operations. This fund has been established to provide a liquidity cushion against potential losses incurred by the EIB in relation to its financing and investment operations eligible for the EFSI EU guarantee under the EFSI Agreement. It will be progressively provisioned and will gradually reach EUR 9,1 billion, which intends to cover 35 % of the total future EU EFSI guarantee obligations; and |
|
— |
an increase of EUR 0,7 billion in Property, plant and equipment (PPE) which relates to further developments of the space assets (Galileo and Copernicus). |
In general, the EU institutions and bodies strive to keep the amounts held as cash and cash equivalents at a low level. The cash balance of EUR 24,1 billion at year-end is lower than in 2016 and is made up of the following main elements:
|
— |
Own resources; the end of year balance includes a total net amount of EUR 8,9 billion to be returned to Member States in early 2018 as result of amending budgets adopted late in 2017; |
|
— |
Fines imposed by the Commission for breach of competition rules of EUR 0,5 billion definitively cashed late in 2017 are also part of the year-end treasury balance; and |
|
— |
The treasury balance also includes the assigned revenue and payment appropriations of EUR 8,4 billion. |
Pre-financing
It should be noted that the level of pre-financing is significantly influenced by the MFF cycle — for example at the beginning of an MFF period one can expect large advances to be paid to Member States under cohesion policy. The Commission makes every effort to ensure that the levels of pre-financing are maintained at an appropriate level. A balance has to be struck between ensuring sufficient funding for the projects and the timely recognition of expenditure.
The total pre-financing (excluding other advances to Member States and contributions to the trust funds Bekou and Africa) on the EU balance sheet amounts to EUR 44,3 billion (2016: EUR 41,6 billion), almost all of which relates to Commission activities. Some 61 % of the Commission's pre-financing concerns shared management, which means that the implementation of the budget is delegated to Member States (the Commission retains a supervisory role).
Commission pre-financing by management mode

The most significant pre-financing amount under shared management mode relates to ERDF & Cohesion Fund (EUR 14,9 billion).
FINANCIAL INSTRUMENTS
The following items are shown in accounting terms as financial instruments in the consolidated financial statements of the EU:
|
— |
Financial Instruments financed by the EU budget: under this type of budget implementation funds are either already disbursed to the fiduciary accounts managed by the entrusted entities and stay available (as cash and cash equivalents and debt securities) to cover future guarantee calls or have been invested in equity; |
|
— |
Financial assets held in guarantee funds for budgetary guarantees: under this type of budget implementation the EU provides guarantees to entrusted entities for which the funding is only partially provisioned via guarantee funds set-up by the Commission and thus creating contingent liabilities for the EU budget — see note 3.3; and |
|
— |
Loans and related borrowings for financial assistance programmes. |
Financial instruments financed by the EU budget
The significance and volume of financial instruments financed by the EU budget under direct and indirect management increases from year to year. The basic concept behind this approach, in contrast to the traditional method of budget implementation by giving grants and subsidies, is that for each euro spent from the budget via financial instruments, the final beneficiary receives more than EUR 1 as financial support due to the leverage effect. This use of the EU budget aims at maximising the impact of the funds available. Financial instruments financed by the EU budget exist in the form of guarantee instruments, equity instruments and loan instruments — see the overview by MFF below. Assets held in these instruments are either kept in cash and cash equivalents or invested in equity instruments and debt securities shown as available for sale financial assets in the consolidated financial statements of the EU.
Available for sale financial assets of financial instruments financed by the EU budget (year-end value)

The following tables provide an overview of financial instruments financed by the EU budget per MFF and their values at 31 December 2017:
|
EUR millions |
|||
|
Related to more than one MFF |
Assets (10) |
Liabilities (11) |
Guarantees (12) |
|
Guarantee and risk-sharing instruments: |
|
|
|
|
Guarantee Facility under the Western Balkan (EDIF) |
28 |
(26) |
— |
|
|
28 |
(26) |
— |
|
Equity instruments: |
|
|
|
|
European Fund for Southeast Europe (EFSE) |
119 |
— |
— |
|
Green for Growth Fund to the Eastern Neighbourhood Region |
70 |
0 |
— |
|
Enterprise Innovation Fund (ENIF) |
18 |
— |
— |
|
MENA Fund for Micro-, Small and Medium Enterprises (SANAD) |
18 |
— |
— |
|
Enterprise Expansion Fund (ENEF) |
10 |
— |
— |
|
Microfinance Initiative for Asia Debt Fund (MIFA) |
8 |
— |
— |
|
|
245 |
0 |
— |
|
Total |
273 |
(26) |
— |
|
MFF 2014-2020 |
Assets |
Liabilities |
Guarantees |
|
Guarantee and risk-sharing instruments: |
|
|
|
|
Horizon 2020 — InnovFin Loan & Guarantee Service for R&I |
941 |
(30) |
(813) |
|
Horizon 2020 — InnovFin SME Guarantee |
694 |
(205) |
(484) |
|
Connecting Europe Facility Debt Instrument (CEF DI) |
524 |
(3) |
(490) |
|
COSME Loan Guarantee Facility |
224 |
(331) |
(2) |
|
Employment and Social Innovation Guarantee Facility (EaSI) |
56 |
(25) |
— |
|
Private Finance for Energy Efficiency Instrument (PF4EE) |
31 |
(1) |
(2) |
|
Cultural and Creative Sector Guarantee Facility |
17 |
(4) |
— |
|
Student Loan Guarantee Facility |
14 |
(1) |
— |
|
SEMED MSME Financial Inclusion Programme |
14 |
— |
(6) |
|
Natural Capital Financing Facility |
12 |
— |
(1) |
|
Eastern Partnership SME Finance Facility |
5 |
(5) |
— |
|
Women in Business Programme in Eastern Partnership |
4 |
— |
(4) |
|
Support for Mongolian Economic Diversification |
2 |
— |
— |
|
|
2 538 |
(604) |
(1 802 ) |
|
Equity instruments: |
|
|
|
|
Horizon 2020 InnovFin Equity Facility for R&I |
312 |
(9) |
— |
|
COSME — Equity Facility for Growth |
45 |
(2) |
— |
|
Risk Capital Facility for the Southern Neighbourhood countries |
20 |
— |
— |
|
Climate Investor One |
16 |
— |
— |
|
Latin American Investment Facility |
13 |
— |
— |
|
Africa Agriculture Trade and Investment Fund |
10 |
— |
— |
|
|
416 |
(12) |
— |
|
Mixed instruments: |
|
|
|
|
EU Deep and Comprehensive Free Trade Area Facility |
70 |
— |
(18) |
|
ElectriFI |
32 |
0 |
— |
|
|
102 |
0 |
(18) |
|
Total |
3 056 |
(615) |
(1 820 ) |
|
MFF Prior to 2014 |
Assets |
Liabilities |
Guarantees |
|
Guarantee and risk-sharing instruments: |
|
|
|
|
Risk Sharing Finance Facility (RSFF) |
763 |
(70) |
(654) |
|
SME Guarantee Facility under CIP |
90 |
(167) |
— |
|
Multi Annual Program (MAP) for Enterprises |
32 |
(32) |
— |
|
SME Guarantee Facility |
12 |
(5) |
— |
|
European Progress Microfinance Mandate |
6 |
(5) |
— |
|
|
904 |
(279) |
(654) |
|
Equity instruments: |
|
|
|
|
High Growth and Innovative SME Facility under CIP |
428 |
(4) |
— |
|
Multi Annual Framework Programme Equity Facility |
217 |
— |
— |
|
European Energy Efficiency Fund |
100 |
— |
— |
|
Marguerite Fund |
79 |
— |
— |
|
Global Energy Efficiency and Renewable Energy Fund |
72 |
— |
— |
|
European Progress Microfinance Facility (PMF) for EaSI |
67 |
— |
— |
|
European Technology Start up Facility 1998 (ETF) |
10 |
— |
— |
|
Technology Transfer Pilot projects |
1 |
— |
— |
|
|
974 |
(4) |
— |
|
Mixed instruments: |
|
|
|
|
Instrument of economic and financial cooperation MEDA |
179 |
(2) |
— |
|
European Neighbourhood and Partnership Instrument (ENPI) |
125 |
(3) |
— |
|
SME Support Loan |
16 |
— |
— |
|
|
320 |
(5) |
— |
|
Total |
2 198 |
(288) |
(654) |
|
Overall Total |
5 526 |
(930) |
(2 473 ) |
Financial assets held in guarantee funds for budgetary guarantees
The Commission has set-up guarantee funds to cover budgetary guarantees (see note 4.1.1 of the consolidated financial statements) given to the EIB group. These guarantee funds are provisioned by payments from the EU budget so as to provide a liquidity cushion against potential losses from guaranteed operations. Payments to the guarantee funds are invested in financial instruments including debt securities, cash and term deposits. At 31 December 2017, the Commission holds financial assets in the:
|
— |
Guarantee Fund for external actions of EUR 2,4 billion; and |
|
— |
EFSI Guarantee Fund of EUR 3,5 billion. |
Loans and related borrowings for financial assistance programmes
Financial support for Member States and third countries in the form of bilateral loans financed from the capital markets with the guarantee of the EU budget is provided by the Commission under decisions of the European Parliament and of the Council.
The Commission, acting on behalf of the EU, currently operates three main programmes:
|
— |
European Financial Stabilisation Mechanism (EFSM); |
|
— |
Balance of Payments (BOP) assistance; and |
|
— |
Macro-financial assistance (MFA), under which it may grant loans. |
The capital required to fund the EU lending is raised on the capital markets or with financial institutions.
At 31 December 2017, the nominal amount of the loans granted for financial assistance under the EFSM and BOP were:
|
EUR billions |
|||||||
|
|
BOP |
EFSM (13) |
TOTAL |
||||
|
|
Latvia |
Romania |
Total |
Ireland |
Portugal |
Total |
|
|
Total granted |
3,1 |
5,0 (14) |
8,1 |
22,5 |
26,0 |
48,5 |
56,6 |
|
Total disbursed at 31.12.2017 |
2,9 |
5,0 |
7,9 |
22,5 |
24,3 |
46,8 |
54,7 |
|
Total repaid at 31.12.2017 |
(2,2 ) |
(2,7 ) |
(4,9 ) |
— |
— |
— |
(4,9 ) |
|
Outstanding amount at 31.12.2017 |
0,7 |
2,3 |
3,0 |
22,5 |
24,3 |
46,8 |
49,8 |
EFSM
EFSM was created to provide financial assistance to all Member States experiencing or seriously threatened with a severe economic financial disturbance caused by exceptional occurrences beyond their control. The EFSM was used to provide financial assistance, conditional on the implementation of reforms, to Ireland and Portugal between 2011 and 2014.
This programme expired and no additional loans can be drawn, though it remains in place for specific tasks such as the lengthening of maturities for loans to Ireland and Portugal and providing bridging loans.
The main points of the EFSM programme are as follows:
Ireland
|
— |
Ireland requested the full total of EUR 22,5 billion granted by the EFSM in December 2010. This amount was disbursed in eight instalments between January 2011 and March 2014; |
|
— |
Ireland has the option to lengthen the maturity of the EFSM loans based on the extension of the maximum weighted average maturity; and |
|
— |
The first repayment of EUR 3,4 billion was scheduled for April 2018. However, Ireland has requested a maturity extension, which was approved and successfully borrowed in the markets in the first quarter of 2018 and this amount has been rescheduled for repayment in two instalments of EUR 2,4 billion and EUR 1 billion in 2025 and 2033 respectively. The second repayment of EUR 0,5 billion is scheduled for October 2018 but again with the possibility of extending the maturity. |
Portugal
|
— |
Portugal has requested EUR 24,3 billion from a total of EUR 26 billion granted by the EFSM in May 2011. This amount was disbursed in seven instalments between May 2011 and November 2014; and |
|
— |
The first repayment of EUR 0,6 billion is scheduled for October 2018 but, as in the case of Ireland, Portugal has the possibility of extending the maturity. |
BOP
The BOP is an assistance programme designed for countries outside the euro area that are experiencing or threatened by difficulties regarding their balance of payments. BOP assistance takes the form of medium-term loans that are conditional on the implementation of policies designed to address underlying economic problems. Typically, balance of payments assistance from the EU is offered in cooperation with the International Monetary Fund (IMF) and other international institutions or countries.
The EU medium-term financial assistance under the BOP facility was activated in November 2008 to help Hungary and subsequently Latvia and Romania, in January and May 2009, to restore market confidence for a total commitment of EUR 14,6 billion. The BOP assistance programme for Hungary expired in 2010 and has been fully repaid in 2016. Both assistance programmes for Latvia and Romania expired in 2012, hence no additional instalments can be disbursed.
Additionally, the two precautionary assistance programmes for Romania expired in 2013 and 2015 respectively without being drawn down.
The main points are as follows:
|
— |
During 2017, the beneficiary Member States of BOP have reimbursed timely and fully a total amount of EUR 1,3 billion out of which EUR 1,2 billion related to a capital reimbursement from Romania, being the remaining related to interests; and |
|
— |
In April 2018, Romania made a capital repayment of EUR 1,2 billion and is expected to make further capital reimbursements EUR 0,1 billion in October 2018. |
MFA
The MFA is a form of financial aid extended by the EU to partner countries outside the EU experiencing a balance of payments crisis. It takes the form of medium/long-term loans or grants, or a combination of these, and is only available to countries benefiting from a disbursing IMF programme.
The outstanding loans at 31 December 2017 under the MFA programme were EUR 3,9 billion at nominal amounts.
1.4. LIABILITIES
The most significant items on the liability side of the balance sheet consists primarily of four key items: (i) pension obligation and other employee benefits liabilities; (ii) borrowings; (iii) payables to third parties and (iv) accrued charges.
Composition of the liabilities on the consolidated balance sheet of the EU
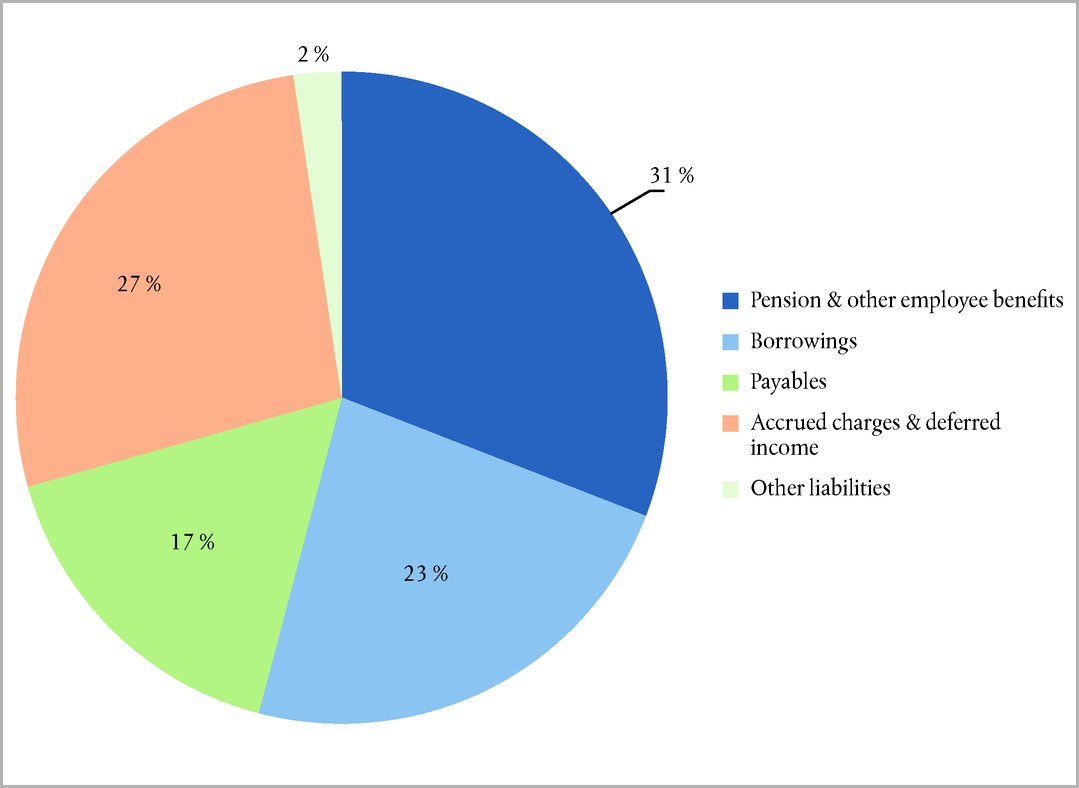
As at 31 December 2017 the total liabilities were EUR 236,5 billion, reflecting an increase of approx. 1 % when compared to the previous year.
The key changes were related to the following effects in:
|
— |
The increase in the total employee benefits liability of EUR 5,9 billion is primarily due to an increase in the net liability of the Pension Scheme of European Officials; |
|
— |
Provisions rose by EUR 1 billion as a consequence of an updated study on JRC dismantlement provision which led to a higher estimate of the obligation. The change relates to the main input of the calculation — the timeframe — that was previously calculated around 20 years and now updated to 40 years; and |
|
— |
Accrued expenses fell by EUR 3,7 billion, which partially compensate the above effects. This decrease in the accrued expenses was due to the fact that the cohesion programmes of the previous MFF are well advanced in the closure phase. |
Overall all other items of the liability remained stable. It is important to note that financial liabilities decreased in the long-term, due to the decrease of borrowings, coupled with an increase of the short term part, this impact is due to BOP and EFSM repayments in 2018 from Romania (EUR 1,35 billion), Ireland (EUR 3,9 billion) and Portugal (EUR 0,6 billion) as expected at the reporting date.
Total cost claims and invoices received and recognised under the payables heading of the balance sheet

Net assets
The excess of liabilities over assets does not mean that the EU institutions and bodies are in financial difficulties, rather it means that certain liabilities will be funded by future annual budgets. Many expenses are recognised under accrual accounting rules in 2017 although they may be actually paid in 2018 or later and funded using future budgets and the related revenues will only be accounted for in future periods. The most significant amounts to be highlighted are the EAGF activities (paid in 2018) and the employee benefits liability (to be paid over the next 30 plus years).
2. PROTECTION OF THE EU BUDGET
Financial corrections and recoveries overview for 2017
An important consideration in implementing the EU budget is the need to ensure the proper prevention or detection and subsequent correction of system weaknesses leading to errors, irregularities and fraud. The Court of Auditors provides in its annual report a statement of assurance on the legality and regularity of transactions underlying the annual accounts, as well as the material level of error in payments. The statement of assurance accompanies the EU annual accounts in its publication in the Official Journal.
The Commission's protective actions mitigate the impact of these errors through two main mechanisms:
|
(1) |
preventive mechanisms (e.g. ex-ante controls, interruptions and suspensions of payments); and |
|
(2) |
corrective mechanisms (primarily financial corrections imposed on or agreed with Member States and recoveries from recipients of EU payments). |
Under the shared management mode (agricultural spending and structural actions), Member States are primarily responsible throughout the expenditure life cycle for ensuring that expenditure paid out from the EU budget is legal and regular.
The protective actions arise following the supervision and checks made by both the Commission and also, in the case of shared management expenditure, Member States on the eligibility of expenditure funded by the EU budget. When deciding on the amount of a financial correction or recovery, the Commission takes into account the nature and seriousness of the breach of applicable law and the financial implications for the EU budget, including cases of deficiencies in management and control systems.
Corrective mechanisms process:

Financial corrections and recoveries are presented at two main stages of the process. Both stages may take place in the same year or in different years:
|
(1) |
Financial corrections and recoveries at confirmation stage: These amounts have been either agreed by the Member State concerned or adopted by a Commission decision. In 2017, the total financial corrections and recoveries confirmed amounted to EUR 2 662 million (2016: EUR 3 777 million), of which EUR 1 826 million resulting from corrective actions. |
Financial corrections and recoveries confirmed in 2017 (*1) — breakdown per policy areas
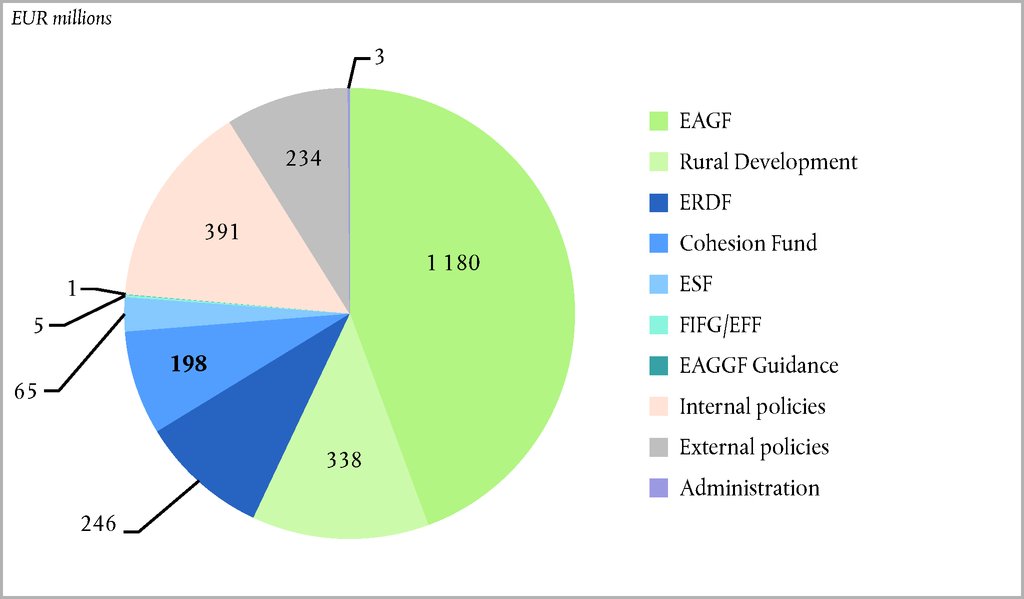
|
(2) |
Financial corrections and recoveries at implementation stage: These amounts represent the final step of the process whereby the observed situation of undue expenditure is definitively corrected. Several implementation mechanisms are foreseen in the sector-based regulatory frameworks. In 2017, the total financial corrections and recoveries implemented amounted to EUR 2 845 million (2016: EUR 3 389 million), of which EUR 1 949 million resulting from corrective actions. The implementation of financial corrections and recoveries may take a number of years mainly due to instalment or deferral decisions granted to Member States under the agricultural policy. Under the Cohesion policy the legal framework foresees the implementation at or after the closure of the programming period. |
Financial corrections and recoveries implemented in 2017 (*1) — breakdown per policy areas
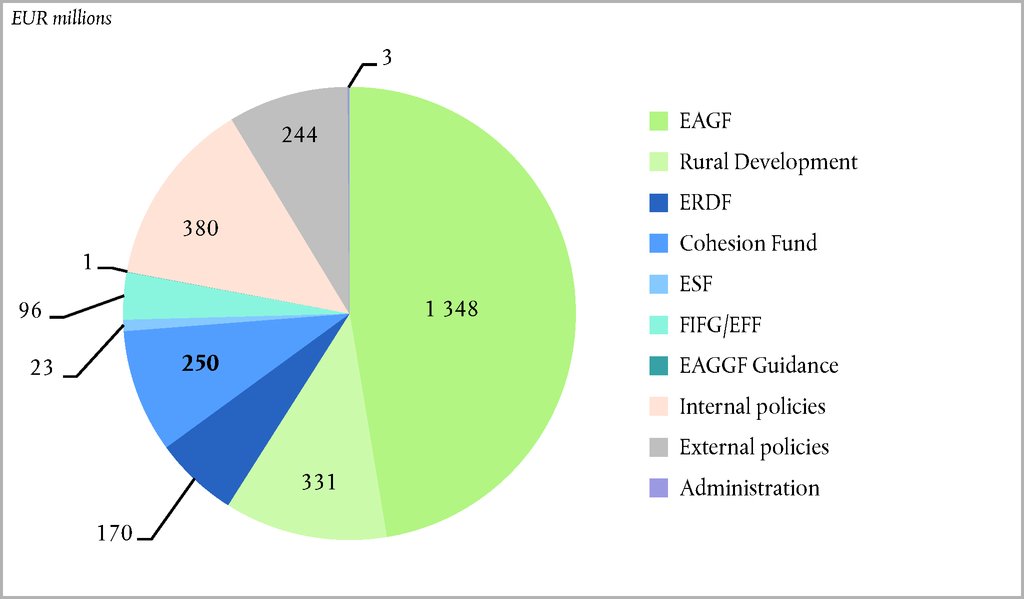
3. MANAGEMENT OF RISKS AND UNCERTAINTIES OF EU BUDGET IMPLEMENTATION
3.1. MACRO-ECONOMIC ENVIRONMENT
The macro-economic environment of the EU (10) has an impact on the ability of EU Member states to meet their funding obligations towards the EU institutions and bodies and thus on the ability of the EU to continue implementing EU policies.
While the broad-based acceleration of global economic activity and trade over the course of last year benefitted the euro area, domestic demand also strengthened, enhanced by above-average business and consumer sentiment, continued policy support, and improving labour markets. The European economy therefore looks set to continue expanding at a solid pace. Robust job creation is expected to continue providing fuel for consumer spending growth. At the same time, investment conditions are set to remain favourable with both domestic and foreign demand expected to strengthen and financing conditions expected to remain loose. The remaining slack in the economy should allow for GDP to continue growing at rates that are higher than the estimated rate of potential growth (around 1,5 %) throughout the forecast horizon. The cyclical momentum in the euro area, however, is forecast to moderate slightly over the course of 2018 as the brisk pace of employment growth starts to ease.
Euro area and EU GDP is estimated to have grown by 2,4 % in 2017 and is forecast to grow by 2,3 % in 2018 before easing somewhat to 2,0 % in 2019.
While labour market conditions have improved across all Member States, unemployment rates continue to vary significantly. Nevertheless, the forecast for GDP growth has been revised up for a large majority of euro area Member States in each of the years covered by the forecast and growth rates are expected to converge further. Due to remaining slack in the labour market, wage pressures and core inflation are expected to rise only gradually. Temporary factors related to energy prices will therefore continue to play a major role in inflation developments and will maintain the headline harmonised indices of consumer prices (HICP) inflation rate above core inflation over much of 2018. After 1,5 % in 2017, HICP inflation is forecast to average 1,5 % over 2018 before edging-up to 1,6 % in 2019.
Risks to the outlook for GDP and inflation remain broadly balanced. While there appears to be room for growth to exceed expectations in the coming quarters, this could lead to growth-limiting supply-side constraints kicking in earlier than otherwise expected. At the same time, benign market expectations concerning asset price valuations appear vulnerable to a re-assessment of sentiment and fundamentals. Risks related to the UK's vote to leave the EU remain, as do downside risks associated with geopolitical tensions and a shift towards more inward looking and protectionist policies.
Momentum in the global economy remains strong, as the broad-based cyclical upswing continues, buoyed by the rebound in investment and trade, still favourable financial conditions and a supportive policy mix. Higher commodity prices are also proving supportive for commodity exporters. The near-term outlook is slightly stronger than projected in autumn 2017, with global GDP growth outside the EU now expected at 4,1 % in both 2018 and 2019, compared to 3,8 % in 2017.
3.2. BUDGETARY CONTINGENT LIABILITIES FOR FINANCIAL ASSISTANCE
The EU borrowing and lending activities for financial assistance programmes are non-budget operations. In general, funds raised are on-lent back-to-back to the beneficiary country, i.e. with the same coupon, maturity and amount. Notwithstanding the back-to-back methodology, the debt service of the funding instruments is a legal obligation of the EU, which will ensure that all payments are made fully and in a timely manner. The Commission has put procedures in place to ensure the repayment of borrowings even in case of a loan default.
Borrowings of the EU constitute direct and unconditional obligations of the EU and are guaranteed by the EU Member States (budgetary contingent liabilities). Borrowings undertaken to fund loans to countries outside the EU are covered by the Guarantee Fund for external actions. Should a beneficiary Member State default, the debt service will be drawn from the available treasury balance of the Commission, if possible. If that would not be possible, the Commission would draw the necessary funds from the Member States. EU Member States are legally obliged, according to the EU own resources legislation (Article 14 of Council Regulation 609/2014), to make available sufficient funds to meet the EU’s obligations. Thus investors are only exposed to the credit risk of the EU, not to that of the beneficiary of loans funded. ‘Back-to-back’ lending ensures that the EU budget does not assume any interest rate or foreign exchange risk.
For each country programme, the EP, the Council and the Commission decisions determine the overall granted amount, the number of instalments to be disbursed, and the maximum (average) maturity of the loan package. Subsequently, the Commission and the beneficiary country agree the loan/funding parameters, in particular the maturity of instalments. In addition, except for the first one, all instalments of the loan depend on compliance with policy conditions, in the context of a joint EU/International Monetary Fund (IMF) financial assistance, which is another factor influencing the timing of funding operations. This implies that the timing and maturities of issuances are dependent on the related EU lending activity. Funding is exclusively denominated in euro and the maturity spectrum is from 3 to 30 years.
The following table provides an overview of the planned reimbursement schedule in nominal value for outstanding EFSM and BOP loan amounts at 31 December 2017:
|
EUR billions |
|||||||
|
|
BOP |
EFSM |
TOTAL |
||||
|
|
Latvia |
Romania |
Total |
Ireland |
Portugal |
Total |
|
|
2018 |
— |
1,3 (15) |
1,3 |
3,9 (16) |
0,6 |
4,5 |
5,8 |
|
2019 |
0,5 |
1,0 |
1,5 |
— |
— |
— |
1,5 |
|
2021 |
— |
— |
— |
3,0 |
6,8 |
9,8 |
9,8 |
|
2022 |
— |
— |
— |
— |
2,7 |
2,7 |
2,7 |
|
2023 |
— |
— |
— |
2,0 |
1,5 |
3,5 |
3,5 |
|
2024 |
— |
— |
— |
0,8 |
1,8 |
2,6 |
2,6 |
|
2025 |
0,2 |
— |
0,2 |
— |
— |
— |
0,2 |
|
2026 |
— |
— |
— |
2,0 |
2,0 |
4,0 |
4,0 |
|
2027 |
— |
— |
— |
1,0 |
2,0 |
3,0 |
3,0 |
|
2028 |
— |
— |
— |
2,3 |
— |
2,3 |
2,3 |
|
2029 |
— |
— |
— |
1,0 |
0,4 |
1,4 |
1,4 |
|
2031 |
— |
— |
— |
— |
2,2 |
2,2 |
2,2 |
|
2032 |
— |
— |
— |
3,0 |
— |
3,0 |
3,0 |
|
2035 |
— |
— |
— |
2,0 |
— |
2,0 |
2,0 |
|
2036 |
— |
— |
— |
— |
1,0 |
1,0 |
1,0 |
|
2038 |
— |
— |
— |
— |
1,8 |
1,8 |
1,8 |
|
2042 |
— |
— |
— |
1,5 |
1,5 |
3,0 |
3,0 |
|
Total |
0,7 |
2,3 |
3,0 |
22,5 |
24,3 |
46,8 |
49,8 |
The Inter-governmental financial stability mechanisms European Financial Stability Facility (EFSF) and European Stability Mechanism (ESM) are outside the EU Treaty framework and thus not included in the consolidated annual accounts of the EU.
3.3. CONTINGENT LIABILITIES RELATING TO BUDGETARY GUARANTEES
The EU has given guarantees to the EIB Group on loans granted outside of the EU and on debt and equity operations covered by the EFSI guarantee. At 31 December 2017, the EU shows in the notes to its consolidated financial statements (see note 4.1.1) contingent liabilities for both guarantees. In order to mitigate the risk guarantee calls by the EIB Group could have on the EU budget, the EU has created dedicated guarantee funds, i.e. the Guarantee Fund for external actions and the EFSI Guarantee Fund.
The Guarantee Fund for external actions is provisioned by the EU budget so as to cover 9 % of the guaranteed loans for EIB external lending mandate activities to third countries outstanding at year-end. At 31 December 2017, the total asset value of EUR 2,2 billion covers an exposure of amounts disbursed of EUR 20 billion, amounts signed of EUR 28,9 billion, and a ceiling of EUR 37,5 billion.
The EFSI Guarantee Fund started its activity in 2016 and was initially expected to be financed out of a total of 50 % a maximum exposure of EUR 16 billion of the EU, thus the fund should gradually (by 2022) reach EUR 8 billion. In December 2017, the EFSI Regulation has been amended, as result, the maximum EU EFSI guarantee was increased up to EUR 26 billion, and the boundary for the guarantee fund decreased to 35 %. Therefore, based on the impact of the amendment the EFSI Guarantee Fund is now expected to reach the total amount of EUR 9,1 billion.
The total assets that make up the EFSI Guarantee Fund at 31 December 2017 is EUR 3,5 million and that covers an exposure of disbursed amounts of EUR 10,1 billion and of amounts signed of EUR 13,5 billion (including amounts disbursed). The EFSI Guarantee Fund currently operates in both EUR and USD.
3.4. BOOST FOR JOBS, GROWTH AND INVESTMENT
Investment Plan for Europe
In 2015 the Commission, together with the EIB, launched the Investment Plan for Europe, which includes the European Fund for Strategic Investments (EFSI), created with an initial EUR 21 billion of EU money and with the key aim of attracting private investment. Forecasts point to an additional 700 000 jobs and a 0,7 % increase in the EU’s gross domestic product by 2020 thanks to the investments approved in 2015 and 2016. This shows that, even in sectors and regions hard hit by the crisis a decade ago, strategic investment is boosting jobs and growth across the EU. Following the agreement in principle reached by the European Parliament and Member States in September, the Parliament voted in December to adopt a Regulation extending and enhancing the European Fund for Strategic Investments. The timeline of the new and improved EFSI 2.0 has been extended from mid-2018 to the end of 2020, and its investment target has been increased from EUR 315 billion to at least EUR 500 billion.
In 2017 the Fund remained firmly on track to mobilise at least EUR 315 billion in additional investments in the real economy by mid-2018. It was active in all 28 Member States and was expected to trigger around EUR 256 billion in total investments by the end of 2017.
A total of 357 infrastructure and innovation projects, representing financing of EUR 39,2 billion, had been approved under the Fund by the end of the year. In addition, 347 financing agreements for small and medium-sized enterprises, worth EUR 11,9 billion, had been approved. Around 539 000 such businesses were expected to benefit from this.
In addition, advisory support for project development and preparation was stepped up through the European Investment Advisory Hub, and projects looking for financing were given the necessary visibility on the European Investment Project Portal.
The European Fund for Strategic Investments supports investment in sectors of strategic importance to the EU economy, including energy, transport, digital technologies, research, development and innovation, environment and resource efficiency, social infrastructure and small companies. This includes investment in social entrepreneurship, social impact and social innovation.
Continuing Support for EU member States
The Structural Reform Support Programme was set up in May 2017 with a budget of EUR 142,8 million for the 2017-2020 period. At the request of Member States the Programme finances tailor-made technical support to help them in the key areas of their reform efforts. Through the Programme the Commission provides targeted support that reinforces the capacity of Member States to design and implement reforms they consider necessary to make their economies more competitive and investment friendly. This technical support covers reforms in the areas of governance and public administration, public financial management, the business environment, labour markets, education, health and social services, the financial sector and access to finance. It is available to all EU Member States, is demand driven and requires no co-financing.
The Programme is implemented by the Structural Reform Support Service, in cooperation with other relevant Commission departments. So far the Service has engaged with 15 Member States to carry out more than 150 support projects. Under the 2018 project cycle it has received more than 400 requests for support from over 20 Member States, leading to substantial excess demand for the Programme’s budget, which is set at EUR 30,5 million for the year.
The EU continued to provide post-programme support to Ireland, Spain, Cyprus, Portugal and Romania. Good progress was again made in the course of the year in implementing the Greek programme, which was designed to create the conditions for the return of confidence and to lay the foundations for a lasting economic recovery in Greece. The second review was concluded in July, allowing the third tranche of funding from the European Stability Mechanism, amounting to EUR 8,5 billion, to be authorised. The third review was ongoing in December, and a staff-level agreement was reached early in that month. Greece also continued to receive economic support through the Investment Plan for Europe.
The Structural Reform Support Service has also taken up special assignments to help coordinate the response to the refugee crisis in Greece and to implement the EU Aid Programme for the Turkish Cypriot community.
3.5. NEW ENTRANTS' RESERVE (NER) 300
The NER 300 fund originates from the sale of the Emission Trading Scheme allowances and belongs to the Member States who use the money to finance innovative low-carbon energy demonstration projects. The Commission manages the programme on behalf of the Member States, while the EIB is responsible for the asset management of the NER 300 Fund and acts as a technical advisor, under the Cooperation Agreement with the Commission. Since neither the revenues from the allowances nor the expenses for the projects financed are part of the EU budget, these amounts are not accounted for in the EU accounts.
BUDGETARY IMPLEMENTATION REPORTS AND EXPLANATORY NOTES (11)
CONTENTS
| EU BUDGET RESULT | 111 |
| STATEMENTS OF COMPARISON OF BUDGET AND ACTUAL AMOUNTS | 112 |
| NOTES TO THE BUDGETARY IMPLEMENTATION REPORTS | 115 |
|
1. |
THE EU BUDGET FRAMEWORK | 115 |
|
1.1. |
MULTIANNUAL FINANCIAL FRAMEWORK 2014-2020 | 115 |
|
1.2. |
MFF DETAILED HEADINGS (PROGRAMS) | 117 |
|
1.3. |
ANNUAL BUDGET | 117 |
|
1.4. |
REVENUE | 117 |
|
1.5. |
CALCULATION OF THE BUDGET RESULT | 119 |
|
1.6. |
RECONCILIATION OF ECONOMIC RESULT WITH BUDGET RESULT | 119 |
|
2. |
IMPLEMENTATION OF THE 2017 EU BUDGET — COMMENTARY | 121 |
|
2.1. |
REVENUE | 121 |
|
2.2. |
EXPENDITURE | 121 |
|
3. |
IMPLEMENTATION OF EU BUDGET REVENUE | 123 |
|
3.1. |
SUMMARY OF THE IMPLEMENTATION OF EU BUDGET REVENUE | 123 |
|
4. |
IMPLEMENTATION OF EU BUDGET EXPENDITURE | 124 |
|
4.1. |
MFF: BREAKDOWN & CHANGES IN COMMITMENT & PAYMENT APPROPRIATIONS | 124 |
|
4.2. |
MFF: IMPLEMENTATION OF COMMITMENT APPROPRIATIONS | 125 |
|
4.3. |
MFF: IMPLEMENTATION OF PAYMENT APPROPRIATIONS | 127 |
|
4.4. |
MFF: MOVEMENTS IN COMMITMENTS OUTSTANDING (RAL) | 128 |
|
4.5. |
MFF: COMMITMENTS OUTSTANDING BY YEAR OF ORIGIN | 129 |
|
4.6. |
DETAILED MFF: BREAKDOWN & CHANGES IN COMMITMENT & PAYMENT APPROPRIATIONS | 130 |
|
4.7. |
DETAILED MFF: IMPLEMENTATION OF COMMITMENT APPROPRIATIONS | 136 |
|
4.8. |
DETAILED MFF: IMPLEMENTATION OF PAYMENT APPROPRIATIONS | 143 |
|
4.9. |
DETAILED MFF: MOVEMENTS IN COMMITMENTS OUTSTANDING (RAL) | 149 |
|
4.10. |
DETAILED MFF: COMMITMENTS OUTSTANDING BY YEAR OF ORIGIN | 154 |
|
5. |
IMPLEMENTATION OF THE BUDGET BY INSTITUTION | 159 |
|
5.1. |
IMPLEMENTATION OF BUDGET REVENUE | 159 |
|
5.2. |
IMPLEMENTATION OF COMMITMENT APPROPRIATIONS | 160 |
|
5.3. |
IMPLEMENTATION OF PAYMENT APPROPRIATIONS | 161 |
|
6. |
IMPLEMENTATION OF THE AGENCIES' BUDGET | 162 |
|
6.1. |
BUDGET REVENUE | 162 |
|
6.2. |
COMMITMENT AND PAYMENT APPROPRIATIONS BY AGENCY | 164 |
EU BUDGET RESULT
|
EUR million |
||
|
|
2017 |
2016 |
|
Revenue for the financial year |
139 691 |
144 717 |
|
Payments against current year appropriations |
(135 764 ) |
(135 180 ) |
|
Payment appropriations carried over to year N+1 |
(1 796 ) |
(1 655 ) |
|
Cancellation of unused appropriations carried over from year N-1 |
40 |
63 |
|
Evolution of assigned revenue |
(1 450 ) |
(1 367 ) |
|
Exchange rate differences for the year |
(166) |
(173) |
|
Budget result |
555 |
6 405 |
STATEMENTS OF COMPARISON OF BUDGET AND ACTUAL AMOUNTS
BUDGET REVENUE
|
EUR million |
|||||
|
|
Initial budget adopted |
Final adopted budget |
Entitlements established |
Revenue |
|
|
1 |
Own resources |
131 718 |
115 484 |
115 455 |
115 416 |
|
|
11 — Sugar levies |
133 |
133 |
134 |
134 |
|
|
12 — Customs duties |
21 334 |
20 374 |
20 364 |
20 325 |
|
|
13 — VAT |
16 599 |
16 620 |
16 584 |
16 584 |
|
|
14 — GNI |
93 652 |
78 356 |
78 279 |
78 279 |
|
|
15 — Correction of budgetary imbalances |
— |
— |
94 |
94 |
|
|
16 — Reduction of GNI based contribution of the Netherlands and Sweden |
— |
— |
(0) |
(0) |
|
3 |
Surpluses, balances and adjustments |
— |
6 405 |
6 416 |
6 416 |
|
4 |
Revenue accruing from persons working with the institutions and other union bodies |
1 490 |
1 490 |
1 495 |
1 484 |
|
5 |
Revenue accruing from the administrative operation of the institutions |
70 |
70 |
611 |
587 |
|
6 |
Contributions and refunds in connection with Union agreements and programmes |
60 |
60 |
12 504 |
12 179 |
|
7 |
Default interest and fines |
1 120 |
3 230 |
11 387 |
3 573 |
|
8 |
Borrowing and lending operations |
7 |
7 |
43 |
28 |
|
9 |
Miscellaneous revenue |
25 |
25 |
15 |
8 |
|
Total |
134 490 |
126 771 |
147 926 |
139 691 |
|
BUDGET EXPENDITURE: COMMITMENTS BY MULTIANNUAL FINANCIAL FRAMEWORK (MFF) HEADING
|
EUR million |
|||||
|
MFF Heading |
Initial adopted budget |
Final adopted budget |
Total appropriations available |
Commitments made |
|
|
1 |
Smart and inclusive growth |
74 899 |
75 399 |
85 181 |
83 268 |
|
|
1a: Competitiveness for growth and jobs |
21 312 |
21 312 |
24 508 |
22 654 |
|
|
1b: Economic, social and territorial cohesion |
53 587 |
54 087 |
60 673 |
60 614 |
|
2 |
Sustainable growth: natural resources |
58 584 |
58 569 |
62 806 |
60 859 |
|
|
of which: Market related expenditure and direct payments |
42 613 |
42 611 |
45 830 |
44 759 |
|
3 |
Security and citizenship |
4 284 |
4 284 |
4 472 |
4 124 |
|
4 |
Global Europe |
10 162 |
10 713 |
12 382 |
11 814 |
|
5 |
Administration |
9 395 |
9 395 |
10 190 |
9 794 |
|
|
of which: Administrative expenditure of the institutions |
3 921 |
3 921 |
4 344 |
4 142 |
|
6 |
Compensations |
— |
— |
— |
— |
|
8 |
Negative reserve and deficit carried over from the previous financial year |
— |
— |
— |
— |
|
9 |
Special Instruments |
534 |
1 472 |
1 544 |
1 291 |
|
Total |
157 858 |
159 831 |
176 576 |
171 150 |
|
BUDGET EXPENDITURE: PAYMENTS BY MULTIANNUAL FINANCIAL FRAMEWORK (MFF) HEADING
|
EUR million |
|||||
|
MFF Heading |
Initial adopted budget |
Final adopted budget |
Total appropriations available |
Payments made |
|
|
1 |
Smart and inclusive growth |
56 522 |
49 840 |
61 168 |
57 030 |
|
|
1a: Competitiveness for growth and jobs |
19 321 |
20 065 |
24 370 |
21 376 |
|
|
1b: Economic, social and territorial cohesion |
37 201 |
29 775 |
36 797 |
35 654 |
|
2 |
Sustainable growth: natural resources |
54 914 |
54 467 |
58 575 |
56 743 |
|
|
of which: Market related expenditure and direct payments |
42 563 |
42 558 |
45 975 |
44 695 |
|
3 |
Security and citizenship |
3 787 |
2 793 |
2 994 |
2 867 |
|
4 |
Global Europe |
9 483 |
8 938 |
10 944 |
9 793 |
|
5 |
Administration |
9 395 |
9 392 |
10 977 |
9 656 |
|
|
of which: Administrative expenditure of the institutions |
3 921 |
3 921 |
4 841 |
4 085 |
|
6 |
Compensations |
— |
— |
— |
— |
|
8 |
Negative reserve and deficit carried over from the previous financial year |
— |
— |
— |
— |
|
9 |
Special Instruments |
390 |
1 341 |
1 414 |
1 291 |
|
Total |
134 490 |
126 771 |
146 071 |
137 379 |
|
NOTES TO THE BUDGETARY IMPLEMENTATION REPORTS
1. THE EU BUDGET FRAMEWORK
The budgetary accounts are kept in accordance with the Financial Regulation (FR) and its rules of application. The general budget is the instrument which provides for and authorises the Union's revenue and expenditure every year, within the ceilings and other provisions laid down in the Multiannual Financial Framework in line with the legislative acts concerning multiannual programmes adopted under that framework.
1.1. MULTIANNUAL FINANCIAL FRAMEWORK 2014-2020
|
EUR million |
||||||||||
|
|
2014 |
2015 |
2016 |
2017 |
2018 |
2019 |
2020 |
Total |
||
|
52 756 |
77 986 |
69 304 |
73 512 |
76 420 |
79 924 |
83 661 |
513 563 |
||
|
16 560 |
17 666 |
18 467 |
19 925 |
21 239 |
23 082 |
25 191 |
142 130 |
||
|
36 196 |
60 320 |
50 837 |
53 587 |
55 181 |
56 842 |
58 470 |
371 433 |
||
|
49 857 |
64 692 |
64 262 |
60 191 |
60 267 |
60 344 |
60 421 |
420 034 |
||
|
of which: market related expenditure and direct payments |
43 779 |
44 190 |
43 951 |
44 146 |
44 163 |
44 241 |
44 264 |
308 734 |
||
|
1 737 |
2 456 |
2 546 |
2 578 |
2 656 |
2 801 |
2 951 |
17 725 |
||
|
8 335 |
8 749 |
9 143 |
9 432 |
9 825 |
10 268 |
10 510 |
66 262 |
||
|
8 721 |
9 076 |
9 483 |
9 918 |
10 346 |
10 786 |
11 254 |
69 584 |
||
|
of which: Administrative expenditure of the institutions |
7 056 |
7 351 |
7 679 |
8 007 |
8 360 |
8 700 |
9 071 |
56 224 |
||
|
29 |
— |
— |
— |
— |
— |
— |
29 |
||
|
— |
— |
— |
— |
— |
— |
— |
— |
||
|
— |
— |
— |
— |
— |
— |
— |
— |
||
|
Commitment appropriations |
121 435 |
162 959 |
154 738 |
155 631 |
159 514 |
164 123 |
168 797 |
1 087 197 |
||
|
Total payment appropriations |
135 762 |
140 719 |
130 694 |
142 906 |
154 565 |
159 235 |
162 406 |
1 026 287 |
||
The above table shows the Multiannual Financial Framework (MFF) ceilings at current prices. 2017 was the fourth financial year covered by the MFF 2014-2020. The overall ceiling for commitment appropriations for 2017 was EUR 155 631 million, equivalent to 1,04 % of the EU GNI, whilst the corresponding ceiling for payment appropriations was EUR 142 906 million, or 0,95 % of the EU GNI valid throughout the budgetary year 2017.
New flexibility provisions have been agreed for the 2014-2020 MFF. One of the new provisions is a possibility to transfer unspent margins under the payment ceilings to the following years — via the Global Margin for Payments in the framework of the technical adjustment of the MFF for the following year. Therefore, the unspent amount from 2015 (EUR 1 288 million in current prices) and 2016 (EUR 13 991 million in current prices) was transferred to the years 2018-2020 and the ceilings of 2015, 2016 and 2018-2020 were adjusted accordingly — see the above mentioned technical adjustment of the MFF for 2017 and the technical adjustment for 2018 (COM(2017) 220 of 24 May 2017).
On 24 May 2017 the Commission adopted a Communication on technical adjustment of the financial framework for 2018 in line with movements in GNI (ESA 2010) (COM(2017) 220 of 24 May 2017). Following the entry into force Council Regulation 2017/1123 amending MFF Regulation 1311/2013 (OJ L 163, 24.6.2017) as a result of the mid-term review/revision, the figures included in the Communication of 24 May 2017 in respect of the Emergency Aid Reserve and the Flexibility Instrument were updated and replaced in the Communication of 15 September 2017 (COM(2017) 473 final). The adjustments of figures in this Communication result directly from the amendment of the MFF Regulation by Regulation (EU, Euratom) 2017/1123 and did not deviate from the provisions of Article 6(4) of the MFF Regulation, according to which no further technical adjustments than those referred to in Article 6(1) are made either during the year or ex-post. The newly introduced technical adjustment for the Flexibility instrument according to Art 6(1)f is provided for the first time.
An explanation of the various headings of the MFF is given below:
Heading 1 — Smart and inclusive growth
This heading is divided into two separate, but interlinked components:
|
1a |
Competitiveness for growth and jobs, encompassing expenditure on research and innovation, education and training, Connecting Europe Facility, social policy, the internal market and accompanying policies. |
|
1b |
Economic, social and territorial cohesion, designed to enhance convergence of the least developed Member States and regions, to complement the EU strategy for sustainable development outside the less prosperous regions and to support inter regional cooperation. |
Heading 2 — Sustainable growth: natural resources
Heading 2 includes the common agricultural and fisheries policies, and the environmental measures, in particular the Life + program.
Heading 3 — Security and citizenship
Heading 3 (Security and citizenship) reflects the growing importance attached to certain fields where the EU has been assigned particular tasks — justice and home affairs, border protection, immigration and asylum policy, public health and consumer protection, culture, youth, information and dialogue with citizens.
Heading 4 — Global Europe
Heading 4 covers all external action, including development cooperation, humanitarian aid, pre-accession and neighbourhood instruments. The EDF remains outside of the EU budget and is not part of the MFF.
Heading 5 — Administration
This heading covers administrative expenditure for all institutions, pensions and the European Schools. For the Institutions other than the Commission, these costs make up the total of their expenditure.
Heading 6 — Compensations
In accordance with the political agreement that new Member States should not become net-contributors to the budget at the very beginning of their membership, compensation was foreseen under this heading. This amount was available as transfers to them to balance their budgetary receipts and contributions.
Heading 9 — Special instruments
Flexibility mechanisms enable the EU to mobilise the necessary funds to react to unforeseen events such as crisis and emergency situations. Their scope, financial allocation and operating modalities are provided for in the MFF regulation and the Interinstitutional Agreement. In the current context of reduced expenditure, they also ensure that budgetary resources can respond to evolving priorities, so that every euro is used where it is most needed. Most of the flexibility mechanisms are therefore kept outside the MFF and the funding can be mobilised above the expenditure ceilings.
1.2. MFF DETAILED HEADINGS (PROGRAMS)
The headings of the MFF are further broken down into detailed headings, corresponding to the main spending programs (e.g. Horizon 2020, Erasmus+ etc.). Underlying legal bases for budget implementation are adopted at this program level. Programs are the commonly used structure for reporting on implementation and results. For this reason, tables by program have been introduced also in these budgetary implementation reports (see tables 4.6 — 4.10 below).
1.3. ANNUAL BUDGET
Every year, the Commission estimates all the Institutions' revenue and expenditure for the year and draws up a draft budget which it sends to the budgetary authority. On the basis of this draft budget, the Council sets out its position, which is then the subject of negotiations between the two arms of the budgetary authority. The President of the EP declares that the joint draft has been finally adopted, thus making the budget enforceable. During the year in question, amending budgets are adopted. The task of executing the budget is mainly the responsibility of the Commission.
The budget structure for the Commission consists of administrative and operational appropriations. The other Institutions have only administrative appropriations. Furthermore, the budget distinguishes between two types of appropriations: non-differentiated and differentiated. Non-differentiated appropriations are used to finance operations of an annual nature (which comply with the principle of annuality). Differentiated appropriations are used in order to reconcile the principle of annuality with the need to manage multiannual operations. Differentiated appropriations are split into commitment and payment appropriations:
|
— |
commitment appropriations: cover the total cost of the legal obligations entered into for the current financial year for operations extending over a number of years. However, budgetary commitments for actions extending over more than one financial year may be broken down over several years into annual instalments where the basic act so provides. |
|
— |
payment appropriations: cover expenditure arising from commitments entered into in the current financial year and/or earlier financial years. |
In the accounts, the types of funding are grouped into two main items:
|
— |
Final adopted budget appropriations; and |
|
— |
Additional appropriations containing:
|
All funding types together form the available appropriations.
1.4. REVENUE
1.4.1. Own resources revenue
The vast majority of revenue comes from own resources, which consist of the following categories:
|
(1) |
Traditional own resources (TOR): usually account for +/- 15 % of own resource revenue. |
|
(2) |
Value added tax (VAT) based resource: usually accounts for around 13 % of own resource revenue. |
|
(3) |
Gross national income (GNI) based resource: usually accounts for +/- 72 % of own resource revenue. |
The allocation of own resources is made in accordance with the rules laid down in the Council Decision No. 2014/335/EU, Euratom of 26 May 2014 on the system of the EU's own resources (ORD 2014). This decision has entered into force on 1 October 2016 and applies retroactively from 1 January 2014. The effects for 2014 and 2015 have been taken into account in the 2016 budgetary year.
The total amount of own resources allocated to the Union to cover annual appropriations for payments shall not exceed 1,20 % of the sum of all the Member States' GNIs.
1.4.2. Traditional own resources (TOR)
Traditional own resources (TOR) consist of customs duties (levied on imports from third countries) and sugar levies (paid by sugar producers to finance expenditure on the sugar common organisation of the market) levied on economic operators and collected by Member States on behalf of the EU. However, Member States keep 20 % as a compensation for their collection costs. All established traditional own resource amounts must be entered in one or other of the accounts kept by the competent authorities:
|
— |
In the ordinary accounts provided for in Article 6(3) of Regulation No 609/2014: all amounts recovered or guaranteed. |
|
— |
In the separate accounts provided for also in the above Article: all amounts not yet recovered and/or not guaranteed; amounts guaranteed but challenged may also be entered in this account. |
Traditional own resources must be entered in the Commission's account with the treasury or national central bank by the Member State at the latest on the first working day following the 19th day of the second month following the month during which the entitlement was established (or recovered in the case of the separate account).
1.4.3. Value added tax (VAT)
Value added tax (VAT) is levied on Member States' VAT bases, which are harmonised for this purpose in accordance with EU rules. However, the VAT base is capped at 50 % of each Member State’s GNI. The uniform VAT rate applied is fixed at 0,30 % except for the period 2014-2020 in which the rate of call for Germany, the Netherlands and Sweden was fixed at 0,15 %.
1.4.4. Gross national income (GNI)
The resource based on gross national income (GNI) is used to finance the part of the budget not covered by any other sources of revenue. The same percentage rate is levied on each Member States' GNI, which is established in accordance with EU rules.
VAT and GNI-based resources are determined on the basis of forecasts of relevant bases made when the draft budget is being prepared. These forecasts are subsequently revised and updated during the budget year in question by means of an amending budget. Differences between the amounts due by the Member States by reference to the actual bases and the sums actually paid on the basis of the (revised) forecasts, either positive or negative, are called by the Commission from the Member States for the first working day of June of the second year following the budget year in question. Corrections may still be made to the actual VAT and GNI bases during the subsequent four years, unless a reservation is issued. These reservations have to be seen as potential claims on the Member States for uncertain amounts as their financial impact cannot be estimated with accuracy. When the exact amount can be determined, the corresponding VAT and GNI-based resources are called either in connection with the VAT and GNI balances exercise or by individual calls for funds.
1.4.5. UK correction
A budgetary imbalance correction mechanism in favour of the United Kingdom (reducing their own resource payments while increasing the payments of other Member States) was instituted by the European Council in Fontainebleau (June 1984). Germany, Austria, Sweden and Netherlands benefit from a reduced financing of the UK correction (restricted to one fourth of their normal share).
1.4.6. Gross reduction
The European Council of 7-8 February 2013 concluded that Denmark, the Netherlands and Sweden should benefit from gross reductions in their annual contributions based on GNI for the period 2014-2020 and that Austria is to benefit from gross reductions for the period 2014-2016 only. The annual reductions are as follows: Denmark EUR 130 million, the Netherlands EUR 695 million and Sweden EUR 185 million.
1.5. CALCULATION OF THE BUDGET RESULT
The budget result of the EU is returned to the Member States during the following year through deduction of their amounts due for that year.
The amounts of own resources entered in the accounts are those credited during the course of the year to the accounts opened in the Commission's name by the governments of the Member States. Revenue comprises also, in the case of a surplus, the budget result for the previous financial year. The other revenue entered in the accounts is the amount actually received during the course of the year.
For the purposes of calculating the budget result for the year, expenditure comprises payments made against the year's appropriations plus any of the appropriations for that year that are carried over to the following year. Payments made against the year's appropriations means payments that are made by the Accounting Officer by 31 December of the financial year. For the EAGF, payments are those effected by the Member States between 16 October N-1 and 15 October N, provided that the Accounting Officer was notified of the commitment and authorisation by 31 January N+1. EAGF expenditure may be subject to a conformity decision following controls in the Member States.
The budget result comprises two elements: the result of the EU and the result of the participation of the EFTA countries belonging to the European Economic Area (EEA). In accordance with Article 1(1) of Regulation No 608/2014 laying down implementing measures for the system of own resources, this result represents the difference between:
|
— |
total revenue received for the financial year; and |
|
— |
total payments made against current year's appropriations plus the total amount of that year's appropriations carried over to the following year. |
The following are added to or deducted from the resulting figure:
|
— |
the net balance of cancellations of payment appropriations carried over from previous years and any payments which, because of fluctuations in the euro rate, exceed non-differentiated appropriations carried over from the previous year; |
|
— |
the evolution of assigned revenue; and |
|
— |
the net exchange-rate gains or losses recorded during the year. |
Appropriations carried over from the previous financial year in respect of contributions by and work for third parties, which by definition never lapse, are included as additional appropriations for the financial year. This explains the difference between carryovers from the previous year in the year N budget implementation reports and those carried over to the following year in the year N-1 budget implementation reports. Appropriations made available again following the repayment of payments on account are disregarded when calculating the budget result.
Payment appropriations carried over include: automatic carryovers and carryovers by decision. The cancellation of unused payment appropriations carried over from the previous year shows the cancellations of appropriations carried over automatically and by decision.
1.6. RECONCILIATION OF ECONOMIC RESULT WITH BUDGET RESULT
|
EUR millions |
||
|
|
2017 |
2016 |
|
ECONOMIC RESULT OF THE YEAR |
8 082 |
1 733 |
|
Revenue |
|
|
|
Entitlements established in current year but not yet collected |
(4 408 ) |
(1 969 ) |
|
Entitlements established in previous years and collected in current year |
10 739 |
3 363 |
|
Accrued revenue (net) |
(257) |
611 |
|
Expenses |
|
|
|
Accrued expenses (net) |
3 725 |
10 678 |
|
Expenses prior year paid in current year |
(3 574 ) |
(7 656 ) |
|
Net-effect pre-financing |
(12 059 ) |
(468) |
|
Payment appropriations carried over to next year |
(3 373 ) |
(3 102 ) |
|
Payments made from carry-overs & cancellation of unused payment appropriations |
1 784 |
1 379 |
|
Movement in provisions |
6 752 |
3 962 |
|
Other |
(6 676 ) |
(2 142 ) |
|
Economic result Agencies and ECSC |
(179) |
16 |
|
BUDGET RESULT OF THE YEAR |
555 |
6 405 |
In accordance with the Financial Regulation, the economic result of the year is calculated on the basis of accrual accounting principles, while the budget result is based on modified cash accounting rules. As the economic result and the budget result both cover the same underlying transactions, it is a useful control to ensure that they are reconcilable.
Reconciling items — Revenue
The actual budgetary revenue for a financial year corresponds to the revenue collected from entitlements established in the course of the year and amounts collected from entitlements established in previous years. Therefore the entitlements established in the current year but not yet collected are to be deducted from the economic result for reconciliation purposes as they do not form part of budgetary revenue. On the contrary the entitlements established in previous years and collected in current year must be added to the economic result for reconciliation purposes.
The accrued revenue mainly consists of accrued revenue for agriculture, own resources, interests and dividends. Only the net-effect, i.e. accrued revenue for current year minus reversal accrued revenue from previous year, is taken into consideration.
Reconciling items — Expenditure
The accrued expenses mainly consists of accruals made for year-end cut-off purposes, i.e. eligible expenses incurred by beneficiaries of EU funds but not yet reported to the Commission. Only the net-effect, i.e. accrued expenses for current year minus reversal accrued expenses from previous year, is taken into consideration. Payments made in the current year relating to invoices registered in prior years are part of current year's budgetary expenditure and therefore must be added to the economic result for reconciliation purposes.
The net effect of pre-financing is the combination of (1) the new pre-financing amounts paid in the current year and recognised as budgetary expenditure of the year and (2) the clearing of the pre-financing through eligible costs accepted during the current year. The latter represent an expense in accrual terms but not in the budgetary accounts since the payment of the initial pre-financing had already been considered as a budgetary expenditure at the time of its payment.
As well as the payments made against the year's appropriations, the appropriations for that year that are carried forward to the next year also need to be taken into account in calculating the budget result for the year (in accordance with Article 1(1) of Regulation No 608/2014). The same applies for the budgetary payments made in the current year from carry-overs from previous years, and the cancellation of unused payment appropriations.
The movement in provisions relates to year-end estimates made in the financial statements (employee benefits mainly) that do not impact the budgetary accounts. Other reconciling amounts comprise different elements such as asset amortisation/depreciation, asset acquisitions, capital lease payments and financial participations for which the budgetary and accrual accounting treatments differ.
2. IMPLEMENTATION OF THE 2017 EU BUDGET — COMMENTARY
2.1. REVENUE
In the initial adopted EU budget, signed by the President of the European Parliament on 1 December 2016, the amount of payment appropriations was EUR 134 490 million and the amount to be financed by own resources totalled EUR 131 718 million. The revenue and expenditure estimates in the initial budget are typically adjusted during the budgetary year, such modifications being presented in amending budgets. Adjustments in the GNI-based own resources ensure that budgeted revenue matches exactly budgeted expenditure. In accordance with the principle of equilibrium, budget revenue and expenditure (payment appropriations) must be in balance.
During 2017, six amending budgets were adopted. Taking them into account, the final adopted revenue for 2017 amounted to EUR 126 771 million. The surplus from the previous financial year, the substantial reduction of payment appropriations, a significant collection of fines and other contributions reduced Member States' GNI balancing contribution in 2017 (EUR 115 484 million).
As far as the own resources result is concerned, the collection of traditional own resources was very close to the forecasted amounts. This is primarily because the budget estimates were modified at the time the amending budget 6/2017 was established (according to the new forecasts of spring 2017).
The final Member States' VAT and GNI payments also correspond closely to the final budgetary estimate. The differences between the forecasted amounts and the amounts actually paid are due to the differences between the euro rates used for budgetary purposes and the rates in force at the time when the Member States outside the EMU actually made their payments.
As far as the VAT and GNI balances are concerned there is a new procedure in place. The rules are set out in Article 10 b of the Making Available Regulation (Regulation 609/2014). The new procedure does not entail an amending budget and therefore the Commission directly requests the Member States to pay the net amounts. The impact for the EU budget was close to zero due to the new netting system.
The heading ‘Contributions and refunds in connection with EU agreements and programmes’ concerns mainly revenue from financial corrections (ESIF, EAGF and EAFRD), the participation of third countries in research programs and other contributions and refunds to EU programs/activities. A substantial part of this total is made up of earmarked revenue, which typically gives rise to the entering of additional appropriations on the expenditure side. In 2017, these contributions and refunds mainly originated from repayments for structural funds (EUR 6,7 billion), the clearance of accounts in agricultural funds (EUR 1,9 billion), the contribution of member states or third parties to specific agreements (EUR 1,6 billion) and contributions to EU programs (EUR 1 billion).
The revenue from fines relates mainly to fines in the field of competition.
2.2. EXPENDITURE
The 2017 budget aimed to achieve the right balance between the implementation of ongoing programmes and addressing newer challenges. It therefore built on commitments made in previous years, and makes use of the existing room for flexibility to respond to challenges in line with the 2014-2020 Multiannual Financial Framework (MFF).
In line with the annual evolution foreseen in the MFF, appropriations proposed in the draft budget were set at EUR 157,7 billion (1,7 % higher when compared to the 2016 budget) in commitments, and EUR 134,9 billion (– 6,2 %) in payments, corresponding to 1,05 % and 0,90 % of EU GNI, respectively. The increase in commitment appropriations was 4,8 % after ‘neutralising’ the impact of the re-programming of the 2014 annual tranche of the European Agricultural Fund for Rural Development, the Asylum, Migration and Integration Fund, and the Internal Security Fund. The significant reduction of total payments essentially reflects the finalisation of the implementation of programmes from the 2007-2013 MFF and the slow implementation of the new generation of programmes in some policy areas.
During the year, commitment appropriations were increased by EUR 500 million through amending budget 3/2017 for the Youth Employment Initiative (YEI) and amending budget 5/2017 to endow the EFSD Guarantee Fund with an initial allocation of EUR 275 million.
Following the difficult situation of 2016, a year in which payment appropriations exceeded the needs and the year was closed with a large surplus, the Commission at first observed equally slow progression in the applications for payments in 2017 and acted to adjust the budget accordingly. Therefore, draft amending budget 6/2017 was presented on 9 October 2017 proposing to decrease the level of payment appropriations by EUR 7,7 billion, out of which EUR 5,9 billion from budget lines under sub-heading 1b Economic, social and territorial cohesion and to a lesser extent from headings 2 Sustainable Growth: Natural Resources, 3 Security and Citizenship, and 4 Global Europe, as well as from the European Union Solidarity Fund (EUSF).
2017 Implementation of available appropriations
The 2017 implementation for all types of appropriations (budget, carry-overs from 2017 and assigned revenue) was 97 % for commitments and 93,9 % for payments. Appropriations from the budget were fully implemented in 2017 (98,35 % in payments), a good achievement given the uncertainties which prevailed in 2016 and most of 2017. The implementation rate rises to 99,9 % of commitment appropriations and 99,8 % of payment appropriations when assuming full consumption of the amounts carried over to 2018.
For the sub-heading 1b Economic, social and territorial cohesion, the financial implementation of 2014-2020 programmes progressed significantly compared to 2016, while the first closure payments were made for the 2007-2013 programmes. The reduction of payment appropriations through amending budget 6/2017 was fully offset by the use of assigned revenue from the clearance of accounts procedure and the final amount spent for payments nearly equalled the budget initially foreseen.
In heading 2 Sustainable Growth: Natural Resources, the financial implementation of the new EAFRD programmes also increased compared to 2016.
Outstanding Commitments
Outstanding commitments (RAL, committed amounts not yet paid for) stood at EUR 267 billion at the end of 2017. The increase of over EUR 28 billion in comparison with the end of 2016 is larger than expected, since the gap between commitments and payments made was wider than initially foreseen due to the reduction of payments in amending budget 6/2017. However an increase in RAL constitutes a normal evolution, as commitment appropriations increase every year as foreseen in the Multiannual Financial Framework. In 2018, a further increase of RAL is expected as a result of the difference between budgeted commitment and payment appropriations. However, this increase should be significantly lower than in 2017 given the smaller gap between commitment and payment appropriations in the adopted 2018 budget. Moreover, payment claims in the area of heading 1b Economic, social and territorial cohesion are expected to increase due to the application of the automatic ‘n+3’ de-commitment rule.
A more detailed analysis of budgetary adjustments, their relevant context, justification and impact is presented in the Commission's report on Budgetary and Financial Management 2017, Part A ‘Overview at budget level’ and Part B dealing with each heading of the Multiannual Financial Framework.
Budget result
The budget result of 2017 was a historically low EUR 0,56 billion and arises primarily from the revenue side, where revenues from contributions and refunds were material in 2017 (EUR 12,2 billion), originating from repayments for structural funds (EUR 6,7 billion), the clearance of accounts in agricultural funds (EUR 1,9 billion), the contribution of member states or third parties to specific agreements (EUR 1,6 billion) and contributions to EU programs (EUR 1 billion). Payment appropriations reached full implementation (98,35 %), unspent amounts were allowed for carry-over to 2018 and the amount not used is insignificant.
3. IMPLEMENTATION OF EU BUDGET REVENUE
3.1. SUMMARY OF THE IMPLEMENTATION OF EU BUDGET REVENUE
|
EUR million |
|||||||||||
|
|
Income appropriations |
Entitlements established |
Revenue |
Receipts as % of budget |
Outstanding |
||||||
|
Title |
Initial adopted budget |
Final adopted budget |
Current year |
Carried over |
Total |
On entitlements of current year |
On entitlements carried over |
Total |
|
||
|
1 |
Own resources |
131 718 |
115 484 |
115 429 |
26 |
115 455 |
115 414 |
2 |
115 416 |
100 % |
39 |
|
3 |
Surpluses, balances and adjustments |
— |
6 405 |
6 416 |
— |
6 416 |
6 416 |
— |
6 416 |
100 % |
— |
|
4 |
Revenue accruing from persons working with the institutions and other union bodies |
1 490 |
1 490 |
1 488 |
7 |
1 495 |
1 478 |
7 |
1 484 |
100 % |
11 |
|
5 |
Revenue accruing from the administrative operation of the institutions |
70 |
70 |
590 |
21 |
611 |
572 |
15 |
587 |
836 % |
24 |
|
6 |
Contributions and refunds in connection with Union agreements and programmes |
60 |
60 |
12 228 |
275 |
12 504 |
12 061 |
118 |
12 179 |
20 299 % |
324 |
|
7 |
Default interest and fines |
1 120 |
3 230 |
4 823 |
6 564 |
11 387 |
541 |
3 032 |
3 573 |
111 % |
7 814 |
|
8 |
Borrowing and lending operations |
7 |
7 |
39 |
5 |
43 |
24 |
5 |
28 |
410 % |
15 |
|
9 |
Miscellaneous revenue |
25 |
25 |
6 |
9 |
15 |
4 |
4 |
8 |
30 % |
7 |
|
Total |
134 490 |
126 771 |
141 020 |
6 906 |
147 926 |
136 509 |
3 182 |
139 691 |
110 % |
8 235 |
|
4. IMPLEMENTATION OF EU BUDGET EXPENDITURE
4.1. MFF: BREAKDOWN & CHANGES IN COMMITMENT & PAYMENT APPROPRIATIONS
|
EUR million |
|||||||||||||
|
MFF Heading |
Commitment appropriations |
Payment appropriations |
|||||||||||
|
Budget appropriations |
Additional appropriations |
Total approp. available |
Budget appropriations |
Additional appropriations |
Total approp. available |
||||||||
|
Initial adopted budget |
Amending budgets & transfers |
Final adopted budget |
Carry-overs |
Assigned revenue |
|
Initial adopted budget |
Amending budgets & transfers |
Final adopted budget |
Carry-overs |
Assigned revenue |
|
||
|
1 |
2 |
3=1+2 |
4 |
5 |
6=3+4+5 |
7 |
8 |
9=7+8 |
10 |
11 |
12=9+10+11 |
||
|
1 |
Smart and inclusive growth |
74 899 |
500 |
75 399 |
0 |
9 782 |
85 181 |
56 522 |
(6 682 ) |
49 840 |
130 |
11 198 |
61 168 |
|
|
1a: Competitiveness for growth and jobs |
21 312 |
— |
21 312 |
0 |
3 195 |
24 508 |
19 321 |
744 |
20 065 |
117 |
4 188 |
24 370 |
|
|
1b: Economic, social and territorial cohesion |
53 587 |
500 |
54 087 |
— |
6 586 |
60 673 |
37 201 |
(7 426 ) |
29 775 |
13 |
7 009 |
36 797 |
|
2 |
Sustainable growth: natural resources |
58 584 |
(15) |
58 569 |
433 |
3 804 |
62 806 |
54 914 |
(447) |
54 467 |
635 |
3 473 |
58 575 |
|
|
of which: Market related expenditure and direct payments |
42 613 |
(2) |
42 611 |
433 |
2 786 |
45 830 |
42 563 |
(5) |
42 558 |
630 |
2 786 |
45 975 |
|
3 |
Security and citizenship |
4 284 |
— |
4 284 |
— |
188 |
4 472 |
3 787 |
(994) |
2 793 |
11 |
189 |
2 994 |
|
4 |
Global Europe |
10 162 |
551 |
10 713 |
109 |
1 560 |
12 382 |
9 483 |
(545) |
8 938 |
120 |
1 887 |
10 944 |
|
5 |
Administration |
9 395 |
0 |
9 395 |
2 |
794 |
10 190 |
9 395 |
(2) |
9 392 |
786 |
798 |
10 977 |
|
|
of which: Administrative expenditure of the institutions |
3 921 |
— |
3 921 |
0 |
423 |
4 344 |
3 921 |
— |
3 921 |
494 |
426 |
4 841 |
|
6 |
Compensations |
— |
— |
— |
— |
— |
— |
— |
— |
— |
— |
— |
— |
|
8 |
Negative reserve and deficit carried over from the previous financial year |
— |
— |
— |
— |
— |
— |
— |
— |
— |
— |
— |
— |
|
9 |
Special Instruments |
534 |
938 |
1 472 |
31 |
41 |
1 544 |
390 |
951 |
1 341 |
32 |
41 |
1 414 |
|
Total |
157 858 |
1 974 |
159 831 |
575 |
16 169 |
176 576 |
134 490 |
(7 720 ) |
126 771 |
1 714 |
17 585 |
146 071 |
|
4.2. MFF: IMPLEMENTATION OF COMMITMENT APPROPRIATIONS
|
EUR million |
||||||||||||||
|
MFF Heading |
|
Commitments made |
Appropriat. carried over to 2018 |
Appropriations lapsing |
||||||||||
|
Total appropr. available |
from final adopted budget |
from carry-overs |
from assigned revenue |
Total |
% |
assigned revenue |
carry-overs by decision |
Total |
from final adopted budget |
from carry-overs |
from assigned revenue |
Total |
||
|
1 |
2 |
3 |
4 |
5=2+3+4 |
6=5/1 |
7 |
8 |
9=7+8 |
10 |
11 |
12 |
13=10+11+12 |
||
|
1 |
Smart and inclusive growth |
85 181 |
75 356 |
0 |
7 912 |
83 268 |
98 % |
1 870 |
27 |
1 897 |
16 |
— |
0 |
16 |
|
|
1a: Competitiveness for growth and jobs |
24 508 |
21 301 |
0 |
1 353 |
22 654 |
92 % |
1 842 |
4 |
1 846 |
8 |
— |
0 |
8 |
|
|
1b: Economic, social and territorial cohesion |
60 673 |
54 056 |
— |
6 559 |
60 614 |
100 % |
28 |
23 |
51 |
8 |
— |
— |
8 |
|
2 |
Sustainable growth: natural resources |
62 806 |
58 100 |
426 |
2 334 |
60 859 |
97 % |
1 470 |
451 |
1 920 |
19 |
8 |
— |
27 |
|
|
of which: Market related expenditure and direct payments |
45 830 |
42 150 |
426 |
2 183 |
44 759 |
98 % |
603 |
451 |
1 054 |
10 |
8 |
— |
18 |
|
3 |
Security and citizenship |
4 472 |
4 035 |
— |
89 |
4 124 |
92 % |
99 |
247 |
345 |
2 |
— |
0 |
2 |
|
4 |
Global Europe |
12 382 |
10 710 |
108 |
997 |
11 814 |
95 % |
563 |
2 |
565 |
1 |
1 |
0 |
3 |
|
5 |
Administration |
10 190 |
9 270 |
2 |
522 |
9 794 |
96 % |
272 |
— |
272 |
125 |
0 |
— |
125 |
|
|
of which: Administrative expenditure of the institutions |
4 344 |
3 838 |
0 |
303 |
4 142 |
95 % |
120 |
0 |
120 |
83 |
0 |
0 |
83 |
|
6 |
Compensations |
— |
— |
— |
— |
— |
0 % |
— |
— |
— |
— |
— |
— |
— |
|
8 |
Negative reserve and deficit carried over from the previous financial year |
— |
— |
— |
— |
— |
0 % |
— |
— |
— |
— |
— |
— |
— |
|
9 |
Special Instruments |
1 544 |
1 259 |
31 |
— |
1 291 |
84 % |
41 |
62 |
103 |
151 |
— |
— |
151 |
|
Total |
176 576 |
158 730 |
567 |
11 854 |
171 150 |
97 % |
4 315 |
788 |
5 103 |
314 |
9 |
0 |
323 |
|
4.3. MFF: IMPLEMENTATION OF PAYMENT APPROPRIATIONS
|
EUR million |
|||||||||||||||
|
MFF Heading |
|
Payments made |
Appropriations carried over to 2018 |
Appropriations lapsing |
|||||||||||
|
Total appropr. available |
from final adopted budget |
from carry-overs |
from assigned revenue |
Total |
% |
automat. carry-overs |
carry-overs by decis. |
assigned revenue |
Total |
from final adopted budget |
from carry-overs |
from assigned revenue |
Total |
||
|
1 |
2 |
3 |
4 |
5=2+3+4 |
6=5/1 |
7 |
8 |
9 |
10=7+8+9 |
11 |
12 |
13 |
14=11+12+13 |
||
|
1 |
Smart and inclusive growth |
61 168 |
49 698 |
111 |
7 220 |
57 030 |
93 % |
121 |
— |
3 977 |
4 098 |
21 |
19 |
0 |
40 |
|
|
1a: Competitiveness for growth and jobs |
24 370 |
19 945 |
101 |
1 330 |
21 376 |
88 % |
108 |
— |
2 858 |
2 966 |
12 |
16 |
0 |
28 |
|
|
1b: Economic, social and territorial cohesion |
36 797 |
29 754 |
11 |
5 890 |
35 654 |
97 % |
13 |
— |
1 119 |
1 132 |
9 |
3 |
— |
11 |
|
2 |
Sustainable growth: natural resources |
58 575 |
53 889 |
626 |
2 228 |
56 743 |
97 % |
111 |
451 |
1 245 |
1 806 |
17 |
9 |
— |
26 |
|
|
of which: Market related expenditure and direct payments |
45 975 |
41 992 |
621 |
2 081 |
44 695 |
97 % |
103 |
451 |
705 |
1 259 |
12 |
8 |
— |
21 |
|
3 |
Security and citizenship |
2 994 |
2 767 |
10 |
90 |
2 867 |
96 % |
11 |
5 |
99 |
115 |
11 |
1 |
0 |
12 |
|
4 |
Global Europe |
10 944 |
8 610 |
116 |
1 067 |
9 793 |
89 % |
314 |
2 |
820 |
1 136 |
12 |
4 |
— |
16 |
|
5 |
Administration |
10 977 |
8 486 |
720 |
451 |
9 656 |
88 % |
781 |
1 |
348 |
1 129 |
125 |
67 |
— |
191 |
|
|
of which: Administrative expenditure of the institutions |
4 841 |
3 363 |
448 |
274 |
4 085 |
84 % |
475 |
0 |
152 |
627 |
83 |
46 |
— |
128 |
|
6 |
Compensations |
— |
— |
— |
— |
— |
0 % |
— |
— |
— |
— |
— |
— |
— |
— |
|
8 |
Negative reserve and deficit carried over from the previous financial year |
— |
— |
— |
— |
— |
0 % |
0 |
— |
— |
— |
— |
— |
— |
— |
|
9 |
Special Instruments |
1 414 |
1 241 |
32 |
18 |
1 291 |
91 % |
0 |
— |
23 |
24 |
99 |
0 |
— |
99 |
|
Total |
146 071 |
124 691 |
1 615 |
11 073 |
137 379 |
94 % |
1 338 |
458 |
6 512 |
8 308 |
284 |
99 |
0 |
384 |
|
4.4. MFF: MOVEMENTS IN COMMITMENTS OUTSTANDING (RAL)
|
EUR million |
||||||||||
|
MFF Heading |
Commitments outstanding at the end of previous year |
Commitments of the current year |
Total commitm. outstanding at the end of the year |
|||||||
|
Commitm. carried forward from previous year |
Decommitm./ Revaluations/ Cancellations |
Payments |
Commitm. outstanding at year-end |
Commitm. made during the year |
Payments |
Cancellation of commitm. which cannot be carried over |
Commitm. outstanding at year-end |
|
||
|
1 |
Smart and inclusive growth |
174 938 |
(4 337 ) |
(49 231 ) |
121 370 |
83 268 |
(7 799 ) |
(3) |
75 467 |
196 837 |
|
|
1a: Competitiveness for growth and jobs |
35 622 |
(1 321 ) |
(13 887 ) |
20 414 |
22 654 |
(7 489 ) |
(3) |
15 162 |
35 576 |
|
|
1b: Economic, social and territorial cohesion |
139 316 |
(3 015 ) |
(35 345 ) |
100 956 |
60 614 |
(310) |
(0) |
60 304 |
161 260 |
|
2 |
Sustainable growth: natural resources |
33 947 |
(180) |
(11 860 ) |
21 907 |
60 859 |
(44 882 ) |
(0) |
15 977 |
37 883 |
|
|
of which: Market related expenditure and direct payments |
247 |
(2) |
(211) |
33 |
44 759 |
(44 484 ) |
— |
275 |
309 |
|
3 |
Security and citizenship |
4 167 |
(231) |
(1 650 ) |
2 286 |
4 124 |
(1 217 ) |
— |
2 908 |
5 194 |
|
4 |
Global Europe |
24 974 |
(517) |
(6 662 ) |
17 795 |
11 814 |
(3 131 ) |
(1) |
8 682 |
26 478 |
|
5 |
Administration |
732 |
(2) |
(726) |
4 |
9 794 |
(8 931 ) |
(0) |
863 |
867 |
|
|
of which: Administrative expenditure of the institutions |
431 |
20 |
(448) |
3 |
4 142 |
(3 637 ) |
0 |
505 |
507 |
|
6 |
Compensations |
— |
— |
— |
— |
— |
— |
— |
— |
— |
|
8 |
Negative reserve and deficit carried over from the previous financial year |
— |
— |
— |
— |
— |
— |
— |
— |
— |
|
9 |
Special Instruments |
0 |
(0) |
(0) |
— |
1 291 |
(1 290 ) |
— |
0 |
0 |
|
Total |
238 759 |
(5 268 ) |
(70 129 ) |
163 362 |
171 150 |
(67 250 ) |
(4) |
103 896 |
267 258 |
|
4.5. MFF: COMMITMENTS OUTSTANDING BY YEAR OF ORIGIN
|
EUR million |
||||||||||
|
MFF Heading |
< 2011 |
2011 |
2012 |
2013 |
2014 |
2015 |
2016 |
2017 |
Total |
|
|
1 |
Smart and inclusive growth |
1 575 |
532 |
1 464 |
13 556 |
6 680 |
41 805 |
55 759 |
75 467 |
196 837 |
|
|
1a: Competitiveness for growth and jobs |
741 |
294 |
829 |
2 754 |
3 620 |
4 893 |
7 283 |
15 162 |
35 576 |
|
|
1b: Economic, social and territorial cohesion |
834 |
238 |
635 |
10 802 |
3 060 |
36 912 |
48 475 |
60 304 |
161 260 |
|
2 |
Sustainable growth: natural resources |
227 |
58 |
76 |
992 |
496 |
5 470 |
14 588 |
15 977 |
37 883 |
|
|
of which: Market related expenditure and direct payments |
— |
— |
— |
— |
0 |
12 |
22 |
275 |
309 |
|
3 |
Security and citizenship |
40 |
34 |
74 |
114 |
77 |
278 |
1 669 |
2 908 |
5 194 |
|
4 |
Global Europe |
1 036 |
543 |
1 054 |
2 232 |
2 675 |
4 226 |
6 030 |
8 682 |
26 478 |
|
5 |
Administration |
— |
— |
— |
0 |
0 |
0 |
4 |
863 |
867 |
|
|
of which: Administrative expenditure of the institutions |
0 |
0 |
0 |
0 |
0 |
0 |
3 |
505 |
507 |
|
9 |
Special Instruments |
— |
— |
— |
— |
— |
— |
— |
0 |
0 |
|
Total |
2 878 |
1 166 |
2 668 |
16 893 |
9 928 |
51 779 |
78 050 |
103 896 |
267 258 |
|
4.6. DETAILED MFF: BREAKDOWN & CHANGES IN COMMITMENT & PAYMENT APPROPRIATIONS
|
EUR million |
|||||||||||||
|
Programme |
Commitment appropriations |
Payment appropriations |
|||||||||||
|
Budget appropriations |
Additional appropriations |
Total approp. available |
Budget appropriations |
Additional appropriations |
Total approp. available |
||||||||
|
Initial adopted budget |
Amending budgets & transfers |
Final adopted budget |
Carry- overs |
Assigned revenue |
|
Initial adopted budget |
Amending budgets & transfers |
Final adopted budget |
Carry- overs |
Assigned revenue |
|
||
|
1 |
2 |
3=1+2 |
4 |
5 |
6=3+4+5 |
7 |
8 |
9=7+8 |
10 |
11 |
12=9+10+11 |
||
|
1.1 |
European Fund Strategic Investments (EFSI) |
2 661 |
0 |
2 661 |
— |
39 |
2 700 |
2 317 |
150 |
2 467 |
— |
39 |
2 506 |
|
|
European satellite navigation (EGNOS/Galileo) |
897 |
— |
897 |
— |
148 |
1 045 |
688 |
162 |
850 |
3 |
255 |
1 108 |
|
|
International Thermonuclear Reactor (ITER) |
323 |
(0) |
322 |
— |
19 |
341 |
426 |
298 |
724 |
0 |
19 |
743 |
|
|
European Earth Observation Progr (Copernicus) |
607 |
— |
607 |
— |
17 |
625 |
697 |
(60) |
637 |
2 |
19 |
658 |
|
|
Nuclear Safety and Decommissioning |
138 |
— |
138 |
— |
— |
138 |
150 |
204 |
354 |
— |
— |
354 |
|
|
Horizon 2020 |
10 346 |
78 |
10 424 |
— |
1 828 |
12 251 |
10 196 |
(97) |
10 100 |
71 |
2 689 |
12 860 |
|
|
Euratom Research and Training Programme |
341 |
(0) |
341 |
— |
112 |
452 |
348 |
(1) |
347 |
20 |
152 |
518 |
|
|
Competitiveness enterprises and SME's (COSME) |
349 |
0 |
349 |
— |
32 |
381 |
369 |
(119) |
250 |
2 |
71 |
324 |
|
|
Education, Training and Sport (Erasmus+) |
2 064 |
6 |
2 070 |
— |
388 |
2 458 |
1 887 |
40 |
1 927 |
7 |
441 |
2 375 |
|
|
Employment and Social Innovation (EaSI) |
136 |
— |
136 |
— |
10 |
146 |
97 |
(7) |
90 |
2 |
10 |
102 |
|
|
Customs, Fiscalis and Anti-Fraud |
137 |
7 |
144 |
— |
5 |
149 |
117 |
(0) |
117 |
5 |
5 |
127 |
|
|
CEF — Energy |
700 |
(77) |
622 |
— |
1 |
623 |
123 |
(40) |
83 |
2 |
0 |
85 |
|
|
CEF — Transport |
1 723 |
(1) |
1 723 |
— |
120 |
1 843 |
971 |
279 |
1 249 |
2 |
103 |
1 354 |
|
|
CEF — Information & Communications Technology (ICT) |
124 |
1 |
125 |
— |
3 |
128 |
118 |
(54) |
63 |
0 |
3 |
67 |
|
|
Energy projects for economic recovery (EERP) |
— |
— |
— |
— |
16 |
16 |
110 |
32 |
142 |
— |
16 |
157 |
|
|
Decentralised agencies |
344 |
(7) |
338 |
— |
18 |
356 |
336 |
(16) |
319 |
— |
18 |
337 |
|
|
Other actions and programmes |
220 |
(2) |
218 |
— |
435 |
653 |
196 |
2 |
198 |
1 |
344 |
543 |
|
|
Pilot projects and preparatory actions |
56 |
(0) |
56 |
— |
1 |
57 |
44 |
(15) |
29 |
— |
0 |
30 |
|
|
Specific competences of the Commission |
144 |
(5) |
139 |
0 |
5 |
143 |
131 |
(13) |
118 |
— |
4 |
123 |
|
Total MFF Heading 1.1 |
21 312 |
(0) |
21 312 |
0 |
3 195 |
24 508 |
19 321 |
744 |
20 065 |
117 |
4 188 |
24 370 |
|
|
1.2 |
Regional convergence (Less developed regions) |
26 122 |
(30) |
26 092 |
— |
3 405 |
29 496 |
19 315 |
(4 613 ) |
14 702 |
— |
3 375 |
18 078 |
|
|
Transition regions |
5 627 |
(15) |
5 613 |
— |
677 |
6 289 |
3 314 |
(1 247 ) |
2 067 |
— |
542 |
2 609 |
|
|
Competitiveness (More developed regions) |
8 251 |
45 |
8 296 |
— |
1 095 |
9 391 |
5 853 |
(1 441 ) |
4 413 |
— |
1 259 |
5 672 |
|
|
Outermost and sparsely populated regions |
222 |
— |
222 |
— |
29 |
251 |
140 |
(14) |
126 |
— |
35 |
161 |
|
|
Cohesion fund |
9 056 |
— |
9 056 |
— |
1 133 |
10 189 |
5 981 |
1 107 |
7 088 |
— |
1 260 |
8 348 |
|
|
European territorial cooperation |
1 940 |
— |
1 940 |
— |
185 |
2 124 |
969 |
(392) |
577 |
— |
53 |
630 |
|
|
Technical assistance |
216 |
(0) |
216 |
— |
1 |
217 |
190 |
(23) |
167 |
13 |
1 |
180 |
|
|
European Aid to the Most Deprived (FEAD) |
546 |
— |
546 |
— |
6 |
553 |
441 |
(150) |
291 |
0 |
6 |
298 |
|
|
Youth Employment initiative |
— |
500 |
500 |
— |
56 |
556 |
600 |
(551) |
49 |
— |
476 |
525 |
|
|
Connecting Europe Facility (CEF) |
1 593 |
— |
1 593 |
— |
— |
1 593 |
383 |
(93) |
290 |
— |
2 |
292 |
|
|
Pilot projects and preparatory actions |
13 |
— |
13 |
— |
0 |
13 |
14 |
(9) |
5 |
— |
0 |
5 |
|
Total MFF Heading 1.2 |
53 587 |
500 |
54 087 |
— |
6 586 |
60 673 |
37 201 |
(7 426 ) |
29 775 |
13 |
7 009 |
36 797 |
|
|
Total MFF Heading 1 |
74 899 |
500 |
75 399 |
0 |
9 782 |
85 181 |
56 522 |
(6 682 ) |
49 840 |
130 |
11 198 |
61 168 |
|
|
2 |
European Agricultural Guarantee Fund (EAGF) |
42 613 |
(2) |
42 611 |
433 |
2 786 |
45 830 |
42 563 |
(5) |
42 558 |
630 |
2 786 |
45 975 |
|
|
Agricultural Fund Rural Development (EAFRD) |
14 366 |
(2) |
14 364 |
— |
862 |
15 226 |
11 208 |
(215) |
10 994 |
1 |
532 |
11 527 |
|
|
European Maritime and Fisheries Fund (EMFF) |
912 |
— |
912 |
— |
133 |
1 045 |
577 |
(192) |
385 |
0 |
133 |
519 |
|
|
Fisheries Partnership Agreements (SFPAs) and Fisheries Management Organisations (RFMOs) |
138 |
(11) |
127 |
— |
2 |
129 |
133 |
3 |
136 |
— |
2 |
139 |
|
|
Environment and climate action (LIFE) |
494 |
— |
494 |
— |
10 |
504 |
364 |
(33) |
331 |
4 |
8 |
343 |
|
|
Decentralised agencies |
55 |
(1) |
54 |
— |
10 |
65 |
55 |
(1) |
54 |
— |
10 |
65 |
|
|
Other actions and measures |
— |
— |
— |
— |
— |
— |
— |
— |
— |
— |
— |
— |
|
|
Pilot projects and preparatory actions |
8 |
— |
8 |
— |
0 |
8 |
13 |
(6) |
8 |
— |
0 |
8 |
|
|
Specific Actions |
— |
— |
— |
— |
— |
— |
— |
— |
— |
0 |
— |
0 |
|
Total MFF Heading 2 |
58 584 |
(15) |
58 569 |
433 |
3 804 |
62 806 |
54 914 |
(447) |
54 467 |
635 |
3 473 |
58 575 |
|
|
3 |
Asylum, Migration and Integration Fund (AMF) |
1 620 |
(6) |
1 614 |
— |
46 |
1 661 |
1 182 |
(559) |
623 |
2 |
45 |
671 |
|
|
Consumer |
27 |
— |
27 |
— |
1 |
28 |
21 |
(0) |
21 |
1 |
1 |
22 |
|
|
Creative Europe |
208 |
1 |
209 |
— |
13 |
222 |
177 |
10 |
187 |
2 |
15 |
204 |
|
|
Emergency Support within the Union (IES) |
200 |
(1) |
199 |
— |
— |
199 |
219 |
(1) |
218 |
0 |
— |
218 |
|
|
Internal Security Fund |
739 |
(4) |
735 |
— |
61 |
796 |
748 |
(350) |
398 |
2 |
60 |
460 |
|
|
IT systems |
20 |
16 |
35 |
— |
3 |
38 |
17 |
12 |
28 |
— |
3 |
31 |
|
|
Justice |
54 |
(0) |
54 |
— |
3 |
56 |
41 |
(4) |
37 |
1 |
3 |
41 |
|
|
Rights, Equality and Citizenship |
63 |
1 |
64 |
— |
2 |
65 |
47 |
6 |
53 |
1 |
2 |
55 |
|
|
Union Civil protection Mechanism |
31 |
(2) |
30 |
— |
2 |
31 |
31 |
(3) |
28 |
— |
2 |
30 |
|
|
Europe for Citizens |
26 |
— |
26 |
— |
1 |
27 |
26 |
— |
26 |
0 |
1 |
27 |
|
|
Food and feed |
256 |
3 |
259 |
— |
3 |
262 |
234 |
6 |
241 |
1 |
4 |
246 |
|
|
Health |
65 |
— |
65 |
— |
2 |
67 |
58 |
1 |
59 |
1 |
2 |
62 |
|
|
Decentralised agencies |
863 |
(6) |
858 |
— |
51 |
909 |
864 |
(99) |
765 |
— |
51 |
816 |
|
|
Pilot projects and preparatory actions |
12 |
(2) |
10 |
— |
0 |
10 |
19 |
(6) |
14 |
— |
1 |
14 |
|
|
Specific Actions |
101 |
— |
101 |
— |
1 |
102 |
102 |
(7) |
96 |
1 |
0 |
97 |
|
Total MFF Heading 3 |
4 284 |
(0) |
4 284 |
— |
188 |
4 472 |
3 787 |
(994) |
2 793 |
11 |
189 |
2 994 |
|
|
4 |
Pre-accession assistance (IPA II) |
2 115 |
4 |
2 118 |
— |
76 |
2 195 |
1 716 |
(330) |
1 386 |
4 |
414 |
1 805 |
|
|
Macro-financial Assistance (MFA) |
46 |
(6) |
40 |
— |
— |
40 |
46 |
(35) |
10 |
— |
— |
10 |
|
|
Guarantee Fund for External Actions |
241 |
— |
241 |
— |
110 |
351 |
241 |
— |
241 |
— |
110 |
351 |
|
|
Union Civil Protection Mechanism |
21 |
(9) |
11 |
— |
1 |
13 |
20 |
(10) |
10 |
— |
2 |
11 |
|
|
EU Aid Volunteers initiative (EUAV) |
22 |
(5) |
17 |
— |
— |
17 |
24 |
(7) |
17 |
— |
— |
17 |
|
|
Fund for Sustainable Development (EFSD) |
— |
275 |
275 |
— |
300 |
575 |
— |
275 |
275 |
— |
300 |
575 |
|
|
European Neighbourhood Instrument (ENI) |
2 440 |
40 |
2 481 |
— |
54 |
2 535 |
2 358 |
(374) |
1 984 |
5 |
59 |
2 048 |
|
|
Development Cooperation Instrument (DCI) |
3 168 |
(17) |
3 151 |
— |
47 |
3 198 |
2 769 |
(140) |
2 629 |
13 |
74 |
2 716 |
|
|
Partnership Instrument (PI) |
134 |
5 |
138 |
— |
2 |
140 |
136 |
(39) |
97 |
1 |
2 |
99 |
|
|
Democracy and Human Rights (EIDHR) |
189 |
(5) |
184 |
— |
4 |
188 |
168 |
(9) |
159 |
3 |
3 |
166 |
|
|
Stability and Peace (IcSP) |
273 |
(13) |
260 |
— |
11 |
272 |
294 |
(36) |
258 |
3 |
10 |
271 |
|
|
Humanitarian aid |
945 |
335 |
1 280 |
99 |
769 |
2 148 |
1 146 |
247 |
1 393 |
91 |
728 |
2 211 |
|
|
Common Foreign and Security Policy (CFSP) |
327 |
(41) |
287 |
9 |
55 |
351 |
294 |
(35) |
259 |
0 |
55 |
313 |
|
|
Nuclear Safety Cooperation (INSC) |
62 |
(11) |
51 |
— |
3 |
54 |
81 |
(11) |
71 |
0 |
3 |
74 |
|
|
Decentralised agencies |
20 |
— |
20 |
— |
0 |
20 |
20 |
— |
20 |
— |
0 |
20 |
|
|
Other actions and programmes |
84 |
(1) |
83 |
— |
126 |
209 |
93 |
(27) |
66 |
0 |
127 |
193 |
|
|
Pilot projects and preparatory actions |
9 |
(1) |
8 |
1 |
0 |
9 |
11 |
(3) |
9 |
— |
0 |
9 |
|
|
Specific Actions |
66 |
(0) |
66 |
— |
0 |
66 |
67 |
(12) |
56 |
— |
0 |
56 |
|
Total MFF Heading 4 |
10 162 |
551 |
10 713 |
109 |
1 560 |
12 382 |
9 483 |
(545) |
8 938 |
120 |
1 887 |
10 944 |
|
|
5 |
Pensions |
1 790 |
12 |
1 802 |
— |
0 |
1 802 |
1 790 |
12 |
1 802 |
— |
0 |
1 802 |
|
|
European schools |
185 |
(1) |
184 |
— |
14 |
198 |
185 |
(1) |
184 |
1 |
14 |
199 |
|
|
Decentralised agencies |
— |
— |
— |
— |
— |
— |
— |
— |
— |
— |
— |
— |
|
|
Pilot projects and preparatory actions |
5 |
— |
5 |
— |
— |
5 |
5 |
(3) |
2 |
— |
— |
2 |
|
|
Commission administrative expenditure |
3 494 |
(11) |
3 483 |
1 |
357 |
3 841 |
3 494 |
(10) |
3 484 |
292 |
358 |
4 134 |
|
|
Administrative expenditure of Other Institutions |
3 921 |
— |
3 921 |
0 |
423 |
4 344 |
3 921 |
— |
3 921 |
494 |
426 |
4 841 |
|
Total MFF Heading 5 |
9 395 |
0 |
9 395 |
2 |
794 |
10 190 |
9 395 |
(2) |
9 392 |
786 |
798 |
10 977 |
|
|
6 |
Compensations |
— |
— |
— |
— |
— |
— |
— |
— |
— |
— |
— |
— |
|
Total MFF Heading 6 |
— |
— |
— |
— |
— |
— |
— |
— |
— |
— |
— |
— |
|
|
8 |
Negative reserve |
— |
— |
— |
— |
— |
— |
— |
— |
— |
— |
— |
— |
|
|
Deficit carried over |
— |
— |
— |
— |
— |
— |
— |
— |
— |
— |
— |
— |
|
Total MFF Heading 8 |
— |
— |
— |
— |
— |
— |
— |
— |
— |
— |
— |
— |
|
|
9 |
Emergency Aid Reserve (EAR) |
315 |
(253) |
62 |
— |
— |
62 |
315 |
(216) |
99 |
— |
— |
99 |
|
|
European Globalisation Adjustment Fund (EGF) |
169 |
— |
169 |
— |
41 |
210 |
25 |
(25) |
0 |
0 |
41 |
42 |
|
|
European Union Solidarity Fund (EUSF) |
50 |
1 191 |
1 241 |
31 |
— |
1 273 |
50 |
1 191 |
1 241 |
31 |
— |
1 273 |
|
Total MFF Heading 9 |
534 |
938 |
1 472 |
31 |
41 |
1 544 |
390 |
951 |
1 341 |
32 |
41 |
1 414 |
|
|
Total |
157 858 |
1 974 |
159 831 |
575 |
16 169 |
176 576 |
134 490 |
(7 720 ) |
126 771 |
1 714 |
17 585 |
146 071 |
|
4.7. DETAILED MFF: IMPLEMENTATION OF COMMITMENT APPROPRIATIONS
|
EUR million |
||||||||||||||
|
Programme |
|
Commitments made |
Appropriat. carried-over to 2018 |
Appropriations lapsing |
||||||||||
|
Total appropr. available |
from final adopted budget |
from carry- overs |
from assigned revenue |
Total |
% |
assigned revenue |
carry- overs by decision |
Total |
from final adopted budget |
from carry- overs |
from assigned revenue |
Total |
||
|
1 |
2 |
3 |
4 |
5=2+3+4 |
6=5/1 |
7 |
8 |
9=7+8 |
10 |
11 |
12 |
13=10+11+12 |
||
|
1.1 |
European Fund Strategic Investments (EFSI) |
2 700 |
2 661 |
— |
39 |
2 700 |
100 % |
0 |
— |
0 |
0 |
— |
— |
0 |
|
|
European satellite navigation (EGNOS/Galileo) |
1 045 |
897 |
— |
32 |
929 |
89 % |
116 |
— |
116 |
— |
— |
— |
— |
|
|
International Thermonuclear Reactor (ITER) |
341 |
322 |
— |
1 |
323 |
95 % |
18 |
— |
18 |
0 |
— |
— |
0 |
|
|
European Earth Observation Progr (Copernicus) |
625 |
607 |
— |
17 |
624 |
100 % |
0 |
— |
0 |
— |
— |
— |
— |
|
|
Nuclear Safety and Decommissioning |
138 |
138 |
— |
— |
138 |
100 % |
— |
— |
— |
0 |
— |
— |
0 |
|
|
Horizon 2020 |
12 251 |
10 422 |
— |
882 |
11 304 |
92 % |
946 |
— |
946 |
1 |
— |
0 |
2 |
|
|
Euratom Research and Training Programme |
452 |
341 |
— |
17 |
357 |
79 % |
95 |
— |
95 |
0 |
— |
— |
0 |
|
|
Competitiveness enterprises and SME's (COSME) |
381 |
349 |
— |
27 |
376 |
99 % |
5 |
— |
5 |
0 |
— |
— |
0 |
|
|
Education, Training and Sport (Erasmus+) |
2 458 |
2 070 |
— |
192 |
2 263 |
92 % |
195 |
— |
195 |
0 |
— |
— |
0 |
|
|
Employment and Social Innovation (EaSI) |
146 |
135 |
— |
3 |
138 |
94 % |
7 |
— |
7 |
1 |
— |
0 |
1 |
|
|
Customs, Fiscalis and Anti-Fraud |
149 |
144 |
— |
1 |
145 |
97 % |
4 |
— |
4 |
0 |
— |
— |
0 |
|
|
CEF — Energy |
623 |
621 |
— |
1 |
622 |
100 % |
0 |
— |
0 |
1 |
— |
— |
1 |
|
|
CEF — Transport |
1 843 |
1 722 |
— |
31 |
1 753 |
95 % |
89 |
— |
89 |
0 |
— |
— |
0 |
|
|
CEF — Information & Communications Technology (ICT) |
128 |
120 |
— |
3 |
124 |
97 % |
0 |
4 |
4 |
0 |
— |
0 |
0 |
|
|
Energy projects for economic recovery (EERP) |
16 |
— |
— |
— |
— |
0 % |
16 |
— |
16 |
— |
— |
— |
— |
|
|
Decentralised agencies |
356 |
338 |
— |
13 |
351 |
99 % |
5 |
— |
5 |
0 |
— |
— |
0 |
|
|
Other actions and programmes |
653 |
218 |
— |
92 |
309 |
47 % |
343 |
— |
343 |
1 |
— |
— |
1 |
|
|
Pilot projects and preparatory actions |
57 |
55 |
— |
1 |
56 |
97 % |
1 |
— |
1 |
1 |
— |
— |
1 |
|
|
Specific competences of the Commission |
143 |
137 |
0 |
3 |
140 |
98 % |
1 |
— |
1 |
2 |
— |
— |
2 |
|
Total MFF Heading 1.1 |
24 508 |
21 301 |
0 |
1 353 |
22 654 |
92 % |
1 842 |
4 |
1 846 |
8 |
— |
0 |
8 |
|
|
1.2 |
Regional convergence (Less developed regions) |
29 496 |
26 092 |
— |
3 378 |
29 470 |
100 % |
27 |
— |
27 |
— |
— |
— |
— |
|
|
Transition regions |
6 289 |
5 613 |
— |
677 |
6 289 |
100 % |
— |
— |
— |
— |
— |
— |
— |
|
|
Competitiveness (More developed regions) |
9 391 |
8 296 |
— |
1 095 |
9 391 |
100 % |
— |
— |
— |
— |
— |
— |
— |
|
|
Outermost and sparsely populated regions |
251 |
222 |
— |
29 |
251 |
100 % |
— |
— |
— |
— |
— |
— |
— |
|
|
Cohesion fund |
10 189 |
9 056 |
— |
1 133 |
10 189 |
100 % |
— |
— |
— |
— |
— |
— |
— |
|
|
European territorial cooperation |
2 124 |
1 917 |
— |
185 |
2 101 |
99 % |
0 |
23 |
23 |
— |
— |
— |
— |
|
|
Technical assistance |
217 |
209 |
— |
— |
209 |
96 % |
1 |
— |
1 |
7 |
— |
— |
7 |
|
|
European Aid to the Most Deprived (FEAD) |
553 |
546 |
— |
6 |
552 |
100 % |
— |
— |
— |
1 |
— |
— |
1 |
|
|
Youth Employment initiative |
556 |
500 |
— |
56 |
556 |
100 % |
— |
— |
— |
— |
— |
— |
— |
|
|
Connecting Europe Facility (CEF) |
1 593 |
1 593 |
— |
— |
1 593 |
100 % |
— |
— |
— |
— |
— |
— |
— |
|
|
Pilot projects and preparatory actions |
13 |
13 |
— |
— |
13 |
100 % |
0 |
— |
0 |
0 |
— |
— |
0 |
|
Total MFF Heading 1.2 |
60 673 |
54 056 |
— |
6 559 |
60 614 |
100 % |
28 |
23 |
51 |
8 |
— |
— |
8 |
|
|
Total MFF Heading 1 |
85 181 |
75 356 |
0 |
7 912 |
83 268 |
97 % |
1 870 |
27 |
1 897 |
16 |
— |
0 |
16 |
|
|
2 |
European Agricultural Guarantee Fund (EAGF) |
45 830 |
42 150 |
426 |
2 183 |
44 759 |
98 % |
603 |
451 |
1 054 |
10 |
8 |
— |
18 |
|
|
Agricultural Fund Rural Development (EAFRD) |
15 226 |
14 360 |
— |
0 |
14 360 |
94 % |
861 |
— |
861 |
4 |
— |
— |
4 |
|
|
European Maritime and Fisheries Fund (EMFF) |
1 045 |
909 |
— |
133 |
1 042 |
100 % |
0 |
— |
0 |
3 |
— |
— |
3 |
|
|
Fisheries Partnership Agreements (SFPAs) and Fisheries Management Organisations (RFMOs) |
129 |
125 |
— |
2 |
128 |
99 % |
— |
— |
— |
2 |
— |
— |
2 |
|
|
Environment and climate action (LIFE) |
504 |
494 |
— |
6 |
500 |
99 % |
4 |
— |
4 |
0 |
— |
— |
0 |
|
|
Decentralised agencies |
65 |
54 |
— |
10 |
64 |
99 % |
1 |
— |
1 |
— |
— |
— |
— |
|
|
Other actions and measures |
— |
— |
— |
— |
— |
0 % |
— |
— |
— |
— |
— |
— |
— |
|
|
Pilot projects and preparatory actions |
8 |
7 |
— |
— |
7 |
90 % |
0 |
— |
0 |
1 |
— |
— |
1 |
|
|
Specific Actions |
— |
— |
— |
— |
— |
0 % |
— |
— |
— |
— |
— |
— |
— |
|
Total MFF Heading 2 |
62 806 |
58 100 |
426 |
2 334 |
60 859 |
97 % |
1 470 |
451 |
1 920 |
19 |
8 |
— |
27 |
|
|
3 |
Asylum, Migration and Integration Fund (AMF) |
1 661 |
1 408 |
— |
14 |
1 422 |
86 % |
32 |
207 |
239 |
0 |
— |
— |
0 |
|
|
Consumer |
28 |
27 |
— |
1 |
28 |
100 % |
0 |
— |
0 |
0 |
— |
— |
0 |
|
|
Creative Europe |
222 |
209 |
— |
9 |
218 |
98 % |
5 |
— |
5 |
0 |
— |
— |
0 |
|
|
Emergency Support within the Union (IES) |
199 |
199 |
— |
— |
199 |
100 % |
— |
— |
— |
0 |
— |
— |
0 |
|
|
Internal Security Fund |
796 |
695 |
— |
35 |
730 |
92 % |
26 |
40 |
66 |
0 |
— |
— |
0 |
|
|
IT systems |
38 |
35 |
— |
0 |
36 |
94 % |
2 |
— |
2 |
0 |
— |
— |
0 |
|
|
Justice |
56 |
53 |
— |
0 |
54 |
95 % |
3 |
— |
3 |
0 |
— |
— |
0 |
|
|
Rights, Equality and Citizenship |
65 |
64 |
— |
0 |
64 |
97 % |
2 |
— |
2 |
0 |
— |
— |
0 |
|
|
Union Civil protection Mechanism |
31 |
29 |
— |
1 |
30 |
96 % |
1 |
— |
1 |
1 |
— |
0 |
1 |
|
|
Europe for Citizens |
27 |
26 |
— |
0 |
27 |
98 % |
0 |
— |
0 |
0 |
— |
— |
0 |
|
|
Food and feed |
262 |
259 |
— |
2 |
261 |
100 % |
1 |
— |
1 |
0 |
— |
— |
0 |
|
|
Health |
67 |
65 |
— |
2 |
66 |
99 % |
1 |
— |
1 |
— |
— |
— |
— |
|
|
Decentralised agencies |
909 |
858 |
— |
25 |
882 |
97 % |
27 |
— |
27 |
— |
— |
— |
— |
|
|
Pilot projects and preparatory actions |
10 |
9 |
— |
— |
9 |
97 % |
0 |
— |
0 |
0 |
— |
— |
0 |
|
|
Specific Actions |
102 |
101 |
— |
0 |
101 |
100 % |
0 |
— |
0 |
0 |
— |
— |
0 |
|
Total MFF Heading 3 |
4 472 |
4 035 |
— |
89 |
4 124 |
92 % |
99 |
247 |
345 |
2 |
— |
0 |
2 |
|
|
4 |
Pre-accession assistance (IPA II) |
2 195 |
2 117 |
— |
34 |
2 151 |
98 % |
43 |
1 |
44 |
0 |
— |
— |
0 |
|
|
Macro-financial Assistance (MFA) |
40 |
40 |
— |
— |
40 |
100 % |
— |
— |
— |
0 |
— |
— |
0 |
|
|
Guarantee Fund for External Actions |
351 |
241 |
— |
— |
241 |
69 % |
110 |
— |
110 |
— |
— |
— |
— |
|
|
Union Civil Protection Mechanism |
13 |
11 |
— |
1 |
12 |
92 % |
1 |
— |
1 |
0 |
— |
0 |
0 |
|
|
EU Aid Volunteers initiative (EUAV) |
17 |
17 |
— |
— |
17 |
100 % |
— |
— |
— |
0 |
— |
— |
0 |
|
|
Fund for Sustainable Development (EFSD) |
575 |
275 |
— |
— |
275 |
48 % |
300 |
— |
300 |
— |
— |
— |
— |
|
|
European Neighbourhood Instrument (ENI) |
2 535 |
2 481 |
— |
34 |
2 515 |
99 % |
20 |
— |
20 |
0 |
— |
— |
0 |
|
|
Development Cooperation Instrument (DCI) |
3 198 |
3 151 |
— |
24 |
3 175 |
99 % |
23 |
— |
23 |
0 |
— |
— |
0 |
|
|
Partnership Instrument (PI) |
140 |
138 |
— |
2 |
140 |
100 % |
0 |
— |
0 |
0 |
— |
— |
0 |
|
|
Democracy and Human Rights (EIDHR) |
188 |
184 |
— |
3 |
187 |
99 % |
1 |
— |
1 |
0 |
— |
— |
0 |
|
|
Stability and Peace (IcSP) |
272 |
260 |
— |
8 |
268 |
99 % |
3 |
— |
3 |
0 |
— |
— |
0 |
|
|
Humanitarian aid |
2 148 |
1 280 |
99 |
722 |
2 101 |
98 % |
47 |
— |
47 |
— |
— |
— |
— |
|
|
Common Foreign and Security Policy (CFSP) |
351 |
287 |
8 |
45 |
340 |
97 % |
9 |
— |
9 |
0 |
1 |
— |
1 |
|
|
Nuclear Safety Cooperation (INSC) |
54 |
51 |
— |
3 |
54 |
100 % |
0 |
— |
0 |
0 |
— |
— |
0 |
|
|
Decentralised agencies |
20 |
20 |
— |
0 |
20 |
100 % |
0 |
— |
0 |
— |
— |
— |
— |
|
|
Other actions and programmes |
209 |
83 |
— |
121 |
204 |
97 % |
6 |
— |
6 |
0 |
— |
— |
0 |
|
|
Pilot projects and preparatory actions |
9 |
8 |
1 |
— |
9 |
94 % |
0 |
1 |
1 |
— |
— |
— |
— |
|
|
Specific Actions |
66 |
66 |
— |
0 |
66 |
99 % |
0 |
— |
0 |
0 |
— |
— |
0 |
|
Total MFF Heading 4 |
12 382 |
10 710 |
108 |
997 |
11 814 |
95 % |
563 |
2 |
565 |
1 |
1 |
0 |
3 |
|
|
5 |
Pensions |
1 802 |
1 797 |
— |
0 |
1 797 |
100 % |
0 |
— |
0 |
5 |
— |
— |
5 |
|
|
European schools |
198 |
184 |
— |
12 |
196 |
99 % |
2 |
— |
2 |
0 |
— |
— |
0 |
|
|
Decentralised agencies |
— |
— |
— |
— |
— |
0 % |
— |
— |
— |
— |
— |
— |
— |
|
|
Pilot projects and preparatory actions |
5 |
5 |
— |
— |
5 |
100 % |
— |
— |
— |
0 |
— |
— |
0 |
|
|
Commission administrative expenditure |
3 841 |
3 446 |
1 |
207 |
3 654 |
95 % |
150 |
— |
150 |
37 |
— |
— |
37 |
|
|
Administrative expenditure of Other Institutions |
4 344 |
3 838 |
0 |
303 |
4 142 |
95 % |
120 |
0 |
120 |
83 |
0 |
0 |
83 |
|
Total MFF Heading 5 |
10 190 |
9 270 |
2 |
522 |
9 794 |
96 % |
272 |
— |
272 |
125 |
0 |
— |
125 |
|
|
6 |
Compensations |
— |
— |
— |
— |
— |
0 % |
— |
— |
— |
— |
— |
— |
— |
|
Total MFF Heading 6 |
— |
— |
— |
— |
— |
0 % |
— |
— |
— |
— |
— |
— |
— |
|
|
8 |
Negative reserve |
— |
— |
— |
— |
— |
0 % |
— |
— |
— |
— |
— |
— |
— |
|
|
Deficit carried over |
— |
— |
— |
— |
— |
0 % |
— |
— |
— |
— |
— |
— |
— |
|
Total MFF Heading 8 |
— |
— |
— |
— |
— |
0 % |
— |
— |
— |
— |
— |
— |
— |
|
|
9 |
Emergency Aid Reserve (EAR) |
62 |
— |
— |
— |
— |
0 % |
— |
62 |
62 |
— |
— |
— |
— |
|
|
European Globalisation Adjustment Fund (EGF) |
210 |
18 |
— |
— |
18 |
9 % |
41 |
— |
41 |
151 |
— |
— |
151 |
|
|
European Union Solidarity Fund (EUSF) |
1 273 |
1 241 |
31 |
— |
1 273 |
100 % |
— |
— |
— |
— |
— |
— |
— |
|
Total MFF Heading 9 |
1 544 |
1 259 |
31 |
— |
1 291 |
84 % |
41 |
62 |
103 |
151 |
— |
— |
151 |
|
|
Total |
176 576 |
158 730 |
567 |
11 854 |
171 150 |
97 % |
4 315 |
788 |
5 103 |
314 |
9 |
0 |
323 |
|
4.8. DETAILED MFF: IMPLEMENTATION OF PAYMENT APPROPRIATIONS
|
EUR million |
|||||||||||||||
|
Programme |
|
Payments made |
Appropriations carried over to 2018 |
Appropriations lapsing |
|||||||||||
|
Total appropr. available |
from final adopted budget |
from carry- overs |
from assigned revenue |
Total |
% |
automatic carry-overs |
carry-overs by decision |
assigned revenue |
Total |
from final adopted budget |
from carry-overs |
from assigned revenue |
Total |
||
|
1 |
2 |
3 |
4 |
5=2+3+4 |
6=5/1 |
7 |
8 |
9 |
10=7+8+9 |
11 |
12 |
13 |
14=11+12+13 |
||
|
1.1 |
European Fund Strategic Investments (EFSI) |
2 506 |
2 467 |
— |
39 |
2 506 |
100 % |
0 |
— |
0 |
0 |
0 |
— |
— |
0 |
|
|
European satellite navigation (EGNOS/Galileo) |
1 108 |
848 |
3 |
45 |
895 |
81 % |
2 |
— |
210 |
212 |
0 |
0 |
— |
0 |
|
|
International Thermonuclear Reactor (ITER) |
743 |
723 |
0 |
1 |
724 |
97 % |
1 |
— |
18 |
19 |
0 |
0 |
— |
0 |
|
|
European Earth Observation Progr (Copernicus) |
658 |
635 |
2 |
19 |
655 |
100 % |
2 |
— |
1 |
3 |
(0) |
0 |
— |
0 |
|
|
Nuclear Safety and Decommissioning |
354 |
354 |
— |
— |
354 |
100 % |
— |
— |
— |
— |
0 |
— |
— |
0 |
|
|
Horizon 2020 |
12 860 |
10 025 |
63 |
775 |
10 863 |
84 % |
68 |
— |
1 914 |
1 982 |
7 |
8 |
0 |
15 |
|
|
Euratom Research and Training Programme |
518 |
327 |
18 |
27 |
371 |
72 % |
20 |
— |
125 |
145 |
0 |
2 |
— |
2 |
|
|
Competitiveness enterprises and SME's (COSME) |
324 |
248 |
2 |
18 |
268 |
83 % |
2 |
— |
53 |
55 |
0 |
0 |
0 |
0 |
|
|
Education, Training and Sport (Erasmus+) |
2 375 |
1 920 |
6 |
226 |
2 153 |
91 % |
7 |
— |
215 |
222 |
0 |
0 |
(0) |
0 |
|
|
Employment and Social Innovation (EaSI) |
102 |
87 |
1 |
3 |
92 |
90 % |
2 |
— |
6 |
8 |
1 |
1 |
0 |
2 |
|
|
Customs, Fiscalis and Anti-Fraud |
127 |
116 |
2 |
1 |
119 |
94 % |
0 |
— |
4 |
4 |
1 |
3 |
— |
4 |
|
|
CEF — Energy |
85 |
81 |
1 |
0 |
83 |
97 % |
1 |
— |
0 |
1 |
1 |
0 |
— |
2 |
|
|
CEF — Transport |
1 354 |
1 248 |
1 |
62 |
1 311 |
97 % |
2 |
— |
41 |
43 |
0 |
0 |
0 |
0 |
|
|
CEF — Information & Communications Technology (ICT) |
67 |
63 |
0 |
3 |
66 |
99 % |
0 |
— |
0 |
1 |
(0) |
0 |
— |
0 |
|
|
Energy projects for economic recovery (EERP) |
157 |
142 |
— |
7 |
149 |
94 % |
0 |
— |
9 |
9 |
— |
— |
— |
0 |
|
|
Decentralised agencies |
337 |
319 |
— |
13 |
333 |
99 % |
0 |
— |
5 |
5 |
0 |
— |
— |
0 |
|
|
Other actions and programmes |
543 |
197 |
1 |
87 |
285 |
52 % |
1 |
— |
257 |
258 |
0 |
0 |
0 |
0 |
|
|
Pilot projects and preparatory actions |
30 |
29 |
— |
0 |
29 |
99 % |
0 |
— |
0 |
0 |
0 |
— |
— |
0 |
|
|
Specific competences of the Commission |
123 |
117 |
— |
3 |
120 |
98 % |
0 |
— |
1 |
1 |
1 |
— |
— |
1 |
|
Total MFF Heading 1.1 |
24 370 |
19 945 |
101 |
1 330 |
21 376 |
88 % |
108 |
— |
2 858 |
2 966 |
12 |
16 |
0 |
28 |
|
|
1.2 |
Regional convergence (Less developed regions) |
18 078 |
14 702 |
— |
2 622 |
17 325 |
96 % |
0 |
— |
753 |
753 |
— |
— |
— |
0 |
|
|
Transition regions |
2 609 |
2 067 |
— |
453 |
2 520 |
97 % |
0 |
— |
89 |
89 |
— |
— |
— |
0 |
|
|
Competitiveness (More developed regions) |
5 672 |
4 413 |
— |
991 |
5 403 |
95 % |
0 |
— |
269 |
269 |
— |
— |
— |
0 |
|
|
Outermost and sparsely populated regions |
161 |
126 |
— |
35 |
161 |
100 % |
0 |
— |
— |
— |
— |
— |
— |
— |
|
|
Cohesion fund |
8 348 |
7 088 |
— |
1 260 |
8 348 |
100 % |
0 |
— |
— |
— |
— |
— |
— |
— |
|
|
European territorial cooperation |
630 |
576 |
— |
53 |
629 |
100 % |
0 |
— |
— |
— |
1 |
— |
— |
1 |
|
|
Technical assistance |
180 |
147 |
11 |
0 |
158 |
88 % |
12 |
— |
1 |
13 |
7 |
2 |
— |
9 |
|
|
European Aid to the Most Deprived (FEAD) |
298 |
291 |
0 |
— |
291 |
98 % |
0 |
— |
6 |
7 |
0 |
0 |
— |
0 |
|
|
Youth Employment initiative |
525 |
49 |
— |
475 |
524 |
100 % |
0 |
— |
1 |
1 |
— |
— |
— |
— |
|
|
Connecting Europe Facility (CEF) |
292 |
290 |
— |
2 |
291 |
100 % |
— |
— |
— |
— |
0 |
— |
— |
0 |
|
|
Pilot projects and preparatory actions |
5 |
5 |
— |
— |
5 |
96 % |
0 |
— |
0 |
0 |
0 |
— |
— |
0 |
|
Total MFF Heading 1.2 |
36 797 |
29 754 |
11 |
5 890 |
35 654 |
97 % |
13 |
— |
1 119 |
1 132 |
9 |
3 |
— |
11 |
|
|
Total MFF Heading 1 |
61 168 |
49 698 |
111 |
7 220 |
57 030 |
94 % |
121 |
— |
3 977 |
4 098 |
21 |
19 |
0 |
40 |
|
|
2 |
European Agricultural Guarantee Fund (EAGF) |
45 975 |
41 992 |
621 |
2 081 |
44 695 |
97 % |
103 |
451 |
705 |
1 259 |
12 |
8 |
— |
21 |
|
|
Agricultural Fund Rural Development (EAFRD) |
11 527 |
10 990 |
1 |
122 |
11 113 |
96 % |
2 |
— |
410 |
412 |
2 |
0 |
— |
2 |
|
|
European Maritime and Fisheries Fund (EMFF) |
519 |
384 |
0 |
4 |
389 |
75 % |
1 |
— |
129 |
130 |
0 |
0 |
— |
0 |
|
|
Fisheries Partnership Agreements (SFPAs) and Fisheries Management Organisations (RFMOs) |
139 |
135 |
— |
2 |
137 |
99 % |
0 |
— |
— |
— |
1 |
— |
— |
1 |
|
|
Environment and climate action (LIFE) |
343 |
326 |
4 |
8 |
337 |
98 % |
4 |
— |
1 |
5 |
1 |
0 |
— |
1 |
|
|
Decentralised agencies |
65 |
54 |
— |
10 |
64 |
99 % |
0 |
— |
1 |
1 |
0 |
— |
— |
0 |
|
|
Other actions and measures |
— |
— |
— |
— |
— |
0 % |
0 |
— |
— |
— |
— |
— |
— |
— |
|
|
Pilot projects and preparatory actions |
8 |
7 |
— |
0 |
7 |
96 % |
0 |
— |
0 |
0 |
0 |
— |
— |
0 |
|
|
Specific Actions |
0 |
— |
— |
— |
— |
0 % |
0 |
— |
— |
— |
— |
0 |
— |
0 |
|
Total MFF Heading 2 |
58 575 |
53 889 |
626 |
2 228 |
56 743 |
97 % |
111 |
451 |
1 245 |
1 806 |
17 |
9 |
— |
26 |
|
|
3 |
Asylum, Migration and Integration Fund (AMF) |
671 |
616 |
2 |
13 |
631 |
94 % |
2 |
— |
32 |
34 |
5 |
0 |
— |
5 |
|
|
Consumer |
22 |
20 |
0 |
1 |
21 |
95 % |
1 |
— |
0 |
1 |
0 |
0 |
— |
0 |
|
|
Creative Europe |
204 |
185 |
2 |
7 |
194 |
95 % |
2 |
— |
8 |
10 |
0 |
0 |
— |
0 |
|
|
Emergency Support within the Union (IES) |
218 |
217 |
0 |
— |
217 |
100 % |
0 |
— |
— |
0 |
0 |
0 |
— |
0 |
|
|
Internal Security Fund |
460 |
395 |
2 |
37 |
433 |
94 % |
2 |
— |
24 |
26 |
1 |
0 |
— |
1 |
|
|
IT systems |
31 |
28 |
— |
1 |
29 |
92 % |
0 |
— |
2 |
2 |
0 |
— |
— |
0 |
|
|
Justice |
41 |
36 |
1 |
2 |
39 |
95 % |
1 |
— |
1 |
1 |
0 |
0 |
0 |
1 |
|
|
Rights, Equality and Citizenship |
55 |
52 |
0 |
1 |
53 |
96 % |
0 |
— |
1 |
2 |
0 |
0 |
— |
1 |
|
|
Union Civil protection Mechanism |
30 |
23 |
— |
1 |
24 |
79 % |
0 |
5 |
1 |
5 |
1 |
— |
— |
1 |
|
|
Europe for Citizens |
27 |
26 |
0 |
0 |
27 |
97 % |
0 |
0 |
0 |
1 |
0 |
— |
— |
0 |
|
|
Food and feed |
246 |
239 |
1 |
2 |
241 |
98 % |
1 |
— |
2 |
3 |
1 |
0 |
— |
1 |
|
|
Health |
62 |
58 |
1 |
1 |
60 |
97 % |
1 |
— |
0 |
1 |
0 |
0 |
0 |
0 |
|
|
Decentralised agencies |
816 |
764 |
— |
25 |
789 |
97 % |
0 |
— |
26 |
26 |
1 |
— |
— |
1 |
|
|
Pilot projects and preparatory actions |
14 |
14 |
— |
— |
14 |
95 % |
0 |
— |
1 |
1 |
0 |
— |
— |
0 |
|
|
Specific Actions |
97 |
95 |
1 |
0 |
96 |
99 % |
1 |
— |
0 |
1 |
0 |
0 |
— |
0 |
|
Total MFF Heading 3 |
2 994 |
2 767 |
10 |
90 |
2 867 |
96 % |
11 |
5 |
99 |
115 |
11 |
1 |
0 |
12 |
|
|
4 |
Pre-accession assistance (IPA II) |
1 805 |
1 376 |
4 |
216 |
1 596 |
88 % |
7 |
— |
199 |
205 |
3 |
1 |
— |
4 |
|
|
Macro-financial Assistance (MFA) |
10 |
10 |
— |
— |
10 |
99 % |
0 |
— |
— |
— |
0 |
— |
— |
0 |
|
|
Guarantee Fund for External Actions |
351 |
241 |
— |
— |
241 |
69 % |
— |
— |
110 |
110 |
— |
— |
— |
— |
|
|
Union Civil Protection Mechanism |
11 |
7 |
— |
1 |
8 |
73 % |
0 |
2 |
0 |
2 |
1 |
— |
— |
1 |
|
|
EU Aid Volunteers initiative (EUAV) |
17 |
17 |
— |
— |
17 |
97 % |
— |
0 |
— |
0 |
0 |
— |
— |
0 |
|
|
Fund for Sustainable Development (EFSD) |
575 |
— |
— |
— |
— |
0 % |
275 |
— |
300 |
575 |
— |
— |
— |
— |
|
|
European Neighbourhood Instrument (ENI) |
2 048 |
1 978 |
5 |
31 |
2 014 |
98 % |
5 |
— |
28 |
33 |
0 |
0 |
— |
0 |
|
|
Development Cooperation Instrument (DCI) |
2 716 |
2 614 |
12 |
16 |
2 642 |
97 % |
14 |
— |
58 |
72 |
1 |
2 |
— |
2 |
|
|
Partnership Instrument (PI) |
99 |
95 |
1 |
1 |
96 |
97 % |
1 |
— |
1 |
1 |
1 |
0 |
— |
2 |
|
|
Democracy and Human Rights (EIDHR) |
166 |
156 |
3 |
2 |
161 |
97 % |
3 |
— |
1 |
4 |
0 |
1 |
— |
1 |
|
|
Stability and Peace (IcSP) |
271 |
253 |
2 |
4 |
259 |
96 % |
3 |
— |
7 |
10 |
2 |
0 |
— |
2 |
|
|
Humanitarian aid |
2 211 |
1 388 |
90 |
644 |
2 123 |
96 % |
5 |
— |
83 |
88 |
0 |
0 |
— |
0 |
|
|
Common Foreign and Security Policy (CFSP) |
313 |
258 |
0 |
32 |
290 |
93 % |
0 |
— |
23 |
23 |
0 |
0 |
— |
0 |
|
|
Nuclear Safety Cooperation (INSC) |
74 |
70 |
0 |
2 |
72 |
98 % |
1 |
— |
1 |
1 |
0 |
0 |
— |
0 |
|
|
Decentralised agencies |
20 |
20 |
— |
0 |
20 |
100 % |
0 |
— |
0 |
0 |
— |
— |
— |
0 |
|
|
Other actions and programmes |
193 |
64 |
0 |
117 |
181 |
94 % |
0 |
— |
10 |
10 |
2 |
— |
— |
2 |
|
|
Pilot projects and preparatory actions |
9 |
8 |
— |
0 |
8 |
95 % |
0 |
— |
0 |
0 |
0 |
— |
— |
0 |
|
|
Specific Actions |
56 |
55 |
— |
0 |
55 |
98 % |
0 |
— |
0 |
0 |
1 |
— |
— |
1 |
|
Total MFF Heading 4 |
10 944 |
8 610 |
116 |
1 067 |
9 793 |
89 % |
314 |
2 |
820 |
1 136 |
12 |
4 |
— |
16 |
|
|
5 |
Pensions |
1 802 |
1 797 |
— |
0 |
1 797 |
100 % |
— |
— |
0 |
0 |
5 |
— |
— |
5 |
|
|
European schools |
199 |
184 |
1 |
12 |
197 |
99 % |
0 |
— |
2 |
2 |
0 |
0 |
— |
0 |
|
|
Decentralised agencies |
— |
— |
— |
— |
— |
0 % |
— |
— |
— |
— |
— |
— |
— |
— |
|
|
Pilot projects and preparatory actions |
2 |
1 |
— |
— |
1 |
53 % |
0 |
1 |
— |
1 |
0 |
— |
— |
0 |
|
|
Commission administrative expenditure |
4 134 |
3 141 |
271 |
165 |
3 577 |
87 % |
305 |
— |
193 |
499 |
37 |
21 |
— |
58 |
|
|
Administrative expenditure of Other Institutions |
4 841 |
3 363 |
448 |
274 |
4 085 |
84 % |
475 |
0 |
152 |
627 |
83 |
46 |
— |
128 |
|
Total MFF Heading 5 |
10 977 |
8 486 |
720 |
451 |
9 656 |
88 % |
781 |
1 |
348 |
1 129 |
125 |
67 |
— |
191 |
|
|
6 |
Compensations |
— |
— |
— |
— |
— |
0 % |
— |
— |
— |
— |
— |
— |
— |
— |
|
Total MFF Heading 6 |
— |
— |
— |
— |
— |
0 % |
— |
— |
— |
— |
— |
— |
— |
— |
|
|
8 |
Negative reserve |
— |
— |
— |
— |
— |
0 % |
0 |
— |
— |
— |
— |
— |
— |
— |
|
|
Deficit carried over |
— |
— |
— |
— |
— |
0 % |
0 |
— |
— |
— |
— |
— |
— |
— |
|
Total MFF Heading 8 |
— |
— |
— |
— |
— |
0 % |
0 |
— |
— |
— |
— |
— |
— |
— |
|
|
9 |
Emergency Aid Reserve (EAR) |
99 |
— |
— |
— |
— |
0 % |
0 |
— |
— |
— |
99 |
— |
— |
99 |
|
|
European Globalisation Adjustment Fund (EGF) |
42 |
0 |
0 |
18 |
18 |
43 % |
0 |
— |
23 |
24 |
0 |
0 |
— |
0 |
|
|
European Union Solidarity Fund (EUSF) |
1 273 |
1 241 |
31 |
— |
1 273 |
100 % |
0 |
— |
— |
— |
— |
— |
— |
— |
|
Total MFF Heading 9 |
1 414 |
1 241 |
32 |
18 |
1 291 |
91 % |
0 |
— |
23 |
24 |
99 |
0 |
— |
99 |
|
|
Total |
146 071 |
124 691 |
1 615 |
11 073 |
137 379 |
94 % |
1 338 |
458 |
6 512 |
8 308 |
284 |
99 |
0 |
384 |
|
4.9. DETAILED MFF: MOVEMENTS IN COMMITMENTS OUTSTANDING (RAL)
|
EUR million |
||||||||||
|
Programme |
Commitments outstanding at the end of previous year |
Commitments of the current year |
Total commitm. outstanding at the end of the year |
|||||||
|
Commitm. carried forward from prev. year |
Decommitm./ Revaluations/ Cancellations |
Payments |
Commitm. outstanding at year-end |
Commitm. made during the year |
Payments |
Cancellation of commitm. which cannot be carried over |
Commitm. outstanding at year-end |
|
||
|
1.1 |
European Fund Strategic Investments (EFSI) |
2 460 |
(0) |
(2 451 ) |
9 |
2 700 |
(55) |
— |
2 645 |
2 654 |
|
|
European satellite navigation (EGNOS/Galileo) |
1 267 |
(1) |
(738) |
528 |
929 |
(157) |
— |
772 |
1 300 |
|
|
International Thermonuclear Reactor (ITER) |
2 128 |
(0) |
(668) |
1 460 |
323 |
(56) |
(0) |
267 |
1 727 |
|
|
European Earth Observation Progr (Copernicus) |
205 |
(0) |
(192) |
13 |
624 |
(464) |
— |
161 |
174 |
|
|
Nuclear Safety and Decommissioning |
867 |
(0) |
(353) |
514 |
138 |
(1) |
— |
137 |
651 |
|
|
Horizon 2020 |
19 940 |
(458) |
(7 173 ) |
12 309 |
11 304 |
(3 689 ) |
(3) |
7 612 |
19 921 |
|
|
Euratom Research and Training Programme |
226 |
(14) |
(106) |
106 |
357 |
(265) |
(0) |
92 |
198 |
|
|
Competitiveness enterprises and SME's (COSME) |
874 |
(74) |
(209) |
591 |
376 |
(59) |
— |
317 |
908 |
|
|
Education, Training and Sport (Erasmus+) |
652 |
(59) |
(258) |
336 |
2 263 |
(1 895 ) |
— |
368 |
704 |
|
|
Employment and Social Innovation (EaSI) |
187 |
(10) |
(61) |
115 |
138 |
(30) |
— |
107 |
222 |
|
|
Customs, Fiscalis and Anti-Fraud |
141 |
(8) |
(82) |
52 |
145 |
(38) |
— |
107 |
159 |
|
|
CEF — Energy |
1 140 |
(1) |
(77) |
1 062 |
622 |
(6) |
— |
616 |
1 678 |
|
|
CEF — Transport |
3 892 |
(661) |
(1 022 ) |
2 210 |
1 753 |
(289) |
— |
1 464 |
3 673 |
|
|
CEF — Information & Communications Technology (ICT) |
304 |
(1) |
(65) |
237 |
124 |
(1) |
— |
123 |
360 |
|
|
Energy projects for economic recovery (EERP) |
694 |
(0) |
(149) |
545 |
— |
— |
— |
— |
545 |
|
|
Decentralised agencies |
31 |
(0) |
(25) |
6 |
351 |
(308) |
— |
44 |
49 |
|
|
Other actions and programmes |
411 |
(23) |
(166) |
221 |
309 |
(119) |
— |
191 |
412 |
|
|
Pilot projects and preparatory actions |
41 |
(2) |
(15) |
25 |
56 |
(15) |
— |
41 |
66 |
|
|
Specific competences of the Commission |
162 |
(9) |
(78) |
75 |
140 |
(42) |
— |
99 |
174 |
|
Total MFF Heading 1.1 |
35 622 |
(1 321 ) |
(13 887 ) |
20 414 |
22 654 |
(7 489 ) |
(3) |
15 162 |
35 576 |
|
|
1.2 |
Regional convergence (Less developed regions) |
71 813 |
(1 537 ) |
(17 260 ) |
53 015 |
29 470 |
(64) |
— |
29 406 |
82 421 |
|
|
Transition regions |
12 382 |
— |
(2 494 ) |
9 888 |
6 289 |
(26) |
— |
6 263 |
16 151 |
|
|
Competitiveness (More developed regions) |
22 235 |
(352) |
(5 340 ) |
16 542 |
9 391 |
(64) |
— |
9 327 |
25 870 |
|
|
Outermost and sparsely populated regions |
523 |
— |
(152) |
371 |
251 |
(9) |
— |
242 |
613 |
|
|
Cohesion fund |
23 497 |
(940) |
(8 341 ) |
14 216 |
10 189 |
(7) |
— |
10 182 |
24 398 |
|
|
European territorial cooperation |
2 218 |
(176) |
(620) |
1 421 |
2 101 |
(9) |
— |
2 092 |
3 514 |
|
|
Technical assistance |
176 |
(8) |
(57) |
111 |
209 |
(101) |
(0) |
107 |
218 |
|
|
European Aid to the Most Deprived (FEAD) |
840 |
(0) |
(267) |
573 |
552 |
(24) |
— |
528 |
1 101 |
|
|
Youth Employment initiative |
2 215 |
— |
(523) |
1 692 |
556 |
(0) |
— |
556 |
2 248 |
|
|
Connecting Europe Facility (CEF) |
3 402 |
(0) |
(286) |
3 117 |
1 593 |
(5) |
— |
1 588 |
4 704 |
|
|
Pilot projects and preparatory actions |
15 |
(1) |
(5) |
9 |
13 |
(0) |
— |
13 |
22 |
|
Total MFF Heading 1.2 |
139 316 |
(3 015 ) |
(35 345 ) |
100 956 |
60 614 |
(310) |
(0) |
60 304 |
161 260 |
|
|
Total MFF Heading 1 |
174 938 |
(4 337 ) |
(49 231 ) |
121 370 |
83 268 |
(7 799 ) |
(3) |
75 467 |
196 837 |
|
|
2 |
European Agricultural Guarantee Fund (EAGF) |
247 |
(2) |
(211) |
33 |
44 759 |
(44 484 ) |
— |
275 |
309 |
|
|
Agricultural Fund Rural Development (EAFRD) |
29 641 |
(145) |
(10 928 ) |
18 567 |
14 360 |
(185) |
— |
14 175 |
32 742 |
|
|
European Maritime and Fisheries Fund (EMFF) |
2 595 |
(30) |
(374) |
2 191 |
1 042 |
(14) |
(0) |
1 028 |
3 218 |
|
|
Fisheries Partnership Agreements (SFPAs) and Fisheries Management Organisations (RFMOs) |
31 |
(0) |
(22) |
9 |
128 |
(115) |
— |
12 |
21 |
|
|
Environment and climate action (LIFE) |
1 404 |
(2) |
(315) |
1 087 |
500 |
(23) |
— |
477 |
1 564 |
|
|
Decentralised agencies |
3 |
— |
(3) |
— |
64 |
(61) |
— |
3 |
3 |
|
|
Other actions and measures |
6 |
— |
— |
6 |
— |
— |
— |
— |
6 |
|
|
Pilot projects and preparatory actions |
21 |
(1) |
(7) |
13 |
7 |
— |
— |
7 |
20 |
|
|
Specific Actions |
0 |
— |
— |
0 |
— |
— |
— |
— |
0 |
|
Total MFF Heading 2 |
33 947 |
(180) |
(11 860 ) |
21 907 |
60 859 |
(44 882 ) |
(0) |
15 977 |
37 883 |
|
|
3 |
Asylum, Migration and Integration Fund (AMF) |
1 734 |
(77) |
(582) |
1 075 |
1 422 |
(49) |
— |
1 373 |
2 447 |
|
|
Consumer |
35 |
(0) |
(16) |
19 |
28 |
(5) |
— |
22 |
41 |
|
|
Creative Europe |
177 |
(8) |
(82) |
87 |
218 |
(112) |
— |
105 |
193 |
|
|
Emergency Support within the Union (IES) |
109 |
(0) |
(78) |
31 |
199 |
(140) |
— |
59 |
90 |
|
|
Internal Security Fund |
1 191 |
(68) |
(421) |
703 |
730 |
(12) |
— |
718 |
1 420 |
|
|
IT systems |
43 |
(3) |
(25) |
15 |
36 |
(4) |
— |
32 |
47 |
|
|
Justice |
93 |
(18) |
(31) |
44 |
54 |
(7) |
— |
46 |
90 |
|
|
Rights, Equality and Citizenship |
117 |
(12) |
(52) |
53 |
64 |
(1) |
— |
63 |
115 |
|
|
Union Civil protection Mechanism |
49 |
(11) |
(16) |
22 |
30 |
(8) |
— |
22 |
44 |
|
|
Europe for Citizens |
23 |
(1) |
(14) |
9 |
27 |
(13) |
— |
13 |
22 |
|
|
Food and feed |
323 |
(27) |
(189) |
108 |
261 |
(53) |
— |
208 |
316 |
|
|
Health |
127 |
(0) |
(48) |
78 |
66 |
(12) |
— |
54 |
133 |
|
|
Decentralised agencies |
41 |
(3) |
(24) |
15 |
882 |
(765) |
— |
117 |
132 |
|
|
Pilot projects and preparatory actions |
31 |
(2) |
(12) |
16 |
9 |
(1) |
— |
8 |
24 |
|
|
Specific Actions |
74 |
(2) |
(61) |
11 |
101 |
(35) |
— |
66 |
77 |
|
Total MFF Heading 3 |
4 167 |
(231) |
(1 650 ) |
2 286 |
4 124 |
(1 217 ) |
— |
2 908 |
5 194 |
|
|
4 |
Pre-accession assistance (IPA II) |
6 400 |
(56) |
(1 408 ) |
4 936 |
2 151 |
(187) |
(0) |
1 963 |
6 899 |
|
|
Macro-financial Assistance (MFA) |
10 |
(0) |
(10) |
0 |
40 |
(0) |
— |
40 |
40 |
|
|
Guarantee Fund for External Actions |
— |
— |
— |
— |
241 |
(241) |
— |
— |
— |
|
|
Union Civil Protection Mechanism |
15 |
(0) |
(7) |
8 |
12 |
(2) |
— |
10 |
18 |
|
|
EU Aid Volunteers initiative (EUAV) |
17 |
— |
(4) |
13 |
17 |
(12) |
— |
5 |
18 |
|
|
Fund for Sustainable Development (EFSD) |
— |
— |
— |
— |
275 |
— |
— |
275 |
275 |
|
|
European Neighbourhood Instrument (ENI) |
7 344 |
(182) |
(1 678 ) |
5 484 |
2 515 |
(336) |
(0) |
2 178 |
7 662 |
|
|
Development Cooperation Instrument (DCI) |
8 282 |
(173) |
(2 377 ) |
5 732 |
3 175 |
(264) |
— |
2 911 |
8 643 |
|
|
Partnership Instrument (PI) |
340 |
(7) |
(83) |
250 |
140 |
(14) |
(0) |
126 |
376 |
|
|
Democracy and Human Rights (EIDHR) |
346 |
(2) |
(113) |
230 |
187 |
(47) |
— |
140 |
370 |
|
|
Stability and Peace (IcSP) |
626 |
(12) |
(224) |
390 |
268 |
(35) |
(0) |
233 |
623 |
|
|
Humanitarian aid |
964 |
(43) |
(575) |
346 |
2 101 |
(1 548 ) |
(0) |
553 |
899 |
|
|
Common Foreign and Security Policy (CFSP) |
204 |
(10) |
(65) |
129 |
340 |
(225) |
— |
115 |
243 |
|
|
Nuclear Safety Cooperation (INSC) |
145 |
(5) |
(46) |
93 |
54 |
(26) |
— |
29 |
122 |
|
|
Decentralised agencies |
— |
— |
— |
— |
20 |
(20) |
— |
— |
— |
|
|
Other actions and programmes |
148 |
(16) |
(23) |
109 |
204 |
(158) |
— |
45 |
154 |
|
|
Pilot projects and preparatory actions |
23 |
(2) |
(8) |
14 |
9 |
(1) |
— |
8 |
22 |
|
|
Specific Actions |
111 |
(9) |
(40) |
62 |
66 |
(15) |
— |
51 |
113 |
|
Total MFF Heading 4 |
24 974 |
(517) |
(6 662 ) |
17 795 |
11 814 |
(3 131 ) |
(1) |
8 682 |
26 478 |
|
|
5 |
Pensions |
— |
— |
— |
— |
1 797 |
(1 797 ) |
— |
— |
— |
|
|
European schools |
1 |
(0) |
(1) |
— |
196 |
(196) |
— |
0 |
0 |
|
|
Decentralised agencies |
— |
— |
— |
— |
— |
— |
— |
— |
— |
|
|
Pilot projects and preparatory actions |
2 |
(0) |
(1) |
1 |
5 |
(0) |
— |
4 |
6 |
|
|
Commission administrative expenditure |
299 |
(22) |
(276) |
1 |
3 654 |
(3 301 ) |
(0) |
353 |
354 |
|
|
Administrative expenditure of Other Institutions |
431 |
20 |
(448) |
3 |
4 142 |
(3 637 ) |
0 |
505 |
507 |
|
Total MFF Heading 5 |
732 |
(2) |
(726) |
4 |
9 794 |
(8 931 ) |
(0) |
863 |
867 |
|
|
6 |
Compensations |
— |
— |
— |
— |
— |
— |
— |
— |
— |
|
Total MFF Heading 6 |
— |
— |
— |
— |
— |
— |
— |
— |
— |
|
|
8 |
Negative reserve |
— |
— |
— |
— |
— |
— |
— |
— |
— |
|
|
Deficit carried over |
— |
— |
— |
— |
— |
— |
— |
— |
— |
|
Total MFF Heading 8 |
— |
— |
— |
— |
— |
— |
— |
— |
— |
|
|
9 |
Emergency Aid Reserve (EAR) |
— |
— |
— |
— |
— |
— |
— |
— |
— |
|
|
European Globalisation Adjustment Fund (EGF) |
0 |
(0) |
(0) |
— |
18 |
(18) |
— |
0 |
0 |
|
|
European Union Solidarity Fund (EUSF) |
— |
— |
— |
— |
1 273 |
(1 273 ) |
— |
— |
— |
|
Total MFF Heading 9 |
0 |
(0) |
(0) |
— |
1 291 |
(1 290 ) |
— |
0 |
0 |
|
|
Total |
238 759 |
(5 268 ) |
(70 129 ) |
163 362 |
171 150 |
(67 250 ) |
(4) |
103 896 |
267 258 |
|
4.10. DETAILED MFF: COMMITMENTS OUTSTANDING BY YEAR OF ORIGIN
|
EUR million |
||||||||||
|
Programme |
< 2011 |
2011 |
2012 |
2013 |
2014 |
2015 |
2016 |
2017 |
Total |
|
|
1.1 |
European Fund Strategic Investments (EFSI) |
— |
— |
— |
— |
— |
2 |
7 |
2 645 |
2 654 |
|
|
European satellite navigation (EGNOS/Galileo) |
— |
0 |
3 |
4 |
0 |
58 |
463 |
772 |
1 300 |
|
|
International Thermonuclear Reactor (ITER) |
— |
— |
— |
796 |
98 |
260 |
306 |
267 |
1 727 |
|
|
European Earth Observation Progr (Copernicus) |
— |
— |
— |
— |
0 |
2 |
11 |
161 |
174 |
|
|
Nuclear Safety and Decommissioning |
— |
— |
16 |
193 |
90 |
80 |
134 |
137 |
651 |
|
|
Horizon 2020 |
165 |
222 |
601 |
1 374 |
2 479 |
3 364 |
4 103 |
7 612 |
19 921 |
|
|
Euratom Research and Training Programme |
0 |
8 |
1 |
4 |
12 |
30 |
51 |
92 |
198 |
|
|
Competitiveness enterprises and SME's (COSME) |
2 |
2 |
32 |
254 |
10 |
77 |
213 |
317 |
908 |
|
|
Education, Training and Sport (Erasmus+) |
0 |
0 |
1 |
5 |
46 |
99 |
185 |
368 |
704 |
|
|
Employment and Social Innovation (EaSI) |
1 |
1 |
4 |
8 |
13 |
33 |
56 |
107 |
222 |
|
|
Customs, Fiscalis and Anti-Fraud |
— |
— |
0 |
— |
3 |
13 |
36 |
107 |
159 |
|
|
CEF — Energy |
6 |
2 |
5 |
3 |
330 |
314 |
401 |
616 |
1 678 |
|
|
CEF — Transport |
29 |
17 |
157 |
82 |
467 |
447 |
1 009 |
1 464 |
3 673 |
|
|
CEF — Information & Communications Technology (ICT) |
— |
— |
0 |
0 |
30 |
49 |
158 |
123 |
360 |
|
|
Energy projects for economic recovery (EERP) |
515 |
30 |
— |
— |
— |
— |
(0) |
— |
545 |
|
|
Decentralised agencies |
— |
— |
— |
— |
— |
0 |
5 |
44 |
49 |
|
|
Other actions and programmes |
22 |
8 |
7 |
23 |
30 |
39 |
92 |
191 |
412 |
|
|
Pilot projects and preparatory actions |
0 |
2 |
1 |
2 |
1 |
6 |
12 |
41 |
66 |
|
|
Specific competences of the Commission |
0 |
0 |
1 |
6 |
11 |
17 |
41 |
99 |
174 |
|
Total MFF Heading 1.1 |
741 |
294 |
829 |
2 754 |
3 620 |
4 893 |
7 283 |
15 162 |
35 576 |
|
|
1.2 |
Regional convergence (Less developed regions) |
519 |
229 |
509 |
7 711 |
1 079 |
19 224 |
23 744 |
29 406 |
82 421 |
|
|
Transition regions |
38 |
— |
— |
— |
305 |
4 671 |
4 874 |
6 263 |
16 151 |
|
|
Competitiveness (More developed regions) |
58 |
9 |
58 |
1 663 |
611 |
6 621 |
7 523 |
9 327 |
25 870 |
|
|
Outermost and sparsely populated regions |
— |
— |
— |
— |
23 |
142 |
206 |
242 |
613 |
|
|
Cohesion fund |
178 |
— |
58 |
1 257 |
436 |
3 870 |
8 418 |
10 182 |
24 398 |
|
|
European territorial cooperation |
41 |
— |
9 |
170 |
— |
284 |
917 |
2 092 |
3 514 |
|
|
Technical assistance |
1 |
— |
1 |
1 |
8 |
42 |
59 |
107 |
218 |
|
|
European Aid to the Most Deprived (FEAD) |
— |
— |
— |
— |
2 |
181 |
391 |
528 |
1 101 |
|
|
Youth Employment initiative |
— |
— |
— |
— |
123 |
1 148 |
420 |
556 |
2 248 |
|
|
Connecting Europe Facility (CEF) |
— |
— |
— |
— |
472 |
728 |
1 917 |
1 588 |
4 704 |
|
|
Pilot projects and preparatory actions |
0 |
— |
— |
0 |
1 |
1 |
7 |
13 |
22 |
|
Total MFF Heading 1.2 |
834 |
238 |
635 |
10 802 |
3 060 |
36 912 |
48 475 |
60 304 |
161 260 |
|
|
Total MFF Heading 1 |
1 575 |
532 |
1 464 |
13 556 |
6 680 |
41 805 |
55 759 |
75 467 |
196 837 |
|
|
2 |
European Agricultural Guarantee Fund (EAGF) |
— |
— |
— |
— |
0 |
12 |
22 |
275 |
309 |
|
|
Agricultural Fund Rural Development (EAFRD) |
34 |
— |
1 |
623 |
303 |
4 228 |
13 378 |
14 175 |
32 742 |
|
|
European Maritime and Fisheries Fund (EMFF) |
84 |
0 |
11 |
268 |
8 |
971 |
847 |
1 028 |
3 218 |
|
|
Fisheries Partnership Agreements (SFPAs) and Fisheries Management Organisations (RFMOs) |
— |
— |
— |
— |
— |
— |
9 |
12 |
21 |
|
|
Environment and climate action (LIFE) |
108 |
57 |
63 |
100 |
180 |
258 |
321 |
477 |
1 564 |
|
|
Decentralised agencies |
— |
— |
— |
— |
— |
— |
— |
3 |
3 |
|
|
Other actions and measures |
— |
— |
— |
— |
— |
— |
6 |
— |
6 |
|
|
Pilot projects and preparatory actions |
— |
0 |
1 |
1 |
5 |
1 |
6 |
7 |
20 |
|
|
Specific Actions |
— |
— |
— |
— |
0 |
0 |
— |
— |
0 |
|
Total MFF Heading 2 |
227 |
58 |
76 |
992 |
496 |
5 470 |
14 588 |
15 977 |
37 883 |
|
|
3 |
Asylum, Migration and Integration Fund (AMF) |
14 |
10 |
19 |
64 |
6 |
67 |
896 |
1 373 |
2 447 |
|
|
Consumer |
— |
— |
0 |
0 |
1 |
4 |
13 |
22 |
41 |
|
|
Creative Europe |
0 |
1 |
1 |
4 |
8 |
17 |
56 |
105 |
193 |
|
|
Emergency Support within the Union (IES) |
— |
— |
— |
— |
— |
— |
31 |
59 |
90 |
|
|
Internal Security Fund |
9 |
14 |
43 |
28 |
14 |
109 |
485 |
718 |
1 420 |
|
|
IT systems |
0 |
1 |
0 |
0 |
6 |
2 |
6 |
32 |
47 |
|
|
Justice |
0 |
1 |
2 |
4 |
7 |
9 |
21 |
46 |
90 |
|
|
Rights, Equality and Citizenship |
0 |
3 |
4 |
3 |
7 |
9 |
26 |
63 |
115 |
|
|
Union Civil protection Mechanism |
— |
— |
0 |
0 |
3 |
6 |
13 |
22 |
44 |
|
|
Europe for Citizens |
0 |
0 |
— |
0 |
0 |
1 |
6 |
13 |
22 |
|
|
Food and feed |
15 |
0 |
0 |
3 |
11 |
23 |
55 |
208 |
316 |
|
|
Health |
1 |
3 |
3 |
6 |
11 |
23 |
32 |
54 |
133 |
|
|
Decentralised agencies |
— |
— |
— |
— |
— |
1 |
14 |
117 |
132 |
|
|
Pilot projects and preparatory actions |
0 |
0 |
1 |
1 |
3 |
5 |
5 |
8 |
24 |
|
|
Specific Actions |
— |
0 |
0 |
0 |
0 |
0 |
10 |
66 |
77 |
|
Total MFF Heading 3 |
40 |
34 |
74 |
114 |
77 |
278 |
1 669 |
2 908 |
5 194 |
|
|
4 |
Pre-accession assistance (IPA II) |
356 |
119 |
154 |
622 |
686 |
1 225 |
1 773 |
1 963 |
6 899 |
|
|
Macro-financial Assistance (MFA) |
— |
— |
— |
— |
— |
— |
0 |
40 |
40 |
|
|
Guarantee Fund for External Actions |
— |
— |
— |
— |
— |
— |
— |
— |
— |
|
|
Union Civil Protection Mechanism |
— |
— |
— |
— |
2 |
3 |
3 |
10 |
18 |
|
|
EU Aid Volunteers initiative (EUAV) |
— |
— |
— |
— |
7 |
4 |
2 |
5 |
18 |
|
|
Fund for Sustainable Development (EFSD) |
— |
— |
— |
— |
— |
— |
— |
275 |
275 |
|
|
European Neighbourhood Instrument (ENI) |
381 |
215 |
441 |
735 |
794 |
1 252 |
1 666 |
2 178 |
7 662 |
|
|
Development Cooperation Instrument (DCI) |
229 |
168 |
359 |
756 |
943 |
1 397 |
1 879 |
2 911 |
8 643 |
|
|
Partnership Instrument (PI) |
0 |
0 |
20 |
17 |
59 |
66 |
87 |
126 |
376 |
|
|
Democracy and Human Rights (EIDHR) |
4 |
4 |
6 |
12 |
34 |
61 |
108 |
140 |
370 |
|
|
Stability and Peace (IcSP) |
10 |
11 |
24 |
41 |
64 |
103 |
138 |
233 |
623 |
|
|
Humanitarian aid |
26 |
13 |
13 |
14 |
8 |
19 |
253 |
553 |
899 |
|
|
Common Foreign and Security Policy (CFSP) |
4 |
1 |
17 |
14 |
34 |
32 |
27 |
115 |
243 |
|
|
Nuclear Safety Cooperation (INSC) |
9 |
6 |
10 |
11 |
16 |
17 |
24 |
29 |
122 |
|
|
Decentralised agencies |
— |
— |
— |
— |
— |
— |
— |
— |
— |
|
|
Other actions and programmes |
11 |
4 |
7 |
9 |
20 |
27 |
32 |
45 |
154 |
|
|
Pilot projects and preparatory actions |
4 |
0 |
2 |
0 |
1 |
5 |
1 |
8 |
22 |
|
|
Specific Actions |
0 |
0 |
2 |
1 |
5 |
16 |
37 |
51 |
113 |
|
Total MFF Heading 4 |
1 036 |
543 |
1 054 |
2 232 |
2 675 |
4 226 |
6 030 |
8 682 |
26 478 |
|
|
5 |
Pensions |
— |
— |
— |
— |
— |
— |
— |
— |
— |
|
|
European schools |
— |
— |
— |
— |
— |
— |
— |
0 |
0 |
|
|
Decentralised agencies |
— |
— |
— |
— |
— |
— |
— |
— |
— |
|
|
Pilot projects and preparatory actions |
— |
— |
— |
— |
— |
— |
1 |
4 |
6 |
|
|
Commission administrative expenditure |
— |
— |
— |
0 |
0 |
0 |
1 |
353 |
354 |
|
|
Administrative expenditure of Other Institutions |
0 |
0 |
0 |
0 |
0 |
0 |
3 |
505 |
507 |
|
Total MFF Heading 5 |
— |
— |
— |
0 |
0 |
0 |
4 |
863 |
867 |
|
|
6 |
Compensations |
— |
— |
— |
— |
— |
— |
— |
— |
— |
|
Total MFF Heading 6 |
— |
— |
— |
— |
— |
— |
— |
— |
— |
|
|
8 |
Negative reserve |
— |
— |
— |
— |
— |
— |
— |
— |
— |
|
|
Deficit carried over |
— |
— |
— |
— |
— |
— |
— |
— |
— |
|
Total MFF Heading 8 |
— |
— |
— |
— |
— |
— |
— |
— |
— |
|
|
9 |
Emergency Aid Reserve (EAR) |
— |
— |
— |
— |
— |
— |
— |
— |
— |
|
|
European Globalisation Adjustment Fund (EGF) |
— |
— |
— |
— |
— |
— |
— |
0 |
0 |
|
|
European Union Solidarity Fund (EUSF) |
— |
— |
— |
— |
— |
— |
— |
— |
— |
|
Total MFF Heading 9 |
— |
— |
— |
— |
— |
— |
— |
0 |
0 |
|
|
Total |
2 878 |
1 166 |
2 668 |
16 893 |
9 928 |
51 779 |
78 050 |
103 896 |
267 258 |
|
5. IMPLEMENTATION OF THE BUDGET BY INSTITUTION
5.1. IMPLEMENTATION OF BUDGET REVENUE
|
EUR million |
||||||||||
|
Institution |
Income appropriations |
Entitlements established |
Revenue |
Receipts as % of budget |
Outstanding |
|||||
|
Initial adopted budget |
Final adopted budget |
Current year |
Carried over |
Total |
On entitlem. of current year |
On entitlem. carried over |
Total |
|||
|
European Parliament |
159 |
159 |
207 |
21 |
227 |
204 |
3 |
207 |
130 % |
20 |
|
European Council and Council |
52 |
52 |
79 |
1 |
80 |
77 |
1 |
78 |
149 % |
2 |
|
Commission |
134 139 |
126 419 |
140 350 |
6 883 |
147 234 |
135 846 |
3 177 |
139 023 |
110 % |
8 210 |
|
Court of Justice |
54 |
54 |
52 |
0 |
52 |
52 |
0 |
52 |
96 % |
0 |
|
Court of Auditors |
20 |
20 |
21 |
0 |
21 |
21 |
0 |
21 |
103 % |
0 |
|
Economic and Social Committee |
11 |
11 |
16 |
0 |
16 |
16 |
0 |
16 |
140 % |
— |
|
Committee of the Regions |
9 |
9 |
12 |
0 |
12 |
12 |
0 |
12 |
137 % |
— |
|
Ombudsman |
1 |
1 |
1 |
0 |
1 |
1 |
0 |
1 |
82 % |
— |
|
European Data Protection Supervisor |
1 |
1 |
1 |
0 |
1 |
1 |
0 |
1 |
74 % |
— |
|
European External Action Service |
44 |
44 |
282 |
1 |
282 |
280 |
1 |
281 |
643 % |
2 |
|
Total |
134 490 |
126 771 |
141 020 |
6 906 |
147 926 |
136 509 |
3 182 |
139 691 |
110 % |
8 235 |
The consolidated reports on the implementation of the general budget of the EU include, as in previous years, the budget implementation of all Institutions since within the EU budget a separate budget for each Institution is established. Agencies do not have a separate budget inside the EU budget and they are partially financed by a Commission budget subsidy.
Concerning the EEAS, it should be noted that, in addition to its own budget, it also receives contributions from the Commission of EUR 144 million (2016: EUR 140 million) and the EDF of EUR 72 million (2016: EUR 44 million). These budget credits are put at the disposal of the EEAS (as assigned revenue) so as to cover primarily the costs of Commission staff working in the EU delegations, these delegations being administratively managed by the EEAS.
5.2. IMPLEMENTATION OF COMMITMENT APPROPRIATIONS
|
EUR million |
|||||||||||||
|
Institution |
Total appropriat. available |
Commitments made |
Appropriations carried over to 2018 |
Appropriations lapsing |
|||||||||
|
from final adopted budget |
from carry-overs |
from assigned revenue |
Total |
% |
from assigned revenue |
carry-overs by decision |
Total |
from final adopted budget |
from carry-overs |
from assigned revenue |
Total |
||
|
1 |
2 |
3 |
4 |
5=2+3+4 |
6=5/1 |
7 |
8 |
9=7+8 |
10 |
11 |
12 |
13=10+ 11+12 |
|
|
European Parliament |
1 999 |
1 890 |
0 |
49 |
1 938 |
97 % |
41 |
0 |
41 |
20 |
0 |
0 |
20 |
|
European Council and Council |
609 |
518 |
0 |
24 |
542 |
89 % |
23 |
0 |
23 |
44 |
0 |
0 |
44 |
|
Commission |
172 231 |
154 892 |
566 |
11 551 |
167 009 |
97 % |
4 195 |
788 |
4 983 |
231 |
9 |
0 |
240 |
|
Court of Justice |
401 |
394 |
0 |
1 |
395 |
98 % |
1 |
0 |
1 |
5 |
0 |
0 |
5 |
|
Court of Auditors |
141 |
138 |
0 |
0 |
138 |
98 % |
0 |
0 |
0 |
3 |
0 |
0 |
3 |
|
Economic and Social Committee |
138 |
129 |
0 |
4 |
133 |
96 % |
0 |
0 |
0 |
5 |
0 |
0 |
5 |
|
Committee of Regions |
97 |
91 |
0 |
4 |
95 |
98 % |
0 |
0 |
0 |
2 |
0 |
0 |
2 |
|
Ombudsman |
11 |
10 |
0 |
0 |
10 |
94 % |
0 |
0 |
0 |
1 |
0 |
0 |
1 |
|
European Data-protection Supervisor |
11 |
10 |
0 |
0 |
10 |
89 % |
0 |
0 |
0 |
1 |
0 |
0 |
1 |
|
European External Action Service |
937 |
658 |
0 |
221 |
880 |
94 % |
55 |
0 |
55 |
2 |
0 |
0 |
2 |
|
Total |
176 576 |
158 730 |
567 |
11 854 |
171 150 |
97 % |
4 315 |
788 |
5 103 |
314 |
9 |
0 |
323 |
5.3. IMPLEMENTATION OF PAYMENT APPROPRIATIONS
|
EUR million |
||||||||||||||
|
Institution |
Total approp. available |
Payments made |
Appropriations carried over to 2018 |
Appropriations lapsing |
||||||||||
|
from final adopted budget |
from carry-overs |
from assigned revenue |
Total |
% |
automatic carry-overs |
carry- overs by decision |
from assigned revenue |
Total |
from final adopted budget |
from carry-overs |
from assigned revenue |
Total |
||
|
1 |
2 |
3 |
4 |
5=2+3+4 |
6=5/1 |
7 |
8 |
9 |
10=7+8+9 |
11 |
12 |
13 |
14 |
|
|
European Parliament |
2 285 |
1 600 |
263 |
41 |
1 904 |
83 % |
290 |
0 |
48 |
338 |
20 |
22 |
0 |
42 |
|
European Council and Council |
671 |
466 |
57 |
23 |
547 |
81 % |
52 |
0 |
24 |
75 |
44 |
6 |
0 |
50 |
|
Commission |
141 230 |
121 328 |
1 167 |
10 800 |
133 294 |
94 % |
862 |
458 |
6 359 |
7 680 |
201 |
54 |
0 |
255 |
|
Court of Justice |
423 |
373 |
19 |
1 |
393 |
93 % |
21 |
0 |
1 |
22 |
5 |
3 |
0 |
8 |
|
Court of Auditors |
151 |
130 |
8 |
0 |
138 |
92 % |
8 |
0 |
0 |
8 |
3 |
1 |
0 |
4 |
|
Economic and Social Committee |
147 |
120 |
7 |
3 |
131 |
89 % |
9 |
0 |
1 |
10 |
5 |
1 |
0 |
6 |
|
Committee of Regions |
105 |
84 |
7 |
2 |
93 |
88 % |
8 |
0 |
2 |
9 |
2 |
1 |
0 |
3 |
|
Ombudsman |
12 |
9 |
1 |
0 |
10 |
87 % |
1 |
0 |
0 |
1 |
1 |
0 |
0 |
1 |
|
European Data-protection Supervisor |
12 |
9 |
1 |
0 |
9 |
77 % |
1 |
0 |
0 |
1 |
1 |
0 |
0 |
1 |
|
European External Action Service |
1 035 |
572 |
85 |
203 |
859 |
83 % |
86 |
0 |
77 |
163 |
2 |
11 |
— |
13 |
|
Total |
146 071 |
124 691 |
1 615 |
11 073 |
137 379 |
94 % |
1 338 |
458 |
6 512 |
8 308 |
284 |
99 |
0 |
384 |
6. IMPLEMENTATION OF THE AGENCIES' BUDGET
6.1. BUDGET REVENUE
|
EUR million |
|||
|
Agency |
Funding Commission Policy Area |
Final adopted budget |
Amounts received |
|
Agency for the Cooperation of Energy Regulators — ACER |
6 |
13 |
13 |
|
Body of European Regulators for Electronic Communications — BEREC |
9 |
4 |
4 |
|
Community Plant Variety Office — CPVO |
17 |
16 |
16 |
|
Consumers, Health, Agriculture and Food Executive Agency — CHAFEA |
17 |
10 |
10 |
|
Education, Audiovisual and Culture Executive Agency — EACEA |
15 |
50 |
50 |
|
European Agency for Safety and Health at Work — EU-OSHA |
4 |
15 |
15 |
|
European Agency for the Operational Management of Large-Scale IT Systems in the Area of Freedom, Security and Justice — eu-LISA |
18 |
68 |
70 |
|
European Asylum Support Office — EASO |
18 |
79 |
80 |
|
European Aviation Safety Agency — EASA |
6 |
192 |
153 |
|
European Banking Authority — EBA |
12 |
38 |
39 |
|
European Border and Coast Guard Agency — Frontex |
18 |
281 |
294 |
|
European Centre for Disease Prevention and Control — ECDC |
17 |
58 |
59 |
|
European Centre for the Development of Vocational Training — CEDEFOP |
15 |
18 |
18 |
|
European Chemicals Agency — ECHA |
2 |
112 |
114 |
|
European Environment Agency — EEA |
7 |
70 |
68 |
|
European Fisheries Control Agency — EFCA |
11 |
17 |
17 |
|
European Food Safety Authority — EFSA |
17 |
81 |
81 |
|
European Foundation for the Improvement of Living and Working Conditions — Eurofound |
4 |
20 |
20 |
|
European Global Navigation Satellite Systems (GNSS) Agency |
6 |
28 |
704 |
|
European Institute for Gender Equality — EIGE |
4 |
8 |
8 |
|
European Institute of Innovation and Technology — EIT |
15 |
303 |
304 |
|
European Insurance and Occupational Pensions Authority — EIOPA |
12 |
24 |
24 |
|
European Maritime Safety Agency — EMSA |
6 |
79 |
78 |
|
European Medicines Agency — EMA |
2 |
331 |
317 |
|
European Monitoring Centre for Drugs and Drug Addiction — EMCDDA |
18 |
16 |
16 |
|
European Police Office |
18 |
118 |
120 |
|
European Research Council Executive Agency — ERCEA |
8 |
47 |
47 |
|
European Securities and Markets Authority — ESMA |
12 |
42 |
42 |
|
European Training Foundation — ETF |
15 |
20 |
20 |
|
European Union Agency for Fundamental Rights — FRA |
18 |
23 |
23 |
|
European Union Agency for Law Enforcement Training — CEPOL |
18 |
9 |
10 |
|
European Union Agency for Network and Information Security — ENISA |
9 |
11 |
11 |
|
European Union Agency for Railways |
6 |
31 |
32 |
|
European Union Intellectual Property Office — EUIPO |
12 |
401 |
245 |
|
European Union's Judicial Cooperation Unit — EUROJUST |
33 |
48 |
49 |
|
Executive Agency for Small and Medium-sized Enterprises — EASME |
6 |
43 |
43 |
|
Fusion for Energy — F4E |
8 |
848 |
860 |
|
Innovation and Networks Executive Agency — INEA |
6 |
24 |
24 |
|
Research Executive Agency — REA |
8 |
67 |
67 |
|
Translation Centre for the Bodies of the European Union |
15 |
49 |
44 |
|
Total |
|
3 714 |
4 212 |
|
EUR million |
||
|
Type of revenue |
Final adopted budget |
Amounts received |
|
Commission subsidy |
2 429 |
2 429 |
|
Fee income |
677 |
664 |
|
Other income |
608 |
1 118 |
|
Total |
3 714 |
4 212 |
6.2. COMMITMENT AND PAYMENT APPROPRIATIONS BY AGENCY
|
EUR million |
||||
|
Agency |
Commitment appropriations |
Payment appropriations |
||
|
Total appropr. available |
Commitm. made |
Total appropr. available |
Payments made |
|
|
Agency for the Cooperation of Energy Regulators — ACER |
13 |
13 |
19 |
16 |
|
Body of European Regulators for Electronic Communications — BEREC |
4 |
4 |
5 |
4 |
|
Community Plant Variety Office — CPVO |
19 |
17 |
17 |
15 |
|
Consumers, Health, Agriculture and Food Executive Agency — CHAFEA |
10 |
9 |
11 |
8 |
|
Education, Audiovisual and Culture Executive Agency — EACEA |
50 |
49 |
55 |
48 |
|
European Agency for Safety and Health at Work — EU-OSHA |
16 |
15 |
20 |
15 |
|
European Agency for the Operational Management of Large-Scale IT Systems in the Area of Freedom, Security and Justice — eu-LISA |
158 |
155 |
78 |
67 |
|
European Asylum Support Office — EASO |
91 |
86 |
87 |
75 |
|
European Aviation Safety Agency — EASA |
227 |
160 |
236 |
147 |
|
European Banking Authority — EBA |
38 |
37 |
41 |
36 |
|
European Border and Coast Guard Agency — Frontex |
310 |
297 |
384 |
264 |
|
European Centre for Disease Prevention and Control — ECDC |
59 |
58 |
70 |
58 |
|
European Centre for the Development of Vocational Training — CEDEFOP |
18 |
18 |
19 |
17 |
|
European Chemicals Agency — ECHA |
112 |
109 |
126 |
110 |
|
European Environment Agency — EEA |
90 |
74 |
95 |
56 |
|
European Fisheries Control Agency — EFCA |
18 |
17 |
19 |
14 |
|
European Food Safety Authority — EFSA |
80 |
80 |
90 |
83 |
|
European Foundation for the Improvement of Living and Working Conditions — Eurofound |
21 |
20 |
24 |
20 |
|
European Global Navigation Satellite Systems (GNSS) Agency |
3 744 |
1 895 |
1 192 |
668 |
|
European Institute for Gender Equality — EIGE |
8 |
8 |
10 |
8 |
|
European Institute of Innovation and Technology — EIT |
317 |
289 |
308 |
306 |
|
European Insurance and Occupational Pensions Authority — EIOPA |
24 |
24 |
26 |
23 |
|
European Maritime Safety Agency — EMSA |
101 |
91 |
94 |
72 |
|
European Medicines Agency — EMA |
331 |
302 |
374 |
292 |
|
European Monitoring Centre for Drugs and Drug Addiction — EMCDDA |
17 |
16 |
17 |
16 |
|
European Police Office |
129 |
125 |
139 |
119 |
|
European Research Council Executive Agency — ERCEA |
47 |
47 |
50 |
47 |
|
European Securities and Markets Authority — ESMA |
46 |
45 |
50 |
44 |
|
European Training Foundation — ETF |
20 |
20 |
21 |
20 |
|
European Union Agency for Fundamental Rights — FRA |
23 |
23 |
29 |
22 |
|
European Union Agency for Law Enforcement Training — CEPOL |
11 |
10 |
12 |
10 |
|
European Union Agency for Network and Information Security — ENISA |
11 |
11 |
12 |
11 |
|
European Union Agency for Railways |
32 |
31 |
34 |
29 |
|
European Union Intellectual Property Office — EUIPO |
417 |
236 |
437 |
230 |
|
European Union's Judicial Cooperation Unit — EUROJUST |
50 |
49 |
58 |
49 |
|
Executive Agency for Small and Medium-sized Enterprises — EASME |
43 |
42 |
47 |
40 |
|
Fusion for Energy — F4E |
879 |
879 |
869 |
835 |
|
Innovation and Networks Executive Agency — INEA |
24 |
24 |
25 |
24 |
|
Research Executive Agency — REA |
67 |
67 |
70 |
66 |
|
Translation Centre for the Bodies of the European Union |
49 |
46 |
53 |
46 |
|
Total |
7 726 |
5 501 |
5 323 |
4 033 |
|
EUR million |
||||
|
Type |
Commitment appropriations |
Payment appropriations |
||
|
Total appropriat. available |
Commitments made |
Total appropriat. available |
Payments made |
|
|
Administrative expenses |
364 |
350 |
436 |
339 |
|
Operational expenses |
6 227 |
4 045 |
3 737 |
2 593 |
|
Operational expenses for specific projects |
3 |
2 |
3 |
2 |
|
Staff |
1 133 |
1 104 |
1 148 |
1 099 |
|
Total |
7 726 |
5 501 |
5 323 |
4 033 |
GLOSSARY
Actuarial assumptions
Assumptions used to calculate the costs of future events that affect the pension liability.
Actuarial gains and losses
For a defined benefit scheme, the changes in actuarial deficits or surpluses. They arise as a result of differences between the previous actuarial assumptions and what has actually occurred and due to effects of changes in actuarial assumptions.
Administrative appropriations
Administrative appropriations cover the running costs of the Institutions and entities (staff, buildings, office equipment).
Adopted budget
Draft budget becomes the adopted budget as soon as it is approved by the Budgetary Authority.
Amending budget
Decision adopted during the budget year to amend (increase, decrease, transfer) aspects of the adopted budget of that year.
Amounts to be called from Member States
These represent expenses incurred during the reporting period that will need to be funded by future budgets, i.e. by the EU Member States. This is a consequence of the co-existence of accruals based financial statements and a cash based budget.
Annual Activity Report (AAR)
Annual Activity Reports indicate the results of operations by reference to objectives set, associated risks and the form of internal control, inter alia. Since the 2001 budget exercise for the Commission and since 2003 for all European Union (EU) institutions, the ‘authorising officer by delegation’ must submit an AAR to his/her institution on the performance of his/her duties, together with financial and management information.
Appropriations
Budget funding. The budget forecasts both commitments and payments (cash or bank transfers to the beneficiaries). Appropriations for commitments and payments often differ (differentiated appropriations) because multi annual programmes and projects are usually fully committed in the year they are decided and are paid over the years as the implementation of the programme and project progresses. Non-differentiated appropriations apply to administrative expenditure, for agricultural market support and direct payments and commitment appropriations equal payment appropriations.
Assigned revenue
Dedicated revenue received to finance specific items of expenditure. The main source of external assigned revenue is financial contributions from third countries to programmes financed by the Union. The main source of internal assigned revenue is revenue from third parties in respect of goods, services or work supplied at their request; revenue arising from the repayment of amounts wrongly paid and revenue from the sale of publications and films, including those on an electronic medium.
Available for sale financial assets
All financial assets (except derivatives) that are according to International Public Sector Accounting Standards measured at fair value and for which the changes in fair value are to be recognised in a reserve in net assets until derecognition (or impairment).
Budget line
As far as the budget structure is concerned, revenue and expenditure are shown in the budget in accordance with a binding nomenclature which reflects the nature and purpose of each item, as imposed by the budgetary authority. The individual headings (title, chapter, article or line) provide a formal description of the nomenclature.
Cancellation of appropriations
Unused appropriations that may no longer be used.
Carryover of appropriations
Exception to the principle of annuality in so far as appropriations that could not be used in a given budget year may, under strict conditions, be exceptionally carried over for use during the following year.
Commitment
Legal pledge to provide finance subject to certain conditions. The EU commits itself to reimbursing its share of the costs of an EU funded project. Today’s commitments are tomorrow’s payments. Today’s payments are yesterday’s commitments.
Commitment appropriation
Commitment appropriations cover the total cost of legal obligations (contracts, grant agreements/decisions) that could be signed in the current financial year.
Current service cost
The increase in scheme liabilities arising from service in the current financial year.
Decommitment
An act whereby a previous commitment (or part of it) is cancelled.
Defined benefit scheme
A pension or other retirement benefit scheme where the scheme rules define the benefits independently of the contributions payable, and the benefits are not directly related to the investments of the scheme. The scheme may be funded or unfunded.
Derivatives
Financial instruments whose value is linked to changes in the value of another financial instrument, an indicator or a commodity. In contrast to the holder of a primary financial instrument (e.g. a government bond), who has an unqualified right to receive cash (or some other economic benefit) in the future, the holder of a derivative has only a qualified right to receive such a benefit. An example of a derivative is currency forward contract.
Direct management
Mode of budget implementation. Under direct management the budget is implemented directly by Commission services, Executive Agencies or Trust Funds.
Discount rate
The rate used to adjust for the time value of money. Discounting is a technique used to compare costs and benefits that occur in different time periods.
Effective interest rate
The rate that discounts estimated future cash receipts or payments over the expected life of the financial asset or financial liability to the net carrying amount of the asset or liability.
Financial assets or liabilities at fair value through surplus or deficit
All financial assets or liabilities that are according to International Public Sector Accounting Standards measured at fair value and for which the changes in fair value are to be recognised in surplus or deficit of the period (i.e. derivatives).
Financial correction
The purpose of financial corrections is to protect the EU budget from the burden of erroneous or irregular expenditure. For expenditure under shared management, the task of recovering incorrectly made payments is primarily the responsibility of the Member State.
A ‘confirmed’ financial correction has been accepted by the Member State concerned. A ‘decided’ financial correction has been adopted by a Commission decision and is always a net correction, where the Member State is required to reimburse irregular funds to the EU budget, thus leading to a definitive reduction of the allocated envelope to the Member State concerned. Confirmed and decided financial corrections are reported in this publication as one category.
An ‘implemented’ financial correction has corrected the observed irregularity.
Indirect management
Mode of budget implementation. Under indirect management the Commission confers tasks of budget implementation to bodies of EU law or national law.
Interruptions and suspensions
If the Commission finds, based on its own work or the information reported by audit authorities, that a Member State has failed to remedy serious shortcomings in the management and control systems and/or to correct irregular expenditure which had been declared and certified, it may interrupt or suspend payments.
Irregularity
An irregularity is an act which does not comply with EU rules and which has a potentially negative impact on EU financial interests, but which may be the result of genuine errors committed either by beneficiaries claiming funds or by the authorities responsible for making payments. If an irregularity is committed deliberately, it constitutes fraud.
Lapsing appropriations
Unused appropriations to be cancelled at the end of the financial year. Lapsing means the cancellation of all or part of the authorisation to make expenditures and/or incur liabilities which is represented by an appropriation. Only for Joint Undertakings, as specified in theirs Financial Rules, any unused appropriations may be entered in the estimate of revenue and expenditure of up to the following three financial years (the so-called ‘N+3’ rule). Hence, lapsing appropriations for JUs could be reactivated until financial year ‘N+3’
Own resources
Represent the main funding for the EU institutions and bodies and are defined in the own resources regulation 609/2014. Own resources comprise GNI-based resources, VAT-based resources and traditional own resources.
Payment appropriations
Payment appropriations cover expenditure due in the current year, arising from legal commitments entered in the current year and/or earlier years.
Pre-financing
A payment intended to provide the beneficiary with a float. It may be split into a number of payments in accordance with the provisions of the underlying contract, decision, agreement or the basic legal act. The float or advance is either used for the purpose for which it was provided during the period defined in the agreement or it is repaid.
Preventive measure
Preventive measures, which are at the Commission’s disposal to protect the EU budget when it is aware of potential deficiencies, include suspensions and interruptions of payments from the EU budget to the operational programme.
Reste à Liquider (RAL)
Represents the amount where a budgetary commitment has been made but the subsequent payment is not yet done. They represent payment obligations for the EU for future years and stem directly from the existence of multi annual programmes and the dissociation between commitment and payment appropriations.
Shared management
Mode of budget implementation. Under shared management budget implementation tasks are delegated to Member States. About 80 % of the EU expenditure falls under this implementation mode.
Traditional own resources
These represent revenue for the EU and are part of the ‘own resources’ which fund the activities of the EU. Traditional own resources are defined in the own resource regulation 609/2014 and comprise customs duties and sugar levies.
Transfers (between budget lines)
Transfers between budget lines imply the relocation of appropriations from one budget line to another, in the course of the financial year, and thereby they constitute an exception to the budgetary principle of specification. They are, however, expressly authorised by the Treaty on the Functioning of the European Union under the conditions laid down in the Financial Regulation (FR). The FR identifies different types of transfers depending on whether they are between or within budget titles, chapters, articles or headings and require different levels of authorisation.
LIST OF ABBREVIATIONS
|
AAR |
Annual Activity Report |
|
ABB |
Activity Based Budgeting |
|
ABM |
Activity Based Management |
|
ACER |
Agency for the Cooperation of Energy Regulators |
|
AMIF |
Asylum, Migration and Integration Fund |
|
AOD |
Authorising Officers by Delegation |
|
ARTEMIS |
Advanced Research & Technology for EMbedded Intelligent Systems |
|
ATM |
Air Traffic Management |
|
BBI |
Bio-Based Industries Joint Undertaking |
|
BEREC |
Body of European Regulators for Electronic Communications |
|
BIC |
Bio-based Industries Consortium |
|
BIS |
Bank for International Settlements |
|
BOP |
Balance of Payments |
|
BUFI Fund |
Budget Fines Fund |
|
CAP |
Common Agricultural Policy |
|
CCS LGF |
Cultural and Creative Sector Guarantee Facility |
|
CEDEFOP |
European Centre for the Development of Vocational Training |
|
CEF |
Connecting Europe Facility |
|
CEF DI |
Connecting Europe Facility Debt Instrument |
|
CEPOL |
European Union Agency for Law Enforcement Training |
|
CF |
Cohesion Fund |
|
CHAFEA |
Consumers, Health, Agriculture and Food Executive Agency |
|
CIP |
Competitiveness and Innovation Framework Programme |
|
COM |
Commission |
|
COSME |
Competitiveness of Enterprises and Small and Medium-sized Enterprises |
|
COSO |
Committee of Sponsoring Organizations of the Treadway Commission |
|
CPR |
Common Provisions Regulation |
|
CPVO |
Community Plant Variety Office |
|
D&WM |
Decommissioning and Waste Management |
|
EACEA |
Education, Audiovisual and Culture Executive Agency |
|
EAFRD |
European Agricultural Fund for Rural Development |
|
EAGF |
European Agricultural Guarantee Fund |
|
EAGGF |
European Agricultural Guidance and Guarantee Fund |
|
EASA |
European Aviation Safety Agency |
|
EaSI |
Employment and Social Innovation |
|
EASME |
Executive Agency for Small and Medium-sized Enterprises |
|
EASO |
European Asylum Support Office |
|
EBA |
European Banking Authority |
|
EBRD |
European Bank for Reconstruction and Development |
|
ECA |
European Court of Auditors |
|
ECB |
European Central Bank |
|
ECDC |
European Centre for Disease Prevention and Control |
|
ECHA |
European Chemicals Agency |
|
ECOFIN |
Economic and Financial Affairs Council |
|
ECSC |
European Coal and Steel Community |
|
ECSEL |
Electronic Components and Systems for European Leadership Joint Undertaking |
|
EDF |
European Development Fund |
|
EDIF |
Guarantee Facility under the Western Balkan |
|
EEA |
European Economic Area |
|
EEA |
European Environment Agency |
|
EEAS |
European External Action Service |
|
EFCA |
European Fisheries Control Agency |
|
EFF |
European Fisheries Fund |
|
EFSA |
European Food Safety Authority |
|
EFSD |
European Fund for Sustainable Development |
|
EFSE |
European Fund for Southeast Europe |
|
EFSF |
European Financial Stability Facility |
|
EFSI |
European Fund for Strategic Investments |
|
EFSM |
European Financial Stabilisation Mechanism |
|
EFTA |
European Free Trade Association |
|
EGNOS |
European Geostationary Navigation Overlay System |
|
EIB |
European Investment Bank |
|
EIF |
European Investment Fund |
|
EIGE |
European Institute for Gender Equality |
|
EIOPA |
European Insurance and Occupational Pensions Authority |
|
EIT |
European Institute of Innovation and Technology |
|
ElectriFI |
Electrification Financing Initiative |
|
EMA |
European Medicines Agency |
|
EMCDDA |
European Monitoring Centre for Drugs and Drug Addiction |
|
EMFF |
European Maritime and Fisheries Fund |
|
EMSA |
European Maritime Safety Agency |
|
EMU |
Economic and Monetary Union |
|
ENEF |
Enterprise Expansion Fund |
|
ENIAC |
European Nanoelectronics Initiative Advisory Council |
|
ENIF |
Enterprise Innovation Fund |
|
ENISA |
European Union Agency for Network and Information Security |
|
ENPI |
European Neighbourhood and Partnership Instrument |
|
EP |
European Parliament |
|
ERCEA |
European Research Council Executive Agency |
|
ERDF |
European Regional Development Fund |
|
ESA |
European Space Agency |
|
ESF |
European Social Fund |
|
ESIF |
European Structural and Investment Funds |
|
ESM |
European Stability Mechanism |
|
ESMA |
European Securities and Markets Authority |
|
ETF |
European Technology Start up Facility 1998 |
|
ETF |
European Training Foundation |
|
EU |
European Union |
|
EUIPO |
European Union Intellectual Property Office |
|
EU-LISA |
European Agency for the Operational Management of Large-Scale IT Systems in the Area of Freedom, Security and Justice |
|
EUMETSAT |
European Organisation for the Exploitation of Meteorological Satellites |
|
EU-OSHA |
European Agency for Safety and Health at Work |
|
Euratom |
European Atomic Energy Community |
|
Eurofound |
European Foundation for the Improvement of Living and Working Conditions |
|
EUROJUST |
European Union's Judicial Cooperation Unit |
|
EUROPOL |
European Police Office |
|
F4E |
Fusion for Energy |
|
FCH |
Fuel Cells Hydrogen Joint Undertaking |
|
FIFG |
Financial Instrument for Fisheries Guidance |
|
FIFO |
First-in, First-out |
|
FP7 |
7th Research Framework Programme for Research and Technological Development |
|
FR |
Financial Regulation |
|
FRA |
European Union Agency for Fundamental Rights |
|
Frontex |
European Border and Coast Guard Agency |
|
FSDA |
Financial Statement Discussion and Analysis |
|
GDP |
Gross Domestic Product |
|
GMES |
Global Monitoring for Environment and Security |
|
GNI |
Gross National Income |
|
GNSS |
Global Navigation Satellite Systems |
|
H2020 |
Horizon 2020 |
|
ICSLT |
International Civil Servants Life Table |
|
IFRP |
Integrated Financial Reporting Package |
|
IIW |
Infrastructure and Innovation Window |
|
IMF |
International Monetary Fund |
|
IMI |
Innovative Medicines Initiative Joint Undertaking |
|
INEA |
Innovation and Networks Executive Agency |
|
IPA II |
Instrument for Pre-accession Assistance |
|
IPSAS |
International Public Sector Accounting Standards |
|
ISF |
Internal Security Fund |
|
IT |
Information Technology |
|
ITER |
International Thermonuclear Experimental Reactor |
|
JAP |
Joint Action Plan |
|
JRC |
Joint Research Centre |
|
JU |
Joint Undertaking |
|
LGTT |
Loan Guarantee Instrument for TEN-T projects |
|
MAP |
Multi Annual Program — Medium Enterprise Financial Inclusion Programme |
|
MEP |
Member of the European Parliament |
|
MFA |
Macro Financial Assistance |
|
MFF |
Multiannual Financial Framework |
|
MSME |
Micro, Small and Medium Enterprise |
|
NEETs |
Not in Education, Employment or Training |
|
ORD |
Own Resources Decision |
|
PBI |
Project Bond Initiative |
|
PF4EE |
Private Finance for Energy Efficiency Instrument |
|
PGF |
Participants Guarantee Fund |
|
PMF |
European Progress Microfinance Facility |
|
PPP |
Public-Private Partnership |
|
PSEO |
Pension Scheme of European Officials |
|
R&I |
Research and Innovation |
|
RAL |
‘Reste à Liquider’ (Outstanding Commitments) |
|
REA |
Research Executive Agency |
|
RSFF |
Risk Sharing Finance Facility |
|
RTD |
Research, Technological Development and Demonstration |
|
S&P |
Standard & Poor's Financial Services LLC |
|
SANAD |
MENA Fund for Micro-, Small and Medium Enterprises |
|
SAPARD |
Special Accession Programme for Agriculture and Rural Development |
|
SEMED |
Southern and Eastern Mediterranean Micro, Small and Middle sized Enterprises Financial Inclusion Programme |
|
SESAR |
Single European Sky ATM Research Joint Undertaking |
|
SIUGI |
SME Initiative Uncapped Guarantee Instrument |
|
SME |
Small and Medium-sized Enterprise(s) |
|
SMEW |
SME Window (Small and Medium-sized Enterprises Window) |
|
TFEU |
Treaty on the Functioning of the European Union |
|
TOR |
Traditional Own Resources |
|
TRDI |
Temporary Rural Development Instrument |
|
VAT |
Value Added Tax |
|
YEI |
Youth Employment Initiative |
(1) On 29 March 2017, the United Kingdom (UK) gave formal notification of its intention to leave the EU thus triggering the withdrawal process under Article 50 of the Treaty on the European Union. The UK is due to leave the EU on 29 March 2019.
(2) Under the principle of subsidiarity, the Union shall act only if and in so far as the objectives of the proposed action cannot be sufficiently achieved by the Member States but can rather, by reason of the scale or effects, be better achieved at Union level. Under the principle of proportionality, the content and form of Union action shall not exceed what is necessary to achieve the objectives of the Treaties. See Article 5 of the TFEU.
(3) See Communication from the Commission, Europe 2020, A strategy for smart, sustainable and inclusive growth, COM(2010)2020, 3 March 2010.
(4) Commission communication ‘Next steps for a sustainable European future European action for sustainability’, SWD(2016) 390 final, 22 November 2016.
(5) Interinstitutional Agreement of 2 December 2013 between the European Parliament, the Council and the Commission on budgetary discipline, on cooperation in budgetary matters and on sound financial management (2013/C 373/01).
(6) For more details see Communication to the Commission from President Juncker and First Vice-President Timmermans: Governance in the European Commission, C(2017) 6915 final of 11 October 2017, URL: https://ec.europa.eu/info/sites/info/files/c_2017_6915_final_en.pdf.
(7) E.g. internal control standards are based on the COSO 2013 Internal Control principles.
(8) As a result, the term ‘European Commission’ is used to denote both the institution — the College — formed by the Members of the Commission, and its administration managed by the Directors-General of its departments (and heads of other administrative structures such as services, offices and executive agencies).
(1) It should be noted that due to the rounding of figures into millions of euros, some financial data in the tables below may appear not to add-up.
(2) The European Parliament adopted a budget on 18 November 2017 which provides for the payment of the Union's short-term liabilities from own resources to be collected by, or called up from, the Member States in 2018. Additionally, under Article 83 of the Staff Regulations (Council Regulation 259/68 of 29 February 1968 as amended), the Member States shall jointly guarantee the liability for pensions.
(3) ‘Not-assigned to MFF heading’ includes consolidated entities' budget execution and consolidation eliminations, off-budget operations and unallocated programmes with immaterial amounts.
(4) Excluding back-to-back loans for financial assistance.
(5) Available for sale financial assets (excluding equity instruments and Unitary Fund).
(6) Financial assets at fair value through surplus or deficit.
(7) Loans and Receivables include recoverables.
(8) With correction coefficient (‘CC’) applied.
(9) Paid for the first 3 years following departure.
(9) It should be noted that due to the rounding of figures into millions of euros, some financial data in the tables below may appear not to add up.
(10) The assets presented in this table include several items of the financial statements (Available-for-sale of EUR 4 014 million (of which EUR 1 145 million are equity instruments); Cash and cash equivalents of EUR 1 325 million; Loans of EUR 93 million and other items in the amount of EUR 94 million).
(11) The liabilities presented in this table include several items of the financial statements (Provisions of EUR 857 million; Payables of EUR 66 million and other items in the amount of EUR 7 million).
(12) For certain guarantees the risk taken by the EU is fully covered by the provisions made.
(13) Without re-financing transactions.
(14) Excluding precautionary assistance.
(*1) The above figures reflect the financial effect of both preventive and corrective mechanisms; for more details see the 2017 Annual Management and Performance Report for the EU budget, section 2.
(10) See for more information: European Commission ‘European Economic Forecast Winter 2018’, URL: https://ec.europa.eu/info/publications/economic-and-financial-affairs-publications_en.
(15) In April 2018, Romania has made a capital repayment of EUR 1,2 billion with a further capital repayment of EUR 0,1 billion to be expected in October 2018.
(16) Ireland has requested a maturity extension for a repayment tranche of EUR 3,4 billion, which was approved and successfully borrowed in the markets in the first quarter of 2018 and this amount has been rescheduled for repayment in two instalments of EUR 2,4 billion and EUR 1 billion in 2025 and 2033 respectively.
(11) It should be noted that due to the rounding of figures into millions of euros, some financial data in the tables below may appear not to add-up.
|
28.9.2018 |
EN |
Official Journal of the European Union |
C 348/175 |
THE COURT’S STATEMENT OF ASSURANCE PROVIDED TO THE EUROPEAN PARLIAMENT AND THE COUNCIL — INDEPENDENT AUDITOR’S REPORT
(2018/C 348/02)
Opinion
|
Reliability of the accounts
|
Opinion on the reliability of the accounts
|
Legality and regularity of the transactions underlying the accounts
|
Opinion on the legality and regularity of revenue underlying the accounts
|
|
Qualified opinion on the legality and regularity of payments underlying the accounts
|
Basis for opinion
Basis for qualified opinion on the legality and regularity of payments underlying the accounts
|
Key audit matters
We assessed the accounting treatment of the European Fund for Strategic Investments (EFSI) guarantee for the equity portfolios
We assessed the liability for pension and other employee benefits
We assessed the accrued charges presented in the accounts
We assessed the potential impact on the 2017 accounts of the United Kingdom’s withdrawal from the European Union
|
Other matters
|
Responsibilities of management
|
Auditor’s responsibilities for the audit of the consolidated accounts and underlying transactions
|
12 July 2018
Klaus-Heiner LEHNE
President
European Court of Auditors
12, rue Alcide De Gasperi, Luxembourg, LUXEMBOURG
(1) The consolidated financial statements comprise the balance sheet, the statement of financial performance, the cash flow statement the statement of changes in net assets, and a summary of significant accounting policies and other explanatory notes (including segment reporting).
(2) The budgetary implementation reports also comprise explanatory notes.
(3) This amounted to 46,7 billion euros. We provide further information in paragraphs 1.19 to 1.21 of our 2017 annual report.
(4) This amounted to 53,5 billion euros. We provide further information in paragraph 1.18 of our 2017 annual report.
(5) Regulation (EU) No 2015/1017 of the European Parliament and of the Council of 25 June 2015 on the European Fund for Strategic Investments, the European Investment Advisory Hub and the European Investment Project Portal and amending Regulations (EU) No 1291/2013 and (EU) No 1316/2013 — the European Fund for Strategic Investments (OJ L 169, 1.7.2015, p. 1) (the ‘EFSI Regulation’).
(6) The guarantee was increased up to 26 billion euros in accordance with the amended EFSI Regulation of December 2017 (Regulation (EU) No 2017/2396 of the European Parliament and of the Council of 13 December 2017 amending Regulations (EU) No 1316/2013 and (EU) No 2015/1017 (OJ L 345, 27.12.2017, p. 34)) and the EFSI Agreement amended in March 2018.
(7) See paragraphs 1.12-1.16 of our 2015 annual report.
(8) The EFSI Facility’s governance structure could be taken as an indication that it is under joint control, as could the use and allocation of the EU guarantee. However, according to the Commission, unanimous consent is not required for decisions on most relevant activities in relation to the SMEW Equity Product or the EFSI initiative as a whole, and therefore the Commission’s Accounting Officer concluded that joint control cannot exist.
(9) See International Public Sector Accounting Standard (IPSAS) 25 — Employee benefits. For the PSEO, the defined benefit obligation reflects the present value of expected future payments that the EU will be required to make to settle the pension obligations resulting from employee service in the current and prior periods.
(10) These comprise accrued charges on the liabilities side of the balance sheet of 64 billion euros and, on the asset side of the balance sheet, 37 billion euros reducing the value of pre-financing.