ISSN 1725-2423
Official Journal
of the European Union
C 86

English edition
Information and Notices
Volume 51
5 April 2008
|
ISSN 1725-2423 |
||
|
Official Journal of the European Union |
C 86 |
|
|
|
||
|
English edition |
Information and Notices |
Volume 51 |
|
Notice No |
Contents |
page |
|
|
II Information |
|
|
|
INFORMATION FROM EUROPEAN UNION INSTITUTIONS AND BODIES |
|
|
|
Council |
|
|
2008/C 086/01 |
||
|
|
Commission |
|
|
2008/C 086/02 |
Initiation of proceedings (Case COMP/M.4942 — Nokia/Navteq) ( 1 ) |
|
|
|
IV Notices |
|
|
|
NOTICES FROM EUROPEAN UNION INSTITUTIONS AND BODIES |
|
|
|
Commission |
|
|
2008/C 086/03 |
||
|
|
V Announcements |
|
|
|
ADMINISTRATIVE PROCEDURES |
|
|
|
Commission |
|
|
2008/C 086/04 |
||
|
|
PROCEDURES RELATING TO THE IMPLEMENTATION OF THE COMPETITION POLICY |
|
|
|
Commission |
|
|
2008/C 086/05 |
Prior notification of a concentration (Case COMP/M.5128 — Nordic Capital/TietoEnator) ( 1 ) |
|
|
2008/C 086/06 |
Prior notification of a concentration (Case COMP/M.5118 — P7S1/United Internet/Maxdome JV) — Candidate case for simplified procedure ( 1 ) |
|
|
2008/C 086/07 |
Communication from the French Government concerning Directive 94/22/EC of the European Parliament and of the Council on the conditions for granting and using authorisations for the prospection, exploration and production of hydrocarbons (Notice regarding an application for an exclusive licence to prospect for oil and gas, designated the Valenciennois Licence) ( 1 ) |
|
|
|
|
|
|
(1) Text with EEA relevance |
|
EN |
|
II Information
INFORMATION FROM EUROPEAN UNION INSTITUTIONS AND BODIES
Council
|
5.4.2008 |
EN |
Official Journal of the European Union |
C 86/1 |
2008 joint progress report of the Council and the Commission on the implementation of the ‘Education and Training 2010’ work programme — ‘Delivering lifelong learning for knowledge, creativity and innovation’
(2008/C 86/01)
1. INTRODUCTION
Education and training are crucial to economic and social change. The flexibility and security needed to achieve more and better jobs depend on ensuring that all citizens acquire key competences and update their skills throughout their lives (1). Lifelong learning supports creativity and innovation and enables full economic and social participation.
That is why the Council set itself ambitious objectives in the Education and Training 2010 work programme. In turn, these support the achievement of the Lisbon guidelines for jobs and growth. These objectives can only be achieved by sustained long term effort. Inevitably, progress will be uneven. It is to identify achievements and to direct effort to areas that are proving more difficult that the Council and the Commission prepare a joint report every second year.
This contribution to the 3rd Joint Report (2) points to significant progress and challenges in education and training reforms. The following areas will need particular effort:
|
— |
raising skill levels. People with low skill levels are at risk of economic and social exclusion. Continued high levels of early school leaving, low participation in lifelong learning by older workers and the low-skilled, and poor skill achievement among migrants cause concern in most countries. Further, future labour markets in a knowledge-based economy will demand ever higher skill levels from a shrinking work force. Low skills will become an ever greater challenge, |
|
— |
lifelong learning strategies. Most countries have made progress in defining unified and overarching strategies. Within such frameworks, progress is evident in pre-primary education, qualification frameworks and the validation of non-formal and informal learning. However, innovative learning partnerships and sustainable funding for high quality, efficient and equitable education and training (3) still elude many countries, the more so as the growth of investment appears to have slowed. Particular attention must also be given to lifelong guidance. Ensuring that reforms are effectively implemented is an important challenge to all, |
|
— |
the knowledge triangle (education, research and innovation). The knowledge triangle plays a key role in boosting jobs and growth. So it is so important to accelerate reform, to promote excellence in higher education and university-business partnerships and to ensure that all sectors of education and training play their full role in promoting creativity and innovation. |
2. PROGRESS HAS BEEN MADE IN A NUMBER OF AREAS
Europe has registered progress in a number of areas. This does not mean that progress is uniform or that efforts can be relaxed. The pace of reform remains a major challenge. But in the following areas most countries have put reforms in place or are in the process of doing so.
2.1. Lifelong learning strategies and qualifications systems
Explicit lifelong learning strategies (4), which set out national policy priorities and how different sectors relate to each other, were developed by the majority of countries (5).
Most of these incorporate a comprehensive vision of lifelong learning, covering all types and levels of education and training. Some, however, focus on formal education and training systems or on developing specific stages of the lifelong learning continuum.
There are signs that the evidence base of education and training policies is being strengthened (6). This is necessary for the overall coherence of systems and for an optimal allocation of resources. The priority given to the promotion of flexible learning pathways and transition between different parts of the system in some countries also strengthens coherence.
Qualifications frameworks and validation of non-formal and informal learning
National qualifications frameworks, which are linked to the establishment of the European Qualifications Framework for lifelong learning (7), are being developed in most countries (5). With them is coming a new focus on learning outcomes.
Systems for the validation of non-formal and informal learning are also coming into place, albeit more slowly (5). The challenge is now to move from experiment to full application in national qualifications systems, including improving access to higher education and access to education and training qualifications for low-skilled and older or unemployed workers.
In Portugal, a nationwide network of Centres for the Recognition, Validation and Certification of Competences (RVCC) was established in 2000. Currently nearly 250 000 adults are going through the validation process. The centres provide assessment and validation of competences for specific qualifications. The certification process includes an examination by an external jury and complementary training, if necessary.
2.2. Pre-primary education
The importance of pre-primary education is increasingly recognised throughout Europe. Its capacity to contribute to both efficiency and equity is reflected in the development of new approaches and policies. Revision of teaching content (8), capacity building of teachers (9), extension of compulsory schooling to parts of the pre-primary level (10), quality assessments (11) and increasing investment, for example through increased numbers of staff in pre-primary schools (12), each find their place.
Successful pilot projects and schemes have been run in a number of countries. The challenge is now to move beyond pilot actions to generalised implementation, supported by investment, in particular in qualified staff.
Between 2000 and 2005 participation of 4-year-olds in education increased in EU-27 by about 3 percentage points to over 85 % (13).
2.3. Higher education: a clear place in the Lisbon agenda
The modernisation of higher education is crucial to the knowledge triangle and to the Lisbon strategy. The issues of governance, funding and attractiveness have received increased attention at the European and national levels. These complement the Bologna reforms.
Solid progress has been registered in increasing university autonomy. This includes greater financial autonomy and new accountability mechanisms. New forms of stakeholder involvement are being tested, mostly as regards management of higher education institutions, but also in relation to curriculum development (14) or the definition of learning outcomes (15).
A compendium on best practice on the modernisation of universities is being developed by the higher education cluster, for policy makers and the wider public.
2.4. Education and training in the broader EU policy context
The large majority of Member States attach great importance to education, training and skills development in their Lisbon National Reform Programmes 2005-2008. This reflects their important contribution to implementing the integrated guidelines for growth and jobs.
Broad progress has been achieved in linking operational programmes under the structural funds to the priorities of the Education and Training 2010 work programme. This has been particularly evident in addressing the agreed indicator and benchmark areas.
Good progress has also been made in developing European reference tools to support reforms. During 2006 and 2007, the European Parliament and Council adopted recommendations in the areas of key competences, quality of mobility, quality assurance in higher education, and has now agreed on the European Qualifications Framework.
In general, the Commission and the Member States have also made substantial progress in implementing the actions announced in the Languages Action Plan 2004-2006 (16).
3. AREAS WHERE PROGRESS REMAINS INSUFFICIENT
3.1. Implementation of lifelong learning
Implementation is still the greatest challenge for lifelong learning strategies. It needs strong institutional commitment, coordination and partnership with all relevant stakeholders. Sustained effort can translate intentions into policies, which, in turn, deliver results. Appropriate dissemination arrangements and improved investment are vital. A lot remains to be done.
Positive trends in public spending on education between 2000 and 2003 seem to have come to a halt in 2004.
Total public expenditure on education as a percentage of GDP increased in the EU between 2000 (4,7 %) and 2003 (5,2 %), but then decreased to 5,1 % in 2004. Levels of expenditure continue to show huge variations between countries (between 3,3 % of GDP in Romania and 8,5 % in Denmark). Private expenditure on educational institutions as a percentage of GDP has increased slightly since 2000 but progress slowed down in 2004 (13).
While EU benchmark areas have found some reflection in national targets, not all countries have set such targets (5).
3.2. Basic skills for all
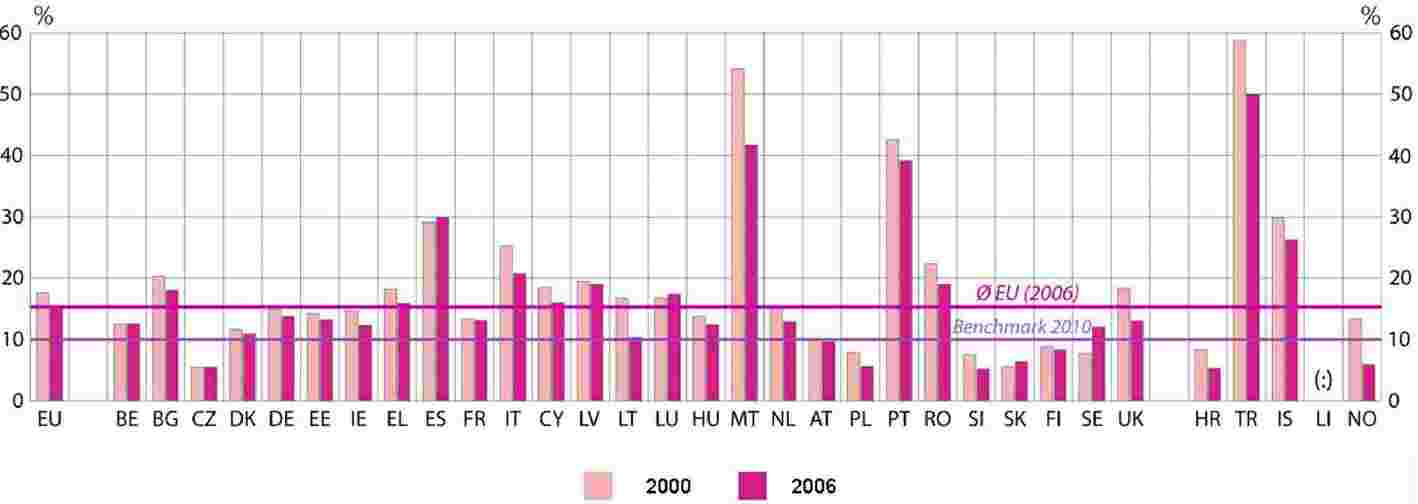
Early school leavers, upper secondary attainment and key competences continue to be major problem areas. There has not been enough progress since 2000 to reach the EU benchmarks by 2010. In some countries performance has actually worsened between 2000 and 2006. Several countries still had very high levels of early school leavers, above 20 %, in 2006. Results for low achievers in reading have deteriorated instead of improving.
Europe has far too many young people leaving education without the skills they need to participate in the knowledge society and to move smoothly into employment (17). They face the risk of social exclusion. Further, they are effectively shut out of lifelong learning early in their lives.
Early school leavers: every sixth young person (15,3 %) aged 18 to 24 in EU-27 still leaves school with no more than lower secondary education and does not participate in any kind of education or training after this. Progress must be faster to attain the EU benchmark of 10 % by 2010.
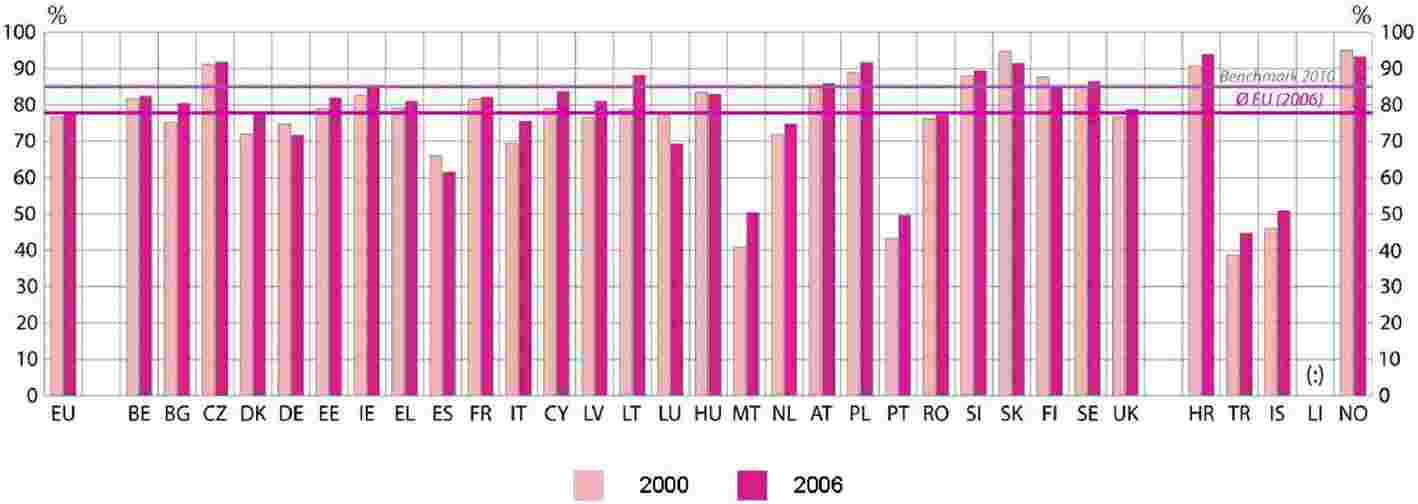
In the case of upper secondary attainment, there has been slow but steady progress. It has picked up slightly in recent years, but is not sufficient to achieve the 2010 objective (at least 85 % of 22-year-olds to complete at least upper secondary education).
While the EU benchmark is to reduce by 20 % the percentage of low-achieving 15-years olds in reading literacy in the EU by 2010 when compared to 2000, this share has actually increased between 2000 and 2006 (13).
Migrants and disadvantaged groups with different cultural backgrounds perform less well in the benchmark areas in most countries (18). They need particular attention. Their integration in pre-primary education would improve language learning and increase their prospects for successful schooling.
Initiatives on early school leaving and socio-economic disadvantage need to be complemented. Extra-curricular activities (such as in culture or sports), local partnerships, better involvement of parents, addressing parents' learning needs, and improving well-being at school for both learners and teachers would help.
3.3. Teacher education and training
No other in-school aspect influences student performance more than the quality of teacher education (19).
Teachers and trainers are challenged by a growing heterogeneity of classes, a demand for new competences, and the need to pay close attention to individual learning needs. Increasing school autonomy brings further tasks.
Large cohorts of older teachers will have to be replaced in the near future. The profession must be made more attractive.
However, current systems of teacher education and training often fail to give teachers the training they need. This is particularly so for continuing teacher training and professional development. In-service training for teachers is compulsory in eleven Member States.
3.4. Higher education: excellence, partnership and funding
Countries are paying more attention to strengthening the role of universities in research and innovation and university-business partnerships are becoming more common. However, many countries still have much to do in this respect (20).
Measures to achieve excellence in higher education institutions should focus on education, research and knowledge transfer alike. Currently, teaching is addressed less often. The proposed European Institute of Technology and Innovation (21) will inspire change in education and research institutions by becoming a reference model for integrating education, research and innovation.
In Germany, the federal and State governments have launched an initiative for excellence that provides an extra EUR 1,9 billion between 2006-2011 to boost top level research at universities selected on a competitive basis. The initiative includes three action lines: graduate schools; clusters to link university research, extra-university research and enterprises; and comprehensive strategies for top research universities.
Increasing investment, including from private sources, remains a challenge. At the same time, equitable access to a large diversity of study and research programmes must be ensured. Several governments have instruments to stimulate private investments such as tax incentives (22), public-private partnership or sponsoring schemes (23), and some have introduced or increased tuition or registration fees (24).
Public spending on tertiary education institutions in the EU, including education and research, was 1,1 % of GDP for EU-27 in 2004. This varied between 0,6 % in Malta and 2,5 % in Denmark. However, total spending remains far below the level in the United States. This is mainly because the level of private funding in the United States is more than seven times higher. Expenditure per tertiary student in the USA was more than twice the EU average (25).
While progress has been made in increasing the autonomy and accountability of universities, little evidence is available on the support provided to university staff and managers to handle this challenge.
3.5. Adult participation in lifelong learning
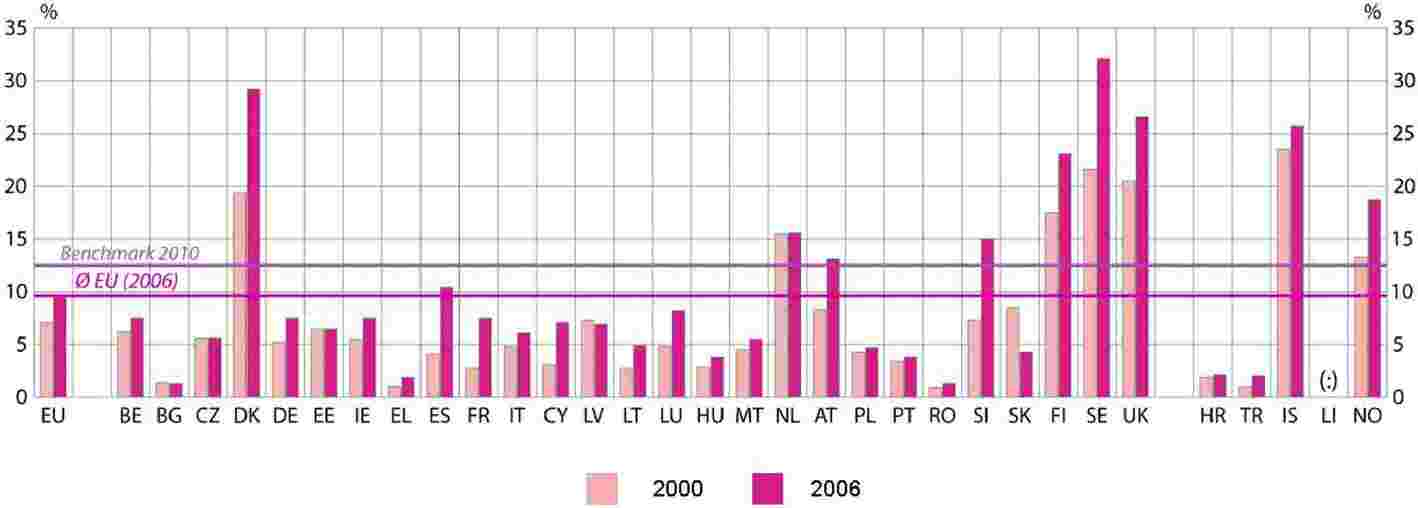
Adult participation in lifelong learning is no longer on track to achieve the EU benchmark. Greater efforts are still required to raise skill levels in the population and to achieve flexibility and security across the labour market.
Progress towards the EU benchmark (12,5 %) was broadly on track until 2005 (26). In 2006, however, an average of 9,6 % of Europeans aged 25-64 were participating in education and training activities, which is slightly less than in 2005. The overall figure hides an important imbalance: adults with a high level of education are more than six times as likely to participate in lifelong learning as the low skilled.
Low participation in lifelong learning of older workers and the low-skilled is a particular problem where participation rates are already low for the overall population (27). Further, there is a particular concentration of low skills among migrants. Demographic and labour market trends will lead to increased demand for high skills and fewer opportunities for the low-skilled. More attention will have to be given to training these groups.
3.6. Attractiveness, quality and relevance of vocational education and training (VET)
Further work must be done to improve the quality and attractiveness of VET. This is a key priority of the Copenhagen process (28).
Some countries have established advanced and comprehensive quality assurance systems (29), while others are still in a development phase (30).
The greater use of approaches based on learning outcomes in training programmes and qualifications is increasing the relevance of VET to the labour market. Renewed emphasis on apprenticeship, collaboration between schools and businesses, and work-based learning is a further plus. However, little progress can be reported on forecasting skills and qualification needs.
VET sometimes suffers from being poorly integrated with the rest of the education system. It can contribute to retaining potential drop-outs in education and training where earlier levels of school provide the key competences needed to enter VET. Although certain Member States (31) have made lifelong guidance a major political priority, particular attention still needs to be paid to strengthening guidance for adults. Further progress must also be made in reducing obstacles to progression between VET and further or higher education.
3.7. Transnational mobility
There is good progress on the implementation and use of Europass (32). Nevertheless, transnational mobility of learners is still mainly enabled by EU programmes. Most national measures concern higher education. Mobility in the field of VET is particularly difficult.
Mobility is compulsory in the University of Luxembourg. All students in a Bachelors programme must spend part of their studies abroad.
4. THE WAY FORWARD
4.1. Implementing lifelong learning to achieve efficiency and equity
Important gaps in the coherence and comprehensiveness of lifelong learning strategies remain. Implementation is now the challenge. In many cases, this has just started. The credibility of the strategies depends on linking them to policy measures. It depends on the capacity of the authorities to target resources. It depends on their capacity to mobilise national institutions and stakeholders at all levels, through learning partnerships.
Improving the knowledge base
Knowledge of the economic and social impact of education and training policies must be strengthened (33). Concern for both efficiency and equity should underpin the development of the European and national research-base on the policy and practice of education and training.
Peer learning and exchanges of experiences between policy-makers and stakeholders is an important source of know-how and should be supported. Monitoring of the development and implementation of lifelong learning strategies should continue, leading to an assessment of progress in the 2010 Joint Report.
Sustainable funding
The level, efficiency and sustainability of funding remain critical. Many countries are experimenting with new instruments and with incentives for private investment. This includes targeting individuals, households and employers. These efforts must be strengthened.
Raising skills levels
Increased investment in early education produces the highest returns to both efficiency and equity (34). The early acquisition of key competences is an effective means to establish the basis for further learning, increasing equity of outcomes and overall skills levels. Transition to the labour market will be made easier, skills shortages avoided.
There is a continuing demand for engineers and science graduates. Increasing recruitment to scientific and technical studies must therefore remain a point of attention.
However, the image, status and attractiveness of VET needs to be strengthened. To facilitate entry into initial VET, mobility and return to the educational system, flexible and modular structures should be developed. Integrated lifelong guidance systems should be available to all citizens. Particular attention is required in relation to adult learning.
Addressing socio-economic disadvantage
Education and training can contribute to overcoming socio-economic disadvantage. But it may also perpetuate it. Inequity in education and training brings huge costs. These are often hidden, but are no less real. Ensuring equity of access, participation, treatment and outcomes must therefore remain a priority.
Using the potential of migrants
The increasing diversity of European societies creates additional challenges for education and training provision. Migrant performance levels, participation and attainment rates are typically lower than average. Although factors such as socio-economic background and language go some way to explain this, there is evidence that education and training policies and systems are not meeting these challenges and themselves may be contributing to the problem (35). This situation requires particular attention, in order to foster the economic and social inclusion of migrants as well as intercultural dialogue.
High quality teaching
Teachers need better professional preparation and continuing development. This will improve education and training outcomes. Involving teachers and trainers in innovation and reform is also very important. The Commission has set out the challenges (36). It is also carrying out a public consultation on schools (37). The work programme offers a suitable context for addressing the challenges.
4.2. Innovation and creativity: education as a key element of the knowledge triangle
Education is fundamental to the knowledge triangle, and so to boosting jobs and growth. Universities are at the heart of the triangle. Centres of excellence which focus on teaching, research and knowledge transfer are vital. Much more needs to be done to enable higher education and business to work in partnership.
Research and innovation need a broad skills base in the population. Excellence and the key competences, particularly those relating to entrepreneurship, creativity and learning-to-learn, must be developed in all systems and levels of education and training. Both schools and VET have a major contribution to make to facilitating innovation. High-quality VET, for example, can contribute to innovation at the workplace.
4.3. Improved governance: making best use of the results of Education & Training 2010
The work programme is showing results at the European and the national level. The development of European reference tools and the work of the clusters and peer learning activities inform and support countries' reforms. Education and training challenges and the development of human resources figure prominently in the Lisbon National Reform Programmes of most Member States. The effectiveness of the open method of coordination in education and training, its impact and political ownership can still be strengthened. Particular attention at both the national and European levels should be given to:
|
— |
joined-up education and training policy in a lifelong learning perspective with strategic priorities set across the whole system, |
|
— |
improving the interfaces with relevant policy areas, such as innovation policy, employment and social policy, enterprise, research and structural funding, |
|
— |
integration of policy developments in the areas of higher education, VET and adult learning within the overall work programme, |
|
— |
strong links between the implementation and development of the Lisbon integrated guidelines and of the Education and Training 2010 work programme and greater visibility of lifelong learning in the Lisbon strategy, |
|
— |
mutual monitoring of developments on a voluntary basis between individual countries, by peer-learning or peer-review, |
|
— |
ensuring that the results of peer-learning activities reach policy makers and ministers, |
|
— |
stronger participation of civil society, |
|
— |
further development of indicators and benchmarks in line with the Council conclusions of May 2007, |
|
— |
making the most of Community funds and programmes, in particular the new Lifelong Learning Programme 2007-2013 and the EU cohesion policy instruments. |
To ensure that the agreed priorities of the Education and Training 2010 work programme are fully reflected in national policy making, the specific actions identified in the 2006 Joint Report should be pursued.
Mechanisms for the implementation of the Education and Training 2010 work programme, and lifelong learning strategies, should be in place. Close coordination is needed with those responsible for broader socio-economic policy, in particular Lisbon reforms and national strategies on social inclusion.
National targets and indicators should be further developed. They should take into account European objectives and benchmarks. Policy and practice should be informed by the use of knowledge and evaluation. The common principles, guidelines and recommendations agreed at the European level offer reference points for the design of national reforms.
4.4. Preparing for post-2010
The Education and Training 2010 work programme provides practical support for Member States' education and training reforms. Significant progress has been achieved since the programme was launched in 2002. Yet education and training reforms need time to bear fruit. Major challenges persist, new challenges have emerged. This work, including cooperation in the framework of the Bologna and Copenhagen processes, needs to be continued and indeed made more effective. Reflections on an updated strategic framework for European cooperation in education and training should therefore start now. Given the crucial role of education and training to the Strategy for Jobs and Growth, this must be closely associated with the future development of the Lisbon process.
(1) Commission Communication ‘Towards Common Principles of Flexicurity: more and better jobs trough flexibility and security.’ COM(2007) 359.
(2) The report is based primarily on an analysis of national reports and of performance against a set of indicators and benchmarks. See Annex 2 and SEC(2007) 1284 ‘Progress towards the Lisbon objectives in education and training. Indicators and benchmarks 2007.’ It also draws on the results of the open method of coordination in the area of education and training, notably the use of EU reference tools, and peer learning supporting Member State reforms and on similar exchanges undertaken as part of the Copenhagen and Bologna processes. For the 1st Joint Report see Council document 6905/04 EDUC 43; for the 2nd OJ C 79, 1.4.2006, p. 1.
(3) Commission Communication ‘Efficiency and Equity in European education and training system’, COM(2006) 481.
(4) The Council agreed that Member States should have coherent and comprehensive lifelong learning strategies in place by 2006 (Council resolution on lifelong learning of June 2002, 2004 Joint Report and 2005 Spring European Council).
(5) See Annex 1.
(6) Flanders, Germany, Estonia, Greece, Hungary, United Kingdom. Bulgaria, Cyprus, Spain, Ireland, Turkey present it as a condition for their strategies. See also SEC(2007) 1098 ‘Towards more knowledge-based policy and practice in education and training’.
(7) COM (2006) 479.
(8) Germany, Denmark, Greece.
(9) Czech Republic.
(10) Cyprus, Denmark, Greece, Poland.
(11) Spain, Lithuania, Croatia, Norway.
(12) Austria, Flanders, Cyprus, Germany, Denmark, Greece, Spain, Hungary, Malta, Netherlands, Poland, Sweden, Slovakia, United Kingdom, Croatia, Iceland, Norway.
(13) See Annex 2.
(14) Cyprus.
(15) Bulgaria, Luxembourg, Sweden, Turkey.
(16) Commission Working Document ‘Report on the implementation of the Action Plan “Promoting language learning and linguistic diversity 2004-2006”’, COM(2007) 554 final/2.
(17) Commission Communication ‘Promoting young people's full participation in education, employment and society’, COM(2007) 498.
(18) SEC(2007) 1284, p. 50, 75.
(19) Commission Communication ‘Improving the Quality of Teacher Education’, COM(2007) 392.
(20) Good practices can be found in the Nordic countries and the United Kingdom.
(21) COM(2006) 604 final/2.
(22) Spain, Sweden, Slovenia, Slovakia, Turkey.
(23) Austria, France, Hungary, Ireland, Luxembourg, Latvia, United Kingdom.
(24) Austria, Germany, Ireland, Netherlands, Slovenia, United Kingdom, Croatia.
(25) SEC(2007) 1284, p. 67.
(26) Progress was broadly on track, however, only as a result of changes in survey methodologies in several countries, which overstated progress. See Annex 2.
(27) SEC(2007) 1284, p. 81.
(28) Conclusions of the Council on the future priorities for enhanced European cooperation on Vocational Education and Training. Council document 14474/06 of 30 October 2006.
(29) Austria, Germany, Denmark, Finland, Ireland, Sweden, Norway.
(30) Bulgaria, Czech Republic, Spain, France, Luxembourg, Malta, Slovenia.
(31) France, Italy.
(32) Decision No 2241/2004/EC of the European Parliament and of the Council of 15 December 2004 (OJ L 390, 31.12.2004, p. 6).
(33) See SEC(2007) 1098.
(34) COM(2006) 481, p. 5.
(35) SEC(2007) 1284, p. 51.
(36) Commission Communication ‘Improving the Quality of Teacher Education’, COM(2007) 392.
(37) ‘Schools for the 21st century’, SEC(2007) 1009.
ANNEX 1
Countries' situation in relation to adoption of explicit lifelong learning strategy, qualifications framework, validation of non-formal/informal learning and national targets in benchmark areas.
|
Y |
= |
Country has strategy, framework, validation system or national targets in place. |
|
D |
= |
Country is developing strategy, framework, or validation system. |
|
N |
= |
Country does not have framework, validation system or national targets. |
|
P |
= |
Country has LLL policies in place but no explicit strategy. |
|
Countries |
Explicit National Lifelong Learning Strategies |
National Qualification Frameworks |
System for validation of non-formal and informal learning |
National targets set in all or some EU benchmark areas |
|
AT |
Y |
D |
D |
N |
|
BE fr |
Y |
D |
Y |
Y |
|
BE nl |
Y |
D |
Y |
Y |
|
BG |
D |
D |
D |
N |
|
CY |
Y |
N |
D |
Y |
|
CZ |
Y |
D |
D |
N |
|
DE |
Y |
D |
N |
N |
|
DK |
Y |
D |
Y |
Y |
|
EE |
Y |
D |
D |
Y |
|
EL |
Y |
N |
D |
Y |
|
ES |
Y |
D |
D |
Y |
|
FI |
Y |
D |
Y |
Y |
|
FR |
P |
Y |
Y |
Y |
|
HR |
Y |
D |
N |
Y |
|
HU |
Y |
D |
N |
Y |
|
IE |
D |
Y |
Y |
Y |
|
IS |
P |
N |
D |
N |
|
IT |
P |
D |
D |
N |
|
LI |
P |
N |
N |
N |
|
LT |
Y |
D |
D |
Y |
|
LU |
P |
D |
D |
N |
|
LV |
Y |
D |
D |
Y |
|
MT |
D |
Y |
N |
Y |
|
NL |
P |
D |
Y |
Y |
|
NO |
Y |
N |
Y |
N |
|
PL |
D |
D |
D |
Y |
|
PT |
P |
D |
Y |
Y |
|
RO |
D |
D |
D |
Y |
|
SE |
Y |
N |
D |
N |
|
SI |
D |
D |
Y |
Y |
|
SK |
Y |
D |
D |
Y |
|
TR |
D |
D |
N |
N |
|
UK |
Y |
Y |
D |
Y |
ANNEX 2
(STATISTICAL ANNEX)
PROGRESS AGAINST THE FIVE REFERENCE LEVELS OF AVERAGE EUROPEAN PERFORMANCE (BENCHMARKS) AND OTHER KEY INDICATORS IN EDUCATION AND TRAINING
Based on Commission Staff Working Document — ‘Progress towards the Lisbon objectives in education and training. Indicators and benchmarks 2007’ — SEC(2007) 1284
Country Codes
EU European Union
|
BE |
Belgium |
|
BG |
Bulgaria |
|
CZ |
Czech Republic |
|
DK |
Denmark |
|
DE |
Germany |
|
EE |
Estonia |
|
EL |
Greece |
|
ES |
Spain |
|
FR |
France |
|
IE |
Ireland |
|
IT |
Italy |
|
CY |
Cyprus |
|
LV |
Latvia |
|
LT |
Lithuania |
|
LU |
Luxembourg |
|
HU |
Hungary |
|
MT |
Malta |
|
NL |
Netherlands |
|
AT |
Austria |
|
PL |
Poland |
|
PT |
Portugal |
|
RO |
Romania |
|
SI |
Slovenia |
|
SK |
Slovakia |
|
FI |
Finland |
|
SE |
Sweden |
|
UK |
United Kingdom |
EEA European Economic Area
|
IS |
Iceland |
|
LI |
Liechtenstein |
|
NO |
Norway |
Candidate Countries
|
HR |
Croatia |
|
TR |
Turkey |
Others
|
JP |
Japan |
|
US/USA |
United States of America |
OVERVIEW ON PROGRESS IN THE FIVE BENCHMARK AREAS

Key results:
|
— |
As regards the number of maths, science and technology (MST) graduates the benchmark will be over-achieved; the progress required has already been made in 2000-2003. |
|
— |
There is some progress in lifelong learning participation. However, much of it is a result of changes in survey methodology in several Member States, which led to higher nominal participation rates and thus overstate overall progress. |
|
— |
There is constant improvement as regards early school leavers, but faster progress is needed in order to achieve the benchmark. |
|
— |
As regards upper secondary completion there has been only little progress. |
|
— |
Results for low achievers in reading have deteriorated since 2000 instead of improving as requested by the benchmark. |
Methodological remarks: The starting point in the year 2000 is set in the graph as zero and the 2010 benchmark as 100. The results achieved in each year are thus measured against the 2010 bench-mark. A diagonal line shows the progress required, i.e. each year an additional 10 % of progress would have to be achieved to reach the benchmark. If a line stays below this diagonal line, progress is not sufficient. As regards participation in lifelong learning, there have been many breaks in time series: some countries have revised their data collection methods between 2002 and 2003. The application of the new methods led to higher results from 2003, and thus progress is overstated between 2002 and 2003. The line 2002-2003 on lifelong learning participation is therefore dotted. For low achievers in reading (data from PISA survey) there are only two data points (2000, 2006) for the 19 countries included in the comparison (comparative 2003 results only for 16 countries).
OVERVIEW ON PROGRESS IN THE FIVE BENCHMARK AREAS
Overview on the 3 school level benchmarks
|
Situation (latest year available) and progress achieved since 2000 |
Low achievers in reading (OECD/PISA) (15 years old, %) |
Early school leavers (Eurostat/LFS) (18-24, %) |
Upper secondary attainment (Eurostat/LFS) (20-24, %) |
||||||||||||||
|
EU average 2006 |
24,1 |
15,3 |
77,8 |
||||||||||||||
|
EU average 2000 |
21,3 |
17,6 |
76,6 |
||||||||||||||
|
Source: |
OECD (PISA) |
Eurostat (LFS) |
Eurostat (LFS) |
||||||||||||||
|
Belgium |
0 |
0 |
0 |
||||||||||||||
|
Bulgaria |
- |
+ |
++ |
||||||||||||||
|
Czech Republic |
- |
0 |
0 |
||||||||||||||
|
Denmark |
++ |
+ |
++ |
||||||||||||||
|
Germany |
++ |
+ |
- |
||||||||||||||
|
Estonia |
/ |
+ |
++ |
||||||||||||||
|
Ireland |
0 |
++ |
++ |
||||||||||||||
|
Greece |
- |
+ |
++ |
||||||||||||||
|
Spain |
- |
- |
- |
||||||||||||||
|
France |
- |
+ |
0 |
||||||||||||||
|
Italy |
- |
++ |
++ |
||||||||||||||
|
Cyprus |
: (1) |
++ |
++ |
||||||||||||||
|
Latvia |
++ |
+ |
++ |
||||||||||||||
|
Lithuania |
/ |
++ |
++ |
||||||||||||||
|
Luxembourg |
0 |
- |
- |
||||||||||||||
|
Hungary |
++ |
+ |
0 |
||||||||||||||
|
Malta |
: |
++ |
++ |
||||||||||||||
|
Netherlands |
- |
++ |
++ |
||||||||||||||
|
Austria |
- |
+ |
0 |
||||||||||||||
|
Poland |
++ |
+ |
++ |
||||||||||||||
|
Portugal |
++ |
+ |
++ |
||||||||||||||
|
Romania |
- |
++ |
+ |
||||||||||||||
|
Slovenia |
/ |
(++) |
++ |
||||||||||||||
|
Slovakia |
- |
- |
- |
||||||||||||||
|
Finland |
++ |
+ |
- |
||||||||||||||
|
Sweden |
- |
- |
+ |
||||||||||||||
|
United Kingdom |
/ |
++ |
+ |
||||||||||||||
|
Croatia |
: |
++ |
++ |
||||||||||||||
|
Turkey |
++ |
++ |
++ |
||||||||||||||
|
Iceland |
- |
+ |
++ |
||||||||||||||
|
Norway |
- |
++ |
- |
||||||||||||||
|
Performance today (latest data) |
|||||||||||||||||
|
Dark/green |
Above EU average |
||||||||||||||||
|
Light/pink |
Below EU average |
||||||||||||||||
|
White |
No data |
||||||||||||||||
|
Compared to 2000
For low achievers the comparison was done for the period 2003-2006 for LU, NL, SK, TR. For more details see notes to tables on individual benchmark areas. |
|||||||||||||||||
KEY COMPETENCES
Percentage of pupils with reading literacy proficiency level one and lower (on the PISA reading literacy scale), 2000-2006

|
% with low reading skills |
All |
Girls |
Boys |
|
|
2000 |
2006 |
2006 |
2006 |
|
|
EU-27 |
21,3 |
24,1 |
17 |
30,4 |
|
Belgium |
19,0 |
19,4 |
13,3 |
24,9 |
|
Bulgaria |
40,3 |
51,1 |
40,4 |
60,9 |
|
Czech Republic |
17,5 |
24,8 |
16,9 |
30,8 |
|
Denmark |
17,9 |
16,0 |
11,4 |
20,7 |
|
Germany |
22,6 |
20,0 |
14,2 |
25,5 |
|
Estonia |
: |
13,6 |
7,0 |
19,9 |
|
Ireland |
11,0 |
12,1 |
7,7 |
16,6 |
|
Greece |
24,4 |
27,7 |
16,2 |
38,6 |
|
Spain |
16,3 |
25,7 |
18,9 |
32,3 |
|
France |
15,2 |
21,7 |
16,5 |
27,3 |
|
Italy |
18,9 |
26,4 |
19,9 |
33,0 |
|
Cyprus |
: |
: |
: |
: |
|
Latvia |
30,1 |
21,2 |
12,8 |
30,1 |
|
Lithuania |
: |
25,7 |
16,6 |
34,5 |
|
Luxembourg |
(35,1) |
22,9 |
17,4 |
28,2 |
|
Hungary |
22,7 |
20,6 |
13,2 |
27,3 |
|
Malta |
: |
: |
: |
: |
|
Netherlands |
(9,5) |
15,1 |
11,6 |
18,5 |
|
Austria |
19,3 |
21,5 |
15,4 |
27,4 |
|
Poland |
23,2 |
16,2 |
10,2 |
22,4 |
|
Portugal |
26,3 |
24,9 |
19,6 |
30,7 |
|
Romania |
41,3 |
53,5 |
43,5 |
63,5 |
|
Slovenia |
: |
16,5 |
7,9 |
25,2 |
|
Slovakia |
: |
27,8 |
20,1 |
35,0 |
|
Finland |
7,0 |
4,8 |
1,6 |
8,1 |
|
Sweden |
12,6 |
15,3 |
9,6 |
20,7 |
|
United Kingdom |
(12,8) |
19,0 |
14,1 |
24,0 |
|
Croatia |
: |
21,5 |
12,6 |
30,5 |
|
Turkey |
: |
32,2 |
21,5 |
41,0 |
|
Iceland |
14,5 |
20,5 |
12,5 |
28,3 |
|
Liechtenstein |
22,1 |
14,3 |
11,1 |
18,0 |
|
Norway |
17,5 |
22,4 |
14,9 |
29,4 |
|
Japan |
10,1 |
18,4 |
13,3 |
23,5 |
|
United States |
17,9 |
: |
: |
: |
|
Source: OECD (PISA). |
||||
In 2000, the share of low performing 15-year olds in reading in the EU was 21,3 % (data available for 18 Member States only). According to the benchmark this proportion should decrease by one fifth by 2010 (and thus reach 17,0 %). While the share has decreased in some Member States (notably Germany, Poland and Latvia), in most Member States it increased and performance at an EU level deteriorated (2006: 24,1 %).
Additional notes:
EU figure: weighted average based on number of pupils enrolled and data for 19 countries (LU, NL and UK not representative in 2000, hence their results have been put in brackets, they are not included in the calculations).
MT could not participate in the PISA study.
CY was not able to participate due to lack of unanimity amongst OECD Member States.
EARLY SCHOOL LEAVERS
Share of the population aged 18-24 with only lower-secondary education and not in education or training, 2000-2006
|
Early school leavers, % |
All |
Females |
Males |
|
|
2000 |
2006 |
2006 |
2006 |
|
|
EU-27 |
17,6 |
15,3 |
13,2 |
17,5 |
|
Belgium |
12,5 |
12,6 |
10,2 |
14,9 |
|
Bulgaria |
20,3 |
18,0 |
17,9 |
18,2 |
|
Czech Republic |
5,5 |
5,5 |
5,4 |
5,7 |
|
Denmark |
11,6 |
10,9 |
9,1 |
12,8 |
|
Germany |
14,9 |
13,8 |
13,6 |
13,9 |
|
Estonia |
14,2 |
13,2 |
10,7 (u) |
19,6 (u) |
|
Ireland |
14,7 |
12,3 |
9,0 |
15,6 |
|
Greece |
18,2 |
15,9 |
11,0 |
20,7 |
|
Spain |
29,1 |
29,9 |
23,8 |
35,8 |
|
France |
13,3 |
13,1 |
11,2 |
15,1 |
|
Italy |
25,3 |
20,8 |
17,3 |
24,3 |
|
Cyprus |
18,5 |
16,0 |
9,2 |
23,5 |
|
Latvia |
19,5 |
19,0 (p) |
16,1 (p) |
21,6 (p) |
|
Lithuania |
16,7 |
10,3 |
7,0 (u) |
13,3 (u) |
|
Luxembourg |
16,8 |
17,4 |
14,0 |
20,9 |
|
Hungary |
13,8 |
12,4 |
10,7 |
14,0 |
|
Malta |
54,2 |
41,7 |
38,8 |
44,6 |
|
Netherlands |
15,5 |
12,9 |
10,7 |
15,1 |
|
Austria |
10,2 |
9,6 |
9,8 |
9,3 |
|
Poland |
7,9 |
5,6 |
3,8 |
7,2 |
|
Portugal |
42,6 |
39,2 (p) |
31,8 (p) |
46,4 (p) |
|
Romania |
22,3 |
19,0 |
18,9 |
19,1 |
|
Slovenia |
7,5 |
5,2 (u) |
3,3 (u) |
6,9 (u) |
|
Slovakia |
5,6 |
6,4 |
5,5 |
7,3 |
|
Finland |
8,9 |
8,3 (p) |
6,4 (p) |
10,4 (p) |
|
Sweden |
7,7 |
12,0 |
10,7 |
13,3 |
|
United Kingdom |
18,4 |
13,0 |
11,4 |
14,6 |
|
Croatia |
8,3 |
5,3 (u) |
5,3 (u) |
5,3 (u) |
|
Turkey |
58,8 |
50,0 |
42,7 |
56,6 |
|
Iceland |
29,8 |
26,3 (p) |
22,0 (p) |
30,5 (p) |
|
Liechtenstein |
: |
: |
: |
: |
|
Norway |
13,3 |
5,9 |
4,3 |
7,4 |
|
Source: Eurostat (LFS spring data) (u) unreliable or uncertain data (p) provisional value. |
||||
In 2006, early school leavers in the EU-27 represented about 15 % of young people aged 18-24. There has been continuous improvement in recent years in reducing the share, but progress will need to be faster to reach the EU benchmark of 10 % in 2010. However, several Member States, notably the Nordic countries and many of the new Member States, already have shares of less than 10 %.
Additional notes:
BG, PL, SI: 2001 instead of 2000 results.
CZ, IE, LV, SK, HR: 2002 instead of 2000 results.
CY: There are a number of specific national factors influencing the international comparability of data, including the large number of Cypriots studying abroad. Hence results for CY are understated.
EE: 2005 instead of 2006 results for females.
COMPLETION OF UPPER SECONDARY EDUCATION BY YOUNG PEOPLE
Percentage of the population aged 20-24 having completed at least upper-secondary education, 2000-2006
|
Upper secondary attainment |
All |
Females |
Males |
|
|
2000 |
2006 |
2006 |
2006 |
|
|
EU-27 |
76,6 |
77,8 |
80,7 |
74,8 |
|
Belgium |
81,7 |
82,4 |
85,6 |
79,1 |
|
Bulgaria |
75,2 |
80,5 (p) |
81,1 (p) |
80,0 (p) |
|
Czech Republic |
91,2 |
91,8 |
92,4 |
91,1 |
|
Denmark |
72,0 |
77,4 |
81,5 |
73,4 |
|
Germany |
74,7 |
71,6 |
73,5 |
69,8 |
|
Estonia |
79,0 |
82,0 |
89,8 |
74,1 |
|
Ireland |
82,6 |
85,4 |
89,1 |
81,8 |
|
Greece |
79,2 |
81,0 (p) |
86,6 (p) |
75,5 (p) |
|
Spain |
66,0 |
61,6 |
69,0 |
54,6 |
|
France |
81,6 |
82,1 |
84,3 |
80,0 |
|
Italy |
69,4 |
75,5 (p) |
79,4 (p) |
71,7 (p) |
|
Cyprus |
79,0 |
83,7 (p) |
90,7 (p) |
76,1 (p) |
|
Latvia |
76,5 |
81,0 |
86,2 |
75,9 |
|
Lithuania |
78,9 |
88,2 |
91,2 |
85,3 |
|
Luxembourg |
77,5 |
69,3 |
74,5 |
64,0 |
|
Hungary |
83,5 |
82,9 |
84,7 |
81,2 |
|
Malta |
40,9 |
50,4 (p) |
52,8 (p) |
48,1 (p) |
|
Netherlands |
71,9 |
74,7 |
79,6 |
69,9 |
|
Austria |
85,1 |
85,8 |
86,7 |
84,9 |
|
Poland |
88,8 |
91,7 |
93,8 |
89,6 |
|
Portugal |
43,2 |
49,6 |
58,6 |
40,8 |
|
Romania |
76,1 |
77,2 (p) |
77,8 (p) |
76,6 (p) |
|
Slovenia |
88,0 |
89,4 |
91,4 |
87,7 |
|
Slovakia |
94,8 |
91,5 |
91,7 |
91,2 |
|
Finland |
87,7 |
84,7 (p) |
87,0 (p) |
82,3 (p) |
|
Sweden |
85,2 |
86,5 |
88,6 |
84,5 |
|
United Kingdom |
76,6 |
78,8 |
80,3 |
77,3 |
|
Croatia |
90,6 |
93,8 |
94,9 |
92,8 |
|
Turkey |
38,6 |
44,7 |
51,7 |
38,9 |
|
Iceland |
46,1 |
50,8 (p) |
57,7 (p) |
44,5 (p) |
|
Liechtenstein |
: |
: |
: |
: |
|
Norway |
95,0 |
93,3 (p) |
95,4 (p) |
91,2 (p) |
|
Source: Eurostat (LFS) (p) provisional value HR: 2002 instead of 2000, 2005 instead of 2006. |
||||
The share of young people (aged 20-24) who have completed upper-secondary education has only slightly improved since 2000. There was thus little progress in achieving the benchmark of raising this share to at least 85 % by 2010. However, some countries with a relatively low share, notably Portugal and Malta, have made considerable progress in the recent past. It should also be noted that many of the new Member States already perform above the benchmark set for 2010 and that four of them, the Czech Republic, Poland, Slovenia and Slovakia, and in addition Norway and Croatia, already have shares of 90 % and above.
Additional notes:
CY: There are a number of specific national factors influencing the international comparability of data, including the large number of Cypriots studying abroad. Hence results for CY are understated.
Since the 5 December 2005 release, Eurostat has been applying a refined definition of the ‘upper secondary’ educational attainment level in order to improve the comparability of results in the EU. For the 1998 data onwards ISCED level 3C programmes shorter than two years no longer fall under the ‘upper secondary’ level but come under ‘lower secondary’. This change implies revision of the results in DK (from 2001), ES, CY and IS. However, the definition cannot yet be implemented in EL, IE and AT, where all ISCED 3C levels are still included.
GRADUATES IN MATHEMATICS, SCIENCE AND TECHNOLOGY (MST)
Growth of tertiary graduates from mathematics, science and technology fields in %

|
|
Graduates per 1 000 (aged 20-29) |
Average growth per year |
Share of female graduates, % |
|
|
2005 |
2000-2005 |
2000 |
2005 |
|
|
EU-27 |
13,1 |
4,7 |
30,8 |
31,2 |
|
Belgium |
10,9 |
1,8 |
25,0 |
27,3 |
|
Bulgaria |
8,6 |
3,8 |
45,6 |
41,1 |
|
Czech Republic |
8,2 |
7,1 |
27,0 |
27,4 |
|
Denmark |
14,7 |
2,1 |
28,5 |
33,9 |
|
Germany |
9,7 |
3,1 |
21,6 |
24,4 |
|
Estonia |
12,1 |
: |
35,4 |
43,5 |
|
Ireland |
24,5 |
3,0 |
37,9 |
30,5 |
|
Greece |
10,1 |
: |
: |
40,9 |
|
Spain |
11,8 |
3,8 |
31,5 |
29,6 |
|
France |
22,5 |
3,0 |
30,8 |
28,4 |
|
Italy |
13,3 |
11,3 |
36,6 |
37,1 |
|
Cyprus |
3,6 |
4,7 |
31,0 |
38,1 |
|
Latvia |
9,8 |
6,2 |
31,4 |
32,8 |
|
Lithuania |
18,9 |
6,6 |
35,9 |
35,2 |
|
Luxembourg |
: |
: |
: |
: |
|
Hungary |
5,1 |
1,8 |
22,6 |
30,0 |
|
Malta |
3,4 |
2,1 |
26,3 |
30,1 |
|
Netherlands |
8,6 |
6,3 |
17,6 |
20,3 |
|
Austria |
9,8 |
6,1 |
19,9 |
23,3 |
|
Poland |
11,1 |
12,1 |
35,9 |
36,6 |
|
Portugal |
12,0 |
13,1 |
41,9 |
39,9 |
|
Romania |
10,3 |
6,7 |
35,1 |
40,0 |
|
Slovenia |
9,8 |
2,0 |
22,8 |
26,2 |
|
Slovakia |
10,2 |
14,7 |
30,1 |
35,3 |
|
Finland |
17,7 |
3,1 |
27,3 |
29,7 |
|
Sweden |
14,4 |
5,1 |
32,1 |
33,8 |
|
United Kingdom |
18,4 |
– 0,1 |
32,1 |
30,8 |
|
Croatia |
5,7 |
1,5 |
: |
32,7 |
|
Turkey |
5,7 |
6,0 |
31,1 |
28,5 |
|
Iceland |
10,1 |
4,1 |
37,9 |
37,2 |
|
Liechtenstein |
12,7 |
: |
: |
28,6 |
|
Norway |
9,0 |
1,0 |
26,8 |
26,0 |
|
Japan |
13,7 |
– 1,1 |
12,9 |
14,7 |
|
USA |
10,6 |
3,1 |
31,8 |
31,1 |
|
Source: Eurostat (UOE) and calculations based on Eurostat data. |
||||
The number of mathematics, science and technology (MST) graduates in EU-27 has increased since 2000 by over 170 000 or by more about 25 %. The EU has thus already achieved the benchmark of increasing the number of MST graduates by 15 % by 2010. More limited progress has been achieved as regards the second goal of reducing the gender imbalance. The share of female MST graduates has increased from 30,8 % in 2000 to 31,2 % in 2005. While Slovakia, Portugal and Poland showed the strongest annual growth in the number of MST graduates (> 12 %), Bulgaria, Estonia, Greece and Romania perform best as regards gender balance.
Additional notes:
For countries with breaks in series growth rates were calculated for years without breaks. PL: growth based on 2001-2005, RO: growth based on 2000-2002 and 2003-2005. HR: growth 2003-2005, SE: growth 2000-2003, HU: growth 2000-2003.
BE: Data for the Flemish community exclude second qualifications in non-university tertiary education; the data also exclude independent private institutions (although the number is small) and the German-speaking community.
EE: National data for 2000.
IT: 2005 result estimated by the Commission.
CY: Data exclude tertiary students graduating abroad. Over half of the total number of Cypriot tertiary students study abroad.
LU: Luxembourg has no complete university system, most MST students study and graduate abroad.
AT: 2000: ISCED level 5B refers to the previous year. HU: 2004: Changes in data collection on graduates by fields led to breaks in the time series.
PL: Data for 2000 exclude advanced research programmes (ISCED level 6).
RO: 2000-2002 data exclude second qualifications and advanced research programmes (ISCED level 6). There is therefore a break in the series in 2003.
SE: 2004: Changes in data collection on graduates by fields led to breaks in the time series.
UK: National data used for 2000.
LI: 2003-2004 data exclude tertiary students graduating abroad.
PARTICIPATION IN LIFELONG LEARNING
Percentage of population aged 25-64 participating in education and training in the four weeks prior to the survey, 2000-2006
|
LLL participation, % Source: Eurostat |
|
Females |
Males |
|
|
2000 |
2006 |
2006 |
2006 |
|
|
EU-27 |
7,1 |
9,6 |
10,4 |
8,8 |
|
Belgium |
6,2 |
7,5 (p) |
7,6 (p) |
7,4 (p) |
|
Bulgaria |
1,4 |
1,3 |
1,3 |
1,3 |
|
Czech Republic |
5,6 |
5,6 |
5,9 |
5,4 |
|
Denmark |
19,4 |
29,2 |
33,8 |
24,6 |
|
Germany |
5,2 |
7,5 |
7,3 |
7,8 |
|
Estonia |
6,5 |
6,5 |
8,6 |
4,2 (u) |
|
Ireland |
5,5 |
7,5 |
8,9 |
6,1 |
|
Greece |
1,0 |
1,9 |
1,8 |
2,0 |
|
Spain |
4,1 |
10,4 |
11,5 |
9,3 |
|
France |
2,8 |
7,5 |
7,8 |
7,2 |
|
Italy |
4,8 |
6,1 |
6,5 |
5,7 |
|
Cyprus |
3,1 |
7,1 |
7,8 |
6,5 |
|
Latvia |
7,3 |
6,9 (p) |
9,3 (p) |
4,1 (p) |
|
Lithuania |
2,8 |
4,9 (p) |
6,6 (p) |
2,9 (u) |
|
Luxembourg |
4,8 |
8,2 |
8,7 |
7,6 |
|
Hungary |
2,9 |
3,8 |
4,4 |
3,1 |
|
Malta |
4,5 |
5,5 |
5,6 |
5,5 |
|
Netherlands |
15,5 |
15,6 |
15,9 |
15,3 |
|
Austria |
8,3 |
13,1 |
14,0 |
12,2 |
|
Poland |
4,3 |
4,7 |
5,1 |
4,3 |
|
Portugal |
3,4 |
3,8 (p) |
4,0 (p) |
3,7 (p) |
|
Romania |
0,9 |
1,3 |
1,3 |
1,3 |
|
Slovenia |
7,3 |
15,0 |
16,3 |
13,8 |
|
Slovakia |
8,5 |
4,3 |
4,6 |
4,0 |
|
Finland |
17,5 |
23,1 |
27,0 |
19,3 |
|
Sweden |
21,6 |
32,1 |
36,5 |
27,9 |
|
United Kingdom |
20,5 |
26,6 |
31,2 (p) |
31,2 |
|
Croatia |
1,9 |
2,1 |
2,1 |
2,0 |
|
Turkey |
1,0 |
2,0 |
2,4 |
1,6 |
|
Iceland |
23,5 |
25,7 |
29,8 |
21,6 |
|
Norway |
13,3 |
18,7 |
20,2 |
17,2 |
|
Source: Eurostat (LFS), (p) = provisional, (u) = unreliable or uncertain data. |
||||
The percentage of the working age population who participated in education and training (in the 4 weeks prior to the survey) amounted to 9,6 % in 2006. Since breaks in time series overstate progress, the real increase was limited. Additional efforts are needed to reach the benchmark of a 12,5 % participation rate in 2010 (2). The Nordic countries, the United Kingdom, Slovenia and the Netherlands currently show the highest participation rates.
Additional notes:
Due to introduction of harmonised concepts and definitions in the survey, breaks in time series were noted in several countries for different years (between 2000 and 2006).
BG, PL, SI: 2001 instead of 2000.
CZ, IE, LV, SK, HR: 2002 instead of 2000.
SE, HR, IS: 2005 instead of 2006.
PARTICIPATION IN PRE-PRIMARY EDUCATION
Participation rates of 4-year-olds in education, 2000-2005

|
Participation in % of 4-year olds |
2000 |
2004 |
2005 |
|
EU-27 |
82,8 |
84,6 |
85,7 |
|
Belgium |
99,2 |
99,9 |
100 |
|
Bulgaria |
67,0 |
72,6 |
73,2 |
|
Czech Republic |
81,0 |
91,2 |
91,4 |
|
Denmark |
90,6 |
93,4 |
93,5 |
|
Germany |
81,4 |
84,3 |
84,6 |
|
Estonia |
78,2 |
83,9 |
84,2 |
|
Ireland |
51,1 |
46,6 |
45,4 |
|
Greece |
53,9 |
57,2 |
57,8 |
|
Spain |
99,0 |
100 |
99,3 |
|
France |
100 |
100 |
100 |
|
Italy |
100 |
100 |
100 |
|
Cyprus |
55,7 |
61,2 |
61,4 |
|
Latvia |
60,6 |
69,1 |
72,2 |
|
Lithuania |
51,0 |
54,5 |
56,8 |
|
Luxembourg |
94,9 |
83,5 |
96,3 |
|
Hungary |
89,5 |
92,3 |
90,7 |
|
Malta |
1,0 |
97,5 |
94,4 |
|
Netherlands |
99,5 |
74,0 |
73,4 |
|
Austria |
79,5 |
82,1 |
82,5 |
|
Poland |
33,3 |
35,7 |
38,1 |
|
Portugal |
72,3 |
79,9 |
84,0 |
|
Romania |
60,3 |
75,2 |
76,2 |
|
Slovenia |
67,7 |
77,8 |
75,9 |
|
Slovakia |
: |
71,7 |
74,0 |
|
Finland |
41,9 |
46,1 |
46,7 |
|
Sweden |
72,8 |
87,7 |
88,9 |
|
United Kingdom |
100 |
92,9 |
91,8 |
|
Croatia |
: |
42,4 |
44,7 |
|
Turkey |
: |
3,4 |
5,0 |
|
Iceland |
90,9 |
95,1 |
95,3 |
|
Liechtenstein |
: |
52,2 |
50,6 |
|
Norway |
78,1 |
86,9 |
88,9 |
|
Japan |
94,9 |
95,2 |
94,7 |
|
USA |
61,7 |
64,1 |
65,3 |
|
Source: Eurostat (UOE). |
|||
Between 2000 and 2005, participation of 4-year olds in education (mostly in pre-primary, in some countries already in primary) increased in EU-27 by about 3 percentage points to reach over 85 %. In 2005 in France, Belgium, Italy and Spain nearly all 4-year olds (over 99 %) participated in education, while participation rates were below 50 % in Ireland, Poland and Finland.
Additional notes:
Data include participation in both pre-primary and primary education.
BE: Data exclude independent private institutions, but these are attended by only a very limited number of children. Data from the German-speaking community are missing.
IE: There is no official provision of ISCED level 0 education. Many children attend some form of ISCED level 0 education, but for the most part data are missing.
NL: In 2002, the reference date for collecting these data was changed from 31 December to 1 October.
FI: Data include children in kindergartens, but not other forms of day-care.
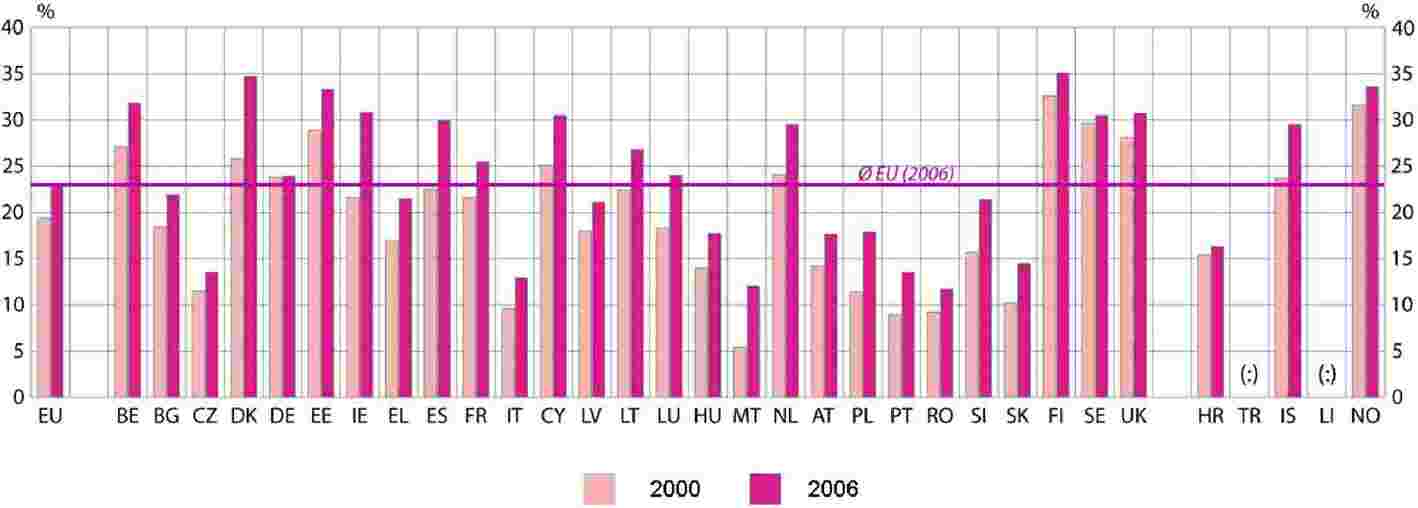
EDUCATIONAL ATTAINMENT OF THE ADULT POPULATION
Adult population (25- to 64-year-olds) with tertiary attainment
|
% of adults (25-64) with tertiary attainment |
||
|
|
2000 |
2006 |
|
EU-27 |
19,4 |
22,9 |
|
Belgium |
27,1 |
31,8 |
|
Bulgaria |
18,4 |
21,9 |
|
Czech Republic |
11,5 |
13,5 |
|
Denmark |
25,8 |
34,7 |
|
Germany |
23,8 |
23,9 |
|
Estonia |
28,9 |
33,3 |
|
Ireland |
21,6 |
30,8 |
|
Greece |
16,9 |
21,5 |
|
Spain |
22,5 |
29,9 |
|
France |
21,6 |
25,5 |
|
Italy |
9,6 |
12,9 |
|
Cyprus |
25,1 |
30,5 |
|
Latvia |
18,0 |
21,1 |
|
Lithuania |
22,4 |
26,8 |
|
Luxembourg |
18,3 |
24,0 |
|
Hungary |
14,0 |
17,7 |
|
Malta |
5,4 |
12,0 |
|
Netherlands |
24,1 |
39,5 |
|
Austria |
14,2 |
17,6 |
|
Poland |
11,4 |
17,9 |
|
Portugal |
9,0 |
13,5 |
|
Romania |
9,2 |
11,7 |
|
Slovenia |
15,7 |
21,4 |
|
Slovakia |
10,2 |
14,5 |
|
Finland |
32,6 |
35,1 |
|
Sweden |
29,7 |
30,5 |
|
United Kingdom |
28,1 |
30,7 |
|
Croatia |
15,4 |
16,3 |
|
Iceland |
23,7 |
29,5 |
|
Norway |
31,6 |
33,6 |
|
Source: Eurostat (LFS). |
||
In 2006, 23 % of the working age population of the EU had attained tertiary education, an increase of more than 3 percentage point compared to 2000. Finland, Denmark and Estonia were the countries with the highest share of population with tertiary attainment, while some Member States still had shares of less than 15 %. However, in some of these countries tertiary enrolment has expanded considerably in the recent past.
Additional notes:
Tertiary includes ISCED levels 5 and 6.
LT: 2001 results instead of 2000.
HR: 2002 results instead of 2000.
INVESTMENT IN HUMAN RESOURCES
Total public expenditure on education as a percentage of GDP, 2000-2004

|
Education spending, % of GDP |
Public |
Private |
||
|
2000 |
2003 |
2004 |
2004 |
|
|
EU-27 |
4,68 |
5,17 |
5,09 |
0,64 |
|
Belgium |
: |
6,06 |
5,99 |
0,34 |
|
Bulgaria |
4,19 |
4,24 |
4,57 |
0,65 |
|
Czech Republic |
4,04 |
4,51 |
4,42 |
0,61 |
|
Denmark |
8,28 |
8,33 |
8,47 |
0,32 |
|
Germany |
4,45 |
4,71 |
4,60 |
0,91 |
|
Estonia |
5,57 |
5,43 |
5,09 |
: |
|
Ireland |
4,29 |
4,41 |
4,75 |
0,32 |
|
Greece |
3,71 |
3,94 |
4,22 |
0,20 |
|
Spain |
4,28 |
4,28 |
4,25 |
0,61 |
|
France |
5,83 |
5,88 |
5,81 |
0,54 |
|
Italy |
4,47 |
4,74 |
4,59 |
0,46 |
|
Cyprus |
5,44 |
7,30 |
6,71 |
1,17 |
|
Latvia |
5,64 |
5,32 |
5,08 |
0,82 |
|
Lithuania |
5,63 |
5,18 |
5,20 |
0,48 |
|
Luxembourg |
: |
3,80 |
3,93 |
: |
|
Hungary |
4,50 |
5,85 |
5,43 |
0,52 |
|
Malta |
4,52 |
4,78 |
4,99 |
0,46 |
|
Netherlands |
4,86 |
5,12 |
5,18 |
0,50 |
|
Austria |
5,66 |
5,50 |
5,45 |
0,39 |
|
Poland |
4,87 |
5,62 |
5,41 |
0,59 |
|
Portugal |
5,42 |
5,61 |
5,31 |
0,13 |
|
Romania |
2,88 |
3,44 |
3,29 |
: |
|
Slovenia |
: |
6,02 |
5,96 |
0,86 |
|
Slovakia |
4,15 |
4,34 |
4,21 |
0,76 |
|
Finland |
6,08 |
6,41 |
6,43 |
0,13 |
|
Sweden |
7,31 |
7,47 |
7,35 |
0,20 |
|
United Kingdom |
4,64 |
5,38 |
5,29 |
0,95 |
|
Croatia |
: |
4,53 |
4,50 |
: |
|
Turkey |
3,48 |
3,74 |
: |
: |
|
Iceland |
5,93 |
7,81 |
7,59 |
0,75 |
|
Norway |
6,81 |
7,62 |
7,58 |
0,05 |
|
Japan |
3,82 |
3,70 |
3,65 |
1,23 |
|
United States |
4,94 |
5,43 |
5,12 |
2,37 |
|
Source: Eurostat (UOE). EU level results represent Commission estimates. 2000 result estimate by DG Education and Culture. |
||||
Between 2000 and 2003, public spending on education as a percentage of GDP increased considerably in EU Member States. However, in 2004, the upward trend stopped and there was a slight decline compared to the year before. However, as a result of GDP growth in absolute terms public education spending still increased. The available data show strong differences in spending levels between countries.
Additional notes:
Data covers formal education including formal adult education.
‘Private’ refers to expenditure on educational institutions from private sources.
DK: Expenditure on post-secondary non-tertiary levels of education not available.
EL, LU, PT: Imputed retirement expenditure not available.
CY: Including financial aid to students studying abroad.
PL, SK, NO: Including child care expenditure at pre-primary level.
FR: Without French Overseas Departments.
HR: Expenditure on educational institutions from public sources.
LU: Expenditure at tertiary level not included.
PT: Expenditure at local level of government not included.
UK, JP, US: Adjustment of GDP to the financial year, which differs from the calendar year.
TR, IS: Expenditure at pre-primary level not included.
TR: Expenditure at regional and local levels of government not included.
US: Expenditure on educational institutions from public sources.
(1) Cyprus was not able to participate due to lack of unanimity amongst OECD Member States.
(2) Data used for assessing the benchmark refer to a 4-week period of participation (LFS 2004). If a longer period were used, rates would be higher. Eurostat data from the LFS ad hoc module on lifelong learning carried out in 2003 (referring to a 12-month period) show a participation rate of 42 % (4,4 % in formal education; 16,5 % in non-formal learning and nearly one European out of three declared having taken some form of informal learning).
Commission
|
5.4.2008 |
EN |
Official Journal of the European Union |
C 86/32 |
Initiation of proceedings
(Case COMP/M.4942 — Nokia/Navteq)
(Text with EEA relevance)
(2008/C 86/02)
On 28 March 2008, the Commission decided to initiate proceedings in the above-mentioned case after finding that the notified concentration raises serious doubts as to its compatibility with the common market. The initiation of proceedings opens a second phase investigation with regard to the notified concentration, and is without prejudice to the final decision on the case. The decision is based on Article 6(1)(c) of Council Regulation (EC) No 139/2004.
The Commission invites interested third parties to submit their observations on the proposed concentration to the Commission.
In order to be fully taken into account in the procedure, observations should reach the Commission not later than 15 days following the date of this publication. Observations can be sent to the Commission by fax ((32-2) 296 43 01 or 296 72 44) or by post, under reference number COMP/M.4942 — Nokia/Navteq, to the following address:
|
Commission of the European Communities |
|
Competition DG |
|
Merger Registry |
|
Rue Joseph II/Jozef II-straat 70 |
|
B-1000 Brussels |
IV Notices
NOTICES FROM EUROPEAN UNION INSTITUTIONS AND BODIES
Commission
|
5.4.2008 |
EN |
Official Journal of the European Union |
C 86/33 |
Euro exchange rates (1)
4 April 2008
(2008/C 86/03)
1 euro=
|
|
Currency |
Exchange rate |
|
USD |
US dollar |
1,5722 |
|
JPY |
Japanese yen |
160,88 |
|
DKK |
Danish krone |
7,4584 |
|
GBP |
Pound sterling |
0,7855 |
|
SEK |
Swedish krona |
9,368 |
|
CHF |
Swiss franc |
1,5872 |
|
ISK |
Iceland króna |
116,41 |
|
NOK |
Norwegian krone |
7,998 |
|
BGN |
Bulgarian lev |
1,9558 |
|
CZK |
Czech koruna |
25,035 |
|
EEK |
Estonian kroon |
15,6466 |
|
HUF |
Hungarian forint |
257,25 |
|
LTL |
Lithuanian litas |
3,4528 |
|
LVL |
Latvian lats |
0,6972 |
|
PLN |
Polish zloty |
3,4743 |
|
RON |
Romanian leu |
3,7145 |
|
SKK |
Slovak koruna |
32,431 |
|
TRY |
Turkish lira |
2,0339 |
|
AUD |
Australian dollar |
1,711 |
|
CAD |
Canadian dollar |
1,5822 |
|
HKD |
Hong Kong dollar |
12,2497 |
|
NZD |
New Zealand dollar |
1,9972 |
|
SGD |
Singapore dollar |
2,1757 |
|
KRW |
South Korean won |
1 534,47 |
|
ZAR |
South African rand |
12,3143 |
|
CNY |
Chinese yuan renminbi |
11,0302 |
|
HRK |
Croatian kuna |
7,2773 |
|
IDR |
Indonesian rupiah |
14 519,27 |
|
MYR |
Malaysian ringgit |
5,0224 |
|
PHP |
Philippine peso |
65,325 |
|
RUB |
Russian rouble |
37,037 |
|
THB |
Thai baht |
49,823 |
|
BRL |
Brazilian real |
2,6954 |
|
MXN |
Mexican peso |
16,5757 |
Source: reference exchange rate published by the ECB.
V Announcements
ADMINISTRATIVE PROCEDURES
Commission
|
5.4.2008 |
EN |
Official Journal of the European Union |
C 86/34 |
CALL FOR PROPOSALS — DG EAC/14/08
ICI Education Cooperation Programme — Cooperation in higher education and training between the European Union and Australia, Japan, New Zealand and the Republic of Korea (1)
(2008/C 86/04)
1. OBJECTIVES AND DESCRIPTION
The general objective of the call for proposals is to promote better understanding and interaction between the peoples of the EU Member States and of the partner countries Australia, Japan, New Zealand and the Republic of Korea, including a broader knowledge of their languages, cultures and institutions, and to improve the quality of higher education and vocational education and training in the EU and in the partner countries. The call for proposals will support the following action:
ICI Joint Mobility Projects
This Action provides funding for international curriculum development projects that involve short term mobility between the EU and the partner ICI country not directly or necessarily related to award of a joint or dual/double degree.
Consortia applying for such a project are formed by higher education or vocational training and education institutions from the EU and from the relevant partner country. Selected consortia will set up a framework for student mobility whereby EU students will typically spend one semester in the partner country institution and vice versa with full recognition of the study period abroad by the home institution. Support includes mobility grants for students and members of the academic and administrative staff (‘faculty’).
2. ELIGIBLE APPLICANTS
Submission of grant requests under this call is open to higher education institutions and to vocational education and training institutions. Eligible applicants must be established in one of the 27 Member States of the European Union.
3. BUDGET AND PROJECT DURATION
The budget available for the co-financing of projects is estimated at EUR 2,5 million. It is anticipated that funding will be provided for 4-5 EU-Australia projects, 2-3 EU-Japan projects, 1 EU-New Zealand project, and 1-2 EU-Korea projects.
The maximum amount of funding on the EU side will be EUR 425 000 for a 3-year Joint Mobility project involving 4 or more EU partner institutions. The duration for Joint Mobility Projects is 3 years.
4. DEADLINE
Applications must be sent to the Commission no later than 6 June 2008.
5. FURTHER INFORMATION
The full text of the call for proposals and the application forms are available on the following website:
http://ec.europa.eu/education/programmes/calls/callg_en.html
For more information, you may write to: eac-3C-cooperation@ec.europa.eu
(1) In alphabetical order.
PROCEDURES RELATING TO THE IMPLEMENTATION OF THE COMPETITION POLICY
Commission
|
5.4.2008 |
EN |
Official Journal of the European Union |
C 86/36 |
Prior notification of a concentration
(Case COMP/M.5128 — Nordic Capital/TietoEnator)
(Text with EEA relevance)
(2008/C 86/05)
|
1. |
On 28 March 2008, the Commission received a notification of a proposed concentration pursuant to Article 4 of Council Regulation (EC) No 139/2004 (1) by which the undertakings Nordic Capital VI Limited and Nordic Capital VII Limited, belonging to the Nordic Capital group (‘Nordic Capital’, Jersey), acquire within the meaning of Article 3(1)(b) of the Council Regulation control of the whole of the undertaking TietoEnator Oyj (‘TietoEnator’, Finland) by way of public bid announced on 20 March 2008. |
|
2. |
The business activities of the undertakings concerned are:
|
|
3. |
On preliminary examination, the Commission finds that the notified transaction could fall within the scope of Regulation (EC) No 139/2004. However, the final decision on this point is reserved. |
|
4. |
The Commission invites interested third parties to submit their possible observations on the proposed operation to the Commission. Observations must reach the Commission not later than 10 days following the date of this publication. Observations can be sent to the Commission by fax ((32-2) 296 43 01 or 296 72 44) or by post, under reference number COMP/M.5128 — Nordic Capital/TietoEnator, to the following address:
|
|
5.4.2008 |
EN |
Official Journal of the European Union |
C 86/37 |
Prior notification of a concentration
(Case COMP/M.5118 — P7S1/United Internet/Maxdome JV)
Candidate case for simplified procedure
(Text with EEA relevance)
(2008/C 86/06)
|
1. |
On 28 March 2008, the Commission received a notification of a proposed concentration pursuant to Article 4 of Council Regulation (EC) No 139/2004 (1) by which the undertakings SevenSenses GmbH (‘SevenSenses’, Germany), a subsidiary of ProSiebenSat.1 Media AG (‘P7S1’, Germany), which is itself controlled by Kohlberg Kravis Roberts & Co. (‘KKR’, USA) and Permira Holdings Limited (‘Permira’, Channel Islands), and 1&1 Internet AG (‘1&1’, Germany), a subsidiary of United Internet AG (‘United Internet’, Germany), acquire within the meaning of Article 3(1)(b) of the Council Regulation joint control of the newly created company Maxdome GmbH & Co. KG (‘Maxdome JV’, Germany) constituting a joint venture by way of purchase of shares. |
|
2. |
The business activities of the undertakings concerned are:
|
|
3. |
On preliminary examination, the Commission finds that the notified transaction could fall within the scope of Regulation (EC) No 139/2004. However, the final decision on this point is reserved. Pursuant to the Commission Notice on a simplified procedure for treatment of certain concentrations under Council Regulation (EC) No 139/2004 (2) it should be noted that this case is a candidate for treatment under the procedure set out in the Notice. |
|
4. |
The Commission invites interested third parties to submit their possible observations on the proposed operation to the Commission. Observations must reach the Commission not later than 10 days following the date of this publication. Observations can be sent to the Commission by fax ((32-2) 296 43 01 or 296 72 44) or by post, under reference number COMP/M.5118 — P7S1/United Internet/Maxdome JV, to the following address:
|
|
5.4.2008 |
EN |
Official Journal of the European Union |
C 86/38 |
Communication from the French Government concerning Directive 94/22/EC of the European Parliament and of the Council on the conditions for granting and using authorisations for the prospection, exploration and production of hydrocarbons (1)
(Notice regarding an application for an exclusive licence to prospect for oil and gas, designated the ‘Valenciennois Licence’)
(Text with EEA relevance)
(2008/C 86/07)
By application of 2 October 2007, Gazonor, a company with registered offices at 2, avenue de la fosse, F-62420 Billy-Montigny, applied for an exclusive five-year licence, designated the ‘Valenciennois Licence’, to prospect for liquid and gaseous hydrocarbons in an area of approximately 423 square kilometres covering part of the North department.
The perimeter of that area is made up of the meridian and parallel arcs successively joining the vertices defined below by their geographical coordinates, the original meridian being that of Paris.
|
Points |
Longitude |
Latitude |
|
A |
1,10° E |
56,10° N |
|
B |
Intersection of the Franco-Belgian border and parallel 56,10° N |
|
|
C |
Intersection of the Franco-Belgian border and parallel 56,10° N |
|
|
D |
Intersection of the Franco-Belgian border and parallel 56,10° N |
|
|
E |
Intersection of the Franco-Belgian border and meridian 1,50° E |
|
|
F |
1,50° E |
55,90° N |
|
G |
1,21° E |
55,90° N |
|
H |
1,21° E |
55,91° N |
|
I |
1,25° E |
55,91° N |
|
J |
1,25° E |
55,93° N |
|
K |
1,21° E |
55,93° N |
|
L |
1,21° E |
55,97° N |
|
M |
1,10° E |
55,97° N |
|
B to C |
: |
Franco-Belgian border. |
|
D to E |
: |
Franco-Belgian border. |
Submission of applications and criteria for awarding rights
The initial applicant and competing applicants must prove that they meet the requirements, as specified in Articles 4 and 5 of Decree No 2006-648 of 2 June 2006 concerning mining rights and underground storage rights (Journal officiel de la République française of 3 June 2006).
Interested companies may, within a period of ninety days of the publication of this notice, submit a competing application in accordance with the procedure summarised in the ‘Notice regarding the granting of mining rights for hydrocarbons in France’ published in Official Journal of the European Communities C 374 of 30 December 1994, p. 11, and established by Decree No 2006-648 concerning mining rights and underground storage rights (décret relatif aux titres miniers et aux titres de stockage souterrain). Competing applications must be sent to the Minister responsible for mines at the address below.
The decisions on the initial application and competing applications will be based on the criteria governing the award of mining rights, as set out in Article 6 of the abovementioned Decree, and will be taken by 24 October 2009 at the latest.
Conditions and requirements regarding performance of the activity and cessation thereof
Applicants are referred to Articles 79 and 79(1) of the Mining Code (code minier) and to Decree No 2006-649 of 2 June 2006 on mining and underground storage operations and the regulations governing mining and underground storage (décret relatif aux travaux miniers, aux travaux de stockage souterrain et à la police des mines et des stockages souterrains) (Journal officiel de la République française of 3 June 2006).
Further information can be obtained from the Ministry of Ecology and Sustainable Development: Ministère de l'écologie, du développement et de l'aménagement durables (direction générale de l'énergie et des matières premières, direction des ressources énergétiques et minérales, bureau de la législation minière), 61, boulevard Vincent Auriol, Télédoc 133, F-75703 Paris Cedex 13 (tel. (33) 144 97 23 02, fax (33) 144 97 05 70)).
The abovementioned laws and regulations can be consulted at:
http://www.legifrance.gouv.fr
(1) OJ L 164, 30.6.1994, p. 3.