 EUROPEAN COMMISSION
Brussels, 14.10.2020
COM(2020) 951 final
REPORT FROM THE COMMISSION TO THE EUROPEAN PARLIAMENT, THE COUNCIL, THE EUROPEAN ECONOMIC AND SOCIAL COMMITTEE AND THE COMMITTEE OF THE REGIONS
Energy prices and costs in Europe
{SWD(2020) 951 final}
1.Introduction
The transition to a decarbonised energy system and economy is in motion. The profound changes entailed by the energy transition require ample social and political support. Energy prices and energy costs (prices multiplied by consumption) should drive the markets’ transformation to achieve a climate neutral economy while keeping energy affordable for citizens and businesses. In these difficult moments created by the COVID-19 crisis, it is even more important to ensure a fair energy transition that complements our efforts for recovery, provides a level playing field for our industry and keeps energy affordable for households. A successful energy transition towards climate neutrality by 2050 as intended under the European Green Deal will require both affordable energy and trigger investments in technologies needed for further decarbonisation. With the Clean energy for all Europeans package now under implementation and several Green Deal initiatives on energy, taxation and climate policies being prepared, monitoring energy prices and costs helps to understand better the effects of our existing policies and provides useful insights for the preparation of the forthcoming proposals.
This report provides comprehensive information to understand the evolution of energy prices and costs in the EU. It analyses the energy prices trends for electricity, gas and petroleum products, looking in detail at their market and regulatory drivers and providing international comparisons. It also assesses the importance and impact of energy costs for our economy, businesses and households. To achieve this, the report analyses the evolution of the EU’s energy import bill, the energy cost shares for more than 40 sectors from manufacturing, agriculture and services, and the impact of energy expenditure in household budgets across the different income levels. The report also looks at the importance of energy taxes as a source of tax revenues and at the various taxes imposed on energy products. Finally, it maps the different realised prices received by power generation technologies and analyses how they affect profitability together with other revenues sources and costs.
As in the 2016 and 2018 editions, the report relies on data and analysis from a combination of Commission works and external studies that allow to better understand energy prices and costs trends in Europe in recent years. Publicly available statistical information sources have been privileged in the report and complemented by a series of specific data collections where public data is overly aggregated or non-existent. Following the exit of the UK from the EU, the report focus on EU-27, which makes its statistics and analyses not fully comparable with previous editions. Energy subsidies, which were covered in the previous editions of the report, are from now on addressed in an annex to the annual State of the Energy Union report.
While the available historical data covers until 2018 and in some cases 2019, given the COVID-19 pandemic’s severe impact on energy prices and costs, where possible, the latest figures were included in the report to provide the most recent picture. Compared to the two previous editions of this report, the COVID-19 pandemic has in some cases limited reporting ability, in particular by industry. For some highly energy intensive sectors, this has somewhat reduced the scope of international comparisons and the comprehensiveness of the assessment of energy prices and costs’ importance.
2.Trends in energy prices
2.1 Electricity prices
In the electricity market, the trend of rising wholesale prices, which began in 2016, culminated towards the end of 2018, with wholesale prices falling abruptly in 2019 due to falling fuel costs, subdued demand and rapidly expanding renewable generation. The decrease in prices across the continent was uneven, which resulted in growing price divergence among different regional markets. In the first half of 2020, compared with the same period in 2019, prices fell between 30% in some southern European regional markets and up to 70% in some northern regions. The uneven decrease could be explained by insufficient interconnection capacities, renewable generation rising unevenly across markets, and a significantly strengthened CO2 price, which affected especially Member States with a greater presence of fossil fuels in the generation mix. This underlines the need for additional investments in grid flexibility, cross-border capacities and renewable generation sources, particularly in Member States lagging behind in these aspects, which should help put wholesale prices on a more convergent trajectory.
In 2020, COVID-19’s negative impact on economic activity caused a significant drop in the demand for electricity, which, together with rising renewable penetration and falling gas prices, has pushed wholesale electricity prices to very low levels. In addition, negative electricity prices have become much more frequent and widespread in wholesale markets. This situation, which occurs when generators have to pay to dispose of their production, reflects insufficient interconnections and/or some generators lacking the technical flexibility or economic incentive to reduce production.
Compared internationally, Europe’s position has been relatively stable over the last years. Wholesale electricity prices in the EU27 have been lower than those in Japan, Australia and Brazil, but higher than in the US, Canada and Russia. COVID-19 has caused a significant drop in global demand for energy, including electricity. Electricity prices, however, have been falling at different speeds depending on regional energy mixes, weather conditions and the severity of COVID-19’s impact.

Figure 1 – Wholesale electricity prices; lowest and highest regional prices and dispersion
Source: Platts, European Power Exchanges
Note: The grey background represents the difference between maximum and minimum price
Retail electricity prices were rising over the last decade. From 2010 to 2019, electricity prices for households rose on average at a rate of 2.3% per year, while overall consumer prices increased by 1.4% per year. For industry, electricity prices increased at a rate of 1.1% per year, while prices of industrial products in general grew by 1.3% per year. Large industrial consumers’ prices evolved more favourably and decreased by 5% over the period. Retail prices rose almost every year, with a pause around 2015-2016.
Retail prices increased between 2017 and 2019 due to a higher energy component (the part of prices made up by wholesale prices and to a lesser extent by the commercialisation costs of supplying energy), while network charges and taxes and levies remained relatively stable. This contrasts with previous years in which wholesale prices had been falling steadily and rises in network charges and taxes and levies, mainly the levies necessary to finance subsidies for renewable energy, had pushed prices up. Recently, the falling costs of renewable technologies and higher carbon prices have triggered a wave of investment in renewable capacities that are capable of competing with other participants in wholesale markets on commercial terms. Additionally, wider use of more market-based instruments promoting renewable energy coupled with a gradual phase-out of previous support schemes should increasingly help contain the share of renewable surcharges in retail prices. This is crucial in light of the more ambitious 2030 climate target, which will require a considerable expansion of renewable capacities across sectors and Member States.
Taxes and levies remain by far the most important source of differences in retail prices across Member States, displaying a dispersion that is three times higher on average than that of the network and energy components. This is due to the differences in Member States’ policies and fiscal instruments affecting the taxation of electricity consumption. In 2019, environmental taxes paid by households ranged from 1 €/MWh in Luxembourg to 118 €/MWh in Denmark, while applied VAT rates ranged from 5% in Malta to 27% in Hungary. Renewable levies range from 3 €/MWh in Sweden to 67 €/MWh in Germany. Furthermore, in most countries, taxes and levies as well as network charges (i.e. the two price components determined by regulatory means), significantly exceed the energy component determined by market forces.
Despite this, retail prices have been converging both for households and for industry since 2016, driven mainly by the energy components moving closer to each other. Continued market integration and some progress in increasing interconnection capacities have contributed to this positive development. The decline in wholesale electricity prices in the first half of 2020 has already had an impact on household retail prices, which have started to decrease. There is, however, uncertainty about the sustainability of this trend in 2021, especially given that wholesale prices for delivery in 2021 were only temporarily affected by COVID-19.
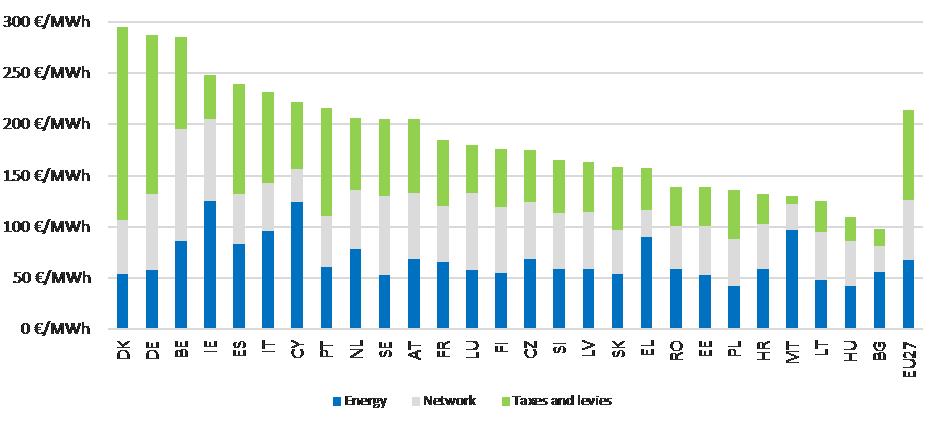 Figure 2 – Household prices in the EU in 2019 (DC band)
Source: Eurostat
2.2 Gas prices
European wholesale gas prices fluctuated between 10 and 40/MWh over the 2015-2019 period. In 2014, crude oil prices started to fall and dragged down gas prices to lows in 2016. This was followed by a recovery until late 2018, when liquefied natural gas (LNG) imports started to ramp up, resulting in a significant price fall in 2019.
In 2020, wholesale gas prices fell further, reaching historical lows in May 2020 (for example, the Dutch TTF gas hub price dropped to 3.5 €/MWh). This was the result of falling gas demand due to the abrupt halt in economic activity induced by the COVID-19 pandemic. As there has not been a similar drop in coal prices, the current low gas prices and high carbon price encourage the switch from coal to gas in power generation, helping to cut the electricity sector’s emissions.
While the overall variability of gas prices trends responds to oil price indexation, price spikes are seasonal and usually appear in winter, like in March in 2013 and 2018, when demand grows for heating and the power sector (owing to low nuclear and/or renewable generation), or when supply is constrained by infrastructure unavailability and/or low storage levels. Extremely low prices are rare but can occur, such as in 2009 and 2020, when demand plummeted in the aftermath of a severe economic slowdown.

Figure 3 - Wholesale gas prices in Europe
Source: Platts, Germany’s Federal Office for Economic Affairs and Export Control (BAFA), comext
Although oil indexation plays an important role in gas prices in Mediterranean markets, this price-setting mechanism is losing ground in Europe as gas markets are increasingly integrated, suppliers tend to supply gas directly from wholesale markets and long-term contracts are increasingly indexed to gas market prices. The growing liquidity of European gas hubs has been encouraged by the EU’s market liberalisation policies. The Dutch TTF gas hub, whose liquidity has been rapidly growing over the last few years, also helped by LNG imports, has become the most important price reference in Europe and its global importance is rising. In Europe, the share of hub priced contracts within total gas consumption rose from 15% in 2005 to 78% in 2019. In central Europe, Scandinavia and the Baltics, hub prices gained importance and became more aligned with prices in the northwest European hubs, rather than with US dollar oil-indexed prices. The increased European sovereignty over the formation of its gas prices reinforces the role of the euro in energy trade in the EU as it reduces the influence of imported prices quoted in USD and the exposure to the volatile international energy commodity markets.
In the context of an increasingly global and expanding market, LNG has become a competitive alternative to pipeline imports in Europe. Last year, LNG imports reached a historical peak of 89 billion cubic metres, roughly 25% of the EU’s total gas imports and 22% of its consumption, contributing to the further diminishing role of oil indexation and enhancing the EU’s security of supply through increased diversification of sources. In the future, domestic bio-methane, hydrogen and synthetic gases may also play an increasingly important role in curbing the EU’s growing gas import dependence, following the UK’s exit from the EU and the earlier closure of EU gas fields.
In international comparisons, European wholesale gas prices are well above those in major gas producers like Canada, Russia and the US, but lower than in other G20 countries, particularly those that rely on LNG imports such as China, Japan and South Korea. International wholesale price differences, although still persistent, have shrunk in absolute value since 2015 alongside declining prices. In the first half of 2020, this convergence was accentuated by significant COVID-19-related price drops in Europe, the US and Asia.

Figure 4 – Household gas prices in the EU in 2019 (D2 band)
Source: Eurostat
Retail gas prices for households rose above inflation by 2.1% per year over this decade. For industry, in contrast, prices rose by only 0.1% per year for medium energy consumers and even fell by 1.3% per year for large consumers. Prices fluctuated over the period and had been falling for some years until 2018, when industry prices stabilised within a narrow range before starting to rise last year.
Gas retail prices remain largely determined by wholesale gas prices, which make up most of the energy component and filter into the retail price after several months. In 2019, the energy component ranged from 45% of the households price (which reached 68 €/MWh in 2019), to 67% of the medium industrial consumer price (32 €/MWh) and 78% of the large industrial consumer price (22 €/MWh).
However, network charges and taxes and levies changes are becoming increasingly important for explaining gas price dynamics. Between 2010 and 2019, the rise of household prices (2.1% per year) was fuelled up by network charges and taxes and levies, which rose at 2.6% per year and 3.6% per year, respectively, while the energy component only rose at 0.8% per year. For medium industry consumers, the increases of network charges and taxes and levies, 3.2% per year and 7.8% per year, respectively, more than compensated the drops in the energy component (1.7% per year), resulting in minor growth of total prices (0.1% per year).
Taxes and levies account for 32% of household prices, while only 13% and 16% of the prices paid by medium and large industrial consumers. Environmental taxes, for both households and industry, account for the highest shares in non-VAT taxes.
The ratio of the most expensive and the cheapest retail price has remained practically constant over the last few years across the EU for households, whereas for industrial consumers a slight price convergence could be observed.
As for electricity, international comparisons show that retail gas prices for households are well above most G20 countries. In some countries, household gas prices seem to be quite low as compared with wholesale prices and disconnected from the evolution of wholesale prices.
2.3 Oil prices
Recent years have seen new episodes of the volatility of crude oil prices. Crude oil prices fell in 2014-2016, rose from mid-2017 to 2018, driven by global demand, geopolitical tensions and OPEC output cuts, before settling in 2019 (at around 60-70 USD/barrel) amid a slowing global economy and increasing US shale oil output. In 2020, prices plummeted amid demand decreases and mobility restrictions resulting from the COVID-19 pandemic, until mid-April 2020, when major oil producers agreed to cut production. Prices have been on the rise since, and may continue to grow alongside increases in global economic activity. However, it is expected that oil prices will not recover closer to the 2019 values before 2021.

Figure 5 — Crude oil (Brent) and European wholesale gasoline, diesel and heating oil prices — Source: Platts, ECB
Crude oil prices’ uncertainty and variability affect the energy system prices increasing risks and (hedging) costs for suppliers and consumers. Through oil-indexed gas prices contracts, crude oil prices influence gas prices, which in turn, influence power market prices, as gas-fired power stations are often setting wholesale prices. This suggests that implementing the Green Deal and greening transport and the energy supply would reduce the volatility linked to crude oil prices.
Wholesale prices for oil products were mainly driven by ups and downs in crude oil prices. However, other factors, like the specific oil product supply-demand balance, refinery maintenance and seasonality, had also some influence on them.
Retail prices rose since 2016, reaching their highest levels since 2012 and 2013 in 2018 and 2019. In the period 2016-2019, in nominal terms, gasoline prices increased by 12% (annual average growth of 3%), diesel by 17% (annual average growth of 4.3%), and heating oil by 20.3% (annual average growth of 5.1%) due to rising oil/wholesale prices and to a lesser extent to excise taxes. All prices evolved in a similar way, fluctuating alongside crude oil prices, but to a much lesser extent. The high share of taxes (excises plus VAT), which may account for up to 70% of the price, protects prices at the pump from the variability of crude oil prices and exchange rates as oil is still traded in US dollars only.
Excise duties also make up most of the price differences of petroleum products across the EU.
3.Trends in energy costs
3.1 The EU energy import bill
The energy import bill is an overall macroeconomic indicator that shows the costs for the EU of its reliance on fossil fuels. This is because most fossil fuels are imported (import dependency on fossil fuels was 55.7% in 2018). The import bill has been rising since 2016, reaching over EUR 330 billion annually according to the latest reported data in 2018. This reverses the downward trend from the highest peak of 2013 (EUR 400 billion).
The bill has recently been driven up by rising fossil fuel prices, in particular by rises in oil prices. In 2018, oil was responsible for 69 % of the total import bill, gas for 27 % and hard coal for 4 %. Oil and gas prices started to fall towards the end of 2019 and this would reduce the energy bill, in particular if consumption would fall. In the first half of 2020, due to COVID-19’s impact on economic activity and transport, prices and consumption fell significantly. COVID-19 has accelerated the increasing market penetration of renewable energy encouraged by EU clean energy policies, contributing to the reduction of coal and gas presence in the electricity mix. All this will reduce the energy import bill in 2020.

Figure 6 - The EU’s import bill
Source: European Commission Directorate-General for Energy calculation
3.2 Households expenditure on energy
The share of total expenditure that European households spend on energy (excluding transport) varies across income levels and countries. Households’ energy expenditure shares have been falling for all income levels since 2012, with the exception of 2017, in which they rose slightly, before falling again in 2018
. That year, they reached values comparable to or lower than those before the 2009-2012 economic recession.
In 2018, the poorest European households (those in the lowest 10 percent income bracket) spent 8.3% of their expenditure on energy. Lower-middle (third decile) and middle income (fifth decile) households spent 7.4 % and 6.7 %, respectively, of their expenditure on energy.
By region, northern and western European middle-income households spent 3-8% while central and eastern Europeans with the same income level spent 10-15%.
By country, the poorest households spent from slightly more than 20% in Slovakia and Czechia to less than 5% in Luxembourg, Finland and Sweden. In absolute terms, the EU poorest households spent on average a total amount of EUR 945 on energy products, which ranged across Member States from less than EUR 500 to EUR 2500. However, it is important to consider that the purchase power varies largely amongst Member States.

Figure 7 – Poorest households’ energy expenditures (excl. transport) by fuel and energy share in their total expenditure (2018)
Source: DG ENER ad hoc data collection on household consumption expenditures
Indicators of European households’ energy poverty continued to decline in 2017 and 2018, as they have been doing since the end of the three-year recession in 2012. From that year until 2018, the average shares of European households experiencing ‘problems to keep their homes warm’ and ‘arrears in their utility bills’, fell from 11% to 8% and from 10% to 7%, respectively, although significant differences between the Member States can still be observed.
All this suggests that energy poverty has overall decreased in Europe over the last years, partly due to improvements in the economic situation. The creation in 2008 of the European Energy Poverty Observatory has made the EU better equipped to identify and tackle energy poverty. Likewise, effective strategies have been developed to incorporate policies tackling energy poverty into energy transition plans and energy efficiency policies.
In the aftermath of the COVID-19 crisis, energy poverty risks increasing as many Europeans are losing their jobs and income in the aftermath of the COVID-19 crisis while retail energy prices and consumption needs may not be falling in the same proportion. The resulting adverse social consequences would need to be addressed and adequate policies by the EU and the Member States deployed to support access to energy services for those in need. The European Pillar of Social Rights places energy among the essential services to which everyone has the right to access.
The Renovation Wave, announced in the Next Generation EU
Recovery Package and the European Green Deal, should help contain energy poverty rises by helping households reduce their energy consumption in buildings and bills, particularly for those living in social housing. The EU’s eco-design and energy labelling measures should also contribute to savings in household appliances’ consumption, reducing household electricity bills. The Commission Recommendation on Energy Poverty accompanying the Renovation Wave will also provide guidance on measuring energy poverty.
3.3. Industrial energy costs
Although energy is essential to enable economic activity, it plays an increasingly modest role in the economy’s value formation in the EU. In 2017, from a macroeconomic perspective, purchases of energy in total production value were 1.7% for industry (2.0 % in 2014) and 1% for services (1.2% in 2014).
For the average business in Europe, energy costs account for a rather small share of production costs (0-3%). Energy costs shares in production costs are more important for the most energy intensive manufacturing sectors (ranging from 3% to 20%) and can reach very high levels for certain industrial subsectors (e.g. 40% in primary aluminium, 31% in zinc, 28% in ferro-alloys and silicon, 25% in flat glass, 71% in fertilisers and 20% in electric-arc-furnace secondary steel). Beyond manufacturing, the purchase of energy can also be a very significant source of costs in certain sectors providing transport, information and accommodation and restauration services.
|
Table 1 — Energy share of production costs across sectors
|
|
Examples of sectors
|
Energy share of production costs (indicative range)
|
|
Average European business
|
0-3 %
|
|
Trade, computers, motor vehicles, electrical equipment, pharmaceutics, construction
|
0.4-1%
|
|
Waste management, plastics, textiles, grain
|
2-4 %
|
|
Accommodation and restaurants
|
3-5 %
|
|
Energy intensive sectors in manufacturing:
Cement, clay building materials, pulp and paper, glass, iron and steel, basic chemicals, non-ferrous metals, refineries
|
3-20 %
|
|
Air transport, land transport
|
20-30%
|
|
Data centres
|
10-15%
|
|
Mining of metals and others, electricity and gas
|
10-20%
|
|
Source: Trinomics (2020), Eurostat
|
|
Between 2010 and 2017, energy costs in the manufacturing sectors under examination fell by 13%. The fall in energy costs was more pronounced between 2014 and 2017, when energy costs declined in all 30 sectors analysed. Energy costs dropped despite slight price rises and more economic activity, thanks to significant reductions in the sectors’ energy intensity, particularly in sectors with moderate energy intensities. The reductions in the sectors’ energy intensities resulted from lower energy consumption per output unit and, to a lesser extent, from fuel switching (from coal to gas and electricity) and from a restructuring of the production mix (to products with high value added and low energy intensity).
In the international perspective, European electricity industrial prices are lower than those in Japan, comparable to those in China, double those in the US, and higher than those in most of the other non-EU G20 countries. European gas prices are lower than in east Asian countries (Japan, South Korea, China), but higher than in most other G20 countries, including the US. Relatively high non-recoverable taxes and levies in the EU and price regulation and or subsidies in the non-EU G20 play an important role in this difference.

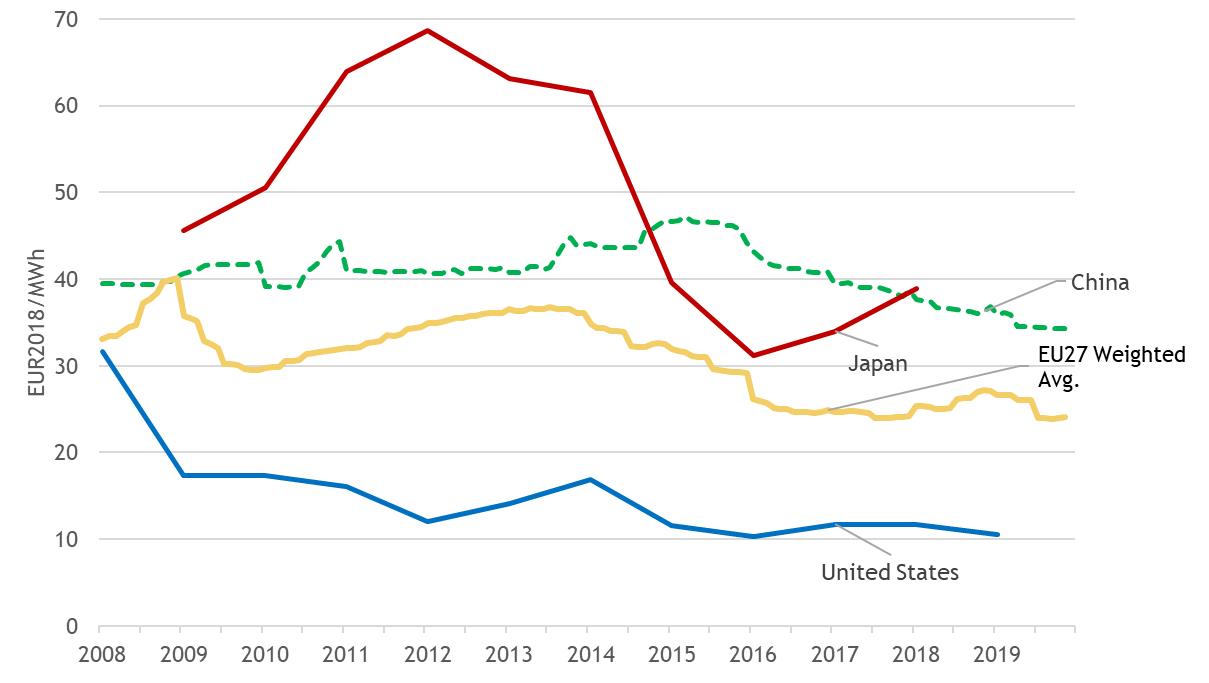
Figure 8 – Electricity (up) and gas (down) industrial prices in EU27, Japan, China and the US
Sources: Trinomics (2020) based on data from Eurostat, CEIC, IEA
Note: China gas prices are proxy on Usage Price, 36 City Average of gas for industrial users.
The limited international data suggests that Europe’s most energy-intensive sectors have energy costs shares of a comparable magnitude to international trade partners. The energy costs shares of these EU sectors are overall lower than or similar to those in the US and, when compared with Japanese sectors, the results are mixed. As for the main fuel used, when compared to Japan and the US, the energy costs shares in these EU sectors tend to be higher for electro-intensive sectors and similar or lower for the more fossil fuel-intensive sectors. The energy intensities of Europe’s most energy-intensive sectors are higher than in Japan and Korea, comparable to the US and lower than in Russia. The moderate energy-intensive sectors in the EU display energy intensities that tend to be lower than those in most of the EU’s international trade partners (and sometimes are the lowest). European industry should continue its energy efficiency efforts that help to curb energy costs gaps with international trade partners. Manufacturing sectors in many non-EU G20 countries often experience lower costs associated with clean energy, climate and environmental policies than those in Europe and/or receive energy subsidies. The Commission is reviewing its state aid regime and the free allocation of ETS allowances aims at addressing the risk of the carbon leakage. Moreover, should differences in levels of ambition worldwide persist, as the EU increases its climate ambition, the Commission will propose a carbon border adjustment mechanism, for selected sectors, to reduce the risk of carbon leakage, as an alternative to current measures.
COVID-19’s negative impact on energy prices in 2020 should in principle reduce energy costs and the share of energy in production costs (as the fall in energy prices may be higher than the fall in price of other production inputs and final products). This, however, may not be fully the case for energy intensive industries with high fixed levels of energy consumption (e.g. industries that have to keep furnaces working 24h/day irrespective of the output).
4.Government revenues from energy taxation and tax and levies applied on energy products
In 2018, EU Member States collected energy taxes that amounted to EUR 294 billion. Energy taxes have remained over the years relatively stable as a GDP share, at ca. 2%, as well as in their share in total tax revenues, representing 4.6% in 2018. Excise duties (of which more than 80% comes from oil products) constitute the largest part of energy taxes.
Energy taxes ensure significant revenues to Member States budgets and provide a buffer mitigating the impacts of the volatility of crude oil prices on retail prices of petroleum products. Energy taxes also play a role in fostering the energy transition and decarbonisation of the economy as they can amplify price signals to discourage wasteful consumption or environmentally harmful behaviour in line with the polluter pays principle.

Figure 9 – Energy taxes in the EU
Source: Eurostat
Taxes and levies account for 41% and 30-34% of households and industry electricity prices, respectively, and for 32% and 13-16% of the households and industry gas prices. They also account for 50% of heating oil prices, 60% of gasoline and 56% of diesel. The types of the taxes and levies (excises, VAT, renewable energy levies, capacity levies, environmental taxes, etc.) and their importance in prices varies widely across energy products and countries. Member States’ different fiscal preferences and policies result in different levies, tax rates and exemptions applied to products. The overall taxes and levies differences between households and industry usually respond to recoverable taxes (VAT) and to taxes and levies exemptions applied to industry for economic reasons. Differences between gas and electricity are due to higher taxes and levies in electricity prices to finance energy and/or climate policies, and lower taxes, negligible renewable levies and tax exemptions for gas, associated with its traditional social role as a heating fuel. Finally, tax breaks for consumption of fossil fuels represent a significant amount of circa EUR 30 billion in 2018.
The upcoming initiatives seeking to align the energy taxation with the Green Deal objectives and ambition, and the commitment to end harmful fossil fuels subsidies, should exploit the potential of energy taxes and of reducing support to fossil fuels to contribute to climate neutrality. It is also important to encourage further awareness of the variety and complexity of taxes and levies affecting energy prices with different purposes and impact. Their combined impact on prices, and thereby the signal given to consumers, could also be considered in the light of these taxes’ different purposes, in particular the promotion of consumption and behaviour aligned with the EU’s energy and climate policies and on achieving a just and fair transition.
In 2020, the COVID-19-related slowdown in economic and transport activity will likely curb revenues from energy (mainly transport fuel excise) taxes. Support to fossil fuels, mainly tax rate reductions to transport fuel excises, are also likely to fall, alongside the drop in consumption of transport fuels. Conversely, the fall in electricity prices could increase the support received by renewable generation still linked to feed-in-tariffs.
5.Prices, costs and investments in power markets
Electricity markets ensure a secure and affordable supply for the EU’s consumers and send the necessary signals to investors to maintain the level of supply in the long term. Undistorted prices, including environmental externalities, provide the right signals to market actors to make the necessary investment decisions for the energy transition.
The EU has set a legal framework prepared for a transition to a system with an increasing share of renewable electricity. Investments in new generation capacity have continued, in particular with respect to renewable sources for electricity generation (RES-E). In 2018, 32% of electricity generated in the EU was from renewable sources.
Electricity wholesale prices can vary significantly during one day as the electricity system has not been designed to store large amounts of electricity but rather to match supply and demand in real time. As a result, price patterns seen by wind and photovoltaic generators are strongly driven by meteorological factors. The profitability of RES-E investments is largely determined by these ‘realised’ prices, by support schemes and by technology costs. Falling technology costs have risen the profitability of renewable energy sources, which can increasingly compete in electricity markets. Support levels, which are increasingly set by competitive auctions, have been falling for both wind and photovoltaic projects. The continuation of this trend to fully market-based RES-E projects should help contain electricity retail prices by reducing the support-related component. The increased penetration of wind and photovoltaic generators has already led to a decrease in market revenues, as shown in Figure 10 using the example of photovoltaic generation.

Figure 10 – Realised price in EUR/MWh (above) and as percentage of baseload price (below) for solar photovoltaic (PV) generation
Source: Trinomics (2020)
This trend is expected to continue with increasing penetration of RES-E and could offset the gains obtained by falling technology costs. Due to the strong decrease in power consumption in the first half of 2020 triggered by the COVID-19 crisis, on some occasions RES-E temporarily supplied 50% of the EU’s demand, resulting in drops in electricity prices. Lessons should be drawn from the impact of this crisis on power markets. This has anticipated a situation originally expected to be seen in the mid-2020s, keeping in mind that reaching at least 55% of greenhouse gas emission reductions by 2030 is expected to lead to ca. 65% share of renewable electricity.
Conventional sources of power generation, such as gas-fired power plants, can adapt output to changes in demand. Consequently, flexible generators take the decision to produce electricity based on price signals, seeking to produce when market revenues cover the costs of producing an additional unit of electricity. While the realised prices for flexible generators will thus be above average power prices, the increasing penetration of meteorologically driven renewable energies can reduce the number of hours during which prices are sufficiently high for breaking even.
6.Conclusions
After 2-3 years of rises, wholesale prices started to fall in 2019 due to the economic slowdown and market specific supply rises. In the first half of 2020, prices plummeted amid falling demand and the mobility restrictions triggered by the COVID pandemic. Prices are expected to rise as the economy picks up, but may need until 2021 to recover to 2019 levels.
Electricity wholesale prices had been converging until they recently diverged across regional markets due to insufficient interconnections and an uneven importance of renewable generation in the Member States’ power mix. This suggests that investments in the grid’s flexibility, cross-border capacities and renewable generation in those Member States which are lagging behind, would bring more integrated and competitive markets with potentially lower price dispersions. Energy markets’ close interlinks result in crude oil prices volatility also affecting gas and electricity prices. This influence however decreases alongside renewable penetration in power markets and the growing importance of European gas hubs, which displace the use of US dollar oil-indexed gas prices and strengthen the international role of the Euro.
European retail prices were on a rising trend or relatively stable between 2017 and 2019. In the previous years, price falls lasted longer and were stronger for gas and large industry consumers than for electricity and households. As a result, over the decade, household electricity and gas prices rose above inflation, while for industry, they rose below industrial-price-indexes, and fell for the larger (in particular gas) consumers. Contrary to what happened during most of the decade, in recent years, taxes and network charges have been relatively stable or have risen slightly resulting in price changes driven by changes in the energy component. The reduced pressure of renewable levies on prices comes along with the wider use of more market-based instruments promoting renewables and a gradual phase-out of previous support schemes. This means that the (market-based) energy component is expected to play a major role in driving price changes in the future, although network charges should become gradually influential, alongside the need to finance investments in more resilient and smarter grids. As for oil products, prices at the pump rise and fall following fluctuations in crude oil prices, buffered at retail level by taxes. Albeit with a certain time lag, retail prices started to react in the 2nd quarter of 2020 to COVID-19-induced falls in wholesale prices and subdued demand.
The EU’s energy import bill, which after 3 years of consecutive rises reached EUR 331 billion in 2018, is a reminder of the costs for the EU derived from its high reliance on fossil fuel imports and exposure to volatile international markets. The bill could have fallen in 2019, due to the lower fossil fuel prices that year, and will fall in 2020, in the light of strong declines in fossil fuels consumption and prices prompted by the COVID-19 pandemic.
Energy costs shares in production costs have fallen generally and in a more pronounced fashion across industrial sectors in recent years, extending their overall downward trend over the decade. The sectors’ lower energy intensity, with moderately energy-intensive sectors joining the highly energy-intensive industries in energy efficiency efforts, contributed to the falls in energy costs, in a context of slight price rises and increasing economic activity. International price differences have remained stable in recent years, with the European industry facing higher prices that the US and comparable or lower prices than Asian competitors. Limited data on energy costs and energy intensities, points to Europe’s sectors having higher energy intensities than those in Asia (but China) and comparable to the US, while facing higher energy costs shares than those in Asia and comparable or lower than those in the US. Some of these differences may be explained by subsidies to industry in non-EU G20 member states and the EU’s higher climate-related costs. To maintain its competitive edge in international markets, European industries should keep on improving their energy efficiency. COVID-19’s impact on energy prices and economic activity is not expected to increase energy costs pressures on industry’s production costs, with the exception of energy-intensive sectors having a large proportion of their energy consumption fixed irrespective of the level of output.
European households are spending on energy a comparable share to what they were spending before the 2008 crisis. The shares’ gradual fall over the last years, along with other energy poverty indicators, point to a reduction in the overall energy poverty risks in Europe that resulted from improvements in the economy and more targeted EU energy policies to identify and address energy poverty. That said, energy poverty remains a challenge for the EU. In 2018, the European poorest households spent on energy (on average) 8.3% of their total expenditure, and up to 15% - 22% in some Central and Eastern European Member States. The EU’s policy efforts should thus continue as COVID-19’s economic impact may be eroding households’ income, particularly for the poorest.
Energy taxes are an important and stable source of revenues for Member States. Total energy tax revenues, which mainly come from excises on oil products, are likely to fall in 2020 in the aftermath of COVID-19’s impact on transport fuels consumption. There are many types of taxes and levies imposed on energy products, which have different purposes and which Member States apply in different ways. All combined, they have a very significant impact on prices, in particular on electricity, which varies widely across energy products and Member States. The EU and its Member States are aiming to align energy taxation with the energy and climate objectives in line with the Green Deal proposed initiatives. In addition, the combined effect on prices of all (not only energy) taxes and levies could be considered when assessing how they promote behaviour aligned with a clean and fair energy transition.
Realised prices for renewable generation are falling along with the renewable energy’s growing market penetration. In the light of the expected growth in renewable investment, the existing monitoring of market design and support schemes should look at ensuring that the appropriate balance will be struck between efficient market revenues and the provision of support (de-risked) revenues that enable investments.