EUROPEAN COMMISSION
Brussels, 4.5.2018
SWD(2018) 246 final
COMMISSION STAFF WORKING DOCUMENT
Accompanying the document
Report from the Commission to the Council and the European Parliament
on the implementation of Council Directive 91/676/EEC concerning the protection of waters against pollution caused from agricultural sources based on Member State reports for the period 2012-2015
{COM(2018) 257 final}
Table 1. Number of stations and station density (stations per 1,000 km2 of land) of reported groundwater monitoring of annual average nitrate measurements in reporting periods 2008-2011 and 2012-2015, the change (%) between both periods, and the annual average sampling frequency in 2012-2015.
Table 2. Number of stations and station density (stations per 1,000 km2 of land) of reported fresh surface water monitoring of annual average nitrate measurements in reporting periods 2008-2011 and 2012-2015, the change (%) between both periods, and the annual average sampling frequency in 2012-2015.
Table 3. Number of stations of reported saline surface water monitoring of annual average nitrate measurements in reporting periods 2008-2011 and 2012-2015, and the change (%) between both periods.
Table 4. Percentage of groundwater monitoring points per water quality class (annual average nitrate concentration in mg nitrate per L) for all stations of the EU 28 Member States for the period 2008-2011 and 2011-2015.
Table 5. Percentage of fresh surface water monitoring points per water quality class (annual average nitrate concentration in mg nitrate per L) for all stations of the EU 28 Member States for the period 2008-2011 and 2011-2015.
Table 6. Annual average nitrogen discharge (kton N) to the aquatic environment and relative contribution of agriculture (%), presented in the article 10 reports of the Member States for reporting periods 2008-2011 and 2012-2015. * If different from 2008-2001 and 2012-2015.
Table 7. Average livestock numbers (1,000,000) presented in the article 10 reports of the Member States for reporting periods 2008-201 and, 2012-2015, and the change between the two reporting periods.
Table 8. Average annual animal manure nitrogen and fertiliser nitrogen use (1,000 kg N) presented in the article 10 reports of the Member States for reporting periods 2008-2011 and 2012-2015, and the change between the two reporting periods.
Table 9. Utilized agricultural area (1,000 ha) in the period 2008-2015, and the change between the periods 2008-2011 and 2012-2015 (Source: Eurostat, June 2017).
Table 10. Number of farms in 2010 and 2013, and the change between 2010 and 2013 (Source: Eurostat, June 2017 ).
Table 11. Average farm size (ha) in 2010 and 2013, and the change between 2010 and 2013 (Source: Eurostat, June 2017).
Table 12. Number of total cattle (1,000) in the period 2008-2015, and the change between the periods 2008-2011 and 2012-2015 (Source: Eurostat, June 2017).
Table 13. Number of dairy cattle (1,000) in the period 2008-2015, and the change between the periods 2008-2011 and 2012-2015 (Source: Eurostat, June 2017).
Table 14. Number of pigs (1,000) in the period 2008-2015, and the change in number between the periods 2008-2011 and 2012-2015 (Source: Eurostat, June 2017).
Table 15. Number of poultry (1,000) in 2010 and 2013, and the change between the years 2010 and 2013 (Source: Eurostat, June 2017).
Table 16. Number of sheep (1,000) in the period 2008-2015, and the change in number between the periods 2008-2011 and 2012-2015 (Source: Eurostat, June 2017).
Table 17. Number of Livestock Units (1,000) in 2010 and 2013, and the change between the years 2010 and 2013 (Source: Eurostat, June 2017).
Table 18. Livestock density (LU per ha UAA) in 2010 and 2013, and the change between the years 2010 and 2013 (Source: Eurostat, June 2017).
Table 19. Fertiliser nitrogen use (1,000 kg N) in the period 2008-2015, and the change between the periods 2008-2011 and 2012-2015 (Source: Eurostat, June 2017).
Table 20. Fertiliser phosphate use (1,000 kg P) in the period 2008-2015, and the change between the periods 2008-2011 and 2012-2015 (Source: Eurostat, June 2017).
Table 21. Animal manure nitrogen use (1,000 kg N) in the period 2008-2015, and the change between the periods 2008-2011 and 2012-2015 (Source: Eurostat, June 2017).
Table 22. Animal manure phosphate use (1,000 kg P) in the period 2008-2015, and the change between the periods 2008-2011 and 2012-2015 (Source: Eurostat, June 2017).
Table 23. Net nitrogen balance (kg N per ha) in the period 2008-2015, and the change between the periods 2008-2011 and 2012-2015 (Source: Eurostat, June 2017).
Table 24. Phosphate balance (kg P per ha) in the period 2008-2015, and the change between the periods 2008-2011 and 2012-2015 (Source: Eurostat, June 2017).
Table 25. Nitrate vulnerable zones in Member States and Member States applying an action programme to the whole national territory in line with Art. 3(5) of the Nitrates Directive (source: data provided by Member States to JRC).
Table 26. Derogations in force at the end of the year 2015.
Figure 1. Groundwater station density (stations per 1,000 km2 of land) in reporting period 2012-2015.Stations with data of average annual nitrate measurements.
Figure 2. Average annual groundwater sampling frequency in reporting period 2012-2015. Stations with data of average annual nitrate measurements.
Figure 3. Surface water station density (stations per 1,000 km2 of land) in reporting period 2012-2015. Stations with data of average annual nitrate measurements.
Figure 4. Annual average fresh surface water sampling frequency in reporting period 2012-2015. Stations with data of average annual nitrate measurements.
Figure 5. Frequency diagram of annual average nitrate concentrations in groundwater, at all depths.
Figure 6. Frequency diagram of annual average nitrate concentrations in groundwater at different depths, aggregated over all Member States.
Figure 7. Frequency diagram of trends in annual average nitrate concentrations in groundwater at different depths, aggregated over all Member States.
Figure 8. Frequency diagram of trends in annual average nitrate concentrations in groundwater.
Figure 9. Frequency diagram of annual average nitrate concentrations in fresh surface waters (rivers and lakes).
Figure 10. Frequency diagram of annual average nitrate concentrations in different surface waters, aggregated over all Member States.
Figure 11. Frequency diagram of trends in annual average nitrate concentrations in fresh surface water (rivers and lakes).
Figure 12. Frequency diagram of the trophic status of rivers in reporting period 2012-2015.
Figure 13. Frequency diagram of the trophic status of lakes in reporting period 2012-2015.
Figure 14. Frequency diagram of trophic status classes of transitional waters in reporting period 2012-2015.
Figure 15. Frequency diagram of trophic status classes of coastal waters in reporting period 2012-2015.
Figure 16. Frequency diagram of trophic status classes of marine waters in reporting period 2012-2015.
Figure 17. Frequency diagram of trophic status classes of different water types in reporting period 2012-2015. Note that the number of underlying Member States is different per water type (Annex 2).
Figure 18 Utilized agricultural area (1,000 ha) in the reporting periods 2008-2011 and 2012-2015 (Source: Eurostat, June 2017).
Figure 19 Change in utilized agricultural area (%) between the reporting periods 2008-2011 and 2012-2015 (Source: Eurostat, June 2017).
Figure 20 Number of farms in 2010 and 2013 (Source: Eurostat, June 2017).
Figure 21 Change in the number of farms (%) between 2010 and 2013 (Source: Eurostat, June 2017 ).
Figure 22 Average farm size (ha) in 2010 and 2013 (Source: Eurostat, June 2017).
Figure 23 Change in average farm size (%) between 2010 and 2013 (Source: Eurostat, June 2017).
Figure 24 Average number of total cattle (1,000) in the reporting periods 2008-2011 and 2012-2015 (Source: Eurostat, June 2017).
Figure 25 Change in the number of total cattle (%) between the reporting periods 2008-2011 and 2012-2015 (Source: Eurostat, June 2017).
Figure 26 Average number of dairy cattle (1,000) in the reporting periods 2008-2011 and 2012-2015 (Source: Eurostat, June 2017).
Figure 27 Change in the number of dairy cattle (%) between the reporting periods 2008-2011 and 2012-2015 (Source: Eurostat, June 2017 ).
Figure 28 Average number of pigs (1,000) in the reporting periods 2008-2011 and 2012-2015 (Source: Eurostat, June 2017).
Figure 29 Change in the number of pigs (%) between the reporting periods 2008-2011 and 2012-2015 (Source: Eurostat, June 2017).
Figure 30 Average number of poultry (1,000) in 2010 and 2013 (Source: Eurostat, June 2017).
Figure 31 Change in the number of poultry (%) between 2010 and 2013 (Source: Eurostat, June 2017).
Figure 32 Average number of sheep (1,000) in the reporting periods 2008-2011 and 2012-2015 (Source: Eurostat, June 2017).
Figure 33 Change in the number of sheep (%) between the reporting periods 2008-2011 and 2012-2015 (Source: Eurostat, June 2017).
Figure 34 Average number of Livestock Units (1,000) in 2010 and 2013 (Source: Eurostat, June 2017 ).
Figure 35 Change in the number of Livestock Units (%) between 2010 and 2013 (Source: Eurostat, June 2017).
Figure 36 Average livestock density (LU per ha UAA) in 2010 and 2013 (Source: Eurostat, June 2017).LU = LiveStock Unit; UAA=Utilised Agricultural Area.
Figure 37 Change in livestock density (%) between 2010 and 2013 (Source: Eurostat, June 2017).
Figure 38 Fertiliser nitrogen use (1,000 kg N) in the period 2008-2015 (Source: Eurostat, June 2017).
Figure 39 Change in fertiliser nitrogen use (%) between the reporting periods 2008-2011 and 2012-2015 (Source: Eurostat, June 2017).
Figure 40 Fertiliser phosphate use (1,000 kg P) in the period 2008-2015 (Source: Eurostat, June 2017).
Figure 41 Change in fertiliser phosphate use (%) between the reporting periods 2008-2011 and 2012-2015 (Source: Eurostat, June 2017).
Figure 42 Animal manure nitrogen use (1,000 kg N) in the period 2008-2015 (Source: Eurostat, June 2017).
Figure 43 Change in animal manure nitrogen use (%) between the reporting periods 2008-2011 and 2012-2015 (Source: Eurostat, June 2017).
Figure 44 Animal manure phosphate use (1,000 kg P) in the period 2008-2015 (Source: Eurostat, June 2017 ).
Figure 45 Change in animal manure phosphate use (%) between the reporting periods 2008-2011 and 2012-2015 (Source: Eurostat, June 2017 ).
Figure 46 Average net nitrogen balance (kg N/ha) in the reporting periods 2008-2011 and 2012-2015 (Source: Eurostat, June 2017).
Figure 47 Change in the net nitrogen balance (%) between the reporting periods 2008-2011 and 2012-2015 (Source: Eurostat, June 2017).
Figure 48 Average phosphate balance (kg P/ha) in the reporting periods 2008-2011 and 2012-2015 (Source: Eurostat, June 2017).
Figure 49 Change in the phosphate balance (kg P/ha) between the reporting periods 2008-2011 and 2012-2015 (Source: Eurostat, June 2017).
Map 1. Annual average nitrate concentrations in groundwater for the reporting period 2012-2015.
Map 2. Stations with annual average nitrate concentrations equal to or exceeding 50 mg/L in groundwater for the reporting period 2012-2015.
Map 3. Maximum nitrate concentrations in groundwater for the reporting period 2012-2015
Map 4. Trends in nitrates concentrations in groundwater between the reporting periods 2008-2011 and 2012-2015 in all stations.
Map 5. Trends in nitrates concentrations in groundwater between the reporting periods 2008-2011 and 2012-2015, for stations with an average annual nitrate concentration below 25 mg/L in 2012-2015.
Map 6. Trends in nitrates concentrations in groundwater between the reporting periods 2008-2011 and 2012-2015, for stations with an average annual nitrate concentration between 25 and 40 mg/L in 2012-2015.
Map 7. Trends in nitrates concentrations in groundwater between the reporting periods 2008-2011 and 2012-2015, for stations with an average annual nitrate concentration between 40 and 50 mg/L in 2012-2015.
Map 8. Trends in nitrates concentrations in groundwater between the reporting periods 2008-2011 and 2012-2015, for stations with an average annual nitrate concentration equal to or above 50 mg/L in 2012-2015.
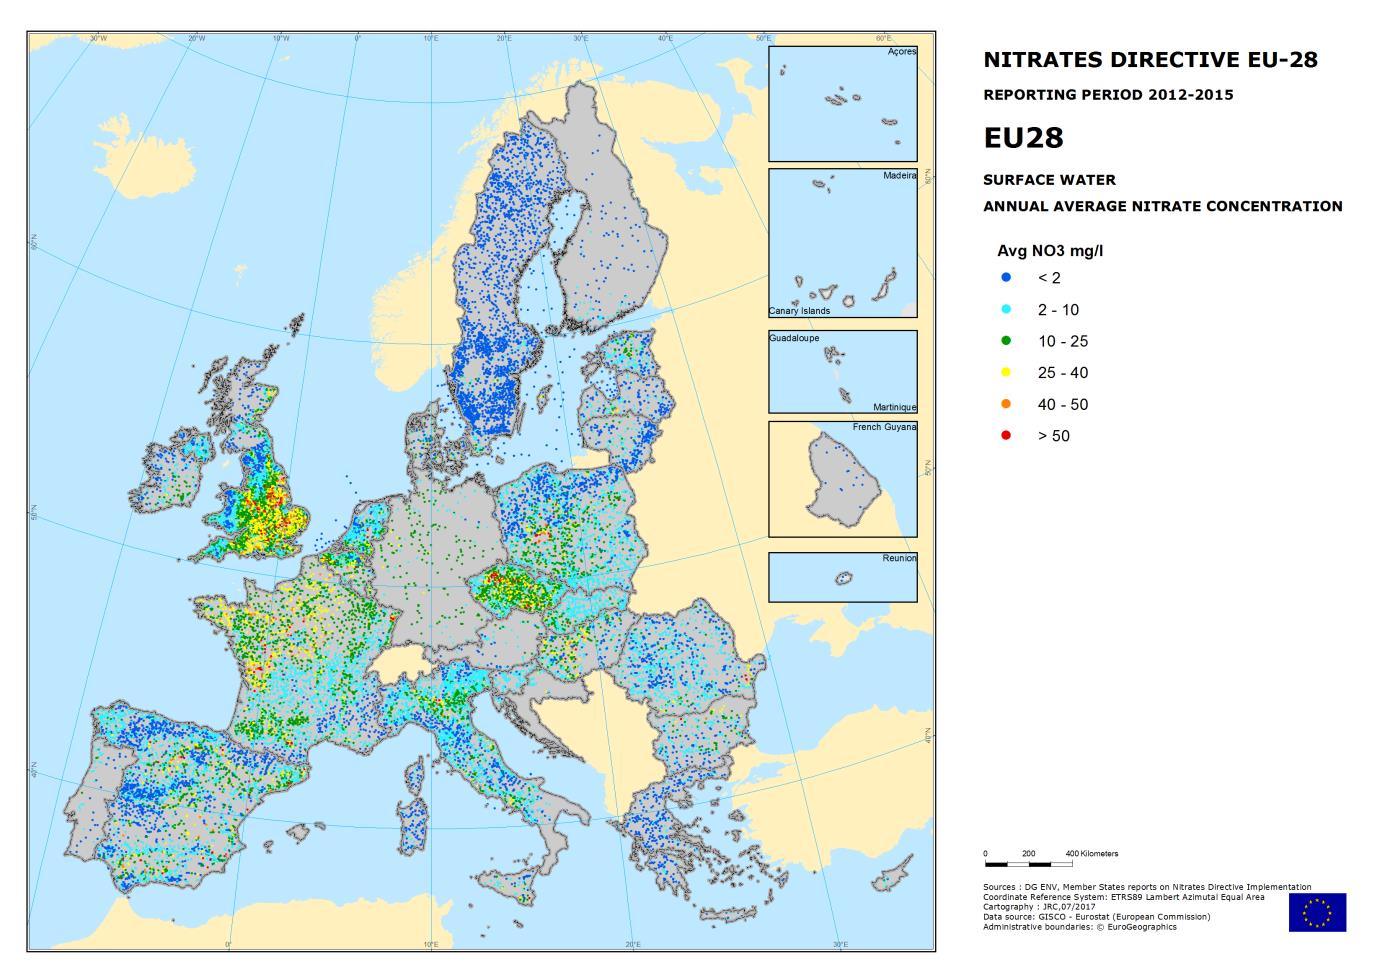
Map 9. Annual average nitrate concentrations in surface water for the reporting period 2012-2015.
Map 10. Winter average nitrate concentrations in surface water for the reporting period 2012-2015.
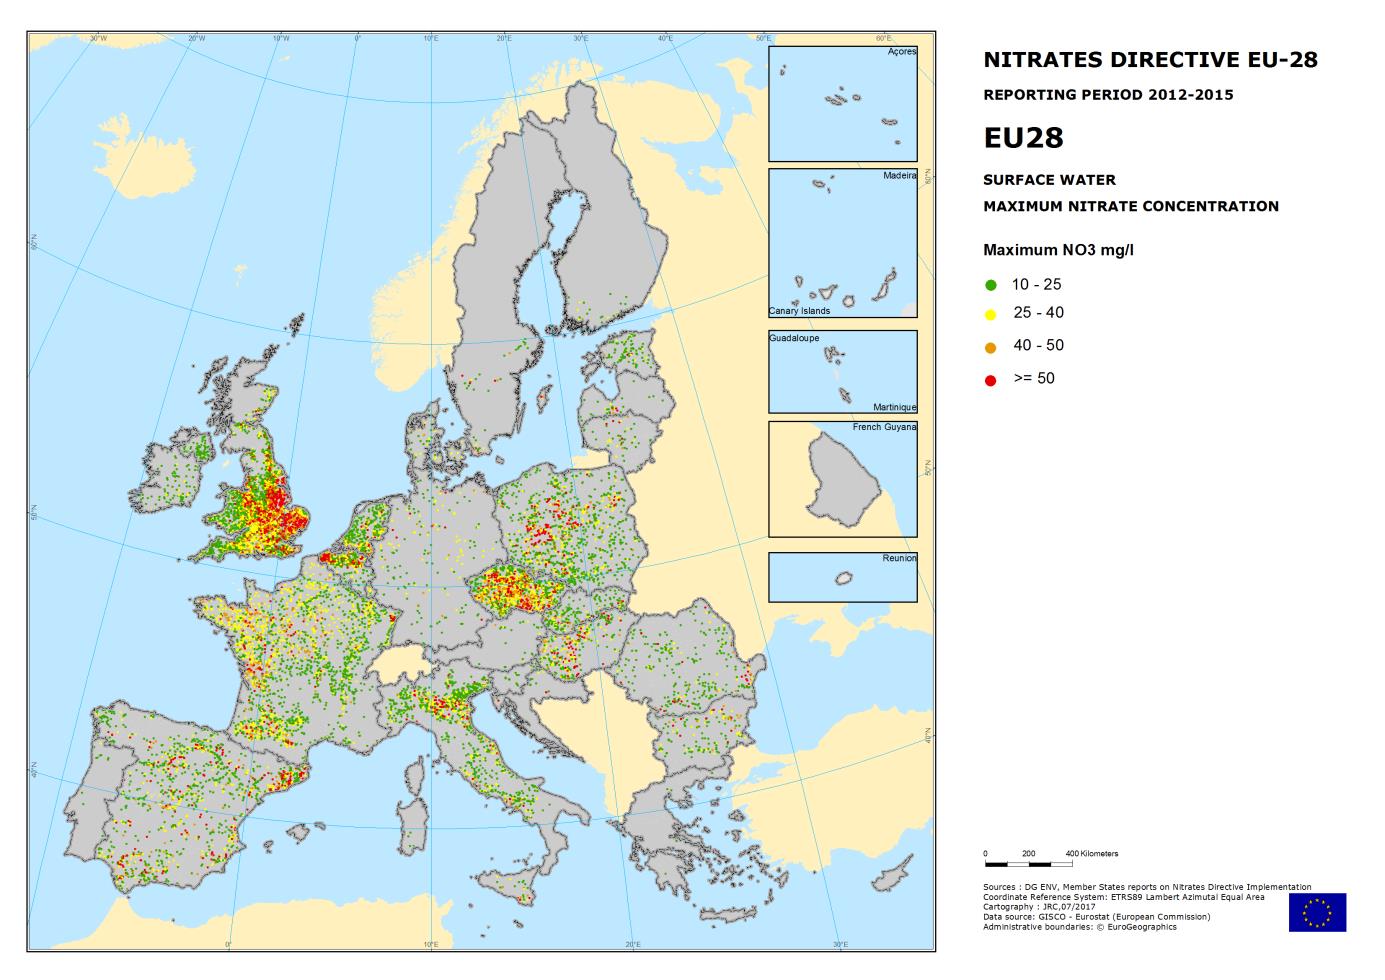
Map 11. Maximum nitrate concentrations in surface water for the reporting period 2012-2015.
Map 12. Trends in annual average nitrate concentrations in surface water between the reporting periods 2008-2011 and 2012-2015 for all.
Map 16. Trends in winter average nitrate concentrations in surface water between the reporting periods 2008-2011 and 2012-2015.
Map 13. Trends in annual average nitrate concentrations in surface water between the reporting periods 2008-2011 and 2012-2015 for stations with an average annual nitrate concentration between 2 and 10 mg/L in 2012-2015.
Map 14. Trends in annual average nitrate concentrations in surface water between the reporting periods 2008-2011 and 2012-2015 for stations with an average annual nitrate concentration between 10 and 25 mg/L in 2012-2015.
Map 15. Trends in annual average nitrate concentrations in surface water between the reporting periods 2008-2011 and 2012-2015 for stations with an average annual nitrate concentration between 25 and 40 mg/L in 2012-2015.
Map 17. Trophic status in surface waters for the reporting period 2012-2015.
Map 18. Implementation of Article 3 of the Nitrates Directive in 2015 (Source: JRC).
SECTION I
WATER QUALITY: STATUS AND TRENDS
Monitoring networks
Groundwater
In the reporting period 2012-2015, the total number of groundwater monitoring stations with annual average nitrate measurements in the EU-28 was 34,091 which is an average of 7.8 stations per 1,000 km2 of land ((
Table 1
,
Figure 1
). The station density varies from 0.6 in Finland to 130 stations per 1,000 km2 of land in Malta. Compared to the previous reporting period 2008-2011 the overall number of monitoring stations remained nearly the same. Relatively large (<-10%) decreases were seen in Spain, Portugal and Romania, while relative large increases (>+10%) were seen in Estonia, Greece, Finland, Latvia, Poland, Sweden and Slovenia.
The average sampling frequency of groundwater is nearly twice a year, and varies from less than once a year in, Denmark, Latvia, Poland and Sweden to around 5 times a year in Belgium and Croatia (
Figure 2
).
Fresh surface water
In the reporting period 2012-2015, the total number of fresh surface water monitoring stations with annual average nitrate measurements in the EU-28 was 33,042 which is an average of 7.6 stations per 1,000 km2 of land (
Table 2
,
Figure 3
). The station density varies from 0.5 per 1,000 km2 in Finland to 34 stations per 1,000 km2 of land in the United Kingdom. Compared to the previous reporting period 2008-2011, the overall number of monitoring stations increased by 23% (
Table 2
). Relatively large (<-10%) decreases were seen in Germany, Latvia, Malta, Poland and Slovakia, while relative large increases (>+10%) were seen in Cyprus, Czech Republic, Estonia, Greece, Finland, Italy, Lithuania, the Netherlands, Sweden and the United Kingdom.
The average sampling frequency is around four times a year, and varies from almost once a year in Sweden to just over 20 times a year in Ireland (
Figure 4
).
Saline surface water
In the reporting period 2012-2015, the total number of saline surface water monitoring stations with annual average nitrate measurements in the EU-28 was 2,205 (
Table 3
). Compared to the previous reporting period 2008-2011 the overall number of monitoring stations decreased by 29% (
Table 2
). Relatively large (<-10%) decreases were seen in Bulgaria, Denmark, Greece, Spain, France, Poland, Portugal, Romania and Sweden, while relative large increases (>+10%) were seen in Estonia, Finland, Ireland and Malta.
Water Quality- Nitrates concentrations
Groundwater
In the reporting period 2012–2015, the average annual nitrate concentration was equal to or exceeded 50 mg/L at 13.2% of the monitoring stations in the EU-28 (
Error! Reference source not found.
,
Figure 5
). This varied from no exceeding stations in Ireland, or less than 5% in Finland, Sweden, Lithuania, Latvia, Croatia and Estonia, to more than 20% in Spain, Germany and Malta. Overall, at EU-28 level, there is a slight improvement compared to the previous reporting period, in which 14.1% of the monitoring stations were equal to or exceeded an average annual nitrate concentration of 50 mg/L. In this reporting period the average annual nitrate concentration was between 40 and 50 mg/L at 5.7 % of the monitoring station in the EU-28.
The lowest nitrate concentrations are observed in captive and karstic groundwater with around 5% of stations equal to or exceeding 50 mg/L (
Figure 6
). In phreatic groundwater the proportion of stations equal to or exceeding 50 mg/L varied from 13% to 19%, with the highest values observed for groundwater depths of 5 to 15 meter. A similar effect was also observed for the trends (
Figure 8
) with a relatively stable situation for karstic and captive groundwater, and a relatively high proportion of decreasing and increasing trends for phreatic groundwater. The lowest proportion of a stable situation was observed for phreatic groundwater at a depth of 5 to 15 meter.
Maximum nitrate concentrations were equal to or exceeded 50 mg/L in 20.3% of the monitoring stations in the EU-28, varying from 1.1% in Sweden to 75.6% in Malta. There is a slight improvement compared to the previous reporting period, in which 20.9% of the monitoring stations had maximum nitrate concentrations equal to or exceeding 50 mg/L.
Compared to the previous reporting period 2008-2011, 26% of all stations in the EU-28 showed an increasing trend and 32% a decreasing trend (
Figure 8
). Member States with a relatively high proportion (>40%) of stations with increasing trends were Malta, Bulgaria, Estonia and Lithuania.
Fresh surface water
In the reporting period 2012-2015, the average annual nitrate concentration was equal to or exceeded 50 mg/L at 1.8% of the monitoring station in the EU-28 (
Figure 9
). Another 2.0% of the stations had average annual nitrate concentrations between 40 and 50 mg/l and 8.8% between 25 and 40 mg/L. The lowest annual average nitrate concentrations (highest proportion less than 2 mg/L) in fresh surface water were found in Sweden, Ireland and Greece and the highest (highest proportions equal to or exceeding 50 mg/L) in the United Kingdom, Belgium and Malta.
The highest nitrate concentrations are generally observed in rivers (
Figure 10
).
There is a slight improvement compared to the previous reporting period, in which 2.4% of the monitoring stations had annual average nitrate concentrations equal to or exceeding 50 mg/L and 2.4% showed concentrations between 40 and 50 mg/L (
Error! Reference source not found.
).
Compared to the reporting period 2008-2011, in the EU-28, a decreasing trend in annual average nitrates concentrations was observed in 31% of all freshwaters monitoring stations, of which 9% showed a large decreasing trend. 50% of the monitoring stations showed stable concentrations. An increasing trend in annual average nitrates concentrations was observed in 19% of all freshwaters monitoring stations, of which 5% showed a large increasing trend (
Figure 11
).
Saline surface water
In saline waters, nitrate concentrations are lower than in fresh water concentrations, with 0.7% of the stations equal to or exceeding 25 mg/L and 75.7% of the stations below 2 mg, based on annual average values.
There is a slight improvement compared to the previous reporting period, in which 1.8% of the monitoring stations had annual average nitrate concentrations equal to or exceeding 25 mg/L.
Eutrophication
The assessment of the trophic status varied widely among Member States, not only regarding the parameters used, but also concerning the methodologies for the definition of trophic status classes. Information on reference conditions is needed to provide a complete picture on eutrophication. The establishment of reference conditions is needed to identify how present day conditions are different from the reference conditions and to set targets for achieving good ecological status of all European waters within the Water Framework Directive. The data delivery on eutrophication varied per Member State and per water type (
Error! Reference source not found.
). Member States are not required to submit data on trends of eutrophication status. The overall comparison between the eutrophication status of the current and previous reporting period is hampered by differences in methods between Member States and also between reporting periods.
Of all reported river monitoring stations in EU-28, 12% and 7% were eutrophic and hypertrophic, respectively, while 31% and 21% were oligotrophic or ultra-oligotrophic respectively (
Figure 12
). The eutrophication state of rivers varied from no eutrophic or hypertrophic stations in Cyprus to 100% hypertrophic rivers in Malta. Of all the Member states that reported on eutrophication the ones with relative low (<10%) proportions of eutrophic or hypertrophic stations were Cyprus, Slovenia, Portugal, Greece, Northern Ireland, Romania, Latvia and Bulgaria. Of all the Member states that reported on eutrophication, the ones with relatively high (>50%) proportions of eutrophic or hypertrophic stations were Austria, Luxemburg, Spain, Lithuania, Czech Republic, Belgium, Croatia and Malta.
In general, the trophic status of rivers is slightly better than the status of lakes (
Figure 17
).
Of all reported lakes monitoring stations in EU-28, 18% and 8% were eutrophic and hypertrophic, respectively, while 45% and 1% were oligotrophic or ultra-oligotrophic, respectively (
Figure 13
). Of all the Member states that reported on eutrophication, the eutrophication state of lakes varied from no eutrophic or hypertrophic stations in Malta to 100% hypertrophic lakes in Croatia. Member states with relative low (<10%) proportions of eutrophic or hypertrophic stations were Malta, Romania and Austria. Member States with relatively high (>50%) proportions of eutrophic or hypertrophic stations were Bulgaria, Croatia and Poland.
Eutrophication data on transitional, coastal and marine waters were only submitted by a limited number of Member States. For transitional waters, six out of the ten Member States that submitted data, showed a 100% proportion of eutrophic or hypertrophic waters (
Figure 14
). For coastal waters, the proportion of stations with eutrophic or hypertrophic conditions varied from 0% in Slovenia to 100% in Latvia (
Figure 15
). Five out of the ten Member States had more than 50% eutrophic or hypertrophic coastal waters. Marine data on eutrophication were submitted by three Member States (
Figure 16
).
Forecast on water quality
The methods applied by Member States to assess future developments in water quality are mostly based on trend analysis, scenario assessments or model simulations, sometimes combined with analyses of past and expected developments in agricultural practices. These predictions, however, are hampered by large uncertainties, due to the large variations in climate and soil conditions and their effects on water quality.
Four Member States and a region (Croatia, Cyprus, Greece, Portugal and Belgium-Flanders,) did not report on the forecast of water quality. Belgium-Flanders and Cyprus mentioned that reliable forecasts are not possible due to the time lag between measures implementation and effect, or due to complicated climates and hydrology.
The results of the other available analyses indicate that 14 Member States or regions (Austria, Bulgaria, Czech Republic, Denmark, France, Germany, Hungary, Luxemburg, the Netherlands, Romania, Slovenia, Sweden, UK-Northern Ireland and UK-Scotland) predict a further decrease in nitrate concentrations in groundwater and surface waters, partly due to the expected effect of changes in agricultural practices driven by the Directive implementation and by several agro-environmental measures included in the Rural Development Programmes. Ten Member States or regions (Belgium-Wallonia, Estonia, Finland, Ireland, Italy, Poland, Slovakia, Spain, UK-England and UK-Wales) did not come to a clear direction about future water quality or predicted increasing or decreasing water quality for different water bodies. Lithuania reported that improvements are unlikely given the current set of measures.

Figure 1. Groundwater station density (stations per 1,000 km2 of land) in reporting period 2012-2015.Stations with data of average annual nitrate measurements.

Figure 2. Average annual groundwater sampling frequency in reporting period 2012-2015. Stations with data of average annual nitrate measurements.

Figure 3. Surface water station density (stations per 1,000 km2 of land) in reporting period 2012-2015. Stations with data of average annual nitrate measurements.

Figure 4. Annual average fresh surface water sampling frequency in reporting period 2012-2015. Stations with data of average annual nitrate measurements.
|
|
Number of stations
|
Stations per 1000 km2
|
|
Change
|
Samplings per year
|
|
MS
|
2008-2011
|
2012-2015
|
2008-2011
|
2012-2015
|
|
(%)
|
2012-2015
|
|
AT
|
1,965
|
1,965
|
23.4
|
23.4
|
|
0.0
|
2.4
|
|
BE
|
2,974
|
2,937
|
97.4
|
96.2
|
|
-1.2
|
4.8
|
|
BG
|
426
|
406
|
3.8
|
3.7
|
|
-4.7
|
3.1
|
|
CY
|
244
|
230
|
26.4
|
24.9
|
|
-5.7
|
1.7
|
|
CZ
|
611
|
621
|
7.7
|
7.9
|
|
1.6
|
1.7
|
|
DE
|
693
|
697
|
1.9
|
2.0
|
|
0.6
|
1.1
|
|
DK
|
1,254
|
1,201
|
29.2
|
28.0
|
|
-4.2
|
0.7
|
|
EE
|
297
|
385
|
6.6
|
8.5
|
|
29.6
|
1.3
|
|
EL
|
370
|
1,078
|
2.8
|
8.2
|
|
191.4
|
1.7
|
|
ES
|
4,780
|
4,132
|
9.6
|
8.3
|
|
-13.6
|
1.6
|
|
FI
|
79
|
187
|
0.2
|
0.6
|
|
136.7
|
1.9
|
|
FR
|
2,509
|
2,598
|
4.6
|
4.8
|
|
3.5
|
1.1
|
|
HR
|
N.A.
|
126
|
N.A.
|
2.2
|
|
N.A
|
5.3
|
|
HU
|
1,763
|
1,756
|
19.0
|
18.9
|
|
-0.4
|
1.7
|
|
IE
|
211
|
205
|
3.0
|
2.9
|
|
-2.8
|
3.2
|
|
IT
|
5,296
|
5,035
|
17.6
|
16.7
|
|
-4.9
|
1.8
|
|
LT
|
62
|
65
|
0.9
|
1.0
|
|
4.8
|
1.0
|
|
LU
|
20
|
20
|
7.7
|
7.7
|
|
0.0
|
2.7
|
|
LV
|
173
|
199
|
2.7
|
3.1
|
|
15.0
|
0.6
|
|
MT
|
41
|
41
|
129.7
|
129.7
|
|
0.0
|
1.4
|
|
NL
|
1,321
|
1,318
|
35.4
|
35.3
|
|
-0.2
|
2.7
|
|
PL
|
1,258
|
1,563
|
4.0
|
5.0
|
|
24.2
|
0.9
|
|
PT
|
657
|
580
|
7.4
|
6.5
|
|
-11.7
|
1.5
|
|
RO
|
1,805
|
1,256
|
7.6
|
5.3
|
|
-30.4
|
1.6
|
|
SE
|
326
|
436
|
0.7
|
1.0
|
|
33.7
|
0.8
|
|
SI
|
104
|
198
|
5.1
|
9.8
|
|
90.4
|
1.5
|
|
SK
|
1,717
|
1,717
|
35.0
|
35.0
|
|
0.0
|
1.2
|
|
UK
|
3,087
|
3,139
|
12.4
|
12.6
|
|
1.7
|
1.8
|
|
EU
|
34,043
|
34,091
|
7.8
|
7.8
|
|
0.1
|
1.9
|
Table 1. Number of stations and station density (stations per 1,000 km2 of land) of reported groundwater monitoring of annual average nitrate measurements in reporting periods 2008-2011 and 2012-2015, the change (%) between both periods, and the annual average sampling frequency in 2012-2015.
|
|
Number of stations
|
Stations per 1000 km2
|
|
Change
|
Samplings per year
|
|
MS
|
2008-2011
|
2012-2015
|
2008-2011
|
2012-2015
|
|
(%)
|
2012-2015
|
|
AT
|
109
|
108
|
1.3
|
1.3
|
|
-1
|
9.3
|
|
BE
|
858
|
835
|
28.1
|
27.4
|
|
-3
|
6.9
|
|
BG
|
305
|
318
|
2.8
|
2.9
|
|
4
|
5.8
|
|
CY
|
10
|
13
|
1.1
|
1.4
|
|
30
|
8.5
|
|
CZ
|
571
|
1,917
|
7.2
|
24.3
|
|
236
|
7.8
|
|
DE
|
303
|
241
|
0.8
|
0.7
|
|
-20
|
13.5
|
|
DK
|
161
|
177
|
3.8
|
4.1
|
|
10
|
3.5
|
|
EE
|
145
|
324
|
3.2
|
7.2
|
|
123
|
2.6
|
|
EL
|
105
|
479
|
0.8
|
3.6
|
|
356
|
1.2
|
|
ES
|
3,730
|
3,903
|
7.5
|
7.8
|
|
5
|
3.4
|
|
FI
|
141
|
167
|
0.4
|
0.5
|
|
18
|
6.9
|
|
FR
|
3,331
|
3,390
|
6.1
|
6.2
|
|
2
|
2.2
|
|
HR
|
N.A.
|
64
|
N.A.
|
1.1
|
|
N.A
|
6.8
|
|
HU
|
525
|
530
|
5.6
|
5.7
|
|
1
|
3.5
|
|
IE
|
252
|
254
|
3.6
|
3.6
|
|
1
|
20.6
|
|
IT
|
2,513
|
3,154
|
8.3
|
10.5
|
|
26
|
3.6
|
|
LT
|
291
|
320
|
4.5
|
4.9
|
|
10
|
3.1
|
|
LU
|
16
|
16
|
6.2
|
6.2
|
|
0
|
10.7
|
|
LV
|
339
|
222
|
5.3
|
3.4
|
|
-35
|
2.5
|
|
MT
|
7
|
5
|
22.2
|
15.8
|
|
-29
|
2.9
|
|
NL
|
457
|
850
|
12.2
|
22.7
|
|
86
|
10.3
|
|
PL
|
2,807
|
2,526
|
9.0
|
8.1
|
|
-10
|
3.2
|
|
PT
|
146
|
154
|
1.6
|
1.7
|
|
5
|
6.3
|
|
RO
|
1,114
|
1,224
|
4.7
|
5.1
|
|
10
|
5.2
|
|
SE
|
187
|
2,792
|
0.4
|
6.4
|
|
1393
|
0.9
|
|
SI
|
139
|
136
|
6.9
|
6.7
|
|
-2
|
3.0
|
|
SK
|
852
|
512
|
17.4
|
10.4
|
|
-40
|
4.6
|
|
UK
|
7,777
|
8,411
|
29.7
|
33.8
|
|
14
|
4.8
|
|
EU
|
26,791
|
33,042
|
6.1
.9.9
|
7.6
|
|
23
|
4.3
|
Table 2. Number of stations and station density (stations per 1,000 km2 of land) of reported fresh surface water monitoring of annual average nitrate measurements in reporting periods 2008-2011 and 2012-2015, the change (%) between both periods, and the annual average sampling frequency in 2012-2015.
|
MS
|
2008-2011
|
2012-2015
|
|
Change (%)
|
|
AT
|
N.A.
|
N.A.
|
|
N.A.
|
|
BE
|
10
|
10
|
|
0.0
|
|
BG
|
7
|
6
|
|
-14.3
|
|
CY
|
0
|
16
|
|
N.A.
|
|
CZ
|
N.A.
|
N.A.
|
|
N.A.
|
|
DE
|
5
|
5
|
|
0
|
|
DK
|
70
|
44
|
|
-37
|
|
EE
|
23
|
26
|
|
13
|
|
EL
|
11
|
0
|
|
-100
|
|
ES
|
631
|
250
|
|
-60
|
|
FI
|
44
|
75
|
|
70
|
|
FR
|
21
|
8
|
|
-62
|
|
HR
|
N.A.
|
0
|
|
N.A.
|
|
HU
|
N.A.
|
N.A.
|
|
N.A.
|
|
IE
|
104
|
117
|
|
13
|
|
IT
|
584
|
577
|
|
-1
|
|
LT
|
17
|
16
|
|
-6
|
|
LU
|
N.A.
|
N.A.
|
|
N.A.
|
|
LV
|
45
|
43
|
|
-4
|
|
MT
|
31
|
49
|
|
58
|
|
NL
|
43
|
39
|
|
-9
|
|
PL
|
46
|
19
|
|
-59
|
|
PT
|
55
|
6
|
|
-89
|
|
RO
|
54
|
35
|
|
-35
|
|
SE
|
233
|
184
|
|
-21
|
|
SI
|
5
|
5
|
|
0
|
|
SK
|
N.A.
|
N.A.
|
|
N.A.
|
|
UK
|
1065
|
675
|
|
-37
|
|
EU
|
3104
|
2205
|
|
-29
|
Table 3. Number of stations of reported saline surface water monitoring of annual average nitrate measurements in reporting periods 2008-2011 and 2012-2015, and the change (%) between both periods.

Figure 5. Frequency diagram of annual average nitrate concentrations in groundwater, at all depths.

Figure 6. Frequency diagram of annual average nitrate concentrations in groundwater at different depths, aggregated over all Member States.

Figure 7. Frequency diagram of trends in annual average nitrate concentrations in groundwater at different depths, aggregated over all Member States.

Figure 8. Frequency diagram of trends in annual average nitrate concentrations in groundwater.

Figure 9. Frequency diagram of annual average nitrate concentrations in fresh surface waters (rivers and lakes).

Figure 10. Frequency diagram of annual average nitrate concentrations in different surface waters, aggregated over all Member States.

Figure 11. Frequency diagram of trends in annual average nitrate concentrations in fresh surface water (rivers and lakes).

Figure 12. Frequency diagram of the trophic status of rivers in reporting period 2012-2015.

Figure 13. Frequency diagram of the trophic status of lakes in reporting period 2012-2015.

Figure 14. Frequency diagram of trophic status classes of transitional waters in reporting period 2012-2015.

Figure 15. Frequency diagram of trophic status classes of coastal waters in reporting period 2012-2015.

Figure 16. Frequency diagram of trophic status classes of marine waters in reporting period 2012-2015.

Figure 17. Frequency diagram of trophic status classes of different water types in reporting period 2012-2015. Note that the number of underlying Member States is different per water type (Annex 2).
EUROPEAN COMMISSION
Brussels, 4.5.2018
SWD(2018) 246 final
COMMISSION STAFF WORKING DOCUMENT
Accompanying the document
Report form the Commission to the Council and the European Parliament
on the implementation of Council Directive 91/676/EEC concerning the protection of waters against pollution caused from agricultural sources based on Member State reports for the period 2012-2015
{COM(2018) 257 final}
SECTION II
AGRICULTURAL PRESSURES IN THE EU: STATUS AND TRENDS
Pressures and consequences
Agriculture provides multiple benefits to society. However, some farming activities result in the alteration of the nitrogen and phosphorus cycles and represent an important pressure on the environment. The intensity of this pressure is dynamic and there can be important differences based on local environmental conditions, characteristics of the production systems and the intensity of production.
Large livestock numbers concentrated locally or regionally pose high risks to the environment when manure production is out of balance with land availability and crop nutrient requirements. This imbalance creates a surplus of nutrients much of which is sooner or later lost to water (nitrates and phosphates) and air (ammonia and nitrogen oxides), if not exported out of the region sometime leading to additional pressures in receiving areas. In particular the loss of nutrients into Europe's waters can result in numerous negative impacts on human health and the environment, such as groundwater pollution and the loss of habitats and biodiversity.
Farm numbers and farm size
In 2013, there were approximately 10.9 million farms in the EU-28, which is an 11% decrease compared to 2010 (
Table 10
). Farm numbers decreased in all Member States, varying from decreases of less than 1% (Ireland) to 38% (Italy), with the exception of the Czech Republic where farm numbers increased by 15%. Farms with livestock decreased from approximately 6.9 to 6.2 million (-10%) in the EU-28 between 2010 and 2013.
The utilized agricultural area showed varying changes between the reporting periods 2008-2011 and 2012-2015 (
Table 9
), with an average decrease of 1%. Member States with relative larger decreasing areas (<-2%) were Austria, Cyprus, Spain, Hungary, Ireland, Italy, the Netherlands and Poland. Relative large increasing areas (>+2%) were observed in Estonia, Greece, Croatia, Lithuania, Latvia and Malta.
Average farm sizes increased from 14.7 to 16.4 ha (+12%) between 2010 and 2013 (
Table 11
). The changes in farm size varied from -13% in the Czech Republic to +77% in Croatia. Small farms (<5 ha) are seen in Cyprus, Malta and Romania, whereas relatively large (>50 ha) are seen in the Czech Republic, Germany, Denmark, France, Luxemburg, Slovakia and the United Kingdom.
Livestock
Because not all Member States have submitted comprehensive data concerning agriculture, official statistics from Eurostat have been used to complement the information provided by the Member States.
The total number of livestock units (comprising cattle, pigs, sheep, goats, poultry, horses and rabbits) in the EU-28 decreased by 3.6% between 2010 and 2013 (
Table 17
). Six Member States (the Czech Republic, Germany, Estonia, Finland, Ireland and Latvia) showed an increasing livestock population varying from less than less than 1% to 3.5%. Relatively large (<-10%) decreases were seen in Bulgaria, Cyprus, Denmark, Greece, Croatia, Malta and Poland.
The average livestock density decreased, by 2.9% between 2010 and 2013 (
Table 18
), from 0.75 to 0.73 livestock units per ha. In 2013, the livestock density varied from 0.21 livestock units per ha in Bulgaria to 3.57 livestock units per ha in the Netherlands. Other countries with relatively high livestock densities (>1.5 livestock units per ha) are Belgium, Cyprus, Denmark and Malta.
The total number of cattle in the EU-28 decreased by 0.7% between the reporting periods 2008-2011 and 2012-2015 (
Table 12
). The changes varied from -11% to +14%. Relatively large increases (>+4%) were observed in Hungary, Estonia, Latvia, Cyprus and the Netherlands while relatively large decreases (<-4%) in Romania, Malta, Greece, and Lithuania.
The total number of dairy cattle in the EU-28 decreased by 0.9% between the reporting periods 2008-2011 and 2012-2015 (
Table 13
). The changes varied from -19% to +14%. Relatively large (>+4%) increases were observed in Cyprus, Italy, Ireland and the Netherlands while relatively large decreases (<-4%) were observed in Croatia, Greece, Lithuania, Malta, Poland, Portugal, Romania and Slovakia.
The total number of pigs in the EU-28 decreased by 3% between the reporting periods 2008-2011 and 2012-2015 (
Table 14
). Most countries showed decreasing pig populations, except Belgium, Germany, Denmark, Spain, Luxemburg, the Netherlands and Portugal. Relatively large decreases (< -10%) were observed in Bulgaria, Cyprus, the Czech Republic, Lithuania, Malta, Poland, Romania and Slovenia.
The total number of poultry in the EU-28 decreased by 0.5% between 2010 and 2013 (
Table 15
). The changes varied from -43% to +38%. Relatively large (>+15%) increases were observed in Finland, Germany, Luxemburg and Sweden, while relatively large decreases (<-15%) were observed in Bulgaria, Cyprus, Greece, Hungary and Portugal.
Changes in sheep numbers between reporting periods 2008-2011 and 2012-2015 showed large variations between Member States (
Table 16
). A very large increase was seen in Lithuania (+107%), and to some extent also in Latvia (+24%). Relatively large decreases (<-10%) were observed in Germany, Spain, Italy, Malta, the Netherlands and Portugal.
The nutrients excretion rate might vary between Member States. Therefore variations in animal numbers are not directly comparable in terms of nutrients production.
Animal manure
The total use of animal manure nitrogen in the EU-28 decreased from 9.5 to 9.2 kton N (- 2.6%) between the reporting periods 2008-2011 and 2012-2015 (
Table 21
). The changes varied from -13% (Czech Republic) to +7% (Hungary). Relatively large (>+5%) increases were observed in Hungary and Latvia. Relatively large (<-5%) decreases were observed in Bulgaria, Cyprus, the Czech Republic, Malta, Poland, Romania and Slovenia.
The total use of animal manure phosphate in the EU-28 decreased from 1.66 to 1.61 kton P (-3.1%) between the reporting periods 2008-2011 and 2012-2015 (
Table 22
). The changes varied from -15% (Czech Republic) to +8% (Hungary). Relatively large (>+5%) increases were observed in Estonia, Hungary and Latvia. Relatively large (<-5%) decreases were observed in Bulgaria, Cyprus, the Czech Republic, Croatia, Malta, the Netherlands, Poland, Romania and Slovenia.
Mineral fertilizer use
The total use of mineral fertiliser nitrogen in the EU-28 increased from 10.5 to 11.0 kton N (+ 4%) between the reporting periods 2008-2011 and 2012-2015 (
Table 19
). The changes varied from -30% (Croatia) to +56% (Bulgaria). Relatively large (>+15%) increases were observed in Bulgaria, the Czech Republic, Spain, Hungary, Lithuania, Latvia, Portugal and Slovakia.
The total use of mineral fertiliser phosphate in the EU-28 increased from 1.07 to 1.13 kton P (+ 6%) between the reporting periods 2008-2011 and 2012-2015 (
Table 20
). The changes varied from -46% (the Netherlands) to +56% (Bulgaria). Relatively large (>+15%) increases were observed in Austria, Bulgaria, the Czech Republic, Denmark, Spain, Hungary, Ireland, Lithuania, Latvia and Slovakia. Relatively large (<-15%) decreases were observed in Belgium, Greece, Italy, Malta and the Netherlands.
Nutrient surplus
A nutrient surplus occurs when not all the fertilizers and animal manure applied to the land are absorbed by the plants or removed during harvest. A surplus represents a potential loss to the environment or accumulation in the soil.
In the current reporting period, the net nitrogen balance in the EU-28 varies from around zero to around 147 kg N per ha (
Table 23
). Member States with relatively high surpluses (>50 kg N/ha) are Belgium, Cyprus, Czech Republic, Denmark, Luxemburg, the Netherlands and the United Kingdom. The net nitrogen balance in the EU-28 increased from 31.8 to 32.5 kg N/ha (+2.4%) between the reporting periods 2008-2011 and 2012-2015. The changes varied from -28 kg N/ha (Malta) to +10 kg N/ha (Ireland). Increase of >+5 kg N/ha were observed in Austria, Bulgaria, the Czech Republic, Hungary, Ireland, Slovenia and Slovakia. Decreases of >5 kg N/ha were observed in Denmark, Estonia, Greece, Croatia, Lithuania, Malta, the Netherlands and Sweden.
In the current reporting period, the phosphate balance in the EU-28 varies from – 7 to +30 kg P per ha (
Table 24
). Member States with negative surpluses are Bulgaria, Czech Republic, Estonia, Hungary, Italy, Romania, Sweden and Slovakia. Relatively high surpluses (>5 kg P/ha) are observed in Belgium, Cyprus, Denmark, Croatia and Malta. The phosphate balance in the EU-28 increased from 1.8 to 2.0 kg P/ha (+14%) between the reporting periods 2008-2011 and 2012-2015. The changes varied from -5.5 kg P/ha (Malta) to +3 kg P/ha (Austria). Relatively large (>2 kg P/ha) increases were observed in Austria and Hungary Relatively large decreases (<-2 kg P/ha) were observed in Malta, the Netherlands and Poland.
Nitrogen discharge
Data on nitrogen discharge into the aquatic environment has not been provided by all Member States (
Table 6
). For the Member States that reported comparable data for both periods (Belgium-Wallonia, Cyprus, Czech Republic, Germany, Estonia, Finland, France, Ireland, Luxemburg, Poland, Romania, UK-Northern Ireland and UK-Scotland), the average nitrogen discharge decreased by 3%. Increases were observed for Czech Republic, Estonia, Ireland and UK-Northern Ireland). In the reporting period 2012-2015 the contribution from agriculture varies from around 50% to nearly 100%.
|
|
Nitrogen discharge (kton N)
|
Contribution agriculture (%)
|
Specific reference years*
|
|
MS
|
2008-2011
|
2012-2015
|
Change (%)
|
2008-2011
|
2012-2015
|
Change (%)
|
|
|
AT
|
80
|
no data
|
|
50
|
no data
|
|
2001 - 2006
|
|
BE-F
|
24
|
16
|
-33
|
no data
|
no data
|
|
1990 / 2011
|
|
BE-W
|
18
|
15
|
-17
|
81
|
no data
|
|
|
|
BG
|
no data
|
no data
|
|
no data
|
no data
|
|
|
|
CY
|
27
|
16
|
-41
|
no data
|
no data
|
|
|
|
CZ
|
217
|
223
|
3
|
95
|
96
|
1
|
|
|
DE
|
56
|
56
|
0
|
86
|
88
|
2
|
|
|
DK
|
no data
|
no data
|
|
no data
|
no data
|
|
|
|
EE
|
23
|
26
|
13
|
85
|
96
|
13
|
|
|
EL
|
no data
|
no data
|
|
no data
|
no data
|
|
|
|
ES
|
no data
|
no data
|
|
no data
|
no data
|
|
|
|
FI
|
39
|
35
|
-10
|
74
|
70
|
-5
|
|
|
FR
|
720
|
809
|
12
|
no data
|
no data
|
|
|
|
HR
|
no data
|
122
|
|
no data
|
96
|
|
|
|
HU
|
410
|
459
|
12
|
93
|
96
|
3
|
2009 / 2011
|
|
IE
|
767
|
786
|
2
|
no data
|
no data
|
|
|
|
IT
|
no data
|
no data
|
|
no data
|
no data
|
|
|
|
LT
|
no data
|
no data
|
|
no data
|
no data
|
|
|
|
LU
|
3
|
3.0
|
0
|
65
|
73
|
12
|
|
|
LV
|
no data
|
no data
|
|
no data
|
no data
|
|
|
|
MT
|
0.2
|
no data
|
|
no data
|
no data
|
|
|
|
NL
|
57
|
51
|
-11
|
63
|
62
|
-2
|
2010 - 2012 / 2013
|
|
PL
|
1696
|
1521
|
-10
|
99
|
99
|
0
|
|
|
PT
|
no data
|
155
|
|
no data
|
87
|
|
|
|
RO
|
820
|
792
|
-3
|
no data
|
no data
|
|
|
|
SE
|
94
|
95
|
1
|
81
|
81
|
0
|
2009 / 2011
|
|
SI
|
no data
|
no data
|
|
87
|
89
|
2
|
|
|
SK
|
no data
|
17
|
|
no data
|
50
|
|
|
|
UK-EN
|
no data
|
193
|
|
no data
|
69
|
|
2012
|
|
UK-NI
|
16
|
17
|
6
|
79
|
79
|
0
|
|
|
UK-SC
|
189
|
169
|
-11
|
72
|
70
|
-3
|
|
|
UK-WA
|
no data
|
no data
|
|
no data
|
no data
|
|
|
Table 6. Annual average nitrogen discharge (kton N) to the aquatic environment and relative contribution of agriculture (%), presented in the article 10 reports of the Member States for reporting periods 2008-2011 and 2012-2015. * If different from 2008-2001 and 2012-2015.
|
|
Cattle
|
|
|
|
Pigs
|
|
|
|
Poultry
|
|
|
|
|
MS
|
2008-2011
|
2012-2015
|
Change (%)
|
Specific reference year*
|
2008-2011
|
2012-2015
|
Change (%)
|
Specific reference year*
|
2008-2011
|
2012-2015
|
Change (%)
|
Specific reference year*
|
|
AT
|
2.01
|
1.96
|
-2.6
|
2010 / 2014
|
3.13
|
2.87
|
-8.5
|
2010 / 2014
|
14.74
|
15.73
|
6.7
|
2010 / 2014
|
|
BE-FL
|
1.33
|
1.30
|
-2.3
|
|
6.12
|
6.30
|
2.9
|
|
26.29
|
29.88
|
13.7
|
|
|
BE-WA
|
1.28
|
1.22
|
-4.7
|
|
0.36
|
0.34
|
-5.6
|
|
5.07
|
4.98
|
-1.8
|
|
|
BG
|
0.55
|
0.55
|
-0.4
|
|
0.69
|
0.57
|
-18.2
|
|
16.70
|
14.67
|
-12.1
|
|
|
CY
|
0.06
|
0.06
|
3.5
|
|
0.44
|
0.36
|
-18.2
|
|
3.83
|
3.30
|
-13.8
|
|
|
CZ
|
1.34
|
1.41
|
4.7
|
|
1.75
|
1.56
|
-10.8
|
|
21.25
|
22.51
|
5.9
|
|
|
DE
|
12.71
|
12.69
|
-0.2
|
2010 / 2013
|
26.90
|
28.13
|
4.6
|
2010 / 2013
|
128.901
|
177.33
|
37.6
|
|
|
DK
|
1.56
|
1.52
|
-2.6
|
|
21.30
|
20.10
|
-5.6
|
|
18.30
|
18.60
|
1.6
|
|
|
EE
|
0.24
|
0.26
|
8.3
|
|
0.37
|
0.26
|
-29.7
|
|
1.91
|
2.22
|
16.2
|
|
|
EL
|
0.63
|
0.43
|
-31.7
|
|
0.90
|
0.20
|
-77.8
|
|
31.60
|
46.60
|
47.5
|
|
|
ES
|
no data
|
no data
|
|
|
no data
|
no data
|
|
|
no data
|
no data
|
|
|
|
FI
|
0.93
|
0.91
|
-1.7
|
|
1.37
|
1.24
|
-9.5
|
|
9.59
|
12.58
|
31.2
|
|
|
FR
|
19.40
|
18.80
|
-3.1
|
2010 / 2013
|
13.80
|
13.30
|
-3.6
|
2010 / 2013
|
335.70
|
335.90
|
0.1
|
2010 / 2013
|
|
UK-EN
|
5.40
|
5.21
|
-3.5
|
2011 / 2015
|
3.60
|
3.83
|
6.4
|
2011 / 2015
|
120.29
|
125.43
|
4.3
|
2011 / 2015
|
|
UK-WA
|
1.13
|
1.11
|
-1.8
|
|
0.03
|
0.03
|
0.0
|
|
7.53
|
8.46
|
12.4
|
|
|
UK-SC
|
1.80
|
1.81
|
0.3
|
|
0.39
|
0.33
|
-16.4
|
|
14.53
|
14.17
|
-2.5
|
|
|
UK-NI
|
1.59
|
1.60
|
0.2
|
|
0.42
|
0.50
|
18.2
|
|
17.54
|
20.05
|
14.3
|
|
|
HR
|
no data
|
0.46
|
|
|
no data
|
1.51
|
|
|
no data
|
12.88
|
|
|
|
HU
|
0.69
|
0.82
|
18.3
|
|
3.27
|
3.12
|
-4.3
|
|
40.72
|
37.12
|
-8.8
|
|
|
IE
|
6.60
|
6.90
|
4.5
|
|
1.50
|
1.60
|
6.7
|
|
|
|
|
|
|
IT
|
6.00
|
6.00
|
0.0
|
|
11.00
|
11.00
|
0.0
|
|
183.00
|
186.00
|
1.6
|
|
|
LT
|
0.76
|
0.73
|
-3.9
|
|
0.89
|
0.76
|
-14.6
|
|
9.08
|
9.40
|
3.5
|
|
|
LU
|
0.20
|
0.20
|
-0.5
|
|
0.08
|
0.09
|
9.8
|
|
0.09
|
0.11
|
25.6
|
|
|
LV
|
0.38
|
0.41
|
7.9
|
|
0.38
|
0.32
|
-14.4
|
|
5.16
|
4.22
|
-18.2
|
|
|
MT
|
0.02
|
0.01
|
-35.9
|
|
0.07
|
0.03
|
-60.1
|
|
1.20
|
0.08
|
-93.5
|
|
|
NL
|
3.90
|
4.00
|
2.6
|
|
12.20
|
12.30
|
0.8
|
|
97.90
|
100.70
|
2.9
|
|
|
PL
|
5.76
|
5.76
|
0.0
|
|
15.28
|
10.59
|
-30.7
|
|
176.49
|
153.21
|
-13.2
|
|
|
PT
|
1.40
|
1.40
|
0.0
|
|
1.90
|
1.80
|
-5.3
|
|
35.40
|
|
|
|
|
RO
|
1.99
|
2.03
|
2.2
|
|
5.36
|
5.15
|
-4.0
|
|
79.84
|
78.34
|
-1.9
|
|
|
SE
|
1.54
|
1.50
|
-2.7
|
2009 / 2013
|
1.53
|
1.40
|
-8.5
|
2009 / 2013
|
12.42
|
16.54
|
33.2
|
2009 / 2013
|
|
SI
|
0.47
|
0.46
|
-1.3
|
|
0.40
|
0.29
|
-27.4
|
|
4.56
|
5.00
|
9.8
|
|
|
SK
|
0.47
|
0.47
|
-1.1
|
|
0.69
|
0.64
|
-7.5
|
|
12.30
|
11.77
|
-4.3
|
|
Table 7. Average livestock numbers (1,000,000) presented in the article 10 reports of the Member States for reporting periods 2008-201 and, 2012-2015, and the change between the two reporting periods.
* If different from 2008-2001 and 2012-2015; 1: DE reported that the figure was underestimated.
|
|
Animal manure
|
|
|
Fertilizer
|
|
|
|
|
MS
|
2008-2011
|
2012-2015
|
Change (%)
|
Specific reference year*
|
2008-2011
|
2012-2015
|
Change (%)
|
Specific reference year*
|
|
AT
|
174
|
167
|
-4.0
|
2010 / 2013
|
104
|
107
|
3.2
|
2010 / 2013
|
|
BE-FL
|
100
|
95
|
-4.9
|
2012-2014
|
39
|
39
|
0.0
|
2012-2014
|
|
BE-WA
|
74
|
71
|
-4.9
|
|
74
|
76
|
3.7
|
|
|
BG
|
69
|
73
|
6.9
|
|
186
|
191
|
2.9
|
|
|
CY
|
15
|
9
|
-37.2
|
|
8
|
7
|
-6.3
|
|
|
CZ
|
69
|
63
|
-8.7
|
|
353
|
397
|
12.6
|
|
|
DE
|
1246
|
1277
|
2.5
|
2010 / 2013
|
1578
|
1597
|
1.2
|
2010-2011
|
|
DK
|
227
|
217
|
-4.4
|
|
197
|
202
|
2.5
|
|
|
EE
|
22
|
23
|
2.7
|
|
30
|
34
|
12.2
|
|
|
EL
|
65
|
57
|
-12.2
|
|
225
|
no data
|
|
|
|
ES
|
no data
|
no data
|
|
|
no data
|
no data
|
|
|
|
FI
|
78
|
75
|
-3.4
|
|
157
|
147
|
-5.8
|
|
|
FR
|
1777
|
1720
|
-3.2
|
2010 / 2014
|
2080
|
2200
|
5.8
|
2010 / 2014
|
|
UK-EN
|
3051
|
no data
|
|
|
8242
|
8192
|
-0.6
|
2011/2015
|
|
UK-WA
|
no data
|
no data
|
|
|
8242
|
8192
|
-0.6
|
2011/2015
|
|
UK-SC
|
152
|
151
|
-0.7
|
|
127
|
143
|
12.6
|
|
|
UK-NI
|
973
|
983
|
1.2
|
|
68
|
71
|
4.1
|
|
|
HR
|
no data
|
49
|
|
|
no data
|
74
|
|
|
|
HU
|
121
|
123
|
1.6
|
|
288
|
335
|
16.3
|
|
|
IE
|
449
|
459
|
2.2
|
|
319
|
328
|
3.0
|
|
|
IT
|
3714
|
3524
|
-5.1
|
|
5455
|
8035
|
47.3
|
|
|
LT
|
53
|
47
|
-11.4
|
|
no data
|
no data
|
|
|
|
LU
|
12
|
12
|
0.0
|
|
13
|
13
|
0.8
|
|
|
LV
|
35336
|
39676
|
12.3
|
|
60
|
76
|
26.8
|
|
|
MT
|
no data
|
no data
|
|
|
0.6
|
0.6
|
0.0
|
|
|
NL
|
314
|
301
|
-4.1
|
|
204
|
190
|
-6.9
|
|
|
PL
|
483
|
517
|
7.0
|
|
1091
|
1004
|
-8.0
|
|
|
PT
|
no data
|
no data
|
|
|
no data
|
no data
|
|
|
|
RO
|
399
|
410
|
2.8
|
|
313
|
312
|
-0.2
|
|
|
SE
|
99
|
103
|
4.0
|
2009 / 2013
|
157
|
155
|
-1.0
|
2009 / 2013
|
|
SI
|
29
|
29
|
-1.0
|
|
27
|
27
|
1.5
|
|
|
SK
|
46
|
48
|
4.8
|
|
96
|
116
|
20.4
|
|
Table 8. Average annual animal manure nitrogen and fertiliser nitrogen use (1,000 kg N) presented in the article 10 reports of the Member States for reporting periods 2008-2011 and 2012-2015, and the change between the two reporting periods.
* If different from 2008-2001 and 2012-2015; 1: 2010 survey;2 England & Wales; 3 Report also stated different values (116/118); 4 Data from 65% of the regions; 5 Data from 75% of the regions; 6 kg manure (no N content available).
|
2008
|
2009
|
2010
|
2011
|
2012
|
2013
|
2014
|
2015
|
08-11
|
12-15
|
Change
|
|
AT
|
3,171
|
3,169
|
3,166
|
2,868
|
2,864
|
2,862
|
2,716
|
2,720
|
3,093
|
2,791
|
-9.8%
|
|
BE
|
1,374
|
1,365
|
1,358
|
1,337
|
1,334
|
1,339
|
1,333
|
1,331
|
1,359
|
1,334
|
-1.8%
|
|
BG
|
5,101
|
5,030
|
5,052
|
5,088
|
5,123
|
4,995
|
4,977
|
5,011
|
5,068
|
5,027
|
-0.8%
|
|
CY
|
127
|
125
|
115
|
116
|
116
|
107
|
107
|
126
|
120
|
114
|
-5.2%
|
|
CZ
|
3,572
|
3,546
|
3,524
|
3,504
|
3,526
|
3,521
|
3,516
|
3,494
|
3,536
|
3,514
|
-0.6%
|
|
DE
|
16,926
|
16,890
|
16,704
|
16,721
|
16,667
|
16,700
|
16,725
|
16,731
|
16,810
|
16,706
|
-0.6%
|
|
DK
|
2,683
|
2,639
|
2,676
|
2,673
|
2,664
|
2,628
|
2,652
|
2,633
|
2,668
|
2,644
|
-0.9%
|
|
EE
|
907
|
932
|
949
|
946
|
956
|
966
|
975
|
994
|
933
|
973
|
4.2%
|
|
EL
|
4,774
|
4,936
|
4,839
|
5,477
|
5,596
|
5,315
|
5,139
|
5,092
|
5,007
|
5,286
|
5.6%
|
|
ES
|
24,718
|
24,190
|
23,719
|
23,894
|
23,463
|
23,495
|
23,572
|
23,897
|
24,131
|
23,607
|
-2.2%
|
|
FI
|
2,296
|
2,296
|
2,292
|
2,287
|
2,285
|
2,259
|
2,267
|
2,273
|
2,293
|
2,271
|
-0.9%
|
|
FR
|
29,385
|
28,876
|
29,311
|
28,853
|
29,001
|
28,976
|
28,930
|
29,115
|
29,106
|
29,005
|
-0.3%
|
|
HR
|
1,289
|
1,300
|
1,334
|
1,326
|
1,331
|
1,301
|
1,241
|
1,538
|
1,312
|
1,353
|
3.1%
|
|
HU
|
5,790
|
5,783
|
5,343
|
5,337
|
5,338
|
5,340
|
5,346
|
5,346
|
5,563
|
5,343
|
-4.0%
|
|
IE
|
4,629
|
4,594
|
4,569
|
4,556
|
4,533
|
4,478
|
4,465
|
4,429
|
4,587
|
4,476
|
-2.4%
|
|
IT
|
13,338
|
13,111
|
12,885
|
12,670
|
12,548
|
12,426
|
12,720
|
12,661
|
13,001
|
12,589
|
-3.2%
|
|
LT
|
2,672
|
2,689
|
2,772
|
2,806
|
2,842
|
2,891
|
2,952
|
3,006
|
2,735
|
2,923
|
6.9%
|
|
LU
|
131
|
131
|
131
|
131
|
131
|
131
|
131
|
131
|
131
|
131
|
0.2%
|
|
LV
|
1,825
|
1,833
|
1,806
|
1,816
|
1,841
|
1,878
|
1,873
|
1,885
|
1,820
|
1,869
|
2.7%
|
|
MT
|
10
|
10
|
11
|
11
|
11
|
12
|
12
|
12
|
11
|
12
|
6.8%
|
|
NL
|
1,933
|
1,921
|
1,872
|
1,858
|
1,842
|
1,848
|
1,839
|
1,846
|
1,896
|
1,843
|
-2.8%
|
|
PL
|
15,608
|
15,625
|
14,603
|
14,780
|
14,529
|
14,410
|
14,424
|
14,398
|
15,154
|
14,440
|
-4.7%
|
|
PT
|
3,726
|
3,695
|
3,654
|
3,649
|
3,664
|
3,716
|
3,701
|
3,700
|
3,681
|
3,696
|
0.4%
|
|
RO
|
13,634
|
13,621
|
14,156
|
13,982
|
13,733
|
13,905
|
13,830
|
13,835
|
13,848
|
13,826
|
-0.2%
|
|
SE
|
3,076
|
3,067
|
3,074
|
3,063
|
3,032
|
3,036
|
3,036
|
3,028
|
3,070
|
3,033
|
-1.2%
|
|
SI
|
492
|
469
|
483
|
458
|
480
|
479
|
482
|
477
|
475
|
479
|
0.8%
|
|
SK
|
1,936
|
1,930
|
1,922
|
1,930
|
1,927
|
1,929
|
1,925
|
1,922
|
1,929
|
1,926
|
-0.2%
|
|
UK
|
17,703
|
17,325
|
17,234
|
17,172
|
17,282
|
17,259
|
17,240
|
17,147
|
17,359
|
17,232
|
-0.7%
|
|
EU-28
|
182,824
|
181,096
|
179,553
|
179,310
|
178,660
|
178,199
|
178,127
|
178,779
|
180,696
|
178,441
|
-1.2%
|
Table 9. Utilized agricultural area (1,000 ha) in the period 2008-2015, and the change between the periods 2008-2011 and 2012-2015 (Source: Eurostat, June 2017).

Figure 18 Utilized agricultural area (1,000 ha) in the reporting periods 2008-2011 and 2012-2015 (Source: Eurostat, June 2017).

Figure 19 Change in utilized agricultural area (%) between the reporting periods 2008-2011 and 2012-2015 (Source: Eurostat, June 2017).
|
2010
|
2013
|
Change
|
|
AT
|
150,170
|
140,430
|
-6.5%
|
|
BE
|
42,850
|
37,760
|
-11.9%
|
|
BG
|
370,490
|
254,410
|
-31.3%
|
|
CY
|
38,860
|
35,380
|
-9.0%
|
|
CZ
|
22,860
|
26,250
|
14.8%
|
|
DE
|
299,130
|
285,030
|
-4.7%
|
|
DK
|
41,360
|
38,280
|
-7.4%
|
|
EE
|
19,610
|
19,190
|
-2.1%
|
|
EL
|
723,060
|
709,500
|
-1.9%
|
|
ES
|
989,800
|
965,000
|
-2.5%
|
|
FI
|
63,870
|
54,400
|
-14.8%
|
|
FR
|
516,100
|
472,210
|
-8.5%
|
|
HR
|
233,280
|
157,440
|
-32.5%
|
|
HU
|
576,810
|
491,330
|
-14.8%
|
|
IE
|
139,890
|
139,600
|
-0.2%
|
|
IT
|
1,620,880
|
1,010,330
|
-37.7%
|
|
LT
|
199,910
|
171,800
|
-14.1%
|
|
LU
|
2,200
|
2,080
|
-5.5%
|
|
LV
|
83,390
|
81,800
|
-1.9%
|
|
MT
|
12,530
|
9,360
|
-25.3%
|
|
NL
|
72,320
|
67,480
|
-6.7%
|
|
PL
|
1,506,620
|
1,429,010
|
-5.2%
|
|
PT
|
305,270
|
264,420
|
-13.4%
|
|
RO
|
3,859,040
|
3,629,660
|
-5.9%
|
|
SE
|
71,090
|
67,150
|
-5.5%
|
|
SI
|
74,650
|
72,380
|
-3.0%
|
|
SK
|
24,460
|
23,570
|
-3.6%
|
|
UK
|
185,200
|
183,040
|
-1.2%
|
|
EU-28
|
12,245,700
|
10,838,290
|
-11.5%
|
Table 10. Number of farms in 2010 and 2013, and the change between 2010 and 2013 (Source: Eurostat, June 2017 ).

Figure 20 Number of farms in 2010 and 2013 (Source: Eurostat, June 2017).

Figure 21 Change in the number of farms (%) between 2010 and 2013 (Source: Eurostat, June 2017 ).
|
2010
|
2013
|
Change
|
|
AT
|
19
|
19
|
1.3%
|
|
BE
|
32
|
35
|
9.3%
|
|
BG
|
12
|
18
|
51.3%
|
|
CY
|
3
|
3
|
1.4%
|
|
CZ
|
152
|
133
|
-12.7%
|
|
DE
|
56
|
59
|
4.9%
|
|
DK
|
64
|
68
|
6.9%
|
|
EE
|
48
|
50
|
4.0%
|
|
EL
|
7
|
7
|
-4.4%
|
|
ES
|
24
|
24
|
0.6%
|
|
FI
|
36
|
42
|
17.0%
|
|
FR
|
54
|
59
|
8.9%
|
|
HR
|
6
|
10
|
76.9%
|
|
HU
|
8
|
9
|
16.7%
|
|
IE
|
36
|
36
|
-0.4%
|
|
IT
|
8
|
12
|
51.0%
|
|
LT
|
14
|
17
|
21.4%
|
|
LU
|
60
|
63
|
5.7%
|
|
LV
|
22
|
23
|
6.6%
|
|
MT
|
1
|
1
|
27.2%
|
|
NL
|
26
|
27
|
5.8%
|
|
PL
|
10
|
10
|
5.2%
|
|
PT
|
12
|
14
|
14.6%
|
|
RO
|
3
|
4
|
4.3%
|
|
SE
|
43
|
45
|
4.8%
|
|
SI
|
6
|
7
|
3.8%
|
|
SK
|
77
|
81
|
4.1%
|
|
UK
|
91
|
95
|
3.8%
|
|
EU-28
|
15
|
16
|
12.1%
|
Table 11. Average farm size (ha) in 2010 and 2013, and the change between 2010 and 2013 (Source: Eurostat, June 2017).

Figure 22 Average farm size (ha) in 2010 and 2013 (Source: Eurostat, June 2017).

Figure 23 Change in average farm size (%) between 2010 and 2013 (Source: Eurostat, June 2017).
|
2008
|
2009
|
2010
|
2011
|
2012
|
2013
|
2014
|
2015
|
08-11
|
12-15
|
Change
|
|
AT
|
1,997
|
2,026
|
2,013
|
1,977
|
1,956
|
1,958
|
1,961
|
1,958
|
2,003
|
1,958
|
-2.3%
|
|
BE
|
2,538
|
2,535
|
2,510
|
2,472
|
2,438
|
2,441
|
2,477
|
2,503
|
2,514
|
2,465
|
-1.9%
|
|
BG
|
574
|
548
|
554
|
568
|
535
|
586
|
562
|
561
|
561
|
561
|
0.0%
|
|
CY
|
56
|
54
|
55
|
57
|
57
|
57
|
60
|
59
|
55
|
58
|
5.0%
|
|
CZ
|
1,358
|
1,356
|
1,319
|
1,339
|
1,321
|
1,332
|
1,373
|
1,366
|
1,343
|
1,348
|
0.4%
|
|
DE
|
12,988
|
12,897
|
12,706
|
12,528
|
12,507
|
12,686
|
12,742
|
12,635
|
12,780
|
12,643
|
-1.1%
|
|
DK
|
1,599
|
1,621
|
1,630
|
1,612
|
1,607
|
1,583
|
1,553
|
1,566
|
1,616
|
1,577
|
-2.4%
|
|
EE
|
238
|
235
|
236
|
238
|
246
|
261
|
265
|
256
|
237
|
257
|
8.6%
|
|
EL
|
682
|
675
|
679
|
681
|
685
|
653
|
659
|
582
|
679
|
645
|
-5.1%
|
|
ES
|
6,020
|
6,082
|
6,075
|
5,923
|
5,813
|
5,802
|
6,079
|
6,183
|
6,025
|
5,969
|
-0.9%
|
|
FI
|
907
|
908
|
909
|
903
|
901
|
903
|
907
|
903
|
907
|
904
|
-0.3%
|
|
FR
|
20,028
|
19,842
|
19,599
|
19,129
|
19,052
|
19,129
|
19,271
|
19,406
|
19,650
|
19,215
|
-2.2%
|
|
HR
|
454
|
447
|
444
|
447
|
452
|
442
|
441
|
455
|
448
|
448
|
-0.1%
|
|
HU
|
701
|
700
|
682
|
697
|
760
|
782
|
802
|
821
|
695
|
791
|
13.8%
|
|
IE
|
6,304
|
6,232
|
5,918
|
5,925
|
6,253
|
6,309
|
6,243
|
6,422
|
6,095
|
6,307
|
3.5%
|
|
IT
|
6,486
|
6,447
|
5,832
|
6,252
|
6,252
|
6,249
|
6,125
|
6,156
|
6,254
|
6,196
|
-0.9%
|
|
LT
|
771
|
759
|
748
|
752
|
729
|
714
|
737
|
723
|
758
|
725
|
-4.2%
|
|
LU
|
196
|
195
|
194
|
188
|
188
|
198
|
201
|
201
|
193
|
197
|
1.9%
|
|
LV
|
380
|
378
|
379
|
381
|
393
|
406
|
422
|
419
|
380
|
410
|
8.0%
|
|
MT
|
18
|
16
|
15
|
15
|
16
|
15
|
15
|
15
|
16
|
15
|
-5.2%
|
|
NL
|
3,996
|
3,998
|
3,960
|
3,912
|
3,985
|
4,090
|
4,169
|
4,315
|
3,967
|
4,140
|
4.4%
|
|
PL
|
5,564
|
5,590
|
5,562
|
5,501
|
5,520
|
5,590
|
5,660
|
5,763
|
5,554
|
5,633
|
1.4%
|
|
PT
|
1,495
|
1,447
|
1,503
|
1,519
|
1,498
|
1,471
|
1,549
|
1,606
|
1,491
|
1,531
|
2.7%
|
|
RO
|
2,684
|
2,512
|
2,001
|
1,989
|
2,009
|
2,022
|
2,069
|
2,092
|
2,296
|
2,048
|
-10.8%
|
|
SE
|
1,505
|
1,482
|
1,475
|
1,450
|
1,444
|
1,444
|
1,436
|
1,428
|
1,478
|
1,438
|
-2.7%
|
|
SI
|
470
|
473
|
470
|
462
|
460
|
461
|
468
|
484
|
469
|
468
|
-0.1%
|
|
SK
|
488
|
472
|
467
|
463
|
471
|
468
|
466
|
457
|
473
|
465
|
-1.5%
|
|
UK
|
9,911
|
9,901
|
9,896
|
9,675
|
9,749
|
9,682
|
9,693
|
9,816
|
9,846
|
9,735
|
-1.1%
|
|
EU-28
|
90,408
|
89,829
|
87,831
|
87,054
|
87,297
|
87,734
|
88,406
|
89,152
|
88,781
|
88,147
|
-0.7%
|
Table 12. Number of total cattle (1,000) in the period 2008-2015, and the change between the periods 2008-2011 and 2012-2015 (Source: Eurostat, June 2017).

Figure 24 Average number of total cattle (1,000) in the reporting periods 2008-2011 and 2012-2015 (Source: Eurostat, June 2017).

Figure 25 Change in the number of total cattle (%) between the reporting periods 2008-2011 and 2012-2015 (Source: Eurostat, June 2017)..
|
2008
|
2009
|
2010
|
2011
|
2012
|
2013
|
2014
|
2015
|
08-11
|
12-15
|
Change
|
|
AT
|
530
|
533
|
533
|
527
|
523
|
530
|
538
|
534
|
531
|
531
|
0.1%
|
|
BE
|
518
|
518
|
518
|
511
|
504
|
516
|
519
|
529
|
516
|
517
|
0.2%
|
|
BG
|
315
|
297
|
314
|
313
|
294
|
313
|
302
|
283
|
310
|
298
|
-3.7%
|
|
CY
|
24
|
23
|
23
|
24
|
24
|
25
|
25
|
26
|
24
|
25
|
6.3%
|
|
CZ
|
400
|
384
|
375
|
374
|
367
|
375
|
372
|
369
|
383
|
371
|
-3.2%
|
|
DE
|
4,229
|
4,169
|
4,182
|
4,190
|
4,190
|
4,268
|
4,296
|
4,285
|
4,193
|
4,260
|
1.6%
|
|
DK
|
566
|
574
|
573
|
579
|
579
|
567
|
547
|
570
|
573
|
566
|
-1.3%
|
|
EE
|
100
|
97
|
97
|
96
|
97
|
98
|
96
|
91
|
97
|
95
|
-2.3%
|
|
EL
|
154
|
145
|
144
|
130
|
132
|
130
|
135
|
111
|
143
|
127
|
-11.3%
|
|
ES
|
888
|
828
|
845
|
798
|
827
|
844
|
845
|
844
|
840
|
840
|
0.0%
|
|
FI
|
288
|
286
|
284
|
282
|
280
|
282
|
283
|
282
|
285
|
282
|
-1.1%
|
|
FR
|
3,857
|
3,748
|
3,718
|
3,664
|
3,644
|
3,697
|
3,699
|
3,661
|
3,747
|
3,675
|
-1.9%
|
|
HR
|
213
|
212
|
207
|
185
|
181
|
168
|
159
|
152
|
204
|
165
|
-19.1%
|
|
HU
|
263
|
248
|
239
|
252
|
255
|
250
|
255
|
251
|
251
|
253
|
0.9%
|
|
IE
|
1,024
|
1,022
|
1,007
|
1,036
|
1,060
|
1,082
|
1,128
|
1,240
|
1,022
|
1,128
|
10.3%
|
|
IT
|
1,831
|
1,878
|
1,746
|
1,755
|
2,009
|
2,075
|
2,069
|
2,057
|
1,803
|
2,052
|
13.9%
|
|
LT
|
395
|
375
|
360
|
350
|
331
|
316
|
314
|
301
|
370
|
315
|
-14.7%
|
|
LU
|
46
|
46
|
46
|
44
|
45
|
48
|
47
|
49
|
46
|
47
|
3.8%
|
|
LV
|
170
|
166
|
164
|
164
|
165
|
165
|
166
|
162
|
166
|
164
|
-0.9%
|
|
MT
|
7
|
7
|
6
|
6
|
6
|
6
|
7
|
6
|
7
|
6
|
-5.0%
|
|
NL
|
1,587
|
1,562
|
1,518
|
1,504
|
1,541
|
1,597
|
1,610
|
1,717
|
1,543
|
1,616
|
4.8%
|
|
PL
|
2,697
|
2,585
|
2,529
|
2,446
|
2,346
|
2,299
|
2,248
|
2,134
|
2,564
|
2,257
|
-12.0%
|
|
PT
|
265
|
255
|
243
|
242
|
237
|
231
|
234
|
243
|
251
|
236
|
-6.1%
|
|
RO
|
1,483
|
1,419
|
1,179
|
1,170
|
1,163
|
1,169
|
1,188
|
1,191
|
1,313
|
1,178
|
-10.3%
|
|
SE
|
366
|
354
|
349
|
348
|
346
|
346
|
344
|
337
|
354
|
343
|
-3.1%
|
|
SI
|
113
|
113
|
109
|
109
|
111
|
110
|
108
|
113
|
111
|
110
|
-0.9%
|
|
SK
|
174
|
163
|
159
|
154
|
150
|
145
|
143
|
139
|
162
|
144
|
-11.2%
|
|
UK
|
1,903
|
1,864
|
1,847
|
1,800
|
1,786
|
1,817
|
1,883
|
1,918
|
1,854
|
1,851
|
-0.1%
|
|
EU-28
|
24,406
|
23,871
|
23,314
|
23,053
|
23,193
|
23,468
|
23,559
|
23,595
|
23,661
|
23,454
|
-0.9%
|
Table 13. Number of dairy cattle (1,000) in the period 2008-2015, and the change between the periods 2008-2011 and 2012-2015 (Source: Eurostat, June 2017).

Figure 26 Average number of dairy cattle (1,000) in the reporting periods 2008-2011 and 2012-2015 (Source: Eurostat, June 2017).

Figure 27 Change in the number of dairy cattle (%) between the reporting periods 2008-2011 and 2012-2015 (Source: Eurostat, June 2017 ).
|
2008
|
2009
|
2010
|
2011
|
2012
|
2013
|
2014
|
2015
|
08-11
|
12-15
|
Change
|
|
AT
|
3,064
|
3,137
|
3,134
|
3,005
|
2,983
|
2,896
|
2,868
|
2,845
|
3,085
|
2,898
|
-6.1%
|
|
BE
|
6,208
|
6,228
|
6,176
|
6,328
|
6,448
|
6,351
|
6,350
|
6,364
|
6,235
|
6,378
|
2.3%
|
|
BG
|
784
|
730
|
664
|
608
|
531
|
586
|
553
|
600
|
696
|
568
|
-18.5%
|
|
CY
|
465
|
463
|
464
|
439
|
395
|
358
|
342
|
328
|
458
|
356
|
-22.3%
|
|
CZ
|
2,135
|
1,914
|
1,846
|
1,487
|
1,534
|
1,548
|
1,607
|
1,555
|
1,845
|
1,561
|
-15.4%
|
|
DE
|
26,719
|
26,841
|
26,901
|
27,402
|
28,331
|
28,133
|
28,339
|
27,652
|
26,966
|
28,114
|
4.3%
|
|
DK
|
12,195
|
12,873
|
12,293
|
12,348
|
12,281
|
12,402
|
12,709
|
12,702
|
12,427
|
12,524
|
0.8%
|
|
EE
|
365
|
365
|
372
|
366
|
375
|
359
|
358
|
305
|
367
|
349
|
-4.9%
|
|
EL
|
1,061
|
1,073
|
1,087
|
1,120
|
1,044
|
1,031
|
1,046
|
877
|
1,085
|
1,000
|
-7.9%
|
|
ES
|
26,290
|
25,343
|
25,704
|
25,635
|
25,250
|
25,495
|
26,568
|
28,367
|
25,743
|
26,420
|
2.6%
|
|
FI
|
1,400
|
1,353
|
1,340
|
1,290
|
1,271
|
1,258
|
1,223
|
1,239
|
1,346
|
1,248
|
-7.3%
|
|
FR
|
14,810
|
14,552
|
14,279
|
13,967
|
13,778
|
13,428
|
13,300
|
13,307
|
14,402
|
13,453
|
-6.6%
|
|
HR
|
1,104
|
1,250
|
1,231
|
1,233
|
1,182
|
1,110
|
1,156
|
1,167
|
1,204
|
1,154
|
-4.2%
|
|
HU
|
3,383
|
3,247
|
3,169
|
3,044
|
2,989
|
3,004
|
3,136
|
3,124
|
3,211
|
3,063
|
-4.6%
|
|
IE
|
1,511
|
1,502
|
1,500
|
1,553
|
1,493
|
1,469
|
1,506
|
1,475
|
1,517
|
1,486
|
-2.0%
|
|
IT
|
9,252
|
9,157
|
9,321
|
9,351
|
8,662
|
8,561
|
8,676
|
8,675
|
9,270
|
8,643
|
-6.8%
|
|
LT
|
897
|
928
|
929
|
790
|
808
|
755
|
714
|
688
|
886
|
741
|
-16.4%
|
|
LU
|
78
|
89
|
89
|
91
|
89
|
90
|
93
|
89
|
87
|
90
|
3.5%
|
|
LV
|
384
|
377
|
390
|
375
|
355
|
368
|
349
|
334
|
381
|
352
|
-7.8%
|
|
MT
|
66
|
66
|
69
|
46
|
45
|
49
|
47
|
44
|
62
|
46
|
-24.8%
|
|
NL
|
11,735
|
12,108
|
12,206
|
12,103
|
12,104
|
12,013
|
12,065
|
12,453
|
12,038
|
12,159
|
1.0%
|
|
PL
|
14,242
|
14,253
|
14,776
|
13,056
|
11,132
|
10,994
|
11,266
|
10,590
|
14,082
|
10,996
|
-21.9%
|
|
PT
|
1,955
|
1,945
|
1,917
|
1,985
|
2,024
|
2,014
|
2,127
|
2,247
|
1,950
|
2,103
|
7.8%
|
|
RO
|
6,174
|
5,793
|
5,428
|
5,364
|
5,234
|
5,180
|
5,042
|
4,927
|
5,690
|
5,096
|
-10.4%
|
|
SE
|
1,703
|
1,616
|
1,607
|
1,568
|
1,474
|
1,480
|
1,458
|
1,435
|
1,623
|
1,462
|
-9.9%
|
|
SI
|
432
|
415
|
396
|
347
|
296
|
288
|
282
|
271
|
398
|
284
|
-28.5%
|
|
SK
|
749
|
741
|
687
|
580
|
631
|
637
|
642
|
633
|
689
|
636
|
-7.7%
|
|
UK
|
4,550
|
4,423
|
4,385
|
4,326
|
4,216
|
4,383
|
4,510
|
4,422
|
4,421
|
4,383
|
-0.9%
|
|
EU-28
|
153,707
|
152,780
|
152,361
|
149,809
|
146,955
|
146,242
|
148,331
|
148,716
|
152,164
|
147,561
|
-3.0%
|
Table 14. Number of pigs (1,000) in the period 2008-2015, and the change in number between the periods 2008-2011 and 2012-2015 (Source: Eurostat, June 2017).

Figure 28 Average number of pigs (1,000) in the reporting periods 2008-2011 and 2012-2015 (Source: Eurostat, June 2017).

Figure 29 Change in the number of pigs (%) between the reporting periods 2008-2011 and 2012-2015 (Source: Eurostat, June 2017).
|
2010
|
2013
|
Change
|
|
AT
|
14,620
|
15,740
|
7.7%
|
|
BE
|
34,370
|
35,100
|
2.1%
|
|
BG
|
17,490
|
14,280
|
-18.4%
|
|
CY
|
3,220
|
1,850
|
-42.5%
|
|
CZ
|
25,320
|
25,340
|
0.1%
|
|
DE
|
128,900
|
177,340
|
37.6%
|
|
DK
|
18,740
|
19,430
|
3.7%
|
|
EE
|
1,940
|
2,170
|
11.9%
|
|
EL
|
36,760
|
27,880
|
-24.2%
|
|
ES
|
200,910
|
205,820
|
2.4%
|
|
FI
|
9,310
|
11,980
|
28.7%
|
|
FR
|
296,130
|
297,070
|
0.3%
|
|
HR
|
13,470
|
13,630
|
1.2%
|
|
HU
|
48,700
|
41,100
|
-15.6%
|
|
IE
|
10,930
|
10,130
|
-7.3%
|
|
IT
|
167,520
|
164,900
|
-1.6%
|
|
LT
|
8,600
|
9,330
|
8.5%
|
|
LU
|
90
|
120
|
33.3%
|
|
LV
|
5,160
|
5,030
|
-2.5%
|
|
MT
|
980
|
920
|
-6.1%
|
|
NL
|
103,620
|
99,430
|
-4.0%
|
|
PL
|
174,300
|
149,200
|
-14.4%
|
|
PT
|
35,350
|
28,620
|
-19.0%
|
|
RO
|
79,190
|
76,300
|
-3.6%
|
|
SE
|
14,290
|
16,620
|
16.3%
|
|
SI
|
4,900
|
4,870
|
-0.6%
|
|
SK
|
12,660
|
11,360
|
-10.3%
|
|
UK
|
162,560
|
155,510
|
-4.3%
|
|
EU-28
|
1,630,030
|
1,621,070
|
-0.5%
|
Table 15. Number of poultry (1,000) in 2010 and 2013, and the change between the years 2010 and 2013 (Source: Eurostat, June 2017).

Figure 30 Average number of poultry (1,000) in 2010 and 2013 (Source: Eurostat, June 2017).

Figure 31 Change in the number of poultry (%) between 2010 and 2013 (Source: Eurostat, June 2017).
|
2008
|
2009
|
2010
|
2011
|
2012
|
2013
|
2014
|
2015
|
08-11
|
12-15
|
Change
|
|
AT
|
333
|
345
|
358
|
361
|
365
|
357
|
349
|
354
|
349
|
356
|
2.0%
|
|
BE
|
|
|
|
|
119
|
117
|
|
|
|
118
|
|
|
BG
|
1,475
|
1,400
|
1,368
|
1,455
|
1,362
|
1,370
|
1,335
|
1,332
|
1,424
|
1,350
|
-5.3%
|
|
CY
|
267
|
300
|
329
|
356
|
347
|
313
|
322
|
332
|
313
|
329
|
5.0%
|
|
CZ
|
183
|
197
|
|
|
|
|
|
|
190
|
|
|
|
DE
|
1,920
|
1,852
|
1,800
|
1,658
|
1,641
|
1,570
|
1,601
|
1,580
|
1,807
|
1,598
|
-11.6%
|
|
DK
|
90
|
:
|
|
|
|
|
|
|
90
|
|
|
|
EE
|
62
|
|
|
|
|
|
|
|
62
|
|
|
|
EL
|
8,994
|
8,859
|
9,791
|
9,781
|
9,213
|
9,356
|
9,072
|
8,852
|
9,356
|
9,123
|
-2.5%
|
|
ES
|
19,952
|
19,718
|
18,552
|
17,003
|
16,339
|
16,119
|
|
|
18,806
|
16,229
|
-13.7%
|
|
FI
|
94
|
|
|
|
|
|
|
|
94
|
|
|
|
FR
|
7,715
|
7,528
|
7,955
|
7,621
|
7,453
|
7,193
|
7,168
|
7,057
|
7,705
|
7,218
|
-6.3%
|
|
HR
|
643
|
619
|
630
|
639
|
679
|
620
|
605
|
608
|
633
|
628
|
-0.8%
|
|
HU
|
1,236
|
1,223
|
1,181
|
1,120
|
1,185
|
1,214
|
1,185
|
1,190
|
1,190
|
1,194
|
0.3%
|
|
IE
|
3,423
|
3,183
|
3,122
|
3,321
|
3,430
|
3,324
|
3,325
|
3,325
|
3,262
|
3,351
|
2.7%
|
|
IT
|
8,175
|
8,013
|
7,900
|
7,943
|
7,016
|
7,182
|
7,166
|
7,149
|
8,008
|
7,128
|
-11.0%
|
|
LT
|
48
|
53
|
59
|
60
|
83
|
100
|
124
|
147
|
55
|
113
|
107.1%
|
|
LU
|
8
|
9
|
8
|
|
|
|
|
|
8
|
|
|
|
LV
|
67
|
71
|
77
|
80
|
84
|
85
|
93
|
102
|
74
|
91
|
23.5%
|
|
MT
|
13
|
13
|
12
|
12
|
12
|
11
|
11
|
11
|
13
|
11
|
-11.5%
|
|
NL
|
1,545
|
1,091
|
1,211
|
1,113
|
1,093
|
1,074
|
1,070
|
1,032
|
1,240
|
1,067
|
-13.9%
|
|
PL
|
270
|
224
|
214
|
213
|
219
|
|
|
|
230
|
219
|
-5.0%
|
|
PT
|
2,558
|
2,368
|
2,226
|
2,170
|
2,092
|
2,074
|
2,033
|
2,043
|
2,331
|
2,060
|
-11.6%
|
|
RO
|
8,882
|
9,142
|
8,417
|
8,533
|
8,834
|
9,136
|
9,518
|
9,810
|
8,743
|
9,324
|
6.6%
|
|
SE
|
521
|
540
|
565
|
623
|
611
|
577
|
589
|
595
|
562
|
593
|
5.4%
|
|
SI
|
139
|
138
|
|
|
|
|
|
|
138
|
|
|
|
SK
|
362
|
377
|
394
|
394
|
410
|
400
|
391
|
381
|
382
|
396
|
3.6%
|
|
UK
|
21,856
|
21,343
|
21,295
|
21,951
|
22,991
|
22,027
|
22,687
|
23,103
|
21,611
|
22,702
|
5.0%
|
|
EU-28
|
|
|
|
|
|
|
|
|
|
|
|
Table 16. Number of sheep (1,000) in the period 2008-2015, and the change in number between the periods 2008-2011 and 2012-2015 (Source: Eurostat, June 2017).

Figure 32 Average number of sheep (1,000) in the reporting periods 2008-2011 and 2012-2015 (Source: Eurostat, June 2017).

Figure 33 Change in the number of sheep (%) between the reporting periods 2008-2011 and 2012-2015 (Source: Eurostat, June 2017).
|
2010
|
2013
|
Change
|
|
AT
|
2,517
|
2,439
|
-3.1%
|
|
BE
|
3,799
|
3,584
|
-5.6%
|
|
BG
|
1,149
|
1,025
|
-10.8%
|
|
CY
|
201
|
175
|
-13.1%
|
|
CZ
|
1,722
|
1,728
|
0.3%
|
|
DE
|
17,793
|
18,407
|
3.5%
|
|
DK
|
4,919
|
4,133
|
-16.0%
|
|
EE
|
306
|
310
|
1.3%
|
|
EL
|
2,407
|
2,143
|
-11.0%
|
|
ES
|
14,831
|
14,502
|
-2.2%
|
|
FI
|
1,121
|
1,146
|
2.2%
|
|
FR
|
22,674
|
21,871
|
-3.5%
|
|
HR
|
1,020
|
864
|
-15.3%
|
|
HU
|
2,484
|
2,259
|
-9.0%
|
|
IE
|
5,787
|
5,929
|
2.5%
|
|
IT
|
9,912
|
9,374
|
-5.4%
|
|
LT
|
900
|
839
|
-6.8%
|
|
LU
|
168
|
165
|
-1.3%
|
|
LV
|
475
|
486
|
2.4%
|
|
MT
|
42
|
35
|
-16.1%
|
|
NL
|
6,712
|
6,602
|
-1.6%
|
|
PL
|
10,377
|
9,165
|
-11.7%
|
|
PT
|
2,206
|
2,036
|
-7.7%
|
|
RO
|
5,444
|
4,975
|
-8.6%
|
|
SE
|
1,752
|
1,712
|
-2.3%
|
|
SI
|
518
|
488
|
-5.9%
|
|
SK
|
668
|
645
|
-3.5%
|
|
UK
|
13,308
|
13,282
|
-0.2%
|
|
EU-28
|
135,212
|
130,320
|
-3.6%
|
Table 17. Number of Livestock Units (1,000) in 2010 and 2013, and the change between the years 2010 and 2013 (Source: Eurostat, June 2017).

Figure 34 Average number of Livestock Units (1,000) in 2010 and 2013 (Source: Eurostat, June 2017 ).

Figure 35 Change in the number of Livestock Units (%) between 2010 and 2013 (Source: Eurostat, June 2017).
|
2010
|
2013
|
Change
|
|
AT
|
0.80
|
0.85
|
7.2%
|
|
BE
|
2.80
|
2.68
|
-4.3%
|
|
BG
|
0.23
|
0.21
|
-9.8%
|
|
CY
|
1.75
|
1.63
|
-6.9%
|
|
CZ
|
0.49
|
0.49
|
0.4%
|
|
DE
|
1.07
|
1.10
|
3.5%
|
|
DK
|
1.84
|
1.57
|
-14.4%
|
|
EE
|
0.32
|
0.32
|
-0.5%
|
|
EL
|
0.50
|
0.40
|
-18.9%
|
|
ES
|
0.63
|
0.62
|
-1.3%
|
|
FI
|
0.49
|
0.51
|
3.7%
|
|
FR
|
0.77
|
0.75
|
-2.4%
|
|
HR
|
0.76
|
0.66
|
-13.2%
|
|
HU
|
0.46
|
0.42
|
-9.0%
|
|
IE
|
1.27
|
1.32
|
4.5%
|
|
IT
|
0.77
|
0.75
|
-1.9%
|
|
LT
|
0.32
|
0.29
|
-10.7%
|
|
LU
|
1.28
|
1.26
|
-1.2%
|
|
LV
|
0.26
|
0.26
|
-1.5%
|
|
MT
|
3.64
|
2.99
|
-17.9%
|
|
NL
|
3.58
|
3.57
|
-0.3%
|
|
PL
|
0.71
|
0.64
|
-10.5%
|
|
PT
|
0.60
|
0.55
|
-9.3%
|
|
RO
|
0.38
|
0.36
|
-7.0%
|
|
SE
|
0.57
|
0.56
|
-1.1%
|
|
SI
|
1.07
|
1.02
|
-5.1%
|
|
SK
|
0.35
|
0.33
|
-3.9%
|
|
UK
|
0.77
|
0.77
|
-0.3%
|
|
EU-28
|
0.75
|
0.73
|
-2.9%
|
Table 18. Livestock density (LU per ha UAA) in 2010 and 2013, and the change between the years 2010 and 2013 (Source: Eurostat, June 2017).

Figure 36 Average livestock density (LU per ha UAA) in 2010 and 2013 (Source: Eurostat, June 2017).LU = LiveStock Unit; UAA=Utilised Agricultural Area.

Figure 37 Change in livestock density (%) between 2010 and 2013 (Source: Eurostat, June 2017).
|
2008
|
2009
|
2010
|
2011
|
2012
|
2013
|
2014
|
2015
|
08-11
|
12-15
|
Change
|
|
AT
|
108,502
|
89,132
|
104,762
|
98,161
|
107,895
|
110,626
|
121,562
|
125,323
|
100,139
|
116,352
|
16.2%
|
|
BE
|
134,648
|
147,412
|
151,341
|
148,562
|
144,685
|
143,618
|
145,382
|
143,592
|
145,491
|
144,319
|
-0.8%
|
|
BG
|
173,917
|
177,553
|
199,083
|
192,357
|
235,386
|
258,856
|
322,004
|
341,608
|
185,728
|
289,464
|
55.9%
|
|
CY
|
46
|
4,312
|
4,276
|
5,086
|
4,881
|
3,147
|
3,147
|
3,147
|
3,430
|
3,581
|
4.4%
|
|
CZ
|
341,628
|
253,759
|
270,256
|
352,745
|
349,008
|
331,616
|
325,667
|
397,136
|
304,597
|
350,857
|
15.2%
|
|
DE
|
1,807,176
|
1,550,625
|
1,569,045
|
1,786,485
|
1,640,414
|
1,648,828
|
1,675,289
|
1,822,791
|
1,678,333
|
1,696,831
|
1.1%
|
|
DK
|
220,674
|
200,412
|
190,072
|
197,162
|
187,164
|
193,688
|
186,971
|
203,631
|
202,080
|
192,864
|
-4.6%
|
|
EE
|
35,455
|
27,328
|
28,628
|
29,803
|
32,978
|
33,659
|
35,806
|
35,806
|
30,304
|
34,562
|
14.1%
|
|
EL
|
201,000
|
175,000
|
213,000
|
181,394
|
175,445
|
182,534
|
180,931
|
185,123
|
192,599
|
181,008
|
-6.0%
|
|
ES
|
739,757
|
781,069
|
940,984
|
846,697
|
843,410
|
961,507
|
1,101,895
|
1,068,103
|
827,127
|
993,729
|
20.1%
|
|
FI
|
162,905
|
136,009
|
156,523
|
146,189
|
138,900
|
138,136
|
147,373
|
143,479
|
150,407
|
141,972
|
-5.6%
|
|
FR
|
2,425,221
|
2,098,801
|
2,080,333
|
2,332,390
|
2,024,929
|
2,143,821
|
2,190,930
|
2,208,168
|
2,234,186
|
2,141,962
|
-4.1%
|
|
HR
|
170,152
|
90,793
|
109,345
|
125,015
|
106,884
|
77,920
|
73,680
|
87,428
|
123,826
|
86,478
|
-30.2%
|
|
HU
|
294,309
|
274,944
|
281,428
|
301,825
|
312,940
|
342,949
|
326,753
|
358,421
|
288,127
|
335,266
|
16.4%
|
|
IE
|
308,960
|
306,806
|
337,574
|
295,795
|
296,536
|
353,044
|
331,782
|
330,959
|
312,284
|
328,080
|
5.1%
|
|
IT
|
659,922
|
518,778
|
496,637
|
515,966
|
683,566
|
546,542
|
505,126
|
517,854
|
547,826
|
563,272
|
2.8%
|
|
LT
|
118,300
|
134,400
|
143,200
|
147,000
|
150,000
|
155,000
|
162,000
|
166,611
|
135,725
|
158,403
|
16.7%
|
|
LU
|
13,329
|
13,384
|
13,766
|
14,446
|
13,675
|
13,366
|
12,714
|
13,007
|
13,731
|
13,191
|
-3.9%
|
|
LV
|
47,492
|
51,877
|
59,458
|
59,803
|
65,204
|
69,696
|
72,935
|
75,820
|
54,658
|
70,914
|
29.7%
|
|
MT
|
594
|
615
|
636
|
640
|
644
|
649
|
653
|
657
|
621
|
651
|
4.7%
|
|
NL
|
220,712
|
211,350
|
205,211
|
200,420
|
199,520
|
216,026
|
213,200
|
244,893
|
209,423
|
218,410
|
4.3%
|
|
PL
|
1,142,273
|
1,095,441
|
1,027,430
|
1,091,065
|
1,094,673
|
1,194,757
|
1,098,455
|
1,003,597
|
1,089,052
|
1,097,871
|
0.8%
|
|
PT
|
105,131
|
97,293
|
100,249
|
95,088
|
106,864
|
110,643
|
122,842
|
121,028
|
99,440
|
115,344
|
16.0%
|
|
RO
|
279,886
|
296,055
|
305,757
|
313,333
|
289,963
|
344,468
|
303,562
|
357,352
|
298,758
|
323,836
|
8.4%
|
|
SE
|
186,500
|
142,400
|
168,000
|
169,800
|
148,100
|
161,100
|
181,100
|
190,200
|
166,675
|
170,125
|
2.1%
|
|
SI
|
25,039
|
28,202
|
27,486
|
27,134
|
26,300
|
27,263
|
28,612
|
28,319
|
26,965
|
27,624
|
2.4%
|
|
SK
|
121,435
|
96,334
|
106,513
|
120,555
|
127,797
|
140,665
|
143,074
|
134,546
|
111,209
|
136,521
|
22.8%
|
|
UK
|
1,000,999
|
948,022
|
1,016,417
|
1,022,082
|
1,000,196
|
999,002
|
1,060,000
|
1,049,000
|
996,880
|
1,027,050
|
3.0%
|
|
EU-28
|
11,045,962
|
9,948,106
|
10,307,410
|
10,816,998
|
10,507,957
|
10,903,126
|
11,073,445
|
11,357,599
|
10,529,619
|
10,960,532
|
4.1%
|
Table 19. Fertiliser nitrogen use (1,000 kg N) in the period 2008-2015, and the change between the periods 2008-2011 and 2012-2015 (Source: Eurostat, June 2017).

Figure 38 Fertiliser nitrogen use (1,000 kg N) in the period 2008-2015 (Source: Eurostat, June 2017).

Figure 39 Change in fertiliser nitrogen use (%) between the reporting periods 2008-2011 and 2012-2015 (Source: Eurostat, June 2017).
|
2008
|
2009
|
2010
|
2011
|
2012
|
2013
|
2014
|
2015
|
08-11
|
12-15
|
Change
|
|
AT
|
13,808
|
7,256
|
12,527
|
9,947
|
12,301
|
14,234
|
14,110
|
13,058
|
10,885
|
13,426
|
23.3%
|
|
BE
|
6,400
|
4,600
|
5,600
|
4,738
|
4,738
|
4,807
|
3,359
|
3,468
|
5,335
|
4,093
|
-23.3%
|
|
BG
|
13,342
|
13,387
|
17,043
|
12,902
|
20,798
|
11,656
|
28,144
|
27,573
|
14,169
|
22,043
|
55.6%
|
|
CY
|
1,000
|
1,000
|
1,000
|
1,000
|
1,000
|
801
|
801
|
801
|
1,000
|
851
|
-14.9%
|
|
CZ
|
24,097
|
7,585
|
13,654
|
17,304
|
18,713
|
18,201
|
20,070
|
21,221
|
15,660
|
19,551
|
24.8%
|
|
DE
|
138,274
|
76,122
|
102,675
|
125,025
|
107,880
|
124,073
|
123,999
|
131,503
|
110,524
|
121,864
|
10.3%
|
|
DK
|
7,000
|
11,000
|
10,000
|
10,000
|
10,000
|
13,601
|
13,985
|
14,430
|
9,500
|
13,004
|
36.9%
|
|
EE
|
4,187
|
2,471
|
2,671
|
2,680
|
2,955
|
3,129
|
3,775
|
3,708
|
3,002
|
3,392
|
13.0%
|
|
EL
|
28,000
|
33,000
|
29,000
|
23,000
|
24,000
|
25,523
|
22,547
|
22,076
|
28,250
|
23,537
|
-16.7%
|
|
ES
|
118,576
|
115,360
|
147,495
|
158,350
|
164,427
|
189,014
|
174,028
|
179,784
|
134,945
|
176,813
|
31.0%
|
|
FI
|
16,239
|
10,784
|
12,599
|
11,046
|
10,600
|
11,184
|
11,845
|
10,983
|
12,667
|
11,153
|
-12.0%
|
|
FR
|
282,425
|
129,142
|
177,025
|
218,428
|
189,633
|
217,184
|
206,798
|
187,054
|
201,755
|
200,167
|
-0.8%
|
|
HR
|
21,291
|
8,790
|
15,763
|
14,028
|
14,330
|
12,518
|
16,875
|
12,899
|
14,968
|
14,156
|
-5.4%
|
|
HU
|
27,431
|
19,232
|
19,976
|
22,113
|
25,735
|
33,247
|
35,987
|
35,530
|
22,188
|
32,625
|
47.0%
|
|
IE
|
26,350
|
20,231
|
28,235
|
28,107
|
27,421
|
36,986
|
35,584
|
36,551
|
25,731
|
34,136
|
32.7%
|
|
IT
|
85,000
|
114,000
|
87,000
|
78,000
|
73,000
|
74,775
|
73,664
|
75,149
|
91,000
|
74,147
|
-18.5%
|
|
LT
|
10,000
|
14,000
|
15,000
|
16,000
|
17,000
|
18,165
|
19,419
|
19,799
|
13,750
|
18,596
|
35.2%
|
|
LU
|
665
|
590
|
515
|
516
|
517
|
515
|
515
|
516
|
572
|
516
|
-9.8%
|
|
LV
|
6,632
|
5,831
|
6,840
|
7,640
|
8,648
|
10,670
|
10,204
|
10,633
|
6,736
|
10,039
|
49.0%
|
|
MT
|
31
|
57
|
59
|
57
|
54
|
31
|
33
|
33
|
51
|
38
|
-26.0%
|
|
NL
|
10,806
|
4,049
|
12,531
|
6,090
|
4,617
|
3,990
|
5,877
|
3,741
|
8,369
|
4,556
|
-45.6%
|
|
PL
|
193,133
|
163,852
|
154,183
|
178,318
|
161,883
|
168,295
|
148,917
|
132,544
|
172,372
|
152,910
|
-11.3%
|
|
PT
|
17,960
|
11,538
|
18,090
|
12,908
|
14,477
|
17,289
|
18,456
|
19,214
|
15,124
|
17,359
|
14.8%
|
|
RO
|
44,718
|
43,900
|
53,849
|
55,123
|
49,353
|
49,697
|
51,772
|
57,921
|
49,398
|
52,186
|
5.6%
|
|
SE
|
14,600
|
8,100
|
9,800
|
10,300
|
10,400
|
11,800
|
12,100
|
12,500
|
10,700
|
11,700
|
9.3%
|
|
SI
|
5,211
|
3,342
|
4,323
|
3,935
|
3,882
|
3,886
|
3,991
|
4,120
|
4,203
|
3,970
|
-5.5%
|
|
SK
|
11,201
|
7,936
|
7,041
|
8,569
|
10,592
|
11,095
|
11,920
|
11,004
|
8,687
|
11,153
|
28.4%
|
|
UK
|
93,873
|
56,324
|
80,338
|
83,831
|
82,085
|
84,704
|
87,761
|
85,577
|
78,592
|
85,032
|
8.2%
|
|
EU-28
|
1,222,250
|
893,479
|
1,044,832
|
1,119,955
|
1,071,039
|
1,171,070
|
1,156,536
|
1,133,390
|
1,070,129
|
1,133,009
|
5.9%
|
Table 20. Fertiliser phosphate use (1,000 kg P) in the period 2008-2015, and the change between the periods 2008-2011 and 2012-2015 (Source: Eurostat, June 2017).

Figure 40 Fertiliser phosphate use (1,000 kg P) in the period 2008-2015 (Source: Eurostat, June 2017).

Figure 41 Change in fertiliser phosphate use (%) between the reporting periods 2008-2011 and 2012-2015 (Source: Eurostat, June 2017).
|
2008
|
2009
|
2010
|
2011
|
2012
|
2013
|
2014
|
2015
|
08-11
|
12-15
|
Change
|
|
AT
|
166,511
|
168,922
|
168,686
|
166,268
|
165,020
|
164,513
|
164,513
|
|
167,597
|
164,682
|
-1.7%
|
|
BE
|
233,639
|
234,607
|
237,137
|
233,621
|
232,281
|
233,855
|
229,547
|
|
234,751
|
231,894
|
-1.2%
|
|
BG
|
108,210
|
101,710
|
96,779
|
93,820
|
90,971
|
89,568
|
93,294
|
|
100,130
|
91,278
|
-8.8%
|
|
CY
|
22,212
|
21,699
|
22,591
|
22,251
|
21,207
|
19,465
|
19,465
|
|
22,188
|
20,046
|
-9.7%
|
|
CZ
|
122,155
|
113,757
|
108,635
|
103,985
|
100,750
|
99,937
|
92,415
|
|
112,133
|
97,701
|
-12.9%
|
|
DE
|
1,260,630
|
1,259,540
|
1,245,772
|
1,242,264
|
1,259,568
|
1,277,241
|
|
|
1,252,052
|
1,268,405
|
1.3%
|
|
DK
|
273,814
|
264,668
|
265,447
|
264,233
|
262,573
|
261,436
|
261,903
|
|
267,041
|
261,971
|
-1.9%
|
|
EE
|
21,595
|
21,421
|
21,862
|
22,282
|
22,428
|
23,003
|
23,067
|
|
21,790
|
22,833
|
4.8%
|
|
EL
|
290,237
|
295,536
|
294,859
|
294,251
|
293,626
|
294,540
|
293,226
|
|
293,721
|
293,797
|
0.0%
|
|
ES
|
797,419
|
789,751
|
788,069
|
776,614
|
755,122
|
743,789
|
757,237
|
|
787,963
|
752,049
|
-4.6%
|
|
FI
|
98,715
|
96,930
|
100,818
|
99,694
|
98,260
|
98,986
|
97,510
|
|
99,039
|
98,252
|
-0.8%
|
|
FR
|
1,801,167
|
1,786,305
|
1,777,207
|
1,741,960
|
1,705,149
|
1,711,695
|
1,720,119
|
|
1,776,660
|
1,712,321
|
-3.6%
|
|
HR
|
62,934
|
65,330
|
64,554
|
63,615
|
63,818
|
60,397
|
61,432
|
|
64,108
|
61,882
|
-3.5%
|
|
HU
|
116,579
|
110,289
|
112,172
|
116,767
|
120,754
|
121,220
|
124,750
|
|
113,952
|
122,241
|
7.3%
|
|
IE
|
458,236
|
454,666
|
443,858
|
439,061
|
452,976
|
462,299
|
|
|
448,955
|
457,638
|
1.9%
|
|
IT
|
856,561
|
859,131
|
838,415
|
839,779
|
827,222
|
836,298
|
826,324
|
|
848,472
|
829,948
|
-2.2%
|
|
LT
|
71,604
|
70,302
|
69,976
|
67,232
|
67,161
|
65,954
|
67,212
|
|
69,779
|
66,776
|
-4.3%
|
|
LU
|
14,908
|
15,006
|
15,328
|
14,974
|
14,651
|
14,930
|
15,144
|
|
15,054
|
14,908
|
-1.0%
|
|
LV
|
34,203
|
33,611
|
34,081
|
34,141
|
35,122
|
36,179
|
37,415
|
|
34,009
|
36,239
|
6.6%
|
|
MT
|
2,836
|
2,723
|
2,636
|
2,349
|
2,325
|
2,409
|
2,380
|
|
2,636
|
2,371
|
-10.0%
|
|
NL
|
418,306
|
405,901
|
423,833
|
405,541
|
382,499
|
393,739
|
408,670
|
|
413,395
|
394,969
|
-4.5%
|
|
PL
|
577,167
|
555,978
|
559,549
|
547,752
|
519,909
|
508,324
|
514,462
|
|
560,112
|
514,232
|
-8.2%
|
|
PT
|
156,248
|
156,344
|
155,698
|
155,173
|
153,447
|
146,841
|
150,441
|
154,371
|
155,866
|
151,275
|
-2.9%
|
|
RO
|
420,796
|
404,124
|
361,122
|
357,893
|
356,924
|
356,015
|
350,008
|
|
385,984
|
354,316
|
-8.2%
|
|
SE
|
124,041
|
122,074
|
120,492
|
118,860
|
118,138
|
120,505
|
|
|
121,367
|
119,322
|
-1.7%
|
|
SI
|
38,673
|
38,667
|
37,919
|
36,559
|
36,036
|
35,587
|
36,421
|
|
37,955
|
36,015
|
-5.1%
|
|
SK
|
59,107
|
59,211
|
58,270
|
55,711
|
57,336
|
56,476
|
53,544
|
|
58,075
|
55,785
|
-3.9%
|
|
UK
|
1,013,310
|
979,824
|
999,292
|
988,698
|
987,602
|
990,467
|
999,952
|
|
995,281
|
992,674
|
-0.3%
|
|
EU-28
|
9,621,813
|
9,488,027
|
9,425,057
|
9,305,348
|
9,202,875
|
9,225,668
|
|
|
9,460,061
|
9,214,272
|
-2.6%
|
Table 21. Animal manure nitrogen use (1,000 kg N) in the period 2008-2015, and the change between the periods 2008-2011 and 2012-2015 (Source: Eurostat, June 2017).

Figure 42 Animal manure nitrogen use (1,000 kg N) in the period 2008-2015 (Source: Eurostat, June 2017).

Figure 43 Change in animal manure nitrogen use (%) between the reporting periods 2008-2011 and 2012-2015 (Source: Eurostat, June 2017).
|
2008
|
2009
|
2010
|
2011
|
2012
|
2013
|
2014
|
2015
|
08-11
|
12-15
|
Change
|
|
AT
|
33,897
|
34,452
|
34,386
|
33,629
|
33,359
|
33,140
|
33,140
|
:
|
34,091
|
33,213
|
-2.6%
|
|
BE
|
35,963
|
36,338
|
36,993
|
36,471
|
36,534
|
38,008
|
37,716
|
:
|
36,441
|
37,419
|
2.7%
|
|
BG
|
15,572
|
14,753
|
13,984
|
13,439
|
13,000
|
12,798
|
12,871
|
:
|
14,437
|
12,890
|
-10.7%
|
|
CY
|
3,868
|
3,824
|
3,943
|
3,893
|
3,692
|
3,383
|
3,383
|
:
|
3,882
|
3,486
|
-10.2%
|
|
CZ
|
25,181
|
23,117
|
21,851
|
20,402
|
19,366
|
19,610
|
18,775
|
:
|
22,638
|
19,250
|
-15.0%
|
|
DE
|
237,622
|
235,943
|
232,481
|
231,080
|
234,341
|
237,142
|
:
|
:
|
234,282
|
235,742
|
0.6%
|
|
DK
|
62,939
|
62,379
|
64,482
|
63,694
|
62,849
|
62,439
|
62,863
|
:
|
63,374
|
62,717
|
-1.0%
|
|
EE
|
4,783
|
4,781
|
4,847
|
4,921
|
5,014
|
5,098
|
5,091
|
:
|
4,833
|
5,068
|
4.9%
|
|
EL
|
39,205
|
40,087
|
40,385
|
40,095
|
40,115
|
40,305
|
40,187
|
:
|
39,943
|
40,202
|
0.6%
|
|
ES
|
138,644
|
136,479
|
137,607
|
135,569
|
133,170
|
131,751
|
135,307
|
:
|
137,075
|
133,409
|
-2.7%
|
|
FI
|
17,738
|
17,390
|
18,238
|
18,100
|
17,923
|
18,281
|
17,691
|
:
|
17,867
|
17,965
|
0.6%
|
|
FR
|
306,731
|
304,127
|
301,006
|
293,864
|
291,842
|
292,828
|
294,266
|
:
|
301,432
|
292,979
|
-2.8%
|
|
HR
|
10,469
|
11,054
|
10,907
|
10,615
|
10,446
|
9,995
|
9,975
|
:
|
10,761
|
10,139
|
-5.8%
|
|
HU
|
24,667
|
23,737
|
20,248
|
22,173
|
24,177
|
24,404
|
24,994
|
:
|
22,706
|
24,525
|
8.0%
|
|
IE
|
64,552
|
64,709
|
63,196
|
63,123
|
64,554
|
65,945
|
:
|
:
|
63,895
|
65,250
|
2.1%
|
|
IT
|
166,417
|
164,508
|
162,101
|
162,478
|
157,919
|
158,632
|
156,713
|
:
|
163,876
|
157,755
|
-3.7%
|
|
LT
|
12,675
|
12,359
|
12,271
|
11,882
|
11,831
|
11,630
|
12,017
|
:
|
12,297
|
11,826
|
-3.8%
|
|
LU
|
2,162
|
2,172
|
2,206
|
2,162
|
2,122
|
2,168
|
2,199
|
:
|
2,176
|
2,163
|
-0.6%
|
|
LV
|
5,234
|
5,137
|
5,182
|
5,158
|
5,369
|
5,503
|
5,669
|
:
|
5,178
|
5,514
|
6.5%
|
|
MT
|
642
|
628
|
620
|
556
|
551
|
578
|
572
|
:
|
612
|
567
|
-7.3%
|
|
NL
|
60,926
|
58,597
|
62,984
|
57,863
|
52,352
|
54,607
|
57,184
|
:
|
60,093
|
54,714
|
-8.9%
|
|
PL
|
115,789
|
110,383
|
118,909
|
108,052
|
98,416
|
96,100
|
97,830
|
:
|
113,283
|
97,449
|
-14.0%
|
|
PT
|
28,378
|
28,533
|
28,314
|
28,174
|
27,829
|
26,442
|
26,930
|
27,554
|
28,350
|
27,189
|
-4.1%
|
|
RO
|
74,600
|
72,087
|
64,228
|
63,873
|
64,143
|
64,458
|
64,181
|
:
|
68,697
|
64,261
|
-6.5%
|
|
SE
|
20,492
|
20,101
|
19,941
|
19,613
|
19,457
|
19,576
|
:
|
:
|
20,037
|
19,517
|
-2.6%
|
|
SI
|
5,621
|
5,598
|
5,451
|
5,247
|
5,165
|
5,115
|
5,267
|
:
|
5,479
|
5,182
|
-5.4%
|
|
SK
|
9,532
|
9,635
|
9,401
|
8,833
|
9,146
|
8,990
|
9,166
|
:
|
9,350
|
9,101
|
-2.7%
|
|
UK
|
167,093
|
160,721
|
165,276
|
163,429
|
162,957
|
163,366
|
165,501
|
:
|
164,130
|
163,941
|
-0.1%
|
|
EU-28
|
1,691,392
|
1,663,629
|
1,661,438
|
1,628,388
|
1,607,639
|
1,612,292
|
:
|
:
|
1,661,212
|
1,609,966
|
-3.1%
|
Table 22. Animal manure phosphate use (1,000 kg P) in the period 2008-2015, and the change between the periods 2008-2011 and 2012-2015 (Source: Eurostat, June 2017).

Figure 44 Animal manure phosphate use (1,000 kg P) in the period 2008-2015 (Source: Eurostat, June 2017 ).

Figure 45 Change in animal manure phosphate use (%) between the reporting periods 2008-2011 and 2012-2015 (Source: Eurostat, June 2017 ).
|
2008
|
2009
|
2010
|
2011
|
2012
|
2013
|
2014
|
2015
|
2008-2011
|
2012-2015
|
Change
|
|
AT
|
0
|
6
|
17
|
8
|
18
|
21
|
15
|
|
8
|
18
|
10
|
|
BE
|
79
|
84
|
96
|
98
|
98
|
93
|
86
|
|
89
|
92
|
3
|
|
BG
|
7
|
13
|
7
|
5
|
17
|
10
|
22
|
|
8
|
16
|
8
|
|
CY
|
162
|
139
|
149
|
159
|
146
|
140
|
156
|
|
152
|
147
|
-5
|
|
CZ
|
62
|
38
|
49
|
62
|
71
|
59
|
46
|
|
53
|
59
|
6
|
|
DE
|
51
|
33
|
47
|
61
|
48
|
48
|
|
|
48
|
48
|
0
|
|
DK
|
77
|
58
|
62
|
60
|
56
|
60
|
53
|
|
64
|
56
|
-8
|
|
EE
|
25
|
15
|
21
|
22
|
18
|
13
|
12
|
|
21
|
14
|
-6
|
|
EL
|
57
|
53
|
59
|
42
|
40
|
46
|
48
|
|
53
|
45
|
-8
|
|
ES
|
20
|
25
|
31
|
22
|
26
|
23
|
35
|
|
25
|
28
|
4
|
|
FI
|
34
|
22
|
41
|
34
|
31
|
30
|
31
|
|
33
|
31
|
-2
|
|
FR
|
38
|
24
|
25
|
36
|
23
|
28
|
28
|
|
31
|
26
|
-4
|
|
HR
|
92
|
39
|
59
|
71
|
66
|
31
|
36
|
|
65
|
44
|
-21
|
|
HU
|
8
|
15
|
23
|
17
|
30
|
24
|
14
|
|
16
|
23
|
7
|
|
IE
|
5
|
6
|
11
|
1
|
7
|
22
|
|
|
6
|
15
|
9
|
|
IT
|
38
|
34
|
33
|
35
|
51
|
43
|
39
|
|
35
|
44
|
9
|
|
LT
|
21
|
22
|
31
|
27
|
17
|
19
|
13
|
|
25
|
16
|
-9
|
|
LU
|
82
|
80
|
86
|
98
|
86
|
87
|
88
|
|
87
|
87
|
1
|
|
LV
|
9
|
14
|
21
|
20
|
16
|
20
|
19
|
|
16
|
18
|
2
|
|
MT
|
91
|
76
|
56
|
23
|
28
|
37
|
37
|
|
62
|
34
|
-28
|
|
NL
|
110
|
101
|
109
|
107
|
104
|
92
|
83
|
|
107
|
93
|
-14
|
|
PL
|
41
|
32
|
35
|
36
|
31
|
37
|
23
|
|
36
|
30
|
-6
|
|
PT
|
17
|
20
|
25
|
23
|
27
|
22
|
26
|
27
|
21
|
26
|
4
|
|
RO
|
3
|
8
|
-10
|
-20
|
7
|
-5
|
-9
|
|
-5
|
-2
|
2
|
|
SE
|
35
|
15
|
26
|
25
|
14
|
17
|
|
|
25
|
16
|
-10
|
|
SI
|
11
|
18
|
11
|
15
|
24
|
36
|
10
|
|
14
|
23
|
10
|
|
SK
|
13
|
18
|
30
|
18
|
26
|
33
|
30
|
|
20
|
30
|
10
|
|
UK
|
47
|
49
|
53
|
50
|
52
|
52
|
50
|
|
50
|
51
|
2
|
|
EU-28
|
34
|
29
|
32
|
32
|
33
|
32
|
|
|
31.8
|
32.5
|
0.75
|
Table 23. Net nitrogen balance (kg N per ha) in the period 2008-2015, and the change between the periods 2008-2011 and 2012-2015 (Source: Eurostat, June 2017).

Figure 46 Average net nitrogen balance (kg N/ha) in the reporting periods 2008-2011 and 2012-2015 (Source: Eurostat, June 2017).

Figure 47 Change in the net nitrogen balance (kg N/ha) between the reporting periods 2008-2011 and 2012-2015 (Source: Eurostat, June 2017).
|
2008
|
2009
|
2010
|
2011
|
2012
|
2013
|
2014
|
2015
|
2008-2011
|
2012-2015
|
Change
|
|
AT
|
-2
|
0
|
1
|
0
|
2
|
4
|
2
|
|
-0.3
|
2.7
|
2.9
|
|
BE
|
4
|
2
|
5
|
5
|
6
|
6
|
5
|
|
4.0
|
5.7
|
1.7
|
|
BG
|
-4
|
-4
|
-5
|
-6
|
-4
|
-9
|
-6
|
|
-4.8
|
-6.3
|
-1.6
|
|
CY
|
33
|
29
|
31
|
32
|
30
|
29
|
32
|
|
31.3
|
30.3
|
-0.9
|
|
CZ
|
0
|
-5
|
-2
|
-3
|
-1
|
0
|
-1
|
|
-2.5
|
-0.7
|
1.8
|
|
DE
|
2
|
-2
|
1
|
3
|
1
|
2
|
|
|
1.0
|
1.5
|
0.5
|
|
DK
|
7
|
7
|
8
|
7
|
7
|
8
|
7
|
|
7.3
|
7.3
|
0.1
|
|
EE
|
-5
|
-6
|
-6
|
-5
|
-6
|
-8
|
-7
|
|
-5.5
|
-7.0
|
-1.5
|
|
EL
|
2
|
3
|
2
|
-1
|
-1
|
2
|
0
|
|
1.5
|
0.3
|
-1.2
|
|
ES
|
1
|
3
|
4
|
3
|
5
|
3
|
5
|
|
2.8
|
4.3
|
1.6
|
|
FI
|
5
|
2
|
5
|
4
|
4
|
4
|
4
|
|
4.0
|
4.0
|
-
|
|
FR
|
4
|
-2
|
1
|
2
|
1
|
2
|
1
|
|
1.3
|
1.3
|
0.1
|
|
HR
|
9
|
1
|
7
|
6
|
7
|
3
|
8
|
|
5.8
|
6.0
|
0.3
|
|
HU
|
-4
|
-3
|
-2
|
-3
|
0
|
-1
|
-2
|
|
-3.0
|
-1.0
|
2
|
|
IE
|
1
|
|
2
|
1
|
2
|
4
|
|
|
1.3
|
3.0
|
1.7
|
|
IT
|
-3
|
0
|
-1
|
-3
|
-2
|
-2
|
-1
|
|
-1.8
|
-1.7
|
0.1
|
|
LT
|
6
|
-1
|
6
|
5
|
7
|
2
|
1
|
|
4.0
|
3.3
|
-0.7
|
|
LU
|
4
|
4
|
4
|
5
|
4
|
4
|
4
|
|
4.3
|
4.0
|
-0.3
|
|
LV
|
1
|
1
|
2
|
2
|
1
|
3
|
2
|
|
1.5
|
2.0
|
0.5
|
|
MT
|
43
|
36
|
33
|
26
|
27
|
30
|
30
|
|
34.5
|
29.0
|
-5.5
|
|
NL
|
8
|
5
|
12
|
7
|
3
|
4
|
1
|
|
8.0
|
2.7
|
-5.3
|
|
PL
|
8
|
4
|
5
|
6
|
3
|
4
|
1
|
|
5.8
|
2.7
|
-3.1
|
|
PT
|
4
|
4
|
6
|
4
|
5
|
4
|
5
|
5.0
|
4.5
|
4.8
|
0.3
|
|
RO
|
1
|
1
|
-1
|
-3
|
1
|
-2
|
-2
|
|
-0.5
|
-1.0
|
-0.5
|
|
SE
|
1
|
-3
|
-1
|
-1
|
0
|
-1
|
|
|
-1.0
|
-0.5
|
0.5
|
|
SI
|
5
|
2
|
3
|
3
|
4
|
6
|
1
|
|
3.3
|
3.7
|
0.4
|
|
SK
|
-1
|
-1
|
0
|
-2
|
0
|
0
|
-2
|
|
-1.0
|
-0.7
|
0.3
|
|
UK
|
4
|
2
|
4
|
4
|
4
|
4
|
3
|
|
3.5
|
3.7
|
0.2
|
|
EU-28
|
2
|
1
|
2
|
2
|
2
|
2
|
|
|
1.8
|
2.0
|
0.2
|
Table 24. Phosphate balance (kg P per ha) in the period 2008-2015, and the change between the periods 2008-2011 and 2012-2015 (Source: Eurostat, June 2017).

Figure 48 Average phosphate balance (kg P/ha) in the reporting periods 2008-2011 and 2012-2015 (Source: Eurostat, June 2017).

Figure 49 Change in the phosphate balance (kg P/ha) between the reporting periods 2008-2011 and 2012-2015 (Source: Eurostat, June 2017).
EUROPEAN COMMISSION
Brussels, 4.5.2018
SWD(2018) 246 final
COMMISSION STAFF WORKING DOCUMENT
Accompanying the document
Report from the Commission to the Council and the European Parliament
on the implementation of Council Directive 91/676/EEC concerning the protection of waters against pollution caused by nitrates from agricultural sources based on Member State reports for the period 2012-2015
{COM(2018) 257 final}
SECTION VI
METHODS
Processing water quality data
Data delivery
Member States delivered water quality data for the reporting period 2012-2015 through EOINET (
http://rod.eionet.europa.eu/obligations/106/deliveries
). The essential data that are processed for the reporting exercise are summarized below for groundwater (GW) and surface water (SW).
Station information (GW_STAT and SW_STAT)
-Stationcode
-Stationtype
-Longitude
-Latitude
Annual nitrate measurements (GW_ANNCONC and SW_ANNCONC)
-Stationcode
-Stationtype
-Year
-Number of samples
-Annual average nitrate
Aggregated nitrate measurements (GW_CONC and SW_CONC)
-Stationcode
-Stationtype
-Period
-Number of samples
-Maximum nitrate
-Trend in annual average nitrate
-Winter average nitrate (SW only)
-Trend in winter average nitrate (SW only)
Eutrophication status (SW_EUTROSTATE)
-Stationcode
-Stationtype
-Period
-Number of samples
-Eutrophication status
Additionally, Member States deliver geo-referenced information about Nitrate Vulnerable Zones (NVZs) through GIS shapefiles and/or boundary files.
Data quality checks
The water quality data and NVZ information follow the specific EIONET dataset definition (
http://dd.eionet.europa.eu/datasets/latest/NiD
). The data go through an automated EIONET check on the presence of mandatory elements, validity and correctness of codes and format of data types. An additional check is carried out on quality, completeness and coherence.
The additional check is executed using FME Workbenches. In these workbenches there is a check on the availability of a value for each of the mandatory attributes and a check on the validity of the given values. The validity check looks for example at the datatype, minimum and maximum values, use of valid codes and the number of characters as defined in the dataset definition.
The additional check also contains a check on the coordinates of the monitoring stations in GW_Stat and SW_Stat. The shapefile NUTS_2013_01M from Eurostat (
http://ec.europa.eu/eurostat/web/gisco/geodata/reference-data/administrative-units-statistical-units/nuts
) is used to check if the monitoring stations are within (or close to, as the boundaries of this dataset do not have a high positional accuracy) the Member State.
To be able to join the different tables with each other, the combination of CountryCode, ND_NatStatCode and ND_StationType should be unique and therefore a check on this uniqueness is included. For the tables GW_AnnConc and SW_AnnConc the combination of CountryCode, ND_NatStatCode, ND_StationType and ND_Year should be unique. For each unique combination it is checked whether there is a record in the other table(s). So, GW_Stat records are matched to records GW_AnnConc and GW_Conc and vice versa. SW_Stat records are matched to records in SW_AnnConc, SW_Conc, SW_EutroMeas and SW_EutroState.
The checked and completed water quality data and NVZ shapefiles are loaded into a GeoDatabase.
Data processing
Monitoring network
The Member States summary sheets and the Staff Working Document (SWD) present tables and figures of the number of stations in the monitoring networks and the sampling density and frequency. These data are based on the number of monitoring stations for which average annual nitrate measurements are reported.
Nitrates concentration
Annual nitrates average concentration presented in all figures, tables and maps of the SWD and Member States Summary Sheets are weighted averages. Nitrate concentrations in water are very variable in time. As the sampling programmes are not always balanced in time due to a varying number of samples per year, the four-year average nitrate concentrations may be affected by incidental extreme variations in nitrate concentrations. Therefore the four-year average is calculated as the weighted average in which each annual value is weighted according to the number of underlying samples.
Four-year weighted average nitrate concentration = Ʃ(ni * AnnualConci) / Ʃ(ni)
ni = number of samples in year i
AnnualConci = Annual average nitrate concentration
Figure 1 in the Member States summary sheets presents the percentage of groundwater stations with average values equal to or exceeding 25, 40 or 50 mg nitrate per L during the current and previous reporting periods. Results are presented for all groundwater stations with measurements at different depths for each of the reporting periods (i.e. 2004-2007, 2008-2011 and 2012-2015) irrespective of possible changes in the Member States monitoring network over time.
Figure 3 in the Member States summary sheets presents the percentage of fresh surface water stations with average values equal to or exceeding 25, 40 or 50 mg nitrate per L during the current and previous reporting periods. Results are presented for all river and lake monitoring stations with measurements for each of the reporting periods (i.e. 2004-2007, 2008-2011 and 2012-2015) irrespective of possible changes in the Member States monitoring network over time.
Stations
Station type
The distinguished station types are presented in Table A1.
Table A1. Groundwater and surface water station types
|
|
Code
|
Type
|
Aggregation
|
|
Ground water
|
0
|
Phreatic groundwater (shallow):0-5m
|
|
|
|
1
|
Phreatic groundwater (deep)
|
|
|
|
1a
|
Phreatic groundwater (deep) 5-15 m
|
|
|
|
1b
|
Phreatic groundwater (deep) 15-30 m
|
|
|
|
1c
|
Phreatic groundwater (deep) > 30 m
|
|
|
|
2
|
Captive groundwater
|
|
|
|
3
|
Karstic groundwater
|
|
|
|
9
|
Other stationtype
|
|
|
|
|
|
|
|
Surface water
|
4
|
Rivers
|
Fresh surface waters
|
|
|
5
|
Lakes
|
|
|
|
6
|
Coastal waters
|
Saline surface waters
|
|
|
7
|
Transitional waters
|
|
|
|
8
|
Marine waters
|
|
Ground water station type
Station density
The station density is calculated as the number of monitoring stations with annual average nitrate measurements per 1000 km2 of land. The land area was derived from Eurostat total landcover in the year 2012. The station density was calculated for groundwater and fresh surface water stations.
Monitoring frequency
Member States submit an annual average nitrate concentration and the number of samples on which the annual average is based. The monitoring frequency is calculated as the sum of all samples taken during the reporting period divided by the total number of monitoring stations. The monitoring frequency was calculated for groundwater, fresh surface water and saline surface water stations.
Trends
Trends are calculated and submitted by Member States. Trends are calculated as the difference in the four-year average nitrate concentration between two consecutive reporting periods, for common monitoring stations of both reporting periods.
Trends are presented for all those stations, and additionally trends are broken down over the annual average nitrate classes of the current reporting period.
Figure 2 in the Member States summary sheets presents for groundwater the trends of all stations common to the two periods ("All stations" pie chart).
Figure 4 in the Member States summary sheets presents for fresh surface water (rivers and lakes) the trends of all stations common two the two periods ("All stations" pie chart).
Classification
Water quality data are classified into different categories in order to be presented in tables, figures and maps. The categories used to classify groundwater and surface water are presented in the following tables.
Table A2. Groundwater categories for average and maximum nitrate concentrations
|
Classification
|
Legend in MS Summary sheets and the SWD
|
|
< 25
|
< 25
|
|
≥25 and <40
|
25-40
|
|
≥40 and <50
|
40-50
|
|
≥ 25
|
≥ 25
|
|
≥ 40
|
≥ 40
|
|
≥ 50
|
≥ 50
|
Change between current and previous reporting period
Changes in an indicator (e.g. animal number or nutrient use) between the current and previous reporting period are calculated as follows:
[(average 2012–2015) – (average 2008–2011)]/[(average 2008–2011)] x 100%
Table A3. Surface water categories for average and maximum nitrate concentration
|
Classification
|
Legend in MS Summary sheets and the SWD
|
|
< 2
|
< 2
|
|
≥2 and <10
|
2-10
|
|
≥10 and <25
|
10-25
|
|
≥25 and <40
|
25-40
|
|
≥40 and <50
|
40-50
|
|
≥25
|
≥ 25
|
|
≥40
|
≥ 40
|
|
≥ 50
|
≥ 50
|
Table A4. Groundwater and surface water categories for trends in nitrate concentration
|
Classification
|
Legend in MS Summary sheets and the SWD
|
Category
|
Aggregated category
|
|
< -5
|
< -5
|
Strong decrease
|
Decreasing
|
|
>=-5 and <-1
|
-5 to -1
|
Light decrease
|
|
|
>=-1 and <1
|
-1 to 1
|
Stable
|
Stable
|
|
>=1 and <5
|
1 to 5
|
Light increase
|
Increasing
|
|
≥5
|
≥5
|
Strong increase
|
|
Regional aggregation
Data from Flanders and Wallonia are aggregated to Belgium, and data from England, Wales, Scotland and Northern Ireland are aggregated to United Kingdom.
Nitrate Vulnerable Zones
The information is based on the NVZ-shapefiles delivered by Member States.
Eutrophication
Member States submit the ND eutrophication status of surface waters. Valid values are Ultra-oligotrophic, Oligotrophic, Mesotrophic, Eutrophic and Hypertrophic. Only if this set of values were reported, the eutrophication data was used for standardised processing of figures and maps in MS summary sheets and the SWD report. The standard processing includes the pie diagrams (figures 5 and 6) in the MS summary sheets and the frequency diagrams and maps in the SWD report.
In some cases other classifications were used (Non Eutrophic, Non-eutrophic, No eutrophication, Unpolluted, Intermediate, May become eutrophic, Potential Eutrophic and Potentially Eutrophic). These data were only used for non-standard tables in the MS summary sheets.
Some Member States did not submit eutrophication status at all.
The water quality parameters to assess the eutrophication status show a large variation between Member States. For fresh waters (rivers and lakes), the most used parameters (nearly 50% of Member States) are total phosphorus and chlorophyll-a. Other parameters that are used regularly (between 10 and 40% of Member States) are ortho-phosphate, total nitrogen, nitrate, plankton, phytobenthos and macrophytes. Parameters used occasionally (less than 10% of Member States) are ammonium, oxygen, organic matter, nitrite and transparency. For saline waters (mainly transitional and coastal waters), the most used parameters (10 to 25%) are total phosphorus, total nitrogen, nitrate, oxygen and chlorophyll-a. Parameters used occasionally (less than 10% of Member States) are ammonium, nitrite and macroalgae.
Eutrophication status
|
MS
|
Rivers
|
Lakes
|
Transitional
|
Coastal
|
Marine
|
|
ND trophic state
|
|
|
|
|
|
AT
|
v
|
v
|
|
|
|
|
BE-F
|
v
|
v
|
v
|
|
|
|
BE-W
|
v
|
|
|
|
|
|
BG
|
v
|
v
|
|
v
|
|
|
CY
|
v
|
|
|
|
|
|
CZ
|
v
|
|
|
|
|
|
EL
|
v
|
v
|
|
|
|
|
ES
|
v
|
v
|
v
|
v
|
|
|
FI
|
v
|
v
|
|
v
|
|
|
HR
|
v
|
v
|
|
|
|
|
IE
|
v
|
v
|
|
|
|
|
IT
|
v
|
v
|
v
|
v
|
v
|
|
LT
|
v
|
v
|
v
|
|
|
|
LU
|
v
|
|
|
|
|
|
LV
|
v
|
v
|
v
|
v
|
v
|
|
MT
|
v
|
v
|
v
|
v
|
|
|
PL
|
v
|
v
|
v
|
v
|
|
|
PT
|
v
|
v
|
|
|
|
|
RO
|
v
|
v
|
v
|
v
|
v
|
|
SE
|
v
|
v
|
|
|
|
|
SI
|
v
|
v
|
|
v
|
|
|
SK
|
v
|
|
|
|
|
|
UK-NI
|
v
|
v
|
v
|
v
|
|
|
Other classification
|
|
|
|
|
|
EE
|
v
|
v
|
|
v
|
|
|
HU
|
v
|
v
|
|
|
|
|
NL
|
v
|
v
|
v
|
v
|
|
|
IE
|
|
|
v
|
v
|
|
|
No data
|
|
|
|
|
|
|
DE
|
|
|
|
|
|
|
DK
|
|
|
|
|
|
|
FR
|
|
|
|
|
|
|
UK-EN
|
|
|
|
|
|
|
UK-WA
|
|
|
|
|
|
|
UK-SC
|
|
|
|
|
|
Country codes of Member States
|
Austria
|
AT
|
|
Belgium
|
BE
|
|
Bulgaria
|
BG
|
|
Cyprus
|
CY
|
|
Czech Republic
|
CZ
|
|
Germany
|
DE
|
|
Denmark
|
DK
|
|
Estonia
|
EE
|
|
Greece
|
EL
|
|
Spain
|
ES
|
|
Finland
|
FI
|
|
France
|
FR
|
|
Croatia
|
HR
|
|
Hungary
|
HU
|
|
Ireland
|
IE
|
|
Italy
|
IT
|
|
Lithuania
|
LT
|
|
Luxembourg
|
LU
|
|
Latvia
|
LV
|
|
Malta
|
MT
|
|
Netherlands
|
NL
|
|
Poland
|
PL
|
|
Portugal
|
PT
|
|
Romania
|
RO
|
|
Sweden
|
SE
|
|
Slovenia
|
SI
|
|
Slovakia
|
SK
|
|
United Kingdom
|
UK
|
Eurostat glossary
Animal categories
The livestock unit, abbreviated as LSU (or sometimes as LU), is a reference unit which facilitates the aggregation of livestock from various species and age as per convention, via the use of specific coefficients established initially on the basis of the nutritional or feed requirement of each type of animal (see table below for an overview of the most commonly used coefficients). The reference unit used for the calculation of livestock units (=1 LSU) is the grazing equivalent of one adult dairy cow producing 3,000 kg of milk annually, without additional concentrated foodstuffs.
Cattle refers to domestic animals of the species Bos taurus (cattle and water buffalo Bubalus bubalis together are called bovines). A distinction can be made by the age of the animal (less than one year old, aged between one and two years, and two years and over), with a further division between male and female cattle. Female cattle aged two years and over is divided into heifers (that have not yet calved) and cows. The latter are further divided into dairy cows and others.
A dairy cow is a cow kept exclusively or principally for the production of milk for human consumption and/or other dairy produce, including cows for slaughter (whether fattened or not between last lactation and slaughter).
A pig is a domesticated animal of the species Sus. A distinction is made between pigs, piglets, fattening pigs and breeding pigs.
Poultry, in the context of European Union (EU) statistics, refers to domestic birds of the species: Gallus gallus (hens and chickens); Meleagris spp. (turkeys); Anas spp. and Cairina moschata (ducks); Anser anser dom. (geese); Coturnix spp. (quails); Phasianus spp. (pheasants); Numida meleagris dom. (guineafowl); Columbinae spp. (pigeons); Struthio camelus (ostriches). It excludes, however, birds raised in confinement for hunting purposes and not for meat production.
Sheep are domesticated animals of the species Ovis aries kept in flocks mainly for their wool or meat. Sheep (of all ages) are divided into: Breeding females – which are female sheep (called ewes) and other sheep - all sheep other than breeding females.
Area
Agricultural area, abbreviated as AA, (or utilised agricultural area abbreviated as UAA) describes the area used for farming. It includes the land categories: arable land; permanent grassland; permanent crops; other agricultural land such as kitchen gardens (even if they only represent small areas of total UAA). The term does not include unused agricultural land, woodland and land occupied by buildings, farmyards, tracks, ponds, etc.
Land cover refers to the observed (bio)physical cover of the Earth's surface.
Nitrogen balance
The gross nitrogen balance is an
agri-environmental indicator
(AEI) calculated from the total inputs minus total outputs to the soil. The gross nitrogen balance per ha is derived by dividing the total gross nitrogen balance by the reference area. The reference area is the sum of
arable land
(L0001),
permanent grassland
(L0002) and
land under permanent crops
(L0003). Data on these areas can be found in Eurobase (
apro_cpp_luse
))
The inputs of the gross nitrogen balance are:
·Fertilisers:
-
inorganic fertilisers
;
- other
organic fertilisers
(not including manure).
·Gross manure input:
- manure production: animal excretion;
- manure withdrawals: manure export, manure processed as industrial waste, non-agricultural use of manure, other withdrawals;
- change in manure stocks;
- manure import.
·Other inputs:
- seeds and planting material;
- biological nitrogen fixation by leguminous crops (like clover, soya beans etc) and free living organisms;
- atmospheric nitrogen deposition.
The outputs of the gross nitrogen balance are:
·total removal of nitrogen with the harvest of crops (cereals, dried pulses, root crops, industrial crops, vegetables, fruit, ornamental plants, other harvested crops);
·total removal of nitrogen with the harvest and grazing of fodder (fodder from arable land, permanent and temporary pasture consumption);
·crop residuals removed from the field.
The Net Nitrogen Balance is the Gross Nitrogen Balance minus Total nitrogen emissions
Gross phosphorus balance
The gross phosphorus balance is an
agri-environmental indicator
(AEI) calculated from the total inputs minus total outputs to the soil. The gross phosphorus balance per ha is derived by dividing the total gross phosphorus balance by the reference area. The reference area is the sum of
arable land
(L0001),
permanent grassland
(L0002) and
land under permanent crops
(L0003). Data on these areas can be found in Eurobase (
apro_cpp_luse
)).
The inputs of the gross phosphorus balance are:
·Fertilisers:
-
inorganic fertilisers
;
- other
organic fertilisers
(not including manure).
·Gross manure input:
- manure production: animal excretion;
- manure withdrawals: manure export, manure processed as industrial waste, non-agricultural use of manure, other withdrawals;
- change in manure stocks;
- manure import.
·Other inputs:
- seeds and planting material;
- atmospheric phosphorus deposition.
The outputs of the gross phosphorus balance are:
·total removal of phosphorus with the harvest of crops (cereals, dried pulses, root crops, industrial crops, vegetables, fruit, ornamental plants, other harvested crops);
·total removal of phosphorus with the harvest and grazing of fodder (fodder from arable land, permanent and temporary pasture consumption);
·crop residuals removed from the field.
EUROPEAN COMMISSION
Brussels, 4.5.2018
SWD(2018) 246 final
COMMISSION STAFF WORKING DOCUMENT
Accompanying the document
Report from the Commission to the Council and the European Parliament
on the implementation of Council Directive 91/676/EEC concerning the protection of waters against pollution caused by nitrates from agricultural sources based on Member State reports for the period 2012-2015
{COM(2018) 257 final}
SECTION VIII
MEMBER STATES SUMMARY SHEETS
In this section Member States summary sheets are presented, including information on water quality and trends, as well as main highlights on pressures from agriculture, nitrate vulnerable zones and controls of compliance with the measures in the action programmes.
Unless otherwise specified, all information on water quality is based on the analysis of the digital data provided by Member States. Section VII includes a Methodological Annex providing details on the methodology followed to estimate the figures presented in the Member States Summary Sheets.
It is to be noted that both comparability across EU Member States and between reporting periods has to be considered indicative for several reasons. For instance, Member States have used different methodologies for the assessment of the trophic status and, in some cases, for a given Member State the methodology used changed between the 2008-2011 and 2012-2015 reporting periods. In addition, information on reference conditions is needed to provide a complete picture on eutrophication. Moreover, the monitoring networks set by the Member States have also been submitted to different degree of changes since the previous reporting period.
The information on pressure from agriculture in the Member States summary sheets (including animal numbers and mineral and manure N use) is based on the written reports submitted by Member States. However, in order to ensure comparability among Member States and to provide a reference for EU, Eurostat data have also been used in the Commission report
.
As regards nitrates vulnerable zones, unless otherwise specified in the text, the figures refer to the designations in force at end of 2015.
1.
Water quality
Water monitoring stations
|
Description
|
Stations with measurements
|
Stations with trends
|
|
Total groundwater stations
|
1965
|
1906
|
|
Total fresh surface water stations
|
108
|
107
|
|
Total saline surface water stations
|
Not relevant
|
Not relevant
|
Table 1. Number of water monitoring stations
Groundwater quality
Nitrates concentration
Trends in nitrates concentration


Figure 2. Percentage of stations with decreasing, stable or increasing trends in average groundwater nitrate concentrations between the reporting periods 2008-2011 and 2012-2015.
Figure 1. Percentage of groundwater stations with average values equal to or exceeding 25, 40 or 50 mg nitrate per L during the current and previous reporting periods. Results are presented for all groundwater stations (at different depths).
Surface water quality
Nitrates concentration
Trends in nitrates concentration


Figure 4. Percentage of stations with decreasing, stable or increasing trends in fresh surface water nitrate concentrations between the reporting periods 2008-2011 and 2012-2015.
Figure 3. Percentage of fresh surface water stations with average values equal to or exceeding 25, 40 or 50 mg nitrate per L on average during 2012-2015 and the previous reporting periods.
Eutrophication
Fresh waters
Eutrophication in rivers is assessed with the biological quality parameter phytobenthos, using the Water Framework Directive (WFD) classification. For this reporting period, data covering 2013-2015 were used. For the previous reporting period, data covering 2010-2012 were used. The WFD classification was derived from the comparison of the current ecological status with the trophic ground state (region specific reference state). The Nitrate Directive classification considers the trophic state only without reference to the trophic ground state. It distinguishes oligotrophic, mesotrophic and eutrophic.
The trophic state of lakes is based on phytoplankton, according to the WFD methodology. The assessment for the current reporting period is based on the data covering 2012-2014. The ecological status was reclassified to trophic status in a similar manner as described above for rivers.

Figure 5. Fresh water ND eutrophication classification during the previous and current reporting period.
Saline waters
Not relevant.
Main findings of monitoring programmes in line with Article 5 (6) of the Directive
The Austrian monitoring network was adapted to the WFD guidelines in 2006. Depending on the objective, three types of monitoring are distinguished: overview, operational and specific research. Rivers are sampled monthly on physical and chemical parameters, and every three years once per year on biological parameters. Lakes are sampled every three months on physical, chemical parameters and phytoplankton, and every six years on other biological parameters.
Approximately 50% of the groundwater monitoring network is located in agricultural areas, but this varies per region. In general, regions with a high environmental risk (nutrients pressure by agriculture or environmental pressure from other sources) have a higher station density than regions with a low environmental risk. The groundwater stations are sampled four times a year, but the frequency may decrease to one or two samples a year when there is only a small risk that the water quality standards are not met.
Pressure from agriculture
The total agricultural area decreased by 5% between 2013 and 2010, mainly due to the smaller area of permanent grassland. Between 2010 and 2014, the number of cattle and pigs decreased by 3% and 8%, respectively, while the number of poultry increased by 7%. This is also represented by the nitrogen excretion which shows similar small changes. The annual use of nitrogen from livestock decreased by 4% between 2010 and 2013, while the use of mineral fertilizer nitrogen increased by 3%.
Due to the high proportion of extensively used mountain pastures, the report also presents nitrogen use, excluding the mountain pastures. The annual use of nitrogen from livestock is 60 kg (including mountain pastures) and 74 kg (excluding mountain pastures) N/ha. For mineral nitrogen these figures are 99 and 121 kg N/ha, respectively.
The gross nitrogen balance (OECD) was 32 kg/ha for the 2012-2014 period, which is slightly up from the previous 2008-2011 period at 28 kg/ha. The annual trend from 2007 onwards shows a more or less stable trend with some annual variation.
Controls
All farms that receive payments under CAP are checked administratively whether they comply with the nitrogen standard of 170 kg/ha per year. Out of these farms at least 1% of the farms are checked on site. Additional controls were carried out on nearly 10% of the farms within the agro-environmental ÖPUL program, which includes approximately 85% of the agricultural area, excluding mountain pastures. For the ÖPUL measures on soil and water quality the proportion of infringement was 2.6%, which were mainly classified as light infringements (details were not reported).
Designation of nitrate vulnerable zones (NVZs)
Austria adopts a whole territory approach (83,879 km2).
Water quality
Water monitoring stations
|
Description
|
Stations with measurements
(nitrate)
|
Stations with trends
(nitrate)
|
|
Total groundwater stations
|
2071
|
1979
|
|
Total fresh surface water stations
|
768
|
756
|
|
Total saline surface water stations
|
0
|
0
|
Table 1. Number of water monitoring stations
Groundwater quality
Nitrates concentration
Trends in nitrates concentration


Figure 2. Percentage of stations with decreasing, stable or increasing trends in average groundwater nitrate concentrations between the reporting periods 2008-2011 and 2012-2015.
Figure 1. Percentage of groundwater stations with average values equal to or exceeding 25, 40 or 50 mg nitrate per L during the current and previous reporting periods. Results are presented for all groundwater stations (at different depths).
Surface water quality
Nitrates concentration
Trends in nitrates concentration


Figure 4. Percentage of stations with decreasing, stable or increasing trends in fresh surface water (rivers only) nitrate concentrations between the reporting periods 2008-2011 and 2012-2015.
Figure 3. Percentage of fresh surface water stations (rivers only) with average values equal to or exceeding 25, 40 or 50 mg nitrate per L on average during 2012-2015 and the previous reporting periods.
Eutrophication
Fresh waters
Eutrophication in rivers and lakes is assessed according to the WFD methodology, using summer average total phosphorus concentrations. The threshold values depend on the water category; Flanders distinguishes two river and five lake categories.

Figure 5. Fresh water eutrophication classification during the previous and current reporting period.
Aggregated values for 2008-2011, Eutrophic and Hypertrophic: 82%
Aggregated values for 2012-2015, Eutrophic and Hypertrophic: 76%
Saline waters
Transitional waters are assessed with winter average concentrations of nitrate, nitrite and ammonium. Eutrophication of coastal and marine waters is reported by the federal authorities.

Figure 6. Saline water eutrophication classification during the previous and current reporting period (transitional waters only).
Aggregated values for 2008-2011, Eutrophic and Hypertrophic: 100%
Aggregated values for 2012-2015, Eutrophic and Hypertrophic: 100%
Main findings of monitoring programmes in line with Article 5 (6) of the Directive
Surface water monitoring is organised by the Vlaamse Milieumaatschappij, which maintains a specific agricultural network of approximately 800 sites in areas with predominantly agricultural pollution sources. Each site is sampled once a month on nitrate. Sites with consistent low values are only sampled three times a year. Since 2007, the surface water monitoring network was extended within the WFD framework with some 240 additional stations that are monitored for a range of eutrophication parameters.
The current groundwater monitoring network is used since 2004, with currently around 2,100 monitoring sites in the agricultural areas of Flanders. All sites are sampled twice a year. Flanders has developed a system of 38 Hydrological Homogeneous Zones, which indicates the potential sensitivity for nitrate leaching. The density of monitoring sites is related to the sensitivity for nitrate leaching, and varies from 200 ha of agricultural land per monitoring point in most sensitive areas to 1,133 ha of agricultural land per monitoring point for the least sensitive areas.
Pressure from agriculture
The total agricultural area remained stable since the previous reporting period, with a small reduction of permanent pasture (-4%) and small increase of perennial crops (+4%). Farm numbers continued to decrease, 5% in the current reporting period, compared to the previous reporting period. The use of nitrogen from manures decreased with 5%, while the use of mineral fertilizers remained at the same level. Cattle numbers decreased slightly (-2%), while pig and poultry numbers increased by 3% and 14%, respectively. Longer term trends, since 1996, show gradual decreases in the number of cattle. Pigs and poultry showed a decrease until reporting period 3 (2004-2007), but increased again since then. This increase is due to the possibility to extend the farm size in combination with proven manure treatment and export. The total nitrogen excretion from cattle and pigs remained almost stable, while the excretion from poultry increased by 14%. The increased manure production did not create additional agricultural pressure on soils as it needed to be processed and exported.
Controls
The number of annual controls on manure and fertiliser application between 2012-2015 varied from 633 to 1,909 with 10 to 15% infringements. The main infringements were on low emission application technique, application near water courses and on-field manure storage (which is prohibited during the winter). Other controls focused on illegal discharge of manures (66 to 100 annual controls with 38 to 49% infringements), manure transport (1,240 to 1,577 annual controls with 7 to 15% infringements).
Annual average soil nitrate residues (90 cm) in autumn were on average between 52 and 66 kg N/ha for the 2012-2015 period, compared to 66 to 90 kg N/ha for the 2008-2011 period. The longer term trend, since 2004, also shows a gradual decline in residual nitrate. The amount of treated and exported manure has increased from 16 kt N in 2007 to 39 kt N in 2014, which was mainly caused by an increasing amount of treated pig manure and exported poultry manure. The total area of farmland under agro-environmental schemes that contribute to decreased nutrient loads to ground- and surfacewaters increased from around 18,000 ha in 2000 to around 34,000 ha in 2010. Since then the area under agreements has decreased again until 23,000 ha in 2014.
Designation of nitrate vulnerable zones (NVZs)
Flanders adopts a whole territory approach (13,522 km2). Since 2011, Flanders uses focus areas to indicate areas with poor surface water quality (based on the evaluation of the exceedance of the threshold of 50 mg nitrate per L) or poor groundwater quality (based on the evaluation of the zonal groundwater goals by means of a trend analysis in relation to the threshold of 50 mg nitrate per L). The focus areas are designated on an annual basis. The total focus area comprised 265,000 ha in 2011-2012, and 238,000 ha in 2015.
Water quality
Water monitoring stations
|
Description
|
Stations with measurements
|
Stations with trends
|
|
Total groundwater stations
|
866
|
857
|
|
Total fresh surface water stations
|
67
|
64
|
|
Total saline surface water stations
|
Not relevant
|
Not relevant
|
Table 1. Number of water monitoring stations
The fresh surface water stations are located in rivers, including dam reservoirs. Dam reservoirs are considered as ‘heavily modified rivers’ under Water Framework Directive (WFD) classification.
Groundwater quality
Nitrates concentration
Trends in nitrates concentration


Figure 2. Percentage of stations with decreasing, stable or increasing trends in average groundwater nitrate concentrations between the reporting periods 2008-2011 and 2012-2015.
Figure 1. Percentage of groundwater stations with average values equal to or exceeding 25, 40 or 50 mg nitrate per L during the current and previous reporting periods. Results are presented for all groundwater stations (at different depths).
Surface water quality
Nitrates concentration
Trends in nitrates concentration


Figure 4. Percentage of stations with decreasing, stable or increasing trends in fresh surface water nitrate concentrations between the reporting periods 2008-2011 and 2012-2015.
Figure 3. Percentage of fresh surface water stations with average values equal to or exceeding 25, 40 or 50 mg nitrate per L on average during 2012-2015 and the previous reporting periods.
The Walloon authorities report that average nitrate concentrations in dam reservoirs (2014) are always lower than 10 mg/L.
Eutrophication
Fresh waters
Eutrophication in rivers is assessed according to the WFD methodology, using annual average orthophosphate and total phosphate concentrations of rivers. Wallonia applies two type-specific threshold values for eutrophication, depending on slope, location, size and soil type.
For dam reservoirs, Wallonia classifies the eutrophication status in two classes, i.e. “good or better” and “average or worse”, with a threshold value of 25 µg/L for chlorophyll-a. The methodology is currently being revised according to WFD standards, but not implemented yet. The Walloon authorities report that 11 out of the 12 dam reservoirs were classified as “good or better” in the previous and current Reporting period.

Figure 5. Fresh water eutrophication classification during the previous and current reporting period.
Aggregated values for 2008-2011, Eutrophic and Hypertrophic: 50%
Aggregated values for 2012-2015, Eutrophic and Hypertrophic: 8%
Saline waters
Not relevant
Main findings of monitoring programmes in line with Article 5 (6) of the Directive
Water monitoring is organised by the Direction Générale Opérationnelle Agriculture, Ressources naturelles et Environnement (DGARNE). Water quality data are coming directly from measurements of DGARNE (30%) and from drinking water producers (70%). There is a large variation in monitoring frequency, from once every four years for small catchments to 12 per year for large catchments. The ND and WFD monitoring network have been standardized so that the same monitoring stations are used. 33 stations were removed from the network for various reasons such as inaccessibility, retirement of drinking water production and inconsistency of some results.
Pressure from agriculture
The total agricultural area remained stable, but there was a shift from pasture (-12%) to arable land (+12%). The use of organic nitrogen from manures decreased with 5%, while there was a 5% increase of mineral fertilizer nitrogen. Cattle, pig and poultry numbers decreased by 5%, 6% and 2%, respectively.
Long-term (past 15 to 25 years) statistical and modelling analysis of national nitrogen and phosphorus flows have been included in the report, and show consistent reductions in nutrient inputs, nutrient surpluses and discharges to water bodies. The main developments in agriculture that are considered to be favourable for the reduction of nitrogen losses are a high participation in agri-environmental measures (eg. natural grassland, hedges, extensive cropping), a lower use of mineral fertilizers, and an increasing number of soil and manure analyses to support nutrient efficient farm management. An unfavourable development is the increasing proportion of temporary grasslands.
Controls
The proportion of farms visited in the current reporting period was 1% (cross compliance). The proportion of compliance varied from 82 to 97% for the several measures in the Code of Good Agricultural Practice, and from 89 to 100% for the AP. Most infringements were related to storage capacity and the limitation of 170 kg N/ha from livestock manure.
In addition to cross compliance checks, the authorities measure nitrate in the soil (APL: potential leachable nitrogen) of three fields per farm on 5% of the farms in NVZs. The proportion of samples that were compliant with the soil- and crop-specific reference levels varied between 82 and 87% for the 2012-2015 period.
Designation of nitrate vulnerable zones (NVZs)
Wallonia’s NVZs covered 9,596 km2, which is 57% of the territory and 69% of the utilised agricultural area. In 2013, the NVZ was extended from 7,072 to 9,596 km2 (+36%). The Wallonia report states that some errors in codes of NVZs have been corrected since the last reporting period (some monitoring stations were allocated to the wrong NVZ).
Water quality
Water monitoring stations
|
Description
|
Stations with measurements
|
Stations with trends
|
|
Total groundwater stations
|
-
|
-
|
|
Total fresh surface water stations
|
-
|
-
|
|
Total saline surface water stations
|
10
|
10
|
Table 1. Number of water monitoring stations (6 coastal and 4 marine stations)
Surface water quality
The nitrate concentration is less than 2 mg/l for all coastal and marine stations.
Eutrophication
Saline waters
The Belgian Federal report presents the water quality of coastal and marine waters. The nitrogen (winter concentration) sources for the Belgian coastal waters are the Schelde and small Belgian rivers (28%), Rijn and Maas (17%), Seine and other French rivers (9%) and Thames (<1%) rivers, western and northern Atlantic waters (27%), and atmospheric deposition (19%). Nitrogen and phosphorus loads from the Belgian territory to the coastal waters are pre-dominantly coming from the Schelde (80%).
There are ten monitoring stations used for OSPAR and WFD monitoring. Three of these stations are used for eutrophication assessment, and are analysed on chlorophyll, total nitrogen and phosphorus and the N/P ratio. For phytoplankton, the threshold value for a good ecological status is 15 µg/l (chlorophyll P90 during the growing season, for a period of six years). Between 2009-2014 the average value was 17 µg/l (moderate status). The threshold values for nitrogen and phosphorus are 15 and 0.8 µmol/l, respectively. During the period 2009-2014, the overall average values were 29.8 and 0.8 µmol/l, respectively (moderate status). Nitrogen concentrations were consistently higher than the threshold value, whereas phosphorus concentrations were lower than the threshold in 2011 and 2014.
Longer term trends (2003-2011) show increasing concentrations of chlorophyll, but this is attributed to hydrometeorological variations. Long term (1990-2014) trends for nitrogen concentrations show a reduction, but with large inter annual variations. For phosphorus, the concentrations are rather stable.
Water quality
Water monitoring stations
|
Description
|
Stations with measurements
|
Stations with trends
|
|
Total groundwater stations
|
406
|
359
|
|
Total fresh surface water stations
|
318
|
289
|
|
Total saline surface water stations
|
6
|
3
|
Table 1. Number of water monitoring stations
Groundwater quality
Nitrates concentration
Trends in nitrates concentration


Figure 2. Percentage of stations with decreasing, stable or increasing trends in average groundwater nitrate concentrations between the reporting periods 2008-2011 and 2012-2015.
Figure 1. Percentage of groundwater stations with average values equal to or exceeding 25, 40 or 50 mg nitrate per L during the current and previous reporting periods. Results are presented for all groundwater stations (at different depths).
Surface water quality
Nitrates concentration
Trends in nitrates concentration


Figure 4. Percentage of stations with decreasing, stable or increasing trends in fresh surface water nitrate concentrations between the reporting periods 2008-2011 and 2012-2015.
Figure 3. Percentage of fresh surface water stations with average values equal to or exceeding 25, 40 or 50 mg nitrate per L on average during 2012-2015 and the previous reporting periods.
Eutrophication
Fresh waters
Eutrophication assessment of rivers was performed using the concentrations of nitrate and ortho-phosphate. For lakes eutrophication assessment was performed using the concentrations of nitrate, total-phosphate, chlorophyll-a and transparency (Secchi-disc). The classification is carried out according to the OECD method.

Figure 5. Fresh water eutrophication classification during the previous and current reporting period.
Aggregated values for 2008-2011, Eutrophic and Hypertrophic: 20%
Aggregated values for 2012-2015, Eutrophic and Hypertrophic: 19%
Saline waters

Figure 6. Saline water eutrophication classification during the previous and current reporting period.
Aggregated values for 2008-2011, Eutrophic and Hypertrophic: 100%
Aggregated values for 2012-2015, Eutrophic and Hypertrophic: 33%
Eutrophication assessment of coastal water was performed using the concentrations of nitrate and chlorophyll-a. The eutrophication classification is based on the worst value of the eutrophication parameters
Main findings of monitoring programmes in line with Article 5 (6) of the Directive
The frequency of surface water monitoring varies between 2 and 12 times a year. Nitrate is measured 12, 12 and 4 times a year for rivers, lakes and coastal waters, respectively. The frequency of groundwater sampling was not reported.
Pressure from agriculture
When comparing the current Reporting period with the previous Reporting period, the total agricultural area decreased by 4%. The agricultural land available for manure spreading is 95% of the agricultural land, and remained constant. The permanent grassland area is 27% of the total agricultural area, but decreased by 17%. The area of perennial crops is 3% of the total agricultural land and decreased by 18%. The use of manure N increased by 7% and the use of mineral N fertilizer increased by 3%. The total number of farms decreased by 31%, while the number of farms with livestock decreased by 34%. The numbers of cattle remained constant, while the number of pigs and poultry decreased by 19% and 15%, respectively. The changes in nitrogen excretion from livestock followed the same pattern.
Controls
The total number of checks in the reporting period was 7,729 of which 4,360 took place in the NVZ. The inspections of farms are carried out in the framework of cross compliance and compliance with the Programme of Measures for Limiting and Preventing Pollution Caused by Nitrates (Action Programme).
Designation of nitrate vulnerable zones (NVZs)
The nitrate vulnerable areas (NVZ) have been defined firstly in 2003, and have been changed in 2007 and 2011. The current NVZ area is 38,352 km2, which is 34.5% of the total territory and 72% of the agricultural area. No changes have been made in the current reporting period.
This is the first report from Croatia. Therefore it does not contain information about previous periods or trends.
Water quality
Water monitoring stations
|
Description
|
Stations with measurements
|
Stations with trends
|
|
Total groundwater stations
|
126
|
0
|
|
Total fresh surface water stations
|
64
|
0
|
|
Total saline surface water stations
|
0
|
0
|
Table 1. Number of water monitoring stations
Groundwater quality
Nitrates concentration

Figure 1. Percentage of groundwater stations with average values equal to or exceeding 25, 40 or 50 mg nitrate per L during the current and previous reporting periods. Results are presented for all groundwater stations (at different depths).
Groundwater monitoring is only carried out inside NVZs.
Surface water quality
Nitrates concentration

Figure 2. Percentage of fresh surface water stations with average values equal to or exceeding 25, 40 or 50 mg nitrate per L on average during 2012-2015 and the previous reporting periods.
The report states that surface water monitoring is only carried out inside NVZs (nevertheless two surface water stations are located outside the NVZ).
Eutrophication
Fresh waters
The evaluation methodology for the trophic status, which was also used during the process of identification of vulnerable zones in Croatia, uses total phosphorus for rivers and total phosphorus and chlorophyll-a for lakes and reservoirs.

Figure 3. Fresh water eutrophication classification during the previous and current reporting period.
Aggregated values for 2012-2015, Eutrophic and Hypertrophic: 94%
Saline waters
Not reported.
Main findings of monitoring programmes in line with Article 5 (6) of the Directive
The competent authority for carrying out the monitoring is the Croatian water management company. Water monitoring is only carried out inside the NVZs. The frequency of the monitoring is not reported. The first Action Program has been introduced in the country in 2013. The assessments of implementation and effect of measures of the 1st Action programme are currently not available due to the relatively short period of implementing the Programme.
Pressure from agriculture
In the current Reporting period (2012-2015), the total agricultural area was 27,872 km2, of which 40% was permanent grassland. There were 176,276 farmers, of which 29% keep livestock. The number of cattle, pigs and poultry was 0.5, 1.5 and 12.9 million, respectively. The gross nitrogen balance for Croatia (OECD) was 27.5 and 30.3 kg N/ha in 2013 and 2014, respectively.
Controls
There were 23,648 farmers in the NVZ, of which 4,036 had livestock. The proportion of farms visited in the current reporting period was 1% per year (cross compliance). According to the report 1% of the controlled farmers meet the requirements of the Action Programme.
Designation of nitrate vulnerable zones (NVZs)
Croatia has designated approximately 9% of its territory as NVZ (5,093 km2)
Water quality
Water monitoring stations
|
Description
|
Stations with measurements
|
Stations with trends
|
|
Total groundwater stations
|
230
|
210
|
|
Total fresh surface water stations
|
13
|
10
|
|
Total saline surface water stations
|
16
|
16
|
Table 1. Number of water monitoring stations
Groundwater quality
Nitrates concentration
Trends in nitrates concentration


Figure 2. Percentage of stations with decreasing, stable or increasing trends in average groundwater nitrate concentrations between the reporting periods 2008-2011 and 2012-2015.
Figure 1. Percentage of groundwater stations with average values equal to or exceeding 25, 40 or 50 mg nitrate per L during the current and previous reporting periods. Results are presented for all groundwater stations (at different depths).
Surface water quality
Nitrates concentration
Trends in nitrates concentration


Figure 4. Percentage of stations with decreasing, stable or increasing trends in fresh surface water nitrate concentrations between the reporting periods 2008-2011 and 2012-2015.
Figure 3. Percentage of fresh surface water stations with average values equal to or exceeding 25, 40 or 50 mg nitrate per L on average during 2012-2015 and the previous reporting periods.
Eutrophication
Fresh waters
The report states that it is not possible to create a reliable eutrophication assessment model due to the intense flow fluctuation of surface waters and the extreme climate of Cyprus. In addition to nitrate analyses, a number of other analyses were carried out regarding other eutrophication parameters, e.g. biochemical oxygen demand (BOD5), total nitrogen (N-tot), total phosphorus (P-tot) and orthophosphate (P-PO4).
Notwithstanding the above doubts about a reliable eutrophication assessment, total phosphorus and orthophosphate analyses were used to classify fresh surface waters according to the ND trophic methodology. Surface waters were considered to be eutrophic, above 0.15 mg P/L or above 0.1 mg ortho-P/L.
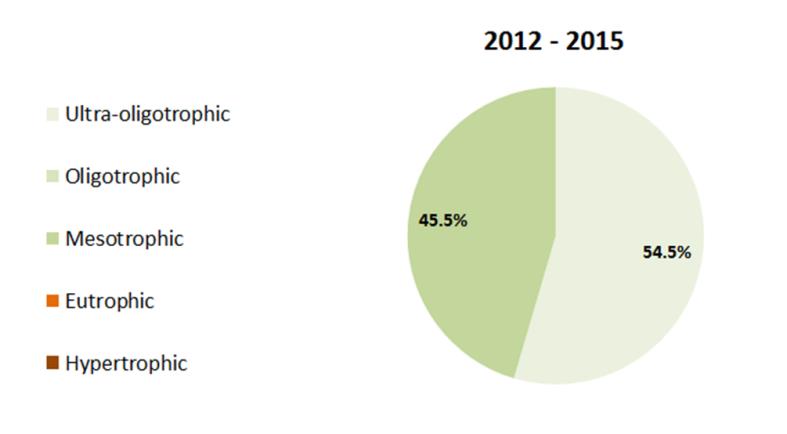
Figure 5. Fresh water eutrophication classification during the previous and current reporting period.
Aggregated values for 2012-2015, Eutrophic and Hypertrophic: 0%
Cyprus did not report on the trophic status of inland surface waters in the Reporting period 2008-2011.
Saline waters
The report states that all coastal waters have an average annual concentration of nitrate and phosphate below 2 mg/L and annual average chlorophyll-a concentration below 2 g/L.
Main findings of monitoring programmes established in line with Article 5 (6) (5-10 lines)
Three new surface water stations were added in the current Reporting period compared to the previous Reporting period, to assess the river basin located in the Orounta region, which is identified as NVZ. Two stations were removed from the coastal monitoring network as they were in close distance to other stations and because the required use of a craft to access the specific locations was not considered to be cost and time effective.
Pressure from agriculture
When comparing the current Reporting period with the previous Reporting period, there were little changes in the total agricultural area and pasture and permanent crops area. Cattle numbers increased by 4%, while pig (-18%) and poultry (-15%) showed significant reductions. The use of nitrogen from manures decreased with 10%, and mineral nitrogen fertiliser use decreased by 6%.
The reported nitrogen excretion from animals in NVZs was not completed for all NVZs and showed large changes between the current and previous Reporting period. For those NVZs that reported data, the nitrogen excretion of cattle (-29%) and pigs (-82%) decreased, while the nitrogen excretion from poultry increased more than threefold.
Controls
Controls are either carried out as administrative controls (cross-compliance) or on-site checks. In 2012, 65 farms were checked, with no penalties imposed. For 2013 and 2014 these figures were 167 (10 penalties) and 194 (2 penalties), respectively. In both Reporting periods, compliance with the Action Programme varied between 70% (manure storage and collection capacity) and 100%. During the current Reporting period soil nitrate sampling has ceased.
Designation of nitrate vulnerable zones (NVZs)
Cyprus’ NVZs covered 444 km2, which is 8% of the territory. This included the latest extension in 2011 of 25 km2.
The coastal zone of South-eastern Mesaoria is designated as a zone under examination (no further details are reported). Furthermore, it was decided that part of the Pentaschoinos river basin, covering a total area of 9 km2, will be proposed as a new vulnerable zone.
Member State: Czech Republic
Water quality
Water monitoring stations
|
Description
|
Stations with measurements
|
Stations with trends
|
|
Total groundwater stations
|
621
|
607
|
|
Total fresh surface water stations
|
1917
|
502
|
|
Total saline surface water stations
|
Not relevant
|
Not relevant
|
Table 1. Number of water monitoring stations
Groundwater quality
Nitrates concentration
Trends in nitrates concentration


Figure 2. Percentage of stations with decreasing, stable or increasing trends in average groundwater nitrate concentrations between the reporting periods 2008-2011 and 2012-2015.
Figure 1. Percentage of groundwater stations with average values equal to or exceeding 25, 40 or 50 mg nitrate per L during the current and previous reporting periods. Results are presented for all groundwater stations (at different depths).
Surface water quality
Nitrates concentration
Trends in nitrates concentration


Figure 4. Percentage of stations with decreasing, stable or increasing trends in fresh surface water nitrate concentrations between the reporting periods 2008-2011 and 2012-2015.
Figure 3. Percentage of fresh surface water stations with average values equal to or exceeding 25, 40 or 50 mg nitrate per L on average during 2012-2015 and the previous reporting periods.
Eutrophication
Fresh waters
Eutrophication assessment consisted almost exclusively of an assessment of the concentration of total phosphorus. Assessment of other indicators, such as chlorophyll-a, oxygen saturation and pH changes, was used only in cases where the assessment based on the total phosphorus fluctuated significantly year by year, and it was necessary to verify the level of eutrophication using other indicators. The trophic level of the surface waters are assessed using the distinctions between ultraoligo-, oligo-, meso-, eutro- and hypertrophic are 0.01, 0.035, 0.1 and 0.2 mg/l total phosphorus.

Figure 5. Fresh water eutrophication classification during the previous and current reporting period.
Aggregated values for 2008-2011, Eutrophic and Hypertrophic: 65%
Aggregated values for 2012-2015, Eutrophic and Hypertrophic: 65%
Saline waters
Not relevant
Main findings of monitoring programmes in line with Article 5 (6) of the Directive
Water and agriculture monitoring is organised by the Water Research Institute (VÚV) and the Crop Research Institute (VÚRV). Surface water quality data are derived from the five state river basin management enterprises (previously from the Agricultural Water Management Administration) and groundwater data from the ČHMÚ (Czech Hydrometeorological Institute) observation network.
Pressure from agriculture
The Czech Republic reports statistical data of the year 2011 to represent the previous Reporting period, and the year 2015 to represent the current Reporting period (thus no 4-year averages). The total agricultural area has remained almost constant between 2015 and 2011.
The agricultural land available for manure is 80% of the total agricultural area in the Czech Republic and decreased by 6% in 2015, compared to 2011. The permanent grassland area was 24% of the total agricultural area in 2015 and increased slightly (+1%) compared to 2011. The area of perennial crops did not change. The area of legumes increased by 6%. The total number of farms increased by 13% while the number of farms with livestock decreased by 3%. The numbers of cattle and poultry increased by 5% and 6%, respectively while the number of pigs decreased by 11% .
The use of animal manure N decreased by 9% while the use of mineral N fertilizer increased by 13%. The decrease of animal manure use is partly related to the increase of biogas plants (400 plants in 2015) which results in increasing production of digestate.
The area of the NVZs increased by 5% between the previous and current period while the agricultural land available for application of manure remained constant (17,000 km2). In NVZs, the number of farms and of farms with livestock both decreased by 18%. The number of cattle, pigs, and poultry in NVZs increased by 8%, 4% and 6%, respectively. As a result of this increase in animal numbers, the annual use of N from livestock manure increased by 7% in the NVZs.
Controls
There are 18,432 farmers in NVZs, of which 70% have livestock. It is reported that 1% of the farmers are annually checked whereas in the previous period it was 2%. It is reported that nearly all visited farmers comply with the requirements of the Action Programme and the principles of good agricultural practice. The only measure where compliance is lower than 99%, is “manure storage on farmland before land application” which has a 94% compliance rate. In the previous Reporting period, compliance was always nearly 100%.
Measurable criteria to evaluate the impact of the Action Programme are presented for the entire territory. For the current Reporting period, the number of analyses of nitrogen in manure was 0.1 per 100 farmers, the fraction of cultivated land in winter without crop cover was 37%, the average distance of agricultural land to water bodies was 2 m, and the nitrogen balance surplus was 64 kg N/ha. These figures were almost similar for the previous Reporting period.
Designation of nitrate vulnerable zones (NVZs)
The nitrate vulnerable zones have been defined in 2003, and have been changed in 2007 and 2011. The proportion agricultural land in the NVZ relative to the total agricultural land in the Czech Republic increased from 43% in 2003 to 48% in 2007, and 49% in 2011. A recent review of NVZs was carried out in 2015, and consequently new NVZs have been declared in August 2016 (50,2 % of the agricultural area).
Water quality
Water monitoring stations
|
Description
|
Stations with measurements
|
Stations with trends
|
|
Total groundwater stations
|
1201
|
1001
|
|
Total fresh surface water stations
|
177
|
138
|
|
Total saline surface water stations
|
44
|
44
|
Table 1. Number of water monitoring stations
Groundwater quality
Nitrates concentration
Trends in nitrates concentration


Figure 2. Percentage of stations with decreasing, stable or increasing trends in average groundwater nitrate concentrations between the reporting periods 2008-2011 and 2012-2015.
Figure 1. Percentage of groundwater stations with average values equal to or exceeding 25, 40 or 50 mg nitrate per L during the current and previous reporting periods. Results are presented for all groundwater stations (at different depths).
Surface water quality
Nitrates concentration
Trends in nitrates concentration


Figure 4. Percentage of stations with decreasing, stable or increasing trends in fresh surface water nitrate concentrations between the reporting periods 2008-2011 and 2012-2015.
Figure 3. Percentage of fresh surface water stations with average values equal to or exceeding 25, 40 or 50 mg nitrate per L on average during 2012-2015 and the previous reporting periods.
Eutrophication
Eutrophication caused by excessive amounts of nutrients is mainly a problem in lakes, marine waters, and large, slowly flowing rivers. In small streams, the residence time of the water is too small generally for planktonic algae to become a problem. Thus, monitoring of eutrophication indicators such as chlorophyll concentration is in Denmark only relevant in lakes, coastal waters and large rivers.
Dissolved nutrients may have an effect on benthic algae and macrophytes. Denmark has not yet established a classification scheme for deriving faunal impacts of nutrient enrichment in water courses. Therefore, Denmark has focused its environmental monitoring in streams on organic matter indicators such as BOD. In Danish water courses there is no monitoring of secchi depth, chlorophyll or other impact indicators of eutrophication.
Fresh waters
The classification of the ecological state of lakes is based on the quality elements chlorophyll, phytoplankton, macrophytes and fish. Lakes missing one or more quality elements (phytoplankton, macrophytes or fish) are downgraded from high/good to moderate ecological state, if summer mean nutrient levels exceed 0,080 mg P/l and 0,95 mg N/l (shallow lakes) or 0,042 mg P/l and 0,90 mg N/l (deep lakes).
The data reported for the eutrophication status of Danish lakes is in accordance with the classification of the ecological state of lakes in the second (2015-2021) River Basin Management Plan (RBMP).
The uploaded data for lakes consist of monitoring data from 662 lakes, of which 25% were classified as high/good and 75% as moderate/bad/poor (second river basin management plan). If a similar approach would have been used as in the previous reporting periods, i.e. classifying eutrophication status in Danish lakes based on thresholds for chlorophyll concentration, the distribution of all previously reported lakes (196), also monitored during RP6, would have shown a comparable distribution as RP5 with 35% as “high/good” and 65% as “moderate/bad/poor”, respectively.


Figure 5. Fresh water (lakes only) ecological state during the previous reporting period and according to the latest River Basin Development Plans (RBMP 2016).Classification in the RP 2008-2011 has been based on the Chlorophyll a concentration for 200 monitored lakes, whereas the classification of the ecological states of 662 lakes in the RBMP 2016 has been based on available monitoring data for the quality elements chlorophyll a, phytoplankton, macrophytes and fish.
Figure 5. Fresh water (lakes only) eutrophication classification during the previous reporting period.
Aggregated values for 2008-2011, Eutrophic and Hypertrophic: 89%

Saline waters
The report uses the average summer concentrations of chlorophyll in surface waters (0-10 m) as a proxy for eutrophication in Danish estuarine, coastal and marine open waters. The report presents a map of chlorophyll concentrations, but does not present the eutrophication status of these waters. At no station did chlorophyll a concentration increase at any time – neither from RP5 to RP6, nor from RP2 to RP6. However, it is stated that chlorophyll cannot stand alone as a proxy for eutrophication as changes in other interrelated parameters like Secchi-depth, bottom water oxygen concentration, eelgrass cover and fauna biomass are also affected during eutrophication. In Denmark, the eutrophication status for coastal waters is officially based on the Water Framework Directive, i.e. based on the status for both chlorophyll, eelgrass depth limit and a benthic fauna index, DKI using the one out-all out principle. In the Danish River Basin Management Plans 2015-21, the environmental objectives are fulfilled for 2 out of 119 estuarine/coastal water bodies ( i.e. have good or high ecological status).
Furthermore the report present a map of maximum surface (0-10 m) nitrate concentrations for the Reporting period 2012 – 2015 at 58 stations in Danish estuarine, coastal and marine open waters. Based on the reporting guidelines, the report states that nitrate concentrations <2 mg/l are considered oligotrophic, between 2-10 mg/l mesotrophic, and > 10 mg/l eutrophic. The map shows 3 estuarine and coastal stations that are eutrophic, while the other estuarine and coastal stations are mainly mesotrophic. The marine open water stations are mostly oligotrophic.
Main findings of monitoring programmes in line with Article 5 (6) of the Directive
The groundwater monitoring programme is designed to monitor recent groundwater recharged since the 1940s. Implementation of the Water Framework Directive has required adjustments of the groundwater-monitoring network and thus some monitoring points used for previous Reporting period were closed and new ones were established in the last Reporting period. The adjustments were expected to be finalised in 2016, but delayed until mid-2017.
Pressure from agriculture
The total agricultural area was slightly smaller (-2%) in the current Reporting period compared to the previous Reporting period. The number of farms decreased by 12% in that same period. Cattle and pig numbers decreased by 3% and 6%, respectively, whereas poultry numbers increased by 2%. The nitrogen excretion followed the changes in animal numbers. The use of nitrogen from manures decreased with 4% (10.000 t N) since the previous Reporting period, but this was partly compensated by a 3% increase (5.000 t N) in the use of mineral fertilizer nitrogen.
The annual surplus of the national nitrogen field balance was reduced from around 405 Mt N in 1990 to around 220 Mt N in 2014, which corresponds to a reduction of more than 40%. The most significant reduction was observed until 2003. The N surplus per ha has been reduced from 128 kg N/ha in 1990 to 80 kg N/ha in 2014. Over the past three years (2012-2014), the N surplus was 83, 79, 80 kg N/ha, respectively.
The total nitrogen discharge to the sea showed little change since RP5; the discharge from agriculture was not specified in detail but was estimated at 70% of the total.
Controls
Besides the administrative controls (including an automated Fertilizer Accounting system), 1.9% of all agricultural holdings were visited. On nearly 10% of the visited farms (2014), the fertilizer accounts and fertilizer use were not compliant with regulations. Furthermore, 3% infringements were reported on the amount of livestock manure applied to land.
Designation of nitrate vulnerable zones (NVZs)
Denmark applies a whole territory approach (43,908 km2).
Water quality
Water monitoring stations
|
Description
|
Stations with measurements
|
Stations with trends
|
|
Total groundwater stations
|
385
|
108
|
|
Total fresh surface water stations
|
324
|
116
|
|
Total saline surface water stations
|
26
|
22
|
Table 1. Number of water monitoring stations
Groundwater quality
Nitrates concentration
Trends in nitrates concentration


Figure 2. Percentage of stations with decreasing, stable or increasing trends in average groundwater nitrate concentrations between the reporting periods 2008-2011 and 2012-2015.
Figure 1. Percentage of groundwater stations with average values equal to or exceeding 25, 40 or 50 mg nitrate per l during the current and previous reporting periods. Results are presented for all groundwater stations (at different depths).
Surface water quality
Nitrates concentration
Trends in nitrates concentration


Figure 4. Percentage of stations with decreasing, stable or increasing trends in fresh surface water nitrate concentrations between the reporting periods 2008-2011 and 2012-2015.
Figure 3. Percentage of fresh surface water stations with average values equal to or exceeding 25, 40 or 50 mg nitrate per l on average during 2012-2015 and the previous reporting periods.
Eutrophication
Fresh waters
The eutrophication assessment of rivers is based on the annual average total nitrogen and total phosphorus concentrations. Limit values are specific for two river types (the third, a separate “large river” type is for Narva River) with specific class boundaries. The eutrophication assessment of lakes is based on the annual average total nitrogen, total phosphorus and chlorophyll-a concentrations. The eight different types of lakes are distinguished with specific class boundaries. The Water Framework Directive (WFD) ecological classes are re-classified into four trophic states for Nitrate Directive reporting: no eutrophication, may become eutrophic, eutrophic, and hypertrophic.
|
|
2008-2011
|
2012-2015
|
|
No Eutrophication
|
79,3%
|
88,2%
|
|
May become eutrophic
|
11,7%
|
8,1%
|
|
Eutrophic
|
8,3%
|
3,2%
|
|
Hypertrophic
|
0,7%
|
0,6%
|
Table 2. Fresh water eutrophication classification during the previous and current reporting period.
Aggregated values for 2008-2011, Eutrophic and Hypertrophic: 9%
Aggregated values for 2012-2015, Eutrophic and Hypertrophic: 4%
Saline waters
The eutrophication assessment of coastal water is based on the annual average total nitrogen, total phosphorus and chlorophyll-a concentrations, and specific class boundaries are distinguished for six coastal water types. The WFD ecological classes are re-classified into four trophic states for ND reporting: no eutrophication, may become eutrophic, eutrophic, and hypertrophic.
|
|
2008-2011
|
2012-2015
|
|
No Eutrophication
|
5,3%
|
0,0%
|
|
May become eutrophic
|
63,2%
|
46,5%
|
|
Eutrophic
|
26,3%
|
46,5%
|
|
Hypertrophic
|
5,3%
|
7,0%
|
Table 3. Saline water eutrophication classification during the previous and current reporting period.
Aggregated values for 2008-2011, Eutrophic and Hypertrophic: 32%
Aggregated values for 2012-2015, Eutrophic and Hypertrophic: 54%
Main findings of monitoring programmes in line with Article 5 (6) of the Directive
A new national groundwater monitoring sub-programme for the current reporting period was completed in 2015. It resulted in fewer groundwater monitoring points in the NVZ (115 compared to 282). Given the higher agricultural load in the NVZ, the density and monitoring frequency (up to 4 times a year) of the network of NVZ monitoring points is greater than outside the NVZ. The sampling frequency of groundwater was 1 to 4 times a year. River sampling frequency varies from 4 to 12 times a year on the stations with “continuous” monitoring. River stations for “ecological status” monitoring are sampled less frequently (once every 6 years, 4 times a year). Lakes are sampled at least once every 6 years, but some are sampled annually (11 small lakes and 2 large lakes, 4-7 times a year). The monitoring of Estonian coastal waters is carried out in 16 different coastal water bodies; the four most affected bodies of coastal water are monitored annually and the other 12 once every six years on a rotational basis.
Pressure from agriculture
The total agricultural area increased by 3%. Three-quarters of the total agricultural production of the country originates from only 5% of the total number of holdings which use more than half of the agricultural land. The total number of farms decreased by 2% and the number of livestock farms by 13%. Cattle and poultry numbers increased by 8% and 16%, respectively. The number of pigs decreased (3%). The annual use of nitrogen from animal manure has increased by 3%, and the amount of mineral N fertilizer by 12%. In NVZs, the area of permanent grassland increased by 19%.
Controls
In the Pandivere and Adavere-Põltsamaa NVZ there are 1,382 farms of which 6% were visited on average each year. Except for the manure storage (84%), 100% of the farmers comply with the requirements.
Designation of nitrate vulnerable zones (NVZs)
Estonia has designated 3,267 km2 as nitrate vulnerable zones, which is 7% of the total territory and 34% of the total agricultural area.
Water quality
Water monitoring stations
|
Description
|
Stations with measurements
|
Stations with trends
|
|
Total groundwater stations
|
187
|
187
|
|
Total fresh surface water stations
|
167
|
165
|
|
Total saline surface water stations
|
75
|
75
|
Table 1. Number of water monitoring stations
Groundwater quality
Nitrates concentration
Trends in nitrates concentration


Figure 2. Percentage of stations with decreasing, stable or increasing trends in average groundwater nitrate concentrations between the reporting periods 2008-2011 and 2012-2015.Note that only 3 stations were above 40 mg/L.
Figure 1. Percentage of groundwater stations with average values equal to or exceeding 25, 40 or 50 mg nitrate per L during the current and previous reporting periods. Results are presented for all groundwater stations (at different depths).
Surface water quality
Nitrates concentration
Trends in nitrates concentration


Figure 4. Percentage of stations with decreasing, stable or increasing trends in fresh surface water nitrate concentrations between the reporting periods 2008-2011 and 2012-2015.
Figure 3. Percentage of fresh surface water stations with average values or equal to or exceeding 25, 40 or 50 mg nitrate per L on average during 2012-2015 and the previous reporting periods.
Eutrophication
Fresh waters
The parameters used to characterize the trophic status for rivers and lakes are total nitrogen and total phosphorus, and besides for lakes chlorophyll-a. Trophic classification was checked against ecological status classification used in WFD reporting in 2016 to make sure that these two classifications are in line.

Figure 5. Fresh water eutrophication classification during the previous and current reporting period.
Aggregated values for 2008-2011, Eutrophic and Hypertrophic: 48%
Aggregated values for 2012-2015, Eutrophic and Hypertrophic: 47%
Saline waters
The parameter used to characterize the trophic status for coastal waters was mainly chlorophyll-a, but total nitrogen and total phosphorus were also used. Trophic classification was checked against ecological status classification used in WFD reporting in 2016 to make sure that these two classifications are in line.

Figure 6. Saline water eutrophication classification during the previous and current reporting period.
Aggregated values for 2008-2011, Eutrophic and Hypertrophic: 70%
Aggregated values for 2012-2015, Eutrophic and Hypertrophic: 53%
Main findings of monitoring programmes in line with Article 5 (6) of the Directive
Mainland
Monitoring network used for reporting under nitrates directive covers the whole territory. Surface waters monitoring is presented only for monitoring locations affected by agriculture (178 stations). Groundwater monitoring is presented for both locations affected by agriculture (145 stations) and 59 background stations. The frequency of the monitoring of surface waters and groundwater are not described in the report, but are available by station and year in the submitted dataset.
Pressure from agriculture
Mainland
The basic information about agriculture is reported for 2002, 2006, 2010 and 2014. The data in the current (2012-2015) and the previous Reporting period (2008-2011) are compared. The total agricultural area decreased by 1%. The total number of farmers decreased by 17% and the number of farmers with livestock decreased by 21%. Currently 31% of farmers have livestock.
The number of poultry increased by 31%. The number of cattle, pigs and others decreased by 2%, 9% and 5%, respectively. The nitrogen excretion changed accordingly. The annual use of nitrogen from livestock manure decreased by 3%, while the annual use of mineral N fertilizer decreased by 6%.
According to the report the percentage of spring cereals has decreased in favour of cereals sown in the autumn, thus increasing the cover in the winter. Cultivation of crops which reduce nitrogen loss has increased, and also investments in manure-spreading technology have increased. However the number of hectares with grass has decreased in the period 1999-2015. Leasing of field has increased to about one-third, which tend to increase application rates of manure, and can result in lower utilization of nutrients by plants. Also the imports of animal feeds have increased in the last five years (2010-2014): 457, 460, 504, 527, 584 million kg feed.
Åland
The number of animals and cropping areas is given for the years 1990 to 2013. In the current Reporting period, the agricultural area is about 14,000 ha. There were 492 farms of which 174 had livestock. In the previous Reporting period (2008-2011) the number of farms was 564 of which 194 had livestock. There were 7 licensed farms (more than 150 livestock units).
Controls
Compliance with the Nitrates Directive is carried out as part of checks on agri-environmental subsidies. The results are reported for 2006, 2010 and 2014 in which 1%, 1% and 1.5% of the farmers were audited, respectively. The compliance in 2014 varied from 85% (manure analysis) to nearly 100%. Criteria to measure compliance good agricultural practice are reported for 2002, 2004, 2006 and 2014. However most of the criteria have not been reported in 2014 (the number of nitrogen analyses per 100 livestock producers, the winter vegetation and the distance to the watercourses).
Designation of nitrate vulnerable zones (NVZs)
Finland has adopted a whole territory approach (304,086 km2).
EUROPEAN COMMISSION
Brussels, 4.5.2018
SWD(2018) 246 final
COMMISSION STAFF WORKING DOCUMENT
Accompanying the document
Report from the Commission to the Council and the European Parliament
on the implementation of Council Directive 91/676/EEC concerning the protection of waters against pollution caused by nitrates from agricultural sources based on Member States reports for the period 2012-2015
{COM(2018) 257 final}
Water quality
Water monitoring stations
|
Description
|
Stations with measurements
|
Stations with trends
|
|
Total groundwater stations
|
2598
|
2094
|
|
Total fresh surface water stations
|
3390
|
2897
|
|
Total saline surface water stations
|
8
|
3
|
Table 1. Number of water monitoring stations
Groundwater quality
Nitrates concentration
Trends in nitrates concentration


The report presents a comparison between the first (1992-1993) and last campaign (2014-2015). Overall, 49% of the monitoring stations showed an increase in average nitrate concentration while 42% of the stations showed a decrease. In NVZs, 53% of the monitoring stations showed an increase in average nitrate concentration. Outside NVZs, only 20% of the stations showed an increasing trend, while 56% showed a decreasing trend.
The average nitrate concentration in overseas areas of the French territory (Guadeloupe, Reunion, Martinique, French Guiana) was always lower than 40 mg/L.
Surface water quality
Nitrates concentration
Trends in nitrates concentration


The report presents a comparison between the first (1992-1993) and last campaign (2014-2015). Overall, 44% of the monitoring stations showed an increase in average nitrate concentration while 35% of the stations showed a decrease. In NVZs, 49% of the monitoring stations showed an increase in average nitrate concentration. Outside NVZs, 27% of the stations showed an increasing trend.
The average nitrate concentration in overseas areas of the French territory was lower than 10 mg/L for 99% of the stations.
Eutrophication
Fresh waters
In 2015, France launched a collective scientific exercise that aims to provide an understanding of causes and consequences of eutrophication phenomena. Until the results of this study are available, France retains a threshold of 18 mg nitrate per L (90% percentile) to identify vulnerable zones for eutrophication. The report presents maps for the 90 percentile above 18 mg/L for 2014-2015 and 2010-2011. Most stations above the threshold are located inside NVZs, whereas less than 2.5% of stations are outside NVZs.
The report further presents results of total phosphorus, orthophosphate, BOD5, dissolved oxygen, nitrites, and chlorophyll-a for rivers. The report concludes that eutrophication in fresh waters is only a minor problem, similar to the previous Reporting period.
Saline waters
Eutrophication parameters are measured in several networks such as REPHY (phytoplankton and phytotoxins), CEVA/RCS (opportunistic macroalgae), OSPAR monitoring network, Barcelona convention monitoring network, CEVA/RCO in Loire-Brittany, and RSL (Lagoon monitoring network). The main parameters used to assess eutrophication are phytoplankton (chlorophyll-a, abundance, species composition), macroalgae (blooms, intertidal, subtidal), and chemo-physical (dissolved oxygen, turbidity). The results of all these networks are presented in the report. The report concludes that the ecological state of French coastal water bodies is generally in good or excellent condition, with the exception of coastal water bodies of the Channel, certain areas in southern Brittany which are evaluated to be in fair condition, and the Mediterranean lagoons.
Main findings of monitoring programmes established in line with Article 5 (6) (5-10 lines)
Water quality monitoring is coordinated by DREAL (directions régionales de l’environnement, de l’aménagement et du logement); the data are provided by water agencies (agricultural monitoring network) and regional health agencies (public drinking water). Since 2010 the monitoring network was adapted under the WFD towards a general surveillance monitoring (RCS) and an operational monitoring (RCO) to assess water bodies that may not meet environmental goals. The ND monitoring includes all possible RCS stations, a selection of RCO stations that are, or may become, polluted by nitrate from agricultural sources, and the existing nitrate monitoring stations that were also monitored in previous campaigns.
Water monitoring is performed once every four years in so-called campaigns. The first campaign covered the period 1992-1993, and the sixth campaign covered 2014-2015. The average annual sampling frequency during the 2014-2015 campaign was 4.3 for groundwater (61% of stations sampled at least 4 times per year) and 9 for surface water (60% of stations sampled at least 6 times per year). The report states that data from previous reporting periods might have changed slightly due to corrections in the database.
Pressure from agriculture
In the last Reporting period, there were little changes (<=2%) in the total agricultural area and pasture and permanent crops area. The use of nitrogen from manures decreased with 3%, and there was a 6% increase in the use of mineral fertilizer nitrogen. Cattle and pig numbers decreased with 3% and 4%, respectively, while poultry numbers remained stable.
The gross national nitrogen surplus decreased from around 70 kg N/ha/yr in the early 1990s to around 50 kg N/ha/year in recent years.
Controls
Three types of controls are used to evaluate the Action Programmes: (i) Cross compliance controls (at least 1% of farmers concerned), (ii) specific compliance checks by water authorities on intercropping and buffer strips, (iii) specific installation checks (ICPE Installation Classée pour la Protection de l'Environnement) for the livestock sector such as effluent management and logbook practices.
Cross compliance sanctions related to the Nitrates Directive varied between 11 and 27% of the controlled farmers for the years 2012 to 2014.
Designation of nitrate vulnerable zones (NVZs)
France’s NVZs covered 188,793 km2, which is 34% of the territory and 68% of the utilised agricultural area. In 2012 and 2015, the NVZs were extended with 7,504 and 29,752 km2, respectively.
Water quality
Water monitoring stations
|
Description
|
Stations with measurements
|
Stations with trends
|
|
Total groundwater stations
|
697
|
692
|
|
Total fresh surface water stations
|
241
|
239*
|
|
Total saline surface water stations
|
5
|
19*
|
Table 1. Number of water monitoring stations
Groundwater quality
Nitrates concentration
Trends in Nitrates concentration


Figure 2. Percentage of stations with decreasing, stable or increasing trends in average groundwater nitrate concentrations between the reporting periods 2008-2011 and 2012-2015.
Figure 1. Percentage of groundwater stations with average values equal to or exceeding 25, 40 or 50 mg nitrate per L during the current and previous reporting periods. Results are presented for all groundwater stations (at different depths).**
Surface water quality
Nitrates concentration
Trends in Nitrates concentration


Figure 4. Percentage of stations with decreasing, stable or increasing trends (winter average) in fresh surface water nitrate concentrations between the reporting periods 2008-2011 and 2012-2015.
Figure 3. Percentage of fresh surface water stations with annual average values equal to or exceeding 25, 40 or 50 mg nitrate per L on average during 2012-2015 and the previous reporting periods.
Figure 3 is based on 239 rivers and 2 lakes with average annual nitrate measurements. Winter average nitrate measurements were available for 25 lakes, showing 48% of the stations with less than 2 mg/L, 44% between 2 and 10 mg/L and 8% between 10 and 25 mg/L. Figure 4 presents the trends of winter average values of 214 rivers and 25 lakes.
Eutrophication
Fresh waters
The eutrophication of surface waters mainly occurs due to excessive phosphorus inputs. Waters are considered eutrophic or under the risk of eutrophication when the values of good ecological status, as defined in Appendix 7 of the surface water ordinance of 20 June 2016 (BGBI, p. 1373), is exceeded. For the measurement of water quality, Germany uses a water type-specific upper phosphorus value, varying from 0.045 to 0.3 mg total P per L for rivers and 0.009 to 0.06 mg total P per L for lakes, as the target value (class II) in a 7-stage water quality classification. The water quality decreases from class I to VII.
For rivers in 2014, 35% of the monitoring stations indicated annual average values below the target value (quality class II) for total phosphorus, 56% of the monitoring stations indicated average concentrations in the range of quality class II-III and 7% of the monitoring stations fell in the range of quality class III. Five monitoring stations of transitional water and the monitoring station established at the Emscher fall in the quality classes III-IV and IV.
When comparing 2011-2014 with 1991-1994, the majority of monitoring stations show either a slight or a clear reduction in contamination. A downward trend can be seen at approximately 91% of the monitoring stations; phosphorus contamination remained steady at approximately 3% of the monitoring stations and increased to a greater or lesser extent at 6 % of stations.
For lakes in 2014, around 36% of monitoring stations indicated an annual average value below the target value (quality class II) for total phosphorus. 45% of the monitoring stations indicated average concentrations in the range of class II-III and 12% of the monitoring stations were in the range of class III. A single monitoring station indicated worse results (quality class III-IV).
Just under 75% of lakes indicated a decreasing trend of total phosphorus concentrations in the periods 1997-2000 and 2011-2014. 37% of the lakes showed a significant decrease in concentrations of more than 50%. One lake showed no change in concentrations.
Saline waters
The orientation values which are consulted in order to assess the effectiveness of reduction measures were developed on the basis of the procedures provided for under OSPAR and HELCOM. If the nutrients are between the background and orientation value there should be a good ecological status in accordance with the Water Framework Directive (WFD). If the orientation values are exceeded, eutrophication effects in accordance with the Nitrates Directive can be expected and the good ecological status under the WFD would be probably missed.
The second application of the harmonised assessment of the eutrophication status of convention waters was based on data from the period 2001-2005. The third application, based on data from 2006-2014, is currently under execution.
The results of the eutrophication assessment of the German Bight, including Wadden Sea, are reflected in the results of the survey conducted in accordance with Section 5 of the WFD based on data from the 2009-2013/14 period. Of the 16 water bodies in Lower Saxony (including water bodies shared with the Netherlands, Hamburg and Schleswig-Holstein) where the ecological status or ecological potential were assessed for transitional and coastal waters, 3 coastal water bodies indicated a moderate ecological status, 7 water bodies indicated an unsatisfactory ecological status, while 2 water bodies indicated a bad ecological status. In the estuaries, 3 transitional water bodies indicated a moderate ecological potential and one water body indicated an unsatisfactory ecological potential. Of the 13 assessed water bodies in Schleswig-Holstein, 9 indicated a moderate ecological status, 2 indicated an unsatisfactory ecological status, while 2 indicated a bad ecological status. The ecological status was primarily impaired by eutrophication effects.
With respect to the Baltic Sea, the current survey conducted according to Article 5 of the WFD was based on data from 2009-2014. Of the 21 assessed water bodies in Mecklenburg-Western Pomerania, 3 indicated a moderate ecological status, 11 indicated an unsatisfactory ecological status, while 7 indicated a bad ecological status. Of the 24 assessed water bodies in Schleswig-Holstein, 12 indicated a moderate ecological status, 4 indicated an unsatisfactory ecological status, while 8 indicated a bad ecological status. The ecological status was primarily impaired by eutrophication effects.
Main findings of monitoring programmes established in line with Article 5 (6) (5-10 lines)
The monitoring network for groundwater has been revised since the previous report in 2012. The new sites were selected on the following criteria: reflect the shallow groundwater so that its water quality reflects the land use, the distribution of land uses (settlement, forest, grassland, arable and other cropping), represent all regions, the sites should at least have data from 2008 and when possible, the sites that were included in the first to fifth Art. 10 reports, should be included. For ND reporting only the sites mainly affected by grassland, arable and other cropping were used.
The nitrate concentration in watercourses is subject to regular measurement at monitoring stations forming part of the monitoring stations networks of the Länder. Sampling is carried out at these monitoring stations at least 12 times per year and in most instances 26 times per year.
Pressure from agriculture
Agricultural pressure was reported for the years 2010 to 2015, but only completely for 2010 and 2013.When comparing 2013 with the 2010, the total agricultural area remained stable. Manure nitrogen use increased slightly (+2%) and mineral fertilizer nitrogen use increased by 1%. Farm numbers decreased, especially farms with livestock (-8%). The number of cattle remained stable, while the number of pigs increased by 5%. Pig numbers peaked in 2014. Since then both the number of holdings engaged in pig production and the number of pigs have been declining. Data about poultry in the 2010 are reported to be unreliable, not allowing a correct comparison.
The net nitrogen area-based balance shows a decreasing surplus of around 100 kg/ha in the early 1990s to around 52 kg/ha in 2014. The report also present regional N surpluses which show relative high surpluses in the northwest, up to 100 kg/ha in some individual years of the current Reporting period.
Controls
The measures of the AP are also checked within Cross compliance regulations. Checks are carried out on random and risk oriented basis, often additional after complaints. In 2014 4,112 (1.3% of all farms) on-site checks were carried out, of which 16% showed minor infringements of measures under cross compliance. Major infringements were found on 0.4% of the checked farms.
Designation of nitrate vulnerable zones (NVZs)
Germany adopts a whole territory approach (357,376 km2).
Water quality
Water monitoring stations
|
Description
|
Stations with measurements
|
Stations with trends
|
|
Total groundwater stations
|
1078
|
0
|
|
Total fresh surface water stations
|
479
|
0
|
|
Total saline surface water stations
|
0
|
0
|
Table 1. Number of water monitoring stations
There were no stations with trend values.
Groundwater quality
Nitrates concentration

Figure 1. Percentage of groundwater stations with average values equal to or exceeding 25, 40 or 50 mg nitrate per L during the current and previous reporting periods. Results are presented for all groundwater stations (at different depths).
Surface water quality
Nitrates concentration

Figure 2. Percentage of fresh surface water stations with average values equal to or exceeding 25, 40 or 50 mg nitrate per L on average during 2012-2015 and the previous reporting periods.
Eutrophication
Fresh waters
Eutrophication in rivers was assessed using concentrations of NO3, NH4, total P and BOD5. The trophic level of the rivers was assessed using the distinctions between oligo-, meso-, eutrotrophic. Values in the range 0.3-5.0 mg/l N-NO3, 0.1-0.8 mg/l N-NH4, 0.1-0.2 mg/l P and 1.0-4.0 mg/l BOD5 are considered mesotrophic, while values below or above these ranges are considered oligotrophic or eutrophic, respectively.
Eutrophication of lakes was assessed using concentration of total N, total P, and chlorophyll-a. The trophic level of the lakes was assessed using the distinctions between oligo-, meso-, eutrotrophic. Values in the range 0.1-1 mg/l N, 0.01-0.03 mg/l P and 2-10 mg/l chlorophyll-a are considered mesotrophic, while values below or above these ranges are considered oligotrophic or eutrophic, respectively.

Figure 5. Fresh water eutrophication classification during the previous and current reporting period..
Note that Greece only uses oligotrophic, mesotrophic and eutrophic.
Saline waters
Not reported.
Main findings of monitoring programmes in line with Article 5 (6) of the Directive
Surface water monitoring is based on the National Water Monitoring Network and funded by the Operational Programme “Environment and Sustainable Development”. Compared to the previous reference period, the number of monitoring network sites has increased significantly.
Pressure from agriculture
In the current Reporting period, the total agricultural area increased by 6%, compared to the previous Reporting period (Eurostat). The area reported in the art. 10 report is probably not correctly reported. According to the previous Reporting period the total agriculture area was 30,590 km2. Compared to the previous Reporting period, the use of nitrogen from manures decreased by 12% in the current Reporting period. The annual use of mineral fertilizer N was not reported for the current period. The number of cattle, pigs and sheep and goats decreased by 32%, 78%, 69%, respectively and the number of poultry increased by 47%. The total number of farmers decreased by 23%. In the current Reporting period 15% of the farmers had livestock and the total number decreased by 8%.
The total areas, agricultural areas and the excretion of nitrogen are reported for all the 29 individual NVZs. For 7 NVZs data about the current and previous Reporting period are presented. These 7 NVZs represent 75% of the total area of all NVZ's. The excretion of manure nitrogen has increased in all individual 7 NVZs. The excretion data in some of these NVZs are very uncertain due to the very large variations between Reporting periods.
Controls
Not reported.
Designation of nitrate vulnerable zones (NVZs)
In 1999, 4 NVZs were designated. Between 2008 and 2014 the number of NVZs was expanded to 29 areas. The current NVZs represent 42,260 km2, of which 12,691 km2 is agricultural area.
Water quality
Water monitoring stations
|
Description
|
Stations with measurements
|
Stations with trends
|
|
Total groundwater stations
|
1756
|
1736
|
|
Total fresh surface water stations
|
530
|
313
|
|
Total saline surface water stations
|
Not relevant
|
Not relevant
|
Table 1. Number of water monitoring stations
Groundwater quality
Nitrates concentration
Trends in nitrates concentration


Figure 2. Percentage of stations with decreasing, stable or increasing trends in average groundwater nitrate concentrations between the reporting periods 2008-2011 and 2012-2015.
Figure 1. Percentage of groundwater stations with average values equal to or exceeding 25, 40 or 50 mg nitrate per L during the current and previous reporting periods. Results are presented for all groundwater stations (at different depths).
Surface water quality
Nitrates concentration
Trends in nitrates concentration


Figure 4. Percentage of stations with decreasing, stable or increasing trends in fresh surface water nitrate concentrations between the reporting periods 2008-2011 and 2012-2015.
Figure 3. Percentage of fresh surface water stations with average values equal to or exceeding 25, 40 or 50 mg nitrate per L on average during 2012-2015 and the previous reporting periods.
Eutrophication
Fresh waters
The parameters used to characterize the trophic status for rivers are phytoplankton, phytobenthos, nitrate, total nitrogen, orthophosphate and total phosphorous. The parameters used to characterize the trophic status for lakes are phytoplankton, macrophytes and total phosphorous. The final state is determined by the parameters with the worst classification. The ecological status is converted into three trophic states: non-eutrophic (excellent-good), potentially eutrophic (moderate), and eutrophic (poor-bad).
|
Description
|
Eutrophic
|
Non-eutrophic
|
Potentially eutrophic
|
|
Rivers
|
36%
|
23%
|
40%
|
|
Lakes
|
4%
|
64%
|
31%
|
|
Fresh surface water
|
34%
|
27%
|
40%
|
Table 2. Percentage of fresh water eutrophication classification during the current reporting period (extracted from submitted water quality data).

Figure 5. Fresh water eutrophication classification during the previous reporting period.
Aggregated values for 2008-2011, Eutrophic and Hypertrophic: 35%
Saline waters
Not relevant.
Main findings of monitoring programmes in line with Article 5 (6) of the Directive
Water monitoring is reported in the National Environmental Protection Information System (OKIR) and surface water protection database (FEVISZ). In the 2012 report the monitoring of sub-surface water was changed in response to comments made by the Commission to decrease the number of sampled deep protected aquifers. The Commission considered the number of unconfined shallow sub-surface water types to be underrepresented. Starting in 2017 the number of monitoring locations for unconfined sub-surface water will increase. The majority of the points is located in Nitrate Vulnerable Zones. The sampling frequency is 1-2 samples per year. Water quality results are presented for the NVZs, for municipal areas within the NVZ, and for the whole territory.
Pressure from agriculture
Compared with the previous reporting period, the total agricultural area decreased by 4%. The number of cattle increased by 18%, while the number of pigs and poultry decreased by 4% and 9%, respectively. The livestock numbers show a slight increase due to the application of Eurostat methodology to account livestock numbers on June 1st and December 1st instead of only December 1st. The total number of farmers decreased by 16% while the number of farmers with livestock increased by 7%. Currently 64% of the farms are livestock farms. The annual use of N from livestock manure increased by 2%. The annual use of mineral N fertiliser increased by 16%. However, the report states that the average fertiliser use is still less than the agronomic crop requirements. The nitrogen balance for Hungary in 2012, 2013 and 2014 was 44, 40 and 29 kg N /ha, respectively.
The national Soil Protection Information and Monitoring System has been sampling soils annually since 1992 at 1,236 locations in the period 15 September to 15 October and analysed for nitrate. The results are presented in five categories (very low, low, medium, high and excessively high). In the top soil (0-30 cm), the annual average proportion of samples with a high (50-100 mg N/kg soil) or excessively high (>100 mg N/kg soil) nitrate content varied from 6 to 32%. In the deepest soil layer (60-90 cm), these fractions with high or excessively high nitrate content ranged from 1 to 3%.
Controls
Administrative controls on the implementation of the Action Programme (AP) measures were carried out on 32% of the arable farms and 9% of the livestock farms in NVZs. The proportion of on-site checks was 8%, both for arable and livestock farms. The percentage of non-compliance varies from 0% to 7% between the AP measures. The highest non-compliance was found for farmers that did not have their soils sampled on time in the new NVZs, due to the associated costs, even despite an intensive information campaign. Soil sampling is required every 5 years on croplands to plan for nutrient management. The second most important non-compliance (3%) are the requirements for manure storage facilities although it is reported to be significantly improved compared to the previous reporting period (data not reported).
Designation of nitrate vulnerable zones (NVZs)
Hungary has designated 65,268 km2 as Nitrate Vulnerable Zones, which is 70% of the total territory. Between the previous and the present reporting period the size of Nitrate Vulnerable Zones has increased (in 2013) from 42,519 km2 to 65,268 km2.
Water quality
Water monitoring stations
|
Description
|
Stations with measurements
|
Stations with trends
|
|
Total groundwater stations
|
205
|
205
|
|
Total fresh surface water stations
|
254
|
250
|
|
Total saline surface water stations
|
117
|
99
|
Table 1. Number of water monitoring stations
Groundwater quality
Nitrates concentration
Trends in nitrates concentration


Figure 2. Percentage of stations with decreasing, stable or increasing trends in average groundwater nitrate concentrations between the reporting periods 2008-2011 and 2012-2015*.
Figure 1. Percentage of groundwater stations with average values equal to or exceeding 25, 40 or 50 mg nitrate per L during the current and previous reporting periods. Results are presented for all groundwater stations (at different depths).
Surface water quality
Nitrates concentration
Trends in nitrates concentration


Figure 4. Percentage of stations with decreasing, stable or increasing trends in fresh surface water nitrate concentrations between the reporting periods 2008-2011 and 2012-2015.
Figure 3. Percentage of fresh surface water stations with average values equal to or exceeding 25, 40 or 50 mg nitrate per L on average during 2012-2015 and the previous reporting periods.
Eutrophication
Fresh waters
Trophic status in Irish rivers is measured on the basis of biological assessments using a biotic index scheme primarily based on aquatic macro-invertebrate communities. The scheme is WFD-compliant and incorporates the WFD’s normative definitions for ecological status. The biotic index contains five levels of ecological status, as defined by specific assemblages of macro invertebrates. The WFD classes High, Good, Moderate, Poor and Bad are re-classed to Ultra-oligotrophic, Oligotrophic, Mesotrophic, Eutrophic and Hypertrophic, respectively.
Eutrophication in lakes is assessed on the basis of a modified OECD scheme, using annual maximum chlorophyll concentrations. It distinguishes the following categories: Oligotrophic, Mesotrophic, Moderately Eutrophic,
Strongly Eutrophic, Highly Eutrophic and Hypertrophic. These are re-classed to the ND trophic classes.

Figure 5. Fresh water eutrophication classification during the previous and current reporting period.
Aggregated values for 2008-2011, Eutrophic and Hypertrophic: 12%
Aggregated values for 2012-2015, Eutrophic and Hypertrophic: 14%
Saline waters
Ireland does not use the ND Trophic State system for categorisation of transitional and coastal waters and is therefore unable to match the categories reported with the ND trophic states.
Since 2001, the Trophic Status Assessment Scheme (TSAS) has been adopted by Ireland to measure sensitivity to eutrophication in transitional, coastal and marine sites. The system is based on evaluating water quality parameters against a set of criteria which are grouped into the following three categories related to the median salinity of the sample: criteria for nutrient enrichment from nitrogen and phosphorus, criteria for accelerated growth of phytoplankton and macroalgae, and criteria for “undesirable disturbance” measured using oxygen conditions. Using these criteria, water bodies are classified into one of four categories to describe their trophic status and tendency to eutrophication: Eutrophic, Potentially Eutrophic, Intermediate or Unpolluted.
|
Water type
|
Unpolluted
|
Intermediate
|
Potentially Eutrophic
|
Eutrophic
|
|
Transitional waters
|
58.8%
|
23.5%
|
11.8%
|
5.9%
|
|
Coastal waters
|
87.5%
|
12.5%
|
0.0%
|
0.0%
|
|
Saline waters
|
69.0%
|
19.6%
|
7.6%
|
3.8%
|
Table 2. Saline water eutrophication classification during the current reporting period.
Main findings of monitoring programmes established in line with Article 5 (6) (5-10 lines)
Ireland implemented a monitoring programme to satisfy the requirements of the Water Framework Directive (WFD) in 2006, including surveillance, operational and investigative monitoring. For the article 10 reporting, data are used from the surface water surveillance network and the groundwater surveillance and operational networks.
Pressure from agriculture
The total agricultural area did not change since the previous Reporting period, but there was a slight increase in permanent grassland (+3%). The annual use of manure nitrogen increased slightly (+2%), while the use of mineral nitrogen also increased (+3%). The number of farms was virtually unchanged and number of animals showed overall increases, i.e. cattle (+4%), sheep (+6%) and pigs (+5%). Poultry numbers were not reported. Nitrogen excretion increased as well for cattle (+2%), sheep (+3%) and poultry (+9%), but remained unchanged for pigs.
The report lists recent developments in agriculture that are considered to be favourable to limit nitrogen losses. These are: grass continues to be the dominant crop in Ireland, the climate and soils ensure grass growth almost right throughout the year in Ireland thereby reducing the potential for nitrogen leaching, and the area in potato (-18%) and maize silage area (-40%) has decreased. On the other hand there are also developments that are considered to be unfavourable to limit nitrogen losses. These are: the area devoted to tillage crops, fruit and horticulture has increased slightly (0.9%), the area devoted to cereal crops has increased, and late harvesting of crops reduces the quality and effectiveness of the green cover being established before the onset of winter (however the Action Programme requires green cover be put in place where a total herbicide is used or arable land is ploughed after 1st July each year).
.
Controls
The number of annual farm inspections carried out by local authorities and Department of Agriculture, Food and the Marine (DAFM) in the period 2012–2015 varied between 6,408-7,000 The average number of inspections for this period is 6,645. These inspections are carried out to determine the effectiveness of the measures set out in the National Action Programme (NAP).
In addition to these inspections, 7,700 DAFM inspections (including Green Low-Carbon Agri-Environment Scheme, derogation farm applicants, eligibility etc.) also take place annually and any nitrates breaches noted on these farms in the course of these inspections are cross reported for penalty purposes.
DAFM also carry out administrative checks on all herd owners to establish if they are adhering to the 170 or 250 kg Nitrogen per hectare limits as appropriate. This is done by checking the total Nitrogen figures from the Animal Identification System (AIM) against the areas declared under the Basic Payment Scheme. Herd owners exceeding these limits are subject to penalties.
Designation of nitrate vulnerable zones (NVZs)
Ireland adopts a whole territory approach (68,900 km2).
Water quality
Water monitoring stations
|
Description
|
Stations with measurements
|
Stations with trends
|
|
Total groundwater stations
|
5035
|
4134
|
|
Total fresh surface water stations
|
3154
|
2183
|
|
Total saline surface water stations
|
577
|
267
|
Table 1. Number of water monitoring stations
Groundwater quality
Nitrates concentration
Trends in nitrates concentration


Figure 2. Percentage of stations with decreasing, stable or increasing trends in average groundwater nitrate concentrations between the reporting periods 2008-2011 and 2012-2015.
Figure 1. Percentage of groundwater stations with average values equal to or exceeding 25, 40 or 50 mg nitrate per L during the current and previous reporting periods. Results are presented for all groundwater stations (at different depths).
Surface water quality
Nitrates concentration
Trends in nitrates concentration


Figure 4. Percentage of stations with decreasing, stable or increasing trends in fresh surface water nitrate concentrations between the reporting periods 2008-2011 and 2012-2015.
Figure 3. Percentage of fresh surface water stations with average values equal to or exceeding 25, 40 or 50 mg nitrate per L on average during 2012-2015 and the previous reporting periods.
Eutrophication
Fresh waters
Italy reports ND trophic status, using LIMeco for rivers and LTLeco for lakes. Details about the method are not reported.

Figure 5. Fresh water eutrophication classification during the previous and current reporting period.
Aggregated values for 2008-2011, Eutrophic and Hypertrophic: 19%
Aggregated values for 2012-2015, Eutrophic and Hypertrophic: 11%
Saline waters
Italy reports ND trophic status, using the TRIX (Trophic Index) index for marine and coastal waters which includes dissolved oxygen and nutrients and chlorophyll-a. For transitional waters dissolved inorganic nitrogen and reactive phosphorus are considered. Details about the method are not reported.

Figure 6. Saline water eutrophication classification during the previous and current reporting period.
Aggregated values for 2008-2011, Eutrophic and Hypertrophic: 13%
Aggregated values for 2012-2015, Eutrophic and Hypertrophic: 14%
Main findings of monitoring programmes in line with Article 5 (6) of the Directive
The monitoring results represent the whole territory, but are also presented separately for northern, central and southern Italy. Groundwater is monitored at least twice a year, while surface waters monitoring varies from 4 to 12 samples per year.
It is reported that the method for the assessment of the trophic state is reviewed in order to harmonize the criteria nationwide, and that this review will be concluded in December 2016.
Pressure from agriculture
The provided national data on agriculture were reported per region, but do not always cover the whole territory. The cover varies between agricultural parameters from 55% to 95% of the regions. When comparing the current with the previous Reporting period, the total agricultural area decreased by 2%, the permanent grassland area decreased by 20%, and the permanent crops area increased by 60%. The use of animal manure N decreased by 5%, and the use of mineral fertilizer N increased by 47%. The total number of farmers decreased by 22%. Currently, 16% of the farms have livestock. Catlle and pig numbers were stable, while poultry numbers increased by 2%.
Specific agriculture data for NVZs were not reported.
Controls
The percentage of checked farmers in NVZs in the current Reporting period varies between 0.4 and 31% per region. The percentages of inspected farmers who comply with the Action Program is between 76 and 100%, and for most measures 90% or higher. The lowest compliances are found for “measures to be applied close to water courses” and “measures relating to rotation and maintenance”.
Designation of nitrate vulnerable zones (NVZs)
Nitrate Vulnerable Zones (NVZs) are designated in 18 regions. The area is stated as: “approximately 13.4% of the national territory”. The area of the NVZs has remained largely unchanged in the current period. In the regions Puglia, Calabria Emilia Romagna, Piemonte, Umbria and Sicilia changes were made that were described in various degrees of detail.
Water quality
Water monitoring stations
|
Description
|
Stations with measurements
|
Stations with trends
|
|
Total groundwater stations
|
199
|
163
|
|
Total fresh surface water stations
|
222
|
159
|
|
Total saline surface water stations
|
43
|
40
|
Table 1. Number of water monitoring stations
Groundwater quality
Nitrates concentration
Trends in nitrates concentration


Figure 2. Percentage of stations with decreasing, stable or increasing trends in average groundwater nitrate concentrations between the reporting periods 2008-2011 and 2012-2015.
Figure 1. Percentage of groundwater stations with average values equal to or exceeding 25, 40 or 50 mg nitrate per L during the current and previous reporting periods. Results are presented for all groundwater stations (at different depths).
Surface water quality
Nitrates concentration
Trends in nitrates concentration


Figure 4. Percentage of stations with decreasing, stable or increasing trends in fresh surface water nitrate concentrations between the reporting periods 2008-2011 and 2012-2015.
Figure 3. Percentage of fresh surface water stations with yearly average values equal to or exceeding 25, 40 or 50 mg nitrate per L on average during 2012-2015 and the previous reporting periods.
Eutrophication
Fresh waters
The trophic status of rivers has been assessed by three parameters: the annual average phosphate concentrations, total phosphorus concentration and the winter average nitrate concentration. The distinctions between oligo-, meso-, eutro- and hypertrophic are 0.1, 0.5, 1, 2, mg PO4/L , 0.05, 0.2, 0.5 and 1 mg P/L and 10, 25, 40, 50 mg NO3/L.
The trophic status of lakes has been assessed by three parameters: total phosphorus, total nitrogen and chlorophyll a concentration. Eutrophication has been assessed by determining the water transparency using Secchi disk. The threshold values for ultra-oligo-, oligo-, meso-, eutro- and hypertrophic are 0.03, 0.055, 0.08, 0.105 mg PO4/L, 1, 1.5, 2, 2.5 mg N/L , and 10, 21, 40, 60 µg Chlorophyll-a/L.

Figure 5. Fresh water eutrophication classification during the previous and current reporting period.
Aggregated values for 2008-2011, Eutrophic and Hypertrophic: 14%
Aggregated values for 2012-2015, Eutrophic and Hypertrophic: 14%
Saline waters
The trophic status has been assessed on the basis of nitrate concentration, phosphate concentration, winter total nitrogen, winter total phosphorous, chlorophyll-a and dissolved oxygen using water type specific threshold values.

Figure 6. Saline water eutrophication classification during the previous and current reporting period.
Aggregated values for 2008-2011, Eutrophic and Hypertrophic: 100%
Aggregated values for 2012-2015, Eutrophic and Hypertrophic: 100%
Main findings of monitoring programmes in line with Article 5 (6) of the Directive
In the period 2013-2015 the monitoring of fresh surface waters was performed once every month over the course of one year, once every four years. In 2012 the monitoring was carried out with various frequencies. Stations in transitional, coastal and sea water were sampled 1.75-2.75 times a year. The frequency for groundwater is not reported.
Pressure from agriculture
Compared to the previous Reporting period (2008-2011) the total agricultural area decreased by 5% in the current Reporting period (2012-2015). However, the utilised agricultural land increased by 3%. The permanent grassland increased by 1% and is 29% of the total agricultural area. The number of farms with livestock decreased by 20%. Approximately 79% of all farms are small farms with 1 to 5 cows. While the number of pigs and poultry decreased by 14% and 18%, respectively, the number of cattle, sheep and rabbits increased by 8%, 14% and 32%, respectively. The total amount of applied livestock manure increased by 12%. It is reported that in recent years manure processing has increased. According to Rural Support Service data, in 2013 there were 40 biogas plants which used 552,200 tons of manure per year. The mineral fertilizer N use increased by 27%. The use of mineral fertilizers has increased every year since 1995.
Controls
The percentage of farms in the NVZs visited by the State Environmental Service (SES) varied between 4% and 21% per year and visits by the State Plant Protection Service (SPPS) varied between 1.4% and 1.9%. SES is responsible for the implementation and control of national policy on environmental protection. SPPS is entitled to check the compliance of fertiliser use and relevant documents with regulatory provisions. The highest percentages of non-compliance (24%) was found for having no registration as an animal holding. Furthermore, a non-compliance of 9% for requirements on storage of manure was found, and 4-13% holdings violated rules for cross-compliance in vulnerable zones (no soil analysis, fertiliser plan, or field history). The most common reported violation concern fertilisers spread on water-saturated, frozen or snow-covered soil. A measureable criteria to assess the impact of the programme is the number of analyses of nitrogen content in waste water, made in animal holdings. In the previous and current reporting period there were 1.89 and 1.79 analyses per 100 animal holdings, respectively.
Designation of nitrate vulnerable zones (NVZs)
The area designated in 2009 as a Nitrate Vulnerable Zone is 8,258.7 km2 which is 12.8% of the national territory. The NVZ has not changed since previous reporting period.
Water quality
Water monitoring stations
|
Description
|
Stations with measurements
|
Stations with trends
|
|
Total groundwater stations
|
65
|
65
|
|
Total fresh surface water stations
|
320
|
217
|
|
Total saline surface water stations
|
16
|
16
|
Table 1. Number of water monitoring stations
Groundwater quality
Nitrates concentration
Trends in nitrates concentration


Figure 2. Percentage of stations with decreasing, stable or increasing trends in average groundwater nitrate concentrations between the reporting periods 2008-2011 and 2012-2015.
Figure 1. Percentage of groundwater stations with average values equal to or exceeding 25, 40 or 50 mg nitrate per L during the current and previous reporting periods. Results are presented for all groundwater stations (at different depths).
Surface water quality
Nitrates concentration
Trends in nitrates concentration


Figure 4. Percentage of stations with decreasing, stable or increasing trends in fresh surface water nitrate concentrations between the reporting periods 2008-2011 and 2012-2015.
Figure 3. Percentage of fresh surface water stations with average values equal to or exceeding 25, 40 or 50 mg nitrate per L on average during 2012-2015 and the previous reporting periods.
Eutrophication
Fresh waters
In the current reporting period chlorophyll-a concentrations were analysed during the spring and summer season (April to October) in 254 lakes/reservoirs and 3 river sites. The trophic level of the surface waters are assessed using Vinberg’s scale by chlorophyll-a concentrations. The eutrophication classes are oligo-, meso-, eutro- and hypertrophic, while the classification of ultra-oligotrophic is not used.

Figure 5. Fresh water eutrophication classification during the previous and current reporting period.
Aggregated values for 2008-2011, Eutrophic and Hypertrophic: 47%
Aggregated values for 2012-2015, Eutrophic and Hypertrophic: 49%
Saline waters
The trophic level of transitional waters was assessed using Vinberg’s scale of the trophic level by chlorophyll-a concentrations.

Figure 6. Saline water eutrophication classification during the previous and current reporting period.
Aggregated values for 2008-2011, Eutrophic and Hypertrophic: 100%
Aggregated values for 2012-2015, Eutrophic and Hypertrophic: 100%
Main findings of monitoring programmes in line with Article 5 (6) of the Directive
Water monitoring is part of the 2011-2017 National Environmental Monitoring Programme and is organised by the Environmental Protection Agency. National groundwater monitoring is carried out by the Geological Survey. The river monitoring network has data from 66 locations of which 11 are situated in the areas with intensive agricultural activity which are sampled 12 times a year, and 55 are situated in areas under mixed pressures which are sampled less intensively. The 254 locations in lakes/reservoirs are monitored at various rates: 9 lakes/reservoirs are monitored every year, seven times per year, the others – once in six- or three-year periods, four times per year. River water quality data results in the report are presented for the whole country, and for the locations in areas with intensive agriculture. Water quality is monitored 4 to 10 times per year in transitional, littoral and marine water. The groundwater monitoring network consist of 65 locations on arable land, pastures and grassland with various depths (monitoring frequency is not reported).
Pressure from agriculture
The total agricultural area, and the area available for manure decreased by 26% and 32%, respectively when comparing the current with the previous Reporting period. The numbers of poultry increased by 4% while the number of cattle and pigs decreased by 4% and 15%, respectively. The total number of farms decreased by 42%, but the number of livestock farms decreased only by 2%.
The reported nitrogen excretion shows other data that do not seem to be consistent with the livestock numbers. The annual nitrogen excretion of pigs increased by 66%, while excretion of cattle and poultry decreased by 35% and 42%, respectively. The report does not state that the excretion factors have been changed.
The annual use of N from livestock manure in the country decreased by 11%. Data on the use of mineral N are not available.
Controls
There are 200 thousand farmers in Lithuania, of which 58% have livestock. It is reported that 6% of the farmers are checked annually. Farmers which seek support with the cross compliance requirements are controlled by the National Paying Agency under the Ministry of Agriculture. The percentage of farmers complying with the items of the Action Programme and Code of Good Practice varies between 94 and 100%, with the lowest percentage for the item: “cover crop in winter”. The Implementation of the requirements of the Nitrates Directive are controlled by the Regional Environmental Protection Departments. The number of checks per measure varies between 39 and 1075 per year. The percentage of farmers complying with requirements of the Nitrates directive varies between 62% and 100%, with the lowest percentage for manure management.
Designation of nitrate vulnerable zones (NVZs)
The whole territory (65,300 km2) has been designated as a Nitrate Vulnerable Zone.
Water quality
Water monitoring stations
|
Description
|
Stations with measurements
|
Stations with trends
|
|
Total groundwater stations
|
20
|
20
|
|
Total fresh surface water stations
|
16
|
16
|
|
Total saline surface water stations
|
Not relevant
|
Not relevant
|
Table 1. Number of water monitoring stations
The fresh surface water stations are located in rivers only.
Groundwater quality
Nitrates concentration
Trends in nitrates concentration


Figure 2. Percentage of stations with decreasing, stable or increasing trends in average groundwater nitrate concentrations between the reporting periods 2008-2011 and 2012-2015.
Figure 1. Percentage of groundwater stations with average values equal to or exceeding 25, 40 or 50 mg nitrate per L during the current and previous reporting periods. Results are presented for all groundwater stations (at different depths).
Surface water quality
Nitrates concentration
Trends in nitrates concentration


Figure 4. Percentage of stations with decreasing, stable or increasing trends in fresh surface water (rivers only) nitrate concentrations between the reporting periods 2008-2011 and 2012-2015.
Figure 3. Percentage of fresh surface water stations (rivers only) with average values equal to or exceeding 25, 40 or 50 mg nitrate per L on average during 2012-2015 and the previous reporting periods.
Eutrophication
Fresh waters
Eutrophication evaluation is based on nitrate, orthophosphate, total phosphorus and chlorophyll, with the same classification criteria for all surface waters. Except for chlorophyll, for which no data were available, each parameter is evaluated, and the final assessment of eutrophication is based on the worst scoring parameter for the remaining 3 parameters and on the scores for the parameters macrophytes and diatoms. The classes very weak-low-moderate-high-very high are converted to the ND classification.
The actual method will be changed following a recent study. From 2016 onwards, the parameters macrophytes and diatoms will be officially included in the evaluation method, while chlorophyll will be excluded.

Figure 5. Fresh water eutrophication classification during the previous and current reporting period. (rivers only).
Aggregated values for 2008-2011, Eutrophic and Hypertrophic: 87.5%
Aggregated values for 2012-2015, Eutrophic and Hyper-trophic:87.5%
Saline waters
Not relevant.
Main findings of monitoring programmes in line with Article 5 (6) of the Directive
Surface waters are monitored in two networks, i.e. for the purpose of assessing nitrate pollution and eutrophication and for the purpose of WFD. The sampling frequency varies from 12 to 13 times a year.
In 2015, a study on eutrophication was conducted which identified monitoring stations that best reflect the pressures from agriculture. The monitoring network will be adapted based on the findings of this study. The study showed that the stations that will not be retained in the future monitoring network are under too much pressure from effluent treatment plants and their catchment areas do not represent high agricultural pressure. The number of monitoring stations will also increase.
Based on another study the groundwater monitoring network will also be adapted with the aim to streamline as far as possible with the WFD monitoring network.
Pressure from agriculture
Agricultural areas and the use of organic and mineral nitrogen did not change. The main changes in agriculture were a decreasing number of farms (-7%) and an increasing number of pigs (+10%) and poultry (+26%). Nitrogen excretion was stable for cattle, decreased for pigs (-6%) and other animals (-3%), and increased for poultry (+35%).
Nitrogen surpluses, at field level, showed a small decrease, due to lower mineral fertilizer use. The modelled nitrogen discharge to the aquatic environment increased by 4%. The report states that the increase is on a lower level caused by increasing livestock numbers, but the main reason has been attributed to slightly higher rainfall in the last Reporting period.
Controls
Controls are carried out in the framework of Cross Compliance controls. On site controls are carried out on a random basis and risk analysis basis (5 to 6% of the farms). The report does not present an overview of infringements.
Designation of nitrate vulnerable zones (NVZs)
Luxemburg adopts a whole territory approach (2,586 km2).
Water quality
Water monitoring stations
|
Description
|
Stations with measurements
|
Stations with trends
|
|
Total groundwater stations
|
41
|
41
|
|
Total fresh surface water stations
|
5
|
0
|
|
Total saline surface water stations
|
49
|
0
|
Table 1. Number of water monitoring stations
Groundwater quality
Nitrates concentration
Trends in nitrates concentration


Figure 2. Percentage of stations with decreasing, stable or increasing trends in average groundwater nitrate concentrations between the reporting periods 2008-2011 and 2012-2015.
Figure 1. Percentage of groundwater stations with average values equal to or exceeding 25, 40 or 50 mg nitrate per L during the current and previous reporting periods. Results are presented for all groundwater stations (at different depths).
Surface water quality
Nitrates concentration

Figure 3. Percentage of fresh surface water stations with average values equal to or exceeding 25, 40 or 50 mg nitrate per L on average during 2012-2015 and the previous reporting periods.
Similar to Malta’s first Nitrate cycle results, very high nitrate values were registered in the three watercourses of valley systems that are surrounded by intense agricultural activity. Average monthly nitrate concentrations and winter averages exceeded 100 mg/L in all three sampling stations. Winter average nitrate concentrations measured in standing waters were between 2 and 10 mg/L.
Eutrophication
Fresh waters
The report states that no eutrophication method was applied to inland surface and transitional waters due to the fact that to date no suitable method has been identified. However, the French (Seq-eaux) categories for nitrate, with values above 40 mg/L considered as eutrophic, were used as an indication of potential eutrophication status in these waters.

Figure 4. Fresh water eutrophication classification during the previous and current reporting period.
Aggregated values for 2008-2011, Eutrophic and Hypertrophic: 43%
Aggregated values for 2012-2015, Eutrophic and Hypertrophic: 60%
Saline waters
The trophic state of the 5 transitional waters were assessed using only nitrate concentrations and applying the French (Seq-eaux) categories for transitional water bodies. The trophic state of the coastal waters is assessed using the trophic index method (TRIX) for Mediterranean coastal waters. The TRIX is a combination of four parameters (chlorophyll-a, dissolved inorganic nitrogen, total phosphorus, and the absolute percentage of deviation of oxygen from the oxygen saturation value). However, the classification of Maltese coastal waters on the basis of the TRIX index does not tally with the results of the baseline survey monitoring results for phytoplankton abundance and composition which results indicate that generally coastal waters are oligotrophic in nature, with the Grand harbour area being the only exception. On the other hand, the application of the TRIX index resulted in medium to high trophic states within most monitored stations. These results highlight the need for further work to refine the assessment of eutrophication in Maltese coastal waters.

Figure 5. Saline water eutrophication classification during the previous and current reporting period.
Aggregated values for 2008-2011, Eutrophic and Hypertrophic: 76%
Aggregated values for 2012-2015, Eutrophic and Hypertrophic: 85%
Main findings of monitoring programmes in line with Article 5 (6) of the Directive
Groundwater samples are collected twice-yearly. The results for all inland surface waters and transitional waters are based on monthly replicate samples from February 2012 to January 2013. Two monitoring programs in coastal water were executed: monitoring of three enclosed coastal waters influenced by agricultural activities (monthly sampling between February 2012 and January 2013) and monitoring of 26 additional locations around the Maltese Islands (monthly sampling between May 2012 and July 2013).
Pressure from agriculture
Compared to the previous Reporting period, the total agricultural area increased by 2% in the current Reporting period. The annual use of mineral fertilizer N did not change. The number of farms decreased by 20% and the number of farms with livestock by 31%. The number of cattle, pigs and poultry decreased by 36%, 60% and 94%, respectively. The nitrogen excretion of cattle, pigs and poultry decreased by 20%, 8% and 2%. Data about the use of N from livestock manure were not available for the current and the previous Reporting period.
Controls
The proportion of farms visited in the current Reporting period was 9% per year. The report presents the percentage of visited farmers that comply with the measures in the Action Programme for the years 2006 and 2007, and for the current Reporting period. Compared to 2006 and 2007, compliance has increased for storage and manure collection and rational fertilizer use. Current compliance varies from 88% (manure collection capacity and rational fertiliser use) to 100%. The report states that the majority of farmers finds it difficult to maintain appropriate records due to low level of education.
Designation of nitrate vulnerable zones (NVZs)
Malta adopts a whole territory approach (316 km2).
Member State: Netherlands
Water quality
Water monitoring stations
|
Description
|
Stations with measurements
|
Stations with trends
|
|
Total groundwater stations
|
1318
|
1229
|
|
Total fresh surface water stations
|
850
|
171
|
|
Total saline surface water stations
|
39
|
33
|
Table 1. Number of water monitoring stations
Groundwater quality
Nitrates concentration
Trends in nitrates concentration


Figure 2. Percentage of stations with decreasing, stable or increasing trends in average groundwater nitrate concentrations between the reporting periods 2008-2011 and 2012-2015.
Figure 1. Percentage of groundwater stations with average values equal to or exceeding 25, 40 or 50 mg nitrate per L during the current and previous reporting periods. Results are presented for all groundwater stations (at different depths).
Surface water quality
Nitrates concentration
Trends in nitrates concentration


Figure 4. Percentage of stations with decreasing, stable or increasing trends in fresh surface water nitrate concentrations between the reporting periods 2008-2011 and 2012-2015.
Figure 3. Percentage of fresh surface water stations with average values equal to or exceeding 25, 40 or 50 mg nitrate per L on average during 2012-2015 and the previous reporting periods.
Eutrophication
In the previous report, eutrophication was characterised on the OECD methodology, which was however found to be not appropriate for shallow lowland waters, typically found in the Netherlands. In the present report, eutrophication is assessed according to the Water Framework Directive (WFD). Each parameter is evaluated using water type dependent classification criteria. There are different quality criteria for 9 types of lakes and 12 types of rivers. Waters in which biological quality elements (including phytoplankton and phytobenthos) score less than ‘good’ are ‘eutrophic’, irrespective of the score for N or P. Waters in which the score of the biological quality elements is ‘good’ and N and P are both below ‘good’ are ‘potentially eutrophic. Waters in which the score for both the biology and one of the nutrients is ‘good’ are ‘not eutrophic’. Assessment of the eutrophication of the waters according to the WFD system was only reported for the period 2011-2013.
The Netherlands prefer the classification ‘eutrophic’, ‘potential eutrophic’ and ‘non-eutrophic’ to identify the level of eutrophication both for fresh and saline fresh waters.
Fresh waters
Eutrophication in rivers and lakes is assessed with various biological quality parameters (phytoplankton in lakes, and phytobenthos in rivers, and if not present other water flora in rivers), as well as the chemical parameters (concentrations of total nitrogen and total phosphorus).

Figure 5. Fresh water eutrophication classification during the previous reporting period.
Aggregated values for 2008-2011, Eutrophic and Hypertrophic: 100%
In the current Reporting period, 60% of the freshwaters are eutrophic, 27% are not eutrophic and 13% are potentially eutrophic.
There was little or no change in the average chlorophyll-a and phosphorus concentration in the fresh WFD waters during the summer season (the season in which eutrophication phenomena may occur) in 2012-2014, compared to the period 2008-2011. The summer average total nitrogen concentration has improved slightly.
Saline waters
Eutrophication in coastal and transitional water is also assessed according to the WFD methodology, using phytoplankton and dissolved inorganic nitrogen.

Figure 6. Saline water eutrophication classification during the previous reporting period.
Aggregated values for 2008-2011, Eutrophic and Hypertrophic: 100%
In the saline waters 13% is assessed as eutrophic, while 81% is potentially eutrophic. The eutrophication effects are very limited in the biology (less than 10%), but the nutrient concentrations (dissolved nitrogen) are too high in more than 80% of these waters.
Based on the water quality parameters, the situation for the transitional, coastal and marine waters virtually remained unchanged in 2012-2014 compared to 2008-2011.
Main findings of monitoring programmes in line with Article 5 (6) of the Directive
Water monitoring for the Nitrate directive is organised by several organisations and reported under the co-ordination of the National Institute for Public Health and the Environment (RIVM), also using information from drinking water companies. Water monitoring programmes (Regulation on the status of surface waters and Regulation on the status of groundwater) have been adapted to the requirements of the Water Framework Directive in 2006.
The report presents the data from the control and operational monitoring sites. Root zone leaching is monitored at farms in all soil type regions by sampling the upper metre of groundwater or soil moisture (groundwater level > 5m) 1-2 times a year, or in case of artificially drained farms by sampling tile drain water 3-4 time per year. Shallow groundwaters under sandy soils are sampled every year whereas under clay and peat they are sampled every two years. Deep wells are sampled every four years. The frequency of sampling drinking water wells varies from once a week to once a year.
Surface waters are generally sampled every month. At sea the frequency of water sampling is once a month in winter and twice a month in summer.
Pressure from agriculture
In the current Reporting period, the total agricultural area decreased by 3% to 18,430 km2, compared to the previous Reporting period. The area of permanent pasture decreased by 6%. The area of perennial crops is small and stable (190 km2).
The number of farms has decreased by 9%. Cattle numbers increased (3%), but their nitrogen excretion increased by 1%, while the excretion per cow decreased by 4%. Poultry and pigs numbers increased by 3% and 1%, respectively, while their excretion decreased both by 5% . Total excretion decreased by 1%.
Overall the amount of nitrogen from animal manure applied to agricultural land decreased by 4%, and the use of mineral nitrogen fertilizer decreased by 7%.
The gross nitrogen balance (OECD/Eurostat) decreased from 161 kg/ha in the previous Reporting period to 148 kg/ha for the current Reporting period. The nitrogen leaching and run-off from in rural areas decreased from 54 to 42 kt per year between 2010 and 2013.
Controls
The Netherlands Enterprise Agency (RVO) checks farms on the basis of register data for the various calendar years. Each year, compliance with the primary nutrient standards and accountability for manure production are checked. The two main target groups are farmers and manure transporters. In 2012, the RVO changed its enforcement approach, focusing more on the result and the effect of the investigations and less on the numbers. The RVO checked the farms in the sample on the basis of register data for compliance with the application standards and accountability for manure production. Where the information was incomplete, additional information was requested to the farm.
In addition to the randomised checks via a random sample, farms were also checked if they met one of the following three criteria: farms applying for derogation, but not meeting one or more of the conditions for derogation, farms with land and manure delivery in the application period, or farms with several business lines.
In 2012, 384 farms were selected at random to check their compliance with regulations. There was one infringement of the application standards for phosphate and for livestock manure. The number of fines in 2012 is lower than the average number of nine fines in the previous three years, although nine cases from 2012 are still in progress.
In addition to the checks via random sample, 755 farms which met the specific risk criteria were investigated. Of the 755 farms, a fine had been imposed on 149 farms. In total, 241 infringements were found, with infringements of several standards per farm in several cases. The violations were exceedance of application standards for nitrogen (22), phosphorus (117), animal manure (85), and violation of reporting obligations (17).
Designation of nitrate vulnerable zones (NVZs)
The Netherlands adopts a whole territory approach (33,680 km2).
Water quality
Water monitoring stations
|
Description
|
Stations with measurements
|
Stations with trends
|
|
Total groundwater stations
|
1563
|
1063
|
|
Total fresh surface water stations
|
2526
|
1656
|
|
Total saline surface water stations
|
19
|
7
|
Table 1. Number of water monitoring stations
Groundwater quality
Nitrates concentration
Trends in nitrates concentration


Figure 2. Percentage of stations with decreasing, stable or increasing trends in average groundwater nitrate concentrations between the reporting periods 2008-2011 and 2012-2015.
Figure 1. Percentage of groundwater stations with average values equal to or exceeding 25, 40 or 50 mg nitrate per L during the current and previous reporting periods. Results are presented for all groundwater stations (at different depths).
Surface water quality
Nitrates concentration
Trends in nitrates concentration


Figure 4. Percentage of stations with decreasing, stable or increasing trends in fresh surface water nitrate concentrations between the reporting periods 2008-2011 and 2012-2015.
Figure 3. Percentage of fresh surface water stations with average values equal to or exceeding 25, 40 or 50 mg nitrate per L on average during 2012-2015 and the previous reporting periods.
Eutrophication
Fresh waters
The assessment of surface water eutrophication was carried out based on guidelines presented in the Regulation of the Minister of the Environment of 23 December 2002 on the criteria for designation of waters vulnerable to pollution with nitrogen compounds from agricultural sources. The relevant parameters are total phosphorus, total nitrogen, nitrate and chlorophyll-a, and for lakes also transparency (Secchi-disc). The classification is initially either eutrophic or non-eutrophic. Additionally, an analysis is performed to assess the ND trophic state, based on the French method (Seq-eaux) for rivers and on the OECD method for lake waters, as referred to in the ND reporting guidelines.

Figure 5. Fresh water eutrophication classification during the previous and current reporting period.
Aggregated values for 2008-2011, Eutrophic and Hypertrophic: 43%
Aggregated values for 2012-2015, Eutrophic and Hypertrophic: 33%
Saline waters
Eutrophication assessment of transitional and coastal waters follows the same methods as described above for fresh waters, but with other threshold values.

Figure 6. Saline water eutrophication classification during the previous and current reporting period.
Aggregated values for 2008-2011, Eutrophic and Hypertrophic: 65%
Aggregated values for 2012-2015, Eutrophic and Hypertrophic: 89%
Main findings of monitoring programmes in line with Article 5 (6) of the Directive
Water monitoring is a part of The State Environmental Monitoring organized by the Inspection of Environmental Protection. Groundwater and surface water quality data from State Environmental Monitoring are reported for the whole territory, and for each NVZ.
Pressure from agriculture
The total agricultural decreased by 6% in the current Reporting period compared to the previous Reporting period. The number of farms decreased by 39%. In the current reporting period, there were 1.43 million farms. Over 50% were farms with an area between 1 and 5 ha. Larger farms with an area between 5 and 50 ha represented 44%, while the largest farms with an area of over 50 hectares represented 2.2%.The permanent grassland area is 21% of the total agricultural area and decreased by 4%. The area with perennial crops is 3% of the total agricultural land and remained constant. The area of agricultural land available for manure application was not reported. There were no significant changes in the number of cattle, while there was a reduction in the number of pigs (-31%) and poultry (-13%). The use of animal manure N increased by 7%, while the use of mineral N decreased by 8%.
In total, the N excretion in NVZs from cattle, pigs, poultry and other was 20, 20, 3 and 0.01 kt N, respectively in the current Reporting period. The permanent grassland area and perennial crops were 12.3% and 1.1% of the agricultural land, respectively within the NVZs.
Controls
The percentage of farms visited per year varied per NVZ, from 0 to 9.5% by the Agency for Restructuring and Modernisation of Agriculture (ARiMR) and from 0.1 to 3.3 % by the Voivodship Inspectorate for Environmental Protection (WIOŚ). The compliance on manure collection and storage was reported to vary from 68 to 100%. Compliance on other measures was not reported.
The measurable criteria to evaluate the impact of the Action Programs is the share of farmland without crops in winter, which varies between 14 and 59% among NVZs. Buffer zones of 20 m are present on 5 to 91% of the agricultural area in the NVZs. No analyses of animal effluents or other criteria are reported. A comparison with the previous period is not possible due to many missing data.
Designation of nitrate vulnerable zones (NVZs)
In the current reporting period Poland has a total NVZ area of 21,308 km2, which represents 6.8% of the total territory (Previous reporting period: 4,605 km2) and 14.6% of the utilised agricultural area. The report states that in the draft of the Water Law there is a proposal to apply a whole territory approach.
Water quality
Water monitoring stations
|
Description
|
Stations with measurements
|
Stations with trends
|
|
Total groundwater stations
|
580
|
553
|
|
Total fresh surface water stations
|
154
|
143
|
|
Total saline surface water stations
|
6
|
2
|
Table 1. Number of water monitoring stations
Groundwater quality
Nitrates concentration
Trends in nitrates concentration


Figure 2. Percentage of stations with decreasing, stable or increasing trends in average groundwater nitrate concentrations between the reporting periods 2008-2011 and 2012-2015.
Figure 1. Percentage of groundwater stations with average values equal to or exceeding 25, 40 or 50 mg nitrate per L during the current and previous reporting periods. Results are presented for all groundwater stations (at different depths).
Surface water quality
Nitrates concentration
Trends in nitrates concentration


Figure 4. Percentage of stations with decreasing, stable or increasing trends in fresh surface water nitrate concentrations between the reporting periods 2008-2011 and 2012-2015.
Figure 3. Percentage of fresh surface water stations with average values equal to or exceeding 25, 40 or 50 mg nitrate per L on average during 2012-2015 and the previous reporting periods.
Eutrophication
Fresh waters
The parameters used to characterize the trophic status for rivers on the mainland of Portugal and on the Azores were total nitrogen and total phosphorus. For rivers 2 classes were used on the mainland (northern group and southern group) and 2 classes on the Azores (deep lakes, shallow lakes). The parameters used to characterize the trophic status for reservoirs on the mainland and Azores were chlorophyll-a, total nitrogen and total phosphorus. Three tropic levels were distinguished for all waters: oligotrophic, mesotrophic and eutrophic.

Figure 5. Fresh water eutrophication classification during the previous and current reporting period.
Note that Portugal only use three classes (oligotrophic, mesotrophic and eutrophic)
Saline waters
The parameter used to characterize the trophic status for coastal and transitional waters is nitrate. All stations had average nitrate concentrations below 2 mg/L. The Eutrophication status itself was not reported.
Main findings of monitoring programmes in line with Article 5 (6) of the Directive
Water monitoring is organized by the Portuguese Environmental Agency and commissioned by the Directorate-General of Agriculture and Rural Development.
Pressure from agriculture
The agricultural land area has decreased slightly by 0.7% in the current Reporting period (2012-2015) compared to the previous Reporting period (2008-2011) while the areas with permanent grassland and perennial crops increased by 2 and 3%, respectively; they represent 50% and 19% of the agricultural land area, respectively.
The number of farms has decreased between the current and the previous reporting period with 13%. The number of cattle has remained constant, while the number of pigs and other farm animals decreased by 5 and 4%, respectively. The number of poultry has not been reported for the current reporting period. The nitrogen balance for Portugal has been reported for NVZs in the mainland and the Azores. The N surplus varied between NVZs from 0 to 108 kg/ha.
Controls
The percentage of farms visited varied between 1% and 10% per NVZ on the mainland of Portugal, and varied between 20 and 100% per NVZ on the Azores, except the São Brás NVZ with zero visits on in total 3 farms. For each NVZ the application of the Action Programme (AP) has been monitored and the results have been reported. The percentage of farmers per NVZ who respect the rules contained in the AP has been reported to be 100% on the mainland in most cases, while on the Azores a compliance of 7 to 100% per NVZ was reported.
The measurable criteria for assessing the impact of the programmes in the field have been reported for each NVZ, but not completely. Not reported, except for one NVZ on the mainland, and for the NVZs on the Azores, are the number of analyses of nitrogen in livestock manure, the percentage of arable land which was uncultivated, and the distance of crops from water courses.
In the mainland of Portugal the control of the Action Programme focused on 1% of farms larger than 2 ha or 0.5 ha with horticulture and/or vegetable crops. The percentage of controls with failures to comply, and a brief description of the observed failures have been reported. For the NVZ Esposende-Vila do Conde and Tejo the percentage of failures varied between 0% and 21% per measure, while in the other NVZs the percentage was reported as zero, except a failure of 72% in Litoral Centro (mostly due to the lack of implementation of soil and water analyses).
Designation of nitrate vulnerable zones (NVZs)
In Portugal, nine areas (Decree No. 164/2010) in the mainland have been designated as vulnerable to leaching of nitrates from agricultural sources in terms of groundwater. There are eight vulnerable areas in the Azores due to the trophic status of some Lakes. The NVZs on the mainland of Portugal vary in size between 31 km2 and 2416 km2. The NVZs on the Azores vary between 0.19 km2 and 19 km2.
In the Reporting period of 2008-2011 the boundaries of NVZ Aveiro and Mira were extended by merging them to the Litoral Centro. The boundaries of the NVZ Elvas-Vila Boim were also expanded, integrating the aquifer system of Elvas-Campo Maior. This period also saw the definition of two new NVZs, Estarreja-Murtosa and Estremoz-Cano.
The total area of NVZs is 4,047 km2 which is 4.4% of the total territory of Portugal.
Water quality
Water monitoring stations
|
Description
|
Stations with measurements
|
Stations with trends
|
|
Total groundwater stations
|
1256
|
849
|
|
Total fresh surface water stations
|
1224
|
931
|
|
Total saline surface water stations
|
35
|
31
|
Table 1. Number of water monitoring stations
Groundwater quality
Nitrates concentration
Trends in nitrates concentration


Figure 2. Percentage of stations with decreasing, stable or increasing trends in average groundwater nitrate concentrations between the reporting periods 2008-2011 and 2012-2015.
Figure 1. Percentage of groundwater stations with average values equal to or exceeding 25, 40 or 50 mg nitrate per L during the current and previous reporting periods. Results are presented for all groundwater stations (at different depths).
Surface water quality
Nitrates concentration
Trends in nitrates concentration


Figure 4. Percentage of stations with decreasing, stable or increasing trends in fresh surface water nitrate concentrations between the reporting periods 2008-2011 and 2012-2015.
Figure 3. Percentage of fresh surface water stations with average values equal to or exceeding 25, 40 or 50 mg nitrate per L on average during 2012-2015 and the previous reporting periods.
Eutrophication
Several ecological status classes (5 classes: high, good, moderate, poor and bad) and ecological potential classes (4 classes: maximum and good, moderate, poor and bad) have been defined taking into account the categories of water bodies (rivers, lakes, transitional waters, coastal waters) and the typology of the water bodies (19 types of water courses, 9 types of natural lakes, 7 types of reservoirs, 2 types of transitional waters and 2 types of coastal waters), with typology specific criteria. The ND trophic status classes have been correlated with the ecological status/ecological potential classes as follows: ultra-oligotrophic - high/maximum (class I); oligotrophic – good/good (class II); meso-trophic - moderate/moderate (class III); eutrophic - poor/poor (class IV); hypertrophic - bad/bad (class V).
Fresh waters
The parameters for rivers indicating eutrophication (limits between high/good ecological status or maximum/good ecological potential and good/moderate ecological status/potential; range depending on the typology of the water bodies) were: nitrates (0.7-2.7, 1.4-5.5 mg/L N), nitrites (0.35 mg/L N), total nitrogen, phosphates (0.035-0.13, 0.075-0.27 mg/L P) and total phosphorus (0.0030-0.32, 0.22-0.66 mg/L P), the dissolved oxygen (8-10, 6-8, mg/L ) and the organic substances (measured by CBO5), as well as chlorophyll a (ranges are for different water types).
The parameters for natural lakes and reservoirs indicating eutrophication were: nitrates (0.4-1.6, 0.8-3.3 mg/L N), nitrites (0.35 mg/L N), total nitrogen, phosphates (0.015-0.12, 0.06-0.25 mg/L P) and total phosphorus (0.02-0.18, 0.04-0.38 mg/L P), the dissolved oxygen (8-10, 6-8, mg/L ) and the organic substances (measured by CBO5), as well as transparency (Secchi disk) and chlorophyll a. The final assessment is based on the one out-all out principle, meaning that the worse situation/class is used, considering all parameters assessed.

Figure 5. Fresh water eutrophication classification during the previous and current reporting period.
Aggregated values for 2008-2011, Eutrophic and Hypertrophic: 30%
Aggregated values for 2012-2015, Eutrophic and Hyper-trophic: 2%
Saline waters

Figure 6. Saline water eutrophication classification during the previous and current reporting period.
Aggregated values for 2012-2015, Eutrophic and Hyper-trophic: 54%
The parameters indicating eutrophication process were: nitrates, nitrites, total nitrogen, phosphates and total phosphorus, the dissolved oxygen and chlorophyll a. For transitional waters the limit values between high/good status (0.012 mg/L P-PO4, < 1 mg/L N-NO3, 0.012 mg/L N-NO2, 9 mg/L O2, 2.6 ug/l chlorophyll) and good/moderate status (0.03 mg/L P-PO4, 1-1.5 mg/L N-NO3, 0.03 mg/L N-NO2, 6.2 mg/L O2, 3.9 ug/l chlorophyll). For coastal waters the limit values were similar with transitional waters, except for phosphate and nitrite (high/good and good/moderate: 0.03 mg/L P-PO4, 0.03 mg/L N-NO2).
Main findings of monitoring programmes in line with Article 5 (6) of the Directive
The Romanian Waters National Administration manages the monitoring of the surface water and groundwater. The quality of the Black Sea is monitored by the laboratory of Dobrogea Water Basin Administration - Coast together with the National Institute for Marine Research and Development.
Groundwater is sampled once or twice per year. Surface water is monitored 4 to 26 times a year. On the monitoring points that are relevant for agricultural pressures, the sampling frequency is 12 times a year.
Pressure from agriculture
Compared to the previous Reporting period (2008-2011) the total agricultural area remained stable in the current reporting period (2012-2015). Overall, the agricultural indicators were fairly stable. The area of permanent pasture decreased with 4%, while the area of perennial crops increased with 3%. Cattle numbers increased by 2% as did their nitrogen excretion. Poultry decreased by 2% and pigs decreased by 4%, as did their excretion. The number of sheep and goats increased by 8%. Overall the use of N from livestock manure increased by 3% and the use of mineral fertilizer N did not change.
Controls
There were 3,563,765 farmers, of which 75% had livestock. The proportion of farms visited in the current Reporting period was 10% per year. The percentage of visited farmers who comply with each measure referred to in the Action Programme and the Code of Good Agricultural Practices was between 74.5% and 99.7%. The lowest compliances were observed for rational fertilisation use, and for the limitation on the use of nitrogen from livestock manure.
Data are also reported about the livestock holdings with more than 100 livestock units (varying between 701 to 912 farms in the current Reporting period), which are subject to the environmental permit release procedure. The number of inspections varied from 1.2 to 2.1 times per year per farm. The number of warnings varied between 16 and 46 per year, and the number of fines between 41 and 54 per year.
Designation of nitrate vulnerable zones (NVZs)
Upon the first designation, the NVZs covered 7% of the Romanian territory. In 2008, NVZs were revised and the area was extended to 58% of the Romanian territory. Since 2013, Romania applies the whole territory approach (283,391 km2).
Water quality
Water monitoring stations
|
Description
|
Stations with measurements
|
Stations with trends
|
|
Total groundwater stations
|
1717
|
1544
|
|
Total fresh surface water stations
|
512
|
378
|
|
Total saline surface water stations
|
Not relevant
|
Not relevant
|
Table 1. Number of water monitoring stations
Groundwater quality
Nitrates concentration
Trends in nitrates concentration


Figure 2. Percentage of stations with decreasing, stable or increasing trends in average groundwater nitrate concentrations between the reporting periods 2008-2011 and 2012-2015.
Figure 1. Percentage of groundwater stations with average values equal to or exceeding 25, 40 or 50 mg nitrate per L during the current and previous reporting periods. Results are presented for all groundwater stations (at different depths.*
Surface water quality
Nitrates concentration
Trends in nitrates concentration


Figure 4. Percentage of stations with decreasing, stable or increasing trends in fresh surface water nitrate concentrations between the reporting periods 2008-2011 and 2012-2015.
Figure 3. Percentage of fresh surface water stations with average values equal to or exceeding 25, 40 or 50 mg nitrate per L on average during 2012-2015 and the previous reporting periods.
Eutrophication
Fresh waters
Surface water eutrophication has been evaluated by two methodologies: the new Slovak methodology and the French methodology, which was also used in previous reporting period. To maintain the possibility of trend assessment also the data using the French methodology are used. The French methodology assesses data by using one set of criteria for the whole country, using peak summer concentrations of chlorophyll-a, and average summer concentrations of nitrates, phosphates and total phosphorus.
Figure 5. Fresh water eutrophication classification during the previous and current reporting period (old method).
Aggregated values for 2008-2011, Eutrophic and Hypertrophic: 37%
Aggregated values for 2012-2015, Eutrophic and Hypertrophic: 16%

The new Slovak methodology for eutrophication assessment (used the first time in the current Reporting period) is based on the European principles introduced in Guidance document No 23 (Eutrophication Assessment in the context of European Water Policies). The methodology is type specific, limit values for phytoplankton (abundance, biomass), phytobenthos (CEE, IPS indices) and macrophytes (IBMR index) are used per type of water body.
The results of the new method (rivers) show that there were 61% evaluated sites with no manifestation or risk of eutrophication, 29% of the sites monitored were found to be at risk of eutrophication, and eutrophication was manifest at 10%.
Saline waters
Not relevant.
Main findings of monitoring programmes in line with Article 5 (6) of the Directive
Monitoring data for groundwater in and outside NVZs originate from the Water Research Institute, the Slovak Hydrometeorological Institute and from water companies. The sampling rate varies between 1 and 39 during the reporting period. The number of surface water monitoring sites is smaller compared to the previous period because the current period extents only over 3 years. The current reporting period is three years (2012-2014) while the previous report was four years (2008-2011). In 2016, the ‘new’ EU Member States, including Slovakia, were required to submit their report by 30 June and no longer by 31 October. Slovakia is therefore making its report four months earlier and could not include data for 2015 in the evaluation.
Pressure from agriculture
The total agricultural area remained stable between 2012 and 2014. Modest changes in the number of livestock occurred in the current Reporting period (2012-2015) compared to the previous Reporting period (2008-2011): a slight decline in the numbers of cattle, pigs and poultry (-1%, -8% and -5%, respectively) and a rise in sheep & goats (4%). When comparing the number of livestock in the current Reporting period to the numbers in 1990, there is a decrease in the numbers of cattle, pigs, poultry and sheep & goats (-70%, -75%, -29%, -29% respectively).
The use of mineral N increased by 28% between both reporting periods. The current consumption of nitrogen (-50%) and phosphorus (-88%) is lower compared to 1990. The annual use of N from livestock manure increased by 5% between 2012 and 2014.
In NVZs the decline in the numbers of cattle, pigs and poultry between 2012 and 2014 represented -3%, -7% and -9%, respectively. Increase of sheep & goats numbers in NVZs was 3%. The changes in animal numbers did not correspond with the changes in nitrogen excretion. The excretion of cattle and sheep & goats did not change, while the excretion of pigs and poultry increased by 10%.
Controls
The number of farms covered by the Farming Programme (Action Programme) in the current Reporting period is 1633, of which 686 have livestock. The proportion of farmers where checks on compliance with the Farming Programme were conducted was 52% per year in the previous Reporting period. In the current Reporting period administrative checks were performed for 100% of the farms and physical checks on 10% (other than cross-compliance checks). The percentage of the visited farmers who comply with each measure referred to in the Farming Programme was close to 100%. Lower compliance was reported for “storage and manure collection capacity” (90%) and “other” (88%). Implementation of the Action Programme is evaluated by a number of indicators: nitrogen balance, and the proportion of land not sown. The nitrogen content in manure or the distance of crops to watercourses are not assessed. The percentage of arable land left bare in winter was 49% in 2011 and 50% in 2014.
Designation of nitrate vulnerable zones (NVZs)
On 1 January 2005 the designated vulnerable areas have been established. The total area is 13,685 km2, which is 28% of the national territory and 55% of the agricultural area.
Water quality
Water monitoring stations
|
Description
|
Stations with measurements
|
Stations with trends
|
|
Total groundwater stations
|
198
|
98
|
|
Total fresh surface water stations
|
136
|
116
|
|
Total saline surface water stations
|
5
|
5
|
Table 1. Number of water monitoring stations
Groundwater quality
Nitrates concentration
Trends in nitrates concentration


Figure 2. Percentage of stations with decreasing, stable or increasing trends in average groundwater nitrate concentrations between the reporting periods 2008-2011 and 2012-2015.
Figure 1. Percentage of groundwater stations with average values equal to or exceeding 25, 40 or 50 mg nitrate per L during the current and previous reporting periods. Results are presented for all groundwater stations (at different depths).
Surface water quality
Nitrates concentration
Trends in nitrates concentration


Figure 4. Percentage of stations with decreasing, stable or increasing trends in fresh surface water nitrate concentrations between the reporting periods 2008-2011 and 2012-2015.
Figure 3. Percentage of fresh surface water stations with average values equal to or exceeding 25, 40 or 50 mg nitrate per L on average during 2012-2015 and the previous reporting periods.
Eutrophication
Eutrophication is assessed according to the Water Framework Directive (WFD) methodology. The report presents a one-to-one conversion table from the classification used under this methodology to the classification used by the Nitrates Directive.
Fresh waters
Eutrophication in rivers is assessed according to the WFD methodology, using the biological quality parameters phytobenthos and macrophytes, as well as the chemical parameters nitrate and total phosphate. Each parameter is evaluated, using water type dependent classification criteria. The final assessment of eutrophication is based on the worst scoring parameter.
The trophic state of lakes is based on phytoplankton, according to the WFD methodology.

Figure 5. Fresh water eutrophication classification during the previous and current reporting period.
Aggregated values for 2008-2011, Eutrophic and Hypertrophic: 4%
Aggregated values for 2012-2015, Eutrophic and Hypertrophic: 4%
Saline waters
The trophic state of coastal waters is based on phytoplankton (WFD). The trophic status of marine waters is not assessed.

Figure 6. Saline water eutrophication classification during the previous and current reporting period (coastal waters only, at three sites).
Aggregated values for 2008-2011, Eutrophic and Hypertrophic: 0%
Aggregated values for 2012-2015, Eutrophic and Hypertrophic: 0%
Main findings of monitoring programmes in line with Article 5 (6) of the Directive
Water monitoring programmes (Regulation on the status of surface waters and Regulation on the status of groundwater) have been adapted to the requirements of the Water Framework Directive in 2006. The report presents the data from the control and operational monitoring sites. For the current reporting period, the size of groundwater monitoring network was almost doubled as compared to previous reporting period?. Samples are taken once or twice a year for groundwater and 4 to 12 times a year for surface water. Two borders stations were sampled every two weeks.
Pressure from agriculture
Overall, the trends in the agriculture were fairly stable. The total agricultural area remained stable (+1%). The area of permanent pasture decreased with 4%, while the area of perennial crops increased with 3%. Cattle numbers did not change, but their nitrogen excretion increased by 9%. The number of poultry increased by 10% while, pigs number decreased by 27%, and consequently their excretion changed by -32% and +2%, respectively. As the calculation method for excretion changed, the comparison between current and previous periods should be assessed with caution. Overall the organic nitrogen applied to agricultural land did not change, and neither did the use of mineral nitrogen.
The gross nitrogen balance (OECD) was 57 kg/ha for the 2012-2014 period, which represents a slight increase as compared to 49 kg/ha in the period 2008-2011. However, the long term trend from 1992 onwards shows a small decrease.
Controls
There are 72,377 farmers, of which 57,749 have livestock. The proportion of farms visited in the current reporting period was 6.5% per year. Furthermore, all farms are inspected administratively for cross compliance. The report does not include results (compliance or infringement).
Waste water (industrial livestock breeding plants) sampling increased slightly to 2.63 samples per farm per year. The proportion of fields without crop cover (excluding specific winter cover/catch crops) increased slightly to 44%.
Designation of nitrate vulnerable zones (NVZs)
Slovenia adopts a whole territory approach (20,273 km2).
Water quality
Water monitoring stations
|
Description
|
Stations with measurements
|
Stations with trends
|
|
Total groundwater stations
|
4132
|
3035
|
|
Total fresh surface water stations
|
3903
|
2916
|
|
Total saline surface water stations
|
250
|
373
|
Table 1. Number of water monitoring stations
Table 1 shows the number of stations with nitrate measurements. The eutrophication status of fresh surface waters was measured at 442 locations, of which 437 were also used for nitrate and 5 locations were only used for eutrophication. The eutrophication status of saline surface waters was measured at 473 locations, of which 250 were also used for nitrate and 223 locations were only used for eutrophication.
Groundwater quality
Nitrates concentration
Trends in nitrates concentration


Figure 2. Percentage of stations with decreasing, stable or increasing trends in average groundwater nitrate concentrations between the reporting periods 2008-2011 and 2012-2015.
Figure 1. Percentage of groundwater stations with average values equal to or exceeding 25, 40 or 50 mg nitrate per L during the current and previous reporting periods. Results are presented for all groundwater stations (at different depths).
Surface water quality
Nitrates concentration
Trends in nitrates concentration


Figure 4. Percentage of stations with decreasing, stable or increasing trends in fresh surface water nitrate concentrations between the reporting periods 2008-2011 and 2012-2015.
Figure 3. Percentage of fresh surface water stations with average values equal to or exceeding 25, 40 or 50 mg nitrate per L on average during 2012-2015 and the previous reporting periods.
Eutrophication
To calculate the trophic level in fresh and marine water, the OECD classification of 1982 for chlorophyll-a is used. For the classes ultraoligotrophic-oligotrophic-mesotrophic-eutrophic-hypertrophic the average threshold values are <1, 1-2.5, 2.5-8, 8-25, and >25 µg chlorophyll-a /L, respectively.
Fresh waters

Figure 5. Fresh water eutrophication classification during the previous and current reporting period.
Aggregated values for 2008-2011, Eutrophic and Hypertrophic: 10%
Aggregated values for 2012-2015, Eutrophic and Hypertrophic: 33%
Saline waters

Figure 6. Saline water eutrophication classification during the previous and current reporting period.
Aggregated values for 2008-2011, Eutrophic and Hypertrophic: 18%
Aggregated values for 2012-2015, Eutrophic and Hyper-trophic: 11%
Main findings of monitoring programmes in line with Article 5 (6) of the Directive
Water management and agricultural policies are shared between the state and Autonomous Communities (CCAA). The sampling and water monitoring, is done by CCAA’s (intracommunity basins) and the state (inter basins). The demarcation between intra and intercommunity basins is given in hydrological plans which are royal decrees. The reporting is done by the state. All monitoring locations have been included in the Program Monitoring and Control of the Water Framework Directive.
Pressure from agriculture
The national nitrogen balance was 15.8 kg/ha for the period 2012-2013, which is slightly higher than the previous reporting period (2008-2011) when it was 13.7 kg/ha. On the longer term, in the period between 2000 and 2013, there was a decrease of the nitrogen balance from 23 to 14 kg/ha. According to the report submitted by Spain, this long term improvement is explained by a lower use of mineral N fertilisers, a lower number of livestock, as well as the growth of organic farming.
All other indicators such as agricultural areas, animal numbers and excretion data are presented for the NVZ areas within a specific CCAA. The data are incomplete and show a large variation between reporting periods. Considering only the CCAAs with reliable data for both reporting periods (Aragon, Baleares, Castilla La Mancha, Estremadura, La Rioja, Murcia, Navarra and Valencia), the average nitrogen excretion increased by 29% for cattle, decreased by 14% for pigs and increased by 23% for poultry.
Controls
Inspections in most NVZs have been reported per CCAA. No or hardly any data are available for the Canary Islands and Castilla y León. The proportion of visited farms varied from 1 to 4%. The proportion of compliance varied from 72 to 100%, but was mostly above 90%. There are some typical regional differences, e.g. for Madrid the compliance was 77% for all measures, while Navarra showed 100% compliance for all measures. Averaged over all regions, all measures scored between 90 and 100%, with no extreme low or high compliances.
Designation of nitrate vulnerable zones (NVZs)
Spain has 80,702 km2 of NVZ, which is 16% of the national territory and 35% of the agricultural area. In the current reporting period (2012-2015) changes were made in the regions Aragon, Catalonia, Madrid, and Pais Vasco. Compared to the previous period (81,699 km2), the area had decreased by 997 km2.
Water quality
Water monitoring stations
|
Description
|
Stations with measurements
|
Stations with trends
|
|
Total groundwater stations
|
436
|
99
|
|
Total fresh surface water stations
|
2792
|
45
|
|
Total saline surface water stations
|
184
|
0
|
Table 1. Number of water monitoring stations
There are 35 stations for which the locations were not disclosed as they are drinking water intake locations. It is assumed that these locations are not located inside a NVZ.
Groundwater quality
Nitrates concentration
Trends in nitrates concentration


Figure 2. Percentage of stations with decreasing, stable or increasing trends in average groundwater nitrate concentrations between the reporting periods 2008-2011 and 2012-2015.
Figure 1. Percentage of groundwater stations with average values equal to or exceeding 25, 40 or 50 mg nitrate per L during the current and previous reporting periods. Results are presented for all groundwater stations (at different depths).
Surface water quality
Nitrates concentration
Trends in nitrates concentration


Figure 4. Percentage of stations with decreasing, stable or increasing trends in fresh surface water nitrate concentrations between the reporting periods 2008-2011 and 2012-2015.
Figure 3. Percentage of fresh surface water stations with average values equal to or exceeding 25, 40 or 50 mg nitrate per L on average during 2012-2015 and the previous reporting periods.
Eutrophication
Fresh waters
The trophic level of surface waters, rivers and lakes, is classified using total P concentrations in five different classes: oligotrophic, mesotrophic, slightly eutrophic, strongly eutrophic and hypertrophic. The report does not state which methodology is used by Sweden for the re-classification into Nitrate Directive trophic states.

Figure 5. Fresh water eutrophication classification during the previous and current reporting period.
Aggregated values for 2008-2011, Eutrophic and Hypertrophic: 15%
Aggregated values for 2012-2015, Eutrophic and Hypertrophic: 14%
Saline waters
The trophic level of transitional waters was assessed by an expert assessment on the basis of various classifications according to: the Swedish Environmental Protection Agency, the Water Framework Directive, and to international assessments (HELCOM, OSPAR). The HELCOM and OSPAR classification is based on nitrate, phosphate, chlorophyll and oxygen. The Report summarizes the current eutrophication status, as shown in Table 2.
|
Area
|
Status
|
|
Skagerak deep-sea areas
|
Good
|
|
Skagerak coastal areas
|
Moderate
|
|
Kattegat deep-sea areas
|
Moderate
|
|
Kattegat coastal areas
|
Moderate
|
|
Baltic Proper
|
Unsatisfactory
|
|
Southern part of the Gulf of Bothnia
|
Good
|
|
Northern part of the Gulf of Bothnia
|
Good
|
Table 2. Weighted expert assessment of eutrophication levels of saline waters based on the status classifications available both nationally and internationally (exact period was not reported).
Main findings of monitoring programmes in line with Article 5 (6) of the Directive
The Department for Environment Analysis (SLU) is the data host for freshwater (lakes and watercourses), the Geological survey of Sweden (SGU) is the host for groundwater and Swedish Meteorological and the Hydrological Institute (SMHI) for coastal and marine waters.
Since 2007, investigations of lake water quality have been carried out annually as part of the national environmental monitoring programme involving cyclical sampling of lakes. The programme covers approximately 4,800 lakes and one sixth of them are sampled every year. In addition, there are approximately 280 regional supplementary lakes that have been added according to the same principle and are therefore included in the evaluation together with the national programme. Results on rivers are reported from a total of 186 stations. The watercourses have been sampled at least 12 times a year.
The report states that groundwater monitoring is based on 80 stations that are sampled several times a year, and larger (but unreported) number of stations which are sampled once every six years. Around a third of the stations are considered to be located in close proximity of agricultural land.
Pressure from agriculture
Statistical data about animal numbers and livestock manure are given for 2009 and 2013 only. The total agricultural area remained constant. The number of cattle and pigs decreased by 3% and 8%, respectively. The numbers of poultry and sheep increased by 33% and 7%, respectively. The amount of nitrogen from manure increased by 4%. The annual use of mineral N fertilizer decreased by 1%.
Between 2009 and 2014 the area of the Nitrate Vulnerable Zones (NVZ) increased by 40% while the total use of livestock manure in the NVZ is 20% higher than outside the NVZ. The proportion of agricultural land in the current NVZ comprises 50% of the agricultural holdings, 60% of the large livestock holdings (>10 livestock units), 72% of the total agricultural land, 73% of arable land, 62% of the pasture, 60% of cattle, 90% of pigs, 84% of poultry and 65% of the sheep.
Controls
The implementation of the Action Programme (AP) is evaluated on the basis of monitoring of cross-compliance, and on the basis of agricultural statistics of nitrogen fertilisation, storage capacity, difference between input and output of nitrogen, and trend analysis of agriculture-affected watercourses. The management requirements for cross compliance include the provisions for the Nitrate Directive. The total numbers of controls are approximately 554 per year. The number of non-conformities for manure management, livestock density and application of manure were 4%, 1%, and 6%, respectively.
Designation of nitrate vulnerable zones (NVZs)
Sweden has currently designated 94,742 km2 as NVZ, which is 23% of the national territory. NVZs were first designated in 1995, and have been adjusted four times. The size of the NVZs were extended in 2002, 2003 and 2013 (also some areas ceased to be a NVZ). A further addition applies from 1 April 2016 (2,484 km2).
Member State: United Kingdom
Water quality
Water monitoring stations
|
Description
|
Stations with measurements
|
Stations with trends
|
|
Total groundwater stations
|
2522
|
2163
|
|
Total fresh surface water stations
|
6460
|
4226
|
|
Total saline water stations
|
424
|
391
|
Table 1 Number of water monitoring stations
Groundwater quality
Nitrates concentration
Trends in nitrates concentration
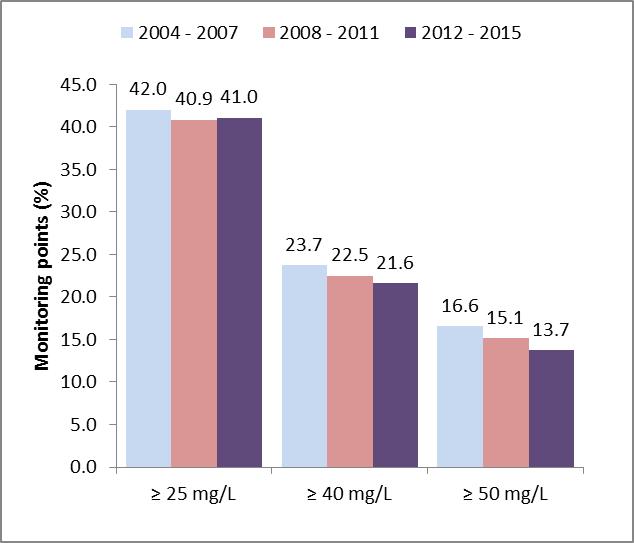

Figure 2. Percentage of stations with decreasing, stable or increasing trends in average groundwater nitrate concentrations between the reporting periods 2008-2011 and 2012-2015.
Figure 1. Percentage of groundwater stations with average values equal to or exceeding 25, 40 or 50 mg nitrate per L during the current and previous reporting periods. Results are presented for all groundwater stations (at different depths).
Surface water quality
Nitrates concentration
Trends in nitrates concentration


Figure 4. Percentage of stations with decreasing, stable or increasing trends in fresh surface water nitrate concentrations between the reporting periods 2008-2011 and 2012-2015.
Figure 3. Percentage of fresh surface water stations with average values equal to or exceeding 25, 40 or 50 mg nitrate per L on average during 2012-2015 and the previous reporting periods.
Eutrophication
The assessment of the trophic status of rivers, lakes, and transitional and coastal water is based on orthophosphate and chlorophyll-a. The report presents tables and maps of averages and trends of the eutrophication parameters but does not assign an eutrophication status to the water bodies.
|
% of points (mg PO4/L)
|
<=0.1
|
>0.1 to <=0.5
|
>0.5 to <=1
|
>1 to <=2
|
>2
|
|
Rivers and lakes
annual average
|
48.4%
|
41.1%
|
6.6%
|
2.8%
|
1.1%
|
|
Transitional/coastal/marine
annual average
|
81.4%
|
15.8%
|
2.4%
|
0.2%
|
0.2%
|
|
|
|
|
|
|
|
|
% of points (µg chlorophyll-a/L)
|
<=2
|
>2 to <=8
|
>8 to <=25
|
>25 to <=75
|
>75
|
|
Rivers and lakes
summer average
|
3%
|
51%
|
32%
|
13%
|
2%
|
|
Transitional/coastal/marine
Summer average
|
7%
|
67%
|
17%
|
8%
|
1%
|
Table 2. Orthophosphate concentrations (upper table, mg PO4/L) and chlorophyll-a mean summer concentrations (lower table, µg/L) for the current Reporting period.
The trends between the previous and current Reporting period show predominantly stable water quality for orthophosphate, but an increasing concentration of chlorophyll-a.
Main findings of monitoring programmes in line with Article 5 (6) of the Directive
The majority of sites are monitored as part of a regular monitoring programme with frequent sampling with the major supply sites being sampled most frequently. Further details are not reported.
Pressure from agriculture
Compared to the previous reporting period the total agricultural area in the current reporting period increased by 1%. The annual use of N from animal manure mineral fertilizer N was not reported (only aggregated data for fertilizer use in England and Wales). The mineral fertilizer use on grass and arable land decreased by 6% and 1%, respectively, between 2015 and 2011. The farm numbers changed by less than 1% when comparing the current and previous Reporting period. The number of cattle decreased by 4%, while the number of pigs and poultry increased by 6% and 4%, respectively. Nitrogen excretion changed accordingly for the different types of animals. It is reported that in addition to livestock manure, digestate (agricultural and food-based feedstocks) and compost (food waste and green compost) are increasingly being applied to agricultural land. According to different surveys, 92 kt N of digestate (2013) and 192 kt N of compost (2012) was applied to agricultural land in England and Wales, compared to 305 kt N from animal manures (England only).
In the NVZs the annual use of N from animal manure decreased by 5% and cattle numbers decreased by 9%. The changes in number of pigs (+4%) and poultry (+6%) were comparable to the whole territory.
Controls
In the previous Reporting period, 4% of the farmers concerned were visited for a full assessment of all measures, compared to 2.4% in the current Reporting period. Additionally, during this Reporting period 1.8% of the farmers in NVZ were checked for farm record keeping only. In the current Reporting period, 77% of the farmers complied with all measures, which is less than 95% in the previous Reporting period. Compliance is above 96% except for record keeping (70%). The impact of the Action Program is assessed by comparing practices in NVZs with England as a total. While inputs are similar, the percentage of farmers with a nutrient management plan using a recognised method is 47% in NVZs and 36% in the whole territory.
Designation of nitrate vulnerable zones (NVZs)
In the current Reporting period England had designated 74,666 km2, which is 58% of the total territory and 62% of the agricultural area. A review of the NVZs was completed during the current Reporting period. The area of NVZs was changed from 2013; the total designated area is 8% smaller than the designated area in the previous Reporting period (81,106 km2).
United Kingdom - Scotland
Water quality
Water monitoring stations
|
Description
|
Stations with measurements
|
Stations with trends
|
|
Total groundwater stations
|
314
|
289
|
|
Total fresh surface water stations
|
431
|
209
|
|
Total saline water stations
|
39
|
39
|
Table 1. Number of water monitoring stations
Groundwater quality
Nitrates concentration
Trends in nitrates concentration


Figure 2. Percentage of stations with decreasing, stable or increasing trends in average groundwater nitrate concentrations between the reporting periods 2008-2011 and 2012-2015.
Figure 1. Percentage of groundwater stations with average values equal to or exceeding 25, 40 or 50 mg nitrate per L during the current and previous reporting periods. Results are presented for all groundwater stations (at different depths).
Surface water quality
Nitrates concentration
Trends in nitrates concentration


Figure 4. Percentage of stations with decreasing, stable or increasing trends in fresh surface water nitrate concentrations between the reporting periods 2008-2011 and 2012-2015.
Figure 3. Percentage of fresh surface water stations with average values equal to or exceeding 25, 40 or 50 mg nitrate per L on average during 2012-2015 and the previous reporting periods.
Eutrophication
The assessment of the trophic status is based on orthophosphate, chlorophyll-a and (not specified) bio-indicators. This accords with the UK approach for identifying waters as “eutrophic, or which may become eutrophic”, as set out in the guidance document “UK Supplement to Agreed Criteria for identifying Sensitive Areas (Eutrophic) & Polluted Waters Eutrophic” (Anon.).
On the basis of the assessment one water body in Scotland (Montrose basin), situated within a NVZ, has been identified as eutrophic or likely to become eutrophic.
|
|
2008-2011
|
2012-2015
|
|
Rivers and lakes
|
0
|
0
|
|
Transitional/coastal/marine
|
1
|
1
|
|
Total
|
1
|
1
|
Table 2. Number of water bodies identified as eutrophic or likely to become eutrophic during the previous and current reporting period.
Main findings of monitoring programmes in line with Article 5 (6) of the Directive
The report does not present details about the organisation of the monitoring network.
Pressure from agriculture
Compared to the previous Reporting period , in the current Reporting period the total agricultural area decreased by 12% whereas the areas available for manure decreased by 1%. The annual use of N from animal manure decreased by 1% while the use of mineral N increased by 13%. The farm numbers decreased by 2%, but the number of farms with livestock increased by 28%. Cattle numbers were stable, whereas sheep, pigs and poultry numbers decreased by 2%, 16% and 2%, respectively. Nitrogen excretion by animal category for the whole of Scotland was only reported for the current Reporting period.
Agricultural pressures inside NVZs are only reported for the current Reporting period.
Controls
In Scotland 1% of the farmers in the NVZs are visited each year, resulting in 382 inspections in this Reporting period. Overall, 86% of the farms complied with all requirements. The individual measure with the lowest compliance (94%) was the maximum N use.
Designation of nitrate vulnerable zones (NVZs)
In Scotland the four current NVZs (11,256 km2) cover 14% of the total land area and 17% of the agricultural land. A review in 2013 has resulted in a new NVZ and addition of a new area to an existing NVZ (designated from 1 January 2016), and removal of some areas (5 February 2015). As these changes did not come into force until February 2015, these are not included in the report.
Water quality
Water monitoring stations
|
Description
|
Stations with measurements
|
Stations with trends
|
|
Total groundwater stations
|
247
|
167
|
|
Total fresh surface water stations
|
1182
|
791
|
|
Total saline water stations
|
188
|
97
|
Table 1. Number of water monitoring stations
Groundwater quality
Nitrates concentration
Trends in nitrates concentration


Figure 2. Percentage of stations with decreasing, stable or increasing trends in average groundwater nitrate concentrations between the reporting periods 2008-2011 and 2012-2015.
Figure 1. Percentage of groundwater stations with average values equal to or exceeding 25, 40 or 50 mg nitrate per L during the current and previous reporting periods. Results are presented for all groundwater stations (at different depths).
Surface water quality
Nitrates concentration
Trends in nitrates concentration


Figure 4. Percentage of stations with decreasing, stable or increasing trends in fresh surface water nitrate concentrations between the reporting periods 2008-2011 and 2012-2015.
Figure 3. Percentage of fresh surface water stations with average values equal to or exceeding 25, 40 or 50 mg nitrate per L on average during 2012-2015 and the previous reporting periods.
Eutrophication
The assessment of the trophic status of rivers, lakes, and transitional and coastal water is based on orthophosphate and chlorophyll-a. The report presents tables and maps of averages and trends of the eutrophication parameters but does not assign an eutrophication status to the water bodies.
|
% of points (mg PO4/L)
|
0 to 0.1
|
>0.1 to 0.5
|
>0.5 to 1
|
>1 to 2
|
>2
|
|
Rivers and lakes
annual average
|
90
|
9
|
0.6
|
0.2
|
0.1
|
|
Transitional/coastal/marine
annual average
|
97
|
3
|
0
|
0
|
0
|
|
|
|
|
|
|
|
|
% of points (µg chlorophyll-a/L)
|
0 to 2
|
>2 to 8
|
>8 to 25
|
>25 to 75
|
>75
|
|
Rivers and lakes
summer average
|
11
|
67
|
21
|
1
|
0.5
|
|
Transitional/coastal/marine
Summer average
|
26
|
58
|
13
|
3
|
0
|
Table 2. Orthophosphate concentrations (upper table; mg PO4/L) and Chlorophyll-a mean summer concentrations (lower table; µg/L) for the current Reporting period.
The trends between the previous and current Reporting period show predominantly stable water quality for orthophosphate, and a significant proportion of stations with stable or increasing concentrations of chlorophyll-a.
Main findings of monitoring programmes in line with Article 5 (6) of the Directive
The organisation and frequency of the sampling are not reported except that the sampling frequency is stated as “variable, with the major water supply sites being sampled most frequently”.
Pressure from agriculture
Compared to the previous reporting period the total agricultural area in the current reporting period increased by 7%. The farm numbers increased by 5%. The number of cattle decreased by 2%, while the number of pigs and poultry increased by 7% and 2%, respectively.
Nitrogen excretion was not reported. The annual use of N from animal manure and mineral fertilizer N was not reported (only aggregated data for fertilizer use in England and Wales). Fertilizer N application to grass decreased from around 100 kg/ha in 2000 to around 60 kg/ha in 2008, and remained fairly stable since then.
It is reported that in addition to livestock manure, digestate (agricultural and food-based feedstocks) and compost (food waste and green compost) are increasingly being applied to agricultural land. According to different surveys, 92 kt N of digestate (2013) and 192 kt N of compost (2012) was applied to agricultural land in England and Wales.
Inside NVZs, on averagecattle numbers increased by 27%, pig numbers decreased by 35% and poultry increased by 131% compared to the previous Reporting period.
Controls
In Wales, 4% to 6% of the 800 farms were visited annually in the NVZ in the current Reporting period. The measure with the lowest compliance was record keeping (93%) and compliance with other measures was near to 100%.
Designation of nitrate vulnerable zones (NVZs)
In 2013, following a review of the water quality, the NVZ area increased from 444 km2 to 479 km2. The current NVZs cover 2.3% of the total land area and 2.5% of the agricultural land. A further review is underway and new NVZs are expected in 2017.
United Kingdom - Northern Ireland
Water quality
Water monitoring stations
|
Description
|
Stations with measurements
|
Stations with trends
|
|
Total groundwater stations
|
56
|
35
|
|
Total fresh surface water stations
|
338
|
322
|
|
Total saline water stations
|
24
|
24
|
Table 1. Number of water monitoring stations
Groundwater quality
Nitrates concentration
Trends in nitrates concentration


Figure 2. Percentage of stations with decreasing, stable or increasing trends in average groundwater nitrate concentrations between the reporting periods 2008-2011 and 2012-2015.
Figure 1. Percentage of groundwater stations with average values equal to or exceeding 25, 40 or 50 mg nitrate per L during the current and previous reporting periods. Results are presented for all groundwater stations (at different depths).
Surface water quality
Nitrates concentration
Trends in nitrates concentration


Figure 4. Percentage of stations with decreasing, stable or increasing trends in fresh surface water nitrate concentrations between the reporting periods 2008-2011 and 2012-2015.
Figure 3. Percentage of fresh surface water stations with average values equal to or exceeding 25, 40 or 50 mg nitrate per L on average during 2012-2015 and the previous reporting periods.
Eutrophication
Eutrophic waters are identified using Water Framework Directive (WFD) nutrient standards and Biological Quality Element (BQE) classification tools which are known to be sensitive to nutrient enrichment. The WFD status is converted one-to-one to Nitrates Directive trophic status.
Fresh waters
The assessment of the trophic status of rivers is based on soluble reactive phosphorus. The status of lakes is based on the lowest trophic class for total phosphorus or chlorophyll-a.

Figure 5. Fresh water eutrophication classification during the previous (rivers only) and current (rivers and lakes) reporting period.
Aggregated values for 2008-2011, Eutrophic and Hypertrophic: 15%
Aggregated values for 2012-2015, Eutrophic and Hypertrophic: 7%
Saline waters
The assessment of the trophic status of transitional and coastal water is based on dissolved inorganic nitrogen, dissolved oxygen, chlorophyll-a and macroalgae.

Figure 6. Saline water eutrophication classification during the previous and current reporting period.
Aggregated values for 2008-2011, Eutrophic and Hypertrophic: 24%
Aggregated values for 2012-2015, Eutrophic and Hypertrophic: 25%
Main findings of monitoring programmes in line with Article 5 (6) of the Directive
The Department of Agriculture, Environment and Rural Affairs (DAERA) has responsibility for monitoring water quality which includes providing monitoring data collected from surface waters and groundwater across Northern Ireland. In 2009, the surface freshwater monitoring network was revised to include broadening of the monitoring coverage in Northern Ireland under the Water Framework Directive (WFD) for the period 2009 - 2014. The proposal aimed to reduce the numbers of monitored sites from 579 to 528 whilst continuing to fulfil monitoring obligations under Water Framework Directive (WFD), Freshwater Fish Directive (FFD) and Nitrates Directive (ND). Further financial constraints, however, have led to additional revisions of the surface freshwater monitoring network. In 2010, the new monitoring approach incorporated monthly sampling at a reduced number of core sites (258) with the remainder of sites (270) monitored for 2 years within the 6-year River Basin Management Plans (RBMPs) cycle on a rolling programme basis (2009 - 2014). The average number of monthly samples analysed for nutrients reduced from 579 to an average of 348 in each year. Due to further current resources and budgetary constraints, changes to the monitoring program were implemented in 2015 for the second 6-year cycle of the River Basin Management Plan (RBMP: 2015 - 2021). Although WFD surveillance stations (monitoring sites) will continue to be sampled monthly, the remainder of the stations is sampled on a quarterly basis, i.e. 4 samples per year. In 2015, the average number of monthly samples analysed for nutrients was 157, while 368 stations were monitored quarterly.
The monitoring of the transitional and coastal marine water bodies has also undergone a change from a network of localised eutrophication monitoring points which were associated with known pressures and specific areas of concern to a network of monitoring sites to provide adequate coverage of all Northern Ireland transitional and coastal marine water bodies. Northern Ireland marine waters (both transitional and coastal) are now assessed for nutrient and ecological status using the WFD classification tools. The nutrient tool is based on the Oslo/Paris convention (OSPAR) criteria.
Regional monitoring of groundwater across Northern Ireland began in 2000. A major review of the groundwater monitoring network was undertaken in 2007 to ensure that the requirements of the WFD would be met. There were no major changes in the current Reporting period.
Pressure from agriculture
Compared to the previous Reporting period the total agricultural area did not change in the current Reporting period. The annual use of N from animal manure increased by 1% and also the use of mineral N increased by 4%. Cattle numbers did not change, while the number of sheep, pigs and poultry increased by 2%, 18% and 14%, respectively. Nitrogen excretion changed accordingly. Farm numbers increased by 2%.
Controls
Controls are carried out as part of the Cross compliance regulations and additional specific checks on compliance with the Nitrate Action Programme (NAP). The percentage of farms visited each year varied between 1.3% and 2.1% in the current Reporting period. Compliance with land application restrictions is above 94% except for Nitrogen fertilizer entering a waterway or groundwater (79%) and livestock manure storage requirements (82%).
The nitrogen efficiency for agriculture in Northern Ireland is used as measurable criterion for the impact of the NAP. The N efficiency is 23.2% in the current Reporting period, 0.3% higher compared to the previous Reporting period.
Designation of nitrate vulnerable zones (NVZs)
Northern Ireland applies a whole territory approach (13,500 km2).