EUROPEAN COMMISSION
Brussels, 11.10.2019
SWD(2019) 365 final
COMMISSION STAFF WORKING DOCUMENT
Statistical evaluation of irregularities reported for 2018: own resources, agriculture, cohesion and fisheries policies, pre-accession and direct expenditure
Accompanying the document
REPORT FROM THE COMMISSION TO THE EUROPEAN PARLIAMENT AND THE COUNCIL
30th Annual Report on the Protection of the European Union's financial interests - Fight against fraud - 2018
{COM(2019) 444 final} - {SWD(2019) 361 final} - {SWD(2019) 362 final} - {SWD(2019) 363 final} - {SWD(2019) 364 final}
Contents
1. Introduction
1.1. Scope of the document
1.2. Structure of the document
2. Traditional Own Resources
2.1. Introduction
2.2. General analysis –Trend analysis
2.2.1. Reporting years 2014-2018
2.2.1.1. Irregularities reported as fraudulent
2.2.1.2. Irregularities not reported as fraudulent
2.2.2. OWNRES data vs TOR collection
2.2.3. Recovery
2.2.3.1. Recovery rates
2.3. Specific analysis
2.3.1. Cases reported as fraudulent
2.3.1.1. Modus operandi
2.3.1.2. Method of detection of fraudulent cases
2.3.1.3. Smuggled cigarettes
2.3.1.4. Cases reported as fraudulent by amount
2.3.2. Irregularities not reported as fraudulent
2.3.2.1. Modus operandi
2.3.2.2. Method of detection of non-fraudulent cases
2.3.2.3. Solar panels vulnerable to irregularities – mutual assistance
2.3.2.4. Cases not reported as fraudulent by amount
2.4. Member States’ activities
2.4.1. Classification of cases as fraudulent and non-fraudulent and related rates
2.4.2. Recovery rates
2.4.2.1. Cases reported as fraudulent
2.4.2.2. Cases not reported as fraudulent
2.4.2.3. Historical recovery rate (HRR)
2.4.3. Commission’s monitoring
2.4.3.1. Examination of the write-off reports
2.4.3.2. Commission’s inspections
2.4.3.3. Particular cases of Member State failure to recover TOR
3.
Common Agricultural Policy (CAP)
3.1.
Introduction
3.2.
General analysis
3.2.1.
Irregularities reported 2014-2018
3.2.2.
Irregularities reported as fraudulent
3.2.3.
Irregularities not reported as fraudulent
3.3.
Specific analysis
3.3.1.
Modus operandi
3.3.1.1.
Support to agriculture (SA)
3.3.1.2.
Rural development (RD)
3.3.2.
Fraud and Irregularity Detection Rates by CAP components
3.3.3.
Market measures – fraudulent and non-fraudulent irregularities
3.3.4. Reasons for performing control
3.3.4.1 Irregularities in relation to rural development
3.3.4.2 Irregularities in relation to market measures
3.3.4.3 Irregularities in relation to direct payments
3.4.
Anti-fraud activities of Member States
3.4.1.
Duration of irregularities
3.4.2.
Detection of irregularities reported as fraudulent by Member State
3.4.2.1.
Reported during the period 2014-2018
3.4.2.2.
Reported in 2018
3.4.3.
Fraud and Irregularity Detection by sector and Member State
3.4.3.1.
Rural development
3.4.3.2.
Market measures
3.4.3.3.
Direct payments to farmers
3.4.3.4.
Concentration by sector and type of irregularity
3.4.4.
Ratio of established fraud / Dismissal ratio
3.5.
Recovery cases
1. Introduction
1.1. Scope of the document
The present document is based on the analysis of the notifications provided by national authorities of cases of irregularities and suspected or established fraud. Their reporting is performed in fulfilment of a legal obligation enshrined in sectoral European legislation.
The document accompanies the Annual Report adopted on the basis of article 325(5) of the Treaty on the Functioning of the European Union (TFEU), according to which “The Commission, in cooperation with Member States, shall each year submit to the European Parliament and to the Council a report on the measures taken for the implementation of this article”.
For this reason, this document should be regarded as an analysis of the achievements of the Member States.
The methodology (including the definition of terms and indicators), the data sources and the data capture systems are explained in detail in the Commission Staff Working Document – Methodology for the Statistical Evaluation of Irregularities accompanying the Annual Report on the Protection of the EU financial interests for the year 2015.
1.2. Structure of the document
The present document is divided in two parts.
The first part is dedicated to the analysis of irregularities reported in the area of the Traditional Own Resources (Revenue).
The second part, concerning the expenditure part of the budget, is composed of four sections, dedicated to shared, decentralised and centralised management modes.
The sections dedicated to shared management, cover agriculture, cohesion policy and fisheries and other internal policies. Decentralised management refers to the pre-accession policy, while the centralised management section mainly deals with internal and external policies for which the Commission directly manages the implementation.
The document is completed by 28 country factsheets, which summarise, for each Member State, the main indicators and information that have been recorded throughout the analyses.
15 Annexes complement the information and data, providing a global overview of the irregularities reported according to the relevant sector regulations. Annexes 1 to 10 concern Traditional Own Resources, Annexes 11 to 14 complement information on the methodology for the analysis of irregularities concerning expenditure, Annex 15 covers all the expenditure sectors for which Member States and beneficiary countries have a reporting obligation.
Part I - REVENUE
2. Traditional Own Resources
2.1. Introduction
The technical explanations and the statistical approach are explained in the accompanying document 'Methodology regarding the statistical evaluation of reported irregularities for 2015'.
The following analysis is based on the data available on the cut-off date (15 March 2019) and aims to provide an overview of the reported cases of fraud and irregularities reported for 2018 together with their financial impact.
2.2. General analysis –Trend analysis
2.2.1. Reporting years 2014-2018
The number of irregularities reported as fraudulent and non-fraudulent via OWNRES for 2018 (4 563) is about 11 % lower than the average number of cases reported for the 2014-2018 period (5 139).
The total estimated and established amount of TOR involved (EUR 615 million) is about 22 % higher than the average estimated and established amount for years 2014-2018 (EUR 504 million).
In 2018, seven big cases for a total amount of about EUR 216 million were reported compared to 2017, when two big cases with a total amount of about EUR 37 million affected the total estimated and established amount. Luxemburg and Malta did not communicate any case exceeding an amount of EUR 10 000.
CHART TOR1: Total number of OWNRES cases and the related estimated and established amount (2014-2018)
Annex 1 of the summary tables shows the situation on the cut-off date (15 March 2019) for the years 2014-2018.
2.2.1.1. Irregularities reported as fraudulent
The number of cases reported as fraudulent registered in OWNRES for 2018 (473) is currently 20% lower than the average number of cases reported for the 2014-2018 period (594).
The total estimated and established amount of TOR involved (EUR 165 million) represents a increase of 37% of the average estimated and established amount for the years 2014-2018 (EUR 120 million).
For 2018, the Czech Republic, Luxemburg, and Malta did not communicate any fraudulent case exceeding an amount of EUR 10 000.
CHART TOR2: OWNRES cases reported as fraudulent and the related estimated and established amount (2014-2018)
On the cut-off date (15 March 2019), 10 % of all cases detected in 2018 were classified as fraudulent. The percentage increased slightly in comparison to 2017 (9,5 %).
Annex 2 of the summary tables shows the situation on the cut-off date for years 2014-2018.
2.2.1.2. Irregularities not reported as fraudulent
At the same time, the number of cases not reported as fraudulent communicated via OWNRES for 2018 (4 090) was 10 % lower than the average number reported for 2014-2018 (4 545).
The total estimated and established amount of TOR (EUR 450 million) was 17 % higher than the average estimated and established amount for the years 2014-2018 (EUR 384 million).
Luxemburg and Malta did not report any case of irregularity exceeding an amount of EUR 10 000 for 2018.
CHART TOR3: OWNRES cases not reported as fraudulent and the related estimated and established amount (2014-2018)
Annex 3 of the summary tables shows the situation on the cut-off date for years 2014-2018.
2.2.2. OWNRES data vs TOR collection
In 2018, the total established amount of TOR (gross) was EUR 25.7 billion and about 98 % was duly recovered and made available to the Commission via the A-account. According to the OWNRES data, around EUR 615 million has been established or estimated by the Member States in connection with cases reported as fraudulent/non fraudulent where the amount at stake exceeds EUR 10 000.
The total estimated and established amount reported in OWNRES represent 2.43 % of the total collected TOR (gross) amount in 2018. This proportion has increased compared with 2017 when it was 1.96 %. A percentage of 2.43 % indicates that of every EUR 100 of TOR (gross) established, an amount of EUR 2.43 is registered as irregular (fraudulent or non-fraudulent) in OWNRES. There are differences among the Member States. In six Member States, the percentage is above the average of 2.43 %. The highest percentage for 2018 can be seen in France, Lithuania and Portugal with 4.67 %, 4.49 % and 4.27 % respectively.
For the seven Member States which established and made available most of the TOR amounts, the average percentage of the estimated and established OWNRES amounts to established TOR for 2018 was equal to 2.66 %. In comparison with the previous year (2.02%), this represents an increase of 0,64%. For France, the proportion of estimated and established OWNRES amounts to established TOR increased in 2018 (4,67%) compared to the previous year (1,43%), while for the Netherlands it has increased from 2,62% to 4,18% and for Spain and Italy decreased by 2,53 % and 0,14 % respectively. For the other three Member States, the average proportion of estimated and established OWNRES amounts to established TOR increased in 2018 (2,47 %) compared to the previous year (1,88 %).
TOR MAP1: Showing the percentage of estimated and established amount in OWNRES of established TOR for 2018
2.2.3. Recovery
The fraud and irregularity cases detected in 2018 correspond to an established amount of EUR 584 million. Nearly EUR 225 million of this was recovered in cases where an irregularity was found and EUR 95 million in fraudulent cases. In total EUR 320 million was recovered by all Member States for all cases which were detected in 2018. In absolute figures, Germany recovered the highest amount in 2018 (EUR 85 million) followed by France (84 million). This is a starting point for the recovery. Analysis shows that lengthy recovery procedures spread over several years are usually required due to administrative and judicial procedures in complex cases or cases with huge financial impact.
In addition, Member States continued their recovery actions related to the detected cases of previous years.
2.2.3.1. Recovery rates
Over the past five years the annual recovery rate has varied between 48 % and 65 % (see CHART TOR4). The recovery rate for cases reported in 2018 is currently 55 %. In other words, out of every amount over EUR 10 000 of duties established and reported for 2018 in OWNRES as irregular/fraudulent, approximately EUR 5 500 has already been paid.
CHART TOR4: Annual recovery rates (2014-2018)
The overall recovery rate is a correlation between the detection, the established amount and the current recovery stage of individual cases (high additional duty claims are more frequently associated with long lasting administrative and criminal procedures).
Recovery rates vary among the Member States. The highest recovery rates for 2018 are in Slovenia (100%), Sweden (97%), Czech Republic (95%), Finland (93 %), Hungary (91 %), France (89%) and Austria (84%). Differences in recovery results may arise from factors such as the type of fraud or irregularity, or the type of debtor involved. Because recovery is ongoing, it can be expected that the recovery rate for 2018 will also go up in the future.
On the cut-off date (15 March 2019), the overall recovery rate for all years 1989-2018 was 63 %.
2.3. Specific analysis
2.3.1. Cases reported as fraudulent
2.3.1.1. Modus operandi
A breakdown by types of fraud reveals that most fraudulent cases in 2018 relate to smuggling of goods, incorrect origin or country of dispatching, valuation or classification/misdescription.
Of all cases reported as fraudulent about 74 % concern such goods as tobacco, vehicles, electrical machinery and equipment, textiles, preparation of foodstuffs, articles of iron and steel and leather. In monetary terms those groups of goods represent about 77 % of all amounts estimated and established for cases reported as fraudulent. China, Brazil, South Korea, Belarus, United States and United Arab Emirates are the most important - in monetary terms - countries of origin of goods affected by fraud.
2.3.1.2. Method of detection of fraudulent cases
In 2018, inspections by anti-fraud services (46 %) was the most successful method of detecting fraudulent cases followed by customs controls carried out at the time of releasing of goods (25 %) and post-release controls (19 %).
CHART TOR5: Method of detection 2018 – Cases reported as fraudulent – by number of cases
In monetary terms, of the EUR 165 million estimated or established in fraudulent cases registered for 2018, around 51 % were discovered during a post-release control, 39% during an inspection by anti-fraud services, 6 % during a control at the time of release of the goods.
CHART TOR6: Method of detection 2018 – Cases reported as fraudulent – by estimated and established amount
In seven Member States more than 50 % of all estimated and established amounts in fraudulent cases were detected by anti-fraud services. As regards amounts, controls at the time of release of goods were the most important method for detecting fraudulent instances in Denmark, Estonia, Croatia, Latvia, Poland, Slovenia, Slovakia, Finland, Sweden and the United Kingdom whereas post-release controls were in Bulgaria, France, Hungary, the Netherlands and Portugal.
In Cyprus, 100 % of all estimated and established amounts in fraudulent cases were detected by an inspection by services or bodies other than customs.
2.3.1.3. Smuggled cigarettes
In 2018, there were 169 cases of smuggled cigarettes registered (CN code 24 02 20 90) involving estimated TOR of around EUR 20 million. In 2017 the number of cases of smuggled cigarettes was 173, totalling around EUR 25 million.
The highest number of cases was reported by the UK (30), Spain (26) and Lithuania (19). The highest amount was reported by Greece (EUR 4.7 million). No cases were reported by nine Member States.
Table TOR1: Cases of smuggled cigarettes in 2018
|
TOR: Cases of smuggled cigarettes* in 2018
|
|
MS
|
Cases
|
Established and estimated amount
|
|
|
N
|
EUR
|
|
BE
|
5
|
2.914.764
|
|
BG
|
1
|
73.834
|
|
DE
|
7
|
334.529
|
|
EE
|
4
|
568.102
|
|
IE
|
9
|
1.468.085
|
|
EL
|
15
|
4.690.915
|
|
ES
|
26
|
2.172.336
|
|
FR
|
18
|
1.397.422
|
|
HR
|
2
|
264.959
|
|
IT
|
1
|
991.692
|
|
LV
|
7
|
779.838
|
|
LT
|
19
|
1.853.247
|
|
AT
|
1
|
30.643
|
|
PL
|
16
|
1.430.997
|
|
PT
|
1
|
51.144
|
|
SK
|
3
|
57.532
|
|
FI
|
3
|
66.719
|
|
SE
|
1
|
33.964
|
|
UK
|
30
|
1.148.881
|
|
Total
|
169
|
20.329.603
|
2.3.1.4. Cases reported as fraudulent by amount
In 2018, the estimated and established amount was below EUR 100 000 in 340 cases reported as fraudulent (72 % of all fraud cases), whereas it was above EUR 100 000 in 133 cases (28%).
The total estimated and established amount in cases reported as fraudulent, where the amount at stake was above EUR 100 000, amounted to EUR 153 million (93 % of the total estimated and established amount for cases reported as fraudulent).
Table TOR2: Cases reported as fraudulent by amount category in 2018
|
Amount, EUR
|
N
|
Estimated and established amount, EUR
|
|
< 100 000
|
340
|
11.826.806
|
|
>= 100 000
|
133
|
153.407.855
|
|
Total
|
473
|
165.234.662
|
2.3.2. Irregularities not reported as fraudulent
2.3.2.1. Modus operandi
A breakdown of irregularities by type of fraud shows that most cases of irregularity related to incorrect declarations (incorrect classification, customs value or incorrect use of preferential arrangements) and formal shortcomings (shortcomings in external transit or failure to fulfil obligations or commitments).
Not all customs procedures are equally susceptible to irregularities; their vulnerability may change in the course of time as certain economic sectors are briefly targeted. The customs procedure ‘release for free circulation’ is the customs procedure mostly affected by irregularities since at the time of release for free circulation the non-compliance in the customs declaration may relate to a large number of irregularities, e.g. to the tariff, CN code, (preferential) origin, incorrect value, etc. On the other hand, in customs suspension regimes (like warehousing, transit, inward processing, etc. - where the payment of duties is suspended) the sole irregularity that might occur is the subtraction of the goods from customs supervision. Thus, it is normal, and indeed to be expected, that most fraud and irregularities be reported in connection with the procedure ‘release for free circulation’.
In 2018 most of the estimated and established amounts in OWNRES in the EU-28 (81 %) for cases reported as non-fraudulent related to the customs procedure ‘release for free circulation’. In all, 15% of all amounts estimated or established in cases not reported as fraudulent in 2018 involved inward processing. Other customs procedures are only marginally affected in 2018.
Of all cases reported as non-fraudulent about 50 % concern electrical machinery and equipment, vehicles, mechanical machinery and appliances, plastics, articles of iron and steel and textiles. In monetary terms those groups of goods represent about 64 % of all amounts estimated or established for cases reported as non-fraudulent. China, United States, Japan, Russia, India and Brazil are - in monetary terms – the most important countries of origin of goods affected by irregularities.
2.3.2.2. Method of detection of non-fraudulent cases
In 2018, most non-fraudulent cases (50 %) were revealed during post-release customs controls. Other methods of detection for non-fraudulent cases that featured frequently were voluntary admission (21 %), release controls (14 %), tax audits (9 %), followed by inspections by anti-fraud services (4%).
CHART TOR7: Method of detection 2018 – Cases not reported as fraudulent – by number of cases
Considering the estimated or established amounts, around 68 % of all irregularity cases registered for 2018 were discovered during a post-release control, 13 % were related to voluntary admission, 7 % to a control at the time of releasing the goods, whereas 6 % related to a tax audit and 4 % were found during an inspection by anti-fraud services.
CHART TOR8: Method of detection 2018 – Cases not reported as fraudulent – by estimated and established amounts
In 15 Member States, more than 50 % of all non-fraudulent cases — in amounts — were detected by post-release controls. In Portugal, Romania and Slovakia more than 50 % of the amounts relating to non-fraudulent cases were detected by anti-fraud services. Significant amounts were reported as non-fraudulent following voluntary admission by the United Kingdom (EUR 29 million) and Germany (EUR 16 million). In 15 Member States voluntary admission was keyed in as a method of detection of cases reported as non-fraudulent.
2.3.2.3. Solar panels vulnerable to irregularities – mutual assistance
In 2018, solar panels originating in China were especially vulnerable to non-fraudulent reported irregularities in monetary terms. About 29 % (EUR 128 million) of the total amount that was established in non-fraudulent irregularities concerned this type of goods. Incorrect classification/misdescription and incorrect country of origin or dispatching country were the main pattern of the infringement reported. The United Kingdom and the Netherlands were particularly affected by this type of goods and infringement. Another seven Member States reported also cases related to solar panels to a smaller extent. Mutual Assistance notices issued by OLAF with regard to those goods in the previous years raised the Member States’ attention and the need for customs controls on imports of solar panels. This underlines the importance of investigations conducted by OLAF in this particular field.
2.3.2.4. Cases not reported as fraudulent by amount
In 2018, the established amount was below EUR 100 000 in 3 586 non-fraudulent cases (88 % of all irregularity cases), whereas it was above EUR 100 000 in 504 cases (12 %).
The total estimated and established amount in non-fraudulent cases where the amount at stake was above EUR 100 000 amounted to EUR 359 million (80 % of the total estimated and established amount for non-fraudulent cases).
Table TOR3: Cases not reported as fraudulent by amount category in 2018
|
Amount, EUR
|
N
|
Estimated and established amount, EUR
|
|
< 100 000
|
3 584
|
91.078.619
|
|
>= 100 000
|
506
|
358.627.831
|
|
Total
|
4 090
|
449.706.450
|
2.4. Member States’ activities
2.4.1. Classification of cases as fraudulent and non-fraudulent and related rates
For 2018, Member States reported 473 cases as fraudulent out of a total of 4 563 cases reported via OWNRES, which indicates a Fraud Frequency Level (FFL) of 10 %. The differences between Member States are relatively large. In 2018, 13 Member States categorised between 10-50 % of all cases reported as fraudulent. However, Czech Republic did not categorise any cases reported as fraudulent. Eight Member States categorised less than 10 % of cases as fraudulent. Four Member States registered more than 50 % of cases as fraudulent.
In 2018, the total estimated and established amount affected by fraud in the EU was EUR 165 million and the Fraud Detection Rate (FDR) was 0.65 %. For 2018, the highest percentages can be seen in France (3.90 %), Greece (2.31 %) and Croatia (2.24 %).)
The total estimated and established amount affected by cases not reported as fraudulent was more than EUR 450 million which indicates an Irregularity Detection Rate (IDR) of 1.78 %. The highest percentages can be seen in the Netherlands (4.10 %), Portugal (3.55 %) and the UK (3.45 %).
There are large differences between Member States’ classifications, which may partly depend on their classification practices. This can influence the comparison of the amounts involved in cases reported as fraudulent and as non-fraudulent by Member States. Moreover, individual bigger cases detected in a specific year may affect annual rates significantly. Factors such as the type of traffic, type of trade, the level of compliance of the economic operators, the location of a Member State can influence the rates significantly. Bearing in mind these variable factors, the rates of incidence can also be affected by the way a Member State’s customs control strategy is set up to target risky imports and to detect TOR-related fraud and irregularities.
2.4.2. Recovery rates
2.4.2.1. Cases reported as fraudulent
Over the 1989-2018 period, OWNRES shows that, on average, 22 % of the initially established amount was corrected (cancelled). The recovery rate (RR) for all years (1989-2018) is 41 %. The RR for cases reported as fraudulent and detected in 2018 was 70 % mainly because of one large debt recovered by France and is significantly above the average rate of 39% for fraudulent cases for the 2014-2018 period. In general, the RR in cases reported as fraudulent is clearly much lower than that for cases not reported as fraudulent.
2.4.2.2. Cases not reported as fraudulent
OWNRES shows that on the cut-off date, on average 36 % (1989-2018) of the initially established amount in relation to cases not reported as fraudulent has been corrected (cancelled) since 1989. The RR for non-fraudulent cases reported for 2018 is 50%. On the cut-off date, the annual RR for the last five years has varied between 51% and 81%. The overall RR for all years (1989-2018) for all cases not reported as fraudulent is 72 %.
2.4.2.3. Historical recovery rate (HRR)
The HRR confirms that in the long term recovery in cases reported as fraudulent is generally much less successful than in cases not reported as fraudulent (see table TOR4). Classification of a case as fraudulent is thus a strong indicator for forecasting short- and long-term recovery results.
Table TOR4: Historical recovery rate (HRR)
|
Irregularities
|
HRR 1989-2015
|
|
Reported as fraudulent
|
56,37 %
|
|
Reported as non-fraudulent
|
90,72 %
|
|
Total
|
81,64 %
|
2.4.3. Commission’s monitoring
2.4.3.1. Examination of the write-off reports
In 2018, 12 Member States submitted 73 new write-off reports to the Commission. In 2018, the Commission assessed 188 cases totalling EUR 113 million. In 33 of these cases amounting to EUR 20 million, the Commission's view was that the Member States did not demonstrate satisfactorily that the TOR was lost for reasons not imputable to them so they were considered financially responsible for the loss.
Examination of Member States’ diligence in write-off cases constitutes a very effective mechanism for gauging their activity in the field of recovery. It encourages national administrations to step up the regularity, efficiency and effectiveness of their recovery activity, since any lack of diligence leading to failure to recover results in individual Member States having to foot the bill.
2.4.3.2. Commission’s inspections
In its TOR inspections, the Commission has put a special emphasis on Member States’ customs control strategies and closely monitors their actions and follow-up in relation to the observations made during the inspections. Member States generally show their willingness to adapt their control strategies and to progressively implement systems that provide for efficient and effective risk analysis to protect the EU’s financial interests. However, budgetary constraints and the increase of tasks related to security have led to cuts in the number of customs officials in charge of duty collection control in many Member States. Coupled with continuing trade facilitations and simplification of procedures and controls, this may undermine the control efficiency and thus pose risks to the protection of the EU financial interest.
In 2018, the general subject of inspection was the keeping of the separate account and the corrections of the normal account, with a specific emphasis on the written-off amounts between EUR 50.000 and EUR 100.000. "Control strategy in the field of customs value" and "Control of imports of solar panels" were the main inspection themes of the on-the-spot customs inspections by the Commission services in Member States.
One general conclusion drawn by the Commission from its inspections in Member States in recent years is that their control strategies are increasingly shifting from customs controls at the time of release of goods to post-release customs controls. The customs controls before or at the time of release of goods remain however indispensable for addressing undervaluation and the detection of new types or patterns of fraud or irregularities.
The digitalisation of the global economy and new economic models like e-commerce is shifting the cross-border trade quickly from a few large/bulk shipments into a large number of low-value and small shipments.
With growing cross-border e-commerce the Member States’ customs control strategies need to be adapted to the changing business models and trade patterns such as e-commerce which poses risks for the EU’s financial interests and the effectiveness of the customs controls. Those risks are in particular related to abuse of the low-value consignment reliefs by undervaluation of e-commerce trade goods, by splitting consignments to be under the relief threshold, by importing of commercial consignments declared as gifts or by importing of goods ineligible for the relief.
A flexible combination of different controls is therefore needed to close any loophole exploited by fraudsters and to enable customs an effective protection of the EU’ financial interests. Therefore, the customs controls strategy should be frequently reviewed taking into account recent detections or new risks and addressing the challenges of the global economy and new business models like e-commerce.
Furthermore, EU-wide and international cooperation in detection of irregular cases is more and more required taking into account the fraud diversion and spreading of specific fraud mechanism.
2.4.3.3. Particular cases of Member State failure to recover TOR
If TOR are not established or recovered because of an administrative error by a Member State, the Commission applies the principle of financial liability. Member States have been held financially liable in 2018 for over EUR 35 million, and new cases are being given appropriate follow-up.
PART II - EXPENDITURE
Sustainable growth: natural resources
The emphasis of the European Union's (EU) policy in this field is on increasing farms' profitability, diversifying the rural economy and protecting the natural environment. There is a direct management component but the majority of expenditure is disbursed by Member States under shared management.
For the purpose of this analysis, the Common Agricultural Policy (CAP) is split in two main parts:
oDirect support to agriculture (SA), through direct payments to farmers and measures to respond to market disturbances, such as private or public storage and export refunds, which are entirely financed by the European Agricultural Guarantee Fund (EAGF);
oRural development programmes of the Member States (RD), which are mainly co-financed through the European Agricultural Fund for Rural Development (EAFRD).
The European Maritime and Fisheries Fund (EMFF) provides funding and technical support for initiatives that can make the fishery industry more sustainable. The EMFF is the successor of the European Fisheries Fund (EFF), for which the full resources have been committed by the end of 2014. Table NR1 shows also the financial resources available for this policy area. However, in light of their belonging to the European Structural and Investment Funds (ESIF) family, EFF and EMFF are treated together with the other structural funds. EAFRD and the EMFF are among the five ESIF which complement each other and seek to promote a growth and job based recovery in Europe.
3.Common Agricultural Policy (CAP)
3.1.Introduction
For the last 50 years, the CAP has been the most important EU common policy. This explains why traditionally it has taken a large part of the EU's budget, although the percentage has steadily declined over recent years.
The CAP is financed by two funds, EAGF and EAFRD, which form part of the EU's general budget.
Under the basic rules for the financial management of the CAP, the European Commission (EC) is responsible for the management of the EAGF and the EAFRD. However, the EC itself does not make payments to beneficiaries. According to the principle of shared management, this task is delegated to the Member States, who themselves work through national or regional paying agencies. Before these paying agencies can claim any expenditure from the EU-budget, they must be accredited on the basis of a set of criteria laid down by the EC.
The paying agencies are, however, not only responsible for making payments to the beneficiaries. Prior to doing so, they must, either themselves or through delegated bodies, satisfy themselves of the eligibility of the aid applications. The exact checks to be carried out are laid down in the CAP sectorial regulations and vary from one sector to another.
The expenditure made by the paying agencies is then reimbursed by the EC to the Member States, in the case of the EAGF on a monthly basis and in the case of EAFRD on a quarterly basis. Those reimbursements are, however, subject to possible financial corrections which the EC may make under the clearance of accounts procedures.
Apart from a difference in scope and objectives, the two funds also function differently. While entitlements and measures supported under the EAGF follow a yearly flow, those under the EAFRD are implemented through multi-annual programmes, very much like the interventions financed through the other ESI funds.
Table NR2 shows the financial resources available for the CAP, giving the detail of the share devoted to market measures and direct payments to farmers.
3.2.General analysis
3.2.1.Irregularities reported 2014-2018
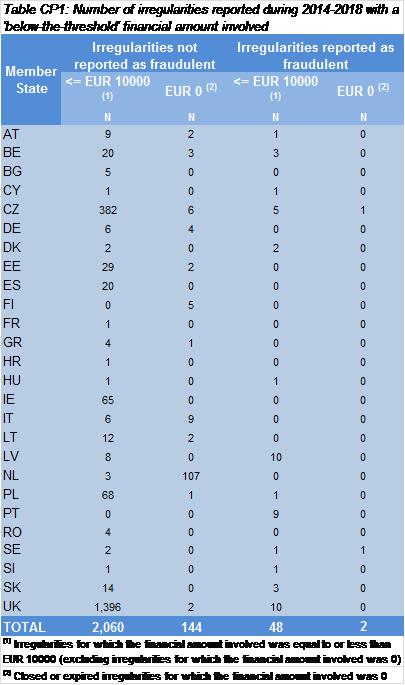
In general, Member States are requested to communicate irregularities with financial amounts involved above EUR 10 000. However, a number of cases with irregular financial amounts equal or below this threshold have been reported by several Member States. Table NR3 provides an overview by Member State. Furthermore, Member States reported cases with financial amounts involved equal to zero. This may be due to the fact that the competent national authority did not have enough information yet to quantify the irregular amounts involved. However, this should not be the case once the case is closed or expired. Table NR3 provides also an overview by Member State of the closed/expired cases, for which the national autorithies have not mentioned the irregular financial amounts involved.
It is not clear why there are some Member States that reported many more 'below-the-threshold' irregularities than others. It should be considered that an irregularity may consist of irregular or fraudulent operations which are interlinked and whose total financial impact exceeds EUR 10 000, even though each operation remains below the threshold. In this case, a number of Member States may have chosen to report these irregularities separately, while other Member States may have combined them in one irregularity. Another explanation may relate to irregularities that were reported because the initial estimation of the irregular financial amounts involved exceeded EUR 10 000, but subsequent updates lowered these financial amounts below the threshold. Furthermore, about 30% of the 'below-the-threshold' irregularities were still open at the cut-off date; the competent national authority might have decided to report them anyway, pending the exact quantification of the financial amount involved. Other explanations may refer to mis-typing or mis-interpretation of the reporting rules.

As shown by Table NR3, there were about 650 irregularities that taken separately were associated to a financial amount equal or below EUR 10 000, which represented less than 4% of all the relevant irregularities. In order to make use of all available information reported by the Member States, all these irregularities are considered in the analysis for this Report. However, Table NR3 provides the reader with additional information to put into context data about detections in different Member States.
Table NR4 shows the number of irregularities (fraudulent and non-fraudulent) reported by the Member States for the period 2014-18 in relation to 'rural development' (RD) and direct 'support to agriculture' (SA). Cases are classified as:
·RD, where they concern only expenditure for rural development;
·SA, where they do not concern rural development expenditure. SA includes expenditure in relation to intervention in agricultural markets and direct payments to farmers;
·'SA/RD', where they concern both types of expenditure (rural development and direct support to agriculture);
·'Unclear', where information is not considered enough to classify the irregularity in any of the other categories.
Annex 11 provides a detailed explanation about the classification of cases.
When inputting a case into the Irregularities Management System (IMS), the contributor is requested to specify the currency in which the amounts are expressed. Where the value of this field is 'EUR' or the field has been left blank, no transformation is applied. Where this field has been filled with another currency, the financial amounts involved in the irregularity are transformed on the basis of the exchange rates published by the ECB at the beginning of 2019.
In 2018, the number of the irregularities related to CAP decreased by 5% (in comparison with 2017) and this brought them to the lowest level recorded during the last five years. The irregularities notified by a minority of Member States (Italy, Romania, Portugal, Spain, Bulgaria, France and Lithuania) represented more than 70% of the total number of the irregularities reported in 2018.
The two types of support (RD and SA) are provided following two different modes. SA follows an annual implementation, while RD finances programmes in a multiannual context, which resembles that of the ESI Funds. In fact, the trends of irregularities detected and reported in relation to RD and ESI Funds are similar and are influenced by the implementation modes. As a consequence, the irregularities related to RD noticeably increased until 2015, then declined at a rather constant and sustained pace during 2016-2017, before stabilising in 2108 (see the chart associated to Table NR4). Overall, the decrease from the 2015 peak has been about -36%. Following a different pattern, the irregularities affecting SA have been relatively stable over time, fluctuating between 1 000 and 1 200 reported cases.
Table NR5 provides information about the financial amounts involved in the cases considered in Table NR4.
The trend of the financial amounts must be assessed while bearing in mind that it can be strongly influenced by single observations of significant value. During 2014-2018, cases which involved financial amounts over 1 million represented less than 1% in terms of numbers, but 32% in terms of amounts. 62% of these 'over 1 million' cases concerned RD, while 36% concerned SA. In such a context, where such a significant portion of the financial amounts is linked to a relatively low number of cases, fluctuations are more likely and should not be over-interpreted. However, the continuous growth of the financial value of irregularities related to RD until 2015 and the specular decrease thereafter were in line with the general trend of irregularities shown in Table NR4.

In 2018, the financial amounts involved in irregularities related to rural development accounted for about 55% of the total. However, one has to bear in mind that, in 2018, RD represented about 20% of the total resources devoted to the CAP. In fact, as in past years, the weight of the financial amounts involved in irregularities on payments is very different between the two types of support, as it is 0.2% for SA and 1.4% for RD (0.5% on the overall 2018 CAP expenditure). This is consistent with the findings of the European Court of Auditors (ECA) referring to 2017, according to which payments made on an entitlement basis (including direct aid to farmers, which is the biggest part of SA) are not affected by a material level of error. According to ECA, direct payments to farmers have benefited from simplified land eligibility rules and an effective ex-ante control system (IACS) that allows automated cross-checks between databases. Payments made on a reimbursement basis (which include rural development) are affected by a higher level of error. See also Section 3.3.2.
In 2018, the financial amounts have decreased by 14% in comparison with 2017, which is more than the decrease in terms of numbers. During the overall period under consideration, SA financial amounts have been following a rather horizotal trend with ups and downs due to a few cases with exceptional amounts involved. Concerning RD financial amounts, in 2018, although the number of irregularities was stable, they continued on the declining path that had started after the 2015 peak, but at a slower pace. This translated in a slight decrease of the average financial amount (AFA) of RD irregularites, which has been broadly stable during 2015-2018. Considering the overall period 2014-2018, the AFA involved in SA cases was higher than in RD cases (+49%).
The AFA of the reported irregularities can be seen as an indicator of the detection capacity. Targeting the limited resources that are available for detection, investigation and (where relevant) prosecution on cases with a higher financial impact can be beneficial in terms of efficiency, recovery and deterrence.
As mentioned, trends are overly influenced by irregularities with exceptional financial amounts, and during 2014-2018 this was particularly the case for SA. This had an obvious impact also on the trends related to AFAs. Graph NR1 shows these trends. The higher volatility related to SA is clear. In order to get a better grasp of the underlying dynamics, Graph NR1 shows also the SA and RD trends, net of irregularities with exceptional financial amounts involved. After this 'filtering', the AFAs of RD and SA irregularities were broadly aligned during the period under consideration, with the exception of 2018. In this year, the AFA of SA irregularities significantly exceeded that of RD irregularities (+30%).
Most of the SA cases with exceptional financial amounts referred, at least in part, to market measures (MM). In general, taking the whole period 2014-2018 together, when SA is considered net of all SA cases concerning market measures, its AFA is lower than that of RD cases. Consistently, the AFAs of SA, net of MM, basically overlap with AFAs of direct payments to farmers (DA), with the exception of 2015.
Given the above, in an attempt to isolate the 'core' trends, Graph NR2 show the SA, RD, MM and DA AFAs during the last five years, when the first and the last percentiles are excluded from the analysis.
Graph NR2 shows that irregularities including a market measure component recorded the highest AFA, which is increasing. The AFA of SA irregularities followed a rather stable trend, with a slight tendency to increase over time. The AFA of RD cases fluctuated around those of the SA cases, with a slight tendency to decrease. The difference was significant in 2018 (-20% for RD AFA), but considering past behaviour, it is not expected to be persistent. The lowest AFA was that related to irregularities with a DA component. However this average has been following an upward trend during 2014-2018.
3.2.2.Irregularities reported as fraudulent
For the period 2014-18, Table NR6 provides an overview of the number of irregularities reported as fraudulent by the Member States in relation to the type of support concerned. After the significant decrease in 2017, the number of fraudulent irregularities was more stable (-7% in 2018 with respect to 2017). This was the result of moderate decreases in the number of both RD and SA irregularities.
After three consecutive years during which the number of irregularities reported as fraudulent in relation to RD had largely exceeded the number of those reported for SA, in 2017 and 2018 they were broadly aligned. As a result, over the period 2014-2018, the number of RD irregularities reported as fraudulent was still higher than the number of SA ones, but the share of the total was just 59%. During 2014-2018, 47 cases concerned both RD and SA. In most of these cases, violations concerning RD were combined with violations concerning direct payments to farmers.

In 2018, the irregularities notified by the first two Member States (Romania and Italy) represented about 61% of the total number of irregularities reported as fraudulent. This concentration was much higher than in 2017 (about 54%) and in 2014 (about 52%). The first ten countries taken together reported 237 cases as fraudulent, which represented about 95% of the total (in 2017 the first ten countries accounted for about 89% and in 2014 about 93% of the total irregularities reported as fraudulent). Significant changes in the number of irregularities reported as fraudulent were recorded in Poland (decrease) and Romania (increase). Concentration of detections is analysed further in Section 3.4.3.1.
Table NR7 provides information about the financial amounts involved in the cases considered in Table NR6. Taking into account the whole 2014-18 period, financial amounts involved in SA cases were predominant (55% of the total amount). However, the share of the RD on the total (43%) was well above the share of the resources allocated to RD on the total of the CAP resources over the same period.
In 2018, the overall financial amounts rose by 11%. After the peak recorded in 2016, the financial amounts related to RD dropped in 2017 (-60%, similar to the number of cases) and remained broadly stable in 2018. The trend of the financial amounts related to SA was heavily influenced by the fact that in each of the years 2014 (Poland), 2015 (France), 2017 (Poland) and 2018 (Poland) one case worth between EUR 20 and 30 million was detected. These 'exceptional' irregularities were all referring to market measures. Net of these cases the irregular financial amounts detected in relation to SA were more stable during 2014-2017, but still doubled in 2018.

Considering the overall period 2014-2018, the AFA involved in SA cases was double that for RD cases (+98%). As mentioned, this is mainly due to irregularities concerning market measures, where potential frauds with exceptional financial amounts happened to be reported. In fact, in 2016 such exceptional cases did not emerge and the AFA of SA fell below that of RD cases. 2018 is a special year: even net of the exceptional irregularity reported by Poland, the AFA of SA was higher than that of RD cases. Net of these exceptional cases, there was no clear pattern: the AFA of potential frauds in SA was still higher than that of RD cases in 2014 and 2018, but not in the period 2015-2017. When SA is considered net of all cases concerning market measures, the AFA is far lower than for RD cases.
Starting from the irregularities that have been selected in relation to Graph NR2, Graph NR3 shows the 'core' trend of the average financial amounts of the SA, RD, MM and DA irregularities reported as fraudulent during the last five years.
The AFAs for SA irregularities and for irregularities with a DA component were broadly stable and lower than for the other categories. The AFA for RD irregularities has been following a rising trend until 2017, but fell in 2018 to the level of SA and DA cases. The AFA of irregularities with a MM component, which are much higher than for the other categories, has been growing during the last 2 years.
3.2.3.Irregularities not reported as fraudulent
Regarding irregularities not reported as fraudulent, the number of those communicated in relation to RD has been constantly increasing until 2015, while that related to SA remained stable or recorded minor variations (see Table NR8). Also the irregular financial amounts linked to RD peaked in 2015 (as highlighted in Table NR9). The irregular financial amounts linked to SA fluctuated around an annual average of about EUR 70 million, with significant annual variations.
In terms of number of irregularities (Table NR8), RD has regularly and significantly exceeded SA across the whole 2014-2018 period, with the result that the number of irregularities linked to RD have been more than double those affecting SA.
In terms of financial amounts (Table NR9), after the peak in 2015, irregularities related to RD gradually decreased, while irregularities related to SA experienced significant changes of opposite signs. This was mainly due to the fact that in each of the years 2014 (France), 2015 (France, Greece) and 2017 (Romania) the Member States detected one or two cases with 'exceptional' financial amounts involved, something which did not happen in 2016 and 2018.
During 2014-2018, the AFA of RD cases was broadly flat, floating around EUR 60 000, which was the result of similar trends for numbers and financial amounts (see Tables NR8 and NR9). Considering the overall period 2014-2018, the AFA involved in SA cases was higher than in RD cases (+28%). This is mainly due to cases with 'exceptional' financial amounts, mostly concerning market measures.
Graph NR4 shows the 'core' trend of the AFA of the SA, RD, MM and DA irregularities not reported as fraudulent during the last five years. The highest AFAs were related to irregularities with a MM component. The AFAs related to the other categories were more aligned, with SA cases and cases with a DA component following an increasing 'core' trend (at least before 2017) and the opposite for RD cases.
It is interesting comparing AFAs of fraudulent and non-fraudulent irregularities. Apart from 2014, this difference was not significant for SA and DA irregularities. For RD irregularities instead, fraudulent cases had a significantly and increasingly higher AFA than non-fradulent irregularities. This stopped abruptly in 2018. The AFAs of fraudulent irregularities with a MM component were constantly and significantly higher than those of the corresponding non-fraudulent irregularities. The difference decreased until 2016, but then started increasing in 2017 and accelerate in 2018.
3.3.Specific analysis
3.3.1.Modus operandi
3.3.1.1.Support to agriculture (SA)
Table NR10 provides an overview of the most frequent categories (or combinations of categories) of irregularities linked to cases reported as fraudulent in relation to SA in 2018 and the financial amounts involved. It also presents how these most recurrent categories (or combinations of categories) featured in the period 2014-2018.
The most recurrent modi operandi were related to 'documentary proof' or to the 'request' (not combined with other categories of irregularity). Each category is subdivided in different types of violations (see Annex 12). With reference to these two categories, the most recurrent types concerned 'false or falsified documents' or 'false or falsified request for aid', both in 2018 and in the overall period 2014-2018.
Irregularities concerning 'Product, species and/or land' (not combined with other categories of irregularity) were also quite recurrent. More specifically, in the overall period 2014-2018, most of these infringements concerned the type 'overdeclaration and/or declaration of ficticious product, species and/or land', while in 2018 they concerned 'unauthorised use'.
During 2014-2018, 57 irregularities were reported as pertaining to the category 'Ethics and integrity' (not combined with other categories of irregularity). All of these violations were communicated by Poland and were not reported under the types 'conflict of interest', 'bribery' or 'corruption', but as 'other irregularities concernig ethics and integrity'. Most of these violations concerned the creation of artificial conditions for receiving financial support. Other Member States may have reported this type of infringement under other categories of irregularity. In 2018, the category 'Ethics and integrity' appeared relatively often also in combination with other categories of irregularity. These cases were reported by Bulgaria and most of them were related to conflict of interest.

Table NR11 provides an overview of the most frequent categories (or combinations of categories) of irregularities linked to cases not reported as fraudulent in relation to SA in 2018 and the financial amounts involved. It also presents how these most recurrent categories (or combinations of categories) featured in the period 2014-2018.
When looking at these irregularities, violations concerning the 'request' were by far the most recurrent category. More specifically, the most recurrent type of violation, both in 2018 and 2014-2018, was by far 'false or falsified request for aid', followed by 'incorrect or incomplete request for aid' and 'Product, species, project and/or activity not eligible for aid'. Violations concerning the other category 'documentary proof' were also quite frequent and, considering the overall period 2014-2018, often related to the type of violation 'false or falsified documents' (about 190 cases in 2014-2018). However this reporting of cases of 'false or falsified documents' as non-fraudulent mostly happened in the past; in 2018 there were only 4 such cases. For most of the SA irregularities not reported as fraudulent where the type of violation was 'false or falsified documents' or 'false or falsified request for aid' there were no ongoing penal proceedings.

Three other prevalent categories of SA irregularities not reported as fraudulent were related to:
·'(Non)action'. In this area, the three most reported types pertained to the action itself (not implemented or not completed), and 'refusal to repay not spent or unduly paid amounts';
·'Product, species and/or land'. For this category, the majority of violations concerned 'Overdeclaration and/or declaration of fictitious product, species and/or land';
·'Beneficiary'. Here the most reported type of violation was 'Operator/beneficiary not having the required quality'.
In relative terms, infringements related to 'Ethics and integrity' were less frequent than for the irregularities reported as fraudulent. Apart from one case of conflict of interest, all of these violations were reported as 'other irregularities concerning ethics and integrity'.
3.3.1.2.Rural development (RD)
Table NR12 provides an overview of the most frequent categories of irregularities reported as fraudulent in RD in 2018 and the related financial amounts. It also presents how these most recurrent categories have featured during the period 2014-2018.
In 2018 and in 2014-2018, the category 'documentary proof' ranked first, with 'false or falsified documents' as the most reported type of violation. Also with reference to the 'request', which is another frequent category, the false-related type of irregularity ('false or falsified request of aid') was the most reported.
Within the CAP, 'RD cases reported as fraudulent' is the domain where the category Ethics and integrity ranked higher, with 141 irregularities in 2014-2018. Similarly to SA cases, most of these violations were communicated by Poland and were not reported under the types 'conflict of interest', 'bribery' or 'corruption', but as 'other irregularities concerning ethics and integrity'. Most of these violations concerned the creation of artificial conditions for receiving financial support. Other Member States may have reported this type of infringement under other categories of irregularity, such as the one referring to the beneficiary. For this category (considered also in combination with other categories), the most reported type of violation was 'Operator/beneficiary not having the required quality', which may have been used, especially for fraudulent irregularities, in relation to cases of creation of artificial conditions.

Table NR13 provides an overview of the most frequent categories of irregularities not reported as fraudulent in RD in 2018 and the related financial amounts. It also presents how these most recurrent categories have featured during the period 2014-2018.
When looking at these irregularities, the most frequently detected category was related to 'non-action' (including 'action not completed', 'action not implemented' or 'failure to respect deadlines' among the most reported types of violation). This category ranked high also in relation to irregularities reported as fraudulent (see Table NR12).
'(Non-)action' was followed by 'documentary proof' representing about 10% of the non-fraudulent cases in 2018 (including 'Documents missing and/or not provided' as the most reported type of violation). During 2014-2018, a number of 'documentary proof' cases (48) concerned the 'false and/or falsified documents' type of violation. The same applies to the category 'request', where a number of cases (16) were related to the 'false or falsified request of aid' type of violation.
In relative terms, the category Beneficiary is more frequent among RD cases not reported as fraudulent than in other CAP areas (about 9% of cases in 2018 and 8.5% in the overall 2014-2018). Within this category, 'Operator/beneficiary not having the required quality' is the most reported type of violation.
Apart from one case of conflict of interest, infringements related to 'Ethics and integrity' were reported as 'other irregularities concerning ethics and integrity'. Most of these irregularities were reported by Spain.
3.3.2.Fraud and Irregularity Detection Rates by CAP components
Via its two funds (EAGF and EAFRD) the CAP supports agriculture and rural development across Europe. The EAGF itself has two components with different aims: measures regulating or supporting agricultural markets (insoforth, referred to as 'intervention in agricultural markets' or 'market measures') and direct payments to farmers. Annex 11 provides a detailed explanation about the classification, for the purpose of this analysis, in these two categories of the cases reported by the Member States.
Table NR14 shows the Fraud Detection Rate (FDR) and the Irregularity Detection Rate (IDR) per type of policy measure.
The same case may cover several budget posts referring to different types of expenditure. In Annex 13, a detailed explanation of this issue and how it has been handled in estimating these FDR/IDR can be found.
As mentioned in Section 3.2.2, the financial amounts involved in irregularities reported as fraudulent concerning market measures were heavily influenced by few exceptional cases. Net of these cases, the FDR for market measures would be 0.37% rather than 1.07%. Similarly, excluding the few (3) 'exceptional' non fraudulent irregularities, the IDR would be 1.04% rather than 1.37%.
3.3.3.Market measures – fraudulent and non-fraudulent irregularities
As showed in Table NR14, market measures feature high FDR and IDR. Table NR15 shows the frequency and financial amounts of irregularities reported as fraudulent in relation to market measures for the period 2014-2018, while Table NR16 shows the same data with reference to irregularities not reported as fraudulent.
The category 'products of the wine-growing sector' was the most recurrent, but 'fruit and vegetables' was the one with the highest financial amounts, in particular due to the high AFA of cases reported as fraudulent. Other categories with high AFA were 'Pigmeat, eggs and poultry, bee-keeping and other animal products', 'Food programmes' (for cases not reported as fraudulent), 'Sugar' (for cases not reported as fraudulent) and 'Promotion' (for cases reported as fraudulent).
3.3.4. Reasons for performing control
3.3.4.1 Irregularities in relation to rural development
In the context of the antifraud cycle, the detection capability is a key feature, which contributes to the effectiveness and efficiency of the system for the protection of the EU budget.
In last year's Report, an analysis of the ‘reasons for performing control’ was introduced and led to the recommendation to further exploit the potential of risk analysis, tailoring the approach to the different types of expenditure and taking advantage of best practices and the risk elements highlighted in that Report. Furthermore, it was recommended to facilitate and assess the spontaneous reporting of potential irregularities and strengthen the protection of whistle-blowers that are also a crucial source for investigative journalism.
Tables NR17-NR22 suggest that so far there has been little improvement on the ground. However, as last year's Report was adopted at the beginning of September 2018, it may be too early to draw any conclusion. Effective evolution from reactive to proactive detections based on risk analysis may take time.
With a focus on controls that led to discover irregularities reported as fraudulent in RD, Table NR17 provides information on the number of controls that were performed because of reasons that can be linked to the above mentioned recommendations. It compares the situation until 2017 with the situation in 2018. In the last year, Member States did not detect any irregularity on the basis of risk analysis or information published by the media. The share of irregularities detected following tips slightly increased from 6% to 7%.

With a focus on controls that led to discover irregularities not reported as fraudulent in RD, Table NR18 compares the situation until 2017 with the situation in 2018. There were no significant changes in the use risk analysis or information published by the media. With specific reference to risk analysis, no Member State that had not reported this type of detections in 2014-2017 started to report them in 2018. During this year detections specifically based on risk analysis were confined to six Member States. The share of irregularities detected following tips slightly increased.
3.3.4.2 Irregularities in relation to market measures
With a focus on controls that led to discover irregularities reported as fraudulent in MM, Table NR19 compares the situation until 2017 with the situation in 2018. The categories 'Scrutiny 4045' and Scrutiny 485' refer to Regulation 4045/1989 and Regulation 485/2008, which deal with the scrutiny of commercial documents of those entities receiving payments from the Guarantee section of the EAGGF (Reg. 4045/1989) or from the EAGF (Reg.485/2008). While Reg. 485/2008 explicitly introduced the concept of risk analysis, Reg. 4045 already required consideration for risk factors and concentration on sectors or undertakings where the risk of fraud is high. In 2018, apart from a declining share concerning 'Scrutiny 485' the Member States did not detect any irregularity on the basis of risk analysis, information published by the media or tips.

With a focus on controls that led to discover irregularities not reported as fraudulent in MM, Table NR20 compares the situation until 2017 with the situation in 2018. In the last year, there was no clear increase in the use of risk analysis with respect to the period 2014-2017. On the one hand, the use of 'comparison of data' rose by more than 1 pp, but this was based on few cases and it is not clear what kind of activity was reported under this reason. On the other hand, the share of irregularities detected on the basis of scrutiny ex-Reg. 485 decreased by more than 2pp. The share of irregularities detected following tips slightly increased, but on the basis on very few cases.
3.3.4.3 Irregularities in relation to direct payments
With a focus on controls that led to discover irregularities reported as fraudulent in DA, Table NR21 compares the situation until 2017 with the situation in 2018. For an explanation about the categories 'Scrutiny 4045' and Scrutiny 485', see above Section 3.3.4.2. In 2018, apart from a declining share concerning tips, the Member States did not detect any irregularity on the basis of risk analysis, scrutiny or information published by the media.
With a focus on controls that led to discover irregularities reported as not fraudulent in DA, Table NR22 compares the situation until 2017 with the situation in 2018. In the last year, there was no increase in the use of risk analysis or information published in the media with respect to the period 2014-2017. The share of irregularities detected following tips slightly increased, from 1.5% to 2.5%.
3.4.Anti-fraud activities of Member States
Previous Sections have examined the trend and main features and characteristics of the irregularities reported as fraudulent.
The present Section digs into some aspects linked to the anti-fraud activities and results of Member States. Four elements are analysed:
(1)duration of irregularities (fraudulent and non-fraudulent). No analysis by Member State is presented in this Section;
(2)the number of irregularities reported as fraudulent by each Member State (in 2018 and over the last five years);
(3)the fraud detection rate (FDR - the ratio between the amounts involved in cases reported as fraudulent and the payments occurred in the same period) and the irregularity detection rate (IDR - the ratio between the amounts involved in cases not reported as fraudulent and the payments occurred in ther same period) over the last five years;
(4)the ratio of cases of established fraud on the total number of irregularities reported as fraudulent.
3.4.1.Duration of irregularities
Of the 17 974 irregularities (fraudulent and non-fraudulent) reported by Member States in 2014-2018 in relation to CAP, 10 359 (58% of the total) involved infringements that have been protracted during a span of time. For the 1 786 irregularities reported as fraudulent, this percentage is higher at about 65%. The remaining part of the dataset refers to irregularities which consisted of a single act identifiable on a precise date (about 36% of the whole dataset and 33% of that including exclusively the fraudulent irregularities) or for which no reliable information has been provided (6% of the whole dataset, but only 2% of the irregularities reported as fraudulent).
The average duration of the irregularities which have been protracted over time was 26 months (i.e. 2 years and 2 months). For the irregularities reported as fraudulent, this average was just 2 months more: 28 months.
3.4.2.Detection of irregularities reported as fraudulent by Member State
3.4.2.1.Reported during the period 2014-2018
Table NR23 offers an overview of the irregularities reported as fraudulent by Member States during the period 2014-2018. It also shows the related amounts, overall payments for the agricultural policy and the FDR.
Finland has notified no irregularities as fraudulent; another seventeen (17) Member States reported less than 30 potentially fraudulent irregularities; four (4) Member States reported between 30 and 60; six (6) Member States more than 60.
Romania, Poland, Hungary and Italy are the four countries which have reported the highest numbers, while Poland, Romania, France and Bulgaria reported the highest amounts. Bulgaria, Estonia, Poland and Romania's FDRs approached 0.5%, about double the Lithuania and Hungary's FDRs, which ranked fifth and sixth..
3.4.2.2.Reported in 2018
Table NR24 offers an overview of the irregularities reported as fraudulent by Member States in 2018. It also shows the related amounts, overall payments for the agricultural policy and the FDR.
Twelve Member States notified no irregularities as fraudulent; most Member States reported less than 30 potentially fraudulent irregularities; only 2 Member States reported more than 30 irregularities.
Romania, and Italy were the Member States which have reported the highest numbers, while Poland and Romania reported the highest amounts. Bulgaria's FDR is 1.5%, more than double the second and third highest FDRs, which have been recorded by Romania and Poland, respectively.
3.4.3.Fraud and Irregularity Detection by sector and Member State
3.4.3.1.Rural development
Table NR25 and Map NR1 provide an overview of the irregularities reported as fraudulent by Member States during the period 2014-2018 in relation to rural development. It also shows the related amounts, overall payments for rural development and the FDR.
These irregularities are exclusively referred to rural development. A number of additional cases concerned both rural develoment and support to agriculture, including market measures or direct payments (see Table NR6, NR7 and Annex 11), but considering them is not likely to significantly change the picture. This applies also to Table 26.
24 Member States have reported potentially fraudulent cases in relation to RD during the period 2014-2018. Romania, Poland and Hungary reported the highest mumbers. The highest financial amounts were communicated by Romania, Poland, Hungary and Bulgaria. Estonia shows the highest FDR, above 1%, while the FDRs of Romania, Lithuania, Hungary and Bulgaria are between 0.5% and 1%.
Table NR26 and Map NR2 provide an overview of the irregularities not reported as fraudulent by Member States during the period 2014-2018 in relation to rural development. Table NR26 also shows the related amounts, overall payments for rural development and the IDR.
Romania, Portugal, Spain, Poland, Italy and Hungary reported the highest numbers. The highest financial amounts were communicated by Romania. Lithuania shows the highest IDR, above 4%, while the IDRs of Portugal, Romania Bulgaria, the Netherlands, Malta and Estonia exceeds 2%.
Tables NR25 and NR26 suggest that the reporting of irregularities was concentrated in a few Member States and that this concentration could go beyond what could be expected on the basis of the distribution of payments related to rural development among Member States.
Graphs NR5 help assessing this hypothesis. Respectively for fradulent and non-fraudulent irregularities, Graphs NR5a and NR5b show the cumulative percentage distribution of the number of cases and related financial amounts involved in relation to rural development. The Member States are sorted on the basis of the number of irregularities reported.
Graph NR5a shows that the first three Member States (Romania, Poland and Hungary) reported nearly 70% of all fraudulent irregularities related to rural development, while they received 25% of the payments. This percentage is noticeably lower in relation to non-fraudulent irregularities (less than 50%), but it is still well above the share of payments received. While Romania was still the Member State with the highest number of cases reported, Portugal and Spain ranked second and third.
In general, the cumulative distributions of number of cases and financial amounts broadly overlap. They rise fast and are quite far from the cumulative distribution of payments related to rural development; this is clearly emphasised when focusing on fraudulent irregularities. To better assess the contribution of each Member State to these patterns, Graph NR5c and NR5d present the individual shares of number of cases, financial amounts involved and payments, respectively for fraudulent and non-fraudulent irregularities.
This corroborates the hypothesis that the concentration of detections is not explained by the concentration of payments during the period 2014-2018. This may be due to many different factors, including different underlying levels of irregularities and fraud, a different quality of the prevention or detection activities or different practices concerning the stage of the procedure when potentially fraudulent irregularities are reported.
This difference in concentration between detections and payments is less evident for non-fraudulent irregularities, which might be taken as an indication of more homogenous approaches to management and administrative controls, even if the examination of data concerning single Member States (see Graph NR5d) highlights significant discrepancies. The concentration of detections is instead more accentuated for fraudulent irregularities, suggesting that different approaches to the use of criminal law to protect the EU budget may be an additional and significant factor causing further inhomogeneity among Member States.
3.4.3.2.Market measures
Table NR27 and Map NR3 provide an overview of the irregularities reported as fraudulent by Member States during the period 2014-2018 in relation to market measures. The table also shows the related amounts, overall payments for market measures and the FDR.
A part of these irregularities are not exclusively referred to market measures, but the reporting authority may have also included budget lines/posts referring to other measures, including direct payments, rural development or other payments related to budget years before 2006 (see Annexes 11 and 13 for the detailed explanation about the classification of cases in relation to CAP expenditure). These irregularities have been included in their full value in Table NR27. This applies also to Table 28 below.
17 Member States have reported potentially fraudulent cases in this area (2 more than in the period 2013-2017). France, Poland and Hungary reported the highest numbers. The highest financial amounts were communicated by Poland, France and Bulgaria. Poland and Bulgaria show the highest FDRs (around 10%).
Table NR28 and Map NR4 provide an overview of the irregularities not reported as fraudulent by Member States during the period 2014-2018 in relation to market measures. It also shows the related amounts, overall payments for market measures and the IDR.
23 Member States have reported non fraudulent cases with reference to market measures (one more than during 2013-2017). Spain, France and Italy reported the highest numbers. The highest financial amounts were communicated by France, Romania and Spain. Malta, Romania and Denmark show the highest IDRs.
Tables NR27 and NR28 suggest that the reporting of irregularities was concentrated in a few Member States and that this concentration could go beyond what could be expected on the basis of the distribution of payments related to market measures among Member States. Graphs NR6 help assessing this hypothesis. For a general explanation about these graphs, see Section 3.4.3.1.
Graph NR6a shows that three Member States (France, Poland and Hungary) reported about 70% of all fraudulent irregularities related to market measures, while they received about 30% of payments. This percentage is lower in relation to non-fraudulent irregularities (about 65%) and it is in line with the share of payments received by these Member States. France was accompanied by Spain and Italy in the group of Member States with the highest number of cases not reported as fraudulent.
The cumulative distributions of number of fraudulent cases and related financial amounts related to market measures rise fast and much faster than the cumulative distribution of payments related to market measures. This is less clear for non-fradulent irregularities, where the patterns of detections and payments are more aligned. To better assess the contribution of each Member State to these patterns, Graphs NR6c and NR6d present the individual shares of number of cases, financial amounts involved and payments, respectively for fraudulent and non-fraudulent irregularities.
This corroborates the hypothesis that the concentration of detections is not explained by the distribution of payments, especially not for fraudulent irregularities. This suggests the need for more homogeneity concerning the use of criminal law to protect the EU.
3.4.3.3.Direct payments to farmers
Table NR29 and Map NR5 provide an overview of the irregularities reported as fraudulent by Member States during the period 2014-2018 in relation to direct payments to farmers. It also shows the related amounts, overall payments for direct payments and the FDR.
A part of these irregularities are not exclusively referred to direct payments, but the reporting authority may have also included budget lines/posts referring to other measures, including market measures, rural development or other payments related to budget years before 2006 (see Annexes 11 and 13). These irregularities have been included in their full value in Table NR29. This applies also to Table 30 below.
15 Member States have reported potentially fraudulent cases in this area. Romania, Italy and Poland reported the highest numbers. The highest financial amounts were communicated by Italy. Italy and Romania show the highest FDRs, which are lower than 0.1%. For the other Member States, FDRs are almost zero.
Table NR30 and Map NR6 provide an overview of the irregularities not reported as fraudulent by Member States during the period 2014-2018 in relation to direct payments. It also shows the related amounts, overall payments for direct payments and the IDR.
23 Member States have reported non fraudulent cases concerning direct payments. Italy and Romania reported both the highest numbers and the highest financial amounts. Romania and Italy show the highest IDRs (about 0.4%).
Tables NR29 and NR30 suggest that the reporting of irregularities was concentrated in a few Member States and that this concentration could go beyond what could be expected on the basis of the distribution of payments related to direct payments among Member States. Graphs NR7 help assessing this hypothesis. For a general explanation about these Graphs, see Section 3.4.3.1.
Graph NR7a shows that three Member States (Romania, Italy and Poland) reported more than 85% of all fraudulent irregularities related to direct payments, while they received about 20% of payments. This percentage is lower in relation to non-fraudulent irregularities (about 70%), but still clearly exceeded the share of payments received by these Member States. Italy and Romania were accompanied by Spain in the group of the Member States with the highest number of cases not reported as fraudulent.
In general, the cumulative distributions of number of cases and financial amounts broadly overlap. They rise fast and are quite far from the cumulative distribution of payments related to direct payments; this is clearly emphasised when focusing on the fraudulent irregularities. To better assess the contribution of each Member State to these patterns, Graph NR7c and NR7d present the individual shares of number of cases, financial amounts involved and payments, respectively for fraudulent and non-fraudulent irregularities.
This corroborates the hypothesis that the concentration of detections is not explained by the distribution of payments. This may be due to different factors, including inhomogeneous management and control systems and, for the fraudulent irregularities, different approaches to the use of criminal law to protect the EU.
3.4.3.4.Concentration by sector and type of irregularity
In Sections 3.4.3.1-3.4.3.3, focusing on different sectors of agriculture expenditure, the concentration of detections in different Member States have been analysed, comparing it with the distribution of related payments.
Graphs NR8 and NR9 are based on an overall measure of the distance between the distribution of detections in different Member States and the distribution of payments received by the Member States in the same period.
These graphs confirm and summarise findings from the previous sections. They show that 'direct payments' was the sector with the largest distance between detections and payments received. Rural development and market measures are more similar. The distance is always lower for non-fraudulent irregularities, especially for rural development and market measures. This might be taken as an indication that management and administrative controls are more homogeneous among Member State than the approaches to the use of the criminal law for the protection of the EU budget and/or reporting of suspected fraud.
3.4.4.Ratio of established fraud / Dismissal ratio
Since the PIF Report 2014, analysis has also tried to focus on the rate of irregularities reported as fraudulent by Member States for which a final decision was taken, establishing that fraud really occurred. By comparing updated data with those published in 2014, it is also possible to identify how many cases have been dismissed (initially reported as fraudulent and then "declassified" or cancelled).
Table NR31, therefore, updates the table already published in the last four Reports indicating that the 'ratio of established fraud' has slightly increased in comparison to last year (from 12% to 14%). The 'dismissal ratio' increased from 17% to 22%. This means that the number of cases that had been reported during 2009-2013 that were still classified as fraudulent at the end of 2018 has decreased by 22% from the end of 2013. This decrease may be due to cases that have been cancelled or that have been re-classified as non-fraudulent, which justify taking this measure as a dismissal ratio. However, it must be considered that between 2014 and 2018, a number of cases that had initially been classifed as non-fraudulent may have been re-classified as fraudulent, contributing to compensate at least part of the decrease. If these cases were not considered in the calculation, the dismissal ratio would be higher.
Focusing on the cases that had been reported during 2009-2013 and that were still classified as fraudulent at the end of 2018 (including irregularities initially classified as non-fraudulent and then re-classified as fraudulent), 14% of them are considered as established fraud (ratio of established fraud).
3.5.Recovery cases
For an in-depth analysis of recovery and financial corrections in the CAP, see section 2.1.1.3 of the Annual Activity Report of DG AGRI and the 2018 Annual Management and Performance Report for the EU Budget.