EUROPEAN COMMISSION
Brussels, 14.10.2020
SWD(2020) 951 final
COMMISSION STAFF WORKING DOCUMENT
Accompanying the document
REPORT FROM THE COMMISSION TO THE EUROPEAN PARLIAMENT, THE COUNCIL, THE EUROPEAN ECONOMIC AND SOCIAL COMMITTEE AND THE COMMITTEE OF THE REGIONS
Energy prices and costs in Europe
{COM(2020) 951 final}
Contents
Introduction
1
Electricity prices
1.1.1
Evolution of wholesale electricity prices
1.1.2
Factors impacting the evolution of wholesale prices
1.1.3
International comparisons
1.2
Retail electricity prices
1.2.1
Household electricity prices
1.2.2
Industrial electricity prices
1.2.3
International comparisons
2
Gas prices
2.1
Wholesale gas prices
2.1.1
Evolution of wholesale gas prices
2.1.2
Factors impacting the evolution of wholesale gas prices
2.1.3
International comparison
2.2
Retail gas prices
2.2.1
Industrial Natural Gas Prices
2.2.2
International comparisons
3
Oil and oil product prices
3.1
Crude oil prices
3.2
Wholesale prices of oil products
3.3
Retail prices of oil products
3.3.1
Methodology
3.3.2
General findings
3.3.3
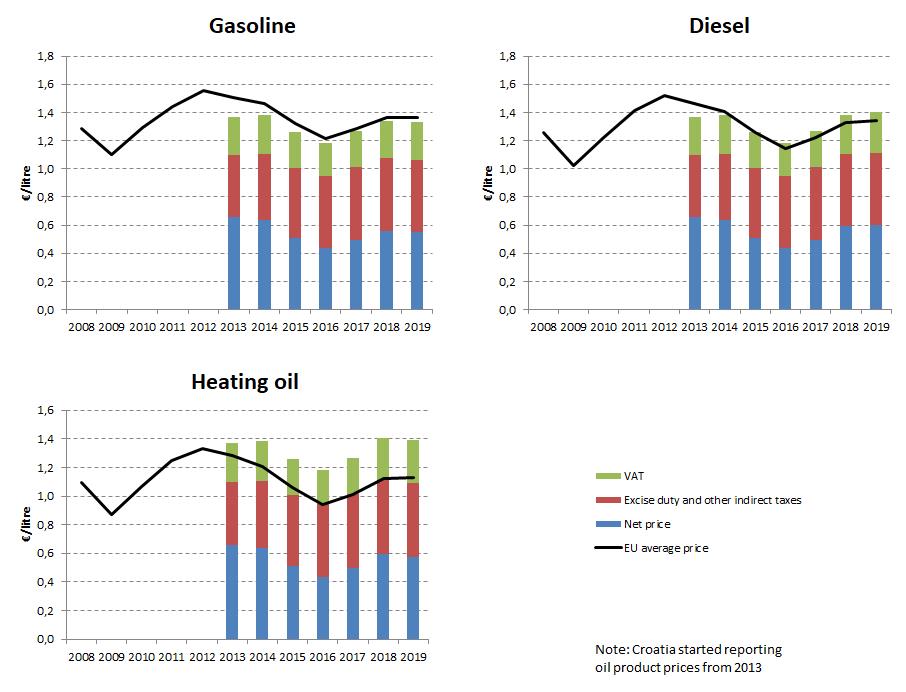
Gasoline
3.3.4
Diesel
3.3.5
Heating oil
3.3.6
Gasoline vs diesel
3.3.7
International comparison
4
The EU energy bill
4.1
Introduction
4.2
Methodology
4.3
Drivers
4.4
Import bill calculation
5
Household energy expenditure and energy poverty
5.1
Energy products’ expenditure in household budgets
5.1.1
Energy expenditure (excluding transport) in households
5.1.2
Energy expenditure (excluding transport) in households with low income
5.1.3
Energy expenditure (excluding transport) in households with middle income
5.1.4
Share of energy in the household expenditure by income and Member States
5.1.5
Energy expenditures in the transport sector
5.1.6
Change in energy expenditures in the Member States (2008-2018)
6
Industry energy costs
6.1
Energy costs and their impact at macroeconomic level
6.2
Energy costs for industry
6.3
Exploring energy intensities
6.4
Energy costs drivers
6.4.1
Drivers of energy costs
6.4.2
Impact of energy costs on total production costs
6.5
International comparisons
6.5.1
Energy costs vs other G20 countries
6.5.2
Energy intensity of EU sectors vs other G20
6.5.3
Industrial electricity prices: EU vs G20 countries
6.5.4
Industrial gas prices: EU vs G20 countries
6.6
Overview of selected Energy Intensive Industries
7
The role of energy for government revenues and inflation
7.1
Government revenues from the energy sector
7.1.1
Energy taxes
7.1.2
Excise duties
7.1.3
Value added tax (VAT)
7.1.4
Tax revenues from oil products
7.1.5
Energy taxes, prices and incentives
8
Realised prices and profitability in the power market
8.1
Introduction
8.2
Methodology
8.3
Realised prices and business cases of key technologies
8.3.1
Solar PV
8.3.2
Wind onshore
8.3.3
Wind offshore
8.3.4
Gas fired power generation
8.3.5
Coal fired power generation
8.3.6
Nuclear Energy
ANNEX – COUNTRY FACTSHEETS
CoNTENT AND METHODOLOGY…………………………………………………………………………………………………………………..…254
Austria
Prices (2019 and recent evolution)
Energy costs for households, industry and services
Belgium
Prices (2019 and recent evolution)
Energy costs for households, industry and services
Bulgaria
Prices (2019 and recent evolution)
Energy costs for households, industry and services
Croatia
Prices (2019 and recent evolution)
Energy costs for households, industry and services
Cyprus
Prices (2019 and recent evolution)
Energy costs for households, industry and services
Czechia
Prices (2019 and recent evolution)
Energy costs for households, industry and services
Denmark
Prices (2019 and recent evolution)
Energy costs for households, industry and services
Estonia
Prices (2019 and recent evolution)
Energy costs for households, industry and services
Finland
Prices (2019 and recent evolution)
Energy costs for households, industry and services
France
Prices (2019 and recent evolution)
Energy costs for households, industry and services
Germany
Prices (2019 and recent evolution)
Energy costs for households, industry and services
Greece
Prices (2019 and recent evolution)
Energy costs for households, industry and services
Hungary
Prices (2019 and recent evolution)
Energy costs for households, industry and services
Ireland
Prices (2019 and recent evolution)
Energy costs for households, industry and services
Italy
Prices (2019 and recent evolution)
Energy costs for households, industry and services
Latvia
Prices (2019 and recent evolution)
Energy costs for households, industry and services
Lithuania
Prices (2019 and recent evolution)
Energy costs for households, industry and services
Luxembourg
Prices (2019 and recent evolution)
Energy costs for households, industry and services
Malta
Prices (2019 and recent evolution)
Energy costs for households, industry and services
Netherlands
Prices (2019 and recent evolution)
Energy costs for households, industry and services
Poland
Prices in 2019
Energy costs for households, industry and services
Portugal
Prices (2019 and recent evolution)
Energy costs for households, industry and services
Romania
Prices (2019 and recent evolution)
Energy costs for households, industry and services
Slovakia
Prices (2019 and recent evolution)
Energy costs for households, industry and services
Slovenia
Prices (2019 and recent evolution)
Energy costs for households, industry and services
Spain
Prices (2019 and recent evolution)
Energy costs for households, industry and services
Sweden
Prices (2019 and recent evolution)
Energy costs for households, industry and services
United Kingdom
Prices (2019 and recent evolution)
Energy costs for households, industry and services
Norway
Prices (2019 and recent evolution)
List of Figures
Figure 1 - Evolution of monthly average wholesale day-ahead baseload electricity prices in Europe, showing the European Power Benchmark and the range of minimum and maximum prices across the markets
Figure 2 – Price convergence on day-ahead markets in selected regions as percentage of hours in a given year
Figure 3 – Monthly evolution of spot and forward wholesale electricity prices and the energy component of retail prices in Europe since 2017
Figure 4 - Regional market prices in the North-Western Europe coupled area
Figure 5 - The Central Eastern Europe average wholesale price and the EPB benchmark
Figure 6 - Regional market prices in Italy and South Eastern Europe
Figure 7 - Electricity consumption, population and economic growth in the EU27
Figure 8 - Electricity generation mix in the EU27
Figure 9 - Monthly electricity generation in the EU27 and the shares of renewables and fossil fuels
Figure 10 - Monthly coal, natural gas and carbon price indexes, compared to the 2008 average price and the share of renewable energy (right hand scale)
Figure 11 - Net electricity flow positions of individual European regions
Figure 12 - Comparison of wholesale electricity prices in the EU with global trade partners
Figure 13 - Comparison of wholesale electricity prices in the EU with global trade partners
Figure 14 - Evolution and composition of the EU household price (DC band)
Figure 15 – Evolution of taxes, fees, levies and charges for EU households since 2010 (DC)
Figure 16 - Composition of the taxes and levies component of household electricity prices in 2019 (DC band)
Figure 17 - Breakdown of household electricity prices (DC band)
Figure 18 - Household prices in 2019 (DC band)
Figure 19 – Difference between the energy component of household retail prices and average day-ahead baseload prices in individual markets in 2019 (DC band)
Figure 20 - Composition of hosehold prices in 2019 (DC band)
Figure 21 - Household prices in 2019 (most representative band)
Figure 22 - Evolution and composition of the average retail electricity price for representative households in EU27 capitals (DC band)
Figure 23 - Evolution and composition of the EU27 industrial retail prices (ID band)
Figure 24 - Industrial retail electricity prices in 2019 (ID band)
Figure 25 – Relative composition of industrial retail electricity prices in 2019 (ID band)
Figure 26 – Comparison of taxes and levies between 2017 and 2019 (ID band)
Figure 27 - Composition of taxes and levies in 2019 (ID band)
Figure 28 - Evolution and composition of the EU27 industrial retail prices (IF band)
Figure 29 - Industrial retail electricity prices in 2019 (IF band)
Figure 30 – Relative composition of industrial retail electricity prices in 2019 (IF band)
Figure 31 - Difference between household retail electricity prices and electricity wholesale prices 2008-2019, EUR2018/MWh
Figure 32 - Difference between industrial retail electricity prices and electricity wholesale prices, EU27 and other G20 countries, 2008-2019, EUR2018/MWh
Figure 33 - Selected wholesale gas prices in Europe
Figure 34 - The difference between the Platts North West Europe Gas Contract Indicator (GCI) and the Dutch hub price (TTF)
Figure 35 - Price formation in Europe
Figure 36 – The role of different price formation methods in different regions of the world
Figure 37 - Daily day-ahead prices at selected gas hubs from 2008 to mid-2018
Figure 38 - The monthly average price of oil (Brent) and oil-indexed gas contracts (Platts GCI)
Figure 39 - Daily spot prices of oil (Brent) and gas (at the Dutch TTF hub)
Figure 40 - Daily change of spot prices of oil (Brent) and gas (at the Dutch TTF hub), between 2008 and 2020
Figure 41 - The monthly average price of oil (Brent) and gas (at the Dutch TTF hub), measured in €/MWh
Figure 42 – Daily residential natural gas consumption and daily average temperatures in some EU countries
Figure 43 – LNG imports and its share in the EU-27 total gas imports and consumption
Figure 44 – Main extra-EU import sources of LNG
Figure 45 – Main EU LNG importer countries in 2019
Figure 46 - Comparison of European, US and Japanese wholesale gas prices
Figure 47 - The ratio of European, US and Japanese wholesale gas prices
Figure 48 - Gas wholesale prices in the EU (weighted average), China, Japan and the US
Figure 49 - Gas wholesale prices in the EU (weighted average) and selected markets
Figure 50 - Composition of the EU household gas price (DC)
Figure 51 - Household gas prices in 2019
Figure 52 - Composition of household gas prices in 2019
Figure 53 – Change in the composition of EU taxes on household gas prices in between 2017 and 2019 and the composition in 2019
Figure 54 - Composition of EU prices for small (I3) industrial gas consumers
Figure 55 - Composition of EU prices for large (I5) industrial gas consumers
Figure 56 - Median (I3) and large (I5) industrial gas prices in 2019
Figure 57 - Composition of median (I3) and large (I5) industrial gas prices in 2019
Figure 58 - Composition of the tax structure of the EU retail gas prices for median (I3) and large (I5) consumers
Figure 59 – Household gas retail prices in the EU, Japan, US and China
Figure 60 - Household retail natural gas prices in the EU27 and in some G20 trading partners
Figure 61 - Retail industrial natural gas prices in the EU and its major G20 trading partners
Figure 62 - The Brent crude oil price from 2000 to mid-2020
Figure 63 - Crude oil (Brent) and European wholesale gasoline, diesel and heating oil prices from 2008 to mid-2018
Figure 64 - Crack spreads of gasoline, diesel and heating oil from 2008 to mid-2018
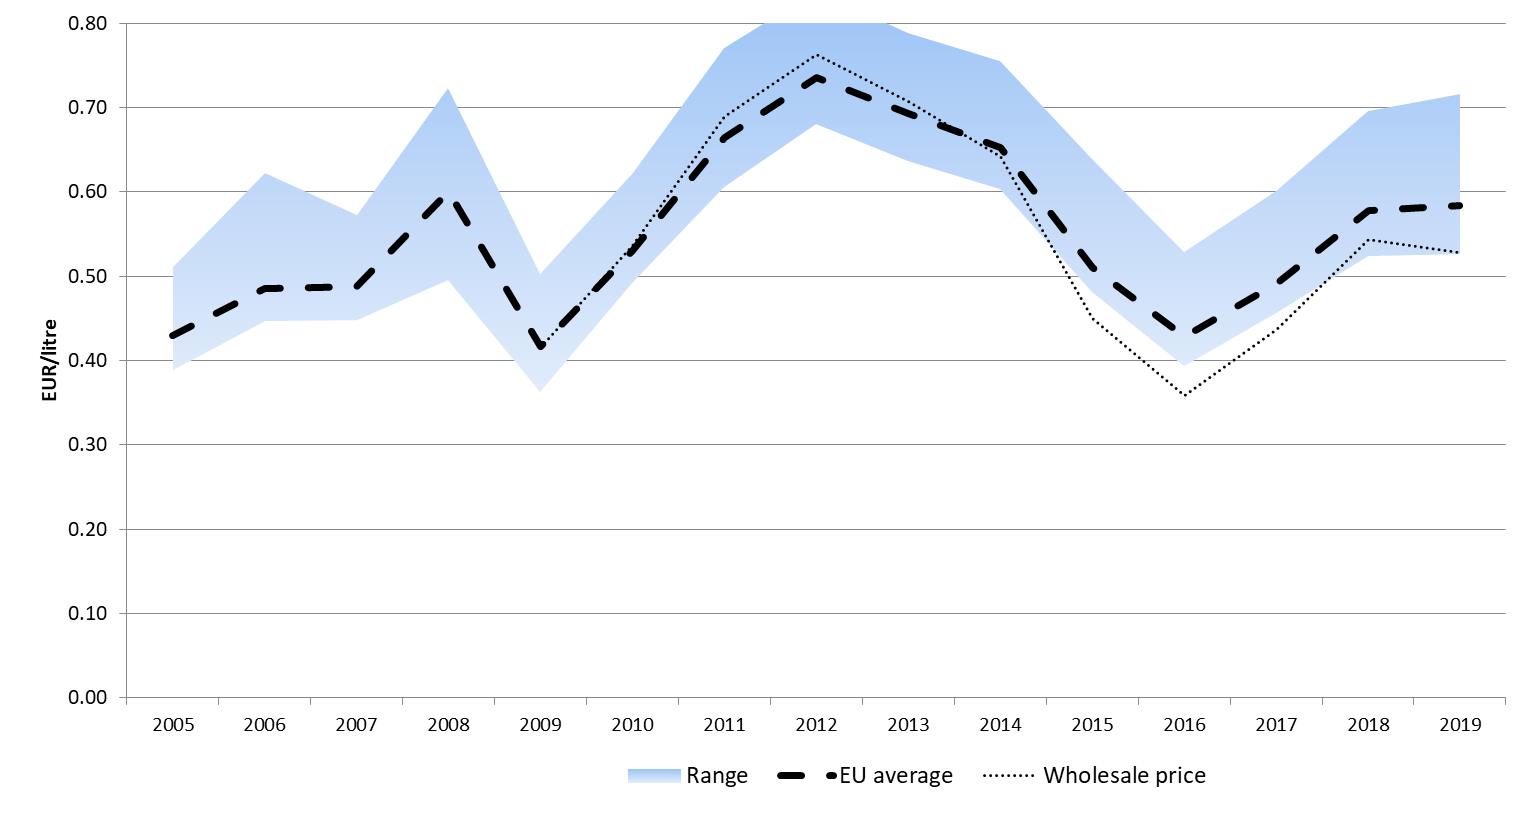
Figure 65 - Average retail price of oil products in the EU
Figure 66 - Average excise duty rates for oil products in the EU (EUR/litre)
Figure 67 - Average retail price of oil products in the EU, without taxes
Figure 68 - The retail price of gasoline in the EU
Figure 69 - The retail price of gasoline in the EU, without taxes
Figure 70 - The excise duty rate of gasoline in the EU
Figure 71 - Average retail price of gasoline in the EU by price component
Figure 72 - Average retail price of gasoline in the first half of 2018 by Member State and price component
Figure 73 - The retail price of diesel in the EU
Figure 74 - The retail price of diesel in the EU, without taxes
Figure 75 - The exercise duty rate of diesel in the EU
Figure 76 - Average retail price of diesel in the EU by price component
Figure 77 - Average retail price of diesel in the first half of 2018 by Member State and price component
Figure 78 - The retail price of heating oil in the EU
Figure 79 - The retail price of heating oil in the EU, without taxes
Figure 80 - The exercise duty rate of heating oil in the EU
Figure 81 - Average retail price of heating oil in the EU by price component
Figure 82 - Average retail price of heating oil in the first half of 2018 by Member State and price component
Figure 83 - Average retail price of gasoline and diesel in the EU, with taxes (EUR per litre)
Figure 84 - Average retail price of gasoline and diesel in the EU, without taxes (EUR per litre)
Figure 85 - Average excise duty rates for gasoline and diesel in the EU (EUR per litre)
Figure 86 - The difference between the average excise duty rate on gasoline and diesel
Figure 87 - Excise duty rates in individual Member States in 2005 (blue) and 2019 (red)
Figure 88 - the change of the difference between the gasoline and diesel excise duty rates between 2005 and the first half of 2019
Figure 89 - Excise duty rates for motor fuels in Belgium
Figure 90 – Gross Inland Consumption of selected alternative fuels
Figure 91 – Total (all sectors) Final Energy Consumption of selected alternative fuels
Figure 92 – Industry’s Final Energy Consumption of selected alternative fuels
Figure 93 – Transport’s Final Energy Consumption of selected alternative fuels
Figure 94 – Household’s (and other sectors) Final Energy Consumption of selected alternative fuels
Figure 95 - International comparison of prices of ethanol
Figure 96 - International comparison of wholesale prices of biodiesel
Figure 97 – International comparison of retail prices of LPG
Figure 98 - Biogas in electricity and heat generation and biogas blending for natural gas
Figure 99: Electricity prices for households in €/MWh (2019)
Figure 100 - Representative sample of EV public charging prices in €/MWh
Figure 101 - EV fast and superfast public charging prices in Tesla network (€/MWh).
Figure 102 - International comparison of retail gasoline prices
Figure 103 - International comparison of retail gasoline prices
Figure 104 - International comparison of retail diesel prices
Figure 105 - International comparison of retail diesel prices
Figure 106 - EU import dependency by fuel
Figure 107 - EU net imports of energy in 2018 (mtoe)
Figure 108 - EU net imports
Figure 109 - Comparison of European oil, gas and coal prices
Figure 110 - The USD/EUR exchange rate since 2013
Figure 111 - The estimated EU import bill
Figure 112 - Shares of consumer goods groups in household expenditure in Member States
Figure 113 - Energy share in the total households’ expenditure by income decile in 2018
Figure 114 - Share of fuels in final energy consumption in the residential sector by EU Member State (2017)
Figure 115 - Share of end-use energy consumption in the residential sector by EU Member State (2018)
Figure 116 – Energy products expediture for the poorest households and the energy share in total household consumption expenditure by EU Member State
Figure 117 - Share of expenditure on household energy products and share of energy in total expenditure for the poorest households by EU Member State
Figure 118 - Energy product expenditure for lower-middle income households and the energy share in household expenditure by EU Member State
Figure 119 - Share of expenditure on household energy products and share of energy in total expenditure for lower-middle income households by EU Member State
Figure 120 – Energy product expenditure for middle income households and the energy share in household expenditure by EU Member State
Figure 121 - Share of expenditure on household energy products and share of energy in total expenditure for middle income households by EU Member State
Figure 122- Ratio of homes not adequately warm for households below the 60% of the median income and the share of energy products in expenditure for the lower-middle income households
Figure 123 - Germany, France, Ireland, Belgium, Netherlands, Luxembourg and Austria - Share of energy in final household expenditure per income deciles
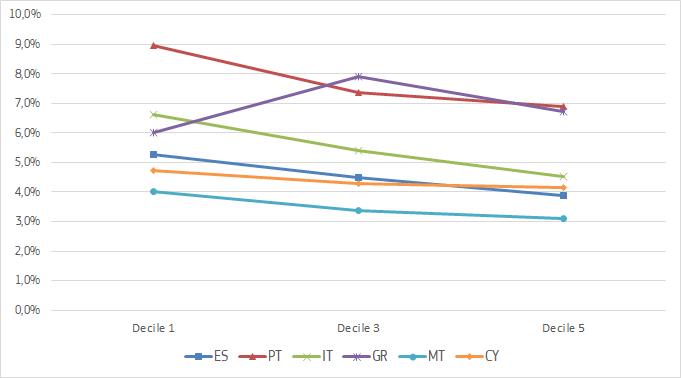
Figure 124 - South European countries: Spain, Portugal, Italy, Greece, Malta and Cyprus - Share of energy in final household expenditure per income deciles
Figure 125 - Poland, Czechia, Slovakia and Hungary - Share of energy in final household expenditure per income deciles
Figure 126 - Nordic and Baltic countries: Sweden, Finland, Denmark, Estonia, Latvia, Lithuania - Share of energy in final household expenditure per income deciles
Figure 127 - South East Europe: Croatia, Slovenia, Romania and Bulgaria - Share of energy in final household expenditure per income deciles
Figure 128 - Expenditures on transport energy products for the poorest households by EU Member State, and energy transport share in household expenditure
Figure 129 - Share of expenditure on transport energy products and share of transport energy in total expenditure for the poorest income households by EU Member State
Figure 130 - Expenditures on transport energy products for middle income households by EU Member State, and energy transport share in household expenditure
Figure 131 - Share of expenditure on household transport energy products and share of transport energy in total expenditure for middle income households by EU Member State
Figure 132 - Proportion of households whose share of energy expenditure in income is more than twice the national median share (2M)
Figure 133 - Share of households whose absolute energy expenditure is below half the national median (M/2, hidden energy poverty).
Figure 134 - Arrears on utility bills for EU average households and expenditures on household energy (electricity, gas, heating, etc.) for the poorest, lower-middle and middle income households by EU Member State
Figure 135 - Expenditures on household energy (electricity, gas, heating, etc.) and transport energy (petrol, diesel, etc.) for the poorest, lower-middle and middle income households by EU Member State
Figure 136- Evolution of energy costs shares in production value, industry and services
Figure 137: Evolution of energy costs shares in production value for Manufacturing
Figure 138 - Breakdown of the energy consumption per energy carrier, EU, 2008-2017 averages
Figure 139 - Energy costs shares in total production costs in manufacturing sectors, 2008-2017
Figure 140 - Energy costs shares in total production costs in non-manufacturing sectors 2010-2017
Figure 141 - Gross Operating Surplus in manufacturing sectors (average 2008-2015)
Figure 142 - Gross Operating Surplus in manufacturing in the EU and Member States, 2008-2015
Figure 143 – Gross Operating Surplus shares of value added in manufacturing, EU vs G20
Figure 144 - Gross Operating Surplus shares of value added in non-manufacturing, EU vs G20
Figure 145 - Energy intensity (consumption/value added in nominal terms) for the most energy-intensive manufacturing sectors (average of available countries)
Figure 146 - Energy intensity (consumption/value added in nominal terms) for non- manufacturing sectors (average of available countries)
Figure 147 - Drivers of energy costs of the total of sectors
Figure 148 - Changes in gross output and energy consumption in high energy-intensity sectors, 2010-2017
Figure 149 - Changes in gross output and energy consumption in low energy-intensity sectors, 2010-2017
Figure 150- Decomposition of output effect in EU, UK, US and China
Figure 151 - International comparision of energy costs shares for selected highly energy-intensive sectors
Figure 152 - Energy costs shares in production value for manufacturing sectors, 2008-2017
Figure 153 - Energy intensity international comparisons for the most energy-intensive manufacturing sectors
Figure 154 - Energy intensity international comparisons for other manufacturing sectors
Figure 155 – Retail electricity prices for industry: EU vs China, Japan & US, 2008-2019
Figure 156 - Retail electricity prices for industry: EU vs other G20, 2007-2019
Figure 157 – Retail electricity indexes prices for industry: EU vs Argentina, Australia & India, 2008-2019
Figure 158 - Range of retail electricity prices for industry in the EU
Figure 159 - Box plot of EU27 industrial retail electricity prices 2008-2019
Figure 160 - EU27 industrial retail electricity prices 2008-2019, individual Member States lines visible, outliers named
Figure 161 - Retail gas prices for industry: EU vs China, Japan and the US, 2008-2019
Figure 162 - Retail gas prices for industry: EU vs other non-EU G20 countries, 2008-2019
Figure 163 - Max-min range of retail gas prices for industry in the EU, 2008-2019
Figure 164 - Box plot of industrial gas prices, 2008-2019
Figure 165 - EU27 industrial retail natural gas prices 2008-2019, Member States lines visible, outliers named
Figure 166 - Electricity prices vs energy intensity by sector (based on plant’s data)
Figure 167 – Gas prices vs energy intensity by sector (based on plant’s data)
Figure 168 - Energy taxes in the EU-28
Figure 169 - Energy taxes as a percentage of tax revenue and of GDP in 2018
Figure 170 - Energy taxes by economic activity
Figure 171 – Average energy tax for 1 toe of gross inland energy consumption in the EU-28
Figure 172 – Average energy tax for 1 toe of gross inland energy consumption in 2018
Figure 173 - Excise duty revenues from energy consumption
Figure 174 - Exercise duty revenues from energy consumption, adjusted for inflation (in 2015 euros)
Figure 175 - The share of excise duty revenues by energy product
Figure 176 - The share of excise duty revenues by energy product, 2018
Figure 177 - The average standard VAT rate in the EU
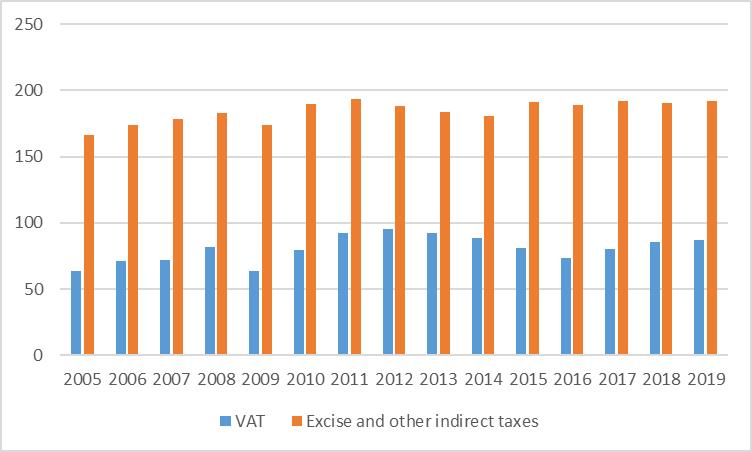
Figure 178 - Estimated tax revenue from gasoline, diesel and heating oil, EUR bn
Figure 179 - Realised electricity price in EUR/MWh for solar PV
Figure 180 - Realised electricity price as percentage of baseload price for solar PV
Figure 181 – Realised electricity price in EUR/MWh for wind onshore
Figure 182 - CAPEX for wind onshore in EUR/kW
Figure 183 - Realised electricity price per as percentage of baseload price for wind offshore
Figure 184 – CAPEX for wind offshore for selected countries
Figure 185 – Realised price for gas-fired power
Figure 186 – Revenue for gas fired generation by installed MW
Figure 187 - Realised price for coal-fired power
List of Tables
Table 1 - Key figures on the evolution and drivers of retail electricity prices between 2010 and 2019
Table 2 - The ratio and the difference of European, US and Japanese wholesale gas prices
Table 3 - Key figures on the evolution and drivers of retail gas prices between 2010 and 2019
Table 4 - Estimated average gas import prices by supplier (€/MWh)
Table 5 - EU crude oil import bill in 2013-2018
Table 6 - EU gas import bill in 2013-2018
Table 7 - EU hard coal import bill in 2013-2018
Table 8 – Summary Table: Evolution of energy, affordable warmth and transport share 2008-2018
Table 9 - Timely evolution of energy expenditure shares (%) 2008-2018
Table 10 – Timely evolution of transport energy expenditure shares (%) 2008-2018
Table 11 - Coverage of manufacturing sectors
Table 12 - Coverage of other sectors, excluding manufacturing
Table 13 - Energy costs shares in total production costs for manufacturing and non-manufacturing sectors, 2010-2017
Table 14 – Drivers of energy costs shares in total production costs, manufacturing and non-manufacturing sectors (EU avrg)
Table 15 – Categorisation of sectors according to the energy and production costs dynamics, 2010 -2017
Table 16 - Sector scope of the EU27 decomposition analysis
Table 17 - Sector scope of the G20 decomposition analysis
Table 18 - Decomposition of energy cost drivers by sectors in the EU between 2010 and 2017
Table 19- Decomposition of energy cost drivers for G20 countries over the period (2010-2016)
Table 20 - Decomposition of output drivers for the EU27 and main G20 trade partners, 2010-2017
Table 21- Structure intensity effect for EU27 for Manufacturing sub sectors at 2 digit level
Table 22- Drivers of total production costs in manufacturing sectors, EU27, 2010-2017
Table 23 - Changes in retail industrial electricity prices compared to EU prices, constant 2018 EUR/MWh
Table 24 - Factors in observed industrial retail electricity price changes per country, nominal prices per MWh
Table 25 - Changes in the industry retail natural gas price differential compared to EU prices between 2008-2019 (constant 2018 euros per MWh)
Table 26 - Factors in observed industrial retail natural gas price changes per country, nominal prices, per MWh
Table 27 - Plants participating in the study
Table 28 Energy prices & costs in selected EU energy-intensive sectors – simple average EU, 2018.
Table 29 - Exposure of EU selected energy-intensive industris to international trade – 2017/2018
Table 30 – Comparison of retail prices and taxes of different energy carriers (2019)
Table 31 –Maximum profitability observed for Solar PV
Table 32 – Maximum profitability observed for wind onshore
Table 33 – Maximum profitabvility observed for wind offshore
Introduction
This edition of the energy prices and costs report comes at an appropriate time alongside with the State of the Energy Report (SoEUR). The profound changes entailed by the energy transition require ample social and political support. Energy prices and energy costs (prices multiplied by consumption) should drive the markets’ transformation to achieve a carbon neutral economy while keeping energy affordable for citizens and businesses. In these difficult moments created by the COVID crisis, it is essential to ensure a fair energy transition that complements our efforts for recovery, provides a level playing field for our industry and keeps energy affordable for households. A successful energy transition towards the climate neutrality by 2050 as foreseen by the European Green Deal will require affordable energy while at the same time triggering investments in technologies needed for further decarbonisation. With the Clean energy for all Europeans package now under implementation and several Green Deal initiatives related to energy, taxation and climate policies being prepared, monitoring energy prices and costs helps to understand better the effects of our existing policies and provide useful insights for the preparation of the forthcoming proposals.
The evidence provided by the energy prices and costs report will serve to assess the implementation of our recent actions and initiatives..
The work and analyses presented in the report were impacted by important political, economic and societal events in recent years.
First, following the confirmation of exit of the United Kingdom from the EU, this report focuses now on the EU-27. Although, in various occasions statistics of UK are provided, the focus of the analysis and comprehensive approach is systematically applied to current 27 Member States. This significantly affects the direct comparability of the results of this report with previous ones.
Second, as for many aspects of our societies and lives, the COVID pandemic has required changes in the approach of this report which usually focused on analyses of ‘historical’ trends in data. While the available historical data covers until 2018 and in some cases 2019, given the COVID pandemic severe impact on energy prices and costs, where possible, the latest figures were included in the report to provide the most recent picture. That said, the COVID pandemic has also affected the quality and comprehensiveness of some of the collected data. Not all Member States were able to fully respond to our call to supply updates on household energy expenditure and less industrial sectors than foreseen participated in the specific collection of data at plant level which provides precious insights on the energy prices paid and the importance of energy costs for the most energy intensive industrial segments. Compared to the two previous editions of this report in 2016 and 20181, the COVID pandemic has in some cases limited the reporting ability in particular by the industry and this is reflected in somewhat reduced international comparisons and comprehensiveness of the assessment of energy prices and costs’ importance for some highly energy intensive sectors.
Part I of the report (Energy Prices, comprising Chapters 1-3) looks at the developments on wholesale and retail energy prices for electricity, gas and oil products between 2008 and 2019-20. On retail prices, the European Commission analyses the cost elements driving them up (or down). It presents the currently most extensive available breakdown of components affecting prices, in particular for taxes and levies, merging the very detailed ad hoc data collections done in the context of the preparation of past reports with the recently available new electricity and gas price statistics collected by Eurostat. Insights on the evolution, composition and drivers of retail prices together with international comparisons of the prices for petroleum, gas and electricity products are also provided in this Part of the report.
The impact of the energy costs on the economy, the industry and households, is addressed in in Part II (Energy costs, Chapters 4-6) of the report. Chapter 4 analyses the latest developments of EU’s energy import bill and the reasons behind them. Chapter 5 looks at the evolution of households’ energy expenditure, what drives it and to which extent it is affecting households’ budgets across income levels and energy poverty. Chapter 6 focuses on the evolution and impact of energy expenditure (energy costs) on the European industry. An assessment of the costs is made for manufacturing, agriculture and services sectors (more than 40 sectors are analysed) putting emphasis on the most energy intensive industries. There is an assessment of sectors’ energy costs shares, energy intensities and energy prices and, where possible under the limited available data, comparisons with international EU-trade partners. The analysis in this chapter benefits from the results of aggregated statistical data and the results of studies that collected data at plant level.
Part III (Chapter 7) looks at the taxes imposed on energy products and assesses their importance for government's budgets and their impact on the prices of these products.
In Part IV of the report (Chapter 8), the collected ‘realised’ prices of different generation technologies in the power market are analysed together with other sources of revenues and costs in order to map the profitability of these technologies. A sensitivity analysis of the profitability is also undertaken considering certain scenarios which include future evolution of key inputs (oil prices, carbon price) and other conditions.
Finally, the Annex of this report presents factsheets of the Member States with detailed information about their energy prices and costs.
PART I
ENERGY PRICES
1Electricity prices
1.1Wholesale electricity prices
Main findings
¾Over the last twelve years, wholesale electricity prices in Europe have generally moved in cycles, following developments in coal and gas markets. The current cycle began in 2016, when electricity prices bottomed out, and reached its peak at the end of 2018, when the European Power Benchmark (EPB) climbed above 60 €/MWh on a monthly basis. Since then, wholesale electricity prices have been on a declining trajectory on the back of falling fuel costs, weakening demand and rising renewable penetration. All these trends were magnified since the imposition of social distancing measures induced by the coronavirus pandemic. Electricity prices in many markets reached all-time lows during the lockdown period in the spring of 2020.
¾Price convergence across European wholesale markets also displays a cyclical nature. Whereas electricity prices on the continent were getting closer to each other in the period between 2015 and 2018, the opposite has been true ever since. The coronavirus pandemic has exacerbated the trend and drove differences in prices among and within regions to record levels. This was caused by the fact that electricity prices have been falling to a different degree, depending on the severity of the demand shock, weather conditions and the structure of the local power mix. Overall price convergence has remained low, which underlines the potential and opportunities for further investment in strengthening network capacities both among and within Member States.
¾The coronavirus pandemic has pushed spot electricity prices to record lows, but has had only a passing effect on long-term electricity prices. Since a significant part of electricity for final consumption is bought by traders year-ahead or even longer before the delivery, there is uncertainty whether the trend of falling retail prices observed in 2020 can be sustained in 2021.
¾In 2019, as widespread coal-to-gas switching progressed on the continent, wholesale power prices began to be influenced more by the developments in the gas market. Rising correlation between gas and electricity prices has been observed in markets where fuel switching has been particularly strong, such as the Netherlands, Germany, Greece, Portugal and Spain. This trend continued in 2020 and is expected to strengthen in the years ahead as coal capacities across Europe are retired in an accelerated fashion.
¾CO2 prices were rising steadily since 2018, culminating in the middle of 2019 at 30 €/t, the highest level since 2008. Unlike during the last major economic crisis in 2008-2009, the carbon market showed resilience in the face of the coronavirus pandemic. The effect of more expensive emission allowances on wholesale power prices has so far been blunted by declining fuel prices, weakening power demand and rising renewable generation. However, in regions with greater reliance on fossil fuels, pricier carbon exerted much stronger upward pressure on electricity prices.
¾Falling costs of renewable technologies and higher carbon prices have triggered a wave of investment in renewable capacities capable of competing with other participants in wholesale markets without any public support. This should be beneficial for consumers as it reduces budgetary needs sourced from renewable taxes imposed on electricity consumption.
1.1.1Evolution of wholesale electricity prices
Since 2008, day-ahead electricity prices in European wholesale markets have developed in cycles, influenced by costs of input fuels (coal and gas) and carbon allowances and by the changing structure of the power mix. The first cycle of the examined period started in the aftermath of the financial crisis in 2008-2009 when energy prices collapsed. The recovery lasted until 2011 and was followed by a prolonged downward path, stretching out to early 2016 when prices sank to levels not seen in more than a decade. A turnaround ensued quickly, however, driven by growing consumption and rising fuel and carbon prices, the effect of which was occasionally reinforced by supply restrictions during high-demand winter periods. This trend culminated in late 2018 on the back of peaking coal and gas prices. At the beginning of 2019, wholesale electricity prices fell abruptly and started to follow a downward trajectory again. This time, slowing economic activity, which curbed consumption, combined with falling fuel costs and rising renewable penetration to drive wholesale prices down. The coronavirus pandemic accentuated all these factors. Widespread lockdown measures imposed since March 2020 drastically reduced power demand, sent coal and gas prices to extreme lows and significantly raised the presence of renewables in the power mix. As a result, average European wholesale prices on the spot market reached an all-time low in April 2020 and began to recover only slowly in the following months.
The next chart (
Figure 1
) shows the evolution of the European Power Benchmark (EPB) and the range of minimum and maximum monthly wholesale electricity prices since 2008. The EPB is a weighted average of day-ahead prices in nine representative markets, serving as a general European benchmark. After averaging 43 €/MWh in 2017, the EPB rose to 52 €/MWh in 2018 and climbed back to 43 €/MWh in 2019. In the first half of 2020, it reached 24 €/MWh, its lowest level on record.

Figure 1 - Evolution of monthly average wholesale day-ahead baseload electricity prices in Europe, showing the European Power Benchmark and the range of minimum and maximum prices across the markets
Source: Platts, European power exchanges
Price convergence across European markets also displays a cyclical nature. Whereas wholesale prices on the continent were getting closer to each other in the period between 2015 and 2018, the opposite has been true ever since. The coronavirus pandemic has exacerbated the trend and drove differences in prices among and within regions to record levels. This was caused by the fact that prices were falling to a different degree, depending on the severity of the demand shock, general weather conditions and the structure of the local power mix. The sharpest declines occurred in the Nordic region where ample hydro reservoirs and rising wind generation reduced daily averages to single digits. Markets in Eastern and South Eastern Europe, on the other hand, experienced a more measured reaction as their lignite-oriented power mixes grappled with resilient carbon prices. As a general observation, it can be noted that rising wholesale prices tend to bring about greater convergence and vice versa.
Figure 2
illustrates in greater detail the degree of price convergence in day-ahead markets within selected European regions expressed in percentages of hours in a given year. The price convergence provides an indication of the level of market integration. Its longer-term drivers are market coupling initiatives or the expansion of transmission infrastructure. In the short term, fluctuations in convergence may also be caused by factors not necessarily related to the level of market integration, such as changes in the amount of cross-zonal capacity designated by grid operators for commercial purposes.
European electricity markets saw mixed developments in terms of convergence between 2018 and 2019. In Central Western Europe, where flow based market coupling has been applied since 2015, the number of occurrences of full price convergence (when the difference between hourly prices in all bidding zones falls within 1 €/MWh) increased noticeably in 2019 compared to the previous year (from 36% to 46% of hours). The decreasing divergence occurred despite the splitting of the DE-LU-AT bidding zone, which came into effect in October 2018 and which increased the number zones in the region from four to five. This could be explained by the fact that full price convergence between the partitioned zones of DE-LU and AT turned out to be relatively high, at 72% of hours in 2019. A considerable increase in full price convergence occurred also within the Baltic region and between Croatia and Slovenia where hourly prices were nearly identical more than 90% of the time in 2019. Price convergence also rose on the British Isles, following the implementation of market coupling between Great Britain and the Irish Integrated Single Electricity Market in October 2018. A new 1 GW interconnector linking Great Britain and the continent since January 2019 contributed to the rise in price convergence between France and Great Britain. On the other hand, decreases in price convergence were observed in Central and Eastern Europe, the Nordic region and between Spain and France in 2019. Overall levels of price convergence in Europe remain relatively low, which underlines the potential for further investment in strengthening network capacities both among and within Member States.

Figure 2 – Price convergence on day-ahead markets in selected regions as percentage of hours in a given year
Source: ENTSO-E, OTE, Nord Pool, Platts. The numbers in brackets refer to the number of bidding zones included. The CWE region comprises of BE, FR, NL and DE-LU-AT zones until October 2018, and separate DE-LU and AT zones since then. The CEE region includes CZ, SK, HU, RO bidding zones which are coupled. The Baltic region includes EE, LV, LT bidding zones. The Nordic region includes 12 bidding zones of Norway, Sweden, Finland and Denmark.
In order to obtain a comprehensive picture of how European wholesale electricity prices have developed since 2017, a consumption-weighted baseload benchmark (EP5) of 5 most advanced markets offering up to a 3-year visibility into the future was created and compared to a day-ahead (spot) equivalent. As shown in
Figure 3
, since the beginning of 2019, markets have been expecting power prices in the future to be higher than in the spot market, a situation which favours buying electricity closer to the time of delivery. The gap between the spot and year-ahead benchmarks has grown to almost 20 €/MWh during the coronavirus pandemic due to low demand, a high presence of renewables in the grid and abundance of cheap gas. The spot benchmark reached its all-time low in April.
The segment of prices for future delivery (forward prices), which are an important indicator for the future development of retail prices, experienced a remarkable shift. Until the end of 2019 the market expected wholesale prices to generally decline going into the future on the back of higher renewable penetration. But those expectations have reversed since then. The further one goes into the future, the higher the prices should climb, with the biggest jump apparent between year-ahead (2021) and two-year-ahead (2022) delivery periods. This is consistent with expectations of economic recovery in the years ahead.

Figure 3 – Monthly evolution of spot and forward wholesale electricity prices and the energy component of retail prices in Europe since 2017
Source: Platts, Vaasaett. The average energy component of household retail prices is weighted using population figures of EU27 capitals.
In 2017 and in the first half of 2018, forward prices generally followed their spot peers and rose considerably on the back of rising carbon and fuel costs. Afterwards, a period of relative stability ensued which lasted until the end of 2019. Forward prices decreased measurably before and especially during the lockdown period in 2020, when the number of known unknowns surrounding the coronavirus grew exponentially. However, forward prices recovered nearly all their losses by the end of July 2020 on the back of quickly rising carbon prices which offset the effect of lower fuel costs (mainly gas) expected in the future. Thus, the pandemic has pushed spot electricity prices to record lows on the one hand, but has had only a passing effect on long-term prices on the other.
Figure 3
illustrates that the interplay between spot and forward prices is not always straightforward. Additionally, since a significant part of electricity for final consumption is bought on the forward market by traders year-ahead of the delivery or even longer, forward wholesale prices play a vital role in determining the energy component of retail prices for households and industry. That is why a decrease in wholesale prices is channelled into retail prices with some delay and usually in a non-linear fashion. The delayed transmission effect helps explain why retail prices rose between 2017 and 2019 despite the fall in spot wholesale prices observed since 2019. A significant part of electricity destined for consumption in 2019 was bought at elevated price levels in 2018.
Given the fact that forward electricity prices have been much less affected by the coronavirus crisis, there is uncertainty whether the trend of falling retail prices observed in 2020 can be sustained in 2021.
According to data from Vaasaett, the average energy component of household retail prices in EU27 capitals started to decline measurably in April 2020 and this trend continued in May and June. The decline could be explained by falling spot prices in the wake of the pandemic.
Figure 4
shows the regional wholesale electricity prices in the North Western Europe (NWE) market coupling area, including Central Western Europe (Germany, France, Austria and the Benelux), Great Britain, the Nordic markets (Norway, Sweden, Denmark, Finland and the Baltic States) and the Iberian market (Spain and Portugal). Nordic markets have generally kept the lowest wholesale prices in Europe thanks to the prominent role of hydro power and rising wind generation in the region. However, Central Western Europe (CWE) moved closer to Nordic levels since 2018 on the back of rapidly rising renewable penetration and a solid performance of local nuclear capacities. During periods of exceptionally high wind generation in springtime, CWE prices went even below their Nord Pool peers.
Prices in the Iberian region kept their usual premium over the EPB during most of 2018 and 2019, but moved closer to the benchmark in 2020 due to significantly expanded renewable capacities, improved hydro generation and the covid-related demand shock. The British market generally displayed the highest prices since 2018, partly due to a carbon levy that puts additional costs on the local generators.
A warm and windy winter of 2019/2020 and restrictions on economic and social activity imposed in response to the spreading coronavirus put wholesale prices in the observed markets on a steep downward path in 2020. The most significant declines occurred in the Nordic markets where ample hydro reservoirs exacerbated the supply overhang.

Figure 4 - Regional market prices in the North-Western Europe coupled area
Source: Platts, European power exchanges
In the Central and Eastern Europe region (CEE – Poland, Czechia, Slovakia, Hungary, Romania, Croatia and Slovenia), prices followed the EPB closely in 2018, but disconnected afterwards as higher carbon prices imposed additional costs on local coal and lignite generators which constitute a large portion of the power mix. The average premium over the EPB reached 10 €/MWh since March 2020 (see
Figure 5
). In the face of the decreased competitiveness of local power plants, the region also began to rely more on imports from Germany and Nordic markets.
Four CEE day-ahead markets (Czechia, Slovakia, Hungary and Romania) are coupled, but overall price convergence within the area remains lower compared to the CWE region (see
Figure 2
). The Polish market is coupled with Sweden (and thus with the NWE region). Croatia and Slovenia are not coupled with the rest of the CEE region.

Figure 5 - The Central Eastern Europe average wholesale price and the EPB benchmark
Source: Platts, European power exchanges
Italy and Greece traditionally display higher wholesale electricity prices compared to the EPB due to the heavy presence of fossil fuels in their power mix and due to a relatively high reliance on imports (
Figure 6
). Since 2019, Greek prices have been consistently the highest of the group as increased carbon costs have challenged the economic viability of the domestic lignite fleet. The market has experienced a broad coal-to-gas switch that partially mitigated the impact of more expensive emission allowances. Italy has traditionally been a net electricity importer, as the cost of import (mainly from the CWE region) is competitive to domestic, primarily gas-fired power generation. Increased renewable penetration and the particularly pronounced covid-related demand shock brought Italian wholesale prices unusually close to the European benchmark in 2020.
Bulgarian wholesale prices shifted from a discount compared to the EBP in 2018 to a sizeable premium in 2019, as headwinds stemming from higher carbon prices impacted the generation costs of local lignite capacities. Bulgaria is normally a net electricity exporter, but its net outflows have been diminishing lately.

Figure 6 - Regional market prices in Italy and South Eastern Europe
Source: Platts, European power exchanges
1.1.2 Factors impacting the evolution of wholesale prices
Wholesale electricity prices are determined by market forces. In this section, we look at factors influencing both the demand and supply side.
On the demand side of the electricity market, residential consumption tends to be driven up by rising number of households, proliferation of electric appliances or the electrification of heating, while energy efficiency measures such as installing LED lightbulbs push electricity demand lower. Average temperatures play an important role too. In the case of businesses, the consumption of electricity is mainly influenced by two similarly countervailing factors: the level of economic activity and energy efficiency measures.
The next chart (
Figure 7
) assesses the relation between electricity consumption, economic activity and population trends. By the end of 2019, the gross domestic product in the EU27 was up by more than 14% and its population rose by 1.4% compared to 2010, yet electricity consumption decreased by 2% in the meantime. The decoupling of economic and population growth from electricity consumption points to the strengthening effect of efficiency measures over the last decade. In the last few years, the trend of exceptionally warm winters also contributed to the stagnation of electricity consumption, which is to some extent influenced by temperature conditions, especially in certain Member States.

Figure 7 - Electricity consumption, population and economic growth in the EU27
Source: Eurostat
On the supply side, the costs of the marginal generation technology (including imports as a competing alternative) in the merit order of a particular market determine wholesale prices. Therefore, the structure of the power mix and its changes can give some clues about price trends. The next chart (
Figure 8
) illustrates these changes in the EU27 electricity mix between 2010 and 2019. The share of fossil fuels (lignite, coal, gas and oil) decreased significantly (from 46% in 2010 to 37% in 2019). The role of coal has diminished in particular, falling from 24% to 16% over the last 10 years. At the same time the share of renewables (including wind, solar, hydro and biomass) increased from 23% to 35%. The share of nuclear-powered generation, meanwhile, decreased from 29% to 26%.

Figure 8 - Electricity generation mix in the EU27
Source: Eurostat. Based on gross generation data. 2019 series are estimates calculated from net generation data
Within renewables, the share of hydro power fluctuated between 11% and 14% depending on meteorological conditions. The increasing importance of renewable energy in the EU27 generation mix was driven mainly by wind power, whose share went up from 5% to 13% between 2010 and 2019, and to a smaller extent by solar PV installations, which emerged from a barely visible presence to capture 4% of the electricity mix in 2019.
Figure 9
offers a more detailed look at the generation mix which underwent considerable changes in the last three years. Two main trends shaped the developments. First was a large-scale switch from coal to gas which gathered strength in the course of 2019 across many markets and which was propelled by falling gas prices and elevated CO2 prices beneficial for less carbon-intensive technologies. Second, rapidly expanding wind and solar capacities together with favourable weather conditions measurably boosted renewable penetration. The coronavirus pandemic magnified both trends. Reduced power demand from the industrial and commercial sector coupled with rising renewable generation significantly restricted the space for coal-fired power plants in the merit order. Additional headwinds for coal came from record low gas prices and the resilience of the carbon market. This combination resulted in a 30% decline in coal generation in the EU27 in the first quarter of 2020 compared to the same quarter in 2019. Pressure on coal intensified in April and May as lockdown restrictions multiplied and dented demand levels. Power demand is expected to recover eventually but by that time rising renewable generation will have prevented coal from clawing back its place in the merit order. Additionally, low gas prices are expected to persist in the months and years ahead, which means that coal should continue to be at a disadvantage to its less CO2-intensive rival. In fact, gas prices fell so low at times in 2020 that they made the least efficient gas plants more competitive than the most efficient lignite plants. This development has been helped by the fact that the carbon market withstood the pandemic and continues to favour cleaner alternatives to coal. Several announcements of accelerated plant closures (Czechia, Denmark, Germany, Italy, Portugal, Spain, Sweden) or abandoned new projects (Poland) confirm the persisting deterioration of coal’s position in the European power sector.

Figure 9 - Monthly electricity generation in the EU27 and the shares of renewables and fossil fuels
Source: ENTSO-E, Eurostat. Data represent net generation.
The marginal costs of each generation technology, which play a crucial role in determining wholesale prices, differ greatly. Wind farms, solar PV installations and hydro power plants have very low or negligible marginal generation costs. Nuclear power plants also display relatively low marginal costs (due to the fact that the cost of nuclear fuel compares very favourably to the amount of energy it is able to release). Coal-, gas- and oil-fired generation technologies have higher running costs (due to a bigger influence of prices of the fuel they burn) and since they usually provide flexibility in response to fluctuating demand patterns, they tend to set the clearing price. Rising generation from intermittent renewables (wind, solar) and other low marginal cost technologies tends to push fossil fuels farther on the merit order curve and, as a result, drags wholesale prices lower, assuming the same level of power demand.
Figure 10
shows monthly coal, gas and emission allowance prices and the European Power Benchmark compared to the average of 2008. Gas prices disconnected from their coal peers in the wake of the Fukushima accident in 2011 as gas-fired power generation in Japan surged to make up for the lost nuclear output. This trend combined with very low carbon prices to seriously undermine the profitability of gas-fired power plants in Europe and gave boost to coal firing in the electricity sector. It is clearly visible that the EPB closely followed coal prices between 2012 and 2016. Afterwards, the trend started to change as European coal and gas prices became more interlinked again. Power prices showed greater correlation with the gas market in 2017, before going back to following coal in 2018. In 2019, as widespread coal-to-gas switching progressed, wholesale power prices seemed to be taking more cues from the gas market. Rising correlation between gas and electricity prices has been detected in markets where the fuel switch has been particularly strong such as the Netherlands, Greece, Germany, Portugal and Spain. This trend continued in 2020 and is expected to strengthen in the years ahead as coal capacities across Europe are retired in an accelerated fashion. Overall, it is obvious that power prices are still greatly influenced by the prices of fossil fuels. However, at local level, higher renewable penetration tends to be associated with lower wholesale prices (Trinomics et altri, 2020).
After a period of low prices between 2011 and 2017, CO2 emission allowances embarked on a rising trajectory since 2018, culminating in the middle of 2019 at 30 €/t, which was the highest level since 2008. The rising trend was underpinned by a tightening of supply through the Market Stability Reserve which started operating in January 2019. Unlike during the last major economic crisis in 2008-2009, the carbon market remained resilient in the wake of the coronavirus pandemic. CO2 prices declined only briefly in the first weeks of the lockdown period in March and gradually recovered in April and May 2020. Monthly averages stayed at or above 20 €/t in the first six months of 2020. Developments in the carbon market significantly contributed to the coal-to-gas switch and to driving current generation capacities as well as planned investments towards the decarbonisation of the European electricity sector. The carbon footprint of power generation in the EU27 declined by 16% in 2019 compared to a year before. The effect of more expensive emission allowances on wholesale power prices has so far been blunted by declining fuel prices, weakening power demand and rising renewable generation. However, in regions with greater reliance on fossil fuels, pricier carbon exerted much stronger upward pressure on electricity prices.

Figure 10 - Monthly coal, natural gas and carbon price indexes, compared to the 2008 average price and the share of renewable energy (right hand scale)
Source: Platts
The growth in renewable energy generation has been helped by supporting policies at EU level as well as at the level of Member States who need to meet their 2020 renewable energy targets. Various instruments such as feed-in-tariffs or feed-in-premiums have incentivised the uptake of wind and solar power in the grid. Falling costs of renewable technologies and higher carbon prices have ignited a wave of investment in new renewable capacities that do not rely on any form of public support. Such renewable projects typically sell part of their production on the open market (day-ahead), while the rest is secured in advance via long-term power purchase agreements, either with industrial electricity consumers or with utilities who then re-sell the electricity to end users. This indicates that in a growing number of markets, renewable technologies are able to compete with other participants without any subsidies. This should be beneficial for consumers as it reduces budgetary needs sourced from renewable taxes imposed on electricity consumption.
Further savings can be expected from the continued integration of European wholesale electricity markets, supported by EU policies. Initiatives such as European Single Intraday Coupling (SIDC), which links intraday markets of more than 20 countries, should bring about more efficiencies thanks to improved liquidity and increased cross-border electricity trade.
At EU level, electricity trade with third countries does not significantly influence wholesale market prices as extra-EU electricity imports or exports are negligible compared to bloc's total consumption. However, for some regions the situation is different (e.g.: Baltic states and Italy), as they source significant amounts of their consumption needs from abroad (see
Figure 11
), which sometimes includes third countries. Of all the regions under observation, only Central Western Europe remained consistently in surplus, retaining its position as Europe’s main exporting region thanks to plentiful and diverse generation capacities, competitive prices and a central position suitable to supply the rest of Europe. The Nordic region shifted repeatedly from surplus to deficit, depending mainly on the regional hydro reservoir level. The other regions remained in a net importer position. As electricity normally flows from areas with lower prices to higher-priced ones, net exporter regions have lower wholesale prices compared to net importers.
The covid-related demand shock reduced importing needs especially in Italy and the British Isles, curbing exports from the CWE region. The Nordic net exports surged in the spring of 2020 on the back of high hydro reservoir levels supported by increased precipitation. The abundance of cheap electricity led to extremely low spot prices in Nord Pool markets in the first half of 2020.

Figure 11 - Net electricity flow positions of individual European regions
Source: ENTSO-E
1.1.3 International comparisons
Comparing the average prices in the EU27 with wholesale prices of Europe’s important trading partners can provide a useful insight into how energy cost differentials can impact the competitiveness of European energy-intensive industries with a high international exposure. Electricity bills are only one of the factors determining international competitiveness. A more detailed analysis of the impact of prices on competitiveness can be found in chapter 6.
Figure 12
shows that since 2008 wholesale electricity prices in the US have been mostly lower than in the EU27, with the EU-US price ratio staying close to 2:1 between 2018 and 2019. This can be traced to the abundance of domestically produced, low-cost natural gas that serves as the fuel to price-setting power plants in most US electricity markets. In contrast, prices in Japan increased significantly after the Fukushima accident in 2011 as a large amount of nuclear capacity was put offline and the country had to rely more on burning imported natural gas. This drove Japanese wholesale prices 3-4 times above their EU peers between 2012 and 2014. Since 2016, as nuclear capacities were gradually put back into operation, the wholesale price gap decreased but never disappeared entirely.
The proxy for wholesale prices in China
has accelerated its decline since 2017. The proxy price level is relatively high, but in reality, the wholesale price is likely to be much lower, as suggested in other studies, but for which price data was not usable
.
Figure 13
shows some further examples of wholesale prices of important EU trade partners. Wholesale prices in Canada were one of the lowest in the world over the last twelve years due to the dominant presence of hydro power plants (60%) in the national power mix, supplanted by other renewables and nuclear generation (21% combined). Similarly low power prices were observed in Russia, richly endowed with natural resources of all kinds. Prices in Australia rose above EU levels in 2018 and 2019, while those in Turkey generally followed their EU peers.
An analysis of the evolution of price differentials between the EU27 average and G20 countries in constant 2018 EUR prices shows that price developments across 10 of the 14 non-EU G20 countries have been positive for the EU. In 2008, six countries (AU, CA, ID, RU, ZA and TK) had lower prices than the EU27 average, but this fell to four countries by 2019 (CA, IN, RU, US), with Australia, Turkey and South Africa becoming more expensive than the EU27 and the US and Indonesia becoming cheaper.

Figure 12 - Comparison of wholesale electricity prices in the EU with global trade partners
Source: Trinomics et altri study (2020)

Figure 13 - Comparison of wholesale electricity prices in the EU with global trade partners
Source: Trinomics et altri study (2020)
1.2Retail electricity prices
Main findings
¾Retail electricity prices across all consumer types increased between 2017 and 2019, driven mainly by rising prices of baseload power in the wholesale market in 2017-2018. In the case of households, the average EU27 retail price went up by 4% to 214 €/MWh. Mid-size industrial companies experienced a 5% increase in the average price to 106 €/MWh.
¾The amount of electricity taxes and levies paid by households in the EU27 per MWh has stabilized since 2017 and has fallen in the case of industrial enterprises. Thus, the role of the tax component, which had long acted as the main inflationary element in the total electricity bill, has decreased for the first time.
¾Progress towards the completion of the single energy market continued and brought energy components in individual Member States closer together than ever before: they became 14% and 9% less spread out since 2010 for households and industrial consumers respectively. This contributed to rising convergence in total retail prices for both consumer categories which can be observed since 2016.
¾Taxes and levies remain by far the most important source of differences in retail prices across Member States, displaying dispersion that is three times higher on average than that of the network and energy components. This is caused by a very varied nature of Member States’ policies and fiscal instruments affecting the taxation of electricity consumption. In 2019, environmental taxes paid by households ranged from 1 €/MWh in Luxembourg to 118 €/MWh in Denmark, while applied VAT rates spread from 5% in Malta to 27% in Hungary.
¾The average amount of electricity taxes collected from households to finance renewable support schemes peaked in 2015 at 29 €/MWh and has stabilized in recent years at 25 €/MWh. This is remarkable as renewable generation in the EU27 expanded by 14% between 2015 and 2019 and the share of renewable electricity in the grid is growing rapidly.
¾The average EU27 household electricity price grew annually by 2.3% since 2010, while general inflation, measured by the harmonised index of consumer prices, advanced by 1.4% annually during the same period. Meanwhile, industrial electricity prices in the ID band grew at an annual rate of 1.1%, which compares to the 1.3% annual inflation rate in producer prices. In the case of large consumers and energy-intensive industries in the IF band, electricity prices in 2019 were 5% lower than in 2010.
¾The most recent data available indicate that the substantial decline in wholesale electricity prices induced by the coronavirus pandemic in the first half of 2020 has already had a measurable impact on household retail prices, which have started to decrease. Furthermore, a fall in the tax component also contributed to the decrease in retail household prices. As a result, the average price paid by a representative household in one of EU27 capitals declined by 3% during the first six months of 2020 compared to 2019.
Table 1 - Key figures on the evolution and drivers of retail electricity prices between 2010 and 2019
|
Consumer type
|
Household (DC)
|
Industrial (ID)
|
Large Industrial (IF)
|
|
Component
|
Annual growth
|
Share 2019
|
∆ Share 2010-2019
|
Annual growth
|
Share 2019
|
∆ Share 2010-2019
|
Annual growth
|
Share 2019
|
∆ Share 2010-2019
|
|
Energy
|
-0.2%
|
32%
|
- 8 p.p.
|
-2.5%
|
46%
|
- 17 p.p.
|
-3.2%
|
55%
|
- 15 p.p.
|
|
Network
|
2.3%
|
27%
|
+ 0 p.p.
|
2.2%
|
19%
|
+ 1 p.p.
|
1.2%
|
15%
|
+ 2 p.p.
|
|
Taxes
|
4.7%
|
41%
|
+ 8 p.p.
|
8.5%
|
34%
|
+ 16 p.p.
|
5.7%
|
30%
|
+ 13 p.p.
|
|
Total
|
2.3%
|
|
|
1.1%
|
|
|
-0.6%
|
|
|
Source: DG ENER in-house data collection. Eurostat
Aim and scope of the chapter
The following chapter analyses retail electricity prices, taking an in-depth look at the evolution, composition and drivers of prices paid by final consumers in the EU27 and selected non-Member States from 2010 to 2019.
Data sources
The chapter draws on past in-house data collection efforts by the Directorate General for Energy of the European Commission (DG ENER) used in the previous iteration of this report and, for the most recent period, on publicly available Eurostat databases of electricity price components for household and non-household consumers (nrg_pc_204_c and nrg_pc_205_c).
The chapter is structured along different consumer types. These are defined by Eurostat methodology under Regulation (EU) 2016/1952 of the European Parliament and of the Council of 26 October 2016 on European statistics on natural gas and electricity prices. It differentiates household and industrial consumers, whereas both consumer types are further broken down into consumption bands. Different bands are applied to electricity and natural gas. Due to the derogations granted to several Member States with regard to the provision of statistics pursuant to Regulation (EU) 2016/1952, the complete set of data for the whole EU27 and certain Member States for 2018 are not available and therefore not included in the report.
The chapter commences by examining household electricity prices at EU level and in each reporting country. Next, the chapter looks at electricity prices paid by industrial consumers. It differentiates between two levels of industrial consumption in order to provide a nuanced picture of a diverse group of consumers, from mid-size businesses to manufacturing industries consuming large amounts of energy.
In order to investigate driving forces behind retail price developments, total prices are further decomposed into three main components: Energy and supply (Energy), Network costs (Network) and Taxes, fees, levies and charges (Taxes and levies). The Taxes and levies category is then further disaggregated into six subcomponents (five in the case of gas) designed to display the importance and impact of specific Member State policies in a comparable way.
All figures representing the EU27 are consumption-weighted averages of EU27 Member States. The number of countries included in each EU average can differ across consumption bands, depending on data availability.
1.2.1Household electricity prices
The following section analyses prices paid by household electricity consumers. It examines weighted EU27 averages for the DC band, covering annual consumption of 2500 to 5000 kWh, which is the most common volume for the majority of households. A comparison of reporting countries based on a most representative band is also included. In this case, each Member State (and selected non-Member States) is represented by the consumption band accounting for the largest share in total household consumption. In other words, it is represented by the price for which most electricity in the household category was sold. It is irrespective of the number of consumers in the band.
Evolution of household electricity prices
Retail prices in the DC band grew at an annual rate of 2.3% from 2010 to 2019, while general inflation, measured by the harmonised index of consumer prices, advanced by 1.4% annually during the same period. Thus, electricity has become 9% more expensive in real terms during the last ten years. In absolute terms, the EU27 retail price grew from 175 to 214 €/MWh in the same period.
The average EU27 price rose by 4% between 2017 and 2019, driven mainly by the rising energy component (+7%), which responded to the developments in the wholesale market, and by more expensive network costs (+5%). The taxes and levies category remained unchanged and its share in the total bill decreased by a percentage point to 41%. This was the first time that the dominant tax component saw its importance reduced. It underlines the fact that the inflationary effect of this category, propelled in the past mainly by renewable support policies, has subsided.


Figure 14 - Evolution and composition of the EU household price (DC band)
Source: DG ENER in-house data collection, Eurostat
Long-term trends in main retail price components
Over the last ten years, the composition of household retail prices changed markedly. The share of the energy component decreased by 8 percentage points to 32% in 2019. At the beginning of the decade, the commodity component, determined largely by wholesale prices, was the most important of the three components at EU level.
In absolute terms, the energy component was little changed in 2019 compared to 2010, decreasing by 2% to 68 €/MWh. At Member State level, 13 Member States reported lower energy components in 2019 than in 2010. One of the most remarkable changes occurred in Germany where the energy component declined by 32% to 58 €/MWh in the last decade. In Romania, meanwhile, the same component rose by 76% to 59 €/MWh. Across Member States, energy components were less spread out in 2019 than ten years earlier (their relative standard deviation decreased by 14%) on the back of progressing wholesale market integration and more competition between suppliers.
The share of network costs in the final household bill has been almost constant at 27% throughout the decade. In absolute terms, the network component grew at an annual rate of 2.3% and reached 59 €/MWh in 2019. This underlines the rising need for infrastructure investment necessary to make the grid more flexible and resilient in order to accommodate growing amounts of decentralized and intermittent renewable electricity.
The taxes and levies component has been the most significant driver of retail price developments over the last decade. Whereas in 2010 it accounted for 33% of the average EU27 price for DC households, its share grew to 42% in 2016, before retreating to 41% in 2019. In absolute terms, taxes grew at an annual rate of 5% and reached 87 €/MWh in 2019. The next section analyses in greater detail which specific policies and fiscal instruments were driving this increase.
Composition of taxes, levies, fees and charges
In order to better understand how Member State policies and fiscal instruments impact household retail prices, the taxes levies, fees and charges category is broken down into six subcomponents. It is important to note that only policies and mechanisms that directly impact retail prices are considered. Also, not every tax subcomponent exists or is applied in each Member State. The following chart displays the evolution of EU27 averages.

Figure 15 – Evolution of taxes, fees, levies and charges for EU households since 2010 (DC)
Source: DG ENER in-house data collection, Eurostat
Figure 15
shows that taxes and levies associated with policies designed to support renewable energy sources were the main driver behind the rise in the whole tax component in the first half of the observed decade, growing from 10 €/MWh in 2010 to 29 €/MWh in 2015. Since then, however, a decline in this subcomponent could be observed, as governments gradually embraced more economically efficient forms of public support (by setting subsidy levels at auctions rather than via fixed feed-in-tariffs for instance). Between 2017 and 2019, the renewable tax subcomponent remained unchanged at 25 €/MWh, making up 12% of the total retail price.
Rising VAT and, in the last few years, rising environmental taxes have also contributed to the growth of the tax component. The VAT subcomponent increased from 27 €/MWh in 2010 to 33 €/MWh in 2019, accounting for 16% of the total household bill for electricity at the end of the observed period. Environmental taxes in the EU27 rose from 13 €/MWh in 2010 to 19 €/MWh in 2019, making up 9% of the total retail price. The influence of other subcomponents has been less pronounced.
The structure of the taxes and levies component changed very little between 2017 and 2019, as did its absolute value. The share of individual subcomponents in 2019 can be seen in
Figure 16
.

Figure 16 - Composition of the taxes and levies component of household electricity prices in 2019 (DC band)
Source: DG ENER in-house data collection, Eurostat
The next section offers a brief description of individual subcomponents.
Value added tax
VAT is imposed on household electricity prices in all reporting countries. The EU VAT Directive explicitly allows Member States to apply reduced rates to electricity. As a result, VAT rates range from 5-6% in Greece and Malta to 25-27% in Denmark, Sweden and Hungary. Most common rates average 20%. As the largest sub-component, VAT accounted for 38% of the tax component and 16% of the total retail price for households. VAT is an ad valorem tax, its absolute value is based on the value of all other elements in the price. Even if VAT rates remain unchanged but other elements increase, the absolute amount of VAT increases. The average amount of VAT paid by households in the EU27 rose by 26% since 2010, which compares with a 22% increase in the total retail price and suggests a slight rise in the average VAT rate applied to electricity.
Environmental taxes
The sub-component includes any manifestation of excise duty, environmental, greenhouse gas emission, transmission and distribution taxes. Their common characteristic is that revenues from these taxes are not normally earmarked to energy, climate- or environment-related policies. In other words, revenues flow into the central state budget regardless of the name of the tax. Minimum excise duty levels on energy products are harmonised at EU level and are defined by the Council Directive 2003/96/EC22. The sub-component excludes VAT. Environmental taxes were collected by 20 Member States in 2019. They made up 22% of the taxes and levies component, representing the third largest item after VAT and renewable taxes. The average amount of environmental taxes paid by households in the EU27 rose by 50% since 2010.
Renewable taxes
This sub-component includes any support to renewable energy, energy efficiency and combined heat and power generation (CHP). Renewable taxes are not collected in 5 Member States. In Finland and Malta, the renewable energy support scheme is not financed through an explicit levy but from the state budget. France has been following the same example since 2016. In Hungary, household electricity consumers, unlike their industrial counterparts, are exempted from renewable surcharges. No green levies are imposed also on Bulgarian households. It is important to note that electricity consumers still contribute to the support of renewable energy as they are also tax payers. In several countries renewable energy is supported also from other sources than taxes on consumer bills.
An average household in the EU27 paid 25 €/MWh in renewable taxes in 2019. This figure is equal to 29% of the taxes and levies component and to 12% of the total EU price. The average amount of renewable taxes paid by households in the EU27 rose by 153% since 2010.
Capacity taxes
This category includes taxes, fees, levies or charges related to ensuring adequate capacity for generation, taxes on coal industry restructuring, taxes on electricity distribution, stranded costs and levies on financing energy regulatory authorities or market operators. Capacity taxes were imposed by 11 Member States in 2019. The impact of these charges remains limited, at around 1% of the total retail price.
Nuclear taxes
This category includes taxes, fees, levies or charges relating to the nuclear sector, including nuclear decommissioning, inspections and fees for nuclear installations. Nuclear taxes are collected in Belgium, Italy (which closed its last nuclear power plant in 1990) and Slovakia. Their impact on prices is negligible at EU level.
Other charges
This category includes all other taxes, fees, levies or charges not covered by any of the previous five categories, such as support for district heating, local or regional fiscal charges, island compensation or concession fees relating to licences and fees for the occupation of land and public or private property by networks or other devices. At 6 €/MWh in 2019, the absolute value if this subcomponent decreased slightly compared to 2010. Its share in the total retail price amounted to 3% in 2019.

Figure 17 - Breakdown of household electricity prices (DC band)
Source: DG ENER in-house data collection, Eurostat
Situation in individual Member States
Figure 18
informs about household retail prices and their composition in individual Member States in 2019. Denmark reported the highest price of 295 €/MWh, overtaking Germany with a price of 287 €/MWh. German households in the DC band, which occupied the top spot in 2017, saw retail prices falling by 6% in the last two years. Relatively high prices were also reported from Belgium (285 €/MWh). Bulgaria had the lowest price among Member States (98 €/MWh). The ratio of the highest to the lowest price across the EU27 reached 3:1 in 2019, a slight decrease compared to previous years. 19 Member States reported prices lower than the EU27 average in 2019, indicating the inflationary influence over the average of larger Member States such as Germany, Spain and Italy which reported above-average prices and which carry a significant weight given their consumption levels. Overall, household retail prices have become less spread out in the last three years. Their relative standard deviation declined by 8% since 2016, pointing towards rising convergence across Member States.

Figure 18 - Household prices in 2019 (DC band)
Source: Eurostat
Despite the fact that retail prices for households have risen at EU level since 2017, eight Member States experienced price falls of a mostly modest nature during the period. The largest of them occurred in Greece where retail prices declined by 13% between 2017 and 2019 on the back of falling taxes. The biggest upward move was reported in the Netherlands where prices rose by a third since 2017 due to a significant increase in VAT and in environmental and renewable taxes.
Denmark and Germany reported the highest tax components of almost 190 and 156 €/MWh respectively, which accounted for more than half of the total retail price in 2019. No other Member State had such a high share of taxes in the final price. In contrast, Belgium’s tax component was in line with the EU27 average, but higher network and energy costs propelled it close to German price levels. The lowest taxes on electricity, both in absolute and relative terms, were assessed in Malta (8 €/MWh) where no renewable surcharges are collected and where the VAT rate is set at 5%, the lowest in the EU27.
As was the case in 2017, Belgium recorded by far the highest network component of 109 €/MWh in 2019, which was nearly double that of the EU average (59 €/MWh). On the opposite side of the spectrum, Malta and Bulgaria had the lowest network charges (25 €/MWh).
The largest energy components were reported in the island systems of Ireland (125 €/MWh), Cyprus (124 €/MWh)
and Malta (97 €/MWh). Relatively high energy costs result from their typical characteristics: limited or (in the Cypriot case) non-existent interconnection capacities, the absence of economies of scale, a limited variety of power sources and a higher proportion of costs to ensure security of supply. Italy and Greece also reported commodity costs above 90 €/MWh which stems from relatively higher wholesale prices in these Member States highly dependent on burning fossil fuels for electricity generation and on imports. The lowest values of the energy component were recorded in Hungary (42 €/MWh) and Poland (43 €/MWh), markets with stronger forms of price regulation. Average wholesale day-ahead prices in both markets climbed above 50 €/MWh in 2019. This is visible in
Figure 19
which depicts the difference between the energy component of household retail prices and the average day-ahead baseload price in wholesale markets of respective countries in 2019.
While other factors influenced the total amount of retailers’ purchasing costs for electricity supplied to their customers in 2019 (such as year-ahead wholesale prices in the previous year, hedging strategy, consumption profiles, structure of customers, balancing costs, various forms of price regulation), the wide differences shown in
Figure 19
still betray relatively large mark-ups netted by retailers in some Member States. In the case of Ireland, even when considering the cost of the energy component for the more representative DD band, the difference still reaches 60 €/MWh.

Figure 19 – Difference between the energy component of household retail prices and average day-ahead baseload prices in individual markets in 2019 (DC band)
Source: Eurostat, Platts, European power exchanges

Figure 20 - Composition of hosehold prices in 2019 (DC band)
Source: Eurostat
Box – Definition of the most representative band
Household electricity consumption is broken down into 5 bands in Eurostat methodology. The most representative band is defined as the one of these five bands with the highest share in total consumption. In other words, the price for which the most electricity is sold. While the DC band is used as the main point of reference for comparative analysis, a few Member States register only a small portion of consumption in this category. Household consumption varies across countries. It is determined by factors including household size, climatic conditions (availability of sunlight and consequent lighting needs, heating and cooling needs), the extent to which electrification is used in heating or the number and efficiency of electric appliances in a typical household.
To analyse prices in a comprehensive manner, reporting in the most representative band in each market is also included. The selection of consumption bands is based on the previous iteration of this report where this concept was introduced.
 Source: DG ENER in-house data collection
As visible from
Figure 21
, the results do not differ greatly from the DC-based comparison. No changes occur either at the top or at the bottom of the chart. Ireland, which falls in the DD band, records 15% lower prices than in the DC band, moving by five spots closer to the centre of the chart. In France, where household heating is dominated by electricity, retail prices in the most representative DD category are 10% lower than in the DC band. A similar, if slightly larger difference could be observed in Slovenia, also put in the DD band. The largest difference was observed in Norway, placed in the DE band with the highest average consumption level in Europe. Retail prices for the most typical Norwegian household reached 117 €/MWh, a third lower than in the DC band.

Figure 21 - Household prices in 2019 (most representative band)
Source: Eurostat
Box – European Commission efforts to increase interconnection and storage capacities
Interconnection and storage capacities – or more precisely the lack thereof – are an important factor driving up wholesale prices and, by extension, energy components of retail prices. The socioeconomic value of electricity interconnectors comes from their ability to reduce costs by increasing the efficiency of the electricity system, improving security of supply and facilitating a cost-effective integration of rising volumes of renewable energy in the grid.
The framework for the trans-European energy networks (TEN-E) and the Projects of Common Interest (PCIs) are the main tools of the EU energy policy to increase physical electricity exchange capacity among Member States. The PCIs aim particularly to better connect the peripheral regions such as the Iberian Peninsula, Ireland or Malta with the rest of Europe or to integrate rapidly growing share of renewables from remote generation areas such as the North Sea. The current fourth PCI list includes 100 electricity transmission and storage projects which benefit from streamlined permitting procedures, improved regulatory conditions and, under certain conditions, are eligible for funding through the Connecting Europe Facility.
In addition, the 10% electricity interconnection target set for 2020 has provided political momentum to advance key cross-border projects. 17 Member States reported being on track to reach that target by 2020, or have already reached the target, but more interconnections are needed in some regions. PCIs currently planned or under construction should help with this effort.
In November 2017, the Commission proposed to operationalise the 15% interconnection target by 2030 through a set of additional and more specific thresholds which serve as indicators of the urgency of the action needed. The new thresholds reflect the three headline goals of European energy policy: increasing competitiveness through market integration and better prices, guaranteeing security of supply and achieving the climate targets through increased use of renewable sources.
Recent developments in household prices
The most recent data available indicate that the substantial decline in wholesale prices observed in the first half of 2020 has already had a measurable impact on household retail prices which have started to decrease. The average energy component of a representative household in EU27 capitals declined by 3% in the first half of 2020 compared to 2019, with falls observed in 19 Member States. Several capitals experienced substantial decreases in the energy component between December 2019 and June 2020, most notably Brussels and Madrid (-29%), followed by Stockholm (-21%) and Copenhagen (-19%). In addition, a fall in the tax component contributed even more to the decrease in retail household prices. Between 2019 and the first half of 2020, the average value of taxes and levies paid by households in EU27 capitals (VAT plus all the other types) decreased by 5%. The largest declines in taxes were observed in the Netherlands, Cyprus and Spain. As a result of falling taxes and wholesale prices, the average household retail price in EU27 capitals declined by 3% during the first six months of 2020 compared to 2019.

Figure 22 - Evolution and composition of the average retail electricity price for representative households in EU27 capitals (DC band)
Source: Vaasaett, the EU27 average is weighted by population figures of EU27 capitals.
1.2.2Industrial electricity prices
The following section analyses prices paid by non-household electricity consumers at EU and Member State levels. It examines prices of the Eurostat band ID, covering annual consumption of 2000 to 20 000 MWh. This band can be considered representative of mid-size businesses across many segments of the economy. Price trends in the IF band are also analysed in order to look more closely at the situation of large enterprises and energy-intensive industries.
Box – Sectoral split of electricity consumption
Households accounted for 27% of the total EU27 electricity consumption in 2018, the most recent year for which data are available. This was slightly lower than a decade earlier, when households made up 28% of the total and reflects progress in energy efficiency measures in the sector and the trend of warmer winters. The share of electricity consumed by industrial users, meanwhile rose from 36% to 37% as efficiency improvements in the sector were outweighed by higher production volumes. Public institutions and commercial establishments kept their share largely unchanged at 28% between 2010 and 2018. The same was true for the transport sector which accounted for just 2% of the total electricity consumption in the bloc. Most of this electricity was consumed by railway operators.
Evolution and drivers of industrial electricity prices at EU level
Industrial electricity prices in the ID band grew at an annual rate of 1.1% during the last decade, or from 96 €/MWh in 2010 to 106 €/MWh in 2019 in absolute terms. This growth was slower than the overall inflation of industrial producer prices which averaged 1.3% annually during the same period. Since 2017, industrial electricity prices rose by 5%, driven by the energy component which gained 21% (or +9 €/MWh). The effect of higher wholesale prices was slightly mitigated by a 6% (-2 €/MWh) fall in the taxes and levies component and a similar relative decline in the network component (-1 €/MWh).


Figure 23 - Evolution and composition of the EU27 industrial retail prices (ID band)
Source: DG ENER in-house data collection, Eurostat
Due to the exclusion of VAT and other factors related to tariff calculation, industrial electricity prices are more influenced by the energy component compared to households and, hence, more driven by developments in wholesale markets. Nevertheless, even in the case of industry, the importance of taxes has grown considerably in the past decade. Whereas taxes (excluding VAT) accounted for 18% of the total retail price in 2010, their share grew to 38% in 2017, before falling to 34% in 2019. This was the first decrease since at least 2007 and mirrors a similar trend in household prices. The share of the energy component declined as the amount of taxes paid by the industry grew. At the beginning of the decade, commodity costs and retailers’ mark-ups accounted for 64% of the total price. Their share reached 46% in 2019.
In absolute terms, the energy component declined by 21% to 49 €/MWh in 2019 compared to 2010. The contraction of the energy component, which apart from wholesale electricity prices contains retailers’ mark-ups, can be partly linked to EU energy policies supporting competition through more interconnection capacities, market coupling and greater supplier choice. The network component grew by 21% over the past decade to 21 €/MWh and its share in the total price rose slightly from 18% to 19%. The taxes and levies component doubled since 2010 to 36 €/MWh.
Situation in individual Member States
As illustrated by
Figure 24
, Denmark reported the highest retail industrial price (186 €/MWh), followed by Cyprus (166 €/MWh), Germany (142 €/MWh) and Italy (141 €/MWh). Sweden (63 €/MWh) and Finland (68 €/MWh) stood at the other end of the price spectrum. The ratio of the highest to the lowest price across the EU27 reached 3:1 in 2019, a significant improvement compared to 4:1 in 2015. 20 Member States reported prices lower than the EU27 average in 2019, indicating the inflationary influence of Germany and Italy which reported above-average prices and which accounted for 34% of the total weight in the average price due to their high consumption levels. Overall, industrial retail prices have become much less spread out in the last few years. Their relative standard deviation declined by 21% since 2016, pointing towards rising convergence across Member States. The main driver behind this development has been the convergence in the energy component, which has risen by a third since 2012 thanks to wholesale market integration and more competition between suppliers. Differences in the tax component remain three times larger (measured by relative standard deviation) than the in the case of network and energy costs. Thus, taxes and levies are the main source divergence of retail prices for the industry.
Taxes and levies were the main reason for high prices in Denmark and Germany. No other Member State came close to amounts collected by governments in Copenhagen and Berlin. Renewable taxes made up 70% of the taxes and levies component in Germany, while in Denmark environmental taxes were responsible for 95% of the whole component. In Cyprus, the energy component was the biggest contributor to the total price, mirroring the composition in the household sector. The lowest taxes were recorded in Bulgaria (1 €/MWh), Malta (2 €/MWh) and Sweden (4 €/MWh).

Figure 24 - Industrial retail electricity prices in 2019 (ID band)
Source: DG ENER in-house data collection, Eurostat
As for the network costs, Ireland (34 €/MWh), Slovakia (33 €/MWh) and Germany (31 €/MWh) reported the highest values in this component. The lowest network costs were registered in Spain (7 €/MWh) and Greece (9 €/MWh).
The largest energy components were reported in the island systems of Cyprus (115 €/MWh), Malta (92 €/MWh) and Ireland (79 €/MWh), similar to the situation in the household sector. German and Danish industrial consumers enjoyed the lowest commodity costs, which partly helped mitigate the high volume of taxes and levies in both countries. In relative terms, the energy component played the biggest role in the final bill of Bulgarian and Spanish businesses where it accounted for 80% of the total price.

Figure 25 – Relative composition of industrial retail electricity prices in 2019 (ID band)
Source: DG ENER in-house data collection, Eurostat
Several countries grant tax reductions to energy-intensive industries. As energy intensity is not based on consumption volumes alone, but also on the share of the energy bill in the total production cost, the ID band can include enterprises that benefit from such reduced tax rates.
Total retail prices increased in all but seven Member States between 2017 and 2019. The largest falls occurred in Latvia and Greece (both -11%), the largest increase was reported from Romania (+28%).
Composition of taxes, levies, fees and charges
The following section considers only policies that directly impact retail prices. The decrease in the tax component between 2017 and 2019 was driven mainly by falling renewable taxes subcomponent (-3 €/MWh), while slight rises in capacity and environmental taxes partly compensated for this.

Figure 26 – Comparison of taxes and levies between 2017 and 2019 (ID band)
Source: DG ENER in-house data collection
In 2019, more than half of the whole tax component paid by the industry went towards the support of renewable energy. Environmental taxes were the second biggest item with a 31% share. Capacity taxes accounted for 5% of the tax component.
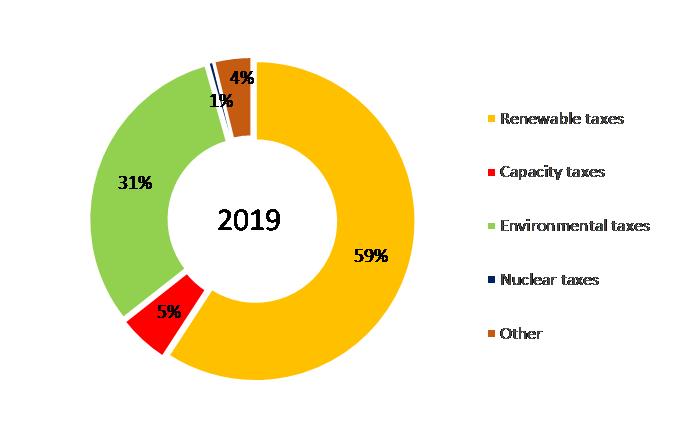
Figure 27 - Composition of taxes and levies in 2019 (ID band)
Source: DG ENER in-house data collection
The following section contains brief comments on the individual subcomponents of the taxes and levies category. The definitions of the subcomponents can be found in the previous chapter on household retail prices.
Value added tax
VAT is recoverable for most industrial consumers in all reporting countries. Therefore, this report analyses industrial prices excluding VAT. Other recoverable taxes are also excluded from the price.
Environmental taxes
Environmental taxes rose by 6% between 2017 and 2019 to 11 €/MWh at EU level. They were collected in some form in all Member States with the exception of Latvia. The rise of the EU27 average was driven mainly by higher taxes in Germany, the Netherlands and Spain, which were partly mitigated by declines in France and Denmark (where the highest tax of more than 100 €/MWh is applied).
Renewable taxes
Taxes financing the support of renewable energy, CHP and energy efficiency measures declined by 11% between 2017 and 2019 to 22 €/MWh at EU level for industrial users. Renewable taxes accounted for 20% of the total retail price in 2019, down from 24% in 2017. Similar to the household category, renewable taxes were not imposed in Bulgaria, Finland, France and Malta. In Finland and Malta, the renewable energy support scheme is not financed from a levy on electricity consumption but from the central state budget. France has been following the same example since 2016. Therefore in these 3 countries the explicit cost of supporting renewable energy is zero for industrial consumers. In Hungary, industrial consumers are subject to a renewable surcharge, while households are exempted. Bulgaria does not impose renewable levies on electricity consumption at all. Renewable taxes have declined in most Member States since 2017. The only significant exception was Belgium, where the renewable surcharge has tripled, and the Netherlands, where it has doubled.
Capacity taxes
Charges related to security of supply or the financing of regulatory authorities were collected in 11 countries in 2019, up from 6 in 2008. The impact of security of supply related charges remained limited, below 2% of the average EU27 price.
Nuclear taxes
Nuclear taxes are collected in Belgium, Italy (which closed its last nuclear power plant in 1990) and Slovakia. Their impact on retail prices at EU level is negligible.
Other charges
The absolute value of the residual subcomponent decreased from 2 €/MWh in 2017 to 1 €/MWh in 2019. Its share in the total retail price amounted to 1% in 2019.
Situation of large enterprises and energy-intensive industries
This section analyses retail prices for the IF band which contains consumption levels between 70 and 150 GWh per annum. Industrial electricity prices in the IF band were unchanged at 76 €/MWh between 2017 and 2019 at EU level, and were 5% lower compared to 2010. Thus, electricity for the largest consumers is today cheaper than it was a decade ago both in nominal and real terms. Since 2017, the energy component rose by 13% to 42 €/MWh, but the effect of rising wholesale prices was fully compensated by falling taxes, which declined by 18% to 23 €/MWh. The network component remained unchanged at 12 €/MWh in the same period.
For large electricity consumers, the influence of the energy component and, by extension, wholesale prices over the final retail price is even more pronounced than in the case of smaller or mid-size companies. Nevertheless, even in this segment, the importance of taxes has grown considerably in the past decade, mostly at the expense of the energy component. The share of taxes in the final bill more than doubled to 36% between 2010 and 2017, but then it fell to 30% in 2019, in line with developments in other consumer bands. This was the first decrease since at least 2007 and mirrors a similar trend in household prices. The share of the energy component declined as the amount of taxes paid by the industry grew. At the beginning of the decade, commodity costs accounted for 70% of the total price. Their share reached 55% in 2019, which was nine percentage points higher than in the ID band.
In absolute terms, the energy component declined by 25% to 42 €/MWh in 2019 compared to 2010. The contraction of the energy component, which apart from wholesale electricity prices contains retailers’ mark-ups, can be partly linked to EU energy policies supporting competition through more interconnection capacities and market coupling. The network component grew by 11% over the past decade to 12 €/MWh and its share in the total price rose from 13% to 15%. The taxes and levies component rose by 65% since 2010 to 23 €/MWh.


Figure 28 - Evolution and composition of the EU27 industrial retail prices (IF band)
Source: DG ENER in-house data collection, Eurostat
Situation in individual Member States
As illustrated by
Figure 29
, Denmark reported the highest retail price in the IF band (177 €/MWh), followed by Cyprus (144 €/MWh). Sweden (50 €/MWh) and Finland (58 €/MWh) stood at the other end of the price spectrum. 11 Member States reported prices lower than the EU27 average in 2019, indicating that larger economies with a greater weight have prices closer to the average level compared to other consumer categories. Overall, industrial retail prices in the IF band were much less spread out in 2019 compared to previous years. Their relative standard deviation, which moved around 40% for most of the past decade, declined by to 33% in 2019, pointing towards rising convergence across Member States. The main driver behind this development has been the convergence in the energy component, which has risen substantially since 2012 thanks to wholesale market integration and more competition between suppliers. Differences in the tax component have also come down over the last years, but still remain three to four times larger (measured by relative standard deviation) than the in the case of network and energy costs. Thus, taxes and levies are the main source of divergence of retail prices for the industry.
By far the highest taxes and levies were paid by large industrial enterprises in Denmark (125 €/MWh). Germany came up distant second (61 €/MWh). The lowest taxes were recorded in Bulgaria (1 €/MWh), Malta (2 €/MWh) and the Netherlands (3 €/MWh).
As for the network costs, Malta (25 €/MWh) and Czechia (23 €/MWh) reported the highest values in this component. The lowest network costs were registered in Spain (5 €/MWh) and Cyprus (6 €/MWh).

Figure 29 - Industrial retail electricity prices in 2019 (IF band)
Source: DG ENER in-house data collection, Eurostat. Data for Greece and Luxembourg are either unavailable or confidential.
The largest energy components were reported in the island systems of Cyprus (106 €/MWh), Ireland (72 €/MWh) and Malta (70 €/MWh), similar to the situation in the household sector. Large German enterprises enjoyed the lowest commodity costs, which partly helped mitigate the high volume of taxes and levies. At 13 €/MWh, the German energy component was three times cheaper than the price of baseload electricity in the local wholesale market. In relative terms, the energy component played the biggest role in the final electricity bill of Bulgarian and Spanish businesses where it accounted for 80-90% of the total price.

Figure 30 – Relative composition of industrial retail electricity prices in 2019 (IF band)
Source: DG ENER in-house data collection, Eurostat. Data for Greece and Luxembourg are either unavailable or confidential.
1.2.3International comparisons
Component level data enables the identification of price drivers. As this data is not available for G20 trading partners, the difference between wholesale and retail prices can serve as a proxy. The difference consists of network charges, taxes, levies as well as of the costs and profit margins of supply companies. Consequently, the difference includes elements from all three components. The non-regulated, supply-related costs account for only a small share of the total difference in most countries.
The difference between wholesale and retail prices, or the impact of the regulated part of the retail price, is larger in the EU27 than in its G20 trading partners. This holds for both electricity and natural gas and both households and industry. Retail prices are below wholesale prices in some trading partner countries, indicating that prices are subsidized and regulated at low levels. Consumers pay less than the actual generation cost of the electricity they use.
Electricity wholesale prices in the EU are often comparable to those in G20 countries. This however does not translate into retail prices as these are on average higher in the EU than in all G20 trading partners. This is a result of relatively high value of taxes and levies which, among other things, provide financing for the promotion of renewable energy, for energy efficiency measures and for other climate-related policies. Higher taxes have brought about higher retail prices but have also propelled the EU to become the leading force in combatting climate change.
Household Electricity Prices
The EU27 average difference between household retail prices and wholesale prices has increased from around 100 €/MWh in 2008 to more than 180 €/MWh in 2019.
The difference in the US is lower, at around 80-90 €/MWh, but it has increased since 2008. The same analysis using the wholesale proxy for China shows negative values, which highlights the fact that household consumers in China are not paying the full cost of their electricity use. Since 2018, the proxy used for China has been increasing, which suggests that subsidies for households are being reduced. The difference in Japan has varied considerably over the observed period, with the Fukushima effect on wholesale prices likely to have played an important role in the 2011 peak. UK’s trend mirrors closely that of the EU27. For the other G20 countries, the difference is also much lower than the EU27 average. In Mexico, Indonesia and Russia, there was only a small difference between the two prices, highlighting also that retail prices are being held low in these countries. In Canada and Turkey, the difference is greater, but still significantly smaller than in the EU27, while Brazil appears to have caught up with the EU27, displaying a greater differential in 2019.


Figure 31 - Difference between household retail electricity prices and electricity wholesale prices 2008-2019, EUR2018/MWh
Source: Trinomics et altri study (2020)
Industrial Electricity Prices
The EU27 average difference between industrial retail prices for the average consumption band and wholesale prices has been relatively volatile lately, moving from 50 to 80 €/MWh within short periods of time due to rapid changes in the wholesale market. The difference in the US was lower than in the EU27, at around 15-40 €/MWh over the period. The difference in Japan is in the same order of magnitude as the EU27 average and US levels, but has varied considerably over the period, with the annual frequency of the data playing a role, and the Fukushima effect on wholesale prices likely to have played an important role in the 2011 peak. The same analysis using the wholesale proxy for China shows virtually no difference, likely due to the proxy being similar to the industrial price. It poses an interesting contrast to household prices, pointing towards energy policy priorities and price interventions in favour of households rather than industry.
For the rest of the G20 countries the difference compared to the EU27 average is typically lower, although the Canadian figures have generally been similar to the EU level.


Figure 32 - Difference between industrial retail electricity prices and electricity wholesale prices, EU27 and other G20 countries, 2008-2019, EUR2018/MWh
Source: Trinomics et altri study (2020)
2Gas prices
2.1Wholesale gas prices
Main findings
¾European wholesale gas prices showed a high degree of volatility in the period of 2008-2020. In 2009, amid the economic crisis, they fell from the 2008 highs, followed by a recovery until 2012. In 2014 crude oil prices started to fall, which also impacted the wholesale gas market, reaching a new trough in 2016. This was followed a recovery again until late 2018, when LNG imports started to ramp up, resulting in a significant price fall in 2019.
¾In 2020, primarily owing to the confinement measures related to the Covid-19 pandemic, resulting in falling gas demand, wholesale gas prices decreased further, and by the end of May 2020 the Dutch TTF hub price fell to historic lows (3.4-3.5 €/MWh). Meanwhile, other energy commodities, such as crude oil, underwent significant price falls in the first four months of 2020. Oil prices were impacted by the demand decrease amid transport restrictions (Covid-19 confinement measures) and by the lack of agreement on production adjustment measures by major oil producers until mid-April 2020.
¾Among the different pricing mechanisms, oil-indexation has been losing ground in Europe but continues to play an important role in certain regions, in particular in the Mediterranean. On the other hand, hub prices gained significant ground in Central Europe and in Scandinavia and the Baltics: wholesale prices in these regions are more and more aligned with Northwest European hub prices, rather than with oil-indexed prices. In Europe on average, the share of hub priced contracts rose to 78% within the total gas consumption in 2019, up from 15% in 2005.
¾Although oil-indexed prices have a diminishing role in the European market, a correlation between European wholesale gas prices and the oil price still exists, reflecting the close relationship between the gas market and the wider energy complex, which also depends on the macro-economic situation. Amid increasing LNG imports in the EU, reaching a historically high 89 bcm in 2019, wholesale gas prices decoupled from oil, which might point to a further weakening link of oil in gas price formation.
¾The importance of LNG is growing on the European gas markets; in 2019 it gave around a quarter of the total gas imports in the EU and its share in the EU gas consumption was 22%. LNG, if it is competitively priced, can be an alternative to pipeline gas imports. The presence of LNG therefore can contribute to the further diminishing role of oil indexation and increasing energy security of supply.
¾Daily wholesale gas prices can show extreme volatility, typically when cold snaps sharply increase the gas demand while supply is constrained by infrastructure unavailability or other factors, such as low nuclear or renewables generation in the electricity sector. Over the past decade there were two price spikes in March (in 2013 and 2018), when low gas storage levels at the end of the winter also contributed to the price spikes. On the other hand, extremely low prices (such as in 2009 and 2020) can occur when demand drops unexpectedly, in the consequences of unforeseeable events.
¾EU natural gas demand shows a strong seasonality as in many EU countries natural gas is the principal fuel for residential heating. There is a clear negative correlation between temperatures and daily gas consumption in the residential sector. There is a weak negative link between temperatures and wholesale gas prices, however, price level is influenced by many other factors, as the most liquid Dutch TTF hub prices is increasingly used as global gas benchmark.
¾In international comparison, European wholesale gas prices are well above those in major gas producing countries (Canada, Russia, US) but in general lower than in other G20 economies, especially those which solely or largely rely on LNG imports (e.g. China, Japan, South Korea). International prices have slightly converged since 2015 which means that the absolute value of the regional differences decreased but, nevertheless, these differences proved persistent. In 2019 the ratio of the lowest and the highest observed wholesale gas price was nearly 7 among G20 countries.
2.1.1Evolution of wholesale gas prices
After the peak in 2008, driven by robust global economic growth and rising demand from emerging markets, particularly China, gas prices in Europe showed a sharp decrease in 2009 during the economic crisis. However, as of 2010 they started to recover and by the end of 2012 they reached the peak levels of 2008, helped by the economic recovery and the Fukushima accident that increased global LNG demand. In March 2013, hub prices exceeded the record levels reached in 2008, also owing to the unusual cold spell across Europe at the end of that month.
In 2013-2016, wholesale gas showed a gradual decline and by 2016, European wholesale gas prices fell to the lowest levels since 2009. Gas prices in this period were impacted by low oil prices (falling from 120 USD/bbl in summer 2014 to less than 30 USD/bbl in February-March 2016) and increasing global LNG supplies, coupled with weak demand put pressure on European gas prices.
Wholesale gas prices started to increase again in the first half of 2016 and by autumn 2018 they rose to the levels seen in 2012, owing to increasing energy commodity prices (oil, coal, etc.) and on the demand side to good economic performance in the EU and in the emerging markets as well. EU hub prices in October 2018 were close to 27-28 €/MWh.
As of the end of 2018 LNG imports, especially from Qatar, US and Russia started to pick up, owing to the narrowing price premium of the Asian markets that made the EU more attractive LNG destination. By the end of 2019, owing to abundant global LNG supply, mild winter weather and high gas storages, EU gas hub prices fell to 10-12 €/MWh.
In 2020 the downward price trajectory continued. In January and February 2020 mild winter conditions, and high renewables share in power generation resulted in decreasing demand for gas, in parallel with high LNG imports and storage withdrawals in the EU, pushing the wholesale prices further down. As of March confinement measures related to the outbreak of the Covid-19 pandemic have been introduced, resulting in restriction of free movement of persons and decreasing industrial activity, demand for gas dropped further, resulting in falling gas wholesale prices. By the end of May 2020 spot prices on the Dutch TTF hub fell as low as 3.4-3.5 €/MWh, the lowest since the beginning of the trade on this hub, being around one fifth of the typical range (18-20 €/MWh) throughout several years.
In parallel, the crude oil market underwent a supply and demand side shock, as major oil producers could not find an agreement on production adjustment (OPEC+) until April 2020, which, combined with dropping demand for oil products amid the confinement measures leading to falling transport, resulted in a huge oversupply and steep price falls on the oil market. In April 2020 the Brent crude physical contracts fell as low as 10-15 USD/bbl, which also impacted the wholesale gas market and other energy commodities.
The Commission follows the development of a number of wholesale gas prices across the EU, including prices at trading hubs, estimated border prices calculated based on customs data and other prices reported by commercial data providers or other sources. Wholesale prices move in a rather broad band: in 2008-2014, the average difference between the highest and lowest price was close to 20 €/MWh. From 2015 to early 2019, prices have perceivably converged, however, as of 2019 hub prices decreased but oil indexed contracts remained stable, the difference between the lowest and highest prices rose again. In case of extreme events (cold spells and/or supply disruptions) affecting specific regions, (e.g. in the first quarter of 2018), the price band can become much wider.
Hub prices, especially those in the liquid Northwest European markets have been close to the lower boundary of the price range during most of the last decade, as demonstrated in
Figure 33
by the price at the Dutch (TTF) and the UK (NBP) hubs. Oil-indexed prices, on the other hand, have been typically closer to the upper boundary of the price band for most of the period, as indicated by the development of the Platts North West Europe Gas Contract Indicator (GCI), a theoretical index showing what a gas price linked 100% to oil would be.
It is important to note that some long term contracts, for example Russian imports in many countries have gradually moved away from oil indexation and adopted hub based pricing, which resulted in more competitive prices for gas customers in these countries, mainly in Central and Eastern Europe. This could also be observed for the German average border price.
Regional price differences are largely explained by the different pricing mechanisms and the different levels of competition. In general, markets with higher levels of competition show a lower price level than markets with only one supply source. Lower oil prices, the decreasing role of oil-indexation and, in some cases, alternative supply sources (e.g. increasing LNG imports as of 2019) contributed to converging wholesale prices in Europe.

Figure 33 - Selected wholesale gas prices in Europe
Source: Platts, BAFA, Eurostat Comext
The difference between GCI and the price at the Dutch hub (TTF) averaged around 10 EUR/MWh in 2011-2014. In the wake of the oil price fall in 2014-2015, oil-indexed gas prices have significantly decreased, facilitating the convergence of European wholesale gas prices. In certain periods, oil-indexed prices were actually lower than the price at the most liquid gas hubs in Northwest Europe. This was the case during most of the 2016-2017 winter and in autumn 2018 as well. However, with the continuous decrease in the European hub prices and constantly high oil-indexed contracts, the GCI price premium started to increase as of the end of 2018 and by May-June 2020 it rose above 20 €/MWh, which was the highest since the creation of the GCI index in 2009. This perfectly underlines the uncompetitive nature of oil-indexed contracts vis-à-vis hub based gas pricing during the last two years, prompting gas exporter countries to adopt more hub based pricing in their gas price formulae.

Figure 34 - The difference between the Platts North West Europe Gas Contract Indicator (GCI) and the Dutch hub price (TTF)
Source: Platts
Figure 35
and
Figure 36
provide a look at the evolution of gas price formation mechanisms over time and/or across regions. In Europe the share of gas-on-gas competition (hub-based pricing) increased from 15% to 78% between 2005 and 2019. However, there are big regional differences behind the European average.
In North-Western Europe (Belgium, Denmark, France, Germany, Ireland, Luxembourg, Netherlands, UK) gas-on-gas competition is now almost exclusive, its share was 95% in the total gas contracts (measured by consumption) in 2019, up from 27% in 2005. In other parts of Europe gas-on-gas competition practically did not exist in 2005, whereas in 2019 its share was 80% in Central Europe (Austria, Czechia, Hungary, Poland, Slovakia, Switzerland), 64% in Scandinavia and the Baltics (Estonia, Finland, Latvia, Lithuania, Norway, Sweden) and 60% in Southeast Europe (Bosnia, Bulgaria, Croatia, North Macedonia, Romania, Serbia, Slovenia). In the Mediterranean region (Greece, Italy, Portugal, Spain, Turkey) gas-on-gas competition had the lowest share, around 47% in 2019.
In parallel with the increasing share of gas-on-gas competition, the share of oil-price escalation (oil-indexed contracts) decreased, as well as other forms of price formation, such as bilateral monopolies or regulated contracts (such as regulation of cost of service, political and social regulation, etc.) between 2005 and 2019.
Gas-on-gas competition had a share of 49% in the world on average in 2019, and oil price escalation represented 19%, whereas bilateral monopolies and diverse forms of price regulation had the remaining share (32%). With its share of gas-to-gas competition of 78%, Europe is the second region in the world behind North America regarding the penetration of hub-based pricing. In other regions, such as Asia, oil price escalation is still predominant, with its share of 63-65% in 2019. High share of oil-price indexation impacts the gas price differential between Europe and Asia, which can be a crucial factor in LNG supply in Europe.
In Russia and other countries of the former Soviet-Union, Africa, Latin-America and the Middle East price regulation was still the most important contract form in 2019.

Figure 35 - Price formation in Europe
Source: IGU Wholesale Gas Price Survey, 2020 Edition
Northwest Europe: Belgium, Denmark, France, Germany, Ireland, Netherlands, UK
Central Europe: Austria, Czechia, Hungary, Poland, Slovakia, Switzerland
Mediterranean: Greece, Italy, Portugal, Spain, Turkey
Southeast Europe: Bosnia, Bulgaria, Croatia, FYROM, Romania, Serbia, Slovenia
Scandinavia & Baltics: Estonia, Finland, Latvia, Lithuania, Norway, Sweden
Other includes bilateral monopoly, netback from final product, regulated cost of service, regulated social and political, regulated below cost, no price available

Figure 36 – The role of different price formation methods in different regions of the world
Source: IGU Wholesale Gas Price Survey, 2020 Edition Other includes bilateral monopoly, netback from final product, regulated cost of service, regulated social and political, regulated below cost, no price available
The monthly average prices depicted in
Figure 33
often hide a high degree of daily volatility. For short periods, daily prices can reach exceptionally high levels, typically when cold snaps sharply increase demand while supply is limited by infrastructure constraints or other factors.
Figure 37
shows that a few such occasions occurred over the last twelve years.

Figure 37 - Daily day-ahead prices at selected gas hubs from 2008 to mid-2018
Source: Platts
Cold spells occurred in February 2012, in March 2013 and January 2017, resulting in rapidly increasing demand for heating needs. This was in several occasions, combined with lower availability of other generation sources in the electricity mixes (e.g.: nuclear or renewables). In March 2013 and March 2018 the cold spell arrived at the end of the winter, implying low gas storage levels, which also contributed, in the form of security of supply worries, to high market prices. In other cases infrastructure availability problems also contributed to security of supply worries, such as on 12 December 2017, when an explosion at the Baumgarten facility in Austria cut Russian supplies to the country, also impacting gas flows to Italy.
These occasions however resulted only in temporary price spikes, and rising prices provided the right signal to market participants and gas supplies were not interrupted at EU wide or larger regional levels, albeit the extent of the price rise seems to point toward the inflexibility of demand.
On the other hand, extreme low prices can also occur, when demand for gas falls unexpectedly (this was the case in the first half of 2009 and in the first half of 2020, when gas demand fell amid economic crisis). In these period spot prices undergo abrupt falls, however, looking at quarter-ahead or year-ahead contracts, it is usual the forward prices fall less steeply, showing that the market prices in price recovery and spot contracts may overreact the market situation.
2.1.2Factors impacting the evolution of wholesale gas prices
The development of wholesale gas prices is influenced by a number of factors, such as demand in power generation and industry, heating related needs, level of gas storages, pipeline and LNG imports, etc. In this section we look into the impact of the oil price and the weather, and finally the latest developments of the European LNG imports are presented.
There is an existing correlation between oil and gas prices, which is the most obvious in the periods of large volatility of energy commodity markets (e.g.: steep price falls or hikes). However, as it was already mentioned, the gas market is now less influenced by the oil price, owing to the increasing role of hub pricing and LNG imports.
By definition, there is a strong correlation for oil-indexed gas prices, as shown by
Figure 38
which depicts the movement of the Brent oil price and the Platts North West Europe Gas Contract Indicator (GCI), a theoretical index showing what a gas price linked 100% to oil would be. Typically there is a 6-9 month time lag in the pricing formulas used which means that oil-indexed gas prices react to changes in the oil price with a delay. For example, Brent started to recover as of early 2016, and reached a peak in October 2018, but this was reflected in the development of oil-indexed prices only from the second half of 2016, and it reached its peak in spring 2019. The steep fall in Brent crude oil prices in March-April 2020 is not yet reflected in the GCI index (until June 2020), it might be perceivable as of autumn 2020.

Figure 38 - The monthly average price of oil (Brent) and oil-indexed gas contracts (Platts GCI)
Source: Platts
The correlation between oil and gas prices also holds for European gas hub prices, as shown in
Figure 39
through the example of the Dutch TTF, Europe's most liquid hub. While oil-indexed prices have a diminishing role in the European market (see section 2.1.1), hub prices continue to be impacted by the oil price, reflecting the close relationship between the gas market and the wider energy complex, also reflecting the macro-economic situation. Nevertheless, in 2019 oil prices showed a relative stability, whereas gas hub prices fell measurably, largely owing to increasing LNG imports in the EU, which are mostly not oil-priced contracts. Therefore, we can expect that the direct link between oil and gas prices will be more perceivable for short term market movements and this will be the impact of the market sentiment on the energy commodities and not directly that of oil.
In last decade, this correlation was apparent during most of the time, however, there were shorter periods when the price trend of the two communities diverged (for example in the second half of 2014 when gas hub prices increased amid falling oil prices or in 2019 when gas prices fell amid stable oil prices).

Figure 39 - Daily spot prices of oil (Brent) and gas (at the Dutch TTF hub)
Source: Platts
Figure 40
depicts daily changes of Brent and TTF. Dots represent individual days, showing the change of oil price (on the horizontal axis) and the gas price (on the vertical axis) compared to the previous day, expressed in percentage. While oil and gas prices do not necessarily change in the same direction every day, there is a weak positive correlation, particularly the increasing oil prices often coincide with increasing gas prices.

Figure 40 - Daily change of spot prices of oil (Brent) and gas (at the Dutch TTF hub), between 2008 and 2020
Source: Platts
Measured in energy content, oil has traditionally been more expensive than natural gas, owing to higher energy transformation costs (and transformation losses) and lower combustion efficiency in power generation. This was the case since 2008, with some short period of exceptions when sudden falls in oil price resulted in comparable or lower costs in energy content compared to natural gas. Between the beginning of 2008 and mid-2020, the price of Brent (measured in €/MWh) was on average 95% higher than the price of gas at the TTF hub. This ratio was following a decreasing trend between 2010 and 2018 (with the exception of the oil price fall in 2014), moving from 2 to 1.5. However, as of 2019 the gas price fall significantly, the ratio rose to 3.5 in September 2019. After volatile months, in June 2020 the ratio rose to 4.2, the highest in the last twelve years as oil prices recovered from the April lows amid permanently low gas prices. Otherwise saying, oil became very expensive vis-à-vis gas, looking at purely its energy content.

Figure 41 - The monthly average price of oil (Brent) and gas (at the Dutch TTF hub), measured in €/MWh
Source: Platts
Note: a conversion rate of 1.7 MWh/barrel was used for Brent
According to 2018 data, the residential sector covered 32% of the final energy consumption of gas in the EU; whereas natural gas had a share of 22% in the EU gross inland gas consumption.
Gas demand in the EU shows a strong seasonality, reflecting the fact that a large proportion of gas is used for space heating. Depending on temperatures, the level of gas consumption can be rather volatile during the winter months which can obviously have an impact on the price of gas.
Figure 42
shows the relation between residential gas consumption and the daily average temperature in 2019 in some EU countries. Not surprisingly, lower average temperatures result in higher gas consumption in the household sector, and the relation between temperatures and gas consumption, with the exception of low consumption ranges (gas consumption other than heating) can be well approximated by a linear function.
In Germany the decrease of the daily average temperatures by 1ºC results in an increase of 9.9 million cubic meter (mcm) in the residential gas consumption. The same value in France is 8.3 mcm, in Italy it amounts to 9.1 mcm, while in the Netherlands it is 4.7 mcm. In the Netherlands the population is less compared to the three other countries, however, more than 70% of the total final energy consumption in the household sector is linked to natural gas, whereas in the other three countries this ratio is lower, amounting to 27-50%.


Figure 42 – Daily residential natural gas consumption and daily average temperatures in some EU countries
Source: Platts Eclipse Xplore and European Commission. Residential gas consumption is estimated by the consumption of Local Distributor Companies, which may also include consumption other than the residential sector
European gas prices over the last two years are increasingly impacted by LNG imports in the EU. Additional gas volumes result in competition with traditional pipeline gas contracts and putting under pressure the still existing oil-priced contracts. This has contributed to lower gas wholesale prices in the EU recently.
As the next chart shows, over the recent years liquefied natural gas (LNG) showed an increasing volume and role in gas consumption in the EU. In the early 2000s LNG imports in the EU showed a measurable increase in consequence of LNG regasification terminal investments in many European countries (e.g.: Spain, Italy, France, UK, Netherlands, Belgium, etc.). However, in 2011, as the aftermath of Fukushima nuclear incident in Japan, resulting in increasing demand for gas fired generation (as nuclear plants were taken offline) in the country, LNG prices in East Asia increased significantly, developing a measurable price premium to Europe and ensuring higher profitability for LNG producers to sell the gas in Asia, rather in Europe. Consequently, between 2010 and 2015 LNG imports in the EU practically halved. Since 2016 the US appeared as new player among LNG exporting countries, and the continuously increasing LNG supply on the global market (the key suppliers are: Qatar, Australia, US and more recently, Russia) outpaced the increase in LNG demand, which resulted in decreasing LNG prices and re-convergence of different regional (US, European, Asian, South-American, etc.) price benchmarks.
Decreasing Asian LNG price premium to Europe resulted in increasing imports in the EU, rising from 35 billion cubic meter (bcm) in 2015 to 89 bcm in 2019, which latter represented around 25% of total gas imports in the EU and around 22% of the total gas consumption.
The EU and the wider European market became to play a balancing role on the global LNG market. In 2019 the total global LNG trade reached an estimated 483 bcm, however, the five most important LNG importer countries in Asia (Japan, China, Korea, Taiwan and India) imported 292 bcm in this year, signalling that Asia is the demand driver on the global LNG market. However, as LNG supply showed a rapid increase owing to LNG liquefaction terminal investments in Australia, Qatar, US and Russia over the last few years, LNG that could not find a place in Asia were directed to other markets, such as Europe, which could also profit from its geographical proximity (implying lower shipment costs) to the main producers (US, Middle East and Russia).
In 2019 Europe (EU plus the UK) had an annual LNG regasification capacity of 213 bcm, signalling the still untapped opportunity to import more LNG in the future, which, if competitively priced, can be a real alternative to pipeline gas imports (from Russia, Norway and North Africa).

Figure 43 – LNG imports and its share in the EU-27 total gas imports and consumption
Source: Refinitiv, Eurostat
Figure 44
shows the main import sources of LNG in the EU. Since 2013, the beginning of available data series in such details, Qatar was the most important LNG exporter to the EU. In 2019 Qatar supplied 21 bcm LNG to the EU, while imports of Russian origin amounted to 18 bcm, followed by the US (14 bcm). However, in the first half of 2020 the US became the most important LNG import source, ensuring 12 bcm of imports, followed by Russia (10 bcm) and Qatar (9 bcm).
The rapid increase in LNG imports (+68% in 2019 compared to 2018) continued in the first quarter of 2020, showing an increase of 26% year-on-year in the EU. However, as of Q2 2020 confinement measures related to the Covid-19 pandemic entered in force, reducing economic activity and movement of persons, a number of LNG shipments to Europe was cancelled, and in year-on-year comparison LNG imports remained practically unchanged (-0.3%), whereas in June 2020 it fell by 18% compared to June 2019. Recovery in LNG imports might be hampered by sluggish demand owing to the economic recession and high gas storage levels across the EU, resulting in less seasonal demand during the summer storage filling season.
The two biggest LNG importer countries in the EU were France (close to 26% of the total EU imports) and Spain (with a share of little bit less than 25%) in 2019. LNG imports were also significant in the Netherlands and Belgium, having shares respectively of 10% and 8% of the total 89 bcm EU LNG imports. Measurable LNG imports could be observed in Portugal (7%), Poland (4%), Greece (3%) and Lithuania (2%), as
Figure 45
shows. In Spain the utilisation rate of LNG regasification terminals is relatively low (was around 40% in Q1 2020), implying that if necessary interconnection capacities are built with the rest of the EU, more import opportunities are expected. In the Netherlands and Belgium the importance of natural gas (including LNG) imports is increasing as domestic gas production in the Netherlands is rapidly dwindling. In Poland and Lithuania LNG is seen as an important alternative to pipeline gas of Russian origin and thus an assurance of energy independence and security of supply.

Figure 44 – Main extra-EU import sources of LNG
Source: Refinitiv

Figure 45 – Main EU LNG importer countries in 2019
Source: Refinitiv
2.1.3International comparison
Comparing European gas wholesale prices with those in the EU's major trading partners provides an insight into how energy costs can impact the international competitiveness of energy intensive industries being exposed to global trade. Although energy prices are only one element of energy costs of industries, besides consumption and efficiency data they make an important part of such analysis.
The 2011 Fukushima accident in Japan resulted in an increasing demand for gas in the country’s electricity generation, as nuclear power plants had to be taken off the grid. In the period of 2011 to 2014 Japanese gas prices were therefore significantly higher compared to the EU and US peers. At the same time the beginning of the US shale gas revolution resulted in abundant domestic gas supply and low prices in the US. Wholesale gas prices in the EU were influenced by high oil prices and dwindling LNG imports in this period, resulting in a divergence between the wholesale prices of the three regions, as
Figure 46
 shows.
As of the end of 2014 Japanese wholesale prices started to decrease, as gas demand went down (returning some nuclear capacities to the electricity grid) and global LNG supply increased. Between 2015 and 2019 the Japanese price premium to Europe shrunk compared to the 2011-14 period, however, it showed a strong seasonality; practically disappearing during the summer months, and widening again during winter months, driven by the strong seasonal demand in Asia. However, as of the winter of 2018/2019 the seasonal gap did not reappear and over the last two years Asian and European gas hub prices remained well aligned, providing good opportunities for LNG shipments to the EU .
Meanwhile, the US Henry hub price remained stable over the last decade, showing a slightly decreasing trend between 2010 and 2019. During most of the decade there were alternation of converging and diverging periods between the TTF and the Henry Hub prices in the EU and the US. However, as of the end of 2018 US LNG exports to the EU ramped up and the EU also started to absorb larger quantity of LNG from other sources as well (like Qatar and Russia), the TTF started to converge to the Henry Hub.
In the first half of 2020, amid generally falling energy commodity prices, gas prices in the three regions also fell significantly (the TTF fell by two thirds by the end of May since the beginning of 2020), and the differentials between the three benchmark practically disappeared by May-June 2020, a phenomenon not seen since 2009-2010.

Figure 46 - Comparison of European, US and Japanese wholesale gas prices
Source: Platts, Thomson Reuters

Figure 47 - The ratio of European, US and Japanese wholesale gas prices
Source: Platts, Thomson Reuters
In the first half of 2020 the average price ratio of the US Henry Hub and the TTF hub was 1.35, being the lowest since 2008-2009, as Table 2 shows. In absolute numbers the EU-US difference was less than 0.7USD/mmBTU, which was not seen in the last twelve years. In the Japan-EU relation the price ratio was stable between 2015 and the first half of 2020, whereas in absolute numbers the difference fell below 0.5USD/mmBTU.
Table 2 - The ratio and the difference of European, US and Japanese wholesale gas prices

Source: Platts, Refintiv – The 2020H1 values refer to the period of the first half 2020
The study prepared by Trinomics
provides a more comprehensive international comparison of gas wholesale prices, covering most G20 economies, with the findings shown in
Figure 48
and
Figure 49
. Prices are expressed in constant (2019) euros. In case of the EU, a weighted average of national wholesale prices was calculated and depicted.
The analysis reveals a very large dispersion of prices in 2011-2014, followed by a measurable convergence from 2015. Part of the gas wholesale prices is indexed to oil prices and hence the price convergence was largely driven by the lowering of the crude oil price in 2014-2016.
Major gas producing countries, including Canada, Russia and the US have the lowest gas wholesale prices in the G20. This was also the case in Australia until 2016 but then domestic supply shortages triggered a significant price rise.
Apart from the producing countries, wholesale prices in the G20 countries tend to be higher than the EU average, often showing a high degree of volatility.
Chinese wholesale prices follow a similar trend to the Japanese price but in 2011-2014, after the Fukushima accident, the absolute level of the price remained somewhat lower, probably because – unlike Japan– China is not fully reliant on LNG (the country also has indigenous production and pipeline imports from a couple of sources). In addition, Chinese prices exhibit less seasonality. Prices were the highest in 2019 in Indonesia, and in South Korea they were also in the top among G20 countries in the last few years, similarly to Mexico and Argentina. In 2019 the ratio of the highest price (Indonesia) and the lowest (Russia) was nearly 7 in 2019.

Figure 48 - Gas wholesale prices in the EU (weighted average), China, Japan and the US
Source: Platts, Thomson Reuters, Knoema (World Gas Intelligence; World Bank), World Bank Commodities Price Data (The Pink Sheet).

Figure 49 - Gas wholesale prices in the EU (weighted average) and selected markets
Source: Platts, Refinitiv, Knoema (World Gas Intelligence; World Bank), World Bank Commodities Price Data (The Pink Sheet).
2.2Retail gas prices
Main findings
¾Natural gas retail prices remained largely determined by the wholesale gas prices and followed its evolution with a slight time lag. Consequently, the energy component - containing wholesale prices- retained its dominant position of the three components, its share ranged from 45% in the case of households to 67-78% in the case of industrial customers within the total retail price.
¾Household retail gas prices were on average 63 €/MWh in 2019 in the EU, whereas medium and large gas customers had to respectively pay 32 €/MWh and 22 €/MWh.
¾Retail gas prices for household customers increased by 2.1% annually between 2010 and 2019, whereas for medium level industrial customers prices rose slightly, by 0.1% and for large industrials prices decreased by 1.3%. The inflation in the EU, measured by the Harmonised Index of Consumer prices was 1.4% over the same period.
¾The energy component of household prices increased by 0.8% between 2010 and 2019 annually, whereas in the case of industrial customers it went down by 1.7-2.3% in each year.
¾Network charges increased for all the three consumer types: for households network charges went up by 2.6% annually, whereas for medium and large industrial customers they rose respectively by 3.2% and 1.9% between 2010 and 2019.
¾The tax component for both households and industrial customers rose measurably, by 3.6% annually for households, while for medium and large industrial customers respectively by 7.8% and 4.6% between 2010 and 2019.
¾The impact of taxation on natural gas prices remained limited. Taxes made up 32% of household bills and only 13-16% of the bills for medium and large industrial customers.
¾In the case of households the share of VAT and environmental taxes are the highest within the total taxation elements, whereas for industrials the main item is environmental taxes, often not related to energy and climate policy goals. Contrarily to electricity, renewable taxes have much lower importance in the taxation of gas.
¾In 2019 the ratio of the most expensive and the cheapest gas price was 3.5 for household customers, whereas for medium and large industrial customers it respectively amounted to 2.6 and 2.8. For industrial customers, a slight price convergence could be observed across the EU over the last few years, whereas for households price differentials remained.
¾Looking at the international comparison of retail gas prices, industrial prices show good correlation of the wholesale prices, whereas in the case of household customers retail prices seem to be low in some countries compared to what the wholesale contracts would suggest, implying the existence of subsidising of households.
Table 3 - Key figures on the evolution and drivers of retail gas prices between 2010 and 2019
|
Consumer type
|
Household (D2)
|
Industrial (I3)
|
Large Industrial (I5)
|
|
Component
|
Annual growth
|
Share 2019
|
∆ Share
|
Annual growth
|
Share 2019
|
∆ Share
|
Annual growth
|
Share 2019
|
∆ Share
|
|
Energy
|
0.8%
|
45%
|
- 5 p.p.
|
-1.7%
|
67%
|
- 12 p.p.
|
- 2.3%
|
78%
|
- 8 p.p.
|
|
Network
|
+ 2.6 %
|
23%
|
+ 1 p.p.
|
+ 3.2%
|
17%
|
+ 4 p.p.
|
+ 1.9%
|
9%
|
+2 p.p.
|
|
Taxes
|
+ 3.6 %
|
32%
|
+ 4 p.p.
|
+ 7.8%
|
16%
|
+ 8 p.p.
|
+ 4.6%
|
13%
|
+6 p.p.
|
|
Total
|
+ 2.1 %
|
|
|
+ 0.1%
|
|
|
- 1.3%
|
|
|
Source: DG ENER in-house data collection and data from Eurostat
Scope of the chapter
Following the Regulation (EU) 2016/1952 the report analyses prices of natural gas sold to consumers who purchase gas for their own use. Therefore prices paid by consumers who purchase gas for electricity generation in power plants or for non-energy purposes (e.g. for use in the chemicals industry) are excluded.
Box - The role of electricity and natural gas in our energy consumption
Natural gas accounted for 32% of the final energy consumption of households in 2018 in the EU on average. The share of natural gas in our final energy consumption has practically remained stable since 2008. The use of natural gas largely differs across EU countries: while in Cyprus and Malta natural gas is not used in the residential sector, and in Sweden and Finland its share was only 0.4% in the total final household energy consumption, in the Netherlands it represented more than 70%, and in Italy and Slovakia more than 50% of the energy consumption in households.
Household gas prices are available for 24 EU Member States in the database of the Eurostat. Natural gas is not used in Malta and Cyprus and gas prices for the household customers is not available in Finland. Regulation (EU) 2016/1952 lays down that reporting countries, where natural gas accounts only for an insignificant share of final energy consumption, are exempted from the obligation of providing price data. According to this Finland, where the share of household consumption of gas in final energy consumption is below 1.5%, is not reporting such data.
The following section analyses gas prices paid by household consumers whose annual consumption falls in the range of 20 to 200 GJ (5,56 to 55,56 MWh). This consumption band is defined by Eurostat as D2. It is the most representative consumption band in most of the EU countries.
Evolution Household Gas Prices
Household retail gas prices grew at 2.1% annual rate from 2010 to 2019. In absolute terms the EU average price grew from 56 €/MWh to 67 €/MWh. This growth is faster than inflation, which averaged at 1.4% annually during the same period. Prices steadily grew from 2010 to 2014, and until 2017 they decreased slightly, from the peak at 70 €/MWh to 63 €/MWh in 2017. And by 2019 they rose again, to 67 €/MWh. In 2019 Hungary reported the lowest (34 €/MWh) and Sweden the highest (116 €/MWh) price. The ratio of the highest to lowest price was 3.4 in 2019.
Composition of Household Gas Prices
The composition of gas prices changed over time, albeit less significantly than in the case of electricity. In 2019 the energy component, which mainly consists of the wholesale price, still made up almost half of the final price even after its share decreased by 5 percentage points from 50% to 45% between 2010 and 2019.
In absolute terms, the energy component increased at an annual rate of 0.8% and reached 30 €/MWh in 2019.
The share of the network component increased slightly from 22% to 23% of the total price. In absolute terms the network component grew at the annual rate of 2.6% and reached 16 €/MWh by 2019.
The share of the taxes component grew by 4 percentage points and reached 32% in 2019. In absolute terms, taxes grew at the annual rate of 3.6% and reached almost 22 €/MWh by 2019.
The impact of taxes was smaller on household gas prices than on their electricity counterparts as the energy component, remained the dominant component. However, the share of taxes increased, implying that taxing of gas consumption might also be subject to policies aiming increasing general budget revenues or, to a lesser extent, to contributing to energy and climate objectives.


Figure 50 - Composition of the EU household gas price (DC)
Source: DG ENER in-house data collection
Drivers of Household Gas Prices
The EU natural gas price for household consumers peaked in 2014 decreased until 2017, which trend slightly reversed in 2019. The trend results from decline of the energy component, continued smaller increases in the network component and a volatile evolution of taxes. In 2019 all the three components increased, the taxation by the most.

Figure 51 - Household gas prices in 2019
Source: DG ENER in-house data collection
In 2019 the two highest gas prices for household customers could be found in Sweden (116 €/MWh) and in the Netherlands (94 €/MWh). Sweden's high gas prices are highly influenced by a carbon tax, which aims to curb greenhouse gas emissions. In the Netherlands relatively high prices stem also from taxation, having the second highest share (reaching 55% of the total price and amounting to 51 €/MWh in 2019). This tax policy aims at reducing demand for natural gas, as domestic sources in the Netherlands dwindling rapidly and the biggest Groningen field will be phased out by 2022. The extraction of these resources causes seismic activity which in turn might cause significant damage to local businesses and homes.
In Denmark the share of the energy component was the lowest (barely 26% in 2019), whereas the taxation share was the highest (58%, in absolute terms 41 €/MWh). Similarly to electricity, Denmark imposes high taxes on natural gas consumption for households, although the energy component of the gas prices was the third lowest in 2019 in the EU, owing to the still existing domestic gas production.
The highest network components for household natural gas prices were reported in Portugal in 2019. In Portugal high investment costs in a relatively new gas grid resulted in higher access tariffs.
In 2019 the ratio of the most expensive and the cheapest retail gas price paid by household customers was 3.5, being stable over the last few years, implying that there is no real converging trend of retail gas prices across the EU.

Figure 52 - Composition of household gas prices in 2019
Source: DG ENER in-house data collection
Composition of taxes, levies, fees and charges
In the case of natural gas prices taxes made up 32% of the total price for household customers. Generally we can say that the number and composition of taxes imposed on household gas prices differ from the ones on electricity taxation, as the variety of taxes on gas prices is much more limited.
Beyond the VAT applicable for household customers (which makes about the half of total payable taxes in the gas prices in 2019), taxation of household gas prices is dominated by environmental taxes, in 2019 making up 42% of the total applicable taxes. Renewable energy support costs, have a very limited impact on household gas prices, as they account for only 4 percent of the total taxes. Beyond this the share of other taxes (including capacity taxes) was around 4.2%. Bearing in mind that the share of taxes in final retail household gas prices were 32% in 2019, we can say that the share of VAT, environmental taxes, renewable taxes and other taxes within the final retail prices were respectively 16%, 14% and 1% for both renewables and others. Between 2017 and 2019 taxes in household gas prices rose by 11% on EU average, driven by the increase in environmental taxes and renewable taxes.

Figure 53 – Change in the composition of EU taxes on household gas prices in between 2017 and 2019 and the composition in 2019
Source: DG ENER in-house data collection
2.2.1Industrial Natural Gas Prices
The following chapter compares gas prices paid by industrial consumers with medium versus large annual consumption. Medium industrial consumption is defined as band I3 by Eurostat, covering annual consumption volumes between 10 000 and 100 000 GJ (2,778 MWh and 27,778 MWh). Large consumption is defined as band I5 covering annual consumption between 1 million and 4 million GJ (277,778 to 1,111,111 MWh). Median industrial (I3) prices were available for 25 EU Member States (with the exception of Cyprus and Malta). Large industrial prices (I5) were reported by 19 EU Member States (on the top of Cyprus and Malta, no data were available for Greece, Croatia, Latvia, Lithuania, Slovenia and Finland), primarily owing to data confidentiality reasons).
Evolution Industrial Gas Prices
Retail gas prices reached the peak in 2012 for both I3 and I5 consumer groups on EU average during the 2010-2019 period. In the case of consumers belonging to the I3 band prices decreased until 2017, then prices slightly turned up in 2019. In the case of I5 band, prices decreased from their 2012 peak until 2016, then in 2017 and 2019 they remained practically stable (slightly rising in 2017 and then falling back in 2019) on EU average.
Looking at the whole of the last decade, industrial prices with median consumption (I3) showed a slight annual increase (+0.1%), whereas prices for large industrial customers (I5) underwent a significant annual decrease of 2.9%. Inflation during the same period averaged at 1.4%, implying that contrarily to household customers, industrials faced gas price changes lower than the inflation. In absolute terms the I3 price slightly rose from 32.1 to 32.4 €/MWh by 2019. The I5 price decreased from 25.1 to 22.3 €/MWh.
In 2019 Belgium reported the smallest I3 price (23€/MWh) and Finland the highest (57 €/MWh). The ratio of the highest and the lowest price across the EU was 2.5 in 2019. The lowest price for I5 consumption band was also reported by Belgium (18 €/MWh), whereas the highest by Denmark (48 €/MWh), implying a highest-lowest price ratio of 2.7 in 2019.
Composition of Industrial Gas Prices
Over time the composition of industrial gas prices also changed, albeit to a different extent for the two consumer types. In 2010, the first year of our observation period, the energy component accounted for 79% of medium (I3) and 86% of large industrial (I5) prices. Energy costs, complemented by the commercial costs of suppliers, made up most of the final consumer price. The impact of network costs and taxes was limited. The share of the energy component decreased to 67% for medium and to 78% for large industrial consumers by 2019.
In the case of I3 prices, the diminishing share of the energy component was taken up on one hand by network charges, increasing from 13% to 17% (by 4 percentage points) and on the other hand by the share of taxes, growing from 8% to 16% (by 8 percentage points) In absolute terms, taxes also increased at a higher speed, by 2.5 €/MWh, reaching 5.1 €/MWh by 2019. Network costs rose by 1.4 €/MWh and reached 5.6 €/MWh in 2019.
The composition of I5 prices also changed significantly, as the share of the energy component decreased from 86% to 78% (8 percentage points) between 2010 and 2019. In absolute terms, energy component decreased by 4 €/MWh, falling to 17.5 €/MWh in 2019. The decrease of 8 percentage points in the share of the energy component was absorbed by the increase of the share of taxes (from 7% to 13%, or by 6 percentage points and by 0.9 €/MWh in absolute terms), and by the share of network costs, rising from 7% to 9% (2 percentage points, 0.3 €/MWh).


Figure 54 - Composition of EU prices for small (I3) industrial gas consumers


Figure 55 - Composition of EU prices for large (I5) industrial gas consumers
Source: DG ENER in-house data collection and Eurostat data
Drivers of Industrial Gas Prices
Industrial gas prices remained dominated by the energy component, which mainly consists of the commodity price. Consequently, consumer prices followed the developments on wholesale gas markets, albeit with a slight time lag. From 2010 to 2012 gas wholesale prices gradually recovered. As a result, I3 and I5 consumer prices grew by 18% and 25% respectively. Between 2012 and 2016/2017, both prices have been on a downward trajectory.
Decreases were mainly driven by the decreasing energy components. Between 2017 and 2019, the energy component slightly increased for the I3 band and owing mainly to the network costs and taxes, increasing by 10-20%, resulted in the increase of the total retail price for I3. For I5 both the final price and the energy costs decreased, albeit increasing network costs and taxes between 2017 and 2019.
In 2019 the ratio of the most expensive and the cheapest retail gas for medium level (I3) customers was 2.6, whereas for larger consumers (I5) it amounted to 2.8. For both consumer groups, a slight price convergence could be observed over the last few years across the EU.

Figure 56 - Median (I3) and large (I5) industrial gas prices in 2019

Figure 57 - Composition of median (I3) and large (I5) industrial gas prices in 2019
Composition of taxes, levies, fees and charges
Gas prices are generally less impacted by policy support costs and fiscal instruments compared to electricity prices. Also, industrial consumers benefit from exemptions and reduced tax rates in most countries. As a result, in 2019 taxes accounted for only 16% and 13% of the total price for medium (I3) and large (I5) consumers respectively. In comparison, taxes made up 32% of the household gas prices.
Taxes imposed on industrial gas prices consist mostly of excise duty and other non- earmarked taxes that do not support any specific policies (shown as environmental taxes on our graphs). These represented in 2019 4.3 €/MWh out of the total 5.1 €/MWh for band I3, representing 84% of the total tax and 13% of the final consumer price. Renewable taxes, similarly to the other taxes (including capacity tax), represented 8% out of the total tax and slightly more than 1% out of the final retail price in 2019.
For prices in band I5, the total tax amounted to 2.8 €/MWh in 2019, of which the environmental tax represented 86% (2.4 €/MWh), which was around 11% of the final retail price, whereas the impact of renewable, capacity and other taxes was much lower.

Figure 58 - Composition of the tax structure of the EU retail gas prices for median (I3) and large (I5) consumers
2.2.2 International comparisons
Household Natural Gas Prices
During most of the time since 2008, the EU27 average household retail gas price fluctuated in the range of 60-80 €/MWh. At the same time household retail gas prices in the US were in a much lower range, 20-40 €/MWh, owing to the price differential of wholesale US Henry Hub prices and the European wholesale benchmarks. Prices in Japan were in a much higher range, mostly between 100-140 €/MWh, owing to high local wholesale prices. Interestingly, retail gas prices paid by households in China were almost as low as in the US, albeit much higher wholesale prices in China, which might imply a subsidisation of household customers.

Figure 59 – Household gas retail prices in the EU, Japan, US and China
In Australia household retail gas prices were among the highest in the observed countries, albeit wholesale gas prices in the country where not among the highest ones. In Brazil and South Korea household retail prices are relatively high compared to the other observed G20 countries, but they were lower than the EU average over the last few years. Household gas prices were low in gas producer countries, such as the US and Canada, however, in Russia and Saudi Arabia the observed prices were low compared with the local wholesale price, which might mean households are being subsidised in these countries.

Figure 60 - Household retail natural gas prices in the EU27 and in some G20 trading partners
Source: Trinomics et altri study
Industrial Natural Gas Prices
The EU27 average industrial retail price was around 25€/MWh over the last few years, whereas since 2008 it was below 35 €/MWh during most of the time. Not surprisingly, industrial retail gas prices in the US were much lower than in the EU, owing to the significant discount of the US wholesale gas prices. On the other hand retail industrial prices in Japan was much higher than in EU, and prices in China, moving closely with EU prices for many years, now also developed a measurable premium to the EU prices.
Industrial gas prices in gas producer countries, like Russia, US, Canada were low in international comparison, similarly to their wholesale peers. Prices in South Korea were the highest among the observed countries, owing to the high wholesale prices in the country, as Korea solely relies on LNG imports with presumably oil indexation in the import price formula.


Figure 61 - Retail industrial natural gas prices in the EU and its major G20 trading partners