

EUR-Lex Access to European Union law
This document is an excerpt from the EUR-Lex website
Document 52022XC1017(09)
Communication from the Commission to the European Parliament, the Council and the Court of Auditors – Annual accounts of the European Development Fund 2021
Communication from the Commission to the European Parliament, the Council and the Court of Auditors – Annual accounts of the European Development Fund 2021
Communication from the Commission to the European Parliament, the Council and the Court of Auditors – Annual accounts of the European Development Fund 2021
OJ C 400, 17.10.2022, p. 1–169
(BG, ES, CS, DA, DE, ET, EL, EN, FR, GA, HR, IT, LV, LT, HU, MT, NL, PL, PT, RO, SK, SL, FI, SV)
|
17.10.2022 |
EN |
Official Journal of the European Union |
C 400/1 |
COMMUNICATION FROM THE COMMISSION TO THE EUROPEAN PARLIAMENT, THE COUNCIL AND THE COURT OF AUDITORS
Annual accounts of the European Development Fund 2021
(2022/C 400/01)
CONTENTS
| CERTIFICATION OF THE ACCOUNTS | 2 |
| IMPLEMENTING AND ACCOUNTING FOR THE EDF RESOURCES | 3 |
| FUNDS MANAGED BY THE EUROPEAN COMMISSION | 8 |
| FINANCIAL STATEMENTS OF THE EDF | 10 |
| FINANCIAL STATEMENTS OF THE EU TRUST FUNDS CONSOLIDATED IN EDF | 52 |
| FINANCIAL STATEMENTS OF THE BÊKOU EU TRUST FUND 2021 | 53 |
| FINANCIAL STATEMENTS OF THE EUTF AFRICA 2021 | 60 |
| CONSOLIDATED FINANCIAL STATEMENTS OF THE EDF AND THE EU TRUST FUNDS | 68 |
| EDF REPORT ON FINANCIAL IMPLEMENTATION | 73 |
| ANNUAL REPORT ON IMPLEMENTATION — FUNDS MANAGED BY THE EUROPEAN INVESTMENT BANK | 99 |
CERTIFICATION OF THE ACCOUNTS
The annual accounts of the European Development Fund for the year 2021 have been prepared in accordance with Title X of the Financial Regulation of the 11th European Development Fund and with the accounting principles, rules and methods set out in the notes to the financial statements.
I acknowledge my responsibility for the preparation and presentation of the annual accounts of the European Development Fund in accordance with Article 18 of the Financial Regulation of the 11th European Development Fund.
I have obtained from the authorising officer and from the EIB, who guarantee its reliability, all the information necessary for the production of the accounts that show the European Development Fund’s assets and liabilities and the budgetary implementation.
I hereby certify that based on this information, and on such checks as I deemed necessary to sign off the accounts, I have a reasonable assurance that the accounts present a true and fair view of the financial position of the European Development Fund in all material aspects.
Rosa ALDEA BUSQUETS
Accounting Officer
IMPLEMENTING AND ACCOUNTING FOR THE EDF RESOURCES
1. BACKGROUND
The European Union (hereinafter referred to as the ‘EU’) has cooperative relations with a large number of developing countries. The main objective is to promote economic, social and environmental development, with the primary aim of reducing and eradicating poverty in the long term by providing beneficiary countries with development aid and technical assistance. To achieve this, the EU draws up, jointly with the partner countries, cooperation strategies and mobilises the financial resources to implement them. These EU resources allocated to development cooperation come from three sources:
|
— |
the EU budget, |
|
— |
the European Development Fund, |
|
— |
the European Investment Bank. |
Up until 2021, the European Development Fund (hereinafter referred to as the ‘EDF’) was the main instrument for providing aid for development cooperation to the African, Caribbean and Pacific (hereinafter referred to as the ‘ACP’) States and Overseas Countries and Territories (hereinafter referred to as the ‘OCTs’).
The EDF is not funded by the EU budget. It is established by an Internal Agreement of the Representatives of the Member States, sitting within the Council, and managed by a specific committee. The European Commission (hereinafter referred to as the ‘Commission’) is responsible for the financial implementation of the operations carried out with EDF resources. The European Investment Bank (hereinafter referred to as the ‘EIB’) manages the Investment Facility.
Each EDF is concluded for a period of around five years and is governed by its own Financial Regulation, which requires the preparation of specific financial statements. In addition, these financial statements are aggregated so as to provide a global view of the financial situation of the resources for which the Commission is responsible.
The Internal Agreement establishing the 11th EDF was signed by the participating Member States, meeting within the Council, in June 2013 (1). It came into force on 1 March 2015.
In 2018, the Council adopted the Financial Regulation applicable to the 11th EDF (2). This new text repealed the previous regulation and is applicable to operations financed from previous EDFs without prejudice to existing legal commitments. This Regulation does not apply to the Investment Facility under previous EDFs.
Within the framework of the ACP-EU Partnership Agreement, the Investment Facility was established, managed by the EIB, and used to support private sector development in the ACP States by financing essentially — but not exclusively — private investments. The Facility is designed as a renewable fund, so that loan repayments can be reinvested in other operations, thus resulting in a self-renewing and financially independent facility. As the Investment Facility is not managed by the Commission, it is not consolidated in the first part of the annual accounts — the financial statements of the EDF and the related report on financial implementation. The financial statements of the Investment Facility are included as a separate part of the annual accounts (Part II) to provide a full picture of the development aid of the EDF.
2. HOW IS THE EDF FUNDED?
The Council of 2 December 2013 adopted Regulation (EU, Euratom) No 1311/2013 laying down the multiannual financial framework for 2014–2020 (3). In this context, it was decided that geographical cooperation with the ACP States would not be integrated into the EU budget, but would continue to be funded through the existing intergovernmental EDF.
The EU budget is annual and according to the budgetary principle of annuality, expenditure and revenue are planned and authorised for one year. Unlike the EU Budget, the EDF is a fund operating based on multiannuality. Each EDF establishes an overall fund to implement development cooperation during a period of usually five years. As resources are allocated on a multiannual basis, the allocated funds may be used over the period of the EDF. The lack of budget annuality is highlighted in the budgetary reporting, where the budgetary implementation of the EDFs is measured against the total funds.
The EDF resources are ‘ad hoc’ contributions from the EU Member States. Approximately every five years, Member State representatives met at intergovernmental level and decided on an overall amount to be allocated to the fund and to oversee its implementation.
The Commission manages the fund in accordance with the Union policy on development cooperation. Since Member States have their own development and aid policies in parallel to the Union policy, the Member States must coordinate their policies with the EU to ensure they are complementary.
In addition to the abovementioned contributions, it is also possible for Member States to enter into co-financing arrangements or to make voluntary financial contributions to the EDF.
3. EDF ACTIVITIES AFTER 31 DECEMBER 2020
The 11th EDF has reached its final stage as the sunset clause came into effect on 31 December 2020. This clause sets a cut-off date for commitments meaning that as of 2021 no further financing agreements can be signed under the 11th EDF. However, specific contracts for the existing financing agreements will still be signed until 31 December 2023 (and even later for audit and evaluation). Furthermore, the implementation of the ongoing projects funded by the European Development Fund will continue until their final completion.
In the context of the new Multi-Annual Financial Framework 2021–2027, the EU cooperation with ACP countries is integrated in the Neighbourhood, Development and International Cooperation Instrument –Global Europe. Similarly, the cooperation with OCTs is now covered by the Overseas Association Decision (OAD). This means that while up to 2021 the EDF programmes were funded by the voluntary contributions of EU Member States, as of 2021 development programmes will be funded through the EU budget. This also implies that the funding of development programmes are subject to the authorisation of the European Parliament and that the transactions have to comply with the EU financial regulations in the same way as other EU-funded programmes.
4. YEAR-END REPORTING
4.1. ANNUAL ACCOUNTS
In accordance with Article 18(3) of the EDF Financial Regulation, the EDF financial statements are prepared based on accrual-based accounting rules that themselves are based on International Public Sector Accounting Standards (IPSAS). These accounting rules adopted by the Accounting Officer of the Commission are applied by all the institutions and bodies of the EU in order to establish a uniform set of rules for accounting, valuation and presentation of the accounts with a view to harmonising the process for drawing up the financial statements. These EU accounting rules are also applied by the EDF while taking into account the specific nature of its activities.
The preparation of the EDF annual accounts is entrusted to the Commission's Accounting Officer who is the Accounting Officer of the EDF and ensures that the annual accounts of the EDF present a true and fair view of the financial position of the EDF.
The annual accounts are presented as follows:
Part I: Funds managed by the Commission
|
(i) |
Financial statements and explanatory notes of the EDF |
|
(ii) |
Financial statements of the EU trust funds consolidated in the EDF |
|
(iii) |
Consolidated financial statements of EDF and the EU trust funds |
|
(iv) |
Report on financial implementation of the EDF |
Part II: Annual report on implementation — Funds managed by the EIB
|
(i) |
Financial statements of the Investment Facility |
The part ‘Financial statements of the European trust funds consolidated in the EDF’ includes financial statements of the two trust funds created under the EDF: The Bêkou EU Trust Fund (see section ‘Financial statements of the Bêkou EU Trust Fund’) and the EU Trust Fund for Africa (see section ‘Financial statements of EU Trust Fund for Africa’). The trust funds individual financial statements are prepared under the responsibility of the Commission’s Accounting Officer and are subject to external audit carried out by a private auditor. The trust funds’ figures included in these annual accounts are provisional.
The EDF annual accounts must be adopted by the Commission no later than 31 July of the year following the balance sheet date and presented to the European Parliament and to the Council for discharge.
5. AUDIT AND DISCHARGE
5.1. AUDIT
The EDF annual accounts are audited by its external auditor, the European Court of Auditors (hereinafter referred to as the ‘ECA’), which draws up an annual report for the European Parliament and the Council.
5.2. DISCHARGE
The final control of the financial implementation of the EDF resources for a given financial year is the discharge. Following the audit and finalisation of the annual accounts, it falls to the Council to recommend, and then to the European Parliament to decide, whether to grant discharge to the Commission for the financial implementation of the EDF resources for a given financial year. This decision is based on a review of the accounts and the annual report of the ECA (which includes an official statement of assurance) and replies of the Commission to questions and further information requests of the discharge authority.
HIGHLIGHTS OF FINANCIAL IMPLEMENTATION 2021

Net amount, only 10th and 11th EDF.
Budget implementation
The year 2021 was marked by two events. 2021 was the first year following the sunset clause for the 11th EDF, which was reached on 31 December 2020. Therefore, in 2021 there were no further global commitments of projects under the 11th EDF. In addition, in 2021 the financial implementation for the 10th and 11th EDF for contracts (individual commitments: EUR 2 118 million) and payments (EUR 3 393 million) was impacted by the prolonged COVID crisis.
The total amount of gross payments for all EDFs (EUR 3 435 million) represents 91 % of the target of EUR 3 763 million communicated to the Member States. Due to the prolonged COVID situation, 50 % of Delegations in sub-Saharan Africa did not reach their minimum forecasted payment target (90 %). Most noticeable were Madagascar, that almost fully closed its borders, making it very difficult to continue implementation as initially foreseen; Chad and Gambia due to suspended or delayed implementation; Ethiopia, Guinea Conakry, and Mali where political crises affected operations severely, with an important impact on forecasted budget support payments. In the Pacific and in the Caribbean, COVID restrictions also affected implementation. In Fiji and Haiti, the negative collateral effects, emanating from the deterioration of the economic, social and political situation, had a devastating impact on infrastructure project.
Impact of the activities in the financial statements
In the financial statements, the impact of the abovementioned activities is most visible when looking at:
|
— |
Pre-financing (see note 2.2): a decrease of EUR 101 million largely as a result of fewer advances paid out due to the decrease in the number of contracts signed (EUR 3 670 million in 2020 v EUR 2 118 million in 2021). This decrease was mainly driven by challenges faced due to the ongoing COVID-19 pandemic and geopolitical crises. Consequently, cash and cash equivalents increased by EUR 266 million as a result of this significant decrease in pre-financing and other payments (see note 2.5), |
|
— |
The significantly lower number of open contracts at the end of 2021, caused both by the scaling down of EDF and adverse impact of the ongoing COVID-19 and geopolitical crises on signing of new contracts resulted in a substantial decrease of accrued charges by EUR 519 million (see note 2.8), |
|
— |
Aid instruments expenses (see note 3.3): an overall decrease in aid instruments expenses of EUR 1 743 million is a combined effect. On one hand the challenging conditions related to the COVID-19 pandemic and unstable geopolitical situation in several countries hampered implementation of EDF activities in 2021. At the same time, the decrease of activities under the 10th and previous EDFs is in line with the scaling down of those EDFs resulting in fewer open contracts under these EDFs. |
Impact of the changes in EAR 11 in the financial statements
On 1 January 2021, as a result of changes in the EU accounting rule 11 (see note 1 on Accounting Policies), the financial assets of the EDF were reclassified from financial assets available for sale to financial assets at fair value through surplus or deficit (FVSD). In both cases the financial assets are measured at fair value: the carrying amounts are thus comparable. The corresponding amount of the fair value reserve has been transferred to the accumulated surplus/deficit. This reclassification did not have any impact on the net assets of the EDF (see statement of changes in net assets).
FUNDS MANAGED BY THE EUROPEAN COMMISSION
CONTENTS
| FINANCIAL STATEMENTS OF THE EDF | 10 |
| EDF BALANCE SHEET | 11 |
| EDF STATEMENT OF FINANCIAL PERFORMANCE | 12 |
| EDF CASHFLOW STATEMENT | 13 |
| EDF STATEMENT OF CHANGES IN NET ASSETS | 14 |
| BALANCE SHEET BY EDF | 15 |
| STATEMENT OF FINANCIAL PERFORMANCE BY EDF | 17 |
| STATEMENT OF CHANGES IN NET ASSETS BY EDF | 18 |
| NOTES TO THE FINANCIAL STATEMENTS OF THE EDF | 21 |
| FINANCIAL STATEMENTS OF THE EU TRUST FUNDS CONSOLIDATED IN EDF | 52 |
| FINANCIAL STATEMENTS OF THE BÊKOU EU TRUST FUND 2021 | 53 |
| BALANCE SHEET | 58 |
| STATEMENT OF FINANCIAL PERFORMANCE | 59 |
| CASHFLOW STATEMENT | 59 |
| FINANCIAL STATEMENTS OF THE EUTF AFRICA 2021 | 60 |
| BALANCE SHEET | 66 |
| STATEMENT OF FINANCIAL PERFORMANCE | 67 |
| CASHFLOW STATEMENT | 67 |
| CONSOLIDATED FINANCIAL STATEMENTS OF THE EDF AND THE EU TRUST FUNDS | 68 |
| CONSOLIDATED BALANCE SHEET | 69 |
| CONSOLIDATED STATEMENT OF FINANCIAL PERFORMANCE | 70 |
| CONSOLIDATED CASH FLOW STATEMENT | 71 |
| CONSOLIDATED STATEMENT OF CHANGES IN NET ASSETS | 72 |
| EDF REPORT ON FINANCIAL IMPLEMENTATION | 73 |
FINANCIAL STATEMENTS OF THE EDF (4)
EDF BALANCE SHEET
|
(EUR million) |
|||
|
|
Note |
31.12.2021 |
31.12.2020 |
|
NON-CURRENT ASSETS |
|
|
|
|
Financial assets |
2.1 |
39 |
33 |
|
Pre-financing |
2.2 |
671 |
870 |
|
Trust Fund contributions |
2.3 |
382 |
394 |
|
Exchange receivables |
|
4 |
3 |
|
|
|
1 096 |
1 300 |
|
CURRENT ASSETS |
|
|
|
|
Pre-financing |
2.2 |
1 453 |
1 355 |
|
Exchange receivables and non-exchange recoverables |
2.4 |
35 |
140 |
|
Cash and cash equivalents |
2.5 |
994 |
728 |
|
|
|
2 481 |
2 223 |
|
TOTAL ASSETS |
|
3 577 |
3 523 |
|
NON-CURRENT LIABILITIES |
|
|
|
|
Financial liabilities |
2.6 |
(7) |
(2) |
|
|
|
(7) |
(2) |
|
CURRENT LIABILITIES |
|
|
|
|
Payables |
2.7 |
(501) |
(615) |
|
Accrued charges |
2.8 |
(1 008 ) |
(1 527 ) |
|
|
|
(1 509 ) |
(2 143 ) |
|
TOTAL LIABILITIES |
|
(1 516 ) |
(2 145 ) |
|
NET ASSETS |
|
2 061 |
1 379 |
|
FUNDS & RESERVES |
|
|
|
|
Fair value reserve |
2.9 |
— |
(5) |
|
Called fund capital — active EDFs |
2.10 |
62 643 |
58 986 |
|
Called fund capital from closed EDFs carried forward |
2.10 |
2 252 |
2 252 |
|
Economic result carried forward from previous years |
|
(59 860 ) |
(55 111 ) |
|
Economic result of the year |
|
(2 974 ) |
(4 744 ) |
|
NET ASSETS |
|
2 061 |
1 379 |
EDF STATEMENT OF FINANCIAL PERFORMANCE
|
(EUR million) |
|||
|
|
Note |
2021 |
2020 |
|
REVENUE |
|
|
|
|
Revenue from non-exchange transactions |
3.1 |
|
|
|
Recovery activities |
|
27 |
92 |
|
|
|
27 |
92 |
|
Revenue from exchange transactions |
3.2 |
|
|
|
Financial revenue |
|
(26) |
6 |
|
Other revenue |
|
74 |
37 |
|
|
|
48 |
43 |
|
Total revenue |
|
75 |
135 |
|
EXPENSES |
|
|
|
|
Aid instruments |
3.3 |
(2 864 ) |
(4 607 ) |
|
Co-financing expenses |
3.4 |
(19) |
(53) |
|
Finance costs |
3.5 |
(20) |
(21) |
|
Other expenses |
3.6 |
(145) |
(197) |
|
Total expenses |
|
(3 049 ) |
(4 878 ) |
|
ECONOMIC RESULT OF THE YEAR |
|
(2 974 ) |
(4 744 ) |
EDF CASHFLOW STATEMENT
|
(EUR million) |
|||
|
|
Note |
2021 |
2020 |
|
Economic result of the year |
|
(2 974 ) |
(4 744 ) |
|
Operating activities |
|
|
|
|
Capital increase — contributions (net) |
|
3 657 |
4 177 |
|
(Increase)/decrease in trust funds contributions |
|
12 |
(127) |
|
(Increase)/decrease in pre-financing |
|
101 |
(29) |
|
(Increase)/decrease in exchange receivables and non-exchange recoverables |
|
105 |
(17) |
|
Increase/(decrease) in financial liabilities |
|
5 |
(17) |
|
Increase/(decrease) in payables |
|
(114) |
99 |
|
Increase/(decrease) in accrued charges and deferred income |
|
(519) |
209 |
|
Other non-cash movements |
|
— |
(3) |
|
Investing activities |
|
|
|
|
(Increase)/decrease in non-derivative financial assets at fair value through surplus or deficit (*1) |
|
(7) |
2 |
|
NET CASHFLOW |
|
266 |
(452) |
|
Net increase/(decrease) in cash and cash equivalents |
|
266 |
(451) |
|
Cash and cash equivalents at the beginning of the year |
2.5 |
728 |
1 179 |
|
Cash and cash equivalents at year-end |
2.5 |
994 |
728 |
EDF STATEMENT OF CHANGES IN NET ASSETS
|
(EUR million) |
|||||||
|
|
Fund capital — active EDFs (A) |
Uncalled funds — active EDFs (B) |
Called fund capital — active EDFs (C) = (A)–(B) |
Cumulative Reserves (D) |
Called fund capital from closed EDFs carried forward (E) |
Fair value reserve (F) |
Total Net Assets (C)+(D)+(E)+(F) |
|
BALANCE AS AT 31.12.2019 |
73 264 |
18 455 |
54 809 |
(55 111 ) |
2 252 |
(2) |
1 948 |
|
Fair value movements |
|
|
|
|
(3) |
|
(3) |
|
Capital increase — contributions |
(223) |
(4 400 ) |
4 177 |
— |
— |
|
4 177 |
|
Economic result of the year |
— |
— |
— |
(4 744 ) |
— |
|
(4 744 ) |
|
BALANCE AS AT 31.12.2020 |
73 041 |
14 055 |
58 986 |
(59 854 ) |
2 252 |
(5) |
1 379 |
|
Impact of revised EAR 11 |
|
|
|
(5) |
|
5 |
— |
|
BALANCE AS AT 1.1.2021 |
73 041 |
14 055 |
58 986 |
(59 860 ) |
2 252 |
— |
1 379 |
|
Capital increase — contributions |
(43) |
(3 700 ) |
3 657 |
— |
— |
|
3 657 |
|
Economic result of the year |
— |
— |
— |
(2 974 ) |
— |
|
(2 974 ) |
|
BALANCE AS AT 31.12.2021 |
72 998 |
10 355 |
62 643 |
(62 834 ) |
2 252 |
— |
2 061 |
BALANCE SHEET BY EDF
|
(EUR million) |
|||||||||||
|
|
|
31.12.2021 |
31.12.2020 |
||||||||
|
|
Note |
Eighth EDF |
Ninth EDF |
10th EDF |
11th EDF |
Total |
Eighth EDF |
Ninth EDF |
10th EDF |
11th EDF |
Total |
|
NON-CURRENT ASSETS |
|
|
|
|
|
|
|
|
|
|
|
|
Financial assets |
2.1 |
— |
— |
(2) |
41 |
39 |
— |
— |
(2) |
35 |
33 |
|
Pre-financing |
2.2 |
— |
— |
219 |
452 |
671 |
— |
3 |
292 |
575 |
870 |
|
Trust Fund contributions |
2.3 |
— |
31 |
9 |
341 |
382 |
— |
29 |
9 |
355 |
394 |
|
Exchange receivables |
|
— |
— |
— |
4 |
4 |
— |
— |
— |
3 |
3 |
|
|
|
— |
31 |
226 |
839 |
1 096 |
— |
33 |
299 |
969 |
1 300 |
|
CURRENT ASSETS |
|
|
|
|
|
|
|
|
|
|
|
|
Pre-financing |
2.2 |
— |
14 |
353 |
1 085 |
1 453 |
0 |
9 |
341 |
1 005 |
1 355 |
|
Exchange receivables and non-exchange recoverables |
2.4 |
180 |
(314) |
1 296 |
(1 127 ) |
35 |
181 |
(177) |
1 723 |
(1 586 ) |
140 |
|
Inter-EDF accounts |
|
181 |
(316) |
1 279 |
(1 144 ) |
— |
181 |
(246) |
1 663 |
(1 598 ) |
— |
|
Cash and cash equivalents |
2.5 |
— |
— |
— |
994 |
994 |
— |
— |
— |
728 |
728 |
|
|
|
361 |
(615) |
2 928 |
(192) |
2 481 |
362 |
(414) |
3 726 |
(1 451 ) |
2 223 |
|
TOTAL ASSETS |
|
361 |
(584) |
3 154 |
646 |
3 577 |
362 |
(381) |
4 025 |
(483) |
3 523 |
|
NON-CURRENT LIABILITIES |
|
|
|
|
|
|
|
|
|
|
|
|
Financial liabilities |
2.6 |
— |
— |
— |
(7) |
(7) |
— |
— |
— |
(2) |
(2) |
|
|
|
— |
— |
— |
(7) |
(7) |
— |
— |
— |
(2) |
(2) |
|
CURRENT LIABILITIES |
|
|
|
|
|
|
|
|
|
|
|
|
Payables |
2.7 |
— |
(0) |
(27) |
(473) |
(501) |
— |
(1) |
(62) |
(554) |
(615) |
|
Accrued charges |
2.8 |
— |
(6) |
(110) |
(892) |
(1 008 ) |
— |
(67) |
(217) |
(1 244 ) |
(1 527 ) |
|
|
|
— |
(6) |
(138) |
(1 365 ) |
(1 509 ) |
— |
(67) |
(279) |
(1 798 ) |
(2 143 ) |
|
TOTAL LIABILITIES |
|
— |
(6) |
(138) |
(1 372 ) |
(1 516 ) |
— |
(67) |
(279) |
(1 800 ) |
(2 145 ) |
|
NET ASSETS |
|
361 |
(591) |
3 016 |
(725) |
2 061 |
362 |
(448) |
3 747 |
(2 282 ) |
1 379 |
|
Fair value reserves |
2.9 |
— |
— |
— |
— |
— |
— |
— |
(2) |
(4) |
(5) |
|
Called fund capital — active EDFs |
2.10 |
12 164 |
10 492 |
20 960 |
19 027 |
62 643 |
12 164 |
10 535 |
20 960 |
15 327 |
58 986 |
|
Called fund capital from closed EDFs carried forward |
2.10 |
627 |
1 625 |
— |
— |
2 252 |
627 |
1 625 |
— |
— |
2 252 |
|
Called fund capital transfers between active EDFs |
2.10 |
(2 512 ) |
2 018 |
101 |
394 |
— |
(2 512 ) |
2 041 |
188 |
283 |
— |
|
Economic result carried forward from previous years |
|
(10 098 ) |
(14 404 ) |
(19 065 ) |
(16 293 ) |
(59 860 ) |
(10 098 ) |
(14 440 ) |
(18 606 ) |
(11 966 ) |
(55 111 ) |
|
Economic result of the year |
|
(1) |
(6) |
(260) |
(2 708 ) |
(2 974 ) |
— |
36 |
(457) |
(4 324 ) |
(4 744 ) |
|
NET ASSETS |
|
180 |
(274) |
1 737 |
419 |
2 061 |
181 |
(203) |
2 084 |
(683) |
1 379 |
STATEMENT OF FINANCIAL PERFORMANCE BY EDF
|
(EUR million) |
|||||||||||
|
|
|
2021 |
2020 |
||||||||
|
Note |
Eighth EDF |
Ninth EDF |
10th EDF |
11th EDF |
Total |
Eighth EDF |
Ninth EDF |
10th EDF |
11th EDF |
Total |
|
|
REVENUE |
|
|
|
|
|
|
|
|
|
|
|
|
Revenue from non-exchange transactions |
3.1 |
|
|
|
|
|
|
|
|
|
|
|
Recovery activities |
|
— |
— |
1 |
26 |
27 |
(1) |
5 |
69 |
19 |
92 |
|
|
|
— |
— |
1 |
26 |
27 |
(1) |
5 |
69 |
19 |
92 |
|
Revenue from exchange transactions |
3.2 |
|
|
|
|
|
|
|
|
|
|
|
Financial revenue |
|
— |
0 |
(22) |
(4) |
(26) |
— |
5 |
1 |
1 |
6 |
|
Other revenue |
|
— |
5 |
14 |
55 |
74 |
— |
5 |
18 |
13 |
37 |
|
|
|
— |
5 |
(8) |
51 |
48 |
— |
10 |
19 |
13 |
43 |
|
Total revenue |
|
— |
5 |
(7) |
78 |
75 |
(1) |
15 |
88 |
32 |
135 |
|
EXPENSES |
|
|
|
|
|
|
|
|
|
|
|
|
Aid instruments |
3.3 |
— |
(7) |
(214) |
(2 644 ) |
(2 864 ) |
— |
34 |
(462) |
(4 179 ) |
(4 607 ) |
|
Co-financing expenses |
3.4 |
— |
— |
— |
(19) |
(19) |
— |
— |
(41) |
(12) |
(53) |
|
Finance costs |
3.5 |
— |
7 |
(23) |
(3) |
(20) |
1 |
(3) |
(16) |
(4) |
(21) |
|
Other expenses |
3.6 |
— |
(11) |
(16) |
(119) |
(145) |
— |
(9) |
(25) |
(162) |
(197) |
|
Total expenses |
|
— |
(12) |
(252) |
(2 785 ) |
(3 049 ) |
1 |
21 |
(545) |
(4 356 ) |
(4 878 ) |
|
ECONOMIC RESULT OF THE YEAR |
|
— |
(8) |
(259) |
(2 708 ) |
(2 974 ) |
— |
36 |
(457) |
(4 324 ) |
(4 744 ) |
STATEMENT OF CHANGES IN NET ASSETS BY EDF
|
(EUR million) |
|||||||
|
Eighth EDF |
Fund capital — active EDFs (A) |
Uncalled funds — active EDFs (B) |
Called fund capital — active EDFs (C) = (A)-(B) |
Cumulative Reserves (D) |
Called fund capital from closed EDFs carried forward (E) |
Called fund capital transfers between active EDFs (F) |
Total Net Assets (C)+(D)+(E)+(F) |
|
BALANCE AS AT 31.12.2019 |
12 164 |
— |
12 164 |
(10 098 ) |
627 |
(2 510 ) |
183 |
|
Transfers to/from the 10th EDF |
|
|
— |
|
|
(2) |
(2) |
|
BALANCE AS AT 31.12.2020 |
12 164 |
— |
12 164 |
(10 098 ) |
627 |
(2 512 ) |
181 |
|
Transfers to/from the 10th EDF |
|
|
— |
|
|
— |
— |
|
BALANCE AS AT 31.12.2021 |
12 164 |
— |
12 164 |
(10 098 ) |
627 |
(2 512 ) |
181 |
|
(EUR million) |
|||||||
|
Ninth EDF |
Fund capital — active EDFs (A) |
Uncalled funds — active EDFs (B) |
Called fund capital — active EDFs (C) = (A)-(B) |
Cumulative Reserves (D) |
Called fund capital from closed EDFs carried forward (E) |
Called fund capital transfers between active EDFs (F) |
Total Net Assets (C)+(D)+(E)+(F) |
|
BALANCE AS AT 31.12.2019 |
10 773 |
15 |
10 758 |
(14 440 ) |
1 625 |
2 109 |
53 |
|
Transfers to/from the 10th EDF |
|
— |
— |
|
|
|
— |
|
Transfers to/from the 10th EDF |
|
|
— |
|
|
(69) |
(69) |
|
Refund to Member States |
(223) |
|
(223) |
|
|
|
(223) |
|
Economic result of the year |
|
|
— |
|
|
|
— |
|
BALANCE AS AT 31.12.2020 |
10 550 |
15 |
10 535 |
(14 440 ) |
1 625 |
2 041 |
(203) |
|
Capital increase — contributions |
|
— |
— |
|
|
|
— |
|
Transfers to/from the 10th EDF |
|
|
— |
|
|
(23) |
(23) |
|
Refund to Member States |
(43) |
|
(43) |
|
|
|
(43) |
|
Economic result of the year |
|
|
— |
(6) |
|
— |
(6) |
|
BALANCE AS AT 31.12.2021 |
10 507 |
15 |
10 492 |
(14 410 ) |
1 625 |
2 018 |
(274) |
|
(EUR million) |
|||||||
|
10th EDF |
Fund capital — active EDFs (A) |
Uncalled funds — active EDFs (B) |
Called fund capital — active EDFs (C) = (A)-(B) |
Cumulative Reserves (D) |
Called fund capital from closed EDFs carried forward (E) |
Fair value reserve (G) |
Total Net Assets (C)+(D)+(E)+(F) |
|
BALANCE AS AT 31.12.2019 |
20 960 |
— |
20 960 |
(18 606 ) |
265 |
|
2 618 |
|
Transfers to/from the Eighth and Ninth EDF |
|
|
— |
|
71 |
|
71 |
|
Transfers to/from the 11th EDF |
|
|
— |
|
(147) |
|
(147) |
|
Economic result of the year |
|
|
— |
(457) |
|
|
(457) |
|
BALANCE AS AT 31.12.2020 |
20 960 |
— |
20 960 |
(19 063 ) |
188 |
(2) |
2 084 |
|
Impact of revised EAR 11 |
|
|
|
(2) |
|
2 |
— |
|
BALANCE AS AT 1.1.2020 |
20 960 |
— |
20 960 |
(19 065 ) |
188 |
— |
2 084 |
|
Transfers to/from the Eighth and Ninth EDF |
|
|
— |
|
23 |
|
23 |
|
Transfers to/from the 11th EDF |
|
|
— |
|
(110) |
|
(110) |
|
Economic result of the year |
|
|
— |
(260) |
|
|
(260) |
|
BALANCE AS AT 31.12.2021 |
20 960 |
— |
20 960 |
(19 324 ) |
101 |
— |
1 737 |
|
(EUR million) |
|||||||
|
11th EDF |
Fund capital — active EDFs (A) |
Uncalled funds — active EDFs (B) |
Called fund capital — active EDFs (C) = (A)-(B) |
Cumulative Reserves (D) |
Called fund capital transfers between active EDFs (F) |
Fair value reserve (G) |
Total Net Assets (C)+(D)+(E)+(F)+(G) |
|
BALANCE AS AT 31.12.2019 |
29 367 |
18 440 |
10 927 |
(11 966 ) |
136 |
(2) |
(905) |
|
Fair value movements |
|
|
|
|
— |
(2) |
(2) |
|
Capital increase — contributions |
|
(4 400 ) |
4 400 |
|
147 |
|
4 547 |
|
Economic result of the year |
|
|
— |
(4 324 ) |
— |
|
(4 324 ) |
|
BALANCE AS AT 31.12.2020 |
29 367 |
14 040 |
15 327 |
(16 290 ) |
283 |
(4) |
(683) |
|
Impact of revised EAR 11 |
|
|
|
(4) |
|
4 |
— |
|
BALANCE AS AT 1.1.2020 |
29 367 |
14 040 |
15 327 |
(16 294 ) |
283 |
— |
(683) |
|
Capital increase — contributions |
|
(3 700 ) |
3 700 |
|
110 |
|
3 810 |
|
Economic result of the year |
|
|
— |
(2 708 ) |
— |
|
(2 708 ) |
|
BALANCE AS AT 31.12.2021 |
29 367 |
10 340 |
19 027 |
(19 002 ) |
394 |
— |
419 |
NOTES TO THE FINANCIAL STATEMENTS OF THE EDF (5)
1. SIGNIFICANT ACCOUNTING POLICIES
1.1. ACCOUNTING PRINCIPLES
The objective of financial statements is to provide information about the financial position, performance and cashflows of an entity that is useful to a wide range of stakeholders.
The overall considerations (or accounting principles) to be followed when preparing the financial statements are laid down in EU Accounting Rule 1 ‘Financial Statements’ and are the same as those described in IPSAS 1: fair presentation, accrual basis, going concern, consistency of presentation, materiality, aggregation, offsetting and comparative information. The qualitative characteristics of financial reporting are relevance, faithful representation (reliability), understandability, timeliness, comparability and verifiability.
1.2. BASIS OF PREPARATION
1.2.1. Reporting period
Financial statements are presented annually. The accounting year begins on 1 January and ends on 31 December.
1.2.2. Currency and basis for conversion
The annual accounts are presented in millions of euros, the euro being the EU’s functional currency. Foreign currency transactions are translated into euros using the exchange rates prevailing at the dates of the transactions. Foreign exchange gains and losses resulting from the settlement of foreign currency transactions and from the re-translation at year-end exchange rates of monetary assets and liabilities denominated in foreign currencies are recognised in the statement of financial performance. Different conversion methods apply to property, plant and equipment and intangible assets, which retain their value in euros at the date when they were purchased.
Year-end balances of monetary assets and liabilities denominated in foreign currencies are translated into euros on the basis of the European Central Bank (ECB) exchange rates applying on 31 December.
Euro exchange rates
|
Currency |
31.12.2021 |
31.12.2020 |
Currency |
31.12.2021 |
31.12.2020 |
|
BGN |
1,9558 |
1,9558 |
PLN |
4,5969 |
4,5597 |
|
CZK |
26,8580 |
26,2420 |
RON |
4,9490 |
4,8683 |
|
DKK |
7,4364 |
7,4409 |
SEK |
10,2503 |
10,0343 |
|
GBP |
0,84028 |
0,8990 |
CHF |
1,0331 |
1,0802 |
|
HRK |
7,5156 |
7,5519 |
JPY |
130,3800 |
126,4900 |
|
HUF |
369,1900 |
363,8900 |
USD |
1,1326 |
1,2271 |
1.2.3. Use of estimates
In accordance with IPSAS and generally accepted accounting principles, the financial statements necessarily include amounts based on estimates and assumptions by management based on the most reliable information available. Significant estimates include, but are not limited to: amounts for employee benefit liabilities, financial risk of accounts receivable and the amounts disclosed in the notes concerning financial instruments, impairment allowance for financial assets at amortised cost and for financial guarantee contract liabilities, accrued revenue and charges, provisions, degree of impairment of intangible assets and property, plant and equipment, net realisable value of inventories, contingent assets and liabilities. Actual results could differ from those estimates.
Reasonable estimates are an essential part of the preparation of financial statements and do not undermine their reliability. An estimate may need revision if changes occur in the circumstances on which the estimate was based or as a result of new information or more experience. By its nature, the revision of an estimate does not relate to prior periods and is not the correction of an error. The effect of a change in accounting estimate shall be recognised in the surplus or deficit in the periods in which it becomes known.
1.2.4. Application of new and revised European Union Accounting Rules (EAR)
Revised EAR effective for periods beginning on or after 1 January 2021
In 2020, the Accounting Officer adopted the revised EAR 11 ‘Financial Instruments’, which is mandatorily effective as of 1 January 2021. The revised EAR 11 is based on the new IPSAS 41 ‘Financial Instruments’, the amended IPSAS 28 ‘Financial Instruments: Presentation’ and the amended IPSAS 30 ‘Financial Instruments: Disclosures’ which were issued in August 2018. It establishes the financial reporting principles for financial assets and financial liabilities. In accordance with the transition provisions of the revised EAR 11, the entity accounts for any changes from the initial application, on 1 January 2021. The revised EAR 11 does not require the restatement of prior periods. As a result, the financial assets, financial liabilities, exchange receivables and interest revenue/expense as at 31 December 2020 presented in these accounts have been accounted for in accordance with the accounting policies as stated in the 2020 financial statements of the entity.
Changes from the application of the revised EAR 11
New classification and measurement principles for financial assets
The revised EAR 11 introduces a principles-based approach to the classification of financial assets and requires the use of two criteria: the entity’s model for managing its financial assets and the contractual cash-flow characteristics of those assets. Depending on these criteria, financial assets are classified in the following categories: ‘financial assets at amortised cost’ (AC), ‘financial assets at fair value through net assets/equity’ (FVNA), or ‘financial assets at fair value through surplus or deficit’ (FVSD).
The application of the new criteria led to the reclassification of all equity investments and debt securities from ‘available for sale’ to FVSD. The related fair value reserve was reclassified — within Net Assets — to accumulated surplus or deficit.
New impairment model
Whereas the previous impairment model was based on incurred losses, the revised EAR 11 has introduced a forward-looking impairment model based on expected credit losses (ECL) over the lifetime of the financial asset. The ECL takes into account possible default events and the evolution of the credit quality of the financial assets. The new impairment model applies to all financial assets measured at AC or at FVNA as well as to loan commitments and financial guarantee contracts.
Financial guarantee accounting
The revised EAR 11 requires the application of the financial guarantee accounting requirements to all financial guarantee contracts. The measurement of the financial guarantee liability relies on the fair value of the guarantee at initial recognition and the evolution of the expected credit losses from the guaranteed debts portfolio.
1.3. BALANCE SHEET
1.3.1. Financial assets
Classification at initial recognition
The classification of the financial instruments is determined at initial recognition. Based on the management model and the asset contractual cash-flow characteristics the financial assets can be classified in three categories: Financial assets at amortised cost (‘AC’), financial assets at fair value through net assets/equity (‘FVNA’) or financial assets at fair value through surplus or deficit (‘FVSD’).
(i) Financial assets at amortised cost
Financial assets at amortised cost are non-derivative financial assets that meet two conditions: (1) The entity holds them in order to collect the contractual cash flows. (2) On specified days, there are contractual cash flows that are solely payments of the principal and interest on the outstanding principal.
This category comprises:
|
— |
cash and cash equivalents, |
|
— |
loans (including term deposits with original maturity of more than three months), |
|
— |
exchange receivables. |
Financial assets at amortised cost are included in current assets, except for those with maturity of more than 12 months from the reporting date.
(ii) Financial assets at fair value through net assets/equity
These non-derivatives financial assets have contractual cash flows that represent only principal and interest on the outstanding principal. In addition, the management model is to hold the financial assets both to collect contractual cash flows and to sell the financial assets.
Assets in this category are classified as current assets, if they are expected to be realised within 12 months from the reporting date.
The entity does not hold such assets at 31 December 2021.
(iii) Financial assets at fair value through surplus or deficit
The entity classifies derivatives and equity investments as FVSD because the contractual cash flows do not represent only principal and interests on the principal.
In addition, the entity classifies the debt securities it holds as FVSD because the portfolios of debt securities are managed and evaluated on a portfolio fair value basis.
Assets in this category are classified as current assets, if they are expected to be realised within 12 months from the reporting date.
Initial recognition and measurement
Purchases of financial assets at fair value through surplus or deficit are recognised on their trade-date — the date on which the entity commits to purchase the asset. Cash equivalents and loans are recognised when cash is deposited in a financial institution or advanced to borrowers.
Financial assets are initially measured at fair value. For all financial assets not carried at fair value through surplus or deficit, the transactions costs are added to the fair value at initial recognition. For financial assets carried at fair value through surplus or deficit the transaction costs are expensed in the statement of financial performance.
The fair value of a financial asset on initial recognition is normally the transaction price unless the transaction is not at arm’s length, i.e. at no or at nominal consideration for public policy purposes. In this case, the difference between the fair value of the financial instrument and the transaction price is a non-exchange component which is recognised as an expense in the statement of financial performance. In this case, the fair value of a financial asset is derived from current market transactions for a directly equivalent instrument. If there is no active market for the instrument, the fair value is derived from a valuation technique that uses available data from observable markets.
Subsequent measurement
Financial assets at amortised cost are subsequently measured at amortised cost using the effective interest method.
Financial assets at fair value through surplus or deficit are subsequently measured at fair value. Gains and losses from changes in the fair value (including those stemming from foreign exchange translation and any interests earned) are included in the statement of financial performance in the period in which they arise.
Fair value at subsequent measurement
The fair values of quoted investments in active markets are based on current bid prices. If the market for a financial asset is not active (and for unlisted securities and over-the–counter derivatives), the EU establishes a fair value by using valuation techniques. These include the use of recent arm’s length transactions, reference to other instruments that are substantially the same, discounted cashflow analysis, option pricing models and other valuation techniques commonly used by market participants.
Investments in venture capital funds which do not have a quoted market price in an active market are valued at the attributable net asset value, which is considered as an equivalent of their fair value.
Impairment of financial assets
The EU recognises and measures an impairment loss for expected credit losses on financial assets that are measured at amortised cost and at fair value through net assets/equity.
The expected credit loss (ECL) is the present value of the difference between the contractual cash flows and the cash flows that the EU expects to receive. The ECL incorporates reasonable and supportable information that is available without undue cost or effort at the reporting date.
For assets at amortised cost, the asset’s carrying amount is reduced by the amount of the impairment loss which is recognised in the statement of financial performance. If, in a subsequent period, the amount of the impairment loss decreases, the previously recognised impairment loss is reversed through the statement of financial performance.
(a) Receivables
The entity measures the impairment loss at the amount of lifetime ECL, using practical expedients (e.g. provision matrix).
(b) Cash and cash equivalents
The entity holds cash and cash equivalents in current bank accounts and term deposits of up to 3 months. The cash is held in banks with very high credit ratings, thus having very low default probabilities. Given the short duration and low default probabilities, the expected credit losses from cash and cash equivalents are negligible. As a result, no impairment allowance is recognised for cash equivalents.
(c) Loans
The ECL is measured with a three stage model that takes into account probability weighted default events during the lifetime of the financial asset and the evolution of credit risk since the origination of the financial asset. For loans, origination is the date of the irrevocable loan commitment
If there is no significant increase in credit risk since origination (‘stage 1’), the impairment loss is the ECL from possible default events in the next 12 months from the reporting date (‘12-month ECL’). If there is a significant increase in credit risk since origination (‘stage 2’) or if there is objective evidence of a credit impairment (‘stage 3’), the impairment loss equals the ECL from possible default events over the whole lifetime of the financial asset (‘lifetime ECL’)
Derecognition
Financial instruments are derecognised when the rights to receive cashflows from the investments have expired or the entity has transferred substantially all risks and rewards of ownership to another party. Sales of financial assets through surplus or deficit are recognised on their trade-date.
1.3.2. Pre-financing amounts
Pre-financing is a payment intended to provide the beneficiary with a cash advance, i.e. a float. It may be split into a number of payments over a period defined in the particular contract, decision, agreement or basic legal act. The float or advance is either used for the purpose for which it was provided during the period defined in the agreement or it is repaid. If the beneficiary does not incur eligible expenditure, he has the obligation to return the pre-financing advance to the entity. Thus, as the entity retains control over the pre-financing and is entitled to a refund for the ineligible part, the amount is recognised as an asset.
Pre-financing is initially recognised on the balance sheet when cash is transferred to the recipient. It is measured at the amount of the consideration given. In subsequent periods pre-financing is measured at the amount initially recognised on the balance sheet less eligible expenses (including estimated amounts where necessary) incurred during the period.
1.3.3. Receivables and recoverables
The EU accounting rules require separate presentation of exchange and non-exchange transactions. To distinguish between the two categories, the term ‘receivable’ is reserved for exchange transactions, whereas for non-exchange transactions, i.e. when the EU receives value from another entity without directly giving approximately equal value in exchange, the term ‘recoverables’ is used (e.g. recoverables from Member States related to own resources).
Receivables from exchange transactions meet the definition of financial instruments. The entity classified them as financial assets at amortised cost and measured them accordingly.
Recoverables from non-exchange transactions are carried at fair value as at the date of acquisition less write-down for impairment. A write-down for impairment is established when there is objective evidence that the entity will not be able to collect all amounts due according to the original terms of the recoverables. The amount of the write-down is the difference between the asset’s carrying amount and the recoverable amount. The amount of the write-down is recognised in the statement of financial performance.
1.3.4. Cash and cash equivalents
Cash and cash equivalents are financial assets at amortised cost and include cash at hand, deposits held at call or at short notice with banks, and other short-term highly liquid investments with original maturities of three months or less.
1.3.5. Payables
Included under accounts payable are both amounts related to exchange transactions such as the purchase of goods and services, and to non-exchange transactions, e.g. to cost claims from beneficiaries, grants or other EU funding, or pre-financing received (see note 1.4.1).
Where grants or other funding are provided to the beneficiaries, the cost claims are recorded as payables for the requested amount, at the moment when the cost claim is received. Upon verification and acceptance of the eligible costs, the payables are valued at the accepted and eligible amount.
Payables arising from the purchase of goods and services are recognised at invoice reception for the original amount. The corresponding expenses are entered in the accounts when the supplies or services are delivered and accepted by the entity.
1.3.6. Financial liabilities
Financial liabilities are classified as financial liabilities carried at amortised cost, financial liabilities at fair value through surplus or deficit, or as financial guarantee contract liabilities.
Financial liabilities at amortised cost are initially recognised at fair value including transaction costs incurred and subsequently carried at amortised cost using the effective interest method. They are derecognised from the statement of financial position if and only if the obligation is discharged, waived, cancelled or expired.
Financial liabilities at fair value through surplus or deficit include derivatives where the fair value is negative. Where the guarantee contract requires the entity to make payments in response to changes in financial instruments prices or foreign exchange rates, the guarantee contract is a derivative. They follow the same accounting treatment as financial assets at fair value through surplus or deficit.
The entity recognises a financial guarantee contract liability when it enters into a contract that requires to make specified payments to reimburse the guarantee holder for a loss it incurs because a specified debtor fails to make payment when due in accordance with the original or modified terms of a debt instrument. Financial guarantee contract liabilities are initially recognised at fair value.
The subsequent measurement depends on the evolution of the credit risk exposure from the financial guarantee. If there is no significant increase in credit risk (‘stage 1’), financial guarantee liabilities are measured at the higher of the 12 months’ expected credit losses and the amount initially recognised less, when appropriate, cumulative amortisation. If there is a significant increase in credit risk (‘stage 2’), financial guarantee liabilities are measured at the higher of the lifetime expected credit losses and the amount initially recognised less, when appropriate, cumulative amortisation.
Financial liabilities are classified as non-current liabilities, except for maturities less than 12 months after the balance sheet date. Financial guarantee contracts are classified as current liabilities except if the entity has an unconditional right to defer the settlement of the liability for at least twelve months after the reporting date.
1.3.7. Accrued and deferred revenue and charges
Transactions and events are recognised in the financial statements in the period to which they relate. At year-end, if an invoice is not yet issued but the service has been rendered, or the supplies have been delivered by the entity or a contractual agreement exists (e.g. by reference to a contract), an accrued revenue will be recognised in the financial statements. In addition, at year-end, if an invoice is issued but the services have not yet been rendered or the goods supplied have not yet been delivered, the revenue will be deferred and recognised in the subsequent accounting period.
Expenses are also accounted for in the period to which they relate. At the end of the accounting period, accrued expenses are recognised based on an estimated amount of the transfer obligation of the period. The calculation of accrued expenses is done in accordance with detailed operational and practical guidelines issued by the Accounting Officer. These aim at ensuring that the financial statements provide a faithful representation of the economic and other phenomena they purport to represent. By analogy, if a payment has been made in advance for services or goods that have not yet been received, the expense will be deferred and recognised in the subsequent accounting period.
1.4. STATEMENT OF FINANCIAL PERFORMANCE
1.4.1. Revenue
Revenue comprises gross inflows of economic benefits or service potential received and receivable by the entity, which represents an increase in net assets, other than increases relating to contributions from owners.
Depending on the nature of the underlying transactions in the statement of financial performance, revenue is distinguished between:
Revenue from non-exchange transactions
Revenue from non-exchange transactions are taxes and transfers, because the transferor provides resources to the recipient entity, without the recipient entity providing approximately equal value directly in exchange. Transfers are inflows of future economic benefits or service potential from non-exchange transactions, other than taxes. For the EU entities, transfers mostly comprise funds received from the Commission (e.g. balancing subsidy to the traditional agencies, operating subsidy for the delegation agreements).
The entity shall recognise an asset in respect of transfers when the entity controls the resources as a result of a past event (the transfer) and expects to receive future economic benefits or service potential from those resources, and when the fair value can be reliably measured. An inflow of resources from a non-exchange transaction recognised as an asset (i.e. cash) is also recognised as revenue, except to the extent that the entity has a present obligation in respect of that transfer (condition), which needs to be satisfied before the revenue can be recognised. Until the condition is met the revenue is deferred and recognised as a liability.
Revenue from exchange transactions
Revenue from the sale of goods and services is recognised when the significant risk and rewards of ownership of the goods are transferred to the purchaser. Revenue associated with a transaction involving the provision of services is recognised by reference to the stage of completion of the transaction at the reporting date.
(a) Interest revenue and expense
Interest revenue and expense from financial assets and financial liabilities at amortised cost are recognised in the statement of financial performance using the effective interest method. This is a method of calculating the amortised cost of a financial asset or a financial liability and of allocating the interest revenue or interest expense over the relevant period.
(b) Revenue from dividends
Revenue from dividends and similar distributions is recognised when the right to receive payment is established.
(c) Revenue and expense from financial assets at fair value through surplus or deficit
This refers to the fair value gains (revenue) and fair value losses (expense) from these financial assets, including those stemming from foreign exchange translation. For interest-bearing financial assets, this also includes interest.
(d) Revenue from financial guarantee contracts
The revenue from financial guarantee contracts (guarantee premium) is recognised over the time the entity stands ready to compensate the holder of the financial guarantee contract for the credit loss it may incur.
1.4.2. Expenses
Expenses are decreases in economic benefits or service potential during the reporting period in the form of outflows or consumption of assets or the incurring of liabilities that result in decreases in net assets. They include both the expenses from exchange transactions and expenses from non-exchange transactions.
Expenses from exchange transactions arising from the purchase of goods and services are recognised when the supplies are delivered and accepted by the entity. They are valued at the original invoice amount. Furthermore, at the balance sheet date expenses related to the service delivered during the period for which an invoice has not yet been received or accepted are recognised in the statement of financial performance.
Expenses from non-exchange transactions relate to transfers to beneficiaries and can be of three types: entitlements, transfers under agreement and discretionary grants, contributions and donations. Transfers are recognised as expenses in the period during which the events giving rise to the transfer occurred, as long as the nature of the transfer is allowed by regulation or an agreement has been signed authorising the transfer; any eligibility criteria have been met by the beneficiary; and a reasonable estimate of the amount can be made.
When a request for payment or cost claim is received and meets the recognition criteria, it is recognised as an expense for the eligible amount. At year-end, incurred eligible expenses due to the beneficiaries but not yet reported are estimated and recorded as accrued expense.
1.5. CONTINGENT ASSETS AND LIABILITIES
1.5.1. Contingent assets
A contingent asset is a possible asset that arises from past events and of which the existence will be confirmed only by the occurrence or non-occurrence of one or more uncertain future events not wholly within the control of the entity. A contingent asset is disclosed when an inflow of economic benefits or service potential is probable.
1.5.2. Contingent liabilities
A contingent liability is either a possible obligation of which the existence will be confirmed only by the occurrence or non-occurrence of one or more uncertain future events not wholly within the control of the entity; or a present obligation where it is not probable that an outflow of resources embodying economic benefits or service potential will be required to settle the obligation.
A contingent liability also arises in the rare circumstances where a present obligation exists but cannot be measured with sufficient reliability.
Contingent liabilities are not recognised in the accounts. They are disclosed unless the possibility of an outflow of resources embodying economic benefits or service potential is remote.
1.6. FUND CAPITAL
The EDF member states provide contributions to the Fund for the implementation of EDF programmes as laid down in the Internal Agreement of each EDF. According to the applicable legal basis the capital calls, i.e. the requests for funding for a given year N, are decided by a Council Decision in year N–1, with the funds to be received clearly assigned to specified future periods.
The contributions meet the criteria of contribution from owners (EAR 1) and are thus treated as fund capital in the EDF financial statements. The fund capital represents the total amount of contributions to be received from the EDF member states. As the uncalled fund capital is openly deducted from the total fund capital (see Statement of Changes in Net Assets), only the called fund capital is recognised in the Balance Sheet.
As the agreed contributions are assigned to specified reporting periods, with the EDF’s legal claim against the EDF member states arising only in these periods, any amounts received in advance are recognised as deferred capital contributions under payables rather than as called capital.
1.7. CO-FINANCING
Co-financing contributions received fulfil the criteria of revenues from non-exchange transactions under conditions and they are presented as payables to Member States, non-Member States and others. The EDF is required to use the contributions to deliver services to third parties or is otherwise required to return the assets (the contributions received). The outstanding payables relating to co-financing agreements represent the co-financing contributions received less the expenses incurred related to the project. The effect on net assets is nil.
Expenses relating to co-financing projects are recognised as they are incurred. The corresponding amount of contributions is recognised as operating revenue and the effect on the economic result of the year is nil.
2. NOTES TO THE BALANCE SHEET
ASSETS
2.1. FINANCIAL ASSETS
A financial asset is any asset that is:
|
(a) |
cash; |
|
(b) |
an equity instrument of another entity; |
|
(c) |
a contractual right: to receive cash or another financial asset from another entity; or to exchange financial assets or financial liabilities with another entity under conditions that are potentially favourable to the entity; or |
|
(d) |
a contract that will or may be settled in the entity’s own equity instruments. |
Financial assets are classified in the following categories: ‘financial assets at fair value through surplus or deficit’, ‘loans and receivables’, ‘held-to-maturity investments’ and ‘available for sale financial assets’. The classification of the financial instruments is determined at initial recognition and re-evaluated at each balance sheet date.
The financial assets of the EDF comprise of financial assets at FVSD and loans and are as follows:
|
(EUR million) |
||
|
|
31.12.2021 |
31.12.2020 |
|
Financial assets at fair value through surplus or deficit (FVSD) |
38 |
— |
|
Available for sale financial assets |
— |
32 |
|
Loans |
1 |
1 |
|
Total |
39 |
33 |
The EUR 38 million of financial assets at FVSD relate to equity investments in two main areas: Renewable sustainable energy via Climate Investor One, ElectriFI and GEEREF, and promoting inclusive smallholder and rural SME finance via the ABC FUND.
EUR 1 million relates entirely to a loan given to ElectriFI which is an investment facility that finances early-stage and small-sised projects focusing on electricity access and generation from sustainable energy sources in emerging markets. It has a global scope, with a particular focus on sub-Saharan Africa.
2.2. PRE-FINANCING
Many contracts provide for payments of advances before the commencement of works, delivery of supplies or the provision of services. Sometimes the payment schedules of contracts foresee payments based on progress reports. Pre-financing is normally paid in the currency of the country or territory where the project is executed.
The timing of use of pre-financing governs whether it is disclosed as a current or a non-current pre-financing. The use is defined by the project’s underlying agreement. Any use due within twelve months after the reporting date are disclosed as current pre-financing. As many of the EDF projects are long-term in nature, it is necessary that the related advances are available for more than one year. Thus some pre-financing amounts are shown as non-current assets.
|
(EUR million) |
|||||||
|
|
Note |
Eighth EDF |
Ninth EDF |
10th EDF |
11th EDF |
31.12.2021 |
31.12.2020 |
|
Non-current pre-financing |
2.2.1 |
— |
— |
219 |
452 |
671 |
870 |
|
Current pre-financing |
2.2.2 |
— |
14 |
353 |
1 085 |
1 453 |
1 355 |
|
Total |
|
— |
14 |
572 |
1 537 |
2 123 |
2 225 |
2021 marked the first year following the sunset clause of the 11th EDF. This meant that as of 1 January 2021 no further global commitments could be made. In addition, the prolonged COVID crisis made implementation increasingly difficult for several delegations in particular in Madagascar, Chad and Gambia. This coupled with political crises in other areas such as Ethiopia, Guinea, Conakry and Mali, led to a decrease in the signature of individual commitments and thus to a decrease in pre-financing in the 11th EDF from EUR 1 583 million in 2020 to EUR 1 537 million in 2021.
The decrease of pre-financing in the 10th EDF from EUR 633 million in 2020 to EUR 572 million in 2021, is a consequence of the normal lifecycle of the EDF. As a result of the phasing out of the 10th EDF many contracts were completed and closed. Consequently, the level of pre-financing payments made to beneficiaries decreased while the clearing of pre-financing increased.
In 2020, included under current pre-financing was an amount of EUR 3 million which are now classified as exchange receivables relating to financial instruments.
2.2.1. Non-current pre-financing by management mode
|
(EUR million) |
||||
|
|
31.12.2021 |
31.12.2020 |
||
|
Direct Management |
|
|
||
|
Implemented by: |
|
|
||
|
72 |
139 |
||
|
8 |
8 |
||
|
15 |
25 |
||
|
|
95 |
171 |
||
|
Indirect Management |
|
|
||
|
Implemented by: |
|
|
||
|
230 |
266 |
||
|
278 |
343 |
||
|
12 |
28 |
||
|
40 |
49 |
||
|
14 |
11 |
||
|
1 |
1 |
||
|
|
575 |
698 |
||
|
Total |
671 |
870 |
||
2.2.2. Current pre-financing
|
(EUR million) |
||||||
|
|
Eighth EDF |
Ninth EDF |
10th EDF |
11th EDF |
31.12.2021 |
31.12.2020 |
|
Pre-financing (gross) |
— |
24 |
970 |
4 717 |
5 711 |
5 097 |
|
Cleared via cut-off |
— |
(10) |
(617) |
(3 632 ) |
(4 258 ) |
(3 742 ) |
|
Total |
— |
14 |
353 |
1 085 |
1 453 |
1 355 |
2.2.3. Current pre-financing by management mode
|
(EUR million) |
||||
|
|
31.12.2021 |
31.12.2020 |
||
|
Direct Management |
|
|
||
|
Implemented by: |
|
|
||
|
61 |
(40) |
||
|
11 |
14 |
||
|
159 |
206 |
||
|
|
231 |
180 |
||
|
Indirect Management |
|
|
||
|
Implemented by: |
|
|
||
|
160 |
224 |
||
|
642 |
572 |
||
|
109 |
73 |
||
|
119 |
146 |
||
|
190 |
155 |
||
|
1 |
4 |
||
|
|
1 221 |
1 175 |
||
|
Total |
1 453 |
1 355 |
||
2.2.4. Guarantees received in respect of pre-financing
Guarantees are held to secure pre-financing and are released when the final claim under a project is paid.
|
(EUR million) |
||
|
|
31.12.2021 |
31.12.2020 |
|
Guarantees for pre-financing |
44 |
49 |
The majority of pre-financing is paid under the indirect management mode. In this case, the beneficiary of the guarantee is not the EDF but the contracting authority. Even though the EDF is not the beneficiary, those guarantees secure its assets. In 2021, those guarantees amounted to EUR 764 million.
2.3. TRUST FUND CONTRIBUTIONS
This heading represents the amount paid as contributions to the EU Trust Fund for Africa and the Bêkou EU Trust Fund. The contributions are net of the costs incurred by the trust funds and attributable to the EDF.
The trust fund contributions are implemented by the EDF under the direct management mode.
|
EUR million |
||||
|
|
Net contribution at 31.12.2020 |
Contributions paid in 2021 |
Allocation of TF’s net expenses 2021 |
Net contribution at 31.12.2021 |
|
Africa |
385 |
627 |
(631) |
381 |
|
Bêkou |
9 |
7 |
(15) |
1 |
|
Total |
394 |
634 |
(646) |
382 |
The decrease of contributions from EUR 800 million in 2020 to EUR 634 million in 2021 stems from the decrease in trust funds expenses due to the ongoing COVID-19 pandemic and deteriorating safety situations in several regions which hampered activities of the trust funds in 2021.
2.4. NON-EXCHANGE RECOVERABLES AND EXCHANGE RECEIVABLES
Exchange transactions are transactions in which the entity receives assets or services, or has liabilities extinguished, and directly gives approximately equal value (primarily in the form of goods, services or use of assets) to the other party in exchange. Non-exchange transactions are transactions in which an entity either receives value from another entity without directly giving approximately equal value in exchange, or gives value to another entity without directly receiving approximately equal value in exchange.
|
(EUR million) |
|||
|
|
Note |
31.12.2021 |
31.12.2020 |
|
Recoverables from non-exchange transactions |
2.4.1 |
26 |
48 |
|
Receivables from exchange transactions |
2.4.2 |
9 |
92 |
|
Total |
|
35 |
140 |
2.4.1. Recoverables from non-exchange transactions
|
(EUR million) |
||||||
|
|
Eighth EDF |
Ninth EDF |
10th EDF |
11th EDF |
31.12.2021 |
31.12.2020 |
|
Member States |
— |
— |
— |
— |
— |
— |
|
Customers |
— |
4 |
47 |
5 |
56 |
61 |
|
Public bodies |
— |
7 |
17 |
2 |
25 |
27 |
|
Third states |
— |
1 |
4 |
1 |
6 |
4 |
|
Write down |
— |
(9) |
(51) |
(5) |
(66) |
(49) |
|
Inter-company accounts with EU Institutions |
— |
— |
— |
5 |
5 |
4 |
|
Total |
— |
2 |
16 |
8 |
26 |
48 |
2.4.2. Receivables from exchange transactions
|
(EUR million) |
||||||
|
|
Eighth EDF |
Ninth EDF |
10th EDF |
11th EDF |
31.12.2021 |
31.12.2020 |
|
Accrued income |
— |
— |
(1) |
— |
— |
88 |
|
Inter-EDF accounts |
181 |
(316) |
1 279 |
(1 144 ) |
— |
— |
|
Other |
— |
— |
— |
9 |
9 |
4 |
|
Total |
181 |
(316) |
1 278 |
(1 136 ) |
9 |
92 |
The decrease in accrued income in 2021, is mainly due to the termination of the debt relief project with the World Bank for which an amount of EUR 62,6 million was still outstanding at the end of 2020 but which was regularised in 2021. In addition, accrued interest in 2020 also included EUR 18 million related to the Africa EU Infrastructure project. Upon further analysis, it resulted that the interest was not due to the EDF and therefore this interest was not collected in 2021 (see note 3.2).
For efficiency reasons, the single treasury covering all the EDFs is allocated to the 11th EDF; this leads to operations between the various EDFs, which are balanced out in the inter-EDF accounts between the various EDF balance sheets.
Inter-EDF accounts are presented only in the individual EDFs. The total of inter-EDF accounts is zero.
The heading ‘other’ comprises two financial instrument receivables; a receivable of EUR 4 million from the Global Energy Efficiency and Renewable Energy Fund (GEEREF) and another receivable of EUR 4 million from Climate Investor One.
2.5. CASH AND CASH EQUIVALENTS (6)
Cash and cash equivalents are financial instruments and include cash at hand, deposits held at call or at short notice with banks (such as current accounts and savings accounts), and other short-term highly liquid investments with original maturities of three months or less.
|
(EUR million) |
||||||
|
|
Eighth EDF |
Ninth EDF |
10th EDF |
11th EDF |
31.12.2021 |
31.12.2020 |
|
Special accounts |
|
|
|
|
|
|
|
Central banks |
— |
— |
— |
795 |
795 |
693 |
|
|
— |
— |
— |
795 |
795 |
693 |
|
Current accounts |
|
|
|
|
|
|
|
Commercial banks |
— |
— |
— |
165 |
165 |
8 |
|
Cash belonging to financial instruments |
— |
— |
— |
34 |
34 |
27 |
|
|
— |
— |
— |
199 |
199 |
35 |
|
Total |
— |
— |
— |
994 |
994 |
728 |
The increase in cash and cash equivalents by EUR 266 million can be explained mainly by the decrease in payments due to the additional challenges brought about by the prolonged COVID-19 pandemic and various political crises. This is in line with the decrease in expenses (see note 3.3) and the decrease in pre-financing (see note 2.2). EDF net payments amounted to EUR 3 323 million in 2021 compared to record high payments of EUR 4 605 million in 2020.
As in previous years and in order to limit counterparty risk more cash is kept in accounts with central banks than in the commercial banks (see note 5.1).
LIABILITIES
2.6. FINANCIAL LIABILITIES
2.6.1. Financial Provisions
These provisions represent the estimated losses that will be incurred in relation to the guarantees given under different financial instruments, where entrusted entities are empowered to issue guarantees in their own name but on behalf of, and at the risk of, the EDF. The financial risk of the EDF linked to the guarantees is capped and financial assets are gradually provisioned to cover for the future guarantee calls.
|
(EUR million) |
||||||
|
|
Eighth EDF |
Ninth EDF |
10th EDF |
11th EDF |
31.12.2021 |
31.12.2020 |
|
Financial guarantee liability |
— |
— |
— |
1 |
1 |
— |
The amount of EUR 1 million represent the estimated loss in relation to the guarantee given under the Euritz financial instrument of EUR 8 million (see note 3.2.1).
2.6.2. Co-financing payables
Co-financing payables represent funds received by the EDF in respect of the co-financing agreements. The EDF is required to use these contributions to deliver agreed services to third parties and return the unused funds to the contributors. Timing of the use of the co-financing amounts determines whether it is disclosed as current or non-current.
At the year-end a case-by-case assessment of all co-financing payables is performed and all amounts that are unlikely to be used in the following 12 months are considered non-current. Current amounts are shown under note 2.7.2.
|
(EUR million) |
||||||
|
|
Eighth EDF |
Ninth EDF |
10th EDF |
11th EDF |
31.12.2021 |
31.12.2020 |
|
Non-current co-financing payables |
— |
— |
— |
6 |
6 |
2 |
|
Current co-financing payables |
— |
— |
(3) |
38 |
35 |
42 |
|
Total |
— |
— |
(3) |
44 |
41 |
44 |
2.7. PAYABLES
Payables are liabilities to pay for goods or services that have been received or supplied and — unlike accrued charges — have already been invoiced or formally agreed with the supplier. Payables can relate to both exchange transactions (such as the purchase of goods and services) and non-exchange transactions (e.g. cost claims from beneficiaries of grants, pre-financing or other EU funding).
|
(EUR million) |
|||||||
|
|
Note |
Eighth EDF |
Ninth EDF |
10th EDF |
11th EDF |
31.12.2021 |
31.12.2020 |
|
Current payables |
2.7.1 |
— |
— |
33 |
230 |
263 |
345 |
|
Sundry payables |
2.7.2 |
— |
— |
(5) |
243 |
238 |
270 |
|
Total |
|
— |
— |
27 |
473 |
501 |
615 |
2.7.1. Current payables
|
(EUR million) |
||||||
|
|
Eighth EDF |
Ninth EDF |
10th EDF |
11th EDF |
31.12.2021 |
31.12.2020 |
|
Suppliers |
— |
— |
25 |
47 |
72 |
141 |
|
Member States |
— |
— |
— |
3 |
3 |
— |
|
Third states |
— |
— |
— |
158 |
158 |
189 |
|
Public bodies |
— |
— |
(11) |
61 |
51 |
100 |
|
Institutions and Agencies |
— |
— |
— |
4 |
4 |
— |
|
Other current payables |
— |
— |
18 |
(44) |
(25) |
(85) |
|
Total |
— |
— |
33 |
230 |
263 |
345 |
Payables largely comprise cost statements received by the EDF in respect to grants provided to the beneficiaries. They are recorded at the moment when the cost statement is received and for the full amount of the cost statement. Following an eligibility check only the eligible amounts are paid to the beneficiaries. At the year-end the outstanding cost claims are analysed and the estimated eligible amounts related to those cost claims are recognised in the statement of financial performance. The estimated non-eligible amounts are shown under other current payables.
Included under payables to third states is an amount of EUR 60 million of budget support to Ethiopia, which has been suspended since November 2020 due to the situation in the country.
The decrease in payables in particular to suppliers and third states is due to a decrease in invoices that have not yet been validated and paid before year-end.
2.7.2. Sundry payables
|
(EUR million) |
|||||||
|
|
Note |
Eighth EDF |
Ninth EDF |
10th EDF |
11th EDF |
31.12.2021 |
31.12.2020 |
|
Co-financing payables |
2.6.2 |
— |
— |
(3) |
38 |
35 |
42 |
|
Deferred capital contributions |
2.7.2.1 |
— |
— |
— |
199 |
199 |
223 |
|
Other sundry payables |
|
— |
— |
(2) |
6 |
4 |
5 |
|
Total |
|
— |
— |
(5) |
243 |
238 |
270 |
2.7.2.1.
An amount of EUR 43 million of deferred capital contributions relate to a refund to Member States from decommitted or unused funds from projects under the Eighth and Ninth EDF (see note 2.10.1). The Member states agreed for the refund to be offset with the contributions from the 11th EDF during the first call for contributions in 2022.
In addition to the refund, an amount of EUR 156 million relate to the first instalment of 2022 paid in advance by the United Kingdom. According to Article 152 of the Withdrawal Agreement, the United Kingdom remains party to the EDF until the closure of the 11th EDF and all previous unclosed EDFs, and assumes the same obligations as the Member States in this respect (see note 2.10.1).
2.8. ACCRUED CHARGES
Accruals are liabilities to pay for goods or services that have been received or supplied but — unlike payables — have not yet been invoiced or formally agreed with the supplier. The calculation of accruals is based on the open amount of budgetary commitments at year-end. The portion of the estimated accrued charges relating to pre-financing paid has been recorded as a reduction of the pre-financing amounts.
Transactions and events are recognised in the financial statements in the period to which they relate. At year-end, if an invoice is issued but the services have not yet been rendered or the goods have not yet been delivered, the revenue will be deferred and recognised in the subsequent accounting period.
|
(EUR million) |
||||||
|
|
Eighth EDF |
Ninth EDF |
10th EDF |
11th EDF |
31.12.2021 |
31.12.2020 |
|
Accrued charges |
— |
6 |
110 |
891 |
1 007 |
1 526 |
|
Other accruals and deferrals |
— |
— |
— |
1 |
1 |
1 |
|
Total |
— |
6 |
110 |
892 |
1 008 |
1 527 |
Accrued charges comprise estimated operating expenses for ongoing or completed contracts without validated cost claims where the eligible expenses incurred by beneficiaries were estimated using the best available information. The portion of the estimated accrued charges that relates to pre-financing paid has been recorded as a reduction of the pre-financing amounts (see note 2.2 above).
The decrease in accrued charges is mainly driven by the decrease of accrued charges under the 11th EDF (2020: EUR 1 244 million) and 10th EDF (2019: EUR 217 million). This is in line with the lifecycle of the EDF and the underlying number of open contracts: The 11th EDF implementation peaked in 2020 in response to the upcoming sunset clause on 31 December 2020. In addition, due to the challenges faced due to the ongoing COVID-19 pandemic as well as political crises in several areas, implementation of EDF activities was difficult which led to a decrease in the number of individual contracts signed in 2021. As a result, at the end of 2021 there were significantly fewer open contracts for which the charges had to be estimated and accrued than in 2020 (see also note 2.2).
NET ASSETS
2.9. FAIR VALUE RESERVE
|
(EUR million) |
||
|
|
31.12.2021 |
31.12.2020 |
|
Fair value reserve |
— |
5 |
As a result of the revision of EAR 11, the fair value reserve has been transferred to the accumulated surplus/deficit (see note 2.1).
2.10. FUND CAPITAL
The EDF Member States provide contributions to the Fund for the implementation of EDF programmes as laid down in the Internal Agreement of each EDF. According to the applicable legal basis the capital calls, i.e. the requests for funding for a given year N, are decided by a Council Decision in year N–1, with the funds to be received clearly assigned to specified future periods.
The contributions meet the criteria of contribution from owners (EAR 1) and are thus treated as fund capital in the EDF financial statements. The fund capital represents the total amount of contributions to be received from the EDF member states. As the uncalled fund capital is deducted from the total fund capital (see Statement of Changes in Net Assets), only the called fund capital is recognised in the Balance Sheet.
As the agreed contributions are assigned to specified reporting periods, with the EDF’s legal claim against the EDF member states arising only in these periods, any amounts received in advance are recognised as deferred capital contributions under Payables rather than as called capital.
2.10.1. Called fund capital — active EDFs
|
(EUR million) |
|||||
|
|
Eighth EDF |
Ninth EDF |
10th EDF |
11th EDF |
Total |
|
Fund capital |
12 164 |
10 550 |
20 960 |
29 367 |
73 041 |
|
Uncalled fund capital |
— |
(15) |
— |
(14 040 ) |
(14 055 ) |
|
Called fund capital 31.12.2020 |
12 164 |
10 535 |
20 960 |
15 327 |
58 986 |
|
Fund capital |
12 164 |
10 507 |
20 960 |
29 367 |
72 998 |
|
Uncalled fund capital |
— |
(15) |
— |
(10 340 ) |
(10 355 ) |
|
Called fund capital 31.12.2021 |
12 164 |
10 492 |
20 960 |
19 027 |
62 643 |
The uncalled funds represent amounts not yet called from Member States. The called fund capital represents the contributions, which have been called by the EDF and transferred to the treasury accounts by the Member States (see below 2.10.2.).
By means of Council Decision (EU) 2021/1941 (7) the Member States’ contributions set out in the Internal Agreements of the Eighth and Ninth EDF were reduced accordingly for an amount of EUR 43 million from funds decommitted under the Eighth and the Ninth EDF. As the funds decommitted under the Eighth EDF have been already transferred to the other EDFs, EUR 43 million was deducted from the capital of the Ninth EDF. Refunds arising from this reduction have been compensated against additional call for funds under the 11th EDF. In fact, the refund will be used against the first instalment of 2022 which explains the EUR 43 million of deferred capital (see note 2.7.2.1).
While the United Kingdom remains party to the EDF until the closure of all programmes, in accordance with Article 153 of the Withdrawal Agreement, its share of uncommitted and decommitted funds from the Eighth, Ninth and 10th EDF cannot be reused.
2.10.2. Called and uncalled fund capital by Member States and the UK
|
(EUR million) |
||||
|
Contributions 11th EDF |
% |
Uncalled capital 31.12.2020 |
Capital called in 2021 |
Uncalled capital 31.12.2021 |
|
Austria |
2,40 |
337 |
(89) |
248 |
|
Belgium |
3,25 |
456 |
(120) |
336 |
|
Bulgaria |
0,22 |
31 |
(8) |
23 |
|
Croatia |
0,23 |
32 |
(8) |
23 |
|
Cyprus |
0,11 |
16 |
(4) |
12 |
|
Czechia |
0,80 |
112 |
(30) |
83 |
|
Denmark |
1,98 |
278 |
(73) |
205 |
|
Estonia |
0,09 |
12 |
(3) |
9 |
|
Finland |
1,51 |
212 |
(56) |
156 |
|
France |
17,81 |
2 501 |
(659) |
1 842 |
|
Germany |
20,58 |
2 889 |
(761) |
2 128 |
|
Greece |
1,51 |
212 |
(56) |
156 |
|
Hungary |
0,61 |
86 |
(23) |
64 |
|
Ireland |
0,94 |
132 |
(35) |
97 |
|
Italy |
12,53 |
1 759 |
(464) |
1 296 |
|
Latvia |
0,12 |
16 |
(4) |
12 |
|
Lithuania |
0,18 |
25 |
(7) |
19 |
|
Luxembourg |
0,26 |
36 |
(9) |
26 |
|
Malta |
0,04 |
5 |
(1) |
4 |
|
Netherlands |
4,78 |
671 |
(177) |
494 |
|
Poland |
2,01 |
282 |
(74) |
208 |
|
Portugal |
1,20 |
168 |
(44) |
124 |
|
Romania |
0,72 |
101 |
(27) |
74 |
|
Slovakia |
0,38 |
53 |
(14) |
39 |
|
Slovenia |
0,22 |
32 |
(8) |
23 |
|
Spain |
7,93 |
1 114 |
(294) |
820 |
|
Sweden |
2,94 |
413 |
(109) |
304 |
|
United Kingdom |
14,68 |
2 061 |
(543) |
1 518 |
|
Total |
100,00 |
14 040 |
(3 700 ) |
10 340 |
Since the capital of the Eighth, Ninth and 10th EDF has been called up and received in its entirety in previous years, in 2021, an amount of EUR 3 700 million has been called which relates entirely to the 11th EDF.
2.10.3. Called fund capital from closed EDFs carried forward
|
(EUR million) |
||||||
|
|
Eighth EDF |
Ninth EDF |
10th EDF |
11th EDF |
31.12.2021 |
31.12.2020 |
|
Funds transferred from closed EDFs |
627 |
1 625 |
— |
— |
2 252 |
2 252 |
This heading includes the resources transferred from closed EDFs to the Eighth and Ninth EDFs.
2.10.4. Called fund capital transfers between active EDFs
|
(EUR million) |
|||||
|
|
Eighth EDF |
Ninth EDF |
10th EDF |
11th EDF |
Total |
|
Balance at 31.12.2019 |
(2 510 ) |
2 109 |
265 |
136 |
— |
|
Transfer of decommitted amounts to the 10th EDF performance reserve from previous EDFs |
(2) |
(69) |
71 |
— |
— |
|
Transfer of decommitted amounts to the 11th EDF performance reserve from previous EDFs |
— |
— |
(147) |
147 |
— |
|
Balance at 31.12.2020 |
(2 512 ) |
2 041 |
188 |
283 |
— |
|
Transfer of decommitted amounts to the 10th EDF performance reserve from previous EDFs |
— |
(23) |
23 |
— |
— |
|
Transfer of decommitted amounts to the 11th EDF performance reserve from previous EDFs |
— |
— |
(110) |
110 |
— |
|
Balance at 31.12.2021 |
(2 512 ) |
2 018 |
101 |
394 |
— |
This heading includes the resources transferred between the active EDFs.
Since the entry into force of the Cotonou Agreement, all the unspent funds in previous active EDFs are transferred to the most recently opened EDF after decommitment. The resources transferred from other EDFs increase the appropriations of the receiving fund and reduce the appropriations of the fund of origin. Funds transferred to the performance reserve of the 10th and 11th EDFs can be committed only under specific conditions set out in the Internal Agreements.
3. NOTES TO THE STATEMENT OF FINANCIAL PERFORMANCE
REVENUE
|
(EUR million) |
|||
|
|
Note |
2021 |
2020 |
|
Revenue from non-exchange transactions |
3.1 |
27 |
92 |
|
Revenue from exchange transactions |
3.2 |
48 |
43 |
|
Total |
|
75 |
135 |
3.1. REVENUE FROM NON-EXCHANGE TRANSACTIONS
Revenue from non-exchange transactions relates to transactions where the transferor provides resources to the recipient entity without the recipient entity providing approximately equal value directly in exchange. The heading mainly includes amounts received from the Commission during the year and recoveries of operational expenses.
|
(EUR million) |
|||||||
|
|
Note |
Eighth EDF |
Ninth EDF |
10th EDF |
11th EDF |
2021 |
2020 |
|
Recovery of expenses |
|
— |
1 |
— |
7 |
8 |
39 |
|
Co-financing revenue |
3.1.1 |
— |
— |
— |
19 |
19 |
53 |
|
Total |
|
— |
1 |
— |
26 |
27 |
92 |
The overall revenue from non-exchange transactions decreased by EUR 65 million returning to a normal level following a significant increase in 2020 (2019: EUR 28 million). Year 2020, saw augmented activities across the EDF in response to the upcoming sunset clause on 31 December 2020 and led to an increase in the co-financing revenue.
The decrease of the recovery from expenses can be largely explained by the fewer number of recovery orders issued in 2021 compared to 2020.
Non-exchange revenue can be broken down by management mode as follows:
|
(EUR million) |
||||
|
|
2021 |
2020 |
||
|
Direct Management |
|
|
||
|
Implemented by: |
|
|
||
|
1 |
2 |
||
|
7 |
11 |
||
|
|
8 |
13 |
||
|
Indirect Management |
|
|
||
|
Implemented by: |
|
|
||
|
27 |
42 |
||
|
(13) |
13 |
||
|
3 |
17 |
||
|
2 |
7 |
||
|
|
19 |
79 |
||
|
Total |
27 |
92 |
||
3.1.1. Co-financing revenue
The co-financing contributions received fulfil the criteria of revenues from non-exchange transactions under conditions and as such should not affect the statement of financial performance when received. The contributions remain under liabilities (see notes 2.6.2 and 2.7.2) until the conditions attached to the donated funds are met, i.e. eligible expenses are incurred (see note 3.4). The corresponding amount is then recognised in the statement of financial performance as non-exchange revenue from co-financing. Consequently, the effect on the economic result of the year is zero.
3.2. REVENUE FROM EXCHANGE TRANSACTIONS
The revenue from exchange transactions and events relates to following types of transactions: rendering of services; sale of goods; and the use by others of entity assets yielding interest, royalties and dividends.
|
(EUR million) |
||||||
|
|
Eighth EDF |
Ninth EDF |
10th EDF |
11th EDF |
2021 |
2020 |
|
Financial revenue |
— |
— |
(22) |
(4) |
(26) |
6 |
|
Other revenue |
— |
5 |
14 |
55 |
74 |
37 |
|
Total |
— |
5 |
(8) |
51 |
48 |
43 |
The financial revenue is negative because last year’s estimated revenue were higher than the current year estimated amounts. This decrease of the estimates is a combined effect. Firstly, upon further analysis it was concluded that interest from the Africa EU Infrastructure project (EUR 18 million), included in the accrued financial revenue last year, forms part of the contributions to the trust fund and is not due to the EDF. Secondly, the accrued interest on late payments of recovery orders has decreased by EUR 8 million compared to last year.
Other revenue relates mainly to foreign exchange gains. The corresponding foreign exchange losses are recorded under other expenses (see note 3.6).
EXPENSES
Included under this heading are expenses incurred in relation to operational activities.
3.3. AID INSTRUMENTS
|
(EUR million) |
||||||
|
|
Eighth EDF |
Ninth EDF |
10th EDF |
11th EDF |
2021 |
2020 |
|
Programmable aid |
— |
(4) |
(19) |
1 268 |
1 244 |
2 889 |
|
Macro-economic support |
— |
7 |
— |
— |
7 |
(8) |
|
Sectoral policy |
— |
(2) |
— |
(2) |
(5) |
3 |
|
Intra-ACP projects |
— |
— |
228 |
724 |
951 |
1 019 |
|
Emergency aid |
— |
6 |
7 |
(6) |
6 |
19 |
|
Other aid programmes |
— |
— |
— |
(1) |
(1) |
— |
|
Institutional support |
— |
— |
(1) |
15 |
14 |
13 |
|
Contributions to Trust Funds |
— |
— |
— |
646 |
646 |
673 |
|
Total |
— |
7 |
214 |
2 644 |
2 864 |
4 607 |
The EDF operational expenditure covers various aid instruments and takes different forms, depending on how the money is paid out and managed.
In 2021, operational expenditure decreased significantly by EUR 1 743 million mainly driven by the decrease in expenses under the 11th EDF (EUR 4 179 million in 2020 to EUR 2 644 million in 2021) coupled with the decrease under the 10th EDF (EUR 462 million in 2020 to EUR 214 million in 2021). This decrease is a combined result of the COVID-19 pandemic and political crises in several areas which slowed down and hampered implementation during the year in particular in the delegations (see note 2.4). In addition, expenses in 2020 were exceptionally high for the 11th EDF: the upcoming sunset clause on 31 December 2021, led to a heightened number of contracts and payments made.
The changes in expenses under the 10th EDF are in line with the lifecycle of the EDF and is also related to the evolution of the number of open contracts. Many contracts were completed and closed under the 10th and previous EDFs in 2021, which resulted in less expenses incurred under those EDFs. In fact, the number of open contracts for the 10th EDF at year-end were 33 % lower than in 2020.
Under the 11th EDF, the decrease in expenses comes mainly from the decrease in three areas:
|
(1) |
Programmable aid (EUR 2 889 million in 2020 v EUR 1 244 million in 2021); |
|
(2) |
Intra-ACP projects (EUR 1 019 million in 2020 v EUR 951 million in 2021); and |
|
(3) |
The contributions to the Trust funds (EUR 673 million in 2020 v EUR 646 million in 2021). |
3.4. CO-FINANCING EXPENSES
|
(EUR million) |
||||||
|
|
Eighth EDF |
Ninth EDF |
10th EDF |
11th EDF |
2021 |
2020 |
|
Co-financing |
— |
— |
— |
19 |
19 |
53 |
Included under this heading are the expenses incurred on co-financing projects in 2021. It should be noted that the expenses incurred include estimated amounts related to the cut-off exercise (and consequently reversals of the estimated amounts related to last year).
As indicated above, 2020 marked an exceptional year due to the sunset clause being reached which led to a heightened level of implementation. The amount of co-financing in 2021 corresponds more to the usual level of co-financing (2019: EUR 14 million) (see note 2.3).
In line with the accounting rules on co-financing, the incurred amounts did not have any impact on the result of the year because they were recognised both in the co-financing expenses and in the co-financing revenue (note 3.1.1).
Aid instruments and co-financing expenses by management type
|
(EUR million) |
||||
|
|
2021 |
2020 |
||
|
Direct Management |
|
|
||
|
Implemented by: |
|
|
||
|
168 |
168 |
||
|
4 |
14 |
||
|
(515) |
19 |
||
|
658 |
1 969 |
||
|
|
315 |
2 170 |
||
|
Indirect Management |
|
|
||
|
Implemented by: |
|
|
||
|
113 |
(67) |
||
|
1 053 |
1 268 |
||
|
204 |
243 |
||
|
212 |
248 |
||
|
983 |
795 |
||
|
3 |
2 |
||
|
|
2 568 |
2 490 |
||
|
Total |
2 883 |
4 660 |
||
3.5. FINANCE COSTS
|
(EUR million) |
||||||
|
|
Eighth EDF |
Ninth EDF |
10th EDF |
11th EDF |
2021 |
2020 |
|
Net impairment losses on loans and receivables |
— |
— |
— |
1 |
1 |
— |
|
Loss on financial assets or liabilities at FVSD |
— |
— |
— |
1 |
1 |
— |
|
Write-down of recoverables |
— |
(7) |
23 |
1 |
17 |
21 |
|
Total |
— |
(7) |
23 |
3 |
20 |
21 |
At 31 December 2021, the net unrealised impairment loss on loans was EUR 1 million.
The EUR 1 million of financial expenses for financial assets at FVSD relate mainly to exchange differences, interest and fair value changes in particular for the ABC FUND.
The negative amount under the 9th EDF for the heading write-down of recoverables is mainly due to the reversal of last year’s closure bookings. In 2020 the estimated expenses on irrecoverable amounts arising from aging recovery orders (over 2 years), bankruptcies and waivers were higher than that in 2021.
3.6. OTHER EXPENSES
Included under this heading are expenses of administrative nature such as external non-IT services, operating leasing expenses, communications and publications, training costs, etc.
|
(EUR million) |
||||||
|
|
Eighth EDF |
Ninth EDF |
10th EDF |
11th EDF |
2021 |
2020 |
|
Administrative and IT expenses |
— |
— |
4 |
94 |
98 |
120 |
|
Realised losses on trade debtors |
— |
6 |
0 |
0 |
7 |
4 |
|
Exchange losses |
— |
5 |
11 |
25 |
41 |
72 |
|
Total |
— |
11 |
16 |
119 |
145 |
197 |
The heading Administrative and IT expenses includes amounts that are based on the EDF internal agreement with the Commission to cover the administrative expenditure incurred by both the Headquarters and the Delegations in respect to managing the EDF programmes. The so-called ‘support expenditure’ relates mainly to expenses for preparation, follow-up, monitoring, and evaluation of projects as well as expenses for computer networks, technical assistance, financial management and forecasting, etc.
The decrease under this heading is a combined effect of the decrease in administrative and IT expenses (2020: EUR 120 million) and the decrease of expenses relating to exchange losses (2020: EUR 72 million).
The significant decrease of foreign exchange losses is mostly due to the decrease in unrealised losses from the revaluation of balances held in currencies at 31 December 2021.
4. CONTINGENT ASSETS & LIABILITIES AND OTHER SIGNIFICANT DISCLOSURES
4.1. CONTINGENT ASSETS
Contingent assets are possible assets that arise from past events, and whose existence will only be confirmed by the occurrence or non-occurrence of one or more uncertain future events that are not wholly within the control of the entity.
|
(EUR million) |
||||||
|
|
Eighth EDF |
Ninth EDF |
10th EDF |
11th EDF |
31.12.2021 |
31.12.2020 |
|
Pre-financing guarantees |
— |
— |
3 |
— |
44 |
49 |
|
Performance guarantees |
— |
7 |
3 |
— |
11 |
12 |
|
Retention guarantees |
— |
5 |
3 |
— |
9 |
9 |
|
Total |
— |
13 |
6 |
— |
20 |
21 |
Pre-financing guarantees are requested in certain cases from beneficiaries that are not Member States, when making advance payments.
Performance guarantees are requested to ensure that beneficiaries of EDF funding meet the obligations of their contracts with the EDF.
Retention guarantees concern only works contracts. Typically, 10 % of the interim payments to beneficiaries are withheld to ensure that the contractors fulfil their obligations. These withheld amounts are reflected as amounts payable. Subject to the approval of the contracting authority, the contractor may instead submit a retention guarantee which replaces the amounts withheld on interim payments. These received guarantees are disclosed as contingent assets.
For contracts managed under indirect management, the guarantees belong to a contracting authority other than the EDF and they are therefore not disclosed by the EDF (see note 2.2.4).
4.2. CONTINGENT LIABILITIES
Contingent liabilities are either possible obligations that arise from past events and whose existence will only be confirmed by the occurrence or non-occurrence of one or more uncertain future events not wholly within the control of the entity, or present obligations arising from past events where the outflow of resources is not probable or the amount cannot be measured reliably.
4.2.1. Guarantees given
|
(EUR million) |
||||||
|
|
Eighth EDF |
Ninth EDF |
10th EDF |
11th EDF |
31.12.2021 |
31.12.2020 |
|
Guarantees given |
— |
— |
— |
(7) |
(7) |
(3) |
The above table shows the extent of the exposure of the EDF to possible future payments linked to guarantees given to the EIB group or other financial institutions. The amounts are presented net of financial provisions or financial liabilities recognised for those programmes.
The amount of EUR 7 million relates entirely to a guarantee under the Euritz financial instrument.
4.3. OTHER SIGNIFICANT DISCLOSURES
4.3.1. Outstanding commitments not yet expensed
The amount disclosed below is the budgetary RAL (‘Reste à Liquider’) less related amounts that have been included as expenses in the statement of financial performance. The budgetary RAL is an amount representing the commitments for which payments and/or de-commitments have not yet been made. This is the normal consequence of the existence of multiannual programmes.
|
(EUR million) |
||||||
|
|
Eighth EDF |
Ninth EDF |
10th EDF |
11th EDF |
31.12.2021 |
31.12.2020 |
|
Outstanding commitments not yet expensed |
— |
21 |
408 |
5 926 |
6 355 |
7 224 |
The decrease in the RAL is largely driven by the decrease in budgetary RAL which totalled EUR 7 993 million (2020: EUR 9 286 million). This decrease is mostly caused by the fewer number of individual commitments signed during the year as a result of new challenges faced which hampered implementation in particular in the delegations (see note 2.2).
5. FINANCIAL RISK MANAGEMENT
The following disclosures with regard to the financial risk management of the EDF relate to the treasury operations carried out by the Commission on behalf of the EDF in order to implement its resources.
5.1. RISK MANAGEMENT POLICIES AND HEDGING ACTIVITIES
The rules and principles for the management of the treasury operations are laid down in the 11th EDF Financial Regulation and in the Internal Agreement.
As a result of the above regulation, the following main principles apply:
|
(a) |
The EDF contributions are paid by Member States in special accounts opened with the bank of issue of each Member State or the financial institution designated by it. The amounts of the contributions shall remain in those special accounts until the payments of EDF need to be made. |
|
(b) |
EDF contributions are paid by Member States in EUR, while the EDF’s payments are denominated in EUR and in other currencies. |
|
(c) |
Bank accounts opened by the Commission on behalf of the EDF may not be overdrawn. |
In addition to the special accounts, other bank accounts are opened by the Commission in the name of the EDF, with financial institutions (central banks and commercial banks), for the purpose of executing payments and receiving receipts other than the Member State contributions to the budget.
Treasury and payment operations are highly automated and rely on modern information systems. Specific procedures are applied to guarantee system security and to ensure segregation of duties in line with the Financial Regulation, the Commission’s internal control standards, and audit principles.
A written set of guidelines and procedures regulate the management of the treasury and payment operations with the objective of limiting operational and financial risk and ensuring an adequate level of control. They cover the different areas of operation, and compliance with the guidelines and procedures is checked regularly.
5.2. CURRENCY RISK
Exposure of the EDF to currency risk at year-end — net position
|
(EUR million) |
||||||||||
|
|
31.12.2021 |
31.12.2020 |
||||||||
|
USD |
DKK |
EUR |
Other |
Total |
USD |
DKK |
EUR |
Other |
Total |
|
|
Financial assets |
|
|
|
|
|
|
|
|
|
|
|
Available for Sale Financial Assets |
— |
— |
— |
— |
— |
2 |
|
31 |
— |
33 |
|
Financial assets at FVSD (*2) |
8 |
— |
30 |
— |
39 |
— |
|
— |
— |
— |
|
Receivables (*3) |
— |
— |
8 |
— |
8 |
65 |
— |
69 |
6 |
140 |
|
Cash and cash equivalents |
3 |
— |
991 |
— |
994 |
2 |
— |
726 |
— |
728 |
|
|
11 |
— |
1 029 |
— |
1 040 |
69 |
— |
826 |
6 |
901 |
|
Financial liabilities |
|
|
|
|
|
|
|
|
|
|
|
Payables (*4) |
— |
— |
— |
— |
— |
(16) |
(6) |
(605) |
10 |
(617) |
|
|
— |
— |
— |
— |
— |
(16) |
(6) |
(605) |
10 |
(617) |
|
Total |
11 |
— |
1 029 |
— |
1 040 |
53 |
(6) |
221 |
16 |
284 |
5.3. INTEREST RATE RISK
The EDF does not borrow money and consequently it is not exposed to interest rate risk.
Interest is accrued on balances it holds in its different banks accounts. The Commission, on behalf of the EDF, has therefore put in place measures to ensure that interest earned regularly reflects market interest rates as well as their possible fluctuation.
Contributions to the EDF budget are credited by each Member State to a special account opened with the financial institution designed by it. As the remuneration applied to some of these accounts may currently be negative, cash management procedures are in place to minimise balances kept on the accounts concerned. In addition, in accordance with Council Regulation (EU) 2016/888 (8), any negative remuneration on these accounts is borne by the relevant Member State.
Overnight balances held in commercial bank accounts are remunerated on a daily basis. The remuneration of balances on such accounts is based on variable market rates to which a contractual margin (positive or negative) is applied. For most of the accounts, the interest calculation is linked to a market reference rate and is adjusted to reflect any fluctuations of this rate. As a result, no risk is taken by the EDF that its balances could be remunerated at rates lower than market rates.
5.4. CREDIT RISK (COUNTERPARTY RISK)
Maximum credit risk exposure
For financial assets, the reported amounts are net carrying amounts and represent the EDFs’ exposure to credit risk at the end of the reporting period.
|
(EUR million) |
|
|
|
31.12.2021 |
|
Financial assets |
|
|
Loans |
1 |
|
Cash and cash equivalents |
994 |
|
Exchange receivables (*5) |
8 |
|
Guarantees given |
|
|
Financial guarantee contracts |
8 |
|
Total at 31.12.2021 |
1 011 |
Financial Instrument Loans: credit quality
|
(EUR million) |
|||||
|
31.12.2021 |
|||||
|
|
Stage 1 |
Stage 2 |
Stage 3 |
POCI |
Total |
|
Credit rating |
|
|
|
|
|
|
Premium and high grade |
— |
— |
— |
— |
— |
|
Upper medium grade |
— |
— |
— |
— |
— |
|
Lower medium grade |
— |
— |
— |
— |
— |
|
Non-investment grade and default grade |
— |
— |
3 |
— |
3 |
|
Gross carrying amount |
— |
— |
3 |
— |
3 |
|
Minus loss allowance |
— |
— |
2 |
— |
2 |
|
Net carrying amount |
— |
— |
1 |
— |
1 |
Cash and cash equivalents: credit quality
|
(EUR million) |
|
|
|
31.12.2021 |
|
Credit rating |
|
|
Premium and high grade |
751 |
|
Upper medium grade |
241 |
|
Lower medium grade |
2 |
|
Non-investment grade and default grade |
— |
|
Gross carrying amount |
994 |
|
Minus loss allowance |
— |
|
Net carrying amount |
994 |
Receivables: credit quality
|
(EUR million) |
||||||
|
31.12.2021 |
||||||
|
|
Not due |
Past due |
Past due |
Past due |
Past due |
Total |
|
0–30 days |
31–90 days |
91 days –1 year |
> 1 year |
|||
|
Gross carrying amount |
8 |
— |
— |
— |
— |
8 |
|
Minus loss allowance |
— |
— |
— |
— |
— |
— |
|
Net carrying amount |
8 |
— |
— |
— |
— |
8 |
Based on the analysis of the exchange receivables and for the purposes of the transition to the updated EAR 11, there is no impairment adjustment to book on 1.1.2021 for the receivables recognised in the EDF annual accounts of 2021.
Financial assets at FVSD: credit quality
In 2021 the financial assets at FVSD included in these financial statements relate to equity investments that are not subject to credit risk (see note 2.1).
Credit risk disclosures published in the 2020 annual accounts
For information, the disclosures made for credit risk in the 2020 annual accounts were as follows:
Financial assets that are neither past due nor impaired
|
(EUR million) |
|||||
|
|
Total |
Neither past due nor impaired |
Past due but not impaired |
||
|
< 1 year |
1–5 years |
> 5 years |
|||
|
Exchange receivables and non-exchange recoverables |
140 |
124 |
7 |
9 |
— |
|
Total at 31.12.2020 |
140 |
124 |
7 |
9 |
— |
Financial assets by risk category
|
(EUR million) |
|||
|
|
31.12.2020 |
||
|
Receivables |
Cash |
Total |
|
|
Counterparties with external credit rating |
|
|
|
|
Prime and high grade |
9 |
372 |
381 |
|
Upper medium grade |
— |
211 |
211 |
|
Lower medium grade |
— |
145 |
145 |
|
Non- investment grade |
— |
— |
— |
|
|
9 |
728 |
737 |
|
Counterparties without external credit rating |
|
|
|
|
Group 1 (debtors without defaults in the past) |
131 |
— |
131 |
|
Group 2 (debtors with defaults in the past) |
— |
— |
— |
|
Total |
131 |
— |
131 |
|
Total |
140 |
728 |
868 |
5.5. LIQUIDITY RISK
Maturity analysis of financial liabilities by remaining contractual maturity
The finance liabilities and payables under this heading are disclosed by the carrying amounts from the Balance Sheet.
|
(EUR million) |
||||
|
|
< 1 year |
1–5 years |
> 5 years |
Total |
|
Financial liabilities at 31.12.2021 |
501 |
6 |
— |
508 |
|
Financial liabilities at 31.12.2020 |
615 |
2 |
— |
617 |
Budget principles applied to the EDF ensure that overall cash resources for the budgetary period are always sufficient for the execution of payments. Indeed the total Member States’ contributions equal the overall amount of payment appropriations for the relevant budgetary period.
Member States’ contributions to EDF, however, are paid in three instalments per year, while payments are subject to seasonality.
In order to ensure that treasury resources are always sufficient to cover the payments to be executed in any given month, information on the treasury situation is regularly exchanged between the Commission’s treasury and the relevant spending departments.
In addition to the above, in the context of the EDF’s treasury operations, automated cash management tools ensure that sufficient liquidity is available on each of the EDF's bank accounts, on a daily basis.
6. RELATED PARTY DISCLOSURES
The related parties of the EDF are the Bêkou and Africa EU Trust Funds and the European Commission. Transactions between these entities take place as part of the normal operations of the EDF and as this is the case, no specific disclosure requirements are necessary for these transactions in accordance with the EU accounting rules.
The EDF has no separate management since it is managed by the Commission. The entitlements of the key management of the EU, including the Commission, have been disclosed in the consolidated annual accounts of the European Union under heading 7.2 ‘Key management entitlements’.
7. EVENTS AFTER THE BALANCE SHEET DATE
Ukraine
In accordance with EU accounting rule 19, Events after Reporting Date, the war in Ukraine, that began in February 2022, is a non-adjusting event, thus not requiring any adjustments to the figures reported in these financial statements at 31 December 2021. For subsequent reporting periods, the war may affect the recognition and measurement of some assets and liabilities on the balance sheet and also of some revenue and expenses recognised in the statement of financial performance. Based on the facts and circumstances at the time of preparation of these financial statements, in particular the evolving situation, the financial effect of the war in Ukraine on the EDF cannot be reliably estimated.
At the date of transmission of these accounts, no other material issues had come to the attention of or were reported to the Accounting Officer of the EDF that would require separate disclosure under this section. The annual accounts and related notes were prepared using the most recently available information and this is reflected in the information presented above.
8. RECONCILIATION OF ECONOMIC RESULT AND BUDGET RESULT
The economic result of the year is calculated based on accrual accounting principles. The budget result is however based on cash accounting rules. As the economic result and the budget result both cover the same underlying operational transactions, it is a useful control to ensure that they are reconcilable. The table below shows this reconciliation, highlighting the key reconciling amounts, split between revenue and expenditure items. The notes to the table provide additional information on the nature of the key reconciling items.
|
(EUR million) |
||
|
|
2021 |
2020 |
|
ECONOMIC RESULT OF THE YEAR |
(2 974 ) |
(4 744 ) |
|
Revenue |
|
|
|
Entitlements not affecting the budget result |
— |
(2) |
|
Entitlements established in current year but not yet collected |
(6) |
(23) |
|
Entitlements established in previous years and collected in current year |
20 |
13 |
|
Revenue decreasing consumption |
13 |
61 |
|
Accrued revenue (net) |
(69) |
(33) |
|
Other |
— |
— |
|
Expenses |
|
|
|
Expenses of the current year not yet paid |
111 |
119 |
|
Expenses of previous years paid in the current year |
(741) |
(817) |
|
Net effect of pre-financing |
(295) |
(281) |
|
Accrued expenses (net) |
539 |
1 102 |
|
BUDGET RESULT OF THE YEAR |
(3 401 ) |
(4 604 ) |
8.1. RECONCILING ITEMS — REVENUE
The budgetary revenue of a financial year corresponds to the revenue collected from entitlements established in the course of the year and amounts collected from entitlements established in previous years.
The entitlements not affecting the budget result are recorded in the economic result but from a budgetary perspective cannot be considered as revenues as the cashed amount is transferred to reserves and cannot be recommitted without a Council decision.
The entitlements established in the current year but not yet collected are to be deducted from the economic result for reconciliation purposes, as they do not form part of budgetary revenue. On the contrary, the entitlements established in previous years and collected in the current year must be added to the economic result for reconciliation purposes.
The net effect of pre-financing line refers to clearing of pre-financing with amounts recovered from the beneficiaries. These cash receipts represent budgetary revenue but have no impact on the economic result and must be thus added for reconciliation purposes.
The net accrued revenue mainly consists of accruals made for year-end cut-off purposes. Only the net effect, i.e. the accrued revenue of the current year less the reversal of accrued revenue of the previous year, is taken into consideration.
8.2. RECONCILING ITEMS — EXPENDITURE
Expenses of the current year not yet paid are to be added for reconciliation purposes as they are included in the economic result but do not form part of budgetary expenditure. On the contrary, the expenses of previous years paid in the current year must be deducted from the economic result for reconciliation purposes as they are part of the current year's budgetary expenditure but have either no effect on the economic result or they decrease the expenses in case of corrections.
The cash receipts from payment cancellations do not affect the economic result whereas they affect the budget result.
The net effect of pre-financing is the combination of the new pre-financing amounts paid in the current year (recognised as budgetary expenditure of the year) and the clearing of pre-financing paid in the current year or previous years through the acceptance of eligible costs. The latter represents an expense in accrual terms but not in the budgetary accounts since the payment of the initial pre-financing had already been considered as a budgetary expenditure at the time of its payment.
The net accrued expenses mainly consist of accruals made for year-end cut-off purposes, i.e. eligible expenses incurred by beneficiaries of EDF funds but not yet reported to the EDF. Only the net effect, i.e. the accrued expenses of the current year less the reversal of accrued expenses of the previous year, is taken into consideration.
FINANCIAL STATEMENTS OF THE EU TRUST FUNDS CONSOLIDATED IN EDF
FINANCIAL STATEMENTS OF THE BÊKOU EU TRUST FUND 2021 (9)
BACKGROUND INFORMATION ON THE BÊKOU EU TRUST FUND
General background on Union Trust Funds
Establishment
In accordance with Articles 234 and 235 of the Financial Regulation applicable to the general budget of the Union (EU FR) (10) and Article 35 of the Financial Regulation applicable to the 11th European Development Fund (EDF FR) (11), the European Commission may establish Union trust funds for external actions (‘EU trust funds’). The Union trust funds are constituted under an agreement concluded with other donors for emergency and post-emergency actions necessary to react to a crisis, or for thematic actions.
Union trust funds are established by the European Commission by a decision after consultation or approval of the European Parliament and the Council. This decision includes the constitutive agreement with other donors.
Union trust funds are only established and implemented subject to the following conditions:
|
— |
There is added value of the Union intervention: the objectives of Union trust funds, in particular by reason of their scale or potential effects, may be better achieved at Union level than at national level and the use of the existing financing instruments would not be sufficient to achieve policy objectives of the Union, |
|
— |
Union trust funds bring clear political visibility for the Union and managerial advantages as well as better control by the Union of risks and disbursements of the Union and other donors’ contributions, |
|
— |
Union trust funds do not duplicate other existing funding channels or similar instruments without providing any additionality, |
|
— |
The objectives of Union trust funds are aligned with the objectives of the Union instrument or budgetary item from which they are funded. |
Current EU Trust Funds
To date, the Commission has set up four EUTFs:
|
— |
The EUTF BÊKOU, whose objective is to support all aspects of the Central African Republic's exit from crisis and its reconstruction efforts. Established on 15 July 2014, |
|
— |
The EUTF MADAD, a European Union Regional Trust Fund in response to the Syrian crisis. Established on 15 December 2014, |
|
— |
The EUTF AFRICA; a European Union Emergency Trust Fund for stability and addressing root causes of irregular migration and displaced persons in Africa. Established on 12 November 2015, |
|
— |
The EUTF COLOMBIA; to support the implementation of the peace agreement in the early recovery and stabilisation post-conflict. Established on 12 December 2016. |
Mission
The EUTF Bêkou was established with the aim of promoting the stabilisation and reconstruction of the Central African Republic (CAR). Its main objective, as set out in the Constitutive Agreement, is ‘to provide consistent, targeted aid for the resilience of vulnerable groups and support for all aspects of the Central African Republic’s exit from the crisis and reconstruction, to coordinate actions over the short, medium and long term and to help neighbouring countries cope with the consequences of the crisis’.
Main operational activities
The Union trust fund pools together resources from different donors to finance programmes on the basis of agreed objectives. Since its creation in July 2014, the EUTF Bêkou has adopted 22 programmes and has reached more than 2,5 million beneficiaries. The programmes are to assist the Central African Republic (CAR) and its population in the aftermath of the 2013 crisis. More specifically, the EUTF Bêkou aims to ensure access to basic services (mainly health, water and sanitation), support economic recovery and job creation, and promote social cohesion and reconciliation.
Governance
The management of the EUTF Bêkou is ensured by the European Commission, which also acts as the secretariat of its two governing bodies — the Trust Fund Board and the Operational Board. The Trust Fund Board and the Operational Committee of the EUTF Bêkou are composed of representatives of the donors, of the Commission, of the European Parliament, a representative of the Central African Republic’s authorities and observers. The rules for the composition of the board and its internal rules are laid down in the constitutive agreement of the Union trust fund.
The main task of the Board is to establish and review the overall strategy of the trust fund. The Operational Board is responsible for the selection of the actions financed by the Fund and supervises their implementation. It also approves the annual accounts and the annual reports on the activities financed by the trust fund.
Sources of financing
The EUTF Bêkou is financed through contributions from donors.
Annual accounts
Basis for preparation
The legal framework and the deadlines for the preparation of the annual accounts are set by the ‘Agreement establishing the European Union trust fund for the Central African Republic, “The Bêkou EU Trust Fund”, and its internal rules’ (‘Constitutive Agreement’). As per this Constitutive Agreement, the annual accounts are prepared in accordance with the rules adopted by the Accounting Officer of the Commission (EU Accounting Rules, EAR), which are based on internationally accepted accounting standards for the public sector (IPSAS).
Accounting Officer
The Accounting Officer of the Commission serves as the Accounting Officer of the Union trust funds. The Accounting Officer is responsible for laying down accounting procedures and chart of accounts common to all Union trust funds. The Commission’s Internal Auditor, OLAF and the Court of Auditors exercise the same powers over Union trust funds as they do in respect of other actions carried out by the Commission. The Union trust funds are also subject to an independent external audit every year.
Composition of the annual accounts
The annual accounts cover the period from 1 January to 31 December and comprise the financial statements and the reports on the implementation of the budget. While the financial statements and the complementary notes are prepared on an accrual accounting basis, the budget implementation reports are primarily based on movements of cash.
Process from provisional accounts to discharge
The annual accounts are subject to independent external audit. The provisional annual accounts prepared by the Accounting Officer are transmitted, by 15 February of the following year, to the Operational Committee who then transmits them to the audit company selected by the entity following a tender procedure. Following the audit, the Accounting Officer prepares the final annual accounts and submits them to the Operational Committee for approval (Article 8.3.4(c)).
The annual accounts of the EUTF Bêkou are consolidated in the annual accounts of the European Development Fund.
Operational highlights
Achievements of the year
The EU launched its first ever Trust Fund (EUTF), named Bêkou (meaning hope in the Sango language), in July 2014 to assist the Central African Republic (CAR) and its population in the aftermath of the 2013 crisis. The Bêkou EUTF aims to ensure access to basic services (mainly health, and water and sanitation), support rural development and economic recovery, and promote reconciliation. Since its creation, the Bêkou EUTF has financed 22 programmes and has reached more than half of the country’s population).
Despite the signature of a peace agreement in February 2019, in 2021, insecurity soared and humanitarian needs increased, prompting the UN Office for the Coordination of Humanitarian Affairs (OCHA) to speak of ‘a humanitarian emergency not seen since 2015’. It is in this complex and fragile context that the Bêkou EUTF deployed its comparative advantages of flexibility and adaptability to changing circumstances. Additionally, the Bêkou EUTF remained the main instrument building resilience for both the population and the State, in a true humanitarian — development — peace nexus approach.
Operational highlights of the year 2021:
In December 2020, the second and the last extension of the Bêkou EUTF, until 31 December 2021, was decided. The implementation of Bêkou EUTF projects in 2021 was affected by a sharp deterioration of the security context. Following the organisation of the general elections in December 2020, a coalition of rebel groups contested the results and a violent conflict started spreading over the whole Central African territory. While the situation in Bangui, the capital, remained less dangerous, the conflict caused important security issues and access restrictions for most of the Bêkou partners.
Although the Bêkou EUTF adopted a programme supporting the deployment of civil protection in the CAR in 2020, the security and institutional context was no longer deemed favourable enough to begin the implementation of this programme. Consequently, the EUR 4 million commitments were de-committed and re-engaged towards a programme dedicated to socio-economic development in the South-East part of the country (RELSUDE).
The response to the COVID-19 outbreak continued in 2021. While the pandemic had a less significant impact on the operations of the EUTF this year, the sanitary measures in place coupled with the turmoil caused by the ongoing conflict disrupted the still very fragile institutions, and the country saw a degradation of basic services. Fulfilling its role as bridge between relief and development, the Bêkou EUTF increased its provisions through the programmes Health III and WASH in continued support of vulnerable populations.
By the end of 2021, Bêkou EUTF finalised the commitments and contracting of all received contributions, with the exception of funds reserved for monitoring, evaluation, audit and communication, which can still be contracted until the end of the EUTF implementation period on 31 December 2025. Additional efforts to avoid financing gaps were carried out during the year and the Operational Committee increased resources for the following sectors: Water and Sanitation (EUR 4,5 million), Socio-Economic Recovery RELSUDE (EUR 5,38 million), Reconciliation II (EUR 1,45 million), Health III (EUR 0,34 million) and the technical cooperation facility FATC II (EUR 1,23 million).
Budget and budget implementation
On the revenue side, by the end of 2021, pledges by EUTF contributors amounted to over EUR 310 million. This is an increase of EUR 1,89 million compared to 2020. All contribution certificates were received.
As described, at decision level, EUR 13 million were committed through top-ups to existing actions under the Bêkou EUTF in 2021. They aimed at supporting the sectors of water and sanitation, socio-economic recovery, health, reconciliation and increased funding to the technical cooperation facility of the EUTF. As described in the operational highlights, these top-ups covered strategic sectors for the response to the changes in the socio-economic and security situation in CAR, but also to support partners with a view to consolidate the sustainability of actions in the context of the transition from the Bêkou Trust Fund to the new Global Europe instrument.
In terms of contracts, the Bêkou EUTF signed 7 new contracts and 14 cost extension contract riders in 2021 for a total amount of nearly EUR 35 million. The new contracts are contributing, for instance, to the implementation of technical assistance for the Ministry of Health and the Ministry of Woman Affairs, to the reconciliation and social cohesion programmes through a project dedicated to the Central African youth, to the prevention of gender-based violence, and to the economic development of the country through professionalisation and promotion of entrepreneurship in urban areas.
Last but not least, more than EUR 36 million was paid in 2021; total disbursements have reached nearly EUR 233 million since the creation of the Bêkou EUTF.
Impact of the activities in the financial statements
In the financial statements, the impact of the abovementioned activities is most visible when looking at:
|
— |
Operating expenses: which have decreased by EUR 938 000; however expenses relating to reconstruction relief, urban development and management, vocational training and private sector development increased as funds from civil protection were redirected towards socio-economic development, |
|
— |
Pre-financing: decreased by EUR 5 924 000 as a result of fewer advances being paid out due to lower value of new contracts signed (EUR 36 million of new contracts and contract amendments in 2021 compared to EUR 53 million in 2020), |
|
— |
Financial liabilities: decreased by EUR 14 671 000 mainly due to the fact that the cashed contributions from the donors are not sufficient to cover the yearly payment outflows. This also led to the reduction in cash and cash equivalents. |
BALANCE SHEET
|
EUR '000 |
||
|
|
31.12.2021 |
31.12.2020 |
|
NON-CURRENT ASSETS |
|
|
|
Pre-financing |
214 |
2 418 |
|
|
214 |
2 418 |
|
CURRENT ASSETS |
|
|
|
Pre-financing |
11 762 |
15 482 |
|
Exchange receivables and non-exchange recoverables |
4 446 |
5 340 |
|
Cash and cash equivalents |
3 792 |
7 339 |
|
|
20 000 |
28 161 |
|
TOTAL ASSETS |
20 214 |
30 579 |
|
NON-CURRENT LIABILITIES |
|
|
|
Financial liabilities |
(3 167 ) |
(17 838 ) |
|
|
(3 167 ) |
(17 838 ) |
|
CURRENT LIABILITIES |
|
|
|
Payables |
(2 847 ) |
(795) |
|
Accrued charges |
(14 200 ) |
(11 947 ) |
|
|
(17 047 ) |
(12 741 ) |
|
TOTAL LIABILITIES |
(20 214 ) |
(30 579 ) |
|
NET ASSETS |
— |
— |
STATEMENT OF FINANCIAL PERFORMANCE
|
(EUR '000) |
||
|
|
2021 |
2020 |
|
REVENUE |
|
|
|
Revenue from non-exchange transactions |
|
|
|
Revenue from donations |
46 995 |
47 889 |
|
Recovery of expenses |
— |
115 |
|
Total revenue |
46 995 |
48 004 |
|
EXPENSES |
|
|
|
Operating expenses |
(46 021 ) |
(46 959 ) |
|
Finance costs |
(48) |
(68) |
|
Other expenses |
(925) |
(978) |
|
Total expenses |
(46 995 ) |
(48 004 ) |
|
ECONOMIC RESULT OF THE YEAR |
— |
— |
CASHFLOW STATEMENT
|
(EUR '000) |
||
|
|
2021 |
2020 |
|
Economic result of the year |
— |
— |
|
(Increase)/decrease in pre-financing |
5 924 |
3 685 |
|
(Increase)/decrease in exchange receivables and non-exchange recoverables |
894 |
(3 487 ) |
|
Increase/(decrease) in financial liabilities |
(14 671 ) |
(11 889 ) |
|
Increase/(decrease) in payables |
2 052 |
784 |
|
Increase/(decrease) in accrued charges |
2 254 |
814 |
|
NET CASHFLOW |
(3 547 ) |
(10 093 ) |
|
Net increase/(decrease) in cash and cash equivalents |
(3 547 ) |
(10 093 ) |
|
Cash and cash equivalents at the beginning of the year |
7 339 |
17 432 |
|
Cash and cash equivalents at year-end |
3 792 |
7 339 |
FINANCIAL STATEMENTS OF THE EUTF AFRICA 2021 (12)
BACKGROUND INFORMATION ON THE EUTF AFRICA
General background on Union Trust Funds
Establishment
In accordance with Articles 234 and 235 of the Financial Regulation applicable to the general budget of the Union (EU FR) (13) and Article 35 of the Financial Regulation applicable to the 11th European Development Fund (EDF FR) (14), the European Commission may establish Union trust funds for external actions (‘EU trust funds’). The Union trust funds are constituted under an agreement concluded with other donors for emergency and post-emergency actions necessary to react to a crisis, or for thematic actions.
Union trust funds are established by the European Commission by a decision after consultation or approval of the European Parliament and the Council. This decision includes the constitutive agreement with other donors.
Union trust funds are only established and implemented subject to the following conditions:
|
— |
There is added value of the Union intervention: the objectives of Union trust funds, in particular by reason of their scale or potential effects, may be better achieved at Union level than at national level and the use of the existing financing instruments would not be sufficient to achieve policy objectives of the Union, |
|
— |
Union trust funds bring clear political visibility for the Union and managerial advantages as well as better control by the Union of risks and disbursements of the Union and other donors’ contributions, |
|
— |
Union trust funds do not duplicate other existing funding channels or similar instruments without providing any additionality, |
|
— |
The objectives of Union trust funds are aligned with the objectives of the Union instrument or budgetary item from which they are funded. |
Current EU Trust Funds
To date, the Commission has set up four EUTFs:
|
— |
The EUTF BÊKOU, whose objective is to support all aspects of the Central African Republic's exit from crisis and its reconstruction efforts. Established on 15 July 2014, |
|
— |
The EUTF MADAD, a European Union Regional Trust Fund in response to the Syrian crisis. Established on 15 December 2014, |
|
— |
The EUTF AFRICA; a European Union Emergency Trust Fund for stability and addressing root causes of irregular migration and displaced persons in Africa. Established on 12 November 2015, |
|
— |
The EUTF COLOMBIA; to support the implementation of the peace agreement in the early recovery and stabilisation post-conflict. Established on 12 December 2016. |
Mission
The main objectives of the EUTF Africa are to support all aspects of stability and contribute to better migration management as well as addressing the root causes of destabilisation, forced displacement and irregular migration, in particular by promoting resilience, economic and equal opportunities, security and development and addressing human rights abuses.
Main operational activities
The Union trust fund pools together resources from different donors to finance an action on the basis of agreed objectives. EUTF Africa operates in three main geographic areas, namely the Sahel region and Lake Chad area, the Horn of Africa and the North of Africa. The neighbouring countries of the eligible countries may benefit, on a case-by-case basis, from the trust fund’s projects. The trust fund is established for a limited period, in order to provide a short and medium-term response to the challenges of the regions.
Governance
The management of the EUTF Africa is ensured by the European Commission, which also acts as the secretariat of its two governing bodies — the Trust Fund Board and the Operational Board. The Trust Fund Board and the Operational Committee of the EUTF Africa are composed of representatives of the donors and of the Commission, as well as representatives of non-contributing EU Member States, authorities of eligible countries' and regional organisations as observers. The rules for the composition of the board and its internal rules are laid down in the constitutive agreement of the Union trust fund.
The main task of the Board is to establish and review the overall strategy of the trust fund. The Operational Board is responsible for the selection of the actions financed by the Fund and supervises their implementation. It also approves the annual accounts and the annual reports on the activities financed by the trust fund.
Sources of financing
The EUTF Africa is financed through contributions from donors.
Annual accounts
Basis for preparation
The legal framework and the deadlines for the preparation of the annual accounts are set by the ‘Agreement establishing the European Union emergency trust fund for stability and addressing root causes of irregular migration and displaced persons in Africa and its internal rules’ (‘Constitutive Agreement’). As per this Constitutive Agreement, the annual accounts are prepared in accordance with the rules adopted by the Accounting Officer of the Commission (EU Accounting Rules, EAR), which are based on internationally accepted accounting standards for the public sector (IPSAS).
Accounting Officer
Based on the Constitutive Agreement, the Accounting Officer of the Commission serves as the Accounting Officer of the Trust Fund.
Composition of the annual accounts
The annual accounts cover the period from 1 January to 31 December and comprise the financial statements and the reports on the implementation of the budget. While the financial statements and the complementary notes are prepared on an accrual accounting basis, the budget implementation reports are primarily based on movements of cash.
Process from provisional accounts to discharge
The annual accounts are subject to independent external audit. The provisional annual accounts prepared by the Accounting Officer are transmitted, by 15 February of the following year, to the Operational Committee who then transmits them to the audit company selected by the entity following a tender procedure. Following the audit, the Accounting Officer prepares the final annual accounts and submits them to the Operational Committee for approval.
The annual accounts of the EUTF Africa are consolidated in the annual accounts of the European Development Fund.
Operational highlights
Achievements of the year
The year 2021 represented the last year during which the EUTF Africa was able to make financial commitments including approval of new actions or budgetary top-ups and signing of new contracts or amendments to existing ones. As of 2022, EUTF Africa programmes will continue being implemented up to end of 2025.
In the course of 2021, the EUTF Africa further demonstrated that it is a swift and effective implementation tool, facilitating policy dialogue with African partner countries across the three regions, applying innovative approaches, and producing tangible results across the three regions (Sahel and Lake Chad, Horn of Africa and North of Africa).
The EUTF Africa further consolidated its achievements in partnership with EU Member States development agencies, UN organisations, NGOs and partner countries, with the approval of few new programmes and a very wide number of budgetary ‘top-ups’ across the three regions for a total of over EUR 242,6 million. This brings the total number of approved programmes to 248 (to which should be added four cross-window programmes), for a total operational budget of over EUR 4 935,1 million. New operational contracts worth over EUR 367 million were signed in 2021 with implementing partners, bringing the total amount of signed contracts to over EUR 4 918. By the end of 2021, operational payments had reached approximately EUR 3 739 million.
In 2021, the EUTF Africa continued addressing the twin goals of fostering stability and handling the root causes of forced displacement and irregular migration in the Sahel and Lake Chad, Horn of Africa and North of Africa regions. The EUTF Africa continued to pursue a balanced approach in addressing the challenges of irregular migration, focusing on areas of mutual interest for the EU and Africa. These include the fight against smuggling of migrants and trafficking of human beings, and the support to voluntary return to, and sustainable reintegration of migrants in, their country of origin.
During the past year, the EUTF Africa received an additional EUR 3,5 million from an EU Member State. As a result, the overall pledge for the EUTF Africa as of 31 December 2021 amounted to over EUR 5 061,7 million, of which EUR 623,2 million by EU Member States and other donors (United Kingdom, Norway and Switzerland).
As in previous years, the Monitoring and Learning System (MLS) reports (available on the EUTF Africa website) on the Sahel and Lake Chad and the Horn of Africa continued to show the tangible results achieved by the EUTF Africa in different areas of work. The Monitoring and Learning system of the North of Africa region generated Monitoring Reports (available on the EUTF Africa website), whose purpose is to analyse how EUTF-funded programmes are contributing to the strategic priorities of the EUTF Africa in the North of Africa region.
Accountability and transparency have been improved through increased communications including regular updates on the EUTF Africa website, publishing posts on social media and organising communication events.
In 2021, the security situation of the Sahel and Lake Chad region continued to deteriorate as banditry and intercommunal tensions increased. Violence from non-state armed groups continued, and almost 10 000 fatalities were recorded in over 3 600 violent attacks in the region. Persisting violence and extreme climate-related events led to further mass displacements. Because of the severe climate conditions, the region was hit also by droughts and floods, causing high levels of food insecurity. Moreover, measures taken by governments of the region to contain the spread of COVID-19 led to lower food productivity, drove inflation, and further constrained humanitarian assistance, exacerbating people’s vulnerability. Against this background, the EUTF Africa’s Operational Committee approved 3 new programmes and 6 budgetary top-ups for a total of EUR 75,9 million (of which EUR 73,4 million of fresh funds, EUR 0,7 million of de-committed funds and EUR 1,8 million of recovered funds). In the course of the year, the EUTF Africa further produced concrete and visible results under the four strategic objectives while further pursuing its stabilisation efforts.
In 2021, the EUTF Africa maintained its comprehensive approach to support all aspects of stability and resilience in the Horn of Africa region, while making the most of its flexibility to face the growing negative impact of the COVID-19 pandemic. Despite the aggravated conflict situation in the region and the disruptions caused by the pandemic, the mobilisation of implementing partners has allowed to reach important milestones on all four specific objectives of the EUTF Africa in line with the work accomplished in previous years. In 2021, one new programme and 22 budgetary top-ups were approved for a total of EUR 158,2 million. In order to maximise the use of EUTF Africa funding for operations prior to the end of the contracting period on 31 December 2021, a total of EUR 136,7 million of unused funds from existing programmes were de-committed and EUR 16,8 million were recovered (mainly from funds previously allocated to projects in Eritrea). These funds were re-committed completely, mainly through budgetary top-ups to other existing programmes.
In 2021, the EUTF for Africa continued to respond comprehensively to challenges in the North of Africa region to save lives, protect the most vulnerable, support host communities, provide opportunities for safe and organised mobility and tackle the consequences of the COVID-19 pandemic. The North of Africa window continued to work along the strategic priorities agreed by the EUTF Strategic Board including support to improve migration governance; support for labour migration and mobility; protection of vulnerable migrants, voluntary return and sustainable reintegration as well as community stabilisation; and integrated border management. In 2021, no new actions were adopted but a number of budgetary top-ups to existing actions were approved for a total of EUR 8,55 million. Moreover, several ongoing programmes were modified to de-commit unused funds and re-allocate them to other ongoing programmes with identified needs so the new commitments net of de-committed/re-allocated funds amount to EUR 7,45 million.
Budget and budget implementation
The total amount committed in 2021 amounted to EUR 112 million compared to EUR 740 million in 2020. The total net additional amount contracted in 2021 amounted to EUR 358 million compared to EUR 1,1 billion in 2020. The payments in the reporting period reached EUR 748 million, which was EUR 304 million lower than in 2020.
In 2021, the total budget implementation in terms of available commitment appropriations used by commitments reached 99,61 %.
In 2021, the Sahel and Lake Chad window approved three new programmes and six budgetary top-ups for a total of EUR 75,9 million (of which EUR 73,4 million were new funds). In order to maximise the use of EUTF for Africa funding for operations prior to the end of the contracting period on 31 December 2021, EUR 0,7 million were de-committed and EUR 1,8 million were recovered, of which the total amount was re-committed through top-ups.
The Horn of Africa approved one new programme and 22 budgetary top-ups for a total of EUR 158,2 million. In order to maximise the use of EUTF for Africa funding for operations prior to the end of the contracting period on 31 December 2021, EUR 136,7 million of unused funds from existing programmes were de-committed and EUR 16,8 million were recovered, of which the total amount was re-committed, mainly through top-ups to other existing projects.
In the North of Africa region, no new programmes were adopted in 2021, but rather a number of budgetary top-ups for a total amount of EUR 8,5 million. To maximise the use of EUTF for Africa funding for operations prior to the end of the contracting period on 31 December 2021, EUR 1,1 million were de-committed and re-committed to other programmes with identified needs.
Since 31 December 2021 marked the end of the contracting period for operational contracts under the EUTF (with the exception of contracts covering admin activities such as evaluation, audit and communication), the three windows proceeded to de- and re-committing these funds; they were then repurposed to address the needs of the vulnerable population.
Response to COVID-19
In 2021, the COVID-19 pandemic continued to have a profound impact on the countries benefitting from the EUTF Africa. Additional EUTF Africa funding was re-oriented to provide the necessary response to the COVID-19 across the three regions covered by the EUTF Africa.
In the Sahel/Lake Chad, COVID-19 programming related to treatment, testing, and emergency response scaled down in 2021. For example, 98 % of individuals assisted in the first half of 2021 were provided with support that was not primarily medical or personal protective equipment, such as prevention activities or socio-economic mitigation measures.
In the Horn of Africa, the COVID-19 pandemic had a significant negative impact on economic activities in the region including on household income, crop and livestock production, sales and food prices. It also exacerbated existing risks and effects of irregular migration due to increased protection concerns such as abuse, gender-based violence, exploitation, trafficking, smuggling and arbitrary detention. With EUTF support, the number of people having improved access to COVID-19-related basic social benefits such as services and cash transfers rose significantly in the first semester of 2021. In 2021, there was a shift in the project activities from mainly being focused on prevention and awareness-raising campaigns on COVID-19 in 2020 to focusing on economic support. In particular, the EUTF Africa delivered close to 6 million COVID-19 supplies in 2021, either through the reallocation of funds to the COVID-19 response or through new programmes.
In 2021, the COVID-19 pandemic had also adverse effects on the economies of the North of Africa region, exacerbating existing difficulties of vulnerable populations to secure livelihoods and increasing dependence on emergency assistance. The window mobilised EUR 34,1 million, which benefited almost 195 000 vulnerable men, women and children across the region, with more than 500 000 units of COVID-19-related supplies delivered to key laboratories and isolation units.
Impact of the activities in the financial statements
In the financial statements, the impact of the abovementioned activities is most visible when looking at:
|
— |
Pre-financing: decreased by EUR 159 078 000 as a result of fewer advances being paid out due to the lower value of new contracts signed, |
|
— |
Operating expenses: remained rather stable with just a small decrease of EUR 30 430 000. Despite the deteriorating security situation and the ongoing COVID-19 pandemic, the trust fund maintained its operations in particular to combat the negative effects of the pandemic and towards fostering stability and handling the root causes of migration, |
|
— |
Financial liabilities: decreased by EUR 23 142 000 mainly due to the fact that cashed contributions were not sufficient to cover the net expenses allocated to the donors. Despite this, cash and cash equivalents increased by EUR 121 788 000 as the cashed contributions were higher than the yearly payment outflows. |
BALANCE SHEET
|
(EUR '000) |
||
|
|
31.12.2021 |
31.12.2020 |
|
NON-CURRENT ASSETS |
|
|
|
Pre-financing |
55 305 |
92 655 |
|
|
55 305 |
92 655 |
|
CURRENT ASSETS |
|
|
|
Pre-financing |
437 657 |
559 386 |
|
Exchange receivables and non-exchange recoverables |
45 339 |
6 346 |
|
Cash and cash equivalents |
179 759 |
57 971 |
|
|
662 755 |
623 703 |
|
TOTAL ASSETS |
718 061 |
716 359 |
|
NON-CURRENT LIABILITIES |
|
|
|
Financial liabilities |
(525 530 ) |
(546 379 ) |
|
|
(525 530 ) |
(546 379 ) |
|
CURRENT LIABILITIES |
|
|
|
Payables |
(53 143 ) |
(45 377 ) |
|
Accrued charges |
(139 388 ) |
(124 602 ) |
|
|
(192 531 ) |
(169 979 ) |
|
TOTAL LIABILITIES |
(718 061 ) |
(716 359 ) |
|
NET ASSETS |
— |
— |
STATEMENT OF FINANCIAL PERFORMANCE
|
(EUR '000) |
||
|
|
2021 |
2020 |
|
REVENUE |
|
|
|
Revenue from non-exchange transactions |
|
|
|
Recovery of expenses |
16 |
— |
|
Revenue from donations |
871 456 |
921 014 |
|
|
871 472 |
921 014 |
|
Revenue from exchange transactions |
|
|
|
Financial revenue |
131 |
— |
|
Other exchange revenue |
16 340 |
2 883 |
|
|
16 471 |
2 883 |
|
Total revenue |
887 943 |
923 897 |
|
EXPENSES |
|
|
|
Operating expenses |
(856 291 ) |
(889 014 ) |
|
Finance cost |
(550) |
(518) |
|
Other expenses |
(31 103 ) |
(34 365 ) |
|
Total expenses |
(887 943 ) |
(923 897 ) |
|
ECONOMIC RESULT OF THE YEAR |
— |
— |
CASHFLOW STATEMENT
|
(EUR '000) |
||
|
|
2021 |
2020 |
|
Economic result of the year |
— |
— |
|
Operating activities |
|
|
|
(Increase)/decrease in pre-financing |
159 078 |
(184 933 ) |
|
(Increase)/decrease in exchange receivables and non-exchange recoverables |
(38 992 ) |
12 125 |
|
Increase/(decrease) in financial liabilities |
(20 849 ) |
161 968 |
|
Increase/(decrease) in payables |
7 765 |
19 408 |
|
Increase/(decrease) in accrued charges |
14 786 |
22 488 |
|
NET CASHFLOW |
121 788 |
31 056 |
|
Net increase/(decrease) in cash and cash equivalents |
121 788 |
31 056 |
|
Cash and cash equivalents at the beginning of the year |
57 971 |
26 915 |
|
Cash and cash equivalents at year-end |
179 759 |
57 971 |
CONSOLIDATED FINANCIAL STATEMENTS OF THE EDF AND THE EU TRUST FUNDS (15)
CONSOLIDATED BALANCE SHEET
|
(EUR million) |
||
|
|
31.12.2021 |
31.12.2020 (*6) |
|
NON-CURRENT ASSETS |
|
|
|
Financial assets |
39 |
33 |
|
Pre-financing (*6) |
726 |
965 |
|
Exchange receivables |
4 |
3 |
|
|
770 |
1 002 |
|
CURRENT ASSETS |
|
|
|
Pre-financing |
1 902 |
1 930 |
|
Exchange receivables and non-exchange recoverables |
85 |
152 |
|
Cash and cash equivalents |
1 177 |
793 |
|
|
3 164 |
2 875 |
|
TOTAL ASSETS |
3 934 |
3 877 |
|
NON-CURRENT LIABILITIES |
|
|
|
Financial liabilities |
(154) |
(173) |
|
|
(154) |
(173) |
|
CURRENT LIABILITIES |
|
|
|
Payables |
(557) |
(661) |
|
Accrued charges and deferred income |
(1 162 ) |
(1 664 ) |
|
|
(1 719 ) |
(2 325 ) |
|
TOTAL LIABILITIES |
(1 873 ) |
(2 498 ) |
|
NET ASSETS |
2 061 |
1 379 |
|
FUNDS & RESERVES |
|
|
|
Fair value reserve |
— |
(5) |
|
Called fund capital — active EDFs |
62 643 |
58 986 |
|
Called fund capital from closed EDFs carried forward |
2 252 |
2 252 |
|
Economic result carried forward from previous years |
(59 860 ) |
(55 111 ) |
|
Economic result of the year |
(2 974 ) |
(4 744 ) |
|
NET ASSETS |
2 061 |
1 379 |
CONSOLIDATED STATEMENT OF FINANCIAL PERFORMANCE
|
(EUR million) |
||
|
|
2021 |
2020 |
|
REVENUE |
|
|
|
Revenue from non-exchange transactions |
|
|
|
Recovery activities |
27 |
92 |
|
Revenue from trust funds donations |
272 |
296 |
|
|
300 |
388 |
|
Revenue from exchange transactions |
|
|
|
Financial revenue |
(25) |
6 |
|
Other revenue |
90 |
40 |
|
|
64 |
46 |
|
Total revenue |
364 |
434 |
|
EXPENSES |
|
|
|
Aid instruments |
(2 218 ) |
(3 935 ) |
|
Expenses implemented by trust funds |
(902) |
(936) |
|
Co-financing expenses |
(19) |
(53) |
|
Finance costs |
(21) |
(22) |
|
Other expenses |
(178) |
(232) |
|
Total expenses |
(3 338 ) |
(5 178 ) |
|
ECONOMIC RESULT OF THE YEAR |
(2 974 ) |
(4 744 ) |
CONSOLIDATED CASH FLOW STATEMENT
|
(EUR million) |
||
|
|
2021 |
2020 |
|
Economic result of the year |
(2 974 ) |
(4 744 ) |
|
Operating activities |
|
|
|
Capital increase — contributions |
3 657 |
4 177 |
|
(Increase)/decrease in trust funds contributions |
— |
|
|
(Increase)/decrease in pre-financing |
266 |
(210) |
|
(Increase)/decrease in exchange receivables and non-exchange recoverables |
66 |
(9) |
|
Increase/(decrease) in financial liabilities |
(19) |
6 |
|
Increase/(decrease) in payables |
(104) |
119 |
|
Increase/(decrease) in accrued charges and deferred income |
(502) |
232 |
|
Other non-cash movements |
— |
(3) |
|
Investing activities |
|
|
|
(Increase)/decrease in available for sale financial assets (*7) |
(7) |
2 |
|
NET CASHFLOW |
384 |
(431) |
|
Net increase/(decrease) in cash and cash equivalents |
384 |
(430) |
|
Cash and cash equivalents at the beginning of the year |
793 |
1 223 |
|
Cash and cash equivalents at year-end |
1 177 |
793 |
CONSOLIDATED STATEMENT OF CHANGES IN NET ASSETS
|
(EUR million) |
|||||||
|
|
Fund capital — active EDFs (A) |
Uncalled funds — active EDFs (B) |
Called fund capital — active EDFs (C) = (A)-(B) |
Cumulative Reserves (D) |
Called fund capital from closed EDFs carried forward (E) |
Fair value reserve (F) |
Total Net Assets (C)+(D)+(E)+(F) |
|
BALANCE AS AT 31.12.2019 |
73 264 |
18 455 |
54 809 |
(55 111 ) |
2 252 |
(2) |
1 948 |
|
Fair value movements |
|
|
|
|
|
(3) |
(3) |
|
Capital increase — contributions (*8) |
(223) |
(4 400 ) |
4 177 |
— |
— |
|
4 177 |
|
Economic result of the year |
— |
— |
— |
(4 744 ) |
— |
|
(4 744 ) |
|
BALANCE AS AT 31.12.2020 |
73 041 |
14 055 |
58 986 |
(59 854 ) |
2 252 |
(5) |
1 379 |
|
Impact of revised EAR 11 |
— |
— |
— |
(5) |
|
5 |
|
|
Balances as at 1.1.2021 |
73 041 |
14 055 |
58 986 |
(59 860 ) |
2 252 |
— |
1 379 |
|
Capital increase — contributions |
(43) |
(3 700 ) |
3 657 |
|
|
|
3 657 |
|
Economic result of the year |
|
|
— |
(2 974 ) |
|
|
(2 974 ) |
|
BALANCE AS AT 31.12.2021 |
72 998 |
10 355 |
62 643 |
(62 834 ) |
2 252 |
— |
2 061 |
EDF REPORT ON FINANCIAL IMPLEMENTATION
CONTENTS
|
1. |
BACKGROUND | 75 |
|
1.1. |
PREVIOUS EDFS | 75 |
|
1.2. |
10TH AND 11TH EDF | 76 |
|
2. |
FINANCIAL IMPLEMENTATION | 77 |
|
2.1. |
FINANCIAL OUTTURN | 77 |
|
2.2. |
REVENUE | 84 |
|
2.3. |
OPERATIONAL EXPENDITURE AND SPECIFIC PROGRAMMES | 85 |
|
3. |
GLOSSARY | 96 |
1. BACKGROUND
Launched in 1959, the European Development Fund is the main instrument for providing EU aid for development cooperation to the African, Caribbean and Pacific (ACP) States and Overseas Countries and Territories (OCTs). Its primary objective is to reduce and ultimately eradicate poverty.
The EDF is established by an Internal Agreement of the Representatives of the Member States and managed by a specific committee. The EDF resources are ‘ad hoc’ contributions from the EU Member States, who decide on an overall amount that will be allocated to the fund (over a period of five years). In addition to these contributions, it is also possible for Member States to enter into co-financing arrangements or to make voluntary financial contributions to the EDF. The European Commission is responsible for the financial implementation of the operations carried out with EDF resources. The European Investment Bank manages the Investment Facility.
The EDF is a fund operating based on multiannuality. Each EDF is concluded for a period of around five years and it is governed by its own Financial Regulation, which requires the preparation of financial statements for each individual EDF. Accordingly, financial statements are prepared separately for each EDF in respect of the part that is managed by the Commission.
The Internal Agreement establishing the last EDF, the 11th EDF (2014–2020), came into force on 1 March 2015. As of 2021, the cooperation with the ACP countries is included in the Neighbourhood, Development and International Cooperation Instrument (NDICI). However, the ongoing projects, funded under the EDF, will continue their implementation under the respective EDF legal basis.
This report is produced in accordance with Article 39 of the Financial Regulation of 11th EDF (16). It focuses on important events that had a significant impact on the financial implementation of year 2021.
Given that there are no ongoing operations under previous EDFs (17), this report includes figures only for the 10th and 11th EDF (unless it is specifically mentioned otherwise).
1.1. PREVIOUS EDFs
6TH AND 7TH EDF
The 6th EDF was closed in 2006 and the 7th EDF was closed in 2008.
8TH AND 9TH EDF
In 2019, the Commission closed the remaining outstanding transactions of the 8th EDF projects. In accordance with Article 1(2)(b) of the Internal Agreement of the 9th EDF, balances and decommitments of previous EDFs have been transferred to the 9th EDF.
The year 2021 marked the financial and operational closure of the 8th EDF for a total amount of expenditure of EUR 10 374 million. The Commission announced the closure of the 8th EDF to the Member States in the Communication that was presented to the Council in October 2021. The closure is also reflected in the present report.
All 8th EDF activities have been completed, all checks and controls have been performed, and all contracts and financial decisions are closed in the EDF accounts. All recovery orders, which were still open after the operational closure, were cashed or waived with the exception of 10 recovery orders (including six litigation cases followed by the Legal Service). In line with Commission Decision C(2003) 1904, these 13 ROs were transferred to the 9th EDF.
The closure of the 9th EDF is progressing well (nine financing decisions closed in 2021). There are still 16 decisions open. However, three of the open decisions concern actions in Southern Sudan (Council Decision 2011/315/EU (18)). These were decided after the 9th EDF sunset clause and should, in principle, be closed by 2023.
From 2015 to 2021, the Commission carried out three refunds of 8th/9th EDF credits for a total amount of EUR 1 826 million. A balance of EUR 43 million was refunded in January 2022 in the context of the payment of the first instalment of MS contributions to the EDF.
1.2. 10TH AND 11TH EDF
The ACP-EC Partnership Agreement was signed on 23 June 2000 in Cotonou by the Member States of the European Community and the States of Africa, the Caribbean and the Pacific (ACP States). It entered into force on 1 April 2003 (establishing the 9th EDF). The Cotonou Agreement was amended twice, firstly by the agreement signed in Luxembourg on 25 June 2005 (establishing the 10th EDF), secondly by the agreement signed in Ouagadougou on 22 June 2010 (establishing the 11th EDF).
The EU Council Decision 2001/822/EC of 27 November 2001 on the association of the overseas countries and territories (OCT) with the European Community (‘Overseas Association Decision’) (19) entered into force on 2 December 2001. This Decision was amended on 19 March 2007 (Decision 2007/249/EC) (20).
The Internal Agreement on the financing of Community aid under the multi-annual financial framework for the period 2014–2020 in accordance with the revised Cotonou Agreement, adopted by the Representatives of the Governments of the Member States of the European Community on August 2013, entered into force on March 2015.
Under the Cotonou Agreement, for the second period (2008–2013), the 10th EDF an overall budget of EUR 22 682 million. Of this amount:
|
— |
EUR 21 966 million were allocated to the ACP countries, |
|
— |
EUR 286 million to the OCT, and |
|
— |
EUR 430 million to the Commission as support expenditure for programming and implementation of the EDF. |
The amount for the ACP countries is divided accordingly:
|
— |
EUR 17 766 million to national and regional indicative programmes, |
|
— |
EUR 2 700 million to intra-ACP and intra-regional cooperation, and |
|
— |
EUR 1 500 million to Investment Facilities. |
Notably, an increased share of the budget is devoted to regional programmes, thereby emphasising the importance of regional economic integration as the basic framework for national and local development. An innovation in the 10th EDF was the creation of ‘incentive amounts’ for each country.
Under the Cotonou Agreement, the third period (2014–2020) of Community aid to the ACP States and OCTs is funded by the 11th EDF for an amount of EUR 30 506 million, of which:
|
— |
EUR 29 089 million is allocated to the ACP countries in accordance with Article 1.2(a) and Article 2(d) of the Internal Agreement, of which EUR 27 955 million is managed by the European Commission, |
|
— |
EUR 364,5 million is allocated to the OCTs in accordance with Article 1.2(a) and Article 3.1 of the Internal Agreement, of which 359,5 million is managed by the European Commission, |
|
— |
EUR 1 052,5 million is for the Commission to finance the costs arising from the programming and implementation of 11th EDF resources, in accordance with Article 1.2(a) of the Internal Agreement. |
2. FINANCIAL IMPLEMENTATION
2.1. FINANCIAL OUTTURN
EVOLUTION OF 10th EDF APPROPRIATIONS
10th EDF
EVOLUTION OF APPROPRIATIONS: 31 December 2021
ANALYSIS OF CREDITS PER INSTRUMENT
|
(EUR million) |
||||||
|
|
INSTRUMENT |
INITIAL APPROPRIATION |
INCREASES/DECREASES IN CUMULATIVE RESOURCES AT 31 DECEMBER 2020 |
INCREASE OR DECREASE IN RESOURCES IN 2021 |
Notes |
CURRENT LEVEL APPROPRIATION |
|
ACP |
Regular MS Contributions |
20 896 |
(280) |
(111) |
|
20 505 |
|
Co-financing |
0 |
202 |
|
|
202 |
|
|
SUBTOTAL ACP |
20 896 |
(78) |
(111) |
|
20 707 |
|
|
OCT |
Regular MS Contributions |
0 |
243 |
(3) |
|
240 |
|
SUBTOTAL OCT |
0 |
243 |
(3) |
|
240 |
|
|
|
TOTAL 10th EDF |
20 896 |
165 |
(113) |
|
20 947 |
EVOLUTION OF 11th EDF APPROPRIATIONS
|
(EUR million) |
||||||
|
|
INSTRUMENT |
INITIAL APPROPRIATION |
INCREASES/DECREASES IN CUMULATIVE RESOURCES AT 31 DECEMBER 2020 |
INCREASE OR DECREASE IN RESOURCES IN 2021 |
Notes |
CURRENT LEVEL APPROPRIATION |
|
ACP |
Regular MS Contributions |
29 008 |
(190) |
197 |
|
29 015 |
|
Co-financing |
0 |
75 |
12 |
|
88 |
|
|
EC Internal SLA |
0 |
1 |
0 |
|
1 |
|
|
SUBTOTAL ACP |
29 008 |
(113) |
209 |
|
29 103 |
|
|
OCT |
Regular MS Contributions |
0 |
349 |
4 |
|
353 |
|
Co-financing |
0 |
0 |
0 |
|
0 |
|
|
EC Internal SLA |
0 |
0 |
0 |
|
0 |
|
|
SUBTOTAL OCT |
0 |
349 |
4 |
|
353 |
|
|
|
TOTAL 11th EDF |
29 008 |
235 |
213 |
|
29 456 |
EVOLUTION OF COMMITMENTS, ASSIGNED FUNDS AND PAYMENTS FOR 10TH EDF
EDF AGGREGATED ACCOUNTS AT 31 DECEMBER 2021
CLASS OF AID
ACP + PTOM — 10th EDF
|
(EUR million) |
|||||||||||||
|
|
|
CREDITS |
DECISIONS |
ASSIGNED FUNDS |
PAYMENTS |
||||||||
|
AGGREG. |
ANNUAL |
% |
AGGREG. |
ANNUAL |
% |
AGGREG. |
ANNUAL |
% |
|||||
|
(1) |
(2) |
|
(2):(1) |
(3) |
|
(3):(2) |
(4) |
|
(4):(3) |
||||
|
|
Regular MS Contributions |
|
|
|
|
|
|
|
|
|
|
||
|
ACP |
SUBTOTAL: A ENVELOPE — NATIONAL ALLOCATIONS |
12 454 |
12 392 |
(108) |
100 % |
12 334 |
(49) |
100 % |
12 143 |
96 |
98 % |
||
|
SUBTOTAL: B ENVELOPE — NATIONAL ALLOCATIONS |
1 979 |
1 972 |
(8) |
100 % |
1 964 |
(4) |
100 % |
1 960 |
5 |
100 % |
|||
|
SUBTOTAL: IMPLEMENTATION COSTS AND INTERESTS REVENUES |
528 |
526 |
0 |
100 % |
526 |
4 |
100 % |
522 |
15 |
99 % |
|||
|
SUBTOTAL: INTRA-ACP ALLOCATIONS |
3 684 |
3 655 |
(28) |
99 % |
3 552 |
93 |
97 % |
3 239 |
165 |
91 % |
|||
|
SUBTOTAL: REGIONAL ALLOCATIONS |
1 842 |
1 825 |
(26) |
99 % |
1 794 |
(13) |
98 % |
1 692 |
25 |
94 % |
|||
|
Co-financing |
|
|
|
|
|
|
|
|
|
|
|||
|
SUBTOTAL: A ENVELOPE — NATIONAL ALLOCATIONS |
185 |
180 |
(1) |
97 % |
177 |
0 |
99 % |
164 |
3 |
93 % |
|||
|
SUBTOTAL: IMPLEMENTATION COSTS AND INTERESTS REVENUES |
5 |
5 |
(0) |
111 % |
5 |
2 |
100 % |
3 |
0 |
66 % |
|||
|
SUBTOTAL: INTRA-ACP ALLOCATIONS |
12 |
11 |
0 |
91 % |
11 |
0 |
100 % |
11 |
0 |
100 % |
|||
|
Non-mobilisable reserve |
|
|
|
|
|
|
|
|
|
|
|||
|
SUBTOTAL: NON-MOBILISABLE RESERVE |
18 |
|
|
|
|
|
|
|
|
|
|||
|
|
Regular MS Contributions |
|
|
|
|
|
|
|
|
|
|
||
|
OCT |
SUBTOTAL: A ENVELOPE — NATIONAL ALLOCATIONS |
186 |
186 |
(0) |
100 % |
183 |
0 |
98 % |
169 |
2 |
92 % |
||
|
SUBTOTAL: B ENVELOPE — NATIONAL ALLOCATIONS |
15 |
15 |
0 |
100 % |
14 |
(0) |
99 % |
14 |
0 |
100 % |
|||
|
SUBTOTAL: IMPLEMENTATION COSTS AND INTERESTS REVENUES |
5 |
5 |
|
100 % |
5 |
|
100 % |
5 |
|
100 % |
|||
|
SUBTOTAL: REGIONAL ALLOCATIONS |
34 |
34 |
(1) |
100 % |
34 |
0 |
99 % |
33 |
(0) |
98 % |
|||
|
Non-mobilisable reserve |
|
|
|
|
|
|
|
|
|
|
|||
|
SUBTOTAL: NON-MOBILISABLE RESERVE |
0 |
|
|
|
|
|
|
|
|
|
|||
|
|
TOTAL: ACP+OCT (INCL. RESERVES) (A+B) |
20 947 |
20 805 |
(172) |
99 % |
20 600 |
33 |
99 % |
19 956 |
311 |
97 % |
||
EVOLUTION OF COMMITMENTS, ASSIGNED FUNDS AND PAYMENTS FOR 11TH EDF
EDF AGGREGATED ACCOUNTS AT 31 DECEMBER 2021
CLASS OF AID
ACP + PTOM — 11th EDF
|
(EUR million) |
|||||||||||||
|
|
|
CREDITS |
DECISIONS |
ASSIGNED FUNDS |
PAYMENTS |
||||||||
|
AGGREG. |
ANNUAL |
% |
AGGREG. |
ANNUAL |
% |
AGGREG. |
ANNUAL |
% |
|||||
|
(1) |
(2) |
|
(2): (1) |
(3) |
|
(3): (2) |
(4) |
|
(4): (3) |
||||
|
|
Regular MS Contributions |
|
|
|
|
|
|
|
|
|
|
||
|
ACP |
SUBTOTAL: A ENVELOPE — NATIONAL ALLOCATIONS |
15 538 |
15 531 |
(24) |
100 % |
14 021 |
928 |
90 % |
9 976 |
1 644 |
71 % |
||
|
SUBTOTAL: B ENVELOPE — NATIONAL ALLOCATIONS |
676 |
675 |
(1) |
100 % |
630 |
21 |
93 % |
577 |
51 |
92 % |
|||
|
SUBTOTAL: IMPLEMENTATION COSTS AND INTERESTS REVENUES |
1 071 |
1 069 |
(1) |
100 % |
1 063 |
190 |
99 % |
856 |
53 |
80 % |
|||
|
SUBTOTAL: INTRA-ACP ALLOCATIONS |
4 014 |
3 908 |
(4) |
97 % |
3 703 |
260 |
95 % |
2 968 |
267 |
80 % |
|||
|
SUBTOTAL: REGIONAL ALLOCATIONS |
7 317 |
7 300 |
4 |
100 % |
6 991 |
593 |
96 % |
4 926 |
955 |
70 % |
|||
|
Co-financing |
|
|
|
|
|
|
|
|
|
|
|||
|
SUBTOTAL: A ENVELOPE — NATIONAL ALLOCATIONS |
46 |
46 |
4 |
100 % |
45 |
4 |
98 % |
18 |
12 |
40 % |
|||
|
SUBTOTAL: IMPLEMENTATION COSTS AND INTERESTS REVENUES |
4 |
4 |
0 |
100 % |
4 |
3 |
100 % |
0 |
|
10 % |
|||
|
SUBTOTAL: INTRA-ACP ALLOCATIONS |
33 |
33 |
6 |
100 % |
33 |
9 |
100 % |
24 |
1 |
72 % |
|||
|
SUBTOTAL: REGIONAL ALLOCATIONS |
6 |
4 |
0 |
67 % |
4 |
0 |
100 % |
4 |
|
100 % |
|||
|
Mobilisable reserves |
|
|
|
|
|
|
|
|
|
|
|||
|
SUBTOTAL: INTRA-ACP RESERVE |
1 |
|
|
|
|
|
|
|
|
|
|||
|
SUBTOTAL: NIP/RIP RESERVE |
(100) |
|
|
|
|
|
|
|
|
|
|||
|
Non-mobilisable reserve |
|
|
|
|
|
|
|
|
|
|
|||
|
SUBTOTAL: NON-MOBILISABLE RESERVE |
498 |
|
|
|
|
|
|
|
|
|
|||
|
EC Internal SLA |
|
|
|
|
|
|
|
|
|
|
|||
|
SUBTOTAL: A ENVELOPE — NATIONAL ALLOCATIONS |
1 |
1 |
0 |
52 % |
1 |
|
100 % |
1 |
|
100 % |
|||
|
|
Regular MS Contributions |
|
|
|
|
|
|
|
|
|
|
||
|
OCT |
SUBTOTAL: A ENVELOPE — NATIONAL ALLOCATIONS |
213 |
213 |
0 |
100 % |
194 |
1 |
91 % |
183 |
12 |
94 % |
||
|
SUBTOTAL: B ENVELOPE — NATIONAL ALLOCATIONS |
12 |
12 |
0 |
100 % |
12 |
2 |
100 % |
12 |
4 |
99 % |
|||
|
SUBTOTAL: IMPLEMENTATION COSTS AND INTERESTS REVENUES |
9 |
8 |
0 |
100 % |
6 |
2 |
75 % |
5 |
1 |
77 % |
|||
|
SUBTOTAL: REGIONAL ALLOCATIONS |
103 |
103 |
(0) |
100 % |
102 |
3 |
99 % |
37 |
12 |
37 % |
|||
|
Co-financing |
|
|
|
|
|
|
|
|
|
|
|||
|
SUBTOTAL: A ENVELOPE — NATIONAL ALLOCATIONS |
0 |
|
|
|
|
|
|
|
|
|
|||
|
Non-mobilisable reserve |
|
|
|
|
|
|
|
|
|
|
|||
|
SUBTOTAL: NON-MOBILISABLE RESERVE |
17 |
|
|
|
|
|
|
|
|
|
|||
|
EC Internal SLA |
|
|
|
|
|
|
|
|
|
|
|||
|
SUBTOTAL: A ENVELOPE — NATIONAL ALLOCATIONS |
0 |
|
|
|
|
|
|
|
|
|
|||
|
|
TOTAL: ACP+OCT (INCL. RESERVES) (A+B) |
29 456 |
28 905 |
(16) |
98 % |
26 807 |
2 015 |
93 % |
19 586 |
3 012 |
73 % |
||
2.2. REVENUE
Nature of Revenue
The main revenue of the EDF is the Member States’ contributions. Three times per year, the European Commission and the European Investment Bank call the Member States to contribute to the EDF. The amount of the contributions called each year reflects the amount of payment to be covered during the year.
Overview of contributions by Member State

2.3. OPERATIONAL EXPENDITURE AND SPECIFIC PROGRAMMES
Nature of expenditure
The amount available under the multiannual financial framework consists of 3 % allocated to Commission for support expenditure and 97 % allocated to the implementation of EDF projects. Amounts are set by each Internal Agreement and can be increased by voluntary contributions and income yielded from operations.
Breakdown of committed, contracted and paid amount per nature of expenditure
|
|
CREDITS |
DECISIONS |
ASSIGNED FUNDS |
PAYMENTS |
||||||
|
AGGREG. |
ANNUAL |
% |
AGGREG. |
ANNUAL |
% |
AGGREG. |
ANNUAL |
% |
||
|
(1) |
(2) |
|
(2):(1) |
(3) |
|
(3):(2) |
(4) |
|
(4):(3) |
|
|
IMPLEMENTATION COSTS AND INTERESTS REVENUES |
1 621 |
1 618 |
(1) |
100 % |
1 609 |
200 |
99 % |
1 391 |
69 |
86 % |
|
OPERATIONNAL IMPLEMENTATION |
48 782 |
48 093 |
(187) |
99 % |
45 798 |
1 848 |
94 % |
38 151 |
3 254 |
78 % |
|
TOTAL 10+11th EDF: ACP + OCT (A+B) |
50 403 |
49 711 |
(188) |
99 % |
47 407 |
2 048 |
94 % |
39 542 |
3 323 |
78 % |
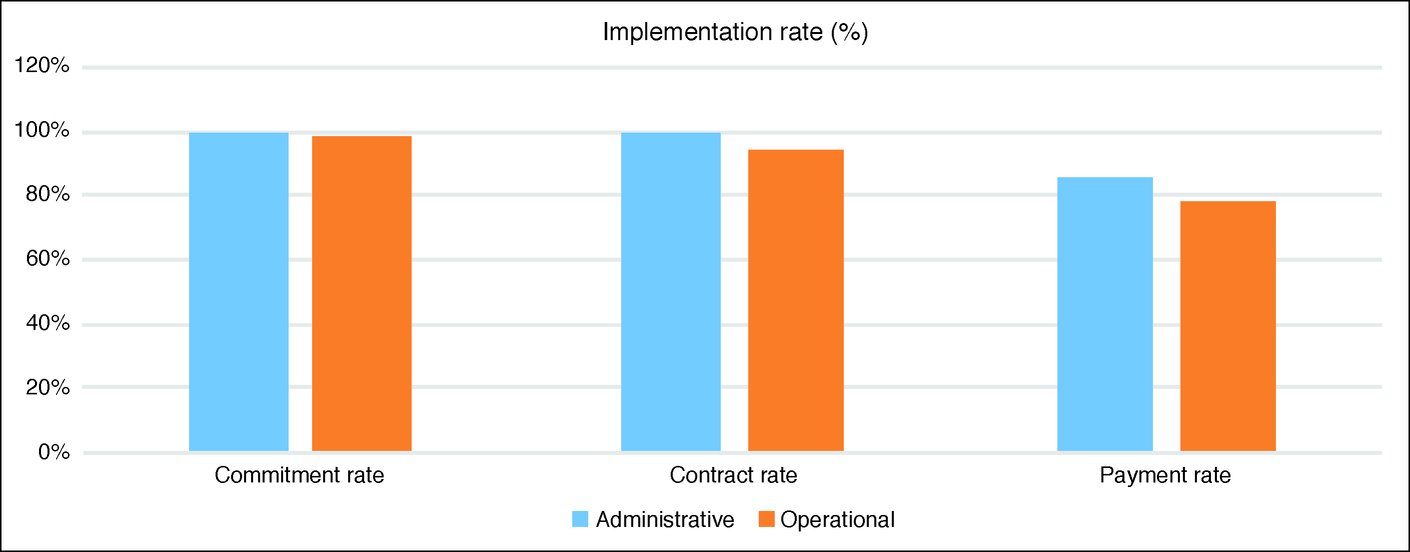
Breakdown of committed, contracted and paid amount per region and country
|
|
|
EDF CUMULATIVE ACCOUNTS AT 31 DECEMBER 2021 BY COUNTRY % APPR |
||||||
|
10 + 11 th EDF |
TOTAL 10th and 11th EDF (EUR in million) |
|||||||
|
Cumulative 2021 |
Appropriations |
Decisions |
% of Appr |
Assigned funds |
% of Appr |
Payments |
% of Appr |
|
|
ACP |
General / enveloppe administrative/intér |
1 608 |
1 604 |
100 % |
1 598 |
99 % |
1 381 |
86 % |
|
Réserve / Non réparti par pays |
2 969 |
2 553 |
86 % |
2 553 |
86 % |
2 202 |
74 % |
|
|
All ACP countries |
4 576 |
4 157 |
91 % |
4 151 |
91 % |
3 583 |
78 % |
|
|
Angola |
348 |
348 |
100 % |
335 |
96 % |
276 |
79 % |
|
|
Bénin |
740 |
737 |
100 % |
690 |
93 % |
647 |
87 % |
|
|
Botswana |
130 |
130 |
100 % |
128 |
98 % |
122 |
94 % |
|
|
Burkina Faso |
1 307 |
1 306 |
100 % |
1 300 |
99 % |
1 226 |
94 % |
|
|
Burundi |
572 |
570 |
100 % |
546 |
95 % |
466 |
81 % |
|
|
Cameroun |
521 |
521 |
100 % |
505 |
97 % |
438 |
84 % |
|
|
Cap Vert |
147 |
147 |
100 % |
146 |
100 % |
145 |
99 % |
|
|
Comores |
80 |
79 |
100 % |
77 |
96 % |
64 |
80 % |
|
|
Congo (Brazzaville) |
163 |
163 |
100 % |
153 |
94 % |
102 |
62 % |
|
|
Congo (République démocratique du) |
1 430 |
1 421 |
99 % |
1 327 |
93 % |
1 105 |
77 % |
|
|
Côte d'Ivoire |
710 |
709 |
100 % |
699 |
98 % |
633 |
89 % |
|
|
Djibouti |
186 |
186 |
100 % |
170 |
92 % |
122 |
66 % |
|
|
Erythrée |
215 |
215 |
100 % |
215 |
100 % |
35 |
16 % |
|
|
Ethiopie |
1 655 |
1 652 |
100 % |
1 579 |
95 % |
1 353 |
82 % |
|
|
Gabon |
35 |
33 |
95 % |
32 |
91 % |
28 |
80 % |
|
|
Gambie |
316 |
315 |
100 % |
309 |
98 % |
243 |
77 % |
|
|
Ghana |
793 |
792 |
100 % |
782 |
99 % |
697 |
88 % |
|
|
Guinée Bissau |
186 |
186 |
100 % |
185 |
100 % |
152 |
82 % |
|
|
Guinée (Conakry) |
504 |
504 |
100 % |
473 |
94 % |
401 |
80 % |
|
|
Ile Maurice |
82 |
82 |
100 % |
82 |
100 % |
78 |
94 % |
|
|
Kenya |
874 |
873 |
100 % |
858 |
98 % |
648 |
74 % |
|
|
Lesotho |
259 |
258 |
100 % |
245 |
95 % |
182 |
70 % |
|
|
Libéria |
495 |
494 |
100 % |
445 |
90 % |
399 |
81 % |
|
|
Madagascar |
791 |
790 |
100 % |
714 |
90 % |
471 |
60 % |
|
|
Malawi |
1 025 |
1 025 |
100 % |
919 |
90 % |
805 |
79 % |
|
|
Mali |
1 425 |
1 424 |
100 % |
1 389 |
98 % |
1 172 |
82 % |
|
|
Mauritanie |
347 |
347 |
100 % |
336 |
97 % |
288 |
83 % |
|
|
Mozambique |
1 468 |
1 462 |
100 % |
1 180 |
80 % |
940 |
64 % |
|
|
Namibie |
189 |
189 |
100 % |
176 |
94 % |
159 |
85 % |
|
|
Niger |
1 287 |
1 285 |
100 % |
1 263 |
98 % |
1 184 |
92 % |
|
|
Nigeria |
1 160 |
1 145 |
99 % |
1 126 |
97 % |
987 |
85 % |
|
|
Ouganda |
1 000 |
1 000 |
100 % |
965 |
97 % |
731 |
73 % |
|
|
République centrafricaine |
624 |
622 |
100 % |
616 |
99 % |
495 |
79 % |
|
|
Rwanda |
841 |
841 |
100 % |
827 |
98 % |
800 |
95 % |
|
|
Sao Tomé-et-Principe |
56 |
56 |
100 % |
50 |
89 % |
41 |
73 % |
|
|
Sénégal |
668 |
667 |
100 % |
638 |
96 % |
581 |
87 % |
|
|
Seychelles |
23 |
23 |
100 % |
23 |
99 % |
21 |
93 % |
|
|
Sierra Leone |
663 |
663 |
100 % |
621 |
94 % |
548 |
83 % |
|
|
Somalie |
903 |
901 |
100 % |
898 |
99 % |
872 |
97 % |
|
|
Swaziland |
135 |
128 |
95 % |
113 |
84 % |
95 |
70 % |
|
|
Tanzanie |
1 176 |
1 174 |
100 % |
1 108 |
94 % |
945 |
80 % |
|
|
Tchad |
938 |
936 |
100 % |
832 |
89 % |
708 |
75 % |
|
|
Togo |
378 |
378 |
100 % |
374 |
99 % |
332 |
88 % |
|
|
Zambie |
834 |
834 |
100 % |
740 |
89 % |
536 |
64 % |
|
|
Zimbabwe |
472 |
471 |
100 % |
465 |
99 % |
435 |
92 % |
|
|
Total Africa |
28 150 |
28 082 |
100 % |
26 654 |
95 % |
22 709 |
81 % |
|
|
Antigua et Barbuda |
16 |
15 |
99 % |
15 |
99 % |
14 |
88 % |
|
|
Barbade |
22 |
22 |
100 % |
22 |
99 % |
20 |
91 % |
|
|
Belize |
43 |
43 |
100 % |
35 |
82 % |
28 |
66 % |
|
|
Dominique |
41 |
41 |
100 % |
41 |
99 % |
38 |
91 % |
|
|
Grenade |
21 |
21 |
100 % |
21 |
99 % |
20 |
94 % |
|
|
Guyane |
81 |
81 |
100 % |
78 |
96 % |
76 |
94 % |
|
|
Haïti |
1 030 |
1 020 |
99 % |
890 |
86 % |
736 |
72 % |
|
|
Jamaïque |
243 |
240 |
99 % |
236 |
97 % |
213 |
88 % |
|
|
République Dominicaine |
283 |
283 |
100 % |
277 |
98 % |
268 |
95 % |
|
|
Sainte-Lucie |
32 |
32 |
100 % |
32 |
100 % |
28 |
86 % |
|
|
Saint Kitts et Nevis |
9 |
8 |
92 % |
8 |
91 % |
6 |
66 % |
|
|
Saint-Vincent -et-les-Grenadines |
27 |
27 |
98 % |
26 |
97 % |
22 |
81 % |
|
|
Surinam |
27 |
27 |
100 % |
27 |
97 % |
20 |
73 % |
|
|
Trinité et Tobago |
29 |
29 |
99 % |
28 |
99 % |
22 |
76 % |
|
|
Total Caribbean |
1 904 |
1 889 |
99 % |
1 735 |
91 % |
1 511 |
79 % |
|
|
Fidji |
49 |
49 |
100 % |
48 |
99 % |
41 |
85 % |
|
|
Iles Cook |
5 |
5 |
99 % |
5 |
99 % |
5 |
99 % |
|
|
Iles Salomon |
69 |
69 |
100 % |
60 |
88 % |
58 |
84 % |
|
|
Kiribati |
42 |
42 |
100 % |
42 |
99 % |
26 |
61 % |
|
|
Marshall Island |
17 |
17 |
100 % |
17 |
99 % |
14 |
82 % |
|
|
Micronésie |
23 |
23 |
100 % |
23 |
97 % |
10 |
43 % |
|
|
Nauru |
4 |
4 |
100 % |
4 |
99 % |
4 |
92 % |
|
|
Nioué |
3 |
3 |
100 % |
3 |
99 % |
3 |
98 % |
|
|
Palau |
5 |
5 |
100 % |
4 |
69 % |
3 |
60 % |
|
|
Papouasie-Nouvelle Guinée |
246 |
244 |
100 % |
228 |
93 % |
155 |
63 % |
|
|
Samoa Occidentale |
67 |
67 |
100 % |
67 |
100 % |
66 |
99 % |
|
|
Timor Leste |
174 |
174 |
100 % |
172 |
99 % |
138 |
79 % |
|
|
Tonga |
28 |
28 |
100 % |
28 |
99 % |
28 |
99 % |
|
|
Tuvalu |
13 |
13 |
100 % |
13 |
99 % |
12 |
89 % |
|
|
Vanuatu |
55 |
55 |
100 % |
50 |
91 % |
41 |
76 % |
|
|
Total Pacific |
800 |
799 |
100 % |
764 |
95 % |
605 |
76 % |
|
|
Intra-ACP Allocations |
7 744 |
7 607 |
98 % |
7 299 |
94 % |
6 242 |
81 % |
|
|
PALOP |
62 |
61 |
98 % |
59 |
95 % |
50 |
80 % |
|
|
REGION AFRIQUE CENTRALE |
555 |
551 |
99 % |
500 |
90 % |
346 |
62 % |
|
|
REGION AFRIQUE EST ET AUSTRALE |
3 176 |
3 166 |
100 % |
3 022 |
95 % |
2 116 |
67 % |
|
|
Région Afrique Occidentale |
1 958 |
1 943 |
99 % |
1 903 |
97 % |
1 399 |
71 % |
|
|
Région Caraïbes |
535 |
531 |
99 % |
474 |
89 % |
323 |
60 % |
|
|
Région Pacifique |
326 |
324 |
99 % |
277 |
85 % |
186 |
57 % |
|
|
Total regional cooperation ACP |
14 355 |
14 182 |
99 % |
13 534 |
94 % |
10 662 |
74 % |
|
|
ACP |
49 785 |
49 110 |
99 % |
46 838 |
94 % |
39 070 |
78 % |
|
|
OCT |
Réserve / Non réparti par par pays/terri |
31 |
14 |
44 % |
11 |
37 % |
10 |
32 % |
|
All OCT countries |
31 |
14 |
44 % |
11 |
37 % |
10 |
32 % |
|
|
Anguilla |
28 |
28 |
100 % |
27 |
99 % |
27 |
99 % |
|
|
Iles Falklands (Malouines) |
10 |
10 |
100 % |
10 |
98 % |
10 |
98 % |
|
|
Iles Pitcairn |
5 |
5 |
100 % |
5 |
100 % |
5 |
100 % |
|
|
Iles Turks-et-Caicos |
33 |
33 |
100 % |
33 |
100 % |
32 |
97 % |
|
|
Iles Vierges britanniques |
2 |
2 |
100 % |
2 |
98 % |
2 |
90 % |
|
|
Montserrat |
33 |
33 |
100 % |
33 |
100 % |
31 |
94 % |
|
|
Sainte Hélène |
38 |
38 |
100 % |
38 |
100 % |
35 |
94 % |
|
|
Total British OCT |
148 |
148 |
100 % |
147 |
100 % |
141 |
96 % |
|
|
Antilles néerlandaises |
41 |
41 |
100 % |
23 |
57 % |
19 |
46 % |
|
|
Antilles néerlandaises — Bonaire |
4 |
4 |
100 % |
4 |
91 % |
2 |
55 % |
|
|
Antilles néerlandaises — Saba |
4 |
4 |
100 % |
3 |
97 % |
3 |
97 % |
|
|
Antilles néerlandaises — Sint-Eustatius |
2 |
2 |
100 % |
2 |
97 % |
2 |
97 % |
|
|
Aruba |
21 |
21 |
100 % |
21 |
99 % |
18 |
84 % |
|
|
Sint Maarten |
14 |
14 |
100 % |
7 |
51 % |
4 |
31 % |
|
|
Total Dutch OCT |
86 |
86 |
100 % |
61 |
71 % |
49 |
57 % |
|
|
Iles Wallis et Futuna |
39 |
39 |
100 % |
37 |
95 % |
26 |
66 % |
|
|
Mayotte |
29 |
29 |
100 % |
29 |
100 % |
29 |
100 % |
|
|
Nouvelle-Calédonie |
50 |
50 |
100 % |
50 |
100 % |
49 |
98 % |
|
|
Polynésie française |
51 |
51 |
100 % |
50 |
98 % |
49 |
96 % |
|
|
Saint-Pierre-et-Miquelon |
47 |
47 |
100 % |
47 |
100 % |
47 |
100 % |
|
|
Total French OCT |
215 |
215 |
100 % |
212 |
99 % |
199 |
93 % |
|
|
Réserve/non réparti par région |
137 |
137 |
100 % |
136 |
99 % |
71 |
52 % |
|
|
Total regional cooperation OCT |
137 |
137 |
100 % |
136 |
99 % |
71 |
52 % |
|
|
OCT |
617 |
599 |
97 % |
567 |
92 % |
471 |
76 % |
|
|
|
TOTAL: ACP+OCT |
50 402 |
49 709 |
99 % |
47 406 |
94 % |
39 540 |
78 % |
Breakdown of committed, contracted and paid amount by spending area for the 11th EDF
11TH EDF Breakdown of committed, contracted and paid amount by spending area (DAC sector codes) (21)
|
(EUR million) |
|||
|
Sector |
Committed |
Contracted |
Paid |
|
Social infrastructure and services |
|
|
|
|
110-Education |
1 192,46 |
1 064,95 |
839,46 |
|
120-Health |
2 131,40 |
2 419,57 |
2 073,28 |
|
130-Population policies/programmes and reproductive health |
352,44 |
40,12 |
25,41 |
|
140-Water and sanitation |
788,50 |
728,46 |
365,94 |
|
150-Government and civil society |
5 909,31 |
5 883,98 |
4 812,88 |
|
160-Other social infrastructure and services |
996,71 |
1 448,73 |
1 299,56 |
|
Social infrastructure and services TOTAL |
11 370,82 |
11 585,81 |
9 416,53 |
|
Economic infrastructure and services |
|
|
|
|
210-Transport and storage |
1 425,48 |
1 933,76 |
742,39 |
|
220-Communications |
140,96 |
139,91 |
83,87 |
|
230-Energy |
2 015,13 |
1 752,16 |
836,02 |
|
240-Banking and financial services |
93,93 |
116,10 |
50,50 |
|
250-Business and other services |
346,23 |
276,47 |
123,41 |
|
Economic infrastructure and services TOTAL |
4 021,71 |
4 218,41 |
1 836,20 |
|
Production sectors |
|
|
|
|
310-Agriculture, forestry and fishing |
3 251,42 |
2 823,53 |
1 839,53 |
|
320-Industry, mineral resources and mining, construction |
644,39 |
424,96 |
158,21 |
|
330-Trade and tourism |
498,46 |
419,71 |
203,21 |
|
Production sectors TOTAL |
4 394,26 |
3 668,20 |
2 200,94 |
|
Multisector/Cross-cutting |
|
|
|
|
410-General environmental protection |
989,44 |
821,21 |
481,09 |
|
430-Other multisector |
3 882,47 |
2 445,97 |
1 365,91 |
|
Multisector/Cross-cutting TOTAL |
4 871,91 |
3 267,18 |
1 847,01 |
|
Commodity aid and general programme assistance |
|
|
|
|
510-General budget support |
3 116,32 |
3 149,33 |
2 436,61 |
|
520-Developmental food assistance |
614,50 |
385,77 |
347,06 |
|
Commodity aid and general programme assistance TOTAL |
3 730,82 |
3 535,09 |
2 783,68 |
|
Action relating to debt |
|
|
|
|
600-Action relating to debt |
91,50 |
91,50 |
91,50 |
|
Action relating to debt TOTAL |
91,50 |
91,50 |
91,50 |
|
Humanitarian aid |
|
|
|
|
720-Emergency response |
746,19 |
460,11 |
437,98 |
|
730-Reconstruction relief and rehabilitation |
137,83 |
44,16 |
34,02 |
|
740-Disaster preparedness |
72,79 |
109,06 |
78,89 |
|
Humanitarian aid TOTAL |
956,81 |
613,33 |
550,89 |
|
Administrative costs of donors / Unallocated / Unspecified |
|
|
|
|
910-Administrative costs of donors |
982,02 |
968,04 |
777,47 |
|
998-Unallocated / Unspecified |
183,30 |
36,68 |
21,44 |
|
N/A-Not Available |
260,50 |
1,57 |
1,15 |
|
Administrative costs of donors / Unallocated / Unspecified TOTAL |
1 425,82 |
1 006,29 |
800,06 |
|
GRAND TOTAL OF 11TH EDF of committed, contracted and paid amount |
30 863,65 |
27 985,81 |
19 526,81 |
Evolution of cumulative committed, contracted and paid amount by spending area for the 11th EDF


3. GLOSSARY
Administrative appropriations
Appropriations to cover the running costs of the entities (staff, buildings, office equipment).
Adopted budget
Draft budget becomes the adopted budget as soon as approved by the budgetary authority.
Amending budget
Decision adopted during the budget year to amend (increase, decrease, transfer) aspects of the adopted budget of that year.
Appropriations
Budget funding.
The budget forecasts both commitments (legal pledges to provide finance) and payments (cash or bank transfers to the beneficiaries). Appropriations for commitments and payments often differ — differentiated appropriations — because multiannual programmes and projects are usually fully committed in the year they are decided and are paid over the years as the implementation of the programme and project progresses.
Assigned revenue
Revenue dedicated to finance specific items of expenditure.
Budget result
The difference between income received and amounts paid, including adjustments for carry-overs, cancellations and exchange rate differences.
For agencies, the resulting amount will have to be reimbursed to the funding authority.
Budget implementation
Consumption of the budget through expenditure and revenue operations.
Budget item / Budget line / Budget position
Revenue and expenditure are shown in the budget structure in accordance with a binding nomenclature, which reflects the nature and purpose of each item, as imposed by the budgetary authority. The individual headings (title, chapter, article or item) provide a formal description of the nomenclature.
Budgetary commitment
Operation by which the authorising officer responsible reserves the budget appropriations necessary to cover for subsequent payments to honour legal commitments.
Cancellation of appropriations
Appropriations which have not been used by the end of the financial year and which cannot be carried over, shall be cancelled.
Carryover of appropriations
Exception to the principle of annuality in so far as appropriations that could not be used in a given budget year may, under strict conditions, be exceptionally carried over for use during the following year.
Commitment appropriations
Commitment appropriations cover the total value of legal obligations (contracts, grant agreements or decisions) that could be signed in the current financial year.
De-commitment
Operation whereby the authorising officer responsible cancels wholly or partly the reservation of appropriations previously made by means of a budgetary commitment.
Differentiated appropriations
Differentiated appropriations are used to finance multiannual operations; they cover, for the current financial year, the total cost of the legal obligations entered into for operations whose implementation extends over more than one financial year.
Economic result
Impact on the balance sheet of expenditure and revenue based on accrual accounting rules.
Entitlements established
Right to collect income from a debtor as recognised through the issuing of a recovery order.
Exchange rate difference
The difference resulting from currency exchange rates applied to the transactions concerning countries outside the euro area, or from the revaluation of assets and liabilities in foreign currencies at the date of the accounts.
Expenditure
Term used to describe spending the budget from all types of funds sources.
Grants
Direct financial contributions from the budget to third-party beneficiaries, engaged in activities that serve Union policies.
Lapsing appropriations
Unused appropriations to be cancelled at the end of the financial year. Lapsing means the cancellation of all or part of the authorisation to make expenditures and/or incur liabilities, as represented by an appropriation.
For joint undertakings (and EIT), as specified in their Financial Rules, any unused appropriations may be entered in the estimate of revenue and expenditure of up to the following three financial years (the so-called ‘N+3’ rule). Hence, lapsing appropriations for JUs can be re-activated until financial year ‘N+3’.
Legal basis / basic act
The legal act adopted by the legislative authority (usually the Council and European Parliament) specifying the objective of a Union spending programme, the purpose of the appropriations, the rules for intervention, expiry date and the relevant financial rules to serve as a legal basis for the implementation of the spending programme.
Legal commitment
The act whereby the Authorising Officer enters into an obligation towards third parties which results in a charge for the Union budget.
Common forms of legal commitments are contracts in the case of procurement, grant agreements and grant decisions.
Non-differentiated appropriations
Appropriations which meet annual needs and must therefore be committed during the budget year. Only amounts qualifying for automatic carryover can be disbursed in the following year. Non-differentiated appropriations which have not been used, i.e. committed, by the end of the year, are cancelled (unless, exceptionally, permission is given by a Commission decision for a non-automatic carryover). Non-differentiated appropriations apply to administrative expenditure and commitment appropriations equal payment appropriations.
Operational appropriations
Operational appropriations finance the different policies, mainly in the form of grants or procurement.
Outstanding commitments
Outstanding commitments (or RAL, from the French ‘reste à liquider’) are defined as the amount of appropriations committed that have not yet been paid. They stem directly from the existence of multiannual programmes and the dissociation between commitment and payment appropriations.
Payment appropriations
Payment appropriations cover expenditure due in the current year, arising from legal commitments entered in the current year and/or earlier years.
RAL (Reste à liquider)
Amount remaining to be paid on a budgetary commitment at a given moment. Cf. Outstanding commitments
Surplus
Positive difference between revenue and expenditure, which has to be returned to the funding authority. Cf. Budget result
Transfer between budget lines
Transfers between budget lines imply the relocation of appropriations from one budget line to another, in the course of the financial year, and thereby they constitute an exception to the budgetary principle of specification.
ANNUAL REPORT ON IMPLEMENTATION — FUNDS MANAGED BY THE EUROPEAN INVESTMENT BANK
|
EUROPEAN INVESTMENT BANK |
CA/551/22 10 March 2022 |
||||||||||||
|
|
Document 22/071 |
||||||||||||
|
|
|||||||||||||
|
INVESTMENT FACILITY FINANCIAL STATEMENTS AS AT 31 DECEMBER 2021 |
|||||||||||||
|
|||||||||||||
STATEMENT OF FINANCIAL POSITION
AS AT 31 DECEMBER 2021
|
(in EUR’000) |
|||
|
|
Notes |
31.12.2021 |
31.12.2020 |
|
ASSETS |
|
|
|
|
Cash and cash equivalents |
5 |
1 358 564 |
923 940 |
|
Amounts receivable from contributors |
9/17 |
85 210 |
68 908 |
|
Treasury financial assets |
10 |
— |
351 873 |
|
Derivative financial instruments |
6 |
7 |
33 584 |
|
Loans and advances |
7 |
1 986 281 |
1 673 445 |
|
Shares and other variable yield securities |
8 |
697 631 |
526 810 |
|
Other assets |
11 |
1 086 |
109 |
|
Total assets |
|
4 128 779 |
3 578 669 |
|
LIABILITIES AND CONTRIBUTORS’ RESOURCES |
|
|
|
|
LIABILITIES |
|
|
|
|
Derivative financial instruments |
6 |
18 835 |
642 |
|
Deferred income |
12 |
48 432 |
29 732 |
|
Provisions for guarantees issued |
13 |
— |
851 |
|
Provisions for loan commitments |
14 |
16 602 |
33 152 |
|
Amounts owed to third parties |
15 |
239 639 |
152 378 |
|
Other liabilities |
16 |
2 333 |
3 446 |
|
Total liabilities |
|
325 841 |
220 201 |
|
CONTRIBUTORS’ RESOURCES |
|
|
|
|
Facility Member States’ contribution called |
17 |
3 471 695 |
3 221 695 |
|
Retained earnings |
|
331 243 |
136 773 |
|
Total contributors’ resources |
|
3 802 938 |
3 358 468 |
|
Total liabilities and contributors’ resources |
|
4 128 779 |
3 578 669 |
STATEMENT OF PROFIT OR LOSS AND OTHER COMPREHENSIVE INCOME
FOR THE YEAR ENDED 31 DECEMBER 2021
|
(in EUR’000) |
|||
|
|
Notes |
From 1.1.2021 |
From 1.1.2020 |
|
to 31.12.2021 |
to 31.12.2020 |
||
|
Interest and similar income (*9) |
19 |
86 456 |
84 783 |
|
Interest and similar expenses |
19 |
-10 436 |
-5 250 |
|
Net interest and similar income |
|
76 020 |
79 533 |
|
Fee and commission income |
20 |
2 219 |
353 |
|
Fee and commission expenses |
20 |
-175 |
-225 |
|
Net fee and commission income |
|
2 044 |
128 |
|
Fair value change of derivative financial instruments |
|
-51 770 |
18 949 |
|
Net result on shares and other variable yield securities |
21 |
123 627 |
-46 717 |
|
Net result on loans and advances measured at FVTPL |
7 |
3 568 |
-29 621 |
|
Sale of loans and proceeds from recovery actions |
|
— |
2 362 |
|
Net foreign exchange result |
|
33 676 |
-48 545 |
|
Net result on financial operations |
|
109 101 |
- 103 572 |
|
Change in impairment on loans and advances, net of reversals |
7 |
42 974 |
-4 312 |
|
Change in provisions for guarantees, net of reversals |
13 |
851 |
-228 |
|
Change in provisions for loan commitments, net of reversals |
14 |
16 616 |
3 715 |
|
General administrative expenses |
22 |
-53 136 |
-58 527 |
|
Profit / (loss) for the year |
|
194 470 |
-83 263 |
|
Total comprehensive income profit / (loss) for the year |
|
194 470 |
-83 263 |
STATEMENT OF CHANGES IN CONTRIBUTORS’ RESOURCES
FOR THE YEAR ENDED 31 DECEMBER 2021
|
(in EUR’000) |
||||
|
|
Notes |
Contribution called |
Retained earnings |
Total |
|
At 1 January 2021 |
|
3 221 695 |
136 773 |
3 358 468 |
|
Member States’ contribution called during the year |
17 |
250 000 |
— |
250 000 |
|
Profit for the year 2021 |
|
— |
194 470 |
194 470 |
|
Changes in contributors’ resources |
|
250 000 |
194 470 |
444 470 |
|
At 31 December 2021 |
|
3 471 695 |
331 243 |
3 802 938 |
|
At 1 January 2020 |
|
2 967 000 |
220 036 |
3 187 036 |
|
Member States’ contribution called during the year |
17 |
209 614 |
— |
209 614 |
|
Reallocation of 9th EDF Contribution to interest subsidies and technical assistance to Contributor’s resources |
17 |
45 081 |
— |
45 081 |
|
(Loss) for the year 2020 |
|
— |
-83 263 |
-83 263 |
|
Changes in contributors’ resources |
|
254 695 |
-83 263 |
171 432 |
|
At 31 December 2020 |
|
3 221 695 |
136 773 |
3 358 468 |
STATEMENT OF CASH FLOWS
FOR THE YEAR ENDED 31 DECEMBER 2021
|
(in EUR’000) |
|||
|
|
Notes |
From 1.1.2021 to 31.12.2021 |
From 1.1.2020 to 31.12.2020 |
|
OPERATING ACTIVITIES |
|
|
|
|
Profit / (loss) for the year |
|
194 470 |
-83 263 |
|
Adjustments made for |
|
|
|
|
Net result in fair value on shares and other variable yield securities |
8 |
- 130 991 |
47 909 |
|
Change in impairment on loans and advances, net of reversals |
7 |
-42 974 |
4 312 |
|
Net result on loans and advances measured at FVTPL |
|
-3 568 |
29 621 |
|
Change in accrued interest and amortised cost on loans and advances |
7 |
6 462 |
-5 202 |
|
Net change in provisions for guarantees issued, net of reversals |
13 |
-851 |
228 |
|
Net change in provisions for loan commitments, net of reversals |
|
-16 550 |
-4 117 |
|
Fair value changes on derivatives |
|
51 770 |
-18 949 |
|
Change in accrued interest and amortised cost on treasury financial assets |
10 |
-1 271 |
1 067 |
|
Change in deferred income |
|
18 700 |
-2 834 |
|
Effect of exchange rate changes on loans |
7 |
-84 893 |
90 878 |
|
Effect of exchange rate changes on shares and other variable yield securities |
8 |
-27 230 |
33 616 |
|
Effect of exchange rate changes on cash held |
|
-9 875 |
9 233 |
|
(Loss) / profit on operating activities before changes in operating assets and liabilities |
|
-46 801 |
102 499 |
|
Loan disbursements |
7 |
- 515 212 |
- 560 291 |
|
Repayments of loans |
7 |
339 944 |
276 101 |
|
Sale of loans and proceeds from recovery actions |
|
— |
2 362 |
|
Change in accrued interest on cash and cash equivalents |
5 |
-304 |
66 |
|
(Increase) in treasury financial assets |
10 |
-2 333 691 |
-2 710 009 |
|
Maturities of treasury financial assets |
10 |
2 684 293 |
2 689 790 |
|
Increase in shares and other variable yield securities |
8 |
-84 224 |
-85 305 |
|
Net proceeds from shares and other variable yield securities |
|
77 749 |
85 477 |
|
Increase in other assets |
|
977 |
109 |
|
(Increase) / Decrease in other liabilities |
|
1 113 |
-1 093 |
|
Increase in amounts payable to the European Investment Bank |
|
34 598 |
8 543 |
|
Net cash flows in / (used) in operating activities |
|
158 442 |
- 191 751 |
|
FINANCING ACTIVITIES |
|
|
|
|
Contribution received from Member States |
|
250 444 |
227 035 |
|
Amounts received from Member States with regard to interest subsidies and technical assistance |
|
63 254 |
60 387 |
|
Amounts paid on behalf of Member States with regard to interest subsidies and technical assistance |
|
-27 337 |
-18 807 |
|
Net cash flows from financing activities |
|
286 361 |
268 615 |
|
Net increase in cash and cash equivalents |
|
444 803 |
76 864 |
|
Summary statement of cash flows: |
|
|
|
|
Cash and cash equivalents at the beginning of financial year |
|
924 077 |
837 980 |
|
Net cash flows from / (used in): |
|
|
|
|
Operating activities |
|
158 442 |
- 191 751 |
|
Financing activities |
|
286 361 |
268 615 |
|
Effects of exchange rate changes on cash and cash equivalents |
|
-9 875 |
9 233 |
|
Cash and cash equivalents at the end of financial year |
|
1 359 005 |
924 077 |
|
Cash and cash equivalents are composed of: |
|
|
|
|
Cash in hand |
5 |
434 064 |
398 991 |
|
Term deposits (excluding accrued interest) |
5 |
672 730 |
380 000 |
|
Commercial papers |
5 |
252 211 |
145 086 |
|
|
|
1 359 005 |
924 077 |
Notes to the financial statements as at 31 December 2021
1. General information
The Investment Facility (‘the Facility’ or ‘IF’) has been established within the framework of the Cotonou Agreement (the ‘Agreement’) on co-operation and development assistance negotiated between the African, Caribbean and Pacific Group of States (the ‘ACP States’) and the European Union and its Member States on 23 June 2000, revised on 25 June 2005 and 22 June 2010.
The Facility is not a separate legal entity and the European Investment Bank (‘EIB’ or ‘the Bank’) manages the contributions on behalf of the Member States (‘Donors’) in accordance with the terms of the Agreement and acts as an administrator of the Facility.
Financing under the Agreement is provided from EU Member States’ budgets. EU Member States contribute with the amounts allocated to finance the IF and grants for the financing of the interest subsidies as provided for under the multi-annual financial frameworks (First Financial Protocol covering the period 2000–2007 and referred to as the 9th European Development Fund (EDF), Second Financial Protocol covering the period 2008–2013 and referred to as the 10th EDF and the Third Financial Protocol covering the period 2014–2020 referred to as the 11th EDF). The EIB is entrusted with the management of:
|
(i) |
the Facility, a EUR 3 685,5 million risk-bearing revolving fund geared to fostering private sector investment in ACP States of which EUR 48,5 million are allocated to overseas countries and territories (‘OCT countries’); |
|
(ii) |
grants for the financing of interest subsidies worth max. EUR 1 220,85 million for ACP States and max. EUR 8,5 million for OCT countries. Up to 15 % of these subsidies can be used to fund project-related technical assistance (‘TA’). |
The EU and ACP sides agreed to amend the decision on transitional measures in order to extend the application of the provisions of the ACP-EU Partnership Agreement until 30 June 2022, or until the entry into force of the new Agreement or the provisional application between the Union and the ACP States of the new Agreement, whichever comes first (Decision No 3/2021 of the ACP-EU Committee of Ambassadors of 26 November 2021 to amend Decision No 3/2019 of the ACP EU Committee of Ambassadors to adopt transitional measures pursuant to Article 95(4) of the ACP EU Partnership Agreement (22)).
The NDICI — Global Europe Regulation, which entered into force on 14 June 2021 (Regulation (EU) 2021/947 of the European Parliament and of the Council (23)), provides the primary legal basis for EU assistance outside the EU in 2021–2027, and the governance for the Bank’s new institutional mandate for operations outside the European Union, including the ACP region. This includes the integration of the current extra-budgetary EDF into the EU budget. The NDICI Regulation provides the legal basis for the Commission to entrust future EU mandates to the EIB for its activity outside the EU. It will also provide the external investment framework for the Union to cooperate with partner institutions through grants or guarantees from the EU budget.
On 23 December 2020, the Council decided to extend the ACP Investment Facility commitment period by at least six months. Going forward, reflows from the ACP IF shall be deployed within the NDICI framework through a combination of a dedicated ACP private sector window under the European Fund for Sustainable Development (EFSD+) and a Trust Fund, both to be implemented by the EIB. The ACP Infrastructure Package, currently secured by the Investment Facility reflows will be transferred to Dedicated Investment Window 1 guarantee, in order to release the ACP Investment Facility reflows net of any prior Investment Facility commitments (in terms of approvals, signatures and guarantees). The ACP Infrastructure Package will be part of the EFSD+ guarantee agreement.
Following, the extension of the Investment Facility commitment period, the Bank approved operations in line with its Mandate until 30 June 2021 (24).
The financial statements have been prepared on a going concern basis, which assumes that the Investment Facility will be able to meet all monies payables under any operations. The duration of the Investment Facility is not determined. The 11th EDF Internal Agreement remains in force (pursuant to Article 14(3) thereof) so long as is necessary for all the operations financed under the ACP-EU Partnership Agreement, the Overseas Association Decision and the multi-annual financial framework to be fully executed.
The present financial statements cover the period from 1 January 2021 to 31 December 2021.
On a proposal from the Management Committee, the Board of Directors adopted the Financial Statements on 10 March 2022 and authorised their submission to the Board of Governors for approval by 22 April 2022.
2. Significant accounting policies
2.1. Basis of preparation — Statement of compliance
The Facility’s financial statements have been prepared in accordance with International Financial Reporting Standards (IFRS) as adopted by the European Union.
2.2. Significant accounting judgments and estimates
The preparation of financial statements requires the use of accounting estimates. It also requires the Bank’s Management to exercise its judgment in the process of applying the Investment Facility’s accounting policies. The areas involving a higher degree of judgment or complexity, or areas where assumptions and estimates are significant to the financial statements are disclosed hereafter.
The most significant use of judgments and estimates are as follows:
— Measurement of fair value of financial instruments
Fair values of financial assets (‘FA’) and financial liabilities (‘FL’) that are traded in active markets are based on quoted market prices or broker price quotations. Where the fair values cannot be derived from active markets, they are determined using a variety of valuation techniques that include the use of mathematical models. The input to these models is taken from observable markets where possible, but where this is not feasible, a degree of judgement is required in establishing fair values. The valuations are categorised into different levels in the fair value hierarchy based on the inputs used in the valuation techniques as described and disclosed in Notes 2.4.2 and 4.
— Impairment losses on loans and advances
The expected credit loss (‘ECL’) measurement requires management to apply significant judgments, in particular, the assessment of a significant increase in credit risk since initial recognition, the incorporation of forward looking information and further the estimation of the amount and timing of future cash flows and collateral values when determining impairment losses. These estimates are driven by a number of factors, which can result in significant changes to the timing and amount of allowance for credit loss to be recognised (Note 2.4.2). Relevant assumptions on the effects on impairment resulting from COVID-19 are detailed under Note 2.4.2 and Note 3.2.3.7.
— Valuation of unquoted equity investments
Valuation of unquoted equity investments is normally based on one of the following:
|
— |
recent arm’s length market transactions, |
|
— |
current fair value of another instrument that is substantially the same, |
|
— |
the expected cash flows discounted at current rates applicable for items with similar terms and risk characteristics, |
|
— |
adjusted net assets method, or |
|
— |
other valuation models. |
The determination of the cash flows and discount factors for unquoted equity investments requires significant estimation. The Facility calibrates the valuation techniques periodically and tests them for validity using either price from observable current market transactions in the same instrument or from other available observable market data.
— Consolidation of entities in which the Facility holds interest
The EIB made significant judgements that none of the entities in which it holds interest, are controlled by the Facility. This is due to the fact that in all such entities, either the General Partner or the Fund Manager or the Management Board have the sole responsibility for the management and control of the activities and affairs of the partnership and have the power and authority to do all things necessary to carry out the purpose and objectives of the partnership complying with the investment and policy guidelines.
— Uncertainty arising from inter-bank offered rates (‘IBOR’) reform
For benchmark cessing to exist immediately after 30 June 2023, namely USD LIBOR, the Facility applies the International Accounting Standards Board (‘IASB’) Phase 1 amendments related to the uncertainty.
2.3. Changes in accounting policies
Except for the changes below, the Facility has consistently applied the accounting policies set out in Note 2.4 to all periods presented in these financial statements. The Facility has adopted the following new standards and amendments to standards.
Standards adopted
The following interpretations, as well as the amendments to and revision of existing standards, became effective for the Facility’s financial statements as of 1 January 2021:
Interest Rate Benchmark Reform — Phase 2 Amendments to IFRS 9 and IFRS 7 (IBOR reform Phase 2)
These amendments, issued on 27 August 2020, concluded the IASB response to the ongoing reform of IBOR and other interest rate benchmarks.
The amendments focus on the effects on financial statements when a company replaces the old interest rate benchmark with an alternative benchmark rate as a result of the reform. They provide practical relief from certain requirements of the standards.
In particular, those reliefs relate to modification of financial instruments, lease contracts or hedge relationships when a benchmark interest rate in a contract is replaced with a new alternative benchmark rate.
When the change to contractual cash flow of a financial instrument is the direct consequence of the interest rate benchmark reform and this change is performed on an economically equivalent basis, the Phase 2 amendments provide a practical expedient to update the effective interest rate to reflect the change without derecognising or adjusting the carrying amount of the financial instrument. The amendments also provide an exception to use a revised discount rate that reflects the change in interest when remeasuring a lease liability rate because of a modification required by the reform.
Finally, the Phase 2 amendments provide a series of reliefs from the hedge accounting requirements when the change is a direct consequence of the reform and is performed on economically equivalent basis. In particular, a company will not have to discontinue its hedge accounting solely because it makes changes required by the reform.
The adoption of the amendments to the standards was performed retrospectively with no impact on the opening balance.
Standards issued but not yet adopted, affecting the Facility
Annual improvements 2018–2020 cycle (amendments on IFRS 1 and IFRS 9) and narrow scope amendments to IFRS 3 and IAS 37
Amendments to IFRS 3 ‘Business Combinations’ — update a reference in IFRS 3 to the Conceptual Framework for Financial Reporting without changing the accounting requirements for business combinations.
Amendments to IAS 37 ‘Provisions, contingent liabilities and contingent assets’ — specify which costs an entity includes when assessing whether a contract will be loss-making.
These amendments have been endorsed by the EU on 28 June 2021 and are effective for annual periods beginning on or after 1 January 2022.
The Facility did not adopt these amendments earlier and does not expect them to have a significant impact on the Facility’s financial statements.
2.4. Summary of significant accounting policies
The statement of financial position represents assets and liabilities in decreasing order of liquidity and does not distinguish between current and non-current items.
2.4.1.
The Facility uses the euro (EUR) for presenting its financial statements, which is also the functional currency. Except as otherwise indicated, financial information presented in EUR has been rounded to the nearest thousand.
Foreign currency transactions are translated, at the exchange rate prevailing on the date of the transaction.
Monetary assets and liabilities denominated in currencies other than euro are translated into euro at the exchange rate prevailing at the statement of financial position date. The gain or loss arising from such translation is recorded in the statement of profit or loss and other comprehensive income.
Non-monetary items that are measured in terms of historical cost in a foreign currency are translated using the exchange rates at the dates of the initial transactions. Non-monetary items measured at fair value in a foreign currency are translated using the exchange rates at the date when the fair value was determined.
Exchange differences arising on the settlement of transactions at rates different from those at the date of the transaction, and unrealised foreign exchange differences on unsettled foreign currency monetary assets and liabilities, are recognised in the statement of profit or loss and other comprehensive income.
2.4.2.
Non-derivative financial instruments are initially recognised using the settlement date basis.
Classification and measurement
Financial assets
On initial recognition, a financial asset is classified as measured at amortised cost (‘AC’), fair value through other comprehensive income (‘FVOCI’) or fair value through P&L (‘FVTPL’) and a financial liability is classified as measured at AC or FVTPL.
Under IFRS 9, classification starts with determining whether the financial asset shall be considered as a debt or equity instrument. IFRS 9 refers to the definitions in IAS 32 Financial Instruments: Presentation.
Debt instruments are those instruments that meet the definition of a financial liability from the counterparty’s perspective, loans and debt securities including bonds, notes or certificates issued by structured entities, government or corporates.
A debt instrument is classified at AC if it meets both of the following conditions and is not designated as at FVTPL:
|
— |
the asset is held within a business model whose objective is to hold assets to collect contractual cash flows, and |
|
— |
the contractual terms of the financial asset give rise on specified dates to cash flows that are solely payments of principal and interest on the principal amount outstanding (SPPI criteria). |
A debt instrument is classified at FVOCI only if it meets both of the following conditions and is not designated as at FVTPL:
|
— |
the asset is held within a business model whose objective is achieved by both collecting contractual cash flows and selling financial assets, and |
|
— |
the contractual terms of the financial asset give rise on specific dates to cash flows that are fulfilling the SPPI criteria. |
The above requirements should be applied to an entire financial asset, even if it contains an embedded derivative.
Equity instruments are instruments that meet the definition of equity from the issuer’s perspective; that is, instruments that do not contain a contractual obligation to pay and that evidence a residual interest in the issuer’s net assets. Equity instruments are measured at FVTPL.
On initial recognition of an equity investment that is not held for trading, the Facility may irrevocably elect to present subsequent changes in other comprehensive income. This election is made on an investment-by-investment basis.
All other financial assets are classified as measured at FVTPL.
Business model assessment
The EIB, as a manager of the Facility, makes an assessment of the objective of a business model in which a debt instrument is held at a portfolio level because this best reflects the way the business is managed and information is provided to management. The information considered includes:
|
— |
the stated policies and objectives for the portfolio and the operation of those policies in practice. In particular, whether management's strategy focuses on earning contractual interest revenue, maintaining a particular interest rate profile, matching the duration of the financial assets to the duration of the liabilities that are funding those assets or realising cash flows through the sale of the assets, |
|
— |
how the performance of the portfolio is evaluated and reported to the Facility’s management, |
|
— |
the risks that affect the performance of the business model (and the financial assets held within that business model) and how those risks are managed, and |
|
— |
the frequency, volume and timing of sales in prior periods, the reasons for such sales and its expectation about future sales activity. |
However, information about sales activity is not considered in isolation, but as part of an overall assessment of how the Facility stated objective for managing the financial assets is achieved and how cash flows are realised.
The business model for the Impact Financing Envelope direct loan operations has been described and disclosed in Note 24.
Solely payment of principal and interests (‘SPPI’) criteria
For the purpose of this assessment, ‘principal’ is defined as the fair value of the debt instrument on initial recognition. ‘Interest’ is defined as consideration for the time value of money and for the credit risk associated with the principal amount outstanding during a particular period of time and for other basic lending risks and costs (e.g. liquidity risk and administrative costs), as well as profit margin.
In assessing whether the contractual cash flows are solely payments of principal and interest, the contractual terms of the instrument are considered. This includes assessing whether the financial asset contains a contractual term that could change the timing or amount of contractual cash flows such that it would not meet this condition.
Derecognition
The Facility derecognises a financial asset when the contractual rights to the cash flows from the financial asset expire, or the rights to receive the contractual cash flow are transferred in a transaction in which either the Facility transfers the risks and rewards of ownership of the financial asset or it retains substantially all of the risks and rewards of ownership but does not retain control of the financial asset.
On derecognition of a financial asset or financial liability (Note 2.4.4), the difference between the carrying amount of the asset or liability (or the carrying amount allocated to the portion of the asset or liability derecognised) and the sum of (i) the consideration received or paid; and (ii) any cumulative gain or loss that had been recognised in other comprehensive income is recognised in profit or loss except for the cumulative gains or losses recognised in other comprehensive income for equity investments measured at fair value through other comprehensive income which are transferred to the reserve fund rather than profit or loss on disposal.
In the context of IBOR reform, the Facility’s assessment of whether a change to an amortised cost financial instrument is substantial, is made after applying the practical expedient introduced by IBOR reform Phase 2. As per the amendments issued by the IASB, the Facility does not derecognise a financial instrument, which contractual cash flows are modified as a direct consequence from the reform and the change is economically equivalent to the previous basis for determining the contractual cash flows (i.e., the basis immediately before the change).
Reclassification
Financial assets are not reclassified subsequent to their initial recognition, except in the period after the Facility changes its business model for managing financial assets.
Modification
A financial asset measured at amortised cost is considered modified when its contractual cash flows are renegotiated or otherwise modified. Renegotiation or modification may or may not lead to derecognition of the old and recognition of the new financial instrument.
A substantial contractual modification on the cash flows of a financial asset measured at amortised cost which results in the derecognition of the financial asset, leads to the recognition of the new financial asset at its fair value, and the recording of the modification gain or loss impact in the consolidated income statement under ‘Result on financial operations’.
A contractual modification is deemed substantial if the discounted present value of the cash flows under the revised terms (discounted using the original effective interest rate) is at least 10 % different from the discounted present value of the remaining cash flows of the original financial asset. Qualitative factors such as a change in the currency on which the financial asset is denominated and conversion features are also considered.
In the context of IBOR reform, the Facility’s assessment of whether a change to an amortised cost financial instrument is substantial, is made after applying the practical expedient introduced by IBOR reform Phase 2. The Facility updates the effective interest rate, without modifying the carrying amount of the financial instrument if the basis for determining the contractual cash flows of the financial instrument, measured at amortised cost, changes as a direct consequence from the reform and if the change is economically equivalent to the previous basis (i.e., the basis immediately before the change).
Measurement of fair values of financial instruments
Fair value is the price that would be received to sell an asset or paid to transfer a liability in an orderly transaction between market participants at the measurement date in the principal, or in its absence, the most advantageous market to which the Facility has access at that date.
When applicable, the EIB on behalf of the Facility measures the fair value of an instrument using the quoted price in an active market for that instrument. A market is regarded as active if transactions for the asset or liability take place with sufficient frequency and volume to provide pricing information on an ongoing basis.
Where the fair values of financial assets and financial liabilities recorded on the statement of financial position cannot be derived from active markets, they are determined using a variety of valuation techniques that include the use of mathematical models. The input to these models is taken from observable markets where possible, but where this is not feasible, a degree of judgement is required in establishing fair values. The chosen valuation technique incorporates all the factors that market participants would take into account in pricing a transaction.
These valuation techniques may include net present value and discounted cash flow models, comparison to similar instruments for which market observable prices exist, Black-Scholes and polynomial option pricing models and other valuation models. Assumptions and inputs used in valuation techniques include risk-free and benchmark interest rates, credit spreads used in estimating discount rates, bond and equity prices, foreign currency exchange rates, equity and equity index prices and expected price volatilities and correlations.
The objective of valuation techniques is to arrive at a fair value measurement that reflects the price that would be received to sell the asset or paid to transfer the liability in an orderly transaction between market participants at the measurement date.
The Bank uses widely recognised valuation models for determining the fair value of common and more simple financial instruments, like interest rate and currency swaps that use only observable market data and require limited management judgement and estimation. Observable prices and model inputs are usually available in the market for listed debt and equity securities, exchange traded derivatives and simple over the counter derivatives like interest rate swaps. Availability of observable market prices and model inputs reduces the need for management judgement and estimation and also reduces the uncertainty associated with determination of fair values. Availability of observable market prices and inputs varies depending on the products and markets and is prone to changes based on specific events and general conditions in the financial markets.
For more complex instruments, the Bank uses its own valuation models, which are developed from recognised valuation models. Some or all of the significant inputs into these models may not be observable in the market, and are derived from market prices or rates or are estimated based on assumptions. Example of instruments involving significant unobservable inputs includes certain loans and guarantees for which there is no active market. Valuation models that employ significant unobservable inputs require a higher degree of management judgement and estimation in the determination of fair value. Management judgement and estimation are usually required for selection of the appropriate valuation model to be used, determination of expected future cash flows on the financial instrument being valued, determination of probability or counterparty default and prepayments and selection of appropriate discount rates.
The Facility measures fair values using the following fair value hierarchy that reflects the significance of the inputs used in making the measurements:
|
— |
Level 1: inputs that are unadjusted quoted market prices in active markets for identical instruments to which the Facility has access. |
|
— |
Level 2: inputs other than quoted prices included within Level 1 that are observable either directly (i.e. as prices) or indirectly (i.e. derived from prices). This category includes instruments valued using quoted market prices in active markets for similar instruments, quoted prices for identical or similar instruments in markets that are considered less than active or other valuation techniques where all significant inputs are directly or indirectly observable from market data. |
|
— |
Level 3: inputs that are not observable. This category includes all instruments where the valuation technique includes inputs not based on observable data and the unobservable inputs have a significant effect on the instrument’s valuation. This category includes instruments that are valued based on quoted prices for similar instruments where significant unobservable adjustments or assumptions are required to reflect differences between the instruments. |
The Facility recognises transfers between levels of the fair value hierarchy as of the end of the reporting period during which the change has occurred.
Impairment on financial assets
IFRS 9 is based on a forward-looking expected credit loss (‘ECL’) model. The EIB has established a framework to calculate ‘expected credit loss’ conditional on the state of the macro-economy. It involves the construction of point-in-time (‘PIT’) credit risk parameters (Probability of default — ‘PD’ and Loss given default — ‘LGD’) based on a systematic factor (credit cycle) that is driven by the macro-economy and projected via macroeconomic forecasts or scenarios. The final ECL is a probability weighted average of the respective macro-economic scenario ECLs. This forward-looking impairment model is applied to financial assets measured at AC, to financial guarantee contracts, as well as to off-balance sheet commitments.
Under IFRS 9, loss allowances are measured on either of the following bases:
|
— |
12-month ECLs: these are the ECLs that result from possible default events within the 12 months after the reporting date, and |
|
— |
lifetime ECLs: these are the ECLs that result from all possible default events over the expected life of a financial instrument. |
The IFRS 9 Standard sets out a ‘three-stage’ model for impairment based on changes in credit quality since initial recognition. Financial instruments are classified in Stage 1 except for those instruments for which significant increase in credit risk (‘SICR’) since initial recognition is identified. This includes both quantitative and qualitative information and analysis, based on the Bank’s expertise, including forward-looking information.
Purchased or originated credit-impaired assets (‘POCI’) are the financial assets which are, from the moment of initial recognition, deemed to be classified as Stage 3. For POCI financial assets, the cumulative changes in lifetime ECL since initial recognition are recognised in the statement of profit or loss.
The Bank’s assessment of the Stage is based on a sequential approach which is consistent with the Credit Risk Guidelines (‘CRG’) and the Financial Monitoring Guidelines and Procedures (‘FMGPs’), notably covering early warning triggers, Watch List (‘WL’), internal rating and arrears.
In line with guidance issued by standard setters and market practises, the EIB considers that the application of COVID-19 short-term forbearance measures to performing counterparties, aimed at addressing the adverse systemic economic impact of the COVID-19 pandemic, should not be considered by themselves as an automatic trigger to conclude that SICR has occurred. As disclosed under Note 3.2.3.8, the EIB applies expert judgement when assessing the credit risk of such counterparties.
The EIB considers that the COVID-19 pandemic effect is reflected within the existing forward-looking ECL model which is deemed sufficiently robust to factor in such extreme events. Notably, the respective impacts have been directly captured through the macroeconomic projections and the PD terms structures.
If significant increase in credit risk has occurred, the financial instrument is moved to Stage 2 but is not yet deemed to be credit-impaired. If the financial instrument is credit-impaired, the financial instrument is then moved to Stage 3.
To identify Stage 3 exposures, the Bank determines whether or not there is objective evidence of a non-performing exposure. A financial asset is considered to be in default when the borrower is unlikely to pay its credit obligations to the Facility in full, without recourse by the Facility or the borrower is past due more than 90 days on any material credit obligation to the Facility.
In this respect, a financial asset is considered impaired when it is determined that it is probable that the Facility will not be able to collect all amounts due according to the original contractual terms or an equivalent value. Individual credit exposures are evaluated based upon the borrower’s characteristics, overall financial condition, resources and payment record, the prospects for support from any financially responsible guarantors and, where applicable, the realisable value of any collateral.
All impaired claims are reviewed and analysed at least semi-annually. Any subsequent changes to the amounts and timing of the expected future cash flows compared to the prior estimates will result in a change in the provision for credit losses and be charged or credited to the income statement. An allowance for impairment is reversed only when the credit quality has improved such that there is reasonable assurance of timely collection of principal and interest in accordance with the original contractual terms of the claim agreement. A write- off is made when all or part of a claim is deemed uncollectible or forgiven. Write-offs are charged against previously established impairments or directly to the income statement and reduce the principal amount of a claim. Recoveries in part or in full of amounts previously written- off are credited to the income statement.
Measuring ECL — Inputs, Assumptions and Techniques
Lifetime ECL measurement applies to Stage 2 and Stage 3 assets, while 12-month ECL measurement applies to Stage 1 assets.
The expected credit losses were calculated based on the following variables:
|
— |
Credit rating and PIT Probability of default (‘PD’), |
|
— |
PIT Loss Given default (‘LGD’), |
|
— |
Exposure at default (‘EAD’). |
The credit rating of a counterpart is determined at a certain date, using score-sheet models tailored to the various categories of counterparties and exposures.
Each credit rating is mapped to a specific PD that represents the likelihood of a counterpart defaulting on its financial obligation, either over the next 12 months, or over the remaining lifetime of the obligation. Hence, ratings are primary input into the determination of the PIT term structure of PD for exposures. The EIB collects performance and default information about the Facility’s credit risk exposures. The collected data are segmented by type of industry and by type of region. Different industries and regions reacting in a homogenous manner to credit cycles are analysed together.
The EIB employs statistical models to analyse the data collected and generate estimates of the remaining lifetime PD of exposures and how these are expected to change because of the passage of time and given specific macro-economic scenarios.
The LGD represents the EIB’s expectation of the ratio of the loss on an exposure due to the default of a counterparty to the amount outstanding at default. LGD can be also defined as ‘1 — Recovery Rate’. LGD estimates are determined mainly by geography and by type of counterparty, with five main exposure classes: Sovereigns, Public Institutions, Financial Institutions, Corporate and Project Finance. LGD values can be further adjusted based on the product and contract specific features of the exposure.
The EIB incorporates PIT and forward-looking information into both its assessment of whether the credit risk of an instrument has increased significantly since its initial recognition and its measurement of expected credit losses.
For the measurement of ECL, the EIB has developed a conditional modelling approach, called the PIT PD model, for calculating PD term structures involving:
|
— |
the definition of an economically reasonable link function between the credit cycle and macroeconomic variables, and |
|
— |
a set of three macro-economic scenarios (one baseline and two scenarios reflecting downturn and upturn in the economy) with multi-year potential realisation for the GDP and their associated likelihoods. |
To generate macroeconomic scenarios, the EIB uses a macro semi-structural multi-country and multi-equation model of the global economy with country specific blocks. The central / baseline scenario is designed to be consistent with the most recent European Commission forecasts. The positive and negative scenarios are designed around the central scenario by deploying of the multi-country/multi-equation model. The scenarios are derived by shocking the GDP, which is the key measure of economic activity. The shocks to real GDP are calibrated to replicate the past volatility of the variable. Also expert judgment is applied, when appropriate, to refine the size and persistency of GDP shocks. As a result, shocks are determined together with a decay function to determine the impact of the shocks over time. Probabilities attached to each scenario are defined reflecting market (volatility) indicators and internally developed indicators/trackers deployed in a consistent manner over time to capture uncertainty.
The EIB’s PIT PD and PIT LGD models use the same projected values of the credit cycle as the main input under different macroeconomic scenarios. The credit cycle is calculated from an external rating agency’s downgrade rates and the projections of annual growth rates of real GDP as well as the spread between long and short-term interest rates.
The EAD represents the expected exposure in the event of a default and is based on the current exposure to the counterparty and potential changes to the current amount allowed under the contract including amortisation. The EAD of a financial asset is its gross carrying amount. For lending commitments and financial guarantees, the EAD includes the amount drawn.
2.4.2.1. Cash and cash equivalents
The Facility defines cash and cash equivalents as current accounts, short-term deposits or commercial papers with original maturities of three months or less. Cash and cash equivalents are carried at AC in the statement of financial position.
2.4.2.2. Treasury financial assets
Treasury financial assets comprise quoted and unquoted bonds with the intention of holding them to maturity, and commercial papers with original maturities of more than three months and are consequently classified at AC.
Those bonds and commercial papers are initially measured at cost, which is the fair value plus any directly attributable transaction cost. The difference between entry price and redemption value is amortised in accordance with the effective interest method over the remaining life of the instrument.
2.4.2.3. Loans and advances
The loan and advances portfolio may consist of debt instruments such as loans and debt securities including bonds, notes or certificates issued by structured entities with the intention of holding them to maturity and to collect the contractual cash flows.
Loans and advances include:
|
— |
Loans and advances measured at AC, |
|
— |
Loans and advances mandatorily measured at FVTPL. |
Loans originated by the Facility are recognised in the assets of the Facility when cash is advanced to borrowers. Undisbursed parts of loans are recorded in the off-balance at their nominal value. Loans passing the SPPI test are initially recorded at cost (their net disbursed amounts), which is the fair value of the cash given to originate the loan, including any transaction costs, and are subsequently measured at AC using the effective interest rate method.
Debt securities are recognised in the assets of the Facility when cash is advanced to the issuer and can take the form of a contractually linked or single tranche debt instrument. Undisbursed parts of debt securities are recorded in the off-balance at their nominal value. Debt securities are initially measured at cost, which is the fair value plus any directly attributable transaction cost, and are subsequently measured at AC using the effective interest rate method. The difference between entry price and redemption value is amortised in accordance with the effective interest method over the remaining life of the instrument.
The impairment policy on loans and advances is described under Note 2.4.2.
Loans and advances not fulfilling the SPPI criterion are mandatorily measured at FVTPL. The fair value measurement technique used is based on a discounted cash flow technique or liquidation value.
For the impact of the IBOR reform on remeasurement of loans and advances at amortised cost, please refer to the dedicated paragraphs in Note 2.4.2 — Classification and Measurement / Modification.
2.4.2.4. Shares and other variable yield securities
There are two types of equity investments at the Facility: (i) direct equity investments; and (ii) venture capital funds. The shares and other variable yield securities are initially recognised at fair value plus transactions costs. Subsequently changes in fair value, including foreign currency translation gains and losses, are recognised in the statement of profit or loss and other comprehensive income under the caption net result on shares and other variable yield securities.
For unquoted investment, when the fair value cannot be derived from active markets, the fair value is determined by applying recognised valuation techniques (Note 4.2.1).
The participations acquired by the Facility typically represent investments in private equity or venture capital funds. According to industry practice, such investments are generally investments jointly subscribed by a number of investors, none of whom is in a position to individually influence the daily operations and the investment activity of such fund. As a consequence, any membership by an investor in a governing body of such fund does not in principle entitle such investor to influence the day-to-day operations of the fund. In addition, individual investors in a private equity or a venture capital fund do not determine policies of a fund such as distribution policies on dividends or other distributions. Such decisions are typically taken by the management of a fund on the basis of the shareholders agreement governing the rights and obligations of the management and all shareholders of the fund. The shareholders’ agreement also generally prevents individual investors from bilaterally executing material transactions with the fund, interchanging managerial personnel or obtaining privileged access to essential technical information. The Facility’s investments are executed in line with the above stated industry practice, ensuring that the Facility neither controls nor exercises any form of significant influence within the meaning of IFRS 10 and IAS 28 over any of these investments, including those investments in which the Facility holds over 20 % of the voting rights.
2.4.3.
Financial guarantee contracts are contracts that require the Facility to make specified payments to reimburse the holder for a loss it incurs because a specified debtor fails to make payments when due in accordance with the terms of a debt instrument.
Under the existing rules, these guarantees do not meet the definition of an insurance contract (IFRS 4 Insurance Contracts).
Financial guarantees are accounted for under IFRS 9 — Financial Instruments, either as ‘Derivatives’ or as ‘Financial Guarantees’, depending on their features and characteristics as defined by IFRS 9.
The accounting policy for derivatives is disclosed under Note 2.4.5.
Financial guarantees are initially recognised in the statement of financial position under ‘Provisions for guarantees issued’ at fair value plus transaction costs that are directly attributable to the issuance of the financial guarantees. At initial recognition the obligation to pay corresponds to the Net Present Value (NPV) of expected premium inflows or the initial expected loss.
Subsequent to initial recognition, financial guarantees are measured at the higher of:
|
— |
The amount of the loss allowance as determined under IFRS 9, and |
|
— |
The premium initially recognised less income recognised in accordance with the principles of IFRS 15. |
Any increase or decrease in the net liability (as measured per IFRS 9) relating to financial guarantees other than the payment of guarantee calls is recognised in the statement of profit or loss and other comprehensive income under ‘Change in provisions for guarantees’.
The premium received is recognised in the statement of profit or loss and other comprehensive income in ‘Fee and commission income’ on the basis of an amortisation schedule in accordance with IFRS 15 over the life of the financial guarantee.
2.4.4.
Classification and measurement
Financial liabilities
A financial liability is measured at amortised cost except for financial liabilities that meet the definition of held for trading (e.g. derivative liabilities).
The Facility derecognises a financial liability when its contractual obligations are discharged, cancelled or expired.
2.4.5.
Derivative financial instruments include cross currency swaps, cross currency interest rate swaps, short-term currency swaps (‘FX swaps’) and interest rate swaps.
Derivative financial instruments are initially recognised using the trade date basis.
In the normal course of its activity, the Facility may enter into swap contracts with a view to hedge specific lending operations or into currency forward contract with a view to hedge its currency positions, denominated in actively traded currencies other than the Euro, in order to offset any gain or loss caused by foreign exchange rate fluctuations.
All derivatives are measured at FVTPL and are reported as derivative financial instruments. Fair values are derived primarily from discounted cash-flow models, option-pricing models and from third party quotes.
Derivatives are recorded at fair value and carried as assets when their fair value is positive and as liabilities when their fair value is negative. Changes in the fair value of derivative financial instruments are shown in the statement of profit and loss and other comprehensive income under ‘Fair value change of derivative financial instruments’.
Under IFRS 9, bifurcation requirements regarding embedded derivatives have been eliminated for financial assets or financial liabilities and therefore, the hybrid contract is treated as a whole for classification of financial assets or financial liability accordingly.
The cash flows of derivatives were accordingly determined using the ISDA fallback rates in replacement of LIBOR benchmarks (1). For the impact of the IBOR reform on the derivative instruments, please refer to the Note 6.
2.4.6.
Contributions from Member States are recognised as receivables in the statement of financial position on the date of the Council Decision fixing the financial contribution to be paid by the Member States to the Facility.
The Member States’ contributions meet the following conditions and are consequently classified as equity:
|
— |
as defined in the contribution agreement, they entitle the Member States to decide on the utilisation of the Facility’s net assets in the events of the Facility’s liquidation, |
|
— |
they are in the class of instruments that is subordinated to all other classes of instruments, |
|
— |
all financial instruments in the class of instruments that are subordinated to all other classes of instruments have identical features, |
|
— |
the instrument does not include any features that would require classification as a liability, and |
|
— |
the total expected cash flows attributable to the instrument over its life are based substantially on the profit or loss, the change in the recognised net assets or the change in the fair value of the recognised and unrecognised net assets of the Facility over the life of the instrument. |
Contributions are classified and measured at AC in the financial statements.
2.4.7.
Interest on loans originated by the Facility is recorded in the statement of profit or loss and other comprehensive income (‘Interest and similar income’) and in the statement of financial position (‘Loans and advances’) on an accrual basis using the effective interest rate, which is the rate that exactly discounts estimated future cash payments or receipts through the expected life of the loan to the net carrying amount of the loan. Once the recorded value of a loan has been reduced due to impairment, interest income continues to be recognised using the original effective interest rate applied to the new carrying amount.
Interest on the POCI loans is recorded in the statement of profit or loss and other comprehensive income (‘Interest and similar income’) and in the statement of financial position (‘Loans and advances’) on an accrual basis using the credit-adjusted effective interest rate through the whole life of the loan, which is the rate that exactly discounts estimated future cash payments or receipts through the expected life of the loan to the amortised cost of the loan.
Interest subsidies received for the Facility’s resources are deferred and recognised as an adjustment to the effective yield, being recorded under ‘Interest and similar income’ in the income statement over the period from disbursement to repayment of the subsidised loan.
Commitment fees are deferred and recognised in income using the effective interest method over the period from disbursement to repayment of the related loan, and are presented in the statement of profit or loss and other comprehensive income within interest and similar income.
2.4.8.
As part of its activity, the Facility manages interest subsidies and technical assistance (‘TA’) on behalf of the Member States.
The part of the Member States’ contributions allocated to the payment of interest subsidies and TA is not accounted for in the Facility’s contributors’ resources but is classified as amounts owed to third parties. The Facility operates the disbursement to the final beneficiaries and then decreases the amounts owed to third parties.
When amounts contributed with regard to interest subsidies and TA are not fully granted, they are reclassified as contribution to the Facility.
2.4.9.
Interest income on cash and cash equivalents is recognised in the statement of profit or loss and other comprehensive income of the Facility on an accrual basis.
2.4.10.
Fees received in respect of services provided over a period of time are recognised as income as the services are provided, while fees that are earned on the execution of a significant act are recognised as income when the significant act has been completed. These fees are presented in the statement of profit or loss and other comprehensive income within fee and commission income.
Dividends relating to shares and other variable yield securities are recognised when received and presented in the statement of profit or loss and other comprehensive income within net realised gains on shares and other variable yield securities.
2.4.11.
The Protocol on the Privileges and Immunities of the European Union, appended to the Treaty on the European Union and the Treaty on the Functioning of the European Union, stipulates that the assets, revenues and other property of the institutions of the Union are exempt from all direct taxes.
3. Risk management
This note presents information about the Facility’s exposure to and its management and control of credit and financial risks, in particular the primary risks associated with its use of financial instruments. These are:
|
— |
credit risk — the risk of loss resulting from client or counterparty default and arising on credit exposure in all forms, including settlement risk, |
|
— |
liquidity risk — the risk that an entity is not able to fund increases in assets and meet obligations as they come due, without incurring unacceptable losses, |
|
— |
market risk — the risk that changes in market prices and rates, such as interest rates, equity prices and foreign exchange rates will affect an entity’s income or the value of its holdings in financial instruments. |
3.1. Risk management organisation
The EIB adapts the IF’s risk management framework on an ongoing basis.
The Risk Management Directorate of the EIB independently identifies, assesses, monitors and reports the risks to which the Facility is exposed. Within a framework whereby the segregation of duties is preserved, the Risk Management is independent of the Front Office.
At EIB level, the Group Chief Risk Officer (‘GCRO’) reports on Group Risks to the EIB Management Committee under the oversight of the MC member in charge of risk. The GCRO has direct access to the Risk Policy Committee and can write directly to and communicate with the EIB Board of Directors on any matter of his/her field of attribution.
3.2. Credit risk
Credit risk is the potential loss that could result from client or counterparty default and arising on credit exposure in all forms, including settlement.
3.2.1.
In carrying out the credit analysis on loan counterparts, the EIB assesses the credit risk and expected loss with a view to quantify and price the risk. The EIB has developed an Internal Rating Methodology (‘IRM’) to determine the Internal Ratings of its credit-relevant borrower/guarantor counterparts. The methodology is based on a system of scoring sheets tailored for each major credit counterpart type (e.g. Corporates, Financial Institutions, etc.). Taking into consideration both, Best Banking Practice applicable to the EIB and the principles set under the Basel International Capital Accord (Basel II), all counterparts that are material to the credit profile of a specific transaction are classified into internal rating categories using the IRM for the specific counterpart type. Each counterpart is assigned an Internal Rating reflecting its PD following an in-depth analysis of the counterpart’s business and financial risk profile and its country risk operating context. Expert adjustments are made when necessary under the consideration of the legal entities’ parental or government support, and the final rating allows for overrides to reflect information (e.g. market pricing) not considered in the scoring sheet.
The credit assessment of project finance and other structured limited recourse operations uses credit risk tools relevant for the sector, focused mainly on cash flow availability and debt service capacity. These tools include the analysis of projects’ contractual framework, counterpart’s analysis and cash flow simulations. Similarly to corporates and financial institutions, each project is assigned an internal risk rating. Finally, non-EU sovereigns are rated by the Economics Department based on a statistical model.
All Internal Ratings are monitored over loan life, and periodically updated.
Specific transaction-level and counterpart size limits are applicable to non-sovereign operations, as relevant. Counterpart limits are set at consolidated group exposure level, where applicable. Such limits typically reflect, amongst others, the size of counterparts own funds.
In order to mitigate credit risk the EIB uses, where appropriate and on a case-by-case basis, various credit enhancements which are:
|
— |
counterparty or project-related securities (e.g. pledge over the shares; pledge over the assets; assignment of rights; pledge over the accounts), or/and |
|
— |
guarantees, generally provided by the sponsor of the financed project (e.g. completion guarantees, first demand guarantees) or bank guarantees. |
The Facility does not use any credit derivatives to mitigate credit risk.
3.2.2.
The following table shows the maximum exposure to credit risk for the components of the statement of financial position, including derivatives. The maximum exposure is shown gross, before the effect of mitigation through the use of collateral.
|
(in EUR’000) |
||||
|
Maximum exposure |
31.12.2021 |
31.12.2020 |
||
|
ASSETS |
|
|
||
|
Cash and cash equivalents |
1 358 564 |
923 940 |
||
|
Amounts receivable from contributors |
85 210 |
68 908 |
||
|
Treasury financial assets |
— |
351 873 |
||
|
Derivative financial instruments |
7 |
33 584 |
||
|
Loans and advances |
1 986 281 |
1 673 445 |
||
|
Other assets |
1 086 |
109 |
||
|
Total |
3 431 148 |
3 051 859 |
||
|
Provisions for loan commitments |
-16 602 |
-33 152 |
||
|
OFF BALANCE SHEET |
|
|
||
|
Contingent liabilities |
|
|
||
|
1 499 675 |
998 560 |
||
|
Commitments |
|
|
||
|
1 677 411 |
1 722 618 |
||
|
256 299 |
554 686 |
||
|
Total off balance sheet |
3 433 385 |
3 275 864 |
||
|
Total credit exposure |
6 847 931 |
6 294 571 |
||
3.2.3.
3.2.3.1. Credit risk measurement for loans and advances
Loans and advances or guarantees undertaken by the Facility benefit from a comprehensive risk assessment and quantification of expected loss estimates that are reflected in a Loan Grading (‘LG’). Operations under the IFE (as described in Note 24), with the exception of intermediated loans, are not subject to the Credit Risk Policy Guidelines and are subject to a different procedure. LGs are established according to generally accepted criteria, based on the quality of the borrower, the maturity of the loan, the guarantee and, where appropriate, the guarantor.
The loan grading system comprises the methodologies, processes, databases and IT systems supporting the assessment of credit risk in lending operations and the quantification of expected loss estimates. It summarises a large amount of information with the purpose of offering a relative ranking of loans’ credit risks. LGs reflect the present value of the estimated level of the ‘expected loss’, this being the product of the PD of the main obligors, the EAD and the loss severity in the case of default. LGs are used for the following purposes:
|
— |
as an aid to a finer and more quantitative assessment of lending risks, |
|
— |
as an indicator of credit risk variations for the purposes of prioritising monitoring efforts, |
|
— |
as a description of the loan’s portfolio quality at any given date, |
|
— |
as a benchmark for calculating the annual additions to the General loan reserve, and |
|
— |
as an input in risk-pricing decisions. |
The following factors enter into the determination of an LG:
|
(i) |
The borrower’s creditworthiness: Risk Management independently reviews borrowers and assesses their creditworthiness based on internal methodologies and external data. In line with the Basel III Internal Ratings Based Approach chosen, the Bank has developed an internal rating methodology (IRM) to determine the internal ratings of borrowers and guarantors. This is based on a set of scoring sheets specific to defined counterparty types. |
|
(ii) |
The default correlation: it quantifies the chances of simultaneous financial difficulties arising for both the borrower and the guarantor. The higher the correlation between the borrower and the guarantor’s default probabilities, the lower the value of the guarantee and therefore the lower (worse) the LG. |
|
(iii) |
The value of guarantee instruments and of securities: this value is assessed on the basis of the combination of the issuer’s creditworthiness and the type of instrument used. |
|
(iv) |
The applicable recovery rate: being the amount assumed to be recovered following a default by the relevant counterpart expressed as a percentage of the relevant loan exposure |
|
(v) |
The contractual framework: a sound contractual framework will add to the loan’s quality and enhance its LG. |
|
(vi) |
The duration of the loan or, more generally, the cash flows of the loan: all else being equal, the longer the loan, the higher the risk of incurring difficulties in the servicing of the loan. |
A loan’s expected loss is computed by combining the five elements discussed above. Depending on the level of this loss, a loan is assigned to one of the following LG classes listed below:
|
‘A’ |
Prime quality loans of which there are three sub-categories: ‘A0’ comprising loans to or guaranteed by an EU Member State which have an expected loss of 0 %. ‘A+’ comprising loans granted to (or guaranteed by) entities other than EU Member States in respect of which there is no expectation of deterioration in quality over their term. ‘A-’ includes those lending operations where there is some doubt about the maintenance of their current status but where any downside is expected to be limited. |
|
‘B’ |
High quality loans: these represent an asset class with which the Bank feels comfortable, although a minor deterioration is not ruled out in the future. B+ and B- are used to denote the relative likelihood of the possibility of such deterioration occurring. |
|
‘C’ |
Good quality loans: an example could be unsecured loans to solid banks and corporates with a 7-year bullet, or equivalent amortising, maturity at disbursement. |
|
‘D’ |
This rating class represents the borderline between ‘acceptable quality’ loans and those that have experienced some difficulties. This watershed in loan grading is more precisely determined by the sub-classifications D+ and D-. Loans rated D- require heightened monitoring. |
|
‘E’ |
This LG category includes loans with a risk profile greater than generally accepted. It also includes loans which in the course of their lives have experienced severe problems and their sliding into a situation of loss cannot be excluded. For this reason, the loans are subject to close and high monitoring. The sub-classes E+ and E- differentiate the intensity of this special monitoring process, with those operations graded E- being in a position where there is a strong possibility that debt service cannot be maintained on a timely basis and therefore some form of debt restructuring is required, possibly leading to an impairment loss. |
|
‘F’ |
F (fail) denotes loans representing unacceptable risks. F- graded loans can only arise out of outstanding transactions that have experienced, after signature, unforeseen, exceptional and dramatic adverse circumstances. All operations where there is a loss of principal to the Facility are graded F and a specific provision is applied. |
Generally, loans internally graded D- or below are placed on the internal loan grading based Watch List. However, if a loan was originally approved with a risk profile of D- or weaker, it will only be placed on the Watch List as a result of a material credit event causing a further deterioration of its LG classification below the one at approval.
The table in Section 3.2.3.3 shows the credit quality analysis of the Facility’s loan portfolio based on the various LG classes as described above.
3.2.3.2. Analysis of lending credit risk exposure
The following table shows the maximum exposure (net carrying amount) to credit risk on loans and advances signed (disbursed and undisbursed) nature of borrower taking into account guarantees provided by guarantors:
|
(in EUR’000) |
|||||
|
At 31.12.2021 |
Guaranteed |
Other credit enhancements |
Not guaranteed |
Total |
% of total disbursed |
|
Financial institutions |
74 086 |
— |
1 115 656 |
1 189 742 |
60 % |
|
Corporates |
211 067 |
— |
368 877 |
579 944 |
29 % |
|
Public authorities |
20 776 |
— |
664 |
21 440 |
1 % |
|
States |
— |
917 |
194 238 |
195 155 |
10 % |
|
Total disbursed |
305 929 |
917 |
1 679 435 |
1 986 281 |
100 % |
|
Undisbursed |
193 663 |
— |
1 467 146 |
1 660 809 |
— |
|
Total disbursed and undisbursed |
499 592 |
917 |
3 146 581 |
3 647 090 |
— |
|
(in EUR’000) |
|||||
|
At 31.12.2020 |
Guaranteed |
Other credit enhancements |
Not guaranteed |
Total |
% of total disbursed |
|
Financial institutions |
87 269 |
— |
963 366 |
1 050 635 |
64 % |
|
Corporates |
203 772 |
27 026 |
177 321 |
408 119 |
24 % |
|
Public authorities |
21 866 |
— |
1 057 |
22 923 |
1 % |
|
States |
— |
1 506 |
190 262 |
191 768 |
11 % |
|
Total disbursed |
312 907 |
28 532 |
1 332 006 |
1 673 445 |
100 % |
|
Undisbursed |
196 692 |
— |
1 492 774 |
1 689 466 |
— |
|
Total disbursed and undisbursed |
509 599 |
28 532 |
2 824 780 |
3 362 911 |
— |
Transaction Management and Restructuring Directorate is tasked with the responsibility of performing borrower and guarantor monitoring, as well as project-related financial and contractual monitoring. Thus, the creditworthiness of the Facility’s loans, borrowers and guarantors are continually monitored, at least annually but more frequently on an as-needed basis and as a function of credit events taking place. In particular, Transaction Management and Restructuring Directorate reviews if contractual rights are met and, in case of a rating deterioration and/or contractual default, remedy action is taken. Mitigation measures are pursued, whenever necessary in accordance with the credit risk guidelines. Also, in case of renewals of bank guarantees received for its loans, it is ensured that these are replaced or action is taken in a timely manner.
3.2.3.3. Credit quality analysis per type of borrower
The tables below show the credit quality analysis of the Facility’s loan portfolio as at 31 December 2021 and 31 December 2020 by the Loan Grading applications, based on the exposure signed (disbursed and undisbursed):
|
(in EUR’000) |
||||||||
|
At 31.12.2021 |
High Grade |
Standard Grade |
Min. Accept. Risk |
High Risk |
No grading (*10) |
Total |
% of Total |
|
|
A to B- |
C |
D+ |
D- and below |
|||||
|
Borrower |
Financial institutions |
285 924 |
109 219 |
443 921 |
1 130 146 |
— |
1 969 210 |
54 % |
|
Corporates |
108 621 |
49 059 |
12 253 |
532 735 |
315 011 |
1 017 679 |
28 % |
|
|
Public authorities |
— |
20 776 |
— |
— |
664 |
21 440 |
1 % |
|
|
States |
917 |
2 529 |
3 360 |
631 955 |
— |
638 761 |
17 % |
|
|
Total |
395 462 |
181 583 |
459 534 |
2 294 836 |
315 675 |
3 647 090 |
100 % |
|
|
(in EUR’000) |
||||||||
|
At 31.12.2020 |
High Grade |
Standard Grade |
Min. Accept. Risk |
High Risk |
No grading (*11) |
Total |
% of Total |
|
|
A to B- |
C |
D+ |
D- and below |
|||||
|
Borrower |
Financial institutions |
290 565 |
90 445 |
475 331 |
815 120 |
— |
1 671 461 |
50 % |
|
Corporates |
118 990 |
46 861 |
14 433 |
512 142 |
313 762 |
1 006 188 |
30 % |
|
|
Public institutions |
— |
21 866 |
— |
— |
1 057 |
22 923 |
1 % |
|
|
States |
— |
4 865 |
3 926 |
653 548 |
— |
662 339 |
19 % |
|
|
Total |
409 555 |
164 037 |
493 690 |
1 980 810 |
314 819 |
3 362 911 |
100 % |
|
3.2.3.4. Risk concentrations of loans and advances
3.2.3.4.1.
Based on the country of borrower, the Facility’s loan portfolio can be analysed by the following geographical regions:
|
(in EUR ‘000) |
||
|
Country of borrower |
31.12.2021 |
31.12.2020 |
|
Egypt |
345 810 |
319 040 |
|
Kenya |
321 069 |
195 917 |
|
Nigeria |
237 992 |
236 149 |
|
Regional-ACP |
208 795 |
37 497 |
|
Mauritius |
101 446 |
76 419 |
|
Ethiopia |
96 391 |
92 346 |
|
Barbados |
85 058 |
75 037 |
|
Rwanda |
64 169 |
59 114 |
|
Uganda |
61 033 |
61 869 |
|
Zambia |
52 345 |
42 553 |
|
Congo (Democratic Republic) |
48 766 |
56 527 |
|
Tanzania |
46 423 |
60 058 |
|
Senegal |
42 968 |
32 850 |
|
Cameroon |
42 097 |
36 749 |
|
New Caledonia |
37 098 |
41 224 |
|
Jamaica |
20 776 |
23 411 |
|
Dominican Republic |
19 076 |
30 741 |
|
Guinea |
18 972 |
18 534 |
|
Ghana |
15 835 |
21 249 |
|
Malawi |
14 898 |
17 349 |
|
Zimbabwe |
14 708 |
— |
|
Angola |
12 253 |
14 654 |
|
Mali |
12 120 |
12 918 |
|
Mauritania |
11 921 |
38 131 |
|
Cape Verde |
11 718 |
14 952 |
|
Mozambique |
9 107 |
10 775 |
|
Cayman Islands |
8 692 |
8 027 |
|
French Polynesia |
5 783 |
8 783 |
|
Benin |
4 023 |
3 932 |
|
Burkina Faso |
3 581 |
1 267 |
|
Micronesia |
2 872 |
3 073 |
|
Seychelles |
2 529 |
3 359 |
|
Eswatini |
1 792 |
— |
|
Haiti |
1 208 |
2 617 |
|
Niger |
1 182 |
2 243 |
|
Samoa |
909 |
1 898 |
|
Vanuatu |
866 |
1 200 |
|
Togo |
— |
10 625 |
|
Palau |
— |
358 |
|
Total |
1 986 281 |
1 673 445 |
3.2.3.4.2.
The table below analyses the Facility’s loan portfolio by industry sector of the borrower. Operations which are first disbursed to a financial intermediary before being disbursed to the final beneficiary are reported under ‘Tertiary and other’:
|
(in EUR’000) |
||
|
Industry sector of borrower |
31.12.2021 |
31.12.2020 |
|
Financial Services |
1 190 407 |
1 030 121 |
|
Electricity |
211 761 |
192 599 |
|
Public Administration |
195 154 |
191 768 |
|
Healthcare |
170 000 |
— |
|
Chemicals |
111 251 |
89 495 |
|
Business Services, IT and Media |
34 306 |
26 638 |
|
Air and Maritime Transport Infrastructure |
20 776 |
21 866 |
|
Pharmaceuticals and Medical Equipment |
13 684 |
11 709 |
|
Telecommunications |
12 253 |
14 964 |
|
Investment Goods |
9 269 |
11 531 |
|
Metals and Mining |
8 667 |
34 292 |
|
Waste Recuperation and Recycling |
5 326 |
6 063 |
|
Tertiary and other |
2 561 |
24 761 |
|
Multi-Utilities |
866 |
1 200 |
|
Building Materials and Construction |
— |
14 433 |
|
Agriculture and Food Chain |
— |
2 005 |
|
Total |
1 986 281 |
1 673 445 |
3.2.3.5. Credit risk exposure for each internal risk rating
The EIB uses an internal rating methodology in line with the Internal ratings based approach under Basel III. The majority of the Facility’s counterparties have been assigned an internal rating according to this methodology. The table below shows a breakdown of the Facility’s loan portfolio by the better of the borrower’s or guarantor’s internal ratings, where available. In cases where an internal rating is not available, the external rating has been used for this analysis.
The table shows both the exposures signed (disbursed and undisbursed) and the risk-weighted exposures, based on an internal methodology that the Facility uses for limit management.
|
(in EUR’000) |
|||||||
|
|
|
2021 |
|||||
|
|
Moody’s equiv. grade |
12-month ECL |
Lifetime ECL not credit-impaired |
Lifetime ECL credit-impaired |
POCI |
FVTPL |
Total |
|
Loans and advances at AC |
|
|
|
|
|
|
|
|
Internal Rating 1 — minimal credit risk |
Aaa |
— |
64 876 |
— |
— |
— |
64 876 |
|
Internal Rating 2 — very low credit risk |
Aa1 — Aa3 |
85 059 |
— |
— |
— |
— |
85 059 |
|
Internal Rating 3 — low credit risk |
A1 — A3 |
1 056 |
— |
— |
— |
— |
1 056 |
|
Internal Rating 4 — moderate credit risk |
Baa1 — Baa3 |
46 507 |
— |
— |
— |
— |
46 507 |
|
Internal Rating 5 — financially weak counterpart |
Ba1 — Ba3 |
435 300 |
12 288 |
— |
— |
— |
447 588 |
|
Internal Rating 6 — high credit risk |
B1 — B3 |
556 705 |
237 898 |
— |
— |
— |
794 603 |
|
Internal Rating 7 — very high credit risk |
below Caa1 |
55 928 |
258 220 |
— |
— |
— |
314 148 |
|
Internal Rating 8 — counterpart in default |
below Caa1 but in default |
— |
— |
69 180 |
— |
— |
69 180 |
|
Loans and advances at FVTPL |
|
— |
— |
— |
— |
272 917 |
272 917 |
|
Loss allowance and FV adjustment |
|
-3 565 |
-33 268 |
-30 169 |
— |
-42 651 |
- 109 653 |
|
Carrying amount of loans and advances |
|
1 176 990 |
540 014 |
39 011 |
— |
230 266 |
1 986 281 |
|
Loan commitments |
|
|
|
|
|
|
|
|
Internal Rating 1 — minimal credit risk |
Aaa |
— |
— |
— |
— |
— |
— |
|
Internal Rating 2 — very low credit risk |
Aa1 — Aa3 |
86 796 |
— |
— |
— |
— |
86 796 |
|
Internal Rating 3 — low credit risk |
A1 — A3 |
87 000 |
— |
— |
— |
— |
87 000 |
|
Internal Rating 4 — moderate credit risk |
Baa1 — Baa3 |
61 060 |
— |
— |
— |
— |
61 060 |
|
Internal Rating 5 — financially weak counterpart |
Ba1 — Ba3 |
173 963 |
— |
— |
— |
— |
173 963 |
|
Internal Rating 6 — high credit risk |
B1 — B3 |
777 195 |
18 595 |
— |
— |
— |
795 790 |
|
Internal Rating 7 — very high credit risk |
below Caa1 |
45 955 |
167 782 |
— |
— |
— |
213 737 |
|
Internal Rating 8 — counterpart in default |
below Caa1 but in default |
— |
— |
10 000 |
— |
— |
10 000 |
|
No internal rating (*12) |
|
129 669 |
27 365 |
— |
— |
— |
157 034 |
|
Loans and advances at FVTPL |
|
— |
— |
— |
— |
92 031 |
92 031 |
|
Loss allowance and FV adjustment |
|
-1 693 |
-14 909 |
— |
— |
— |
-16 602 |
|
Carrying amount of loan commitments |
|
1 359 945 |
198 833 |
10 000 |
— |
92 031 |
1 660 809 |
|
(in EUR’000) |
|||||||
|
|
|
2020 |
|||||
|
|
Moody’s equiv. grade |
12-month ECL |
Lifetime ECL not credit-impaired |
Lifetime ECL credit-impaired |
POCI |
FVTPL |
Total |
|
Loans and advances at AC |
|
|
|
|
|
|
|
|
Internal Rating 1 — minimal credit risk |
Aaa |
— |
73 545 |
— |
— |
— |
73 545 |
|
Internal Rating 2 — very low credit risk |
Aa1 — Aa3 |
75 048 |
— |
— |
— |
— |
75 048 |
|
Internal Rating 3 — low credit risk |
A1 — A3 |
2 087 |
— |
— |
— |
— |
2 087 |
|
Internal Rating 4 — moderate credit risk |
Baa1 — Baa3 |
54 412 |
6 087 |
— |
— |
— |
60 499 |
|
Internal Rating 5 — financially weak counterpart |
Ba1 — Ba3 |
392 787 |
19 761 |
— |
— |
— |
412 548 |
|
Internal Rating 6 — high credit risk |
B1 — B3 |
581 607 |
193 877 |
32 032 |
— |
— |
807 516 |
|
Internal Rating 7 — very high credit risk |
below Caa1 |
70 495 |
177 919 |
1 493 |
— |
— |
249 907 |
|
Internal Rating 8 — counterpart in default |
below Caa1 but in default |
— |
5 693 |
45 000 |
— |
— |
50 693 |
|
Loans and advances at FVTPL |
|
— |
— |
— |
— |
92 436 |
92 436 |
|
Loss allowance and FV adjustment |
|
-16 389 |
-43 976 |
-44 538 |
— |
-45 931 |
- 150 834 |
|
Carrying amount of loans and advances |
|
1 160 047 |
432 906 |
33 987 |
— |
46 505 |
1 673 445 |
|
Loan commitments |
|
|
|
|
|
|
|
|
Internal Rating 2 — very low credit risk |
Aa1 — Aa3 |
95 067 |
— |
— |
— |
— |
95 067 |
|
Internal Rating 3 — low credit risk |
A1 — A3 |
87 000 |
— |
— |
— |
— |
87 000 |
|
Internal Rating 4 — moderate credit risk |
Baa1 — Baa3 |
57 282 |
— |
— |
— |
— |
57 282 |
|
Internal Rating 5 — financially weak counterpart |
Ba1 — Ba3 |
152 264 |
— |
— |
— |
— |
152 264 |
|
Internal Rating 6 — high credit risk |
B1 — B3 |
675 365 |
8 964 |
— |
— |
— |
684 329 |
|
Internal Rating 7 — very high credit risk |
below Caa1 |
72 500 |
110 331 |
— |
— |
— |
182 831 |
|
Internal Rating 8 — counterpart in default |
below Caa1 but in default |
— |
— |
38 497 |
— |
— |
38 497 |
|
No internal rating (*13) |
|
129 669 |
27 365 |
— |
— |
— |
157 034 |
|
Loans and advances at FVTPL |
|
— |
— |
— |
— |
268 314 |
268 314 |
|
Loss allowance and FV adjustment |
|
-6 817 |
-26 335 |
— |
— |
— |
-33 152 |
|
Carrying amount of loan commitments |
|
1 262 330 |
120 325 |
38 497 |
— |
268 314 |
1 689 466 |
The EIB continually monitors events affecting its borrowers and guarantors, especially banks. In particular, the EIB is assessing on a case-by-case basis its contractual rights in case of rating deterioration and is seeking mitigating measures. It is also closely following the renewals of bank guarantees received for its loans to ensure that these are replaced or action is taken in a timely manner if need be.
3.2.3.6. Arrears on loans and impairments
Amounts in arrears are identified, monitored and reported according to the procedures defined into the Bank-wide ‘Finance Monitoring Guidelines and Procedures’. These procedures are in line with best banking practices and are adopted for all loans managed by the EIB.
The monitoring process is structured in order to make sure that (i) potential arrears are detected and reported to the services in charge with minimum delay; (ii) critical cases are promptly escalated to the right operational and decision level; (iii) regular reporting to the Facility management is provided on the overall status.
The arrears and impairments on loans and advances can be analysed as follows:
|
(in EUR’000) |
||
|
|
Loans and advances |
Loans and advances |
|
|
31.12.2021 |
31.12.2020 |
|
Carrying amount |
1 986 281 |
1 673 445 |
|
Lifetime ECL credit-impaired |
|
|
|
Gross amount |
69 180 |
45 000 |
|
Impairment- loss allowance |
-30 169 |
-44 538 |
|
Carrying amount of lifetime ECL credit-impaired |
39 011 |
462 |
|
Past due but not credit-impaired |
|
|
|
Past due comprises |
|
|
|
0–30 days |
2 334 |
2 008 |
|
30–60 days |
9 |
— |
|
60–90 days |
— |
— |
|
90–180 days |
— |
174 |
|
more than 180 days |
— |
— |
|
Carrying amount past due but not credit-impaired |
2 343 |
2 182 |
|
Carrying amount neither past due nor credit impaired |
1 944 927 |
1 670 801 |
|
Total carrying amount loans and advances |
1 986 281 |
1 673 445 |
3.2.3.7. Sensitivity on ECL to future economic conditions (in EUR’000)
The ECL is sensitive to judgments and assumptions made regarding formulation of forward-looking scenarios. The EIB performs a sensitivity analysis on the ECL recognised on material classes of its assets.
The forecasts of future economic conditions (via macroeconomic scenarios) are inputs to forecasting model producing conditional risk parameters, which are an input to loss allowance calculation.
The scenarios are derived shocking GDP, which is the key measurement of economic activity. The shocks to real GDP are calibrated to replicate the past volatility of the variable. In addition, expert judgment is applied, when appropriate, to refine the size and persistency of GDP shocks. As a result, shocks are determined together with a decay function to determine the impact of the shocks over time. Probabilities attached to each scenario are defined reflecting market (volatility) indicators and internally developed indicators/trackers consistently deployed over time to capture uncertainty. The weighting of positive and negative shocks depends on the balance of risks in the economy, on average negative and positive shocks EUR -15 250 (2020: EUR -20 533) and EUR 11 780 (2020: EUR 17 658) were respectively applied on quarterly projections in the past exercise.
The table below shows the loss allowance on loans and advances under Stage 1 and 2. Each forward-looking scenario (e.g. baseline, positive and negative) was weighted 100 % instead of applying scenario probability weights across the three scenarios.
|
(in EUR’000) |
|||
|
|
2021 |
||
|
Positive |
Baseline |
Negative |
|
|
Gross exposure |
3 319 800 |
3 319 800 |
3 319 800 |
|
Loss allowance |
37 862 |
49 642 |
64 892 |
|
(in EUR’000) |
|||
|
|
2020 |
||
|
Positive |
Baseline |
Negative |
|
|
Gross exposure |
3 063 652 |
3 063 652 |
3 063 652 |
|
Loss allowance |
70 645 |
88 303 |
108 836 |
3.2.3.8. Loan renegotiation and forbearance
The EIB considers loans to be forborne loans (i.e. loans, debt securities and loan commitments) in respect of which forbearance measures have been extended. Forbearance measures consist of ‘concessions’ that the EIB decides to make towards an obligor who is considered unable to comply with the contractual debt service terms and conditions due to its financial difficulties, in order to enable the obligor to service the debt or to refinance, totally or partially, the contract. Exposures shall be treated as forborne if a concession has been made, irrespective of whether any amount is past-due, or the exposure is classified as defaulted. Exposures shall not be treated as forborne when the obligor is not in financial difficulties.
In the normal course of business, the LG of the loans in question would have deteriorated, the loans would have been included in the Watch List before renegotiation and the financial instrument would move from Stage 1 to Stage 2 in the three-stage model for impairment. Once renegotiated, the EIB would continue to closely monitor these loans and the financial instrument would be credit impaired and moved to Stage 3. If subsequently the LG of a loan improves sufficiently, the loan would be removed from the Watch List in line with the EIB’s procedures.
As part of its response to the economic effects of the COVID-19 pandemic, the Bank has decided to make a number of supportive measures available to its clients in certain circumstances, which include, among other things, (i) the temporary easing (including waivers) of financial covenants and other key clauses; (ii) the re-profiling of cash flows by setting new repayment schedules or the temporary standstill of repayment obligations; and (iii) certain other complementary supportive measures, such as the signing of new contracts, accelerating loan disbursements and increasing amounts lent to borrowers. The Bank is assessing requests for such measures on a case-by-case basis within the limits of certain specific conditions. These measures are intended to be extended to clients who are temporarily affected by the economic effects of the COVID-19 pandemic but who are not experiencing any structural financial difficulties or solvency issues and are considered to be a going concern at the time of granting such measures. If, as a result of the assessment, a client does not meet these requirements or the Facility identifies risks for the long-term sustainability of the client’s business model, it will consider any other appropriate measures and, if necessary, follow the EIB’s standard restructuring processes.
Forbearance measures and practices undertaken by the EIB during the reporting period include, but are not limited to, extension of maturities, deferral of capital only, deferral of capital and interest, breach of material covenants and capitalisation of arrears.
Operations subject to forbearance measures are reported as such in the table below:
|
(in EUR’000) |
||||
|
|
31.12.2021 |
31.12.2020 |
||
|
Performing |
Non-Performing |
Performing |
Non-Performing |
|
|
Number of contracts subject to forbearance practices |
16 |
9 |
12 |
14 |
|
Carrying values (incl. interest and amounts in arrears) |
210 553 |
58 742 |
169 274 |
58 748 |
|
ECL allowance recognised |
16 124 |
20 475 |
19 311 |
28 934 |
|
Interest income in respect of forborne contracts |
11 583 |
3 563 |
7 729 |
5 099 |
|
Exposures written-off / derecognised (following the termination / sale of the operation) |
— |
— |
— |
49 472 |
|
(in EUR’000) |
|||||||
|
|
Forbearance measures |
||||||
|
|
31.12.2020 |
Extension of maturities |
Deferral of capital and interest |
Breach of material financial covenants |
Other |
Contractual repayment, termination and/or write off |
31.12.2021 |
|
Financial institutions |
90 525 |
— |
— |
61 942 |
4 920 |
-8 061 |
149 326 |
|
Corporates |
137 497 |
-690 |
— |
-13 752 |
— |
-3 086 |
119 969 |
|
Total |
228 022 |
-690 |
— |
48 190 |
4 920 |
-11 147 |
269 295 |
3.2.4.
Available funds are invested in accordance with the Facility’s schedule of contractual disbursement obligations. As of 31 December 2021, and 31 December 2020, investments were in the form of bank deposits, certificates of deposit and commercial papers.
The authorised entities have a rating similar to the short-term and long-term ratings required for the EIB’s own treasury placements. In case of different ratings being granted by more than one credit rating agency, the lowest rating governs. The maximum authorised limit for each authorised bank is currently EUR 50 000 000 (fifty million euro). An exception to this rule has been granted to Societe Generale where the Facility has its operational cash accounts. The short-term credit limit for Societe Generale as at 31 December 2021 and 31 December 2020 amounts to EUR 110 000 000 (one hundred and ten million euro). The increased limit applies to the sum of the cash held at the operational cash accounts and the instruments issued by this counterpart and held by the treasury portfolio.
All investments have been done with authorised entities with a maximum tenor of three months from value date. All credit exposure limit breaches have been reported to the mandators. As at 31 December 2021 and as at 31 December 2020 all term deposits, commercial papers and cash in hand held by the treasury portfolio of the Facility had a minimum rating of at least P-2 (Moody’s equivalent) at settlement day.
The following table shows the situation of cash and cash equivalents including accrued interest:
|
(in EUR’000) |
|||||
|
Minimum short-term rating |
Minimum long-term rating |
31.12.2021 |
31.12.2020 |
||
|
(Moody’s term) |
(Moody’s term) |
||||
|
P-1 |
Aaa |
299 814 |
22 % |
49 988 |
5 % |
|
P-1 |
Aa2 |
160 066 |
12 % |
25 022 |
3 % |
|
P-1 |
Aa3 |
67 036 |
5 % |
130 024 |
14 % |
|
P-1 |
A1 |
82 730 |
6 % |
99 969 |
11 % |
|
P-1 |
A2 |
199 879 |
15 % |
119 972 |
13 % |
|
P-1 |
A3 |
444 064 |
32 % |
498 965 |
54 % |
|
P-2 |
A3 |
104 975 |
8 % |
— |
— |
|
Total |
1 358 564 |
100 % |
923 940 |
100 % |
|
3.2.5.
3.2.5.1. Credit risk policy of derivatives
The credit risk with respect to derivatives is represented by the loss which a given party would incur where the other counterparty to the deal would be unable to honour its contractual obligations. The credit risk associated with derivatives varies according to a number of factors (such as interest and exchange rates) and generally corresponds to only a small portion of their notional value.
In the normal course of its activity, the Facility may enter into swap contracts with a view to hedge specific lending operations or into currency forward contracts, with a view to hedge its currency positions denominated in actively traded currencies other than the euro. All the swaps are executed by the EIB with an external counterpart. The swaps are arranged by the same Master Swap Agreements and Credit Support Annexes signed between the EIB and its external counterparts.
3.2.5.2. Credit risk measurement for derivatives
All the swaps executed by the EIB that are related to the Facility are treated within the same contractual framework and methodologies applied for the derivatives negotiated by the EIB for its own purposes. In particular, eligibility of swap counterparts is determined by the EIB based on the same eligibility conditions applied for its general swap purposes.
The EIB measures the credit risk exposure related to swaps and derivatives transactions using the Net Market Exposure (‘NME’) and Potential Future Exposure (‘PFE’) approach for reporting and limit monitoring. The NME and the PFE fully include the derivatives related to the Investment Facility.
The Facility enters into foreign exchange short-term currency swaps (‘FX swaps’) contracts in order to hedge currency risk on loan disbursements in currencies other than EUR. FX swaps have a maturity of maximum three months and are regularly rolled-over. The notional amount of FX swaps stood at EUR 1 530,0 million as at 31 December 2021 against EUR 1 480,0 million as at 31 December 2020. The fair value of FX swaps amounts to EUR -16,3 million as at 31 December 2021 against EUR 33,6 million as at 31 December 2020.
The Facility enters into cross currency swaps contracts in order to hedge currency risk on loan disbursements in currencies other than EUR. Cross currency swaps have a long-term maturity. The notional amount of FX swaps stood at EUR 51,9 million as at 31 December 2021 and the fair value of FX swaps amounts to EUR -2,6 million as at 31 December 2021 against 31 December 2020 when there was no cross currency swap.
The Facility enters into interest rate swap contracts in order to hedge the interest rate risk on loans disbursed. As at 31 December 2021 interest rate swaps were unwind. Outstanding notional amount of EUR 0,0 million (2020: EUR 17,7 million) and a fair value of EUR 0,0 million (2020: EUR -0,6 million).
3.2.6.
The following table shows the situation of the treasury portfolio entirely composed of commercial papers issued by sub-sovereigns, banks and non-bank entities original maturity of more than three months. EU Member States, their agencies, banks and non-bank entities are eligible issuers. The maximum authorised limit for each authorised issuer is EUR 50 000 000 (fifty million euro). Investments in medium and long-term bonds could also be eligible depending on liquidity requirements:
|
(in EUR ‘000) |
|||||
|
Minimum short-term rating |
Minimum long-term rating |
31.12.2021 |
31.12.2020 |
||
|
(Moody’s term) |
(Moody’s term) |
||||
|
P-1 |
Aa1 |
— |
0 % |
50 006 |
14 % |
|
P-1 |
Aa2 |
— |
0 % |
50 040 |
14 % |
|
P-1 |
Aa3 |
— |
0 % |
50 016 |
14 % |
|
P-1 |
Aaa |
— |
0 % |
51 705 |
15 % |
|
P-1 |
A2 |
— |
0 % |
50 058 |
15 % |
|
P-2 |
Baa1 |
— |
0 % |
50 035 |
14 % |
|
P-2 |
Baa3 |
— |
0 % |
50 013 |
14 % |
|
Total |
— |
0 % |
351 873 |
100 % |
|
3.3. Liquidity risk
Liquidity risk refers to an entity’s ability to fund increases in assets and meet obligations as they come due, without incurring unacceptable losses. It can be split into funding liquidity risk and market liquidity risk. Funding liquidity risk is the risk that an entity will not be able to meet efficiently both expected and unexpected current and future cash flow needs without affecting its daily operations or its financial condition. Market liquidity risk is the risk that an entity cannot easily offset or eliminate a position at the market price because of inadequate market depth or market disruption.
3.3.1.
The Facility is primarily funded by annual contributions from Member States as well as by reflows stemming from the Facility’s operations. The Facility manages its funding liquidity risk primarily by planning its net liquidity needs and the required Member States annual contributions.
In order to calculate Member States’ annual contributions, disbursement patterns of the existing and pipelined portfolio is analysed and followed up throughout the year. Special events, such as early reimbursements, sales of shares or default cases are taken into account to correct annual liquidity requirements.
To further minimise the liquidity risk, the Facility maintains a liquidity reserve sufficient to cover at any PIT forecasted cash disbursements, as communicated periodically by the EIB’s Lending Department. Funds are invested on the money market and bond markets in the form of interbank deposits and other short-term financial instruments by taking into consideration the Facility’s cash disbursement obligations. The Facility’s liquid assets are managed by the Bank’s Treasury Department with a view to maintain appropriate liquidity to enable the Facility to meet its obligations.
In accordance with the principle of segregation of duties between the Front and Back Office, settlement operations related to the investment of these assets are under the responsibility of the EIB’s Planning and Settlement of Operations Department. Furthermore, the authorisation of counterparts and limits for treasury investments, as well as the monitoring of such limits, are the responsibility of the Bank’s Risk Management Directorate.
3.3.2.
The tables in this section analyse the financial liabilities of the Facility by maturity on the basis of the period remaining between the balance sheet date and the contractual maturity date (based on undiscounted cash flows).
In terms of non-derivative financial liabilities, the Facility holds commitments in form of undisbursed portions of the credit under signed loan agreements, of undisbursed portions of signed capital subscription/investment agreements, of loan guarantees granted, or of committed interest subsidies and TA.
Loans under the IF have a disbursement deadline. However, disbursements are made at times and in amounts reflecting the progress of underlying investment projects. Moreover, the IF’s loans are transactions performed in a relatively volatile operating environment, hence their disbursement schedule is subject to a significant degree of uncertainty.
Capital investments become due when and as soon as equity fund managers issue valid calls for capital, reflecting the progress in their investment activities. The drawdown period is usually of 3 years, with frequent prolongation by one or two years. Some disbursement commitments usually survive the end of the drawdown period until full disposal of the fund’s underlying investments, as the fund’s liquidity may be insufficient from time to time to meet payment obligations arising in respect of fees or other expenses.
Guarantees are not subject to specific disbursement commitments unless a guarantee is called. The amount of guarantees outstanding is reduced alongside the repayment schedule of guaranteed loans.
Committed interest subsidies’ cash outflows occur in the case of subsidised loans financed by the Bank’s own resources. Therefore, reported outflows represent only commitments related to these loans rather than the total amount of committed undisbursed interest subsidies. As in the case of loans, their disbursement schedule is uncertain.
Committed TA ‘gross nominal outflow’ in the ‘Maturity profile of non-derivative financial liabilities’ table refers to the total undisbursed portion of signed TA contracts. The disbursement time pattern is subject to a significant degree of uncertainty. Cash outflows classified in the ‘3 months or less’ bucket represent the amount of outstanding invoices received by the reporting date.
Commitments for non-derivative financial liabilities for which there is no defined contractual maturity date are classified under ‘Maturity Undefined’. Commitments, for which there is a recorded cash disbursement request at the reporting date, are classified under the relevant time bucket.
In terms of derivative financial liabilities, the maturity profile represents the contractual undiscounted gross cash flows of swap contracts including cross currency swaps (CCS), cross currency interest rate swaps (CCIRS), short-term currency swaps and interest rate swaps.
|
(in EUR’000) |
||||||
|
Maturity profile of non-derivative financial liabilities |
3 months or less |
More than 3 months to 1 year |
More than 1 year to 5 years |
More than 5 years |
Maturity Undefined |
Gross nominal outflow |
|
as at 31.12.2021 |
||||||
|
Outflows for committed but undisbursed loans |
— |
— |
— |
— |
1 677 411 |
1 677 411 |
|
Outflows for committed investment funds and share subscription |
6 322 |
— |
— |
— |
466 678 |
473 000 |
|
Others (signed non-issued guarantees, issued guarantees) |
— |
— |
— |
— |
1 755 974 |
1 755 974 |
|
Outflows for committed interest subsidies |
— |
— |
— |
— |
379 620 |
379 620 |
|
Outflows for committed TA |
1 519 |
— |
— |
— |
37 617 |
39 136 |
|
Total |
7 841 |
— |
— |
— |
4 317 300 |
4 325 141 |
|
(in EUR’000) |
||||||
|
Maturity profile of non-derivative financial liabilities |
3 months or less |
More than 3 months to 1 year |
More than 1 year to 5 years |
More than 5 years |
Maturity Undefined |
Gross nominal outflow |
|
as at 31.12.2020 |
||||||
|
Outflows for committed but undisbursed loans |
199 006 |
— |
— |
— |
1 523 612 |
1 722 618 |
|
Outflows for committed investment funds and share subscription |
1 043 |
— |
— |
— |
377 303 |
378 347 |
|
Others (signed non-issued guarantees, issued guarantees) |
— |
— |
— |
— |
1 553 246 |
1 553 246 |
|
Outflows for committed interest subsidies |
18 494 |
— |
— |
— |
356 391 |
374 885 |
|
Outflows for committed TA |
2 504 |
— |
— |
— |
43 029 |
45 533 |
|
Total |
221 047 |
— |
— |
— |
3 853 581 |
4 074 629 |
|
(in EUR’000) |
|||||
|
Maturity profile of derivative financial liabilities |
3 months or less |
More than 3 months to 1 year |
More than 1 year to 5 years |
More than 5 years |
Gross nominal inflow/outflow |
|
as at 31.12.2021 |
|||||
|
CCS — Inflows |
82 |
3 340 |
34 870 |
9 394 |
47 686 |
|
CCS — Outflows |
-115 |
-8 470 |
-47 250 |
-10 329 |
-66 164 |
|
Short-term currency swaps — Inflows |
1 530 000 |
— |
— |
— |
1 530 000 |
|
Short-term currency swaps — Outflows |
-1 547 698 |
— |
— |
— |
-1 547 698 |
|
Total |
-17 731 |
-5 130 |
-12 380 |
-935 |
-36 176 |
|
(in EUR’000) |
|||||
|
Maturity profile of derivative financial liabilities |
3 months or less |
More than 3 months to 1 year |
More than 1 year to 5 years |
More than 5 years |
Gross nominal inflow/outflow |
|
as at 31.12.2020 |
|||||
|
Short-term currency swaps — Inflows |
1 480 000 |
— |
— |
— |
1 480 000 |
|
Short-term currency swaps — Outflows |
-1 448 077 |
— |
— |
— |
-1 448 077 |
|
Interest Rate Swaps — Inflows |
147 |
394 |
775 |
— |
1 316 |
|
Interest Rate Swaps — Outflows |
— |
-815 |
-1 142 |
— |
-1 957 |
|
Total |
32 070 |
-421 |
-367 |
— |
31 282 |
3.3.3.
The following table sets out the non-derivative financial assets and financial liabilities expected to be recovered or settled more than 12 months after the reporting date.
|
(in EUR’000) |
||
|
|
31.12.2021 |
31.12.2020 |
|
Financial assets: |
|
|
|
Loans and advances |
2 074 642 |
1 812 807 |
|
Shares and other variable yield securities |
697 631 |
526 810 |
|
Other assets |
1 086 |
109 |
|
Total |
2 773 359 |
2 339 726 |
|
Financial liabilities: |
|
|
|
Provisions for guarantees issued |
— |
851 |
|
Amount owed to third parties (*14) |
179 593 |
81 371 |
|
Provisions for loan commitments |
16 602 |
33 152 |
|
Total |
196 195 |
115 374 |
3.4. Market risk
Market risk represents the risk that changes in market prices and rates, such as interest rates, equity prices and foreign exchange rates will affect an entity’s income or the value of its holdings in financial instruments.
3.4.1.
Interest rate risk arises from the volatility in the economic value of, or in the income derived from, interest rate bearing positions due to adverse movements in interest rates.
The Facility is not directly impacted by the fluctuation of its economic value or to pricing mismatches between different assets, liabilities and hedge instruments because (i) it does not have any direct borrowing costs or interest rate bearing liabilities and (ii) it accepts the impact of interest rate fluctuations on the revenues from its investments.
The Facility measures the sensitivity of its loan portfolio and micro hedging swaps to interest rate fluctuations via a Basis Point Value (‘BPV’) calculation.
The BPV measures the gain or loss in the net present value of the relevant portfolio, due to a 1 basis point (0,01 %) increase in interest rates tenors ranging within a specified time bucket ‘money market — up to one year’, ‘very short — 2 to 3 years’, ‘short — 4 to 6 years’, ‘medium — 7 to 11 years’, ‘long — 12 to 20 years’ or ‘extra-long — more than 21 years’.
To determine the net present value (‘NPV’) of the loans’ cash flows denominated in EUR, the Facility uses the EUR 3 month swap curve. The NPV of the loans’ cash flows denominated in non-EUR currencies is determined by using the EUR 3 month swap plus the cross currency swap basis. For those non-EUR currencies for which a reliable and sufficiently complete discount curve is not available, either the EUR or USD discount curve is used instead.
To calculate the net present value of the micro hedging swaps, the Facility uses the EUR swap curve for cash flows denominated in EUR and the USD swap curve for cash flows denominated in USD.
As shown in the following table the net present value of the loan portfolio including related micro-hedging swaps as at 31 December 2021 would decrease by EUR 769 000 (as at 31 December 2020: decrease by EUR 697 000) if all relevant interest rates curves are simultaneously shifted upwards in parallel by 1 basis point.
|
(in EUR’000) |
|||||||
|
Basis point value |
Money |
Very Short |
Short |
Medium |
Long |
Extra Long |
Total |
|
Market |
|||||||
|
As at 31.12.2021 |
1 year |
2 to 3 years |
4 to 6 years |
7 to 11 years |
12 to 20 years |
21 years |
|
|
Total sensitivity of loans and micro hedging swaps |
-46 |
-120 |
-371 |
-218 |
-14 |
— |
-769 |
|
(in EUR’000) |
|||||||
|
Basis point value |
Money |
Very Short |
Short |
Medium |
Long |
Extra Long |
Total |
|
Market |
|||||||
|
As at 31.12.2020 |
1 year |
2 to 3 years |
4 to 6 years |
7 to 11 years |
12 to 20 years |
21 years |
|
|
Total sensitivity of loans and micro hedging swaps |
-45 |
-113 |
-313 |
-215 |
-11 |
— |
-697 |
IBOR Reform:
Nature and extent of Risk and Risk Management
Interest rate benchmarks, such as the London InterBank Offered Rate (‘LIBOR’) are widely used in financial contracts. In recent years, confidence in their reliability and robustness has been undermined, and regulators across the globe have been pushing for a reform of interest rate benchmarks. The global transition to alternative interest rate benchmark rates is one of the most challenging reforms to be undertaken in the financial markets.
In February 2018, the Bank’s Assets & Liabilities Committee (ALCO) set up a dedicated sub-ALCO working group on IBORs, the IBOR Working Group to proactively follow and monitor the developments related to the transition to alternative interest rates.
The objectives of the IBOR Working Group included closely monitoring the developments related to the interest rate benchmark reform, evaluating the extent to which the transition to the alternative rates advanced. It covered, among others, the progress on contracts amendments, bilateral negotiations with clients, IT systems and applications updates, introduction of fallback language in new contracts, regular monitoring of the exposure to IBORs per currency and asset class.
The progress in the implementation of the established workplan has been regularly monitored and discussed at the ALCO, and periodically reported to the Bank’s Senior Management.
The main risks to which the Facility has been exposed as a result of IBOR reform are operational. For example, updating of systems that use IBOR curves and revision of operational controls related to the reform and regulatory risks, the renegotiation of loan contracts through bilateral negotiation with customers, updating of contractual terms, adjustments to settlement and payment infrastructures. Financial risk is predominantly limited to interest rate risk.
The risks did not result in a change of the Facility’s risk management strategy.
Exposure per financial instruments class and transition status
As part of its lending, the Facility is mainly exposed to the IBOR Reform on Floating Rates Loans denominated in USD. Floating rates assets are generally reported at amortised cost in the Facility’s statement of financial position. In addition, the Facility uses derivative instruments to micro hedge fixed rates loans and borrowings operations as well as for monitoring its global interest rate and foreign exchange positions.
Derivatives are the largest asset class directly exposed to IBOR rate as their corresponding cash flows are referenced to IBOR rate (i.e., floating interest rate).
As at 31 December 2021, through the application of the ISDA fallback protocol, the Facility has migrated the whole portfolio of its derivatives referring to LIBORs that will cease to exist immediately after 30 June 2023 respectively. For the impact of the IBOR reform on the derivative instruments, please refer to the Note 6.
Loans are the second largest asset class directly exposed to IBOR rate as their corresponding cash flows are referenced to IBOR rate (i.e., floating interest rate).
Since 1 July 2020, the Bank has implemented and has been applying the updated EIB fallback language in all new loan contracts; a revised fallback language was introduced in Q2 2021.
The Bank set up a task force, which focused on reaching out to clients with contracts referencing USD LIBOR, in order to raise awareness, introduce fallback language wherever possible and generally understand clients’ preferences.
3.4.2.
Foreign exchange (‘FX’) risk for the IF is the risk of loss in earnings or economic value due to adverse movements of FX rates.
Given a reference accounting currency (EUR for the IF), the Facility is exposed to FX risk whenever there is a mismatch between assets and liabilities denominated in a non-reference accounting currency. FX risk also includes the effect of changes in the value of future cash flows denominated in non-reference accounting currency, e.g. interest and dividend payments, due to fluctuations in exchange rates.
3.4.2.1. Foreign exchange risk and treasury assets
The IF’s treasury assets are denominated in either EUR or USD.
FX risk is hedged by means of FX cross currency spot or forward transactions, FX swaps or cross-currency swaps. The EIB’s Treasury Department can, where deemed necessary and appropriate, use any other instrument, in line with the Bank’s policy, that provide protection against market risks incurred in connection with the IF’s financial activities.
3.4.2.2. Foreign exchange risk and operations financed or guaranteed by the IF
Member States’ IF contributions are received in EUR. The operations financed or guaranteed by the IF as well as interest subsidies can be denominated in EUR, USD or any other authorised currency.
A foreign exchange risk exposure (against the EUR reference currency) arises whenever transactions denominated in currencies other than the EUR are left un-hedged. The IF’s foreign exchange risk hedging guidelines are set out below.
3.4.2.2.1.
The FX risk generated by IF operations denominated in USD shall be covered on an aggregated basis via the use of EUR/USD FX swaps, rolled over and adjusted in terms of amount on a periodic basis. The use of FX swaps serves a dual purpose. On one side the necessary liquidity for new disbursements (loans and equity) is generated and on the other side an FX macro hedge is maintained.
At the beginning of each period, the cash flows to be received or paid in USD during the next period shall be estimated on the basis of planned or expected reflows/disbursements. Subsequently, the maturing FX swaps shall be rolled over, their amount being adjusted to cover at least the USD liquidity needs projected over the next period.
On a monthly basis, the USD FX position shall be hedged, if exceeding the relevant limits, by means of a spot or forward operation.
Within a roll-over period, unexpected USD liquidity deficits shall be covered by means of ad hoc FX swap operations while liquidity surpluses shall either be invested in treasury assets or converted into EUR if occurred from an increase of the FX position.
3.4.2.2.2.
IF operations denominated in currencies other than EUR and USD shall be hedged through cross-currency swap contracts with the same financial profile as the underlying Loan, provided that a swap market is operational.
IF has operations denominated in currencies for which hedging possibilities are either not efficiently available or available at a high cost. These operations are denominated in local currencies (‘LCs’) but settled in EUR or USD. IF’s financial risk framework, which was approved by the IF Committee on 22 January 2015, offers the possibility to hedge the FX exposure in LCs that exhibit a significant positive correlation with the USD synthetically via USD-denominated derivatives. The LCs hedged synthetically with USD denominated derivatives are reported in the table in Section 3.4.2.2.3 below under item ‘Local currencies (under synthetic hedge)’, while the LCs not hedged synthetically with the USD are reported in the same table under item ‘Local currencies (not under synthetic hedge)’.
3.4.2.2.3.
The tables of this note show the Facility’s foreign exchange position.
The foreign exchange position is presented in the tables below in accordance with the IF’s Risk Policies (as described in the IF’s financial risk framework). The FX position as per Risk Policies is based on accounting figures and defined as the balance between selected assets and liabilities. The assets and liabilities defined in the FX position as per Risk Policies are selected to ensure that the earnings will only be converted into the reporting currency (EUR) when received.
The fair value change on shares and other variable yield securities are included in the FX position as per Risk Policies, as well as impairments on loans and advances. Derivatives included in the FX position as per Risk Policies are considered at their nominal value instead of their fair value, in order to be aligned with the retained value of the assets, considered also at their nominal value adjusted by the impairment for loans.
In the tables below, the remaining part of the assets and liabilities, which includes mainly interest accruals on loans, derivatives and subsidies, are presented under ‘FX position excluded from Risk Policies’.
|
As at 31 December 2021 |
Assets and liabilities |
Commitments and contingent liabilities |
||
|
Currencies |
FX position as per Risk Policies |
FX position excluded from Risk Policies |
Balance sheet FX position |
|
|
USD |
- 130 383 |
-29 399 |
- 159 782 |
756 190 |
|
Local currencies (under synthetic hedge) (*15) |
|
|
|
|
|
KES |
90 567 |
7 138 |
97 705 |
— |
|
TZS |
16 478 |
333 |
16 811 |
— |
|
DOP |
18 783 |
301 |
19 084 |
— |
|
UGX |
36 935 |
978 |
37 913 |
— |
|
RWF |
49 667 |
365 |
50 032 |
— |
|
Local currencies (not under synthetic hedge) (*15) |
|
|
|
|
|
HTG, MUR, MZN, XOF, ZMW, BWP, JMD, NGN, ZAR |
96 450 |
-517 |
95 933 |
— |
|
Total non-EUR currencies |
178 497 |
-20 801 |
157 696 |
756 190 |
|
EUR |
— |
3 645 241 |
3 645 241 |
628 913 |
|
Total EUR and non-EUR |
178 497 |
3 624 440 |
3 802 937 |
1 385 103 |
|
As at 31 December 2020 |
Assets and liabilities |
Commitments and contingent liabilities |
||
|
Currencies |
FX position as per Risk Policies |
FX position excluded from Risk Policies |
Balance sheet FX position |
|
|
USD |
- 117 144 |
-51 893 |
- 169 037 |
479 103 |
|
Local currencies (under synthetic hedge) (*16) |
|
|
|
|
|
KES |
23 439 |
-960 |
22 479 |
— |
|
TZS |
27 302 |
272 |
27 574 |
— |
|
DOP |
14 538 |
320 |
14 858 |
— |
|
UGX |
44 997 |
572 |
45 569 |
— |
|
RWF |
44 523 |
-872 |
43 651 |
— |
|
Local currencies (not under synthetic hedge) (*16) |
|
|
|
|
|
HTG, MUR, MZN, XOF, ZMW, BWP, JMD, NGN, ZAR |
98 509 |
-1 512 |
96 997 |
— |
|
Total non-EUR currencies |
136 164 |
-54 073 |
82 091 |
479 103 |
|
EUR |
— |
3 276 377 |
3 276 377 |
1 661 939 |
|
Total EUR and non-EUR |
136 164 |
3 222 304 |
3 358 468 |
2 141 042 |
3.4.2.3. Foreign exchange sensitivity analysis
As at 31 December 2021 a 10 per cent depreciation of EUR versus all non-EUR currencies would result in an increase of the contributors’ resources amounting to EUR 17,5 million (31 December 2020: EUR 9,1 million). A 10 per cent appreciation of the EUR versus all non-EUR currencies would result in a decrease of the contributors’ resources amounting to EUR -14,3 million (31 December 2020: EUR -7,5 million).
3.4.2.4. Conversion rates
The following conversion rates were used for establishing the balance sheet at 31 December 2021 and 31 December 2020:
|
|
31 December 2021 |
31 December 2020 |
|
Non-EU currencies |
|
|
|
Botswana Pula (BWP) |
13,27 |
13,20 |
|
Dominican Republic Pesos (DOP) |
64,83 |
71,27 |
|
Fiji Dollars (FJD) |
2,36 |
2,46 |
|
Haitian Gourde (HTG) |
113,16 |
87,33 |
|
Jamaican Dollar (JMD) |
173,48 |
172,10 |
|
Kenya Shillings (KES) |
128,26 |
133,80 |
|
Mauritania Ouguiyas (MRU) |
40,99 |
44,14 |
|
Mauritius Rupees (MUR) |
49,30 |
48,52 |
|
Mozambican Metical (MZN) |
71,70 |
91,02 |
|
Nigerian Naira (NGN) |
467,07 |
466,78 |
|
Rwanda Francs (RWF) |
1 162,53 |
1 210,77 |
|
Tanzania Shillings (TZS) |
2 610,48 |
2 838,58 |
|
Uganda Shillings (UGX) |
4 027,00 |
4 474,00 |
|
United States Dollars (USD) |
1,13 |
1,23 |
|
Franc CFA Francs (XAF/XOF) |
655,96 |
655,96 |
|
South Africa Rand (ZAR) |
18,06 |
18,02 |
|
Zambia Kvacha (ZMW) |
18,88 |
25,93 |
3.4.3.
Equity price risk refers to the risk that the fair values of equity investments decrease as the result of changes in the levels of equity prices and/or the value of equity investments.
The IF is exposed to equity price risk via its investments in direct equity and venture capital funds.
The value of non-listed equity positions is not readily available for the purpose of monitoring and control on a continuous basis. For such positions, the best indications available include prices derived from any relevant valuation techniques.
The effect on the Facility’s contributors’ resources (as a result of a change in the fair value of the equity instruments portfolio) due to a +/-10 % change in the value of individual direct equity and venture capital investments, with all other variables held constant, is EUR 69,8 million and EUR -69,8 million respectively as at 31 December 2021 (EUR 52,7 million and EUR -52,7 million respectively as at 31 December 2020).
4. Fair values of financial instruments
4.1. Accounting classifications and fair values
The following table shows the carrying amounts and fair values of financial assets and financial liabilities, including their levels in the fair value hierarchy. These do not include fair value information for financial assets and financial liabilities not carried at fair value if the carrying amount is a reasonable approximation of fair value.
|
(in EUR’000) |
||||||||||
|
At 31 December 2021 |
Carrying amount |
Fair value |
||||||||
|
|
Derivative financial instruments |
Shares and other variable yield securities |
Cash, loans and advances |
Treasury financial assets |
Other financial assets/liabilities |
Total |
Level 1 |
Level 2 |
Level 3 |
Total |
|
Financial assets mandatorily measured at FVTPL |
|
|
|
|
|
|
|
|
|
|
|
Derivative financial instruments |
7 |
— |
— |
— |
— |
7 |
— |
7 |
— |
7 |
|
Venture Capital Fund |
— |
590 570 |
— |
— |
— |
590 570 |
— |
— |
590 570 |
590 570 |
|
Direct Equity Investments |
— |
107 061 |
— |
— |
— |
107 061 |
— |
— |
107 061 |
107 061 |
|
Loans and advances |
— |
— |
229 991 |
— |
— |
229 991 |
— |
— |
229 991 |
229 991 |
|
Total financial assets mandatorily measured at FVTPL |
7 |
697 631 |
229 991 |
— |
— |
927 629 |
— |
7 |
927 622 |
927 629 |
|
Financial assets measured at AC |
|
|
|
|
|
|
|
|
|
|
|
Cash and cash equivalents |
— |
— |
1 358 564 |
— |
— |
1 358 564 |
— |
252 080 |
— |
252 080 |
|
Loans and advances |
— |
— |
1 756 290 |
— |
— |
1 756 290 |
— |
1 918 979 |
— |
1 918 979 |
|
Amounts receivable from contributors |
— |
— |
85 210 |
— |
— |
85 210 |
— |
— |
— |
— |
|
Treasury financial assets |
— |
— |
— |
— |
— |
— |
— |
— |
— |
— |
|
Other assets |
— |
— |
— |
— |
1 086 |
1 086 |
— |
— |
— |
— |
|
Total financial assets measured at AC |
— |
— |
3 200 064 |
— |
1 086 |
3 201 150 |
— |
2 171 059 |
— |
2 171 059 |
|
Total financial assets |
7 |
697 631 |
3 430 055 |
— |
1 086 |
4 128 779 |
|
|
|
|
|
Financial liabilities measured at FVTPL |
|
|
|
|
|
|
|
|
|
|
|
Derivative financial instruments |
-18 835 |
— |
— |
— |
— |
-18 835 |
— |
-18 835 |
— |
-18 835 |
|
Total financial liabilities measured at FVTPL |
-18 835 |
— |
— |
— |
— |
-18 835 |
— |
-18 835 |
— |
-18 835 |
|
Financial liabilities at AC |
|
|
|
|
|
|
|
|
|
|
|
Provisions for guarantees issued |
— |
— |
— |
— |
— |
— |
|
|
|
|
|
Provisions for loan commitments |
— |
— |
— |
— |
-16 602 |
-16 602 |
|
|
|
|
|
Amounts owed to third parties |
— |
— |
— |
— |
- 239 639 |
- 239 639 |
|
|
|
|
|
Other liabilities |
— |
— |
— |
— |
-2 333 |
-2 333 |
|
|
|
|
|
Total financial liabilities measured at AC |
— |
— |
— |
— |
- 258 574 |
- 258 574 |
|
|
|
|
|
Total financial liabilities |
-18 835 |
— |
— |
— |
- 258 574 |
- 277 409 |
|
|
|
|
|
(in EUR’000) |
||||||||||
|
As at 31 December 2020 |
Carrying amount |
Fair value |
||||||||
|
|
Derivative financial instruments |
Shares and other variable yield securities |
Cash, loans and advances |
Treasury financial assets |
Other financial assets/liabilities |
Total |
Level 1 |
Level 2 |
Level 3 |
Total |
|
Financial assets mandatorily measured at FVTPL |
|
|
|
|
|
|
|
|
|
|
|
Derivative financial instruments |
33 584 |
— |
— |
— |
— |
33 584 |
— |
33 584 |
— |
33 584 |
|
Venture Capital Fund |
— |
437 142 |
— |
— |
— |
437 142 |
— |
— |
437 142 |
437 142 |
|
Direct Equity Investment |
— |
89 668 |
— |
— |
— |
89 668 |
— |
— |
89 668 |
89 668 |
|
Loans and advances |
— |
— |
47 309 |
— |
— |
47 309 |
— |
— |
47 309 |
47 309 |
|
Total financial assets mandatorily measured at FVTPL |
33 584 |
526 810 |
47 309 |
— |
— |
607 703 |
— |
33 584 |
574 119 |
607 703 |
|
Financial assets at AC |
|
|
|
|
|
|
|
|
|
|
|
Cash and cash equivalents |
— |
— |
923 940 |
— |
— |
923 940 |
— |
— |
— |
— |
|
Loans and advances |
— |
— |
1 626 136 |
— |
— |
1 626 136 |
— |
1 757 593 |
— |
1 757 593 |
|
Amounts receivable from contributors |
— |
— |
68 908 |
— |
— |
68 908 |
— |
— |
— |
— |
|
Treasury financial assets |
— |
— |
— |
351 873 |
— |
351 873 |
300 174 |
50 032 |
— |
350 206 |
|
Other assets |
— |
— |
— |
— |
109 |
109 |
— |
— |
— |
— |
|
Total financial assets measured at AC |
— |
— |
2 618 984 |
351 873 |
109 |
2 970 966 |
300 174 |
1 807 625 |
— |
2 107 799 |
|
Total financial assets |
33 584 |
526 810 |
2 666 293 |
351 873 |
109 |
3 578 669 |
|
|
|
|
|
Financial liabilities mandatorily measured at FVTPL |
|
|
|
|
|
|
|
|
|
|
|
Derivative financial instruments |
-642 |
— |
— |
— |
— |
-642 |
— |
-642 |
— |
-642 |
|
Total financial liabilities measured at FVTPL |
-642 |
— |
— |
— |
— |
-642 |
— |
-642 |
— |
-642 |
|
Financial liabilities at AC |
|
|
|
|
|
|
|
|
|
|
|
Provisions for guarantees issued |
— |
— |
— |
— |
-851 |
-851 |
|
|
|
|
|
Provisions for loan commitments |
— |
— |
— |
— |
-33 152 |
-33 152 |
|
|
|
|
|
Amounts owed to third parties |
— |
— |
— |
— |
- 152 378 |
- 152 378 |
|
|
|
|
|
Other liabilities |
— |
— |
— |
— |
-3 446 |
-3 446 |
|
|
|
|
|
Total financial liabilities measured at AC |
— |
— |
— |
— |
- 189 827 |
- 189 827 |
|
|
|
|
|
Total financial liabilities |
-642 |
— |
— |
— |
- 189 827 |
- 190 469 |
|
|
|
|
4.2. Measurement of fair values
4.2.1.
The table below sets out information about the valuation techniques and significant unobservable inputs used in measuring financial instruments, categorised as Level 2 and 3 in the fair value hierarchy:
|
Valuation technique |
Significant unobservable inputs |
Relationship of unobservable inputs to fair value measurement |
|
|
Financial instruments carried at fair value |
|
|
|
|
Derivative financial instruments |
Discounted cash flow: Future cash flows are estimated based on forward exchange/interest rates (from observable forward exchange rates and yield curves at the end of the reporting period) and contract forward/interest rates, discounted at a rate that reflects the credit risk of various counterparties. |
Not applicable. |
Not applicable. |
|
Venture Capital Fund (VCF) |
Adjusted net assets method: The fair value is determined by applying either the Facility’s percentage ownership in the underlying vehicle to the net asset value reflected in the most recent report adjusted for cash flows or, where available, the precise share value at the same date, submitted by the respective Fund Manager. In order to bridge the interval between the last available Net assets value (NAV) and the year-end reporting, a subsequent event review procedure is performed and if necessary the reported NAV is adjusted. |
Adjustment for time elapsed between the last reporting date of the VCF and the measurement date, taking into account: operating expenses and management fees, subsequent changes in the fair value of the VCF’s underlying assets, additional liabilities incurred, market changes or other economic condition changes. |
The longer the period between the fair value measurement date and the last reporting date of the VCF, the higher the adjustment for time elapsed. |
|
Direct Equity Investment |
Adjusted net assets. |
Adjustment for time elapsed between the last reporting date of the investee and the measurement date, taking into account: operating expenses, subsequent changes in the fair value of the investee’s underlying assets, additional liabilities incurred, market changes or other economic condition changes, capital increase, sale/change of control. |
The higher the marketability discount, the lower the fair value. |
|
|
|
Discount for lack of marketability (liquidity) determined by reference to previous transaction prices for similar equities in the country/region, ranging from 5 to 30 %. |
|
|
Loans at fair value (IFE) |
For going concern borrowers: Discounted cash flow using contractual/expected future cash flows discounted with appropriate risk-adjusted discount rate that captures the risk inherent to the loan (including credit risk of the borrower). The discount rate is compared/assessed with any relevant market benchmark. For borrowers not going concern: Net assets approach (liquidation value approach). |
Components of the discount rate to reflect the credit risk of borrower compared to the risk-free market rates. |
The higher the discount rate the lower the fair value |
|
Financial instruments not carried at fair value |
|
|
|
|
Loans and advances |
Discounted cash flows: The valuation model uses contractual cash flows that are conditional upon the non-occurrence of default by the debtor and do not take into account any collateral values or early repayments’ scenarios. To obtain the Net Present Value (NPV) of the loans, the model retained discounts the contractual cash flows of each loan using an adjusted market discount curve. The individual loan NPV is then adjusted to take into consideration the relevant associated Expected Loss. The results are then summed to obtain the fair value of loans and advances. |
Not applicable. |
Not applicable. |
|
Treasury financial assets |
Discounted cash flows. |
Not applicable. |
Not applicable. |
With the application of IFRS 13, valuation adjustments are included in the fair value of derivatives as at 31 December 2021 and 2020, namely:
|
— |
Credit valuation adjustments (CVA), reflecting counterparty credit risk on derivative transactions, amounting to EUR - 167 800 as at 31 December 2021 and to EUR -34 300 as at 31 December 2020. |
|
— |
Debit valuation adjustments (DVA), reflecting own credit risk on derivative transactions, amounting to EUR +2 700 as at 31 December 2021 and EUR +21 800 as at 31 December 2020. |
4.2.2.
The Facility’s policy is to recognise the transfers between Levels as of the date of the event or change in circumstances that caused the transfer.
In 2021 and 2020 the Facility did not make transfers from Level 1 to 2 or Level 2 to 1 of the fair value hierarchy.
4.2.3.
Reconciliation of Level 3 fair values
The following tables present the changes in Level 3 instruments for the year ended 31 December 2021 and 31 December 2020:
|
(in EUR'000) |
|
|
Shares and other variable yield securities |
|
|
Balance as at 1 January 2021 |
526 810 |
|
Gains or losses included in profit or loss: |
|
|
Derecognition of fair value adjustment due to sales |
13 489 |
|
Net fair value change on shares and other variable yield securities |
117 502 |
|
Total |
130 991 |
|
Disbursements |
84 224 |
|
Repayments |
-71 624 |
|
Foreign exchange rates differences |
27 230 |
|
Balance as at 31 December 2021 |
697 631 |
|
(in EUR'000) |
|
|
Shares and other variable yield securities |
|
|
Balance as at 1 January 2020 |
604 311 |
|
Gains or losses included in profit or loss: |
|
|
Derecognition of fair value adjustment due to sales |
-15 632 |
|
Net fair value change on shares and other variable yield securities |
-47 909 |
|
Total |
-63 541 |
|
Disbursements |
85 305 |
|
Repayments |
-65 649 |
|
Foreign exchange rates differences |
-33 616 |
|
Balance as at 31 December 2020 |
526 810 |
In 2021 and 2020 the Facility did not make transfers out or to Level 3 of the fair value hierarchy.
5. Cash and cash equivalents
The cash and cash equivalents are composed of:
|
(in EUR'000) |
||
|
|
31.12.2021 |
31.12.2020 |
|
Cash in hand |
434 064 |
398 991 |
|
Term deposits |
672 730 |
380 000 |
|
Commercial papers |
252 211 |
145 086 |
|
Cash and cash equivalents in the cash flow statement |
1 359 005 |
924 077 |
|
Accrued interest |
-441 |
-137 |
|
Cash and cash equivalents in the statement of financial position |
1 358 564 |
923 940 |
6. Derivative financial instruments
The main components of derivative financial instruments, classified as held for trading, are as follows:
|
(in EUR'000) |
|||
|
As at 31 December 2021 |
Fair Value |
Notional amount |
|
|
Assets |
Liabilities |
||
|
Cross currency swaps |
7 |
-2 568 |
51 865 |
|
FX swaps |
— |
-16 267 |
1 530 000 |
|
Total derivative financial instruments |
7 |
-18 835 |
1 581 865 |
|
(in EUR'000) |
|||
|
As at 31 December 2020 |
Fair Value |
Notional amount |
|
|
Assets |
Liabilities |
||
|
Interest rate swaps |
— |
-642 |
17 710 |
|
FX swaps |
33 584 |
— |
1 480 000 |
|
Total derivative financial instruments |
33 584 |
-642 |
1 497 710 |
As a result of the IBOR reform, in 2021 minimal one-time valuation difference occurred from the change in benchmark cash flows and discount curve to be used in amount of EUR 883.
7. Loans and advances
7.1. Loans and advances
The following table shows the reconciliation from the opening to the closing balance of loans and advances:
|
(in EUR'000) |
|||||
|
|
Global loans (*17) |
Senior loans |
Subordinated loans |
POCI |
Total |
|
Nominal of loans at AC as at 1 January 2021 |
1 151 398 |
572 864 |
— |
— |
1 724 262 |
|
Disbursements |
274 020 |
62 869 |
— |
— |
336 889 |
|
Write offs |
— |
— |
— |
— |
— |
|
Repayments |
- 225 990 |
- 113 215 |
— |
— |
- 339 205 |
|
Interest capitalised |
— |
— |
— |
— |
— |
|
Foreign exchange rates differences |
61 532 |
26 597 |
— |
— |
88 129 |
|
Nominal of loans at AC as at 31 December 2021 |
1 260 960 |
549 115 |
— |
— |
1 810 075 |
|
Impairment — loss allowance as at 1 January 2021 |
-68 243 |
-35 550 |
— |
— |
- 103 793 |
|
Net changes of the 12-month ECL |
6 509 |
6 836 |
— |
— |
13 345 |
|
Net changes of lifetime ECL not credit-impaired |
6 327 |
6 045 |
— |
— |
12 372 |
|
Lifetime ECL credit-impaired |
-249 |
-742 |
— |
— |
-991 |
|
Reversal of lifetime ECL credit-impaired |
15 875 |
2 373 |
— |
— |
18 248 |
|
Foreign exchange rates differences |
-3 942 |
-1 153 |
— |
— |
-5 095 |
|
Impairment — loss allowance as at 31 December 2021 |
-43 723 |
-22 191 |
— |
— |
-65 914 |
|
Loans and advances at AC as at 31 December 2021 |
1 217 237 |
526 924 |
— |
— |
1 744 161 |
|
Nominal of loans at FVTPL as at 1 January 2021 |
1 080 |
61 493 |
30 000 |
— |
92 573 |
|
Disbursements |
— |
8 323 |
170 000 |
— |
178 323 |
|
Repayments |
— |
-739 |
— |
— |
-739 |
|
Foreign exchange rates differences |
— |
1 859 |
— |
— |
1 859 |
|
Nominal of loans at FVTPL as at 31 December 2021 |
1 080 |
70 936 |
200 000 |
— |
272 016 |
|
Fair value adjustment as at 1 January 2021 |
-1 080 |
-25 893 |
-18 291 |
— |
-45 264 |
|
Net FV change |
— |
1 609 |
1 959 |
— |
3 568 |
|
Foreign exchange rates differences |
— |
-329 |
— |
— |
-329 |
|
Fair value adjustment as at 31 December 2021 |
-1 080 |
-24 613 |
-16 332 |
— |
-42 025 |
|
Loans and advances at FVTPL as at 31 December 2021 |
— |
46 323 |
183 668 |
— |
229 991 |
|
Amortised Cost |
-3 151 |
-3 736 |
— |
— |
-6 887 |
|
Interest |
10 295 |
8 686 |
35 |
— |
19 016 |
|
Loans and advances as at 31 December 2021 |
1 224 381 |
578 197 |
183 703 |
— |
1 986 281 |
|
(in EUR'000) |
|||||
|
|
Global loans (*18) |
Senior loans |
Subordinated loans |
POCI |
Total |
|
Nominal of loans at AC as at 1 January 2020 |
1 021 556 |
597 364 |
27 714 |
— |
1 646 634 |
|
Disbursements |
433 466 |
67 762 |
— |
— |
501 228 |
|
Write offs |
-15 170 |
-2 268 |
-27 905 |
— |
-45 343 |
|
Repayments |
- 214 018 |
-60 571 |
— |
— |
- 274 589 |
|
Foreign exchange rates differences |
-74 436 |
-29 423 |
191 |
— |
- 103 668 |
|
Nominal of loans at AC as at 31 December 2020 |
1 151 398 |
572 864 |
— |
— |
1 724 262 |
|
Impairment — loss allowance as at 1 January 2020 |
-96 166 |
-36 650 |
-27 714 |
— |
- 160 530 |
|
Net changes of the 12-month ECL |
-1 344 |
-2 531 |
— |
— |
-3 875 |
|
Net changes of lifetime ECL not credit-impaired |
-5 888 |
-3 628 |
— |
— |
-9 516 |
|
Lifetime ECL credit-impaired |
-12 373 |
— |
— |
— |
-12 373 |
|
Reversal of lifetime ECL credit-impaired |
19 565 |
1 887 |
— |
— |
21 452 |
|
Write offs |
15 170 |
2 268 |
27 905 |
— |
45 343 |
|
Foreign exchange rates differences |
12 793 |
3 104 |
-191 |
— |
15 706 |
|
Impairment — loss allowance as at 31 December 2020 |
-68 243 |
-35 550 |
— |
— |
- 103 793 |
|
Loans and advances at AC as at 31 December 2020 |
1 083 155 |
537 314 |
— |
— |
1 620 469 |
|
Nominal of loans at FVTPL as at 1 January 2020 |
1 080 |
36 858 |
— |
— |
37 938 |
|
Disbursements |
— |
29 063 |
30 000 |
— |
59 063 |
|
Repayments |
— |
-1 512 |
— |
— |
-1 512 |
|
Foreign exchange rates differences |
— |
-2 916 |
— |
— |
-2 916 |
|
Nominal of loans at FVTPL as at 31 December 2020 |
1 080 |
61 493 |
30 000 |
— |
92 573 |
|
Fair value adjustment as at 1 January 2020 |
-1 080 |
-15 156 |
— |
— |
-16 236 |
|
Net FV change |
— |
-11 330 |
-18 291 |
— |
-29 621 |
|
Foreign exchange rates differences |
— |
593 |
— |
— |
593 |
|
Fair value adjustment as at 31 December 2020 |
-1 080 |
-25 893 |
-18 291 |
— |
-45 264 |
|
Loans and advances at FVTPL as at 31 December 2020 |
— |
35 600 |
11 709 |
— |
47 309 |
|
Amortised Cost |
-3 578 |
-5 100 |
— |
— |
-8 678 |
|
Interest |
7 325 |
7 020 |
— |
— |
14 345 |
|
Loans and advances as at 31 December 2020 |
1 086 902 |
574 834 |
11 709 |
— |
1 673 445 |
7.2. Impairment on loans and advances — Loss allowances
|
(in EUR'000) |
|||||
|
|
2021 |
||||
|
Lifetime ECL |
|||||
|
12-month ECL |
Lifetime ECL not credit-impaired |
Lifetime ECL credit-impaired |
POCI |
Total |
|
|
Loans and advances at AC |
|
|
|
|
|
|
Balance as at 1 January 2021 |
16 389 |
43 976 |
43 428 |
— |
103 793 |
|
Transfer to 12-month ECL |
— |
— |
— |
— |
— |
|
Transfer to lifetime ECL not credit-impaired |
-5 008 |
-1 019 |
— |
— |
-6 027 |
|
Transfer to lifetime ECL credit-impaired |
— |
-77 |
249 |
— |
172 |
|
Net measurement of loss allowance |
-8 480 |
-8 912 |
-15 309 |
— |
-32 701 |
|
New financial assets originated or purchased |
504 |
1 039 |
— |
— |
1 543 |
|
Financial assets that have been derecognised |
-361 |
-3 405 |
-2 195 |
— |
-5 961 |
|
Foreign exchange rates differences |
521 |
1 666 |
2 908 |
— |
5 095 |
|
Balance as at 31 December 2021 |
3 565 |
33 268 |
29 081 |
— |
65 914 |
|
(in EUR'000) |
|||||
|
|
2020 |
||||
|
Lifetime ECL |
|||||
|
12-month ECL |
Lifetime ECL not credit-impaired |
Lifetime ECL credit-impaired |
POCI |
Total |
|
|
Loans and advances at AC |
|
|
|
|
|
|
Balance as at 1 January 2020 |
17 191 |
38 509 |
104 830 |
— |
160 530 |
|
Transfer to 12-month ECL |
96 |
-167 |
— |
— |
-71 |
|
Transfer to lifetime ECL not credit-impaired |
-770 |
3 439 |
-6 080 |
— |
-3 411 |
|
Transfer to lifetime ECL credit-impaired |
-127 |
-54 |
7 170 |
— |
6 989 |
|
Net measurement of loss allowance |
3 200 |
2 950 |
-6 554 |
— |
-404 |
|
New financial assets originated or purchased |
2 278 |
3 001 |
1 352 |
— |
6 631 |
|
Financial assets that have been derecognised |
-802 |
347 |
-4 967 |
— |
-5 422 |
|
Write offs |
— |
— |
-45 343 |
— |
-45 343 |
|
Foreign exchange rates differences |
-4 677 |
-4 049 |
-6 980 |
— |
-15 706 |
|
Balance as at 31 December 2020 |
16 389 |
43 976 |
43 428 |
— |
103 793 |
8. Shares and other variable yield securities
The following table show reconciliation from the opening to the closing balance of the Equity investments:
|
(in EUR'000) |
|||
|
|
Venture Capital Funds |
Direct Equity Investments |
Total |
|
Cost as at 1 January 2021 |
452 161 |
76 258 |
528 419 |
|
Disbursements |
84 224 |
— |
84 224 |
|
Repayments / sales |
-71 624 |
— |
-71 624 |
|
Foreign exchange rates differences |
28 400 |
1 220 |
29 620 |
|
Cost as at 31 December 2021 |
493 161 |
77 478 |
570 639 |
|
Unrealised gains and losses as at 1 January 2021 |
-15 019 |
13 410 |
-1 609 |
|
Net change in unrealised gains and losses |
101 418 |
16 084 |
117 502 |
|
Derecognition of fair value adjustment due to sales |
13 489 |
— |
13 489 |
|
Foreign exchange rates differences |
-2 479 |
89 |
-2 390 |
|
Unrealised gains and losses as at 31 December 2021 |
97 409 |
29 583 |
126 992 |
|
Shares and other variable yield securities as at 31 December 2021 |
590 570 |
107 061 |
697 631 |
|
(in EUR'000) |
|||
|
|
Venture Capital Funds |
Direct Equity Investments |
Total |
|
Cost as at 1 January 2020 |
462 304 |
101 424 |
563 728 |
|
Disbursements |
85 305 |
— |
85 305 |
|
Repayments / sales |
-66 011 |
-18 274 |
-84 285 |
|
Foreign exchange rates differences |
-29 437 |
-6 892 |
-36 329 |
|
Cost as at 31 December 2020 |
452 161 |
76 258 |
528 419 |
|
Unrealised gains and losses as at 1 January 2020 |
42 390 |
13 810 |
56 200 |
|
Net change in unrealised gains and losses |
-45 079 |
-2 830 |
-47 909 |
|
Derecognition of fair value adjustment due to sales |
-15 632 |
3 019 |
-12 613 |
|
Foreign exchange rates differences |
3 302 |
-589 |
2 713 |
|
Unrealised gains and losses as at 31 December 2020 |
-15 019 |
13 410 |
-1 609 |
|
Shares and other variable yield securities as at 31 December 2020 |
437 142 |
89 668 |
526 810 |
9. Amounts receivable from contributors
The amounts of EUR 85,2 million (2020: EUR 68,9 million) receivable from contributors are entirely composed of Member States’ contributions called but not paid.
10. Treasury financial assets
The treasury portfolio is composed of quoted bonds which have a remaining maturity of less than three months at reporting date. The following table shows the movements of the treasury portfolio:
|
(in EUR'000) |
|
|
Balance as at 1 January 2021 |
351 873 |
|
Acquisitions |
2 333 691 |
|
Maturities |
-2 684 293 |
|
Change in amortisation of premium/discount |
301 |
|
Change in accrued interest |
-1 572 |
|
Balance as at 31 December 2021 |
— |
|
(in EUR'000) |
|
|
Balance as at 1 January 2020 |
330 587 |
|
Acquisitions |
2 710 009 |
|
Maturities |
-2 689 790 |
|
Change in amortisation of premium/discount |
-208 |
|
Change in accrued interest |
1 275 |
|
Balance as at 31 December 2020 |
351 873 |
11. Other assets
The main components of other assets are as follows:
|
(in EUR'000) |
||
|
|
31.12.2021 |
31.12.2020 |
|
Amount receivable from the EIB |
877 |
— |
|
Financial guarantees |
209 |
109 |
|
Total other assets |
1 086 |
109 |
12. Deferred income
The main components of deferred income are as follows:
|
(in EUR'000) |
||
|
|
31.12.2021 |
31.12.2020 |
|
Deferred interest subsidies |
47 981 |
28 788 |
|
Deferred commissions on loans and advances |
451 |
944 |
|
Total deferred income |
48 432 |
29 732 |
13. Provisions for guarantees issued, net of reversals
The following tables show the reconciliation from the opening to the closing balance of the provision for financial guarantees.
|
(in EUR'000) |
||||
|
|
2021 |
|||
|
12-month ECL |
Lifetime ECL not credit-impaired |
Lifetime ECL credit-impaired |
Total |
|
|
Guarantees issued |
|
|
|
|
|
Balance as at 1 January |
851 |
— |
— |
851 |
|
Net measurement of loss allowance |
-851 |
— |
— |
-851 |
|
Balance as at 31 December |
— |
— |
— |
— |
|
(in EUR'000) |
||||
|
|
2020 |
|||
|
12-month ECL |
Lifetime ECL not credit-impaired |
Lifetime ECL credit-impaired |
Total |
|
|
Guarantees issued |
|
|
|
|
|
Balance as at 1 January |
628 |
— |
— |
628 |
|
Net measurement of loss allowance |
228 |
— |
— |
228 |
|
Foreign exchange rates differences |
-5 |
— |
— |
-5 |
|
Balance as at 31 December |
851 |
— |
— |
851 |
14. Provisions for loan commitments
The following tables show the reconciliation from the opening to the closing balance of the loss allowance for undisbursed loans (loan commitments):
|
(in EUR'000) |
||||
|
|
2021 |
|||
|
12-month ECL |
Lifetime ECL not credit-impaired |
Lifetime ECL credit-impaired |
Total |
|
|
Loan commitments |
|
|
|
|
|
Balance as at 1 January |
6 817 |
26 335 |
— |
33 152 |
|
Net measurement of loss allowance |
-4 089 |
-7 013 |
— |
-11 102 |
|
New financial assets originated or purchased |
869 |
3 015 |
— |
3 884 |
|
Financial assets that have been derecognised |
-1 942 |
-7 456 |
— |
-9 398 |
|
Foreign exchange rates differences |
38 |
28 |
— |
66 |
|
Balance as at 31 December |
1 693 |
14 909 |
— |
16 602 |
|
(in EUR'000) |
||||
|
|
2020 |
|||
|
12-month ECL |
Lifetime ECL not credit-impaired |
Lifetime ECL credit-impaired |
Total |
|
|
Loan commitments |
|
|
|
|
|
Balance as at 1 January |
3 943 |
33 326 |
— |
37 269 |
|
Transfer to 12-month ECL |
181 |
— |
— |
181 |
|
Net measurement of loss allowance |
388 |
-5 932 |
— |
-5 544 |
|
New financial assets originated or purchased |
3 885 |
2 773 |
— |
6 658 |
|
Financial assets that have been derecognised |
-1 157 |
-3 853 |
— |
-5 010 |
|
Foreign exchange rates differences |
-423 |
21 |
— |
-402 |
|
Balance as at 31 December |
6 817 |
26 335 |
— |
33 152 |
15. Amounts owed to third parties
The main components of amounts owed to third parties are as follows:
|
(in EUR'000) |
||
|
|
31.12.2021 |
31.12.2020 |
|
Net general administrative expenses payable to the EIB |
53 136 |
58 527 |
|
Other amounts payable to the EIB |
40 045 |
56 |
|
Interest subsidies and TA not yet disbursed owed to Member States |
146 458 |
93 795 |
|
Total amounts owed to third parties |
239 639 |
152 378 |
16. Other liabilities
The main components of other liabilities are as follows:
|
(in EUR'000) |
||
|
|
31.12.2021 |
31.12.2020 |
|
Loan repayments received in advance |
1 793 |
3 166 |
|
Deferred income from interest subsidies |
540 |
280 |
|
Total other liabilities |
2 333 |
3 446 |
17. Member States’ contribution called (in EUR’000)
|
Member States |
Contribution to the Facility |
Contribution to interest subsidies and technical assistance |
Total contributed |
Called and not paid (*19) |
|
Austria |
88 683 |
11 770 |
100 453 |
2 398 |
|
Belgium |
130 046 |
17 069 |
147 115 |
3 249 |
|
Bulgaria |
2 113 |
596 |
2 709 |
219 |
|
Croatia |
563 |
180 |
743 |
225 |
|
Cyprus |
1 287 |
359 |
1 646 |
— |
|
Czechia |
7 704 |
2 170 |
9 874 |
797 |
|
Denmark |
72 328 |
9 702 |
82 030 |
1 980 |
|
Estonia |
776 |
219 |
995 |
86 |
|
Finland |
51 342 |
7 083 |
58 425 |
1 509 |
|
France |
774 222 |
96 940 |
871 162 |
17 814 |
|
Germany |
772 017 |
101 078 |
873 095 |
20 580 |
|
Greece |
46 503 |
6 854 |
53 357 |
1 507 |
|
Hungary |
7 694 |
2 144 |
9 838 |
615 |
|
Ireland |
25 571 |
4 097 |
29 668 |
940 |
|
Italy |
438 908 |
61 020 |
499 928 |
12 530 |
|
Latvia |
1 074 |
303 |
1 377 |
116 |
|
Lithuania |
1 796 |
505 |
2 301 |
181 |
|
Luxembourg |
9 757 |
1 301 |
11 058 |
255 |
|
Malta |
431 |
120 |
551 |
38 |
|
Netherlands |
175 971 |
23 537 |
199 508 |
4 777 |
|
Poland |
19 573 |
5 511 |
25 084 |
2 007 |
|
Portugal |
36 258 |
5 368 |
41 626 |
1 197 |
|
Romania |
5 938 |
1 686 |
7 624 |
718 |
|
Slovakia |
3 291 |
932 |
4 223 |
376 |
|
Slovenia |
2 576 |
721 |
3 297 |
225 |
|
Spain |
230 483 |
35 684 |
266 167 |
7 932 |
|
Sweden |
95 412 |
13 274 |
108 686 |
2 939 |
|
United Kingdom |
469 378 |
68 773 |
538 151 |
— |
|
Total as at 31 December 2021 |
3 471 695 |
478 996 |
3 950 691 |
85 210 |
|
Total as at 31 December 2020 |
3 221 695 |
398 996 |
3 620 692 |
68 908 |
18. Commitments and contingent liabilities
|
(in EUR'000) |
||
|
|
31.12.2021 |
31.12.2020 |
|
Commitments |
|
|
|
Undisbursed loans |
1 677 411 |
1 722 618 |
|
Undisbursed commitment in respect of shares and other variable yield securities |
473 000 |
378 347 |
|
Issued guarantees |
1 499 675 |
998 560 |
|
Interest subsidies and technical assistance |
478 011 |
483 897 |
|
Contingent liabilities |
|
|
|
Signed non-issued guarantees |
256 299 |
554 686 |
|
Total commitments and contingent liabilities |
4 384 396 |
4 138 108 |
19. Interest and similar income and expenses
The main components of interest and similar income are as follows:
|
(in EUR'000) |
||
|
|
From 1.1.2021 |
From 1.1.2020 |
|
|
to 31.12.2021 |
to 31.12.2020 |
|
Loans and advances |
80 395 |
80 252 |
|
Interest subsidies |
6 061 |
4 531 |
|
Total interest and similar income |
86 456 |
84 783 |
The main components of interest and similar expenses are as follows:
|
(in EUR'000) |
||
|
|
From 1.1.2021 |
From 1.1.2020 |
|
|
to 31.12.2021 |
to 31.12.2020 |
|
Derivative financial instruments |
-4 800 |
-541 |
|
Cash and cash equivalents |
-3 598 |
-2 961 |
|
Treasury financial assets |
-2 038 |
-1 748 |
|
Total interest and similar expenses |
-10,436 |
-5,250 |
20. Fee and commission income and expenses
The main components of fee and commission income are as follows:
|
(in EUR'000) |
||
|
|
From 1.1.2021 |
From 1.1.2020 |
|
|
to 31.12.2021 |
to 31.12.2020 |
|
Fee and commission on loans and advances |
1 702 |
141 |
|
Fee and commission on financial guarantees |
517 |
211 |
|
Other |
— |
1 |
|
Total fee and commission income |
2 219 |
353 |
The main component of fee and commission expenses is as follows:
|
(in EUR'000) |
||
|
|
From 1.1.2021 |
From 1.1.2020 |
|
|
to 31.12.2021 |
to 31.12.2020 |
|
Commission paid to third parties with regard to shares and other variable yield securities |
-175 |
-225 |
|
Total fee and commission expenses |
-175 |
-225 |
21. Net result on shares and other variable yield securities
The main components of the net result on shares and other variable yield securities are as follows:
|
(in EUR'000) |
||
|
|
From 1.1.2021 |
From 1.1.2020 |
|
|
to 31.12.2021 |
to 31.12.2020 |
|
Net proceeds |
4 310 |
-3 069 |
|
Dividend income |
1 815 |
4 261 |
|
Net fair value change |
117 502 |
-47 909 |
|
Net result on shares and other variable yield securities |
123 627 |
-46 717 |
22. General administrative expenses
General administrative expenses represent the actual costs incurred by the EIB for managing the Facility less income generated from standard appraisal fees directly charged by the EIB to clients of the Facility.
The main components of general administrative expenses are as follows:
|
(in EUR'000) |
||
|
|
From 1.1.2021 |
From 1.1.2020 |
|
|
to 31.12.2021 |
to 31.12.2020 |
|
Actual cost incurred by the EIB |
-55 924 |
-61 470 |
|
Income from appraisal fees directly charged to clients of the Facility |
2 788 |
2 943 |
|
Total general administrative expenses |
-53 136 |
-58 527 |
23. Involvement with unconsolidated structured entities (in EUR’000)
Definition of a structured entity
A structured entity is one that has been designed so that voting or similar rights are not the dominant factor in deciding, who controls the-entity. IFRS 12 observes that a structured entity often has some or all of the following features:
|
— |
Restricted activities, |
|
— |
A narrow and well-defined objective, such as to effect a tax-efficient lease, carry out research and development activities, provide a source of capital or funding to an entity or provide investment opportunities for investors by passing on risks and rewards associated with the assets of the structured entity to investors, |
|
— |
Insufficient equity to permit the structured entity to finance its activities without subordinated financial support, |
|
— |
Financing in the form of multiple contractually linked instruments to investors that create concentrations of credit or other risks (tranches). |
Unconsolidated structured entities
The term ‘unconsolidated structured entities’ refers to all structured entities that are not controlled by the Facility and includes interests in structured entities that are not consolidated.
Definition of interests in structured entities:
IFRS 12 defines ‘interests’ broadly to include any contractual or non-contractual involvement that exposes the reporting entity to variability in returns from the performance of the entity. Examples of such interests include the holding of equity interests and other forms of involvement such as the provision of funding, liquidity support, credit enhancements, commitments and guarantees to the other entity. IFRS 12 states that a reporting entity does not necessarily have an interest in another entity solely because of a typical customer-supplier relationship.
The table below describes the types of structured entities that the Facility does not consolidate but in which it holds an interest.
|
Type of structured entity |
Nature and purpose |
Interest held by the Facility |
|
Project Finance — lending to Special Purposes Vehicles (‘SPV’) |
Project Finance Transactions (PF Operations) are transactions where the Facility relies for the servicing of its debt on a borrower whose sole or main source of revenue is generated by a single or limited number of assets being financed by such debt or other pre-existing assets contractually linked to the project. PF operations are often financed through SPV. |
Net disbursed amounts; Interest income. |
|
Venture capital operations |
The Facility finances venture capital and investment funds. Venture capital and investment funds pool and manage money from investors seeking private equity stakes in small and medium-size enterprises with strong growth potential as well as financing infrastructure projects. |
Investments in units/shares issued by the venture capital entity; Dividends received as dividend income. |
The table below shows the carrying amounts of unconsolidated structured entities in which the Facility has an interest at the reporting date, as well as the Facility's maximum exposure to loss in relation to those entities. The maximum exposure to loss includes the carrying amounts and the related undisbursed commitments.
|
Type of structured entity |
Caption |
Carrying amount at 31.12.2021 |
Carrying amount at 31.12.2020 |
Maximum exposure to loss at 31.12.2021 |
Maximum exposure to loss at 31.12.2020 |
|
Venture capital funds |
Shares and other variable yield securities |
590 570 |
437 142 |
590 570 |
437 142 |
|
Total |
|
590 570 |
437 142 |
590 570 |
437 142 |
No support is provided to structured entities by the Facility beyond the respective financing.
24. Impact financing envelope (in EUR’000)
In June 2013 the ACP-EU Joint Ministerial Council approved the new financial protocol for the 11th European Development Fund (EDF), covering the period 2014–2020.
A new EUR 500 million endowment was agreed for the Investment Facility, the so called ‘impact financing envelope’ or ‘IFE’, enabling the Facility to support projects that promise a particularly high development impact whilst bearing the greater risks inherent in such investments. This envelope presents new possibilities for enhancing the Facility’s private sector lending through investments in the following instruments:
Social impact equity funds — promoted by an emerging population of private equity fund managers who put the alleviation of social or environmental issues at the core of their funds' investment strategy but still target sustainability at the levels of both the fund and its investee companies.
Loans to financial intermediaries — (e.g. microfinance institutions, local banks and credit unions) operating in ACP countries in which the EIB cannot consider financing — in particular in local currency — under the existing credit risk guidelines, e.g. due to either high country risks, currency volatility or lack of pricing benchmarks. The main objective of such loans is to fund projects with a high developmental impact, especially in the field of support to micro and small enterprises (MSEs) and agriculture, which generally do not qualify for IF financing.
Risk sharing facilitating instruments — which take the form of first loss guarantees (‘first loss pieces’) that facilitate risk sharing operations of the EIB with local financial intermediaries (mainly commercial banks) for the benefit of underserved SMEs and small projects that meet the Impact Financing Criteria in situations where a market gap has been identified in relation to the access of SMEs/small projects to finance. The first loss pieces would be structured as a counter-guarantee in favour of senior guarantee tranches funded by the EIB — under the Investment Facility — and by other International Financial Institutions/Development Financial Institutions, thus generating a substantial leverage effect.
Direct financing — through debt (i.e. loans) or equity instruments in projects with sound and experienced promoters and high developmental impacts, but that will, however, also entail higher expectations of losses and difficulties to recover the investment (equity type risk with higher than usual expectation of losses). The EIB applies strict selection and eligibility criteria for this instrument, as these projects, notwithstanding their high developmental impact, would not be able to meet acceptable financing criteria (i.e. low expectation of recovering the investment or offsetting the losses through interest rates /equity returns).
The IFE also allows diversification into new sectors, such as health and education, agriculture and food security, and the development of new and innovative risk-sharing instruments. In 2016, the IFE financing capacity was increased to EUR 800 million by making the IFE partially revolving.
From a financial and accounting perspective the IFE forms part of the IF portfolio and is accounted for in the overall IF annual financial statements.
The following table represents the carrying amounts and the committed, but undisbursed amounts, per type of asset:
|
Type of IFE investment |
Caption |
Measurement |
Gross carrying amount as at 31.12.2021 |
Loss allowance / FV adj. amount as at 31.12.2021 |
Carrying amount as at 31.12.2021 |
Undisbursed amount as at 31.12.2021 |
OFF BS ECL adj. amount as at 31.12.2021 |
|
Loans to financial intermediaries |
Loans and advances |
AC |
68 228 |
-1 981 |
66 247 |
29 272 |
-242 |
|
Direct loan operations |
Loans and advances |
FVTPL |
101 840 |
-41 403 |
60 437 |
92 031 |
— |
|
Social impact equity funds |
Shares and other variable yield securities |
FVTPL |
61 611 |
9 866 |
71 477 |
106 675 |
— |
|
Direct equity participations |
Shares and other variable yield securities |
FVTPL |
58 523 |
23 608 |
82 131 |
14 |
— |
|
Risk sharing facilitating instruments |
Issued guarantees |
higher of approach (*20) |
— |
— |
— |
44 146 |
— |
|
Total |
|
|
290 202 |
-9 910 |
280 292 |
272 138 |
-242 |
|
Type of IFE investment |
Caption |
Measurement |
Gross carrying amount as at 31.12.2020 |
Loss allowance/FV adj. amount as at 31.12.2020 |
Carrying amount as at 31.12.2020 |
Undisbursed amount as at 31.12.2020 |
OFF BS ECL adj. amount as at 31.12.2020 |
|
Loans to financial intermediaries |
Loans and advances |
AC |
49 522 |
-1 839 |
47 683 |
26 954 |
-199 |
|
Direct loan operations |
Loans and advances |
FVTPL |
91 186 |
-44 681 |
46 505 |
98 314 |
— |
|
Social impact equity funds |
Shares and other variable yield securities |
FVTPL |
41 885 |
-4 778 |
37 107 |
73 362 |
— |
|
Direct equity participations |
Shares and other variable yield securities |
FVTPL |
57 395 |
9 195 |
66 590 |
14 |
— |
|
Risk sharing facilitating instruments |
Issued guarantees |
higher of approach (*21) |
— |
— |
— |
40 746 |
— |
|
Total |
|
|
239 988 |
-42 103 |
197 885 |
239 390 |
-199 |
The EIB is applying the General Mandate Risk Principles to IFE direct loan operations (excluding loans to financial intermediaries), as envisaged in the EIB’s Credit and Equity Risk Guidelines, and to monitor and report the risk associated with the IFE direct loan operations on the basis of their fair value. According to the methodology, the Bank performs a Qualitative Risk Assessment (QRA) aiming to assess the soundness of the investment rationale and plausible business viability of such operations.
25. Subsequent events
In the context of the COVID-19 pandemic, the IF continues to monitor the situation closely notably as part of the subsequent event review. It is considered that there have been no material events after the balance sheet date that would require adjustment of, or disclosure in, the financial statements as at 31 December 2021.
(2) Council Regulation (EU) 2018/1877 of 26 November 2018 on the financial regulation applicable to the 11th European Development Fund, and repealing Regulation (EU) 2015/323 (OJ L 307, 3.12.2018, p. 1).
(3) OJ L 347, 20.12.2013, p. 884.
(4) It should be noted that due to the rounding of figures into millions of euros, some financial data in the tables below may appear not to add up.
(*1) The 2020 figure relates to the (increase)/decrease in available for sale financial assets.
(5) It should be noted that due to the rounding of figures into millions of euros, some financial data in the tables may appear not to add up.
(6) In accordance with Article 53 of the Financial Regulation applicable to the 11th European Development Fund, the treasury is presented in the balance sheet of the 11th EDF. The nature of the various bank accounts is outlined in Chapter 5, Financial Risk Management.
(7) Council Decision (EU) 2021/1941 of 9 November 2021 on the financial contributions to be paid by the parties to the European Development Fund to finance that Fund, including the ceiling for 2023, the annual amount for 2022, the amount of the first instalment for 2022 and an indicative and non-binding forecast for the expected annual amounts of contributions for the years 2024 and 2025 (OJ L 396, 10.11.2021, p. 61).
(*2) As of 2021, reclassification of financial assets (in the scope of updated EAR11).
(*3) As of 2021, receivables exclude deferred charges and accrued income (no currency risk) and recoverables are not displayed (not in the scope of updated EAR11).
(*4) As of 2021, payables are no longer disclosed as they are not exposing the EDF to significant currency risk (as vast majority is in EUR).
(8) Council Regulation (EU) 2016/888 of 6 June 2016 amending Regulation (EU) 2015/323 on the financial regulation applicable to the 11th European Development Fund as regards payment of the instalments (OJ L 149, 7.6.2016, p. 1).
(*5) Excluding deferred charges
(9) It should be noted that due to the rounding of figures into thousands of euros (kEUR), some financial data in the tables may appear not to add up.
(10) Regulation (EU, Euratom) 2018/1046 of the European Parliament and of the Council of 18 July 2018 on the financial rules applicable to the general budget of the Union amending Regulations (EU) No 1296/2013, (EU) No 1301/2013, (EU) No 1303/2013, (EU) No 1304/2013, (EU) No 1309/2013, (EU) No 1316/2013, (EU) No 223/2014, (EU) No 283/2014, and Decision No 541/2014/EU and repealing Regulation (EU, Euratom) No 966/2012 (OJ L 193, 30.7.2018, p. 1).
(11) Council Regulation (EU) 2018/1877.
(12) It should be noted that due to the rounding of figures into thousands of euros (kEUR), some financial data in the tables may appear not to add up.
(13) Regulation (EU, Euratom) 2018/1046 of the European Parliament and of the Council.
(14) Council Regulation (EU) 2018/1877.
(15) It should be noted that due to the rounding of figures into millions of euros, some financial data in the tables may appear not to add up.
(*6) Due to a clerical error, the 2020 EDF Consolidated Financial Statements included a negative amount of EUR 2 million of Trust Funds contributions that was erroneously reported on the balance sheet. In the 2021 EDF Consolidated Financial Statements this reporting error has been corrected and the 2020 balances shown in these statements are aligned with the trial balance.
(*7) The 2020 figure relates to the (increase)/decrease in available for sale financial assets.
(*8) In 2020, the contributions and refund to Member States were reported on a separate line. In order to align the presentation with the EDF changes in net assets table these two lines have been merged.
(16) Council Regulation (EU) 2018/1877.
(17) Except for operations in South Sudan.
(18) OJ L 142, 28.5.2011, p. 61.
(19) OJ L 314, 30.11.2001, p. 1.
(20) OJ L 109, 26.4.2007, p. 33.
(21) Gross amounts (i.e. excluding decommitments and recovery orders). Amounts in columns committed, contracted, paid are colour weighted.
(*9) For the year ended 31 December 2021, Interest and similar income includes EUR 77,5 million (2020: EUR 77,9 million) calculated on assets held at amortised cost based on the effective interest method.
(22) OJ L 420, 14.12.2020, p. 32.
(23) Regulation (EU) 2021/947 of the European Parliament and of the Council of 9 June 2021 establishing the Neighbourhood, Development and International Cooperation Instrument — Global Europe, amending and repealing Decision No 466/2014/EU of the European Parliament and of the Council and repealing Regulation (EU) 2017/1601 of the European Parliament and of the Council and Council Regulation (EC, Euratom) No 480/2009 (OJ L 209, 14.6.2021, p. 1).
(24) Council Decision 2020/2233 of 23 December 2020 concerning the commitment of the funds stemming from reflows under the ACP Investment Facility from operations under the 9th, 10th and 11th European Development Funds (OJ L 437, 28.12.2020, p. 188).
(1) Cash flows referenced to USD LIBOR are defined using the LIBOR benchmarks when the USD LIBOR settings are not yet terminated.
(*10) Loan operations measured at FVTPL.
(*11) Loan operations measured at FVTPL.
(*12) Agency agreements for which there are no underlying counterparts at reporting date.
(*13) Agency agreements for which there are no underlying counterparts at reporting date.
(*14) The amounts owed to third parties are including the interest subsidies and TA not yet disbursed owed to Member States, where the maturity is mainly undefined.
(*15) See section 3.4.2.2.2 for explanations on synthetic hedge.
(*16) See Section 3.4.2.2.2 for explanations on synthetic hedge.
(*17) Including agency agreements
(*18) Including agency agreements.
(*19) On 9 November 2021, the Council fixed the amount of financial contributions to be paid by each Member State by 21 January 2022. As at 31 December 2021, EUR 85,2 million were not paid in.
(*20) For details, please refer to section subsequent measurement of Note 2.4.3.
(*21) For details, please refer to section subsequent measurement of Note 2.4.3.