EUROPEAN COMMISSION
Brussels, 26.2.2020
SWD(2020) 526 final
COMMISSION STAFF WORKING DOCUMENT
Country Report Sweden 2020
Accompanying the document
COMMUNICATION FROM THE COMMISSION TO THE EUROPEAN PARLIAMENT, THE EUROPEAN COUNCIL, THE COUNCIL, THE EUROPEAN CENTRAL BANK AND THE EUROGROUP
2020 European Semester: Assessment of progress on structural reforms, prevention and correction of macroeconomic imbalances, and results of in-depth reviews under Regulation (EU) No 1176/2011
{COM(2020) 150}
Contents
Executive summary
1.Economic situation and outlook
2.Progress with country-specific recommendations
3.Summary of the main findings from the MIP in-depth review
4.Reform priorities
4.1.Public finances and taxation
4.2.Financial sector
4.3.Labour market, education and social policies
4.4. Competitiveness, reforms and investment
4.5.Environmental sustainability
Annex A: Overview table
Annex B: Commission debt sustainability analysis and fiscal risks
Annex C: Standard tables
Annex D: Investment guidance on Just Transition Fund 2021-2027 for Sweden
Annex E: Progress towards the Sustainable Development Goals (SDGs)
References
LIST OF Tables
Table 1.1:Key economic and financial indicators - Sweden
Table 2.1:Summary table on CSR assessments (*)
Table 3.1:MIP assessment matrix (*) - Sweden 2019
Table 4.2.1:Financial soundness indicators (1)
Table 4.4.1:Contributions to productivity growth in the business sector
Table C.1:Financial market indicators
Table C.2:Headline Social Scoreboard indicators
Table C.3:Labour market and education indicators
Table C.4:Social inclusion and health indicators
Table C.5:Product market performance and policy indicators
Table C.6:Green growth
LIST OF Graphs
Graph 1.1:
Output gap, real GDP growth and its components (1) (2)
Graph 1.2:
Contributions to potential growth (1)
Graph 1.3:
Share of employees working in elementary occupation, 2nd quarter of 2019
Graph 1.4:
Breakdown of rate of change of unit labour costs (ULC)
Graph 1.5:
Labour productivity and wage growth, 2011-2017
Graph 1.6:
Breakdown of Net International Investment Position by sectors
Graph 2.1:
Overall multiannual implementation of 2011 - 2019 country-specific recommendations to date (1) (2) (3)
Graph 4.1.1:
Swedish fiscal rules index and government gross debt
Graph 4.2.1:
Common Equity Tier 1 capital ratios (%)
Graph 4.2.2:
House prices by market segment (nominal)
Graph 4.2.3:
Estimated house price valuation gaps based on different indicators (1) (2) (3)
Graph 4.2.4:
New housing construction and estimated need
Graph 4.2.5:
Household dwellings by type
Graph 4.2.6:
Types of tenure and vacancy rates
Graph 4.2.7:
Household debt evolution (indexed, 2005 = 100)
Graph 4.2.8:
Maturity of mortgages and interest rates
Graph 4.2.9:
Household saving ratio, adjusted for net pension contributions and capital formation
Graph 4.2.10:
Leverage, Non-Financial Corporations
Graph 4.3.1:
Employment rate by educational attainment
Graph 4.3.2:
Employment rate by citizenship
Graph 4.3.3:
At-risk-of-poverty or social exclusion rate and its components (AROP, SMD, LWI)
Graph 4.4.1:
Labour productivity in the business sector in SEK per hour worked
Graph 4.4.2:
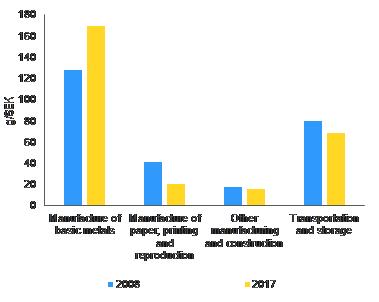
Labour productivity and hours worked by sector 2001-2018 - changes between 2001 and 2018 (1)
Graph 4.4.3:
Investment as share of GDP by institutional sector - EU 28 and Sweden
Graph 4.4.4:
Investment in intangible capital assets
Graph 4.4.5:
Business birth rates
Graph 4.5.1:
The ten EU countries with the lowest greenhouse gas emissions in 2017
Graph 4.5.2:
Greenhouse gas emissions, carbon taxes and economic growth
Graph 4.5.3:
Share of renewable sources in final energy consumption, 2017
Graph 4.5.4:
Final energy consumption (Mtoe(1))
Graph 4.5.5:
Carbon dioxide emissions/gross value added (g/SEK)
LIST OF Boxes
Box 2.1: EU funds and programmes to address structural challenges and to foster growth and competitiveness in Sweden
Box 4.3.2: Monitoring performance in light of the European Pillar of Social Rights
Box 4.4.3: The dynamics of labour productivity
Box 4.4.4: Investment challenges and reforms in Sweden
Box 4.5.5: Fossil free Sweden initiative
Executive summary
Sweden’s economy has performed well in recent years, but its subdued medium-term growth prospects call for further structural reforms. A persistent housing shortage is the result of demographic developments, insufficient new housing construction and inefficient use of the existing housing stock. Reforming the rental market and supporting construction, in particular in urban areas, could help address this shortage and support mobility and flexibility in the labour market. Tax incentives favouring property ownership and mortgage debt are contributing to high household debt and elevated house prices. In the labour market, the integration of non-EU migrants remains a major challenge, while shortages have emerged for high-skilled workers and productivity growth has recently stalled. Reviving reform momentum, e.g. by advancing the announced comprehensive tax reform, would address these issues and make the Swedish economy more resilient, while reducing risks from imbalances ().
Economic growth remains positive, but is expected to slow. According to the Commission’s autumn 2019 forecast, real GDP grew by 2.2% in 2018 and is set to have slowed to 1.2% in 2019. With domestic demand and investment in particular weakening and a slowing global economy, economic activity is forecast to remain subdued. Real GDP growth is expected to stay just above 1% over the forecast period. In the long run, potential growth should remain below pre-crisis levels as productivity growth is set to be low.
Sweden has had high growth, while lowering greenhouse gas emissions. In 1990-2017, Sweden’s greenhouse gas emissions fell by 26%, while it’s GDP per capita increased by 54%. This is partially due to a significant price on carbon dioxide emissions introduced in the early 1990s.
Exports are still holding up well, but are expected to lose momentum. Growth in exports, particularly of services, was strong in 2019. A slowing in import growth due to weak domestic demand pushed up the current account surplus. Exports of goods and services are likely to expand more modestly by around 2% in 2020-2021, against the backdrop of trade tensions and as growth in Sweden’s main trading partners eases. The current account surplus is forecast to increase to above 4% of GDP.
The labour market has started to weaken, albeit from high employment levels. Sweden has one of the highest employment rates in the EU (82.4% in 2018), but the Commission’s autumn 2019 forecast expects unemployment to increase from 6.3% in 2018 to 7.2% in 2021. However, labour shortages and skills mismatches, where the jobs available do not match the skills of the jobless, will remain, in particular for high-skilled jobs. Low-skilled people, especially non-EU migrants, face particular difficulties finding a job given the current economic headwinds. Long-term unemployment is set to rise, therefore, albeit from low levels.
Monetary policy is normalising, despite limited inflationary pressures, and the fiscal position is strong. Monetary policy has remained accommodative for years due to low inflation. Despite inflation remaining below the Riksbank target of 2%, the central bank further lifted the policy rate at the end of December 2019 to 0%. The general government balance, while remaining in surplus, is expected to decline from 0.8% of GDP in 2018 to 0.1% of GDP in 2021. Public debt is expected to continue falling to 32% of GDP by 2021 due to prudent fiscal management.
Overall investment levels are high. Residential and equipment investment are declining due to the slowing economy. Investments in R&D, sustainable transportation and education and skills have been maintained tackling the continued investment needs in these areas.
Sweden has made some () progress in addressing the 2019 country-specific recommendations.
There has been substantial progress in the following area:
·Sweden maintained investment in sustainable transport (see Section 4.4).
There has been some progress in the following areas:
·With its 2020 budget, Sweden focused investment-related economic policy on education and skills, and research and innovation (see Sections 4.1 and 4.4).
·Sweden adopted new legislative measures to strengthen the anti-money laundering framework. In addition, the country has started to address shortcoming in effective enforcement (see Section 4.2).
There has been limited progress in the following area:
Stimulating housing construction, most notably through an investment subsidy for construction (see Section 4.2).
There has been no progress in the following areas:
·No progress has been made on reforming the favourable tax treatment of mortgage debt and home ownership, flexibility in the rental market and revising the design of the capital gains tax (see Section 4.2).
Sweden performs very well on the Social Scoreboard supporting the European Pillar of Social Rights. The employment rate is among the highest and the gender employment gap is among the lowest in the EU. The level of digital skills among the population is very high. The good overall results reflect Sweden's advanced welfare model with a strong dialogue between unions and employers. However, the increasing share of early leavers from education and training is a source of concern and income inequality is rising, albeit from a relatively low level.
On progress towards its national targets under the Europe 2020 strategy, Sweden has reached its targets for the employment rate, greenhouse gas emissions, share of renewable energy, post-secondary education attainment and poverty risks. Areas where the targets have not yet been achieved are early school leaving, energy efficiency and R&D.
Sweden is among the best performing Member States on ‘Good health and well-being’ (SDG3), while its performance has deteriorated recently on ‘Reduced inequalities’ (SDG10), albeit from high levels ().
The main findings of the in-depth review contained in this report and the related policy challenges are as follows:
·The banking sector is resilient but could be vulnerable to sudden changes in economic and financing conditions. The profitability of banks has been among the highest in the EU due to low non-performing loan ratios, high cost efficiency and low funding costs. However, banks rely on wholesale funding, exposing them to risks of liquidity shortages and changes in interest rate conditions. In addition, they have a large exposure to mortgages and commercial real estate. In the event of an abrupt reversal of the high valuation of house prices, in combination with a general worsening of economic and financing conditions, these structural features could have negative consequences for the Swedish economy and the Nordic region, where Swedish banks are active.
·Household debt as a share of GDP has stabilised at high levels. Household debt grew by 6.1 % in 2018, reaching about 88% of GDP and 176% of disposable income, which is among the highest in the EU. This was driven mainly by higher mortgage borrowing linked to high house prices, coupled with structural distortions favouring mortgage-financed property purchases. Sweden has implemented several macro-prudential measures in recent years, including a strengthened repayment rule for high debt-to-income mortgages in force since March 2018 and increased the countercyclical capital buffer for banks from September 2019. However, the policy steps taken so far appear to have had a limited overall impact on the growth of mortgage lending.
·While house prices declined in late 2017, they have started to rise again and valuations remain stretched. Key issues include tax incentives favouring home ownership and mortgage debt, and accommodative credit conditions coupled with still relatively low mortgage repayment rates. New construction does not meet housing needs, particularly of affordable homes around major cities, where demand is growing. This shortage is linked to structural inefficiencies, such as a limited level of competition in the construction sector. The housing stock is not being used efficiently. In the rental market, below-market rents create lock-in and ‘insider/outsider’ effects while the vacancy rate has fallen to virtually zero. In the owner-occupancy market, capital gains taxes reduce homeowner mobility. The housing shortage makes it harder for people to move location for a new job, thus contributing to labour shortages, and can add to intergenerational inequality.
·The high level of household debt and banks’ exposure to real estate are a risk to macroeconomic stability. Despite gradual policy action, mortgage debt continues to grow. With the housing market still appearing somewhat overvalued, high levels of indebtedness create a risk of a disorderly correction. This could have an adverse impact on the economy and potentially also for the banking sector.
Other key structural issues analysed in this country report, which point to particular challenges facing the Swedish economy, are the following:
·Allegations of suspected money laundering remain a source of concern and have affected the reputation of Swedish banks. However, new legislation is in force and measures have been taken to improve coordination of the enforcement measures of the anti-money laundering regime and increased resources have been allocated to authorities to strengthen anti-money laundering work. These measures have yet to be assessed and yield results.
·Despite years of economic growth, some population groups have difficulties finding a job. Sweden is a top performer in the EU for high employment and low long-term unemployment rates. Challenges remain, however, for the integration of low-skilled people and non-EU migrants, especially women, into the labour market. This challenge is likely to remain in the coming years aggravated by the number and composition of asylum seekers who arrived in late 2015. Efforts have been made to improve their employability, but the slowing economy might further add to this challenge.
·While educational performance has improved overall, the educational attainment gap between different social groups is large and widening. Despite positive results in the OECD’s Programme for International Skills Assessment (PISA), the performance gap between pupils born in Sweden and those with a migrant background has markedly increased, especially challenging as the number of pupils with a migrant background nearly doubled between 2009 and 2018. Another challenge is the growing shortage of teachers.
·Despite the favourable business environment, productivity growth has stalled recently and is expected to remain low in the short term. Productivity growth in the longer term will depend on the successful transformation of the production base and the introduction of further innovations in information and communication services and strategic value chains. The country performs well in terms of efficient public administration, access to finance for small and medium-sized enterprises, and innovation and internationalisation by businesses. However, investment and innovation could benefit from a closer cooperation between academia and business, supporting productivity growth.
·To achieve Sweden’s ambitious climate objectives, sizeable investments and adequate funding will be key. The country intends to be carbon-neutral by 2045. This will require investments in infrastructure, such as the electrification of transportation and industry, and close cooperation across society to support innovation, while maintaining competitiveness. On the government’s initiative, several energy-intensive sectors including steel, cement and mining have presented roadmaps for becoming climate neutral by 2045, while discussions are ongoing on a comprehensive tax reform for increasing environmental taxes while reducing those on labour and business. The Commission’s proposal for a Just Transition Mechanism under the next multi-annual financial framework for the period 2021-2027, includes a Just Transition Fund, a dedicated just transition scheme under InvestEU, and a new public sector loan facility with the EIB. It is designed to ensure that the transition towards EU climate neutrality is fair by helping the most affected regions in Sweden address the social and economic consequences. Key priorities for support by the Just Transition Fund, set up as part of the Just Transition Mechanism, are identified in Annex D, building on the analysis of the transition challenges outlined in this report.
1.
Economic situation and outlook
GDP growth
After years of solid growth, the Swedish economy is losing momentum. Real GDP increased by 2.2% in 2018, but grew very little in the first three quarters of 2019 as domestic demand decelerated. Gross fixed capital formation even turned negative in the first half of 2019. The unemployment rate, which normally lags economic growth, has increased since mid-2018 with the cooling of the economy.
Waning domestic demand and heightened external risks cloud the outlook. Investment, a main growth driver in recent years, has become a drag on economic growth and private consumption has slowed. Although the fall in investment was led by a drop in housing construction, investment in machinery and equipment is cooling as well. Gross fixed capital formation is not expected to turn positive until 2021 (Graph 1.1). By contrast, net trade was buoyed by strong services exports and is forecast to support growth, in particular in 2019 and 2020 and private consumption will pick up from 2020. Overall, real GDP growth is projected to average 1.3% in 2019-2021.
|
Graph 1.1:Output gap, real GDP growth and its components (1) (2)
|
|
|
|
Source: European Commission
|
Potential growth
The slowing economy is negatively affecting estimated potential output growth. As labour demand weakens due to waning domestic demand, the contribution of labour to potential growth is set to halve (Graph 1.2). In addition, the fall in gross fixed capital formation reduces the capital contribution to potential growth. The fact that the labour market is decelerating faster than investment, together with high growth in the capital stock in recent years, supports total factor productivity growth (
) (see Box 4.4.1).
|
Graph 1.2:Contributions to potential growth (1)
|
|
|
|
Source: European Commission
|
Inflation and monetary policy
Inflation remains low at below 2%. Following an increase in 2018 due to temporary factors (in particular a sharp rise in energy prices) the inflation rate is set to fall to 1.6% in 2021. Weak economic activity and expected moderate wage increases limit inflationary pressures.
Despite a slowing economy and low inflation, the Riksbank increased its central policy rate from negative territory to zero. The Riksbank increased the repo rate on 20 December 2018 from ‑0.5% to ‑0.25% and again to 0% on 19 December 2019 and indicated that no more rises are planned in the immediate future. The Riksbank will continue to purchase government bonds until the end of December 2020, maintaining its holdings close to the average since the beginning of 2018. Long-term interest rates in Sweden have been determined by government bond purchases in combination with the international low-interest rate environment. The 10-year government bond benchmark rate turned negative around mid‑2019, associated with an even more negative term premium in mortgage rates with a likely supportive effect on credit growth.
Private debt
Household debt remains at historically high levels posing a risk to the economic outlook. Household debt reached 176% of disposable income in 2018, with the ratio levelling off. In nominal terms, household debt increased by 4.8% year-on-year in the first three quarters of 2019, following a rise of 5.8% in 2018. Following macro-prudential tightening, the distribution of debt has become more concentrated. The share of new loans with debt-to-income ratios above 450% fell from 15.0% in 2017 to 8.4% in 2018. At the same time, the share of new loans with debt-to-income ratios between 300% and 450% jumped from 32.1% in 2017 to 37.8% in 2018. High indebtedness, linked to high house prices, implies a risk of a need for deleveraging with possibly severe implications for domestic demand (see Section 4.2.3).
Labour market
The labour market, which has had a high employment level, has started to weaken. The unemployment rate has increased markedly from an average of 6.3% in 2018 and is set to stabilise just above 7% in 2020 and 2021 (
). At the same time, Sweden continues to have one of the highest employment rates in the EU. However, the disparity between the employment rates of low-, medium-, and high-skilled workers remains high. In 2018 the employment rate for low-skilled employees stood at 62%, compared to 89% for those with tertiary education.
Labour shortages and skills mismatch persist. The Public Employment Service (PES) (Arbetsförmedlingen) expects continued labour shortages in the coming years. While the cyclical economic slowdown should ease the pressure, skills shortages of a more structural nature are expected prevent the gap from narrowing. This applies in particular to education, health care, social work, ICT, industry and construction. Thus, securing sufficient skills is a key challenge if sustained economic growth is to be ensured (see Section 4.3).
Growth of the Swedish labour force is increasingly due to immigration. In 2018, the foreign-born represented half of total growth in employment, and in education and health care the foreign-born actually accounted for all growth (Arbetsförmedlingen, 2019a). The PES expects the foreign-born to account for 90% of employment growth over the medium to long term.
Finding employment without adequate education is a challenge, in particular for the non-EU-born. Sweden is among the countries with the lowest share of employees in occupations for which only primary education is required with a figure standing at around 5% (Graph 1.3). Non-EU migrants who have only primary education often find it hard to find work. As structural labour shortages are most pronounced for high skilled jobs, weaker employment growth in the expected cyclical economic downswing risks having the most impact on the employment prospects of the lower educated, including immigrants.
|
Graph 1.3:Share of employees working in elementary occupation, 2nd quarter of 2019
|
|
|
|
Source: European Commission
|
Competitiveness
Despite weak productivity growth, the Swedish economy remains competitive. Strong competitiveness is shown by indicators on effective exchange rates and wage and cost developments (Graph 1.4) and is consistent with a relatively strong export performance. On average, real hourly wage growth has outpaced lacklustre productivity growth since 2011. In the most recent expansionary phase of the business cycle average wage growth remained modest, while wage dispersion across industries remained limited (
). The ensuing moderate gains in unit labour costs, together with the depreciating krona, have supported overall competitiveness and have been an important determinant of subdued inflation.
|
Graph 1.4:Breakdown of rate of change of unit labour
costs (ULC)
|
|
|
|
Source: European Commission
|
Inequality
The increasing return on human capital benefits the lower paid but not the lowest paid. In 2015, the Organisation for Economic Cooperation and Development (OECD) noted that in Sweden employment opportunities, including wages, are strongly linked to educational attainment (OECD, 2015). Those on the highest incomes, in sectors where skills shortages are most pressing, have experienced significantly higher wage growth than those on the lowest incomes (Graph 1.5). With a large part of the labour force being relatively well-educated, however, increases have not been proportional across income groups. Wage growth has been particularly strong for those in lower paid jobs, although not for the 20% of the workforce earning the lowest wages.
While Sweden remains among the more equal societies in the EU, it is no longer among the top performers. Social transfers are the main means of counterbalancing the increased disparity between low and higher-wage earners. While wages have increased for the lower paid jobs but not for the lowest paid, the disposable income of the lowest paid has actually increased more than that of any other income group due to redistribution, except the top decile for which business income is an important determinant of disposable income. Income inequality, measured by the income share of the richest 20% compared with that of of the poorest 20%, remains stable at just above a ratio of 4. However, when measured using the Gini-coefficient, income inequality has increased because of changes in relative incomes other than the lowest due to changes along the full range of incomes. In addition, Sweden has experienced increased wealth inequality and, in particular, housing wealth inequality (see Section 4.2.2). It is difficult for young people, low-income groups, and newly arrived migrants to find affordable housing, particularly in the big cities. More broadly, housing, other non-financial and financial wealth dynamics have been an important driver of income inequalities (Andersen, 2019).
|
Graph 1.5:Labour productivity and wage growth, 2011-2017
|
|
|
|
Source: Statistics Sweden (income) and European Commission (productivity, wages), European Commission calculations
Note: Ninth decile given for its high wage income share in disposable income; tenth decile has large share of business income
|
External position
The fall in the current account surplus reversed in 2019. While the goods balance fell from a surplus of 6.9% of GDP in 2006 to 1.5% of GDP in 2018, an increasing services surplus compensated for this until 2016. From then onwards, however, the services balance deteriorated too and the total trade surplus fell from 4.4% of GDP in 2016 to 1.9% of GDP in 2018, despite the fact that the Swedish krona depreciated by 4.7% in real effective terms over the same period. In 2019, however, the current account surplus widened, as exports held up (supported by strong competiveness) while imports slumped in line with the deceleration in domestic demand.
Corporates reducing their borrowing, and further increases in household savings, will support the current account. Since 2004, a rising household savings surplus was partly offset by a reduction in borrowing by corporations. As the economy enters a phase of muted growth, weak domestic demand is lowering imports, and reduced corporate investments are expected to improve the savings ratio. Looking at the sectoral breakdown of the international investment position, only the monetary financial institutions have a substantial negative net international investment position (NIIP). This to a large extent mirrors the funding of banks through securities issuance, mostly in international capital markets, amounting to around 40 to 50% of GDP and around 25% of total funding. This source of financing has remained stable, also in the wake of recent money laundering allegations (see also Section 4.2).
|
Graph 1.6:Breakdown of Net International Investment Position by sectors
|
|
|
|
Source: European Commission
|
Public finances
While some pressure is building, budgetary developments remain solid. The cooling of the economy, in combination with tax cuts, has slowed revenue growth in 2019 and beyond. At the same time, demographic developments and the integration of recently arrived immigrants are putting upward pressure on expenditure. Consequently, medium-term budget projections point to decreasing surpluses of 0.3% of GDP in 2019 and 0.1% in 2020-2021.
Sweden’s debt-to-GDP ratio is expected to continue to fall. Strong economic growth, primary budget surpluses and prudent fiscal management brought the debt-to-GDP ratio to 38.8% in 2018. The decline is set to continue with the debt-to-GDP ratio at 32.0% in 2021, significantly below the reference value of 60 % of GDP agreed in the Treaty (see also Section 4.1). Moreover, while the overall debt is set to decrease, its composition is changing: local governments and regions are taking on more debt to finance investments welfare provision facilities such as schools, preschools and homes for the elderly.
Progress towards the Sustainable Development Goals
Sweden generally performs very well towards achieving the Sustainable Development Goals (SDGs) (
). It is among the EU Member States performing best on “zero hunger” (SDG 2), “Good health and well-being” (SDG 3), “Gender equality” (SDG 5), “Clean water and sanitation” (SDG 6), and “Sustainable cities and communities” (SDG 11). Sweden has seen a deterioration in its performance in recent years on “Reduced inequalities” (SDG 10) and “Responsible consumption and production” (SDG 12) albeit from high levels. In several sub-indices Sweden is among the top performers, e.g. in adult participation in learning", "death rate for chronic diseases”, “investment as a share of GDP”, and “seats held by women in parliament”. Swedes continue to have a high confidence in institutions. The crime rate, however, has been rising and is now above the EU average.
|
|
|
Table 1.1:Key economic and financial indicators - Sweden
|
|
|
|
Source: Eurostat and ECB as of 4-2-2020, where available; European Commission for forecast figures (Winter forecast 2020 for real GDP and HICP, Autumn forecast 2019 otherwise)
|
|
|
2.
Progress with country-specific recommendations
Since the launch of the European Semester in 2011, 88% of all country-specific recommendations (CSRs) addressed to Sweden have recorded at least ‘some progress’ (
). 12% have recorded ‘limited’ or ‘no progress’ (Graph 2.1). Substantial progress and full implementation have been achieved in several policy areas, in particular fiscal governance and research and innovation. Limited progress has been achieved in implementing CSRs related to the housing market and household debt.
|
Graph 2.1:Overall multiannual implementation of 2011 - 2019 country-specific recommendations to date (1) (2) (3)
|
|
|
|
Source: European Commission
|
Sweden’s fiscal policy continues to be in a healthy state. Continued budgetary surpluses, a declining debt-to-GDP ratio well below the Treaty threshold and a sound fiscal framework have ensured Sweden’s compliance with the medium-term budgetary objective.
For the labour market, the government achieved some progress in improving the employment situation of young people. Measures to support apprenticeships and other types of work-based vocational education were adopted, but the low-skilled and the non-EU born citizens in particular face high unemployment levels.
Every year since 2011, it has been recommended that Sweden address its high and rising household debt and high house prices. The authorities have implemented and adopted policy measures to address the issue, but these have been of a rather incremental nature.
In addition to macro-prudential steps, the government has aimed to increase housing supply. Macro-prudential measures include a loan-to-value ceiling of 85% in 2010, raising banks risk weight floors for mortgages in 2013 and 2014, a formal amortisation requirement in 2016, further strengthened in 2018 and an enhanced legal mandate for the financial supervisor in 2018. While this has improved banking sector resilience, it has not stopped household debt growth. The authorities also revised the building and planning regulations and provided budgetary support for more construction. This has increased building supply, but not enough to cover expected needs, in particular in major cities.
Sweden has made some progress (
) in addressing its 2019 country-specific recommendations. Sweden received three CSRs. The first one relates to the high level of household debt and high house prices. This is relevant for the macroeconomic imbalance procedure (see Section 3). Limited progress has been made in addressing these imbalances. The unlawful sale of rental contracts has been criminalized and fines are now higher. The government marginally changed the capital gains tax to improve mobility and achieve a better use of the existing housing stock. To support housing supply, the government has reinstated investment support for building rental apartments (see Section 4.2.2). In addition, the countercyclical capital buffer requirement for systemic banks has been raised from 2.0% to 2.5% effective from 19 September 2019.
Sweden has made some progress on the second CSR related to investment and on the third CSR related to anti-money laundering. The country is increasing its investment in education and in infrastructure. Investment in research and innovation and transport has been maintained. The third recommendation covers anti-money laundering, where Sweden has made some progress. It strengthened the legal anti-money laundering framework and somewhat increased staffing, although a further strengthening is needed. The country has started reviews of the governance of major Swedish banks and their control of anti-money laundering measures in Baltic subsidiaries and launched two investigations at the end of 2019.
Upon request from a Member State, the Commission can provide tailor-made expertise via the Structural Reform Support Programme to help design and implement growth-enhancing reforms. Since 2018, such support has been provided to Sweden for three projects. In 2018, the Commission provided the authorities with support for the implementation of the corporate-income-tax gap assessment methodology. In 2019, work started to improve the capacity of municipalities to assess the quality of healthcare at home and in nursing homes. The Commission is also assisting the authorities in preparing a study to digitalise the issuance of import permits, export permits and re-export certificates in order to comply with the Convention on International Trade in Endangered Species of Wild Fauna and Flora (
CITES
).
|
|
|
Table 2.1:Summary table on CSR assessments (*)
|
|
|
|
Source: European Commission
(*) The assessment of CSR 2 does not take into account the contribution of the EU 2021-2027 cohesion policy funds. The regulatory framework underpinning the programming of the 2021-2027 EU cohesion policy funds has not yet been adopted by the co-legislators, pending inter alia an agreement on the multiannual financial framework (MFF).
|
|
|
|
Box 2.1: EU funds and programmes to address structural challenges and to foster growth and competitiveness in Sweden
Sweden benefits from EU support. The financial allocation from the EU Cohesion policy funds
I
for Sweden amounts to € 3.47 billion in the current Multiannual Financial Framework, equivalent to around 0.1% of GDP annually. By the end of 2019, some € 2.98 billion (around 86 % of the total amount planned) was allocated to specific projects, while € 1.57 billion was reported as spent by the selected projects
II
showing a level of implementation above the EU average.
EU Cohesion policy funding also contributes to addressing structural challenges in Sweden. The Cohesion Policy programmes for Sweden have allocated € 644.25 million for smart growth, € 244.54 million for sustainable growth and sustainable transport and € 783.80 million for inclusive growth. In 2019, following a performance review
III
, € 139.54 million was made available within performing priorities.
EU Cohesion policy funding is contributing to transformations of the Swedish economy by promoting growth and employment via investments, mainly in research, technological development and innovation, competitiveness of enterprises, sustainable transport, employment and labour mobility. By 2019, investments driven by the European Regional Development Fund (ERDF) had approved 800 projects, 1,800 organisations are co-financing the projects, 20,000 SMEs are supported. European Social Fund (ESF) funding contributes to employment growth and a sustainable working life through measures aimed at skills development and support for vulnerable groups. In total, more than 160,000 people have benefited from the support. The Fund has helped the process of integration of the foreign-born into the labour market, especially women. The ESF and the Youth Employment Initiative supported over 25,000 participants with a foreign background or minorities. Over 10% of the ESF projects focus on the newly arrived in Sweden.
Agricultural and fisheries funds and other EU programmes also help address investment needs. The European Agricultural Fund for Rural Development (EARDF) provides supports of € 3.46 billion and the European Maritime and Fisheries Fund (EMFF) has € 173.18 million (including the national co-financing for both) available. Sweden benefits also from other EU programmes, such as the Connecting Europe Facility, which allocated € 347.11 million to specific projects on strategic transport networks. Horizon 2020 allocated € 1.6 billion (including to 485 SMEs of about € 248.11 million).
EU funding contributes to mobilisation of private investment. By the end of 2018, European Structural and Investment funds
IV
helped programmes mobilise additional capital by committing about € 275.3 million in the form of loans, guarantees and equity, which is 4.6% of all decided allocations of the European Structural and Investment funds (ESIF).
EU funds already invest amounts on actions in line with the Sustainable Development Goals (SDGs). In Sweden, European Structural and Investment Funds support 10 of the 17 SDGs with up to 95% of the respective expenditure.
|
3.
Summary of the main findings from the MIP in-depth review
The 2020 Alert Mechanism Report concluded that another in-depth review should be undertaken for Sweden to assess the persistence or unwinding of imbalances (European Commission, 2019a). In February 2019, Sweden was again identified as having macroeconomic imbalances (European Commission, 2019a). The identified imbalances related in particular to elevated house prices coupled with high and increasing household debt. This chapter summarises the findings of the analyses in the context of the MIP in-depth review that is contained in various sections in this report (
).
3.1.Imbalances and their gravity
Consolidated private sector debt stood at 200% of GDP in 2018, among the highest in Europe. It grew by two percentage points in 2017-2018. Consolidated debt of both households (88% of GDP in 2018) and non-financial corporations (112% of GDP in 2018) both grew. Current debt levels are high compared to other EU countries and above debt benchmarks developed by the European Commission.
Household debt remains the main concern. Not only has household debt risen faster than GDP and disposable income for an extended period of time, but the expansion of household debt is also strongly tied to high house prices and very low interest rates. While households possess significant assets, these are usually illiquid and their value is exposed to market risk. Moreover, high household debt is a particular concern for certain groups that entered the housing market in recent years and took on above average levels of debt relative to income (see ‘Household debt developments’ in Section 4.2.3).
The debt level of non-financial corporations, while high, appears manageable. Swedish non-financial corporations deleveraged following the financial crisis as nominal GDP growth outstripped credit growth. Deleveraging in Sweden has been orderly, i.e. the non-performing (NPL) ratio and the number of bankruptcies have been low and stable. Leverage continues to be high in comparison with most Member States, however, but equity cushions and corporate savings provide for a substantial buffer. Thus, overall, the corporate sector is in a position to further reduce leverage if needed. Some segments, like commercial real estate, appear more vulnerable. In the commercial real estate sector, asset prices have risen fast, yields have fallen and banks’ exposure to lending for the sector has increased. (see ‘Corporate debt developments’ in Section 4.2.3).
High house prices in combination with high household debt expose the Swedish economy to shocks. House prices have risen significantly over the past two decades and remain high, despite a correction in 2017. The overall estimate of the overvaluation gap is at around 30%. Strong fundamentals, low interest rates, distortive taxation and supply side inefficiencies all contribute to the overvaluation (see Section 4.2.2). Because of the combination of high house prices and high private debt, the European Systemic Risk Board (ESRB) stepped up its warning and issued in 2019 a recommendation to Sweden to address these structural factors (ESRB, 2019a).
The banking sector is relatively resilient, but could be vulnerable to sudden changes in economic and financing conditions. Bank profitability has been among the highest in the EU due to low NPL ratios, high cost efficiency and low funding costs. However, banks rely on wholesale funding, exposing them to risks of liquidity shortages and changes in interest rate conditions. In addition, they have a large exposure to mortgages and commercial real estate. If there is an abrupt reversal of the high house prices, in combination with a general worsening of economic and financing conditions, these structural features could have negative consequences for the Swedish economy and for the Nordic region, where Swedish banks are active.
3.2.evolution, prospects and policy responses
Household debt continues to rise. The stricter amortisation rules for new residential mortgages resulted in a somewhat slower credit growth. In nominal terms, it grew 4.8% year-on-year in the first three quarters of 2019 (5.8% in 2018). In the third quarter of 2019, household debt stood at 177% of disposable income. The combination of favourable financing conditions due to low interest rates, a uptick in house prices and still growing disposable income will highly likely result in continued uptake of debt in particular by first-time buyers (Emanuelsson et al., 2018).
House prices are likely to increase further. House prices started to grow again in 2019 as the supply of new homes is lagging and the rental market does not offer many alternatives. Moreover, the low interest rates and negative term premium can suppress user housing costs even if debt increases. In December 2019 the year-on-year increase in house prices was 4.2%, leaving them 3.2% below their August 2017 peak (
). Real house prices were 2.3% year-on-year higher in December 2019 and 7.8% below their 2017 peak. Indicators still point to an overvaluation of house prices, with the gap between prices and fundamentally justified values among the highest in the EU. Continued distortions in supply and demand together with growth of nominal disposable income and some financial space (lower interest rates at the longer end of the yield curve plus uptake of consumer loans) suggest that prices are likely to rise moderately in the future.
Corporate debt is on the rise, again. After reaching a post-crisis low of 106% of GDP, consolidated corporate debt has started to rise again. Quarterly indicators for non-consolidated debt point to a further, albeit moderate, rise in the first half of 2019. Corporates have somewhat started to lengthen the duration of loans following the strong decline in longer maturities. Still, 70% of the remaining maturity is below 3 months and 90% below one year.
Limited policy steps have been taken to address the imbalances associated with household debt and the housing market. For the rental market, the unlawful sale of rental contracts has been criminalised and fines have been increased. The government marginally changed the capital gains tax to improve mobility and achieve better use of the existing housing stock. Deferral of the capital gains tax liability on housing transactions remains possible when moving house, with the maximum deferrable amount increased to SEK 3 million. To partially address the continued shortage of housing supply, the government has reinstated investment support for building rental apartments (including for students) as part of the 2020 budget bill. This entered into force on 1 January 2020 with a budget allocation of SEK 2.1 billion, which should gradually increase to SEK 3 billion. Concerning macroprudential policy, the countercyclical capital buffer for systemic banks has been raised from 2.0 to 2.5%, effective from 19 September 2019 and the FSA proposed tighter capital requirements on banks for their exposures to commercial real estate.
Important policy gaps remain, particularly in relation to tax incentives for (debt-financed) home ownership and the rental market. Sweden is one of the very few EU countries with tax relief on the full amount of mortgage interest paid and there has been no progress towards reducing this tax deductibility. Nor has any action been taken to reform the system of recurrent property taxation, which currently has a relatively low ceiling so that the tax in practice tends to be a rather modest fixed fee that does not increase apace with property values. At the same time, the capital gains tax, which negatively affects housing mobility in the owner-occupied housing market segment, has been broadly left untouched. Sweden’s rental market remains tightly regulated and discourages increased supply of rental housing and more efficient usage of the existing stock.
3.3.Overall assessment
The Swedish economy still faces macro-economic imbalances related to high private debt and overvalued house prices. Macroeconomic shocks could still destabilise the Swedish economy as household debt related to overvalued house prices could trigger a harmful adjustment. In such an adverse scenario, a large and disorderly correction of house prices would lead to a negative interaction between credit and economic growth. This could spill over to other countries in the region through the financial system.
Policy measures have not sufficiently addressed housing debt and house price imbalances. The authorities have resorted mostly to macro-prudential measures to address demand pressures while supply measures have been restricted to subsidising construction in the rental market. The 2016 ‘22-point plan’ to improve the working of the housing market, which was implemented gradually, has been superseded by the broader reform agenda contained in the government programme of January 2019 (‘the January Agreement’). Still policy gaps remain for housing-related taxation and for the functioning of housing supply and the rental market.
|
|
|
Table 3.1:MIP assessment matrix (*) - Sweden 2019
|
|
|
|
|
|
(Continued on the next page)
|
|
Table (continued)
|
|
|
|
|
|
|
|
Source: European Commission
|
|
|
4.
Reform priorities
4.1.Public finances and taxation
Public finances remain resilient. The general government balance had a surplus of 0.8% of GDP in 2018, with the general government gross debt at 38.8% of GDP and the debt-to-GDP ratio expected to have declined below the new 35% debt anchor in 2019. A slightly expansionary 2020 budget bill and slower growth are expected to lead to a decline in the general government surplus, but Sweden still faces low fiscal sustainability risks in the medium to long term.
4.1.1.Fiscal framework
A revised fiscal framework came into force in Sweden in 2019. The main changes are the introduction of a debt anchor set at 35% of GDP with a 5 percentage point tolerance margin and a lower net lending surplus target over the cycle to 0.33% of GDP, from the previous 1% of GDP. In addition, it entails a strengthened mandate for the Fiscal Policy Council (Finanspolitiska rådet), which has worked since 2007 to monitor fiscal rules and evaluate the official macro-forecasts. The fiscal framework kept the expenditure ceiling and a balanced budget requirement for local authorities.
The framework has strong credibility based on its institutional set-up and Sweden’s track record. The framework has contributed to long-term fiscal sustainability in Sweden (Graph 4.1.1), combining stability and sound implementation over time with the possibility of amending when necessary, for example in response to demographic changes or debt development assessments. Since 2017, ties between the budget and climate policies have been strengthened through the climate policy framework, and the budget includes an annual climate report.
|
Graph 4.1.1:Swedish fiscal rules index and government gross debt
|
|
|
|
Source: European Commission
|
Broad political support was and remains crucial for the success of the framework. The institutional set-up of Sweden’s public finances is based on consensus across party lines, which has been a factor for its soundness (see European Commission, 2019b). The predictability of the fiscal framework has contributed to its success. According to the framework, statutory revisions should be made every 8 years. The current policy agreement between the government and two centre-right parties (the Liberals and the Centre Party) explicitly states that the framework is to be complied with over the election period, also to be prepared for a downturn.
It is too early to evaluate the results of the new fiscal framework. While the debt level is in line with the benchmark rule and is projected to have fallen to 34.6% of GDP in 2019, an assessment of the surplus target requires more data points under the new rule. It appears that the current expenditure ceiling will help achieve the surplus target. In a retroactive perspective, the new target would not have been reached (Finanspolitiska rådet, 2019). Looking ahead, local governments and regions face a rising demand for welfare services. The long-term ability of the pension system to guarantee adequate pensions is also uncertain. In the event of substandard pensions, ad hoc interventions could put additional pressure on public finances (Aspegren et al., 2019).
4.1.2.Taxation and budgetary developments
The general level of taxation remains above the EU average, but varies across specific taxes. The total tax burden was 43.8% of GDP in 2018 (EU average 39.2% of GDP). The overall labour tax burden is also high with an implicit tax rate of 39.6% in 2018, above the EU average of 36.2%. At the same time, the relatively low recurrent property tax on homes (
), and mortgage interest deductibility, result in a regressive tax bias in favour of house ownership. However, capital taxes are also below the EU average (6.1% of GDP; EU average of 8.5%, and 13.8% of total taxation; EU average of 21.6%).
The high tax burden on labour might affect work incentives. Low-income earners at 50% of the average wage face a particularly high tax wedge, i.e. the gap between labour costs and take-home pay, at 39.5%. Furthermore, incentives to move from inactivity to employment as measured by the inactivity trap indicator, are low at 50% and 67% of average wage, due to a high tax burden.
A broader tax reform could support employment and help mitigate the build-up of household debt. The government’s 2019 policy statement included an objective to carry out a major tax reform. No concrete plans have yet been announced, however. Therefore, it is not certain whether the forthcoming reform would include e.g. a tax shift from labour to property by revising the rules on mortgage interest deductibility or the recurrent property tax. Reforms in this area could contribute to more favourable development of household debt (see Section 4.2), foster employment and possibly also have a favourable impact on income equality (Justo et al., 2019).
The 2020 budget bill is slightly expansionary. It reflects rising demand for welfare services and the financial constraints of local governments and regions, which will receive higher grants (an increase of SEK 5 billion). Moreover, it includes new spending on law and order and a commitment to support a green transition using SEK 3.2 billion to promote the transition to a fossil-free economy. On the revenue side, sizeable tax cuts translate into slower revenue growth. This includes the abolition of the 5% ‘austerity tax’ levied on the portion of individual incomes exceeding SEK 689,300 per year (removing the top layer of progressivity), and a reduction in income tax rates for income above SEK 17,000 /month for the over-65s. The aim of the measure is to remove the gap between taxation of employment income and pension income.
Revenue from environmental taxes is below the EU average. Environmental taxes accounted for 2.1% of GDP in 2018 (EU average 2.4%) and energy taxes for 1.6% of GDP (EU average 1.8%). In the same year, environmental tax revenue accounted for 4.8% of total revenue from taxes and social security contributions (EU average 6.2%). This situation is partially due to the intended behavioural impact of taxes, and an increased substitution to biofuels in the transport sector.
Some exemptions and reductions in tax rates for carbon and energy are being phased out. Discounts in the carbon tax on heating fuels in the non-ETS (emissions trading system) sectors have been reduced, and ultimately abolished in 2018. Tax reductions or exceptions remain only for fuels in certain areas, such as agriculture and inland sea transport. Since 2017, taxes on petrol and diesel are subject to an annual increase of two percentage points on top of consumer price inflation. The ‘diesel differential’ (difference in price of diesel versus petrol) has been reduced by gradually adjusting the respective excise tax rates.
4.1.3.sustainability of public finances
Sweden’s government debt is expected to continue declining over the medium term. Sound fiscal management and sustainable economic development under the Commission’s baseline no-policy change scenario is projected to bring government debt to 15.4% of GDP in 2030 from 34.6% of GDP in 2019. The pension system is being reformed, with the aim of tying the minimum pensionable age to a ‘reference age’ that will increase with life expectancy. As a first step, the minimum age for the regular old age pension (income-based pension) has been raised from 61 to 62 in January 2020, and further steps to raise the reference age for the old age (income-based) pension and minimum (guaranteed sum) pensions are expected in the coming years (Aspegren et al., 2019). Overall, the outlook for fiscal sustainability appears sound in the short, medium and long term (European Commission, 2020a) (
).
Debt appears to be resilient to shocks. Given the low stock of initial debt, adverse shocks to growth, interest rates or the primary balance would not have a sizeable impact on the debt ratio. In all sensitivity test scenarios government debt remains on a downward trend. Debt-to-GDP at the end of the projection period (2030) in these scenarios is moderately higher than the baseline. In the worst case scenario, based on a shock to the exchange rate, gross public debt would reach 18.0% of GDP in 2030.
Public expenditure on long-term care is projected to increase. Demographic changes imply that under current policies, spending on long-term care can be expected to increase significantly, from 3.2% of GDP in 2016 (the second highest in the EU) to 4.9% of GDP in 2070 (European Commission and Ageing Working Group of the EPC, 2018). This corresponds to a 53% increase, slightly below the EU average. The share of the population receiving long-term care is relatively high by EU standards, whereas the underlying level of need (
) is among the lowest in the EU.
4.2.
Financial sector
4.2.1.Banking sector (*) (
)
Overview
The banking sector is resilient thanks to high profitability and low credit losses. Despite negative interest rates in recent years, bank profitability still ranks among the highest in Europe. Moreover, in 2019, the Swedish banking sector continued to exhibit one of the lowest average NPL ratios for both households and non-financial corporations (see Table 4.2.1). This low incidence provides resilience in the event of adverse shocks and has led to low funding costs. These developments and high cost efficiency resulted in return on equity and return on assets averaging 12 and 0.7% respectively in 2019. Share prices fell, however, as several Swedish banks are being investigated for failures to properly prevent money laundering, particularly in their Baltic branches and subsidiaries.
Vulnerabilities and risks remain due to the size, concentration and interconnectedness of the Swedish banking system. The size of the banking system, measured by its total assets, is almost 300% of GDP (
). The sector is concentrated around three major (pan-Nordic) banks covering over 60% of the market across all main segments. In addition, these banks are closely interlinked through their trading operations and their bilateral non-secured loans. There are also sizeable cross-holdings of covered bonds (
), which entails significant risks of contagion in the event of disruptions.
Regulatory changes in the calculation of banks' risk-weighted assets led to a significant decline in reported capital ratios. At the end of 2018, the Financial Supervisory Authority (Finansinspektionen, FSA) revised the modalities for the risk-weight-floor imposed on residential mortgages for banks using internal risk models, enhancing the international comparability of reported capital ratios. The ensuing drop in reported bank capitalisation as a ratio of risk-weighted assets moved it closer to the EU average (see Graph 4.2.1). However, the leverage ratio remains between 4% and 5% for most banks and is among the lowest in the EU. The comparatively low level of own funds illustrates the existing structural vulnerabilities, consistent with the finding of Betz et al. (2014) that the leverage ratio is the simple best indicator predicting failure for European banks. Capital requirements related to the output floor (
), as agreed by the Basel Committee on Banking Supervision, may lead to higher capital buffers for Swedish banks going towards full implementation on 1 January 2027 (Finansinspektionen, 2019a).
|
Graph 4.2.1:Common Equity Tier 1 capital ratios (%)
|
|
|
|
Source: European Commission
|
|
|
|
Table 4.2.1:Financial soundness indicators (1)
|
|
|
|
Source: European Central Bank; European Commission calculations
|
|
|
Swedish banks have maturity mismatches between assets and liabilities and rely on wholesale funding. The loan-to-deposit ratio is high in Sweden (182.2 as of Q2-2019, twice the EU average). Compared to European peers, the major banks in Sweden have a large share of loans on the asset side, mainly mortgages with usually a very long maturity of 30–50 years. On the liability side, bank deposits, commonly perceived as a stable funding source, are a comparatively small share. Swedish banks rely on the international capital markets to cover the resulting funding gap of around 50% of their loan books, mostly with short-term debt in foreign currency and covered bond issuances backed by residential mortgages.
The liability structure exposes credit institutions to the risks of liquidity shortage and higher funding costs. Because international wholesale funding is much more sensitive to changes in interest rates or conditions of financial stress, Swedish banks could find it difficult to get sufficient liquidity in an adverse situation e.g. disruption on the housing market or confidence effects stemming from the ongoing money laundering investigations. Against this background, Swedish supervisors have stressed the importance of adequate liquidity coverage ratios and the need to diversify liquidity buffers (Finansinspektionen, 2019b; Riksbank 2019a). On the other hand, all systemically important institutions already meet the current minimum requirements for own funds and eligible liabilities (MREL). This is the amount of own funds and liabilities that can be written down or converted into new equity to absorb losses and restore capital in a crisis.
Stress tests show mixed results for Swedish banks. According to the 2018 stress test conducted by the European Banking Authority (European Banking Authority, 2019), the major Swedish banks would have the ability to withstand a severe recession combined with falling real estate prices (illustrated, among other things, by a reduction in the Common Equity Tier 1 (CET1) ratio of at the most between 2.7 and 3.3 percentage points). By contrast, the results of the Riksbank’s stress tests show that in the event of a deep recession the major banks’ credit losses could be higher. They would incur substantial operating losses, lowering their CET1 ratio by almost 14 percentage points and the leverage ratio by over 4 percentage points (
).
The exposure of banks to the housing market poses risks. Households remain vulnerable to an adjustment in the housing market and an increase in debt service costs (see Section 4.2.3). An indicator developed by the Riksbank (Giordani et al, 2017) to measure vulnerability in the financial system is currently at historically high levels, partly due to high indebtedness and rising real housing prices. This is despite the macro-prudential policy measures adopted to cover the associated risks.
Risks related to the commercial real estate market triggered an in-depth analysis by the Financial Supervisory Authority. Commercial real estate prices have increased sharply since 2013, in particular for offices in the centres of Stockholm and Gothenburg (Finansinspektionen, 2019c). Banks' commercial real estate lending has grown in parallel, possibly indicating a search for yield. However, given the size of the commercial property market in Sweden (around 36% of GDP)(
) and its sensitivity to macro-financial shocks, a sharp market correction could have ramifications for financial stability, via the exposure of construction firms to interest rate and refinancing risk. Thus, the FSA conducted an in-depth analysis of the appropriate capital requirement for banks to cover losses from commercial real estate lending. In January 2020, the supervisor raised Pillar 2 capital requirements to ensure sufficient capital coverage (Finansinspektionen, 2020). The adjusted risk weight is 35% (with a lower 25% requirement for commercial exposures secured by residential property) against the current level of around 23%.
Work on a revised Riksbank act is progressing, while the Banking Union inquiry was completed. On 29 November 2019 a dedicated parliamentary committee presented a report to the government with a proposal for a new Riksbank Act with some changes to the mandate of the central bank, which is due for subsequent public consultation (SOU, 2019a). On 10 December 2019, the government released the results of an inquiry into a possible Swedish membership of the Banking Union (SOU, 2019b). The report lists advantages and disadvantages of membership, but does not contain explicit policy proposals.
Anti-money laundering
Cases of alleged money laundering have put the spotlight on Swedish banks. Recent large-scale alleged money laundering cases involving activities of Swedish banks through their branches and subsidiaries in the Baltics, resulted in a CSR for Sweden to address shortcomings in its anti-money laundering framework (see Section 2). The European Commission looked at the case of Nordea and the role of the Swedish authorities (European Commission, 2019c) and asked the European Banking Authority to investigate whether financial supervision in the Swedbank case was in line with EU law. This investigation has not yet been completed. Allegations of suspected money laundering have affected the reputation of Swedish banks, resulting in a sharp fall in share prices in 2018-2019.
Enforcement of the anti-money laundering legal framework will be better coordinated. Sweden has created a special body to promote efficient collaboration between the supervisory authorities and the Police Authority, consisting of representatives from 17 organizations. It aims at bring together different types of knowledge and skills to ensure that they are of use to the entire system, and to foster collaboration, dialogue and effective exchange between the authorities, and between the authorities and operators.
The Financial Supervisory Authority recruited additional staff to ensure a more transparent, risk-based and efficient supervision. It increased its staff by four new posts in 2018 to a total of 13, still low for the size of the Swedish financial sector. The 2020 budget allocates an additional amount of SEK 10 million to the FSA to strengthen its anti-money laundering work (Finansinspektionen, 2019d).The FSA is currently working at domestic level to apply the risk-based supervision approach through a risk classification tool, which will need to be updated in 2020. More work is needed, however, to understand and correctly apply the risk-based approach, revising its inspection procedures and applying a more dissuasive sanctioning policy. In parallel, permanent structures have been set up to integrate anti-money laundering and counter terrorism financing supervision at the Nordic or Nordic-Baltic levels.
Sweden’s Financial Intelligence Unit (Finanspolisen, FIU) started to upgrade its national reporting system for suspicious transactions. Also to be able to handle an increased number of notices, the FIU plans to replace its existing reporting system with an integrated one by March 2020. The new system should not only improve the quality of reporting but also enhance the FIU’s capacity to identify, map and analyse risks and methods for money laundering and terrorist financing. Sweden only makes limited use of the FIU.net for requests and exchange of information with other EU Financial Intelligence Units. At present, it still suffers from outdated internal databases and a lack of clear procedures to prioritise and analyse incoming suspicious transaction reports. The FIU has currently around 35 staff, and is in the process of recruiting more staff to strengthen its analytical capacity.
4.2.2.housing market (*)
Housing market developments
Residential real estate prices have started to grow again in 2019, while housing construction is shrinking. House prices increased by 2.7% in September 2019 year-on-year, leaving them 2.5% below their peak of August 2017. In real terms, the increase was 1.4%. House prices are estimated to have been overvalued by 7% in 2018 according to the European Commission’s model. When compared to income only, the overvaluation amounted to 36% in 2018. After the cooling of the housing market for tenant-owned apartments in 2018, the transaction volume returned to its 2017 high in early 2019. Supply constraints and demand developments are expected to support house prices in the near term while market distortions remain in place.
Single-family houses and apartments showed different price trends. Apartments have been more affected by the 2017 price decline than single-family houses, possibly due to a combination of high construction volumes for apartments coupled with macroprudential tightening. Apartment prices declined more (10.4%) than those for single-family houses (8.3%) from peak (August 2017) to trough (December 2017) and have recovered less with prices in September 2019 standing 5.1% below their peak (single-family houses: -0.8%) (see Graph 4.2.2).
|
Graph 4.2.2:House prices by market segment (nominal)
|
|
|
|
Source: Valueguard HOX house price index
|
Real house prices have grown faster than disposable income over the past 25 years. The increase of about 200% outpaced house price rises in most other EU countries. House prices are most overvalued when compared with rents. Since the Swedish rental market is highly regulated, rents are on average below market rents and waiting lists are long (see European Commission, 2019b, p.30). The development of price-to-income and the Commission’s in-house model also suggest some overvaluation (see Graph 4.2.3). The European Systemic Risk Board came to a similar conclusion in its assessment and recommendation to Sweden (ESRB, 2019a; ESRB, 2019c). (
)
Low interest rates have supported high house prices, but valuations seem stretched. Historically low interest rates have reduced the user cost of home ownership, pushing house prices up. Interest expenses of households have declined to the lowest level in three decades. Debt service of households, however, has stayed close to its pre-crisis high since 2011. The Swedish Debt Office (Riksgälden) (Bjellerup and Majtorp, 2019) examined the valuation of the housing market and concluded that price developments up to 2017 can be explained by changes in disposable income and after-tax interest payments, with also a significant effect from the imposition of loan-to-value limits. Recent developments are more difficult to explain using this model. In recent years, there have been changes in the structure of the mortgage market. Engström (2020) examines the role of new credit intermediaries and the possible impact they have on competitive conditions and interest rates in the mortgage market. To conclude, valuations continue to appear stretched for the entire market, but less markedly so than in 2016 and 2017.
|
Graph 4.2.3:Estimated house price valuation gaps based on different indicators (1) (2) (3)
|
|
|
|
Source: European Commission calculations
|
Demand drivers
Interest rates at historical lows and structural features propel housing demand. Monetary policy has been expansionary due to low interest rates and quantitative easing (see Section 1). Therefore, three-month interest rates have been negative since the second quarter of 2015. Interest rates for longer maturities have declined even more. This has translated into households increasing the duration of their mortgages (see Section 4.2.3). However, it seems difficult to secure current low mortgage rates beyond five years, regardless of the lower long-term rates and the predictability this could offer for monthly housing costs.
The tax system still favours debt used for investment in housing, and amplifies regional divergences in house prices. The interest that households pay on their debt is deductible at 30%, first against capital income and then against labour income tax if capital income is smaller than labour income. For annual interest payments above the threshold of SEK 100,000, 21% can be deducted (
). At the same time, local property taxes continue to be low compared with other countries and are capped nationally. The national cap implies that accumulated housing wealth is taxed relatively more in poorer regions than in richer regions. Combined with regional disparities in the income tax, this may reinforce differences in house prices between regions.
The opening gap between growth in house prices and income has increased the vulnerabilities of specific groups. While house prices have increased across the entire spectrum, it seems that the rise has been stronger in lower housing market segments than for other parts of the market. At the same time, there has been less growth of income in households focusing on these segments. Using the difference between mean and median as a rough indicator for this development shows that for tenant-owned apartments, the median price increased 36 percentage points more than the mean between 2005 and 2017 (
).
Three factors possibly explain the relatively higher prices in the lower segment. These are: (1) building activity favouring more expensive houses, (2) increased income inequality, and (3) housing wealth accumulation. The annual additions to the housing stock has on average been below 1% (see “Supply drivers”) in the past 10 years and income inequality (see Section 4.3) has increased only to a limited extent. Housing wealth accumulation takes place when new entrants pay a higher price than earlier entrants did. This wealth accumulation can be passed on along the housing ladder, i.e. those selling a house to a new entrant will use the proceeds to acquire a new, likely more expensive house. The growing wealth accumulation on the asset side is partially offset by the increase in household debt. At the current very low interest rates, this does not translate into higher housing costs for new homeowners but new entrants in the housing market tend to have (much) higher debt relative to their income than households that had entered earlier (see subsection 4.2.3).
Supply drivers
Building activity has fallen short of estimated needs for several years. The National Board of Housing, Building and Planning (Boverket )(2019) projects an annual need of some 93,000 new home constructions for 2018- 2020 and a need of 51,000 for the subsequent period to 2025. The effective housing supply, even at the peak in 2017, has fallen well short of the estimated short-term need and has only rarely met the structural, longer-term need. Residential real estate construction is forecast to shrink at a high rate in 2019 (-9.0% year-on-year) with a further decline in 2020 (-2.0% year-on-year). Confidence surveys record falling orders and expectations are at the lowest level since the 2012 recession. New building permits and housing starts show a decline too.
Structural hurdles tend to constrain housing supply and raise construction costs. Developable land is not coming fast to the market and despite some reforms, zoning and building regulations, such as the varying interpretation of building rules by municipalities seems to fragment the market. This could particularly prevent foreign construction companies from entering the market, preventing competition to induce lower prices and higher productivity (European Commission, 2019b, p.29). In addition, lack of competition in a number of building materials markets contribute to increased construction costs (Swedish Competition Authority (Konkurrensverket), 2018).
|
Graph 4.2.4:New housing construction and estimated need
|
|
|
|
Source: Boverket, Statistics Sweden
|
In addition to shortage of supply, available housing does not fit households’ needs. The ratio of existing housing stock to number of households has been relatively stable recently at between 105% and 106% because the number of households has increased since 2013 at the same annual rate of 1.0% as the housing stock. Beyond the shortage of building supply, the most pressing mismatch appears to be the size of households and the characteristics of the housing stock. Around 70% of Swedish households consist of no more than two people, but only 51% of the housing stock is non-rental multi-dwelling houses, broadly unchanged since the start of records in 2013 (first available year, see Graph 4.2.5). The number of one person households, already 40% of all households, has grown faster than average (1.2%) as has the number of households with more than five people. This last category represents only 6% of all households.
|
Graph 4.2.5:Household dwellings by type
|
|
|
|
Source: Statistics Sweden
|
The housing stock and rental market fail to adjust to changing needs due to inertia. Conversion and destruction are even more limited than new additions to the housing stock, rendering changes in the existing stock slow. Building constraints are particularly binding in the metropolitan areas (
). Those depending more on public housing, i.e. those with lower incomes, face an-ever-tighter gridlock in the rental market. The share of public housing for rent out of the total housing stock has declined from 23% in 2001 to 18% in 2018 while the vacancy rate for rental accommodation has dropped to a historic low of 0.5% and continues to be much lower than the EU average (see Graph 4.2.6).
The housing stock is not used efficiently. In the rental market, below-market rents create lock-in and ‘insider/outsider’ effects. In the owner-occupancy market, capital gains taxes reduce homeowner mobility. The housing shortage makes it harder for people to change jobs (European Commission, 2019b, p.30).
|
Graph 4.2.6:Types of tenure and vacancy rates
|
|
|
|
Source: European Central Bank
|
Policy developments
Policy steps to address imbalances in the housing market have been limited. Whereas policy measures in 2018 mostly focused on the demand side, the supply side featured more prominently in 2019. These steps have been of a rather incremental nature and are unlikely to fundamentally change housing market distortions. To bring this about, determined policy action is needed in the rental market and in tax policy.
Sweden has raised the ceiling for deferred capital gains taxes from SEK 1.45 million to SEK 3 million. The increase in the ceiling can promote housing market mobility. However, the deferred capital gain is subject to an annual tax of roughly 0.5%, which in the current low-interest-rate environment makes deferral less interesting. Moreover, during the period 21 June 2016 - 20 June 2020, there is a temporary exemption from the previous maximum deferrable amount of SEK 1.45 million, so in practice the new rules represent a tightening of the deferral conditions. More generally, deferral only reduces the immediate cash flow impact and not the effective wealth reduction, and so there is still room for a substantial capital gains tax reform.
The FSA has tightened macro-prudential policy somewhat further. The supervisor increased the countercyclical capital buffer (CCyB) to 2.5% from 19 September 2019. Previously, the FSA had gradually raised the CCyB since its introduction in 2014. The previous level of 2% had been applicable from 14 March 2017. This increase in the countercyclical buffer aims to support overall financial sector resilience even if was not specifically targeted at imbalances related to household debt and the housing market. In addition, the FSA adapted the requirements for macro-prudential risk weights for residential real estate. This measure entered into force on 31 December 2018 for a period of 2 years. While unlikely to have a marked impact on lending, it increased the comparability of reported risk-weighted capital ratios for Swedish banks with those of their EU peers.
Investment support for building rental apartments has been reinstated. To reduce the continued shortage of housing supply, the government has earmarked SEK 2.1 billion to encourage the building of rental apartments (including for students) in its 2020 budget bill. The support should enter into force on 1 January 2020. Together with an easing of building regulations this may attenuate supply side issues somewhat.
The announced comprehensive tax reform could be an opportunity to address several shortcomings in one go. In its political agreement, the government indicated the intention to overhaul the tax system. So far, no timeline or details have been communicated. Such a tax reform could address not only the incentives for debt accumulation but could also lower the barrier to the housing market for people with lower incomes, promoting housing mobility and reducing wealth inequality.
4.2.3.Private indebtedness (*)
Household debt developments
Household debt remains high, although its rate of increase is slowing. Swedish household debt has been on a persistent upward trajectory since the early 2000s, significantly outpacing debt growth in peer countries (see Graph 4.2.7). However, on the back of less buoyant credit flows, the rate of growth of nominal household debt slowed to 5.8% in 2018, well below the peak increase of 8.0% in 2016 and declined further to 4.8% by the third quarter of 2019, bringing it broadly on a par with nominal household disposable income growth.
|
Graph 4.2.7:Household debt evolution (indexed, 2005 = 100)
|
|
|
|
Source: European Commission
|
The recent more moderate increase in household debt helped stabilise household debt ratios. The average debt-to-disposable income (DTI) and debt-to GDP ratios both broadly levelled off in 2018 and even fell back somewhat in the first half of 2019. Despite the broad stabilisation in aggregate debt ratios, they remain well above the fundamentals-based and prudential benchmarks for Sweden and are still among the highest in the EU. There is also significant dispersion in debt levels across households. The average DTI ratio for new borrowers in 2018 was 289% down from 300% the previous year. Households with a mortgage living in large metropolitan areas, as well as younger and lower-income households tend to face particularly high debt service costs relative to their incomes(
).That said, persistently low interest rates helped check the rise in mortgage interest payments and thus debt service as a share of disposable income (Finansinspektionen 2019e).
Drivers of household debt dynamics
Household debt growth mostly reflects mortgage lending. Mortgage debt amounts to over 80% of total household borrowing, and has been the key driver of the persistent rise in overall household indebtedness. Sweden experienced an extended period in which house price rises (see Section 4.2.1) and mortgage debt growth were mutually reinforcing. Increases in the underlying value of collateral enabled higher housing loans, in turn putting upward pressure on prices and thus keeping increases in the loan-to-value ratio in check. The growth in household mortgage loans contracted slightly for most of 2018 in the wake of the correction in house prices in late 2017. However, as house price growth has resumed, albeit at modest rates, and mortgage interest rates have remained low, overall mortgage lending has picked up again.
Unsecured borrowing has not been a major substitute for mortgages. Unsecured borrowing and household loans with other collateral (e.g. cars) have historically grown comparatively slowly. As mortgage credit growth slowed, unsecured borrowing kept increasing at a brisk pace, in part due to rapid changes in the technological, institutional and market conditions under which providers of consumer credit operate. However, Van Santen (2017) finds no evidence of a significant shift in borrowing for housing purposes towards unsecured loans. Overall, unsecured borrowing by households remains under 5% of GDP, a level broadly in line with the EU average, with currently limited implications for financial stability.
Structural factors account for relatively low debt service costs. There are strong tax incentives for purchasing owner-occupied housing, especially when financed with tax-deductible debt (see Section 4.2.2). Swedish mortgage contracts have long maturities compared to other EU countries, and overall amortisation rates are still low in comparative perspective. For historical and institutional reasons, mortgages mostly have had variable rates heavily skewed towards the short end of the yield curve(
), which between 2011 and 2016 allowed lower interest rates to translate relatively quickly into reduced interest payments as a share of household income, despite ongoing increases in house prices. The combination of these factors has limited current debt service costs, but also implies risks related to future interest rate rises.
|
Graph 4.2.8:Maturity of mortgages and interest rates
|
|
|
|
Source: Macrobond
|
A move towards longer maturities helps reduce the interest sensitivity of mortgage service. The long-term increase in the ratio of household mortgage debt to income implied higher interest sensitivity, given the predominance of housing loans linked to very short-term interest rates. Since late 2017, however, the share of mortgages with a maturity of 3‑5 years has increased markedly, implying a lower speed at which interest rates changes would be passed on to households (Graph 4.2.7). This broadly coincided with the adjustment in the housing market in the autumn of 2017 and thus possibly partly reflects a shift in risk appreciation on the part of households. However, it also went hand in hand with a change in the term structure of mortgage interest rates offered by banks, as the yield premium for longer maturities increased. On balance this recent shift implies that the immediate effects of an interest rate increase on the capacity of households to service their debt would be cushioned, thus heightening resilience.
Policy developments
High household debt coupled with high house prices are a risk for the Swedish economy. While the recent stabilisation in household debt implies that debt dynamics do not further aggravate existing vulnerabilities, the already high debt level keeps the Swedish economy vulnerable to a rapid deterioration in market conditions. Hence, risks may come into play should the projected economic slowdown be more severe than expected. If incomes were to fall due to an external shock to the economy, or if there was a sharp rise in mortgage risk premiums triggered, for instance, by higher bank funding costs that might originate in the global economy, highly-leveraged households may need to reduce consumption to service their debts. This would reduce demand and increase uncertainty, potentially weighing on investment, employment and economic growth thus further impairing households' debt service ability. At the same time, falling collateral values make banks more cautious about new lending. Ultimately, this could lead to a self-reinforcing deleveraging process with a broader macroeconomic impact.
Risks are partly mitigated by households’ robust payment ability and financial wealth. Households have relatively high income surpluses after mortgage service costs and day-to-day expenses, of roughly 40% of disposable income on average (Finansinspektionen, 2019f). The fact that these estimated buffers have stabilised or even slightly improved in recent years lends some comfort. The strong ability of households to pay back their loans is also reflected in a very low share of non-performing household loans (see Section 4.2.1). Additionally, households have significant financial wealth, estimated at roughly three times their liabilities.
Amortisation requirements for mortgages helped dampen household debt dynamics. In 2016 and 2018 the Financial Supervisory Authority (FSA) imposed amortisation requirements on mortgage loans for households with loan-to-value and/or loan-to-income ratios above certain thresholds (European Commission, 2019b, p. 35), with a view to curbing the growth in housing loans and indebtedness. According to preliminary assessments from the FSA (Finansinspektionen, 2019d), the stricter amortisation requirements helped limit the build-up in household debt. New mortgagors who were subject to the stricter amortisation requirement borrowed less and purchased less expensive homes than they would have done without the requirement. The FSA further found that the sharpened amortisation requirement did not significantly limit young households’ access to the housing market compared to other groups. Their access was affected, however, by the general increase in house prices (Finansinspektionen, 2019b).
However, the strong overall financial position would likely provide only limited cushioning in a disorderly deleveraging scenario. Income surpluses are high on average, but they are heavily skewed towards higher-income households (European Commission, 2018). Moreover, stressed scenarios assume that households are able to reduce their spending to near-subsistence levels. Thus, although most households may be able to continue servicing their debt even in a downturn, this would likely require a considerable fall in consumption with substantial knock-on effects on the rest of the economy.
A significant part of household financial wealth is illiquid, tied up in pension funds or life insurances. The Swedish gross household savings ratio is among the highest in the EU, partly due to considerable pension savings which outstripped the rise in household income in the last decade. The build-up in pension buffers reflects ageing but also the shift towards a pension system based on defined contributions in both the first and second pension pillars (Aspregren et al., 2019). However, correcting for pension contributions and capital formation the freely available savings that Swedish households have available to counter financial shocks do not appear to be particularly high in comparison to other EU countries with high gross household saving ratios (Graph 4.2.9). In addition, most non-housing financial assets are exposed to market risks and would likely fall in value in an economic downturn, weighing on consumption via wealth effects.
|
Graph 4.2.9:Household saving ratio, adjusted for net pension contributions and capital formation
|
|
|
|
Source: European Commission
|
Corporate debt developments
Following a period of post-crisis deleveraging, corporate debt growth has again picked up in recent years. Swedish non-financial corporations deleveraged significantly in the wake of the global financial crisis, as still positive net credit flows to the sector grew less than nominal GDP. The ratio of consolidated corporate debt bottomed out at around 106% of GDP in 2016, still well above the fundamentals based and prudential benchmarks and also well above the EU average. The increase in the debt ratio in 2017 reflected buoyant credit growth spurred by low interest rates in an environment of strong economic activity, supporting corporate investment. Thus, in 2017 the absolute size of credit flows to the nonfinancial corporate sector outpaced those to households for the first time since 2008. The recent cyclical weakening in economic activity led to a moderation in credit growth to nonfinancial corporations, which, however, kept outpacing nominal GDP growth. In recent years, commercial real estate has become an important driver of growth in credit to non-financial corporations. The debt-to-GDP ratio reached 113.9% at the end of the second quarter of 2019.
Overall, despite high corporate debt levels firms generally face limited risks of financial distress. Although Sweden’s corporate-debt-to-GDP ratio is high compared to other EU countries, other indicators show that financial risks are overall limited. Corporates have significant equity cushions, with a debt-to-equity ratio that is already at a quite low level (around 42 % as of Q2 2019, compared to about 60 % on average for EU countries) and continues to fall (Graph4.2.10). In addition, the gross corporate savings ratios remains high at around 13 % of GDP. Thus, on the whole the corporate sector is in a position to reduce leverage should that be needed. While some segments, such as commercial real estate (Section 4.2.1), appear more vulnerable, the financial stability concerns stemming from corporate debt seem limited.
|
Graph 4.2.10:Leverage, Non-Financial Corporations
|
|
|
|
Source: European Commission
|
4.3.
Labour market, education and social policies
4.3.1.Employment and skills
The labour market performs well, but the economic slowdown has a cooling effect. The employment rate grew in 2018 to 82.4%, maintaining one of the highest levels in the EU (EU average 73.2%). However, signs point to a slowdown in 2019, with employment declining to 82.1% in the second quarter of 2019. Employment levels vary between various socio-economic groups, from 60.5% among non-EU born women to 87.4% among native-born men. Temporary contracts are slightly more prevalent than on average in the EU (15.0%; EU average 14.1%). Labour shortages and skills mismatches persists, and the integration of foreign born into the labour market remains a key challenge.
Unemployment is slowly increasing, also for young people. While unemployment was below the EU average in 2018 (6.3%; EU average 6.8%), it was above the EU average in Q3-2019 at 6.9%. The main reasons for this increase were weak job growth and an increase in the labour force, with more people far from the labour market. Youth unemployment increased sharply from 17.4% in 2018 to 19.9% in Q3-2019. The rate of young people neither in education, employment nor training was among the lowest in the EU in 2018, at a rate of 6.1% (EU average 10.4%). However, this number has seen a decrease in 2019, falling to 5.5% in Q2-2019.
While long-term unemployment remains among the lowest in the EU, it is set to rise. It was at 1.1% in 2018, well below the EU average of 2.9%. The Public Employment Service (PES) predicts that long-term unemployment will reach its highest level since the 1990s in the coming years (Arbetsförmedlingen, 2019a). This is due to a weaker labour demand, increased structural transformation, the composition of the unemployed and fewer subsidised jobs. In the first half of 2019, for the first time since records began, more women than men were registered with the PES as unemployed for more than 12 months. The weakest development has been among foreign-born women lacking primary education.
Labour shortages persist, despite the economic slowdown. In the construction and services sectors shortages are the highest in the EU (European Commission, 2019d). In a survey 37% of private employers and 60% of public sector employers reported recruitment problems (Arbetsförmedlingen, 2019a). The PES expects a continued shortage in the coming years, despite the slowdown in the economy.
Shortages are particularly pronounced in education, health care, social work, ICT, industry and construction. Sweden has a high number of ICT specialists compared to other EU countries, at 6.6% of total employment. However, 5.4% of Swedish enterprises (EU 4.6%) report that it is hard to fill vacancies with specialist ICT skills. In the ICT sector, more than 50% of employers report a shortage affecting growth (Arbetsförmedlingen, 2019b). In the public sector, the shortage has declined from record high levels in 2017 due to the recruitment of more support positions. The labour shortage is also affected by the housing market. Almost one in five (19%) employers state that difficulties in finding accommodation affect the responsiveness to their recruitment offers (Svenskt Näringsliv, 2019).
Demand for people with low levels of qualification is very limited. The share of the population in elementary occupations is 5.4%, the lowest in the EU. The disparity between the employment rates of workers with primary, secondary and tertiary education remains high. In 2018, the employment rate of the low qualified was 62.3%, compared to 89% of people with tertiary education. The employment gap (19.2 percentage points (pps)) between non-EU-born and native-born for the low qualified is the second highest in the EU, and well above the EU average of 1.7 pps.
People with disabilities are also at a disadvantage. While their employment level of 52.6% (2017) is above the EU average of 50.6%, the employment gap between people with and without disabilities is wider than the EU average (30.9 pps vs EU average 24.2 pps). Their unemployment level, 20.3%, is also higher than among people without disabilities (4.7%, 20-64 years).
|
Graph 4.3.1:Employment rate by country of birth (20-64 yrs)
|
|
|
|
Source: European Commission
|
The employment rate of the foreign-born remains low. In 2018, the employment rate of non-EU-born, at 66.1%, above the EU average of 64.4%, but it was 20.2 pps lower than that of native-born Swedes. This is the largest gap in the EU (EU average 9.4 pps). The employment gap is 16.1 pps for the highly educated, which is also above the EU average (11.7 pps). The rate of over-qualification among 20-64 year-olds is much higher for non-EU-born (34.4%) than for native-born Swedes (12.2%), suggesting entry barriers for highly educated migrants to jobs for which they would be qualified. On average, 42% of 25-54 year-olds in Sweden who were not born in the EU have a high level of education, while 34% have a low level of education. To overcome potential barriers, a new ‘intensive introduction year’ within the establishment programme is being introduced. It will include training (such as social orientation, Swedish language training, and labour market education) and new measures (such as mentorships and certificates of knowledge documenting professional and language skills).
Among non-EU-born women, the employment gap is wider still. The employment rate of non-EU-born women is 60.5%, compared to 85.0% among the native born, due to both higher inactivity and unemployment. Non-EU-born women have an unemployment rate of 18.7% (3.9% among native-born women): this difference is the highest in the EU, pointing at a shortcoming in otherwise excellent performance on SDG5, ‘Gender equality’. While the activity rate of non-EU-born women is significantly higher than the EU average (73.9% vs 63.6%), it is still 13.7 pps below the rate among native-born women. Thus, foreign-born women are a particular focus of government and PES efforts. However, women with temporary residence permits are less likely to register with the PES for introduction activities than are women with permanent residence permits (Wickström Östervall, 2019).
The successful labour market integration of non-EU-born residents remains high on the political agenda. Sweden has a well-known tradition and track record of integrating newly arrived migrants into the society, which has contributed to social cohesion. Recent research (Calmfors and Gassen, 2019) comparing the integration experience across the Nordics concludes that an efficient policy response to ease barriers to entering the labour market consists of a mix covering education and training, active labour market policy, incentives through social benefits and appropriate wage levels. The authors argue that stronger efforts to educate could have a great potential to improve immigrants’ employment opportunities, and lifelong learning could be especially effective in the long run for non-EU-born women, the group that is farthest from the labour market today.
|
Graph 4.3.2:Employment rate by citizenship
|
|
|
|
Source: European Commission
|
|
Box 4.3.2: Monitoring performance in light of the European Pillar of Social Rights
The European Pillar of Social Rights is a compass for a renewed process of upward convergence towards better working and living conditions in the European Union. It sets out twenty essential principles and rights in the areas of equal opportunities and access to the labour market; fair working conditions; and social protection and inclusion.
Sweden performs well on most of the indicators of the Social Scoreboard supporting the European Pillar of Social Rights. The employment rate is among the highest and the gender employment gap among the lowest in the EU. The level of digital skills among the population is very high. The good overall results reflect Sweden’s advanced welfare model with an active labour market policy, robust social protection system, and long-standing and well-established social dialogue. However, increasing the labour market participation of the low skilled and foreign-born, in particular women, remains a challenge. While income inequality is below the EU average, it has increased in recent years.
There has been a sharp increase in the early school-leaving rate. While remaining slightly below the EU average, the share of early leavers from education and training has been growing since 2014, with a sharp increase in the past year. Students born abroad are more likely to leave school early. There is a continued rise in influence of the socio-economic background of students on their educational performance, as shown by the recent PISA results.
Sweden continues to improve its policies to facilitate labour market integration. The public employment services have long been implementing policies to make the labour market more inclusive and to encourage education and training. A new intensive year for newly arrived is being developed, which would combine existing measures with new targeted measures. The new measures will consist of a new form of internship, mentorship and a certificate of knowledge after the completed year. The measures used during the year would be adapted to individual, local and regional needs and conditions, and industry representatives and other stakeholders will play a role in developing them.
|
The government decided to reform the Public Employment Service. A complete reorganisation is envisioned by 2022. This schedule has already been revised, however, to ensure a continuous provision of services. Among other changes, job matching is to be carried out by independent contractors. The employment services will also intensify digitalisation, providing services via telephone, chat and video.
Vocational education and training in Sweden improves employability, but overall participation rates remain low. At 88.7% in 2018, the employment rate of recent training graduates is well above the EU average of 79.5%. Still, overall participation rates are lower than the EU average. Total enrolment in upper secondary vocational education and training in Sweden declined slightly in 2017 to 34.1% of all upper secondary pupils, below the EU average of 47.8%.
Participation in vocational education and training programmes increased, and continues to be supported. This includes measures to increase the quality and supply of work-based learning and apprenticeships, resulting in a 207% increase in the number of apprentices in upper secondary school VET between 2013-2014 and 2018-2019 (12,400 apprentices representing 12% of all learners in a national vocational education and training programme in 2018-19) (Cedefop, 2020). A state grant has been available till 2020 for the development of regional support structures for work-based learning placements for social partners and stakeholder organisations (a total of SEK 10 million, or about € 935,000, per year) (Cedefop, 2020).
Participation of adults in learning is generally high, and the government has made training of low-skilled people a priority. In 2018, 29.2% of adults participated in learning, well above the national Europe 2020 target of 15%, but slightly fewer than in the year before. The government and its parliamentary partners have agreed to expand opportunities for adults to participate in further education and training, and to make access to study loans easier.
The Swedish labour force has good digital skills. 81.6% of employees, self-employed and family workers and 94% of the unemployed have more than basic digital skills in Sweden, among the highest in the EU.
4.3.2.Social policies and healthcare
Sweden remains a relatively equal society, but is no longer among the top EU performers in income equality or low risk of poverty. Income inequality is below the EU average, as measured by the Gini coefficient (
): in 2018 it stood at 0.27 (EU average 0.31). The ratio of disposable income of the top 20% compared to the bottom 20% (S80/S20) was 4.13 in 2018, lower than the EU average of 5.17. However, Sweden stands out compared to other EU countries due to the continuously increasing income inequalities (Fritzell et al. 2014; Keeley 2015). The share of people at risk of poverty or social exclusion (18.0% in 2018) is below the EU average (21.9%). Still, the risk of poverty or social exclusion has been stable in Sweden in recent years, while on average steadily decreasing across the EU. The small increase from 2017 to 2018 was driven by higher monetary poverty (from 15.8% to 16.4%), severe material deprivation (from 1.1% to 1.6%) and people in very low work-intensity households (from 8.8% to 9.1%).
Vulnerable groups are more likely to be at risk of poverty or social exclusion. Among non-EU born adults, 41.1% are at risk of poverty or social exclusion, which is significantly more than among the native-born (12.9%). The risk of poverty or social exclusion for children 0-17 years old increased from 19.4% in 2017 to 20.6% in 2018, while it decreased on average across the EU. Educational background also has a marked impact on the risk of poverty. The low skilled have an in-work at-risk-of-poverty rate of 13.1%, substantially above the risk for medium- and high-skilled workers (6.4% and 4.8% respectively). People with disabilities are more likely to be at risk of poverty or social exclusion. This risk in Sweden is higher than the EU average (30.1%; EU average 29.3%), and the gap between people with and without disabilities is very wide compared with the EU average (14.7 pps; EU average 10.3 pps).
|
Graph 4.3.3:At-risk-of-poverty or social exclusion rate and its components (AROP, SMD, LWI)
|
|
|
|
Source: European Commission
|
The demand for affordable housing is growing. In 2019, 240 municipalities (of 290) had a housing shortage, particularly for low-income households in the rental sector (Boverket, 2019). 221 municipalities also reported a shortage of housing for newly arrived migrants (particularly refugees). While Sweden does not have social housing as such, in special cases the social services may be obliged to provide housing as social assistance (emergency and more long-term housing solutions). Families with children and young people aged 18-29 with a low income, pensioners and people receiving activity assistance (
) or sickness assistance can apply for housing benefit. According to the Skåne County Administrative Board (2018) older people with care needs, pensioners with a minimum pension, youth and young adults, students and newly arrived migrants find it more and more difficult to either enter the ordinary housing market or have the financial means to keep their housing.
The lack of affordable housing is a driver behind the increase in homelessness and housing exclusion. In the latest count about 33, 250 people lacked a permanent abode in Sweden (National Board of Health and Welfare, 2017). Almost 50% of these were in long-term housing arrangements (for instance municipal social contracts), whereas 650 people were acutely homeless, sleeping outdoors or in public spaces. The number of homeless people doubled between the first homelessness count in 1993 and the most recent one in 2017. An increasing number of homeless people are aged 65 or older, women (38% in 2017 vs 17% in 1993) and people with a migrant background (43% in 2017 vs 23% in 1993).
Sweden has a good, tax-funded and generally effective healthcare system with a strong focus on outpatient and long-term care. Total healthcare spending as a share of GDP is higher than the EU average (11.0 %; EU average 9.8%). The share of health component in long-term care spending is also significantly higher than the EU average (26%; EU average 15.7%). Ageing and disease patterns in the coming decades might exert pressures on spending, mainly public spending on long-term care, which is already above the EU average (3.2%; EU average 1.6%). Life expectancy at birth is one of the highest in the EU (82.4 years; EU average 81.0). Mortality rates of preventable and treatable causes are low, and most Swedes report being in good health (77%; EU average 70%), with a substantial gap in self-rated health by socioeconomic status: in the top 20% income bracket 89% of people report good health, compared with 67% of those in the bottom 20% income bracket.
The healthcare system is generally good. However, steps to address and improve access to care (better treatment guarantees in primary care) and ‘patient contracts’ (a coherent map of planned care) are being rolled-out. Total unmet medical care needs and out-of-pocket payments are below the EU average, showing Sweden’s good performance on SDG3, ‘Good health and well-being’.
More than one third of all deaths in Sweden can be attributed to behavioural risk factors (dietary risks, alcohol consumption and low physical activity). The obesity rate among adults has increased, but remains below the EU average. Cancer screening is still not fully rolled out, despite high coverage rates for mammography and cervical cancer screening (Cancerfonden, 2019). A national cancer strategy (and new investments) is being planned, focusing on quality and equity in treatment and targets for prevention and early detection.
Waiting times for health services are still high and have significant regional differences. The situation in urban areas has slightly improved, but there are still areas where waiting times are much higher than the national average (SALAR, 2018). Despite high numbers (above EU average, (OECD/EU, 2019)) of doctors and nurses (whose tasks in primary care have gradually expanded to prescribing and care coordination), healthcare employers still report a need to increase their staff numbers. The availability of healthcare professionals varies across the country and access to care is still influenced by the cumbersome recruitment situation in a number of health professions (the proportion of ‘outsourced doctors’ is highest in primary health care and in psychiatry).
Reforms are planned for primary care. The reforms hope to attract and train advanced practice and specialist nurses and to reduce waiting times for elective surgery. A coordination body responsible for long-term planning of health personnel and skills supply will be put in place (Government of Sweden, 2019).
Shortcomings in care coordination at different levels are still present. Half of patients reported experiencing a coordination gap in hospital discharge planning (OECD/EU, 2019). Legislation to promote more timely discharge is in place but cooperation between various actors (regions, municipalities) has to be further improved.
4.3.3.Education
The Swedish education system is well-funded and offers overall satisfactory results, but increasing gaps are a challenge. Between 2009 and 2018, the number of students with a migrant background nearly doubled, challenging the capacity of the education system to cater for the needs of all learners. Schools with many students with a migrant background perform worse than is the EU average for such schools (OECD, 2019b). Socio-economic factors also play a role, with increasing income inequality and housing market inefficiencies.
Participation in early childhood education and care (ECEC) is widespread, and steps are being taken to further improve its quality. The participation rate in ECEC for children up to 3 years old is one of the highest in the EU (49.4%) and, for children over 3 it is above the EU average (96.3%; EU average 95.4%) (European Commission, 2019d). As of autumn 2019, a new curriculum aims to strengthen the focus on learning, in particular reading, Swedish and digital skills, and supports integration and equality. Since autumn 2018, the pre-school class (age 6) has formally been compulsory. Pre-school directors now need to have the same qualifications as school directors to increase the quality of instruction.
The shortage of teachers remains a challenge, despite measures taken. Reflecting recent downward revisions in migration estimates, the projected teachers’ shortfall for 2033 stand at 45,000, still a substantial figure, corresponding to 21% of the current teacher population (Skolverket, 2019). The shortage of teachers reflects both external factors, such as demographic growth and the large recent influx of migrants, including a large proportion of school-age children, and profession-specific problems, such as 40% of teachers being over 50 years old and on relatively low salaries (European Commission, 2019d). While the ‘Boost for Teachers’ Salaries’ scheme has increased the salaries of one in three teachers, it has also created inequalities and divisions among teachers, and it has not sufficiently improved the profession’s image.
A high workload, work-related stress and health issues are affecting the teacher shortages. Many teachers are leaving the profession and the share of teachers receiving unemployment benefits increased by 14% in 2018 (Arevik, 2019; Lärarnas riksförbund, 2019a). Despite earlier measures, there has been no clear improvement. The government is therefore trying to reduce the burden on teachers by financing more teacher assistants to handle administrative and other non-teaching tasks. The budget for 2020 has announced a continuation of the Boost for Teachers programme, targeted programmes for special needs and vocational teachers and additional training of school leaders. (Regeringen, 2019c). In 2017/2018, almost 20% of teachers in compulsory and upper secondary schools had no formal teacher education (European Commission, 2019d), and an inquiry is now looking into how to increase quality of teacher training and make it easier for people to become teachers (Regeringen, 2019c).
Sweden is among the EU countries with the highest expenditure on education. In 2017, general government expenditure on education was among the highest in the EU both as a proportion of GDP (6.8%; EU 4.6%) and as a proportion of total general government expenditure (13.7%; EU 10.2%). The school-age population is expected to grow by 12.3% between 2020 and 2030, and by 17.8% by 2040, one of the highest rates of growth in the EU, suggesting that continued high investment in education will be needed (
) (European Commission, 2019d).
Swedish pupils score well in basic skills. The OECD’s Programme for International Skills Assessment (PISA) shows that pupils’ performance in basic skills in Sweden, after a period of deterioration in mathematics and science, has now improved and is better than the EU average in all three skills (
). The performance of top achievers in mathematics and reading has also improved, and in reading is among the best in the EU (13.3% of top performers compared to 8.9%) (OECD, 2019b). The improvement suggests that the educational reforms introduced in recent years are bearing fruit, and is a clear sign of good performance on SDG4, ‘Quality education’.
The Swedish education system has traditionally been equitable, but inequality is rising. An education reform in the 1990s brought about a decentralisation of education (resulting in inequality of funding across municipalities) and introduced school choice and competition among schools (
). This led to widening inequalities across pupils and schools (OECD, 2019c). According to PISA 2018, the average performance of learners with a migrant background in reading is 83 points worse than that of native students, the second biggest difference in the EU. This gap has significantly increased since 2015, when it stood at 60 points. As a result, learners with a migrant background are three times more likely to underperform in reading than their peers with a native background (OECD, 2019b).
Efforts are being made to reduce inequality between schools and to improve the quality of compulsory education. Learners with a migrant background are concentrated in relatively few municipalities, often in socio-economically challenged areas. The government is directing additional funding to these municipalities, seeking to reduce the differences and improve teaching quality (SOU, 2017). There are also introductory programmes, offered at different educational levels, with strengthened language teaching for pupils with a migrant background. Currently, these programmes are offered from pre-school (ECEC) to facilitate integration. The National Agency for Education has proposed changes to the syllabus, to make it clearer and simpler and to emphasise teaching of factual knowledge in earlier years, adapting content to grades (Fredriksson, 2019). Three inquiries are ongoing to address inequality and educational quality. They will analyse the rules of admission to compulsory school, grade inflation (
) (Regeringen, 2019c), and the learning environment in after-school centres (Regeringen, 2019b).
Early school leaving has continuously risen in the last decade. It stands at 9.3%, below the EU average of 10.6%, but higher than the national Europe 2020 target of 7%. The difference between native-born pupils (7.3%) and those born abroad (17.7%) is wide and growing, mainly linked to the difficulty of integration among school-age migrants arriving late in the course of compulsory education, from weaker educational systems. Building on earlier projects by the Swedish Association of Local Authorities and Regions, Uppdrag fullföljd utbildning (Preventing early school leaving) project aims to produce a national strategy against early school leaving (SALAR, 2019a).
The education system is one of the most digitalised in the EU. Programming is part of the national curriculum and national tests are being digitalised. A digital strategy for schools has been in place since 2017, and an action plan was launched in March 2019, but its implementation is slow, casting doubt on whether the goals of the strategy can be achieved as planned by 2022. The share of young people aged 16–19 with above-basic digital skills is higher than the EU average (68%; EU average 57%). However, this group reports that overuse of digital technologies prevents them from doing homework and severely reduces reading (Statens Medieråd (Swedish Media Council), 2019).
The tertiary attainment rate and the graduate employment rate are among the highest in the EU, but there are shortages for some categories of graduates. Sweden has one of the highest tertiary educational attainment rates in the EU (52% in 2018) (European Commission, 2019d) and graduates easily find employment (92.5% in 2018, among the highest in the EU). However, the proportion of students studying natural sciences, mathematics and statistics is very low, which could be linked to a weaker performance of the school system in the past. In addition, there are shortages of graduates in teaching, medicine, nursing and ICT.
4.4. Competitiveness, reforms and investment
4.4.1.Productivity AND INVESTMENT
Productivity Developments
Similar to other developed countries, Sweden’s labour productivity growth (
) rate has deteriorated in recent years. Labour productivity growth in the business sector increased two decades ago following labour and product market reforms (Heyman et al., 2019). In line with international developments, average productivity growth has been falling gradually since 2007 (Graph 4.4.1). The average quarterly growth rate of labour productivity in Sweden fell from around 1.5% in 2010 to 0.4% in late 2018. As productivity growth is a crucial component of prosperity, it is important to understand the drivers behind the recent slowdown.
|
Graph 4.4.1:Labour productivity in the business sector in SEK per hour worked
|
|
|
|
Source: Statistics Sweden
|
The slowdown in productivity growth came in particular from manufacturing and a shift to services and construction. Productivity growth in manufacturing fell from an average quarterly growth rate of 1.4% in the 1990s to 0.2% after the crisis. The shrinking size and productivity of the electronics and communications equipment sector account for most of the lower productivity performance of manufacturing after 2007. In addition, there has been a reallocation of labour from manufacturing to the services and construction sectors, which have relatively lower productivity (Graph 4.4.2). This shift has contributed to the stagnation of productivity growth. Still, productivity growth has been outstanding in some services sectors such as computer programming, consultancy and related activities and information services making up for the drop in productivity in manufacturing.
|
Graph 4.4.2:Labour productivity and hours worked by sector 2001-2018 - changes between 2001 and 2018 (1)
|
|
|
|
Source: Statistics Sweden
|
Drivers of labour productivity growth
Growth accounting suggests that lower capital deepening and total factor productivity growth have been behind the productivity slowdown. Productivity growth can be divided into three components: changes in the input of capital per unit of labour (capital deepening), variations in labour quality and effects on total output not caused by changes in the inputs capital and labour (total factor productivity). Breaking down productivity growth shows a significant fall in capital deepening and total factor productivity in 2011-2017 compared to earlier periods (Table 4.4.1).
|
|
|
Table 4.4.1:Contributions to productivity growth in the business sector
|
|
|
|
Source: Swedish National Institute of Economic Research
|
|
|
Hours worked increased faster than investment, lowering capital deepening. The availability of physical capital per unit of labour has fallen, reducing its contribution to labour productivity growth from 1.1% in 1997-2007 to just 0.2% at present. This is the result of a lower rate of physical capital accumulation and the increase in the number of hours worked in the market sector (about 25% in 2018 with respect to 2001). Physical non-ICT capital has been a consistent contributor to productivity growth throughout the whole period, but its importance has decreased since the crisis. Intangible assets like R&D and software have been an important driver for productivity growth in Sweden, albeit to a lesser extent recently.
The quality of labour was a major driver of productivity growth before the crisis but its contribution is now moderate. The indicators of labour quality peaked even before the crisis had set in. It has become negative recently, especially in some manufacturing activities (
). The average contribution of labour quality to total factor productivity was 0.3% on average per year in 1997-2007, falling to 0.2% in the crisis years and to 0.1% between 2011 and 2017 (Table 4.4.1). Education levels of younger workers (25- 34 years old) have increased in the last 20 years, but there are some disappointing recent results for particular parts of the population (see Section 4.3.3). The lower education level of the non-EU-born labour force, and their increasing share, has lowered the contribution of labour quality to productivity growth.
Total factor productivity (TFP) growth has been falling in recent years. TFP measures overall efficiency in the combination of inputs and it is often associated with innovation and intangible assets such as brands, organisational capital, management practices and other horizontal factors having a cross-cutting impact on efficiency. TFP was the main driver of labour productivity before the crisis, but it contributed much less between 2011 and 2017 (Table 4.4.1), similar to other developed countries. Shortcomings could be related to the process of technological diffusion, since it seems that new technologies benefit technological leaders much more than the bulk of industry.
Reviving productivity growth
Addressing the productivity gap between small and large firms could improve productivity. In Sweden as in most EU Member States, small firms on average have lower productivity than large ones. While there are many reasons why such a gap may exist (
), the difference has recently widened (Andrews et al, 2016). This suggests that policies supporting the adaption of new technologies by small firms, facilitating business dynamism and adequate skills of the workforce could play an important role in fostering productivity growth.
Sweden encourages SMEs to embrace new technologies faster. Only 4.4% of large enterprises have very low digital intensity compared to 22.3% of SMEs. Moreover, only 22.5% of SMEs provide training for their staff to develop or upgrade their ICT skills compared to 74.5% in large companies. SMEs and their managements need to become more aware of the advantages of digital technologies and speed up their adoption (OECD, 2019c). The Swedish smart industry strategy supports the digital transformation of SMEs with, for example, vouchers for consultancy services (€10.7 million). The government has also provided €1.46 million for digital skills for SMEs’ management teams.
Business dynamics could also affect productivity performance in Sweden. Heyman et al. (2018) have shown that the entry of new firms has a positive impact on employment creation, while productivity growth mainly comes from large and established firms. However, there is no clear conclusion on the net impact of entry/exit on productivity in Sweden. A horizontal study conducted for a number of EU Member States (Bauer, 2019) suggests that net entry and the subsequent reallocation of resources have a small but positive impact on productivity in the services sectors (just above 1%). Thus, increasing Sweden’s very low entry rate (see Section 4.4.4) could have a positive impact on productivity.
Specific sectors will be crucial for productivity growth in the near future. The transport vehicles sector has been a key contributor to the Swedish economy in recent years. Against the backdrop of climate change, the sector is facing technological and global market challenges. Considerable investments are underway in Sweden to improve the competitiveness of Swedish manufacturers involved in the automobile supply chain, especially for the production of batteries. The “computer programming” sector is highly dynamic and has taken the relay from the “computers and electronic equipment sector as a leading contributor to productivity growth. The construction sector is one of the few sectors with labour productivity below the EU average and has been attracting resources due to increasing demand, which has reduced overall productivity growth. Increasing competition could help reverse this trend (see Section 4.2.2).
Embracing new technology has the potential to improve productivity in the long term. Artificial intelligence and robotics are widely expected to have a strong impact on societies and economies. While it is uncertain how and when current research will be converted into widely used technology that improves productivity, it is important to follow developments closely. The Swedish government adopted a roadmap for artificial intelligence in 2018, which aims to improve welfare and competitiveness and make the country a world leader in the field. The roadmap focuses on education, research, innovation, and frameworks and infrastructure. The Swedish Innovation Agency will invest €100 million over the next 10 years in AI-related projects. This matches the investment made by the Wallenberg foundation. In June 2019, the government announced an investment of SEK 40 million in professional education in AI.
The successful deployment of 5G in Sweden depends on the timely availability and assignment of the 5G pioneer bands. While part of the 700 MHz band was assigned last year, decisions are pending for the use of the reserved 2×10 MHz spectrum block and the unsold 20 MHz spectrum block. The 3.6 GHz band auction was postponed indefinitely to consider national security issues concerning 5G roll out.
Investment
Investment increased steadily, but it is expected to decline in 2019 and 2020. Although the contribution of private business investment to gross capital formation is significantly higher in Sweden than in the EU-28 (see Graph 4.4.3), recent surveys indicate a decline in investment. According to the European Investment Bank (2019), the share of firms intending to reduce investments in 2019 exceeded those expecting an increase. Participants saw a worsening economic climate and a lack of skilled workers as the main obstacles holding back investment. The survey from Statistics Sweden (2019) suggests that these factors will also prevail in 2020.
|
Graph 4.4.3:Investment as share of GDP by institutional sector - EU 28 and Sweden
|
|
|
|
Source: European Commission
|
|
Box 4.4.3: The dynamics of labour productivity
During Sweden’s current economic expansion labour productivity has become more pro-cyclical. Sweden’s economy outperformed the EU over the past decade, with particularly strong investment growth. At the same time, the country’s productivity growth has slowed. An important difference compared with earlier cycles has been the behaviour of employment, which has grown almost steadily since 2007 regardless of the cycle. Because employment growth has been less sensitive to the cycle, the cyclicality of gross value added per hour worked (that is labour productivity) has increased compared to earlier cycles (see Graph 1).
Structural shifts between and within sectors have determined productivity patterns in this cycle but not all of it is permanent. The services sector has increased its relative importance in the economy at the expense of manufacturing (see Section 4.4.1), which is likely a lasting shift. Services’ labour productivity has been more pro-cyclical in the past decade, until recently. In the current cycle, an increase in pro-cyclical construction activity has had an important imprint on productivity’s cyclicality as well. This is more likely to have been an exceptional feature of the recent boom. Manufacturing, on the other hand, has lost share in the economy and saw somewhat less cyclical behaviour of productivity growth. With labour shortages and increasing skills scarcity, firms seem more cautious about shedding labour after the crisis. This has mostly benefited the better-educated (with at least secondary education). It also offered opportunities to more marginal groups to enter the labour market, but likely in return for lower wages and higher job uncertainty.

The recent loss in economic momentum will put the new productivity and labour market dynamics to the test. Since the early 1990, a dichotomy has opened up in the Swedish labour market, as in other Member States. The 20% of the workforce earning the lowest wages has had to accept more limited wage growth than other groups while also facing lower employment growth (see Section 1). They, therefore, seem to be most at risk of job losses as output growth slows. Lower employment protection for temporary workers is likely to require higher flexibility from these workers. Additionally, labour hoarding has been increasingly associated with business churn (Bauer, 2019) i.e. the entry and exit of firms. In the event of a prolonged downturn, the new preference for labour hoarding could result in firms exiting the market instead of restructuring. Policy will have to anticipate these factors (see Section 4.3) in order to keep up employment and structurally raise productivity growth. Education, integration and a fostering environment for innovation are needed to achieve this.
|
The allocation of capital and labour across sectors has followed similar patterns. Investment data show a shift of capital flows away from manufacturing towards services. In 1996, services accounted for 50% of all business investment against 37% in manufacturing. At the end of 2018, the share of services was up to almost 70% and manufacturing had fallen to less than 20%. In the services sector, real estate accounts for a hefty and stable share of investment (around 38%).
Business investment is highly concentrated in the main exporting sectors. Transport equipment accounts for 35% of total manufacturing in investment, followed by machinery with 15%. The capital-labour ratio increased threefold between 1995 and 2015 in the transport sector, probably due to the higher density of robots. Transport equipment and machinery are currently the top export sector and both are quite sensitive to changes in foreign demand for their products.
|
Graph 4.4.4:Investment in intangible capital assets
|
|
|
|
Source: Klems 2019
|
Investment in intangible capital assets has increased. The relative importance of these assets is higher than in the EU average, amounting to approximately two thirds of the total investment in assets accounted for (see Graph 4.4.4). Design and other product developments are the main asset types, followed by purchased organisational capital. In both cases, there has been a sharp upswing in the volume of investments, resulting in a relatively higher importance of intangibles as productivity drivers.
Sweden has a vibrant and fast-growing venture capital market, especially in high-tech. According to Atomico (2019), Sweden is the fourth Member State after the UK, Germany and France by stock of capital in deep tech companies in 2019, with over €3 billion since 2015. It hosts Northvolt, which collected the biggest venture-capital backed funding deal in Europe in 2019, of approximately € 1 billion.
Investment in Research and Development
Sweden invests considerable resources in R&D and continues to be one of the most innovative economies in the EU. The country has been the top performer in the European Innovation Scoreboard since 2011 and has further increased its performance over time. It benefits from an innovation-friendly environment, highly skilled workers, attractive research systems and internationally competitive and innovative large companies. With 3.3% of GDP allocated to R&D in 2018, Sweden has the highest R&D spending in the EU. It has the highest business spending on R&D (2018: 2.35% of GDP) and the second highest public spending on R&D (2018: 0.96% of GDP) in the EU. Sweden’s national goal for R&D expenditure in relation to GDP amounts to around 4% by 2020. Addressing these challenges would lead to progress on SDG 9.
Sustaining a high quality public research base is essential to keep the Swedish knowledge economy competitive. Sweden has the second highest number of scientific publications in relation to population in the EU (
). A strong increase in international scientific co-publications since 2011 has not led to an increase in scientific impact, however (
). The number of new doctoral graduates (
) has fallen over the past 7 years (European Commission, 2019e; Swedish Research Council, 2019). In 2019, the government launched a public enquiry (Steering and resource distribution of universities, STRUT) into a possible reform of government control and allocation of resources to higher education institutions (SOU, 2019a). The new Swedish research bill, with priorities and focuses for the next four years, is currently being prepared and will be presented in autumn 2020.
A sufficient supply of talent is essential to maintain Sweden’s high innovation performance. A key challenge for SMEs in 2018 was the availability of skilled staff (European Commission/European Central Bank, 2019). Among Sweden’s most R&D intensive companies, 4 out of 10 consider it difficult to recruit R&D personnel, and more than a third respond that it has become more difficult than 5 years ago. (Royal Swedish Academy of Engineering Sciences, 2019, see Section 4.3.2). A shortage of highly skilled personnel in science, technology and engineering might hamper investment in R&D and ultimately affect innovation performance.
Exploiting the full potential of SMEs can broaden and strengthen Sweden’s innovation performance. So far, innovation has relied on a limited number of large and globally competitive companies. However, the innovation performance of SMEs has decreased since 2011 and could improve. SMEs could benefit from stronger collaboration between academia and the business sector. Although there are close links between the business sector and public sector researchers, which result in academic publications, the co-funding of public R&D expenditure has decreased in recent years, with Sweden ranked 8th in the EU (European Commission, 2019e). This shows further potential for privately co-funded university and government R&D to support the research needs of the business sector.
Green investments
Identifying investment needs and securing adequate funding will be key to delivering on Sweden’s ambitious climate and energy objectives and transforming the Swedish economy to become sustainable and climate neutral by 2045 (see Section 4.5). Sweden will also need to support the decarbonisation of the economy using ambitious policies to promote innovation and competitiveness. The final Swedish national energy and climate plan (Regeringen, 2020), which is to be assessed by the European Commission, presents investment needs in electricity production and infrastructure. Recent initiatives for long-term investments have focused on decarbonising energy-intensive industrial sectors and making transport sustainable by upgrading the different transport modes, in particular railways. The government’s budget for 2020 includes a number of measures for additional support to renewable energy and charging infrastructure for electric vehicles in rural areas.
Swedish firms invest relatively more in energy efficiency. The percentage of investment in energy efficiency in 2019 was higher than the EU average (14% compared to 10%). As a result, the share of building stock meeting high energy efficiency standards was 31%, up 2 pps with respect to 2018. In parallel, energy audits increased as well, with 50% of firms having done an energy audit in the last 3 years.
Investment in transport infrastructure
The government’s 73-point programme reiterates investment needs in transport infrastructure. Following the September 2018 parliamentary elections, the new government confirmed the national plan for infrastructure 2018-2029 with substantial investments. The plan anticipates total spending of SEK 700 billion, including maintenance of rail tracks and investments in new railways (see European Commission, 2019f). If this is implemented as planned, in the next 12 years the state will invest three times more in new rail infrastructure than in new roads, which could shift transport from road (currently 86%) to rail (currently 10%). In addition, the charging infrastructure for electrical vehicles should get more attention to prepare the ground for the intended ban on the sale of new petrol and diesel cars from 2030. The government has proposed SEK 50 million over 3 years and has set up an electrification commission to develop an action plan for the electrification of the most trafficked roads.
4.4.2.SINGLE MARKET INTEGRATION AND SERVICES SECTOR
Energy system
Sweden has a dynamic and competitive energy wholesale market. The wholesale electricity market is fully liberalised and competition benefits from good connectivity to both the Nordic market and other European countries. In addition, a well-designed model of price zones does not unduly limit cross-border flows. Sweden also has a well-functioning, albeit small gas market, which is supplied by one route from Denmark.
|
Box 4.4.4: Investment challenges and reforms in Sweden
Macroeconomic perspective
Total investment as % of GDP was above the EU average over the past decade. Both private and public investment have grown faster than GDP and the EU average. Private investment is set to fall in 2019 and 2020, as equipment investment is affected by the cyclical slowdown and residential investment adjusts to lower levels due to lagged effects of the 2017 housing market weakness. Public investment in housing, healthcare and education infrastructure is set to have remained robust overall in 2019.
Assessment of barriers to investment and ongoing reforms
Barriers to investment in Sweden are overall low (European Commission, 2019e), but scope remains for measures in tackling barriers to construction (see Section 4.2.2) and in research and innovation (see Section 4.4.1) and construction investment. .
Several institutions promote access to finance for early-stage companies and SMEs (European Commission, 2019). The EU supports investment in Sweden also via the European Fund for Strategic Investments (EFSI). By October 2019 total financing under the EFSI amounted to € 2.3 billion, intended to trigger € 8 billion in additional investments. The current experience with the EU financial instruments and the EFSI budgetary guarantee demonstrated a need for simplification, streamlining and better coordination of the EU’s investment support instruments during the next (2021-2027) programming period, including by increasing complementarity between support at EU level and that at national/regional level. By the end of 2020, EFSI and other EU financial instruments will come under the roof of the new InvestEU programme that promotes a more coherent approach to financing EU policy objectives and increases the choice of policy implementation options and implementing partners to tackle country specific market failures and investment gaps. In addition, under InvestEU, Member States can set-up a national compartment by allocating up to 5% of their structural funds to underpin additional guarantee instruments supporting the financing of investments with a higher degree of adaptation to local conditions. InvestEU will be policy-driven and focus on four main areas: Sustainable Infrastructure, Research, Innovation, and Digitisation, Small Businesses, and Social Investment and Skills.
|
Market concentration of power generation is below the EU average and has been falling over the last decade, ensuring competitive pricing. Wholesale electricity prices are among the lowest in the EU, although they are subject to unpredictable price swings driven by hydrological developments, due to the importance of hydropower in Sweden’s overall generation capacity.
The retail electricity market remains competitive, with a large number of suppliers. For a mature market (the Swedish electricity market was liberalised in 1996), consumers’ supplier switching rates are healthy (9.7% per year in 2017) due to strong competition among suppliers. Smart meters also support competition and should facilitate the uptake of new energy services, such as demand response aggregation. As a result, retail electricity price developments tend to be mainly driven by network charges. Due to investments to modernise the grid and accommodate an increased share of wind power these charges have increased recently and are among the highest in the EU for household customers.
4.4.3.REGIONAL DIfferences AND INFRASTRUCTURE
Sweden’s regional prosperity is at or above the EU average, but challenges lie ahead. In 2017, GDP per head (in purchasing power parity) was above the EU average in all regions except for North-Central Sweden, where it is just below the average (European Commission, 2019e). While all regions benefited from economic growth, prosperity gains were higher in the urban areas around Stockholm, Gothenburg and Malmö, slightly widening regional disparities (see European Commission, 2019e, p.50). Over the coming decade, demographic developments are set to pose challenges for most regions. The number of people over 80 years old will rise by 47% and those younger than 20 by 10%. At the same, the population in employment and paying taxes is set to grow at only 6%. These diverging trends result in higher expenditure for elderly care, schooling and healthcare, while tax revenues remain rather stable, opening up an estimated financing need of more than SEK 60 billion a year (SALAR, 2019b).
Differences between urban centres and regions also exist in productivity and innovation. Similar disparities as for GDP per head are present in other economic dimensions. Productivity growth was higher in larger city regions with Stockholm well ahead, whereas North-Central Sweden, East-Central Sweden, Upper Norrland and Middle Norrland had low or even negative productivity growth (
) (Eurostat 2017). The larger city regions are all innovation leaders, with an innovation performance of 130%-155% of the EU average in 2018. The other regions are strong innovators (with a performance of 91%-115%), except for Mellersta Norrland, the only moderate innovator, with (89%).
Sweden uses regional smart specialisation strategies and intends to coordinate rural and regional policy better. Eighteen strategies are already in place, supported by the ERDF. The strategies focus on regions’ comparative advantages to foster growth and innovation. Every region will need such a strategy to fulfil the enabling conditions for the upcoming ERDF programming period. In addition, the government announced in its 2020 budget bill that it wants to strengthen the innovation capacity of counties. Regional development strategies including innovation or smart specialisation should interact with national and international strategies and actions.
Transport infrastructure
Improving Sweden’s transport infrastructure and making it climate friendly is a key challenge. Among EU Member States, Sweden ranks 13th on infrastructure in the Global Competitiveness Report (World Economic Forum, 2019), with rail infrastructure at only 25th. Planned investment in rail infrastructure and waterways is important to facilitate a modal split in transport and to deliver on Sweden’s ambitious climate objective (see Section 4.5). The objective is to decrease emissions from domestic transport (except aviation) by at least 70% by 2030 from 2010 levels, so a comprehensive and relatively fast transformation of the fleet to low emissions vehicles is on the political agenda. The government has introduced a new climate bonus for electric lorries and electric working machines, merged it with the existing electric bus bonus and boosted the common funding by SEK 20 million for 2020, bringing it to SEK 120 million. In addition, the eco-bonus system to promote a shift of goods transports from road to ship is being prolonged, with SEK 50 million per year until 2022. Sweden’s maritime transport sector is also preparing to end the use of fossil fuels domestically by 2045, in line with the national climate objectives.
The government has launched several public inquiries and initiatives to further enhance energy efficiency in the transport sector. To facilitate public transport within and between regions an inquiry was launched, running until April 2020, which is looking into necessary requirements for introducing a national ticketing system for all public transport. As a follow-up to the national action plan for promoting domestic shipping presented by the Swedish Transport Administration (Trafikverket) in May 2019, the government agency Transport Analysis (Trafikanalys) has to evaluate the implementation each year until 2022. The agency is also looking into how e-commerce could become more efficient and sustainable. The Swedish Transport Administration has until 30 April 2020 to investigate what would be required to procure daily night trains from Sweden to several European cities.
Broadband
Sweden is a front-runner for ultrafast connectivity and has a competitive telecoms market, but it might miss its broadband targets. 84% of Swedish households had access to ultrafast broadband of 100 Mbps in 2018. The goal is to reach 95% coverage by 2020. 86% had access to 30 Mbps, and the goal here is to reach 98% coverage by 2025. To reach these targets roll-out in sparsely populated areas needs to speed up. For the next three years, the Swedish government has allocated SEK 650 million for broadband development, but the Swedish Post and Telecom Authority (PTS) estimates that additional investment of SEK 22 billion is required to achieve the 2025 target. The PTS is designing a new model for state support to broadband expansion. Public actors will set priorities about areas in need of support and the development will be exposed to competition.
4.4.4.Institutional quality and governance
Business Environment
Sweden has a favourable business environment. The country ranked 10th in the World Bank’s Ease of Doing Business 2020 Indicators. It scores particularly high in obtaining electricity and the registration of property, but less so in getting credit, enforcement of contracts and starting a business. Companies, including SMEs, benefit from good access to finance (European Commission, 2020b). Shortcomings are related to the availability of skilled labour and the processing of work permit extensions for highly skilled non-EU professionals, which is still slow, despite some improvements.
Starting a new business is relatively easy, further facilitated by lowered minimum capital requirements. The number of procedures and the administrative burden involved when opening a new business are below the EU average. The minimum permissible share capital to start a private limited company was reduced from SEK 50,000 to SEK 25,000. This measure should help foster entrepreneurship, competition and market dynamism.
Despite the favourable business environment, the rate of market entry and creation of new firms is relatively low. Sweden has one of the lowest percentages of new firms created every year divided by the total number of incumbent firms – the ‘business birth rate’ – in the EU. This rate has remained stable at around 7% in past 10 years, and fell to 6.6% in 2017 (
), below the levels of the crisis period. The birth rate is also comparatively low in the services sector, where more new businesses are created (6.8%, compared to 12% in Denmark and 10% in Finland).
|
Graph 4.4.5:Business birth rates
|
|
|
|
Source: European Commission
|
Entrepreneurship as a career has become less attractive. The Global Entrepreneurship Monitor (2019) has highlighted the fall of entrepreneurship activity in Sweden since 2013, especially among women. It indicates that while there is a perception of abundant business opportunities, the motivation to start up a new company is decreasing. For the first time in the past fifteen years, less than 50% of the surveyed population consider entrepreneurship as an attractive career choice.
The public sector is digitally mature, but there is room for improvement on open data and the reuse of public data. E-government services are widespread in Sweden with 93% of internet users able to submit forms online. However, the country achieved only 52% of the maximum score on open data in 2018. The new agency for digital government (DIGG), set up in 2018, has the objective of increasing the use of data by the public administration. It has not yet implemented any changes. To advance, a focus on data as a strategic resource and better leadership might be required, together with work on trust and accessibility in digital services. This and the good conditions for using data could build citizen-related services, analyse complex societal changes and promote digital innovation.
4.5.
Environmental sustainability
Leading towards carbon neutrality
Sweden has experienced high growth while lowering greenhouse gas emissions. Sweden is among the EU Member States with the lowest per capita greenhouse gas (GHG) emissions (Graph 4.5.1). Between 1990 and 2017, Sweden’s GHG emissions fell by 26%, while it’s per capita GDP increased by 54%. Over this period, the decline in CO2 emissions per capita GDP outpaced the EU’s average.
|
Graph 4.5.1:The ten EU countries with the lowest greenhouse gas emissions in 2017
|
|
|
|
Source: European Commission
|
A significant price on carbon dioxide emissions has been a key feature of Swedish climate policy. The carbon tax was SEK 250 when introduced in 1991 and reached SEK 1,180 in 2017, a real increase of 233%. It is levied on fossil fuels and determined by their carbon content (see Section 4.1 for tax exemptions and subsidies). The carbon tax covers about 40% of Swedish greenhouse gas emissions (World Bank, 2019). It is not applied to the sectors falling under the EU ETS. A high carbon tax has helped reduce greenhouse gas emissions without stopping the Swedish economy from growing faster than most other EU Member States with lower carbon taxes (Graph 4.5.2 and Andersson, 2019).
|
Graph 4.5.2:Greenhouse gas emissions, carbon taxes and economic growth
|
|
|
|
Source: World Bank, European Commission
|
Sweden has the highest share of renewables in energy consumption in the EU. The share of renewable resources in final energy consumption increased from 41% in 2005 to 55% in 2018, making Sweden the only EU country to source over half of its energy from renewable sources (Graph 4.5.3). Biofuel is the largest renewable source and is used mostly for heating, whereas in electricity hydropower is the dominant renewable source.
|
Graph 4.5.3:Share of renewable sources in final energy consumption, 2017
|
|
|
|
Source: European Commission
|
Sweden has a very ambitious GHG emissions reduction target. Its national GHG emission reduction targets are more ambitious than the EU commitments, aiming at a reduction in non-ETS emissions by 2030 of 63% compared to 1990 levels. According to the Climate Act adopted in 2017, Sweden shall reach carbon neutrality by 2045, including emissions within ETS. Up to 15% of the emissions reductions to reach carbon neutrality can be compensated through other measures like carbon capture and storage or investments abroad. Reducing the carbon-intensity of the Swedish economy would lead to progress on SDG 7 “Affordable and clean energy” and SDG 13 “Climate action”. Sweden´s draft integrated national energy and climate plan projects a 65% share of renewables in final energy consumption by 2030 (Regeringen, 2019f). The targets set in the plan would make for a moderate contribution towards the EU 2030 energy efficiency targets on primary energy consumption and a low contribution towards the EU targets for final energy consumption (European Commission, 2019g). Across the business sector, it has been difficult to reduce final energy consumption (Graph 4.5.4).
|
Graph 4.5.4:Final energy consumption (Mtoe(1))
|
|
|
|
Source: European Commission
|
Challenges on the way to carbon neutrality
Sweden is likely to meet its EU commitments but will need to take additional policy action to achieve its own objectives. Sweden is fully on course to meet its EU 2020 and 2030 targets to reduce GHG emissions in non-ETS sectors by 17% and 40%, respectively, from 2005 levels. However, the annual rate of reductions has been below 1% since 2014, which means that Sweden is not on course to meet its 2030 and 2045 domestic targets ((Klimatpolitiska rådet (the Swedish Climate Policy Council), 2019). With current policies, Sweden will reduce emissions from 53 million ton of carbon dioxide equivalents in 2018 to 45 in 2045 (Naturvårdsverket (Swedish Environment Protection Agency), 2019).
The transition to lower carbon emissions has benefited from a competitive advantage in renewable energy. Sweden´s geography offers opportunities for producing renewable energy, in particular from wood and hydropower. Low-cost hydropower energy provides the most electricity, and this has given Sweden a competitive advantage while allowing it to reduce greenhouse gas emissions. An energy-intensive sector like paper and pulp is a showcase: it has hardly reduced its final energy consumption but has halved the carbon-intensity of its gross value added. The decline in the exchange rate over the years has likely been another supporting factor for the paper and pulp industry, which faces strong competition in the global market.
|
Graph 4.5.5:Carbon dioxide emissions/gross value added (g/SEK)
|
|
|
|
Source: European Commission
|
As the competitive advantage in renewable energy decreases, energy efficiency will become more important. Sweden has the largest potential for the share of renewable energy in final energy consumption by 2030 among Member States (IRENA, 2018). However, additional renewable energy would have to come from higher cost sources instead of the relatively low-cost hydropower (IRENA, 2020). This puts the comparative advantage of Sweden under pressure as it moves to decarbonize economic growth further. Energy efficiency measures complement renewable energy deployment as a way of reducing the carbon emissions as well as supporting Swedish competitiveness.
Transport is the prime target for emissions reduction. Transport including international shipping and aviation accounted for 60% of the national carbon dioxide emissions in 2017 with domestic road transport being responsible for 34% (cars represent 23% of total emissions). Whereas emissions from industry and domestic transport have decreased, those from international aviation and maritime have increased. Domestically, too, transport has fallen behind industry’s emission reductions. Domestic transport remains the single most important source of carbon emissions. The emmissions from domestic transport (aviation excluded) is expected to decrease by at least 70% by 2030 compared to 2010. In order to achieve carbon neutrality, the Swedish Climate Policy Council assessed that the transport sector needs to be completely fossil-free by 2045. With current policies, it predicts a reduction in emissions from some 16 million tonnes to 12-13 million tonnes of carbon dioxide equivalents by 2030 while emissions need to be reduced to less than 6 million tonnes in order to reach the domestic 2030 target. Separate analysis by the National Institute of Economic Research (Konjunkturinstitutet) (2019) confirms that current policies are insufficient and pricing instruments need to become more powerful and efficient.
Industry roadmaps for fossil free competitiveness are identifying investment needs in the power sector. The supporting analysis for the electricity roadmap (SwedEnergy, 2020) projects an increase in electricity demand from 140 TWH/year to 190 TWH/year in 2045. The scenarios in the report identify large-scale investments needs until 2045, in power supply (SEK 560-640 billion), energy infrastructure (SEK 441-516 billion) and in system operation.
Greenhouse gas emissions vary widely regionally, mainly due to differences in the business structure. In Upper Norrland, the steel industry is an important industry and emitter. It is in the midst of a transformation process to become fossil-free by 2035 for which it has developed a roadmap. Fossil carbon dioxide emissions from the steel industry emanate mainly from production processes and internal transport. To reduce these emissions, the industry is looking at innovative processes such as using hydrogen to reduce iron ore to iron whereby emissions are eliminated from the reduction process leaving water as the only by-product. However, these technological changes are costly and involve numerous challenges and greenhouse gas emissions have actually increased.
Policy and industry initiatives
The government has recognised the need for further measures. Its climate policy action plan, published in December 2019, presents 132 measures across different sectors. The focus is on reducing GHG emissions from the transportation sector. More broadly, the government continue its policy of significant pricing of emissions to reduce emissions while at the same time considering a shift from labour and corporate taxes to environmental taxes.
Sweden intends to reduce carbon emissions by electrifying the transport sector. This will require large investments in several modes of transport by both public and private sectors (see also Section 4.4). At the end of 2019, the government launched an inquiry into phasing out cars powered by fossil fuels. The electrification of transport will also necessitate investments in power generation and distribution infrastructure.
The Industrial Leap programme to support low-carbon innovation in industry was scaled up during the year. In early 2019, the Swedish Parliament approved the allocation of SEK 300 million per year to the programme for the next 3 years, with a particular focus on the steel industry. In the government’s climate action plan of December 2019, the government proposed doubling the funding of this programme. The intention is to continue annual funding until 2040. Other research programmes focus on areas where Sweden can have a competitive edge such as biofuels- and waste-based combined heat and power production, forest carbon sequestration and efficient use of bioenergy sources.
|
Box 4.5.5: Fossil free Sweden initiative
The government launched the Fossil Free Sweden initiative (Fossilfritt Sverige) in 2015. It invites all business sectors to produce roadmaps on how to become climate neutral by 2045 while also increasing their competitiveness. So far, 13 industry sectors have presented such roadmaps, including several of the Sweden’s most energy-intensive sectors such as steel, cement and mining. In their roadmaps, the industries describe when and how they will be fossil free, what technological solutions need to be developed, what investments have to be made and what obstacles need to be removed to support the transformation.
In October 2019, the coordinator for Fossilfritt Sverige presented 27 measures to promote ‘fossil free competitiveness’ in Swedish industry based on the 13 roadmaps. The recommended measures include reviewing the system for taxes and other economic instruments, streamlining regulations and permit processes for new installations and low-carbon technologies, and launching national strategies to promote electrification and the bioeconomy, as well as carbon capture, utilisation and storage (CCUS).
|
The government is also supporting measures to reduce GHG emissions on local and regional level through the Climate Leap programme. The Climate Leap helps municipalities to invest in charging infrastructure for electrical vehicles, fuel switching to biofuels and district heating, as well lanes and other infrastructure for cycling. A total of SEK 4.7 billion was approved for such investments in 2015-2018, In 2019, the Climate Leap was allocated a total budget of SEK 1.5 billion and was budgeted a further SEK 1.8 -1.9 billion per year for the period 2020-2022.
The Swedish government promotes energy efficiency. Investments are needed towards the 2030. Appropriate mechanisms put in place by the Swedish government in line with EU’s ‘Smart finance for smart buildings initiative’ can unlock investments and attract private financing for energy efficiency investments. There is potential for Sweden to use more intensely the European local energy assistance (ELENA) program, or to put in place similar instruments at national or regional level. The building sector has an important role to play in the fulfilment of energy efficiency and climate targets for 2030 and beyond.
The Just Transition Fund (see annex D) could help develop of new and innovative solutions bringing together academia, public authorities and industry in more innovative environments to help stimulate intersections between ideas from different industries and regions. A good example on how this could work might be the Transiton Lab on low carbon economy and resource efficiency in North-Central Sweden, which addresses the regional challenges in the areas of broadening and diffusing innovation (particularly in relation to SMEs) and building a more effective industrial ecosystem (to attract talent, research and innovation resources, and investments).
Annex A: Overview table
|
Commitments
|
Summary assessment ()
|
|
2019 country-specific recommendations (CSRs)
|
|
CSR 1: Address risks related to high household debt by gradually reducing the tax deductibility of mortgage interest payments or increasing recurrent property taxes. Stimulate investment in residential construction where shortages are most pressing, in particular by removing structural obstacles to construction. Improve the efficiency of the housing market, including by introducing more flexibility in rental prices and revising the design of the capital gains tax.
|
Sweden has made Limited Progress in addressing CSR 1
|
|
Address risks related to high household debt by gradually reducing the tax deductibility of mortgage interest payments or increasing recurrent property taxes.
|
·No Progress No measures have been announced to reduce the tax deductibility of mortgage interest payment or to increase recurrent property taxes
|
|
Stimulate investment in residential construction where shortages are most pressing, in particular by removing structural obstacles to construction.
|
·Limited Progress Sweden has integrated its policy ambitions for the housing market into the January agreement of early 2019. This includes a subsidy for the construction of new rental housing.
|
|
Improve the efficiency of the housing market, including by introducing more flexibility in rental prices and revising the design of the capital gains tax.
|
·No Progress The government marginally changed the capital gains tax - a deferral of the capital gains tax liability on housing transactions remains possible when changing houses, while the maximum deferrable amount increased to SEK 3 million. However, this is de facto a tightening since the cap had been temporarily removed previously. There has been no change in the setting of rents.
|
|
CSR 2: Focus investment related economic policy on education and skills, maintaining investment in sustainable transport to upgrade the different transport modes, in particular railways , and research and innovation, taking into account regional disparities.
|
Sweden has made Some Progress in addressing CSR 2
|
|
Focus investment related economic policy on education and skills,
|
·Some Progress While some measures have been taken, for example in the 2020 Budget Bill, there is a continued need for investments in education and skills.
|
|
maintaining investment in sustainable transport to upgrade the different transport modes, in particular railways,
|
·Substantial Progress The implementation of the national plan for infrastructure 2018-2029 adopted in June 2018 is underway according to plan confirmed by the 73-point program presented by the government and its two supporting parties which include measures to support transport infrastructure.
|
|
and research and innovation, taking into account regional disparities.
|
·Some Progress Sweden continues to invest considerable resources in R&D and continues to be one of the most innovative economies in the EU. With 3.31% of GDP allocated to R&D (2018), Sweden remains the country with the highest R&D spending in the EU. However, there is a slight decrease in R&D Intensity (GERD as % of GDP) from 3.37 (2017) to 3.31 (2018), mainly due to a reduction in the business enterprise expenditure on R&D (BERD) as % of GDP from 2.4 (2017) to 2.35 (2018).
|
|
CSR 3: Ensure effective supervision and the enforcement of the anti-money laundering framework.
|
Sweden has made Some Progress in addressing CSR 3: Sweden has made substantial progress in terms of new legislative measures that will form the basis for a strengthened anti-money laundering framework. It has achieved some progress through the creation of a special body to promote collaboration between different competent authorities. Sweden has made some progress to ensure more effective supervision and enforcement by allocating additional human resources to both the Financial Supervisory Authority, which will enable the authority to develop a new risk classification tool, and the Financial intelligence Unit, which will allow it to process information more effectively. Sweden also made some progress in relation to reviews of major Swedish banks’ governance and control of anti-money laundering measures in Baltic subsidiaries and initiated two new investigations at the end of 2019. However, there is limited progress in other areas, notably the FSA’s staffing dedicated to supervision remains low compared to the size of the Swedish financial sector and the FIU still needs to make better use of the system for requests and exchange of information between EU FIUs (FIU.net) and strengthen its analytical capacity.
|
|
Europe 2020 (national targets and progress)
|
|
Employment rate target set in the NRP: 80 %.
|
Sweden has passed its target in 2014 and remained above target ever since registering an 82.4% employment rate in 2018 and 82.0% rate in the first three quarters.
|
|
R&D target set in the NRP: 4 % of GDP
|
Sweden remains the country with the highest R&D spending in the EU. However, there is a slight decrease in R&D Intensity (GERD as % of GDP) from 3.37 (2017) to 3.31 (2018), mainly due to a reduction in the business enterprise expenditure on R&D (BERD) as % of GDP from 2.4 (2017) to 2.35 (2018). Sweden will reach its national target for R&D intensity only if the stagnation in public R&D intensity can be overcome and if business R&D intensity can be increased.
|
|
National greenhouse gas (GHG) emissions target:
- 17 % in 2020 compared with 2005 (in sectors not included in the EU emissions trading scheme)
|
|
Between 2005 and 2018, Sweden’s greenhouse gas emissions in the non-ETS sectors dropped by 25%. They are projected to decline by 32% by 2020, thus overachieving the national target by 15 percentage points.
|
|
|
2020 renewable energy target: 49 % of final energy consumption
|
At 55%, Sweden has already exceeded its 2020 target
|
|
Energy efficiency, 2020 energy consumption targets:
Sweden's 2020 energy efficiency target is 43.4 Mtoe expressed in primary energy consumption (30.3 Mtoe expressed in final energy consumption)
|
Sweden's primary energy consumption in 2017 was 46.8 Mtoe, an increase compared to 46.4 Mtoe in 2017. Final energy consumption in 2018 reached 32.0 Mtoe, a decrease compared to 32.3 in 2017. More efforts are needed to meet the indicative national 2020 target.
|
|
Early school/training leaving target: below 7 %.
|
Early leavers from education and training (share of the population aged 18-24 with at most lower secondary education and not in further education or training) in 2018 was 9.3%. It has risen continuously since 2014, and more sharply (by 1.6 pps) between 2017 and 2018 (2017: 7.7%; 2016: 7.4%; 2015: 8%; 2014: 6.7%).
The share is 2.3 pps above the national target of 7%.
|
|
Tertiary education target: 45 - 50 % of population aged 30-34.
|
Tertiary educational attainment (share of population 30-34 having successfully completed tertiary education) in 2018 was 52% (2017: 51.3%; 2016: 51%; 2015: 50.2%; 2014: 49.9%).
The target of 45-50% has been achieved and the trend remains good
|
|
Target for reducing the number of people at risk of poverty or social exclusion: Reducing to well under 14% the number of people aged 20-64 who are not in the labour force (except full-time students), long-term unemployed or on long-term sick leave.
|
The corresponding indicator has continued to decrease, reaching 10.8% in 2018, according to feedback from national authorities (2017: 11.4%; 2016: 12.0 %; 2015: 12.4 %; 2014:12.6 %; 2013: 12.7 %). While the target has been reached, the decreasing trend is likely to change, as long-term unemployment is on the rise.
|
Annex B: Commission debt sustainability analysis and fiscal risks
Annex C: Standard tables
|
|
|
Table C.1:Financial market indicators
|
|
|
|
Source: European Commission (long-term interest rates); World Bank (gross external debt); Eurostat (private debt); ECB (all other indicators).
|
|
|
|
|
|
Table C.2:Headline Social Scoreboard indicators
|
|
|
|
Source: Eurostat
|
|
|
|
|
|
Table C.3:Labour market and education indicators
|
|
|
|
Source: Eurostat, OECD
|
|
|
|
|
|
Table C.4:Social inclusion and health indicators
|
|
|
|
Source: Eurostat, OECD
|
|
|
|
|
|
Table C.5:Product market performance and policy indicators
|
|
|
|
Source: European Commission; World Bank — Doing Business (for enforcing contracts and time to start a business); OECD (for the product market regulation indicators); SAFE (for outcome of SMEs' applications for bank loans).
indicators); SAFE (for outcome of SMEs' applications for bank loans).
|
|
|
|
|
|
Table C.6:Green growth
|
|
|
|
Source: European Commission and European Environment Agency (Share of GHG emissions covered by ETS); European Commission (Environmental taxes over labour taxes and GDP); Eurostat (all other indicators).
|
|
|
Annex D: Investment guidance on Just Transition Fund 2021-2027 for Sweden
Building on the Commission proposal, this Annex (
) presents the preliminary Commission services’ views on priority investment areas and framework conditions for effective delivery for the 2021-2027 Just Transition Fund investments in Sweden. These priority investment areas are derived from the broader analysis of territories facing serious socio-economic challenges deriving from the transition process towards a climate-neutral economy of the Union by 2050 in Sweden, assessed in the report. This Annex provides the basis for a dialogue between Sweden and the Commission services as well as the relevant guidance for the Member States in preparing their territorial just transition plans, which will form the basis for programming the Just Transition Fund. The Just Transition Fund investments complement those under Cohesion Policy funding for which guidance in the form of Annex D was given in the 2019 Country Report for Sweden (
).
In Sweden, the sparsely populated regions of Norrbotten and Västerbotten within the region Upper Norrland rely on industries using fossil fuels where process related greenhouse gas emissions intensity significantly exceed the EU average.
The carbon intensity of the steel industry in Upper Norrland region highlights the scale of the decarbonisation challenge, suggesting that the sector would be likely to undergo by 2030 significant restructuring in its industrial processes. There is a risk of a negative impact on the around 4,000 people directly employed in the production, as well as further impact on the subcontractors and the regional economy. A restructuring that takes into account social aspects would need new innovative solutions for the whole value chain. Based on this preliminary assessment, it appears warranted that the Just Transition Fund concentrates its intervention on that region.
The smart specialisation strategy (
) provides an important framework to set priorities for innovation in support of economic transformation. In order to tackle these transition challenges, investment needs have been identified for diversifying and making the regional economy more modern. Key actions of the Just Transition Fund could target in particular:
•productive investments in SMEs, including start-ups, leading to economic diversification and reconversion;
•investments in the creation of new firms, including through business incubators and consulting services;
•investments in research and innovation activities and fostering the transfer of advanced technologies;
•investments in the deployment of technology and infrastructures for affordable clean energy, in greenhouse gas emission reduction, energy efficiency and renewable energy;
•investments in enhancing the circular economy, including through waste prevention, reduction, resource efficiency, reuse, repair and recycling;
•upskilling and reskilling of workers.
Steel production sites in this region, performing activities listed in Annex I to Directive 2003/87/EC employ a substantial number of workers and their activity is at risk due to their high greenhouse gas emissions. Support to investments to reduce the emissions could be considered, provided that they achieve a substantial reduction of emissions (going substantially below the relevant benchmarks used for free allocation under Directive 2003/87/EC) and on the condition that the investments are compatible with the European Green Deal.
Annex E: Progress towards the Sustainable Development Goals (SDGs)
Assessment of Sweden’s short-term progress towards the SDGs ()
Table E.1 shows the data for Sweden and the EU-28 for the indicators included in the EU SDG indicator set used by Eurostat for
monitoring progress towards the SDGs in an EU context
(). As the short-term trend at EU-level is assessed over a 5-year period, both the value at the beginning of the period and the latest available value is presented. The indicators are regularly updated on the
SDI dedicated section
of the Eurostat website.
|
Table (continued)
|
|
|
|
|
|
|
|
(Continued on the next page)
|
|
Table (continued)
|
|
|
|
|
|
|
|
(Continued on the next page)
|
|
Table (continued)
|
|
|
|
|
|
|
|
(Continued on the next page)
|
|
Table (continued)
|
|
|
|
|
|
Source: Eurostat
|
|
|
References
Andersen, T.M. (2019), Inequality and economic performance: Bilaga 4 till Långtidsutredningen 2019, SOU (Statens offentliga utredningar) 2019:54, Stockholm.
Andersson, J. (2019), ‘Carbon Taxes and CO2 Emissions: Sweden as a Case Study’, American Economic Journal: Economic Policy, 11(4), pp. 1-30.
Andrews, D. Criscuolo, C. and Gal, P. (2016), The best versus the rest: the global productivity slowdown, divergence across firms and the role of public policy, OECD Productivity Working Papers 2016, No.5.
Arbetsförmedlingen, Public Employment Service (2019a), Arbetsmarknadsutsikterna våren 2019 Prognos för arbetsmarknaden 2019-2020, Stockholm.
Arbetsförmedlingen, Public Employment Service (2019b), Arbetsmarknadsutsikterna hösten 2019 Prognos för arbetsmarknaden 2019-2021, Stockholm.
Arevik, N. (2019), ‘Allt fler lärare säger upp sig på grund av arbetsmiljön’, Lärarnas tidning 11 Februari 2019, Lärarförbundet (
https://lararnastidning.se/allt-fler-larare-sager-upp-sig-pa-grund-av-arbetsmiljon
).
Aspegren, H., Durán, J. and Masselink, M. (2019), Pension reform in Sweden: sustainability and adequacy of public pensions, ECFIN Economic brief 048, European Commission.
Atomico (2019), The State of European Tech 2019, chapter 3.3 (
https://2019.stateofeuropeantech.com
).
Bauer, P. (2019), ‘Role of Firm Demography in Productivity Growth’, in: Joint Research Centre (2019) Productivity in Europe, JRC Technical Reports November 2019, European Commission.
Betz, F., Oprica, S., Peltonen, T and P. Sarlin (2014), Predicting distress in European banks, Journal of Banking & Finance 45, pp. 225–24.
Bjellerup, M. and Majtorp, L., (2019), The development of Swedish housing prices, Riksgälden Focus Report, 15 November 2019, Stockholm.
Boverket (2019), Bostadsmarknadsenkäten 2019, Karlskrona.
Calmfors, L., Ek, S., Kolm, A. and Skedinger, P. (2019), Kollektivavtal och lönebildning i en ny tid, Dialogos, Stockholm.
Calmfors, L. and N.S Gassen eds. (2019), Integrating immigrants into the Nordic labour markets, Nordic Council of Ministers, Nordenshus, Copenhagen.
Cancerfonden (2019), Screening – vad är det?, (
https://www.cancerfonden.se/om-cancer/screening-vad-ar-det
).
Cedefop (2020 forthcoming), Developments in vocational education and training policy in 2015-19: Sweden, Cedefop monitoring and analysis of VET policies, Publications Office of the European Union, Luxembourg.
Emanuelsson, R., Katinic, G., and Spector, E. (2018), Developments in the housing market and their contribution to household debt, Economic Commentaries 2018 No.14 2018, Sveriges Riksbank.
Engström, N. (2020), Nya utmanare på bolånemarknaden - Ökad konkurrens och möjlig räntepress, Ekonomiska kommentarer 2020 No 1 2020, Sveriges Riksbank.
Espinoza, A. and Xie, Y. (2015), ‘Labour Quality’, Statistics Sweden, 27 April 2015.
European Banking Authority (2019), 2018 EU-wide stress test results, (
https://eba.europa.eu/sites/default/documents/files/documents/10180/2419200/126521e6-613f-45e4-af84-cbd3b854afc5/2018-EU-wide-stress-test-Results.pdf
).
European Commission (2018), Country Report Sweden 2018, Commission Staff Working Document (2018) 225, Publications Office of the European Union, Luxembourg.
European Commission and Ageing Working Group of the EPC (2018), The 2018 Ageing Report: Economic and Budgetary Projections for the EU Member States (2016-2070), Institutional paper 079, Brussels.
European Commission (2019a), Alert Mechanism Report 2020, Commission Staff Working Document (2019) 630, Publications Office of the European Union, Luxembourg.
European Commission (2019b), Country Report Sweden 2019, Commission Staff Working Document (2019) 150, Publications Office of the European Union, Luxembourg.
European Commission (2019c), Report from the Commission to the European Parliament and the Council on the assessment of recent alleged money laundering cases involving EU credit institutions, Commission Report (2019) 373, Publications Office of the European Union, Luxembourg.
European Commission (2019d), Education and Training Monitor 2019 Sweden, Publications Office of the European Union, Luxembourg.
European Commission (2019e), Innovation Scoreboard, (
https://interactivetool.eu/EIS/EIS_2.html#
).
European Commission (2019f), Transport in the EU: Current trends and issues, Publications Office of the European Union, Luxembourg.
European Commission (2019g), Assessment of the draft National Energy and Climate Plan of Sweden – Accompanying the document Commission Recommendation on the draft integrated National Energy and Climate Plan of Sweden covering the period 2021-2030, Commission Staff Working Document (2019) 278, Publications Office of the European Union, Luxembourg.
European Commission (2020a), Debt Sustainability Monitor 2019, Directorate-General for Economic and Financial Affairs, European Economy Institutional Paper 120/2020, Publications Office of the European Union, Luxembourg.
European Commission (2020b), SME access to finance in the EU countries 2019, (
https://ec.europa.eu/docsroom/documents/38442
).
European Commission/European Central Bank (2019), Survey on the access to finance of enterprises (SAFE), (
https://ec.europa.eu/growth/access-to-finance/data-surveys_en
).
European Investment Bank (2019), EIB Group Survey on Investment and Investment Finance; Country overview: Sweden, Publications Office of the European Union, Luxembourg.
ESRB European Systemic Risk Board (2019a), Recommendation of the European Systemic Risk Board of 27 June 2019 on medium-term vulnerabilities in the residential real estate sector in Sweden, ESRB/2019/9.
ESRB European Systemic Risk Board (2019b), Methodologies for the assessment of real estate vulnerabilities and macroprudential policies: commercial real estate, Report, 17 December 2019.
ESRB European Systemic Risk Board (2019c), Vulnerabilities in the residential real estate sectors of the EEA countries, Report, 23 September 2019.
Finansinspektionen (2019a), Clarification on the impact for Swedish banks from revised Basel standards, 23 December 2019, (
https://www.fi.se/en/published/news/2019/clarification-on-the-impact-for-swedish-banks-from-revised-basel-standards
).
Finansinspektionen (2019b), FI’s liquidity coverage ratio requirements in individual currencies and diversification of covered bonds in the liquidity buffer, Memorandum, 3 March 2019
Finansinspektionen (2019c), The commercial real estate market and financial stability, Report, 28 May 2019.
Finansinspektionen (2019d), FI’s work to combat money laundering and terrorist financing, Report, 15 November 2019.
Finansinspektionen (2019e), The Swedish Mortgage Market (2019), Report, 27 March 2019.
Finansinspektionen (2019f), Stability in the Financial System (2019:2), Report, 28 November 2019.
Finansinspektionen (2019h), Unga vuxnas ställning på bostadsmarknaden, FI-analys 19, 17 November 2019.
Finansinspektionen (2020), Ökade kapitalkrav för banklån till kommersiella fastigheter, FI Dnr 19-14171, 28 January 2020
Finanspolitiska Rådet (2019), Svensk finanspolitik 2019, Stockholm.
Fredriksson, P. (2019), ‘Faktakunskaper betonas i förslaget till nya kursplaner‘, Debate article, DN Debatt, Dagens Nyheter 24 September 2019, (
https://www.dn.se/debatt/faktakunskaper-betonas-i-forslaget-till-nya-kursplaner/
).
Fritzell, J., Bacchus Hertzman, J., Bäckman, O., Borg, I., Ferrarini, T. & Nelson, K. (2014) Sweden: Increasing Income Inequalities and Changing Social Relations. in: Nolan, B., Salverda, W., Checchi, D., Marx, I., Mcknight, A., Tóth, I. & Van De Werfhorst, H. eds., Changing Inequalities and Societal Impacts in Rich Countries: Thirty Countries’ Experiences, Oxford University Press, Oxford
Giordani, P., Spector, E., and Zhang, X. (2017), A new early warning indicator of financial fragility in Sweden, Economic Commentaries No.1 2017, Sveriges Riksbank.
Global Entrepreneurship Monitor (2019) at
https://www.gemconsortium.org/
.
Government of Sweden (2019), Statement of Government Policy, 21 January 2019,
https://www.government.se/speeches/20192/01/statement-of-government-policy-21-january-2019/
.
Heyman, F., Norbäck, P-J, and Persson, L. (2018), ‘Who Creates Jobs and Who Creates Productvity’, Economic Letters, 164, March, pp. 50-57.
Heyman, F., Norbäck, P-J, and Persson, L. (2019), The Turnaround of the Swedish Economy: Lessons from large Business Sector Reforms, Cesifo Working paper 7627/2019, April.
Holmberg, U., Janzén, H., Oscarius, L., van Santen, P. and Spector, E. (2015), An analysis of the fixation period for Swedish mortgages, Economic Commentaries, No.7 2015, Sveriges Riksbank.
IRENA (2018), Renewable energy perspectives for the European Union, RE-MAP report, International Renewable Energy Agency, Abu Dhabi.
IRENA (2020), Innovative solutions for 100% renewable power in Sweden, International Renewable Energy Agency, Abu Dhabi.
Joint Research Centre (2019), Productivity in Europe, JRC Technical Reports November 2019, European Commission.
Justo, I., Hartley, J., Picos, F., and Riscado, S. (2019), Mortgage tax reform in Sweden: scope for a double dividend?, ECFIN Economic brief 049, European Commission.
Keeley, B. (2015), Income Inequality: The Gap Between Rich and Poor, OECD Publishing, Paris.
Klimatspolitiska Rådet (Swedish Climate Policy Council) (2019), Annual Report 2019, Report Nr. 2, Stockholm.
Konkurrensverket (2018), Bättre konkurrens bostadsbyggandet, Konkurrensverkets rapportserie 2018:7, Stockholm.
Lärarnas riksförbund, (2019a), Gymnasielärarna som inte får sova. En undersökning om en orimlig arbetsbörda, Lärarnas riksförbund, Stockholm (
https://www.lr.se/download/18.39c4ed9c16b9b126dc41e968/1565952240549/gymnasielararna_som_inte_far_sova_LRUND176_201908.pdf
).
National Board of Health and Welfare (2017), Hemlöshet 2017 – omfattning och karaktär, Socialstyrelsen, Stockholm.
National Institute of Economic Research (Konjunkturinstitut) (2019b), The Swedish Economy, October.
Naturvårdsverket (Swedish Environmental Protection Agency) (2019), Underlag till regeringens klimatpolitiska handlingsplan, Rapport 6879, Stockholm.
OECD (2015), Sweden Country Survey 2015, OECD Publishing, Paris.
OECD (2019a), PISA 2018 Results (Volume II): Where all Students Can succeed, PISA, OECD Publishing, Paris,
https://doi.org/10.1787/b5fd1b8f-en
.
OECD (2019b), PISA 2018 Results (Volume I): What Students Know and Can Do, PISA, OECD Publishing, Paris,
https://doi.org/10.1787/5f07c754-en
.
OECD (2019c), TALIS 2018 Results (Volume I): Teachers and School Leaders as Lifelong Learners, TALIS (
http://www.oecd.org/education/talis/
).
OECD (2019d), OECD Ecoscope – An economic lens on policies for growth and well-being; Sweden’s schools: lessons from history to build a better future, (
https://oecdecoscope.blog/2019/03/29/swedens-schools-lessons-from-history-to-build-a-better-future/
)
OECD (2019), SME and Entrepreneurship Outlook 2019, OECD Publishing, Paris.
OECD/EU (2019), State of Health in the EU – Sweden: Country Health Profile 2019, OECD Publishing, Paris/European Observatory on Health Systems and Policies, Brussels.
Regeringen (2019a), Skolpaket för att alla elever ska lära sig mer, Press release 13 September 2019 (
https://www.regeringen.se/pressmeddelanden/2019/09/skolpaket-for-att-alla-elever-ska-lara-sig-mer/
).
Regeringen (2019b), Reformering av lärarutbildningen, Press release 17 October 2019 (
https://www.regeringen.se/pressmeddelanden/2019/10/reformering-av-lararutbildningen/
).
Regeringen (2019c), Satsning på lärarassistenter fördubblas, Press release 11 September 2019 (
https://www.regeringen.se/pressmeddelanden/2019/09/satsning-pa-lararassistenter-fordubblas/
).
Regeringen (2019d), Sweden’s draft integrated national energy and climate plan according to Regulation (EU) 2018/1999 of the European Parliament and of the Council on the Governance of the Energy Union and Climate Action.
https://www.government.se/48ee21/contentassets/e731726022cd4e0b8ffa0f8229893115/swedens-draft-integrated-national-energy-and-climate-plan
Regeringen (2020), Sweden’s final integrated national energy and climate plan according to Regulation (EU) 2018/1999 of the European Parliament and of the Council on the Governance of the Energy Union and Climate Action.
https://www.regeringen.se/48edd1/globalassets/regeringen/dokument/sveriges-integrerade-nationella-energi-och-klimatplan-enligt-forordning-eu-2018-1999.pdf
Riksbank (2019a), Consultation response regarding Finansinspektionen’s requirement for liquidity coverage ratios in individual currencies and diversification of covered bonds in the liquidity buffer, 10 April 2019.
Riksbank (2019b), Financial Stability Report 2019:1.
Royal Swedish Academy of Engineering Sciences (Kungliga Ingenjörsvetenskapsakademien) (2019), FoU-barometer 2019, (
https://www.iva.se/publicerat/ivas-fou-barometer-2019/
).
SALAR (Swedish Association of Local Authorities and Regions; Sveriges Kommuner och Landsting) (2018), Hälso- och sjukvårdsrapporten 2018: Öppna jämförelser, Statens medieråd, Stockholm,
https://webbutik.skl.se/bilder/artiklar/pdf/7585-637-7.pdf
.
SALAR (Swedish Association of Local Authorities and Regions; Sveriges Kommuner och Landsting) (2018), Skolans rekryteringsutmaningar — lokala strategier och exempel, Statens medieråd, Stockholm (
https://webbutik.skl.se/sv/artiklar/skolans-rekryteringsutmaningar-.html
).
SALAR (Swedish Association of Local Authorities and Regions; Sveriges Kommuner och Landsting) (2019a), Uppdrag fullföljd utbildning, Statens medieråd, Stockholm
https://skr.se/skolakulturfritid/forskolagrundochgymnasieskola/uppdragfullfoljdutbildning.26377.html
).
SALAR (Swedish Association of Local Authorities and Regions; Sveriges Kommuner och Landsting) (2019b), Ekonomirapporten, (Om kommunernas och regionernas ekonomi), Statens medieråd, Stockholm (
https://skr.se/tjanster/merfranskr/rapporterochskrifter/publikationer/ekonomirapportenoktober2019.29716.html
).
Santen, van, P. (2017), ‘Drivers and implications of the strong growth in consumption loans’, Sveriges Riksbank staff memo, December.
Skolverket, National Agency for Education (NAE) (2019), Ny prognos: Fortsatt mycket stort behov av fler lärare, Press release 9 December 2019 (
https://www.skolverket.se/om-oss/press/pressmeddelanden/pressmeddelanden/2019-12-09-ny-prognos-fortsatt-mycket-stort-behov-av-fler-larare
)
Skåne County Administrative Board (2018), Bostadsförsörjning mer än bostadsbyggande, Rapport 2018:3, County Administrative Board, Skåne.
Statens medieråd, (2019), Ungar och medier 2019, Statens medieråd, Stockholm (
https://statensmedierad.se/publikationer/ungarochmedier/ungarochmedier2019.3347.html
).
Statistics Sweden (Statistikmyndigheten SCB ) (2019), Investment Survey Third Quarter 2019, 29 November 2019, Stockholm (
https://www.scb.se/en/finding-statistics/statistics-by-subject-area/business-activities/business-investments/investment-survey/pong/statistical-news/investment-survey-third-quarter-2019/
).
Svenskt Näringsliv, Confederation of Swedish Enterprise (2019), Ett utmanat Sverige - Arbetskraft utan bostäder, Stockholm.
Svensson, L.E.O. (2019), Housing price, housing debt, and macroeconomic risk: problems of macroprudential policy I, unpublished paper, accessible on
https://larseosvensson.se
.
Swedish Research Council (Vetenskapsrådet) (2019), The Swedish Research Barometer 2019: the Swedish Research System in International Comparison, Stockholm,
https://www.vr.se/download/18.77b9d6db16ce4de84475b0/1568640723925/2019%20Forskningsbarometer_ENG.pdf
.
SOU (Statens offentliga utredningar) (2017), Samling för skolan: nationell strategi för kunskap och likvärdighet, SOU 2017:35, Stockholm (
http://www.sou.gov.se/wp-content/uploads/2017/04/SOU_2017_35_webb_Final-version.pdf
).
SOU (Statens offentliga utredningar) (2019a), En ny riksbankslag, SOU 2019:46, Stockholm,
https://www.regeringen.se/rattsliga-dokument/statens-offentliga-utredningar/2019/11/sou-201946/
).
SOU (Statens offentliga utredningar) (2019b), Sverige och bankunionen, SOU 2019:52, Stockholm,
https://www.regeringen.se/rattsliga-dokument/statens-offentliga-utredningar/2019/12/sou-201952/
).
SOU (Statens offentliga utredningar) (2019c), En långsiktig, samordnad och dialogbaserad styrning av högskolan, Utbildningsdepartementet, SOU 2019:6, Stockholm, (
https://www.regeringen.se/rattsliga-dokument/statens-offentliga-utredningar/2019/02/sou-20196/
)/
SwedEnergy (Energiföretagen), (2019), Färdplan for fossilfri konkurrenskraft: Elbranschen,
https://www.energiforetagen.se/globalassets/dokument/fardplaner/ffs_elbranschen_webb.pdf
).
Wickström Östervall, Linnea (2019), Lägre andel nyanlända kvinnor kommer till etableringen –Konsekvenser av tillfälliga uppehållstillstånd, Arbetsförmedlingen, Stockholm.
World Bank (2019), Carbon Pricing Dashboard,
https://carbonpricingdashboard.worldbank.org/
.
World Economic Forum (2019), The Global Competitiveness Report 2019, Cologny/Geneva.
-
(I)
European Regional Development Fund, Cohesion Fund, European Social Fund, Youth Employment Initiative, including national co-financing.
-
(II)
https://cohesiondata.ec.europa.eu/countries/SE
.
-
(III)
The performance review is regulated by Article 22 of the Regulation (EU) No 1303/2013, whereby 5-7 % of overall resources allocated are released to performing priority axes of the operational programmes, the amount includes national co-financing.
-
(IV)
European Regional Development Fund, Cohesion Fund, European Social Fund, European Agricultural Fund for Rural Development Fund and European Maritime and Fisheries Fund.