 EUROPEAN COMMISSION
Brussels, 23.11.2017
SWD(2017) 390 final
COMMISSION STAFF WORKING DOCUMENT
Energy Union Factsheet Denmark
FMT:ItalicAccompanying the document/FMT
COMMUNICATION FROM THE COMMISSION TO THE EUROPEAN PARLIAMENT, THE COUNCIL, THE EUROPEAN ECONOMIC AND SOCIAL COMMITTEE, THE COMMITTEE OF THE REGIONS AND THE EUROPEAN INVESTMENT BANK
Third Report on the State of the Energy Union
{COM(2017) 688 final}
{SWD(2017) 384 final}
{SWD(2017) 385 final}
{SWD(2017) 386 final}
{SWD(2017) 387 final}
{SWD(2017) 388 final}
{SWD(2017) 389 final}
{SWD(2017) 391 final}
{SWD(2017) 392 final}
{SWD(2017) 393 final}
{SWD(2017) 394 final}
{SWD(2017) 395 final}
{SWD(2017) 396 final}
{SWD(2017) 397 final}
{SWD(2017) 398 final}
{SWD(2017) 399 final}
{SWD(2017) 401 final}
{SWD(2017) 402 final}
{SWD(2017) 404 final}
{SWD(2017) 405 final}
{SWD(2017) 406 final}
{SWD(2017) 407 final}
{SWD(2017) 408 final}
{SWD(2017) 409 final}
{SWD(2017) 411 final}
{SWD(2017) 412 final}
{SWD(2017) 413 final}
{SWD(2017) 414 final}
 Denmark
Energy Union factsheet
1.Macro-economic implications of energy activities
Energy and transport are key sectors for the overall functioning of the economy as they provide an important input and service to the other sectors of the economy. Together the activity in these two sectors accounted for 6.7 % of the total value added of Denmark in 2015. Similarly, their share in total employment was 5.4 % in 2015, of which 5.0% in the transport sector and 0.4 % in the energy sector.

(source: Eurostat)
The decarbonisation of the energy and transport sectors will require significant investments and economic activity beyond the remit of these sectors themselves. The energy transition implies a structural shift in economic activity. Energy-related investment and jobs will in part migrate from traditional fossil fuel based activities towards construction, equipment manufacturing and other services related to the deployment of low carbon and clean energy technologies. At the moment the efforts related to the energy transition in other sectors cannot be reliably quantified and are therefore not included.
In the case of renewable energy sector, both the direct as well as the indirect effects on employment are being estimated. According to EurObserv'ER, in 2015, the turnover of the renewable energy industry in the same year was estimated at around EUR 12.76 billion, the vast majority being attributed to the wind industry.

(source: Eurobserv'Er, 16th annual overview barometer)
An indication of the level of efforts and challenges encountered by Denmark in the energy sector is given by the Gross fixed capital formation (GFCF). Investments in the electricity and gas sectors, which are taken as reference sectors, have steadily been in the range of 0.4-0.6 % of GDP, with the exception of two years with higher levels, i.e. 2013 and 2015.

(source: Eurostat)
In contrast to most other EU countries, Denmark exhibits a small trade surplus in energy. Denmark had in 2015 a net trade deficit for oil, coal and electricity, while the gas export showed a trade surplus. The overall trade surplus in energy products has, however, fallen from about 2% of GDP in 2005 to 0.04 % in 2015, reflecting declining export and prices of oil and gas. The largest decrease is accounted for by oil, which turned from a surplus of 1.5 % to a slight deficit in the observed period. The trade surplus in gas fell by two thirds, from 0.6 % to 0.2 % of GDP. Denmark appears also to have moved towards regular trade deficits for electricity in the second half of the period, i.e. as of 2011 at a level of about 0.03 % of GDP.

(source: Eurostat)
2.Energy security, solidarity and trust
2.1.Energy Mix
In comparison to the average energy mix in the EU, Denmark's energy mix of primary products has a much higher share of renewable energy (29.3 % vs 13 %). Denmark does not rely on nuclear energy at all, and has also a lower share of natural gas (17.6 % vs 22 %) and solid fuels (10.6 % vs 16.2 %) than the EU28. The share of oil in gross inland consumption is 5.4 % points higher in Denmark than the average in the EU28, at 39.8 % and 34.44 % respectively.

(source: Eurostat)
2.2.Import dependency and energy security
The share of energy consumption coming from imports is 13.1 %, well below the EU average of 54 %. This is primarily due to Danish gas and oil production in the North Sea fields, but also to the high importance of renewable energy in the country's energy mix.
Nevertheless, the declining production of natural gas turned Denmark into a net importer of energy, with the share of energy consumption coming from imports increasing in the period 2005-2015 from -49.8 % (i.e. significant net exports) to 13.1 %. At the EU level, import dependency increased by only 1.8 percentage points over the same period.
Denmark only imports relatively small amounts of natural gas, for which Norway is the most important external supplier (82.8 % of total imports from non-EU countries). Norway is also the main external supplier for crude oil and NGL (73.5 %). As regard hard coal, Russia supplies slightly more than half of total imports to Denmark.

(source: Eurostat)
The security of gas supply regulation requires that, if the single largest gas infrastructure fails in one Member State, the capacity of the remaining infrastructure is able to satisfy total gas demand during a day of exceptionally high gas demand. Denmark complies with this requirement. The Danish system is well-supplied, including from own production; its security of supply does not depend seriously on any external (to the EU) sources or any routes and is guaranteed also against disruption of infrastructure. The market is also resilient to price changes of outside sources. These trends are expected to continue at least until 2030.

(source: gas coordination group)
Denmark is still a net exporter of natural gas (and oil), but at much lower levels than a decade ago. Denmark is currently exporting gas mainly to Sweden and Netherlands, while importing some volumes from Germany and Norway.
According to ENTSOG’s analysis, the basis Remaining Flexibility (RF) of the Danish gas system (i.e. without any Project of Common Interests) is 52 % in 2020 and 100 % by 2030; this means that the existing system can cover a daily peak demand exceeding the expected one by up to 50 % in 2020 and by up to 100 % by 2030.
However, projections suggest that current gas interconnection points (with Germany in Ellund and from the North Sea in Nybro) might not be sufficient from the security of supply perspective in the longer term. Therefore, various options have been considered, notably two gas interconnectors connecting Denmark and Poland (known as Baltic Pipe) and Denmark and Norway (known as Tie-in). The Baltic pipe is included in the PCIs list and has already benefited from CEF funding. Danish promoters together with their Polish and Norwegian counterparts are also considering interconnections between countries.
3.Internal market
3.1.Interconnections and wholesale market functioning
3.1.1.Electricity
(source: EC services based on ENTSOE; EC services based on Eurostat; EC services based on Platts and European power exchanges)
While Denmark has, at 50.6%, a level of electricity interconnection well above the 10 % target for 2020, available electricity interconnection capacity with Germany, notably on the DK1-DE interconnector, needs to be increased in order to facilitate cross-border trading. Indeed, although a 2014 study estimated that maintaining a minimum of 1000 MW of cross-border capacity could bring benefits of around EUR 40 million per annum, the average available interconnection capacity between West Denmark and Germany was only 250 MW in 2015. Not only does this restrict cross-border trading, but it can also result in costs associated with curtailing generators in order to manage this reduction.
The PCIs for Denmark in the electricity sector are those enhancing Denmark's electricity interconnections with Germany (three onshore and offshore grid projects), with the United Kingdom (subsea link currently known as "Viking Link") and the Netherlands (one offshore project). These are long-term projects with commissioning dates foreseen for years 2018 - 2022. Denmark received EUR 7 million under CEF calls for two electricity PCIs (DK-DE and DK-UK interconnectors).
Wholesale electricity prices are lower than EU average, and the gap has widened between 2013 and 2016 (prices decreased 29.1 % in Denmark during this period, compared to 14.8 % in the EU).
3.1.2.Gas
The market concentration index for wholesale gas supply is significantly lower than the EU average.
At 13.8 EUR/MWh in 2016, wholesale gas prices remain at similar level compared to the EU average.

(source: ACER for the left graph and EC services based on on Platts, gas hubs, ESTAT for the right graph)
In addition to the upgrade of capacity at the Ellund interconnection point between Denmark and Germany (completed in August 2016) several gas infrastructure projects are foreseen: PCI Poland-Denmark interconnection "Baltic Pipe" (feasibility study phase), the Tie-in project connecting Denmark and Norway (feasibility study phase). Denmark received EUR 200 000 of funding from the Connecting Europe Facility for the Baltic Pipe.
3.2.Retail electricity and gas markets
3.2.1.Electricity
In 2016, Danish household customers continued to pay the highest electricity prices in EU, due to the high level of taxes and levies, which represented approximately 68% of household electricity prices. The decrease in electricity prices without taxes has been more than compensated by the increase in taxes and levies, leading to a price increase with taxes of 4.7 % between 2013 and 2016.
The switching rate for electricity customers in 2015 was 7.2 %, which is above the EU28 average of 6.3 %. The phasing out of regulated prices was completed in 2017.
In 2013, the Danish Energy Agency issued a Regulation for the roll-out of smart meters for electricity by 2020. More than 60 % of customers now have smart meters.

(source: ACER)
(source: Eurostat)
(source: Eurostat)
3.2.2.Gas
On the gas retail market, the switching rate more than tripled between 2011 and 2015, and was significantly above the EU 28 average (10.1 % vs 7.0 %).
As is the case for electricity retail prices, the share of taxes and levies in household gas prices is significantly higher than the EU average, at 58.3 % in 2016. The household price with taxes decreased by 24.2 % between 2013 and 2016 and is now at 0.074 EUR/kWh, still above the EU28 average of 0.064 EUR/kWh. In 2016, the Danish Regulator indicated that approximately 90 percent of gas customers received gas at unregulated prices.
The Danish authorities continue to consider whether to abolish the current system of supply obligation licences in the gas sector, for which a new supply obligation license period started on 1 May 2016 and will run until 31 March 2019.

(source: ACER)
(source: Eurostat)
(source: Eurostat)
3.2.3.Market performance indicators
According to the periodical survey of DG JUST, Danish consumers are slightly more satisfied than the EU average regarding retail electricity and gas services.

(source: DG JUST survey)
3.3.Energy affordability
In 2015 the share of energy in total household expenditure in Denmark for the lowest quintile of population was above the EU28 average (9.7 % vs 8.6 %). However, relatively few households were below the at-risk-of poverty threshold and unable to keep their home adequately warm (12.7 % vs EU 28 average of 22.7 %). This is partly explained by the purchasing power of households and the high average energy efficiency standards of residential buildings.

(source: ad-hoc data collection of DG ENER based on HBS with the support of Eurostat and national statistics)
4.Energy efficiency and moderation of demand
Since 2005, Denmark decreased its primary energy consumption by 14.3 % to 16.51 Mtoe in 2015. Over the same period, final energy consumption also decreased by 10 % to 13.95 Mtoe in 2015.These developments have been impacted by a steadily increasing share of notably renewable electricity but also a renewed increase in consumption for transport following several years of stagnation and the reduction in final energy consumption in manufacturing industries and services sector in spite of economic growth. Even if Denmark has already achieved levels of primary and final energy consumption below the indicative national 2020 targets (17.4 Mtoe in primary energy consumption and 14.4 Mtoe in final energy consumption), it needs to continue the efforts to keep these levels until 2020.

(source: Eurostat)
Denmark is one of the least energy-intensive economies in the EU. Its primary energy intensity is 43% lower than the EU average and is decreasing at the same pace (-2.1 % on the period 2005-2015). A sectoral assessment shows that the energy intensities of Denmark's industry and services sector are amongst the lowest in the EU, and they decreased by respectively 2.3 % and 1.6 % between 2005 and 2015. As regard final energy consumption per square meter in residential sector, Denmark is slightly below the EU average. Final energy consumption in households has decreased by 6.5 % since 2006 and remained essentially unchanged from 2013 to 2014, despite an increase in the number of households and square metres.

(source: Eurostat)
(source: Eurostat)
(source: Odyssee database)
In 2015, transport was the one sector consuming the most energy, with a 35.5 % share of total final energy consumption. Compared to the EU average, the Danish industry represents a much lower share of final energy consumption (15.1 % vs 25.3 %). Though the shares of the other sectors in final energy consumption are relatively comparable to the EU average, the residential sector's share is 5 percentage points higher in Denmark than in the EU28.

(source: Eurostat)
Although passengers and freight transport activity increased between 2005 and 2015 in Denmark, final energy consumption in transport recorded an average annual decrease of 0.7 %. In the same period, GDP increased at an annual average of 0.7 %. Since 2013, final consumption in transport has however increased.

(source: Eurostat)
(source: Eurostat and DG MOVE pocketbook)
Collective land transport represented in 2015 one fifth of all passengers transport in Denmark. The share of collective passengers land transport in total passengers' transport decreased slightly between 2005 and 2015, indicating a higher use of private transport means in Denmark (the EU average being stable on the period).

(source: Eurostat)
Banedanmark (the Danish National Railway Agency) has launched a large-scale project for the electrification of a large part of the Danish state railway network in the years to come. The electrification programme will create the framework for a more modern railway system with cheaper and more stable operation, while the expansion of the operation of electrical trains will reduce pollution and contribute to a cleaner environment. The project will improve the reliability and attractiveness of the railways and lead to clear benefits for passengers, operators as well as the environment
The Fehrman Belt Connection, a strategically important cross-border infrastructure project for Denmark, has created concerns due to the prolonged and complex plan approval procedure. However, the final approval of the project is expected by mid-2018. It is expected that construction works could commence by 2020.
In road haulage, Denmark initiated an EMS (European Modular System) trial in November 2008, which was originally intended to last until 2011, but has since then been extended twice and will now be running until 2030. Evaluations of the trial have shown considerable socio-economic benefits as a consequence of lower transport costs and lower CO2 emissions.
5.Decarbonisation of economy
5.1.GHG emissions
Danish GHG emissions were reduced by 27.4 % from 1990 to 2016. Emissions covered by the Effort Sharing Decision were reduced by 19.3 % from 2005 to 2016, which is a larger reduction than the interim target for 2016 of - 14.9 %. According to the 2017 projections, Denmark is expected to achieve its' 2020 target by a margin of 2.3 percentage points.

(source: EC and EEA)
Denmark has a considerably lower GHG intensity in the economy than the EU average, while GHG emissions per capita are slightly higher than the EU average. A relatively large share of emissions comes from agriculture (25.1 % vs. 12.0 % in EU 28). Emissions from agriculture have increased between 2005 and 2015.

(source: EC and EEA)
Preliminary accounts under the Kyoto Protocol for Denmark show overall removals of -3.9 Mt CO2-eq. as an annual average in the period 2013-2015. For comparison, the annual average of the EU-28 accounted for removals of -119.0 Mt CO2-eq. It should be noted that in this preliminary simulated accounting exercise, removals from Forest Management did still not exceed the accounting cap, which was mainly due to shifting from a sink to a source.
There are varying patterns of relative importance of activities. Removals by Forest Management were overall highest in 2013 and 2014, while its contribution to emissions is comparatively small in 2015. Removals by Cropland Management are important in all years. Of lesser importance are removals by Afforestation and emissions by Deforestation and Grassland Management. Overall, the graph depicts a highly varying pattern with above-mentioned reversals for Forest Management from a sink to a source. Afforestation depicts an increase in removals while emissions by Deforestation also increase over the course of the three-year period. In addition, preliminary accounted emissions by Grassland Management and removals by Cropland Management depict varying patterns over time.

Note: Forest Management credits are capped and presented as yearly averages when the total Forest Management credits of the considered period exceed the simulated cap over the same period.
(source: EC and EEA)
CO2 emissions in transport and alternative fuelled vehicles
CO2 emissions from road transport have decreased between 2005 and 2015, but were still 23.3 % higher in 2015 than in 1990. Thanks to a strong decrease between 2005 and 2016 (-35.2 % vs -27.3 % for the EU28), the average CO2 emissions of new cars in Denmark, which were higher than the EU average in 2005, were below the EU average in 2016.

(source: European Environment Agency)
The number of electric charging points in Denmark has over the last four years almost quadrupled, from 552 units in 2013 to 2 096 units in 2016.

(European Environment Agency)
(European Alternative Fuels Observatory)
National Policy Frameworks under Directive 2014/94/EU on alternative fuels infrastructure have to establish targets, objective and measures for the development of the market of alternative fuels in the transport sector and the deployment of the relevant infrastructure. Denmark has submitted its National Policy Framework as requested under article 3 of the Directive 2014/94/EU.
A detailed assessment of the Danish National Policy Framework in terms of its compliance with the requirements of Directive 2014/94/EU on alternative fuels infrastructure, its contribution to achievement of long-term energy and climate objectives of the Union and coherence of its targets and objectives in terms of cross-border continuity has been published as part of the Communication on Alternative Fuels Action Plans (COM(2017)652) and the related staff working document SWD(2017)365.
5.2.Adaptation to climate change
The Danish National Adaptation Strategy was adopted in 2008. Fourteen sectors of priority are identified: construction and housing, coasts and ports, transport, water, agriculture, forestry, fisheries, energy, tourism, nature, health, emergency preparedness, insurance, and spatial planning. An action plan for a climate-proof Denmark was launched in 2012, based on the notion that a responsible climate policy includes both working in the short and the long term. To date, there is seemingly no overall monitoring and evaluation mechanism of climate change adaptation, nor are there clear reports publishing progress on adaptation in different sectors.
5.3.Taxes on energy and transport
Denmark uses taxation as part of their climate policy, and has a carbon tax in place. It is a part of the overall energy taxation framework and is applied on all fuels, e.g. including heating oil fuels (light and heavy), natural gas and coal. High excise duties apply to electricity consumption, whereas biomass is exempt in line with the carbon tax framework. In terms of vehicle taxation, both the registration and circulation taxes reflect fuel efficiency.
The overall tax burden on energy and transport (including carbon taxation) in Denmark is nearly 3.9% of GDP, i.e. 1.5 percentage points higher than the EU average. It is particularly the tax burden on transport vehicles that is higher (1 percentage point) and on electricity and heat (0.9 percentage points). The tax burden on fuels is, however, below the EU-average. The overall tax burden on energy and transport has fallen since 2007, mainly due to lower tax revenue from vehicle taxation.

(source: Eurostat)
5.4.Renewable energy
With a 30.8 % share of renewable energy in final energy consumption in 2014, Denmark already attained its 2020 target of 30 %. Progress is the most noticeable in electricity generation (biomass and wind energy) and in heating (largely biomass).
The renewable energy share is more than 50 % in electricity generation and almost 40 % in heating and cooling.

(source: Eurostat-SHARES)

(source: Eurostat-SHARES)
The main way of supporting renewable energy in Denmark has been through the Public Service Obligation (PSO) scheme financed by a dedicated levy. As from 2017, Denmark is phasing out the PSO tax replacing it with revenues from the general State budget. The government based its decision on an evaluation of the PSO scheme, which showed that its impact on energy costs was too high compared to its effectiveness in promoting the development of renewables. In addition, the European Commission raised competition concerns over the PSO tax scheme, because electricity producers from other EU Member States exporting electricity to Denmark did not have access to subsidies under the same conditions as Danish energy companies. For some existing support schemes there will be a gradual phase-out from the PSO levy over a 5-year transitional period (2017-2021) during which the share of State budget financing will be increased each year.
It is estimated that thanks to the advances of renewable energy, Denmark consumed in 2014 21.6 % less fossil fuels and emitted 15.8 % less GHG.

(source: EEA)
5.5.Contribution of the Energy Union to better air quality
Air quality in Denmark continues to give cause for concern. For the year 2013, the European Environment Agency estimated that about 2,890 premature deaths were attributable to fine particulate matter (PM2,5) concentrations and over 60 to nitrogen dioxide (NO2) concentrations.
For NO2, Denmark reported exceedances of the binding EU air quality standard. For the year 2015, Denmark reported exceedances of the limit value for NO2 in 1 out of the 3 air quality zones in Denmark.

(source: EEA)
The health-related external costs from air pollution in Denmark have been estimated to be more than EUR 3 billion/year (income adjusted, 2010), which includes the intrinsic value of living a healthy life without premature death as well as the direct costs to the economy such as healthcare costs and lost working days due to sickness caused by air pollution.
The Energy Union can substantially contribute to addressing these air quality problems through measures reducing emissions of both GHG and air pollutants such as PM and nitrogen oxides (NOx) from major contributing sectors such as (road) transport, energy production, industry and residential heating (e.g. stoves and boilers).

(Source: EEA. This table reflects only sources of primary PM2,5 emissions.)
6.Research, innovation and competitiveness
6.1.Research and innovation policy
Denmark's particular strength in clean energy research, development and demonstration (RD&D) is offshore energy, in particular wind energy, but increasingly also wave energy which benefits from synergies with wind energy (e.g. wave energy converters are integrated in offshore wind turbine farms within R&I projects). Other areas with significant RD&D activity are energy efficiency and heating and cooling technologies.
The Energy Technology Development and Demonstration Programme (EUDP), is the biggest clean energy research and innovation funding programme in Denmark. The vast majority of EUDP grants are allocated to projects within the following fields of technology: biomass technologies, systems for transport and energy, wind power and other renewable energy technologies (e.g. solar power), hydrogen and fuel cell technologies, low energy buildings, energy-efficient solutions and energy-system integration, energy-efficiency technologies for oil and gas, and more efficient and environmentally friendly production in general (heat and power), including carbon capture and storage (CCS).
Demonstration activities are funded through the Green Labs demonstration programme, established in 2010. The Green Labs programme, which also aims at enabling more effective participation of SMEs, comprises nine large-scale demo facilities for new climate methodologies. Moreover, Energinet.dk, the Danish system operator, also funds energy research through the ELForsk programme (financed through the national-grid tariff). Denmark's consistent and prolonged public support for wind energy RD&D is also continuing today through Megavind, a strategic partnership for the entire Danish wind industry which aims at strengthening public-private cooperation between the State, private enterprises, knowledge institutions and venture capital to accelerate innovation processes within several areas of technology. Lastly, clean energy RD&D activities are also supported through the Innovationsfonden.
Denmark participates in only one of the temporary working groups for the implementation of the integrated Strategic Energy Technologies (SET) Plan actions, the group on offshore wind.
Regarding the Horizon 2020 (H2020) programme, Denmark has received so far 4.4% of the EU contribution devoted to the 'secure, clean and efficient energy' part of the programme. About 141 participations from Danish organisations have been awarded EUR 65 million in Horizon 2020 energy projects. The biggest amounts were attracted by offshore wind and wave energy sector, by smart cities/islands/grids' projects and by numerous energy efficiency projects. Non-negligible amount went to biofuel and biogas-related projects. Among the most prominent projects with Danish participation is the UPWAVE demonstration project of 1-MW wave energy converter integrated in an offshore wind turbine farm (EUR 12 million EU funding for Danish participants). Another important H2020 project in Denmark is HyBalance, which will be the first project in Europe to demonstrate the complete value chain from hydrogen renewable energy production to end users (3 of 6 project participants are DK entities). Hydrogen will be produced from water electrolysis and used for clean transportation. HyBalance is supported by H2020 through the European Fuel Cells and Hydrogen Joint Undertaking (EUR 8 million EU contribution). Renewable electricity produced by wind turbines stored in the form of hydrogen will support grid reliability, showing the potential of hydrogen in the future energy mix.
Denmark is a founding member of Mission Innovation. As a result, it has committed to doubling its public funding in clean energy R&I under EUDP programme, from DKK 292 million (approximately EUR 40 million) in 2016 to DKK 580 million (approximately EUR 80 million) in 2020.
6.2.Investments and patents in the Energy Union R&I priorities
In 2016, public (national) investments in the Energy Union R&I priorities reached EUR 99 million having decreased by 31 % compared to 2015. The highest share of investments (37 %) was attracted by the Renewables R&I priority of the Energy Union, followed by the Smart Systems and Sustainable Transport priorities (27 % and 18 % respectively). In the period 2007-2016, the maximum annual public investment was EUR 174 million, reported in 2010. In 2014, the most recent year for which data for most Member States are available, public investment per GDP in Denmark was twice the EU average.
Private investment in the Energy Union R&I priorities in 2013 was estimated at EUR 528 million (3 % of the private R&I investment in Energy Union R&I priorities in the EU). The focus was on Renewables, which received 44 % of these investments, followed by Efficient Systems with a share of 21%.
In 2013, the most recent year for which complete patent statistics are available, 77 companies and research organisations based in Denmark filed 220 patents in low-carbon energy technologies (3 % of the EU total). The focus was on Renewables (47 %), followed by the Efficient Systems (23 %) and Smart System priorities (17 %).
In 2013, private R&I investments and patents in Energy Union R&I priorities were higher than the EU average when normalised by GDP and by population respectively. In the period 2007-2013, both private R&I investments and the number of patents in the Energy Union R&I priorities increased on average by 12 % and 18 % per year, displaying higher rates of increase than the EU indicators (6 % and 15 % respectively).

Note: The international comparison (right) is shown for 2014 (Denmark had reported EUR 149 million). Reporting at EU level for 2015 is not as complete, and very few countries have reported for 2016.

(Data sources: Public investment as available in the International Energy Agency RD&D Statistics database for codes relevant to Energy Union RIC priorities. Patent data based on the European Patent Office PATSTAT database. Private investment as estimated by JRC SETIS. Detailed methodology available from the JRC.)
6.3.Competitiveness
In 2014, the real unit energy costs (RUEC) in Denmark were well below those at the EU average (6 vs 15.3), but also those in the US, Japan, China and Russia. The electricity prices paid by industrial customers with median consumption (annual consumption between 500 MWh and 2 000 MWh) in Denmark were below that of the EU average in the first half of 2016. Gas prices for industrial consumers with media consumption (annual consumption between 2 780 MWh and 27 800 MWh) are below the EU average.
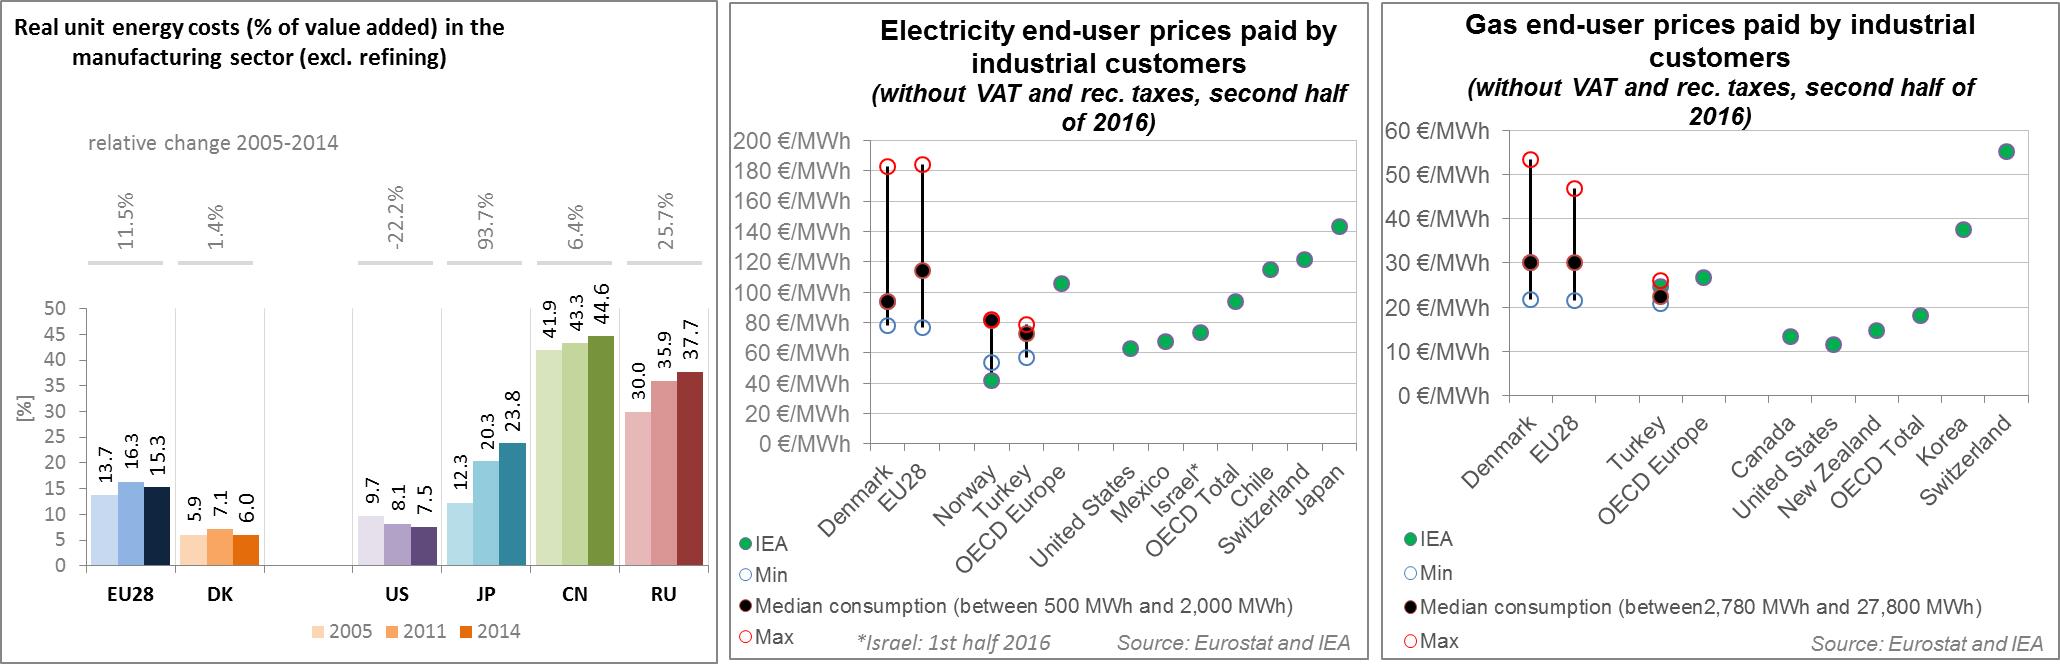
(source: ECFIN)
(source: ESTAT and IEA)
Regarding the competitiveness in wind and solar energy, Denmark is one of the main exporters in the wind sector, where it has a strong comparative advantage in particular for towers, blades, gearboxes and generators. In contrast, the relative strength is less pronounced for power electronics. As indicated by the revealed comparative advantage indicator
below 1, the Danish economy is, in contrast, not specialised in solar PV. The relative trade balance
confirms that Denmark is a strong net exporter of wind components, clearly above the EU average. The relative trade balance has also developed positively since 2005.

7.Regional and local cooperation
In June 2016 Denmark signed the Political Declaration on energy cooperation between the North seas countries. This Declaration has established a High-Level Group on North Seas Energy Cooperation to give the necessary political impetus to a project which is fundamental to facilitate the cost-effective deployment of offshore renewable energy and to promote further interconnection and further integration of wholesale electricity markets around the North Sea. Through a coordinated approach it will be allowed to achieve market integration and the integration of substantial amounts of indigenous low carbon generation, at lower cost and with an optimal use of maritime space (avoidance of conflicts with other North Sea users).
Denmark is part of the Baltic Energy Market Interconnection Plan (BEMIP). BEMIP’s main objectives are to develop an internal and regional energy market between the EU Member States in the Baltic Sea region and integrating it fully into the EU's energy markets thus increasing security of supplies. BEMIP projects have been part of the European Economic Recovery Plan (EERP) and the Trans-European Energy Networks Programme. BEMIP projects have also been funded through the EU's structural funds, including the European Regional Development Fund (ERDF) and the Cohesion Fund (CF). Many infrastructure projects are supported through CEF co-funding amounting to 534.3 million euro. In the framework of the societal challenge for secure, clean and efficient energy of the Horizon 2020 programme, 16.9 million euro is allocated to participants from the Baltics to stimulate research and innovation in this field.
Denmark is also part of Nordic Cooperation together with Iceland, Norway, Sweden, the Faroe Islands, Greenland, and Åland. As part of the modernisation and reform process towards a 'New Nordic Region', it was decided to commission strategic reviews of all sectors. On 27 October 2015, the energy ministers agreed to commission a strategic review of co-operation in their sector. The objective is to ensure effective co-operation now and for the coming 5 to 10 years. The report on this was issued in June 2017.
The electricity markets of Norway, Sweden, Finland, Denmark, Estonia, Latvia and Lithuania together form the Nordic and Baltic electricity market. The common electricity market combines the wholesale markets in the Nordic and Baltic countries, creating the price signals to produce electricity where the price is lowest. The Nordic Council tasked the Nordic National Regulatory Authorities (NordREG) to develop a truly common Nordic electricity market. Many steps have been taken to transform the nationals market to allow 'Nordic' consumer's access to supplier from other Member States. Recent measures include the development and progressing implementation of the supplier centric market processes and of data-hubs.
The Nordic Energy Technology Perspectives 2016 presents technology pathways towards a near-zero emission Nordic energy system by 2050. The analysis is presented around the Nordic Carbon-Neutral Scenario which results in 85 % reduction of emissions by 2050 (compared to 1990 levels). The analysis is performed by Nordic Energy Research in cooperation with the International Energy Agency.
The EU macro-regional strategy for the Baltic Sea Region in which Denmark takes part can be used as a basis for regional cooperation on energy. European Territorial Cooperation – 'Interreg' – under EU cohesion policy also provides further opportunities for cross-border, transnational and interregional cooperation, including in the Energy Union areas.
Cities and urban areas have a key role in the energy and climate challenge. The Urban Agenda for the EU, established by the Pact of Amsterdam in May 2016, better involves cities in the design and implementation of policies, including those related to the Energy Union. It is implemented through Partnerships, in which the Commission, Member States, cities and stakeholders work together on a number of important areas, including on Energy Transition, Urban Mobility, Air Quality, Climate Adaptation and Housing.
By 2016, in the context of the Covenant of Mayors, the sustainable energy action plan delivered in Denmark covered about 2.9 million inhabitants (more than half of the population) in 36 municipalities. Overall, these municipalities committed to reducing GHG emissions by 26.3% by 2020 compared to the 1990 baseline, somewhat less than the average of all submitted plans.

In Denmark, by September 2016, 4 cities (covering 0.68 million inhabitants) have committed to conduct vulnerability and risk assessment and develop and implement adaptation plans in the framework of the Covenant of Mayors for Climate and Energy.
8.Cohesion policy and EU-supported clean energy investments
EU cohesion policy makes a key contribution to delivering the Energy Union objectives on the ground, including investment possibilities to implement energy policy objectives in Denmark which are complemented by national public and private co-financing, aiming at optimal leverage. It also ensures integrated territorial solutions to energy and climate challenges, supports capacity building and provides technical assistance.
Over 2014-2020, cohesion policy is investing some EUR 41 million in energy efficiency improvements in SMEs in Denmark. Cohesion policy is also investing significantly in R&I and in SME competitiveness in Denmark, based on the national strategy for smart specialisation. For Denmark, the strategy includes a focus on assisting SMEs in developing resource efficient business plans, production methods and operations. At this stage, at least EUR 11 million is foreseen for investments in R&I and adoption of low-carbon technologies in Denmark, but this might increase further in line with the evolving content of the smart specialisation strategy.

Source: DG Regio
Overall, the EU cohesion policy investments in Denmark over 2014-2020 are expected to contribute to an estimated annual decrease of GHG emissions of around 41,000 tonnes of CO2eq.
For example, the project "Development programme for sub-suppliers in the windmill industry: Innovation through cooperation in knowledge" is located in Central Jutland and runs from January 2016 to December 2018. Project partners are Aarhus University, the Danish Technical University, Aalborg University, and the Danish Advanced Manufacturing Research Center (DAMRC F.M.B.A.). The main objective of the project is that several small and medium-sized sub-suppliers to the windmill industry develop new product and process innovations through co-operation with knowledge institutions, thereby increasing their innovation potential. It is expected that the project results in 15 new innovative businesses, 70 new jobs, and EUR 16 million additional turnover and EUR 5 million additional export revenues. In order to achieve the highest possible synergies, the windmill industry is lead partner in all three work packages. The eligible expenditure amounts to DKR 17.25 million (EUR 2.3 million), whereof 50 % from the European Regional Development Fund (ERDF).
As another example, the "Growth plans in SMEs: We Know How You Grow with Less Energy" project is located in Middelfart, South Denmark, just across the bridge from Fredericia. The project is to create several growth businesses for sustainability and energy efficiency in South Denmark with a focus on SMEs. The expected results are additional export revenues of 20%, and 10% more jobs for the participating businesses. The activities concern among others screening of and advice to businesses for the development of concrete growth plans. Running from December 2014 to December 2017, the projects represents eligible expenditure of DKR 14.3 million (EUR 1.9 million), whereof 50 % from the European Regional Development Fund (ERDF).
Through its support to sustainable transport systems, the Connecting Europe Facility (CEF) also contributes to the goals of the Energy Union. Following Danish participation in the CEF – Transport 2014-2015 Calls, the Danish action portfolio comprises 22 signed grant agreements, allocating EUR 658.7 million of actual CEF Transport Funding to Danish beneficiaries (state-of-play February 2017). The transport mode which receives the highest share of funding is rail (92.3 % of actual funding). The greatest part of the CEF funding allocated to Denmark is concentrated in implementing the Fehmarn Belt fixed link, aiming to construct cross-border railway tunnels between Denmark and Germany.
Denmark continues to demonstrate a strong commitment to the greening of the maritime sector, developing new technologies and upgrading a number of maritime links through better performance of ships and increased handling efficiency of ports. In the area of Air Traffic Management (ATM), Denmark is involved through multi-beneficiary actions that intend to develop and use harmonised best practices. The actions include the convergence of DSNA and ATM Systems of the COOPANS (Alliance of air navigation service providers of Austria, Croatia, Denmark, Ireland and Sweden), the deployment of the Single European Sky ATM Research (SESAR), as well as the implementation of a harmonised air navigation service within the Functional Airspace Block of Denmark and Sweden.


