 EUROPEAN COMMISSION
Brussels, 18.12.2020
SWD(2020) 397 final
COMMISSION STAFF WORKING DOCUMENT
Commission recommendations for Hungary’s CAP strategic plan
Accompanying the document
COMMUNICATION FROM THE COMMISSION TO THE EUROPEAN PARLIAMENT, THE COUNCIL, THE EUROPEAN ECONOMIC AND SOCIAL COMMITTEE AND THE COMMITTEE OF THE REGIONS
Recommendations to the Member States as regards their strategic plan for the Common Agricultural Policy
{COM(2020) 846 final} - {SWD(2020) 367 final} - {SWD(2020) 368 final} - {SWD(2020) 369 final} - {SWD(2020) 370 final} - {SWD(2020) 371 final} - {SWD(2020) 372 final} - {SWD(2020) 373 final} - {SWD(2020) 374 final} - {SWD(2020) 375 final} - {SWD(2020) 376 final} - {SWD(2020) 377 final} - {SWD(2020) 379 final} - {SWD(2020) 384 final} - {SWD(2020) 385 final} - {SWD(2020) 386 final} - {SWD(2020) 387 final} - {SWD(2020) 388 final} - {SWD(2020) 389 final} - {SWD(2020) 390 final} - {SWD(2020) 391 final} - {SWD(2020) 392 final} - {SWD(2020) 393 final} - {SWD(2020) 394 final} - {SWD(2020) 395 final} - {SWD(2020) 396 final} - {SWD(2020) 398 final}
Contents
1.Commission recommendations for Hungary’ CAP Strategic Plan
1.1
Foster a smart, resilient and diversified agricultural sector ensuring food security
1.2
Bolster environmental care and climate action and contribute to the environmental- and climate-related objectives of the Union
1.3
Strengthen the socio-economic fabric of rural areas and address societal concerns
1.4
Modernising the sector by fostering and sharing of knowledge, innovation and digitalisation, and encouraging their uptake
1.5
Recommendations
2.Analysis of agriculture and rural development in Hungary
2.1
Support viable farm income and resilience across the EU territory to enhance food security
2.2
Enhance market orientation and increase competitiveness including greater focus on research, technology and digitalisation
2.3
Improve farmers' position in the value chain
2.4
Contribute to climate change mitigation and adaptation, as well as sustainable energy
2.5
Foster sustainable development and efficient management of natural resources such as water, soil and air
2.6
Contribute to the protection of biodiversity, enhance ecosystem services and preserve habitats and landscapes
2.7
Attract young farmers and facilitate business development in rural areas
2.8
Promote employment, growth, social inclusion and local development in rural areas, including bio-economy and sustainable forestry
2.9
Improve the response of EU agriculture to societal demands on food and health, including safe, nutritious and sustainable food, as well as animal welfare.
2.10
Cross-cutting objective on knowledge, innovation and digitalisation
1.Commission recommendations for Hungary’ CAP Strategic Plan
In the framework of the structured dialogue for the preparation of the common agricultural policy (CAP) strategic plan, this document contains the recommendations for the CAP strategic plan of Hungary. The recommendations are based on analysis of the state of play, the needs and the priorities for agriculture and rural areas in Hungary. The recommendations address the specific economic, environmental and social objectives of the future CAP and in particular the ambition and specific targets of the Farm to Fork Strategy and the Biodiversity Strategy for 2030. As stated in the Farm to Fork Strategy, the Commission invites Hungary, in its CAP strategic plan, to set explicit national values for the Green Deal targets, taking into account its specific situation and these recommendations.
1.1
Foster a smart, resilient and diversified agricultural sector ensuring food security
The shift to a sustainable food system presents significant economic opportunities as well as challenges for Hungarian farmers.
The economic performance of Hungary’s agricultural sector (both farmers and food businesses) has been positive overall in recent years. The gradual growth of entrepreneurial income and the fact that it is closing the gap with the rest of economy are significant indicators of economic progress. Hungarian farmers have improved on their relatively good position in the value chain, and this has allowed them to benefit from the expansion and capture an increasing share of the added-value. Farm products have remained competitive and the agricultural trade balance positive, this indicates that, on balance, Hungary has managed to take advantage of the opportunities offered by the single market. However, besides efficiency gains and the general expansion of consumer demand, public support (inter alia income support) has also been key in the sector’s development, which indicates a degree of dependency.
The consolidation in the number of farms and farm sizes continued, increasing the economic efficiency of agriculture. However, productivity (inter alia labour productivity) is still lagging behind. Structurally, although Hungary is characterised by highly concentrated access to land, it also has a large number of small farms (including many subsistence/semi-subsistence farms). Bigger operators, who enjoy a better position in the value chain and easier access to financing, seem to have less of a need for income support, partially thanks to increasingly available self-help tools. For instance, although risk-management tools (e.g. livestock insurances, on-farm strategies, better exploitation of forward/futures markets) are generally well established with broad coverage of various risks, their actual use by farmers still leaves room for improvement. The emerging challenges stemming from climate change and the ensuing uncertainty call for efforts to explore further options to help farmers to manage risks.
While maintaining competitiveness and the capacity to create jobs in farming and the wider agri-food economy in order to ensure continued growth, the agricultural sector should gradually change its growth pattern to take advantage of the opportunities of a greener, more modern and more sustainable agriculture as well as those arising from cooperation, innovation and increased focus on consumer demand.
1.2
Bolster environmental care and climate action and contribute to the environmental- and climate-related objectives of the Union
The economic growth that Hungary has experienced (and should pursue in order to ensure economic viability for businesses and contribute to social sustainability in rural areas) does not appear sustainable from an environmental and climate point of view.
The state of natural resources, in particular as regards biodiversity, has got significantly worse owing to a number of factors, including the intensification of agricultural practices on arable land and a deterioration in the state of grasslands. This calls for efforts to halt biodiversity loss and restore non-productive features and natural areas such as wetlands in line with the target set in the biodiversity strategy. Biodiversity also needs to be improved in forested areas in order to access their full potential. It is essential to ensure sustainable forest management and afforestation, thus enhancing multi-functionality, forest protection and the restoration of forest ecosystems in order to ensure the good condition of habitats and species, enhance ecological services and build resilience to threats.
After sharp initial falls in the 1990s, other factors such as greenhouse gas (GHG) and ammonia emissions have stabilised or even increased since 2012 and today Hungary is at high risk of non-compliance with the ammonia emission reduction commitments for 2020-2029 and for 2030 and beyond.
As regarding nutrients, the presence of some issues relating to nitrate concentration, in particular rising concentrations in groundwaters and surface waters since 2004 (and probably before) point to the potential presence of hotspots that should be addressed to contribute to the relevant Green Deal target.
Besides restoring natural features and switching to a more sustainable production model, the sector should also prepare for upcoming challenges linked to climate change that will make the management of resources (especially water) very critical to ensuring its production potential. Apart from adaptation, it has great potential to mitigate the adverse impacts of climate events and to contribute to the circular economy. For instance, studies indicate that rewetting agricultural land in Hungary has significant potential to reduce GHG emissions: rewetting 1% of its agricultural area could reduce its agricultural GHG emissions by 24%, while contributing to biodiversity
I
. Finally, despite remarkable growth in recent years, organic farming has seen a drop in the share of utilized agricultural area (UAA) under conversion to organic and is still far short of Green Deal target. Obstacles to further growth should therefore be addressed.
For all of the above processes to produce the desired outcomes, it is vital to secure the understanding and participation of the farming community. On the one hand, this will require new business models that generate income, to make it more attractive for farmers to adapt their farming practices. On the other, solid obligations (good agricultural and environmental conditions (GAECs) and statutory management requirements (SMRs)) are also needed, to ensure level-playing field and enforcement to prevent farmers producing below the necessary standards from gaining a cost advantage. Besides subsidies to guide farm practices, advice for farmers on more technically complicated production methods will be essential for success. Finally, to contribute to the Green Deal, there is also a need for a more integrated policy combining soil management and nutrient policy, manure management, climate mitigation, biodiversity and landscapes.
1.3
Strengthen the socio-economic fabric of rural areas and address societal concerns
Despite progress in several domains, thanks to public investment and robust economic growth in Hungary, rural areas still suffer from several disadvantages, including a lack of basic infrastructures and services, investment and innovation. They also display a high poverty rate, especially as compared with urban areas. They are characterized by high unemployment among vulnerable groups, an ageing population and lower educational and training levels (in farming and other sectors). The rate of economic activity among women is especially low. These weaknesses have resulted in outmigration, especially among young people and women. The employment rate can be enhanced with targeted investment in human skills, basic services and infrastructures and by boosting economic development in rural areas (e.g. via the bioeconomy). Agriculture still plays an important role in the rural economy, but faces difficulties in attracting newcomers. Besides structural problems in rural areas, young farmers face additional obstacles in the form of a lack of financing and access to land. Moreover, efforts should be made to close gender gaps in employment, pay, pensions, and decision-making.
As regards the transition to safe, nutritious and sustainable food and better animal welfare, the situation is mixed in Hungary. The sale of plant protection products is slowly decreasing and the trend needs to be further encouraged in view of the Green Deal target, by prioritising the reduction of more hazardous pesticides and through integrated pest management. As regards the use of antimicrobials, there is room for improvement if Hungary is to contribute to the Green Deal target of cutting sales by 50%. Challenges associated with animal welfare and biosecurity in view of the risk of African Swine Fever (ASF) persist, calling for continued awareness. Hungary should also promote healthier diets, as it has a very high burden from non-communicable diseases due to dietary risk factors. New consumer expectations of a more nature-friendly, traditional, local and quality agriculture producing healthier and more sustainable food with the use of innovation and new technologies also have the potential to drive a change in production methods, increase the attractiveness of the sector and hence to contribute to the revival of rural areas. They should therefore be addressed in a more focused way.
The high standards of EU agriculture will obviously need to be preserved in the process. For instance, ensuring the protection of agricultural workers, especially those in precarious, seasonal and undeclared employment, will play a major role in delivering on the respect of rights enshrined in legislation. Such rules are also an essential element of the fair food system envisaged in the Farm to Fork Strategy.
1.4
Modernising the sector by fostering and sharing of knowledge, innovation and digitalisation, and encouraging their uptake
The overall educational and knowledge level of farmers and others living in rural areas is still below the EU average, hindering their capacity to improve their skills or be more active in the labour market. There is a rather low uptake of the planned rural development budget for knowledge exchange, training, information, advice and interactive innovation projects. To bring about large-scale change, besides enhancing training and innovation, it is crucial that the results of innovation and technical advance be made more broadly available to farmers and the rural population, so that they can be put to good use. In this context, Hungary should link existing resources and make full use of a well-functioning, widened, agricultural knowledge and information system (AKIS) and the agricultural European innovation partnership (EIP AGRI). Including more downstream food system-related businesses, operational groups, living labs and accelerators, and better integrating information, knowledge, advice, innovation and digital skills (which farmers will need more and more), should also help Hungary’s farming sector to become smarter, more sustainable and more productive. To enable changes and meet the ambition of the Green Deal, broadband connectivity should also be further expanded.
1.5
Recommendations
To address the above interconnected economic, environmental/climate and social challenges- the Commission considers that the Hungarian CAP strategic plan needs to focus its priorities and concentrate its interventions on the following points, while adequately taking into account the territorial diversity of the Hungarian agriculture and rural areas:
Foster a smart, resilient and diversified agricultural sector ensuring food security
·Improving the viability of farms by better addressing the income gaps among different (professional) farm sizes, sectors and territories. Recommended approaches include: strengthened redistribution by applying, for example, the round sum payment for small farmers, the reduction of payments and the complementary redistributive income support for sustainability, which reflect actual support needs in light of the economic, social and territorial objectives and further encouraging the use of risk management instruments.
·Promote market orientation and competitiveness of the farming and agri-food sector by further supporting investments in logistics and processing.
·Strengthen the position of farmers by supporting: farmer cooperation - in particular through producer organisations which integrate their economic activities; farmers’ engagement in more downstream activities; innovation; and the development of new markets.
·Increase the resilience of the farm sector by supporting it to add value to products – e.g. via EU quality schemes (including organic farming), processing or specialisation in products for which Hungary has a competitive advantage.
Bolster environmental care and climate action and to contribute to the environmental- and climate-related objectives of the Union
·Halt and reverse the loss of biodiversity and improve the conservation status of farm and forest habitats in line with the priorities defined in the Prioritised Action Framework, i.e. by offering support to maintain and re-establish landscape features beneficial for biodiversity on agricultural land via investments or area-based payments, thereby contributing to the EU Green Deal target on high diversity landscape features.
·Prepare agriculture for challenges on water management by: limiting the conversion of areas with high soil water retention (SWR) capacity and organic matter (grasslands, peatlands, wetlands, etc.); supporting the reconversion to such areas (especially the deep-lying, regularly inland-watered, soil-defective areas); promoting practices improving soil organic matter such as conservation/zero tilling and arable land cover during winter; and investing in irrigation systems taking account of the issue of SWR and the potential for water reuse.
·Improve the efficiency of nutrient management to reduce losses and pollution to soil, air and water, by applying reduction measures ranging from low-emission animal housing to manure storage and fertilisation application techniques, thereby helping to achieve the Green Deal target on reducing nutrient losses. Ensure action via a mix of obligations and funded interventions to improve the situation in particular in hotspots and to promote a wider transition to precision farming through funded schemes.
·Contribute to the EU Green Deal target on organic farming by supporting sustainable (re)conversion and maintenance of organic farming, by using all possible incentives from investments in processing and local markets - to participation in quality schemes and promotion activities (with a particular focus on sectors where progress is slower).
·Promote climate mitigation practices and adaptation instruments, for instance by designing carbon farming approaches to remunerate carbon sequestration, afforestation, incentivising soil carbon sequestration and the reduction of soil erosion (e.g. catch and cover crops), improving feed and manure management to decrease methane emissions (in line with the Methane Strategy), encouraging the use of site-adapted mix of species that are more resistant to climate change.
Strengthen the socio-economic fabric of rural areas and address societal demands
·Reversing depopulation and ageing trends in rural Hungary, by supporting investments in access to basic services and infrastructures, boosting the local economic activity also by supporting local initiatives and new sectors (i.e. bio-economy) with particular attention to the most vulnerable groups. In doing so it will be important to ensure synergies with other EU and national funds.
·Making the agricultural sector more attractive for newcomers - with particular attention to territories lagging behind - by supporting the use of smart, innovative and local solutions that address (where necessary) issues of access to land, credit and training.
·Contributing to the achievement of the EU Green Deal target on antimicrobials by putting in place sizeable efforts to significantly reduce the use of antimicrobials in farming, considering that the figures indicate sales of antimicrobials above the EU average. Hungary is encouraged to use all available tools, including instruments under the CAP to support the farmers e.g. by promoting best practices on reduced and prudent use of antimicrobials, together with improved livestock management, biosecurity, infection prevention and control.
·Improving animal welfare, especially for pigs, and farm biosecurity, through support for improved livestock practices.
·Contributing to the Green Deal target on pesticides by strengthening the efforts to decrease the quantities and risks of most hazardous used pesticides and promoting the sustainable use of pesticides, in particular by ensuring the uptake of integrated pest management practices
Fostering and sharing of knowledge, innovation and digitalisation in agriculture and rural areas, and encouraging their uptake
·Contribute to the EU Green Deal target on broadband connectivity by completing investments in a timely manner for fast broadband connection coverage in rural areas. In doing so it will be important to ensure synergies with other EU and national funds.
·Empower farmers, agri-food businesses and people living in rural areas, by fostering knowledge, skills and technological development, exchange, research, advice, digitalization and innovation projects by strengthening the existing connections among research, education, and farming advice, and by providing innovation support across the farming and the rural community.
2.Analysis of agriculture and rural development in Hungary
Agriculture in Hungary has always been an important part of the country's economy and is an important contributor to the export performance. Agricultural output is varied and balanced between arable crops and the animal sector. The sector continues to have a fragmented structure, with an important share of small and medium-sized farms. State of environment and ongoing climate change however put production potential at risk and force adaptation and a transition to more sustainable practices.
Rural areas in different parts of Hungary are diverse and face quite different socio-economic conditions, but many areas are lagging behind. They host about 19% of the national population.
2.1
Support viable farm income and resilience across the EU territory to enhance food security
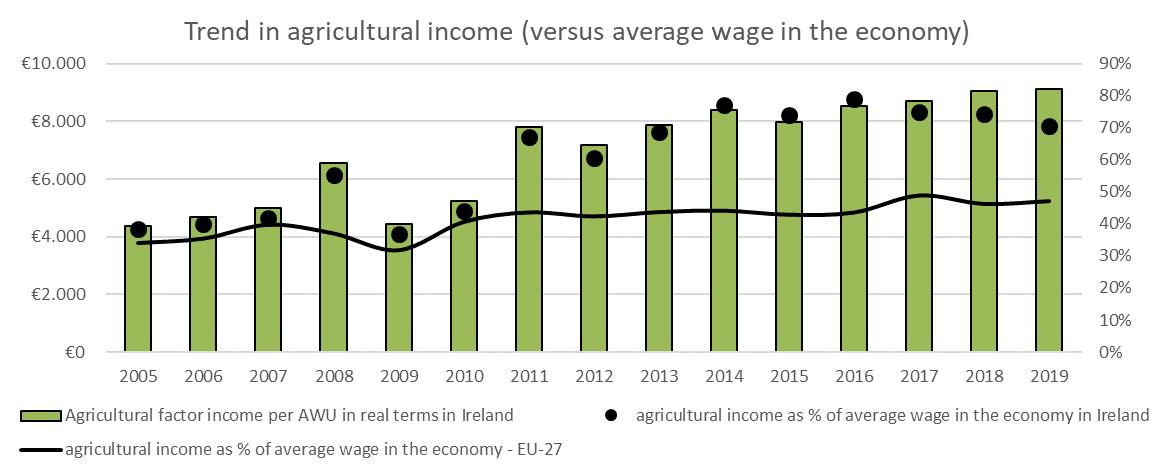
The average entrepreneurial income in agriculture almost tripled between 2005 and 2018, ultimately reaching 9 100 EUR per annual work unit (AWU).
II
This reduced the gap with the EU average (from -60% to -43%). Besides, it reached 74% of the average wages in the Hungarian economy, a ratio much more favorable than the EU average (i.e. 46%).
III
Agricultural factor income also improved spectacularly between 2005 and 2018: from 4 400 to 9 000 EUR/AWU
IV
, although still remaining well below the EU average.
EU subsidies play a key role in farm revenues and thus in their economic viability. On average, almost half (47% in 2018) of the factor income comes from subsidies: 34% from direct payments (DP), 9% from rural development programme (RDP) payments and further 5% from other subsidies.
V
These shares are quite balanced over the various economic farm sizes, with slightly lower values only in case of the smallest and largest farms. The unit amount of direct payments (255 EUR/ha on average in 2018) show only moderate differentiation per hectare
VI
, arising from coupled support payments, capping of payments to larger farms and the young farmer and small farmer schemes in particular. The Single Area Payment Scheme, representing 55% of the direct payments envelope, covers 93% of the utilised agricultural area and provides a uniform rate (148 EUR/ha in 2018).
VII
A number of the previously mentioned measures aim to strengthen the redistribution to smaller than average farms, but these have very limited impact based upon the indicator measuring redistribution to smaller farms.
VIII
The distribution of direct payments (20% of farms receive 84% of direct payments) thus mirrors the relatively high concentration of land (also 20% / 84%).
IX
An analysis of the factor income development highlights various needs for income support, depending on the following factors:
·Farm size: ¾ of the Hungarian farms are below 4 000 EUR of economic size, many of these actually semi-subsistence farms often below the minimum requirements for DP (only 40% of all holdings benefit from DP). Farms below 10 ha (or EUR 15 000 of economic size
X
) show characteristically low factor income (around, or even below 10 000 EUR/AWU); but this value gradually grows with the farm size, reaching a distinctive peak (between 30 000 and 40 000 EUR/AWU) in the 100 to 500 ha size class (or EUR 100 000 to 500 000 of economic size). The 500+ ha farms, representing around 30% of the UAA, show somewhat lower factor income partly due to their lower subsidies (capping above EUR 176 000) and to very high employment on these farm (lower labor productivity in those classes). Cooperatives are strongly represented in this size class.
XI
·Agricultural sector: Fruits, wine and sheep & goat generate the lowest FNVA, whereas COP, cattle and other field crops the highest. VCS, which takes up 15% of the direct payments envelope, aims to accommodate the additional support need in 7 sectors facing difficulties (highest amounts earmarked in the dairy, beef, sheep & goat, fruit & vegetables and protein crop sectors). Some of these sectors, cattle in particular, already show signs of recovery, whereas in others (e.g. sheep & goat, fruits) the factor income remains still low.
XII
·Region: Regional differences exist, but they are relatively limited. ANC payments were provided until 2019 (phasing out), but only a smaller share (20.7%) of the UAA was designated as ANC (no mountain ANC), whose increased CAP support (Pillar 2) seemed to compensate fully their moderate efficiency gap (and some years even further). There is no definition of ANC under RDP since 2020.
XIII
Agricultural income as % of average wage in the economy
Agricultural income as % of average wage in the economy – EU-27
Agricultural factor income per AWU in real terms
Trend in agricultural income (versus average wage in the economy) in Hungary
 Risk management possibilities are generally well-established. It is a combination of national and EU instruments, combining insurances and investments. Under the rural development programme, Hungary supported risk prevention investments against natural disasters. In terms of climatic risks, centrally coordinated indemnity based multiple-peril crop insurance is compulsory above a certain area threshold (90+% uptake). Besides, subsidized crop insurance contracts (implemented under the 2nd pillar of the CAP) also show development. However, the non-subsidized livestock insurances have low uptake (only 4% share from all agricultural insurances) due to the high fees. The income stabilisation tool, programmed in the 2014-2020 RDP, is to be implemented from 2021. Forward contracts have exceptionally high uptake (50+% for crop farms, dairy, pig and poultry); but futures contracts have low penetration (below 5% for cereals and protein crops, none for livestock) due to the lack of liquidity and knowledge. On-farm strategies exist, but there is still room for improvement.
XIV
Risk management possibilities are generally well-established. It is a combination of national and EU instruments, combining insurances and investments. Under the rural development programme, Hungary supported risk prevention investments against natural disasters. In terms of climatic risks, centrally coordinated indemnity based multiple-peril crop insurance is compulsory above a certain area threshold (90+% uptake). Besides, subsidized crop insurance contracts (implemented under the 2nd pillar of the CAP) also show development. However, the non-subsidized livestock insurances have low uptake (only 4% share from all agricultural insurances) due to the high fees. The income stabilisation tool, programmed in the 2014-2020 RDP, is to be implemented from 2021. Forward contracts have exceptionally high uptake (50+% for crop farms, dairy, pig and poultry); but futures contracts have low penetration (below 5% for cereals and protein crops, none for livestock) due to the lack of liquidity and knowledge. On-farm strategies exist, but there is still room for improvement.
XIV
Source: DG AGRI, based on EUROSTAT
XV
2.2
Enhance market orientation and increase competitiveness including greater focus on research, technology and digitalisation
The agri-food trade balance in Hungary is positive
XVI
(both for EU and non-EU trade). The Hungarian agri-food sector is dominated by micro and small-sized enterprises (92%) in terms of numbers, though it may be assumed that the bulk of the output in most sectors comes from medium and large enterprises (the actual figures differ by sector). The agri-food industry is labour-intensive. In terms of production value, the five main agri-food sub-sectors are: milk processing and dairy products (9.6%), meat processing and preserving (9.4%), poultry meat processing and preserving (9.3%), other fruit and vegetable processing and preserving (7.2%), and beverages and mineral water production (7.1%)
XVII
. Over the last five years, turnover and sales have increased significantly, driven mainly by exports. However, between 2014 and 2017 the number of enterprises decreased by almost 10%. In general, export-oriented agri-food companies perform better than those focused on the local market.
Hungarian crop outputs, of which cereals (27%), industrial crops (12%) and vegetable & horticultural products (9%), represents 58% of agricultural goods outputs whereas Hungarian animal outputs counts for 37%, with poultry and pigs counting for 11% and 10% respectively
XVIII
.
The total number of farms declined steeply between 2005 and 2016 from 715 000 to 430 000 (which represents 4% of EU-27 holdings). A vast majority of them has less than 5 ha UAA (81%) and an economic size of less than 4000 EUR (80%). Almost ¾ of the holdings (72%) belong to male holders. Fixed capital consumption is slightly decreasing
XIX
. The average farm size increased from 8 to 12 ha in the same time period
XX
. The agricultural area decreased in the same time period from 5.8 million hectares in 2005 to 5.3 million hectares in 2016. The decline in agricultural area appears both in arable land and in permanent grassland
XXI
.
The number of livestock units has decreased from 2.5 million to 2.44 million LU. The livestock density over the total period remained stable around 0.43 LU/ha, though the proportion of UAA extensively grazed increased from 10% in 2005 to 19% in 2013
XXII
.
Employment in the agricultural sector accounts for 4% of the total Hungarian employment while forestry accounts for 0.3%. Labour productivity in agriculture in Hungary is the sixth lowest among EU-27
XXIII
.
The total factor productivity (TFP) has increased in Hungary. The decreasing capital productivity in the period 2007-2012 suggest investments that did not immediately resulted in improved output. The increased labour productivity is mainly a result of an outflow of labour (-19% between 2005 and 2017). The capital productivity presents the returns on investments. Land productivity reflect the developments in yields and rents.
There has been a steep increase in investments amongst individual agricultural producers between 2015 and 2019, triggered by the inflow of CAP payments and other public support. Yet, the main constraint faced by farmers in accessing finance is a lack of business data as well as farmer’s lack of an adequate business plan
XXIV
.The major problem for the sector is a lack of financial resources for technological development and innovation, due to the sector’s low profitability. There is a need to create innovative financing approaches to allow agri-food companies to modernise their technologies, equipment and buildings, catering at the same time for their current indebtedness and rather low level of profits
XXV
.
Total factor productivity in agriculture in Hungary (Index 2005 = 100)
Intermediate costs productivity
Total factor productivity
 Source: EUROSTAT for TFP and DG AGRI for partial productivities
2.3
Improve farmers' position in the value chain
Between 2008 and 2017, the share of agriculture in the total value added along the food supply chain (FSC) in Hungary oscillated around 40-52%, well above the EU average of 23-26%, which indicates that Hungary’s food supply chain is perhaps not as complex and developed as the chain in other Member States. In absolute terms, the gross value added by producers in Hungary rose from an average of € 3.3 billion in 2008/09 to an average of € 4.8 billion in 2016/17
XXVI
.
This increase of 45 % has to be seen in the context of an increase of only 34% of the total value added along the FSC, which rose from an average of € 7.7 billion in 2008/09 to an average of € 10.3 billion in 2016/17
XXVII
. This means farmers in Hungary capture more of the value added along the FSC than the average EU farmer, and they also capture more of the growth of the value added in the FSC in Hungary compared to food manufacturers, distributors and consumer services. Exports of primary products to other EU countries for processing appear to play a determining role in potential added-value both for farmers and domestic food manufacturers.
On the other hand, farmers do not manage to keep the development of agricultural incomes in line with the evolution of salaries in other sectors of the economy (that in particular the last years (2017-19) increased much faster
XXVIII
). While having caught up with the average national wage for many years, over the last years (2014-18), agricultural incomes stabilised at barely 80 % of the average national wage, even if this is much higher than the EU average
XXIX
.
In terms of sectors where farmers in Hungary create most value, the crop sector generates 62% of the agricultural output, in particular through cereals (25%), industrial crops and vegetables & horticulture. In the animal sector, poultry production (11 %) is the biggest contributor to Hungary’s agricultural output
XXX
. The share of agricultural products in total retail sales of packaged food is above the EU average (47% vs 40%)
XXXI
.
Along the FSC, the importance of discounters is relatively high in Hungary
XXXII
and compared to other Member States (MSs) the concentration in the food retail sector is fairly average (in 2012 the five largest retailers in the grocery sector had a market share of 67%, whereas in other MSs the ratio ranges from 19-76%)
XXXIII
. The concentration of the Hungarian food retail sector is high but does not exceed the EU average
XXXIV
.
Within the agricultural sector itself, there has been an ongoing concentration of holdings; the number and area of the smallest farms have decreased, while those of the larger farms increased. Already in 2005, 1.3% of the largest farms (i.e. those having at least 50 hectares) cultivated 43% of Hungary’s total farm area, while the bulk of farms (73%) cultivated only 5% of the total area
XXXV
.
One way for farmers to improve their position in the FSC is to cooperate in producer organisations (POs). In 2017 there were 69 recognised POs in two agricultural sectors in Hungary, which makes 104 recognised POs per million holdings – versus an EU average of 254 recognised POs per million holdings. Almost half of the POs (30) have been recognised since 2010, and almost all (64) were recognised in the fruit & vegetables (F&V) sector. In the latter, no PO has an annual turnover over € 50 million, which means none is bigger than a small and medium-sized enterprise, and overall these POs add only 19% of the value generated in the F&V sector – versus an EU average of 38%. In Hungary there are also estimated to be at least 1 000 agricultural cooperatives, mostly not recognised as POs, with market shares in their respective sectors of around 20%, which is less than in most other MSs
XXXVI
. Hungary has also recognised 9 IBOs contributing to a higher degree of vertical cooperation in the chain.
Hungary has specific national legislation in place (that is only applicable towards retailers, though), to tackle UTPs through a general clause, empowers POs to participate in the proceedings, and has already led to investigations.
XXXVII
In Hungary, food prices are 15% below the EU average
XXXVIII
, but producer prices increase in line with consumer prices and faster than the EU average
XXXIX
.
Food and beverage consumer services
Food and beverage manufacturing
% for primary producers (right axis)
Food and beverage distribution
% for primary producers – EU-27
Value added for primary producers in the food chain in Hungary (in million EUR)
 By September 2020 in Hungary, 64 product names had been granted a GI under the EU quality schemes
XL
(1.8% of all GIs in the EU), of which 39 a PDO (2.1% of all PDOs in the EU – Italy and France together have 58%), mostly for wine and fruit, vegetables & cereals, followed by 8 spirits GIs,
XLI
. Hungary has notified its first national quality scheme in 2020.
By September 2020 in Hungary, 64 product names had been granted a GI under the EU quality schemes
XL
(1.8% of all GIs in the EU), of which 39 a PDO (2.1% of all PDOs in the EU – Italy and France together have 58%), mostly for wine and fruit, vegetables & cereals, followed by 8 spirits GIs,
XLI
. Hungary has notified its first national quality scheme in 2020.
Source: EUROSTAT
2.4
Contribute to climate change mitigation and adaptation, as well as sustainable energy
Agriculture is one of the major sources of emissions in Hungary. The share of agricultural greenhouse gases (GHG) is 12% (2017), close to the EU average
XLII
,and representing almost 2% of the EU total emission of non-CO2 GHG from agriculture. The total emissions of GHG from agriculture have been stagnating for the last two decades
XLIII
, but are still below 1990 level by 28.4%. There is an upwards trend since 2010 that is expected to continue increasing. This trend is partly due to an increase in fertiliser use. In terms of emissions of methane (CH4) and Nitrous oxide (N2O) expressed per hectare of utilised agricultural area (UAA), Hungary is ranked 27th out of 28 in 2018
XLIV
, which reflects a low level of intensification of agricultural activities as well as a low density of livestock.
In 2018, agricultural soils accounted for the majority of the agricultural GHG emissions with 52%, enteric fermentation accounted for 29%, and manure management for 15%
XLV
. Removals linked to land use, land use change and forestry have been stagnating the past 10 years.
Hungary showed an upward trend in the production of renewable energies (RE), which picked in 2013; since then production has decreased. In 2018the share of production of RE is 17% for agriculture and 71% for forestry (that plays an important role in domestic climate regulation), well above the EU average for each sector (respectively 12.1% and 41.4%)
XLVI
. In contrast 7% of the energy used in agriculture/forestry comes from RE
XLVII
. Between 2009 and 2015, Hungary increased by more than 6% annually its consumption of energy use in the food industry. By 2030, Hungary intends to rely more on renewable energy sources. Still, the share of energy consumption by agriculture in final energy consumption
XLVIII
has slightly increased between 2007 and 2017
XLIX
. In 2018, the respective share in total final energy consumption of Hungarian agriculture and forestry and of the direct use of energy in food processing is respectively 3.6% and 3.7% just above the EU-27 average of 2.9% for both categories
L
.
The increasing temperature caused by climate change also constitute a threat for the sector. Around 400 thousand hectares of agricultural land were affected by damage caused by extreme weather conditions. The health status of the Hungarian forest stands is deteriorating, their age and species composition is unfavourable, forest renewals are protracted and their carbon sequestration capacity is reduced. Despite a recent increase, the share of forest in the country’s total surface area is only at 22%
LI
. Furthermore, peatland covers 3% of the Hungarian soil
LII
.
Under the Rural Development Programme, Hungary supported resource efficiency and renewable energy investments in the agricultural and food sectors, invested in resource efficient water use; programmed afforestation of 25 000 hectares and invested in greenhouse gas emission reduction.
To achieve the energy efficiency targets set by the European Green Deal and the 2030 EU Energy and Climate Strategy, the Hungarian National Energy and Climate Plan (NECP) aims to reduce GHG emissions by at least 40% by 2030 over the year 1990
LIII
. In the agricultural sector, this translates into the reduction of agricultural emissions with appropriate practices and various aid schemes and the rise of CO2 sink capacities that will significantly increase the share of areas covered by forest and other tree stock consistently with the National Forest Strategy. Also, Hungary’s Renewable Energy Action Plan aims at enabling the country to reduce its current energy dependency and increase the share of RE sources.
% of agriculture in total GHG emissions (exc. LULUCF)
% of agriculture (incl. emissions from cropland and grassland) in total GHG emissions (incl. LULUCF)
EU-27 % of agriculture (incl. Emissions from cropland and grassland) in total GHG emissions (incl. LULUCF)
Total Greenhouse gas emissions from agriculture (including and excluding LULUCF) in Hungary (in million tonnes of CO2 equivalents)

Source: European Environmental Agency. As in EUROSTAT [
env_air_gge
]
2.5
Foster sustainable development and efficient management of natural resources such as water, soil and air
92% of the total reported ammonia emissions in Hungary in 2018 came from agricultural sources
LIV
. The level of ammonia emissions, after a strong decrease at the beginning of the 90’s, have been stagnating and even increasing since 2012
LV
(71.5 kT in 2018 representing more than 90% of total), while other pollutants have been steadily decreasing. For both 2020-29 and for 2030 and beyond, Hungary is at high-risk of non-compliance with the emission reduction commitment for ammonia under the NEC Directive
LVI
. Regarding sectors involved, it is to be noted that while livestock is responsible for an overwhelming share of agricultural emissions, the share of emissions from crop production is steadily increasing. In addition to the ammonia pollution, almost 26% of the total reported emissions of nitrogen oxides and 25% of the total reported emissions of non-methane volatile organic compounds are from agriculture.
In general the level of soil organic carbon of Hungarian soils, that is of strategic importance in Hungary because of the importance to climate change, water management and SWD, is quite low, with Hungary having a mean soil organic carbon content of 20.5 g kg-1 versus an EU average of 43.1
LVII
. Soil organic content varies across the regions, necessitating a differentiated approach per area to tackle the issue.
Due to its geographical characteristics, Hungary is less prone to erosion, with agricultural areas subject to moderate to severe water erosion below EU average (2.8% of areas versus 6.6% for the EU in 2016
LVIII
). Almost 42% of arable land is left bare during winter
LIX
and 89% of tillable area is tilled conventionally
LX
. Moving to more sustainable farming practices should better protect soil and water resources. These efforts will also benefit from research under the forthcoming Horizon Europe mission on soil health and food.
Regarding the nutrient balance, in general Hungarian soils are subject to a Nitrogen surplus and a Phosphorus deficit. For Nitrogen, between 2010 and 2013 the average surplus for Hungary stood at 34.8 kg nitrogen per hectare (kg N/ha). This rate, below the EU average exceeding 50 kg, is subject to annual variations and shows an increasing trend
LXI
. The nitrates concentration of both surface waters and groundwater is stagnating or slowly increasing
LXII
. For phosphorus the average deficit is steadily established at 1.5 kg P/ha, and is stable over time. In relation to the Water Framework Directive around 78% of surface waters are failing to achieve good status and around 8% of surface waters are failing to achieve good chemical status while 46% are in unknown chemical status. For groundwater around 20% are failing to achieve good quantitative status and around 21% are failing to achieve good chemical status. The most significant pressures included physical alteration of channel/bed/riparian area/shore due to agriculture and diffuse agricultural pollution for surface waters and the 4th most significant pressure for groundwater is abstraction or flow diversion from agriculture. Better integration of water objectives in other policy areas such as agriculture, is needed to achieve the requirements of the WFD and synergies should be optimised with polices including the CAP.
According to the last available data, 7% of the monitoring stations in groundwater and 1.5% of the monitoring stations in surface water had average values equal to or exceeding 50 mg nitrate per L during the reporting period (2012-2015). The share of monitoring stations exceeding this limit increased since 2004 and the nitrates concentration is increasing in 15% of groundwater stations and 24% of surface water stations.
Almost half of Hungary’s arable land is to various degrees inland-watered. With the projected increase of extreme precipitation events, in line with the Second Climate Change Strategy, in deep-lying, regularly inland-watered, soil-defective areas arable cultivation practices should be adapted to cope with excess water.
Water abstraction has been varying between 100 and 150 million m³, a figure that is low compared to Southern countries and average in the region. Accordingly, the Water Exploitation Index is low and stands between 0 and 10 over the years
LXIII
. According to last available data, the share of irrigation in water abstraction was low at 2.6% [in 2012]
LXIV
. The share of irrigated land is relatively low and represents 2.6% of total utilised agricultural area (below EU average), but shows a 6% increase over the 2010-16 period
LXV
(above EU average). The availability of water varies very much during the year.
Overall, while the current situation with irrigation may be seen as satisfactory from the point of view of the management of the resource, challenges stemming from climate change and the high risk of further salinization of Hungarian soils will require adaptation.
Potential surplus of N and P on agricultural land in Hungary
Potential surplus of phosphorus on agricultural land (in kg P/ha/year)
Potential surplus of nitrogen on agricultural land (in kg N/ha/year)
 Source: EUROSTAT [aei_pr_gnb]
2.6
Contribute to the protection of biodiversity, enhance ecosystem services and preserve habitats and landscapes
The situation of biodiversity is not favourable in Hungary. On the quantitative side, a slightly above EU average share of Hungarian land (21.4% vs 19.8%), and farmland (14.8% vs. 11.2%) is protected by Natura 2000
LXVI
, most of which are covered by management plans
LXVII
, that set the framework for farming activity in the area.
The state of biodiversity, however, appears to be continuously worsening. High-nature value farmland is continuously decreasing
LXVIII
. Similarly, the latest 2013-2018 reporting on the status and trends of bird populations while indicating some improvements in long term trends, also showed an equal proportion of decreasing short term trends (14% compared to 19% in the previous 2008-2012 report). For arable land, the Farmland Bird Index shows a continuous, albeit slowing decline
LXIX
from 100 to 76.06 between 2000-2018 (e.g. skylarks and grey partridge with 50% decline, and turtle doves with 25% drop), particularly pronounced for migratory birds subject to multiple threats some of which can be partly addressed via the CAP (e.g. climate change) and some are out of its scope (hunting during migration route). According to the reporting on the conservation status and trends of species and habitats under the EU Habitats Directive (2013-2018), none of the grassland habitat types present in Hungary are currently in favourable conservation status and only about 13% of the habitats and 35% of the species were in favourable status in 2013-2018, based on their assessments
LXX
. Landscape features in Hungary have been actively removed to facilitate agriculture and today the share of fallow land (3%) and landscape features (0,4%) in agricultural area is below EU average (respectively 4.1 and 0.5%)
LXXI
. The decreasing trend should be reversed to achieve the biodiversity strategy objective of at least 10% of agricultural area under high-diversity landscape features by 2030. Similarly, due to the continuously shrinking wetland area, wetlands conservation and restoration measures should also have more focus.
For forests, the picture is slightly more positive. In 2020 22.7% of Hungary’s area was covered by forests, which is below the EU average. A large share of forest areas are protected by Natura 2000 (43.2% vs. 31% for EU)
LXXII
. Hungary belongs to those countries where all forests are covered by management plans and actions such as close to nature forestry are actively promoted. Hungary is also using rural development measures to expand forest area and improve quality. Despite these positive elements, the state of a number of forest habitats which are covered by Annex 1 of the Habitats Directive 92/43/EEC and species is not satisfactory
LXXIII
, with only 8% of habitats in good condition.
As regards pressures leading to this status, over 40% of habitats assessments and over 47% of species assessment are affected by agriculture (improper land use practices, over- or undergrazing or not timely mowing, land use change, invasive species and change of water regime and fragmentation), and respectively over 44% and over 41% by forestry activities (unsustainable forest practices). These highlight the impact of agricultural intensification
LXXIV
, (though Hungary still remains below EU average
LXXV
), combined with other factors such as climate change.
Whereas the area under organic farming was rather stagnating in Hungary between 2005 and 2015, it displayed a very significant increase of 44% between 2015 and 2016 (Figure 3) and is almost 6% of UAA in 2019
LXXVI
. The share of UAA under conversion was high in 2016 and 2017 but declined in 2018 and should be increased again in order to maintain growth. The number of organic farmers registered in Hungary also increased during that period, doubling between 2016 and 2018 (from 1672 farmers in 2016 to 3414 in 2018). The Rural development supported the conversion and maintenance of 110 000 ha of organic land during the programming periods 2014-2020. Organic livestock production is still very low and less pronounced. There was no significant increase in organic livestock, but rather a decrease between 2014 and 2018 with exception of poultry that increased by 80 per cent.
The underdeveloped domestic market and demand for organic fruits and vegetables and the lack of processing capacity have favoured the predominance of arable crops production, mainly cereals, oleaginous crops and forage crops. The products are mainly intended for export in bulk without processing and it can be stored for a long time without degradation and transported in large quantities, easily, and many integrator organisations are active in their production and wholesale. The production of cereals is also facilitated by a higher level of know-how among farmers.
% of area under organic farming in the EU-27
Hectares under organic farming
% of agricultural area under organic farming in Hungary
Area under organic farming in Hungary
The infrastructure dedicated exclusively to organic farming lacks integration (producer organisations, processors’ cooperation, etc.), the cooperation of farms is still inadequate. However, a vocational education of organic farming at university and secondary level education has been developed, and teaching materials have been produced that are suitable for the transfer of basic knowledge.
Instructions: Using the length of the text box, draft a short analysis on the state of play for cross-cutting objective. For each of the specific objectives it could address the different elements identified in the toolkit by the specific objectives:
(I)Functioning of the Agricultural Knowledge and Innovation Systems (AKISs) and related structures, relevant document to consult:
AKIS study
(II)Other relevant aspects in the context of the CO, notably the availability and use of innovative organisational solutions/structures (e.g. knowledge exchange groups such as the EIP Operational groups), digital infrastructure and new technologies (e.g. precision agriculture, artificial intelligence, smart villages), and the preparedness in terms of skills or access to training
(III)This section could include analysis and followed by recommendations in relation to implementation of IACS and LPIS. It could also be considered to add considerations in relation to simplicity of implementation of the policy and the Strategic Plan.]
Instructions: Using the length of the text box, draft a short analysis on the state of play for cross-cutting objective. For each of the specific objectives it could address the different elements identified in the toolkit by the specific objectives:
(IV)Functioning of the Agricultural Knowledge and Innovation Systems (AKISs) and related structures, relevant document to consult:
AKIS study
(V)Other relevant aspects in the context of the CO, notably the availability and use of innovative organisational solutions/structures (e.g. knowledge exchange groups such as the EIP Operational groups), digital infrastructure and new technologies (e.g. precision agriculture, artificial intelligence, smart villages), and the preparedness in terms of skills or access to training
(VI)This section could include analysis and followed by recommendations in relation to implementation of IACS and LPIS. It could also be considered to add considerations in relation to simplicity of implementation of the policy and the Strategic Plan.]
Instructions: Using the length of the text box, draft a short analysis on the state of play for cross-cutting objective. For each of the specific objectives it could address the different elements identified in the toolkit by the specific objectives:
(VII)Functioning of the Agricultural Knowledge and Innovation Systems (AKISs) and related structures, relevant document to consult:
AKIS study
(VIII)Other relevant aspects in the context of the CO, notably the availability and use of innovative organisational solutions/structures (e.g. knowledge exchange groups such as the EIP Operational groups), digital infrastructure and new technologies (e.g. precision agriculture, artificial intelligence, smart villages), and the preparedness in terms of skills or access to training
(IX)This section could include analysis and followed by recommendations in relation to implementation of IACS and LPIS. It could also be considered to add considerations in relation to simplicity of implementation of the policy and the Strategic Plan.]
 Source: EUROSTAT [
org_cropar_h1
] and [
org_cropar
]
Source: EUROSTAT [
org_cropar_h1
] and [
org_cropar
]
Landscape features as % of agricultural area
Fallow land as % of agricultural area
Share of agricultural area covered by high-diversity landscape features in the EU

Source: DG AGRI based on Eurostat and JRC based on LUCAS survey.
* Linear elements considered here: Grass margins, shrub margins, single trees bushes, lines of trees, hedges and ditches. This estimation is to be taken with caution because of methodological caveats.
2.7
Attract young farmers and facilitate business development in rural areas
The agricultural sector in Hungary is characterised by an ageing farming population. In 2016, more than half (58.1%) of all farm managers are older than 55 years in Hungary, while only 6% of farmers are younger than 35 years (the ratio of young to elderly farmers is 0.10)
LXXVII
. The share of young farm managers is decreasing since 2005, therefore there is an urgent need for generational renewal. The percentage of female young farmers is increasing over the years. In 2019 27% of the farmers were women, which is slightly below the EU average (29%)
Access to agricultural land is one of the main barriers faced by young farmers in Hungary, given the limited availability and high prices of the land for sale or rent. The average economic and physical farm size for young farmers in Hungary has doubled size since 2005, reaching an average of 12 ha; but is still far from other EU countries where young farmers tend to have bigger and more specialized farms. Young farmers also encounter administrative barriers stemming from national legislation that creates difficulties in the access to land, especially on the handovers.
LXXVIII
Young farmers and new entrants face serious difficulties when trying to access to capital. The main reason is their lack of business data and credit history in addition to the limited assets that could be used as collateral and no land that can be mortgaged. Young farmers taking over existing farms have better chances to obtain loans since credit institutions are financed on a cash flow basis rather than collaterals. The main problem remains in long term financing needed for the initial investments for setting-up the business
LXXIX
. Low attractiveness and low level of income of the farming sector (at 76.7% of the average wage) also acts as an obstacle for young farmers in Hungary.
Access to knowledge is another of the main challenges faced by the young farmers. Hungary is among the countries in which the agricultural training of young farm managers is the lowest. The share is increasing over the years but is much below the EU average, especially when referring to full agricultural training (8% in Hungary vs 21% in EU)
LXXX
.
Hungary is already implementing different instruments under the CAP to encourage generational renewal in the agricultural sector. Under the first pillar, Hungary has earmarked 0.4% of the national ceiling for direct payments to the payment for young farmers in each year since 2016, though the actual expenditure was higher (0.9% in 2018). This financed 68 EUR/ha in annual support for 9-11 000 young farmers, each with 19-21 ha on average
LXXXI
. Furthermore, the Rural Development Programme is supporting the start-up of 3 000 young farmers.
Share of farm managers below 35 years – EU-27
Share of male farm managers below 35 years
Ratio < 35 y.o />= 55 y.o. (right axis)
Share of female farm managers < 35 years
Share of farm managers < 35 years by gender in Hungary
 Economic activity is low in rural areas: GDP per capita (PPS/inhabitant) stands at EUR 12 331 in rural regions (vs. EUR 20 067 in the EU and EUR 38 677 in urban areas). Agriculture still plays a significant role in the economy with 4,2 % of GDP, but its impact in rural economy and employment is slowly declining. Basic services and infrastructures are often missing or of poor quality in rural Hungary, conditions that are important for ensuring generational renewal and local development
LXXXII
and to attract young people in rural areas and in farming. In 2016, 9 891 business were created in rural areas following a growing trend in the latest years
LXXXIII
.
Economic activity is low in rural areas: GDP per capita (PPS/inhabitant) stands at EUR 12 331 in rural regions (vs. EUR 20 067 in the EU and EUR 38 677 in urban areas). Agriculture still plays a significant role in the economy with 4,2 % of GDP, but its impact in rural economy and employment is slowly declining. Basic services and infrastructures are often missing or of poor quality in rural Hungary, conditions that are important for ensuring generational renewal and local development
LXXXII
and to attract young people in rural areas and in farming. In 2016, 9 891 business were created in rural areas following a growing trend in the latest years
LXXXIII
.
Source: EUROSTAT
2.8
Promote employment, growth, social inclusion and local development in rural areas, including bio-economy and sustainable forestry
According to Eurostat definitions, 28%
LXXXIV
of the Hungarian territory is rural. 18.7 % of the population lives in rural areas; and a high share 63.4% in intermediate regions
LXXXV
.
The agricultural sector, that concentrates an overwhelming share of CAP payments, still plays a significant economic role in Hungary with a GDP contribution of 4.2%
LXXXVI
(much above the EU average of 1.8%), but its labour contribution is rather limited at 4% (EU average). The employment rate is increasing in rural areas, the primary sector still represents 11.2% of the employment in rural areas (slightly below the EU average at 12.7%). The proportion of women farmers is at 27%, slightly below the EU average (28%)
LXXXVII
.
Most farms are of very low economic size, with more than 80% of them below EUR 8000 of standard output. 60% of Hungarian agricultural holdings do not receive direct payments (well above the EU average at 40%)
LXXXVIII
.
Hungary programmed about 7% of the RDP budget on basic services development in rural areas and the minimum spending was programmed on LEADER (5%). Currently, LEADER covers 66% of the rural territory with around 100 Local action groups. Local action groups have at their disposal a rather low budget therefore can contribute only to a limited extent to rural areas’ development.
In rural areas, the poverty rate shows good trends, however is much higher at 23.3%
LXXXIX
than in cities at 14.9% and especially high in some rural counties. The GDP per inhabitant in purchasing power standard compared to EU27 average in rural areas is especially low and has been no real improvement since 2006, while in cities it is well above the EU27 average. The rural population has decreased by 2.7% since 2015, population density has slightly decreased since 2013 (at 74/km² in 2016) and outmigration is especially high among active women (their share in the rural population has reduced by 6% between 2015-2019 for the age group 15-64 years). Ageing is an issue as the share of elderly people in rural population increased by 10% for men and by 6% for women.
XC
Youth unemployment in rural areas is around 10%. The female employment rate in rural areas has increased to 60% (a positive trends), but is still well below the male employment rate (75%)
XCI
. The female unemployment rate is around 6%, meaning that still a large share of women in active age, is neither in employment nor in unemployment. It could indicate an important share of non-recognised labour of women (for example on farm, caring about elderly, disabled and children at home etc.) that increases their risk of vulnerability. According to estimations, the Roma population represents between 300 000 and 900 000 persons with half of them living in rural villages, often in the poorest part of the country. 1/3 are below 15 years old and only 1/5 are above 60 years old. Combined with the high poverty rate, children and young are under specific vulnerability risk among the Roma. The educational level of Roma is lower than in the rest of the population (80% has only primary educational level.). Their unemployment rate is especially high, however trends are positive mainly due to public work schemes. The Roma represent an important vulnerable group in rural areas, but also an opportunity in response to demands in terms of workforce, also in the agricultural, food and forestry sectors.
In view of the geographical composition of the country, remoteness of rural areas, in principle should not be a major challenge. However connectivity is an issue for homesteads and villages located in poorer rural territories, even when those villages are located in well performing regions. In several counties, rural areas are facing lack of access to basic infrastructures and services creating a feeling of remoteness and letting aside.
The bio–economy employs 390 000 people in Hungary, mainly in the agricultural sector, followed by the food sector. From an economic point of view, the food sector is by far the most important sector in the bio-economy with 46% of the turnover, followed by agriculture (28%). The economic and employment trends are positive but remain at low levels. In 2015, the labour productivity of the bio-economy was much lower in Hungary (EUR 67 300 per person) than in the EU-27 (EUR 119 000 per person) and, unlike it, had decreased since 2008
XCII
.
The productivity of the forestry sector is rather low and decreasing. The number of person employed in forestry is low at 0.56% and has slightly decreased since 2013 (from 0.6%). Hungary is now investing a lot in new afforestation with the support of the current RDP and there is a clear political national objective to improve the forestry sector.
2.9
Improve the response of EU agriculture to societal demands on food and health, including safe, nutritious and sustainable food, as well as animal welfare.
Ensuring the safety of pesticides and controls on their use is paramount for sustainable food production. In this regard, the evolution of the overall weighted index for both Harmonised Risk Indicators provide important information: HR1
XCIII
has remained stable over the last number of years and has shown a marked decrease for 2018; the evolution of HRI2 has also exhibited a downward trend. Despite this the sales of more hazardous pesticides is high and a stable percentage of total sales over this period
An audit on the implementation of the Directive on the sustainable use of pesticides, carried out in 2018 by DG SANTE
XCIV
, identified a number of weaknesses. Like in many other MS, the National Action Plan (NAP) covering the period 2013-2017 lacked overall quantitative objectives and quantifiable targets making it impossible to demonstrate progress towards meeting the objectives of the Directive. In addition, the NAP had not been reviewed within a five-year period, as required by the Directive.
There were important areas, where further action is needed to meet the requirements of the Directive
XCV
. In particular, this concerns aerial spraying (verification of the conditions for granting derogations for aerial spraying), inspection of pesticide application equipment (the control system was established but there is no legal obligation for inspection in Hungary) and to control the implementation of Integrated Pest Management. The overall challenge for Hungary now will be to maintain the positive trend in order to meet the targets from the Farm to Fork strategy.
Antimicrobial resistance (AMR) linked to the excessive and inappropriate use of antimicrobials in animal and human healthcare should be especially prioritised as Hungary is amongst the EU Member States that have higher sales of veterinary antimicrobial agents at 180,6 mg/PCU in 2018
XCVI
.
Hungary, with 150.2 tonnes of sales of veterinary antimicrobial agents in 2018, is above the EU average 118.3 mg/PCU and the fifth highest of the EU-27. Hungarian livestock keepers use high levels of polymyxin (10.1 mg/PCU, third highest in EU) and fluoroquinolone antimicrobials (10.8 mg/PCU, second highest). The use of generation 3-4 cephalosporins is subdued in Hungary as in other Member States although Hungary is among the highest specific consumers in the EU with 0.5 mg/PCU. During the survey conducted by NAIK AKI on the use of antibiotics in 2019, farmers indicated in the questionnaire that antibiotics are routinely used prophylactically for the purpose of prevention irrespectively of the animal species. The high proportion of preventive stock management is also confirmed by the fact that the Hungarian data transmitted to ESVAC show a high use of tetracycline and penicillin with extended spectrum.
Hungary currently has 4 animal welfare programs (Animal welfare aid for poultry, for pigs, for breeding sows and for breeding poultry).
Based on the audit carried out in 2019 by DG SANTE
XCVII
it was concluded that the Hungarian authorities and the pig sector have taken no tangible actions to reduce tail biting and avoid routine tail docking of pigs, which is still regularly carried out throughout the country. Hungary was not in a position to justify the ongoing routine tail-docking of 95% of pigs. Therefore, further incentives are needed to improve the conditions on-farm in order to decrease the number of tail docked pigs.
Biosecurity is equally a challenge, considering that Hungary is among the countries affected by African Swine Fever (ASF) where farms with low biosecurity and poor controls pose higher risk for animal disease infections and spread.
Hungary has a very high burden from non-communicable diseases due to dietary risk factors expressed as disability-adjusted life years (DALYs) per 100,000 population
XCVIII
. The value of DALYs is influenced by a number of risk factors, which include besides diet, tobacco and alcohol consumption, insufficient physical activity and corpulence. A very high part of Hungary’s population is overweight or obese
XCIX
. Efforts should focus on shifting towards healthy sustainable diets, in line with national recommendations, in order to contribute to reducing overweight and obesity rates and the incidence of non-communicable diseases while simultaneously improving the overall environmental impact of the food system. This would include moving to a more plant based diet with less red and processed meat (the estimated consumption of which is very high in Hungary
C
) and more fruits and vegetables, whole grains, legumes, nuts and seeds, as this could contribute to healthy and more sustainable diets.
Sales of veterinary antimicrobial agents marketed mainly for food-producing animals in Hungary
Sales in mg/PCU in Hungary
Harmonised Risk Indicator 1 for pesticides in Hungary
(2011-2013 = 100)

 Although estimates exist for Hungary, there is no officially measured or collected data on the magnitude of food waste, except for households
CI
. It could be expected that appropriate coverage of food loss and waste in agriculture will be included in the new national food waste prevention programme as required by Article 29(2a) of the Waste Framework Directive 2008/98/EC. The current programme covers 2014-2020 and does not adequately address food waste from primary production of food.
Although estimates exist for Hungary, there is no officially measured or collected data on the magnitude of food waste, except for households
CI
. It could be expected that appropriate coverage of food loss and waste in agriculture will be included in the new national food waste prevention programme as required by Article 29(2a) of the Waste Framework Directive 2008/98/EC. The current programme covers 2014-2020 and does not adequately address food waste from primary production of food.
Source: DG AGRI after ESVAC, Tenth ESVAC Report (2020)
Source: EUROSTAT [aei_hri]
2.10
Cross-cutting objective on knowledge, innovation and digitalisation
Some parts of the Hungarian agricultural knowledge and innovation system (AKIS) are well organised and coordinated. The Hungarian Chamber of Agriculture operates farm advisory, information and education services with a strong network of Interbranch Organisations (IBOs), representing the most important agri-food supply chains of Hungary (e.g. milk, poultry, pig, cereals, fruit & vegetable). The education sector includes six, mainly agricultural, horticultural and veterinary universities and forty-six vocational schools. The agricultural applied research sector is mainly concentrated in the National Agricultural and Innovation Center, operating through a network of diverse institutions located across the country. To ensure dissemination, several initiatives were taken. A European Innovation Partnership (EIP-AGRI) website was launched in 2016, offering potential Operational Groups possibilities to present ideas and results on progress of projects. There is an informal AKIS working group in place since 2017 to discuss knowledge and innovation challenges, share experiences, and strengthen the links between actors. There are a few agri-food related clusters in Hungary.
The number of people employed in Network Support Units (both at national level and in regional antennas) is low as compared to other Member States
CII
. There is no data available on the budget of the National Rural Network. EIP-AGRI Operational Groups have been selected and started to implement innovative projects, but concrete results are not reported yet. Hungary could improve the accessibility of agricultural data for researchers and policy makers.
Overall, while the structures appear to be solid, the Hungarian AKIS is still relatively weak and somewhat fragmented. Hence, the cooperation between different parts could be further improved
CIII
, and also the synergies between the CAP and the European Research Area could be strengthened.
Hungary has not yet opted for the use of satellite-based means to monitor CAP implementation and is currently not part of EU projects dealing with the uptake of new technologies for the modernisation of CAP.
Under the current rural development programme, Hungary planned slightly higher amounts on knowledge transfer (1.4%) and advisory services (1.1%) than EU average. However, the budget is rather limited and mainly targets the rural development implementation. Moreover, actual expenditure has been limited, with 45% for knowledge transfer (second quarter of 2020) and no expenditure at all for advisory services and EIP Operational Groups. The total budget planned for all knowledge and innovation measures under the RDP was around the EU average.
Source: EUROSTAT. [
ef_mp_training
].
Hungarian farmers level of education and knowledge is lower that the EU average. 79% of the farmers have only practical experience (EU 68%), 17% have basic training skills (EU 23%) and only 4% have full agricultural training (EU 9%)
CIV
. The share of women is especially high in the category “only practical experience”. Rural areas are generally characterised by lower levels of education. The Young NEET rate (Young people neither in employment, nor in education or training aged 15-24) is higher in rural areas (at 15%), and is especially high for young women (19%). The ratio of early leavers form education and training between 18 and 24 years old is much higher in rural areas (18%) than in cities (6%). 26,9% of the rural population has less than primary, primary and lower secondary education (8.9% in cities), and only 11.7% has tertiary education (compared to 39% in cities).
Innovation is also a challenge, as research and development (R&D) intensity in Hungary is rather low at 1.53% of GDP (compared to 2.12% in the EU) and especially low in the agricultural sector (only 1.3% of the total expenditure and from this amount only 21.5% is dedicated to applied research).
R&D is concentrated in Budapest (61.2%). Resources for R&D are in majority from the private sector (52%) and 53% in companies with more than 500 employees
CV
. Under the current rural development programme, Hungary programmed slightly lower amounts for cooperation projects (1.3%) than EU average (1.7%). Such expenditure on cooperation can specifically aid the planned 70 EIP-AGRI groups and 400 cooperation projects, however, as mentioned before, implementation is limited.
Fast broadband internet access is key to rural innovation. Next generation broadband coverage in rural areas is at 80%. This is the result of a positive trend, but 20% of rural households do not yet have access to high speed internet. When it comes to digital skills, Hungary is among the worst performers as only 20% of the population has internet user skills. According to DESI 2020 report, the socio–demographic aspects are essential: the elderly, inactive, less educated are digitally more vulnerable.
NGA broadband (% of rural households)
NGA broadband (% of total households)
Broadband access (% of rural households)
Broadband coverage in Hungary

Source: European Commission. Digital Economy and Society Index. DESI individual indicators – 1b1 Fast BB (NGA) coverage [
desi_1b1_fbbc
]
-
(I)
Greifswald Mire Centre: Peatlands in the EU Common Agriculture Policy (CAP) after 2020 Position Paper (2020)
https://www.greifswaldmoor.de/files/dokumente/Infopapiere_Briefings/202003_CAP%20Policy%20Brief%20Peatlands%20in%20the%20new%20EU%20Version%204.8.pdf
-
(II)
Directorate General for Agriculture and Rural Development. Common Agriculture Policy context indicator C.26 Agricultural entrepreneurial income. Income based on EUROSTAT [
aact_eaa04
], [
aact_ali01
] and [
aact_eaa06
], adding back the compensation of employees to the entrepreneurial income.
-
(III)
Directorate General for Agriculture and Rural Development. Common Agriculture Policy context indicator C.26 Agricultural entrepreneurial income. Income based on EUROSTAT [
aact_eaa04
], [
aact_ali01
] and [
aact_eaa06
], adding back the compensation of employees to the entrepreneurial income and divided by the total number of annual working units. Note: 2019 data estimated. The Average wage in the economy based on EUROSTAT [
nama_10_a10_e
] thousand hours worked using employees domestic concept and [
nama_10_a10
], item wages and salaries.
-
(IV)
Directorate General for Agriculture and Rural Development. CAP context indicator C.25 Agricultural factor income. Based on EUROSTAT [
aact_eaa04
], [
aact_ali01
] and [
aact_eaa06
].
-
(V)
Directorate General for Agriculture and Rural Development own calculations based on FADN data (up to 2018).
-
(VI)
Directorate General for Agriculture and Rural Development own calculations based on FADN data (up to 2018).
-
(VII)
Directorate General for Agriculture and Rural Development own calculations based on Member State notifications via ISAMM.
-
(VIII)
CAP indicator dashboard: CAP indicator dashboard: CAP indicator dashboard: Directorate General for Agriculture and Rural Development own calculations based on CATS (Clearance of Accounts trailing System) data (2015-2017). CAP result indicator
R6 Redistribution to smaller farms
.
-
(IX)
Directorate General for Agriculture and Rural Development own calculations based on CATS (Clearance of Accounts Trailing System) data (up to 2017).
-
(X)
According to the FADN definition, the “economic size” of an agricultural holding is measured based upon its total Standard Output (expressed in euro), i.e. the standard value of its agricultural output.
-
(XI)
Data with regard to physical size: Directorate General for Agriculture and Rural Development own calculations based on FADN data (up to 2018); data with regard to economic size: Farm Accountancy Data Network. FADN Standard reports.
YEAR.COUNTRY.SIZ6
and own calculations (up to 2018).
-
(XII)
Farm Accountancy Data Network. FADN Standard reports.
YEAR.COUNTRY.TF14
and own calculations (up to 2018).
-
(XIII)
Farm Accountancy Data Network. FADN Standard reports.
YEAR.COUNTRY.ANC3
and own calculations (up to 2018).
-
(XIV)
European Commission, Directorate-General for Agriculture and Rural Development, ECORYS, Wageningen Economic Research; 24/08/2018,
Study on risk management in EU agriculture
-
(XV)
Directorate General for Agriculture and Rural Development. Common Agriculture Policy context indicator C.26 Agricultural entrepreneurial income. Income based on EUROSTAT [
aact_eaa04
], [
aact_ali01
] and [
aact_eaa06
], adding back the compensation of employees to the entrepreneurial income and divided by the total number of annual working units. Note: 2019 data estimated. The Average wage in the economy based on EUROSTAT [
nama_10_a10_e
] thousand hours worked using employees domestic concept and [
nama_10_a10
], item wages and salaries.
-
(XVI)
European Commission. Statistical Factsheet – Hungary. September 2019,
https://ec.europa.eu/info/sites/info/files/food-farming-fisheries/farming/documents/agri-statistical-factsheet-hu_en.pdf
-
(XVII)
Financial needs in the agriculture and agri-food sectors in Hungary, Fi-Compass, June 2020, p.55
https://www.fi-compass.eu/sites/default/files/publications/financial_needs_agriculture_agrifood_sectors_Hungary.pdf
-
(XVIII)
Hungary statistical factsheet, June 2020, p.2
https://ec.europa.eu/info/sites/info/files/food-farming-fisheries/farming/documents/agri-statistical-factsheet-hu_en.pdf
-
(XIX)
European Commission. CAP context indicator C.17 Agricultural holdings (farms). Based on EUROSTAT [
ef_m_farmleg
]
-
(XX)
It should be noted that this average value is based on land ownership data. Many farms are much larger than this, but rent most of their land.
-
(XXI)
European Commission. CAP context indicator C.17 Agricultural holdings (farms). Based on EUROSTAT [
ef_m_farmleg
]
European Commission. CAP context indicator C.18 Agricultural area. Based on EUROSTAT [
apro_cpsh1
]
European Commission. CAP context indicator C.21 Livestock units. Based on EUROSTAT [
ef_lsk_main
], [
ef_lsk_poultry
], [
ef_lsk_bovine
] and [
ef_lus_main
].
European Commission. CAP context indicator C.23 Age structure of farm managers. Based on EUROSTAT [
ef_m_farmang
]
-
(XXII)
European Commission. CAP context indicator C.17 Agricultural holdings (farms). Based on EUROSTAT [
ef_m_farmleg
]
European Commission. CAP context indicator C.18 Agricultural area. Based on EUROSTAT [
apro_cpsh1
]
European Commission. CAP context indicator C.21 Livestock units. Based on EUROSTAT [
ef_lsk_main
], [
ef_lsk_poultry
], [
ef_lsk_bovine
] and [
ef_lus_main
].
European Commission. CAP context indicator C.23 Age structure of farm managers. Based on EUROSTAT [
ef_m_farmang
]
-
(XXIII)
European Commission. CAP context indicator C.14 Labour productivity in agriculture. Based on EUROSTAT [
aact_eaa01
] and [
aact_ali01
]
-
(XXIV)
Financial needs in the agriculture and agri-food sectors in Hungary, Fi-Compass, June 2020, p.13
https://www.fi-compass.eu/sites/default/files/publications/financial_needs_agriculture_agrifood_sectors_Hungary.pdf
-
(XXV)
Financial needs in the agriculture and agri-food sectors in Hungary, Fi-Compass, June 2020, p.11
https://www.fi-compass.eu/sites/default/files/publications/financial_needs_agriculture_agrifood_sectors_Hungary.pdf
-
(XXVI)
European Commission.
https://europa.eu/!Pj64rj
-
(XXVII)
European Commission.
https://europa.eu/!Pj64rj
-
(XXVIII)
European Commission. Statistical Factsheet – Hungary. June 2020,
https://ec.europa.eu/info/sites/info/files/food-farming-fisheries/farming/documents/agri-statistical-factsheet-hu_en.pdf
-
(XXIX)
European Commission. Statistical Factsheet – Hungary. June 2020,
https://ec.europa.eu/info/sites/info/files/food-farming-fisheries/farming/documents/agri-statistical-factsheet-hu_en.pdf
-
(XXX)
European Commission. Statistical Factsheet – Hungary. June 2020,
https://ec.europa.eu/info/sites/info/files/food-farming-fisheries/farming/documents/agri-statistical-factsheet-hu_en.pdf
-
(XXXI)
European Commission. Commission Staff Working Document – Impact assessment. Initiative to improve the food supply chain (unfair trading practices)
https://europa.eu/!rX64CX
-
(XXXII)
OCDE. Competition Issues in the Food Chain Industry 2013
https://oe.cd/39q
-
(XXXIII)
European Commission. Commission Staff Working Document Market transparency in the EU's food supply chain Accompanying the document
https://europa.eu/!NY67fH
-
(XXXIV)
Potori, Norbert and Chmieliński, Paweł and Fieldsend, Andrew F. (eds); Potori, Norbert and Chmieliński, Paweł and Karwat-Woźniak, Bożena and Biró, Szabolcs and Wasilewski, Adam and Tóth, Orsolya and Fogarasi, József and Wieliczko, Barbara and Wigier, Marek and Tóth, Kristóf and Lámfalusi, Ibolya and Pawłowska-Tyszko, Joanna and Floriańczyk, Zbigniew and Székely, Erika and Fieldsend, Andrew F. and Kemény, Gábor and Klimkowski, Cezary and Varga, Tibor and Jankuné Kürthy, Gyöngyi and Hamulczuk, Mariusz and Dudás, Gyula and Felkai, Beáta Olga and Juhász, Anikó and Szabó, Dorottya and Nagy, László and Hryszko, Krzysztof and Rycombel, Danuta and Szajner, Piotr and Vőneki, Éva and Ehretné Berczi, Ildikó and Bugała, Anna and Nosecka, Bożena and Németh, Szilvia and Garay, Róbert and Szczepaniak, Iwona and Mroczek, Robert and Vágó, Szabolcs (2014): Structural changes in Polish and Hungarian agriculture since EU accession: lessons learned and implications for the design of future agricultural policies. Agrárgazdasági Kutató Intézet, Budapest. ISBN 978-963-491-588-1
http://repo.aki.gov.hu/id/eprint/283
-
(XXXV)
Burger, A. The Situation of Hungarian Agriculture. 2019
https://doi.org/10.22004/ag.econ.90651
-
(XXXVI)
Arcadia International E.E.I.G , Directorate-General for Agriculture and Rural Development (European Commission) , EZ Study of the best ways for producer organisations to be formed, carry out their activities and be supported, 2019
http://doi.org/10.2762/034412
-
(XXXVII)
European Commission. Commission Staff Working Document – Impact assessment. Initiative to improve the food supply chain (unfair trading practices)
https://europa.eu/!rX64CX
-
(XXXVIII)
Eurostat.
https://europa.eu/!Ht94Cf
-
(XXXIX)
Food price monitoring tool
https://europa.eu/!BX43Dw
-
(XL)
eAmbrosia – the EU geographical indications register:
https://ec.europa.eu/info/food-farming-fisheries/food-safety-and-quality/certification/quality-labels/geographical-indications-register/#
-
(XLI)
European Commission.
https://europa.eu/!Pj64rj
-
(XLII)
European Commission. CAP context indicator C.45 Emissions from agriculture. Based on EUROSTAT [
env_air_emis
], original source European Environmental Agency (UNFCC_v22)
-
(XLIII)
https://appsso.eurostat.ec.europa.eu/nui/show.do?dataset=env_air_gge&lang=en
-
(XLIV)
EUROSTAT
https://ec.europa.eu/eurostat/statistics-explained/pdfscache/16817.pdf
-
(XLV)
https://www.eea.europa.eu/data-and-maps/data/data-viewers/greenhouse-gases-viewer
-
(XLVI)
European Commission. CAP context indicator C.43 Production of renewable energy from agriculture and forestry. Based on EUROSTAT [
nrg_bal_c
] and [
nrg_cb_rw
], and Strategie Grains
-
(XLVII)
European Commission. Statistical Factsheet – Hungary. June 2020,
https://ec.europa.eu/info/sites/info/files/food-farming-fisheries/farming/documents/agri-statistical-factsheet-hu_en.pdf
-
(XLVIII)
Eurostat
(nrg_bal_s)
https://ec.europa.eu/eurostat/statistics-explained/index.php/Agri-environmental_indicator_-_energy_use#Analysis_at_EU_and_country_level
-
(XLIX)
European Commission. CAP context indicator C.44 Energy use in agriculture, forestry and food industry. Based on EUROSTAT [
nrg_bal_s
]
-
(L)
European Commission. CAP context indicator C.44 Energy use in agriculture, forestry and food industry. Based on EUROSTAT [
nrg_bal_s
]
-
(LI)
https://fra-platform.herokuapp.com/HUN/assessment/fra2020/extentOfForest/
-
(LII)
European Commission. Joint Research Centre (JRC)
https://esdac.jrc.ec.europa.eu/ESDB_Archive/octop/Resources/Peatland_Per_Country.pdf
-
(LIII)
National Energy and Climate Plan
https://ec.europa.eu/energy/sites/ener/files/documents/hu_final_necp_main_en.pdf
-
(LIV)
European Environmental Agency (EEA)
https://www.eea.europa.eu/data-and-maps/dashboards/necd-directive-data-viewer-3
-
(LV)
European Environmental Agency (EEA)
https://www.eea.europa.eu/data-and-maps/dashboards/air-pollutant-emissions-data-viewer-3
-
(LVI)
Report form the Commission to the European Parliament and the Council on the progress made on the implementation of Directive (EU) 2016/2284 on the reduction of national emissions of certain atmospheric pollutants, COM(2020) 266 final:
https://eur-lex.europa.eu/legal-content/EN/TXT/?qid=1596794534116&uri=CELEX:52020DC0266
-
(LVII)
European Commission. CAP context indicator C.39 Water abstraction in agriculture. Based on EUROSTAT [
env_wat_abs
]
-
(LVIII)
European Commission. CAP context indicator C.42 Soil erosion by water. Original source: Joint Research Center
-
(LIX)
EUROSTAT
https://ec.europa.eu/eurostat/statistics-explained/index.php/Agri-environmental_indicator_-_soil_cover
-
(LX)
EUROSTAT
https://ec.europa.eu/eurostat/statistics-explained/index.php/Agri-environmental_indicator_-_tillage_practices
-
(LXI)
European Commission. CAP context indicator C.40 Water quality. Based on EUROSTAT [
aei_pr_gnb
] and European Environmental Agency as in
Waterbase – Water Quality, CSI020
, based on data reported to EIONET
-
(LXII)
SWD accompanying the report on the implementation of Council Directive 91/676/EEC concerning the protection of waters against pollution caused by nitrates from agricultural sources
-
(LXIII)
European Environmental Agency (EEA)
https://www.eea.europa.eu/data-and-maps/explore-interactive-maps/water-exploitation-index-for-river-2
-
(LXIV)
European Commission. CAP context indicator C.39 Water abstraction in agriculture. Based on EUROSTAT [
env_wat_abs
]
-
(LXV)
European Commission. CAP context indicator C.18 Agricultural area. Based on EUROSTAT [
apro_cpsh1
]
-
(LXVI)
European Commission. Prioritised Action Frameworkd (PAF) for Natura 20000 in Hungary
-
(LXVII)
European Commission. Prioritised Action Frameworkd (PAF) for Natura 20000 in Hungary
-
(LXVIII)
European Environmental Agency (EEA)
https://www.eea.europa.eu/data-and-maps/figures/loss-of-hnv-farmland-due
-
(LXIX)
European Commission. CAP context indicator C.35 Farmland birds index (FBI). As in EUROSTAT [
env_bio2
], original source: EBCC, BirdLife, RSPB and CSO
-
(LXX)
European Commission. CAP context indicator C.36 Conservation status of agricultural habitats. Original source:
European Environmental Agency
-
(LXXI)
Directorate General for Agriculture and Rural Development based on Eurostat and JRC based on LUCAS survey
-
(LXXII)
European Commission. CAP context indicator C.34 Natura 2000 areas. Based on NATURA 2000 Barometer and European Environmental Agency, Corine Land Cover 2018
-
(LXXIII)
National Biodiversity Strategy
-
(LXXIV)
National Biodiversity Strategy
-
(LXXV)
European Commission. CAP context indicator C.33 Farming intensity. Based on FADN –Agri-environmental indicator “Intensification/Extensification”
-
(LXXVI)
Eurostat [
ORG_CROPAR
]
-
(LXXVII)
European Commission. CAP context indicator C.23 Age structure of farm managers. Based on EUROSTAT [
ef_m_farmang
]
-
(LXXVIII)
Financial needs in the agriculture and agri-food sectors in Hungary, Fi-Compass, June 2020, p.55
https://www.fi-compass.eu/sites/default/files/publications/financial_needs_agriculture_agrifood_sectors_Hungary.pdf
-
(LXXIX)
Financial needs in the agriculture and agri-food sectors in Hungary, Fi-Compass, June 2020, p.55
https://www.fi-compass.eu/sites/default/files/publications/financial_needs_agriculture_agrifood_sectors_Hungary.pdf
-
(LXXX)
European Commission. CAP context indicator C.24 Agricultural training of farm managers. Based on EUROSTAT [
ef_mp_training
]
-
(LXXXI)
Directorate General for Agriculture and Rural Development own calculations based on Member State notifications via ISAMM.
-
(LXXXII)
https://ec.europa.eu/info/food-farming-fisheries/key-policies/common-agricultural-policy/cmef/rural-areas/impact-common-agricultural-policy-generational-renewal-local-development-and-jobs-rural-areas_en
-
(LXXXIII)
EUROSTAT
-
(LXXXIV)
Hungarian Rural Development Plan (HU RDP) 2014-2020. According to the HU definition used in the programming period 2014-2020: 91% of the territory is rural and 45% of the population lives in rural territories.
-
(LXXXV)
European Commission. CAP context indicator C.01 Population. Based on EUROSTAT [
demo_r_gind3
]
-
(LXXXVI)
European Commission. Statistical Factsheet – Hungary. June 2020,
https://ec.europa.eu/info/sites/info/files/food-farming-fisheries/farming/documents/agri-statistical-factsheet-hu_en.pdf
-
(LXXXVII)
EUROSTAT. [
ef_m_farmang
]
-
(LXXXVIII)
European Commission. Statistical Factsheet – Hungary. June 2020,
https://ec.europa.eu/info/sites/info/files/food-farming-fisheries/farming/documents/agri-statistical-factsheet-hu_en.pdf
-
(LXXXIX)
European Commission. CAP context indicator C.09 Poverty rate. Based on EUROSTAT [
ilc_peps11
]
-
(XC)
European Commission. CAP context indicator C.02 Age structure. Based on EUROSTAT [
demo_r_pjanaggr3
]
-
(XCI)
European Commission. CAP context indicator C.07 Unemployment rate. Based on EUROSTAT [
lfst_r_lfu3rt
]
-
(XCII)
European Commission. Turnover per person employed in the bio-economy in 2008 and 2015- HU rural factsheet based on
https://datam.jrc.ec.europa.eu/datam/mashup/BIOECONOMICS/index.html
Joint Research Center (JRC)
-
(XCIII)
European Commission. Harmonised Risk Indicator for pesticides (HRI 1), by group of active substance. As in EUROSTAT [
SDG_02_51
]
-
(XCIV)
DG SANTE report No. 2018-6363: https://ec.europa.eu/food/audits-analysis/country_profiles/details.cfm?co_id=HU
-
(XCV)
DG SANTE report No. 2018-6363: https://ec.europa.eu/food/audits-analysis/country_profiles/details.cfm?co_id=HU
-
(XCVI)
European Medicines Agency, European Surveillance of Veterinary Antimicrobial consumption (ESVAC). Sales of veterinary antimicrobial agents in 31 countries in 2018 – trends from 2010 to 2018 Tenth ESVAC Report.
EMA/24309/2020
.
-
(XCVII)
DG SANTE report No. 2019-6604: https://ec.europa.eu/food/audits-analysis/country_profiles/details.cfm?co_id=HU
-
(XCVIII)
https://ec.europa.eu/jrc/en/health-knowledge-gateway/societal-impacts/burden
-
(XCIX)
https://ec.europa.eu/eurostat/databrowser/view/sdg_02_10/default/table?lang=en
-
(C)
Defined as beef, lamb and pork, 234,18g/per capita/d, net of waste in the EU 2010. GBD study 2017 and M. Springmann.
-
(CI)
Dedicated website organized by the National Food Chain Safety Office,
https://www.eljmaradektalanul.hu/
-
(CII)
ENRD. Working Document – final version - Y5 RDP Screening on NRN programming and action plans 2020, page 6,
https://enrd.ec.europa.eu/sites/enrd/files/y5_rdp_screening_nrns_summary_report.pdf
-
(CIII)
Standing Committee on Agricultural Research (SCAR). 4th Report of the Strategic Working Group on
Agricultural Knowledge and Innovation Systems (AKIS) – Preparing for future AKIS in Europe,
https://ec.europa.eu/info/sites/info/files/food-farming-fisheries/key_policies/documents/report-preparing-for-future-akis-in-europe_en.pdf
)
-
(CIV)
EUROSTAT. [
ef_mp_training
].
-
(CV)
Hungarian Central Statistical Office (KSH) [
6.3.4.1. Kutató-fejlesztő helyek
]

