 EUROPEAN COMMISSION
Brussels,7.3.2018
SWD(2018) 206 final
COMMISSION STAFF WORKING DOCUMENT
Country Report Ireland 2018
x0009
Including an In-Depth Review on the prevention and correction of macroeconomic imbalances
Accompanying the document
COMMUNICATION FROM THE COMMISSION TO THE EUROPEAN PARLIAMENT, THE COUNCIL, THE EUROPEAN CENTRAL BANK AND THE EUROGROUP
2018 European Semester: Assessment of progress on structural reforms, prevention and correction of macroeconomic imbalances, and results of in-depth reviews under Regulation (EU) No 1176/2011
{COM(2018) 120 final}
Contents
Executive summary
1.Economic situation and outlook
2.Progress with country-specific recommendations
3.Summary of the main findings from the Macroeconomic Imbalance Procedure in-depth review
4.Reform priorities
4.1.Public finances and taxation
4.2.Financial sector and indebtedness
4.3.Labour market, education and social policies
4.4.Investment
4.5.Sectoral policies
Annex A Overview table
Annex B Macroeconomic Imbalance Procedure Scoreboard
Standard tablesAnnex C
References
LIST OF Tables
Table 1.1:Key economic, financial and social indicators - Ireland
Table 2.1:Summary table on 2017 CSR Assessment
Table 3.1:MIP assessment matrix (*) — Ireland 2017
Table B.1:The MIP scoreboard for Ireland (AMR 2018)
Table C.1:Financial market indicators
Table C.2:Headline Social Scoreboard indicators
Table C.3:Labour market and education indicators
Table C.4:Social inclusion and health indicators
Table C.5:Product market performance and policy indicators
Table C.6:Green growth
LIST OF Graphs
Graph 1.1:
GNI* vs GDP
Graph 1.2:
Modified Domestic Demand and Employment
Graph 1.3:
Employment developments
Graph 1.4:
Actual and predicted wage growth based on economic fundamentals
Graph 1.5:
Core investment and its components
Graph 2.1:
Level of implementation today of 2011-2017 CSRs
Graph 4.1.1:
Alternative debt indicators (EU countries, 2016)
Graph 4.1.2:
Bonds and EU-IMF programme loans repayment schedule (end-December 2017)
Graph 4.1.3:
Charges paid for the use of intellectual property
Graph 4.2.1:
Profitability of the main domestic banks
Graph 4.2.2:
NPL reduction by portfolio - domestic banks
Graph 4.2.3:
International investment position by institutional sector, non-IFSC
Graph 4.2.4:
Current account balance benchmark
Graph 4.2.5:
CA vs CA*
Graph 4.2.6:
Private debt evolution
Graph 4.2.7:
Composition of corporate debt
Graph 4.2.8:
Credit advanced to Irish companies
Graph 4.2.9:
Households’ financial assets
Graph 4.2.10:
New SME lending: volumes and interest rates
Graph 4.3.1:
Unemployment and inactivity as a percentage of the population aged 25-54
Graph 4.3.2:
Employment rates by level of education
Graph 4.3.3:
Change in employment by sector
Graph 4.3.4:
Main social indicators
Graph 4.3.5:
Progress towards reaching the benchmark of low achievers in reading, 2009-2015
Graph 4.4.1:
Total investment and main drivers
Graph 4.4.2:
Capital expenditure by the general government sector
Graph 4.4.3:
Labour productivity across sectors and firms, 2014
Graph 4.4.4:
Distribution of TFP values and means by quintile, indigenous companies vs multinationals, 2014
Graph 4.4.5:
Average growth rate of labour productivity
Graph 4.5.1:
House price increases
Graph 4.5.2:
Overvaluation gap with respect to price/income, price/rent and fundamental model valuation gaps
Graph 4.5.3:
Public support for business R&D as % of GDP, 2006 and 2014
LIST OF Boxes
Box 1.1: GNI* and other new indicators of Ireland's domestic economic activity
Box 2.1: Tangible results delivered through EU support to structural change in Ireland
Box 4.3.1: Monitoring performance in light of the European Pillar of Social Rights
Box 4.4.1: Investment challenges and reforms in Ireland
Box 4.5.1: Policy highlights: Technology Partnerships and Technology/Research Centres
Executive summary
The sustained strong economic growth in Ireland provides ample momentum to further increase the resilience of the public and private sectors. A continued reduction in government debt and deficit could create tailwinds against the possible materialization of external risks. Moreover, a rebalancing towards less volatile sources of government revenues could ensure the sustainability of public finances in the long run. Improvements in the balance sheets of households, companies and banks reflect continued deleveraging and progress in resolving nonperforming loans. Addressing these challenges would reduce the risk of a slowdown, should the external environment and financial conditions become less supportive. A tightening labour market, with rapidly subsiding unemployment, brings to the fore the importance of increases in labour market participation, while accumulating skills shortages further accentuate the need to continue upskilling efforts. Ensuring that the already broad-based growth reaches all parts of society, including addressing the remaining housing, social and infrastructural shortcomings, remains a government priority (
).
The Irish economy continues to grow at a solid pace. In the first three quarters of 2017, real GDP increased by 7.4 % year-on-year (y-o-y), well above the euro area average. It is projected to further increase by 4.4 % in 2018 and 3.1 % in 2019 (
). Uncertainties persist, primarily related to the outcome of the negotiations between the UK and the EU and potential changes to the international taxation environment. Ireland is one of the most affected Member States by the UK's decision to leave the EU, given the nature of the all-island economy, Ireland's geographical position and the volume of trade between the two countries.
Domestic economic activity continues to thrive. Modified domestic demand, a new measure of domestic activity that strips out some of the effects of multinationals, increased in 2016 and the first three quarters of 2017, driven by private consumption and construction investment. The strong, broad-based growth in employment also reflects the strength of domestic activity.
The labour market remains strong, with some outstanding challenges. In the third quarter of 2017, total employment increased by 2.9 % on an annual basis, and across almost all economic sectors. Fulltime employment increased by 7.1 % as people who had been working parttime are moving into full-time jobs. The unemployment rate fell to 6.7 % in 2017. In the third quarter of 2017, very longterm unemployment (over two years) stood at 28.9 % of all unemployment, somewhat above the EU average. Some challenges remain in relation to high inactivity rates and skills shortages in certain sectors. Some households also continue to experience poverty and social exclusion and the homelessness rate continues to increase.
The government has repeatedly intervened to tackle the undersupply of housing, but it will take time for the measures to have an effect. Against the backdrop of a limited housing stock, residential property price growth accelerated. Years of low investment following the economic bust are taking their toll on the availability of supporting infrastructure for residential sector construction (such as water and transport), constraining housing supply. Although prices did not seem overvalued in 2016, affordability is a concern.
The government deficit is moving closer to balance. The general government deficit is expected to decline further in the near future, although progress in making public finances more resilient has slowed down in recent years. Relying on highly volatile, highly pro-cyclical sources of revenue remains a risk.
Ireland has made some progress in addressing the 2017 country-specific recommendations (CSRs). With regard to the fiscal recommendations, it made some progress in 2017. The proceeds from the sale of government shares in state-owned banks have been used to reduce public debt and the National Asset Management Agency redeemed all of its government-guaranteed debt. As regards the recommendation to limit the scope and the number of tax expenditures and broaden the tax base, only a few of the measures taken have the potential to broaden the tax base. A new spending review signals progress in enhancing the quality of expenditure. Some progress has also been made in improving social infrastructure and delivering an integrated package of labour market activation policies. However, it remains difficult to access affordable, full-time, quality childcare. With regard to the lasting reduction of non-performing loans (NPLs), Ireland made some progress in 2017 as the stock of NPLs decreased. Insolvency procedures, in- and out-of-court arrears resolution avenues remain under-used. The credit register should become operational in 2018.
Regarding progress in reaching the national Europe 2020 strategy targets, Ireland is performing well on the employment rate and early school leaving targets. It needs to do more on investing in R&D, reducing greenhouse gas emissions, increasing the proportion of renewable energy, improving energy efficiency, reaching the national target for tertiary education and reducing poverty.
Ireland performs relatively well on most indicators of the Social Scoreboard supporting the European Pillar of Social Rights, while challenges remain. Ireland is tackling poverty and social exclusion and preventing early school leaving. Social protection systems do relatively well in reducing poverty and promoting social inclusion. Work-life balance measures are improving as take-up of childcare for children under three years has increased in recent years. Healthcare and homelessness show significant room for improvement. Despite its many information and communication technology (ICT) graduates, the proportion of the overall population having basic digital skills in Ireland remains low.
The main findings of the in-depth review contained in this report and the related policy challenges are as follows:
·Private debt levels continue to fall, improving the resilience of households and businesses. A large part of the stock of private debt in Ireland is attributed to multinational corporations with more modest linkages to the domestic economy. Domestic economic actors overall continue to reduce their debt bringing it broadly in line with fundamentals. Hence, the headline private debt levels somewhat overstate the severity of this imbalance. The growth in house prices increased the net worth of households and reduced the number of those in negative equity.
·Public debt continues to fall, but remains high. As a percentage of GDP it significantly declined to 72.8 % in 2016, on the back of strong nominal GDP growth. However, complementary indicators, including some which strip out the effect of multinationals, suggest that the burden of public debt remains significant by historical and international standards, exposing Ireland to economic shocks
·While Ireland's net international investment position remains very negative, risks to the external position of domestic sectors seem contained. The country’s negative net international investment position has improved somewhat after significantly deteriorating in 2015, but remains large. The nonfinancial corporate sector contributes the most to the negative balance, driven by the activities of a small number of very large multinationals with few implications for the external sustainability of the domestic sector. The risks associated with the external liabilities of these companies are mitigated by factors such as high profitability and offsetting overseas assets. Moreover, these liabilities are not linked to Irish investors. On the other hand, the net external position of the domestic sectors has improved.
·On the way to a sustained recovery of the financial sector, legacy issues still create constraints. Domestic banks have remained profitable and strengthened their capital ratios. They have also further reduced their NPLs, even though their stock remains considerable and provisioning coverage ratios fairly low. Their overall good performance allows for a more ambitious NPL reduction pace in particular through durable restructurings and write-offs. Long-term mortgage arrears (over two years past due) remain the biggest challenge. Insolvency procedures, in- and out-of-court options for arrears resolution remain little used. A fully functioning credit register, expected in 2018, will be crucial for assessing the debt servicing capacities of borrowers.
·Rapid house price increases are observed countrywide. Residential property prices rose by 11.6 % y-o-y to November 2017, continuing the upward trend of the previous years. Private sector rents have continued to increase, exceeding their pre-crisis peak. The macroprudential framework in place is expected to ensure that new credit is extended under prudent conditions, preventing any potential credit bubble. This is especially important given the current high demand for mortgages.
Other key structural issues analysed in this report, which point to particular challenges for Ireland’s economy, are the following:
·Broadening the tax base could help improve revenue stability in the face of economic fluctuations. In particular, taxes on corporate income as a proportion of total taxation continued to rise. In Ireland’s case such taxes are highly concentrated and prone to volatility.
·Debt overhang and uncertainty in some exporting sectors affect corporate credit demand. While some sectors are starting to borrow again, companies that export to the UK may be delaying some of their investment and borrowing decisions. Collateral and guarantee requirements, alongside interest rates above the EU average, could be curbing demand further.
·The strong labour market has had a positive impact on a number of social issues, but some challenges remain. Inactivity is still a concern, with a large proportion of the working age population remaining outside the labour force. The lack of access to affordable childcare services forces many, in particular women, into inactivity. The employment rate of people with disabilities is one of the lowest in the EU. Skills shortages are becoming increasingly apparent, most notably in ICT, financial services and engineering. Ireland has a relatively low level of the population with basic digital skills. Many people have yet to reap the benefits of the economic upturn.
·Some indicators suggest that Ireland’s tax rules are used by multinationals engaged in aggressive tax planning structures. Ireland has taken steps to amend some aspects of its tax system that may facilitate aggressive tax planning and is carrying out a consultation on further changes. However, the absence of some anti-abuse rules or the exemption from withholding taxes on dividend payments made by companies based in Ireland suggest that Ireland's corporate tax rules may still be used in tax avoidance structures.
·Addressing emerging infrastructure bottlenecks is essential for sustainable and balanced growth in the future. Combined with better spatial planning, improved infrastructure services, including for transport, energy and water, are critical enablers for an appropriate housing supply response, the enhancement of private investment and economic development. Finally, infrastructure investment as well as intensified efforts in the field of renewables will be essential for Ireland to succeed in its transition towards a low-carbon and environmentally resilient economy. The new Project Ireland 2040 framework proposes a series of measures to address the above-mentioned bottlenecks and promote a regionally balanced development model.
·A comparatively costly healthcare system, compounded by an ageing population, represent important challenges for the healthcare system. Demographic changes are projected to affect Ireland in the coming years, in particular the fiscal sustainability of its healthcare system. Multi-year budgeting and better expenditure control would support the much needed shift towards universal healthcare. Primary and community care services are not yet capable of alleviating the mounting pressure on capacity within hospital care.
·The productivity of domestic companies is lower, and growing at a slower pace, in comparison with the multinationals operating in Ireland. Positive spillovers from the multinationals appear when domestic companies are integrated with them in value chains. Spillovers from the multinationals could be greater if domestic companies invested more in R&D and innovation. Overall, Ireland is a strong innovator and continues to improve its position in international innovation rankings, but low public expenditure on R&D remains a cause for concern.
1.
Economic situation and outlook
GDP growth
The Irish economy continues to grow robustly. In the first three quarters of 2017, Ireland’s real GDP increased by 7.4 % year-on-year (y-o-y), well above the euro area average. GDP is estimated to further increase by 4.4 % in 2018 and 3.1 % in 2019. However, the headline figures remain volatile and heavily influenced by the activities of multinational enterprises in Ireland, especially in relation to contract manufacturing (
) and aircraft leasing.
|
Graph 1.1:GNI* vs GDP
|
|

|
|
Source: CSO
|
Domestic demand remains strong. Modified domestic demand (Box 1.1), a measure of domestic activity that strips out some of the distorting impact of multinationals, increased in 2016 and the first three quarters of 2017, supported by private consumption and construction investment. These factors are expected to further boost the underlying domestic economy, and are projected to expand at an average rate of 4 % over the next two years. The strong and broad-based growth in employment, in particular full-time employment, also reflects the strength of domestic economic activity (Graph 1.2).
|
Graph 1.2:Modified Domestic Demand and Employment
|
|

|
|
Source: CSO, European Commission
|
Output in the domestic economy is also increasing at a robust pace. In 2016, gross value added (GVA), output net of the inputs used for its production, increased by 5.3 % y-o-y in domestic sectors where the presence of foreignowned multinationals is not prevalent. GVA in the multinationals-dominated sectors increased by 4.9 %. A deceleration from the surge in 2015 was driven by the contraction in contract manufacturing. Industrial production data show that the output in domestic sectors declined by 0.7% y-o-y in the first 11 months of 2017. Over the same period, the output in sectors dominated by multinationals fell by 3.7%, also reflecting the slowdown in contract manufacturing from the previous year (Section 4.2.2).
External risks to the macro-economic outlook are tilted to the downside. They relate mostly to the outcome of the negotiations between the UK and the EU and changes to the international taxation environment.
|
Box 1.1: GNI* and other new indicators of Ireland's domestic economic activity
The Irish Central Statistical Office (CSO) published complementary adjusted measures of national indicators in an attempt to account for the effects of globalisation on measuring the Irish economy. In July 2016, the National Income and Expenditure Annual Results 2015 showed a massive surge in Irish GDP of more than 26%, due to relocations of a number of multinational companies' (entire) balance sheets to Ireland. These were dominated by intangible intellectual property (IP) assets, which added approximately EUR 300 billion to Ireland's capital stock. While there have always been difficulties with GDP in an Irish context, after the level shift in activity in 2015 it became broadly accepted that GDP and GNI do not provide a complete understanding of the Irish economy. The CSO set up the Economic Statistics Review Group (ESRG) to investigate alternative indicators of domestic economic activity. Based on its recommendations, in July 2017, the CSO published an adjusted indicator: the Modified Gross National Income* (GNI* - read as GNI "star"), an adjusted Balance of Payments (BoP) and additional cyclical indicators. Further metrics are to be developed in the near future.
Modified Gross National Income (GNI*) is an indicator designed to reflect aspects that distort the aggregate size of the domestic economic activity. Table 1 presents the compilation of the new GNI* measure. The transition from GDP to GNI has the largest quantitative impact. GNI* excludes the retained earnings of re-domiciled public limited companies (PLCs) because relocation, often motivated by tax considerations, may not be associated with substantive domestic economic activity. In addition, under the ESA2010 national accounting framework, intangible assets, including IP, are treated as non-financial assets subject to depreciation. The significant increase in 2015 investment therefore led to an increase in depreciation charged in Ireland on what is a foreign-owned portion of capital stock. Since the depreciation on the foreign-owned capital stock is borne by foreign investors, it should not affect a measure that is intended to capture the resources accruing to domestic residents. For this reason, GNI* also deducts this element, which accounts for approximately 70% of the gap between GNI and GNI*. The leased aircraft can be viewed as a physical asset for the host country. It involves depreciation charged in Ireland but ultimately borne by the (foreign) end user of the aircraft, with little or no impact on the actual domestic economy. This is why GNI* also subtracts the depreciation of leased aircraft. Furthermore, it is published only on an annual basis and in nominal terms. While GNI* is intended as an additional indicator to provide a more comprehensive picture of the domestic economy, GDP continues to be the standard international measure used.
Table 1: GDP and transition from GNI to GNI*

Source: CSO
Modified total domestic demand is defined as total domestic demand net of trade in aircraft by leasing companies and investment in intellectual property. The indicator also measures the domestic economy. It is designed to be largely unaffected by the activities of multinational companies and to be more closely related to employment growth. In order to derive this measure, the CSO compiles an indicator for modified gross domestic fixed capital formation (GFCF*) which aims to better indicating the physical capital used to produce domestic output. GFCF* then replaces GFCF in the calculation of modified total domestic demand.
Modified current account measure (CA*) adjusts for the activities linked to multinationals. It excludes from the current account balance (CA) the following: imports of R&D-related IP and aircraft for leasing, the depreciation of this foreignowned domestic capital and the factor income of re-domiciled companies. Some multinationals in Ireland purchase IP, or aircraft for leasing, from their parent company. In time, they repay the costs from the profit associated with the IP or aircraft for leasing. These import costs are therefore not a liability for Irish residents and should be excluded from the CA. The CA* also substracts the depreciation of capital assets sometimes held outside Ireland and owned by Irish resident foreign-owned companies (such as IP and aircraft leasing), which is borne by foreign investors. This is especially the case if the relocated capital is not used in combination with domestic labour but in combination with overseas workers through contract manufacturing arrangements. The income flows on portfolio debt/equity are recorded on a cash basis. This means that if a re-domiciled company opts to retain its net income, this is recorded as a direct investment inflow and added to the stock of portfolio equity liabilities. The corresponding outflow is only recorded when dividends are paid to the foreign shareholders, and the CA will then decline accordingly. Therefore, if the earnings are retained the CA (and GNI) will be inflated by the non-payment of the dividend. In order to discount for the timing effect of divided payouts, the CA* subtracts the net incomes of these re-domiciled companies, treating them as income outflows regardless of whether they are distributed as dividends or retained.
The new indicators will not be used as official instruments of economic surveillance, only as complementary where relevant. One of the purposes of economic surveillance is to ensure that the indicators are comparable across EU countries. However, the new indicators represent a specific reaction to some major concerns for Ireland at the moment and they can add value to the analysis of the Irish economy. Therefore, they will be used as complementary indicators where relevant and possible.
|
Labour market
The labour market continues to perform strongly. In the third quarter of 2017, employment increased across almost all economic sectors by an average of 2.9 % yo-y (Eurostat definition, age group 20-64). Fulltime employment increased by 7.1 %, exceeding the increase in total employment as part-time workers start working full-time (Graph 1.3). The unemployment rate fell to 6.7 % in 2017. With the improvements of the labour market, skills shortages have been reported in a number of sectors, in particular within information and communications technology.
|
Graph 1.3:Employment developments
|
|

|
|
Source: European Commission
|
Wage growth resumed in 2014 reflecting the economic recovery, and remained moderate in 2016 and 2017. Nominal compensation per employee increased by 2 % in 2016, and is expected to have increased to 2.6 % in 2017 (based on estimates by Arpaia and Kiss, 2015). This is consistent with productivity growth, inflation and the fall in unemployment (see Graph 1.4). It is also consistent with a roughly constant percentage of wages in total income and slightly increasing unit labour costs. Moderate wage developments coupled with dynamic employment growth could indicate a persistent slack in the labour market.
|
Graph 1.4:Actual and predicted wage growth based on economic fundamentals
|
|

|
|
Source: European Commission AMECO database and update of calculations by Arpaia and Kiss (2015).
|
Social developments
Ireland's social situation continues to improve. Absolute poverty levels and joblessness have dropped since 2012, but the proportion of people at risk of poverty or social exclusion remains high. This is mainly because there is a very high number of low-work-intensity households in Ireland. Homelessness has also increased in recent years, with the situation being exacerbated by housing shortages (Section 4.4.3).
Wealth inequality is decreasing from high levels as market prices of housing assets recover. The Gini coefficient used to measure inequality for net wealth was 75 in 2013, among the highest in the EU (
). However, this was driven partly by high levels of negative housing equity – meaning the value of the mortgage exceeded the market value of the housing asset. When households in negative equity are excluded, the Gini coefficient falls to 65, which is in line with the euro area average. The recovery in the value of housing assets in recent years has led to a reduction in negative equity (see Section 4.2.3), and consequently to a reduction in wealth inequality.
Inflation
Consumer price inflation (HICP) remains fairly muted. Inflation rose only marginally in 2017 by 0.3 %. The upward pressure came from increasing energy prices and services. However, currency depreciation in the UK, from which Ireland imports approximately 25% of all goods, has contributed to the persistently negative price inflation of goods, offsetting increases in the prices of services. The negative price impetus coming from the goods side is expected to continue in the short term. Prices for services and residential rents are expected to remain the main positive driving force behind inflation in the next two years.
Competitiveness
External competitiveness appears to have deteriorated slightly because of exchange rate fluctuations. The depreciation of sterling in relation to the euro, contributed to the deterioration in Ireland’s competitiveness in 2016. This was partly offset by weak consumer price inflation.
External position
The activities of multinationals have a major impact on Ireland’s trade and external sector statistics. Contract manufacturing weighed on exports figures in 2017 (
), even though it played a major positive role in Q3-2017. Overall, in the first three quarters of 2017, total exports increased by 5.1 % y-o-y, mostly driven by exports of services. Total imports declined by 5.8 % yoy held back by extremely volatile imports of intellectual property services. As a result, a highly positive net external trade contributed significantly to GDP growth in the first three quarters of 2017. Under the technical assumption of no disruption to trading relations between the EU and the UK, exports are projected to increase in line with global trade. Imports are predicted to gather momentum on the back of strong consumer demand, leading to a moderation of the positive impact of net exports on GDP growth.
The risks to the external position of domestic sectors are smaller than the headline figures suggest. The headline net international investment position (NIIP) deteriorated markedly in 2015. However, this is primarily related to the position of non-financial corporations, a sector dominated by multinationals with limited links to domestic activity. By contrast, the international investment position of domestic sectors, such as the Central Bank, domestic commercial banks and general government, improved. Distinguishing between domestic and multinational companies in the non-financial sector is necessary to better interpret these headline figures. The marked deterioration in the external position of multinationals, in particular in 2015, considered as a whole, does not appear to threaten the domestic economy (Section 4.2.2). However, the high negative NIIP warrants continuous monitoring.
Financial sector
The financial sector remains stable, but legacy assets remain a challenge. The capital buffers of the Irish banks have improved and their profitability levels are being maintained (Section 4.2.1). However, legacy assets, overall subdued credit demand and the interest rate environment are preventing them from significantly improving their profitability. Their stock of non-performing loans is declining but remains high, and their provisioning levels are below the EU average. In particular, the resolution of long-term mortgage arrears is progressing at a sub-optimal pace. External uncertainty is an additional concern for parts of the financial sector with links to the UK.
While the deleveraging of the domestic private sector is ongoing, credit demand is recovering for certain categories of loans. This is the case for consumer and mortgage loans, as well as for certain corporate activities. In 2017, new mortgage lending increased by 29 % on an annual basis. House price dynamics have also increased the average value of mortgages drawdown. A stronger recovery of demand for mortgages could, however, be curbed by housing supply limitations. The concentration of the banking sector and legacy assets have resulted in interest rates somewhat above the euro area averages. Corporate loans account for over 40 % of domestic banks’ new lending, but net lending remains negative as SMEs continue to deleverage (Section 4.2.5). State-supported credit measures are being reshaped to better address companies’ needs, in particular those of exporters to the UK.
Investment and housing market
Headline investment figures remain very volatile and should be interpreted with caution. Much of the surge in investment in 2016 (61 % y-o-y), attributable to intangible assets, was related to intellectual property services, with no impact on GDP because these services are imported. Total investment (gross fixed capital formation) in the Irish economy declined by 15.6% y-o-y in the first three quarters of 2017, but the quarterly profiles have been extremely volatile. Investment in aircraft has also contributed to the swings in total investment.
Evidence suggests that core domestic investment continues to gain momentum. In particular, investment in residential property in the first three quarters of 2017 increased by 14.9 %, supported by government policies (Graph 1.5). The recent dip in core machinery and equipment investment may be a sign that investors are reacting to external uncertainties (DBEI, 2017). The European Investment Bank confirms a deteriorating outlook for investment by companies, due largely to global uncertainties (EIB 2017).
|
Graph 1.5:Core investment and its components
|
|

|
|
Source: CSO
|
Public investment is recovering. In its Mid-term Review of the Capital Investment Plan, the government announced an additional EUR 6 billion for public investment over the period 2018-2021, on top of the EUR 42 billion allocated in the initial 2015 Plan. Capital expenditure is now expected to reach 2.5 % of GDP in 2021. In 2018, the government plans to publish a new 10-year National Investment Plan for the period 2018-2027.
Residential property price growth has accelerated recently. In terms of volume, residential building and construction output increased by 37.7 % y-o-y in the third quarter of 2017, albeit from a very low base. Based on current estimates (
), market participants expect annual house completions in the order of 23 000 units in 2018. The number of house completions seems unlikely to reach the level required, estimated in the range of 23 000 (rising to 32 000 by 2024) (Duffy et al, 2016) to 50 000 (Lynons, 2017) new homes per year. The overall stock of residential properties listed for rent has fallen. All these factors are contributing to rising prices and rents (Section 4.5.1). House prices are 71.6 % higher than their through in 2013 and the price increases accelerated in 2017, putting pressure on affordability.
Lasting housing shortages are being addressed, but it will take time for the measures to have an effect. Many companies consider the housing infrastructure in their region inadequate. The slow growth in total housing stock is a direct consequence of the crisis and the breakdown in construction production capacity, as well as bottlenecks in supporting infrastructure. Housing pressures are most chronic in Dublin. Supply-side actions under the government’s five-year Rebuilding Ireland Action Plan include targeted enabling infrastructure provision to open up strategic residential sites, mainly in the cities, activation of state-owned sites as well as fast-track planning procedures to speed up decision-making. The new National Planning Framework could facilitate a more stable housing market by enabling a coherent spatial distribution of housing and infrastructure.
Public finances
The government deficit is moving closer to balance. The general government deficit is expected to have reached 0.4 % of GDP in 2017, an improvement of 0.3 pps compared to the previous year’s deficit. Taking into account the package of measures announced in the 2018 Draft Budgetary Plan, the deficit is still expected to fall further to 0.2 % in 2018 due to the resilient outlook for GDP and domestic demand. However, risks to the budgetary projections are on the downside. They relate mainly to macroeconomic uncertainties and the volatility of some sources of government revenues.
Relying on volatile, highly pro-cyclical sources of revenue remains a risk. The majority of revenue-raising measures introduced in Budget 2018 are biased towards uncertain tax bases. In particular, the increase in the stamp duty rate on commercial property purchases, although an additional yield, increases reliance on transaction-based taxes. In the recent past, these have proved to be an unstable and highly pro-cyclical source of government revenue. The reduction in capital allowances for intangible assets may help smoothen corporate tax revenue over time. However, it will not impact the overall tax receipts.
Public debt, as a percentage of GDP, continues to fall, but remains elevated. Gross general government debt is expected to have declined to 69.6 % of GDP in 2017, from 72.8 % of GDP in 2016, and to further decline to 69.1 % in 2018 and 67.2 % of GDP in 2019. This is contingent on continued robust GDP growth and the realisation of primary budget surpluses. However, complementary indicators, including debt-to-GNI* (Box 1.1), show that the burden of public debt remains considerable (Section 4.1.1). Favourable market conditions and the long-term maturity of the debt stock are expected to smooth future refinancing operations.
|
|
|
Table 1.1:Key economic, financial and social indicators - Ireland
|
|

|
|
Source: Eurostat and ECB as of 30 Jan 2018, where available; European Commission for forecast figures (Winter forecast 2018 for real GDP and HICP, Autumn forecast 2017 otherwise)
|
|
|
2.
Progress with country-specific recommendations
Progress with the implementation of the recommendations addressed to Ireland in 2017 (
) has to be seen in a longer term perspective since the introduction of the European Semester in 2011. Looking at the multi-annual assessment of the implementation of the CSRs since these were first adopted, 80 % of all the CSRs addressed to Ireland have recorded at least 'some progress'. 20 % of these CSRs recorded 'limited' or 'no progress' (see Figure 2.1). Labour market policies such as job creation and life-long learning have been among the most successful.
|
Graph 2.1:Level of implementation today of 2011-2017 CSRs
|
|

|
|
Source: European Commission
|
Efforts with regard to the structural part of the fiscal country-specific recommendation (CSR) are mixed. Ireland has achieved considerable success in stabilising its public finances and has been able to ensure a sustainable correction of the excessive deficit. The government deficit has improved from 3.6 % in 2014 to 0.7 % in 2016. The structural balance has also improved, but more slowly in recent years. Limited progress has been made in broadening the tax base. Expenditure ceilings now take into account demographic pressures and carry-over effects, but their repeated changes remain a concern for budgetary execution. Measures have been taken to increase the cost-effectiveness of the healthcare system but many of them are still in their infancy. Public investment started to increase in 2014 and the government has outlined some of its investment priorities until 2021. The insufficient supply of housing, as well as related deficiencies in infrastructure and planning, have become more pressing for both economic and social reasons. The government is adopting measures to support supply, including increasing the provision of social housing units and the vacant site levy.
The labour market recovery has also been supported by CSR implementation since 2014. Ireland has implemented a range of active labour market reforms over recent years. Support programmes for jobseekers have now been fully rolled out. Intreo (Irish Public Employment Service) centres offering activation and social protection measures have been set up. Reforms of further education and training, aimed at promoting re-skilling and up-skilling, have also made continuous progress. Ireland has also achieved some success in addressing child poverty by, for example, improving inclusion programmes. The Housing Assistance Programme and the Back to Work Family Dividend have reduced disincentives to return to work. It remains difficult to access affordable, full-time, quality childcare, although the situation did improve in 2017. The policy measures undertaken are in line with the EAR 3 that emphasizes the promotion of quality job creation, equal opportunities and access to labour market, fair working conditions, as well as social protection and inclusion.
Progress in implementing the financial sector CSR has been made since 2014, but the high stock of non-performing loans (NPLs) remains a burden. The stock of NPLs has decreased considerably but their ratio to total gross loans remains among the highest in the EU and the pace of reduction has slowed down somewhat. Long-term impaired mortgages have proven to be the most difficult to restructure, with most of these cases still at some stage of the lengthy legal process. The supervisor is closely monitoring the banks’ non-performing loan reduction strategies and their restructuring practices. Several policy measures have been introduced to support debtors in distress and increase the number of personal insolvency arrangements, but take-up of these measures remains limited overall. The central credit register is supposed to be ready for use in early 2018.
|
|
|
Table 2.1:Summary table on 2017 CSR Assessment
|
|

|
|
Source: European Commission
|
|
|
Ireland has made some (
) progress in addressing the 2017 CSRs. Since the CSR adoption in July 2017, some windfall gains have been used to accelerate the reduction of public debt, but the country has taken measures with mixed impact on the tax base. This means that some progress was made on CSR 1. With regard to CSR 2, which is reflective of both EAR 2 and EAR 3, a new spending review process has improved the quality of expenditure. Improvements have also been made in social infrastructure and an integrated package of labour market activation policies has been proposed. However, access to quality childcare and the labour market participation of particular groups, many requiring upskilling support, remain problematic. Ireland has also made some progress on CSR 3. The stock of NPLs has continued to fall but remains high, while the long-term sustainability and resilience of restructuring solutions has yet to be proven. As noted in the EAR 4, a tangible acceleration of NPL resolution contributes to overall risk reduction.
|
Box 2.1: Tangible results delivered through EU support to structural change in Ireland
Ireland is a beneficiary of European Structural and Investment Funds (ESI Funds) support and can receive up to EUR 3.4 billion until 2020. This represents around 7% of public investment
I
annually over the period 2014-2018. By 31 December 2017, an estimated EUR 2.6 billion (79 % of the total) was allocated to projects on the ground. This has paved the way for over 31 000 enterprises (50% of the target) to have received support and/or management and marketing training, for over 850 enterprises engaged with co-funding strategic research centres and over 550 new researchers employed in supported entities; over 830 new and 20 000 existing enterprises are supported, including for the creation of over 2 700 additional jobs and 36 000 trained persons for SMEs; over 400 000 people benefit from training and education programmes; and 500 farm partnerships have been created, leading to generational renewal in agriculture.
ESI Funds help address structural policy challenges and implement country-specific recommendations. These include prioritising public investment in innovation in particular in support of SMEs, incentivising employment and increasing the flexibility of the labour market and labour market access. The ESI Funds also support the implementation of CSRs by helping strengthen activation measures, innovation and research. ESI Funds address wider structural obstacles to growth and competitiveness, including upskilling people within and outside the labour force in order to meet future skill needs, enlarging the coverage of superfast broadband; incentivising innovation and private investments; and supporting and training workers of several thousand Irish enterprises. High take-up levels by end users of rolled-out superfast broadband throughout the country will enable e-Commerce and e-Government by SMEs and inhabitants, new competitiveness skills in thousands of SMEs after support and training, and hundreds of more RTDI results to come from research institute-company cooperation to make Irish-owned firms more competitive to produce products and services in demand in global markets. ESI Funds are also mobilised to improve the digital skills of the working age population which is highlighted as a challenge for Ireland in the Social Scoreboard supporting the European Pillar of Social Rights.
Ireland is advancing in the take up of the European Fund for Strategic Investments (EFSI). As at December 2017, the overall financing volume of operations approved under the EFSI amounted to EUR 982 million, which is expected to trigger total private and public investment of EUR 3.9 billion. More specifically, 14 projects involving Ireland have been approved so far under the Infrastructure and Innovation Window (including 7 multi-country projects), amounting to EUR 733 million in EIB financing under the EFSI. This is expected to trigger EUR 2.6 billion in investments. Under the SME Window, six agreements with financial intermediaries have been approved so far. European Investment Fund financing enabled by the EFSI amounts to EUR 249 million, which is expected to mobilise approximatively EUR 1.3 billion in total investment. Over 13 600 smaller companies or start-ups will benefit from this support. Energy ranks first in terms of operations and volume approved, followed by SMEs, social and environment.
Funding under Horizon 2020, the Connecting Europe Facility and other directly managed EU funds is additional to the ESI Funds. By the end of 2017, Ireland has signed agreements for EUR 96 million for projects under the Connecting Europe Facility.
https://cohesiondata.ec.europa.eu/countries/IE
|
ESI Funds are important in addressing key challenges to inclusive growth and convergence in Ireland, notably by prioritising public investment in innovation in support of SMEs throughout the country, supporting institute-company cooperation to make Irish-owned firms more competitive to produce products and services in demand in global markets and incentivising innovation and private investments. ESI Funds are also instrumental for upskilling the labour force in order to meet future skill needs, increasing the flexibility of the labour market and labour market access.
3.
Summary of the main findings from the MACROECONOMIC IMBALANCE PROCEDURE in-depth review
The in-depth review for the Irish economy is presented in this report. In spring 2017, Ireland was identified as having macroeconomic imbalances, in particular relating to the high levels of private and public debt, the negative net external liabilities, the high stock of nonperforming loans and the rapidly rising property prices. The 2018 Alert Mechanism Report concluded that an in-depth review should be undertaken for Ireland to assess developments relating to identified imbalances. Analyses relevant for the in-depth review can be found in the following sections: public debt in Section 4.1.1, financial sector imbalances in Section 4.2.1, external imbalances in Section 4.2.2, private indebtedness in Section 4.2.3, and the property market in Section 4.5.1 (
).
3.1 Imbalances and their gravity
While private sector debt remains a vulnerability, the underlying flows signal strong continued deleveraging. A large part of the stock of private debt is attributable to multinational corporations with fewer connections to the domestic financial system and the domestic economy as such. There is continued evidence that domestic economic actors are still deleveraging in general, with some credit recovery in specific categories such as larger corporate and mortgage loans. The rise in housing prices increased the net worth of households and reduced the number of those in negative equity, but certain cohorts of borrowers remain particularly vulnerable.
Irish public indebtedness has decreased in recent years, while remaining elevated. As a proportion of GDP it has significantly declined, to 72.8 % in 2016, on the back of strong GDP growth. However, in Ireland’s case, the GDP figure overstates the actual size of the domestic economy. Measured as a proportion of GNI*, public debt amounted to 106 % in 2016. Although policy measures are being taken to make public finances more resilient, high public debt makes Ireland vulnerable to economic shocks.
The stock of NPLs decreased steadily in the year to June 2017, albeit more slowly than before. The aggregate NPL ratio for domestic banks was 14.4 % at the end of June 2017, down from 17.2 % in the previous year. The reduction in the stock of NPLs is the result of a combination of restructuring activities and portfolio sales, with varying degrees of success among individual banks. Long-term arrears continue to be a challenge, accounting for more than half of total mortgage NPLs and more than a third of total NPLs.
The country’s very negative net international investment position (NIIP) is improving. After significantly deteriorating in 2015 to -244 % of GDP, it recovered to 170 % in the third quarter of 2017. While the risks to the external position of domestic sectors seem contained, it is difficult to assess them fully.
Persistent supply shortages, coupled with increasing demand, continue to fuel property price increases. After two years of already strong increase, real house prices grew by 6.6 % in 2016 and continued to increase in 2017. This is a trend observed countrywide. House prices do not yet seem to be overvalued, but affordability may become a concern. Supply shortages remain the prime driver of the increase in house prices and rents. While supply is forecast to fall short of demand for some time, construction activity is gaining momentum. Starting from a low base, housing completions are estimated to have picked up by 42.3 % y-o-y in November 2017.
3.2 Evolution, prospects and policy responses
Domestic private sector deleveraging could be reaching a turning point for some categories of borrowers. While debt reduction is overall expected to continue, some firms are seeking credit again. Household debt also stopped contracting in 2017. However, credit expansion for both of these categories is limited by current housing supply shortages as well as heightened external uncertainty for some businesses.
Some measures have been introduced to accelerate the reduction of public debt. The 2018 Draft Budgetary Plan estimates gross debt to have fallen to 70.1 % of GDP in 2017 and to reach 69.0 % in 2018, contingent on continued strong GDP growth and the realisation of primary budget surpluses. The government has also used some proceeds, notably income from the sale of shares in state-owned banks, to accelerate debt reduction.
Insolvency procedures, incourt and outofcourt arrears resolution avenues remain under-used. The number of personal insolvency applications has increased since the Abhaile aidand-advice scheme was set up. However, there has been an increase in creditors’ rejections of the proposed insolvency arrangements, which transfers the cases to court, reducing the number of arrangements concluded. Collateral repossessions are still quite rare. The credit register should become fully operational in 2018.
The external position of the domestic sectors has improved. As banks restored their access to market funding, the NIIP for the domestic banking sector turned positive in 2016 and further increased in 2017. This in turn improved the Central Bank’s net external position, which stood at 6.5 % of GDP in the second quarter of 2017, a 5.5 pps annual improvement. The general government position remains negative but is improving. Overall, the predominantly negative level of its NIIP appears to be driven by the activities of multinationals in Ireland, with few implications for the sustainability of the domestic economy (Section 4.2.2).
The government has repeatedly intervened in the residential property market to help boost supply, but it will take time for the measures to have an effect. Building on Rebuilding Ireland – Action Plan for Housing and Homelessness (see Country Report 2017), the 2018 Budget envisages a number of additional measures aimed at addressing the housing shortage, including social housing and changes to the vacant site levy. A new National Planning Framework, intended to replace the 2002 National Spatial Strategy, could facilitate a more stable housing market by enabling a coherent spatial distribution of housing and infrastructure. Other measures include speeding up the planning permission process, making land in state/semi-state ownership available for residential development and financing resources for commercial investment in housing. The government published draft guidelines including measures reducing some restrictions on apartment building, to make it more attractive and affordable. The 2017 review of mortgage-related measures left the existing macroprudential framework largely in place.
3.3 Overall assessment
The levels of external, public and private debt and the share of NPLs are a source of vulnerability for the economy. After declining in 2016, household debt remained broadly unchanged in 2017 against the background of a recovery in credit demand, while most domestic companies continued reducing their debt. Public debt is on a firm downward trajectory and the deficit is projected to move closer to balance. The level of NPLs is declining and the banks’ capital positions have improved, which makes them well placed to further intensify NPL restructuring efforts. The country’s very negative NIIP is by and large due to the operations of some multinational companies in 2015 and the negative net position of the International Finance Services Centre (IFSC) (
), with limited exposure to the domestic sector, and therefore to its external sustainability. Property prices continued to increase over the course of 2017 but to date there is no significant evidence of overvaluation. Unlike in the pre-crisis period, bank credit is not driving current price developments. Comprehensive policy measures have been taken to address these vulnerabilities. They include reducing government debt by using windfall gains and measures to reduce the high stock of NPLs. The government has repeatedly intervened to tackle the undersupply of housing, but it will take time for the measures to have an effect. Macroprudential rules have also been put in place to ensure the resilience of households and banks by preventing unsustainable credit growth. High uncertainty surrounds the final outcome of the negotiations between the UK and the EU. Possible changes to international tax and trade policies could also be a source of asymmetric shock.
|
|
|
Table 3.1:MIP assessment matrix (*) — Ireland 2017
|
|

|
|
|
|
(Continued on the next page)
|
|
Table (continued)
|
|
|
|

|
|
Source: European Commission
|
4.
Reform priorities
4.1.
Public finances and taxation
4.1.1.Fiscal policy*(public deficit and debt developments)
Irish public debt remains elevated. In nominal terms, it peaked at EUR 215 billion (or 120 % of GDP) at the end of 2013, a five-fold increase from what it was shortly before the crisis. Since then, Irish public debt as a proportion of GDP has significantly declined, reaching 72.8 % in 2016 (EUR 201 billion), on the back of strong GDP growth. However, when assessed using a range of other metrics, including debt-to-GNI* (see Box 1.1), Ireland’s stock of public debt remains high by historical standards and by comparison with other EU countries (Graph 4.1.1).
In spite of its high debt levels, the country’s financing situation remains comfortable. Government bond yields have fallen sharply since the end of 2013 and remain low by historical standards. This reflects Ireland’s continuing strong economic and fiscal performance, as well as the ongoing ECB bond purchases under its quantitative easing programme. Almost EUR 15.8 billion were raised in 2017 via benchmark bond sales. This is somewhat in excess of the government’s initial plans, with the additional issuance linked to the early repayment of EUR 5.5 billion in EU-IMF programme loans.
Public debt is largely long-term, at a fixed rate. At the end of 2016, it amounted to EUR 201 billion, 89.7 % of which had a maturity of more than one year. Over half of the medium- and long-term debt — around EUR 102 billion — consisted of fixed rate treasury and amortising bonds while EUR 19.5 billion were floating rate notes. After the early loan repayment in late 2017, around 26 % of long-term marketable and official debt represented official loans from the EU-IMF programme partners. The combination of currently very favourable market conditions and sensible debt management operations has contributed to the decline in the effective interest rate. It was estimated at around 3.1 % in 2016, 0.3 pps. lower than in 2015, and it is projected to further decline to 2.8 % in 2018.
|
Graph 4.1.1:Alternative debt indicators (EU countries, 2016)
|
|

|
|
Source: European Commission and CSO
|
Despite the average long maturities, an amortisation hump is expected in the forthcoming years. The weighted average maturity of Irish public debt, above 10 years, is one of the longest in the EU. However, there will be a noticeable amortisation hump of bonds and programme loans, amounting to an average annual financing need of around 6 % of GDP, between 2019 and 2020. The redemption profile of European Financial Stability Facility (EFSF) and European Financial Stabilisation Mechanism (EFSM) loans currently extends until 2042, with the next principal repayment due in 2018. However, the 2018 EFSM maturities are expected to be refinanced, owing to the maturity extensions granted in 2013. In this regard, early loan repayment is also expected to improve debt sustainability by locking in low interest rates and longer maturities.
|
Graph 4.1.2:Bonds and EU-IMF programme loans repayment schedule (end-December 2017)
|
|

|
|
Source: National Treasury Management Agency
|
The decision to repay, early and in full, some outstanding loans is expected to further reduce the interest burden. In December 2017 (
), the Irish authorities repaid the outstanding IMF loans, together with the bilateral loans from Denmark and Sweden, early and in full. The intention was to make use of the currently favourable market conditions and the healthy cash position (
) to improve Ireland’s debt sustainability. According to the National Treasury Management Agency (NTMA) these early repayments are expected to generate interest savings of around EUR 150 million over the remaining life of the loans, while smoothening and extending the debt maturity profile.
Debt sustainability has improved. A debt sustainability analysis by the Commission (
) based on the 2017 Autumn Economic Forecast, projects that, in a baseline no-policy-change scenario, Ireland's public debt will decrease by about 21.7 % of GDP between 2017 and 2028, to around 48.3 % of GDP. The analysis also shows that adverse shocks to real GDP growth — of a magnitude reflecting the country’s historical variability of output (
) — would increase the public debt-to-GDP ratio by 19.2 pps. by 2028 compared to the baseline scenario, to about 67.5%.
Government contingent liabilities are waning. State guarantees, most of which are linked to the support granted to financial institutions, fell sharply to 1.9 % of GDP at the end of 2016, down from 4.8 % in 2015. In October 2017, the National Asset Management Agency (NAMA) redeemed the final EUR 500 million of its government-guaranteed debt, three years ahead of target.
Long-term fiscal sustainability risks related to the cost of ageing remain. According to the most recent long-term assessment approved by the Economic Policy Committee Ageing Working Group, the cost of ageing presents a medium fiscal sustainability risk over the long-term. Despite more favourable population projections than those assumed in the previous assessment undertaken in 2015, total age-related expenditure is forecast to rise by 4.1 pps. of GDP during 20162070, with total pensions alone rising by 1.6 pps. of GDP (European Commission, 2018a). Moreover, while the Irish authorities have legislated a wide range of reforms to contain public pension expenditure, the total pension system deficit will grow significantly from 1.7 % of GDP in 2016 to 2.7 % of GDP in 2070.
4.1.2.Fiscal frameworks and spending reviews
Overall government expenditure in 2017 was within budget allocations. The overall spending remained on target. In some departments, however, slippages of around EUR 480 million emerged, driven by current healthcare expenditure and increased capital spending on housing. This was offset mainly by a lower than expected EU budget contribution and debt interest payments. Current primary expenditure was up 4.0 % yoy and on profile. Capital expenditure was up 9.3 % yoy and above profile (EUR 44 million). The overruns were largely accommodated within the supplementary 2017 expenditure agreed by the parliament in December 2017.
Budget 2018 has benefited from a new spending review process. The government carried out a spending review of current expenditure to help prepare Budget 2018, by analysing the current spending package and new policy proposals. The spending review, in its first three-year cycle, focused on specific critical spending areas, representing around 30 % of current government expenditure. Examples would be drug costs in the healthcare sector, disability and employment support in the area of social protection, and public transport (European Commission, 2018c). The process for setting and revising three-year expenditure ceilings and, more generally, the medium-term budgetary framework, could also be reviewed. Despite the evident improvements in the expenditure management framework, year-on-year departmental budgeting has led to repeated changes to expenditure ceilings, which ultimately weakened multi-annual spending planning.
A Rainy Day Fund could contribute to more sustainable growth. The resilience of public finances to economic fluctuations and adverse shocks could be strengthened. In its 2017 Summer Economic Statement the government proposed that EUR 500 million per year (around 0.2 % of projected 2019 GDP) of the 20192020 fiscal space be deployed in a Rainy Day Fund. However, the details of this fund still need to be set out (European Commission, 2018c). As discussed in the Irish Fiscal Advisory Council's pre-budget 2018 statement (IFAC, 2017), it is unclear how the design of the Rainy Day Fund could ensure that it is truly countercyclical.
4.1.3.Taxation
Tax revenues have increased a lot in recent years, but the volatility of certain sources of revenue remains a concern. On the back of the strong economic recovery, tax revenues increased at an average annual rate of around 7% over the period 2011-2017. However, as a proportion of GNI* (Box 1.1), they were just below 28 % in 2016, 2 pps. lower than the historical average (1995-2015). Corporate income taxes as a percentage of total taxation continued to increase, amounting to 11.6 % of total taxation in 2016, the highest level since 2006 and an increase of 3.3 pps. since 2014. As outlined in the 2017 country report (Section 4.1.3), corporate tax revenue is highly concentrated and prone to volatility. However, the reduction in capital allowances for intangible assets may help smoothen corporate tax revenue over time.
Broadening the tax base can help improve revenue stability in the face of economic fluctuations. According to a EUROMOD simulation (
), however, the personal income tax base has been narrowed in the last few budgets (
). The measures in Budget 2018 show a mixed picture in terms of their impact on tax bases (European Commission, 2018c).
Some measures in Budget 2018 seem to shift towards more volatile sources. Proposals such as increasing the stamp duty rate on commercial property purchases — although intended to rebalance development towards residential property — increase reliance on transaction-based taxes, a highly pro-cyclical source of government revenue. The high proportion of corporate taxation, and the dependence on a small number of major taxpayers, remains a source of uncertainty, prone to economic fluctuations potentially stemming from swift decisions made by multinationals.
Some indicators suggest that Ireland's corporate tax rules are used in aggressive tax planning structures. As shown in a study, Ireland's high inward and outward FDI stock (
) can only partly be explained by real economic activities taking place in Ireland (IHS, 2018). The high level of dividend payments and, in particular, charges for using intellectual property, suggest that the country’s tax rules are used by companies that engage in aggressive tax planning (Graph 4.1.3) (
). Exemptions from withholding taxes on dividend payments made by companies based in Ireland () may lead to those payments escaping tax altogether, if they are also not subject to tax in the recipient jurisdiction. This may facilitate aggressive tax planning. Furthermore, the existence of some provisions in bilateral tax treaties between Ireland and some other countries may be used by companies to overrule the new tax residence rule put in place in Ireland in 2015 (
).
Ireland has taken measures to amend some aspects of its system that were facilitating tax planning. Changes to tax residency rules implemented in 2015 have reduced opportunities for aggressive tax planning, although existing companies are able to use the previous rules until the end of 2020. The Irish Knowledge Development Box, introduced in 2015, has been approved by the Code of Conduct on Business Taxation Group and the OECD Forum on Harmful Tax Practices. While the economic evidence for the effectiveness of patent boxes in encouraging R&D remains limited (CPB, 2014), they may be used as a tax competition tool (Alstadsæter et al., 2017). The government has published an Independent Review of the Corporation Tax Code (Coffey, 2017) and is carrying out a consultation on some of its recommendations (Department of Finance, 2017b). The provisions of the Anti-Tax Avoidance Directives (ATADs) will have to be transposed into national law by the end of 2018 and 2019. This will introduce new anti-abuse rules (
). Once it is clear whether additional changes will be brought forward following the consultation, it will be important to assess to what extent these, in conjunction with the effect of the transposition of the ATADs and steps such as the change of the tax residency rule, limit the scope for aggressive tax planning in Ireland.
|
Graph 4.1.3:Charges paid for the use of intellectual property
|
|

|
|
Source: Eurostat
|
Ireland has further potential to improve the way that its tax system can support environmental objectives. Revenues from environmental taxes are above the EU average as a percentage of total taxation (7.9 % for Ireland compared to an EU-28 average of 6.3 %). However, the different tax treatment of diesel and gasoline for road use is still to be addressed. In Ireland diesel is taxed at a lower rate both in terms of carbon and energy content, although it also emits more air pollutants. The tax advantage in favour of diesel currently stands at 11 cents per litre (Department of Finance, 2017).
4.2.
Financial sector and indebtedness
4.2.1.Banking sector*
The financial sector keeps its stable performance course amid heightened external uncertainties. Domestic banks remain susceptible to external spillovers, most notably from the UK’s decision to leave the EU. As a result, the stock prices of Irish banks remained relatively flat in 2017, trading below the euro area financial indices. Despite these conditions, state-owned Allied Irish Banks (AIB) successfully completed its initial public offering in June 2017 with the sale of a 25 % stake, raising EUR 3.4 billion.
The capital buffers of Irish banks improved. The aggregate Common Equity Tier 1 (CET1) capital position of Irish banks was 17.3 % in June 2017, up from 16.8 % at the end of 2016. This improvement was largely possible due to increasing net interest margins, NPL reduction, and a reversal of provisions. In addition to the external uncertainties, relatively weak lending volumes and the impacts of new regulatory measures may lower capital buffers in the medium term. An eventual tightening of monetary policy could have a positive impact on interest income but could also increase debt servicing costs for borrowers. The restructured mortgage accounts could be especially vulnerable to changes in the interest rate environment.
The banks are preparing to fulfil new regulatory requirements. The impact of the upcoming IFRS9 reforms (
) is expected to be manageable, and progress is also made towards achieving the minimum requirement for own funds and eligible liabilities (MREL) (
).
The profitability levels achieved in 2014 are being maintained (Graph 4.2.1). Irish banks have relatively high net interest margins compared to their peers. They have managed to further reduce their deposit funding costs and keep their administrative costs stable. Pressures could arise on the staffing expenses side, in view of a potential tightening of the labour market and the possible relocation of financial companies from London to Dublin.
|
Graph 4.2.1:Profitability of the main domestic banks
|
|

|
|
Source: Central Bank of Ireland
|
NPLs are reducing as a result of debt restructuring activities and portfolio sales, but remain high. The acceleration of NPL resolution is paramount for the systemic risk reduction as noted in EAR 4. The three main domestic banks have put a lot of work into reducing their non-performing loan book (Graph 4.2.2), although with varying success. Their distressed loan-books reduced by about EUR 4.5 billion between September 2016 and September 2017, with the most progress being made in commercial real estate and corporate portfolios. The aggregate NPL ratio for the domestic banks was 14.4 % at the end of June 2017. It stood at 11.6% when accounting for foreign branches and subsidiaries. The banks are required to submit their portfolio-specific NPL reduction plans and projections to the supervisor. In September 2017 12.7 % of the total mortgage stock was in arrears (CBI 2017).
The level of bank provisions against NPLs is among the lowest in the EU, and declining. The average coverage ratio (
) of Irish banks was 32.6 % in June 2017, compared with the 45.8 % euro area average. While some provision releases are linked to debt resolution activities and domestic real estate price increases, it is important for them to remain at prudent levels.
|
Graph 4.2.2:NPL reduction by portfolio - domestic banks
|
|

|
|
Source: Central Bank of Ireland
|
Long-term mortgage arrears resolution is progressing more slowly because there are difficulties in restructuring certain difficult cases. The stock of mortgage arrears declined by about EUR 1.8 billion in the year to September 2017. Recent research also shows that since 2013 the share of permanent (durable) mortgage arrears restructurings has increased significantly (McCann 2017b). Still, over 70 % of the remaining arrears balance relates to mortgages with payments overdue for longer than 2 years. By the end of 2016, only 61 % of these debtors had engaged with their creditors. Of those who engaged, 13 % never concluded a modification arrangement, 64 % received a temporary modification (some of these have already elapsed) and only 16 % received a permanent modification, (McCann, 2017). The number of personal insolvency applications has increased since the introduction of the Abhaile aid-and-advice scheme, but it is still quite low. The number of actual arrangements has declined, largely due to the increase in cases currently subject to court reviews. These are sought by the debtor when the personal insolvency proposal has been rejected by creditors. Following a Review of the Mortgage to Rent Scheme, a range of amendments to its eligibility criteria and administration came into effect to enable more properties to qualify and to make the scheme more flexible and accessible to borrowers.
The mismanagement of a significant number of tracker mortgages by banks is being addressed through an industry-wide examination led by the CBI (CBI 2017a) (
). As of mid-December 2017, approximately 33,700 mortgage accounts have been identified as having been put on an incorrect interest rate, resulting in overcharging or even property loss. The examination continues with around EUR 297 million paid out by the banks to affected customers so far.
Macroprudential policy is gaining importance amid the current housing sector dynamics. Current housing market pressures, resulting from a scarcity of residential properties, highlight the importance of having prudent loan-to-value and loan-to-income limits in place. The second review of the framework currently in place, completed in November 2017, recognised this by retaining the binding loan-to-value and loan-to-income ratios. The change that will be in force from January 1, 2018 pertains to the size of the banks' discretionary buffer (lending above the loan-to-income cap) for non-first-time buyers, from 20% to 10% of the value of new lending. The implementation of the credit register is in its final phase, after several delays. The register should become operational in early 2018 and cover all types of lending by the end of 2018. It will be a crucial tool for accurately assessing the debt servicing capacity of borrowers.
4.2.2.External sustainability*
External sustainability risks to the domestic economy seem limited. The analysis presented in the 2017 country report (European Commission, 2017a) showed that a substantial proportion of Ireland’s external liabilities are attributable to multinational companies with little connection with the domestic activity. The risks associated with the external liabilities of these companies are mitigated by a number of factors such as their high profitability and offsetting overseas assets. Moreover, their liabilities are not linked to Irish investors. IMF analyses reach similar conclusions, showing that external debt not related to the International Financial Services Centre (IFSC) (
) is only moderately sensitive to standardised shocks, i.e. interest rate (IMF, 2017).
The headline net international investment position is improving but remains negative. Ireland’s net international investment position (NIIP) had been falling rapidly before 2015, when it fell at -244 % of GDP (Q12015) (
). By the third quarter of 2017, it had improved to -170 % of GDP but it remains significantly negative. It is expected to improve further in 2018, on the back of GDP growth and current account surpluses.
The international investment position of domestic sectors is improving slightly. In sectoral terms, and excluding the IFSC, the largest proportion of the NIIP is attributable to the nonfinancial sector. It consists of multinationals — including re-domiciled PLCs, aircraft leasing and contract manufacturing companies. In the second quarter of 2017 the NIIP of these multinationals was -154.1 % of GDP. The trends in the net position of domestic sectors — the Central Bank, non-IFSC banks, general government — gradually improved in 2016 (Graph 4.2.3).
The composition of the NIIP is biased towards riskier instruments, but these mostly belong to multinationals. In 2016, debt instruments (for all sectors in the economy) accounted for approximately -234 % of GDP in net terms, but the foreign direct investment (FDI) and equity shares instruments had a positive net position (57 % of GDP). The concentration of debt liabilities, such as bonds and fund shares, increases the sustainability risk as these instruments require payments of principal and interests at defined moments in time and irrespective of the liabilities’ performance, which means they carry a higher probability of default (
). However, the majority of these liabilities relate to nonresident funding of intellectual property (IP) assets (CSO, 2017b). In 2015, the negative financial worth of Ireland dropped by 70 % y-o-y, at EUR -531 billion. The sharp decline was due to an increase in equity and fund shares used to fund IP assets and machinery and equipment, including aircraft for leasing, as nonfinancial assets registered in Ireland (
).
|
Graph 4.2.3:International investment position by institutional sector, non-IFSC
|
|

|
|
Source: CSO
|
The current account (CA) balance remains very volatile and difficult to assess. The headline CA experienced a substantial level shift in 2015, surging to a surplus of around 11 % of GDP, linked to the activities of multinationals. These activities also disrupted the services trade and the primary income balance on account of large imports of IP services.
|
Graph 4.2.4:Current account balance benchmark
|
|

|
|
Source: European Commission
|
The fundamentals suggest a higher CA surplus than the headline figures show. The European Commission’s 'norm' CA benchmarks suggest that domestic fundamentals, such as demographics, are responsible for around 2.5 pps of the Irish surplus over the period 2013-2016. The overall average increase of the CA during this period was 3.7 pps (Graph 4.2.4). In 2015, when the CA experienced the level shift to 10.9 % of GDP, the fundamentals suggested a CA surplus of only around 3.6 % of GDP. The gap is largely explained by the strong impact of multinational activities in 2015. Policy factors such as the government balance, or the decline in credit for construction in the aftermath of the crisis, also account for a considerable proportion of the CA gap. In 2016, the surplus attributable to fundamentals was around 5.5 %, versus a headline figure of 3.3 % (
)(
).
|
Graph 4.2.5:CA vs CA*
|
|

|
|
Source: CSO
|
The CSO published a modified CA balance (CA*) (Box 1.1) in an attempt to clarify the reading of the underlying developments. It shows a slightly more positive balance for 2016 than the traditional CA indicator (Graph 4.2.5). From 2009 to 2010 there was a substantial increase in the global income returned to the Irish headquarters of redomiciled companies as an increasing number of multinationals relocated their headquarters to Ireland from the UK, the US and Bermuda (CSO, 2016a). From 2014 to 2015, the contribution of IP depreciation increased from EUR 0.8 billion to over EUR 25 billion on the back of multinationals relocating these assets to Ireland. In 2016, this depreciation was outpaced by the imports of IP services and aircraft for leasing. Consequently, the CA* was 4.9 % of GDP by comparison with the headline CA balance of 3.3 %. CA* surplus stood at 7.1 % as a percentage of GNI*.
4.2.3.Private indebtedness*
While private sector debt remains high, the underlying flows signal continued deleveraging. At end-June 2017, private sector debt stood at 214 % of GDP and 53.4 % of GDP for corporates and households respectively. The observed overall deleveraging trend continued in 2017, with some renewal of credit demand appearing (Graph 4.2.6). The private debt-to-GDP ratio is heavily influenced by multinational corporations' activities affecting both the numerator and the denominator. Their debt, with few connections to the domestic banks, accounts for a substantial part of the total (European Commission 2016).
|
Graph 4.2.6:Private debt evolution
|
|

|
|
Source: Central Bank of Ireland
|
Risks stemming from high debt levels of the indigenous sector are decreasing, but the headline numbers still require monitoring. Debt owed by foreign-owned companies to foreign lenders doubled in 2015 to almost 150 % of GDP, before declining slightly to 123.6 % in 2016. On the other hand, debt held by indigenous companies and households was visibly less than half of the total private debt stock in 2016. Indigenous companies seem to have deleveraged to prudential levels, bringing the domestic private sector debt levels are now broadly in line with fundamentals (Graph 4.2.7) (
).
|
Graph 4.2.7:Composition of corporate debt
|
|

|
|
Source: CSO, European Commission
|
A continued focus on post-crisis balance sheet repair by individuals and companies alike is reflected in an overall reduction in outstanding (net) debt. Real-estate legacy debt repayments are still dominant. A low degree of market competition among lenders and interest rates somewhat above the euro-area averages (especially for firms) affect the overall interest burden and might also be curbing demand for new credit.
Amid continued favourable macroeconomic conditions, a recovery in credit demand is observed for certain categories of loans. This is especially visible in specific areas such as consumer and mortgage loans as well as certain corporate activities (CBI 2017b). However, overall this trend remains muted as the pick-up comes from a very low base.
Some Irish companies have started borrowing again. They account for over 40 % of domestic banks’ outstanding lending. Non-financial non-property corporate credit has been increasing since 2016 (Graph 4.2.8). This is mostly accounted for by credit extended to larger companies. SMEs are still in deleveraging mode resulting in a significant decrease in the share of indebted SMEs, from 77 % of all SMEs in September 2013 to 50 % three years later. An environment of heightened uncertainty could be inducing firms, especially exporters, to postpone a part of their investment decisions.
|
Graph 4.2.8:Credit advanced to Irish companies
|
|

|
|
Source: Central Bank of Ireland
|
Rising property prices have increased households’ net worth and reduced the number of households in negative equity, but pockets of vulnerability remain. In June 2017 household’s net worth was 59.6 % higher than the trough in mid-2012, reflecting mostly a recovery in the value of housing assets. During 2016 both household debt-to-disposable-income ratio (DTI) and debt-to-asset ratio (DTA) declined as a result of active deleveraging and an improvement in income (CBI 2017c and d) (
). However, certain categories of borrowers remain heavily indebted, in negative equity and/or in mortgage arrears. Moreover, tracker mortgages, particularly vulnerable to any potential interest rate change, still represent over 40% of total mortgages (about 42.5 % in September 2017). Younger borrowers are more likely to be on a tracker rate and generally have larger mortgages and longer remaining loan durations (McIndoe-Calder, 2017).
After years of debt reduction, Irish households could be approaching a turning point in credit demand. The stock of loans to households increased in 2017, for the first time since 2009 (3.2 % y-o-y in September 2017), Close to EUR 7.3 billion of mortgages were drawn down in 2017, more than double the yearly amounts drawn down in the period 2011-2013, but still just a small fraction of the peak EUR 40 billion in 2006. New mortgage lending in the first half of 2017 was 33 % higher than during the same period in 2016. A surge in mortgage lending is being curbed by the macroprudential framework in place, which ensures that the size of loans remains prudently in line with the property’s value and the household income. The overall volumes of mortgage credit are being restrained by the limited supply in residential property (Section 4.5.1).
|
Graph 4.2.9:Households’ financial assets
|
|

|
|
Source: Eurostat
|
The move from variable to fixed-rate mortgage products reduces uncertainty in relation to the interest rate burden. However, fixed-rate mortgages in the Irish market usually have a fixation term of up to five years (only). CBI research on household lending in the first half of 2017 shows an increase in average loan sizes and residential property values. First time buyers saw an increase in income levels and lower average interest rates.
4.2.4.SME access to finance
While debt repayments are still dominant, new SME credit is growing. Total new lending to non-financial SMEs in the second quarter of 2017 increased by 4.3 % y-o-y and by 34.7 % compared to mid-2015. In June 2017, the outstanding lending to Irish non-financial SMEs had fallen by 13.5 % y-o-y and by 32.7 % compared to mid-2015 (CBI 2017e).
Debt overhang, market concentration and heightened uncertainty in some exporting sectors weigh on the demand for SME credit. Approximately one in five SME loans is in default, with some differences across sectors and regions (CBI 2017f). Recent surveys indicate some hesitation when it comes to investment decisions of exporters to the UK, as export volumes and especially margins have already decreased due to the devaluation of sterling (DJEI 2017).
When borrowing, Irish companies remain mostly reliant on internal funds and on banks. Close to 75 % of their investment is financed using own funds, substantially above the EU average of 60 % (EIB, 2017). The share of SMEs applying for any banking product, decreasing since 2015, currently stands at 20 %, with larger SMEs tending to make greater use of banking products (CBI 2017f). New loans and overdrafts make up an increasingly larger proportion of total bank lending, as opposed to old loan renewals and restructurings. As bank products account for about 85 % of total external financing for Irish companies, there is significant scope for a more intensive use of non-bank financing, with 54 % of companies considering leasing as a relevant source of financing. Venture capital is also gaining prominence. In 2016, Irish SMEs raised a total of EUR 888 million, compared to EUR 522 million in 2015 and EUR 242 million in 2008 (IVCA).
While present, the difficulties in obtaining bank credit do not appear acute at this stage. Interest rates for new SME loans have been decreasing since 2016 but remained quite flat in 2017 at above 4 % (Graph 4.2.10). They are still comparatively high compared to larger loans and euro area peers. The difference between domestic and euro area SME credit interest rates is the result of difficulties in collateral access, market concentration and the perception of risk (Carroll and McCann, 2017). While bank rejection rates for SME financing have increased over the past year, certain surveys report that domestic companies do not regard bank interest rates and credit conditions as primary concerns at the moment (SAFE).
Irish banks more often require collateral for large or longer maturity loans, as well as for riskier borrowers (Carroll and McCann, 2017b). Over 50 % of loans issued are secured. Stakeholders hope that the banks’ understanding of underlying businesses and cash-flows can improve in order for them to price risk more adequately.
|
Graph 4.2.10:New SME lending: volumes and interest rates
|
|

|
|
Source: Central Bank of Ireland
|
State-supported measures are being re-shaped to better cater for companies’ needs. EUR 544 million were on-lent (
) through the State-supported Strategic Banking Corporation of Ireland (SBCI) scheme in 2016, 84 % of which for investment purposes. Close to one quarter of beneficiaries are from the agricultural sector. The SBCI aims to further expand its range of products and increase the number of general and specialized on-lenders, as well as the use of EU financial instruments. It will also manage the EUR 300 million Brexit Loan Scheme (
).
4.3.
Labour market, education and social policies
4.3.1.Labour market
The improvements of the labour market were felt by most groups, but long-term unemployment remains a challenge. The positive developments in the labour market continued in 2017 in line with the robust economic expansion, while wage growth remained moderate (see Section 1). Employment (20-64) grew in the third quarter of 2017 by 1.5 pp compared to the same quarter in the previous year, reaching 73.2% with 60 000 new jobs created. Unemployment fell to 6.7% in 2017, from 8.4% a year earlier, while youth unemployment fell below the EU average, to 14.7%. As a proportion of total unemployment, long-term unemployment was at 42.2% in Q3-2017, inching down below the EU average of 44.4%. Very-long-term unemployment (over two years) amounted to 28.9% of all unemployment in the same quarter, in comparison with the EU average of 27.7%.
Labour market participation remains a problem. The activity rate (
) has largely recovered from a slight fall during the crisis. It stood at 78.2 % (20-64 age group) in the third quarter of 2017) edging above the EU average (78.1 %). Compared to the rest of the EU, the percentage of people not working is comparatively high because of inactivity, not unemployment (Graph 4.3.1). This suggests that there is untapped potential outside the labour force.
One of the main drivers of the low labour market participation is the gender activity gap. The inactivity of women due to caring responsibilities is among the highest in the EU (especially in the 55-64 age group). The gender employment gap is also higher than the EU average. The design of family leaves does not support a balanced sharing of work and caring responsibilities between women and men. Although the introduction of two weeks of paternity leave in September 2016 represents a positive development, parental leave is not compensated, which deters men, often first-earners, to take it. The high cost of childcare services (see section 4.3.2) also represents an obstacle to female participation in the labour market.
Ireland also has one of the lowest employment rates of people with disabilities in the EU (only 29.1% vs EU 47.4% in 2015) and one of the widest employment gaps between people with and without disabilities (41.3 pps, EU 25.7 pps).
While employment rates have improved, there are sizeable disparities between employment levels for different skills groups, pointing to skills mismatches. Ireland has a high overall level of skills, with a good performance in terms of basic skills and one of the highest levels of tertiary attainment in the EU (52.9 % of those aged 30-34 in 2016 – see Education and Skills section). However, there are large discrepancies of labour market outcomes across skills groups. This suggests that there remain barriers to the employment of some groups of low-skilled individuals. There are also large discrepancies in the unemployment and long-term unemployment rates of various skills groups. The differences between the employment rates of low, medium and highly skilled labour were among the highest in the EU in 2016. The employment rate was almost 10 pps lower in 2016 for the low-skilled than before the economic crisis (Graph 4.3.2).
|
Graph 4.3.1:Unemployment and inactivity as a percentage of the population aged 25-54
|
|

|
|
Source: European Commission (2017f)
|
Skills mismatches are related to shifts in economic activity since 2008. Employment in the construction sector increased by 6.9 % between Q3-2016 and Q3-2017 (CSO), although it employed about 100 000 fewer workers in Q1 2017 than in Q1 2008 (Graph 4.3.3). Significant net employment growth occurred in the tradable service sectors (wholesale and retail trade, transport, accommodation and food services) and in the public sector. There are skill shortages in ICT, engineering, science, business and finance, healthcare and construction sectors (SOLAS, 2016) as well as a lack of digital skills in the general population, which in light of skills shortages is particularly worrying for those on the labour market (see box 4.3.3 below). Skills needs in Ireland are being tackled through training efforts (see also Education and Skills section below) and through migration. Between 14 000 and 30 000 people are estimated to cross the border daily for work.(
) Moreover, in 2016, there was a total of 182 thousand third-country nationals and 384 thousand EU citizens living in Ireland, of which 121 thousand were UK citizens.(
)
|
Graph 4.3.2:Employment rates by level of education
|
|

|
|
Source: European Commission
|
Government intervention has helped bring down long-term unemployment. The JobPath activation programme has now been fully rolled out and the first results suggest that it has contributed significantly to the drop in long-term unemployment. Of the 20 447 participants who completed the programme, 26 % got a job (JobPath Performance Data 2017).The chances of employment improved by as much as 42.5 % following participation in JobPath, according to a 2017 evaluation. The programme has proven particularly successful for people who have been unemployed for more than three years.
As unemployment declines further, the inactive population is increasingly being targeted in order to improve social inclusion and maximise available human capital. A key recent initiative to tap into underused human capital outside the labour force is the Action Plan for Jobless Households. It is part of the overarching Pathways to Work strategy. Two key target groups are inactive single parents and spouses of benefit recipients. The idea is to extend activation services to these groups and to remove systemic barriers to their labour market participation through coordinated case management across agencies and a joint approach to helping jobless couples. It remains to be seen how the strategy is being rolled out but its focus addresses the needs identified in the 2017 country report.
|
Graph 4.3.3:Change in employment by sector
|
|

|
|
Source: European Commission
|
|
Box 4.3.1: Monitoring performance in light of the European Pillar of Social Rights
The European Pillar of Social Rights, proclaimed on 17 November 2017 by the European Parliament, the Council and the European Commission, sets out 20 key principles and rights to benefit citizens in the EU. In light of the legacy of the crisis and changes in our societies driven by population ageing, technological change and new ways of working, the Pillar serves as a compass for a renewed process of convergence towards better working and living conditions.
 Ireland performs relatively well on most indicators of the Social Scoreboard (1) supporting the European Pillar of Social Rights, while challenges remain. The Irish tax and benefits system is very effective in reducing poverty and inequalities. In the fifth year of the labour market recovery, Ireland shows relatively good employment-related outcomes. At the same time, a low percentage of the population has at least basic digital skills.
The integration of digital skills in education continues to be one of the challenges and priorities for educational policy. Only 44 % of individuals have at least basic digital skills, which is one of the lowest levels in the EU, with no significant improvement in recent years. The priority given to integrating digital skills in education and providing the digital skills needed on the market was confirmed in the 2017 Action Plan for Education. The 2014 ICT Skills Action Plan moreover sets a target of meeting 74 % of industry demand for high-level ICT skills from the education system by 2018, as well as targets for the number of ICT graduates. However, efforts to improve the digital skills of working age adults currently not in full-time education remain limited.
Early school leaving rates are lowering and a high percentage of the population acquires a tertiary education. Ireland's relatively good education-related outcomes are in part due to a promising education programme in disadvantaged areas called 'Delivering equality of opportunity in schools' (DEIS). It promotes equity and access to education with ambitious targets for school completion and participation in higher education.
(1) The Social Scoreboard includes 14 headline indicators, of which 12 are currently used to compare Member States performance. The indicators "participants in active labour market policies per 100 persons wanting to work" and "compensation of employees per hour worked (in EUR)" are not used due to technical concerns by Member States. Possible alternatives will be discussed in the relevant Committees. GDHI: gross disposable household income.
|
While Ireland does not intend to introduce a fully-fledged one-stop shop system combining employment and social services, their integration and coordination have been improved. The government is piloting open days where service providers across the board join up to provide integrated advice to the groups that are hardest to reach. There is still room for improvement in terms of offer flexibility, but cooperation between training providers and the local Irish Public Employment Service offices (Intreo centres) has improved in recent years and employercentred services have been strengthened.
In relation to work incentives to people with disabilities, the Irish Government has announced changes to make it easier to return to the disability allowance scheme and to take up employment while benefitting from the allowance. Since October 2015, the Employment Strategy for People with Disabilities has steered efforts to improve the labour market attachment of people with disabilities and the Action Plan for Jobless Households is expected to support this.
Social dialogue is well organised, with social partners mostly playing only consultative roles. The social partnership model was considerably altered during and after the economic crisis, making it more difficult to reach binding agreements and giving more weight to tripartite discussions. In 2015 the government created a structured forum for national economic dialogue where social partners have the opportunity to be heard, in a consultative rather than a negotiating capacity. The consultative nature of social dialogue in Ireland still remains unchanged.
4.3.2.Social policy
Absolute poverty levels and joblessness have fallen since 2012, but social transfers remain essential for the most vulnerable groups. Severe material deprivation has dropped since 2013 but is still considerably higher than before the crisis, at 7.5 % of the population in 2016. The at-risk-of-poverty-or-social-exclusion rate (percentage of total population) is on a right track but still remained high in 2016, at 24.2 %. The main reason for this is the high proportion of people living in households with low work intensity, almost twice as high as the EU average. The at-risk-of-poverty-or-social-exclusion rate for children also remains higher than the EU average. Income support for the unemployed ranks Ireland above EU average in terms of adequacy of unemployment benefits and minimum income. The unemployment benefit is just below the EU average in terms of the length of weeks required to access benefits and on average in terms of the duration (for a 1 year work record)(
). The New Deal for the Self-Employed (part of Budget 2017) extends the social protection for self-employed by giving them access to treatment benefits and non-means tested income support in case of injury or illness.
With the launch of the Action Plan for Jobless Households in September 2017, Ireland has made a major commitment to combating joblessness and low work intensity. The plan adopts a familyfocused approach to case management to reducing households’ joblessness and sets two new headline targets for 2020. The first is to reduce the proportion of households that are jobless to 13 % or less. The second is to reduce the percentage of the 18-59 population resident in such households to less than 8 % (12 % in 2015). The plan is to reach these targets by extending the existing activation support measures to adults in jobless households, especially those with children. The new target group will not have to fulfil availability and job-search requirements otherwise associated with the activation system.
While income inequality (
) is comparatively low, there are nonetheless concerns related to the opportunities for those from a disadvantaged background. While the high degree of income tax progressivity and high cash benefits are effective in equalising highly unequal market incomes (European Commission 2017f), there is a high risk of poverty (57 % of the total cohort) for households with dependent children and very low work intensity. The availability of medical cards for the unemployed and inactive significantly reduces health inequalities for the poorest households, but middle-income households face a comparatively high level of unmet medical examination needs due to the cost of meeting such needs (EU-SILC). Access to tertiary education is also linked to socioeconomic background. Students from fee-paying secondary schools were nearly twice as likely (65 %) to attend one of Ireland’s seven universities in 2015 than their non-fee-paying counterparts. The situation is particularly bad in Dublin, where students from more affluent areas go on to attend university at a rate of up to four times that of those from disadvantaged areas. According to analysis carried out by the European Social Policy Network for the upcoming Pension Adequacy Report, social welfare pensions are very redistributive due to their flat-rate payments and earning-based contributions. Social transfers in Ireland effectively prevent older people from falling into poverty during their retirement (the at-risk-of-poverty or social exclusion rate (% of total population) was 16.5 % for 65 + in 2015, considerably below the average in Ireland) (
).
|
Graph 4.3.4:Main social indicators
|
|

|
|
Source: CSO
|
Recent reform efforts have tried to tackle the problem of weak work incentives for low-income groups, including partners who are out of work. Ireland has addressed those disincentives by tapering the withdrawal of benefits when returning to work. In 2015 the Back to Work Family Dividend was brought in. The Housing Assistance Payment Scheme, designed to tackle work disincentives in previous housing support schemes, was fully rolled out by March 2017. By November 2017 over 29 800 households had their housing needs met under the scheme. The government also committed itself to bringing in a Working Family Payment to promote work by supplementing on a gradual basis the income of households, at the same time incentivising more working hours and full-time work. The analysis leading up to the proposal has suggested that rather than introducing a new benefit, a package of changes to existing schemes would be required to address the particular disincentives identified.
Accessibility to affordable, full-time and quality childcare remains difficult. The employment rate of women remained below the EU average in 2016, at 64.2 %, with many moving into inactivity or part-time work because of caring responsibilities. The cost of childcare is particularly high (European Commission 2017c) and can act as a barrier to accessing paid employment, particularly in low- income households, including single parents. OECD figures show that childcare costs are the highest in the EU in Ireland. The figure shows that in 2015 the net cost for a lone mother with two children and low earnings amounts to 42% of the disposable income (OECD 2017e).
A Bill providing for the Single Affordable Childcare Scheme was approved and published in December 2017, and is currently proceeding through the Houses of the Oireachtas (Houses of Parliament) with a view to enactment as early as possible this year. Preparation for implementation of the new scheme is expected to progress during 2018. Delays reflect the complexity of the IT system being developed for the scheme. Pending introduction of the Single Affordable Childcare Scheme, current childcare benefits have been made more generous and accessible. Their having been made more generous might result in childcare supply constraints but there are no signs of a capacity shortage for the time being, with more places currently being offered. A capital investment scheme is in place for childcare providers. There are reports of a constraint in the supply of qualified childcare workers, although the number of graduates in the field is increasing. Overall, 2018 will see a further increase in funding for the Department of Children and Youth Affairs. While pre-school childcare services are already regulated, the Government has committed to introducing the regulation of school-age childcare in 2018.
Homelessness continues to increase according to the latest census, although the absolute figures are still quite low. Homelessness increased by 81 % in the period 2011-2016 (CSO, 2016). Family homelessness is a particular concern as it increased by 200 % within the same period. International comparisons on homelessness are notoriously difficult to make due to different national definitions but the OECD Homeless Population Report from 2016 estimates Ireland's level of homelessness at 0.08 % of the population. While this places Ireland in the better performing half of the countries analysed in the report, Ireland uses a rather narrow definition of homelessness compared with other countries. Ireland continues to implement the Action Plan for Housing and Homelessness, with approximately 3 000 sustainable exits from homelessness during 2016 (up 31 % from 2015). However, the provision of social housing remains insufficient, posing a serious challenge (Section 4.5.1).
4.3.3.Education and skills
Public spending on education is progressively returning to its pre-crisis level. The proportion of general government expenditure on education relative to GDP stood at 3.7 % in 2015, compared to 4.9 % in the EU. This was in the context of an anomalous rise in measured GDP that year. As a percentage of government expenditure, in 2015 education accounted for a stable 12.4 %, against 10.3 % for the EU. In the light of emerging labour market skills shortages, priority is being given to strengthening the system of further education and training. Ireland also has an ambitious infrastructure investment plan for education at all levels. Capital investment in education at all levels is again on the rise since 2015-2016.
Despite high participation in early childhood education and care, its accessibility, affordability and full-time provision remain problematic. The early childhood education and care participation rate in Ireland was 92.7 % in 2015, against the EU average of 94.8 %. Attendance has fallen by 5.4 pps since 2013 and the availability and cost of full-time provision are still problematic. The quality of early childhood education and care is supported by Síolta, the national quality framework for the sector, and by Aistear, a curriculum framework published by the National Council for Curriculum and Assessment. There is more engagement with stakeholders on issues of concern and on policy delivery. There have also been important changes to the minimum qualifications required for staff in the sector and a reorganisation of the inspection system for pre-schools in order to encourage the full participation of children, including those with disabilities.
Ireland is continuously improving its performance and lowering early school leaving rates, but disparities remain at local level. The percentage of early school leavers fell to 6.3 % of young people aged 18-24 in 2016, well below the Europe 2020 national target of 8 % and the EU average of 10.7 %. Ireland has made significant progress, effectively halving its rate since 2009. No major gap is visible between native- and foreign-born students. There is, however, a persistent gap between girls (4.6 %) and boys (7.8 %). The 2017 national reform programme highlights the renewed ‘Delivering equality of opportunity in schools’ initiative (Department of Education and Skills (DES), 2017a) in disadvantaged areas. The proportion of 15-24 year-olds not in employment, education or training is 13.0 %, slightly above the EU average of 11.5 % in 2016, indicating there is still potential to do more to reduce early school leaving.
In terms of basic skills, Ireland has continued to perform well, especially in reading, ranking high among EU countries. In the OECD’s 2015 Programme for International Student Assessment (PISA) survey, Ireland improved slightly in mathematics compared with previous results. In science, it remained above the EU and OECD averages, but with a significant drop from 2012 (ERC, 2016a). The proportion of low achievers is the lowest in the EU in reading (10 %) (Graph 4.3.5) and among the lowest in maths (15 %) and science (15 %). The impact of socioeconomic status on performance is also relatively limited (OECD, 2016b). Gender gaps are among the narrowest in the EU in all three test areas (European Commission, 2016).
|
Graph 4.3.5:Progress towards reaching the benchmark of low achievers in reading, 2009-2015
|
|

|
|
Source: OECD (PISA, 2009 - 2015)
|
The Action Plan for Education 2017 sets ambitious targets to improve PISA mathematics performance. They include maintaining the proportion of low achievers below 10 %, while increasing the percentage of top performers to the level of the OECD average by 2025 (DES, 2017) (
). It also recognises that policies are needed to strengthen the capacity of school leaders and teachers to address the growing linguistic and cultural diversity among students from an increasingly varied immigrant background (Eurydice, 2017).
Nevertheless, some basic skills gaps persist for disadvantaged groups, such as pupils from an immigrant background or the children of Travellers. There is a performance gap between non-immigrants and first- and second-generation immigrants (OECD, 2016c). Recent research has highlighted the continuing insufficient levels of educational attainment among the Traveller community (
) (Watson et al., 2017).
Ireland ranked among the highest in the EU on tertiary educational attainment and has an ambitious national target for 2020. The proportion of 30-34 year-olds with higher education was 52.9 % in 2016, well above the EU average of 39.1 %. The ambitious national target for 2020 is 60 %. There is a clear gender gap, with women (at 58.5 %) outperforming men (at 46.6 %). Migrant students have a higher attainment rate (58.4 % in 2016) than native-born students (50.5 %). The employability of tertiary graduates is also improving. In 2016 the employment rate of recent graduates increased by 3.3 pps from the previous year to 86.7 %, against the 82.8 % EU average.
Future funding for higher education is on the agenda and a new higher education reform was tabled on 15 January 2018. The Department of Education and Skills published both the Review of the Allocation Model for Funding Higher Education Institutions and the Higher Education System Performance Framework for 2018-2020, paving the way for a new tertiary sector agenda (DES, 2018).
The attractiveness of vocational education and training (VET) compared to academic education remains a challenge. The rate of participation in VET in Ireland is below that of other EU countries, due to the fact that it takes place for the most part at post-secondary education level. Adult participation in lifelong learning remained low in 2016, at 6.4 %, well below the EU average of 10.8 %. The employability of recent VET graduates is visibly improving and getting closer to the EU average. In 2016 the employability rate of those with secondary education was 67.2 %, compared to the EU average of 72.6 %. In the case of those with tertiary education it was 86.7 % compared to 82.8 %. This makes Ireland one of the EU countries with the widest disparities in the employment rates of people with different skill levels (Eurostat, 2017).
Ireland’s National Skills Strategy for 2025 provides a strategic vision and specific objectives for meeting the country’s future skills needs. There is an increased focus on lifelong learning and an ambitious target to increase participation in adult learning to 15 % by 2025. One option being explored is the redeployment of spending from the National Training Fund. SOLAS (the further education and training authority) is overseeing the development of a framework for employee skills development (Irish Government, 2017). However, considerable investment is needed in upskilling those in employment in order to reach national targets.
New types of apprenticeship schemes are being introduced and promoted by relevant actors. A key measure is to provide 50 000 upskilling and reskilling places in higher education by 2021. These will fill identified skills gaps in the economy and support an increase in lifelong learning (DES, 2017) (
). At the lower skills end, ongoing preparations for the implementation of the Upskilling Pathways Recommendation should benefit the reintegration of the inactive population.
4.3.4.HEALTHCARE
A comparatively costly health system compounded with the overall process of ageing makes the need for health system reform pressing in Ireland. That said, demographic changes are projected to affect the country in the coming years, with expenditure on healthcare and long-term care expected to increase by 2.9 pp of GDP (1.0 due to health care and 1.9 due to long-term care) from 2016 to 2070, above the EU average of 2.1 (0.9 and 1.2 respectively). This will increase the pressure on the healthcare system, which is already comparatively costly to run (
). In the absence of reform, there are likely to be losses of effectiveness, accessibility, resilience and fiscal sustainability.
Multi-year budgeting and better expenditure control would be relevant supporting mechanisms for overhauling the Irish healthcare system. Consecutive budget increases cover repeated overspending rather than a significant expansion of service provision. Many of the cost-containment measures introduced are still in their infancy. More can be done to pool funding models and align care planning locally and regionally. Ireland’s current Health Service Executive governance structure has been deemed unfit for purpose (Houses of the Oireachtas, 2017) and plans are afoot to set up an independent board to strengthen oversight and performance.
The shift towards universal healthcare is complicated by an unwieldy two-tier system. Public hospitals operate at nearly full capacity all year round. Long waiting lists for public health patients represent an immediate challenge for improving access to acute care. These are fuelled by capacity challenges and create demand in the private insurance market, which provides fast-track access to a range of treatments. Private insurance, in turn, plays a much bigger role in financing healthcare than in most other EU countries. The system also creates perverse incentives for public hospitals to favour private practice, with most doctors dependent on private revenue. However, untangling the public-private links would disrupt the private insurance industry and, as such, require Ireland to confront powerful vested interests. It also risks jeopardising the funding model for the public sector.
An ambitious reform agenda to address quality and access to healthcare has been put forward. This will see a shift from acute, hospital-centric care to primary and community care (see below), with a strong focus on coordination and integration. As regards accessibility, the vision is to progress towards a universal, one-tier system. However, it is unclear whether the costing exercise underpinning key reform measures is sufficiently robust. An independent impact assessment is being carried out to validate the costings and look at the possible unintended consequences of gradually removing private practice from the acute care system.
Primary and community care services are not yet capable of taking on some of the burden of hospital care. Ireland is the only western European country without universal primary care coverage (OECD/European Observatory on Health Systems and Policies, 2017). A greater role for primary care would reduce unnecessary hospital admissions, reinforce prevention activities and play a crucial role in tackling health inequalities. Though vulnerable groups are protected by a GP visit card, a significant proportion of the population must pay out-of-pocket. There are also serious capacity problems. Primary care centres, focused on coordination and integration, are being introduced successfully across the country, but additional negotiations with general practitioners’ representatives will be required to increase capacity. Renegotiated capitation rates would need to reflect existing tight market conditions for medical labour supply, as well as the cost to private GPs of the foregone out-of-pocket payments due to a shift to universal coverage.
Ensuring sufficient staffing is a policy challenge in both primary and acute care. The healthcare workforce is at the centre of changing demographics and changing models of care. Task shifting is progressing well, with a number of routine procedures being done by nurses (despite significant shortages) and pharmacists. Yet the number of healthcare professionals remains inadequate, constituting a major hurdle for reducing hospital waiting lists, making the shift towards primary care and tackling broader population ageing. A new national framework was launched in November 2017 to support the recruitment and retention of the right mix of staff across the healthcare system.
4.4.
Investment
4.4.1.INVESTMENT for balanced and sustainable growth
Recent developments
Headline investment figures remain volatile and changes should be interpreted with caution. Much of the surge (61 % y-o-y) in total investment (gross fixed capital formation) in 2016 can be attributed to R&Drelated intellectual property (IP), which has a neutral effect on GDP as they are largely imported. Investment in aircraft has also contributed to the swings in total investment (Graph 4.4.1). However, evidence suggests that core domestic investment continues to gain momentum (Graph 1.6 in Section 1). In particular, investment in residential property was stronger in the first half of 2017 when it increased by 14.9 %, supported by government policies. On the other hand, some surveys report a decrease in companies’ propensity to invest compared to 2016 (EIB 2017), as well as a significant qualitative change. Replacing old assets was still the main purpose of investment in fixed assets in 2016, but investment priorities shifted towards product innovation and capacity expansion in 2017 (EIB 2016 and 2017).
|
Graph 4.4.1:Total investment and main drivers
|
|

|
|
Source: European Commission
|
Public investment is increasing. It dropped during the crisis to levels that were barely sufficient to meet the depreciation of the existing stock of capital (Department for Public Expenditure and Review (DPER), 2017). This was the result of a policy decision to prioritise current expenditure with the aim of mitigating the social consequences of the crisis. Transport and housing were the areas most affected by this reduction (Graph 4.4.2). The Capital Investment Plan announced in 2015 allocated EUR 42 billion to capital expenditure over the period 2016-2021. Thanks to sustained economic growth and the stabilisation of public finances an additional EUR 6 billion have been allocated for the period up to 2021. Public capital expenditure is expected to reach 2.5 % of GDP in 2021 (or 3.8 % of GNI*), from an average of 1.9 % over the period 2013-2016. As a percentage of total government expenditure this would put it at 9.9 %, above the long-term average and the euro area average (
).
|
Graph 4.4.2:Capital expenditure by the general government sector
|
|

|
|
Source: European Commission, Department for Public Expenditure and Review
|
Investment bottlenecks and related policies
A number of barriers could have a significant negative impact on investment in Ireland. Infrastructure bottlenecks, including lack of superfast broadband for all economic operators, insufficient public investment in innovation, rigidities in the regulatory environment, specific aspects of access to finance (Section 4.2.4) and a lack of skilled labour in some areas hamper investment (Box 4.4.1). In addition, uncertainties related to the global economic environment also put a check on it (Section 1).
Infrastructure bottlenecks have been identified as an ‘immediate challenge’ (National Competitiveness Council (NCC), 2017c). Investment in transport is one of the most pressing issues, with the level of investment remaining below its long-term average (Graph 4.4.2). According to the Strategic Investment Framework for Land Transport, EUR 9.6 billion have been allocated to transport infrastructure over the next seven years, with EUR 3.6 billion earmarked for public transport and EUR 6 billion for roads (DPER, 2017). So far, road transport investments have mainly aimed to maintain and renew strategically important parts of existing networks, reduce urban congestion and increase efficiency and safety. To this end, the widening the Naas Bypass and the Sallins Bypass and the upgrading of roads in the vicinity of Grangecastle Business Park were started in 2017 in the Greater-Dublin area. The long-term objectives of regionally balanced growth require maintenance and upgrading of the existing transport network as well as the expansion of its capacity in several areas of the country. As regards public transport in Dublin, work on planning and designing the new Metro North has started and the Luas Cross City tramline has been operating since December 2017. Deficits in transport infrastructures are not limited to land transport. Ports are critical for international trade and their importance has been enhanced by recent developments (Section 4.4.2) (NCC, 2017c).
Water distribution and treatment infrastructure bottlenecks persist. Challenges remain as regards ensuring a good infrastructure and service standard. This includes waste water treatment, reducing leaks and improving the quality of drinking water (Section 4.5.4).
Housing provision and spatial planning have become most pressing. Alongside measures already taken to address housing shortages (Section 4.5.1), a planned new National Planning Framework (NPF) is intended to facilitate a more stable housing market by enabling a more coherent spatial distribution of economic activity, housing and infrastructure (Section 4.5.1).
Climate policy objectives are an important criterion to consider when addressing key infrastructure priorities. Ireland is not on track to achieve its greenhouse gas emission reduction objectives domestically (Section 4.5.4). Public investment will have to play an important role in achieving sustainable, low-carbon economic growth. Particularly relevant issues include investment in public transport, including in rail, supporting infrastructure for low-carbon private transport, energy-efficient buildings and infrastructure investments that support the spatial planning objectives.
Skills shortages in some areas are a growing challenge for investment and competitiveness, especially for smaller companies. Some sectors and regions are more affected than others, in particular the information and communications technology and healthcare sectors (Section 4.3). Wages in multinationals of EU origin are 64 % higher than in domestic companies. The difference is 74 % for multinationals of non-EU origin (Siedschlag, I., Di Ubaldo, M. and Tong Koeclin, M., 2017). Under these circumstances, Irish SMEs have difficulties recruiting and retaining skilled workers, hindering their growth and exporting potential (Hays, 2016; NCC, 2017b). The National Skills Council was launched on 27 April 2017 with the purpose of anticipating and responding to the rapidly changing skills needs across all sectors, as well as responding to changes in relationships with key trading partners, in particular the UK. Nine Regional Skills Fora were also launched with a key role to deliver economic growth and drive regional development. Each forum will work closely with the enterprise base in their region, as well as with IDA, Enterprise Ireland and the Local Enterprise Offices. The RSF will provide a structure for enterprises, employers and the education and training to work together to rapidly respond to the identified skills needs of their regions.
|
Box 4.4.1: Investment challenges and reforms in Ireland
Section 1. Macroeconomic perspective
In the immediate aftermath of the crisis, investment fell faster in Ireland than in the euro area average. While multinational companies continue to distort national investment figures, domestic investment is increasing driven by strong construction activity (Section 1). Public investment declined sharply in the wake of fiscal consolidation following the crisis, but it has been increasing gradually since 2016, and is expected to reach 9.3% of total general government expenditure by 2021, above the euro area average (Section 4.4.1 and Section1).
Section 2. Assessment of barriers to investment and ongoing reforms

Barriers to investment relate to infrastructure bottlenecks, rigidities in the regulatory environment, specific aspects of access to finance and a lack of skilled labour in some areas. These affect multinationals and indigenous companies differently. Ireland remains a very competitive destination for foreign direct investment.
Main barriers to investment and priority actions underway
1. Inadequate infrastructures are a major barrier (National Competitiveness Council (NCC 2017b). The World Economic Forum ranks Ireland 52nd in the world in terms of the quality of its infrastructure (WEF 2017) due to challenges related to land transport, sea ports, water distribution and broadband infrastructure. The uneven distribution of infrastructure across regions hinders balanced growth. For this reason, the Capital Investment Plan tackles key infrastructure bottlenecks (Section 4.4.1). It remains to be seen to what extent the different constraints will be addressed.
2. Housing shortages and the insufficient provision of related infrastructures have become a serious concern. The government has taken a number of measures to promote residential construction, including the 2016 Action Plan for Housing and Homelessness and a new National Planning Framework (Section 4.5.1), but it will take time for some of these measures to have an effect. The lack of affordable housing, may discourage domestic and foreign investments as these problems add to other difficulties to attract qualified employees. The supply-side response to these housing deficits is slow for several reasons. The procedures for obtaining permits to build houses, and for commercial and other types of construction, although improved, remain quite rigid. For example, save for exemptions in the case of some minor works, there are no alternative, simpler procedures for obtaining full building permits, such as notification schemes based on self-certification or type approvals (Ecorys, 2017). This lack of flexibility may discourage new providers from entering the Irish construction market, deterring competition, which may lead to inefficiency and higher prices, affecting the economy at large.
3. Public R&D expenditure remains an issue. Ireland is a strong innovator and continues to improve its position in international innovation rankings. However, the domestic economy could benefit more from the large presence of multinationals by increasing public and domestic private sectors R&D investment. So far, public support for business R&D has mainly relied on tax credits. Better targeted policy mixes and other measures more suitable to address the needs of indigenous SMEs are being put in place (Section 4.5.3).
|
Regional imbalances across the country remain in investment, economic growth, competitiveness and innovation. The National Planning Framework to be set in law aims at guiding the spatial patterns of projected population growth and investments to build up on the strengths and potential of the regions in order to improve regional performances to become more in line with that of the greater Dublin area. The NPF targets balanced development throughout the country in particular with physical, digital and research infrastructures to attract investment and create jobs. The regional imbalances are compounded by a reliance in certain regions on indigenous companies, in traditional sectors such activities agrifood and construction (strongly reliant on the UK market) as a source of quality sustainable employment. The new National Planning Framework and Capital Investment Plan recognise the need to proactively boost the ability of these regions to create and grow sustainable enterprises, to maximise the potential of the planned investment in particular in human capital and digital infrastructure investment, in particular through the development of regional innovation capability.
The investment plans in place or envisaged focus on key socioeconomic objectives. The Capital Investment Plan and the NPF tackle the infrastructure bottlenecks that have emerged as a consequence of reduced public investment in the aftermath of the crisis in areas such as housing, transport and water infrastructure. The Capital Investment Plan also addresses other sectors such as education and healthcare, given the impact of population growth and ageing on these sectors. Against this backdrop, the 2018 Budget includes measures to improve the resilience of the economy, increase growth potential, balance development and other social challenges (Department of Public Expenditure (DPER), 2017a; Department of Finance, 2017e). To this end a new long-term planning process — the 10-year National Investment Plan for the period 20182027 — is envisaged in 2018, integrated with the new National Planning Framework (DPER 2017) ().
Aligning the planned frameworks with each other would help promote sustainable, balanced and inclusive growth. An integrated approach to investment planning, encompassing the strategies mentioned above, would help to ensure a balanced regional development. This also requires good interdepartmental coordination, stakeholder involvement and a balanced application of social choice and economic efficiency criteria. Increasing public capital expenditure should also be consistent with economic and fiscal sustainability requirements (DPER, 2017) in order to avoid a renewed pro-cyclical pattern (IFAC, 2017).
The ongoing spending review process is expected to provide useful guidance for prioritising public investment. So far, it has focused on reviewing projects in specific critical spending areas representing around 30 % of current government expenditure. Given the multiple demands for higher public spending in different areas, the process can provide useful guidance for prioritising expenditure and selecting projects, helping to improve the efficiency and quality of public investment.
4.4.2.Competitiveness* and the business environment
The external competitiveness of the Irish economy remains high. Since 2016 the depreciation of sterling and, more recently, the US dollar, with respect to the euro, is taking its toll on Irish competitiveness. But productivity is the main driver of competitiveness in the long-run.
Monitoring productivity in Ireland requires a careful consideration of the heterogeneous composition of the economy. As a small open economy, productivity levels are influenced by the prominent presence of multinationals in the economy, accounting for approximately 40 % of gross value added (GVA). The spread in productivity levels across indigenous and multinational companies is considerable. Some multinationals operating in Ireland also often engage in contract manufacturing and register the value added from those activities in Ireland, although they do not involve domestic labour or capital in the production process. This means that aggregate productivity indicators do not gauge the actual productivity levels of economic activities carried out only in Ireland. This was particularly the case in 2015, when total factor productivity (TFP) increased by around 16 pps (European Commission 2017a).
Differences in productivity levels and productivity growth
There are considerable differences in productivity across companies and sectors. Understanding them could help policymakers make better decisions. Microdata show large differences in labour productivity (Graph 4.4.3) and TFP (Graph 4.4.4) between multinationals and indigenous Irish companies. In addition, within the group of multinationals, multinationals from EU Member States show lower productivity than those originating from non-EU countries. The former are 25 % more productive than Irish companies, while multinationals of non-EU origin are 43 % more productive in TFP terms (Siedschlag, I., Di Ubaldo, M. and Tong Koeclin, M., 2017) (
).
|
Graph 4.4.3:Labour productivity across sectors and firms, 2014
|
|

|
|
Source: Siedschlag, Di Ubaldo and Tong Koecklin (2017)
|
Productivity growth differences between Irish and multinational companies are even greater. Foreign non-EU multinationals are increasing their productivity much faster than other companies operating in Ireland (Graph 4.4.5). Some Irish companies have high productivity growth rates, even higher than the affiliates of EU multinationals. These figures suggest increasing convergence in productivity levels between companies of Irish and EU origin.
Labour productivity differentials are reflected in wage differentials. Wages in multinationals of EU origin are 64 % higher than in domestic companies. The difference is 74 % for multinationals of non-EU origin.
|
Graph 4.4.4:Distribution of TFP values and means by quintile, indigenous companies vs multinationals, 2014
|
|

|
|
Source: Siedschlag, Di Ubaldo and Tong Koecklin (2017)
|
The Irish economy benefits from the activity of multinationals, but the evidence around spillovers is limited. Multinationals create jobs and contribute to aggregate domestic demand. They also help local companies diversify export destinations and volumes. It appears that indigenous companies acquiring inputs from or selling to multinationals of EU origin increase their numbers of exported products and export destinations (Siedschlag, Di Ubaldo, Tong Koecklin, 2017). However, there is relatively little evidence of intra-sector or regional spillovers from multinationals to domestic companies. Irish companies can sometimes improve their performance when they are integrated into value chains with multinationals. For example, there is some evidence of productivity improvements in Irish companies that provide services to multinationals (Di Ubaldo M., Lawless M. and Siedschlag I., forthcoming).
|
Graph 4.4.5:Average growth rate of labour productivity
|
|

|
|
Source: Di Ubaldo, Lawless, and Siedschlag (forthcoming).
|
Productivity improvements are more likely to appear in cases where Irish companies engage in R&D and innovation activities. For example, in the services sector, only companies that invest in R&D are able to increase their productivity when supplying inputs to multinationals. The benefits for Irish companies may therefore depend on their capacity to innovate (Di Ubaldo M., Lawless M. and Siedschlag I., forthcoming). Attracting foreign investment is not enough to ensure a positive impact on the domestic economy’s productivity.
Innovation
High rates of innovation contribute to sustainable growth and competitiveness. Enterprise Ireland and local enterprise offices effectively support innovation among Irish companies. With over 170 schemes in place, Enterprise Ireland has been very successful in developing Irish start-ups and scaleups (EI, 2017). Overall, Science Foundation Ireland and the European Regional Development Fund (ERDF) coinvest 35 % of the total ERDF allocation in innovation performance with high absorption rates and interim outputs. The 2018 Budget contains measures to strengthen the international competitiveness of the indigenous production base. The National Competitiveness Council (NCC, 2017b) has also underlined that improving the productivity of indigenous companies remains important for competitiveness.
Foreign investment contributes to the overall competitiveness of the Irish economy. The Irish Industrial Development Agency (IDA Ireland) has a long and successful record in attracting FDI. New activities include the sectoral diversification of foreign investments and ensuring their contribution to regionally balanced growth. The 2018 Budget contains measures for improving the regional geographic balance of FDI. These include targeted funding in support of the IDA regional property/advanced facilities programme and EUR 60 million in competitive regional funding through Enterprise Ireland and local enterprise offices (a further EUR 25 million is envisaged) (Department of Finance, 2017f)..
The cooperation between local companies, multinationals and the national science and research community can play a key role in the adoption and diffusion of new technologies. Enterprise Ireland provides examples of successful collaborative engagement between multinationals and indigenous SMEs in areas ranging from 3D printing to advanced materials for aerospace.
A number of tax incentives for investment have been adopted. Ireland’s Employment and Investment Incentive provides tax relief on investments in medium-term equity capital for companies that would ordinarily find it difficult to raise such funding. It has been identified as a good example in terms of achieving additional objectives of incentivising employment and R&D. However, the scheme (which is to be reviewed in 2018) in certain areas, for example tax relief on investment returns and adaption of its target to the age of the business in question as well as broadening out the target audience for investment (PwC & HIS, 2017).
Sectoral and geographic diversification of exports
Diversification of export destinations remains a challenge given the global uncertainties (Department of Finance, 2017c; NCC. 2017c). This is all the more important in the context of a concentration in export markets towards the US and the UK. Domestic companies export only a limited number of products. In 2015 the median number of products exported was 5, compared to 11 for multinationals (European Commission 2017a). Budget 2018 contains measures to address these challenges. However, there is considerable uncertainty regarding a number of factors affecting the export performance of Irish-owned companies.
Part of the trade between Ireland and the rest of the world relies on UK infrastructure and logistics. The UK plays an important role as a ‘bridge’ between Ireland, the continent and the rest of the world. Changes in current trade patterns would have an impact on logistics and the physical infrastructure of critical importance for the Irish trade (Lawless and Morgenroth, 2017) in particular for key Irish exports such as livestock, minerals or refrigerated merchandise. They are also crucial for the provision of imports needed by Irish companies. Disruptions in logistics and port infrastructure adequacy would add to the already high cross-border trading costs of Irish companies (for the description of the methodology for calculating trading costs see The World Bank (2017a).
Higher interest rates can also affect SMEs' exports. At a time when the diversification of geographic and product markets is a stated objective of the Irish government, financing constraints for SMEs are likely to deter them from exporting. Research has shown that Irish companies reporting to have experienced financing difficulties are less likely to engage in exporting activities (Siedschlag, Di Ubaldo, Tong Koecklin, 2017). The fear of application refusals and high interest payments are among the main constraints for the exporting decisions of SMEs.
Business environment
Ireland offers an attractive environment for doing business. The regulatory environment is businessfriendly and it has a high quality public administration and governance framework (OECD, 2017a). Ireland has recently emerged as an ideal location for start-ups due to a range of governmentsupported programmes, a highly educated young workforce and access to the modern technology (IVCA, 2017).
In the retail sector, it is important to ensure that entry barriers do not hinder entry of Irishowned and foreign-owned retailers. Changes to the national planning framework that could create barriers to entry, may deter the innovation and productivity as well as the increased consumer choice such entry can bring.
Barriers in the market for legal services continue to represent a challenge. They affect mostly small businesses as they hamper competition and increase litigation costs. The new Legal Services Regulation Act led to the creation of the Legal Services Regulatory Authority in October 2016, but the key regulatory work that needs to be done for the Act to be implemented has been slow. Furthermore, regulations are not expected to take full advantage of open-ended provisions in order to minimise the impact on competition and reduce costs of legal services. Public consultations, a pre-requisite to implementing legislation (
), are experiencing significant delays.
The envisaged composition of a new body for proposing judicial appointments raises concerns regarding the level of participation of the judiciary in that body. The proposed composition of the Judicial Appointments Commission, which would comprise only 3 judges over 13 (including a lay chairperson accountable to the Oireachtas) would not be in line with European standards (Paragraph 47 of Recommendation CM/Rec(2010)12 adopted by the Committee of Ministers of the Council of Europe on 17 November 2010), and was opposed by the Association of judges in Ireland. As to efficiency, the average length of proceedings in the High Court hearing civil and commercial cases (excluding divorce) at first instance increased from 680 days in 2015 to 772 in 2016 (CS, 2016). For claims of at least EUR 1 million and other major commercial disputes, the High Court’s Commercial proceedings List offers short disposition time (approx. 21 weeks to trial from entry).
4.5.
Sectoral policies
4.5.1.Property market*
Rapid house price increases are observed country-wide. Residential property prices rose by 11.6 % y-o-y to November 2017, continuing the upward trend of the previous years (Graph 4.5.1). While price growth was similar across the country, significant regional differences remain in absolute terms, with the median price of dwellings sold in Dublin in 2016 being EUR 320 000, compared to EUR 196 000 nationally.
|
Graph 4.5.1:House price increases
|
|

|
|
Source: CSO
|
Private sector rents have continued to trend upwards and exceeded their pre-crisis peak. Private rent inflation was 9.5 % year on year in the third quarter of 2017, with rents 7.0 % above their peak level recorded in the fourth quarter of 2007 (RTB, 2017). This is expected to be related to the tight housing market conditions, fuelling rental demand. Moreover, the labour market increasingly requires a more mobile workforce, possibly diverting demand to the rental market (Tax Strategy Group, 2017).
House prices do not appear to be overvalued at this stage, but, affordability is a concern. Based on price-to-rent indicators or regression-based equilibrium price indicators, prices did not seem overvalued in 2016 (Graph 4.5.2). However, the price-to-income (affordability) indicator has been increasing steadily since 2012 and exceeded its quarterly long-term average in the fourth quarter of 2016. New mortgage credit is starting to increase, albeit from a low base (Section 4.2.3). In the second quarter of 2017, 34 % of household transactions remained non-mortgaged (largely based on cash) (CBI, 2017d).
|
Graph 4.5.2:Overvaluation gap with respect to price/income, price/rent and fundamental model valuation gaps
|
|

|
|
Source: European Commission
|
Housing supply is increasing, although from a very low level. The total national housing stock grew by only 8 800 dwellings between 2011 and 2016, compared to the growth of some 225 000 units recorded between 2006 and 2011. This is a direct consequence of the real estate bubble burst. Starting from this low base, housing completions, estimated on the basis of new electricity connections, picked up by 42.3 % y-o-y in November 2017. While it is clear that housebuilding is growing rapidly, alternative data based on energy rating statistics suggest that in absolute terms figures may be much lower (
).
Despite an increasing need for higher-density housing, semi-detached houses remain the most popular type of new homes built. Although the percentage of apartments increased over the period 2011-2016, semi-detached homes still represented most (41.2 %) new completions in 2016. Apartments represented only 13.8 % of new buildings (
), despite the need for a more one- and two-bedroom apartments. The high cost of apartment delivery is sometimes cited as a significant barrier to new apartment supply. A government cost assessment, including a comparison with other countries, is being done and new apartment guidelines, informed by this assessment and other analysis, are being refined (see Section 3.2).
An inability to meet housing demand could have an adverse effect on growth prospects. The draft National Planning Framework (DHPLG, 2017) projects the need to accommodate 550 000 additional households by 2040. Other estimates of housing demand range from 23 000 (
) (Duffy et al., 2016)) and 50 000 (Lyons, 2017) annually. No matter what indicator is used, it is clear that new supply remains below all estimates of the number of new housing units required to meet demand. In this regard, the National Competitiveness Council has stressed the need to find solutions to increase the availability of property. The lack of housing could limit the ability to maintain and to compete for new jobs in multinationals and sustain growth in foreign investment. At the same time, if any relocation of companies to Dublin also leads to a relocation of employees, existing scarcity of housing may be exacerbated.
The 2018 Budget contains a number of extra measures aimed at addressing the housing shortage, including social housing. In September 2016, the net need (
) for social housing support delivered through the current expenditure (Section 4.3.2) was estimated at 91 600 households (DPER, 2017). Updated housing need assessment figures for 2017 show a drop in a nine-month period of 6.1 % to 85 799 (Housing Agency, 2018). Overall, the housing needs of a further 80 000 eligible households will be met under the five -year Action Plan through Housing Assistance Payments and other supports. Concerning the capital expenditure, the budget included a target of building some 3 800 new social housing units in 2018. An additional EUR 500 million was allocated in this budget to increase the total provision of new-build social housing units by 2021 by 3 000, bringing the total target for new social housing in the Action Plan for Housing and Homelessness to 50 000 by the same date (of which 33 500 through construction of new stock). However, this takes time. Construction figures from September 2017 show 3 700 new social housing homes being built across 190 sites, at different stages of development.
An appropriate supply response requires coherent and concrete action, including in the infrastructure and planning system. Building on previous actions (see table 3.1), the 2018 Budget announced that up to EUR 750 million was being made available for financing commercial investment in housing by means of a new dedicated fund. The difficulty of accessing development finance may in particular remain an inhibitor for small companies, as there are more opportunities for better capitalised, large developers. Capital gains tax changes are expected to help increase supply. The budget also signalled an increase in the vacant site levy. While this could encourage builders to use development land, in practice the increase will not have an effect until 2019. While such tax measures should address speculation, they may not address issues such as commercial unviability, mentioned above, and the lack of supporting infrastructure (such as water and transport). The latter is showing the strain of the years of low investment that followed the bust, constraining housing supply.
The government is introducing initiatives in the commercial property market, to shift developers’ attention towards residential building. The budget included an increase in the level of stamp duty on commercial property transactions from 2 % to 6 %. While this is a considerable change which may reduce the volume of commercial transactions in the next few years, there are doubts whether it would actually divert developers’ attention to the residential market. A stamp duty refund scheme for land purchased for the development of housing was also introduced. Finally, a new, time-limited tax deduction for pre-letting expenses was introduced to encourage owners of vacant residential property to bring it into the rental market. Official vacant homes data may be overestimating the number of habitable vacant homes at the moment (
).
4.5.2.Transport and telecoms
Transport
Recent investment levels in transport infrastructure have been lower than before the crisis, linked to the lower level of resources available for capital investment. While increased demand for transport is driven by economic growth, investment in the sector remains constrained (Section 4.4.1). Ireland has more motorways per capita than the EU average, but the ‘Performance Indicators in Local Authorities’ Report published by the National Oversight and Audit Commission in December 2016 highlighted the need for major work on Ireland’s rural road networks. The capital allocation for the Department of Transport, Tourism and Sport will total EUR 7.5 billion over the four-year period to 2021. Overall, most of the department’s expenditure will be on land transport, with landmark projects such as the Naas Bypass upgrade/ Sallins Bypass (including Osberstown interchange) project and investment in significant public transport programmes.
The weak transport infrastructure, in particular around urban centres, is hindering matters. There has been significant and increasing traffic congestion in all urban areas in recent years. Dublin and Galway are particularly congested, with international ratings ranking Dublin as the ‘slowest’ major city studied (
) (INRIX Research, 2017). Increasing demand in urban centres highlights the need for targeted investment in additional capacity where significant bottlenecks exist. The Capital allocation over the four-year period from 2018 to 2021 allows for an envelope of €2.7 billion for public transport. This funding should progress key capital programmes that would help address congestion and emerging capacity constraints on public transport system across Ireland's cities.
Ireland’s urban transport policy emphasis has been on shifting commuters from their private cars to other modes, including public and sustainable transport. In 2015, there were an extra 7.7 million passenger journeys spread across bus, rail and light rail services, with public transport accounting for 5.8 % of all journeys in 2014. Any new infrastructure is to account for its impact on Ireland’s obligations under the EU energy, climate and air quality policies. The need for further public infrastructure investment has been demonstrated, in particular in public transport and cycling infrastructure in the main cities with a funding allocation of some €114m to support this objective. Consideration must also be given to moving away from diesel-only fuelled public transport fleets, in view of the obligations under the EU Renewable Energy Directive to introduce more renewables into the energy mix for transport and this is being considered for urban bus fleets in the context of future year funding allocations.
Telecoms
Access to fixed broadband remains a challenge for rural areas in particular. In 2017, around 80% of rural households had access to fixed networks offering at least 30 Mbps, which is well above the EU average (47%) and represents a substantial y-o-y increase. However, 6 % of rural households had no access even to basic fixed broadband (offering at least 2 Mbps). Overall, 52% of households had access to a fixed network offering at least 100 Mbps. This figure is likely to be significantly lower in rural areas. 16% of SMEs reported that the speed of their Internet connection is insufficient for their needs. A number of SME stakeholders consider unavailability of connections of at least 100 Mbps a challenge, hampering growth and cross-border sales.
Overcoming connectivity challenges, in particular in rural areas, requires public intervention, notwithstanding private investments from operators. The 2015 National Broadband Plan Intervention Strategy provides for the delivery to all premises of a minimum download of 30 Mbps and a minimum upload of 6 Mbps, with a mix of private and public intervention. On the other hand, it does not specify a concrete target for access to networks offering at least 100 Mbps. The plan is eligible for EUR 75 million under the ERDF programme 2014-2020.
The implementation of the National Broadband Plan is experiencing substantial delays. It is therefore important that Irish authorities complete the related procurement process.
4.5.3.Research, development and innovation (R&D&I)
Ireland is a strong innovator and continues to improve its position in international innovation rankings. This is evidenced by its position in the Innovation Output Indicator (3rd) and on the European Innovation Scoreboard (10th). The strengths of the Irish innovation system are the quality of human capital, the openness and quality of its research system as well as an enabling business environment. Relative weaknesses relate to finance, links between academia and business and inter-company collaboration.
The country’s ability to sustain its robust economic growth depends greatly on its vision to become a global innovation leader (Innovation 2020, DBEI 2015). Its strengths stem from a well-developed knowledge-intensive services sector and medium- and high-tech manufacturing. The proportion of employment in high-growth companies (fourth in the EU) and in fast-growing companies in innovative sectors (first in the EU) strongly outperforms the EU average. Exports are the main driver of economic growth (10th world’s leading exporter of services). However, they are increasingly concentrated in a limited number of sectors (pharmaceuticals, medical devices and software) and mainly produced by multinationals (Section 4.2.2).
Public expenditure on R&D continues to cause concern. Public R&D intensity has continued to decline from 0.50 % in 2010 to 0.34 % of GDP in 2016. However, in absolute terms, public expenditure in R&D grew from EUR 836 million to EUR 950 million over the same period. Nevertheless, the low levels of investment will make it difficult for Ireland to reach its R&D intensity target of 2.5 % of GNP by 2020 and if unreversed, this can have long-lasting negative effects.
The strong public research base and Ireland’s highly qualified human resources are key drivers of the Irish innovation ecosystem. The strength of the Irish research base is reflected in the number of high quality scientific publications (
) (fifth in EU) and the number of new doctoral graduates (seventh in EU). In 2016 the government put in place the National Skills Strategy 2025 to help Ireland deliver technology talent and skills. Some Irish universities have fallen in international rankings. The additional allocation of EUR 36.5 million planned in 2017 may be a signal of reinvestment. The drop in PhD enrolments in 2016 was reversed in 2017, recovering to 2015 levels (
) (Higher Education Authority (HEA) statistics). Moreover, a new PhD and Research Master’s Programme for 150 enrolments in disciplines aligned to business needs and the Laureate Awards for frontier research have been launched.
Addressing barriers to pension portability that can restrict researcher mobility is hence of key importance to ensure qualified research staff. To this end, Ireland has initiated to explore the possibility of higher education institution and other research performing organisations participation in the EU RESAVER pension scheme.
|
Box 4.5.1: Policy highlights: Technology Partnerships and Technology/Research Centres
The European Commission's Country Specific Recommendations (CSRs) for Ireland have called for increased attention by the public sector to the diffusion of technologies among Irish indigenous companies. In particular, the 2017 CSRs suggested stimulating innovation by SMEs with new and more direct policy mixes. The Innovation 2020 Strategy, adopted in December 2015, has been developing new policy instruments that have succeeded in fostering cooperation between research institutions and domestic firms as an effective way of finding out and spreading the use of new technology solutions and innovations. In June 2017, Innovation 2020 reported that, over the previous twelve months, 45 new actions have been initiated, 12 actions have been completed and 72 actions were continuing to progress.
In the context of Innovation 2020, technology partnerships and Technology/Research Centres are a vital part of the system of public support for enhancing competitiveness through innovation and commercialization of research. The Centres provide firms with a mechanism to access expertise and technology beyond what they have available in-house. They have managed to turn every euro invested in the scheme into a seven euro increase in the turnover of firms. The Centres are co-financed with public and private funds and primarily focused on research and innovation priority areas that have been identified as market opportunities for Ireland. They also provide a path to commercialization for intellectual property emerging from the public research system.
Ireland currently has a sophisticated network of such Centres. The Research Centres, funded by Science Foundation Ireland, have a specific research mission and competency. These are complemented by a network of enterprise-led Technology Centres located on campuses across the Higher Education System. They act in sync with Incubation Centres, technology transfer offices, and Technology Gateways supported by Enterprise Ireland.
In 2017, five new Research Centres were added to the already existing 12 Research Centres: Confirm (smart manufacturing), Beacon (sustainable use of biological resources), FutureNeuro (rare neurological diseases), I-Form (Additive Manufacturing) and Future Milk (precision pasture-based dairying). The Centres will enable collaborative partnerships between industry and academia supported by an investment of EUR 98 million by Science Foundation Ireland matched by EUR 54 million from 125 industry partners. A Meat Technology Centre and a Manufacturing Research Technology Centre were also set up in 2017. An Applied Internet of Things Cluster and an Engineering, Materials and Design Cluster were also set up to maximize the potential of Technology Gateways working in these thematic areas.
Regular reassessment of the ongoing work allows for the possible winding down of some initiatives. For instance, in 2017 a number of Technology Centres were wound down "primarily as their target objectives and company base did not continue to match the Technology Centre model and requirements. This allows other Centres to scale subject to their funding proposals being of sufficient quality and robustly supported by industry." (DJEI 2017).
Interesting concrete results can be reported from the activity of these Centres. While partnerships encourage collaboration between industry and academia there is an increasing emphasis on promoting collaboration across firms as well. One such example was a EUR 1.1 million partnership award in late 2015 between Boston Scientific (a US medical device firm), Schivo (an indigenous precision engineering company) and Lisnabrin Engineering (an indigenous tool manufacturing company). The collaboration between these companies and the South Eastern Applied Materials (SEAM) Technology Gateway in WIT resulted in a joint research programme which aims to bring a considerable improvement o the way manufacturing industries operate in Ireland through a new process linked to metal lasering.
|
Business R&D expenditure continues to increase and is dominated by foreign-owned firms. It increased from EUR 1.5 billion in 2006 to EUR 2.3 billion in 2016. Still, Business R&D intensity in Ireland, at 0.83 % GDP in 2016, remained below the EU average of 1.31 %. Despite the increase in SMEs engaging in R&D, business R&D is dominated by multinationals (73 % of total business R&D expenditure). Public support for business R&D has increasingly relied on R&D tax incentives, accounting for 81 % of total public support for business R&D. A 2016 evaluation (IGEES, 2016) found that the R&D tax credit achieves reasonable additionality (
). The review highlighted that most firms conducting R&D are small and Irish, but that total expenditure on R&D comes mainly from older, larger and non-Irish firms. The review found that it was mainly older, larger and non-Irish firms who derived financial benefit from the scheme, although it was typically Irish firms who benefited more from the repayable credit element. The Knowledge Development Box (Certification of inventions) Act 2017 has come into operation, enabling SMEs to qualify for a lower rate of corporation tax (
). While information on its take-up or impact is not yet available, there are indications that some of the modalities might be too complex for SMEs to use.
Evidence suggests that policies to incentivise innovation and investment in knowledge-based capital (
) should be further tailored to indigenous Irish SMEs. For Irish-owned companies, the largest productivity gains are driven by investment in R&D and in organisational and branding capital (Siedschlag, 2017). To gear innovation policies towards more direct support for local SMEs, new initiatives are being launched. The Enterprise Ireland Strategy 2017-2020 (EI, 2017a) seeks to support SMEs by increasing its R&D investment by 50 % to EUR 1.25 billion by 2020. A review of R&D and innovation support for companies is being done, to be finalised by the end of the year. Six small business innovation research projects were launched in 2017 and a new credit guarantee scheme (a Counter Guarantee Scheme) will be launched shortly.
A network of technology and research centres helps companies collaborate with the public research system and generates inter-company collaboration, including multinationals. In 2016, three gateways were added to the network. A Meat Technology Centre and a Manufacturing Research Technology Centre were set up in 2017. An Applied Internet of Things Cluster and an Engineering, Materials and Design Cluster were also set up. Five new research centres will enable collaborative partnerships between industry and academia supported by an investment of EUR 98 million by Science Foundation Ireland matched by EUR 54 million from 125 industry partners.
|
Graph 4.5.3:Public support for business R&D as % of GDP, 2006 and 2014
|
|

|
|
Source: European Commission
|
There is scope to increase industry-academia collaboration and accelerate knowledge spillovers from multinationals to local SMEs. The level of business enterprise funding of public R&D is one of the lowest in the EU and the amount of publicprivate scientific copublications per million inhabitants remains relatively low. The Technology Transfer Strengthening Initiative Third Phase has been launched to enhance the knowledge transfer system. Alternative ways of increasing the diffusion of new technologies and getting multinationals more involved in R&D with local SMEs need to be explored.
Innovation is high on the agenda thanks to a comprehensive approach, rolled out at national and regional level. It is not only addressed in a dedicated Innovation 2020 Strategy (Interdepartmental Committee on Science, Technology and Innovation, 2015), but as part of a comprehensive framework bringing together other government strategies, such as on education, taxation and employment. The Innovation 2020 Second Progress Report 2017 (Cross Government Implementation Group, 2017) shows good advancement in implementing actions and a good monitoring and evaluation system. Research prioritisation, being reviewed, is almost complete.
4.5.4.Energy and climate action
Ireland’s current climate change mitigation efforts will not enable it achieve its Europe 2020 climate goals domestically. Greenhouse gas emissions declined between 2001 and 2011, but the economic recovery has put emissions on a renewed rising trend since 2012, which demonstrates Ireland’s challenges and limited progress in decarbonising key parts of its economy, mainly agriculture, road transport and the residential sector.
Ireland is projected to greatly exceed its emission allocations under the Effort Sharing Decision by 2020. National projections indicate that cumulated emissions (with existing measures) over the 2013-2020 compliance period will exceed allocations by 13.7 million tons of CO2 equivalent, and that emissions in 2020 will be only 3 % below 2005 levels, compared to a reduction target of 20 %. This means that Ireland will need to buy allocations from other Member States in surplus in order to comply with the Effort Sharing Decision.
National projections highlight the scale of additional efforts needed. Emissions under the Effort Sharing Decision are likely to increase up to 2025 (
), before stabilising at a level slightly below 2005 emissions. The implementation of additional measures already identified would only slow down the rising trend until 2025.
Ireland recently adopted a National Mitigation Plan. It is the first plan to present a coherent and integrated roadmap towards a low-carbon economy, laying out a coherent framework to tackle persisting challenges in the energy sector. It sets out broad objectives and wide-ranging policy instruments aimed at decarbonising power generation, the built environment and transport while reaching carbon neutrality for agriculture, forestry and land use. The plan will be a living document to which mitigation measures/policies will be added iteratively. As it stands, however, it offers few specific new mitigation measures. It should still be a good basis for preparing Ireland’s integrated national energy and climate plan.
Other key initiatives are being implemented, that will affect Ireland’s capacity to decarbonise its economy. The recently released draft National Planning Framework has a climate component. Adequate spatial planning will be a critical enabler of mitigation given the population is so widely dispersed and Ireland only has a small number of large urban areas, all of which have serious congestion and public transport issues to deal with. The Capital Investment Plan will also play a crucial role in decarbonisation as it will determine the extent to which additional means are mobilised for public transport and low-energy housing (Section 4.5.2 and below). How the government deals with the housing shortage may have a significant impact on energy efficiency in the residential sector for many years to come. Both the consistency with the National Mitigation Plan (Section 4.5.1.) and the affordability of house building need to be considered. In the energy sector (see below), Ireland has put in place a series of policies to foster decarbonisation in line with the White Paper on Energy (DCCAE, 2015). However, subsidies to two peat power plants under public service obligations will remain in place until 2019. The planned capacity remuneration mechanism under the Integrated Single Electricity Market may still support fossil fuel-based power plants to a certain extent for security of supply.
The transition to low-carbon energy sources continues to be challenging. Fossil fuel energy represents over 90 % of total energy used (). Replacing it with renewable energy and improving energy efficiency will be crucial for making progress towards decarbonisation. In view of the obligations under the EU Renewable Energy Directive, it is noted that diesel-powered vehicles accounted for 71 % of all new vehicle sales in Ireland in 2016.
There is a considerable need for public and private investment in energy infrastructure, including in management systems, smart distribution and storage (Environmental Protection Agency, 2016). In this context, the roll-out of smart meters, planned to commence in 2019, is expected to significantly contribute to the low-carbon economy and to bring benefits to the energy system and final consumers.
It will be difficult for Ireland to reach its renewable energy targets by 2020. It is staying in line with the 2013/2014 indicative trajectory for the deployment of renewable energy (its share in gross final energy consumption) and is currently in line with the 2015/2016 indicative trajectory. However, as the indicative trajectory becomes steeper, reaching the 2020 target of 16 % remains challenging and may require further measures.
Ireland has intensified its energy-efficiency efforts, although reaching the targets remains challenging. Ireland has achieved levels of primary and final energy consumption below the indicative national 2020 targets. However, the latest projections (DCCAE, 2017) suggest that it might not reach its 2020 target and efficiency improvements would need to be intensified because of the robust growth of the Irish economy. The 2018 budget has allocated €107m to energy efficiency, an increase of over €50m since 2015, allocating an additional EUR 36 million to expanding energy efficiency programmes in the residential, commercial and public sectors. Several initiatives have been launched to promote energy efficiency renovations in homes with promising results, such as the Warmer Homes Better Energy scheme (SEAI, 2017) to combat energy poverty of the most vulnerable households.
Due to its geographical location, interconnection is a key challenge for Ireland. The level of interconnection of installed electricity generation capacity was 7.4 % in 2017. There are a number of ‘projects of common interest’ in the pipeline involving Ireland, which should help improve interconnection, including the Celtic interconnector, which is undergoing a feasibility study and, if successful, could allow the Irish grid direct access to electricity from France.
The Integrated Single Electricity Market for Ireland and Northern Ireland is scheduled to enter into force in May 2018. It is expected to facilitate the transition to a low-carbon energy sector in a more competitive market environment.
Resource efficiency and the circular economy
Ireland is in great need of investments in the water sector. According to the national utility Irish Water, EUR 5.5 billion need to be invested over the period 2014-2021 to bring water infrastructure and services up to an ‘acceptable’ level. It is estimated that investment of almost €14 billion will be required by Irish Water over the period 2018 to the mid-2030s, on a structured and phased basis, to meet its investment needs. 'The Water Services Act 2017, which was signed into law on 17 November 2017, provides for liabilities under the pre-existing charging system to be extinguished and for domestic water services to be funded from general taxation in future. The Act also provides for a regime of charging for excessive usage above a threshold. Irish Water also receives funding from charges to non-domestic customers and will raise debt, within limits set from a government debt management perspective, only for non-domestic sector capital expenditure
Waste water treatment and substandard drinking water continue to give rise to serious environmental and human health concerns. In nearly one quarter (50 out of 185) of Ireland’s large urban areas, which account for almost two thirds of national waste water collection, treatment does not meet European quality standards. The Irish Environmental Protection Agency calls for significant capital investments to upgrade deficient collecting and treatment systems and to improve water quality (Environmental Protection Agency, 2017). Capital expenditure on waste water treatment infrastructure in 2016 was EUR 172 million. This is nearly EUR 100 million less than the average spent each year between 2000 and 2011. A substantial increase in investment over the coming years would be needed in order to protect and improve the quality of water and minimise public health risks (and corresponding costs).
Annex A
Overview table
|
Commitments
|
Summary assessment (
)
|
|
2017 Country-specific recommendations (CSRs)
|
|
CSR 1: Pursue a substantial fiscal effort in 2018 in line with the requirements of the preventive arm of the Stability and Growth Pact. Use any windfall gains arising from the strong economic and financial conditions, including proceeds from asset sales, to accelerate the reduction of the general government debt ratio. Limit the scope and the number of tax expenditures and broaden the tax base.
|
Ireland has made Some Progress in addressing CSR 1 (the overall assessment of the CSR1 does not include an assessment of compliance with the Stability and Growth Pact)
|
|
·Pursue a substantial fiscal effort in 2018 in line with the requirements of the preventive arm of the Stability and Growth Pact.
|
·The compliance assessment with the Stability and Growth Pact will be included in spring when final data for 2017 will be available.
|
|
·Use any windfall gains arising from the strong economic and financial conditions, including proceeds from asset sales, to accelerate the reduction of the general government debt ratio.
|
·Some Progress The proceeds from the sale of government's shares in state-owned banks have been used to reduce public debt and the National Asset Management Agency recently redeemed, three years ahead of target, the final EUR 500 million of the government-guaranteed debt. In December 2017, the Irish authorities repaid the outstanding IMF loans, together with the bilateral loans from Denmark and Sweden, early and in full.
|
|
·Limit the scope and the number of tax expenditures and broaden the tax base.
|
·Limited Progress: Some of the measures in the Budget do not contribute to expanding the tax base: the increases to tax credits for self-employed and home carers, the creation of a stamp duty refund scheme for residential land, the reduction from seven to four years of the holding period to qualify for the capital gains tax exemption on certain property assets, the tapered extension of mortgage interest relief for the remaining recipients, the fiscal incentive for certain types of share-based remunerations, or the decision to extend the universal social charge relief for medical card holders for a further two years. Conversely, the reduced cap of 80% on the amount of capital allowances for intangible assets and the introduction of a new tax on sugar-sweetened drinks can potentially broaden the tax base.
|
|
CSR 2: Better target government expenditure, by prioritising public investment in transport, water services, and innovation in particular in support of SMEs. Enhance social infrastructure, including social housing and quality childcare; deliver an integrated package of activation policies to increase employment prospects of low-skilled people and to address low work intensity of households.
|
Ireland has made Some Progress in addressing CSR 2
|
|
·Better target government expenditure, by prioritising public investment in transport, water services, and innovation in particular in support of SMEs.
|
·Some Progress has been made in enhancing the quality of expenditure through a new spending review. Public investment continues to recover while addressing key infrastructure bottlenecks. A Water Service Act has been adopted that provides for the current domestic water charging regime to be discontinued and for this to be replaced by a regime where general taxes fund domestic water services. Some progress has been achieved in the provision of innovation infrastructures to SMEs, in particular as regards the creation of Technology Centres. Ireland has an ambitious infrastructure investment plan for education at all levels.
|
|
·Enhance social infrastructure, including social housing and quality childcare;
|
·Some Progress: The government is adopting an array of measures to support housing supply, including increasing the provision of social housing units. Childcare costs remain elevated and according to recent OECD figures are the highest in the EU. Despite high participation in early childhood education and care (ECEC), its accessibility, affordability and full-time provision remain problematic. The ECEC participation rate in Ireland was 92.7 % in 2015 against the EU average of 94.8 %. Attendance fell by 5.4 pp percentage points (pps.) since 2013, and the availability and cost of full-time provision are still problematic. The quality of ECEC is supported by Síolta, the national quality framework for the sector, and by Aistear, a curriculum framework published by the National Council for Curriculum and Assessment (NCCA). In August 2016, a National Collaborative Forum for the sector was created. This facilitates engagement with stakeholders on issues of concern and on policy and delivery. There have been important changes to the minimum qualifications required for staff in the sector, and a reorganisation of the inspection system for pre-schools in order to help children with disabilities fully participate. From December 2016 all staff working directly with children must hold at least a level 5 qualification ('major award in early childhood care and education'). More funding is available to services where the pre-school leader has a pre-school award in ECEC at level 7 on the national qualifications framework and the assistants have achieved a minimum level-5 award.
|
|
·deliver an integrated package of activation policies to increase employment prospects of low-skilled people and to address low work intensity of households.
|
·Some Progress: With the Action Plan for Jobless Households, IE has taken important steps to expand the labour force, combat joblessness and ensure that the inactive households are equipped with the skills required on the labour market. How the plan will be put into effect and implemented is still to be seen. A more holistic approach to support provision for the inactive households could be sought considering the diverse needs of this group and integration of services across areas could be recommended for the whole target group. In general the Action Plan is rather weak in terms of defining the personalised services to be designed. More flexibility would need to be included in the training and education offers provided.
|
|
CSR 3: Encourage a continued and more durable reduction in non-performing loans through resolution strategies that involve write-offs for viable businesses and households, with a special emphasis on resolving long-term arrears.
|
Ireland has made Some Progress in addressing CSR 3:
·The reduction of NPLs continues but perhaps not as quickly as one would have expected given the economic performance of IE in recent years. It is difficult to establish to what extend the reduction in NPLs is the result of policy measures or just the consequence of the upturn in the business cycle. The pace of NPL reduction has slowed somewhat as the most difficult cases are proving sticky. The nature of impaired loans restructuring is such that it requires time to show whether arrangements put in place are truly sustainable and resilient to changes in the interest rate environment. Several policy measures have been introduced to support the engagement of debtors in distress and increase the number of personal insolvency arrangements, but the take-up remains overall limited.
|
|
Europe 2020 (national targets and progress)
|
|
Employment rate target set in the NRP: Between 69 and 71 %.
|
The employment rate (Eurostat definition, age group 2064) rose to 70.3 % in 2016 compared with an average of 63.7 % in 20112012.
|
|
R&D target set in the NRP: 2.5 % of GNP
|
Public R&D intensity has continued to decline from 0.50 % in 2010 to 0.34 % of GDP. However, in absolute terms, public expenditure in R&D grew from EUR 836 million to EUR 950 million over the same period. Business R&D expenditure increased from EUR 1.5 billion in 2006 to EUR 2.3 billion in 2016. Yet, business R&D intensity, at 0.83 % GDP in 2016, remained below the EU average of 1.31 %. Overall, the relatively low levels of investment and with an overall R&D intensity of 1.18% of GPD (in 2016) will make it difficult for Ireland to reach its R&D intensity target of 2.5 % of GNP by 2020.
|
|
Greenhouse gas emissions, national target: Reduction of greenhouse gas emissions in sectors that are not covered by the Emission Trading System by 20 % in 2020 compared to 2005 levels
|
National projections indicate that cumulated emissions (on the basis of existing measures) over the 2013-2020 compliance period will exceed allocations by 13.7 million tons of CO2 equivalent and that emissions in 2020 will be only 3 % below 2005 levels, almost 17 percentage points short of the reduction target. This means that Ireland will need to buy allocations from other Member States in surplus in order to comply with the Effort Sharing Decision.
|
|
2020 renewable energy target: 16 % proportion of renewable energy in total gross energy consumption in 2020.
|
The share of renewable energy in 2016 is estimated to have reached 9.49 %. Ireland has achieved its 2015-2016 indicative interim target as set out in the Renewable Energy Directive. However, Ireland might need to step up its efforts to enable the achievement of the 2017-2018 11.5 % indicative interim target and the binding 2020 –target of 16·%.
|
|
Energy efficiency, 2020 energy consumption targets:
13.9 million tons of oil equivalent expressed in primary energy consumption (11.7 million tons of oil equivalent in final energy consumption).
|
Ireland increased its primary energy consumption by 4.6 % from 13.96 Mtoe in 2015 to 14.6 Mtoe in 2016. Final energy consumption also increased by 3.5% from 11.21 Mtoe in 2015 to 11.6 Mtoe in 2016. Ireland has to increase its efforts to reverse the increase of its primary energy consumption in order to achieve its primary energy target for 2020 (13.9 Mtoe). Ireland should also endeavour to keep its current final energy consumption level below its final energy target for 2020 (11.7 Mtoe).
|
|
Early school leaving (ESL) target: 8 %.
|
On early school leaving Ireland is continuously improving its performance, but disparities remain at local level. The share of early leavers fell to 6.3 % in 2016, well below the Europe 2020 national target of 8 % and the EU average of 10.7 %. Ireland has made important progress, effectively halving the rate since 2009. No major gap is visible between native- and foreign-born students. There is, however, a persistent gap between girls (4.6 %) and boys (7.8 %). The 2017 National Reform Programme highlights the renewed ‘Delivering equality of opportunity in schools’ (DEIS) initiative (DES, 2017a) in disadvantaged areas (see box 1 below). It also points to the need to improve retention rates in the most socioeconomically disadvantaged schools (Irish Government, 2017), which continue to lag considerably in 'educational outcomes' (Smyth et al., 2015). The proportion of 15- to 24-year-olds not in employment, education or training is 13.0 %, slightly above the EU average of 11.5 % in 2016.
|
|
Tertiary education target: 60 %.
|
Ireland ranks near the top of the EU on tertiary attainment and has an ambitious national target for 2020. Ireland ranks fourth in the EU in 2016 on tertiary attainment rates. The proportion of 30- to 34-year-olds with higher education was 52.9 % in 2016, well above the EU average of 39.1 % (see Figure 3). The national target for 2020 is 60 %, which is quite ambitious. There is a clear gender gap, with women (at 58.5 %) outperforming men (at 46.6 %). Interestingly, migrant students have a higher attainment rate (58.4 % in 2016) than native-born students (50.5 %). The employability of tertiary graduates is also improving. In 2016 the employment rate of recent graduates increased by 3.3 pp. from the previous year to reach 86.7 %, against the 82.8 % EU average. Irish students are very mobile in pursuing their studies, with a rate of 8.4 % for ISCED 5-8 students, up from 6.2 % in 2013. This is especially true at masters (16.9 % in 2015) and doctoral level (22.1 % in 2015).
|
|
To reduce the number experiencing consistent poverty to 4 % by 2016 (interim target) and to 2 % or less by 2020, from the 2008 baseline rate of 6.2 %, which will lift at least 200 000 people out of the risk of poverty and exclusion between 2012 and 2020 (revised target).
|
The number of people at risk of poverty or social exclusion decreased from 1.27 million in 2014 to 1.20 million in 2015. This remains significantly above the precrisis level of 1.05 million in 2008. Achieving the national target remains ambitious (the rate was 8.7 % in 2015) and requires additional action. Similarly, while the proportion of those in combined poverty fell from 37.4% in 2014 to 33.7% in 2015, there are now 1.6 million in combined poverty in Ireland, which is 150,000 higher than the 2008 baseline figure. This means Ireland must now lift 350,000 people out of combined poverty to meet this target, a significant challenge.
|
|
|
Annex B
Macroeconomic Imbalance Procedure Scoreboard
|
|
|
Table B.1:The MIP scoreboard for Ireland (AMR 2018)
|
|

|
|
Source: European Commission 2017, Statistical Annex to the Alert Mechanism Report 2018, SWD(2017) 661.
|
|
|
Annex C
Standard tables
|
|
|
Table C.1:Financial market indicators
|
|

|
|
Source: European Commission (long-term interest rates); World Bank (gross external debt); Eurostat (private debt); ECB (all other indicators).
|
|
|
|
|
|
Table C.2:Headline Social Scoreboard indicators
|
|
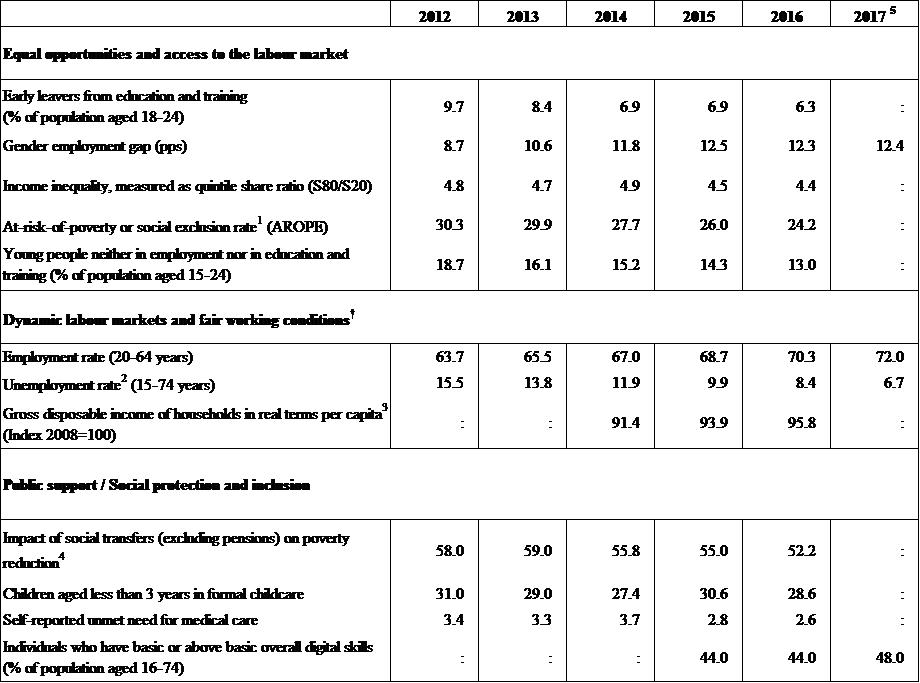
|
|
(5) Average of first three quarters of 2017 for the employment rate and gender employment gap.
Source: Eurostat
|
|
|
|
|
|
Table C.3:Labour market and education indicators
|
|

|
|
(5) Average of first three quarters of 2017, unless for the youth unemployment rate (annual figure).
Source: Eurostat, OECD
|
|
|
|
|
|
Table C.4:Social inclusion and health indicators
|
|

|
|
(6) Fixed broadband take up (33%), mobile broadband take up (22%), speed (33%) and affordability (11%), from the Digital Scoreboard.Source: Eurostat, OECD
|
|
|
|
|
|
Table C.5:Product market performance and policy indicators
|
|

|
|
Source: European Commission; World Bank — Doing Business (for enforcing contracts and time to start a business); OECD (for the product market regulation indicators); SAFE (for outcome of SMEs' applications for bank loans)."
|
|
|
|
|
|
Table C.6:Green growth
|
|

|
|
* European Commission and European Environment AgencySource: European Commission and European Environment Agency (Share of GHG emissions covered by ETS); European Commission (Environmental taxes over labour taxes and GDP); Eurostat (all other indicators)
|
|
|
References
Acheson J., Deli, Y. T., Lambert, D., Morgenroth, E. L. W. (2017), ‘Income Tax Revenue Elasticities in Ireland: An Analytical Approach’, Economic and Social Research Institute, Research Series, No 59, March 2017.
Arpaia, A. and Kiss, A. (2015), ‘Benchmarks for the assessment of wage developments’, European Commission, Directorate-General for Employment, Social Affairs and Inclusion, Analytical web note 2/2015.
Carroll, J. and McCann, F. (2017), ‘Observables and residuals: exploring cross-border differences in SME borrowing costs’, CBI, 2017.
Carroll, J. and McCann, F. (2017b), ‘SME collateral: risky borrowers or risky behaviour?’, CBI, 2017.
Central Bank of Ireland (CBI) (2017), ‘Residential Mortgage Arrears and Repossessions Statistics (Q2 2017)’. (
https://www.centralbank.ie/docs/default-source/statistics/data-and-analysis/credit-and-banking-statistics/mortgage-arrears/residential-mortgage-arrears-and-repossessions-statistics-june-2017.pdf?sfvrsn=7
)
CBI (2017a), ‘Update on examination of tracker mortgages, October 2017’ (
https://www.centralbank.ie/docs/default-source/consumer-hub-library/tracker-issues/update-on-tracker-examination.pdf?sfvrsn=5
)
CBI (2017b), ‘Irish Responses to the October 2017 Bank Lending Survey, October 2017’ (
https://www.centralbank.ie/docs/default-source/statistics/data-and-analysis/credit-and-banking-statistics/bank-lending-survey/comment-on-results-october-2017.pdf?sfvrsn=4
).
CBI (2017c), ‘Household credit market report H1 2017 (
https://www.centralbank.ie/news-media/press-releases/household-credit-market-report-for-h1-2017-released
)
CBI (2017d), ‘Household credit market report H2 2017 (
https://www.centralbank.ie/docs/default-source/publications/household-credit-market-report/household-credit-market-report-2017h2.pdf?sfvrsn=4
)
CBI (2017e), ‘Trends in Business Credit and Deposits: Q3, 2017’ (
https://www.centralbank.ie/statistics/data-and-analysis/credit-and-banking-statistics/business-credit-and-deposits
)
CBI (2017f), ‘SME Market Report H1 2017’.(
https://www.centralbank.ie/docs/default-source/publications/sme-market-reports/sme-market-report-2017h1.pdf?sfvrsn=6
)
Coffey, S. (2017), ‘Review of Ireland’s corporation tax code presented to the Minister for Finance and Public Expenditure and Reform by Mr Seamus Coffey’ (
http://www.finance.gov.ie/wp-content/uploads/2017/09/170912-Review-of-Irelands-Corporation-Tax-Code.pdf
)
Central Statistics Office (CSO) (2016), ‘Census 2016 Profile 5 - Homeless Persons in Ireland’
(
http://www.cso.ie/en/csolatestnews/presspages/2017/census2016profile5-homelesspersonsinireland/
)
CSO (2016a), ‘Redomiciled PLCs in the Irish Balance of Payments, October 2016’. (
http://www.cso.ie/en/media/csoie/methods/balanceofinternationalpayments/RedomiciledPLCs.pdf
)
CSO (2017), ‘Environmental subsidies and similar transfers 2015, online publication of recent data (
http://www.cso.ie/en/releasesandpublications/er/esst/environmentalsubsidiesandsimilartransfers2015/
)
CSO (2017a) ‘National Income and Expenditure Annual Results 2016’ -
http://www.cso.ie/en/releasesandpublications/er/nie/niear2016/
.
CSO (2017b) ‘National Balance Sheet for Ireland 2015’ - _at
http://www.cso.ie/en/releasesandpublications/ep/p-nbsi/nationalbalancesheetforireland2015/
, December 2017.
CSO (2017c), ‘Explaining Goods Exports and Imports 2012-2016’.
http://www.cso.ie/en/releasesandpublications/in/geid/explaininggoodsexportsandimports2012-2016/
CSO (2017d) ‘Quarterly National Household Survey, Second Quarter 2017’ (
http://pdf.cso.ie/www/pdf/20170922124340_Quarterly_National_Household_Survey_Quarter_2_2017_full.pdf
)
Cross Government Implementation Group (2017) ‘Innovation 2020 Second Progress Report. July 2017’ (
https://dbei.gov.ie/en/Publications/Publication-files/Innovation-2020-Second-Progress-Report.pdf
)
Department of Business, Enterprise and Innovation (DBEI) (2017) ‘Brexit — the view of Irish SMEs, January 2017’ (
https://dbei.gov.ie/en/Publications/Brexit-the-view-of-Irish-SMEs.html
) Department of Communications, Climate Action & Environment (2015) ‘White Paper on Energy: Ireland’s Transition to a Low Carbon Energy Future 2015-2030’. (
https://www.dccae.gov.ie/en-ie/energy/topics/Energy-Initiatives/energy-policy-framework/white-paper/Pages/White-Paper-on-Energy-Policy-in-Ireland-.aspx
)
Department of Communications, Climate Action & Environment (2017) ‘National Energy Efficiency Action Plan for Ireland #4 2017-2020’, (
http://www.dccae.gov.ie/documents/NEEAP%204.pdf (accessed September 2017
).
Department of Finance (2017), ‘Tax Strategy Group — TSG 17/08: Energy and environmental taxes’, Dublin (
http://www.finance.gov.ie/wp-content/uploads/2017/07/TSG-17-08-Environmental-Taxes-Paper-GK.pdf
)
Department of Finance (2017a), ‘Credit Demand Survey October 2016-March 2017’, June 2017.
Department of Finance (2017b), ‘Update on Ireland’s international tax strategy and consultation on Coffey review’, October 2017 (
http://www.budget.gov.ie/Budgets/2018/Documents/Update_International_Tax_Strategy_Consultation.pdf
Department of Finance (2017c), ‘UK and EU Exit: Trade Exposures of Sectors of the Irish Economy in a European Context’, September 2017.
Department of Finance (2017d), ‘Budget 2018: Economic and Fiscal Outlook’, October 2017.
Department of Finance (2017e), ‘Budget 2018: Expenditure Allocation’, October 2017.
Department of Finance, (2017f), ‘Budget 2018: Part II — Expenditure Allocations 2018-20’, October 2017.
Department of Housing Planning and Local Government (2017), ‘Ireland 2040. Our Plan. National Planning Framework’ (
http://npf.ie/draft-of-ireland-2040/
)
Department of Jobs, Enterprise and Innovation (DJEI) (2016). ‘Economic and Enterprise Impacts from Public Investment in R&D in Ireland, October 2016’. (
https://dbei.gov.ie/en/Publications/Publication-files/Economic-Enterprise-Impacts-Public-Investment-RD-Ireland.pdf
)
Department of Jobs, Enterprise and Innovation (DJEI) (2017). ‘Innovation 2020 - Second Progress report, July 2017’. (https://dbei.gov.ie/en/Publications/Innovation-2020-Progress-Reports.html)
Department of Public Expenditure DPER (2017), ‘Analysis of current expenditure on housing supports’ (
http://www.per.gov.ie/wp-content/uploads/Current-Expenditure-on-Housing-Supports.pdf
)
Department of Public Expenditure (DPER) (2017a), ‘Review of the Capital Investment Plan 2016-2017, Building on Recovery, Progress Report & Update on Public Investment Priorities’, August 2017
Di Ubaldo M., Lawless M. and Siedschlag I. (forthcoming). ‘Productivity Spillovers from Multinational Activity to Indigenous Firms in Ireland. Economic and Social Research Institute Working Paper forthcoming’.
Digital Economy Society Index (2017) (
https://ec.europa.eu/digital-single-market/en/desi
)
Duffy, D., Foley, D., McInerney, N. and McQuinn, K. (2016), ‘Demographic Change, Long-Run Housing Demand and the Related Challenges for the Irish Banking Sector’. The Economic and Social Research Institute (ESRI) (
https://www.esri.ie/pubs/CB201617.pdf
)
ECB/EC Survey on the Access to Finance of Enterprises (SAFE)’.
Economic and Social Research Institute (ESRI) (2017), ‘Quarterly Economic Commentary, Autumn 2017’.
Ecorys (2017), ‘Administrative formalities and costs involved in accessing markets cross-border for provisions of accountancy, engineering and architecture services, May 2017’. (
https://publications.europa.eu/en/publication-detail/-/publication/5c8a6c62-44e3-11e7-aea8-01aa75ed71a1
)
European Banking Authority, ‘Risk Dashboard, H1 2017’.
European Commission (2016), ‘2016 European Semester: Country Report — Ireland’.
European Commission (2017a), ‘Country Report Ireland 2017’, Commission Staff Working Document, 22 February 2017.
European Commission (2017b), ‘Digital Scoreboard 2017’ (
https://ec.europa.eu/digital-single-market/en/digital-scoreboard
)
European Commission (2017c), ‘EU Monitor of Macroeconomic Imbalances, 2017’.
European Commission (2017d), ‘European Innovation Scoreboard 2017’ (
http://ec.europa.eu/DocsRoom/documents/24829
)
European Commission (2017e), ‘Innovation Output Indicator’ (
https://rio.jrc.ec.europa.eu/en/stats/innovation-output-indicator
)
European Commission (2017f), ‘Labour market and wage developments in Europe 2017, Directorate-General for Employment, Social Affairs and Inclusion’.
European Commission (2018a) (Directorate-General for Economic and Financial Affairs) – Economic Policy Committee (Ageing Working Group), ‘2018 Ageing Report: Economic and Budgetary Projections for the EU Member States (2016-2070)’ (forthcoming)
European Commission (2018b), ‘Debt Sustainability Monitor 2017’
European Commission (2018c), ‘Post-Programme Surveillance Report, Ireland, Winter 2018, Institutional Paper XX/2018’.European Commission and the European Central Bank (2017) ‘SAFE’ (
https://www.ecb.europa.eu/stats/ecb_surveys/safe/html/index.en.html)
European Environment Agency (2016), ‘Report No 17/2016: Environmental taxation and EU environmental policies’, Publications Office of the European Union, Luxembourg (
https://www.eea.europa.eu/publications/environmental-taxation-and-eu-environmental-policies
)
European Environment Agency (2017), ‘Urban waste water treatment in 2016’, Johnstown Castle Estate, County Wexford, Ireland (
http://www.epa.ie/pubs/reports/water/wastewater/Urban%20waste%20water%20report%20for%202016 %20Final%20Version.pdf
)
European Investment Bank (2016), ‘EIB Group Survey on Investment and Investment Finance 2016. Country Overview: Ireland’.(http://www.eib.org/attachments/efs/eibis_2016_ireland_en.pdf)
European Investment Bank (2017), ‘EIB Investment Survey 2017 — Ireland overview, November 2017’ (
http://www.eib.org/infocentre/publications/all/econ-eibis-2017-ireland.htm
)
Higher Education Authority Statistics (
http://hea.ie/statistics/
)
Houses of the Oireachtas (2017), ‘Committee on the Future of Healthcare: Sláintecare Report’, (
https://www.oireachtas.ie/parliament/media/committees/futureofhealthcare/Oireachtas-Committee-on-the-Future-of-Healthcare-Slaintecare-Report-300517.pdf
)
Housing Agency (2018), Summary of Social Housing Assessments 2017 (
http://rebuildingireland.ie/install/wp-content/uploads/2018/01/SHA-Summary-2017-v5.pdf
)
IBF/PwC (2017), ‘IBF/PwC Mortgage Market Profile, Banking & Payments Federation of Ireland’.
Irish Fiscal Advisory Council (IFAC) (2017), ‘Pre-Budget 2018 Statement’ (
http://www.fiscalcouncil.ie/pre-budget-statements/pre-budget-2018-statement/
)
IHS (2018), ‘Aggressive Tax Planning indicators study, forthcoming in Taxation Papers’.
INRIX Research (2017), ‘INRIX Global Traffic Scorecard’ (
http://inrix.com/scorecard
)
Interdepartmental Committee on Science, Technology and Innovation (2015) ‘Innovation 2020, Ireland's strategy for research and development, science and technology’
International Monetary Fund (IMF) (2017), ‘Ireland: 2017 Article IV Consultation—Press Release; and Staff Report, June 2017’.
Irish Fiscal Advisory Council (IFAC) (2017), ‘Fiscal Assessment Report, November 2017’.
Irish National Organisation of the Unemployed (2017), ‘E-Bulletin October 2017’ (
https://www.inou.ie/newsandupdates/newsletter/2017/10/05/
)
Irish SME Association (2017), ‘Budget 2018 Scorecard. Press release’, October 2017.
Irish Tax Institute (2017). ‘IVCA Venture Pulse 2017: Funds raised by Irish SMEs (IVCA)’, Irish Venture Capital Association, 2017.
Irish Tax Institute (2017a). ‘A future tax strategy to grow Irish indigenous exports’.
Jenkinson, F., O’Callaghan, D., Reidy, P., Kane, F. and Prior, S. (2017), ‘Strategic Public Infrastructures Capacity and Demand Analysis’. Capital Section and DPER IGEES (Irish Government Economic and Evaluation Service) Unit, Department of Public Expenditure and Reform, August 2017.
Jordan, D., Fákó P. (2017), ‘RIO Country Report 2017: Ireland’.
Kinghan, C., Lyons, P., McCarthy, Y. and O’Toole, C. (2017), ‘Macroprudential Measures and Irish Mortgage Lending: An Overview of Lending in 2016’, CBI, 2016.
Lane, P. R. and Milesi-Ferretti, G.M. (2017), ‘International Financial Integration in the Aftermath of the Global Financial Crisis, IMF Working Paper WP/17/115’, May 2017.
Lawless, M. and. Morgenroth, E. L. W. (2017), ‘Ireland’s international trade and transport connections’, Economic and Social Research Institute, Working Paper No 573, October.
Levinsohn, J. and Petrin, A. (2003), ‘Estimating production functions using inputs to control for unobservables’, Review of Economic Studies, Vol.70, No 2, pp. 317-341.
Lyons, R. (2017), ‘How to Build Enough Homes’ (
http://www.ronanlyons.com/category/blog/propertymarket/
)
McCann, F. (2017), ‘Borrower-lender engagement during the Irish mortgage arrears crisis’, CBI, 2017.
McCann, F. (2017b), ‘Mortgage modification in Ireland: a recent history’, CBI, 2017.
McIndoe-Calder, T. (2017), ‘Debt giveth and debt taketh away: mortgage debt burdens in Ireland’, CBI, 2017.
Morgenroth, E. L. W. (2009), ‘Irish Public Capital Spending in a Recession, Economic and Social Research Institute’, Working Paper No 298, May 2009.
National Competitiveness Council (2016), ‘Ireland’s Competitiveness Challenge’, December 2016.
National Competitiveness Council (2017a), ‘Costs of Doing Business in Ireland’, July 2017.
National Competitiveness Council (2017b), ‘Ireland’s Competitiveness Scorecard’, July 2017.
National Competitiveness Council (2017c), ‘Ireland’s Competitiveness Challenge 2017’, December 2017.
OECD (2015) – ‘Education at a glance, 2015’, November 2015.
OECD (2016a), ‘PISA 2015 Results’ (http://www.oecd.org/education/pisa-2015-results-volume-i-9789264266490-en.htm)
OECD, (2016b), ‘PISA Low-Performing Students’ (http://www.oecd.org/edu/low-performing-students-9789264250246-en.htm)
OECD (2016c), ‘Education at a Glance’ ( http://www.oecd.org/edu/education-at-a-glance-19991487.htm)
OECD (2017a), ‘Governance at a Glance’ (
https://www.oecd.org/gov/government-at-a-glance-2017-executive-summary.pdf)
OECD (2017b), ‘FDI in Ireland’, Working Group on International Investment Statistics, October 2017.
OECD (2017c), ‘Entrepreneurship at a Glance’, Paris, October 2017.
OECD (2017d), ‘Ireland — Trade and Investment Statistical Note. International Trade, Foreign Direct Investment and Global Value Chains’, Paris.
OECD/European Observatory on Health Systems and Policies (2017), ‘Ireland: Country Health Profile 2017, State of Health in the EU’, OECD Publishing, Paris/European Observatory on Health Systems and Policies, Brussels (
http://dx.doi.org/10.1787/9789264283435-en
)
PwC & IHS (2017), ‘Effectiveness of tax incentives for venture capital and business angels. Final report’. Study commissioned by the European Commission.
Residential Tenancies Board (2017) ‘Rent Index. Quarter 3 2017’ (https://onestopshop.rtb.ie/images/uploads/Comms%20and%20Research/RTB_Rent_Index_2017_Q3_Final.pdf)
Schwab, K. ed. (2017), ‘The Global Competitiveness Report 2017-2018’. World Economic Forum, Geneva.
SHARES 2016 Eurostat, published provisional results. (http://ec.europa.eu/eurostat/web/energy/data/shares)
Siedschlag, I., Di Ubaldo, M. and Tong Koeclin, M. (2017), ‘Comparative Performance of Indigenous and Multinational Firms Operating in Ireland’, ESRI, 8 December 2017.
Siedschlag, I., Lawless, M. and Di Ubaldo, M. (2017) ‘The impact of business investment in knowledge based capital on productivity growth, a review of international and Irish evidence’.
SOLAS (2016), ‘National Skills Bulletin 2016’ (
http://www.skillsireland.ie/Publications/2016/National%20Skills%20Bulletin%202016.html
)
Sustainable Energy Authority of Ireland, ‘Better Energy Warmer Homes Scheme’ (
http://www.seai.ie/Grants/Warmer_Homes_Scheme/About_the_BEWH.html- accessed May 2017
).
Tax Strategy Group (2017), ‘The Tax and Fiscal Treatment of Rental Accommodation Providers’ (
http://www.finance.gov.ie/wp-content/uploads/2017/07/TSG-17-03-Tax-and-Fiscal-Treatment-of-Landlords-JC.pdf
)
The Courts Service (2016), ‘Courts Service Annual Report 2016’ (p. 71)
The World Bank (2017), ‘Doing Business. Measuring Business Regulations’ (
http://www.doingbusiness.org/
)
Watson, D., et al., (2017), 'A Social Portrait of Travellers in Ireland', by the ESRI (
http://www.esri.ie/pubs/RS56.pdf
)
-
(I)
() Public investment is defined as gross fixed capital formation + investment grants + national expenditure on agriculture and fisheries.


