

EUR-Lex Access to European Union law
This document is an excerpt from the EUR-Lex website
Document 52005XC1130(09)
Annual accounts for the financial year 2004 of the 6th, 7th, 8th and 9th European Development Funds
Annual accounts for the financial year 2004 of the 6th, 7th, 8th and 9th European Development Funds
Annual accounts for the financial year 2004 of the 6th, 7th, 8th and 9th European Development Funds
OJ C 303, 30.11.2005, p. 1–224
(ES, CS, DA, DE, ET, EL, EN, FR, IT, LV, LT, HU, MT, NL, PL, PT, SK, SL, FI, SV)
|
30.11.2005 |
EN |
Official Journal of the European Union |
C 303/1 |
ANNUAL ACCOUNTS FOR THE FINANCIAL YEAR 2004 OF THE 6TH, 7TH, 8TH AND 9TH EUROPEAN DEVELOPMENT FUNDS
(2005/C 303/01)
TABLE OF CONTENTS
|
1. |
Financial statements |
|
1.1. |
Accounting principles and valuation rules |
|
1.2. |
Consolidated balance sheet of the 6th, 7th, 8th and 9th EDFs |
|
1.3. |
6th European Development Fund |
|
1.4. |
7th European Development Fund |
|
1.5. |
8th European Development Fund |
|
1.6. |
9th European Development Fund |
|
1.7. |
Statement of sources and uses of funds for the 6th, 7th, 8th and 9th EDFs |
|
1.8. |
Notes to the accounts |
|
2. |
Report on financial implementation |
|
2.1. |
Appropriations at 31 December 2004 |
|
2.2. |
Consolidated accounts |
|
2.3. |
Situation by country and by instrument |
|
2.4. |
Other management information |
|
3. |
Financial information EIB |
|
3.1. |
Balance sheet as at 31 December 2004 |
|
3.2. |
Profit and loss account |
|
3.3. |
Notes to the financial statements as at 31 December 2004 |
|
4. |
Appendix — Situation by country and by instrument |
|
4.1. |
6th EDF |
|
4.2. |
7th EDF |
|
4.3. |
8th EDF |
|
4.4. |
9th EDF |
|
4.5. |
All EDFs |
1. FINANCIAL STATEMENTS
1.1. ACCOUNTING PRINCIPLES AND VALUATION RULES
1.1.1. FINANCIAL REGULATIONS
The balance sheets and income and expenditure accounts were drawn up in accordance with the Financial Regulations applicable to the 6th, 7th, 8th and 9th European Development Funds (EDFs).
The relevant documents must be presented to the Court of Auditors as provided for in Article 71 of the financial Regulation applicable to the 7th EDF, Articles 66, 67 and 68 of the Financial Regulation applicable to the 8th EDF and Articles 102 and 103 of the Financial Regulation applicable to the 9th EDF.
In accordance with the provisions of articles 99 and 135.3, full accrual based accounts will be prepared for the first time for the financial year 2005. Therefore the first set of accrual-based accounts will be sent to the institutions on 31st July 2006.
1.1.2. ACCOUNTING PRINCIPLES & STANDARDS
A. Principle of unit of account
EDF resources are established and implemented in euro and the accounts are presented in euro.
However, for the treasury management purposes referred to in Article 26 of the Financial Regulation applicable to the 9th EDF, the accounting officer may carry out operations in euro, in other currencies and in national currencies.
According to Article 100 of the Financial Regulation applicable to the 9th EDF, the financial statements are presented in millions of euro. Therefore, in these accounts amounts of less than € 4 999 are shown as 0,00, while zero amounts are show as -.
B. Principle of specification
The resources of the EDF are earmarked for specific purposes according to the main instruments of cooperation, as described in the Financial Protocol of the ACP-EC Agreement and the Overseas Association Decision.
C. Principle of sound financial management
EDF resources are used in accordance with the principles of sound financial management, that is to say, in accordance with the principles of economy, efficiency and effectiveness.
D. Principle of transparency
The resources of the EDF are established and implemented and the accounts presented in compliance with the principle of transparency.
E. Revenue
Financial contributions are paid by Member States (EUR 15) in euro. The Commission makes transfers from the Treasury accounts to operational accounts held in euro or a Member State's currency to meet the cash requirements of projects and programmes.
Member States' contributions to an EDF must be fully utilised before contributions relating to the following EDF are called in.
F. Expenditure
Expenditure takes into account all payment orders executed by the banks up to 31 December 2004. However, in the case of local expenditure in the ACP States and for those payments for which information was not communicated to the Commission's accounting departments before the end of the financial year, payments are based on the information received for the latest period prior to 31 December. The total amount of payments in question, which are not included in the 2004 accounts, are not considered to be material.
Expenditure by delegations is not finally entered in to the EDF accounts until validated by the authorising officer and the accounting officer. Expenditure not yet validated is shown under the heading ‘transactions to be finalised’.
G. Payment of account/advances
Payments on account (any amount paid on the basis of supporting documents pending final payment) and advances paid within the framework of the implementation of the contracts are included in the expenditure of the year and do not appear under assets in the balance sheet.
However, advances for study awards and advances for technical assistance are regarded as a receivable and consequently appear under assets in the balance sheet.
H. Recording of operations
EDF appropriations are not subject to any time limit. Once granted, they are available until they are used up or reassigned. The obligation to present a balance sheet of the EDF's assets and liabilities means that the entitlements due from the Member States (mainly contributions for which payment has been deferred or interest on late payment) must be entered in the accounts. These headings are contained in the balance sheets for the various EDFs.
In accordance with the principles of accrual-based accounting, the financial statements show the financial charges and income for the financial year regardless of the date of payment or collection, however, operational payments are at present still accounted for on a cash basis.
I. Other generally accepted accounting principles
The financial statements have been drawn up in accordance with generally accepted accounting principles, namely:
|
a) |
going concern basis; |
|
b) |
prudence; |
|
c) |
consistent accounting methods; |
|
d) |
comparability of information; |
|
e) |
materiality; |
|
f) |
no netting off; |
|
g) |
reality over appearance; |
|
h) |
accrual-based accounting. |
This last principle represents that expenditure and revenue had been registered according to the value date on the bank statement, except for operational payments which continue to be accounted for on a cash basis. In accordance with the provisions of articles 99 and 135.3, full accrual based accounts will be prepared for the first time for the financial year 2005. Therefore the first set of accrual-based accounts will be sent to the institutions on 31st July 2006.
1.1.3. VALUATION RULES
A. Revenue
Member States' contributions are paid in euros.
Other revenue is booked at the exchange rates applying on the date of receipt.
B. Expenditure
The rates used for the conversion into euros of payments made in local currencies for projects and programmes are those in force on the actual date of such payments. Certain contracts involve fixed exchange rates; this constitutes an exception to the general rule.
C. Bank transfers
Transfers from accounts held in euros to operational accounts held in local currencies are made at the rate of exchange in force on the date of such transfers.
D. Assigned funds
Assigned funds are converted into euros at the exchange rate in force at the time of booking and are entered in the accounts at their historical value.
E. Cash at bank
The rates used for converting cash at bank in national currencies into euros at 31 December 2004 are those of the European Central Bank as follows:
1 euro = 0,701 GBP
1.2. CONSOLIDATED BALANCE SHEET OF THE 6TH, 7TH, 8TH AND 9TH EDFs
Consolidated Balance Sheet of the 6th, 7th, 8th and 9th EDF at 31 December 2004
|
(million EUR) |
|||||
|
|
Notes |
2004 |
2003 |
||
|
ASSETS |
|||||
|
Long term assets |
|||||
|
Contributions |
|||||
|
Initial allocation |
1 |
|
40 390,15 |
|
40 035,15 |
|
EIB special contribution |
2 |
|
60,00 |
|
60,00 |
|
less: amounts called up |
3 |
|
- 23 240,00 |
|
- 20 820,00 |
|
|
|
|
17 210,15 |
|
19 275,15 |
|
Amounts called up |
3 |
23 240,00 |
|
20 820,00 |
|
|
less: payments received |
4 |
- 23 197,62 |
|
- 20 724,23 |
|
|
|
|
|
42,38 |
|
95,77 |
|
Stabex contributions |
|||||
|
Initial allocation |
|
1 800,00 |
|
1 800,00 |
|
|
less: amounts called up and received |
|
- 1 800,00 |
|
- 1 800,00 |
|
|
|
|
|
- |
|
- |
|
Net contributions receivable |
|
|
17 252,53 |
|
19 370,92 |
|
Current assets |
|||||
|
Debtors |
5 |
|
25,79 |
|
26,27 |
|
Short-term investments |
6 |
|
- |
|
3,15 |
|
Deferred expenditure |
7 |
|
537,00 |
|
427,82 |
|
Cash at bank |
8 |
|
798,88 |
|
526,16 |
|
Total assets |
|
|
18 614,20 |
|
20 354,32 |
|
LIABILITIES |
|||||
|
Fund capital |
|||||
|
Contributions |
1 |
|
40 390,15 |
|
40 035,15 |
|
EIB special contribution |
2 |
|
60,00 |
|
60,00 |
|
Stabex contributions |
|
|
1 800,00 |
|
1 800,00 |
|
|
|
|
42 250,15 |
|
41 895,15 |
|
Total inter-fund transfers |
9 |
|
848,74 |
|
848,74 |
|
|
|
|
43 098,89 |
|
42 743,89 |
|
Capitalised income |
10 |
|
704,68 |
|
689,00 |
|
Total Fund capital |
|
|
43 803,57 |
|
43 432,89 |
|
Other sources of funds |
|||||
|
Payments |
11 |
|
- 25 918,06 |
|
- 23 504,12 |
|
Recoveries |
5 |
|
18,18 |
|
9,76 |
|
Transactions to be finalised |
12 |
|
- 6,87 |
|
- 10,80 |
|
Doubtful debt provisions |
8 |
|
- 0,02 |
|
- 2,75 |
|
Creditors |
13 |
|
717,40 |
|
429,35 |
|
Total liabilities |
|
|
18 614,20 |
|
20 354,32 |
Consolidated Income & Expenditure Account of the 6th, 7th, 8th and 9th EDFs for the year ended 31 December 2004
|
(million EUR) |
||||
|
|
Notes |
Balance at 1.1.2004 |
I&E for the year ended 31.12.2004 |
Balance at 31.12.2004 |
|
Capitalised interest |
5, 10 |
35,45 |
1,80 |
37,25 |
|
European bank interest |
5, 10 |
25,42 |
1,51 |
26,92 |
|
Stabex interest |
5, 10 |
322,52 |
- 2,63 |
319,89 |
|
Stabex interest — security accounts |
5, 10 |
25,10 |
9,63 |
34,73 |
|
Interest on late contributions Stabex |
5, 10 |
1,86 |
- |
1,86 |
|
EIB interest |
5, 10 |
3,51 |
0,02 |
3,53 |
|
Interest on late contributions |
5, 10 |
6,23 |
0,71 |
6,94 |
|
Interest on Congo special Fund |
5, 10 |
- |
1,92 |
1,92 |
|
Inter EDF transfers |
9 |
848,74 |
- |
848,74 |
|
Transfer on closing |
8 |
- |
- |
- |
|
Total income |
|
1 268,83 |
12,95 |
1 281,78 |
|
Programmable aid |
|
11 689,43 |
1 029,88 |
12 719,31 |
|
Macro-economic support |
|
248,87 |
380,18 |
629,06 |
|
Regional programs |
|
61,60 |
12,12 |
73,72 |
|
Interest-rate subsidies |
|
341,92 |
9,62 |
351,54 |
|
Emergency aid |
|
718,13 |
2,03 |
720,16 |
|
Refugee aid |
|
235,96 |
26,55 |
262,51 |
|
Aids Fund |
|
2,53 |
- |
2,53 |
|
Risk Capital |
|
1 993,82 |
143,28 |
2 137,10 |
|
STABEX |
|
3 403,59 |
7,29 |
3 410,87 |
|
Sysmin |
|
535,84 |
27,22 |
563,06 |
|
Rehabilitation Programmes |
|
380,42 |
10,42 |
390,84 |
|
Structural adjustment |
|
2 543,85 |
89,68 |
2 633,54 |
|
Debt relief |
|
720,00 |
100,00 |
820,00 |
|
Payments world bank |
|
380,00 |
- |
380,00 |
|
Sectoral policy |
|
18,89 |
277,77 |
296,65 |
|
Humanitarian Aid |
|
37,56 |
118,77 |
156,33 |
|
Compensation export receipts |
|
- |
20,67 |
20,67 |
|
Centre for the development of enterprise |
|
- |
14,64 |
14,64 |
|
Centre for the development of agriculture |
|
- |
12,46 |
12,46 |
|
General Assembly |
|
- |
0,63 |
0,63 |
|
Special operations |
|
- |
- |
- |
|
Technical assistance |
|
0,25 |
0,06 |
0,32 |
|
Social sectors |
|
170,00 |
5,55 |
175,55 |
|
Methodological and developmental support |
|
- |
5,74 |
5,74 |
|
Natural resources |
|
0,35 |
0,07 |
0,42 |
|
Private sector |
|
- |
1,18 |
1,18 |
|
Peace building and conflict prevention |
|
- |
39,48 |
39,48 |
|
Miscellaneous |
|
- |
6,87 |
6,87 |
|
Congo Fund |
|
- |
0,09 |
0,09 |
|
Transactions awaiting finalisation |
12 |
22,73 |
- 11,62 |
11,11 |
|
Operational expenditure |
14 |
23 505,75 |
2 330,63 |
25 836,39 |
|
Implementation expenses |
15 |
0,00 |
55,08 |
55,09 |
|
Costs linked to devolution |
15 |
13,48 |
16,44 |
29,92 |
|
Administrative and financial costs |
15 |
7,62 |
0,16 |
7,78 |
|
Provision for loss on short term investment |
6 |
3,15 |
- 3,15 |
- |
|
Provision for doubtful debts |
8.6 |
2,75 |
- 2,74 |
0,02 |
|
Provision for bank charges |
13.2 |
0,10 |
- 0,05 |
0,05 |
|
|
|
27,10 |
65,75 |
92,85 |
|
Excess of expenditure over income |
|
- 22 264,02 |
- 2 383,43 |
- 24 647,45 |
1.3. 6TH EUROPEAN DEVELOPMENT FUND
6th EDF Balance Sheet at 31 December 2004
|
(million EUR) |
|||||
|
|
Notes |
2004 |
2003 |
||
|
ASSETS |
|||||
|
Long term assets |
|||||
|
Contributions |
|||||
|
Initial allocation |
1 |
|
7 500,00 |
|
7 500,00 |
|
EIB special contribution |
2 |
|
60,00 |
|
60,00 |
|
less: amounts called up |
3 |
|
- 7 560,00 |
|
- 7 560,00 |
|
|
|
|
- |
|
- |
|
Amounts called up |
3 |
|
7 560,00 |
|
7 560,00 |
|
less: payments received |
4 |
- 7 560,00 |
|
- 7 560,00 |
|
|
|
|
|
- |
|
- |
|
Stabex contributions |
|||||
|
Initial allocation |
|
- |
|
- |
|
|
less: amounts called up and received |
|
- |
|
- |
|
|
|
|
|
- |
|
- |
|
Net contributions receivable |
|
|
- |
|
- |
|
Current assets |
|||||
|
Debtors |
5 |
|
9,77 |
|
16,49 |
|
Short-term investments |
6 |
|
- |
|
- |
|
Deferred expenditure |
7 |
|
- |
|
- |
|
Liaison accounts |
8 |
|
2 395,42 |
|
2 446,01 |
|
Cash at bank |
8 |
|
- |
|
- |
|
Total assets |
|
|
2 405,19 |
|
2 462,51 |
|
LIABILITIES |
|||||
|
Fund capital |
|||||
|
Contributions |
1 |
|
7 500,00 |
|
7 500,00 |
|
EIB special contribution |
2 |
|
60,00 |
|
60,00 |
|
Stabex contributions |
|
|
- |
|
- |
|
|
|
|
7 560,00 |
|
7 560,00 |
|
Total inter-fund transfers |
9 |
|
- 343,53 |
|
- 311,29 |
|
|
|
|
7 216,47 |
|
7 248,71 |
|
Capitalised income |
10 |
|
222,88 |
|
222,88 |
|
Total Fund capital |
|
|
7 439,35 |
|
7 471,59 |
|
Other sources of funds |
|||||
|
Payments |
11 |
|
- 7 312,16 |
|
- 7 282,16 |
|
Recoveries |
5 |
|
5,54 |
|
4,58 |
|
Transactions to be finalised |
12 |
|
- 6,84 |
|
- 10,80 |
|
Doubtful debt provisions |
8 |
|
- |
|
- |
|
Creditors |
13 |
|
- |
|
- |
|
Liaison accounts |
8 |
|
2 279,31 |
|
2 279,31 |
|
Total liabilities |
|
|
2 405,19 |
|
2 462,51 |
6th EDF Income & Expenditure Account for the year ended 31 December 2004
|
(million EUR) |
||||
|
|
Notes |
Balance at 1.1.2004 |
I&E for the year ended 31.12.2004 |
Balance at 31.12.2004 |
|
Inter EDF transfers |
9 |
- 311,29 |
- 32,24 |
- 343,53 |
|
Transfer on closing |
8 |
- 166,70 |
50,59 |
- 116,11 |
|
Total income |
|
- 478,00 |
18,35 |
- 459,65 |
|
Programmable aid |
|
4 696,06 |
27,20 |
4 723,25 |
|
Regional programs |
|
10,00 |
- |
10,00 |
|
Interest-rate subsidies |
|
84,02 |
- |
84,02 |
|
Emergency aid |
|
179,90 |
- |
179,90 |
|
Refugee aid |
|
94,72 |
- |
94,72 |
|
Aids Fund |
|
2,53 |
- |
2,53 |
|
Risk Capital |
|
537,21 |
2,28 |
539,49 |
|
Stabex |
|
1 451,12 |
- |
1 451,12 |
|
Sysmin |
|
128,11 |
0,04 |
128,15 |
|
Rehabilitation Programmes |
|
85,53 |
0,33 |
85,86 |
|
Structural adjustment |
|
5,33 |
- |
5,33 |
|
|
|
7 274,54 |
29,84 |
7 304,38 |
|
Transactions awaiting finalisation |
|
22,73 |
- 11,65 |
11,08 |
|
Total operational expenditure |
14 |
7 297,27 |
18,19 |
7 315,46 |
|
Administrative and financial costs |
15 |
7,62 |
0,16 |
7,78 |
|
Excess of expenditure over income |
|
- 7 782,88 |
0,16 |
- 7 775,10 |
1.4. 7TH EUROPEAN DEVELOPMENT FUND
7th EDF Balance Sheet at 31 December 2004
|
(million EUR) |
|||||
|
|
Notes |
2004 |
2003 |
||
|
ASSETS |
|||||
|
Long term assets |
|||||
|
Contributions |
|||||
|
Initial allocation |
1 |
|
10 940,00 |
|
10 940,00 |
|
EIB special contribution |
2 |
|
- |
|
- |
|
less: amounts called up |
3 |
|
- 10 940,00 |
|
- 10 940,00 |
|
|
|
- |
|
- |
|
|
Amounts called up |
3 |
10 940,00 |
|
10 940,00 |
|
|
less: payments received |
4 |
- 10 940,00 |
|
- 10 940,00 |
|
|
|
|
|
- |
|
- |
|
Stabex contributions |
|||||
|
Initial allocation |
|
- |
|
- |
|
|
less: amounts called up and received |
|
- |
|
- |
|
|
|
|
|
- |
|
- |
|
Net contributions receivable |
|
|
- |
|
- |
|
Current assets |
|||||
|
Debtors |
5 |
|
8,00 |
|
4,06 |
|
Short-term investments |
6 |
|
- |
|
- |
|
Deferred expenditure (STABEX) |
7 |
|
9,03 |
|
9,53 |
|
Liaison accounts |
|
|
2 279,31 |
|
2 279,31 |
|
Cash at bank |
8 |
|
- |
|
- |
|
Total assets |
|
|
2 296,34 |
|
2 292,89 |
|
LIABILITIES |
|||||
|
Fund capital |
|||||
|
Contributions |
1 |
|
10 940,00 |
|
10 940,00 |
|
EIB special contribution |
2 |
|
- |
|
- |
|
Stabex contributions |
|
|
- |
|
- |
|
|
|
|
10 940,00 |
|
10 940,00 |
|
Total inter-fund transfers |
9 |
|
- 473,06 |
|
- 420,58 |
|
|
|
|
10 466,94 |
|
10 519,42 |
|
Capitalised income |
10 |
|
400,74 |
|
406,68 |
|
Total Fund capital |
|
|
10 867,68 |
|
10 926,10 |
|
Other sources of funds |
|||||
|
Payments |
11 |
|
- 9 849,57 |
|
- 9 605,10 |
|
Recoveries |
5 |
|
8,00 |
|
4,06 |
|
Transactions to be finalised |
12 |
|
- |
|
- |
|
Doubtful debt provisions |
8 |
|
- |
|
- |
|
Creditors |
13 |
|
9,03 |
|
- |
|
liaison accounts |
|
|
1 261,20 |
|
967,84 |
|
Total liabilities |
|
|
2 296,34 |
|
2 292,89 |
7th EDF Income & Expenditure Account for the year ended 31 December 2004
|
(million EUR) |
||||
|
|
Notes |
Balance at 1.1.2004 |
I&E for the year ended 31.12.2004 |
Balance at 31.12.2004 |
|
Stabex Interest |
5, 10 |
312,46 |
- |
312,46 |
|
European bank interest |
5, 10 |
22,47 |
- |
22,47 |
|
EIB interest |
5, 10 |
3,41 |
- |
3,41 |
|
Interest late contributions |
5, 10 |
6,21 |
- |
6,21 |
|
Inter EDF transfers |
9 |
- 420,34 |
- 52,72 |
- 473,06 |
|
Transfer on closing |
8 |
- 1 311,47 |
293,36 |
- 1 018,11 |
|
Total income |
|
- 1 387,25 |
240,64 |
- 1 146,61 |
|
Programmable aid |
|
4 702,40 |
203,06 |
4 905,47 |
|
Regional programs |
|
50,00 |
- |
50,00 |
|
Interest-rate subsidies |
|
201,99 |
0,67 |
202,66 |
|
Emergency aid |
|
405,81 |
- 0,42 |
405,39 |
|
Refugee aid |
|
84,47 |
0,04 |
84,51 |
|
Risk Capital |
|
764,56 |
10,07 |
774,64 |
|
Stabex |
|
1 589,33 |
0,50 |
1 589,83 |
|
Sysmin |
|
323,21 |
20,33 |
343,54 |
|
Rehabilitation programmes |
|
294,89 |
10,09 |
304,98 |
|
Structural adjustment |
|
1 148,43 |
0,12 |
1 148,54 |
|
Debt relief |
|
40,00 |
- |
40,00 |
|
Total operational expenditure |
14 |
9 605,10 |
244,47 |
9 849,57 |
|
Excess of expenditure over income |
|
- 10 992,36 |
- 3,82 |
- 10 996,18 |
1.5. 8TH EUROPEAN DEVELOPMENT FUND
8th EDF Balance Sheet at 31 December 2004
|
(million EUR) |
|||||
|
|
Notes |
2004 |
2003 |
||
|
ASSETS |
|||||
|
Long term assets |
|||||
|
Contributions |
|||||
|
Initial allocation |
1 |
|
11 040,00 |
|
11 040,00 |
|
EIB special contribution |
2 |
|
- |
|
- |
|
less: amounts called up |
3 |
|
- 4 635,00 |
|
- 2 320,00 |
|
|
|
|
6 405,00 |
|
8 720,00 |
|
Amounts called up |
3 |
4 635,00 |
|
2 320,00 |
|
|
less: payments received |
4 |
- 4 592,62 |
|
- 2 224,23 |
|
|
|
|
|
42,38 |
|
95,77 |
|
Stabex contributions |
|||||
|
Initial allocation |
|
1 800,00 |
|
1 800,00 |
|
|
less: amounts called up and received |
|
- 1 800,00 |
|
- 1 800,00 |
|
|
|
|
|
- |
|
- |
|
Net contributions receivable |
|
|
6 447,38 |
|
8 815,77 |
|
Current assets |
|||||
|
Debtors |
5 |
|
3,71 |
|
1,13 |
|
Short-term investments |
6 |
|
- |
|
- |
|
Deferred expenditure (STABEX) |
7 |
|
421,14 |
|
418,30 |
|
Liaison accounts |
8 |
|
- |
|
- |
|
Cash at bank |
8 |
|
- |
|
- |
|
Total assets |
|
|
6 872,23 |
|
9 235,19 |
|
LIABILITIES |
|||||
|
Fund capital |
|||||
|
Contributions |
1 |
|
11 040,00 |
|
11 040,00 |
|
EIB special contribution |
2 |
|
- |
|
- |
|
Stabex contributions |
|
|
1 800,00 |
|
1 800,00 |
|
|
|
|
12 840,00 |
|
12 840,00 |
|
Total inter-fund transfers |
9 |
|
- 1 319,54 |
|
- 1 112,55 |
|
|
|
|
11 520,46 |
|
11 727,45 |
|
Capitalised income |
10 |
|
72,04 |
|
62,41 |
|
Total Fund capital |
|
|
11 592,50 |
|
11 789,86 |
|
Other sources of funds |
|||||
|
Payments |
11 |
|
- 7 531,11 |
|
- 6 339,20 |
|
Recoveries |
5 |
|
3,71 |
|
1,13 |
|
Transactions to be finalised |
12 |
|
- |
|
- |
|
Doubtful debt provisions |
8 |
|
- |
|
- |
|
Creditors |
13 |
|
421,14 |
|
427,82 |
|
Liaison accounts |
8 |
|
2 385,99 |
|
3 355,58 |
|
Total liabilities |
|
|
6 872,23 |
|
9 235,19 |
8th EDF Income & Expenditure Account for the year ended 31 December 2004
|
(million EUR) |
||||
|
|
Notes |
Balance at 1.1.2004 |
Income & Expenditure for the year ended 31.12.2004 |
Balance at 31.12.2004 |
|
Interest on late contributions Stabex |
5, 10 |
1,86 |
- |
1,86 |
|
Stabex interest — security accounts |
5, 10 |
25,10 |
9,63 |
34,73 |
|
Capitalised EU banks interest |
5, 10 |
35,45 |
- |
35,45 |
|
Inter EDF transfers |
9 |
- 1 112,55 |
- 207,00 |
- 1 319,54 |
|
Transfer on closing |
8 |
3 355,58 |
- 969,59 |
2 385,99 |
|
Total income |
|
2 305,44 |
- 1 166,95 |
1 138,49 |
|
Programmable aid |
|
2 290,97 |
799,62 |
3 090,59 |
|
Macro-economic support |
|
199,87 |
103,81 |
303,69 |
|
Interest-rate subsidies |
|
55,91 |
8,94 |
64,85 |
|
Emergency aid |
|
132,41 |
2,45 |
134,87 |
|
Aid to refugees |
|
56,77 |
26,51 |
83,28 |
|
Risk capital |
|
692,04 |
130,93 |
822,98 |
|
STABEX |
|
363,13 |
6,79 |
369,92 |
|
Sysmin |
|
84,52 |
6,84 |
91,36 |
|
Structural adjustment |
|
1 390,09 |
89,57 |
1 479,66 |
|
Payments world bank |
|
380,00 |
- |
380,00 |
|
Payments HIPC |
|
680,00 |
- |
680,00 |
|
Total operational expenditure |
14 |
6 325,73 |
1 175,46 |
7 501,19 |
|
Costs linked to devolution |
15 |
13,48 |
16,44 |
29,92 |
|
Excess of expenditure over income |
|
- 4 033,76 |
- 2 358,86 |
- 6 392,62 |
1.6. 9TH EUROPEAN DEVELOPMENT FUND
9th EDF Balance Sheet at 31 December 2004
|
(million EUR) |
|||||
|
|
Notes |
2004 |
2003 |
||
|
ASSETS |
|||||
|
Long term assets |
|||||
|
Contributions |
|||||
|
Initial allocation |
1 |
|
10 910,15 |
|
10 555,15 |
|
EIB special contribution |
2 |
|
- |
|
- |
|
less: amounts called up |
3 |
|
- 105,00 |
|
- |
|
|
|
|
10 805,15 |
|
|
|
Amounts called up |
3 |
105,00 |
|
- |
|
|
less: payments received |
4 |
- 105,00 |
- |
- |
- |
|
Stabex contributions |
|||||
|
Initial allocation |
|
- |
|
- |
|
|
less: amounts called up and received |
|
- |
|
- |
|
|
|
|
- |
|
- |
|
|
Net contributions receivable |
|
|
10 805,15 |
|
10 555,15 |
|
Current assets |
|||||
|
Debtors |
5 |
|
4,31 |
|
4,58 |
|
Short-term investments |
6 |
|
- |
|
3,15 |
|
Deferred expenditure (CONGO) |
7 |
|
106,83 |
|
- |
|
Liaison accounts |
|
|
1 581,74 |
|
2 257,96 |
|
Cash at bank |
8 |
|
798,88 |
|
526,16 |
|
Total assets |
|
13 296,91 |
|
13 347,01 |
|
|
LIABILITIES |
|||||
|
Fund capital |
|||||
|
Contributions |
1 |
|
10 910,15 |
|
10 555,15 |
|
EIB special contribution |
2 |
|
- |
|
- |
|
Stabex contributions |
|
|
- |
|
- |
|
|
|
|
10 910,15 |
|
10 555,15 |
|
Total inter-fund transfers |
9 |
|
2 984,87 |
|
2 693,15 |
|
|
|
|
13 895,02 |
|
13 248,30 |
|
Capitalised income |
10 |
|
9,02 |
|
- 2,97 |
|
Total Fund capital |
|
|
13 904,04 |
|
13 245,33 |
|
Other sources of funds |
|||||
|
Payments |
11 |
|
- 1 225,22 |
|
- 277,66 |
|
Recoveries |
5 |
|
0,93 |
|
- |
|
Transactions to be finalised |
12 |
|
- 0,03 |
|
- |
|
Doubtful debt provisions |
8 |
|
- 0,02 |
|
- 2,75 |
|
Creditors |
13 |
|
287,24 |
|
1,53 |
|
Liaison accounts |
|
|
329,96 |
|
380,56 |
|
Total liabilities |
|
|
13 296,91 |
|
13 347,01 |
9th EDF Income & Expenditure Account for the year ended 31 December 2004
|
(million EUR) |
||||
|
|
Notes |
Balance at 1.1.2004 |
I&E for the year ended 31.12.2004 |
Balance at 31.12.2004 |
|
Capitalised interest |
5, 10 |
- |
1,80 |
1,80 |
|
European bank interest |
5, 10 |
2,94 |
1,51 |
4,45 |
|
Stabex interest |
5, 10 |
10,06 |
- 2,63 |
7,43 |
|
EIB interest |
5, 10 |
0,10 |
0,02 |
0,12 |
|
Interest on late contributions |
5, 10 |
0,02 |
0,71 |
0,73 |
|
Interest on Congo special Fund |
5, 10 |
- |
1,92 |
1,92 |
|
Inter EDF transfers |
9 |
2 692,91 |
291,96 |
2 984,87 |
|
Transfer on closing |
8 |
- 1 877,40 |
625,63 |
- 1 251,77 |
|
Total income |
|
828,63 |
295,28 |
3 001,32 |
|
Macro-economic support |
|
49,00 |
276,37 |
325,37 |
|
Sectoral policy |
|
18,89 |
277,77 |
296,65 |
|
Humanitarian Aid |
|
37,56 |
118,77 |
156,33 |
|
Compensation export receipts |
|
- |
20,67 |
20,67 |
|
Centre for the development of enterprise |
|
- |
14,64 |
14,64 |
|
Centre for the development of agriculture |
|
- |
12,46 |
12,46 |
|
General Assembly |
|
- |
0,63 |
0,63 |
|
Special operations |
|
- |
- |
- |
|
Technical assistance |
|
0,25 |
0,06 |
0,32 |
|
Regional indicative programs |
|
1,60 |
12,12 |
13,72 |
|
Social sectors |
|
170,00 |
5,55 |
175,55 |
|
Methodological and developmental support |
|
- |
5,74 |
5,74 |
|
Natural resources |
|
0,35 |
0,07 |
0,42 |
|
Private sector |
|
- |
1,18 |
1,18 |
|
Peace building and conflict prevention |
|
- |
39,48 |
39,48 |
|
Miscellaneous |
|
- |
6,87 |
6,87 |
|
Debt relief (HIPC) |
|
- |
100,00 |
100,00 |
|
Congo Fund |
|
- |
0,09 |
0,09 |
|
|
|
277,66 |
892,48 |
1 170,13 |
|
Transactions awaiting finalisation |
|
- |
0,03 |
0,03 |
|
Total operational expenditure |
14 |
277,66 |
892,51 |
1 170,16 |
|
Implementation expenses |
15 |
- |
55,08 |
55,09 |
|
Provision for loss on short term investment |
6 |
3,15 |
- 3,15 |
- |
|
Provision for doubtful debts |
8 |
2,75 |
- 3,15 |
0,02 |
|
Provision for bank charges |
13,2 |
0,10 |
- 0,05 |
0,05 |
|
Excess of expenditure over income |
|
544,97 |
- 646,37 |
1 776,00 |
1.7. STATEMENT OF SOURCES AND USES OF FUNDS FOR THE 6TH, 7TH, 8TH AND 9TH EDFs
|
(million EUR) |
||
|
|
|
|
|
Treasury, ACP paying agents and EUR paying agents |
||
|
Treasury balance (excluding Stabex) at 1.1.2004 |
|
82,27 |
|
Contributions from Member States |
2 652,32 |
2 547,32 |
|
Interest paid on late contributions |
1,33 |
|
|
Interest |
5,24 |
|
|
Decrease in transactions awaiting finalisation |
3,96 |
|
|
Decrease in provision for doubtful debts |
2,74 |
|
|
Decrease in advances |
7,69 |
|
|
Total sources |
|
2 673,27 |
|
Operational payments |
2 406,41 |
|
|
Total uses |
|
2 406,41 |
|
Treasury balance (excluding Stabex) at 31.12.2004 |
|
349,13 |
|
Stabex current account |
||
|
Stabex current account balance at 1.1.2004 |
|
22,20 |
|
Interest receipts |
0,39 |
|
|
Receipts on investment sales |
3,15 |
|
|
Total sources |
|
3,54 |
|
Decrease in portfolio value |
6,12 |
|
|
Transfer to security accounts |
- |
|
|
Portfolio management costs |
0,02 |
|
|
Transfer to European bank accounts |
- |
|
|
Total uses |
|
6,14 |
|
Stabex current account balance at 31.12.2004 |
|
19,59 |
|
Stabex security accounts |
||
|
Stabex security accounts balance at 1.1.2004 |
|
427,82 |
|
Transfers from Stabex current account |
- |
|
|
Interest received |
9,63 |
|
|
Total sources |
|
9,63 |
|
Stabex payments |
7,29 |
|
|
Total uses |
|
7,29 |
|
Stabex security accounts balance at 31.12.2004 |
|
430,17 |
1.8. NOTES TO THE ACCOUNTS
1) Initial allocation
|
(million EUR) |
|||||
|
Initial allocation |
6th EDF |
7th EDF |
8th EDF |
9th EDF |
Total |
|
Total 2003 |
7 500,00 |
10 940,00 |
11 040,00 |
10 555,15 |
40 035,15 |
|
2004 |
|
|
|
|
|
|
conditional billion |
|
|
|
250,00 |
250,00 |
|
Congo Fund |
|
|
|
105,00 |
105,00 |
|
Total 2004 |
7 500,00 |
10 940,00 |
11 040,00 |
10 910,15 |
40 390,15 |
This represents the total amount receivable from the Member States for the relevant EDF fund as laid down in the internal agreement between the Member States and the beneficiary African, Caribbean and Pacific (ACP) States and the Overseas Countries and Territories (OCT).
The initial allocation for the (current) 9th EDF, which originally totalled 10 555,15 million Euro, has since been increased by an amount of 105 million Euro, which was released by the EIB in accordance with the provisions of Council Decision 2003/583/EC. This additional allocation is in favour of actions to be undertaken in the Democratic Republic of the Congo.
A further 250 million Euro was taken from the 1 000 million Euro reserve (Article 2(2) of the Internal Agreement for the 9th EDF) following the adoption of Council Decision 2004/289/CE in order to establish a water facility.
2) EIB special contribution
The Special EIB contribution provided for by Council Decision 87/592/EEC of 14 December 1987 has been used to finance the special programme for highly indebted countries.
3) Contributions called up
|
(million EUR) |
|||||
|
Contributions called up |
6th EDF |
7th EDF |
8th EDF |
9th EDF |
Total |
|
Total 2003 |
7 560,00 |
10 940,00 |
2 320,00 |
- |
20 820,00 |
|
2004 |
|
|
|
|
|
|
Member states |
|
|
2 215,00 |
|
2 215,00 |
|
BEI |
|
|
100,00 |
105,00 |
205,00 |
|
Total 2004 |
7 560,00 |
10 940,00 |
4 635,00 |
105,00 |
23 240,00 |
This represents the amount of the initial allocations which has been called up for transfer to the treasury accounts by the Member States in accordance with the procedure in Article 8 of the Financial Regulation, whereby each year the Commission must establish and communicate to the Council a statement of the payments to be made in the following year and a schedule of calls for contributions. The Commission must justify the amount requested on the basis of its capacity to deliver the proposed level of resources effectively.
Contributions are still being called up from the 8th EDF, with the sole exception of the 105 million Euro in favour of the Democratic Republic of the Congo called in from the 9th Fund.
In an extraordinary meeting of the ACP Working Group at Council on 26 October 2004, Member States unanimously agreed that the EIB should transfer an amount of 100 million Euro from its EDF treasury to the Commission’s EDF treasury, with a consequent reduction of the overall amount of the contributions from Member States.
4) Contributions received
|
(million EUR) |
|||||
|
Contributions received |
6th EDF |
7th EDF |
8th EDF |
9th EDF |
Total |
|
Total 2003 |
7 560,00 |
10 940,00 |
2 224,23 |
- |
20 724,23 |
|
2004 |
|
|
|
|
|
|
Member states |
|
|
2 268,39 |
|
2 268,39 |
|
BEI |
|
|
100,00 |
105,00 |
205,00 |
|
Total 2004 |
7 560,00 |
10 940,00 |
4 592,62 |
105,00 |
23 197,62 |
Details of contributions called up and received during the year 2004 are shown in table 1. The EIB contribution is the sum of the Special Congo Contribution (see notes 1 and 3) and the 100 million Euro transfer referred to in note 3 above.
Table 1
Contributions called up and received for the year ended 31 December 2004
|
(million EUR) |
||||||||
|
|
% |
Called up in 2003 |
Received in 2003 |
Outstanding at 31.12.2003 |
Called up in 2004 |
Received in 2004 |
Outstanding at 31.12.2004 |
Total called up |
|
Austria |
2,65 |
56,18 |
56,18 |
- |
58,70 |
58,70 |
- |
120,18 |
|
Belgium |
3,92 |
83,10 |
83,10 |
- |
86,83 |
86,83 |
- |
177,77 |
|
Denmark |
2,14 |
45,37 |
45,37 |
- |
47,40 |
47,40 |
- |
97,05 |
|
Finland |
1,48 |
31,38 |
31,38 |
- |
32,78 |
32,78 |
- |
67,12 |
|
France |
24,30 |
515,16 |
434,25 |
80,91 |
538,25 |
576,78 |
42,38 |
1 102,01 |
|
Germany |
23,36 |
495,23 |
495,23 |
- |
517,42 |
517,42 |
- |
1 059,38 |
|
Greece |
1,25 |
26,50 |
26,50 |
- |
27,69 |
27,69 |
- |
56,69 |
|
Ireland |
0,62 |
13,14 |
13,14 |
- |
13,73 |
13,73 |
- |
28,12 |
|
Italy |
12,54 |
265,85 |
265,85 |
- |
277,76 |
277,76 |
- |
568,69 |
|
Luxemburg |
0,29 |
6,15 |
6,15 |
- |
6,42 |
6,42 |
- |
13,15 |
|
Netherlands |
5,22 |
110,66 |
110,66 |
- |
115,62 |
115,62 |
- |
236,73 |
|
Portugal |
0,97 |
20,56 |
16,49 |
4,07 |
21,49 |
25,56 |
- |
43,99 |
|
Spain |
5,84 |
123,81 |
123,81 |
- |
129,36 |
129,36 |
- |
264,84 |
|
Sweden |
2,73 |
57,88 |
47,09 |
10,78 |
60,47 |
71,25 |
- |
123,81 |
|
United Kingdom |
12,69 |
269,03 |
269,03 |
- |
281,08 |
281,08 |
- |
575,49 |
|
EIB |
|
|
|
- |
205,00 |
205,00 |
- |
205,00 |
|
|
100,00 |
2 120,00 |
2 024,23 |
95,77 |
2 420,00 |
2 473,39 |
42,38 |
4 740,00 |
5) Debtors
The detail of this heading is detailed in table 2:
Table 2
|
(million EUR) |
|||||||
|
Debtors |
Notes |
6th |
7th |
8th |
9th |
Total at 31.12.2004 |
Total at 31.12.2003 |
|
Interest on late contributions |
5.1 |
- |
- |
- |
2,43 |
2,43 |
3,29 |
|
Interest on late contributions — Stabex |
5.2 |
- |
- |
- |
0,79 |
0,79 |
0,79 |
|
Interest receivable — European banks |
5.3 |
- |
- |
- |
0,16 |
0,16 |
0,47 |
|
Interest receivable — Stabex main account |
5.4 |
- |
- |
- |
- |
- |
0,03 |
|
Advances bourses |
5.5 |
4,24 |
- |
- |
- |
4,24 |
11,93 |
|
Recoveries and VAT |
5.6 |
5,54 |
8,00 |
3,71 |
0,93 |
18,18 |
9,76 |
|
Total |
|
9,77 |
8,00 |
3,71 |
4,31 |
25,79 |
26,27 |
Until the 2003 financial year, interest earned was presented in the balance sheet of the 7th EDF. As and from 2004, for reasons of coherence, interest income is presented in the balance sheet of the 9th EDF (including interest earned in 2003, in accordance with the provisions of the Cotonou Agreement — see also note 16). The sole exception is STABEX security interest which is presented in 8th EDF as this aid instrument does not feature in the 9th EDF.
5.1) Interest on late contributions
In accordance with Article 40(4) of the 9th EDF Financial Regulation interest is charged to the Member States in the event of late payment of the called-up contributions. Details of interests charged and subsequently paid by the Member States are given in table 2.1.
Table 2.1
Interest for late payment of EDF contributions for the year ended 31.12.2004
|
(million EUR) |
||||
|
|
Balance at 1.1.2004 |
Interest charged 2004 |
Interest paid 2004 |
Balance at 31.12.2004 |
|
Austria |
0,01 |
- |
- |
0,01 |
|
Belgium |
0,02 |
0,05 |
0,06 |
0,01 |
|
Denmark |
- |
- |
- |
- |
|
Finland |
0,00 |
0,00 |
0,00 |
- |
|
France |
2,10 |
0,26 |
1,18 |
1,18 |
|
Germany |
- |
0,10 |
- |
0,10 |
|
Greece |
0,01 |
- |
0,01 |
- |
|
Ireland |
0,00 |
- |
- |
0,00 |
|
Italy |
- |
- |
- |
- |
|
Luxemburg |
0,00 |
0,01 |
- |
0,01 |
|
Netherlands |
- |
- |
- |
- |
|
Portugal |
0,04 |
0,02 |
0,03 |
0,03 |
|
Spain |
0,06 |
- |
- |
0,06 |
|
Sweden |
0,03 |
0,03 |
0,06 |
- |
|
United Kingdom |
1,02 |
- |
- |
1,02 |
|
Total |
3,29 |
0,47 |
1,33 |
2,43 |
5.2) Interest on late contributions STABEX
All STABEX contributions were received prior to the beginning of the 2004 financial year. The amount shown for interest due represents the outstanding balance carried over from last year and corresponds to interest due from France.
5.3) Interest receivable European banks
This amount represents interest earned on the European bank accounts during the financial year 2004 but only credited to the bank accounts in 2005.
5.4) Interest receivable — STABEX main account
This amount represents interest earned on the STABEX current account during the financial year 2004 but only credited to the bank account in 2005.
5.5) Advances
This amount corresponds to advances for study awards and to bodies such as GTZ, AGRER and AEC, as shown in table 2.2.
Table 2.2
|
(million EUR) |
||
|
6th EDF |
Balance at 31.12.2004 |
Balance at 31.12.2003 |
|
Study awards |
2,41 |
1,53 |
|
AEC |
0,56 |
0,56 |
|
AGRER |
- |
0,37 |
|
GTZ |
1,24 |
9,43 |
|
Adjustments |
0,03 |
0,03 |
|
Total |
4,24 |
11,93 |
5.6) Recoveries
In previous years, all negative payments were considered as recoveries. During the financial year 2004 a new procedure for the follow up of the recoveries has been put in place by the Accounting Officer, in order to distinguish between recoveries and other negative transactions. As a result the figures for open recovery orders have been restated. The difference in the 7th EDF (- 17,73 million Euro, see also note 16) is due to an error made in the calculation of the euro counter value of local currency recovery orders, when originally establishing the closing balance as of 31.12.2003.
The movements for the year on recoveries are shown below in table 2.3:
Table 2.3
|
(million EUR) |
||||||
|
|
Open recovery orders at 31.12.2003 |
Correction of opening balance |
Open recovery orders at 1.1.2004 |
New recovery orders issued in 2004 |
Recovery orders closed in 2004 |
Open recovery orders at 31.12.2004 |
|
6th EDF |
0,54 |
- |
0,54 |
4,60 |
0,48 |
4,66 |
|
7th EDF |
21,79 |
- 17,73 |
4,06 |
9,27 |
5,33 |
8,00 |
|
8th EDF |
1,13 |
- |
1,13 |
15,64 |
13,06 |
3,71 |
|
9th EDF |
- |
- |
- |
17,06 |
16,13 |
0,93 |
|
Transactions to be finalised |
4,04 |
- |
4,04 |
2,17 |
5,33 |
0,88 |
|
Total |
27,50 |
-17,73 |
9,76 |
48,75 |
40,34 |
18,18 |
The closing balance for recovery orders (18,18 million Euro) represents the value of recovery orders issued but unpaid at the year end. During 2004, recovery order files closed amounted to € 40,34 million (including a ‘one-off’ recovery of 15 million Euro from DG RELEX). Of this total, an amount of 970 161,53 Euro was written off by the Authorising Officer during the year and an amount of 3 169 860,39 Euro was recovered by the Accounting Officer by way of offsetting, in accordance with the provisions of Article 46 of the 9th EDF Financial Regulation.
6) Short-term investments
Up to 2003 the funds from the main STABEX account which had not yet been transferred to a STABEX security account were invested. The value shown for short-term investments in the 2003 accounts included a provision for the loss resulting on the disposal of the last of the portfolio.
The shares in question were actually sold on 29 December 2003 — however the proceeds from the sale were not received until 6 January 2004. The portfolio had therefore been completely disposed of as at 31.12.2003 even if the proceeds from the sale were not credited to the bank account until after the year end.
Some misprints in 2003 accounts concerning sales price and the resultant profit/loss have been corrected in the table below.
Details of the profit and loss on the sale of individual investments are shown in table 3:
Table 3
|
(million EUR) |
||||
|
|
Cost |
Sales price |
Profit/loss |
|
|
Portfolio at 1.1.2003 |
107,25 |
|
|
|
|
11.7.2003 |
sale |
- 3,73 |
4,18 |
0,46 |
|
11.7.2003 |
sale |
- 25,45 |
27,22 |
1,77 |
|
11.7.2003 |
sale |
- 5,81 |
6,24 |
0,43 |
|
11.7.2003 |
sale |
- 9,86 |
11,12 |
1,26 |
|
11.7.2003 |
sale |
- 20,94 |
21,94 |
1,00 |
|
11.7.2003 |
sale |
- 20,32 |
22,03 |
1,71 |
|
11.7.2003 |
sale |
- 5,05 |
5,56 |
0,51 |
|
1.12.2003 |
sale |
- 9,98 |
10,54 |
0,56 |
|
|
|
- 101,12 |
108,82 |
7,70 |
|
Portfolio at 31.12.2003 |
6,12 |
- |
- |
|
|
6.1.2004 |
sale |
- 3,06 |
2,22 |
-0,84 |
|
6.1.2004 |
sale |
- 3,06 |
0,93 |
-2,13 |
|
|
|
- 6,12 |
3,15 |
-2,97 |
|
Portfolio at 31.12.2004 |
- |
|
|
|
7) Deferred expenditure
|
(million EUR) |
|||||
|
Deferred expenditure |
6th EDF |
7th EDF |
8th EDF |
9th EDF |
Total |
|
Total 2003 |
- |
9,53 |
418,30 |
- |
427,82 |
|
2004 |
|
|
|
|
|
|
Stabex |
- |
9,03 |
421,14 |
- |
430,17 |
|
Congo Fund |
- |
- |
- |
106,83 |
106,83 |
|
Total 2004 |
- |
9,03 |
421,14 |
106,83 |
537,00 |
This heading represents the total funds available for the relevant ACP State. The amount shown in 7th and 8th EDF concerns STABEX deferred expenditure, whilst the amount shown in 9th EDF concerns the available Special Congo Fund.
A change in accounting policy was adopted during 2003 in relation to STABEX expenditure. In prior years amounts transferred to the STABEX security accounts (see also note 8.5 below) had been treated as if they were payments and thus expensed in the income and expenditure account. However, in view of the fact that the STABEX security accounts are bank accounts under the sole control of the European Commission it was considered more appropriate not to consider these transfers as expenditure in the accounts and to amend previous transactions accordingly. As and from 2003 accounts, the total of the STABEX deferred expenditure represents the total of STABEX funds available and which will be transferred to the relevant beneficiary ACP State at some future date. These final transfers to the beneficiaries will in future be accounted for as expenditure.
8) Cash at bank and transfers on closing
For reasons of efficiency, there is a single treasury for all the EDFs being implemented; this leads to operations between the various EDFs, which are balanced out in the liaison accounts between the various balance sheets.
|
(million EUR) |
|||||
|
Transfer on closing |
6th EDF |
7th EDF |
8th EDF |
9th EDF |
Total at 31.12.2004 |
|
to/from 6th EDF |
- |
2 279,31 |
- 2 065,45 |
- 329,96 |
- 116,11 |
|
to/from 7th EDF |
- 2 279,31 |
- |
- |
1 261,20 |
- 1 018,11 |
|
to/from 8th EDF |
2 065,45 |
- |
- |
320,54 |
2 385,99 |
|
to/from 9th EDF |
329,96 |
- 1 261,20 |
- 320,54 |
- |
- 1 251,77 |
|
|
116,11 |
1 018,11 |
-2 385,99 |
1 251,77 |
- |
Balances on the liaison accounts at 31.12.2004 are detailed in table 4.1.
Table 4.1
|
(million EUR) |
|||||
|
Liaison accounts |
6th EDF |
7th EDF |
8th EDF |
9th EDF |
Total |
|
2003 |
|
|
|
|
|
|
Assets |
2 446,01 |
2 279,31 |
- |
2 257,96 |
6 983,28 |
|
Liabilities |
2 279,31 |
967,84 |
3 355,58 |
380,56 |
6 983,28 |
|
Total 2003 |
166,70 |
1 311,47 |
- 3 355,58 |
1 877,40 |
- |
|
2004 |
|
|
|
|
|
|
Assets |
2 395,42 |
2 279,31 |
- |
1 581,74 |
6 256,47 |
|
Liabilities |
2 279,31 |
1 261,20 |
2 385,99 |
329,96 |
6 256,47 |
|
Total 2004 |
116,12 |
1 018,11 |
- 2 385,99 |
1 251,77 |
- |
Until 2003 financial year, the treasury has been presented in the balance sheet of the 6th EDF. As from 2003 the treasury is presented in the balance sheet of the 9th EDF in accordance with Article 129 of the 9th EDF Financial Regulation. Table 4 shows the breakdown of total cash at bank:
Table 4
|
(million EUR) |
|||
|
9th EDF — Cash at bank |
Notes |
Balance at 31.12.2004 |
Balance at 31.12.2003 |
|
Treasury accounts |
8.1 |
82,33 |
9,98 |
|
ACP Paying Agents |
8.2 |
42,73 |
57,87 |
|
EUR Paying Agents |
8.3 |
17,04 |
17,16 |
|
STABEX current account |
8.4 |
19,59 |
16,07 |
|
STABEX security accounts |
8.5 |
430,17 |
427,82 |
|
Congo Special Fund |
8.4 |
106,83 |
- |
|
Provision doubtful debts |
8.6 |
- |
- 2,74 |
|
Funds en route |
8.7 |
100,20 |
- |
|
Total |
|
798,88 |
526,16 |
8.1) Treasury accounts
Accounts held with the central banks of the Member States into which EDF contributions are paid.
8.2) ACP paying agents
Amounts held in bank accounts in the ACP States used for making payments locally. The accounts are generally kept in euros, but may also be kept in a currency of a Community Member State.
8.3) EUR paying agents
These accounts are held with commercial banks established in the Member States (EUR 15). The accounts are kept in euros and are used for payments to beneficiaries within the Union. Payments are generally made in euros, but may also be made in other currencies. These funds are also used to replenish ACP paying agent accounts.
8.4) STABEX current account and Special Congo Fund account
This amount represents the cash balance remaining on the principal STABEX account and the Special Congo Fund account.
8.5) STABEX security accounts
For the purposes of transparency and sound financial management and to secure the amounts due to the ACP countries prior to utilisation, it was decided during 2001 to open an account in the Commission’s name with a European commercial bank consisting of sub-accounts in the name of each beneficiary state. Detailed information on the accounts opened in the name of the various beneficiary States are given in table 4.2:
Table 4.2
STABEX movement schedule for the year ended 31.12.2004
|
(million EUR) |
|||||
|
|
Balance per 31.12.2003 |
Interest |
Transfers |
Payments |
Balance at 31.12.2004 |
|
BENIN |
0,04 |
0,00 |
- |
- |
0,05 |
|
BURKINA FASO |
0,73 |
0,02 |
- |
- |
0,75 |
|
BURUNDI |
26,18 |
0,61 |
- |
0,50 |
26,29 |
|
CAMEROON |
5,15 |
0,12 |
- |
- |
5,27 |
|
COMOROS |
0,05 |
0,00 |
- |
- |
0,05 |
|
DOMINICA |
5,06 |
0,12 |
- |
- |
5,18 |
|
ETHIOPIA |
0,86 |
0,03 |
- |
- |
0,88 |
|
GAMBIA |
0,96 |
0,02 |
- |
- |
0,98 |
|
GRENADA |
0,31 |
0,01 |
- |
- |
0,32 |
|
GUINEA-BISSAU |
0,32 |
0,01 |
- |
- |
0,32 |
|
HAITI |
2,80 |
0,02 |
- |
2,82 |
- |
|
COTE D'IVOIRE |
41,04 |
0,97 |
- |
- |
42,01 |
|
JAMAICA |
4,50 |
0,04 |
- |
3,96 |
0,57 |
|
MADAGASCAR |
13,24 |
0,31 |
- |
- |
13,55 |
|
MALAWI |
0,87 |
0,02 |
- |
- |
0,89 |
|
MAURITANIA |
16,99 |
0,40 |
- |
- |
17,39 |
|
PAPUA-NEW GUINEA |
0,63 |
0,01 |
- |
- |
0,64 |
|
RWANDA |
5,49 |
0,13 |
- |
- |
5,62 |
|
SENEGAL |
9,63 |
0,23 |
- |
- |
9,86 |
|
SIERRA LEONE |
2,92 |
0,07 |
- |
- |
2,99 |
|
SAINT LUCIA |
13,10 |
0,31 |
- |
- |
13,41 |
|
SOLOMON ISLANDS |
28,83 |
0,68 |
- |
- |
29,50 |
|
SUDAN |
192,74 |
4,18 |
- |
- |
196,92 |
|
ST VINCENT & GRENADINES |
3,78 |
0,09 |
- |
- |
3,87 |
|
TANZANIA |
29,58 |
0,69 |
- |
- |
30,27 |
|
TONGA |
0,08 |
0,00 |
- |
- |
0,08 |
|
UGANDA |
19,25 |
0,48 |
- |
- |
19,73 |
|
ZIMBABWE |
2,70 |
0,06 |
- |
- |
2,77 |
|
Total |
427,82 |
9,63 |
- |
7,29 |
430,17 |
8.6) Provision for doubtful debts
|
(million EUR) |
||
|
Doubtful debts provision |
9th EDF |
Total |
|
2003 |
|
|
|
Zaire bank account |
2,74 |
2,74 |
|
Recoveries |
0,01 |
0,01 |
|
Total 2003 |
2,75 |
2,75 |
|
2004 |
|
|
|
Zaire bank account |
- |
- |
|
Recoveries |
0,02 |
0,02 |
|
Total 2004 |
0,02 |
0,02 |
In previous years recoveries which were written off were netted off against payments, meaning that they were not separately identified in the accounts. Towards the end of 2003 a new procedure was introduced whereby amounts written off will be posted to the provision for doubtful debts and if appropriate written off to a specific bad debts account.
In 2003, following the prudence principle, a provision was created for the full balance of an old bank account in Congo (former Zaire) amounting to 2,74 million Euro, about which there were some doubt as to recoverability due to the fact that there was no Commission presence in the country and there had been no movements on the account for several years. However as the bank balance was confirmed to the Commission during 2004 (on resumption of activities in the country), this provision has now been reversed.
The amount of 15 498,96 Euro registered under this heading at 31.12.2004, concerns recovery orders from 6th and 7th EDF.
8.7) Funds en route
Some replenishments sent before the year end were only registered by the beneficiary bank in 2005.
9) Inter-fund transfers
This heading shows resources transferred from other funds which increase the appropriation of the receiving fund and reduce that of the Fund of origin. The total balance is shown in table 5 below.
Table 5
|
(million EUR) |
||||||
|
Inter-EDF transfers |
6th EDF |
7th EDF |
8th EDF |
9th EDF |
Consolidate |
Total at 31.12.2004 |
|
to/from 4th EDF |
144,32 |
- |
- |
- |
- |
144,32 |
|
to/from 5th EDF |
177,63 |
526,78 |
- |
- |
- |
704,41 |
|
to/from 6th EDF |
- |
181,76 |
94,00 |
389,73 |
665,49 |
665,49 |
|
to/from 7th EDF |
- 181,76 |
- |
532,82 |
648,78 |
999,84 |
999,84 |
|
to/from 8th EDF |
- 94,00 |
- 532,82 |
- |
1 946,36 |
1 319,54 |
1 319,54 |
|
to/from 9th EDF |
- 389,73 |
- 648,78 |
- 1 946,36 |
- |
- 2 984,87 |
- 2 984,87 |
|
Total |
- 343,53 |
- 473,06 |
- 1 319,54 |
2 984,87 |
- |
848,74 |
After the entry into force of the Cotonou Agreement, all the unspent funds in previous EDFs are transferred to the 9th EDF after decommittment. Table 2.1 on the Report on Financial Implementation shows the amounts still committed for ongoing projects under 4th EDF (91,15 million Euro transferred to 6th EDF. See table 2.2) and 5th (349,77 million Euro transferred to 7th EDF. See table 2.3).
10) Capitalised income
Until 2003 financial year, the interest earned has been presented in the balance sheet of the 7th EDF. As from 2004 for reasons of coherence the interest income is presented in the balance sheet of the 9th EDF with the exception of STABEX security interest which is presented in 8th EDF due to absence of this aid instrument in the 9th EDF.
Although interest income on STABEX late contributions is presented as well under the 8th EDF, it has been transferred to the 9th EDF during 2005 financial year. This amount is not yet booked on the Authorising Officer accounts and therefore there is a difference between the total fund capital presented in the balance sheet and the total appropriations shown in the Report on Financial Implementation (see table 2.1 on the report).
Capitalised income is shown in table 6 below:
Table 6
|
(million EUR) |
|||||||
|
Capitalised income |
Notes |
6th EDF |
7th EDF |
8th EDF |
9th EDF |
Total at 31.12.2004 |
Total at 31.12.2003 |
|
Capitalised interest |
10,1 |
13,70 |
49,00 |
35,45 |
1,80 |
99,95 |
98,15 |
|
Stabex interest |
10,1 |
24,08 |
319,89 |
- |
|
343,97 |
348,46 |
|
EIB interest |
10,1 |
- |
3,41 |
- |
0,12 |
3,53 |
3,51 |
|
European banks interest |
10,1 |
- |
22,47 |
- |
4,45 |
26,92 |
25,42 |
|
Interest late contributions |
10,2 |
- |
5,96 |
1,86 |
0,73 |
8,56 |
6,23 |
|
Replenishment of Stabex resources |
10,3 |
185,10 |
- |
- |
- |
185,10 |
185,10 |
|
Provision for loss on short term investments |
6 |
- |
- |
- |
- |
- |
- 2,97 |
|
Interest income Stabex security accounts |
10,4 |
- |
- |
34,73 |
- |
34,73 |
25,10 |
|
Interest income special Congo contribution |
10,5 |
- |
- |
- |
1,92 |
1,92 |
- |
|
Total |
|
222,88 |
400,74 |
72,04 |
9,02 |
704,68 |
689,00 |
10.1) Capitalised interest, capitalised STABEX interest, EIB interest, European bank interest
The interest earned on accounts with European paying agents (including the main STABEX account) can be used to finance projects in accordance with Articles 1.3 and 9 of the Internal Agreement.
This heading represents the amount of interest on deposited funds which can be committed for the financing of projects. This interest results in an effective increase in the Funds’ overall appropriations.
10.2) Interest on late contributions
This is interest from late payment of contributions which can be committed for the financing of projects. This interest results in an effective increase in the Funds’ overall appropriations.
10.3) Replenishment of STABEX resources
This heading comprises direct contributions by the ACP States (replenishment of resources) and the amounts by which transfer entitlements have been reduced at the request of the ACP States. The obligation to replenish STABEX resources was abolished by the ACP-EDF Council Decision of 19 November 1991.
10.4) Interest income, STABEX security accounts
(See also note 7 above)
This represents the accumulated income generated by the STABEX security accounts. Whilst such income appears to increase the total of the Fund it should be borne in mind that any income generated by these accounts is earmarked for the specific beneficiary state.
10.5) Interest income, Special Congo Fund
This represents the cumulated income generated by the Special Congo account. Whilst such income appears to increase the total of the Fund it should be borne in mind that any income generated by these account is earmarked for the specific purpose set out in Council Decision 2003/583/EC.
11) Payments
These amounts represents total project expenditure for the Fund(s) in question and includes advance payments to World Bank (209 million Euro in 2003; 100 million Euro in 2004) and final transfers of STABEX funds (to accounts held by the beneficiary ACP States), amounting to 114 million Euro in 2003 and 7 million Euro in 2004.
In order to present a true and fair view of the EDF financial situation, a change in accounting policy for STABEX payments (see note 7 above) was reflected in the 2003 Financial Statements. The differences between the restated figures, presented in these Financial Statements, and the figures drawn from the accounting system, presented in the Report on Financial Implementation (see section 2.2 ‘consolidated accounts’) are as follows:
|
Year |
Financial Statements restated figures (1) |
Accounting system figures (2) |
Difference 3 = (1-2) |
|
2001 |
1 722,83 |
2 067,86 |
- 345,03 |
|
2002 |
1 872,33 |
1 852,72 |
19,61 |
|
2003 |
2 288,80 |
2 179,47 |
109,33 |
|
2004 |
2 413,93 |
2 197,84 |
216,09 |
|
Cumulative |
25 918,06 |
25 913,69 |
4,36 |
It was not possible to give effect to all the relevant transactions in the accounting system before the date of the closure of the 2004 financial year. As a result, there is a difference of 4,36 million Euro (see cumulative figures above) between both sets of figures. This situation will be rectified during 2005.
12) Transactions awaiting finalisation
|
(million EUR) |
|||
|
Transactions awaiting finalisation |
6th EDF |
9th EDF |
Total |
|
2003 |
|
|
- |
|
transactions to be finalised |
10,80 |
- |
10,80 |
|
advances bourses (note 5.5) |
11,93 |
- |
11,93 |
|
Total 2003 |
22,73 |
- |
22,73 |
|
2004 |
|
|
- |
|
transactions to be finalised |
6,84 |
0,03 |
6,87 |
|
advances bourses (note 5.5) |
4,24 |
- |
4,24 |
|
Total 2004 |
11,08 |
0,03 |
11,11 |
This amount comprises all payments/receipts awaiting final allocation to the appropriate projects as shown in table 7.
Table 7
|
(million EUR) |
||||
|
Transactions to be finalized |
6th EDF |
9th EDF |
Total at 31.12.2004 |
Total at 31.12.2003 |
|
co financing |
- |
- |
- |
0,28 |
|
expenditure to be finalised |
6,93 |
- |
6,93 |
10,61 |
|
devaluation |
- 0,09 |
- |
- 0,09 |
- 0,09 |
|
compensation transactions |
- |
0,52 |
0,52 |
- |
|
income to be regularised |
- |
- 0,49 |
- 0,49 |
- |
|
Total |
6,84 |
0,03 |
6,87 |
10,80 |
13) Creditors
The total creditor balance is detailed in table 8:
Table 8
|
(million EUR) |
|||||||
|
Creditors |
Notes |
6th EDF |
7th EDF |
8th EDF |
9th EDF |
Total at 31.12.2004 |
Total at 31.12.2003 |
|
Contributions received in advance |
13.1 |
- |
- |
- |
180,36 |
180,36 |
1,43 |
|
Provision for bank charges |
13.2 |
- |
- |
- |
0,05 |
0,05 |
0,10 |
|
Outstanding Stabex payments |
13.3 |
- |
9,03 |
421,14 |
- |
430,17 |
427,82 |
|
Outstanding Special Congo funds |
13.4 |
- |
- |
- |
106,83 |
106,83 |
- |
|
Total |
|
- |
9,03 |
421,14 |
287,24 |
717,40 |
429,35 |
13.1) Contributions received in advance
Certain contributions were paid in advance by Member States, as shown in table 8.1:
Table 8.1
|
(million EUR) |
||
|
Contributions received in advance |
Balance at 31.12.2003 |
Balance at 31.12.2004 |
|
Ireland |
- |
0,16 |
|
Italy |
1,13 |
- |
|
Luxemburg |
0,30 |
- |
|
United Kingdom |
- |
180,20 |
|
Total |
1,43 |
180,36 |
13.2) Provisions for bank charges
This amount is made up of transactions relating to bank charges for the year ended 31 December 2004, which were debited to the relevant bank accounts after the year end.
13.3) Outstanding STABEX payments
(See also notes 7, 8.5 and 10.4 above).
This balance represents the amounts due to beneficiary ACP States in respect of the STABEX aid instrument. The total balance represents the amount held on the STABEX security accounts.
13.4) Outstanding Special Congo Funds
This balance represents the amounts available for Congo in accordance with the provisions of Council Decision 2003/583/EC.
14) Expenditure
These amounts show the fund expenditure by aid instrument.
15) Administrative expenditure and financial costs
|
(million EUR) |
||||
|
|
Administrative expenditure and financial costs 6th EDF |
Costs linked to devolution 8th EDF |
Implementation expenses 9th EDF |
Total |
|
2003 |
7,62 |
13,48 |
0,00 |
21,10 |
|
2004 |
7,78 |
29,92 |
55,09 |
92,78 |
These amounts are detailed in tables 9 to 11:
Table 9
|
(million EUR) |
|||
|
Administrative expenditure and financial costs — 6th EDF |
Balance at 1.1.2004 |
Charge for the year |
Balance at 31.12.2004 |
|
Financial costs |
0,08 |
0,02 |
0,11 |
|
Interest on late payments |
0,10 |
- |
0,10 |
|
Year end re-evaluations |
4,17 |
0,07 |
4,24 |
|
Interests and bank charges on account for advances on study grants |
- 0,06 |
- 0,00 |
- 0,06 |
|
Contract BDC |
0,28 |
0,06 |
0,35 |
|
Service contract |
0,09 |
- |
0,09 |
|
Others |
0,37 |
0,00 |
0,37 |
|
Total |
5,03 |
0,16 |
5,18 |
|
Audit and evaluation costs financed from interest |
2,59 |
- |
2,59 |
|
Total |
7,62 |
0,16 |
7,78 |
The implementation expenses related to the devolution process are financed following the provisions of articles 1.3, 4 and 9 of the Internal Agreement. The breakdown of theses expenses is shown in tables 10 (8th EDF) and 11 (9th EDF).
Table 10
|
(million EUR) |
|||
|
Costs linked to devolution — 8th EDF |
Balance at 1.1.2004 |
Charge for the year |
Balance at 31.12.2004 |
|
Technical assistence AGEER — GTZ |
4,79 |
- |
4,79 |
|
Consultancy |
0,94 |
0,87 |
1,80 |
|
Personnel costs (AIDCO) |
1,13 |
1,41 |
2,55 |
|
Personnel costs (RELEX) |
3,00 |
7,60 |
10,60 |
|
Other costs |
0,60 |
0,46 |
1,06 |
|
Infrastructure costs |
3,00 |
5,00 |
8,00 |
|
Audit |
0,01 |
0,80 |
0,81 |
|
Personnel costs linked to Individual Experts management |
- |
0,30 |
0,30 |
|
Total |
13,48 |
16,44 |
29,92 |
Table 11
|
(million EUR) |
|||
|
Implementation expenses |
Balance at 1.1.2004 |
Charge for the year |
Balance at 31.12.2004 |
|
Financial costs |
- |
0,17 |
0,17 |
|
Individual experts |
- |
1,03 |
1,03 |
|
Year end re-evaluations |
- |
0,11 |
0,11 |
|
Personnel costs (RELEX) |
- |
20,60 |
20,60 |
|
Other costs (RELEX) |
- |
6,40 |
6,40 |
|
Infrastructure costs (RELEX) |
- |
26,28 |
26,28 |
|
Training |
0,00 |
0,33 |
0,33 |
|
IT |
- |
0,18 |
0,18 |
|
Total |
0,00 |
55,08 |
55,09 |
16) Re-statement of certain figures for 2003
Certain figures for 2003 have been restated in order to comply with the generally accepted accounting principle ‘Comparability of information’ and to implement International Accounting Standard, IPSAS no. 3.
As shown in the comparative consolidated balance sheet below, these corrections lead to a reduction of the total balance amounting to 17,54 million Euro. This is the sum of a decrease of 17,73 million Euro in the figure for Recovery Orders payable (Debtors), an increase of 0,18 million Euro of the value of the short term investments and a decrease of 0,01 million Euro in the doubtful debt provision which was double counted in 2003 balance sheet by error. Details are set out in the table below:
Consolidated Balance Sheet of the 6th, 7th, 8th and 9th EDF at 31 December 2004
|
(million EUR) |
||||
|
|
Notes |
Restated closing balance 2003 |
Correction of opening balance |
Balance as originally shown in 2003 accounts |
|
ASSETS |
||||
|
Long term assets |
||||
|
Contributions |
||||
|
Initial allocation |
1 |
40 035,15 |
- |
40 035,15 |
|
EIB special contribution |
2 |
60,00 |
- |
60,00 |
|
less: amounts called up |
3 |
- 20 820,00 |
- |
- 20 820,00 |
|
|
|
19 275,15 |
- |
19 275,15 |
|
Amounts called up |
3 |
20 820,00 |
- |
20 820,00 |
|
less: payments received |
4 |
- 20 724,23 |
- |
- 20 724,23 |
|
|
|
95,77 |
- |
95,77 |
|
Stabex contributions |
||||
|
Initial allocation |
|
1 800,00 |
- |
1 800,00 |
|
less: amounts called up and received |
|
- 1 800,00 |
- |
- 1 800,00 |
|
|
|
- |
- |
- |
|
Net contributions receivable |
|
19 370,92 |
- |
19 370,92 |
|
Current assets |
||||
|
Debtors |
5 |
26,27 |
- 17,73 |
44,00 |
|
Short-term investments |
6 |
3,15 |
0,18 |
2,97 |
|
Deferred expenditure |
7 |
427,82 |
- |
427,82 |
|
Cash at bank |
8 |
526,16 |
- |
526,16 |
|
Total assets |
|
20 354,32 |
- 17,54 |
20 371,87 |
|
LIABILITIES |
||||
|
Fund capital |
||||
|
Contributions |
1 |
40 035,15 |
- |
40 035,15 |
|
EIB special contribution |
2 |
60,00 |
- |
60,00 |
|
Stabex contributions |
|
1 800,00 |
- |
1 800,00 |
|
|
|
41 895,15 |
- |
41 895,15 |
|
Total inter-fund transfers |
9 |
848,74 |
- |
848,74 |
|
|
|
42 743,89 |
- |
42 743,89 |
|
Capitalised income |
10 |
689,00 |
0,18 |
688,82 |
|
Total Fund capital |
|
43 432,89 |
0,18 |
43 432,71 |
|
Other sources of funds |
||||
|
Payments |
11 |
- 23 504,12 |
- |
- 23 504,12 |
|
Recoveries |
5 |
9,76 |
- 17,73 |
27,50 |
|
Transactions to be finalised |
12 |
- 10,80 |
- |
- 10,80 |
|
Doubtful debt provisions |
8 |
- 2,75 |
0,01 |
- 2,76 |
|
Creditors |
13 |
429,35 |
- |
429,35 |
|
Total liabilities |
|
20 354,32 |
- 17,54 |
20 371,87 |
2. REPORT ON FINANCIAL IMPLEMENTATION
INTRODUCTORY NOTE
Previous EDFs
Decision No 1/2000 of the ACP-EC Council of 27 July 2000 regarding transitional measures provides for some of the unallocated resources from previous EDFs to be used for programmes consistent with the relevant provisions of the Cotonou Agreement and put into early application under transitional measures.
Commission Decision No 410/2001 of 16 March 2001, which fixes the allocations for the indicative programmes of the ACP countries under the ACP-EC Partnership Agreement, stipulates that the unallocated resources from previous EDFs up to maximum of EUR 1 200 million are to be used for implementation in accordance with the rules and procedures of the relevant EDFs pending the entry into force of the Financial Protocol to the 9th EDF.
Commission Decision No 1033/2001 of 15 June 2001 fixed the allocations for regional programmes and intra-ACP cooperation under the Financial Protocol to the ACP-EC Partnership Agreement.
Commission Decision No 1252/2002 of 11 July 2002 increased the envelope intended for intra-ACP cooperation by EUR 60 million, from the general reserves of the 6th and 7th EDFs, and also provided for the use of these additional funds pending the entry into force of the Financial Protocol to the 9th EDF, in accordance with the rules and procedures applicable to the original EDFs.
Lastly, Decision No 3/2002 of the ACP-EC Council of Ministers of 23 December 2002 took an amount of EUR 25 million from the unallocated resources of the 8th EDF (general reserve) and allocated it to regional cooperation under the ACP-EC Partnership Agreement.
As last year, to ensure transparency in the presentation of the accounts the various tables below set out separately for each of the 6th, 7th and 8th EDFs the part used for Lomé Convention programming and the part used for programming under the Cotonou Agreement. Entry in the accounts and the presentation of accounts in connection with the Cotonou Agreement is based on Article 3(2) of Annex IV of the ACP-EC Partnership Agreement, as regards countries. That Article gives the ACP countries an allocation A to cover macroeconomic support and support for programmes and projects and an allocation B to cover unforeseen needs such as emergency assistance, debt relief initiatives and support to offset the adverse effects of instability in export earnings (1). For the regions, the accounts are set out according to the regional programming as referred to in Chapter 2 of the ACP-EC Partnership Agreement (i.e. regional indicative programme and intra-ACP cooperation).
9th EDF
The ACP-EC Partnership Agreement signed on 23 June 2000 in Cotonou by the Member States of the European Community and the States of Africa, the Caribbean and the Pacific (ACP States) entered into force on 1 April 2003.
The EU Council Decision of 27 November 2001 (2001/822/EC) on the association of the overseas countries and territories (OCT) with the European Community entered into force on 2 December 2001.
The Cotonou Agreement was concluded for a twenty-year period with a five-year review clause and a Financial Protocol for each five-year period. The EU Council Decision on the association of the OCT with the European Community is applicable for ten years.
The first five years are, therefore, financed under the 9th EDF. The 9th EDF was set at EUR 13 800 million, including EUR 13 500 million allocated to the ACP States in accordance with the first Financial Protocol included in the Cotonou Agreement, EUR 175 million allocated to the OCT (provided for by the EU Council Decision on the association of the OCT) and EUR 125 million reserved for the European Commission to cover expenses in connection with implementing the 9th EDF resources (provided for in the internal agreement for the 9th EDF).
Of the total 9th-EDF budget for the ACP States, EUR 1 000 million may only be released after examination by the EU Council in 2004, on the basis of a proposal from the European Commission. An initial tranche of EUR 250 million was released in 2004 in accordance with Council Decision 7189/04 of 22 March 2004 and allocated to the Intra ACP Fund (natural resources) to finance the Water Facility operation (EUR 42 million committed in 2004).
The breakdown of 9th EDF allocations for ACP States, including the ‘conditional billion’ and allocations managed directly by the European Investment Bank (EIB), is as follows:
|
|
9th EDF allocation |
Reduction/conditional billion |
Unopened allocations (EIB-managed) |
Open allocations OLAS |
|
Long-term development budget |
10 000 000 000 |
(491 000 000) |
(186 850 000) (2) (interest-rate subsidies) |
9 322 150 000 |
|
Regional budget |
1 300 000 000 |
(96 000 000) |
|
1 204 000 000 |
|
Investment facility |
2 200 000 000 |
(163 000 000) |
(2 037 000 000) |
0 |
|
Total |
13 500 000 000 |
(750 000 000) |
(2 223 850 000) |
10 526 150 000 |
The long-term development budget for ACP States has two components:
The A allocation for macroeconomic support for sectoral policies, programmes and projects supporting focal or non-focal areas of Community aid corresponds to the allocation for the NIPs and structural adjustment in previous EDFs.
The B allocation, intended to cover unforeseen needs such as emergency aid, contributions to debt reduction initiatives and support to offset adverse fluctuations in export earnings, generally corresponds to the Stabex, Sysmin and emergency aid allocations in previous EDFs.
The breakdown of 9th EDF allocations for the OCT, including those managed directly by the European Investment Bank (EIB), is as follows:
|
|
9th EDF allocation |
Unopened allocations (EIB-managed) |
Open allocations OLAS |
|
Long-term development budget |
127 100 000 |
|
127 100 000 |
|
C reserve |
17 900 000 |
(1 000 000) (interest rate subsidies) |
16 900 000 |
|
Regional budget |
8 000 000 |
|
8 000 000 |
|
Budget for studies and technical assistance |
2 000 000 |
|
2 000 000 |
|
Investment Facility |
20 000 000 |
(20 000 000) |
0 |
|
Totals |
175 000 000 |
(21 000 000) |
154 000 000 |
The unallocated C reserve for OCTs is maintained to finance humanitarian aid, emergencies, refugee assistance and fluctuations in export earnings, and corresponds to the B allocation for the ACP countries.
Moreover, under Commission Decision E/982/2003 of 16 June 2003, all unspent balances from EDFs prior to the date of entry into force of the Cotonou Agreement (for ACP countries) and the date of entry into force of the internal agreement on the 9th EDF (for the OCT countries), and all amounts decommitted after those dates for ongoing projects under those EDFs, have been transferred to the 9th EDF. Any resource thus transferred to the 9th EDF after previously having been allocated to the indicative programme of an ACP State or region has been allocated to that State or region. On the other hand, the unallocated resources have been transferred to reserves which will subject to new programming under the 9th EDF.
The tables at Annex giving the amounts decided, contracted and paid refer to net data. Only Table 2.7 refers separately to amounts committed and decommitted and amounts paid and recovered. Attention should be drawn to the impact which a reclassification carried out in 2004 had on Stabex security payments, reducing total payments that year by EUR 209 million.
2.1. APPROPRIATIONS AT 31.12.2004
Table 1.1
6TH EDF
Situation of appropriations (EUR): 31 December 2004
ANALYSIS OF FUND BY INSTRUMENT
|
(million EUR) |
||||
|
Instrument |
Initial appropriation |
Accumulated increases or reductions in resources at 31 December 2003 |
Increases or reductions in resources during 2004 |
Current appropriation |
|
ACP |
||||
|
Lomé |
||||
|
Grants |
4 362,50 |
10,15 |
(31,36) |
4 341,29 |
|
Special loans |
600,00 |
(166,99) |
(0,08) |
432,93 |
|
Interest-rate subsidies |
207,50 |
(126,08) |
|
81,42 |
|
Emergency aid |
210,00 |
(30,61) |
|
179,39 |
|
Aid for refugees |
80,00 |
14,77 |
|
94,77 |
|
Risk capital |
600,00 |
(70,30) |
|
529,70 |
|
Stabex |
925,00 |
522,12 |
|
1 447,12 |
|
Sysmin |
415,00 |
(276,38) |
(0,59) |
138,02 |
|
Transfer 4th EDF — 6th EDF |
|
89,30 |
|
89,30 |
|
Structural adjustment |
|
6,00 |
|
6,00 |
|
Intra ACP Allocation |
|
10,00 |
|
10,00 |
|
General reserve |
|
|
|
|
|
TOTAL ACP |
7 400,00 |
(18,01) |
(32,03) |
7 349,96 |
|
OCT |
||||
|
Grants |
48,50 |
1,32 |
|
49,82 |
|
Special loans |
25,00 |
(9,80) |
(0,21) |
14,98 |
|
Interest-rate subsidies |
2,50 |
0,10 |
|
2,60 |
|
Emergency aid |
3,00 |
(2,49) |
|
0,51 |
|
Aid for refugees |
1,00 |
(1,00) |
|
|
|
Risk capital |
15,00 |
(0,38) |
|
14,62 |
|
Stabex |
4,00 |
|
|
4,00 |
|
Sysmin |
1,00 |
|
|
1,00 |
|
Transfer 4th EDF — 6th EDF |
|
1,85 |
|
1,85 |
|
TOTAL OCT |
100,00 |
(10,40) |
(0,21) |
89,39 |
|
TOTAL 6TH EDF |
7 500,00 |
(28,41) |
(32,24) |
7 439,35 |
Table 1.2
6TH EDF
Situation of appropriations (EUR): 31 December 2004
ANALYSIS OF MOVEMENTS DURING THE YEAR
|
(million EUR) |
|||||||||||||
|
ACP |
Lomé |
Cotonou |
General Reserve |
Total ACP |
|||||||||
|
Grants |
Special loans |
Interest rate subsidies |
Emergency aid |
Aid for refugees |
Risk capital |
STABEX |
SYSMIN |
Transfer 4th EDF — 6th EDF |
Structural adjustment |
Intra ACP |
|||
|
Situation at 31.12.2003 (3) |
4 372,65 |
433,01 |
81,42 |
179,39 |
94,77 |
530 |
1 447,12 |
138,62 |
89,30 |
6,00 |
10,00 |
0,00 |
7 381,99 |
|
(31,36) |
(0,08) |
|
|
|
|
|
(0,59) |
|
|
|
|
(32,03) |
|
|
Situation at 31.12.2004 |
4 341,29 |
432,93 |
81,42 |
179,39 |
94,77 |
529,70 |
1 447,12 |
138,02 |
89,30 |
6,00 |
10,00 |
0,00 |
7 349,96 |
|
OCT |
Grants |
Special loans |
Interest rate subsidies |
Emergency aid |
Aid for refugees |
Risk capital |
STABEX |
SYSMIN |
Transfer 4th EDF — 6th EDF |
Total OCT |
|
Situation at 31.12.2003 (3) |
49,82 |
15,20 |
2,60 |
0,51 |
0 |
15 |
4 |
1 |
1,85 |
24,58 |
|
|
(0,21) |
|
|
|
|
|
|
|
(0,21) |
|
|
Situation at 31.12.2004 |
49,82 |
14,98 |
2,60 |
0,51 |
0 |
14,62 |
4,00 |
1,00 |
1,85 |
24,37 |
Table 1.3
7TH EDF
Situation of appropriations (EUR): 31 December 2004
ANALYSIS OF FUND BY INSTRUMENT
|
(million EUR) |
||||
|
Instrument |
Initial appropriation |
Accumulated increases or reductions in resources at 31 December 2003 |
Increases or reductions in resources during 2004 |
Current appropriation |
|
ACP |
||||
|
Lomé |
||||
|
Grants |
6 215,00 |
(669,73) |
(42,07) |
5 503,20 |
|
Interest-rate subsidies |
280 ,00 |
(74,64) |
(5,21) |
200,15 |
|
Emergency aid |
250,00 |
154,82 |
(1,47) |
403,35 |
|
Aid for refugees |
100,00 |
(13,82) |
(1,31) |
84,87 |
|
Risk capital |
825,00 |
(3,47) |
(3,43) |
818,10 |
|
Stabex |
1 500,00 |
196,69 |
|
1 696,69 |
|
Sysmin |
480,00 |
(33,69) |
(0,02) |
446,29 |
|
Transfer 5th EDF — 7th EDF |
0,00 |
343,54 |
(3,61) |
339,93 |
|
Structural adjustment |
1 150,00 |
1,28 |
(0,80) |
1 150,48 |
|
Heavily indebted poor countries |
|
40,00 |
|
40,00 |
|
Intra-ACP Allocation |
|
50,00 |
|
50,00 |
|
General reserve |
|
|
|
|
|
TOTAL ACP |
10 800,00 |
9,01 |
(57,92) |
10 733,07 |
|
Grants |
97,50 |
(9,99) |
(0,50) |
87,01 |
|
Interest-rate subsidies |
6,00 |
(1,78) |
|
4,22 |
|
Emergency aid |
2,50 |
(0,24) |
|
2,26 |
|
Aid for refugees |
0,50 |
(0,21) |
|
0,29 |
|
Risk capital |
25,00 |
(2,51) |
|
22,49 |
|
Stabex |
6,00 |
|
|
6,00 |
|
Sysmin |
2,50 |
|
|
2,50 |
|
Transfer 5th EDF — 7th EDF |
|
9,84 |
|
9,84 |
|
TOTAL OCT |
140,00 |
(4,89) |
(0,50) |
134,61 |
|
TOTAL 7TH EDF |
10 940,00 |
(13,90) |
(58,42) |
10 867,68 |
Table 1.4
7TH EDF
Situation of appropriations (EUR): 31 December 2004
ANALYSIS OF MOVEMENTS DURING THE YEAR
|
(million EUR) |
|||||||||||||
|
ACP |
Lomé |
Cotonou |
General reserve |
Total ACP |
|||||||||
|
Grants |
Interest rate subsidies |
Emergency aid |
Aid for refugees |
Risk capital |
STABEX |
SYSMIN |
Transfer 5th EDF — 7th EDF |
Structural adjustment |
Heavily indebted poor countries |
Intra ACP |
|||
|
Situation at 31.12.2003 (4) |
5 545,27 |
205,36 |
404,82 |
86,18 |
821,53 |
1 696,69 |
446,31 |
343,54 |
1 151,28 |
40 |
50 |
0,00 |
10 790,99 |
|
(42,07) |
(5) |
(1,47) |
(1,31) |
(3,43) |
0,00 |
(0,02) |
(3,61) |
(0,80) |
0 |
0 |
0,00 |
(57,92) |
|
|
Situation at 31.12.2004 |
5 503,20 |
200 |
403,35 |
84,87 |
818 |
1 696,69 |
446,29 |
339,93 |
1 150,48 |
40 |
50 |
0,00 |
10 733,07 |
|
OCT |
Grants |
Interest rate subsidies |
Emergency aid |
Aid for refugees |
Risk capital |
STABEX |
SYSMIN |
Transfer 5th EDF — 7th EDF |
TOTAL OCT |
|
Situation at 31.12.2003 (4) |
88 |
4 |
2 |
0 |
22 |
6 |
3 |
10 |
135,11 |
|
(1) |
0 |
0 |
0 |
0 |
|
|
|
(0,50) |
|
|
Situation at 31.12.2004 |
87 |
4 |
2 |
2 |
22 |
6 |
3 |
9,84 |
134,61 |
Table 1.5
8TH EDF
Situation of appropriations (EUR): 31 December 2003
ANALYSIS OF FUND BY INSTRUMENT
|
(million EUR) |
||||
|
Instrument |
Initial appropriation |
Accumulated increases or reductions in resources at 31 December 2003 |
Increases or reductions in resources during 2004 |
Current appropriation |
|
ACP |
||||
|
Lomé |
||||
|
Grants |
7 562,00 |
(1 756,12) |
(54,93) |
5 750,95 |
|
Interest-rate subsidies |
370,00 |
(246,51) |
(18,45) |
105,04 |
|
Emergency aid |
140,00 |
(0,01) |
(1,46) |
138,53 |
|
Aid for refugees |
120,00 |
(1,46) |
|
118,54 |
|
Risk capital |
1 000,00 |
210,23 |
(37,77) |
1 172,46 |
|
Stabex |
1 800,00 |
(1 136,53) |
34,73 |
698,21 |
|
Sysmin |
575,00 |
(453,83) |
(8,33) |
112,84 |
|
Structural adjustment |
1 400,00 |
204,83 |
(14,70) |
1 590,14 |
|
Heavily indebted poor countries |
|
1 060,00 |
|
1 060,00 |
|
Utilisation of interest income |
|
38,15 |
|
38,15 |
|
Cotonou |
||||
|
A envelope |
|
552,21 |
(61,53) |
490,68 |
|
B envelope |
|
255,00 |
|
255,00 |
|
Regional |
|
8,50 |
(8,50) |
|
|
TOTAL ACP |
12 967,00 |
(1 265,53) |
(170,94) |
11 530,53 |
|
OCT |
||||
|
Grants |
115,00 |
(68,12) |
(0,10) |
46,78 |
|
Interest-rate subsidies |
8,50 |
(6,13) |
(1,23) |
1,14 |
|
Emergency aid |
3,00 |
(3,00) |
|
|
|
Aid for refugees |
0,50 |
(0,50) |
|
|
|
Risk capital |
30,00 |
(21,50) |
|
8,50 |
|
Stabex |
5,50 |
(4,32) |
|
1,18 |
|
Sysmin |
2,50 |
|
|
2,50 |
|
TOTAL OCT |
165,00 |
(103,57) |
(1,33) |
60,11 |
|
TOTAL 8TH EDF |
13 132,00 |
(1 369,10) |
(172,26) |
11 590,64 |
Table 1.6
8TH EDF
Situation of appropriations (EUR): 31 December 2004
ANALYSIS OF MOVEMENTS DURING THE YEAR
|
(million EUR) |
||||||||||||||
|
ACP |
Lomé |
Cotonou |
Total ACP |
|||||||||||
|
Grants |
Interest rate subsidies |
Emergency aid |
Aid for refugees |
Risk capital |
STABEX |
SYSMIN |
Structural adjustment |
Heavily indebted poor countries |
Utilisation of interest income |
A Envelope |
B Envelope |
Regional |
||
|
5 805,88 |
123,49 |
139,99 |
118,54 |
1 210,23 |
663,47 |
121,17 |
1 604,83 |
1 060,00 |
38,15 |
552,21 |
255,00 |
8,50 |
11 701,47 |
|
|
(54,93) |
(18,45) |
(1,46) |
0,00 |
(37,77) |
|
(8,33) |
(14,70) |
0,00 |
0,00 |
(61,53) |
0,00 |
(8,50) |
(205,67) |
|
|
|
|
|
|
|
34,73 |
|
|
|
|
|
|
|
34,73 |
|
|
SITUATION AT 31.12.2004 |
5 750,95 |
105,04 |
138,53 |
118,54 |
1 172,46 |
698,21 |
112,84 |
1 590,14 |
1 060,00 |
38,15 |
490,68 |
255,00 |
0,00 |
11 530,53 |
|
OCT |
Grants |
Interest rate subsidies |
Emergency aid |
Aid for refugees |
Risk capital |
STABEX |
SYSMIN |
Heavily indebted poor countries |
Total OCT |
|
Situation at 31.12.2003 (5) |
46,88 |
2,37 |
0,00 |
0,00 |
8,50 |
1,18 |
2,50 |
0,00 |
61,43 |
|
(0,10) |
(1,23) |
0,00 |
0,00 |
0,00 |
0,00 |
|
|
(1,33) |
|
|
Situation at 31.12.2004 |
46,78 |
1,14 |
0,00 |
0,00 |
8,50 |
1,18 |
2,50 |
0,00 |
60,11 |
Table 1.7
9TH EDF
Situation of appropriations (EUR): 31 December 2004
ANALYSIS OF FUND BY INSTRUMENT
|
(million EUR) |
||||
|
Instrument |
Initial appropriation |
Accumulated increases or reductions in resources at 31 December 2003 |
Increases or reductions in resources during 2004 |
Current appropriation |
|
ACP |
||||
|
A envelope |
5 318,30 |
1 456,90 |
|
8 237,10 |
|
B envelope |
2 107,90 |
0,00 |
(885,47) |
1 222,43 |
|
National allocations reserve |
1 224,10 |
0,00 |
(403,76) |
820,34 |
|
CDE, CTA and Joint Assembly |
164,00 |
(99,10) |
0,00 |
64,90 |
|
Long-term dev. reserve |
257,85 |
20,01 |
93,91 |
371,77 |
|
Regional allocations |
904,00 |
10,00 |
23,13 |
937,13 |
|
Intra-ACP |
300,00 |
1 135,71 |
253,28 |
1 688,98 |
|
Implementing expenses |
125,00 |
0,00 |
0,00 |
125,00 |
|
Interest and other revenue |
0,00 |
32,22 |
4,04 |
36,25 |
|
Special allocation for Congo |
0,00 |
0,00 |
106,92 |
106,92 |
|
TOTAL ACP |
10 401,15 |
2 555,73 |
653,94 |
13 610,82 |
|
OCT |
||||
|
A envelope |
0,00 |
78,62 |
83,55 |
162,17 |
|
Long-term dev. reserve |
144,00 |
40,57 |
(81,97) |
102,59 |
|
Regional allocations |
8,00 |
17,99 |
0,47 |
26,47 |
|
Tech. assistance allocation |
2,00 |
0,00 |
0,00 |
2,00 |
|
TOTAL OCT |
154,00 |
137,18 |
2,05 |
293,22 |
|
TOTAL 9th EDF |
10 555,15 |
2 692,91 |
655,98 |
13 904,04 |
Table 1.8
9TH EDF
Situation of appropriations (EUR): 31 December 2004
ANALYSIS OF MOVEMENTS DURING THE YEAR
|
(million EUR) |
|||||||||||
|
ACP |
A envelope |
B envelope |
National allocations reserve |
CDE, CTA and Joint Assembly |
Long-term dev.reserve |
Regional allocations |
Intra-ACP |
Implementing expenses |
Interest and other revenue |
Special allocation for Congo |
Total ACP |
|
Situation at 31.12.2003 (7) (8) (9) (10) (11) (12) (13) (14) (15) (16) |
6 775,20 |
2 107,90 |
1 224,10 |
64,90 |
277,86 |
914 ,00 |
1 435,71 |
125,00 |
32,22 |
0,00 |
12 956,88 |
|
172,67 |
|
|
|
96,54 |
23 ,13 |
3,28 |
|
|
|
295,62 |
|
|
191,00 |
13 |
(204) |
|
|
|
|
|
|
|
0,00 |
|
|
532,50 |
86 |
(618) |
|
|
|
|
|
|
|
0,00 |
|
|
(47,00) |
(372) |
419 |
|
|
|
|
|
|
|
0,00 |
|
|
|
|
|
|
|
|
250,00 |
|
|
|
250,00 |
|
|
|
|
|
|
|
|
|
|
4,04 |
|
4,04 |
|
|
|
|
|
|
|
|
|
|
|
105,00 |
105,00 |
|
|
|
|
|
|
|
|
|
|
|
1,92 |
1,92 |
|
|
612,73 |
(613) |
|
|
|
|
|
|
|
|
|
|
|
|
|
|
|
(2,63) |
|
|
|
|
|
(2,63) |
|
|
Situation at 31.12.2004 |
8 237,10 |
1 222,43 |
820,34 |
64,90 |
371,77 |
937,13 |
1 688,98 |
125,00 |
36,25 |
106,92 |
13 610,82 |
|
OCT |
A envelope |
Long-term dev.reserved |
Regional Allocations |
Tech.assistance allocation |
Total OCT |
|
Situation at 31.12.2003 (7) |
78,62 |
184,57 |
25,99 |
2,00 |
291,18 |
|
0,35 |
1,23 |
0,47 |
|
2,05 |
|
|
83,20 |
(83,20) |
|
|
0,00 |
|
|
Situation at 31.12.2004 |
162,17 |
102,59 |
26,47 |
2,00 |
293,22 |
Table 1.9
6TH-7TH-8TH-9TH EDF
Increases, reductions and transfer of resources during 2004
|
(million EUR) |
|||||
|
ACP |
Total 6th EDF |
Total 7th EDF |
Total 8th EDF |
Total 9th EDF |
Net variation |
|
SITUATION AT 31.12.2003 |
7 381,99 |
10 790,99 |
11 701,47 |
12 956,88 |
|
|
Transfer to 9th EDF following the entry in force of Cotonou (Commission decision of 16 April 2003) |
(32,03) |
(57,92) |
(205,67) |
295,62 |
0,00 |
|
Interest earned on Stabex security accounts |
|
|
34,73 |
0,00 |
34,73 |
|
release of conditional billion |
|
|
|
250,00 |
250,00 |
|
interest on EDF funds in 2004 |
|
|
|
4,04 |
4,04 |
|
Special Congo — Council decision 21.7.2003 |
|
|
|
105,00 |
105,00 |
|
interest on Congo funds in 2004 |
|
|
|
1,92 |
1,92 |
|
STABEX cash loss |
|
|
|
(2,63) |
(2,63) |
|
SITUATION AT 31.12.2004 |
7 349,96 |
10 733,07 |
11 530,53 |
13 610,82 |
393,05 |
|
ACP |
Total 6th EDF |
Total 7th EDF |
Total 8th EDF |
Total 9th EDF |
Net variation |
|
SITUATION AT 31.12.2003 |
24,58 |
135,11 |
61,43 |
291,18 |
|
|
Transfer to 9th EDF following the entry in force of Cotonou (Commission decision of 16 April 2003) |
(0,21) |
(0,50) |
(1,33) |
2,05 |
0,00 |
|
SITUATION AT 31.12.2004 |
24,37 |
134,61 |
60,11 |
293,22 |
0,00 |
|
TOTAL ACP + PTOM |
7 374,33 |
10 867,68 |
11 590,64 |
13 904,04 |
393,05 |
|
TOTAL TRANSFER TO 9th EDF (ACP + PTOM) |
(32,24) |
(58,42) |
(207,00) |
297,66 |
0,00 |
Table 1.10


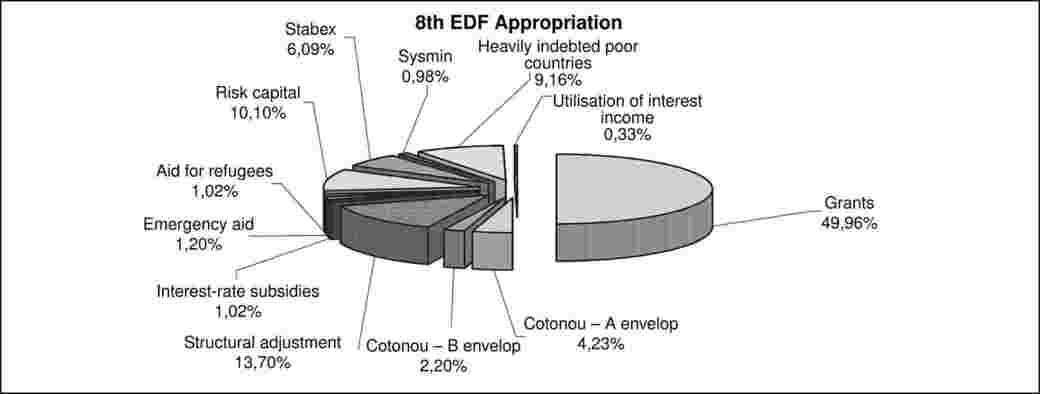
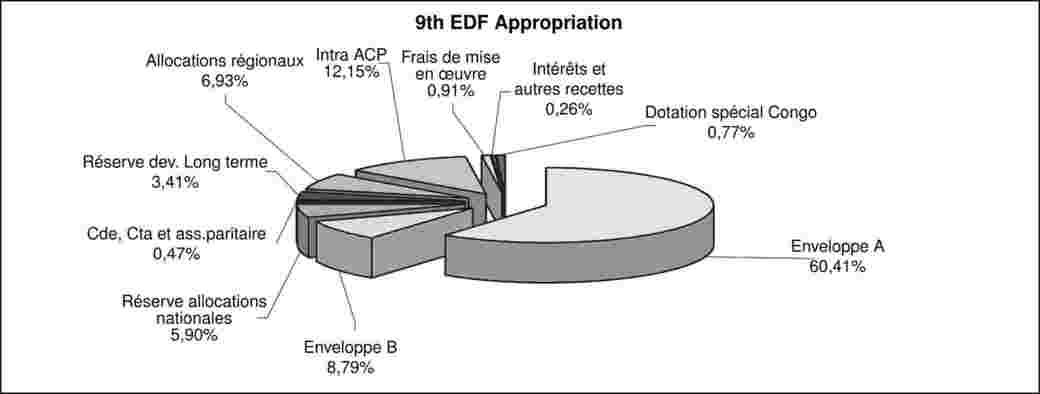
2.2. CONSOLIDATED ACCOUNTS
EDF consolidated accounts at 31.12.2004
Table 2.1
PROGRESS REPORT
|
(million EUR) |
||||||
|
|
Appropriations |
6th EDF |
7th EDF |
8th EDF |
9th EDF |
6th, 7th, 8th and 9th |
|
Lomé |
Programmable aid |
4 839,03 |
5 590,21 |
5 797,73 |
|
16 226,97 |
|
Non-programmable aid |
2 499,17 |
4 877,70 |
5 047,23 |
|
12 424,09 |
|
|
Transfers to other Funds |
91,15 |
349,77 |
|
|
440,92 |
|
|
Sundry revenue |
|
|
|
|
|
|
|
Cotonou |
A envelope |
|
|
490,68 |
8 399,26 |
8 889,94 |
|
B envelope |
|
|
255,00 |
1 222,43 |
1 477,43 |
|
|
Regional allocation |
|
|
|
963,59 |
963,59 |
|
|
Intra-ACP allocation |
10,00 |
50,00 |
|
1 688,98 |
1 748,98 |
|
|
|
CDE, CTA and Joint Assembly |
|
|
|
64,90 |
64,90 |
|
|
Countries Reserve Cotonou |
|
|
|
820,34 |
820,34 |
|
|
Long-term dev. reserve |
|
|
|
474,36 |
474,36 |
|
|
Dot.speciale dec.cons.4/04 |
|
|
|
106,92 |
106,92 |
|
|
Implementing expenses and int. |
|
|
|
163,25 |
163,25 |
|
|
Total |
7 439,35 |
10 867,68 |
11 590,64 |
13 904,04 |
43 801,71 |
|
|
EDF |
Aggregate total |
Annual figures |
|||||
|
As at 31.12.2004 |
% of appropriation |
2000 |
2001 |
2002 |
2003 |
2004 |
||
|
DECISIONS |
||||||||
|
|
6 |
7 439,35 |
100 % |
29,81 |
(14,20) |
2,84 |
(13,13) |
(32,24) |
|
|
7 |
10 867,68 |
100 % |
113,87 |
48,21 |
125,99 |
(2,60) |
(58,42) |
|
|
8 |
11 590,64 |
100 % |
3 613,74 |
1 520,15 |
1 639,56 |
255,11 |
(172,26) |
|
|
9 |
5 794,53 |
42 % |
0,00 |
|
|
3 156,44 |
2 638,08 |
|
TOTAL |
|
35 692,19 |
|
3 757,42 |
1 554,16 |
1 768,39 |
3 395,83 |
2 375,15 |
|
ASSIGNED FUNDS |
||||||||
|
|
6 |
7 378,34 |
99 % |
30,64 |
26,92 |
33,49 |
30,74 |
28,68 |
|
|
7 |
10 418,48 |
96 % |
294,74 |
294,11 |
328,12 |
311,69 |
121,42 |
|
|
8 |
9 775,16 |
84 % |
1 970,77 |
1 942,32 |
1 781,30 |
1 406,57 |
848,67 |
|
|
9 |
2 741,19 |
20 % |
|
|
|
993,70 |
1 747,48 |
|
TOTAL |
|
30 313,17 |
|
2 296,16 |
2 263,36 |
2 142,92 |
2 742,71 |
2 746,25 |
|
PAYMENTS |
||||||||
|
|
6 |
7 312,16 |
98 % |
100,84 |
50,46 |
48,53 |
47,04 |
30,00 |
|
|
7 |
9 849,57 |
91 % |
478,19 |
406,92 |
326,12 |
382,21 |
234,94 |
|
|
8 |
7 526,75 |
65 % |
969,14 |
1 610,48 |
1 478,07 |
1 472,56 |
985,34 |
|
|
9 |
1 225,22 |
9 % |
|
|
|
277,66 |
947,56 |
|
TOTAL |
|
25 913,69 |
|
1 548,16 |
2 067,86 |
1 852,72 |
2 179,47 |
2 197,84 |
|
* Negative figures represent decommitments. |
||||||||

Table 2.2
CLASS OF AID
|
(million EUR) |
|||||||||||
|
|
|
6th EDF |
% |
7th EDF |
% |
8th EDF |
% |
9th EDF |
% |
TOTAL |
% |
|
Lomé |
PROGRAMMABLE AID (NIP) |
|
|
|
|
|
|
|
|
|
|
|
Appropriation |
4 839,03 |
|
5 590,21 |
|
5 797,73 |
|
|
|
16 226,97 |
|
|
|
Decisions |
4 839,03 |
100 % |
5 590,21 |
100 % |
5 797,73 |
100 % |
|
|
16 226,97 |
100 % |
|
|
Assigned funds |
4 791,18 |
99 % |
5 256,21 |
94 % |
4 418,81 |
76 % |
|
|
14 466,20 |
89 % |
|
|
Payments |
4 731,03 |
98 % |
4 905,47 |
88 % |
3 090,59 |
53 % |
|
|
12 727,09 |
78 % |
|
|
NON-PROGRAMMABLE AID |
|
|
|
|
|
|
|
|
|
|
|
|
Appropriation |
2 499,17 |
|
4 877,70 |
|
5 047,23 |
|
|
|
12 424,09 |
|
|
|
Decisions |
2 499,17 |
100 % |
4 877,70 |
100 % |
5 047,23 |
100 % |
|
|
12 424,09 |
100 % |
|
|
Assigned funds |
2 487,78 |
100 % |
4 788,39 |
98 % |
4 903,52 |
97 % |
|
|
12 179,68 |
98 % |
|
|
Payments |
2 482,74 |
99 % |
4 589,12 |
94 % |
4 132,47 |
82 % |
|
|
11 204,33 |
90 % |
|
|
TRANSFERS FROM OTHER FUNDS |
|
|
|
|
|
|
|
|
|
|
|
|
Appropriation |
91,15 |
|
349,77 |
|
|
|
|
|
440,92 |
|
|
|
Decisions |
91,15 |
100 % |
349,77 |
100 % |
|
|
|
|
440,92 |
100 % |
|
|
Assigned funds |
89,39 |
98 % |
323,88 |
93 % |
|
|
|
|
413,27 |
94 % |
|
|
Payments |
88,39 |
97 % |
304,98 |
87 % |
|
|
|
|
393,37 |
89 % |
|
|
TOTAL |
|
|
|
|
|
|
|
|
|
|
|
|
Appropriation |
7 429,35 |
|
10 817,68 |
|
10 844,96 |
|
|
|
29 091,99 |
|
|
|
Decisions |
7 429,35 |
100 % |
10 817,68 |
100 % |
10 844,96 |
100 % |
|
|
29 091,99 |
100 % |
|
|
Assigned funds |
7 368,34 |
99 % |
10 368,48 |
96 % |
9 322,32 |
86 % |
|
|
27 059,15 |
93 % |
|
|
Payments |
7 302,16 |
98 % |
9 799,57 |
91 % |
7 223,06 |
67 % |
|
|
24 324,79 |
84 % |
|
|
Cotonou |
A ENVELOPE |
|
|
|
|
|
|
|
|
|
|
|
Appropriation |
|
|
|
|
490,68 |
|
8 399,26 |
|
8 889,94 |
|
|
|
Decisions |
|
|
|
|
490,68 |
100 % |
3 583,18 |
43 % |
4 073,85 |
46 % |
|
|
Assigned funds |
|
|
|
|
386,98 |
79 % |
1 633,99 |
19 % |
2 020,96 |
23 % |
|
|
Payments |
|
|
|
|
278,57 |
57 % |
622,03 |
7 % |
900,59 |
10 % |
|
|
B ENVELOPE |
|
|
|
|
|
|
|
|
|
|
|
|
Appropriation |
|
|
|
|
255,00 |
|
1 222,43 |
|
1 477,43 |
|
|
|
Decisions |
|
|
|
|
255,00 |
100 % |
450,51 |
37 % |
705,51 |
48 % |
|
|
Assigned funds |
|
|
|
|
65,86 |
26 % |
254,07 |
21 % |
319,93 |
22 % |
|
|
Payments |
|
|
|
|
25,12 |
10 % |
177,00 |
14 % |
202,12 |
14 % |
|
|
CDE, CTA ET ASS. PARITAIRE |
|
|
|
|
|
|
|
|
|
|
|
|
Appropriation |
|
|
|
|
|
|
64,90 |
|
64,90 |
|
|
|
Decisions |
|
|
|
|
|
|
64,85 |
100 % |
64,85 |
100 % |
|
|
Assigned funds |
|
|
|
|
|
|
36,52 |
56 % |
36,52 |
56 % |
|
|
Payments |
|
|
|
|
|
|
27,73 |
43 % |
27,73 |
76 % |
|
|
REGIONAL ALLOCATION |
|
|
|
|
|
|
|
|
|
|
|
|
Appropriation |
|
|
|
|
|
|
963,59 |
|
963,59 |
|
|
|
Decisions |
|
|
|
|
|
|
303,16 |
31 % |
303,16 |
31 % |
|
|
Assigned funds |
|
|
|
|
|
|
66,17 |
7 % |
66,17 |
7 % |
|
|
Payments |
|
|
|
|
|
|
13,72 |
1 % |
13,72 |
1 % |
|
|
INTRA-ACP ALLOCATION |
|
|
|
|
|
|
|
|
|
|
|
|
Appropriation |
10,00 |
|
50,00 |
|
|
|
1 688,98 |
|
1 748,98 |
|
|
|
Decisions |
10,00 |
100 % |
50,00 |
100 % |
|
|
1 173,42 |
69 % |
1 233,42 |
71 % |
|
|
Assigned funds |
10,00 |
100 % |
50,00 |
100 % |
|
|
592,50 |
35 % |
652,50 |
37 % |
|
|
Payments |
10,00 |
100 % |
50,00 |
100 % |
|
|
329,25 |
19 % |
389,25 |
22 % |
|
|
DOT.SPECIALE DEC.CONS.4/04 |
|
|
|
|
|
|
|
|
|
|
|
|
Appropriation |
|
|
|
|
|
|
106,92 |
|
106,92 |
|
|
|
Decisions |
|
|
|
|
|
|
91,96 |
5 % |
91,96 |
5 % |
|
|
Assigned funds |
|
|
|
|
|
|
81,63 |
5 % |
81,63 |
5 % |
|
|
Payments |
|
|
|
|
|
|
0,09 |
0 % |
0,09 |
0 % |
|
|
FRAIS DE MISE EN ŒUVRE ET INT. |
|
|
|
|
|
|
|
|
|
|
|
|
Appropriation |
|
|
|
|
|
|
163,25 |
|
163,25 |
|
|
|
Decisions |
|
|
|
|
|
|
127,45 |
78 % |
127,45 |
78 % |
|
|
Assigned funds |
|
|
|
|
|
|
76,32 |
47 % |
76,32 |
47 % |
|
|
Payments |
|
|
|
|
|
|
55,40 |
34 % |
55,40 |
34 % |
|
|
TOTAL |
|
|
|
|
|
|
|
|
|
|
|
|
Appropriation |
10,00 |
|
50,00 |
|
745,68 |
|
12 609,34 |
|
13 186,87 |
|
|
|
Decisions |
10,00 |
100 % |
50,00 |
100 % |
745,68 |
100 % |
5 794,53 |
46 % |
6 571,16 |
50 % |
|
|
Assigned funds |
10,00 |
100 % |
50,00 |
100 % |
452,84 |
61 % |
2 741,19 |
22 % |
3 268,64 |
25 % |
|
|
Payments |
10,00 |
100 % |
50,00 |
100 % |
303,69 |
41 % |
1 225,22 |
10 % |
1 582,09 |
12 % |
|
|
|
COUNTRIES RESERVE — COTONOU |
|
|
|
|
|
|
820,34 |
|
820,34 |
|
|
|
REGIONAL RESERVE — COTONOU |
|
|
|
|
|
|
|
|
|
|
|
|
RESERVE DEV.LONG TERME |
|
|
|
|
|
|
474,36 |
|
474,36 |
|
|
|
TOTAL |
|
|
|
|
|
|
|
|
|
|
|
|
Appropriation |
7 439,35 |
|
10 867,68 |
|
11 590,64 |
|
13 904,04 |
|
43 801,71 |
|
|
|
Decisions |
7 439,35 |
100 % |
10 867,68 |
100 % |
11 590,64 |
100 % |
5 794,53 |
42 % |
35 692,19 |
81 % |
|
|
Assigned funds |
7 378,34 |
99 % |
10 418,48 |
96 % |
9 775,16 |
84 % |
2 741,19 |
20 % |
30 313,17 |
69 % |
|
|
Payments |
7 312,16 |
98 % |
9 849,57 |
91 % |
7 526,75 |
65 % |
1 225,22 |
9 % |
25 913,69 |
59 % |
Table 2.3
ANALYSIS BY AID INSTRUMENT
ACP + OCT — 6th EDF
|
(million EUR) |
||||||||||
|
|
Appropriation |
Decisions |
Assigned funds |
Payments |
||||||
|
AGG. TOTAL |
ANNUAL |
% |
AGG. TOTAL |
ANNUAL |
% |
AGG. TOTAL |
ANNUAL |
% |
||
|
(1) |
(2) |
|
(2) : (1) |
(3) |
|
(3) : (2) |
(4) |
|
(4) : (3) |
|
|
ACP |
||||||||||
|
Total indicative programmes |
4 774,22 |
4 774,22 |
(31,44) |
100 |
4 727,11 |
29,78 |
99 |
4 667,48 |
26,99 |
99 |
|
LOMÉ |
|
|
|
|
|
|
|
|
|
|
|
Grants |
4 341,29 |
4 341,29 |
(31,36) |
100 |
4 296,37 |
29,73 |
99 |
4 237,22 |
27,21 |
99 |
|
Special loans |
432,93 |
432,93 |
(0,08) |
100 |
430,74 |
0,05 |
99 |
430,26 |
(0,22) |
100 |
|
Total non-programmable aid |
2 476,43 |
2 476,43 |
(0,59) |
100 |
2 465,04 |
(1,02) |
100 |
2 460,01 |
2,32 |
100 |
|
Interest-rate subsidies |
81,42 |
81,42 |
|
100 |
81,42 |
|
100 |
81,42 |
|
100 |
|
Emergency aid |
179,39 |
179,39 |
|
100 |
179,39 |
|
100 |
179,39 |
|
100 |
|
Aid for refugees |
94,77 |
94,77 |
|
100 |
94,72 |
|
100 |
94,72 |
|
100 |
|
Risk capital |
529,70 |
529,70 |
|
100 |
529,70 |
|
100 |
524,86 |
2,28 |
99 |
|
Stabex |
1 447,12 |
1 447,12 |
|
100 |
1 447,12 |
|
100 |
1 447,12 |
|
100 |
|
Sysmin |
138,02 |
138,02 |
(0,59) |
100 |
127,35 |
(1,02) |
92 |
127,15 |
0,04 |
100 |
|
Structural adjustment |
6,00 |
6,00 |
|
100 |
5,33 |
|
89 |
5,33 |
|
100 |
|
Transfer 4th EDF — 6th EDF |
89,30 |
89,30 |
|
100 |
87,54 |
(0,00) |
98 |
86,56 |
0,33 |
99 |
|
COTONOU |
|
|
|
|
|
|
|
|
|
|
|
Intra ACP Allocation |
10,00 |
10,00 |
|
100 |
10,00 |
|
100 |
10,00 |
|
100 |
|
General Reserve |
|
|
|
|
|
|
|
|
|
|
|
TOTAL ACP (a) |
7 349,96 |
7 349,96 |
(32,03) |
100 |
7 289,70 |
28,76 |
99 |
7 224,05 |
29,64 |
99 |
|
OCT |
||||||||||
|
Total indicative programmes |
64,81 |
64,81 |
(0,21) |
100 |
64,06 |
(0,09) |
99 |
63,54 |
0,36 |
99 |
|
Grants |
49,82 |
49,82 |
|
100 |
49,08 |
(0,09) |
99 |
48,56 |
0,36 |
99 |
|
Special loans |
14,98 |
14,98 |
(0,21) |
100 |
14,98 |
|
100 |
14,98 |
|
100 |
|
Total non-programmable aid |
22,73 |
22,73 |
0,00 |
100 |
22,73 |
0,00 |
100 |
22,73 |
0,00 |
100 |
|
Interest-rate subsidies |
2,60 |
2,60 |
|
100 |
2,60 |
|
100 |
2,60 |
|
100 |
|
Emergency aid |
0,51 |
0,51 |
|
100 |
0,51 |
|
100 |
0,51 |
|
100 |
|
Aid for refugees |
|
|
|
|
|
|
|
0,00 |
|
|
|
Risk capital |
14,62 |
14,62 |
|
100 |
14,62 |
|
100 |
14,62 |
|
100 |
|
Stabex |
4,00 |
4,00 |
|
100 |
4,00 |
|
100 |
4,00 |
|
100 |
|
Sysmin |
1,00 |
1,00 |
|
100 |
1,00 |
|
100 |
1,00 |
|
100 |
|
Transfer 4th EDF — 6th EDF |
1,85 |
1,85 |
|
100 |
1,85 |
|
100 |
1,83 |
|
99 |
|
TOTAL OCT (b) |
89,39 |
89,39 |
(0,21) |
100 |
88,64 |
(0,09) |
99 |
88,11 |
0,36 |
99 |
|
TOTAL (a) + (b) |
7 439,35 |
7 439,35 |
(32,24) |
100 |
7 378,34 |
28,68 |
99 |
7 312,16 |
30,00 |
99 |
Table 2.4
ANALYSIS BY AID INSTRUMENT
ACP + OCT — 7th EDF
|
(million EUR) |
||||||||||
|
|
Appropriations |
Decisions |
Assigned funds |
Payments |
||||||
|
AGG. TOTAL |
ANNUAL |
% |
AGG. TOTAL |
ANNUAL |
% |
AGG. TOTAL |
ANNUAL |
% |
||
|
(1) |
(2) |
|
(2) : (1) |
(3) |
|
(3) : (2) |
(4) |
|
(4) : (3) |
|
|
ACP |
||||||||||
|
Total indicative programmes |
5 503,20 |
5 503,20 |
(42,07) |
100 |
5 172,96 |
126,51 |
94 |
4 826,00 |
195,59 |
93 |
|
LOMÉ |
|
|
|
|
|
|
|
|
|
|
|
Total non-programmable aid |
4 839,93 |
4 839,93 |
(12,24) |
100 |
4 751,72 |
(8,45) |
98 |
4 553,16 |
21,64 |
96 |
|
Interest-rate subsidies |
200,15 |
200,15 |
(5,21) |
100 |
200,15 |
(5,21) |
100 |
198,44 |
0,67 |
99 |
|
Emergency aid |
403,35 |
403,35 |
(1,47) |
100 |
403,28 |
(0,72) |
100 |
403,13 |
(0,42) |
100 |
|
Aid for refugees |
84,87 |
84,87 |
(1,31) |
100 |
84,41 |
(0,70) |
99 |
84,22 |
0,04 |
100 |
|
Risk capital |
818,10 |
818,10 |
(3,43) |
100 |
818,10 |
(2,93) |
100 |
752,14 |
10,07 |
92 |
|
Stabex |
1 696,69 |
1 696,69 |
0,00 |
100 |
1 696,69 |
0,00 |
100 |
1 583,83 |
(9,03) |
93 |
|
Sysmin |
446,29 |
446,29 |
(0,02) |
100 |
360,21 |
1,11 |
81 |
342,85 |
20,18 |
95 |
|
Structural adjustment |
1 150,48 |
1 150,48 |
(0,80) |
100 |
1 148,88 |
|
100 |
1 148,54 |
0,12 |
100 |
|
Heavily indebted poor countries |
40,00 |
40,00 |
|
100 |
40,00 |
|
100 |
40,00 |
|
100 |
|
Transfer 5th EDF — 7th EDF |
339,93 |
339,93 |
(3,61) |
100 |
314,82 |
2,52 |
93 |
296,98 |
10,12 |
94 |
|
Sundry Revenue |
|
|
|
|
|
|
|
|
|
|
|
COTONOU |
|
|
|
|
|
|
|
|
|
|
|
Intra-ACP Allocation |
50,00 |
50,00 |
|
100 |
50,00 |
0,00 |
100 |
50,00 |
|
100 |
|
General Reserve |
|
|
|
|
|
|
|
|
|
|
|
TOTAL ACP (a) |
10 733,07 |
10 733,07 |
(57,92) |
100 |
10 289,50 |
120,58 |
96 |
9 726,14 |
227,35 |
95 |
|
OCT |
||||||||||
|
Total indicative programmes |
87,01 |
87,01 |
(0,50) |
100 |
83,25 |
0,03 |
96 |
79,47 |
7,47 |
95 |
|
Total non-programmable aid |
37,77 |
37,77 |
0,00 |
100 |
36,67 |
0,80 |
97 |
35,96 |
0,15 |
98 |
|
Interest-rate subsidies |
4,22 |
4,22 |
|
100 |
4,22 |
|
100 |
4,22 |
|
100 |
|
Emergency aid |
2,26 |
2,26 |
|
100 |
2,26 |
|
100 |
2,26 |
|
100 |
|
Aid for refugees |
0,29 |
0,29 |
|
100 |
0,29 |
|
100 |
0,29 |
|
100 |
|
Risk capital |
22,49 |
22,49 |
|
100 |
22,49 |
|
100 |
22,49 |
|
100 |
|
Stabex |
6,00 |
6,00 |
|
100 |
6,00 |
|
100 |
6,00 |
|
100 |
|
Sysmin |
2,50 |
2,50 |
|
100 |
1,40 |
0,80 |
56 |
0,69 |
0,15 |
49 |
|
Transfer 5th EDF — 7th EDF |
9,84 |
9,84 |
|
100 |
9,06 |
(0,00) |
92 |
8,00 |
(0,03) |
88 |
|
TOTAL OCT (b) |
134,61 |
134,61 |
(0,50) |
100 |
128,99 |
0,84 |
96 |
123,43 |
7,59 |
96 |
|
TOTAL (a) + (b) |
10 867,68 |
10 867,68 |
(58,42) |
100 |
10 418,48 |
121,42 |
96 |
9 849,57 |
234,94 |
95 |
Table 2.5
ANALYSIS BY AID INSTRUMENT
ACP + OCT — 8th EDF
|
(million EUR) |
||||||||||
|
|
Appropriations |
Decisions |
Assigned funds |
Payments |
||||||
|
AGG. TOTAL |
ANNUAL |
% |
AGG. TOTAL |
ANNUELS |
% |
AGG. TOTAL |
ANNUELS |
% |
||
|
(1) |
(2) |
|
(2) : (1) |
(3) |
|
(3) : (2) |
(4) |
|
(4) : (3) |
|
|
ACP |
||||||||||
|
Total indicative programmes |
5 750,95 |
5 750,95 |
(54,93) |
100 |
4 382,94 |
668,56 |
76 |
3 065,47 |
788,06 |
70 |
|
LOMÉ |
|
|
|
|
|
|
|
|
|
|
|
Total non-programmable aid |
5 033,90 |
5 033,90 |
(45,97) |
100 |
4 891,97 |
88,49 |
97 |
4 124,98 |
78,54 |
84 |
|
Interest-rate subsidies |
105,04 |
105,04 |
(18,45) |
100 |
105,04 |
(18,45) |
100 |
63,71 |
8,88 |
61 |
|
Emergency aid |
138,53 |
138,53 |
(1,46) |
100 |
137,82 |
(0,70) |
99 |
134,87 |
2,45 |
98 |
|
Aid for refugees |
118,54 |
118,54 |
0,00 |
100 |
111,27 |
11,39 |
94 |
83,28 |
26,51 |
75 |
|
Risk capital |
1 172,46 |
1 172,46 |
(37,77) |
100 |
1 120,75 |
27,08 |
96 |
818,15 |
127,94 |
73 |
|
Stabex |
698,21 |
698,21 |
34,73 |
100 |
685,29 |
33,98 |
98 |
364,37 |
(199,79) |
53 |
|
Sysmin |
112,84 |
112,84 |
(8,33) |
100 |
102,75 |
7,59 |
91 |
91,02 |
6,54 |
89 |
|
Structural adjustment |
1 590,14 |
1 590,14 |
(14,70) |
100 |
1 535,53 |
20,86 |
97 |
1 479,66 |
89,57 |
96 |
|
Heavily indebted poor countries |
1 060,00 |
1 060,00 |
0,00 |
100 |
1 060,00 |
0,00 |
100 |
1 060,00 |
0,00 |
100 |
|
Utilisation of interest income |
38,15 |
38,15 |
0,00 |
100 |
33,52 |
6,74 |
88 |
29,92 |
16,44 |
89 |
|
TOTAL |
10 784,85 |
10 784,85 |
(100,91) |
100 |
9 274,92 |
757,05 |
86 |
7 190,45 |
866,60 |
78 |
|
COTONOU |
|
|
|
|
|
|
|
|
|
|
|
A Envelope |
490,68 |
490,68 |
(61,53) |
100 |
386,98 |
51,47 |
79 |
278,57 |
98,89 |
72 |
|
B Envelope |
255,00 |
255,00 |
|
100 |
65,86 |
38,65 |
26 |
25,12 |
4,92 |
38 |
|
Regional allocation |
0,00 |
0,00 |
(8,50) |
|
0,00 |
0,00 |
|
|
|
|
|
TOTAL |
745,68 |
745,68 |
(61,53) |
100 |
452,84 |
90,12 |
61 |
303,69 |
103,81 |
67 |
|
TOTAL ACP (a) |
11 530,53 |
11 530,53 |
(170,94) |
100 |
9 727,75 |
847,17 |
84 |
7 494,13 |
970,41 |
77 |
|
OCT |
||||||||||
|
Total indicative programmes |
46,78 |
46,78 |
(0,10) |
100 |
35,86 |
2,06 |
77 |
25,12 |
11,56 |
70 |
|
Total non-programmable aid |
13,32 |
13,32 |
(1,23) |
100 |
11,54 |
(0,56) |
87 |
7,49 |
3,36 |
65 |
|
Interest-rate subsidies |
1,14 |
1,14 |
(1,23) |
100 |
1,14 |
(1,23) |
100 |
1,14 |
0,06 |
100 |
|
Emergency aid |
|
|
|
|
|
|
|
|
|
|
|
Aid for refugees |
0,00 |
0,00 |
|
|
|
|
|
|
|
|
|
Risk capital |
8,50 |
8,50 |
|
100 |
8,50 |
|
100 |
4,83 |
3,00 |
57 |
|
Stabex |
1,18 |
1,18 |
|
100 |
1,18 |
|
100 |
1,18 |
|
100 |
|
Sysmin |
2,50 |
2,50 |
|
100 |
0,72 |
0,67 |
|
0,34 |
0,31 |
|
|
TOTAL OCT (b) |
60,11 |
60,11 |
(1,33) |
100 |
47,41 |
1,51 |
79 |
32,62 |
14,92 |
69 |
|
TOTAL (a) + (b) |
11 590,64 |
11 590,64 |
(172,26) |
100 |
9 775,16 |
848,67 |
84 |
7 526,75 |
985,34 |
77 |
Table 2.6
ANALYSIS BY AID INSTRUMENT
ACP + OCT — 9th EDF
|
(million EUR) |
||||||||||
|
|
Appropriations |
Decisions |
Assigned funds |
Payments |
||||||
|
AGG. TOTAL |
ANNUAL |
% |
AGG. TOTAL |
ANNUAL |
% |
AGG. TOTAL |
ANNUAL |
% |
||
|
(1) |
(2) |
|
(2) : (1) |
(3) |
|
(3) : (2) |
(4) |
|
(4) : (3) |
|
|
ACP |
||||||||||
|
A Envelope |
8 237,10 |
3 536,27 |
1 708,10 |
43 |
1 606,68 |
1 063,64 |
45 |
615,42 |
547,66 |
38 |
|
Macroeconomic support |
|
1 081,14 |
382,74 |
|
869,95 |
362,35 |
|
390,89 |
329,39 |
|
|
Sectoral Policies |
|
2 455,13 |
1 325,36 |
|
736,74 |
701,30 |
|
224,53 |
218,27 |
|
|
B Envelope |
1 222,43 |
450,51 |
230,22 |
37 |
254,07 |
204,57 |
56 |
177,00 |
139,44 |
70 |
|
Compensation export earnings |
|
79,77 |
43,28 |
|
24,70 |
24,70 |
|
20,67 |
20,67 |
|
|
Emergency aid |
|
363,14 |
179,34 |
|
221,77 |
172,27 |
|
156,33 |
118,77 |
|
|
Heavily indebted poor countries |
|
7,60 |
7,60 |
|
7,60 |
7,60 |
|
|
|
|
|
Regional Allocation |
937,13 |
296,07 |
127,66 |
32 |
65,32 |
57,84 |
22 |
13,48 |
11,88 |
21 |
|
Intra-ACP Allocation |
1 688,98 |
1 173,42 |
413,62 |
69 |
592,50 |
218,12 |
50 |
329,25 |
158,89 |
56 |
|
Other |
64,90 |
64,85 |
26,97 |
100 |
36,52 |
36,52 |
56 |
27,73 |
27,73 |
76 |
|
Implementing expenses |
125,00 |
125,00 |
|
100 |
74,75 |
56,27 |
60 |
54,81 |
54,81 |
73 |
|
Interest and other receipts |
36,25 |
1,80 |
1,80 |
5 |
1,12 |
1,12 |
62 |
0,27 |
0,27 |
24 |
|
Special allocation for Congo |
106,92 |
91,96 |
91,96 |
86 |
81,63 |
81,63 |
89 |
0,09 |
0,09 |
0 |
|
TOTAL |
12 418,71 |
5 739,88 |
2 600,33 |
46 |
2 712,59 |
1 719,70 |
47 |
1 218,05 |
940,78 |
45 |
|
Countries reserve — Cotonou |
820,34 |
|
|
|
|
|
|
|
|
|
|
Reserve dev.long terme |
371,77 |
|
|
|
|
|
|
|
|
|
|
TOTAL ACP (a) |
13 610,82 |
5 739,88 |
2 600,33 |
42 |
2 712,59 |
1 719,70 |
47 |
1 218,05 |
940,78 |
45 |
|
OCT |
||||||||||
|
A Envelope |
162,17 |
46,90 |
31,31 |
29 |
27,30 |
26,94 |
58 |
6,61 |
6,47 |
24 |
|
Macroeconomic support |
|
|
|
|
|
|
|
|
|
|
|
Sectoral Policies |
|
46,90 |
31,31 |
|
27,30 |
26,94 |
|
6,61 |
6,47 |
|
|
Regional Allocation |
26,47 |
7,10 |
6,45 |
27 |
0,84 |
0,84 |
12 |
0,25 |
0,25 |
29 |
|
Support expenses |
2,00 |
0,65 |
|
33 |
0,45 |
|
69 |
0,32 |
0,06 |
70 |
|
Long-term development budget |
102,59 |
|
|
|
|
|
|
|
|
|
|
Total OCT (b) |
293,22 |
54,65 |
37,75 |
19 |
28,60 |
27,78 |
52 |
7,17 |
6,78 |
25 |
|
Total (a) + (b) |
13 904,04 |
5 794,53 |
2 638,08 |
42 |
2 741,19 |
1 747,48 |
47 |
1 225,22 |
947,56 |
45 |
Table 2.7
ANNUAL 2004 GROSS FIGURES BY INSTRUMENT FOR DECISIONS AND PAYMENTS
Annual decision 2004
|
(million EUR) |
||||
|
|
|
Commitments |
Decommitments |
Net |
|
Lomé |
GRANTS |
0,00 |
(128,97) |
(128,97) |
|
SPECIAL LOANS |
0,00 |
(0,29) |
(0,29) |
|
|
TOTAL INDICATIVE PROGRAMME |
0,00 |
(129,26) |
(129,26) |
|
|
INTEREST RATE SUBSIDIES |
0,00 |
(24,88) |
(24,88) |
|
|
EMERGENCY AID |
0,00 |
(2,94) |
(2,94) |
|
|
AID FOR REFUGIES |
0,00 |
(1,31) |
(1,31) |
|
|
RISK CAPITAL |
0,00 |
(41,20) |
(41,20) |
|
|
STABEX ( INTERETS) |
34,73 |
0,00 |
34,73 |
|
|
SYSMIN |
0,00 |
(8,94) |
(8,94) |
|
|
TRANSFER FROM OTHER FUNDS |
0,00 |
(3,61) |
(3,61) |
|
|
STRUCTURAL ADJUSTMENT |
0,00 |
(15,50) |
(15,50) |
|
|
TOTAL NON PROGRAMMABLE AID |
34,73 |
(98,38) |
(63,64) |
|
|
USE OF INTERESTS |
|
|
|
|
|
Total |
34,73 |
(227,63) |
(192,90) |
|
|
Cotonou |
A ENVELOPE |
1 739,51 |
(61,63) |
1 677,87 |
|
B ENVELOPE |
230,22 |
0,00 |
230,22 |
|
|
CDE+CTA+JOINT ASSEMBLY |
26,97 |
0,00 |
26,97 |
|
|
REGIONAL PROJECTS |
134,12 |
(8,51) |
125,61 |
|
|
INTRA ACP |
413,62 |
0,00 |
413,62 |
|
|
INTRA ACP DEBT RELIEF |
0,00 |
0,00 |
0,00 |
|
|
SPECIAL ALLOCATION FOR CONGO |
91,96 |
0,00 |
91,96 |
|
|
IMPLEMENTING EXPENSES & USE OF INTEREST |
1,80 |
0,00 |
1,80 |
|
|
Total |
2 638,20 |
(70,14) |
2 568,05 |
|
|
Total |
2 672,93 |
(297,78) |
2 375,15 |
|
Annual payments 2004
|
(million EUR) |
||||
|
|
|
Paid |
Recovered |
Net |
|
Lomé |
GRANTS |
1 075,07 |
(44,81) |
1 030,26 |
|
SPECIAL LOANS |
0,08 |
(0,30) |
(0,22) |
|
|
TOTAL INDICATIVE PROGRAMME |
1 075,15 |
(45,11) |
1 030,04 |
|
|
INTEREST RATE SUBSIDIES |
9,78 |
(0,16) |
9,62 |
|
|
EMERGENCY AID |
2,48 |
(0,45) |
2,03 |
|
|
AID FOR REFUGIES |
26,89 |
(0,34) |
26,55 |
|
|
RISK CAPITAL |
143,28 |
0,00 |
143,28 |
|
|
STABEX SECURITY |
(208,81) |
|
(208,81) |
|
|
SYSMIN |
27,36 |
(0,14) |
27,22 |
|
|
TRANSFER FROM OTHER FUNDS |
11,20 |
(0,79) |
10,42 |
|
|
STRUCTURAL ADJUSTMENT |
89,73 |
(0,05) |
89,68 |
|
|
TOTAL NON PROGRAMMABLE AID |
101,91 |
(1,93) |
99,98 |
|
|
USE OF INTERESTS |
16,45 |
(0,01) |
16,44 |
|
|
Total |
1 193,51 |
(47,05) |
1 146,46 |
|
|
Cotonou |
A ENVELOPE |
654,66 |
(1,64) |
653,03 |
|
B ENVELOPE |
144,39 |
(0,03) |
144,36 |
|
|
CDE+CTA+JOINT ASSEMBLY |
27,73 |
0,00 |
27,73 |
|
|
REGIONAL PROJECTS |
12,27 |
(0,15) |
12,12 |
|
|
INTRA ACP |
58,93 |
(0,03) |
58,89 |
|
|
INTRA ACP DEBT RELIEF |
100,00 |
0,00 |
100,00 |
|
|
TECHNICAL ASSISTANCE, OCT |
0,07 |
(0,00) |
0,06 |
|
|
SPECIAL ALLOCATION FOR CONGO |
0,09 |
0,00 |
0,09 |
|
|
IMPLEMENTING EXPENSES & USE OF INTEREST |
56,49 |
(1,41) |
55,08 |
|
|
Total |
1 054,63 |
(3,26) |
1 051,37 |
|
|
Total |
2 248,15 |
(50,31) |
2 197,84 |
|
2.3. SITUATION BY COUNTRY AND BY INSTRUMENT
2.3.1. 6TH EDF
Notes to the management accounts:
|
(a) |
In tables 3.1.1 to 3.1.8, the figure ‘0,0’ indicates that the corresponding amount is between EUR - 4 999 and EUR 4 999. Where no figure is given, the amount is equal to zero. Countries with a nil balance in all columns are not listed in the tables. |
|
(b) |
In all tables the heading ‘All countries ACP’ refers to projects which cover a number of countries but are not financed by regional cooperation. |
|
(c) |
In all tables the heading ‘Financial and administrative expenses’ represents projects financed by EDF interest which have been transferred to a financial instrument (grants, Structural Adjustment Facility) with the exception of one amount of EUR 1 million financed from the ‘grants’ appropriation and used for posting bank charges and exchange rate differences. |
|
(d) |
In the first column of tables 3.1.1 and 3.1.2, the allocation for ‘Regional cooperation’ (EUR 873,82 million) corresponds to the Commission’s regional cooperation target for ACP states only (EUR 912,23 million) minus the amount transferred during the years 2000, 2001 and 2002 to the general reserve according the transitional measures (i.e. EUR 1 million, EUR 1,36 million and 0,16 million EUR) and EUR 28,9 million transferred to 9th EDF following the entry in force of Cotonou in 2003 and 6,9 millions in 2004. |
|
(e) |
All the amounts of appropriations are the same of those of decisions since the amounts not committed have been transferred to 9th EDF following the entry in force of Cotonou (Commission Decision of 16 April 2003). |
The relatives tables are attached in appendix.
2.3.2. 7TH EDF
Notes to the management accounts:
|
— |
In tables 3.2.1 to 3.2.8, the figure ‘0,0’ indicates that the corresponding amount is between EUR - 4 999 and EUR 4 999. Where no figure is given, the amount is equal to zero. Countries with a nil balance in all columns are not listed in the tables. |
|
— |
In all tables the heading ‘All countries ACP’ refers to projects which cover a number of countries but are not financed by regional cooperation. |
|
— |
In all tables the heading ‘Financial and administrative expenses’ represents projects financed by EDF interest which have been transferred to a financial instrument (grants, Structural Adjustment Facility). |
|
— |
In the first column of tables 3.2.1 and 3.2.2, the allocation for ‘Regional Cooperation’ (EUR 1 136,42 million) is composed as follows:
|
|
— |
All the amounts of appropriations are the same of those of decisions since the amounts not committed have been transferred to 9th EDF following the entry into force of Cotonou (Commission Decision of 16 April 2003). |
The relatives tables are attached in appendix.
2.3.3. 8TH EDF
Notes to the management accounts:
|
(a) |
In tables 3.3.1 to 3.3.8, the figure ‘0,0’ indicates that the corresponding amount is between EUR - 4 999 and EUR 4 999. Where no figure is given, the amount is equal to zero. Countries with a nil balance in all columns are not listed in the tables. |
|
(b) |
In all tables the heading ‘All countries ACP’ refers to projects which cover a number of countries but are not financed by regional cooperation. |
|
(c) |
In all tables the heading ‘Financial and administrative expenses’ represents projects financed by EDF interest which have been transferred to a financial instrument (grants, Structural Adjustment Facility). |
|
(d) |
In the third column of tables 1 and 2, the allocation for ‘Regional Cooperation’ (EUR 1 450,56 million) is composed as follows:
|
|
(e) |
All the amounts of appropriations are the same of those of decisions since the amounts not committed have been transferred to 9th EDF following the entry in force of Cotonou (Commission Decision of 16 April 2003). |
The relatives tables are attached in appendix.
2.3.4. 9TH EDF
Notes to the management accounts:
|
(a) |
In tables 3.4.1 to 3.4.8, the figure ‘0,0’ indicates that the corresponding amount is between EUR - 4 999 and EUR 4 999. Where no figure is given, the amount is equal to zero. Countries with a nil balance in all columns are not listed in the tables. |
|
(b) |
In all tables the presentation has been made taking in account the financial resources (envelope A, envelope B and implementation costs) used and the nature of the project (macroeconomic support, sectoral policies, emergency assistance etc.). |
The relatives tables are attached in appendix.
2.3.5. ALL EDF
The total amount of cumulated and annual payments includes an amount of EUR 352,03 million which corresponds to Stabex payments transferred to security account Stabex in 2001. In 2004 the Commission has decided to regularise these operations. As a result of the regularisation, a net (negative) amount of € 209 million was booked as payments in the 2004 EDF accounts. The interests gained on the secured account during the concerned period (2001 — 2004) have been booked as new commitments (€ 34,7 million) and as additional allocations.
The relatives tables are attached in appendix.
2.4. OTHER MANAGEMENT INFORMATION
Table 4.1.1
STATUS OF ‘SLEEPING’ COMMITMENTS
The tables below set out, for each of the allocations of the 6th, 7th and 8th EDFs, commitments for which implementation is slow. A commitment is regarded as ‘dormant’ or ‘slow’ if, over the 24 months before the end of the 2004 financial year:
|
— |
no new contract has been concluded |
|
— |
no existing contract has been revised |
|
— |
no payment or advance has been made. |
Projects which have been dormant since before 1999 (old outstanding commitments) are not included in this table.
Slow commitments have been broken down into three categories:
|
|
Projects which must remain open, projects to be closed, projects whose status is unknown. |
|
|
The book values given represent the sum of unpaid commitments known as unexpended balances or RALs. |
|
|
Some commentary is given in the notes below as regards projects with a book value of more than EUR 1 million, which must remain open despite appearing inactive, and projects for which no proof of status has been obtained. |
|
ALLOCATIONS |
6 |
7 |
8 |
TOTAL |
||||||||||||
|
AMOUNT UNPAID |
BALANCE TO REMAIN OPEN |
BALANCE TO BE CLOSED |
STATUS UNKNOWN |
AMOUNT UNPAID |
BALANCE TO REMAIN OPEN |
BALANCE TO BE CLOSED |
STATUS UNKNOWN |
AMOUNT UNPAID |
BALANCE TO REMAIN OPEN |
BALANCE TO BE CLOSED |
STATUS UNKNOWN |
AMOUNT UNPAID |
BALANCE TO REMAIN OPEN |
BALANCE TO BE CLOSED |
STATUS UNKNOWN |
|
|
PROGRAMMABLE AID |
0,33 |
|
0,12 |
0,20 |
11,44 |
6,68 |
0,65 |
4,11 |
146,92 |
110,34 |
29,37 |
7,20 |
158,68 |
117,02 |
30,14 |
11,52 |
|
SAF |
0,00 |
|
|
|
0,00 |
|
|
|
16,86 |
4,96 |
11,64 |
0,26 |
16,86 |
4,96 |
11,64 |
0,26 |
|
EMERGENCY AID |
0,00 |
|
|
|
0,00 |
|
|
|
1,29 |
0,03 |
|
1,26 |
1,29 |
0,03 |
0,00 |
1,26 |
|
AID FOR REFUGEES |
0,00 |
|
|
|
0,00 |
|
|
|
0,67 |
0,53 |
|
0,14 |
0,67 |
0,53 |
0,00 |
0,14 |
|
STABEX |
0,00 |
|
|
|
0,00 |
|
|
|
197,50 |
197,50 |
|
|
197,50 |
197,50 |
0,00 |
0,00 |
|
SYSMIN |
0,00 |
|
|
|
0,00 |
|
|
|
0,14 |
|
0,14 |
0,00 |
0,14 |
0,00 |
0,14 |
0,00 |
|
INTEREST SUBSIDIES |
0,00 |
|
|
|
0,00 |
|
|
|
21,34 |
21,34 |
|
|
21,34 |
21,34 |
0,00 |
0,00 |
|
RISK CAPITAL |
2,44 |
2,44 |
|
|
12,00 |
12,00 |
|
|
101,71 |
92,26 |
9,45 |
|
116,15 |
106,70 |
9,45 |
0,00 |
|
Grand Total |
2,77 |
2,44 |
0,12 |
0,20 |
23,44 |
18,68 |
0,65 |
4,11 |
486,42 |
426,96 |
50,60 |
8,86 |
512,63 |
448,07 |
51,37 |
13,18 |
Breakdown of dormant sleeping commitments (TRO): Projects with outstanding commitments of over € 1 million
1. Stabex projects
|
(million EUR) |
|||
|
Country |
Projects |
Amount unspent |
|
|
8th EDF |
Burundi |
Coffee |
8,7 |
|
Ethiopia |
Hides and skins |
4,5 |
|
|
Madagascar |
Coffee |
11,1 |
|
|
Mauritania |
Squid, octopus and cuttlefish |
14,7 |
|
|
Rwanda |
Coffee |
3,4 |
|
|
Rwanda |
Hides and skins |
1,1 |
|
|
Senegal |
Oil |
2,4 |
|
|
Sierra Leone |
Coffee |
2,0 |
|
|
Sudan |
Cotton, Stabex 98 |
4,8 |
|
|
Sudan |
Cotton, Stabex 99 |
44,9 |
|
|
Tanzania |
Coffee |
26,2 |
|
|
Tanzania |
Green coffee |
1,0 |
|
|
Togo |
Oil cakes |
1,4 |
|
|
Togo |
Coffee |
2,0 |
|
|
Togo |
Cotton |
3,0 |
|
|
Uganda |
Hides and Skins |
1,0 |
|
|
St Lucia |
Bananas |
3,1 |
|
|
Solomon Islands |
Coconut products |
1,9 |
|
|
Solomon Islands |
Palm products |
10,2 |
|
|
Solomon Islands |
Timber |
13,8 |
|
|
Total |
161,2 |
||
2. Slow starters
These are primarily projects for which contracts have not yet been awarded. This may be because the tender procedure had to be cancelled to comply with the rules of sound financial management (non-compliant bids, procedural failures by the beneficiary administration) or the start has been delayed (e.g. amendments had to be made to the financing agreement). In the case of budgetary support/structural adjustment projects, audits on previous instalments and/or those needed for payment of instalments have not been completed yet.
|
(million EUR) |
|||
|
Country |
Projects |
Amount unspent |
|
|
7th EDF |
Ethiopia |
Church conservation in Lalibela |
4,0 |
|
8th EDF |
Cameroon |
Institutional support for decentralisation |
23,4 |
|
Rep. Congo |
Supporting the rule of law |
14,3 |
|
|
Ethiopia |
Church conservation in Lalibela |
5,1 |
|
|
Ethiopia |
Water supply |
6,0 |
|
|
Gabon |
Economic reform |
4,9 |
|
|
Mauritania |
Renovation of ore port |
45,0 |
|
|
All countries |
Multi-country demobilisation |
10,0 |
|
|
Total |
112,7 |
||
3. Ongoing projects which do not entail payments during the reference period and EIB projects for which the contract has not yet been signed.
|
(million EUR) |
|||
|
Country |
Projects |
Amount unspent |
|
|
6th EDF |
Mozambique |
Private sector support |
1,9 |
|
7th EDF |
Rwanda |
Kigali international airport |
6 |
|
8th EDF |
Benin |
Optb ii |
6,5 |
|
Benin |
Global loan to financial sector |
3,8 |
|
|
Caribbean region |
Dflsa global facilities |
5,0 |
|
|
Caribbean region |
Tiona fund |
1,6 |
|
|
Dominican Rep. |
Financial sector |
4,5 |
|
|
Guyana |
Power project |
20,0 |
|
|
Haiti |
Metropolitan water |
6,0 |
|
|
Haiti |
Metropolitan water |
10,0 |
|
|
Malawi |
Blantyre hotels |
2,0 |
|
|
Mauritius |
Sewerage project |
7,5 |
|
|
Mauritius |
SSR airport extension |
3,0 |
|
|
Mauritius |
Water project |
3,5 |
|
|
Mozambique |
Motraco ii |
1,9 |
|
|
Mozambique |
RSA natural gas project |
35,0 |
|
|
St Lucia |
Bank of St Lucia |
3,0 |
|
|
Trinidad |
Caribbean microfinance |
4,0 |
|
|
Total |
125,2 |
||
4. Technically completed projects for which financial advances were granted but remain either unaccounted for or refundable. Projects for which, despite regularisation measures undertaken in particular by the National Authorising Officers of the ACP countries concerned, supporting documents or repayment had not been received by 31 December 2004
|
(million EUR) |
|||
|
Country |
Projects |
Amount unspent |
|
|
7th EDF |
Angola |
Micro projects |
1,0 |
|
Nigeria |
Support for elections |
1,0 |
|
|
8th EDF |
Botswana |
Community forestry development |
1,0 |
|
Total |
3,0 |
||
Table 4.2.1
UNFINALIZED PAYING AGENTS' CASHFLOWS
Revenue and expenditure on paying agents' accounts still to be entered in the authorizing officer's accounts at the end of 2004 (shown by beneficiary country).
At the date of publication of the financial statements, the vast majority of the revenues and expenditures in question have been recorded in the accounts of the projects concerned.
|
(EUR '000) |
|||
|
Country |
revenue/expenditure |
total |
|
|
pre 2004 |
during 2004 |
||
|
Total ACP states |
3 433,47 |
2 924,17 |
6 357,64 |
|
ANTIGUA AND BARBUDA |
0,00 |
4,37 |
4,37 |
|
BARBADOS |
32,14 |
0,00 |
32,14 |
|
BELIZE |
0,00 |
145,75 |
145,75 |
|
BENIN |
0,00 |
(135,44) |
(135,44) |
|
BOTSWANA |
0,00 |
(5,58) |
(5,58) |
|
BURUNDI |
0,03 |
(430,51) |
(430,48) |
|
CENTRAFRICA |
(30,76) |
41,60 |
10,84 |
|
CHAD |
51,23 |
0,00 |
51,23 |
|
CAMEROON |
75,70 |
81,97 |
157,67 |
|
CONGO BRAZZAVILLE |
39,76 |
131,51 |
171,27 |
|
COMORES |
0,00 |
(0,00) |
(0,00) |
|
CAP VERTE |
0,00 |
(7,02) |
(7,02) |
|
DOMINICAN REPUBLIC |
(24,26) |
(80,47) |
(104,72) |
|
DOMINICA |
0,52 |
0,00 |
0,52 |
|
EQUATORIAL GUINEA |
261,98 |
26,63 |
288,61 |
|
ETHIOPIA |
(0,74) |
(0,33) |
(1,07) |
|
GABON |
(10,60) |
91,18 |
80,59 |
|
GHANA |
0,00 |
467,27 |
467,27 |
|
GAMBIA |
29,17 |
54,20 |
83,37 |
|
GUINEA BISSAU |
119,62 |
379,32 |
498,94 |
|
GUINEA |
21,81 |
0,00 |
21,81 |
|
HAITI |
0,00 |
97,44 |
97,44 |
|
JAMAICA |
0,00 |
(0,49) |
(0,49) |
|
KIRIBATI |
0,00 |
29,05 |
29,05 |
|
LESOTHO |
3,95 |
0,00 |
3,95 |
|
MADAGASCAR |
415,67 |
0,00 |
415,67 |
|
MALAWI |
174,01 |
0,00 |
174,01 |
|
MAURETANIE |
0,00 |
121,67 |
121,67 |
|
NAMIBIA |
210,50 |
6,53 |
217,03 |
|
PAPOUASIA NEW GUINEA |
24,41 |
1 381,14 |
1 405,56 |
|
RWANDA |
53,67 |
0,00 |
53,67 |
|
SENEGAL |
0,00 |
(28,82) |
(28,82) |
|
SOLOMON ISLAND |
0,00 |
(197,75) |
(197,75) |
|
SAO TOME & PRINCIPE |
1,55 |
(67,58) |
(66,03) |
|
SWAZILAND |
0,00 |
451,29 |
451,29 |
|
TANZANIA |
37,95 |
(58,89) |
(20,94) |
|
TOGO |
0,00 |
123,34 |
123,34 |
|
TRINIDAD AND TOBAGO |
(14,70) |
157,57 |
142,87 |
|
UGANDA |
354,18 |
(81,66) |
272,52 |
|
VANUATU |
0,00 |
(3,03) |
(3,03) |
|
ZAMBIA |
1 423,89 |
0,00 |
1 423,89 |
|
ZIMBABWE |
0,54 |
0,00 |
0,54 |
|
OTHER ACP (REGIONAL, ETC.) |
182,22 |
229,90 |
412,12 |
|
OCT |
2,71 |
0,00 |
2,71 |
|
TOTAL |
3 436,18 |
2 924,17 |
6 360,35 |
|
Situation at 31 December 2003: |
|
|
9 859,85 |
|
Annual change: |
|
|
(35,49 %) |
Table 4.2.2
ADVANCES FOR STUDY AWARDS AND TECHNICAL ASSISTANCE CONTRACTS AT 31.12.2004
Advances are paid to Commission delegations and agencies in Member States administering study awards and technical assistance contracts on behalf of the Commission. These advances are cleared regularly, when expense reports are received, and replenished based on the volume of study awards and technical assistance contracts handled.
The amount of outstanding advances at the end of 2004 and 2003 respectively is shown below.
|
(Amounts in EUR '000) |
||
|
|
31.12.2004 |
31.12.2003 |
|
STUDY AWARDS |
2 442,6 |
1 568,2 |
|
Commission Delegations |
1 228,3 |
1 030,9 |
|
BURKINA FASO |
46,9 |
46,9 |
|
CHAD |
21,1 |
21,1 |
|
CAMEROUN |
165,9 |
41,3 |
|
IVORY COAST |
398,3 |
278,6 |
|
JAMAICA |
26,3 |
52,8 |
|
KENYA |
41,5 |
41,5 |
|
LIBERIA |
45,0 |
45,0 |
|
LESOTHO |
23,2 |
23,2 |
|
MAURITIUS |
23,5 |
23,5 |
|
RWANDA |
53,6 |
53,6 |
|
SENEGAL |
43,1 |
43,1 |
|
TANZANIA |
139,3 |
139,3 |
|
NIGERIA |
78,7 |
78,7 |
|
ZAMBIA |
28,4 |
28,4 |
|
OTHER COMMISSION DELEGATIONS |
93,6 |
114,0 |
|
Member State agencies |
1 214,3 |
537,3 |
|
BELGIUM/AEC |
40,1 |
40,1 |
|
FRANCE/CIES |
37,0 |
86,5 |
|
GERMANY/CDG |
182,6 |
120,2 |
|
NETHERLANDS/NUFFIC |
100,2 |
58,6 |
|
PORTUGAL/INSTITUTO DA COOPERAÇAO PORTUGUESA |
378,5 |
337,8 |
|
UK/BRITISH COUNCIL |
475,9 |
- 105,8 |
|
TECHNICAL ASSISTANCE* |
1 793,3 |
10 357,0 |
|
AEC |
557,8 |
557,8 |
|
GTZ |
1 235,5 |
9 433,5 |
|
AGRER |
0,0 |
365,7 |
|
Total |
4 236,0 |
11 925,2 |
Table 4.2.3
ADVANCES ON CONTRACTS AS AT 31.12.2004
Many contracts provide for payments of advances before the commencement of works, deliveries of supplies or the provision of services. Sometimes the payment schedules of contracts foresee payments on account on the basis of progress reports. In accordance with the Financial Regulation both payments on account and advances are treated as expenditure on projects in the annual accounts of the EDF.
Advances, which normally are paid in the currency of the country or territory, where the project is executed, are however kept separate in the accounts to allow them to be cleared. The table below summarizes outstanding advances at the end of the year. Conversion into EUR is made using the official exchange rate at December 31, 2004.
|
(million EUR) |
||||||
|
|
|
6th EDF |
7th EDF |
8th EDF |
9th EDF |
Total |
|
LOMÉ |
Grants and special loans |
40,43 |
157,09 |
592,64 |
|
790,17 |
|
ACP |
40,07 |
156,05 |
587,19 |
|
783,31 |
|
|
OCT |
0,36 |
1,04 |
5,45 |
|
6,85 |
|
|
TOTAL INDICATIVE PROGRAM |
40,43 |
157,09 |
592,64 |
|
790,17 |
|
|
ACP |
40,07 |
156,05 |
587,19 |
|
783,31 |
|
|
OCT |
0,36 |
1,04 |
5,45 |
|
6,85 |
|
|
SYSMIN/STABEX |
0,00 |
13,84 |
5,50 |
|
19,35 |
|
|
ACP |
0,00 |
13,71 |
5,31 |
|
19,02 |
|
|
OCT |
0,00 |
0,14 |
0,19 |
|
0,33 |
|
|
Aid for refugees and emergency aid |
0,00 |
0,14 |
38,26 |
|
38,41 |
|
|
ACP |
0,00 |
0,14 |
38,26 |
|
38,41 |
|
|
OCT |
0,00 |
0,00 |
0,00 |
|
0,00 |
|
|
TOTAL NON-PROGRAMMABLE AID |
0,00 |
13,99 |
43,77 |
|
57,75 |
|
|
ACP |
0,00 |
13,85 |
43,57 |
|
57,42 |
|
|
OCT |
0,00 |
0,14 |
0,19 |
|
0,33 |
|
|
TRANSFER FROM OTHER FUNDS |
0,20 |
19,76 |
0,00 |
|
19,96 |
|
|
ACP |
0,20 |
19,69 |
0,00 |
|
19,89 |
|
|
OCT |
0,00 |
0,06 |
0,00 |
|
0,06 |
|
|
USE OF INTEREST |
|
|
0,69 |
0,00 |
0,69 |
|
|
ACP |
|
|
0,69 |
0,00 |
0,69 |
|
|
OCT |
|
|
0,00 |
0,00 |
0,00 |
|
|
COTONOU |
A envelope — Sectoral Policy |
|
|
5,04 |
133,32 |
138,36 |
|
ACP |
|
|
5,04 |
133,07 |
138,11 |
|
|
OCT |
|
|
0,00 |
0,25 |
0,25 |
|
|
B envelop |
|
|
0,00 |
87,96 |
87,96 |
|
|
ACP |
|
|
0,00 |
87,96 |
87,96 |
|
|
OCT |
|
|
0,00 |
0,00 |
0,00 |
|
|
Regional allocation |
|
|
0,00 |
8,29 |
8,29 |
|
|
ACP |
|
|
0,00 |
8,05 |
8,05 |
|
|
OCT |
|
|
0,00 |
0,25 |
0,25 |
|
|
Intra ACP |
|
|
0,00 |
327,53 |
327,53 |
|
|
ACP |
|
|
0,00 |
327,53 |
327,53 |
|
|
OCT |
|
|
0,00 |
0,00 |
0,00 |
|
|
CDE — CDA — Paritaire |
|
|
0,00 |
24,62 |
24,62 |
|
|
ACP |
|
|
0,00 |
24,62 |
24,62 |
|
|
OCT |
|
|
0,00 |
0,00 |
0,00 |
|
|
USE OF INTEREST |
|
|
0,00 |
50,90 |
50,90 |
|
|
ACP |
|
|
0,00 |
50,90 |
50,90 |
|
|
OCT |
|
|
0,00 |
0,00 |
0,00 |
|
|
TOTAL |
40,63 |
190,83 |
642,14 |
632,62 |
1 506,23 |
|
|
ACP |
40,27 |
189,59 |
636,49 |
632,13 |
1 498,48 |
|
|
OCT |
0,36 |
1,24 |
5,64 |
0,50 |
7,74 |
|
|
Note: Under structural adjustment programmes and direct budgetary support programme, some payments are registered as advances. As they do not represent advances in the same sense as the above summarized advances on contracts, those payments are not included above table. |
||||||
Table 4.2.4
ITALIAN COFINANCING
In 1985 the European Commission signed an agreement with the Italian Government to cofinance development projects that would be managed by the Commission.
The agreement was repeatedly extended to 31 December 2004 by exchanges of letters between the Italian Government and the Member of the Commission responsible for Development.
The Commission then took a decision to implement the framework cofinancing agreement under written procedure E/1588/2004. The purpose of this decision was to adopt the regulatory budgetary framework for commitments made under the Agreement. With this in mind, the Commission decision states that the Commission will implement the cofinancing arrangements in accordance with the rules laid down in the EDF Financial Regulation and that the same EDF authorising officers by delegation or subdelegation are empowered by this decision to manage Italy’s contribution. The authorising officer by delegation is also empowered to determine the appropriate final deadline for implementation in accordance with the applicable rules.
The treasury movements of Italian funds for projects managed by the Commission in ACP countries in 2004 are as follows (in EUR):
|
No project |
Country |
Project |
Balance 31.12.2003 |
Contribution |
Payments |
Balance 31.12.2004 |
|
|
ITA COF |
1 |
BURUNDI |
REG. — Ruzizi II |
0,00 |
0,00 |
0,00 |
0,00 |
|
ITA COF |
2 |
CAP VERT |
Airport |
0,00 |
0,00 |
0,00 |
0,00 |
|
ITA COF |
3 |
ACP |
ACP — Fiere |
0,00 |
0,00 |
0,00 |
0,00 |
|
ITA COF |
4 |
ACP |
ACP — Fiere |
0,00 |
0,00 |
0,00 |
0,00 |
|
ITA COF |
5 |
TOGO |
CIMAO |
0,00 |
0,00 |
0,00 |
0,00 |
|
ITA COF |
6 |
GUINEA BISSAU |
M'Pack road |
0,00 |
0,00 |
0,00 |
0,00 |
|
ITA COF |
7 |
ACP |
ACP — Fiere |
0,00 |
0,00 |
0,00 |
0,00 |
|
ITA COF |
8 |
ZAIRE |
A.T. Ofida |
0,00 |
0,00 |
0,00 |
0,00 |
|
ITA COF |
9 |
ZAMBIA |
Sismin II |
438 254,02 |
0,00 |
0,00 |
438 254,02 |
|
ITA COF |
10 |
TANZANIA |
Musoma road |
0,00 |
0,00 |
0,00 |
0,00 |
|
ITA COF |
11 |
ZAIRE |
Parco Virunga |
155 561,80 |
0,00 |
0,00 |
155 561,80 |
|
ITA COF |
12 |
GUINEA BISSAU |
Farim bridge |
3 034,20 |
0,00 |
0,00 |
3 034,20 |
|
ITA COF |
13 |
SUDAN |
Sugar |
0,00 |
0,00 |
0,00 |
0,00 |
|
ITA COF |
14 |
SUDAN |
Steel supply |
0,00 |
0,00 |
0,00 |
0,00 |
|
ITA COF |
15 |
ZAIRE |
A.T. Kivu |
202 332,84 |
0,00 |
0,00 |
202 332,84 |
|
ITA COF |
16 |
ZAIRE |
Drinking water |
0,00 |
0,00 |
0,00 |
0,00 |
|
ITA COF |
17 |
TANZANIA |
Railway |
0,00 |
0,00 |
0,00 |
0,00 |
|
ITA COF |
18 |
DOMINICA |
Dryer |
0,00 |
0,00 |
0,00 |
0,00 |
|
ITA COF |
19 |
ACP |
ACP — Fiere |
0,00 |
0,00 |
0,00 |
0,00 |
|
ITA COF |
20 |
BURKINA FASO |
DIAPER II |
35 326,10 |
0,00 |
0,00 |
35 326,10 |
|
ITA COF |
21 |
MAURITIUS |
Footwear |
0,00 |
0,00 |
0,00 |
0,00 |
|
ITA COF |
22 |
BOTSWANA |
K. airport |
160 586,01 |
0,00 |
0,00 |
160 586,01 |
|
ITA COF |
23 |
SOMALIA |
Somalia — beef |
1 694 318,41 |
0,00 |
0,00 |
1 694 318,41 |
|
ITA COF |
24 |
GUINEA BISSAU |
Oil import |
194 860,96 |
0,00 |
0,00 |
194 860,96 |
|
ITA COF |
25 |
MALI |
Nioro |
169 812,57 |
0,00 |
0,00 |
169 812,57 |
|
ITA COF |
26 |
ANGOLA |
Boavida hosp. |
161 422,54 |
0,00 |
0,00 |
161 422,54 |
|
ITA COF |
27 |
TANZANIA |
Hospital P. |
9 592,49 |
0,00 |
0,00 |
9 592,49 |
|
ITA COF |
28 |
DJIBOUTI |
IGADD food project |
3 031,61 |
0,00 |
0,00 |
3 031,61 |
|
ITA COF |
29 |
SEYCHELLES |
Technical assistance |
51 073,21 |
0,00 |
0,00 |
51 073,21 |
|
ITA COF |
30 |
ACP |
ACP — Fiere |
0,00 |
0,00 |
0,00 |
0,00 |
|
ITA COF |
31 |
BURUNDI |
Rutana Kankuzo |
154 846,04 |
0,00 |
0,00 |
154 846,04 |
|
ITA COF |
32 |
CONGO |
Kinkala B. road |
0,00 |
0,00 |
0,00 |
0,00 |
|
ITA COF |
33 |
GUI. CONAKRY |
Fouta Djalon |
305 162,33 |
0,00 |
0,00 |
305 162,33 |
|
ITA COF |
34 |
SENEGAL |
National Road No 2 |
0,00 |
0,00 |
0,00 |
0,00 |
|
ITA COF |
35 |
ZAIRE |
Film Kivu |
0,00 |
0,00 |
0,00 |
0,00 |
|
ITA COF |
36 |
BURKINA FASO |
Technical assistance |
89 763,43 |
0,00 |
0,00 |
89 763,43 |
|
ITA COF |
37 |
|
Cofinancing interest |
12 896 187,23 |
431 771,31 |
0,00 |
13 327 958,54 |
|
ITA COF |
38 |
TANZANIA |
Pemba ports |
0,00 |
0,00 |
0,00 |
0,00 |
|
ITA COF |
39 |
ANGOLA |
Lubango road |
200 500,00 |
0,00 |
0,00 |
200 500,00 |
|
ITA COF |
40 |
|
Administrative expenditure |
697 844,92 |
10 071,16 |
290 214,53 |
417 701,55 |
|
ITA COF |
41 |
MOZAMBIQUE |
Technical assistance |
78 963,69 |
0,00 |
0,00 |
78 963,69 |
|
ITA COF |
42 |
MOZAMBIQUE |
Maputo |
14 387,00 |
0,00 |
0,00 |
14 387,00 |
|
ITA COF |
43 |
MOZAMBIQUE |
Refugees |
0,00 |
0,00 |
0,00 |
0,00 |
|
ITA COF |
44 |
MADAGASCAR |
Manambery bridge |
65 250,91 |
0,00 |
0,00 |
65 250,91 |
|
ITA COF |
45 |
MOZAMBIQUE |
Children assistance |
11 295,81 |
0,00 |
0,00 |
11 295,81 |
|
ITA COF |
46 |
ANGOLA |
Minars assistance |
44 100,00 |
0,00 |
43 602,06 |
497,94 |
|
ITA COF |
47 |
ACP |
ACP-Conf. after Lome IV |
2 708,00 |
0,00 |
0,00 |
2 708,00 |
|
ITA COF |
48 |
ANGOLA |
SMEs |
27 750,00 |
0,00 |
0,00 |
27 750,00 |
|
ITA COF |
49 |
SADC |
SME- Workshop |
0,00 |
0,00 |
0,00 |
0,00 |
|
ITA COF |
50 |
SOMALIA |
Rehabilitation |
8 936 419,98 |
10 000 000,00 |
3 307 365,83 |
15 629 054,15 |
|
ITA COF |
51 |
TANZANIA |
Bogamoyo road |
1 636 461,46 |
0,00 |
0,00 |
1 636 461,46 |
|
ITA COF |
52 |
SOMALIA |
PACE |
550 646,00 |
0,00 |
0,00 |
550 646,00 |
|
Total |
|
|
28 991 493,56 |
10 441 842,47 |
3 641 182,42 |
35 792 153,61 |
|
A total of 52 projects have been cofinanced by the Italian Government in the ACP States since the signature of the above agreement, two of which were still running in 2004.
In that year one financing decision was taken by the Italian Government for a total amount of EUR 14 986 937 ,00 and five riders were signed to extend the date and change the breakdown of the budget without requiring any additional financial commitment.
Table 4.2.5
REPORT ON STABEX UTILISATION FUNDS
Stabex is a financial instrument foreseen by the Lome convention (articles 186-212). It has been replaced under Cotonou by the new instrument FLEX (as part of the B envelope). The aim of Stabex was to remedying the harmful effects of the instability of export earnings of the ACP states. Upon the signature of a transfer agreement with individual ACP states, a treasury transfer was made by the Commission into a security bank account in Europe (Art. 211), under double signature of the Commission and the ACP state. Such movements were booked in the EDF financial statements as mere cash transfers and deferred expenditure.
Subsequently, a Framework of Mutual Obligations (FMO) is established (art. 186), stipulating how the funds are to be used at the various stages of the operations agreed on. Following the signature such FMOs by the Commission and the ACP’s National Authorising Officer (art. 205), disbursements were made from the security account in Europe to local bank accounts in the ACP states. The funds in such local recipient bank accounts are ownership of the ACP states. Nevertheless, the Commission has a control over these local bank accounts by a double signature on the subsequent cash outflows, when the funds are mobilised for the operations specified in the FMO. As a consequence, the funds in the local bank accounts are not included in the financial statements of the EDF. But as the Commission ensures the co-management of these funds, for this reason a financial situation is annexed to our accounts.
According to art. 212 of the LOME convention, within twelve months of such mobilisation of funds resources, the recipient ACP state shall send the Commission a report on the use which it has made of the funds received via the local recipient bank account.
The financial situation taking in account the transfers made and the FMOs signed as at 31.12.2004 is the following (18):
|
ACP Countries |
transfers from the 6th EDF |
Total Transfer Agreements from 7th+8th EDF |
Total interests earned on Stabex accounts |
Total Funds available (Transfers + Interests) as at 31.12.2003 |
Frameworks of Mutual Obligations FMO/COM as at 31.12.2004 |
Total OUT of FMOs |
Total Banks balance (Europe + local) as at 31.12.2003 |
Disbursements calculated as at 31.12.2003 |
|
|
(1) |
(2) |
(3) |
(4)=(1)+(2)+(3) |
(5) |
(6)=(4)-(5) |
(7) |
(8)=(4)-(7) |
|
BENIN |
|
2 279 518 |
61 714 |
2 341 232 |
2 274 819 |
66 413 |
268 566 |
2 072 666 |
|
BURKINA FASO |
|
20 063 915 |
2 728 467 |
22 792 382 |
20 063 915 |
2 728 467 |
9 160 790 |
13 631 592 |
|
BURUNDI |
|
68 393 759 |
2 237 207 |
70 630 966 |
56 124 985 |
14 505 981 |
32 654 780 |
37 976 186 |
|
CAMER. |
|
260 819 530 |
51 887 137 |
312 706 667 |
330 873 158 |
- 18 166 491 |
28 857 572 |
283 849 095 |
|
C. VERDE |
|
1 862 107 |
385 471 |
2 247 578 |
1 937 563 |
310 015 |
1 181 535 |
1 066 043 |
|
CHAD |
|
11 307 153 |
316 505 |
11 623 658 |
10 969 958 |
653 700 |
1 937 918 |
9 685 740 |
|
COMORES |
|
9 223 570 |
960 574 |
10 184 144 |
7 127 432 |
3 056 712 |
4 879 060 |
5 305 084 |
|
DOMINICA |
|
43 380 734 |
4 036 261 |
47 416 995 |
47 176 935 |
240 060 |
9 379 661 |
38 037 334 |
|
EQUAT. GUINEA |
|
8 397 999 |
|
8 397 999 |
8 397 999 |
0 |
|
|
|
ETHIOPIA |
|
184 365 543 |
50 012 540 |
234 378 083 |
234 300 943 |
77 140 |
856 450 |
233 521 633 |
|
GAMBIA |
|
4 612 569 |
405 951 |
5 018 520 |
4 612 569 |
405 951 |
1 660 660 |
3 357 860 |
|
GHANA |
|
50 581 460 |
8 832 319 |
59 413 779 |
50 581 460 |
8 832 319 |
14 927 997 |
44 485 782 |
|
GRENADA |
|
13 409 109 |
1 781 902 |
15 191 011 |
15 084 189 |
106 822 |
4 064 790 |
11 126 221 |
|
GUINEA BISSAU |
|
1 572 748 |
34 643 |
1 607 391 |
1 827 332 |
- 219 941 |
958 993 |
648 398 |
|
HAITI |
|
35 386 871 |
11 133 980 |
46 520 851 |
32 508 975 |
14 011 876 |
11 506 398 |
35 014 453 |
|
IVORY COAST |
147 572 |
345 182 669 |
19 219 810 |
364 550 051 |
345 330 242 |
19 219 809 |
43 039 140 |
321 510 911 |
|
JAMAICA |
|
8 806 983 |
836 442 |
9 643 425 |
9 612 587 |
30 838 |
5 927 833 |
3 715 592 |
|
KENYA |
|
132 640 940 |
62 134 765 |
194 775 705 |
196 428 706 |
- 1 653 001 |
51 438 714 |
143 336 991 |
|
KIRIBATI |
|
908 379 |
|
908 379 |
908 379 |
0 |
|
|
|
LESOTHO |
1 224 000 |
3 705 350 |
1 404 250 |
6 333 600 |
6 333 600 |
0 |
312 928 |
6 020 672 |
|
MADAG. |
|
74 244 488 |
16 333 116 |
90 577 604 |
86 465 577 |
4 112 027 |
27 158 842 |
63 418 762 |
|
MALAWI |
|
20 030 585 |
2 929 284 |
22 959 869 |
22 552 308 |
407 561 |
7 724 933 |
15 234 936 |
|
MALI |
|
941 986 |
64 818 |
1 006 804 |
1 002 088 |
4 716 |
0 |
1 006 804 |
|
MAURITAN |
|
32 010 377 |
1 849 875 |
33 860 252 |
32 010 377 |
1 849 875 |
17 918 533 |
15 941 719 |
|
MOZAMB. |
|
3 637 727 |
688 494 |
4 326 221 |
4 326 221 |
0 |
4 326 221 |
0 |
|
PAPUA NW GUINEA |
|
85 162 106 |
14 153 927 |
99 316 033 |
85 162 106 |
14 153 927 |
7 734 825 |
91 581 208 |
|
RCA |
|
24 617 114 |
5 338 494 |
29 955 608 |
29 955 608 |
0 |
4 768 625 |
25 186 983 |
|
RWANDA |
|
66 306 027 |
13 002 032 |
79 308 059 |
76 957 796 |
2 350 263 |
20 467 918 |
58 840 141 |
|
SAMOA |
661 324 |
5 813 570 |
1 371 497 |
7 846 391 |
7 511 810 |
334 581 |
1 878 579 |
5 967 812 |
|
SAO TOME |
|
2 886 861 |
|
2 886 861 |
2 886 861 |
0 |
|
|
|
SENEGAL |
|
69 821 420 |
6 105 937 |
75 927 357 |
69 821 088 |
6 106 269 |
45 677 532 |
30 249 825 |
|
SIERRA LEONE |
|
14 834 753 |
688 094 |
15 522 847 |
15 183 510 |
339 337 |
3 270 313 |
12 252 534 |
|
SOLOMON ISLANDS |
1 114 079 |
79 274 382 |
7 896 303 |
88 284 764 |
86 397 620 |
1 887 144 |
73 226 020 |
15 058 744 |
|
ST LUCIA |
|
73 337 780 |
9 791 706 |
83 129 486 |
82 432 418 |
697 068 |
30 103 412 |
53 026 074 |
|
ST VINCENT |
|
63 376 174 |
11 210 681 |
74 586 855 |
73 879 635 |
707 220 |
31 337 906 |
43 248 949 |
|
SUDAN |
|
190 981 534 |
1 755 449 |
192 736 983 |
192 736 983 |
0 |
192 736 983 |
0 |
|
TANZANIA |
|
88 225 486 |
12 302 954 |
100 528 440 |
99 032 714 |
1 495 726 |
42 245 425 |
58 283 015 |
|
TOGO |
1 732 479 |
22 009 485 |
8 852 676 |
32 594 640 |
28 279 293 |
4 315 347 |
15 836 101 |
16 758 539 |
|
TONGA |
|
2 469 490 |
|
2 469 490 |
2 469 490 |
0 |
|
|
|
TUVALU |
|
37 569 |
|
37 569 |
37 569 |
0 |
|
|
|
UGANDA |
|
175 946 889 |
40 667 057 |
216 613 946 |
187 719 763 |
28 894 183 |
62 161 168 |
154 452 778 |
|
VANUATU |
|
3 497 440 |
1 529 756 |
5 027 196 |
3 903 039 |
1 124 157 |
76 745 |
4 950 451 |
|
ZIMBAWE |
|
41 636 938 |
9 349 649 |
50 986 587 |
44 746 128 |
6 240 459 |
21 035 418 |
29 951 169 |
|
Total |
4 879 454 |
2 348 001 087 |
384 291 737 |
2 737 172 278 |
2 617 945 748 |
119 226 530 |
832 699 284 |
1 889 772 696 |
3. FINANCIAL INFORMATION EIB
INVESTMENT FACILITY
3.1 BALANCE SHEET AS AT 31 DECEMBER 2004
|
(in EUR '000) |
||
|
|
Year ended 31.12.2004 |
Initial accounting period ended 31.12.2003 |
|
ASSETS |
||
|
Loans and advances to credit institutions |
||
|
Other loans and advances (Note D) |
11 790 |
67 473 |
|
Loans (Note E) |
7 804 |
- |
|
Loans and advances to customers |
||
|
Loans (Note E) |
78 664 |
- |
|
Shares and other variable-yield securities (Note C) |
11 787 |
3 693 |
|
Facility Member States Contribution, called but not paid (Note G) |
60 000 |
133 487 |
|
Other assets |
||
|
Currency swap contracts adjustment account |
139 |
- |
|
Prepayment and accrued income (Note F) |
318 |
- |
|
TOTAL ASSETS |
170 502 |
204 653 |
|
LIABILITIES |
||
|
Facility Member States Contribution called (Note G) |
165 000 |
205 000 |
|
Reserves |
||
|
Loss brought forward |
- 347 |
- |
|
Accruals and deferred income (Note F) |
1 |
- |
|
Profit/(Loss) for the financial year/period |
5 848 |
- 347 |
|
TOTAL LIABILITIES |
170 502 |
204 653 |
|
OFF-BALANCE SHEET ITEMS |
||
|
Commitments |
||
|
Undisbursed loans [note E] |
|
|
|
— credit institutions |
186 884 |
40 000 |
|
— customers |
102 812 |
44 100 |
|
Undisbursed commitment in respect of equity investments |
|
|
|
— investments in venture capital enterprises |
52 285 |
52 010 |
|
— investments in other enterprises |
4 600 |
- |
|
Guarantees in respect to loans granted by third parties |
||
|
Drawn |
- |
- |
|
Undrawn |
25 000 |
- |
|
Nominal value of currency swap contracts payable |
5 873 |
- |
|
Nominal value of currency swap contracts receivable |
6 012 |
- |
|
The bracketed notes refer to the notes to the Financial Statements. |
||
3.2 PROFIT AND LOSS ACCOUNT
For the year ended 31 December 2004
|
(in EUR '000) |
||
|
|
Year ended 31.12.2004 |
Initial accounting period ended 31.12.2003 |
|
Interest and similar income (Note H) |
1 780 |
- |
|
Commission (Note I) |
5 048 |
- |
|
Result on financial operations (Note J) |
(980) |
(347) |
|
Profit/(Loss) for the financial year/period |
5 848 |
(347) |
3.3 NOTES TO THE FINANCIAL STATEMENTS AS AT 31 DECEMBER 2004
GENERAL
The Investment Facility (the ‘Facility’) has been established within the framework of the Cotonou Agreement (the ‘Agreement’) on co-operation and development assistance negotiated between the African, Caribbean and Pacific Group of States (‘the ACP States’) and the European Union and its Member States on 23 June 2000.
The Facility is managed by the European Investment Bank (the ‘EIB’ or the ‘Bank’). Under the terms of the Agreement up to EUR 2,200 million for ACP and EUR 20 million for OCT (as agreed by the Council Decision of 27 November 2001 on the association of the Overseas Countries and Territories with the European Community) may be allocated to finance the Facility. Within the framework of the Agreement, the EIB also manages loans granted from its own resources. All other financial resources and instruments under the Agreement are administered by the European Commission.
These financial statements comprise only the operations of the Facility. Under Council Decision of 8 April 2003, the Member states agreed to cover in full the expenses incurred by the Bank for the management of the Facility for the first 5 years of the 9th European Development Fund. Accordingly, these financial statements exclude such expenses.
Under the terms of the Facility and according to the Financial Regulation applicable to the 9th European Development Fund, the funds received by the EIB on behalf of the Facility are recorded separately. Interest on these deposits, placed by the Facility with the EIB, is not accounted for by the Facility as it is payable directly to the European Commission.
Reflows, being repayment of principal or interest or commissions stemming from financial operations, and interest calculated on reflows are accounted for within the Facility.
SIGNIFICANT ACCOUNTING POLICIES
Accounting standards
These financial statements have been prepared in accordance with the general principles of the Directive 86/635/EEC of the Council of the European Communities of 8 December 1986 (as amended by Directive 2001/65/EC of 27 September 2001) on the annual accounts and consolidated accounts of banks and other financial institutions (the ‘Directive’).
Foreign currency translation
The accounts of the Facility are expressed in Euro.
For the presentation of the financial statements, assets, liabilities and off balance-sheet items denominated in currencies other than the Euro are translated into Euro at the spot rates of exchange prevailing on the balance sheet date.
The profit and loss accounts are translated monthly into Euro based on the exchange rates prevailing at the end of each month.
Exchange differences arising on translation are recorded as a currency gain or loss in the profit and loss account.
Financial assets
Financial assets are accounted for using the settlement date basis.
Shares and other variable yield securities
Investments in venture capital enterprises
Investments in venture capital enterprises represent shares and other variable-yield securities acquired for the longer term in the normal course of the Facility’s activities and are shown in the balance sheet at their original purchase cost.
Based on the reports received from fund managers up to the balance sheet date, the portfolio of Venture Capital Investments is valued on a line-by-line basis at the lower of cost or attributable net asset value (‘NAV’), thus excluding any attributable unrealised gain that may be prevailing in this portfolio.
The attributable NAV is determined through applying either the Facility’s percentage ownership in the underlying vehicle to the NAV reflected in the most recent report or, to the extent available, the value per share at the same date, submitted by the respective Fund Manager. The attributable NAV is adjusted for events having occurred between the date of the latest available NAV and the balance sheet date to the extent that such adjustment is considered to be material.
Unrealised losses due solely to administrative expenses of venture capital funds in existence for less than two years at the balance sheet date are not taken into consideration in determining the attributable NAV.
Investments in other enterprises
Investments in other enterprises represent shares and other variable-yield securities acquired for the longer term in the normal course of the Facility’s activities and are shown in the balance sheet at their original purchase cost.
These investments are revalued on a line-by-line basis at the lower of cost or market, thus excluding any attributable unrealised gain that may be prevailing in this portfolio.
Provisions
As disbursements of loans to customers and investments have occurred mainly within the last twelve months, no significant requirement for provisions for decline in value of these items has been identified as at 31 December 2004.
Taxation
The Protocol on the Privileges and Immunities of the European Union, appended to the Treaty of 29 October 2004 establishing a Constitution for Europe, stipulates that the assets, revenues and other property of the Institution of the Union are exempt from all direct taxes.
Swaps
In the normal course of its activity, the Facility may enter into swap contracts with a view to hedge specific lending operations, denominated in currencies other than the Euro, in order to offset any gain or loss caused by foreign exchange rate fluctuations.
The net result on hedging operations is recognized in the profit and loss account.
SHARES AND OTHER VARIABLE-YIELD SECURITIES
|
(in EUR '000) |
|||||||
|
|
Purchase price at the beginning of the period |
Additions |
Disposals |
Foreign exchange adjustments |
Purchase price at the end of the period |
Cumulative value adjustments at the end of the period |
Carrying amount at the end of the period |
|
Investments in venture capital enterprises |
3 693 |
4 495 |
- |
(574) |
7 614 |
- |
7 614 |
|
Investments in other enterprises (19) |
- |
4 173 |
- |
- |
4 173 |
- |
4 173 |
|
Shares and other variable-yield securities |
3 693 |
8 668 |
- |
(574) |
11 787 |
- |
11 787 |
LOANS AND ADVANCES TO CREDIT INSTITUTIONS — OTHER LOANS AND ADVANCES
As at 31 December 2004, other loans and advances to credit institutions were as follows:
|
(in EUR '000) |
||
|
|
Less than 3 months |
|
|
2004 |
2003 |
|
|
Term deposits — Member States contributions |
||
|
European Investment Bank (20) |
9 336 |
67 473 |
|
Term deposits — Facility reflows |
||
|
European Investment Bank (20) |
2 454 |
- |
|
|
11 790 |
67 473 |
SUMMARY STATEMENT OF LOANS
|
(in EUR '000) |
||||
|
Aggregate loans granted (21) |
to intermediary credit institutions |
directly to final beneficiaries (22) |
31.12.2004 |
31.12.2003 |
|
Disbursed portion |
7 804 |
78 664 |
86 468 |
- |
|
Undisbursed loans |
186 884 |
102 812 |
289 696 |
84 100 |
|
Aggregate loans granted |
194 688 |
181 476 |
376 164 |
84 100 |
PREPAYMENTS AND ACCRUED INCOME — ACCRUALS AND DEFERRED INCOME
|
(in EUR '000) |
||
|
|
31.12.2004 |
31.12.2003 |
|
Prepayments and accrued income |
||
|
Interest and commission receivable |
318 |
- |
|
|
318 |
- |
|
Accruals and deferred income |
||
|
Interest and commission payable (23) |
1 |
- |
|
|
1 |
- |
FACILITY MEMBER STATES CONTRIBUTION
The Member States Contribution to the Facility called amounts to EUR 165 million of which EUR 105 million has been paid-in.
In 2004, a prior contribution amounting to EUR 100 million, called but not paid-in as at 31 December 2003, was cancelled retroactively at the request of the Member States participating in the 9th European Development Fund.
The statement of Facility Member States Contribution as at 31 December 2004 is as follows:
|
(in EUR) |
|||
|
Member States |
Total |
Unpaid |
Paid-in |
|
Austria |
4 372 500 |
1 590 000 |
2 782 500 |
|
Belgium |
6 468 000 |
2 352 000 |
4 116 000 |
|
Denmark |
3 531 000 |
1 284 000 |
2 247 000 |
|
Finland |
2 442 000 |
888 000 |
1 554 000 |
|
France |
40 095 000 |
14 580 000 |
25 515 000 |
|
Germany |
38 544 000 |
14 016 000 |
24 528 000 |
|
Greece |
2 062 500 |
750 000 |
1 312 500 |
|
Ireland |
1 023 000 |
372 000 |
651 000 |
|
Italy |
20 691 000 |
7 524 000 |
13 167 000 |
|
Luxembourg |
478 500 |
174 000 |
304 500 |
|
Netherlands |
8 613 000 |
3 132 000 |
5 481 000 |
|
Portugal |
1 600 500 |
582 000 |
1 018 500 |
|
Spain |
9 636 000 |
3 504 000 |
6 132 000 |
|
Sweden |
4 504 500 |
1 638 000 |
2 866 500 |
|
United Kingdom |
20 938 500 |
7 614 000 |
13 324 500 |
|
Total |
165 000 000 |
60 000 000 |
105 000 000 |
INTEREST AND SIMILAR INCOME
|
(in EUR) |
||
|
|
31.12.2004 |
31.12.2003 |
|
Interest and similar income |
||
|
Interest on deposits |
6 406 |
- |
|
Interest on loans |
1 774 067 |
- |
|
|
1 780 473 |
- |
COMMISSION (IN EUR)
The Facility has received commission for an amount of EUR 5 047 610, including EUR 4 166 665 represented by 17 361 104 shares in Kenmare Resources Plc received as commission in kind (see Note C).
RESULT ON FINANCIAL OPERATIONS
Some investments in venture capital operations and loans were disbursed and are denominated in currencies other than the Euro; the exchange loss recorded results from the depreciation of those currencies against the Euro between the time of disbursement and the financial year-end (see Note B2).
In 2004, the Facility entered into a swap contract to hedge a position held in USD. The net result on hedging operations represents the revaluation of swap positions as at 31.12.2004.
As at 31 December, the result on financial operations comprised:
|
(in EUR) |
||
|
|
31.12.2004 |
31.12.2003 |
|
Net gain on hedging operations |
139 063 |
- |
|
Net loss arising from foreign exchange variations |
(1 119 084) |
(346 782) |
|
Other financial operations |
(68) |
- |
|
|
(980 089) |
(346 782) |
4. APPENDIX — SITUATION BY COUNTRY AND BY INSTRUMENT
Table 3.1.1
6th EDF
Cumulative 2004
GLOBAL SITUATION BY STATE
|
(million EUR) |
|||||||||||||
|
|
Lomé |
Cotonou |
Total |
||||||||||
|
NIP |
National indicative programmes |
Other aid |
Regional Decisions |
||||||||||
|
Decisions |
as % of NIP |
Payments |
as % of NIP |
Decisions |
as % of NIP |
Payments |
as % of NIP |
Decisions |
Assigned funds |
Payments |
|||
|
ANGOLA |
101,34 |
101,34 |
100 |
97,30 |
96 |
18,79 |
19 |
18,79 |
19 |
|
120,13 |
116,42 |
116,09 |
|
BENIN |
85,62 |
85,62 |
100 |
85,62 |
100 |
34,07 |
40 |
34,07 |
40 |
|
119,69 |
119,69 |
119,69 |
|
BURKINA FASO |
106,57 |
106,57 |
100 |
106,57 |
100 |
27,00 |
25 |
27,00 |
25 |
|
133,56 |
133,56 |
133,56 |
|
BOTSWANA |
27,10 |
27,10 |
100 |
26,31 |
97 |
29,57 |
109 |
29,57 |
109 |
|
56,66 |
55,87 |
55,87 |
|
BURUNDI |
93,54 |
93,54 |
100 |
93,54 |
100 |
56,21 |
60 |
56,21 |
60 |
|
149,76 |
149,76 |
149,76 |
|
CENTRAFRIQUE |
67,69 |
67,69 |
100 |
67,15 |
99 |
39,10 |
58 |
39,10 |
58 |
|
106,79 |
106,37 |
106,26 |
|
TCHAD |
84,20 |
84,20 |
100 |
83,84 |
100 |
48,47 |
58 |
48,47 |
58 |
|
132,67 |
132,49 |
132,30 |
|
CAMEROUN |
99,87 |
99,87 |
100 |
99,87 |
100 |
203,20 |
203 |
203,20 |
203 |
|
303,07 |
303,07 |
303,07 |
|
CONGO |
35,91 |
35,91 |
100 |
35,91 |
100 |
11,87 |
33 |
11,87 |
33 |
|
47,79 |
47,79 |
47,79 |
|
COMORES |
20,21 |
20,21 |
100 |
20,21 |
100 |
11,97 |
59 |
11,97 |
59 |
|
32,17 |
32,17 |
32,17 |
|
CAP VERT |
24,39 |
24,39 |
100 |
24,38 |
100 |
3,29 |
13 |
3,29 |
13 |
|
27,67 |
27,67 |
27,67 |
|
DJIBOUTI |
15,87 |
15,87 |
100 |
15,11 |
95 |
2,27 |
14 |
2,27 |
14 |
|
18,14 |
17,38 |
17,38 |
|
GUINEE EQUATORIALE |
11,93 |
11,93 |
100 |
11,89 |
100 |
14,16 |
119 |
14,16 |
119 |
|
26,10 |
26,06 |
26,06 |
|
ETHIOPIE |
172,63 |
172,63 |
100 |
170,00 |
98 |
187,09 |
108 |
187,09 |
108 |
|
359,72 |
358,00 |
357,09 |
|
GABON |
26,00 |
26,00 |
100 |
25,82 |
99 |
3,49 |
13 |
3,49 |
13 |
|
29,49 |
29,48 |
29,32 |
|
GHANA |
96,44 |
96,44 |
100 |
96,24 |
100 |
25,21 |
26 |
25,21 |
26 |
|
121,65 |
121,61 |
121,45 |
|
GAMBIE |
20,62 |
20,62 |
100 |
20,52 |
100 |
19,81 |
96 |
19,81 |
96 |
|
40,43 |
40,34 |
40,33 |
|
GUINEE BISSAU |
37,40 |
37,40 |
100 |
36,15 |
97 |
6,70 |
18 |
6,66 |
18 |
|
44,10 |
43,04 |
42,82 |
|
GUINEE |
113,83 |
113,83 |
100 |
111,79 |
98 |
77,15 |
68 |
70,84 |
62 |
|
190,99 |
182,98 |
182,63 |
|
COTE D'IVOIRE |
81,79 |
81,79 |
100 |
81,77 |
100 |
383,27 |
469 |
383,27 |
469 |
|
465,06 |
465,04 |
465,04 |
|
KENYA |
111,70 |
111,70 |
100 |
109,97 |
98 |
90,50 |
81 |
90,35 |
81 |
|
202,19 |
200,79 |
200,32 |
|
LIBERIA |
45,00 |
45,00 |
100 |
43,15 |
96 |
9,07 |
20 |
9,02 |
20 |
|
54,07 |
53,76 |
52,17 |
|
LESOTHO |
40,30 |
40,30 |
100 |
40,30 |
100 |
10,38 |
26 |
10,38 |
26 |
|
50,68 |
50,68 |
50,68 |
|
MADAGASCAR |
117,08 |
117,08 |
100 |
115,87 |
99 |
38,11 |
33 |
38,11 |
33 |
|
155,20 |
154,09 |
153,98 |
|
MALAWI |
114,28 |
114,28 |
100 |
111,72 |
98 |
53,81 |
47 |
53,77 |
47 |
|
168,09 |
167,70 |
165,49 |
|
MAURICE |
30,23 |
30,23 |
100 |
29,82 |
99 |
12,24 |
40 |
12,24 |
40 |
|
42,47 |
42,39 |
42,06 |
|
MAURITANIE |
61,11 |
61,11 |
100 |
59,36 |
97 |
42,45 |
69 |
42,45 |
69 |
|
103,56 |
101,95 |
101,81 |
|
MALI |
131,13 |
131,13 |
100 |
131,13 |
100 |
38,48 |
29 |
38,48 |
29 |
|
169,61 |
169,61 |
169,61 |
|
MOZAMBIQUE |
158,98 |
158,98 |
100 |
147,06 |
93 |
66,03 |
42 |
62,92 |
40 |
|
225,01 |
222,32 |
209,98 |
|
NIGER |
107,27 |
107,27 |
100 |
107,27 |
100 |
37,71 |
35 |
37,71 |
35 |
|
144,98 |
144,98 |
144,98 |
|
RWANDA |
109,93 |
109,93 |
100 |
101,65 |
92 |
77,14 |
70 |
75,17 |
68 |
|
187,07 |
181,63 |
176,81 |
|
SENEGAL |
108,49 |
108,49 |
100 |
107,91 |
99 |
158,80 |
146 |
158,75 |
146 |
|
267,29 |
266,77 |
266,66 |
|
SEYCHELLES |
6,18 |
6,18 |
100 |
6,18 |
100 |
1,69 |
27 |
1,69 |
27 |
|
7,86 |
7,86 |
7,86 |
|
SIERRA LEONE |
62,86 |
62,86 |
100 |
62,80 |
100 |
9,59 |
15 |
9,59 |
15 |
|
72,45 |
72,44 |
72,39 |
|
SOMALIE |
159,15 |
159,15 |
100 |
155,28 |
98 |
30,53 |
19 |
30,52 |
19 |
|
189,68 |
187,37 |
185,80 |
|
SAO TOME & PRINCIPE |
6,00 |
6,00 |
100 |
6,00 |
100 |
4,02 |
67 |
4,02 |
67 |
|
10,02 |
10,02 |
10,02 |
|
SOUDAN |
91,30 |
91,30 |
100 |
79,16 |
87 |
146,69 |
161 |
146,69 |
161 |
|
237,99 |
234,83 |
225,85 |
|
SWAZILAND |
24,61 |
24,61 |
100 |
24,61 |
100 |
9,37 |
38 |
9,37 |
38 |
|
33,98 |
33,98 |
33,98 |
|
TANZANIE |
160,92 |
160,92 |
100 |
160,71 |
100 |
23,44 |
15 |
23,44 |
15 |
|
184,35 |
184,35 |
184,14 |
|
TOGO |
49,26 |
49,26 |
100 |
49,26 |
100 |
33,89 |
69 |
33,89 |
69 |
|
83,15 |
83,15 |
83,15 |
|
OUGANDA |
132,84 |
132,84 |
100 |
127,03 |
96 |
26,24 |
20 |
26,24 |
20 |
|
159,08 |
156,13 |
153,27 |
|
NIGERIA |
178,77 |
178,77 |
100 |
177,24 |
99 |
17,66 |
10 |
17,63 |
10 |
|
196,44 |
195,47 |
194,87 |
|
ZAMBIE |
89,24 |
89,24 |
100 |
88,88 |
100 |
14,31 |
16 |
14,31 |
16 |
|
103,55 |
103,50 |
103,20 |
|
ZIMBABWE |
73,56 |
73,56 |
100 |
72,56 |
99 |
12,74 |
17 |
12,74 |
17 |
|
86,30 |
85,30 |
85,30 |
|
REP. DEMOCRATIQUE CONGO |
166,46 |
166,46 |
100 |
150,00 |
90 |
8,28 |
5 |
8,28 |
5 |
|
174,74 |
173,22 |
158,28 |
|
* TOTAL AFRIQUE |
3 659,61 |
3 659,61 |
100 |
3 574,93 |
98 |
2 175,84 |
59 |
2 164,08 |
59 |
5 835,45 |
5 793,11 |
5 739,01 |
|
|
ANTIGUA-BARBUDA |
4,42 |
4,42 |
100 |
4,42 |
100 |
1,50 |
34 |
1,50 |
34 |
|
5,92 |
5,92 |
5,92 |
|
BARBADE |
3,76 |
3,76 |
100 |
3,76 |
100 |
2,15 |
57 |
2,15 |
57 |
|
5,91 |
5,91 |
5,91 |
|
BELIZE |
7,98 |
7,98 |
100 |
7,98 |
100 |
5,07 |
63 |
5,07 |
63 |
|
13,05 |
13,05 |
13,05 |
|
BAHAMAS |
3,33 |
3,33 |
100 |
3,33 |
100 |
2,65 |
80 |
2,65 |
80 |
|
5,99 |
5,99 |
5,98 |
|
DOMINIQUE |
5,84 |
5,84 |
100 |
5,84 |
100 |
5,03 |
86 |
5,03 |
86 |
|
10,87 |
10,87 |
10,87 |
|
GRENADE |
5,44 |
5,44 |
100 |
5,44 |
100 |
5,26 |
97 |
5,26 |
97 |
|
10,70 |
10,70 |
10,70 |
|
GUYANE (ETAT) |
21,85 |
21,85 |
100 |
21,83 |
100 |
3,91 |
18 |
3,91 |
18 |
|
25,76 |
25,75 |
25,74 |
|
JAMAIQUE |
40,00 |
40,00 |
100 |
39,77 |
99 |
11,58 |
29 |
11,53 |
29 |
|
51,58 |
51,57 |
51,30 |
|
ST CHRISTOPHE (KITTS) & NEVI |
3,50 |
3,50 |
100 |
3,50 |
100 |
1,50 |
43 |
1,50 |
43 |
|
5,00 |
5,00 |
5,00 |
|
SAINTE LUCIE |
5,12 |
5,12 |
100 |
5,10 |
100 |
2,96 |
58 |
2,96 |
58 |
|
8,08 |
8,06 |
8,06 |
|
SURINAME |
17,15 |
17,15 |
100 |
16,61 |
97 |
3,89 |
23 |
3,89 |
23 |
|
21,04 |
20,77 |
20,50 |
|
SAINT VINCENT & GRENADINES |
6,90 |
6,90 |
100 |
6,64 |
96 |
3,23 |
47 |
3,23 |
47 |
|
10,13 |
9,96 |
9,87 |
|
TRINITE & TOBAGO |
7,07 |
7,07 |
100 |
6,99 |
99 |
11,27 |
159 |
11,27 |
159 |
|
18,34 |
18,26 |
18,26 |
|
* TOTAL CARAIBES |
132,37 |
132,37 |
100 |
131,20 |
99 |
60,01 |
45 |
59,95 |
45 |
|
192,37 |
191,80 |
191,15 |
|
FIDJI |
18,53 |
18,53 |
100 |
18,39 |
99 |
3,98 |
21 |
3,98 |
21 |
|
22,50 |
22,50 |
22,37 |
|
KIRIBATI |
6,50 |
6,50 |
100 |
6,49 |
100 |
3,27 |
50 |
2,77 |
43 |
|
9,77 |
9,76 |
9,26 |
|
PAPOUASIE NOUVELLE GUINEE |
34,50 |
34,50 |
100 |
34,29 |
99 |
148,91 |
432 |
144,33 |
418 |
|
183,41 |
178,85 |
178,62 |
|
SALOMON |
16,45 |
16,45 |
100 |
16,09 |
98 |
33,81 |
205 |
33,81 |
205 |
|
50,27 |
50,08 |
49,91 |
|
TONGA |
6,50 |
6,50 |
100 |
6,36 |
98 |
6,25 |
96 |
6,25 |
96 |
|
12,75 |
12,66 |
12,61 |
|
TUVALU |
1,58 |
1,58 |
100 |
1,58 |
100 |
0,64 |
40 |
0,64 |
40 |
|
2,22 |
2,22 |
2,22 |
|
VANUATU |
6,70 |
6,70 |
100 |
6,70 |
100 |
20,97 |
313 |
20,97 |
313 |
|
27,67 |
27,67 |
27,67 |
|
SAMOA |
8,97 |
8,97 |
100 |
8,96 |
100 |
15,60 |
174 |
15,60 |
174 |
|
24,57 |
24,56 |
24,56 |
|
* TOTAL PACIFIQUE |
99,72 |
99,72 |
100 |
98,87 |
99 |
233,42 |
234 |
228,34 |
229 |
|
333,15 |
328,30 |
327,21 |
|
BUDGET INTRA ACP |
10,00 |
|
|
|
|
|
|
|
|
10,00 |
10,00 |
10,00 |
10,00 |
|
COOPERATION REGIONALE ACP |
873,82 |
873,82 |
100 |
854,71 |
98 |
70,35 |
8 |
68,73 |
8 |
|
944,17 |
932,48 |
923,44 |
|
* TOTAL COOPER. REGIONALE ACP |
883,82 |
873,82 |
99 |
854,71 |
97 |
70,35 |
8 |
68,73 |
8 |
10,00 |
954,17 |
942,48 |
933,44 |
|
TOUS PAYS ACP |
|
|
|
|
|
20,10 |
|
20,10 |
|
|
20,10 |
20,10 |
20,10 |
|
FRAIS ADMINISTR. & FINANCIERS |
8,70 |
8,70 |
100 |
7,78 |
89 |
6,02 |
69 |
5,35 |
62 |
|
14,72 |
13,91 |
13,13 |
|
* TOTAL ACP |
4 784,22 |
4 774,22 |
100 |
4 667,48 |
98 |
2 565,73 |
54 |
2 546,56 |
53 |
10,00 |
7 349,96 |
7 289,70 |
7 224,05 |
|
MAYOTTE |
4,75 |
4,75 |
100 |
4,75 |
100 |
1,15 |
24 |
1,15 |
24 |
|
5,90 |
5,90 |
5,90 |
|
NOUVELLE CALEDONIE |
7,81 |
7,81 |
100 |
7,81 |
100 |
4,37 |
56 |
4,36 |
56 |
|
12,19 |
12,18 |
12,17 |
|
POLYNESIE FRANCAISE |
8,25 |
8,25 |
100 |
8,10 |
98 |
7,52 |
91 |
7,52 |
91 |
|
15,77 |
15,73 |
15,61 |
|
SAINT PIERRE & MIQUELON |
3,43 |
3,43 |
100 |
3,41 |
100 |
0,03 |
1 |
0,03 |
1 |
|
3,46 |
3,46 |
3,45 |
|
TERRES AUSTRALES FRANCAISES |
0,27 |
0,27 |
100 |
0,27 |
100 |
|
|
|
|
|
0,27 |
0,27 |
0,27 |
|
WALLIS & FUTUNA |
3,23 |
3,23 |
100 |
3,23 |
100 |
|
|
|
|
|
3,23 |
3,23 |
3,23 |
|
* TOTAL PTOM FRANCAIS |
27,74 |
27,74 |
100 |
27,57 |
99 |
13,08 |
47 |
13,06 |
47 |
|
40,82 |
40,78 |
40,63 |
|
ARUBA |
5,75 |
5,75 |
100 |
5,75 |
100 |
3,29 |
57 |
3,29 |
57 |
|
9,04 |
9,04 |
9,04 |
|
ANTILLES NEERLANDAISES |
14,91 |
14,91 |
100 |
14,34 |
96 |
1,48 |
10 |
1,48 |
10 |
|
16,39 |
16,11 |
15,82 |
|
* TOTAL PTOM NEERLANDAIS |
20,66 |
20,66 |
100 |
20,09 |
97 |
4,77 |
23 |
4,77 |
23 |
|
25,43 |
25,15 |
24,86 |
|
ANGUILLA |
1,69 |
1,69 |
100 |
1,69 |
100 |
1,50 |
89 |
1,50 |
89 |
|
3,19 |
3,19 |
3,19 |
|
CAIMANS |
1,49 |
1,49 |
100 |
1,49 |
100 |
0,50 |
33 |
0,50 |
33 |
|
1,99 |
1,99 |
1,99 |
|
FALKLAND |
0,70 |
0,70 |
100 |
0,66 |
94 |
0,49 |
70 |
0,49 |
70 |
|
1,19 |
1,15 |
1,15 |
|
MONTSERRAT |
2,00 |
2,00 |
100 |
2,00 |
100 |
2,24 |
112 |
2,24 |
112 |
|
4,24 |
4,24 |
4,24 |
|
SAINTE HELENE |
1,39 |
1,39 |
100 |
1,39 |
100 |
|
|
|
|
|
1,39 |
1,39 |
1,39 |
|
TURKS & CAICOS |
1,73 |
1,73 |
100 |
1,73 |
100 |
0,15 |
9 |
0,15 |
9 |
|
1,88 |
1,88 |
1,88 |
|
VIERGES (BRITANNIQUES) |
1,50 |
1,50 |
100 |
1,50 |
100 |
1,44 |
96 |
1,44 |
96 |
|
2,94 |
2,94 |
2,94 |
|
* TOTAL PTOM BRITANNIQUES |
10,50 |
10,50 |
100 |
10,45 |
100 |
6,31 |
60 |
6,31 |
60 |
|
16,81 |
16,76 |
16,76 |
|
COOPERATION REGIONALE PTOM |
5,91 |
5,91 |
100 |
5,43 |
92 |
|
|
|
|
|
5,91 |
5,53 |
5,43 |
|
* COOPERATION REGIONALE PTOM |
5,91 |
5,91 |
100 |
5,43 |
92 |
5,91 |
5,53 |
5,43 |
|||||
|
TOUS PTOM |
|
|
|
|
|
0,43 |
|
0,43 |
|
|
0,43 |
0,43 |
0,43 |
|
* TOTAL PTOM |
64,81 |
64,81 |
100 |
63,54 |
98 |
24,58 |
38 |
24,56 |
38 |
|
89,39 |
88,64 |
88,11 |
|
* TOTAL ACP + PTOM |
4 849,03 |
4 839,03 |
100 |
4 731,03 |
98 |
2 590,32 |
53 |
2 571,13 |
53 |
10,00 |
7 439,35 |
7 378,34 |
7 312,16 |
Table 3.1.2
6th EDF
Annual 2004
GLOBAL SITUATION BY STATE
|
(million EUR) |
||||||||||||
|
|
Lomé |
Total |
||||||||||
|
NIP |
National indicative programmes |
Other aid |
||||||||||
|
Decisions |
as % of NIP |
Payments |
as % of NIP |
Decisions |
as % of NIP |
Payments |
as % of NIP |
Decisions |
Assigned funds |
Payments |
||
|
ANGOLA |
101,34 |
- 0,03 |
0 |
0,32 |
0 |
|
|
|
|
- 0,03 |
- 0,04 |
0,32 |
|
BOTSWANA |
27,10 |
|
|
0,02 |
0 |
|
|
|
|
|
|
0,02 |
|
CENTRAFRIQUE |
67,69 |
|
|
- 0,10 |
0 |
|
|
|
|
|
0,00 |
- 0,10 |
|
TCHAD |
84,20 |
|
|
0,13 |
0 |
|
|
|
|
|
|
0,13 |
|
CAMEROUN |
99,87 |
- 0,16 |
0 |
|
|
|
|
|
|
- 0,16 |
|
|
|
CAP VERT |
24,39 |
|
|
- 0,00 |
0 |
|
|
|
|
|
- 0,01 |
- 0,00 |
|
DJIBOUTI |
15,87 |
|
|
|
|
|
|
|
|
|
- 0,00 |
|
|
GUINEE EQUATORIALE |
11,93 |
- 0,02 |
0 |
|
|
|
|
|
|
- 0,02 |
|
|
|
ETHIOPIE |
172,63 |
- 18,50 |
- 11 |
0,02 |
0 |
|
|
|
|
- 18,50 |
- 0,00 |
0,02 |
|
GABON |
26,00 |
|
|
0,17 |
1 |
|
|
|
|
|
- 0,00 |
0,17 |
|
GHANA |
96,44 |
- 0,57 |
- 1 |
0,28 |
0 |
|
|
|
|
- 0,57 |
- 0,61 |
0,28 |
|
GUINEE |
113,83 |
- 0,16 |
0 |
- 0,02 |
0 |
|
|
- 0,00 |
0 |
- 0,16 |
- 0,82 |
- 0,02 |
|
COTE D'IVOIRE |
81,79 |
- 0,01 |
0 |
0,03 |
0 |
|
|
|
|
- 0,01 |
- 0,02 |
0,03 |
|
KENYA |
111,70 |
- 0,50 |
0 |
2,06 |
2 |
|
|
|
|
- 0,50 |
- 0,03 |
2,06 |
|
LIBERIA |
45,00 |
|
|
0,06 |
0 |
|
|
|
|
|
|
0,06 |
|
MADAGASCAR |
117,08 |
- 1,79 |
- 2 |
- 0,12 |
0 |
|
|
|
|
- 1,79 |
- 1,87 |
- 0,12 |
|
MALAWI |
114,28 |
- 0,11 |
0 |
0,67 |
1 |
|
|
0,04 |
0 |
- 0,11 |
2,77 |
0,71 |
|
MAURICE |
30,23 |
|
|
0,14 |
0 |
|
|
|
|
|
|
0,14 |
|
MAURITANIE |
61,11 |
|
|
1,05 |
2 |
|
|
|
|
|
- 1,50 |
1,05 |
|
MOZAMBIQUE |
158,98 |
|
|
0,19 |
0 |
|
|
|
|
|
8,60 |
0,19 |
|
RWANDA |
109,93 |
|
|
1,02 |
1 |
|
|
2,55 |
2 |
|
1,23 |
3,57 |
|
SENEGAL |
108,49 |
|
|
0,08 |
0 |
- 0,59 |
- 1 |
0,04 |
0 |
- 0,59 |
- 0,72 |
0,12 |
|
SIERRA LEONE |
62,86 |
- 0,79 |
- 1 |
0,04 |
0 |
|
|
|
|
- 0,79 |
- 0,00 |
0,04 |
|
SOMALIE |
159,15 |
|
|
1,50 |
1 |
|
|
|
|
|
- 0,69 |
1,50 |
|
SOUDAN |
91,30 |
|
|
3,31 |
4 |
|
|
|
|
|
3,97 |
3,31 |
|
TANZANIE |
160,92 |
- 0,21 |
0 |
|
|
|
|
|
|
- 0,21 |
|
|
|
OUGANDA |
132,84 |
|
|
0,87 |
1 |
|
|
|
|
|
3,73 |
0,87 |
|
NIGERIA |
178,77 |
|
|
|
|
|
|
|
|
|
- 0,14 |
|
|
ZAMBIE |
89,24 |
|
|
- 0,30 |
0 |
|
|
|
|
|
- 0,02 |
- 0,30 |
|
ZIMBABWE |
73,56 |
- 0,08 |
0 |
0,01 |
0 |
|
|
|
|
- 0,08 |
- 0,05 |
0,01 |
|
REP. DEMOCRATIQUE CONGO |
166,46 |
|
|
11,15 |
7 |
|
|
|
|
|
10,06 |
11,15 |
|
* TOTAL AFRIQUE |
2 895,00 |
- 22,92 |
- 1 |
22,56 |
1 |
- 0,59 |
0 |
2,63 |
0 |
- 23,52 |
23,84 |
25,19 |
|
ANTIGUA-BARBUDA |
4,42 |
- 0,08 |
- 2 |
|
|
|
|
|
|
- 0,08 |
|
|
|
GUYANE (ETAT) |
21,85 |
- 0,00 |
0 |
0,06 |
0 |
|
|
|
|
- 0,00 |
- 0,00 |
0,06 |
|
JAMAIQUE |
40,00 |
|
|
|
|
|
|
0,02 |
0 |
|
|
0,02 |
|
SURINAME |
17,15 |
|
|
0,58 |
3 |
|
|
|
|
|
0,53 |
0,58 |
|
TRINITE & TOBAGO |
7,07 |
- 1,46 |
- 21 |
|
|
|
|
|
|
- 1,46 |
- 0,02 |
|
|
* TOTAL CARAIBES |
90,49 |
- 1,54 |
- 2 |
0,64 |
1 |
|
|
0,02 |
0 |
- 1,54 |
0,50 |
0,66 |
|
FIDJI |
18,53 |
|
|
0,63 |
3 |
|
|
|
|
|
0,60 |
0,63 |
|
SALOMON |
16,45 |
|
|
0,03 |
0 |
|
|
|
|
|
- 0,03 |
0,03 |
|
SAMOA |
8,97 |
|
|
|
|
|
|
|
|
|
- 0,01 |
|
|
* TOTAL PACIFIQUE |
43,95 |
|
|
0,66 |
1 |
|
|
|
|
0,00 |
0,57 |
0,66 |
|
COOPERATION REGIONALE ACP |
873,82 |
- 6,97 |
- 1 |
2,98 |
0 |
|
|
|
|
- 6,97 |
3,86 |
2,98 |
|
* TOTAL COOPER. REGIONALE ACP |
873,82 |
- 6,97 |
- 1 |
2,98 |
0 |
|
|
|
|
- 6,97 |
3,86 |
2,98 |
|
FRAIS ADMINISTR. & FINANCIERS |
8,70 |
|
|
0,16 |
2 |
|
|
|
|
|
- 0,01 |
0,16 |
|
* TOTAL ACP |
3 911,96 |
- 31,44 |
- 1 |
26,99 |
1 |
- 0,59 |
0 |
2,65 |
0 |
- 32,03 |
28,76 |
29,64 |
|
POLYNESIE FRANCAISE |
8,25 |
|
|
0,37 |
4 |
|
|
|
|
|
|
0,37 |
|
SAINT PIERRE & MIQUELON |
3,43 |
|
|
0,00 |
0 |
|
|
|
|
|
|
0,00 |
|
* TOTAL PTOM FRANCAIS |
11,68 |
|
|
0,37 |
3 |
|
|
|
|
|
|
0,37 |
|
ANTILLES NEERLANDAISES |
14,91 |
- 0,21 |
- 1 |
- 0,02 |
0 |
|
|
|
|
- 0,21 |
- 0,05 |
- 0,02 |
|
* TOTAL PTOM NEERLANDAIS |
14,91 |
- 0,21 |
- 1 |
- 0,02 |
0 |
|
|
|
|
- 0,21 |
- 0,05 |
- 0,02 |
|
* TOTAL PTOM BRITANIQUES |
|
|
|
|
|
|
|
|
|
|
|
|
|
COOPERATION REGIONALE PTOM |
5,91 |
|
|
0,01 |
0 |
|
|
|
|
|
- 0,03 |
0,01 |
|
* COOPERATION REGIONALE PTOM |
5,91 |
|
|
0,01 |
0 |
|
|
|
|
|
-0,03 |
0,01 |
|
* TOTAL PTOM |
32,50 |
- 0,21 |
- 1 |
0,36 |
1 |
|
|
|
|
- 0,21 |
- 0,09 |
0,36 |
|
* TOTAL ACP + PTOM |
3 944,46 |
- 31,65 |
- 1 |
27,35 |
1 |
- 0,59 |
0 |
2,65 |
0 |
- 32,24 |
28,68 |
30,00 |
Table 3.1.3
6th EDF
Decisions cumulative 2004
SITUATION BY INSTRUMENT AND STATE
|
(million EUR) |
|||||||||||||||
|
|
Lomé |
Cotonou |
Total state |
||||||||||||
|
NIP |
Non NIP |
Total |
|||||||||||||
|
Grants |
Special loans |
Total NIP |
Interest subsidies |
Emergency aid |
Refugee aid |
Risk capital |
STABEX |
SYSMIN |
Transfers from others funds |
SAF |
Total non NIP |
||||
|
ANGOLA |
101,34 |
|
101,34 |
|
13,66 |
2,62 |
2,50 |
|
|
|
|
18,79 |
120,13 |
|
120,13 |
|
BENIN |
85,62 |
|
85,62 |
|
0,33 |
0,12 |
12,72 |
17,72 |
|
3,18 |
|
34,07 |
119,69 |
|
119,69 |
|
BURKINA FASO |
106,57 |
|
106,57 |
|
0,35 |
|
12,74 |
7,32 |
|
6,58 |
|
27,00 |
133,56 |
|
133,56 |
|
BOTSWANA |
21,78 |
5,32 |
27,10 |
2,59 |
0,43 |
0,37 |
4,04 |
|
21,65 |
0,48 |
|
29,57 |
56,66 |
|
56,66 |
|
BURUNDI |
83,62 |
9,92 |
93,54 |
|
0,21 |
0,39 |
10,06 |
44,50 |
|
1,06 |
|
56,21 |
149,76 |
|
149,76 |
|
CENTRAFRIQUE |
67,69 |
|
67,69 |
|
0,61 |
|
4,76 |
31,22 |
|
2,50 |
|
39,10 |
106,79 |
|
106,79 |
|
TCHAD |
84,20 |
|
84,20 |
|
1,17 |
1,79 |
3,54 |
40,39 |
|
1,57 |
|
48,47 |
132,67 |
|
132,67 |
|
CAMEROUN |
70,49 |
29,38 |
99,87 |
|
0,14 |
|
1,00 |
198,76 |
|
3,30 |
|
203,20 |
303,07 |
|
303,07 |
|
CONGO |
28,25 |
7,67 |
35,91 |
|
|
|
11,54 |
|
|
0,33 |
|
11,87 |
47,79 |
|
47,79 |
|
COMORES |
20,21 |
|
20,21 |
|
|
|
2,00 |
9,56 |
|
0,40 |
|
11,97 |
32,17 |
|
32,17 |
|
CAP VERT |
24,39 |
|
24,39 |
|
|
|
3,00 |
|
|
0,29 |
|
3,29 |
27,67 |
|
27,67 |
|
DJIBOUTI |
15,87 |
|
15,87 |
|
0,15 |
1,13 |
0,87 |
|
|
0,13 |
|
2,27 |
18,14 |
|
18,14 |
|
GUINEE EQUATORIALE |
11,93 |
|
11,93 |
|
|
|
4,00 |
9,83 |
|
0,33 |
|
14,16 |
26,10 |
|
26,10 |
|
ETHIOPIE |
165,02 |
7,61 |
172,63 |
|
47,45 |
10,25 |
29,94 |
98,61 |
|
0,84 |
|
187,09 |
359,72 |
|
359,72 |
|
GABON |
18,69 |
7,31 |
26,00 |
|
0,10 |
|
|
3,13 |
|
0,27 |
|
3,49 |
29,49 |
|
29,49 |
|
GHANA |
96,44 |
|
96,44 |
3,22 |
|
|
21,98 |
|
|
0,01 |
|
25,21 |
121,65 |
|
121,65 |
|
GAMBIE |
20,62 |
|
20,62 |
|
0,20 |
|
5,70 |
13,72 |
|
0,20 |
|
19,81 |
40,43 |
|
40,43 |
|
GUINEE BISSAU |
37,40 |
|
37,40 |
|
0,08 |
|
3,36 |
2,88 |
|
0,38 |
|
6,70 |
44,10 |
|
44,10 |
|
GUINEE |
108,83 |
5,00 |
113,83 |
|
1,05 |
2,29 |
38,00 |
|
35,00 |
0,81 |
|
77,15 |
190,99 |
|
190,99 |
|
COTE D'IVOIRE |
60,75 |
21,04 |
81,79 |
11,83 |
0,88 |
1,40 |
0,09 |
365,26 |
|
3,82 |
|
383,27 |
465,06 |
|
465,06 |
|
KENYA |
101,70 |
10,00 |
111,70 |
10,81 |
0,43 |
0,02 |
6,65 |
70,90 |
|
1,69 |
|
90,50 |
202,19 |
|
202,19 |
|
LIBERIA |
45,00 |
|
45,00 |
|
6,71 |
1,83 |
|
|
|
0,53 |
|
9,07 |
54,07 |
|
54,07 |
|
LESOTHO |
30,46 |
9,84 |
40,30 |
|
|
|
4,96 |
4,36 |
|
1,05 |
|
10,38 |
50,68 |
|
50,68 |
|
MADAGASCAR |
104,72 |
12,37 |
117,08 |
|
0,25 |
|
30,38 |
4,51 |
|
2,97 |
|
38,11 |
155,20 |
|
155,20 |
|
MALAWI |
109,32 |
4,96 |
114,28 |
1,66 |
4,14 |
13,22 |
12,00 |
21,70 |
|
1,09 |
|
53,81 |
168,09 |
|
168,09 |
|
MAURICE |
20,56 |
9,67 |
30,23 |
3,20 |
0,07 |
|
5,81 |
2,95 |
|
0,22 |
|
12,24 |
42,47 |
|
42,47 |
|
MAURITANIE |
61,11 |
|
61,11 |
|
0,74 |
1,55 |
21,51 |
|
18,00 |
0,65 |
|
42,45 |
103,56 |
|
103,56 |
|
MALI |
126,13 |
5,00 |
131,13 |
|
0,76 |
|
14,76 |
20,27 |
|
2,70 |
|
38,48 |
169,61 |
|
169,61 |
|
MOZAMBIQUE |
158,98 |
|
158,98 |
|
16,29 |
13,29 |
15,00 |
21,45 |
|
|
|
66,03 |
225,01 |
|
225,01 |
|
NIGER |
102,66 |
4,61 |
107,27 |
|
0,37 |
2,72 |
14,30 |
6,61 |
12,18 |
1,53 |
|
37,71 |
144,98 |
|
144,98 |
|
RWANDA |
109,93 |
|
109,93 |
|
1,57 |
0,22 |
12,25 |
61,91 |
|
1,20 |
|
77,14 |
187,07 |
|
187,07 |
|
SENEGAL |
98,49 |
10,00 |
108,49 |
|
1,60 |
4,23 |
22,32 |
106,95 |
21,20 |
2,51 |
|
158,80 |
267,29 |
|
267,29 |
|
SEYCHELLES |
6,18 |
|
6,18 |
0,22 |
|
|
1,47 |
|
|
|
|
1,69 |
7,86 |
|
7,86 |
|
SIERRA LEONE |
57,99 |
4,87 |
62,86 |
|
0,42 |
|
7,50 |
|
|
1,67 |
|
9,59 |
72,45 |
|
72,45 |
|
SOMALIE |
159,15 |
|
159,15 |
|
10,48 |
3,78 |
11,29 |
|
|
4,97 |
|
30,53 |
189,68 |
|
189,68 |
|
SAO TOME & PRINCIPE |
6,00 |
|
6,00 |
|
0,11 |
|
2,25 |
1,62 |
|
0,03 |
|
4,02 |
10,02 |
|
10,02 |
|
SOUDAN |
91,30 |
|
91,30 |
|
40,62 |
19,94 |
21,74 |
63,92 |
|
0,47 |
|
146,69 |
237,99 |
|
237,99 |
|
SWAZILAND |
19,89 |
4,73 |
24,61 |
0,71 |
|
1,34 |
7,00 |
|
|
0,32 |
|
9,37 |
33,98 |
|
33,98 |
|
TANZANIE |
160,92 |
|
160,92 |
|
0,10 |
|
13,44 |
8,91 |
|
0,99 |
|
23,44 |
184,35 |
|
184,35 |
|
TOGO |
46,86 |
2,40 |
49,26 |
|
|
|
7,54 |
25,55 |
|
0,81 |
|
33,89 |
83,15 |
|
83,15 |
|
OUGANDA |
132,84 |
|
132,84 |
|
2,52 |
5,92 |
15,60 |
|
|
2,20 |
|
26,24 |
159,08 |
|
159,08 |
|
NIGERIA |
50,16 |
128,61 |
178,77 |
15,02 |
1,08 |
|
0,59 |
|
|
0,96 |
|
17,66 |
196,44 |
|
196,44 |
|
ZAMBIE |
74,24 |
15,00 |
89,24 |
|
0,55 |
0,63 |
11,41 |
|
|
1,72 |
|
14,31 |
103,55 |
|
103,55 |
|
ZIMBABWE |
43,64 |
29,92 |
73,56 |
10,52 |
|
1,26 |
0,95 |
|
|
|
|
12,74 |
86,30 |
|
86,30 |
|
REP. DEMOCRATIQUE CONGO |
159,31 |
7,15 |
166,46 |
1,26 |
0,94 |
2,05 |
|
|
|
4,02 |
|
8,28 |
174,74 |
|
174,74 |
|
* TOTAL AFRIQUE |
3 307,23 |
352,38 |
3 659,61 |
61,04 |
156,56 |
92,38 |
432,55 |
1 264,50 |
108,02 |
60,79 |
|
2 175,84 |
5 835,45 |
|
5 835,45 |
|
ANTIGUA-BARBUDA |
3,44 |
0,98 |
4,42 |
|
|
|
1,50 |
|
|
|
|
1,50 |
5,92 |
|
5,92 |
|
BARBADE |
2,83 |
0,93 |
3,76 |
1,10 |
|
|
0,37 |
|
|
0,68 |
|
2,15 |
5,91 |
|
5,91 |
|
BELIZE |
4,98 |
3,00 |
7,98 |
0,14 |
|
1,81 |
1,00 |
|
|
2,11 |
|
5,07 |
13,05 |
|
13,05 |
|
BAHAMAS |
2,59 |
0,74 |
3,33 |
2,57 |
|
|
|
|
|
0,08 |
|
2,65 |
5,99 |
|
5,99 |
|
DOMINIQUE |
5,84 |
|
5,84 |
|
|
|
3,80 |
1,21 |
|
0,03 |
|
5,03 |
10,87 |
|
10,87 |
|
GRENADE |
5,44 |
|
5,44 |
|
0,09 |
|
2,62 |
2,53 |
|
0,02 |
|
5,26 |
10,70 |
|
10,70 |
|
GUYANE (ETAT) |
21,85 |
|
21,85 |
|
0,25 |
|
3,60 |
|
|
0,07 |
|
3,91 |
25,76 |
|
25,76 |
|
JAMAIQUE |
30,00 |
10,00 |
40,00 |
5,40 |
0,77 |
|
2,09 |
|
|
3,32 |
|
11,58 |
51,58 |
|
51,58 |
|
ST CHRISTOPHE (KITTS) & NEVI |
3,50 |
|
3,50 |
|
|
|
1,50 |
|
|
|
|
1,50 |
5,00 |
|
5,00 |
|
SAINTE LUCIE |
5,12 |
|
5,12 |
0,91 |
|
|
2,00 |
|
|
0,05 |
|
2,96 |
8,08 |
|
8,08 |
|
SURINAME |
16,61 |
0,54 |
17,15 |
|
0,10 |
|
3,00 |
|
|
0,78 |
|
3,89 |
21,04 |
|
21,04 |
|
SAINT VINCENT & GRENADINES |
6,90 |
|
6,90 |
0,55 |
0,09 |
|
2,59 |
|
|
0,00 |
|
3,23 |
10,13 |
|
10,13 |
|
TRINITE & TOBAGO |
7,07 |
|
7,07 |
1,91 |
0,10 |
|
2,96 |
|
|
6,31 |
|
11,27 |
18,34 |
|
18,34 |
|
* TOTAL CARAIBES |
116,18 |
16,19 |
132,37 |
12,58 |
1,40 |
1,81 |
27,02 |
3,74 |
|
13,45 |
|
60,01 |
192,37 |
|
192,37 |
|
FIDJI |
13,65 |
4,88 |
18,53 |
1,97 |
0,30 |
|
1,23 |
0,26 |
|
0,21 |
|
3,98 |
22,50 |
|
22,50 |
|
KIRIBATI |
6,50 |
|
6,50 |
|
|
|
0,50 |
2,46 |
|
0,31 |
|
3,27 |
9,77 |
|
9,77 |
|
PAPOUASIE NOUVELLE GUINEE |
21,00 |
13,50 |
34,50 |
4,59 |
|
0,58 |
3,50 |
110,01 |
30,00 |
0,23 |
|
148,91 |
183,41 |
|
183,41 |
|
SALOMON |
14,78 |
1,68 |
16,45 |
|
0,43 |
|
2,00 |
31,27 |
|
0,12 |
|
33,81 |
50,27 |
|
50,27 |
|
TONGA |
6,50 |
|
6,50 |
0,22 |
|
|
1,67 |
4,33 |
|
0,03 |
|
6,25 |
12,75 |
|
12,75 |
|
TUVALU |
1,58 |
|
1,58 |
|
|
|
0,50 |
0,14 |
|
|
|
0,64 |
2,22 |
|
2,22 |
|
VANUATU |
6,70 |
|
6,70 |
|
0,55 |
|
1,00 |
19,29 |
|
0,13 |
|
20,97 |
27,67 |
|
27,67 |
|
SAMOA |
8,97 |
|
8,97 |
|
0,22 |
|
4,20 |
11,12 |
|
0,06 |
|
15,60 |
24,57 |
|
24,57 |
|
* TOTAL PACIFIQUE |
79,66 |
20,06 |
99,72 |
6,78 |
1,49 |
0,58 |
14,60 |
178,88 |
30,00 |
1,09 |
|
233,42 |
333,15 |
|
333,15 |
|
BUDGET INTRA ACP |
|
|
|
|
|
|
|
|
|
|
|
|
|
10,00 |
10,00 |
|
COOPERATION REGIONALE ACP |
829,52 |
44,30 |
873,82 |
1,02 |
|
|
55,53 |
|
|
13,80 |
|
70,35 |
944,17 |
|
944,17 |
|
* TOTAL COOPER. REGIONALE ACP |
829,52 |
44,30 |
873,82 |
1,02 |
|
|
55,53 |
|
|
13,80 |
|
70,35 |
944,17 |
10,00 |
954,17 |
|
TOUS PAYS ACP |
|
|
|
|
19,95 |
|
|
|
|
0,15 |
|
20,10 |
20,10 |
|
20,10 |
|
FRAIS ADMINISTR. & FINANCIERS |
8,70 |
|
8,70 |
|
|
|
|
|
|
0,02 |
6,00 |
6,02 |
14,72 |
|
14,72 |
|
* TOTAL ACP |
4 341,29 |
432,93 |
4 774,22 |
81,42 |
179,39 |
94,77 |
529,70 |
1 447,12 |
138,02 |
89,30 |
6,00 |
2 565,73 |
7 339,96 |
10,00 |
7 349,96 |
|
MAYOTTE |
2,75 |
2,00 |
4,75 |
|
|
|
1,15 |
|
|
|
|
1,15 |
5,90 |
|
5,90 |
|
NOUVELLE CALEDONIE |
5,51 |
2,30 |
7,81 |
|
0,09 |
|
3,00 |
|
1,00 |
0,29 |
|
4,37 |
12,19 |
|
12,19 |
|
POLYNESIE FRANCAISE |
6,48 |
1,77 |
8,25 |
0,87 |
|
|
2,56 |
3,92 |
|
0,17 |
|
7,52 |
15,77 |
|
15,77 |
|
SAINT PIERRE & MIQUELON |
2,43 |
1,00 |
3,43 |
|
|
|
|
|
|
0,03 |
|
0,03 |
3,46 |
|
3,46 |
|
TERRES AUSTRALES FRANCAISES |
0,27 |
|
0,27 |
|
|
|
|
|
|
|
|
|
0,27 |
|
0,27 |
|
WALLIS & FUTUNA |
2,30 |
0,93 |
3,23 |
|
|
|
|
|
|
|
|
|
3,23 |
|
3,23 |
|
* TOTAL PTOM FRANCAIS |
19,74 |
8,00 |
27,74 |
0,87 |
0,09 |
|
6,71 |
3,92 |
1,00 |
0,49 |
|
13,08 |
40,82 |
|
40,82 |
|
ARUBA |
4,12 |
1,63 |
5,75 |
0,18 |
|
|
2,90 |
|
|
0,21 |
|
3,29 |
9,04 |
|
9,04 |
|
ANTILLES NEERLANDAISES |
13,05 |
1,86 |
14,91 |
0,62 |
|
|
0,24 |
|
|
0,63 |
|
1,48 |
16,39 |
|
16,39 |
|
* TOTAL PTOM NEERLANDAIS |
17,17 |
3,49 |
20,66 |
0,80 |
|
|
3,14 |
|
|
0,84 |
|
4,77 |
25,43 |
|
25,43 |
|
ANGUILLA |
1,69 |
|
1,69 |
|
|
|
1,50 |
|
|
|
|
1,50 |
3,19 |
|
3,19 |
|
CAIMANS |
|
1,49 |
1,49 |
0,50 |
|
|
|
|
|
|
|
0,50 |
1,99 |
|
1,99 |
|
FALKLAND |
0,70 |
|
0,70 |
|
|
|
|
0,08 |
|
0,41 |
|
0,49 |
1,19 |
|
1,19 |
|
MONTSERRAT |
1,50 |
0,50 |
2,00 |
|
|
|
2,13 |
|
|
0,11 |
|
2,24 |
4,24 |
|
4,24 |
|
SAINTE HELENE |
1,39 |
|
1,39 |
|
|
|
|
|
|
|
|
|
1,39 |
|
1,39 |
|
TURKS & CAICOS |
1,73 |
|
1,73 |
|
|
|
0,15 |
|
|
|
|
0,15 |
1,88 |
|
1,88 |
|
VIERGES (BRITANNIQUES) |
|
1,50 |
1,50 |
0,44 |
|
|
1,00 |
|
|
|
|
1,44 |
2,94 |
|
2,94 |
|
* TOTAL PTOM BRITANIQUES |
7,01 |
3,49 |
10,50 |
0,94 |
|
|
4,78 |
0,08 |
|
0,52 |
|
6,31 |
16,81 |
|
16,81 |
|
COOPERATION REGIONALE PTOM |
5,91 |
|
5,91 |
|
|
|
|
|
|
|
|
|
5,91 |
|
5,91 |
|
* COOPERATION REGIONALE PTOM |
5,91 |
|
5,91 |
|
|
|
|
|
|
|
|
|
5,91 |
|
5,91 |
|
TOUS PTOM |
|
|
|
|
0,43 |
|
|
|
|
|
|
0,43 |
0,43 |
|
0,43 |
|
* TOTAL PTOM |
49,82 |
14,98 |
64,81 |
2,60 |
0,51 |
|
14,62 |
4,00 |
1,00 |
1,85 |
|
24,58 |
89,39 |
|
89,39 |
|
* TOTAL ACP + PTOM |
4 391,11 |
447,92 |
4 839,03 |
84,02 |
179,90 |
94,77 |
544,32 |
1 451,12 |
139,02 |
91,15 |
6,00 |
2 590,32 |
7 429,35 |
10,00 |
7 439,35 |
Table 3.1.4
6th EDF
Decisions annual 2004
SITUATION BY INSTRUMENT AND STATE
|
(million EUR) |
||||||||||||||
|
|
Lomé |
Total state |
||||||||||||
|
NIP |
Non NIP |
Total |
||||||||||||
|
Grants |
Special loans |
Total NIP |
Interest subsidies |
Emergency aid |
Refugee aid |
Risk capital |
STABEX |
SYSMIN |
Transfers from others funds |
SAF |
Total non NIP |
|||
|
ANGOLA |
- 0,03 |
|
- 0,03 |
|
|
|
|
|
|
|
|
|
- 0,03 |
- 0,03 |
|
CAMEROUN |
- 0,16 |
|
- 0,16 |
|
|
|
|
|
|
|
|
|
- 0,16 |
- 0,16 |
|
GUINEE EQUATORIALE |
- 0,02 |
|
- 0,02 |
|
|
|
|
|
|
|
|
|
- 0,02 |
- 0,02 |
|
ETHIOPIE |
- 18,50 |
|
- 18,50 |
|
|
|
|
|
|
|
|
|
- 18,50 |
- 18,50 |
|
GHANA |
- 0,57 |
|
- 0,57 |
|
|
|
|
|
|
|
|
|
- 0,57 |
- 0,57 |
|
GUINEE |
- 0,16 |
|
- 0,16 |
|
|
|
|
|
|
|
|
|
- 0,16 |
- 0,16 |
|
COTE D'IVOIRE |
- 0,01 |
- 0,00 |
- 0,01 |
|
|
|
|
|
|
|
|
|
- 0,01 |
- 0,01 |
|
KENYA |
- 0,50 |
|
- 0,50 |
|
|
|
|
|
|
|
|
|
- 0,50 |
- 0,50 |
|
MADAGASCAR |
- 1,79 |
|
- 1,79 |
|
|
|
|
|
|
|
|
|
- 1,79 |
- 1,79 |
|
MALAWI |
- 0,11 |
|
- 0,11 |
|
|
|
|
|
|
|
|
|
- 0,11 |
- 0,11 |
|
SENEGAL |
|
|
|
|
|
|
|
|
- 0,59 |
|
|
- 0,59 |
- 0,59 |
- 0,59 |
|
SIERRA LEONE |
- 0,79 |
|
- 0,79 |
|
|
|
|
|
|
|
|
|
- 0,79 |
- 0,79 |
|
TANZANIE |
- 0,21 |
|
- 0,21 |
|
|
|
|
|
|
|
|
|
- 0,21 |
- 0,21 |
|
ZIMBABWE |
|
- 0,08 |
- 0,08 |
|
|
|
|
|
|
|
|
|
- 0,08 |
- 0,08 |
|
* TOTAL AFRIQUE |
- 22,84 |
- 0,08 |
- 22,92 |
|
|
|
|
|
- 0,59 |
|
|
- 0,59 |
- 23,52 |
- 23,52 |
|
ANTIGUA-BARBUDA |
- 0,08 |
|
- 0,08 |
|
|
|
|
|
|
|
|
|
- 0,08 |
- 0,08 |
|
GUYANE (ETAT) |
- 0,00 |
|
- 0,00 |
|
|
|
|
|
|
|
|
|
- 0,00 |
- 0,00 |
|
TRINITE & TOBAGO |
- 1,46 |
|
- 1,46 |
|
|
|
|
|
|
|
|
|
- 1,46 |
- 1,46 |
|
* TOTAL CARAIBES |
- 1,54 |
|
- 1,54 |
|
|
|
|
|
|
|
|
|
- 1,54 |
- 1,54 |
|
* TOTAL PACIFIQUE |
|
|
|
|
|
|
|
|
|
|
|
|
|
|
|
COOPERATION REGIONALE ACP |
- 6,97 |
|
- 6,97 |
|
|
|
|
|
|
|
|
|
- 6,97 |
- 6,97 |
|
* TOTAL COOPER. REGIONALE ACP |
- 6,97 |
|
- 6,97 |
|
|
|
|
|
|
|
|
|
- 6,97 |
- 6,97 |
|
* TOTAL ACP |
- 31,36 |
- 0,08 |
- 31,44 |
|
|
|
|
|
- 0,59 |
|
|
- 0,59 |
- 32,03 |
- 32,03 |
|
* TOTAL PTOM FRANCAIS |
|
|
|
|
|
|
|
|
|
|
|
|
|
|
|
ANTILLES NEERLANDAISES |
|
- 0,21 |
- 0,21 |
|
|
|
|
|
|
|
|
|
- 0,21 |
- 0,21 |
|
* TOTAL PTOM NEERLANDAIS |
|
- 0,21 |
- 0,21 |
|
|
|
|
|
|
|
|
|
- 0,21 |
- 0,21 |
|
* TOTAL PTOM BRITANNIQUES |
|
|
|
|
|
|
|
|
|
|
|
|
|
|
|
* COOPERATION REGIONALE PTOM |
|
|
|
|
|
|
|
|
|
|
|
|
|
|
|
* TOTAL PTOM |
|
- 0,21 |
- 0,21 |
|
|
|
|
|
|
|
|
|
- 0,21 |
- 0,21 |
|
* TOTAL ACP + PTOM |
- 31,36 |
- 0,29 |
- 31,65 |
|
|
|
|
|
- 0,59 |
|
|
- 0,59 |
- 32,24 |
- 32,24 |
Table 3.1.5
6th EDF
Assigned funds cumulative 2004
SITUATION BY INSTRUMENT AND STATE
|
(million EUR) |
|||||||||||||||
|
|
Lomé |
Cotonou |
Total state |
||||||||||||
|
NIP |
Non NIP |
Total |
|||||||||||||
|
Grants |
Special loans |
Total NIP |
Interest subsidies |
Emergency aid |
Refugee aid |
Risk capital |
STABEX |
SYSMIN |
Transfers from others funds |
SAF |
Total non NIP |
||||
|
ANGOLA |
97,63 |
|
97,63 |
|
13,66 |
2,62 |
2,50 |
|
|
|
|
18,79 |
116,42 |
|
116,42 |
|
BENIN |
85,62 |
|
85,62 |
|
0,33 |
0,12 |
12,72 |
17,72 |
|
3,18 |
|
34,07 |
119,69 |
|
119,69 |
|
BURKINA FASO |
106,57 |
|
106,57 |
|
0,35 |
|
12,74 |
7,32 |
|
6,58 |
|
27,00 |
133,56 |
|
133,56 |
|
BOTSWANA |
20,99 |
5,32 |
26,31 |
2,59 |
0,43 |
0,37 |
4,04 |
|
21,65 |
0,48 |
|
29,57 |
55,87 |
|
55,87 |
|
BURUNDI |
83,62 |
9,92 |
93,54 |
|
0,21 |
0,39 |
10,06 |
44,50 |
|
1,06 |
|
56,21 |
149,76 |
|
149,76 |
|
CENTRAFRIQUE |
67,27 |
|
67,27 |
|
0,61 |
|
4,76 |
31,22 |
|
2,50 |
|
39,10 |
106,37 |
|
106,37 |
|
TCHAD |
84,02 |
|
84,02 |
|
1,17 |
1,79 |
3,54 |
40,39 |
|
1,57 |
|
48,47 |
132,49 |
|
132,49 |
|
CAMEROUN |
70,49 |
29,38 |
99,87 |
|
0,14 |
|
1,00 |
198,76 |
|
3,30 |
|
203,20 |
303,07 |
|
303,07 |
|
CONGO |
28,25 |
7,67 |
35,91 |
|
|
|
11,54 |
|
|
0,33 |
|
11,87 |
47,79 |
|
47,79 |
|
COMORES |
20,21 |
|
20,21 |
|
|
|
2,00 |
9,56 |
|
0,40 |
|
11,97 |
32,17 |
|
32,17 |
|
CAP VERT |
24,38 |
|
24,38 |
|
|
|
3,00 |
|
|
0,29 |
|
3,29 |
27,67 |
|
27,67 |
|
DJIBOUTI |
15,11 |
|
15,11 |
|
0,15 |
1,13 |
0,87 |
|
|
0,13 |
|
2,27 |
17,38 |
|
17,38 |
|
GUINEE EQUATORIALE |
11,90 |
|
11,90 |
|
|
|
4,00 |
9,83 |
|
0,33 |
|
14,16 |
26,06 |
|
26,06 |
|
ETHIOPIE |
164,35 |
6,56 |
170,91 |
|
47,45 |
10,25 |
29,94 |
98,61 |
|
0,84 |
|
187,09 |
358,00 |
|
358,00 |
|
GABON |
18,68 |
7,31 |
25,99 |
|
0,10 |
|
|
3,13 |
|
0,27 |
|
3,49 |
29,48 |
|
29,48 |
|
GHANA |
96,40 |
|
96,40 |
3,22 |
|
|
21,98 |
|
|
0,01 |
|
25,21 |
121,61 |
|
121,61 |
|
GAMBIE |
20,53 |
|
20,53 |
|
0,20 |
|
5,70 |
13,72 |
|
0,20 |
|
19,81 |
40,34 |
|
40,34 |
|
GUINEE BISSAU |
36,38 |
|
36,38 |
|
0,08 |
|
3,36 |
2,88 |
|
0,34 |
|
6,66 |
43,04 |
|
43,04 |
|
GUINEE |
106,95 |
5,00 |
111,95 |
|
1,05 |
2,29 |
38,00 |
|
28,88 |
0,81 |
|
71,04 |
182,98 |
|
182,98 |
|
COTE D'IVOIRE |
60,73 |
21,04 |
81,77 |
11,83 |
0,88 |
1,40 |
0,09 |
365,26 |
|
3,82 |
|
383,27 |
465,04 |
|
465,04 |
|
KENYA |
100,41 |
10,00 |
110,41 |
10,81 |
0,43 |
0,02 |
6,65 |
70,90 |
|
1,57 |
|
90,37 |
200,79 |
|
200,79 |
|
LIBERIA |
44,72 |
|
44,72 |
|
6,71 |
1,83 |
|
|
|
0,50 |
|
9,03 |
53,76 |
|
53,76 |
|
LESOTHO |
30,46 |
9,84 |
40,30 |
|
|
|
4,96 |
4,36 |
|
1,05 |
|
10,38 |
50,68 |
|
50,68 |
|
MADAGASCAR |
103,61 |
12,37 |
115,98 |
|
0,25 |
|
30,38 |
4,51 |
|
2,97 |
|
38,11 |
154,09 |
|
154,09 |
|
MALAWI |
108,95 |
4,96 |
113,91 |
1,66 |
4,14 |
13,22 |
12,00 |
21,70 |
|
1,06 |
|
53,78 |
167,70 |
|
167,70 |
|
MAURICE |
20,48 |
9,67 |
30,15 |
3,20 |
0,07 |
|
5,81 |
2,95 |
|
0,22 |
|
12,24 |
42,39 |
|
42,39 |
|
MAURITANIE |
59,50 |
|
59,50 |
|
0,74 |
1,55 |
21,51 |
|
18,00 |
0,65 |
|
42,45 |
101,95 |
|
101,95 |
|
MALI |
126,13 |
5,00 |
131,13 |
|
0,76 |
|
14,76 |
20,27 |
|
2,70 |
|
38,48 |
169,61 |
|
169,61 |
|
MOZAMBIQUE |
156,30 |
|
156,30 |
|
16,29 |
13,29 |
15,00 |
21,45 |
|
|
|
66,03 |
222,32 |
|
222,32 |
|
NIGER |
102,66 |
4,61 |
107,27 |
|
0,37 |
2,72 |
14,30 |
6,61 |
12,18 |
1,53 |
|
37,71 |
144,98 |
|
144,98 |
|
RWANDA |
104,76 |
|
104,76 |
|
1,57 |
0,22 |
12,25 |
61,91 |
|
0,93 |
|
76,87 |
181,63 |
|
181,63 |
|
SENEGAL |
98,25 |
9,77 |
108,02 |
|
1,60 |
4,18 |
22,32 |
106,95 |
21,20 |
2,51 |
|
158,75 |
266,77 |
|
266,77 |
|
SEYCHELLES |
6,18 |
|
6,18 |
0,22 |
|
|
1,47 |
|
|
|
|
1,69 |
7,86 |
|
7,86 |
|
SIERRA LEONE |
57,98 |
4,87 |
62,85 |
|
0,42 |
|
7,50 |
|
|
1,67 |
|
9,59 |
72,44 |
|
72,44 |
|
SOMALIE |
156,84 |
|
156,84 |
|
10,48 |
3,78 |
11,29 |
|
|
4,97 |
|
30,52 |
187,37 |
|
187,37 |
|
SAO TOME & PRINCIPE |
6,00 |
|
6,00 |
|
0,11 |
|
2,25 |
1,62 |
|
0,03 |
|
4,02 |
10,02 |
|
10,02 |
|
SOUDAN |
88,14 |
|
88,14 |
|
40,62 |
19,94 |
21,74 |
63,92 |
|
0,47 |
|
146,69 |
234,83 |
|
234,83 |
|
SWAZILAND |
19,89 |
4,73 |
24,61 |
0,71 |
|
1,34 |
7,00 |
|
|
0,32 |
|
9,37 |
33,98 |
|
33,98 |
|
TANZANIE |
160,92 |
|
160,92 |
|
0,10 |
|
13,44 |
8,91 |
|
0,99 |
|
23,44 |
184,35 |
|
184,35 |
|
TOGO |
46,86 |
2,40 |
49,26 |
|
|
|
7,54 |
25,55 |
|
0,81 |
|
33,89 |
83,15 |
|
83,15 |
|
OUGANDA |
129,90 |
|
129,90 |
|
2,52 |
5,92 |
15,60 |
|
|
2,20 |
|
26,24 |
156,13 |
|
156,13 |
|
NIGERIA |
49,96 |
127,89 |
177,85 |
15,02 |
1,08 |
|
0,59 |
|
|
0,93 |
|
17,63 |
195,47 |
|
195,47 |
|
ZAMBIE |
74,19 |
15,00 |
89,19 |
|
0,55 |
0,63 |
11,41 |
|
|
1,72 |
|
14,31 |
103,50 |
|
103,50 |
|
ZIMBABWE |
42,83 |
29,73 |
72,56 |
10,52 |
|
1,26 |
0,95 |
|
|
|
|
12,74 |
85,30 |
|
85,30 |
|
REP. DEMOCRATIQUE CONGO |
157,79 |
7,15 |
164,94 |
1,26 |
0,94 |
2,05 |
|
|
|
4,02 |
|
8,28 |
173,22 |
|
173,22 |
|
* TOTAL AFRIQUE |
3 273,77 |
350,19 |
3 623,95 |
61,04 |
156,56 |
92,33 |
432,55 |
1 264,50 |
101,91 |
60,27 |
|
2 169,15 |
5 793,11 |
|
5 793,11 |
|
ANTIGUA-BARBUDA |
3,44 |
0,98 |
4,42 |
|
|
|
1,50 |
|
|
|
|
1,50 |
5,92 |
|
5,92 |
|
BARBADE |
2,83 |
0,93 |
3,76 |
1,10 |
|
|
0,37 |
|
|
0,68 |
|
2,15 |
5,91 |
|
5,91 |
|
BELIZE |
4,98 |
3,00 |
7,98 |
0,14 |
|
1,81 |
1,00 |
|
|
2,11 |
|
5,07 |
13,05 |
|
13,05 |
|
BAHAMAS |
2,59 |
0,74 |
3,33 |
2,57 |
|
|
|
|
|
0,08 |
|
2,65 |
5,99 |
|
5,99 |
|
DOMINIQUE |
5,84 |
|
5,84 |
|
|
|
3,80 |
1,21 |
|
0,03 |
|
5,03 |
10,87 |
|
10,87 |
|
GRENADE |
5,44 |
|
5,44 |
|
0,09 |
|
2,62 |
2,53 |
|
0,02 |
|
5,26 |
10,70 |
|
10,70 |
|
GUYANE (ETAT) |
21,84 |
|
21,84 |
|
0,25 |
|
3,60 |
|
|
0,07 |
|
3,91 |
25,75 |
|
25,75 |
|
JAMAIQUE |
30,00 |
10,00 |
40,00 |
5,40 |
0,77 |
|
2,09 |
|
|
3,31 |
|
11,57 |
51,57 |
|
51,57 |
|
ST CHRISTOPHE (KITTS) & NEVI |
3,50 |
|
3,50 |
|
|
|
1,50 |
|
|
|
|
1,50 |
5,00 |
|
5,00 |
|
SAINTE LUCIE |
5,10 |
|
5,10 |
0,91 |
|
|
2,00 |
|
|
0,05 |
|
2,96 |
8,06 |
|
8,06 |
|
SURINAME |
16,34 |
0,54 |
16,88 |
|
0,10 |
|
3,00 |
|
|
0,78 |
|
3,89 |
20,77 |
|
20,77 |
|
SAINT VINCENT & GRENADINES |
6,74 |
|
6,74 |
0,55 |
0,09 |
|
2,59 |
|
|
0,00 |
|
3,23 |
9,96 |
|
9,96 |
|
TRINITE & TOBAGO |
6,99 |
|
6,99 |
1,91 |
0,10 |
|
2,96 |
|
|
6,31 |
|
11,27 |
18,26 |
|
18,26 |
|
* TOTAL CARAIBES |
115,62 |
16,19 |
131,81 |
12,58 |
1,40 |
1,81 |
27,02 |
3,74 |
|
13,44 |
|
60,00 |
191,80 |
|
191,80 |
|
FIDJI |
13,64 |
4,88 |
18,52 |
1,97 |
0,30 |
|
1,23 |
0,26 |
|
0,21 |
|
3,98 |
22,50 |
|
22,50 |
|
KIRIBATI |
6,50 |
|
6,50 |
|
|
|
0,50 |
2,46 |
|
0,31 |
|
3,27 |
9,76 |
|
9,76 |
|
PAPOUASIE NOUVELLE GUINEE |
21,00 |
13,50 |
34,50 |
4,59 |
|
0,58 |
3,50 |
110,01 |
25,44 |
0,23 |
|
144,35 |
178,85 |
|
178,85 |
|
SALOMON |
14,59 |
1,68 |
16,27 |
|
0,43 |
|
2,00 |
31,27 |
|
0,12 |
|
33,81 |
50,08 |
|
50,08 |
|
TONGA |
6,40 |
|
6,40 |
0,22 |
|
|
1,67 |
4,33 |
|
0,03 |
|
6,25 |
12,66 |
|
12,66 |
|
TUVALU |
1,58 |
|
1,58 |
|
|
|
0,50 |
0,14 |
|
|
|
0,64 |
2,22 |
|
2,22 |
|
VANUATU |
6,70 |
|
6,70 |
|
0,55 |
|
1,00 |
19,29 |
|
0,13 |
|
20,97 |
27,67 |
|
27,67 |
|
SAMOA |
8,96 |
|
8,96 |
|
0,22 |
|
4,20 |
11,12 |
|
0,06 |
|
15,60 |
24,56 |
|
24,56 |
|
* TOTAL PACIFIQUE |
79,37 |
20,06 |
99,43 |
6,78 |
1,49 |
0,58 |
14,60 |
178,88 |
25,44 |
1,09 |
|
228,87 |
328,30 |
|
328,30 |
|
BUDGET INTRA ACP |
|
|
|
|
|
|
|
|
|
|
|
|
|
10,00 |
|
|
COOPERATION REGIONALE ACP |
819,06 |
44,30 |
863,36 |
1,02 |
|
|
55,53 |
|
|
12,57 |
|
69,12 |
932,48 |
|
932,48 |
|
* TOTAL COOPER. REGIONALE ACP |
819,06 |
44,30 |
863,36 |
1,02 |
|
|
55,53 |
|
|
12,57 |
|
69,12 |
932,48 |
10,00 |
942,48 |
|
TOUS PAYS ACP |
|
|
|
|
19,95 |
|
|
|
|
0,15 |
|
20,10 |
20,10 |
|
20,10 |
|
FRAIS ADMINISTR. & FINANCIERS |
8,56 |
|
8,56 |
|
|
|
|
|
|
0,02 |
5,33 |
5,35 |
13,91 |
|
13,91 |
|
* TOTAL ACP |
4 296,37 |
430,74 |
4 727,11 |
81,42 |
179,39 |
94,72 |
529,70 |
1 447,12 |
127,35 |
87,54 |
5,33 |
2 552,59 |
7 279,70 |
10,00 |
7 289,70 |
|
MAYOTTE |
2,75 |
2,00 |
4,75 |
|
|
|
1,15 |
|
|
|
|
1,15 |
5,90 |
|
5,90 |
|
NOUVELLE CALEDONIE |
5,51 |
2,30 |
7,81 |
|
0,09 |
|
3,00 |
|
1,00 |
0,29 |
|
4,37 |
12,18 |
|
12,18 |
|
POLYNESIE FRANCAISE |
6,44 |
1,77 |
8,21 |
0,87 |
|
|
2,56 |
3,92 |
|
0,17 |
|
7,52 |
15,73 |
|
15,73 |
|
SAINT PIERRE & MIQUELON |
2,43 |
1,00 |
3,43 |
|
|
|
|
|
|
0,03 |
|
0,03 |
3,46 |
|
3,46 |
|
TERRES AUSTRALES FRANCAISES |
0,27 |
|
0,27 |
|
|
|
|
|
|
|
|
|
0,27 |
|
0,27 |
|
WALLIS & FUTUNA |
2,30 |
0,93 |
3,23 |
|
|
|
|
|
|
|
|
|
3,23 |
|
3,23 |
|
* TOTAL PTOM FRANCAIS |
19,70 |
8,00 |
27,70 |
0,87 |
0,09 |
|
6,71 |
3,92 |
1,00 |
0,49 |
|
13,07 |
40,78 |
|
40,78 |
|
ARUBA |
4,12 |
1,63 |
5,75 |
0,18 |
|
|
2,90 |
|
|
0,21 |
|
3,29 |
9,04 |
|
9,04 |
|
ANTILLES NEERLANDAISES |
12,77 |
1,86 |
14,63 |
0,62 |
|
|
0,24 |
|
|
0,63 |
|
1,48 |
16,11 |
|
16,11 |
|
* TOTAL PTOM NEERLANDAIS |
16,89 |
3,49 |
20,38 |
0,80 |
|
|
3,14 |
|
|
0,84 |
|
4,77 |
25,15 |
|
25,15 |
|
ANGUILLA |
1,69 |
|
1,69 |
|
|
|
1,50 |
|
|
|
|
1,50 |
3,19 |
|
3,19 |
|
CAIMANS |
|
1,49 |
1,49 |
0,50 |
|
|
|
|
|
|
|
0,50 |
1,99 |
|
1,99 |
|
FALKLAND |
0,66 |
|
0,66 |
|
|
|
|
0,08 |
|
0,41 |
|
0,49 |
1,15 |
|
1,15 |
|
MONTSERRAT |
1,50 |
0,50 |
2,00 |
|
|
|
2,13 |
|
|
0,11 |
|
2,24 |
4,24 |
|
4,24 |
|
SAINTE HELENE |
1,39 |
|
1,39 |
|
|
|
|
|
|
|
|
|
1,39 |
|
1,39 |
|
TURKS & CAICOS |
1,73 |
|
1,73 |
|
|
|
0,15 |
|
|
|
|
0,15 |
1,88 |
|
1,88 |
|
VIERGES (BRITANNIQUES) |
|
1,50 |
1,50 |
0,44 |
|
|
1,00 |
|
|
|
|
1,44 |
2,94 |
|
2,94 |
|
* TOTAL PTOM BRITANIQUES |
6,96 |
3,49 |
10,45 |
0,94 |
|
|
4,78 |
0,08 |
|
0,52 |
|
6,31 |
16,76 |
|
16,76 |
|
COOPERATION REGIONALE PTOM |
5,53 |
|
5,53 |
|
|
|
|
|
|
|
|
|
5,53 |
|
5,53 |
|
* COOPERATION REGIONALE PTOM |
5,53 |
|
5,53 |
|
|
|
|
|
|
|
|
|
5,53 |
|
5,53 |
|
TOUS PTOM |
|
|
|
|
0,43 |
|
|
|
|
|
|
0,43 |
0,43 |
|
0,43 |
|
* TOTAL PTOM |
49,08 |
14,98 |
64,06 |
2,60 |
0,51 |
|
14,62 |
4,00 |
1,00 |
1,85 |
|
24,15 |
88,21 |
|
88,64 |
|
* TOTAL ACP + PTOM |
4 345,45 |
445,73 |
4 791,18 |
84,02 |
179,90 |
94,72 |
544,32 |
1 451,12 |
128,35 |
89,39 |
5,33 |
2 576,74 |
7 367,92 |
10,00 |
7 378,34 |
Table 3.1.6
6th EDF
Assigned funds annual 2004
SITUATION BY INSTRUMENT AND STATE
|
(million EUR) |
||||||||||||||
|
|
Lomé |
Total state |
||||||||||||
|
NIP |
Non NIP |
Total |
||||||||||||
|
Grants |
Special loans |
Total NIP |
Interest subsidies |
Emergency aid |
Refugee aid |
Risk capital |
STABEX |
SYSMIN |
Transfers from others funds |
SAF |
Total non NIP |
|||
|
ANGOLA |
- 0,04 |
|
- 0,04 |
|
|
|
|
|
|
|
|
|
- 0,04 |
- 0,04 |
|
CENTRAFRIQUE |
0,00 |
|
0,00 |
|
|
|
|
|
|
|
|
|
0,00 |
0,00 |
|
CAP VERT |
- 0,01 |
|
- 0,01 |
|
|
|
|
|
|
|
|
|
- 0,01 |
- 0,01 |
|
ETHIOPIE |
- 0,00 |
|
- 0,00 |
|
|
|
|
|
|
|
|
|
- 0,00 |
- 0,00 |
|
GABON |
- 0,00 |
|
- 0,00 |
|
|
|
|
|
|
|
|
|
- 0,00 |
- 0,00 |
|
GHANA |
- 0,61 |
|
- 0,61 |
|
|
|
|
|
|
|
|
|
- 0,61 |
- 0,61 |
|
GUINEE |
- 0,37 |
|
- 0,37 |
|
|
|
|
|
- 0,45 |
|
|
- 0,45 |
- 0,82 |
- 0,82 |
|
COTE D'IVOIRE |
- 0,02 |
|
- 0,02 |
|
|
|
|
|
|
|
|
|
- 0,02 |
- 0,02 |
|
KENYA |
- 0,03 |
|
- 0,03 |
|
|
|
|
|
|
|
|
|
- 0,03 |
- 0,03 |
|
MADAGASCAR |
- 1,87 |
|
- 1,87 |
|
|
|
|
|
|
|
|
|
- 1,87 |
- 1,87 |
|
MALAWI |
2,79 |
|
2,79 |
|
|
|
|
|
|
- 0,02 |
|
- 0,02 |
2,77 |
2,77 |
|
MAURITANIE |
- 1,50 |
|
- 1,50 |
|
|
|
|
|
|
|
|
|
- 1,50 |
- 1,50 |
|
MOZAMBIQUE |
8,60 |
|
8,60 |
|
|
|
|
|
|
|
|
|
8,60 |
8,60 |
|
RWANDA |
1,21 |
|
1,21 |
|
|
|
|
|
|
0,02 |
|
0,02 |
1,23 |
1,23 |
|
SENEGAL |
- 0,23 |
0,08 |
- 0,15 |
|
|
|
|
|
- 0,57 |
|
|
- 0,57 |
- 0,72 |
- 0,72 |
|
SIERRA LEONE |
- 0,00 |
|
- 0,00 |
|
|
|
|
|
|
|
|
|
- 0,00 |
- 0,00 |
|
SOMALIE |
- 0,69 |
|
- 0,69 |
|
|
|
|
|
|
|
|
|
- 0,69 |
- 0,69 |
|
SOUDAN |
3,97 |
|
3,97 |
|
|
|
|
|
|
|
|
|
3,97 |
3,97 |
|
OUGANDA |
3,73 |
|
3,73 |
|
|
|
|
|
|
|
|
|
3,73 |
3,73 |
|
NIGERIA |
- 0,14 |
|
- 0,14 |
|
|
|
|
|
|
|
|
|
- 0,14 |
- 0,14 |
|
ZAMBIE |
- 0,02 |
|
- 0,02 |
|
|
|
|
|
|
|
|
|
- 0,02 |
- 0,02 |
|
ZIMBABWE |
- 0,02 |
- 0,03 |
- 0,05 |
|
|
|
|
|
|
|
|
|
- 0,05 |
- 0,05 |
|
REP. DEMOCRATIQUE CONGO |
10,06 |
|
10,06 |
|
|
|
|
|
|
|
|
|
10,06 |
10,06 |
|
* TOTAL AFRIQUE |
24,82 |
0,05 |
24,87 |
|
|
|
|
|
- 1,02 |
0,00 |
|
- 1,02 |
23,85 |
23,85 |
|
GUYANE (ETAT) |
- 0,00 |
|
- 0,00 |
|
|
|
|
|
|
|
|
|
- 0,00 |
- 0,00 |
|
SURINAME |
0,53 |
|
0,53 |
|
|
|
|
|
|
|
|
|
0,53 |
0,53 |
|
TRINITE & TOBAGO |
- 0,02 |
|
- 0,02 |
|
|
|
|
|
|
|
|
|
- 0,02 |
- 0,02 |
|
* TOTAL CARAIBES |
0,50 |
|
0,50 |
|
|
|
|
|
|
|
|
|
0,50 |
0,50 |
|
FIDJI |
0,60 |
|
0,60 |
|
|
|
|
|
|
|
|
|
0,60 |
0,60 |
|
SALOMON |
- 0,03 |
|
- 0,03 |
|
|
|
|
|
|
|
|
|
- 0,03 |
- 0,03 |
|
SAMOA |
- 0,01 |
|
- 0,01 |
|
|
|
|
|
|
|
|
|
- 0,01 |
- 0,01 |
|
* TOTAL PACIFIQUE |
0,57 |
|
0,57 |
|
|
|
|
|
|
|
|
|
0,57 |
0,57 |
|
COOPERATION REGIONALE ACP |
3,86 |
|
3,86 |
|
|
|
|
|
|
|
|
|
3,86 |
3,86 |
|
* TOTAL COOPER. REGIONALE ACP |
3,86 |
|
3,86 |
|
|
|
|
|
|
|
|
|
3,86 |
3,86 |
|
FRAIS ADMINISTR. & FINANCIERS |
- 0,01 |
|
- 0,01 |
|
|
|
|
|
|
|
|
|
- 0,01 |
- 0,01 |
|
* TOTAL ACP |
29,74 |
0,05 |
29,78 |
|
|
|
|
|
- 1,02 |
|
|
- 1,02 |
28,76 |
28,76 |
|
* TOTAL PTOM FRANCAIS |
|
|
|
|
|
|
|
|
|
|
|
|
|
|
|
ANTILLES NEERLANDAISES |
- 0,05 |
|
- 0,05 |
|
|
|
|
|
|
|
|
|
- 0,05 |
- 0,05 |
|
* TOTAL PTOM NEERLANDAIS |
- 0,05 |
|
- 0,05 |
|
|
|
|
|
|
|
|
|
- 0,05 |
- 0,05 |
|
* TOTAL PTOM BRITANNIQUES |
|
|
|
|
|
|
|
|
|
|
|
|
|
|
|
COOPERATION REGIONALE PTOM |
- 0,03 |
|
- 0,03 |
|
|
|
|
|
|
|
|
|
- 0,03 |
- 0,03 |
|
* COOPERATION REGIONALE PTOM |
- 0,03 |
|
- 0,03 |
|
|
|
|
|
|
|
|
|
- 0,03 |
- 0,03 |
|
* TOTAL PTOM |
- 0,09 |
|
- 0,09 |
|
|
|
|
|
|
|
|
|
- 0,09 |
- 0,09 |
|
* TOTAL ACP + PTOM |
29,65 |
0,05 |
29,70 |
|
|
|
|
|
- 1,02 |
|
|
- 1,02 |
28,68 |
28,68 |
Table 3.1.7
6th EDF
Payments cumulative 2004
SITUATION BY INSTRUMENT AND STATE
|
(million EUR) |
|||||||||||||||
|
|
Lomé |
Cotonou |
Total state |
||||||||||||
|
NIP |
Non NIP |
Total |
|||||||||||||
|
Grants |
Special loans |
Total NIP |
Interest subsidies |
Emergency aid |
Refugee aid |
Risk capital |
STABEX |
SYSMIN |
Transfers from others funds |
SAF |
Total non NIP |
||||
|
ANGOLA |
97,30 |
|
97,30 |
|
13,66 |
2,62 |
2,50 |
|
|
|
|
18,79 |
116,09 |
|
116,09 |
|
BENIN |
85,62 |
|
85,62 |
|
0,33 |
0,12 |
12,72 |
17,72 |
|
3,18 |
|
34,07 |
119,69 |
|
119,69 |
|
BURKINA FASO |
106,57 |
|
106,57 |
|
0,35 |
|
12,74 |
7,32 |
|
6,58 |
|
27,00 |
133,56 |
|
133,56 |
|
BOTSWANA |
20,99 |
5,32 |
26,31 |
2,59 |
0,43 |
0,37 |
4,04 |
|
21,65 |
0,48 |
|
29,57 |
55,87 |
|
55,87 |
|
BURUNDI |
83,62 |
9,92 |
93,54 |
|
0,21 |
0,39 |
10,06 |
44,50 |
|
1,06 |
|
56,21 |
149,76 |
|
149,76 |
|
CENTRAFRIQUE |
67,15 |
|
67,15 |
|
0,61 |
|
4,76 |
31,22 |
|
2,50 |
|
39,10 |
106,26 |
|
106,26 |
|
TCHAD |
83,84 |
|
83,84 |
|
1,17 |
1,79 |
3,54 |
40,39 |
|
1,57 |
|
48,47 |
132,30 |
|
132,30 |
|
CAMEROUN |
70,49 |
29,38 |
99,87 |
|
0,14 |
|
1,00 |
198,76 |
|
3,30 |
|
203,20 |
303,07 |
|
303,07 |
|
CONGO |
28,25 |
7,67 |
35,91 |
|
|
|
11,54 |
|
|
0,33 |
|
11,87 |
47,79 |
|
47,79 |
|
COMORES |
20,21 |
|
20,21 |
|
|
|
2,00 |
9,56 |
|
0,40 |
|
11,97 |
32,17 |
|
32,17 |
|
CAP VERT |
24,38 |
|
24,38 |
|
|
|
3,00 |
|
|
0,29 |
|
3,29 |
27,67 |
|
27,67 |
|
DJIBOUTI |
15,11 |
|
15,11 |
|
0,15 |
1,13 |
0,87 |
|
|
0,13 |
|
2,27 |
17,38 |
|
17,38 |
|
GUINEE EQUATORIALE |
11,89 |
|
11,89 |
|
|
|
4,00 |
9,83 |
|
0,33 |
|
14,16 |
26,06 |
|
26,06 |
|
ETHIOPIE |
163,44 |
6,56 |
170,00 |
|
47,45 |
10,25 |
29,94 |
98,61 |
|
0,84 |
|
187,09 |
357,09 |
|
357,09 |
|
GABON |
18,52 |
7,31 |
25,82 |
|
0,10 |
|
|
3,13 |
|
0,27 |
|
3,49 |
29,32 |
|
29,32 |
|
GHANA |
96,24 |
|
96,24 |
3,22 |
|
|
21,98 |
|
|
0,01 |
|
25,21 |
121,45 |
|
121,45 |
|
GAMBIE |
20,52 |
|
20,52 |
|
0,20 |
|
5,70 |
13,72 |
|
0,20 |
|
19,81 |
40,33 |
|
40,33 |
|
GUINEE BISSAU |
36,15 |
|
36,15 |
|
0,08 |
|
3,36 |
2,88 |
|
0,34 |
|
6,66 |
42,82 |
|
42,82 |
|
GUINEE |
106,79 |
5,00 |
111,79 |
|
1,05 |
2,29 |
38,00 |
|
28,68 |
0,81 |
|
70,84 |
182,63 |
|
182,63 |
|
COTE D'IVOIRE |
60,73 |
21,04 |
81,77 |
11,83 |
0,88 |
1,40 |
0,09 |
365,26 |
|
3,82 |
|
383,27 |
465,04 |
|
465,04 |
|
KENYA |
99,97 |
10,00 |
109,97 |
10,81 |
0,43 |
0,02 |
6,65 |
70,90 |
|
1,55 |
|
90,35 |
200,32 |
|
200,32 |
|
LIBERIA |
43,15 |
|
43,15 |
|
6,71 |
1,83 |
|
|
|
0,48 |
|
9,02 |
52,17 |
|
52,17 |
|
LESOTHO |
30,46 |
9,84 |
40,30 |
|
|
|
4,96 |
4,36 |
|
1,05 |
|
10,38 |
50,68 |
|
50,68 |
|
MADAGASCAR |
103,50 |
12,37 |
115,87 |
|
0,25 |
|
30,38 |
4,51 |
|
2,97 |
|
38,11 |
153,98 |
|
153,98 |
|
MALAWI |
106,76 |
4,96 |
111,72 |
1,66 |
4,14 |
13,22 |
12,00 |
21,70 |
|
1,05 |
|
53,77 |
165,49 |
|
165,49 |
|
MAURICE |
20,15 |
9,67 |
29,82 |
3,20 |
0,07 |
|
5,81 |
2,95 |
|
0,22 |
|
12,24 |
42,06 |
|
42,06 |
|
MAURITANIE |
59,36 |
|
59,36 |
|
0,74 |
1,55 |
21,51 |
|
18,00 |
0,65 |
|
42,45 |
101,81 |
|
101,81 |
|
MALI |
126,13 |
5,00 |
131,13 |
|
0,76 |
|
14,76 |
20,27 |
|
2,70 |
|
38,48 |
169,61 |
|
169,61 |
|
MOZAMBIQUE |
147,06 |
|
147,06 |
|
16,29 |
13,29 |
11,88 |
21,45 |
|
|
|
62,92 |
209,98 |
|
209,98 |
|
NIGER |
102,66 |
4,61 |
107,27 |
|
0,37 |
2,72 |
14,30 |
6,61 |
12,18 |
1,53 |
|
37,71 |
144,98 |
|
144,98 |
|
RWANDA |
101,65 |
|
101,65 |
|
1,57 |
0,22 |
11,03 |
61,91 |
|
0,45 |
|
75,17 |
176,81 |
|
176,81 |
|
SENEGAL |
98,14 |
9,77 |
107,91 |
|
1,60 |
4,18 |
22,32 |
106,95 |
21,20 |
2,51 |
|
158,75 |
266,66 |
|
266,66 |
|
SEYCHELLES |
6,18 |
|
6,18 |
0,22 |
|
|
1,47 |
|
|
|
|
1,69 |
7,86 |
|
7,86 |
|
SIERRA LEONE |
57,93 |
4,87 |
62,80 |
|
0,42 |
|
7,50 |
|
|
1,67 |
|
9,59 |
72,39 |
|
72,39 |
|
SOMALIE |
155,28 |
|
155,28 |
|
10,48 |
3,78 |
11,29 |
|
|
4,97 |
|
30,52 |
185,80 |
|
185,80 |
|
SAO TOME & PRINCIPE |
6,00 |
|
6,00 |
|
0,11 |
|
2,25 |
1,62 |
|
0,03 |
|
4,02 |
10,02 |
|
10,02 |
|
SOUDAN |
79,16 |
|
79,16 |
|
40,62 |
19,94 |
21,74 |
63,92 |
|
0,47 |
|
146,69 |
225,85 |
|
225,85 |
|
SWAZILAND |
19,89 |
4,73 |
24,61 |
0,71 |
|
1,34 |
7,00 |
|
|
0,32 |
|
9,37 |
33,98 |
|
33,98 |
|
TANZANIE |
160,71 |
|
160,71 |
|
0,10 |
|
13,44 |
8,91 |
|
0,99 |
|
23,44 |
184,14 |
|
184,14 |
|
TOGO |
46,86 |
2,40 |
49,26 |
|
|
|
7,54 |
25,55 |
|
0,81 |
|
33,89 |
83,15 |
|
83,15 |
|
OUGANDA |
127,03 |
|
127,03 |
|
2,52 |
5,92 |
15,60 |
|
|
2,20 |
|
26,24 |
153,27 |
|
153,27 |
|
NIGERIA |
49,53 |
127,71 |
177,24 |
15,02 |
1,08 |
|
0,59 |
|
|
0,93 |
|
17,63 |
194,87 |
|
194,87 |
|
ZAMBIE |
74,19 |
14,70 |
88,88 |
|
0,55 |
0,63 |
11,41 |
|
|
1,72 |
|
14,31 |
103,20 |
|
103,20 |
|
ZIMBABWE |
42,83 |
29,73 |
72,56 |
10,52 |
|
1,26 |
0,95 |
|
|
|
|
12,74 |
85,30 |
|
85,30 |
|
REP. DEMOCRATIQUE CONGO |
142,85 |
7,15 |
150,00 |
1,26 |
0,94 |
2,05 |
|
|
|
4,02 |
|
8,28 |
158,28 |
|
158,28 |
|
* TOTAL AFRIQUE |
3 225,23 |
349,71 |
3 574,93 |
61,04 |
156,56 |
92,33 |
428,21 |
1 264,50 |
101,71 |
59,73 |
|
2 164,08 |
5 739,01 |
|
5 739,01 |
|
ANTIGUA-BARBUDA |
3,44 |
0,98 |
4,42 |
|
|
|
1,50 |
|
|
|
|
1,50 |
5,92 |
|
5,92 |
|
BARBADE |
2,83 |
0,93 |
3,76 |
1,10 |
|
|
0,37 |
|
|
0,68 |
|
2,15 |
5,91 |
|
5,91 |
|
BELIZE |
4,98 |
3,00 |
7,98 |
0,14 |
|
1,81 |
1,00 |
|
|
2,11 |
|
5,07 |
13,05 |
|
13,05 |
|
BAHAMAS |
2,59 |
0,74 |
3,33 |
2,57 |
|
|
|
|
|
0,08 |
|
2,65 |
5,98 |
|
5,98 |
|
DOMINIQUE |
5,84 |
|
5,84 |
|
|
|
3,80 |
1,21 |
|
0,03 |
|
5,03 |
10,87 |
|
10,87 |
|
GRENADE |
5,44 |
|
5,44 |
|
0,09 |
|
2,62 |
2,53 |
|
0,02 |
|
5,26 |
10,70 |
|
10,70 |
|
GUYANE (ETAT) |
21,83 |
|
21,83 |
|
0,25 |
|
3,60 |
|
|
0,07 |
|
3,91 |
25,74 |
|
25,74 |
|
JAMAIQUE |
29,77 |
10,00 |
39,77 |
5,40 |
0,77 |
|
2,09 |
|
|
3,27 |
|
11,53 |
51,30 |
|
51,30 |
|
ST CHRISTOPHE (KITTS) & NEVI |
3,50 |
|
3,50 |
|
|
|
1,50 |
|
|
|
|
1,50 |
5,00 |
|
5,00 |
|
SAINTE LUCIE |
5,10 |
|
5,10 |
0,91 |
|
|
2,00 |
|
|
0,05 |
|
2,96 |
8,06 |
|
8,06 |
|
SURINAME |
16,06 |
0,54 |
16,61 |
|
0,10 |
|
3,00 |
|
|
0,78 |
|
3,89 |
20,50 |
|
20,50 |
|
SAINT VINCENT & GRENADINES |
6,64 |
|
6,64 |
0,55 |
0,09 |
|
2,59 |
|
|
0,00 |
|
3,23 |
9,87 |
|
9,87 |
|
TRINITE & TOBAGO |
6,99 |
|
6,99 |
1,91 |
0,10 |
|
2,96 |
|
|
6,31 |
|
11,27 |
18,26 |
|
18,26 |
|
* TOTAL CARAIBES |
115,01 |
16,19 |
131,20 |
12,58 |
1,40 |
1,81 |
27,02 |
3,74 |
|
13,40 |
|
59,95 |
191,15 |
|
191,15 |
|
FIDJI |
13,51 |
4,88 |
18,39 |
1,97 |
0,30 |
|
1,23 |
0,26 |
|
0,21 |
|
3,98 |
22,37 |
|
22,37 |
|
KIRIBATI |
6,49 |
|
6,49 |
|
|
|
|
2,46 |
|
0,31 |
|
2,77 |
9,26 |
|
9,26 |
|
PAPOUASIE NOUVELLE GUINEE |
20,78 |
13,50 |
34,29 |
4,59 |
|
0,58 |
3,50 |
110,01 |
25,44 |
0,21 |
|
144,33 |
178,62 |
|
178,62 |
|
SALOMON |
14,42 |
1,68 |
16,09 |
|
0,43 |
|
2,00 |
31,27 |
|
0,12 |
|
33,81 |
49,91 |
|
49,91 |
|
TONGA |
6,36 |
|
6,36 |
0,22 |
|
|
1,67 |
4,33 |
|
0,03 |
|
6,25 |
12,61 |
|
12,61 |
|
TUVALU |
1,58 |
|
1,58 |
|
|
|
0,50 |
0,14 |
|
|
|
0,64 |
2,22 |
|
2,22 |
|
VANUATU |
6,70 |
|
6,70 |
|
0,55 |
|
1,00 |
19,29 |
|
0,13 |
|
20,97 |
27,67 |
|
27,67 |
|
SAMOA |
8,96 |
|
8,96 |
|
0,22 |
|
4,20 |
11,12 |
|
0,06 |
|
15,60 |
24,56 |
|
24,56 |
|
* TOTAL PACIFIQUE |
78,81 |
20,06 |
98,87 |
6,78 |
1,49 |
0,58 |
14,10 |
178,88 |
25,44 |
1,07 |
|
228,34 |
327,21 |
|
327,21 |
|
BUDGET INTRA ACP |
|
|
|
|
|
|
|
|
|
|
|
|
|
10,00 |
|
|
COOPERATION REGIONALE ACP |
810,40 |
44,30 |
854,71 |
1,02 |
|
|
55,53 |
|
|
12,19 |
|
68,73 |
923,44 |
|
923,44 |
|
* TOTAL COOPER. REGIONALE ACP |
810,40 |
44,30 |
854,71 |
1,02 |
|
|
55,53 |
|
|
12,19 |
|
68,73 |
923,44 |
10,00 |
933,44 |
|
TOUS PAYS ACP |
|
|
|
|
19,95 |
|
|
|
|
0,15 |
|
20,10 |
20,10 |
|
20,10 |
|
FRAIS ADMINISTR. & FINANCIERS |
7,78 |
|
7,78 |
|
|
|
|
|
|
0,02 |
5,33 |
5,35 |
13,13 |
|
13,13 |
|
* TOTAL ACP |
4 237,22 |
430,26 |
4 667,48 |
81,42 |
179,39 |
94,72 |
524,86 |
1 447,12 |
127,15 |
86,56 |
5,33 |
2 546,56 |
7 214,05 |
10,00 |
7 224,05 |
|
MAYOTTE |
2,75 |
2,00 |
4,75 |
|
|
|
1,15 |
|
|
|
|
1,15 |
5,90 |
|
5,90 |
|
NOUVELLE CALEDONIE |
5,51 |
2,30 |
7,81 |
|
0,09 |
|
3,00 |
|
1,00 |
0,27 |
|
4,36 |
12,17 |
|
12,17 |
|
POLYNESIE FRANCAISE |
6,32 |
1,77 |
8,10 |
0,87 |
|
|
2,56 |
3,92 |
|
0,17 |
|
7,52 |
15,61 |
|
15,61 |
|
SAINT PIERRE & MIQUELON |
2,41 |
1,00 |
3,41 |
|
|
|
|
|
|
0,03 |
|
0,03 |
3,45 |
|
3,45 |
|
TERRES AUSTRALES FRANCAISES |
0,27 |
|
0,27 |
|
|
|
|
|
|
|
|
|
0,27 |
|
0,27 |
|
WALLIS & FUTUNA |
2,30 |
0,93 |
3,23 |
|
|
|
|
|
|
|
|
|
3,23 |
|
3,23 |
|
* TOTAL PTOM FRANCAIS |
19,57 |
8,00 |
27,57 |
0,87 |
0,09 |
|
6,71 |
3,92 |
1,00 |
0,47 |
|
13,06 |
40,63 |
|
40,63 |
|
ARUBA |
4,12 |
1,63 |
5,75 |
0,18 |
|
|
2,90 |
|
|
0,21 |
|
3,29 |
9,04 |
|
9,04 |
|
ANTILLES NEERLANDAISES |
12,48 |
1,86 |
14,34 |
0,62 |
|
|
0,24 |
|
|
0,63 |
|
1,48 |
15,82 |
|
15,82 |
|
* TOTAL PTOM NEERLANDAIS |
16,59 |
3,49 |
20,09 |
0,80 |
|
|
3,14 |
|
|
0,84 |
|
4,77 |
24,86 |
|
24,86 |
|
ANGUILLA |
1,69 |
|
1,69 |
|
|
|
1,50 |
|
|
|
|
1,50 |
3,19 |
|
3,19 |
|
CAIMANS |
|
1,49 |
1,49 |
0,50 |
|
|
|
|
|
|
|
0,50 |
1,99 |
|
1,99 |
|
FALKLAND |
0,66 |
|
0,66 |
|
|
|
|
0,08 |
|
0,41 |
|
0,49 |
1,15 |
|
1,15 |
|
MONTSERRAT |
1,50 |
0,50 |
2,00 |
|
|
|
2,13 |
|
|
0,11 |
|
2,24 |
4,24 |
|
4,24 |
|
SAINTE HELENE |
1,39 |
|
1,39 |
|
|
|
|
|
|
|
|
|
1,39 |
|
1,39 |
|
TURKS & CAICOS |
1,73 |
|
1,73 |
|
|
|
0,15 |
|
|
|
|
0,15 |
1,88 |
|
1,88 |
|
VIERGES (BRITANNIQUES) |
|
1,50 |
1,50 |
0,44 |
|
|
1,00 |
|
|
|
|
1,44 |
2,94 |
|
2,94 |
|
* TOTAL PTOM BRITANNIQUES |
6,96 |
3,49 |
10,45 |
0,94 |
|
|
4,78 |
0,08 |
|
0,52 |
|
6,31 |
16,76 |
|
16,76 |
|
COOPERATION REGIONALE PTOM |
5,43 |
|
5,43 |
|
|
|
|
|
|
|
|
|
5,43 |
|
5,43 |
|
* COOPERATION REGIONALE PTOM |
5,43 |
|
5,43 |
|
|
|
|
|
|
|
|
|
5,43 |
|
5,43 |
|
TOUS PTOM |
|
|
|
|
0,43 |
|
|
|
|
|
|
0,43 |
0,43 |
|
0,43 |
|
* TOTAL PTOM |
48,56 |
14,98 |
63,54 |
2,60 |
0,51 |
|
14,62 |
4,00 |
1,00 |
1,83 |
|
24,56 |
88,11 |
|
88,11 |
|
* TOTAL ACP + PTOM |
4 285,78 |
445,24 |
4 731,03 |
84,02 |
179,90 |
94,72 |
539,49 |
1 451,12 |
128,15 |
88,39 |
5,33 |
2 571,13 |
7 302,16 |
10,00 |
7 312,16 |
Table 3.1.8
6th EDF
Payments annual 2004
SITUATION BY INSTRUMENT AND STATE
|
(million EUR) |
||||||||||||||
|
|
Lomé |
Total state |
||||||||||||
|
NIP |
Non NIP |
Total |
||||||||||||
|
Grants |
Special loans |
Total NIP |
Interest subsidies |
Emergency aid |
Refugee aid |
Risk capital |
STABEX |
SYSMIN |
Transfers from others funds |
SAF |
Total non NIP |
|||
|
ANGOLA |
0,32 |
|
0,32 |
|
|
|
|
|
|
|
|
|
0,32 |
0,32 |
|
BOTSWANA |
0,02 |
|
0,02 |
|
|
|
|
|
|
|
|
|
0,02 |
0,02 |
|
CENTRAFRIQUE |
- 0,10 |
|
- 0,10 |
|
|
|
|
|
|
|
|
|
- 0,10 |
- 0,10 |
|
TCHAD |
0,13 |
|
0,13 |
|
|
|
|
|
|
|
|
|
0,13 |
0,13 |
|
CAP VERT |
- 0,00 |
|
- 0,00 |
|
|
|
|
|
|
|
|
|
- 0,00 |
- 0,00 |
|
ETHIOPIE |
0,02 |
|
0,02 |
|
|
|
|
|
|
|
|
|
0,02 |
0,02 |
|
GABON |
0,17 |
|
0,17 |
|
|
|
|
|
|
|
|
|
0,17 |
0,17 |
|
GHANA |
0,28 |
|
0,28 |
|
|
|
|
|
|
|
|
|
0,28 |
0,28 |
|
GUINEE |
- 0,02 |
|
- 0,02 |
|
|
|
|
|
- 0,00 |
|
|
- 0,00 |
- 0,02 |
- 0,02 |
|
COTE D'IVOIRE |
0,03 |
|
0,03 |
|
|
|
|
|
|
|
|
|
0,03 |
0,03 |
|
KENYA |
2,06 |
|
2,06 |
|
|
|
|
|
|
|
|
|
2,06 |
2,06 |
|
LIBERIA |
0,06 |
|
0,06 |
|
|
|
|
|
|
|
|
|
0,06 |
0,06 |
|
MADAGASCAR |
- 0,12 |
|
- 0,12 |
|
|
|
|
|
|
|
|
|
- 0,12 |
- 0,12 |
|
MALAWI |
0,67 |
|
0,67 |
|
|
|
|
|
|
0,04 |
|
0,04 |
0,71 |
0,71 |
|
MAURICE |
0,14 |
|
0,14 |
|
|
|
|
|
|
|
|
|
0,14 |
0,14 |
|
MAURITANIE |
1,05 |
|
1,05 |
|
|
|
|
|
|
|
|
|
1,05 |
1,05 |
|
MOZAMBIQUE |
0,19 |
|
0,19 |
|
|
|
|
|
|
|
|
|
0,19 |
0,19 |
|
RWANDA |
1,02 |
|
1,02 |
|
|
|
2,28 |
|
|
0,27 |
|
2,55 |
3,57 |
3,57 |
|
SENEGAL |
|
0,08 |
0,08 |
|
|
|
|
|
0,04 |
|
|
0,04 |
0,12 |
0,12 |
|
SIERRA LEONE |
0,04 |
|
0,04 |
|
|
|
|
|
|
|
|
|
0,04 |
0,04 |
|
SOMALIE |
1,50 |
|
1,50 |
|
|
|
|
|
|
|
|
|
1,50 |
1,50 |
|
SOUDAN |
3,31 |
|
3,31 |
|
|
|
|
|
|
|
|
|
3,31 |
3,31 |
|
OUGANDA |
0,87 |
|
0,87 |
|
|
|
|
|
|
|
|
|
0,87 |
0,87 |
|
ZAMBIE |
|
- 0,30 |
- 0,30 |
|
|
|
|
|
|
|
|
|
- 0,30 |
- 0,30 |
|
ZIMBABWE |
0,01 |
|
0,01 |
|
|
|
|
|
|
|
|
|
0,01 |
0,01 |
|
REP. DEMOCRATIQUE CONGO |
11,15 |
|
11,15 |
|
|
|
|
|
|
|
|
|
11,15 |
11,15 |
|
* TOTAL AFRIQUE |
22,78 |
- 0,22 |
22,56 |
|
|
|
2,28 |
|
0,04 |
0,31 |
|
2,63 |
25,19 |
25,19 |
|
GUYANE (ETAT) |
0,06 |
|
0,06 |
|
|
|
|
|
|
|
|
|
0,06 |
0,06 |
|
JAMAIQUE |
|
|
|
|
|
|
|
|
|
0,02 |
|
0,02 |
0,02 |
0,02 |
|
SURINAME |
0,58 |
|
0,58 |
|
|
|
|
|
|
|
|
|
0,58 |
0,58 |
|
* TOTAL CARAIBES |
0,64 |
|
0,64 |
|
|
|
|
|
|
0,02 |
|
0,02 |
0,66 |
0,66 |
|
FIDJI |
0,63 |
|
0,63 |
|
|
|
|
|
|
|
|
|
0,63 |
0,63 |
|
SALOMON |
0,03 |
|
0,03 |
|
|
|
|
|
|
|
|
|
0,03 |
0,03 |
|
* TOTAL PACIFIQUE |
0,66 |
|
0,66 |
|
|
|
|
|
|
|
|
|
0,66 |
0,66 |
|
COOPERATION REGIONALE ACP |
2,98 |
|
2,98 |
|
|
|
|
|
|
|
|
|
2,98 |
2,98 |
|
* TOTAL COOPER. REGIONALE ACP |
2,98 |
|
2,98 |
|
|
|
|
|
|
|
|
|
2,98 |
2,98 |
|
FRAIS ADMINISTR. & FINANCIERS |
0,16 |
|
0,16 |
|
|
|
|
|
|
|
|
|
0,16 |
0,16 |
|
* TOTAL ACP |
27,21 |
- 0,22 |
26,99 |
|
|
|
2,28 |
|
0,04 |
0,33 |
|
2,65 |
29,64 |
29,64 |
|
POLYNESIE FRANÇAISE |
0,37 |
|
0,37 |
|
|
|
|
|
|
|
|
|
0,37 |
0,37 |
|
* TOTAL PTOM FRANÇAIS |
0,37 |
|
0,37 |
|
|
|
|
|
|
|
|
|
0,37 |
0,37 |
|
ANTILLES NEERLANDAISES |
- 0,02 |
|
- 0,02 |
|
|
|
|
|
|
|
|
|
- 0,02 |
- 0,02 |
|
* TOTAL PTOM NEERLANDAIS |
- 0,02 |
|
- 0,02 |
|
|
|
|
|
|
|
|
|
- 0,02 |
- 0,02 |
|
* TOTAL PTOM BRITANNIQUES |
|
|
|
|
|
|
|
|
|
|
|
|
|
|
|
COOPERATION REGIONALE PTOM |
0,01 |
|
0,01 |
|
|
|
|
|
|
|
|
|
0,01 |
0,01 |
|
* COOPERATION REGIONALE PTOM |
0,01 |
|
0,01 |
|
|
|
|
|
|
|
|
|
0,01 |
0,01 |
|
* TOTAL PTOM |
0,36 |
|
0,36 |
|
|
|
|
|
|
|
|
|
0,36 |
0,36 |
|
* TOTAL ACP + PTOM |
27,57 |
- 0,22 |
27,35 |
|
|
|
2,28 |
|
0,04 |
0,33 |
|
2,65 |
30,00 |
30,00 |
Table 3.2.1
7th EDF
Cumulative 2004
GLOBAL SITUATION BY STATE
|
(million EUR) |
||||||||||||
|
|
Lomé |
Total |
||||||||||
|
NIP |
National indicative programmes |
Other aid |
||||||||||
|
Decisions |
as % of NIP |
Payments |
as % of NIP |
Decisions |
as % of NIP |
Payments |
as % of NIP |
Decisions |
Assigned funds |
Payments |
||
|
ANGOLA |
113,44 |
113,44 |
100 |
89,06 |
79 |
39,71 |
35 |
39,53 |
35 |
153,14 |
150,06 |
128,60 |
|
BENIN |
89,96 |
89,96 |
100 |
85,13 |
95 |
60,46 |
67 |
60,45 |
67 |
150,42 |
147,75 |
145,57 |
|
BURKINA FASO |
147,88 |
147,88 |
100 |
138,13 |
93 |
151,66 |
103 |
149,68 |
101 |
299,54 |
293,42 |
287,80 |
|
BOTSWANA |
30,91 |
30,91 |
100 |
30,08 |
97 |
55,18 |
179 |
55,15 |
178 |
86,09 |
85,48 |
85,23 |
|
BURUNDI |
94,58 |
94,58 |
100 |
65,07 |
69 |
86,35 |
91 |
77,06 |
81 |
180,93 |
176,69 |
142,13 |
|
CENTRAFRIQUE |
72,31 |
72,31 |
100 |
71,24 |
99 |
34,78 |
48 |
33,11 |
46 |
107,09 |
104,80 |
104,35 |
|
TCHAD |
102,70 |
102,70 |
100 |
98,54 |
96 |
34,56 |
34 |
34,07 |
33 |
137,26 |
132,91 |
132,61 |
|
CAMEROUN |
107,39 |
107,39 |
100 |
104,37 |
97 |
289,86 |
270 |
285,69 |
266 |
397,25 |
395,04 |
390,06 |
|
CONGO |
39,01 |
39,01 |
100 |
28,22 |
72 |
7,30 |
19 |
7,26 |
19 |
46,31 |
43,47 |
35,48 |
|
COMORES |
21,64 |
21,64 |
100 |
20,80 |
96 |
13,82 |
64 |
13,82 |
64 |
35,46 |
34,89 |
34,62 |
|
CAP VERT |
24,68 |
24,68 |
100 |
23,19 |
94 |
13,34 |
54 |
13,34 |
54 |
38,02 |
36,93 |
36,53 |
|
DJIBOUTI |
18,04 |
18,04 |
100 |
17,42 |
97 |
5,77 |
32 |
5,67 |
31 |
23,80 |
23,20 |
23,10 |
|
GUINEE EQUATORIALE |
12,46 |
12,46 |
100 |
11,60 |
93 |
8,28 |
66 |
7,73 |
62 |
20,74 |
19,87 |
19,33 |
|
ERITHREE |
47,57 |
47,57 |
100 |
39,33 |
83 |
13,48 |
28 |
13,48 |
28 |
61,05 |
60,58 |
52,81 |
|
ETHIOPIE |
212,57 |
212,57 |
100 |
171,96 |
81 |
350,57 |
165 |
318,89 |
150 |
563,15 |
534,50 |
490,84 |
|
GABON |
29,68 |
29,68 |
100 |
29,22 |
98 |
24,80 |
84 |
24,75 |
83 |
54,48 |
54,25 |
53,97 |
|
GHANA |
106,47 |
106,47 |
100 |
89,88 |
84 |
165,91 |
156 |
163,89 |
154 |
272,38 |
264,69 |
253,77 |
|
GAMBIE |
21,72 |
21,72 |
100 |
21,54 |
99 |
11,58 |
53 |
11,31 |
52 |
33,30 |
33,14 |
32,85 |
|
GUINEE BISSAU |
36,73 |
36,73 |
100 |
34,13 |
93 |
22,17 |
60 |
21,89 |
60 |
58,90 |
57,84 |
56,01 |
|
GUINEE |
126,17 |
126,17 |
100 |
121,05 |
96 |
168,59 |
134 |
147,01 |
117 |
294,76 |
281,96 |
268,06 |
|
COTE D'IVOIRE |
104,05 |
104,05 |
100 |
103,13 |
99 |
371,49 |
357 |
371,49 |
357 |
475,54 |
475,02 |
474,62 |
|
KENYA |
132,30 |
132,30 |
100 |
108,27 |
82 |
156,89 |
119 |
153,97 |
116 |
289,19 |
285,99 |
262,24 |
|
LIBERIA |
|
|
|
|
|
34,60 |
|
33,13 |
|
34,60 |
34,24 |
33,13 |
|
LESOTHO |
47,61 |
47,61 |
100 |
47,24 |
99 |
54,70 |
115 |
54,24 |
114 |
102,31 |
101,88 |
101,48 |
|
MADAGASCAR |
131,25 |
131,25 |
100 |
129,82 |
99 |
87,20 |
66 |
86,60 |
66 |
218,45 |
217,66 |
216,42 |
|
MALAWI |
127,05 |
127,05 |
100 |
121,96 |
96 |
134,03 |
105 |
133,06 |
105 |
261,08 |
258,64 |
255,02 |
|
MAURICE |
31,96 |
31,96 |
100 |
31,30 |
98 |
17,85 |
56 |
17,85 |
56 |
49,81 |
49,72 |
49,16 |
|
MAURITANIE |
63,39 |
63,39 |
100 |
62,09 |
98 |
127,96 |
202 |
127,75 |
202 |
191,35 |
190,51 |
189,84 |
|
MALI |
143,91 |
143,91 |
100 |
141,28 |
98 |
112,85 |
78 |
103,51 |
72 |
256,76 |
248,35 |
244,79 |
|
MOZAMBIQUE |
169,18 |
169,18 |
100 |
152,95 |
90 |
94,14 |
56 |
94,02 |
56 |
263,32 |
257,50 |
246,97 |
|
NAMIBIE |
46,87 |
46,87 |
100 |
46,61 |
99 |
53,61 |
114 |
53,61 |
114 |
100,48 |
100,30 |
100,22 |
|
NIGER |
139,51 |
139,51 |
100 |
138,24 |
99 |
63,85 |
46 |
59,56 |
43 |
203,35 |
201,11 |
197,80 |
|
RWANDA |
117,13 |
117,13 |
100 |
103,09 |
88 |
84,99 |
73 |
77,38 |
66 |
202,11 |
197,95 |
180,46 |
|
SENEGAL |
113,45 |
113,45 |
100 |
110,40 |
97 |
89,87 |
79 |
89,07 |
79 |
203,32 |
201,85 |
199,47 |
|
SEYCHELLES |
5,26 |
5,26 |
100 |
5,26 |
100 |
3,05 |
58 |
3,05 |
58 |
8,31 |
8,31 |
8,31 |
|
SIERRA LEONE |
77,14 |
77,14 |
100 |
59,13 |
77 |
42,91 |
56 |
42,91 |
56 |
120,06 |
116,06 |
102,05 |
|
SOMALIE |
|
|
|
|
|
18,90 |
|
18,34 |
|
18,90 |
18,64 |
18,34 |
|
SAO TOME & PRINCIPE |
8,00 |
8,00 |
100 |
7,89 |
99 |
10,63 |
133 |
9,92 |
124 |
18,63 |
18,60 |
17,81 |
|
SOUDAN |
|
|
|
|
|
144,19 |
|
40,07 |
|
144,19 |
144,05 |
40,07 |
|
SWAZILAND |
27,30 |
27,30 |
100 |
23,60 |
86 |
17,42 |
64 |
17,26 |
63 |
44,72 |
41,40 |
40,86 |
|
TANZANIE |
159,90 |
159,90 |
100 |
155,67 |
97 |
224,62 |
140 |
222,84 |
139 |
384,52 |
381,34 |
378,51 |
|
TOGO |
64,25 |
64,25 |
100 |
36,12 |
56 |
25,94 |
40 |
24,70 |
38 |
90,20 |
69,16 |
60,82 |
|
OUGANDA |
161,21 |
161,21 |
100 |
149,21 |
93 |
248,28 |
154 |
244,42 |
152 |
409,49 |
400,59 |
393,63 |
|
NIGERIA |
257,72 |
257,72 |
100 |
129,21 |
50 |
14,74 |
6 |
14,43 |
6 |
272,46 |
192,18 |
143,64 |
|
ZAMBIE |
102,02 |
102,02 |
100 |
99,97 |
98 |
215,80 |
212 |
215,58 |
211 |
317,83 |
316,57 |
315,55 |
|
ZIMBABWE |
89,64 |
89,64 |
100 |
83,91 |
94 |
103,04 |
115 |
102,55 |
114 |
192,67 |
190,09 |
186,46 |
|
REP. DEMOCRATIQUE CONGO |
156,98 |
156,98 |
100 |
78,63 |
50 |
42,55 |
27 |
39,83 |
25 |
199,53 |
134,01 |
118,46 |
|
* TOTAL AFRIQUE |
3 932,98 |
3 932,98 |
100 |
3 414,93 |
87 |
4 154,27 |
106 |
3 934,92 |
100 |
8 087,26 |
7 783,19 |
7 349,85 |
|
ANTIGUA-BARBUDA |
3,03 |
3,03 |
100 |
2,94 |
97 |
0,70 |
23 |
0,70 |
23 |
3,74 |
3,64 |
3,64 |
|
BARBADE |
3,03 |
3,03 |
100 |
2,87 |
95 |
6,34 |
210 |
6,34 |
210 |
9,37 |
9,27 |
9,21 |
|
BELIZE |
8,98 |
8,98 |
100 |
8,98 |
100 |
8,75 |
98 |
8,75 |
98 |
17,73 |
17,73 |
17,73 |
|
BAHAMAS |
4,30 |
4,30 |
100 |
4,29 |
100 |
7,33 |
171 |
7,27 |
169 |
11,63 |
11,63 |
11,57 |
|
REPUBLIQUE DOMINICAINE |
84,77 |
84,77 |
100 |
80,79 |
95 |
72,18 |
85 |
67,84 |
80 |
156,95 |
151,70 |
148,63 |
|
DOMINIQUE |
5,45 |
5,45 |
100 |
2,19 |
40 |
19,59 |
359 |
19,59 |
359 |
25,05 |
23,46 |
21,78 |
|
GRENADE |
5,38 |
5,38 |
100 |
5,38 |
100 |
14,78 |
275 |
14,78 |
275 |
20,16 |
20,16 |
20,16 |
|
GUYANE (ETAT) |
32,54 |
32,54 |
100 |
31,77 |
98 |
31,75 |
98 |
31,75 |
98 |
64,29 |
63,96 |
63,52 |
|
HAITI |
84,02 |
84,02 |
100 |
79,69 |
95 |
68,37 |
81 |
62,37 |
74 |
152,39 |
148,72 |
142,06 |
|
JAMAIQUE |
46,69 |
46,69 |
100 |
46,23 |
99 |
145,26 |
311 |
60,81 |
130 |
191,95 |
125,98 |
107,04 |
|
ST CHRISTOPHE (KITTS) & NEVI |
2,49 |
2,49 |
100 |
2,48 |
100 |
2,23 |
90 |
2,23 |
90 |
4,72 |
4,72 |
4,71 |
|
SAINTE LUCIE |
1,95 |
1,95 |
100 |
1,77 |
91 |
30,75 |
1576 |
30,75 |
1576 |
32,71 |
32,53 |
32,53 |
|
SURINAME |
17,51 |
17,51 |
100 |
15,94 |
91 |
6,44 |
37 |
5,73 |
33 |
23,95 |
22,54 |
21,67 |
|
SAINT VINCENT & GRENADINES |
3,22 |
3,22 |
100 |
3,22 |
100 |
36,72 |
1141 |
36,68 |
1140 |
39,94 |
39,91 |
39,90 |
|
TRINITE & TOBAGO |
9,99 |
9,99 |
100 |
9,27 |
93 |
32,73 |
328 |
28,71 |
287 |
42,72 |
42,00 |
37,98 |
|
* TOTAL CARAIBES |
313,35 |
313,35 |
100 |
297,80 |
95 |
483,95 |
154 |
384,32 |
123 |
797,31 |
717,95 |
682,12 |
|
FIDJI |
21,99 |
21,99 |
100 |
17,86 |
81 |
3,20 |
15 |
3,14 |
14 |
25,19 |
25,19 |
21,00 |
|
KIRIBATI |
6,00 |
6,00 |
100 |
5,75 |
96 |
1,78 |
30 |
1,78 |
30 |
7,78 |
7,65 |
7,53 |
|
PAPOUASIE NOUVELLE GUINEE |
45,79 |
45,79 |
100 |
42,74 |
93 |
135,88 |
297 |
134,97 |
295 |
181,68 |
179,98 |
177,70 |
|
SALOMON |
20,25 |
20,25 |
100 |
19,51 |
96 |
9,88 |
49 |
9,88 |
49 |
30,12 |
29,63 |
29,38 |
|
TONGA |
6,00 |
6,00 |
100 |
5,58 |
93 |
3,27 |
55 |
3,26 |
54 |
9,27 |
9,26 |
8,84 |
|
TUVALU |
1,06 |
1,06 |
100 |
1,06 |
100 |
0,58 |
54 |
0,08 |
7 |
1,64 |
1,64 |
1,14 |
|
VANUATU |
7,44 |
7,44 |
100 |
7,44 |
100 |
4,01 |
54 |
4,01 |
54 |
11,45 |
11,45 |
11,45 |
|
SAMOA |
8,92 |
8,92 |
100 |
8,92 |
100 |
11,62 |
130 |
11,12 |
125 |
20,55 |
20,54 |
20,04 |
|
* TOTAL PACIFIQUE |
117,45 |
117,45 |
100 |
108,86 |
93 |
170,23 |
145 |
168,23 |
143 |
287,67 |
285,34 |
277,08 |
|
BUDGET INTRA ACP |
50,00 |
|
|
|
|
|
|
|
|
50,00 |
50,00 |
50,00 |
|
COOPERATION REGIONALE ACP |
1 136,42 |
1 136,42 |
100 |
1 001,76 |
88 |
100,09 |
9 |
97,59 |
9 |
1 236,51 |
1 182,60 |
1 099,35 |
|
* TOTAL COOPER. REGIONALE ACP |
1 186,42 |
1 136,42 |
96 |
1 001,76 |
84 |
100,09 |
8 |
97,59 |
8 |
1 286,51 |
1 232,60 |
1 149,35 |
|
TOUS PAYS ACP |
|
|
|
|
|
264,91 |
|
260,07 |
|
264,91 |
262,29 |
260,07 |
|
FRAIS ADMINISTR. & FINANCIERS |
3,00 |
3,00 |
100 |
2,65 |
88 |
6,41 |
214 |
5,02 |
167 |
9,41 |
8,12 |
7,67 |
|
* TOTAL ACP |
5 553,20 |
5 503,20 |
99 |
4 826,00 |
87 |
5 179,87 |
93 |
4 850,14 |
87 |
10 733,07 |
10 289,50 |
9 726,14 |
|
MAYOTTE |
6,69 |
6,69 |
100 |
6,69 |
100 |
5,39 |
81 |
5,39 |
81 |
12,08 |
12,08 |
12,08 |
|
NOUVELLE CALEDONIE |
12,44 |
12,44 |
100 |
11,42 |
92 |
11,63 |
93 |
9,24 |
74 |
24,07 |
22,98 |
20,67 |
|
POLYNESIE FRANÇAISE |
12,96 |
12,96 |
100 |
12,71 |
98 |
7,37 |
57 |
7,37 |
57 |
20,34 |
20,23 |
20,08 |
|
SAINT PIERRE & MIQUELON |
3,00 |
3,00 |
100 |
3,00 |
100 |
0,54 |
18 |
0,54 |
18 |
3,54 |
3,54 |
3,54 |
|
TERRES AUSTRALES FRANÇAISES |
0,00 |
0,00 |
100 |
0,00 |
100 |
|
|
|
|
|
|
0,00 |
|
WALLIS & FUTUNA |
4,58 |
4,58 |
100 |
4,57 |
100 |
0,09 |
2 |
0,09 |
2 |
4,67 |
4,67 |
4,66 |
|
RESERVE AIDE NAT. PROGR. PTF |
|
|
|
|
|
0,09 |
|
|
|
0,09 |
|
|
|
* TOTAL PTOM FRANÇAIS |
39,68 |
39,68 |
100 |
38,39 |
97 |
25,11 |
63 |
22,64 |
57 |
64,79 |
63,50 |
61,03 |
|
ARUBA |
7,16 |
7,16 |
100 |
6,96 |
97 |
0,33 |
5 |
0,17 |
2 |
7,50 |
7,28 |
7,13 |
|
ANTILLES NEERLANDAISES |
17,18 |
17,18 |
100 |
12,34 |
72 |
11,41 |
66 |
10,45 |
61 |
28,59 |
25,47 |
22,79 |
|
* TOTAL PTOM NEERLANDAIS |
24,35 |
24,35 |
100 |
19,30 |
79 |
11,74 |
48 |
10,62 |
44 |
36,09 |
32,75 |
29,92 |
|
ANGUILLA |
2,72 |
2,72 |
100 |
2,72 |
100 |
0,35 |
13 |
0,35 |
13 |
3,07 |
3,07 |
3,07 |
|
CAIMANS |
|
|
|
|
|
1,17 |
|
1,17 |
|
1,17 |
1,17 |
1,17 |
|
FALKLAND |
|
|
|
|
|
5,70 |
|
5,69 |
|
5,70 |
5,69 |
5,69 |
|
MONTSERRAT |
3,90 |
3,90 |
100 |
3,65 |
94 |
0,59 |
15 |
0,59 |
15 |
4,49 |
4,38 |
4,24 |
|
SAINTE HELENE |
1,10 |
1,10 |
100 |
1,10 |
100 |
0,05 |
4 |
0,05 |
4 |
1,15 |
1,15 |
1,15 |
|
TURKS & CAICOS |
3,89 |
3,89 |
162 |
3,89 |
162 |
0,06 |
2 |
0,06 |
2 |
3,95 |
3,95 |
3,95 |
|
VIERGES (BRITANNIQUES) |
2,40 |
2,40 |
100 |
2,39 |
100 |
1,41 |
59 |
1,41 |
59 |
3,80 |
3,80 |
3,80 |
|
* TOTAL PTOM BRITANNIQUES |
14,01 |
14,01 |
100 |
13,75 |
98 |
9,31 |
66 |
9,31 |
66 |
23,32 |
23,20 |
23,06 |
|
COOPERATION REGIONALE PTOM |
8,97 |
8,97 |
100 |
8,02 |
89 |
0,47 |
5 |
0,44 |
5 |
9,44 |
8,57 |
8,46 |
|
* COOPERATION REGIONALE PTOM |
8,97 |
8,97 |
100 |
8,02 |
89 |
0,47 |
5 |
0,44 |
5 |
9,44 |
8,57 |
8,46 |
|
TOUS PTOM |
|
|
|
|
|
0,96 |
|
0,96 |
|
0,96 |
0,96 |
0,96 |
|
* TOTAL PTOM |
87,01 |
87,01 |
100 |
79,47 |
91 |
47,60 |
55 |
43,96 |
51 |
134,61 |
128,98 |
123,43 |
|
* TOTAL ACP + PTOM |
5 640,21 |
5 590,21 |
99 |
4 905,47 |
87 |
5 227,47 |
93 |
4 894,10 |
87 |
10 867,68 |
10 418,48 |
9 849,57 |
Table 3.2.2
7th EDF
Annual 2004
GLOBAL SITUATION BY STATE
|
(million EUR) |
||||||||||||
|
|
Lomé |
Total |
||||||||||
|
NIP |
National indicative programmes |
Other aid |
||||||||||
|
Decisions |
as % of NIP |
Payments |
as % of NIP |
Decisions |
as % of NIP |
Payments |
as % of NIP |
Decisions |
Assigned funds |
Payments |
||
|
ANGOLA |
113,44 |
- 0,02 |
0 |
13,21 |
12 |
- 1,15 |
- 1 |
|
|
- 1,17 |
20,98 |
13,21 |
|
BENIN |
89,96 |
|
|
1,64 |
2 |
|
|
2,91 |
3 |
|
1,14 |
4,55 |
|
BURKINA FASO |
147,88 |
- 0,09 |
0 |
2,10 |
1 |
- 0,11 |
0 |
1,15 |
1 |
- 0,21 |
1,32 |
3,26 |
|
BOTSWANA |
30,91 |
|
|
0,07 |
0 |
|
|
0,22 |
1 |
|
- 0,01 |
0,29 |
|
BURUNDI |
94,58 |
|
|
- 1,86 |
- 2 |
- 0,01 |
0 |
- 9,03 |
- 10 |
- 0,01 |
9,62 |
- 10,89 |
|
CENTRAFRIQUE |
72,31 |
|
|
0,13 |
0 |
|
|
- 0,12 |
0 |
|
- 0,01 |
0,00 |
|
TCHAD |
102,70 |
- 2,34 |
- 2 |
- 0,34 |
0 |
|
|
|
|
- 2,34 |
- 1,77 |
- 0,34 |
|
CAMEROUN |
107,39 |
|
|
1,72 |
2 |
|
|
0,04 |
0 |
|
- 0,55 |
1,76 |
|
CONGO |
39,01 |
- 1,29 |
- 3 |
3,98 |
10 |
|
|
|
|
- 1,29 |
0,11 |
3,98 |
|
COMORES |
21,64 |
- 0,84 |
- 4 |
0,62 |
3 |
- 0,55 |
- 3 |
|
|
- 1,39 |
- 0,87 |
0,62 |
|
CAP VERT |
24,68 |
|
|
0,09 |
0 |
|
|
|
|
|
- 0,02 |
0,09 |
|
DJIBOUTI |
18,04 |
|
|
0,02 |
0 |
- 0,13 |
- 1 |
|
|
- 0,13 |
- 0,51 |
0,02 |
|
GUINEE EQUATORIALE |
12,46 |
- 0,04 |
0 |
2,12 |
17 |
- 0,07 |
- 1 |
|
|
- 0,11 |
1,68 |
2,12 |
|
ERITHREE |
47,57 |
- 5,52 |
- 12 |
2,17 |
5 |
- 1,18 |
- 2 |
- 0,03 |
0 |
- 6,71 |
0,05 |
2,14 |
|
ETHIOPIE |
212,57 |
- 0,20 |
0 |
15,94 |
7 |
- 1,07 |
- 1 |
3,63 |
2 |
- 1,27 |
- 0,69 |
19,57 |
|
GABON |
29,68 |
|
|
0,41 |
1 |
|
|
|
|
|
0,11 |
0,41 |
|
GHANA |
106,47 |
- 0,75 |
- 1 |
4,43 |
4 |
|
|
0,40 |
0 |
- 0,75 |
1,30 |
4,83 |
|
GAMBIE |
21,72 |
- 0,73 |
- 3 |
|
0 |
|
|
0,03 |
0 |
- 0,73 |
0,00 |
0,03 |
|
GUINEE BISSAU |
36,73 |
- 0,12 |
0 |
- 0,21 |
- 1 |
|
|
0,60 |
2 |
- 0,12 |
0,73 |
0,39 |
|
GUINEE |
126,17 |
- 0,84 |
- 1 |
0,17 |
0 |
- 0,84 |
- 1 |
11,48 |
9 |
- 1,67 |
2,30 |
11,65 |
|
COTE D'IVOIRE |
104,05 |
- 0,05 |
0 |
0,18 |
0 |
- 0,18 |
0 |
|
|
- 0,23 |
- 0,24 |
0,18 |
|
KENYA |
132,30 |
- 0,57 |
0 |
25,68 |
19 |
|
|
0,91 |
1 |
- 0,57 |
0,91 |
26,59 |
|
LIBERIA |
|
|
|
|
|
- 0,01 |
|
0,14 |
|
- 0,01 |
- 0,13 |
0,14 |
|
LESOTHO |
47,61 |
- 0,25 |
- 1 |
0,30 |
1 |
- 3,21 |
- 7 |
0,37 |
1 |
- 3,46 |
- 3,25 |
0,67 |
|
MADAGASCAR |
131,25 |
- 0,20 |
0 |
1,69 |
1 |
- 0,67 |
- 1 |
0,11 |
0 |
- 0,87 |
- 0,50 |
1,80 |
|
MALAWI |
127,05 |
- 1,85 |
- 1 |
2,48 |
2 |
|
|
- 0,01 |
0 |
- 1,85 |
0,68 |
2,47 |
|
MAURICE |
31,96 |
- 0,41 |
- 1 |
0,64 |
2 |
- 0,05 |
0 |
|
|
- 0,46 |
0,13 |
0,64 |
|
MAURITANIE |
63,39 |
- 0,14 |
0 |
0,09 |
0 |
|
|
1,99 |
3 |
- 0,14 |
0,19 |
2,08 |
|
MALI |
143,91 |
- 0,11 |
0 |
1,74 |
1 |
|
|
1,94 |
1 |
- 0,11 |
- 1,33 |
3,68 |
|
MOZAMBIQUE |
169,18 |
- 0,00 |
0 |
2,98 |
2 |
- 0,10 |
0 |
|
|
- 0,10 |
0,30 |
2,98 |
|
NAMIBIE |
46,87 |
- 0,29 |
- 1 |
0,96 |
2 |
|
|
|
|
- 0,29 |
- 0,07 |
0,96 |
|
NIGER |
139,51 |
|
|
- 0,02 |
0 |
|
|
4,10 |
3 |
|
1,22 |
4,08 |
|
RWANDA |
117,13 |
|
|
15,27 |
13 |
|
|
0,72 |
1 |
|
16,16 |
15,99 |
|
SENEGAL |
113,45 |
|
|
0,01 |
0 |
|
|
|
|
|
- 0,47 |
0,01 |
|
SEYCHELLES |
5,26 |
- 0,01 |
0 |
- |
0 |
|
|
|
|
- 0,01 |
|
|
|
SIERRA LEONE |
77,14 |
|
|
11,15 |
14 |
|
|
|
|
|
7,22 |
11,15 |
|
SOMALIE |
|
|
|
|
|
|
|
0,10 |
|
|
- 0,18 |
0,10 |
|
SAO TOME & PRINCIPE |
8,00 |
|
|
0,22 |
3 |
|
|
0,29 |
4 |
|
- 0,03 |
0,51 |
|
SOUDAN |
|
|
|
|
|
- 0,04 |
|
|
|
- 0,04 |
- 0,01 |
|
|
SWAZILAND |
27,30 |
- 0,44 |
- 2 |
0,16 |
1 |
|
|
|
|
- 0,44 |
- 0,09 |
0,16 |
|
TANZANIE |
159,90 |
- 8,14 |
- 5 |
1,53 |
1 |
- 0,41 |
0 |
2,04 |
1 |
- 8,55 |
- 2,06 |
3,57 |
|
TOGO |
64,25 |
- 1,43 |
- 2 |
2,94 |
5 |
|
|
0,24 |
0 |
- 1,43 |
6,66 |
3,18 |
|
OUGANDA |
161,21 |
- 0,74 |
0 |
2,00 |
1 |
- 0,07 |
0 |
0,12 |
0 |
- 0,81 |
2,02 |
2,12 |
|
NIGERIA |
257,72 |
- 3,51 |
- 1 |
20,65 |
8 |
|
|
|
|
- 3,51 |
23,27 |
20,65 |
|
ZAMBIE |
102,02 |
- 0,15 |
0 |
- |
0 |
- 0,76 |
- 1 |
- 0,41 |
0 |
- 0,91 |
- 0,49 |
- 0,41 |
|
ZIMBABWE |
89,64 |
- 1,05 |
- 1 |
1,83 |
2 |
- 2,00 |
- 2 |
0,31 |
0 |
- 3,05 |
- 0,92 |
2,13 |
|
REP. DEMOCRATIQUE CONGO |
156,98 |
|
|
10,94 |
7 |
|
|
2,82 |
2 |
|
12,81 |
13,76 |
|
* TOTAL AFRIQUE |
3 932,98 |
- 32,15 |
- 1 |
149,84 |
4 |
- 12,60 |
0 |
27,05 |
1 |
- 44,75 |
96,72 |
176,89 |
|
ANTIGUA-BARBUDA |
3,03 |
|
|
- 0,00 |
0 |
|
|
|
|
|
- 0,09 |
- 0,00 |
|
BELIZE |
8,98 |
|
|
- |
0 |
- 0,11 |
- 1 |
- |
0 |
- 0,11 |
|
|
|
BAHAMAS |
4,30 |
|
|
0,15 |
4 |
|
|
0,07 |
2 |
|
|
0,22 |
|
REPUBLIQUE DOMINICAINE |
84,77 |
|
|
1,70 |
2 |
|
|
2,34 |
3 |
|
- 1,34 |
4,04 |
|
DOMINIQUE |
5,45 |
- 0,04 |
- 1 |
0,76 |
14 |
|
|
|
|
- 0,04 |
0,18 |
0,76 |
|
GRENADE |
5,38 |
- 0,06 |
- 1 |
- |
0 |
- 0,00 |
0 |
|
|
- 0,06 |
|
|
|
GUYANE (ETAT) |
32,54 |
|
|
0,02 |
0 |
- 0,60 |
- 2 |
|
|
- 0,60 |
- 0,12 |
0,02 |
|
HAITI |
84,02 |
- 0,40 |
0 |
0,64 |
1 |
|
|
|
|
- 0,40 |
- 0,89 |
0,64 |
|
JAMAIQUE |
46,69 |
- 2,24 |
- 5 |
0,41 |
1 |
- 0,18 |
0 |
0,45 |
1 |
- 2,41 |
- 0,03 |
0,86 |
|
SAINTE LUCIE |
1,95 |
|
|
0,02 |
1 |
|
|
|
|
|
- 0,01 |
0,02 |
|
SURINAME |
17,51 |
- 0,21 |
- 1 |
0,29 |
2 |
|
|
- 0,03 |
0 |
- 0,21 |
- 0,23 |
0,25 |
|
TRINITE & TOBAGO |
9,99 |
- 1,05 |
- 10 |
- 1,05 |
- 10 |
|
|
1,00 |
10 |
- 1,05 |
- 1,05 |
- 0,05 |
|
* TOTAL CARAIBES |
304,62 |
- 4,00 |
- 1 |
2,93 |
1 |
- 0,89 |
0 |
3,83 |
1 |
- 4,89 |
- 3,59 |
6,76 |
|
FIDJI |
21,99 |
|
|
5,04 |
23 |
|
|
|
|
|
9,14 |
5,04 |
|
KIRIBATI |
6,00 |
|
|
0,93 |
15 |
|
|
0,20 |
3 |
|
0,09 |
1,13 |
|
PAPOUASIE NELLE GUINEE |
45,79 |
|
|
- 0,66 |
- 1 |
|
|
|
|
|
0,21 |
- 0,66 |
|
SALOMON |
20,25 |
|
|
0,37 |
2 |
|
|
|
|
|
- 0,01 |
0,37 |
|
TUVALU |
1,06 |
|
|
- |
0 |
|
|
|
|
|
0,50 |
|
|
SAMOA |
8,92 |
|
|
0,03 |
0 |
|
|
1,00 |
11 |
|
0,03 |
1,03 |
|
* TOTAL PACIFIQUE |
104,01 |
|
|
5,71 |
5 |
|
|
1,20 |
1 |
0,00 |
9,95 |
6,91 |
|
BUDGET INTRA ACP |
50,00 |
|
|
|
|
|
|
|
|
|
|
|
|
COOPERATION REGIONALE ACP |
1 136,42 |
- 5,92 |
- 1 |
37,10 |
3 |
- 2,23 |
0 |
- 0,32 |
0 |
- 8,15 |
17,64 |
36,78 |
|
* TOTAL COOPER. REGIONALE ACP |
1 186,42 |
- 5,92 |
0 |
37,10 |
3 |
- 2,23 |
0 |
- 0,32 |
0 |
- 8,15 |
17,64 |
36,78 |
|
TOUS PAYS ACP |
|
|
|
|
|
- 0,14 |
|
|
|
- 0,14 |
- 0,14 |
|
|
FRAIS ADMINISTR. & FINANCIERS |
3,00 |
|
|
0,01 |
0 |
|
|
|
|
|
|
0,01 |
|
* TOTAL ACP |
5 531,03 |
- 42,07 |
- 1 |
195,59 |
4 |
- 15,85 |
0 |
31,76 |
1 |
- 57,92 |
120,58 |
227,35 |
|
NELLE CALEDONIE |
12,44 |
|
|
2,52 |
20 |
|
|
0,20 |
2 |
|
0,80 |
2,72 |
|
POLYNESIE FRANÇAISE |
12,96 |
|
|
|
|
|
|
|
|
|
- 0,00 |
|
|
WALLIS & FUTUNA |
4,58 |
|
|
0,50 |
11 |
|
|
|
|
|
|
0,50 |
|
* TOTAL PTOM FRANÇAIS |
29,99 |
|
|
3,02 |
10 |
|
|
0,20 |
1 |
0,00 |
0,80 |
3,22 |
|
ANTILLES NEERLANDAISES |
17,18 |
- 0,03 |
0 |
1,97 |
11 |
|
|
- 0,08 |
0 |
- 0,03 |
0,23 |
1,89 |
|
* TOTAL PTOM NEERLANDAIS |
17,18 |
- 0,03 |
0 |
1,97 |
11 |
|
|
- 0,08 |
0 |
- 0,03 |
0,23 |
1,89 |
|
ANGUILLA |
2,72 |
|
|
0,14 |
5 |
|
|
|
|
|
|
0,14 |
|
MONTSERRAT |
3,90 |
|
|
2,34 |
60 |
|
|
|
|
|
- 0,10 |
2,34 |
|
* TOTAL PTOM BRITANNIQUES |
6,62 |
|
|
2,48 |
37 |
|
|
|
|
0,00 |
- 0,10 |
2,48 |
|
COOPERATION REGIONALE PTOM |
8,97 |
- 0,47 |
- 5 |
|
|
|
|
|
|
- 0,47 |
- 0,10 |
|
|
* COOPERATION REGIONALE PTOM |
8,97 |
- 0,47 |
- 5 |
|
|
|
|
|
|
- 0,47 |
- 0,10 |
0,00 |
|
* TOTAL PTOM |
62,76 |
- 0,50 |
- 1 |
7,47 |
12 |
|
|
0,12 |
0 |
- 0,50 |
0,84 |
7,59 |
|
* TOTAL ACP + PTOM |
5 593,79 |
- 42,57 |
- 1 |
203,06 |
4 |
- 15,85 |
0 |
31,88 |
1 |
- 58,42 |
121,42 |
234,94 |
Table 3.2.3
7th EDF
Decisions cumulative 2004
SITUATION BY INSTRUMENT AND STATE
|
(million EUR) |
||||||||||||||
|
|
Lomé |
Cotonou |
Total state |
|||||||||||
|
NIP |
Non NIP |
Total |
||||||||||||
|
Grants |
Interest subsidies |
Emergency aid |
Refugee aid |
Risk capital |
STABEX |
SYSMIN |
Transfers from others funds |
SAF |
Heavily indebted poor countries |
Total non NIP |
||||
|
ANGOLA |
113,44 |
|
28,38 |
9,41 |
1,91 |
|
|
|
|
|
39,71 |
153,14 |
|
153,14 |
|
BENIN |
89,96 |
|
0,92 |
|
12,00 |
1,31 |
|
7,13 |
39,10 |
|
60,46 |
150,42 |
|
150,42 |
|
BURKINA FASO |
147,88 |
|
0,84 |
|
23,66 |
18,63 |
22,25 |
2,87 |
83,41 |
|
151,66 |
299,54 |
|
299,54 |
|
BOTSWANA |
30,91 |
16,45 |
|
0,23 |
2,53 |
|
33,72 |
2,25 |
|
|
55,18 |
86,09 |
|
86,09 |
|
BURUNDI |
94,58 |
|
17,05 |
|
|
54,56 |
|
2,75 |
12,00 |
|
86,35 |
180,93 |
|
180,93 |
|
CENTRAFRIQUE |
72,31 |
|
|
0,23 |
|
18,37 |
|
6,32 |
9,85 |
|
34,78 |
107,09 |
|
107,09 |
|
TCHAD |
102,70 |
|
0,98 |
|
|
11,31 |
|
2,69 |
19,58 |
|
34,56 |
137,26 |
|
137,26 |
|
CAMEROUN |
107,39 |
0,27 |
|
|
8,61 |
244,19 |
|
3,19 |
33,61 |
|
289,86 |
397,25 |
|
397,25 |
|
CONGO |
39,01 |
|
|
|
|
|
|
0,70 |
6,60 |
|
7,30 |
46,31 |
|
46,31 |
|
COMORES |
21,64 |
|
|
|
2,43 |
4,29 |
|
0,60 |
6,50 |
|
13,82 |
35,46 |
|
35,46 |
|
CAP VERT |
24,68 |
|
0,18 |
|
11,71 |
1,20 |
|
0,25 |
|
|
13,34 |
38,02 |
|
38,02 |
|
DJIBOUTI |
18,04 |
|
0,42 |
0,47 |
0,50 |
|
|
0,28 |
4,10 |
|
5,77 |
23,80 |
|
23,80 |
|
GUINEE EQUATORIALE |
12,46 |
|
|
|
|
7,60 |
|
0,67 |
|
|
8,28 |
20,74 |
|
20,74 |
|
ERITHREE |
47,57 |
|
1,75 |
3,73 |
8,00 |
|
|
|
|
|
13,48 |
61,05 |
|
61,05 |
|
ETHIOPIE |
212,57 |
|
6,95 |
7,07 |
68,51 |
179,49 |
|
10,16 |
78,40 |
|
350,57 |
563,15 |
|
563,15 |
|
GABON |
29,68 |
0,40 |
|
|
0,60 |
|
14,00 |
1,66 |
8,15 |
|
24,80 |
54,48 |
|
54,48 |
|
GHANA |
106,47 |
13,46 |
1,28 |
|
1,65 |
50,58 |
0,15 |
11,74 |
87,06 |
|
165,91 |
272,38 |
|
272,38 |
|
GAMBIE |
21,72 |
|
|
|
4,30 |
0,35 |
|
0,72 |
6,20 |
|
11,58 |
33,30 |
|
33,30 |
|
GUINEE BISSAU |
36,73 |
|
1,20 |
|
4,63 |
1,28 |
|
5,59 |
9,48 |
|
22,17 |
58,90 |
|
58,90 |
|
GUINEE |
126,17 |
3,28 |
2,37 |
1,49 |
48,06 |
|
80,17 |
7,56 |
25,66 |
|
168,59 |
294,76 |
|
294,76 |
|
COTE D'IVOIRE |
104,05 |
6,12 |
0,83 |
2,53 |
11,55 |
269,68 |
|
3,66 |
77,12 |
|
371,49 |
475,54 |
|
475,54 |
|
KENYA |
132,30 |
10,65 |
9,31 |
0,86 |
44,53 |
84,80 |
|
6,74 |
|
|
156,89 |
289,19 |
|
289,19 |
|
LIBERIA |
|
|
16,09 |
4,58 |
|
|
|
13,94 |
|
|
34,60 |
34,60 |
|
34,60 |
|
LESOTHO |
47,61 |
6,89 |
|
|
17,22 |
3,71 |
|
5,30 |
21,59 |
|
54,70 |
102,31 |
|
102,31 |
|
MADAGASCAR |
131,25 |
|
1,65 |
|
12,71 |
55,50 |
|
6,55 |
10,80 |
|
87,20 |
218,45 |
|
218,45 |
|
MALAWI |
127,05 |
|
1,30 |
14,34 |
44,79 |
8,69 |
|
12,56 |
52,34 |
|
134,03 |
261,08 |
|
261,08 |
|
MAURICE |
31,96 |
12,15 |
|
|
5,10 |
|
|
0,60 |
|
|
17,85 |
49,81 |
|
49,81 |
|
MAURITANIE |
63,39 |
3,47 |
1,36 |
0,08 |
18,40 |
16,15 |
58,03 |
6,00 |
24,46 |
|
127,96 |
191,35 |
|
191,35 |
|
MALI |
143,91 |
5,02 |
1,21 |
0,68 |
20,81 |
0,94 |
15,06 |
7,82 |
61,32 |
|
112,85 |
256,76 |
|
256,76 |
|
MOZAMBIQUE |
169,18 |
|
6,16 |
26,18 |
28,16 |
3,64 |
|
|
30,00 |
|
94,14 |
263,32 |
|
263,32 |
|
NAMIBIE |
46,87 |
9,42 |
0,17 |
|
6,42 |
|
37,60 |
|
|
|
53,61 |
100,48 |
|
100,48 |
|
NIGER |
139,51 |
|
0,46 |
0,09 |
5,00 |
|
31,08 |
4,82 |
22,40 |
|
63,85 |
203,35 |
|
203,35 |
|
RWANDA |
117,13 |
|
24,43 |
0,64 |
14,00 |
41,62 |
|
4,30 |
|
|
84,99 |
202,11 |
|
202,11 |
|
SENEGAL |
113,45 |
2,35 |
0,65 |
1,43 |
13,10 |
32,27 |
|
7,57 |
32,50 |
|
89,87 |
203,32 |
|
203,32 |
|
SEYCHELLES |
5,26 |
|
|
|
3,00 |
|
|
0,05 |
|
|
3,05 |
8,31 |
|
8,31 |
|
SIERRA LEONE |
77,14 |
|
9,53 |
0,81 |
8,00 |
10,01 |
0,18 |
2,48 |
11,90 |
|
42,91 |
120,06 |
|
120,06 |
|
SOMALIE |
|
|
|
|
|
|
|
18,90 |
|
|
18,90 |
18,90 |
|
18,90 |
|
SAO TOME & PRINCIPE |
8,00 |
|
|
|
5,60 |
2,89 |
|
0,07 |
2,07 |
|
10,63 |
18,63 |
|
18,63 |
|
SOUDAN |
|
|
39,97 |
|
|
103,83 |
|
0,38 |
|
|
144,19 |
144,19 |
|
144,19 |
|
SWAZILAND |
27,30 |
|
|
|
16,00 |
|
|
1,42 |
|
|
17,42 |
44,72 |
|
44,72 |
|
TANZANIE |
159,90 |
|
2,84 |
0,10 |
50,96 |
57,74 |
|
9,67 |
103,30 |
|
224,62 |
384,52 |
|
384,52 |
|
TOGO |
64,25 |
|
0,41 |
|
|
20,77 |
0,06 |
4,70 |
|
|
25,94 |
90,20 |
|
90,20 |
|
OUGANDA |
161,21 |
0,78 |
1,41 |
0,75 |
38,86 |
144,07 |
|
6,02 |
51,80 |
4,59 |
248,28 |
409,49 |
|
409,49 |
|
NIGERIA |
257,72 |
9,97 |
1,03 |
|
2,50 |
|
|
1,24 |
|
|
14,74 |
272,46 |
|
272,46 |
|
ZAMBIE |
102,02 |
|
1,25 |
1,10 |
49,85 |
|
60,16 |
7,03 |
96,41 |
|
215,80 |
317,83 |
|
317,83 |
|
ZIMBABWE |
89,64 |
13,72 |
0,64 |
1,78 |
16,15 |
26,97 |
0,09 |
7,66 |
36,00 |
|
103,04 |
192,67 |
|
192,67 |
|
REP. DEMOCRATIQUE CONGO |
156,98 |
|
13,54 |
5,30 |
|
|
|
23,71 |
|
|
42,55 |
199,53 |
|
199,53 |
|
* TOTAL AFRIQUE |
3 932,98 |
114,39 |
196,59 |
83,87 |
631,80 |
1 476,42 |
352,56 |
230,34 |
1 063,71 |
4,59 |
4 154,27 |
8 087,26 |
|
8 087,26 |
|
ANTIGUA-BARBUDA |
3,03 |
|
0,66 |
|
|
|
|
0,05 |
|
|
0,70 |
3,74 |
|
3,74 |
|
BARBADE |
3,03 |
5,40 |
|
|
|
|
|
0,95 |
|
|
6,34 |
9,37 |
|
9,37 |
|
BELIZE |
8,98 |
0,46 |
0,74 |
0,50 |
3,50 |
|
|
3,56 |
|
|
8,75 |
17,73 |
|
17,73 |
|
BAHAMAS |
4,30 |
6,91 |
|
|
|
|
|
0,43 |
|
|
7,33 |
11,63 |
|
11,63 |
|
REPUBLIQUE DOMINICAINE |
84,77 |
1,16 |
|
|
25,23 |
|
23,01 |
|
22,78 |
|
72,18 |
156,95 |
|
156,95 |
|
DOMINIQUE |
5,45 |
|
|
|
2,50 |
14,94 |
|
0,00 |
2,15 |
|
19,59 |
25,05 |
|
25,05 |
|
GRENADE |
5,38 |
0,68 |
|
|
1,50 |
10,59 |
|
0,02 |
1,98 |
|
14,78 |
20,16 |
|
20,16 |
|
GUYANE (ETAT) |
32,54 |
|
|
|
13,30 |
|
0,24 |
4,07 |
7,70 |
6,44 |
31,75 |
64,29 |
|
64,29 |
|
HAITI |
84,02 |
|
4,89 |
|
14,00 |
32,51 |
|
|
16,97 |
|
68,37 |
152,39 |
|
152,39 |
|
JAMAIQUE |
46,69 |
20,69 |
|
|
19,12 |
|
70,11 |
32,85 |
2,50 |
|
145,26 |
191,95 |
|
191,95 |
|
ST CHRISTOPHE (KITTS) & NEVI |
2,49 |
|
|
|
2,00 |
|
|
0,23 |
|
|
2,23 |
4,72 |
|
4,72 |
|
SAINTE LUCIE |
1,95 |
2,23 |
0,08 |
|
1,50 |
26,83 |
|
0,12 |
|
|
30,75 |
32,71 |
|
32,71 |
|
SURINAME |
17,51 |
|
|
0,50 |
0,65 |
|
0,16 |
5,13 |
|
|
6,44 |
23,95 |
|
23,95 |
|
SAINT VINCENT & GRENADINES |
3,22 |
|
|
|
5,00 |
31,57 |
|
0,15 |
|
|
36,72 |
39,94 |
|
39,94 |
|
TRINITE & TOBAGO |
9,99 |
15,46 |
|
|
10,07 |
|
|
1,00 |
6,20 |
|
32,73 |
42,72 |
|
42,72 |
|
* TOTAL CARAIBES |
313,35 |
52,97 |
6,36 |
1,00 |
98,37 |
116,46 |
93,53 |
48,55 |
60,28 |
6,44 |
483,95 |
797,31 |
|
797,31 |
|
FIDJI |
21,99 |
1,20 |
1,00 |
|
0,06 |
|
|
0,95 |
|
|
3,20 |
25,19 |
|
25,19 |
|
KIRIBATI |
6,00 |
|
|
|
1,00 |
0,63 |
|
0,16 |
|
|
1,78 |
7,78 |
|
7,78 |
|
PAPOUASIE NOUVELLE GUINEE |
45,79 |
4,97 |
0,11 |
|
21,33 |
84,58 |
|
4,39 |
20,50 |
|
135,88 |
181,68 |
|
181,68 |
|
SALOMON |
20,25 |
|
|
|
1,30 |
8,10 |
|
0,48 |
|
|
9,88 |
30,12 |
|
30,12 |
|
TONGA |
6,00 |
0,64 |
|
|
0,22 |
2,02 |
|
0,40 |
|
|
3,27 |
9,27 |
|
9,27 |
|
TUVALU |
1,06 |
|
|
|
0,50 |
0,03 |
|
0,04 |
|
|
0,58 |
1,64 |
|
1,64 |
|
VANUATU |
7,44 |
|
0,15 |
|
1,00 |
2,69 |
|
0,17 |
|
|
4,01 |
11,45 |
|
11,45 |
|
SAMOA |
8,92 |
|
0,30 |
|
5,50 |
5,78 |
|
0,04 |
|
|
11,62 |
20,55 |
|
20,55 |
|
* TOTAL PACIFIQUE |
117,45 |
6,80 |
1,57 |
|
30,91 |
103,82 |
|
6,63 |
20,50 |
|
170,23 |
287,67 |
|
287,67 |
|
BUDGET INTRA ACP |
|
|
|
|
|
|
|
|
|
|
|
|
50,00 |
50,00 |
|
COOPERATION REGIONALE ACP |
1 136,42 |
12,86 |
|
|
44,76 |
|
|
42,46 |
|
|
100,09 |
1 236,51 |
|
1 236,51 |
|
* TOTAL COOPER. REGIONALE ACP |
1 136,42 |
12,86 |
|
|
44,76 |
|
|
42,46 |
|
|
100,09 |
1 236,51 |
50,00 |
1 286,51 |
|
TOUS PAYS ACP |
|
13,12 |
198,82 |
|
12,25 |
|
0,21 |
11,54 |
|
28,97 |
264,91 |
264,91 |
|
264,91 |
|
FRAIS ADMINISTR.& FINANCIERS |
3,00 |
|
|
|
|
|
|
0,41 |
6,00 |
|
6,41 |
9,41 |
|
9,41 |
|
* TOTAL ACP |
5 503,20 |
200,15 |
403,35 |
84,87 |
818,10 |
1 696,69 |
446,29 |
339,93 |
1 150,48 |
40,00 |
5 179,87 |
10 683,07 |
50,00 |
10 733,07 |
|
MAYOTTE |
6,69 |
|
0,49 |
|
4,90 |
|
|
|
|
|
5,39 |
12,08 |
|
12,08 |
|
NOUVELLE CALEDONIE |
12,44 |
0,68 |
0,25 |
|
6,00 |
|
2,50 |
2,20 |
|
|
11,63 |
24,07 |
|
24,07 |
|
POLYNESIE FRANCAISE |
12,96 |
0,92 |
0,11 |
|
3,91 |
0,93 |
|
1,50 |
|
|
7,37 |
20,34 |
|
20,34 |
|
SAINT PIERRE & MIQUELON |
3,00 |
|
|
|
|
|
|
0,54 |
|
|
0,54 |
3,54 |
|
3,54 |
|
WALLIS & FUTUNA |
4,58 |
|
0,08 |
|
|
|
|
0,02 |
|
|
0,09 |
4,67 |
|
4,67 |
|
RESERVE AIDE NAT. PROGR. PTF |
|
|
|
|
|
|
|
0,09 |
|
|
0,09 |
0,09 |
|
0,09 |
|
* TOTAL PTOM FRANCAIS |
39,68 |
1,61 |
0,92 |
|
14,81 |
0,93 |
2,50 |
4,35 |
|
|
25,11 |
64,79 |
|
64,79 |
|
ARUBA |
7,16 |
0,07 |
|
|
|
|
|
0,27 |
|
|
0,33 |
7,50 |
|
7,50 |
|
ANTILLES NEERLANDAISES |
17,18 |
0,67 |
|
|
6,59 |
|
|
4,15 |
|
|
11,41 |
28,59 |
|
28,59 |
|
* TOTAL PTOM NEERLANDAIS |
24,35 |
0,74 |
|
|
6,59 |
|
|
4,42 |
|
|
11,74 |
36,09 |
|
36,09 |
|
ANGUILLA |
2,72 |
|
|
|
|
|
|
0,35 |
|
|
0,35 |
3,07 |
|
3,07 |
|
CAIMANS |
|
1,07 |
|
0,09 |
|
|
|
|
|
|
1,17 |
1,17 |
|
1,17 |
|
FALKLAND |
|
0,62 |
|
|
|
5,07 |
|
0,02 |
|
|
5,70 |
5,70 |
|
5,70 |
|
MONTSERRAT |
3,90 |
|
0,38 |
0,20 |
|
|
|
0,01 |
|
|
0,59 |
4,49 |
|
4,49 |
|
SAINTE HELENE |
1,10 |
|
|
|
|
|
|
0,05 |
|
|
0,05 |
1,15 |
|
1,15 |
|
TURKS & CAICOS |
3,89 |
|
|
|
|
|
|
0,06 |
|
|
0,06 |
3,95 |
|
3,95 |
|
VIERGES (BRITANNIQUES) |
2,40 |
0,19 |
|
|
1,10 |
|
|
0,12 |
|
|
1,41 |
3,80 |
|
3,80 |
|
* TOTAL PTOM BRITANNIQUES |
14,01 |
1,88 |
0,38 |
0,29 |
1,10 |
5,07 |
|
0,60 |
|
|
9,31 |
23,32 |
|
23,32 |
|
COOPERATION REGIONALE PTOM |
8,97 |
|
|
|
|
|
|
0,47 |
|
|
0,47 |
9,44 |
|
9,44 |
|
* COOPERATION REGIONALE PTOM |
8,97 |
|
|
|
|
|
|
0,47 |
|
|
0,47 |
9,44 |
|
9,44 |
|
TOUS PTOM |
|
|
0,96 |
|
|
|
|
|
|
|
0,96 |
0,96 |
|
0,96 |
|
* TOTAL PTOM |
87,00 |
4,22 |
2,26 |
0,29 |
22,49 |
6,00 |
2,50 |
9,84 |
|
|
47,60 |
134,61 |
|
134,61 |
|
* TOTAL ACP + PTOM |
5 590,21 |
204,37 |
405,61 |
85,16 |
840,59 |
1 702,69 |
448,79 |
349,77 |
1 150,48 |
40,00 |
5 227,47 |
10 817,68 |
50,00 |
10 867,68 |
Table 3.2.4
7th EDF
Decisions annual 2004
SITUATION BY INSTRUMENT AND STATE
|
(million EUR) |
|||||||||||||
|
|
Lomé |
Total state |
|||||||||||
|
NIP |
Non NIP |
Total non NIP |
Total |
||||||||||
|
Grants |
Interest subsidies |
Emergency aid |
Refugee aid |
Risk capital |
STABEX |
SYSMIN |
Transfers from others funds |
SAF |
Heavily indebted poor countries |
||||
|
ANGOLA |
- 0,02 |
|
|
|
- 1,15 |
|
|
|
|
|
- 1,15 |
- 1,17 |
- 1,17 |
|
BURKINA FASO |
- 0,09 |
|
- 0,11 |
|
|
|
|
|
|
|
- 0,11 |
- 0,21 |
- 0,21 |
|
BURUNDI |
|
|
- 0,01 |
|
|
|
|
|
|
|
- 0,01 |
- 0,01 |
- 0,01 |
|
TCHAD |
- 2,34 |
|
|
|
|
|
|
|
|
|
|
- 2,34 |
- 2,34 |
|
CONGO |
- 1,29 |
|
|
|
|
|
|
|
|
|
|
- 1,29 |
- 1,29 |
|
COMORES |
- 0,84 |
|
|
|
- 0,55 |
|
|
|
|
|
- 0,55 |
- 1,39 |
- 1,39 |
|
DJIBOUTI |
- |
|
|
- 0,13 |
|
|
|
|
|
|
- 0,13 |
- 0,13 |
- 0,13 |
|
GUINEE EQUATORIALE |
- 0,04 |
|
|
|
|
|
|
- 0,07 |
|
|
- 0,07 |
- 0,11 |
- 0,11 |
|
ERITHREE |
- 5,52 |
|
|
- 1,18 |
|
|
|
|
|
|
- 1,18 |
- 6,71 |
- 6,71 |
|
ETHIOPIE |
- 0,20 |
|
- 0,21 |
|
- 0,86 |
|
|
|
|
|
- 1,07 |
- 1,27 |
- 1,27 |
|
GHANA |
- 0,75 |
|
|
|
|
|
|
|
|
|
|
- 0,75 |
- 0,75 |
|
GAMBIE |
- 0,73 |
|
|
|
|
|
|
|
|
|
|
- 0,73 |
- 0,73 |
|
GUINEE BISSAU |
- 0,12 |
|
|
|
|
|
|
|
|
|
|
- 0,12 |
- 0,12 |
|
GUINEE |
- 0,84 |
|
|
|
|
|
|
- 0,09 |
- 0,74 |
|
- 0,84 |
- 1,67 |
- 1,67 |
|
COTE D'IVOIRE |
- 0,05 |
|
|
|
|
|
|
- 0,12 |
- 0,06 |
|
- 0,18 |
- 0,23 |
- 0,23 |
|
KENYA |
- 0,57 |
|
|
|
|
|
|
|
|
|
|
- 0,57 |
- 0,57 |
|
LIBERIA |
|
|
- 0,01 |
|
|
|
|
|
|
|
- 0,01 |
- 0,01 |
- 0,01 |
|
LESOTHO |
- 0,25 |
- 3,21 |
|
|
|
|
|
|
|
|
- 3,21 |
- 3,46 |
- 3,46 |
|
MADAGASCAR |
- 0,20 |
|
|
|
- 0,47 |
|
|
- 0,20 |
|
|
- 0,67 |
- 0,87 |
- 0,87 |
|
MALAWI |
- 1,85 |
|
|
|
|
|
|
|
|
|
|
- 1,85 |
- 1,85 |
|
MAURICE |
- 0,41 |
|
|
|
|
|
|
- 0,05 |
|
|
- 0,05 |
- 0,46 |
- 0,46 |
|
MAURITANIE |
- 0,14 |
|
|
|
|
|
|
|
|
|
|
- 0,14 |
- 0,14 |
|
MALI |
- 0,11 |
|
|
|
|
|
|
|
|
|
|
- 0,11 |
- 0,11 |
|
MOZAMBIQUE |
- 0,00 |
|
- 0,10 |
|
|
|
|
|
|
|
- 0,10 |
- 0,10 |
- 0,10 |
|
NAMIBIE |
- 0,29 |
|
|
|
|
|
|
|
|
|
|
- 0,29 |
- 0,29 |
|
SEYCHELLES |
- 0,01 |
|
|
|
|
|
|
|
|
|
|
- 0,01 |
- 0,01 |
|
SOUDAN |
|
|
- 0,04 |
|
|
|
|
|
|
|
- 0,04 |
- 0,04 |
- 0,04 |
|
SWAZILAND |
- 0,44 |
|
|
|
|
|
|
|
|
|
|
- 0,44 |
- 0,44 |
|
TANZANIE |
- 8,14 |
|
|
|
- 0,41 |
|
|
|
|
|
- 0,41 |
- 8,55 |
- 8,55 |
|
TOGO |
- 1,43 |
|
|
|
|
|
|
|
|
|
|
- 1,43 |
- 1,43 |
|
OUGANDA |
- 0,74 |
|
|
|
|
|
|
- 0,07 |
|
|
- 0,07 |
- 0,81 |
- 0,81 |
|
NIGERIA |
- 3,51 |
|
|
|
|
|
|
|
|
|
|
- 3,51 |
- 3,51 |
|
ZAMBIE |
- 0,15 |
|
- 0,75 |
|
|
|
- 0,02 |
|
|
|
- 0,76 |
- 0,91 |
- 0,91 |
|
ZIMBABWE |
- 1,05 |
- 2,00 |
|
|
|
|
|
|
|
|
- 2,00 |
- 3,05 |
- 3,05 |
|
* TOTAL AFRIQUE |
- 32,15 |
- 5,21 |
- 1,23 |
- 1,31 |
- 3,43 |
|
- 0,02 |
- 0,60 |
- 0,80 |
|
- 12,60 |
- 44,75 |
- 44,75 |
|
BELIZE |
|
|
- 0,11 |
|
|
|
|
|
|
|
- 0,11 |
- 0,11 |
- 0,11 |
|
DOMINIQUE |
- 0,04 |
|
|
|
|
|
|
|
|
|
|
- 0,04 |
- 0,04 |
|
GRENADE |
- 0,06 |
|
|
|
|
|
|
- 0,00 |
|
|
- 0,00 |
- 0,06 |
- 0,06 |
|
GUYANE (ETAT) |
|
|
|
|
|
|
|
- 0,60 |
|
|
- 0,60 |
- 0,60 |
- 0,60 |
|
HAITI |
- 0,40 |
|
|
|
|
|
|
|
|
|
|
- 0,40 |
- 0,40 |
|
JAMAIQUE |
- 2,24 |
|
|
|
|
|
|
- 0,18 |
|
|
- 0,18 |
- 2,41 |
- 2,41 |
|
SURINAME |
- 0,21 |
|
|
|
|
|
|
|
|
|
|
- 0,21 |
- 0,21 |
|
TRINITE & TOBAGO |
- 1,05 |
|
|
|
|
|
|
|
|
|
|
- 1,05 |
- 1,05 |
|
* TOTAL CARAIBES |
- 4,00 |
|
- 0,11 |
|
|
|
|
- 0,78 |
|
|
- 0,89 |
- 4,89 |
- 4,89 |
|
COOPERATION REGIONALE ACP |
- 5,92 |
|
|
|
|
|
|
- 2,23 |
|
|
- 2,23 |
- 8,15 |
- 8,15 |
|
* TOTAL COOPER. REGIONALE ACP |
- 5,92 |
|
|
|
|
|
|
- 2,23 |
|
|
- 2,23 |
- 8,15 |
- 8,15 |
|
TOUS PAYS ACP |
|
|
- 0,14 |
|
|
|
|
|
|
|
- 0,14 |
- 0,14 |
- 0,14 |
|
* TOTAL ACP |
- 42,07 |
- 5,21 |
- 1,47 |
- 1,31 |
- 3,43 |
|
- 0,02 |
- 3,61 |
- 0,80 |
|
- 15,85 |
- 57,92 |
- 57,92 |
|
ANTILLES NEERLANDAISES |
- 0,03 |
|
|
|
|
|
|
|
|
|
|
- 0,03 |
- 0,03 |
|
* TOTAL PTOM NEERLANDAIS |
- 0,03 |
|
|
|
|
|
|
|
|
|
|
- 0,03 |
- 0,03 |
|
COOPERATION REGIONALE PTOM |
- 0,47 |
|
|
|
|
|
|
|
|
|
|
- 0,47 |
- 0,47 |
|
* COOPERATION REGIONALE PTOM |
- 0,47 |
|
|
|
|
|
|
|
|
|
|
- 0,47 |
- 0,47 |
|
* TOTAL PTOM |
- 0,50 |
|
|
|
|
|
|
|
|
|
|
- 0,50 |
- 0,50 |
|
* TOTAL ACP + PTOM |
- 42,57 |
- 5,21 |
- 1,47 |
- 1,31 |
- 3,43 |
|
- 0,02 |
- 3,61 |
- 0,80 |
|
- 15,85 |
- 58,42 |
- 58,42 |
Table 3.2.5
7th EDF
Assigned funds cumulative 2004
SITUATION BY INSTRUMENT AND STATE
|
(million EUR) |
||||||||||||||
|
|
Lomé |
Cotonou |
Total state |
|||||||||||
|
NIP |
Non NIP |
Total |
||||||||||||
|
Grants |
Interestsubsidies |
Emergency aid |
Refugee aid |
Risk capital |
STABEX |
SYSMIN |
Transfers from others funds |
SAF |
Heavily indebted poor countries |
TotalNon NIP |
||||
|
ANGOLA |
110,43 |
|
28,31 |
9,41 |
1,91 |
|
|
|
|
|
39,63 |
150,06 |
|
150,06 |
|
BENIN |
87,30 |
|
0,92 |
|
12,00 |
1,31 |
|
7,12 |
39,10 |
|
60,45 |
147,75 |
|
147,75 |
|
BURKINA FASO |
142,03 |
|
0,84 |
|
23,66 |
18,63 |
21,98 |
2,87 |
83,41 |
|
151,39 |
293,42 |
|
293,42 |
|
BOTSWANA |
30,30 |
16,45 |
|
0,23 |
2,53 |
|
33,72 |
2,25 |
|
|
55,18 |
85,48 |
|
85,48 |
|
BURUNDI |
90,58 |
|
17,05 |
|
|
54,56 |
|
2,59 |
11,92 |
|
86,11 |
176,69 |
|
176,69 |
|
CENTRAFRIQUE |
71,51 |
|
|
0,23 |
|
18,37 |
|
4,84 |
9,85 |
|
33,29 |
104,80 |
|
104,80 |
|
TCHAD |
98,83 |
|
0,98 |
|
|
11,31 |
|
2,21 |
19,58 |
|
34,08 |
132,91 |
|
132,91 |
|
CAMEROUN |
105,33 |
0,27 |
|
|
8,61 |
244,19 |
|
3,04 |
33,61 |
|
289,72 |
395,04 |
|
395,04 |
|
CONGO |
36,18 |
|
|
|
|
|
|
0,69 |
6,60 |
|
7,29 |
43,47 |
|
43,47 |
|
COMORES |
21,07 |
|
|
|
2,43 |
4,29 |
|
0,60 |
6,50 |
|
13,82 |
34,89 |
|
34,89 |
|
CAP VERT |
23,59 |
|
0,18 |
|
11,71 |
1,20 |
|
0,25 |
|
|
13,34 |
36,93 |
|
36,93 |
|
DJIBOUTI |
17,53 |
|
0,42 |
0,47 |
0,50 |
|
|
0,19 |
4,10 |
|
5,67 |
23,20 |
|
23,20 |
|
GUINEE EQUATORIALE |
12,14 |
|
|
|
|
7,60 |
|
0,13 |
|
|
7,73 |
19,87 |
|
19,87 |
|
ERITHREE |
47,10 |
|
1,75 |
3,73 |
8,00 |
|
|
|
|
|
13,48 |
60,58 |
|
60,58 |
|
ETHIOPIE |
190,47 |
|
6,95 |
7,07 |
68,51 |
179,49 |
|
3,80 |
78,21 |
|
344,03 |
534,50 |
|
534,50 |
|
GABON |
29,49 |
0,40 |
|
|
0,60 |
|
13,96 |
1,65 |
8,15 |
|
24,75 |
54,25 |
|
54,25 |
|
GHANA |
98,78 |
13,46 |
1,28 |
|
1,65 |
50,58 |
0,15 |
11,74 |
87,06 |
|
165,91 |
264,69 |
|
264,69 |
|
GAMBIE |
21,72 |
|
|
|
4,30 |
0,35 |
|
0,57 |
6,20 |
|
11,43 |
33,14 |
|
33,14 |
|
GUINEE BISSAU |
35,73 |
|
1,20 |
|
4,63 |
1,28 |
|
5,52 |
9,48 |
|
22,11 |
57,84 |
|
57,84 |
|
GUINEE |
122,13 |
3,28 |
2,37 |
1,49 |
48,06 |
|
71,41 |
7,56 |
25,66 |
|
159,82 |
281,96 |
|
281,96 |
|
COTE D'IVOIRE |
103,53 |
6,12 |
0,83 |
2,53 |
11,55 |
269,68 |
|
3,66 |
77,12 |
|
371,49 |
475,02 |
|
475,02 |
|
KENYA |
130,57 |
10,65 |
9,31 |
0,86 |
44,53 |
84,80 |
|
5,26 |
|
|
155,41 |
285,99 |
|
285,99 |
|
LIBERIA |
|
|
16,09 |
4,32 |
|
|
|
13,83 |
|
|
34,24 |
34,24 |
|
34,24 |
|
LESOTHO |
47,45 |
6,89 |
|
|
17,22 |
3,71 |
|
5,04 |
21,59 |
|
54,43 |
101,88 |
|
101,88 |
|
MADAGASCAR |
131,01 |
|
1,65 |
|
12,71 |
55,50 |
|
6,00 |
10,80 |
|
86,65 |
217,66 |
|
217,66 |
|
MALAWI |
125,41 |
|
1,30 |
14,34 |
44,79 |
8,69 |
|
11,75 |
52,34 |
|
133,22 |
258,64 |
|
258,64 |
|
MAURICE |
31,87 |
12,15 |
|
|
5,10 |
|
|
0,60 |
|
|
17,85 |
49,72 |
|
49,72 |
|
MAURITANIE |
62,55 |
3,47 |
1,36 |
0,08 |
18,40 |
16,15 |
58,03 |
6,00 |
24,46 |
|
127,96 |
190,51 |
|
190,51 |
|
MALI |
142,47 |
5,02 |
1,21 |
0,68 |
20,81 |
0,94 |
8,12 |
7,79 |
61,32 |
|
105,88 |
248,35 |
|
248,35 |
|
MOZAMBIQUE |
163,46 |
|
6,16 |
26,08 |
28,16 |
3,64 |
|
|
30,00 |
|
94,05 |
257,50 |
|
257,50 |
|
NAMIBIE |
46,69 |
9,42 |
0,17 |
|
6,42 |
|
37,60 |
|
|
|
53,61 |
100,30 |
|
100,30 |
|
NIGER |
138,95 |
|
0,46 |
0,09 |
5,00 |
|
29,60 |
4,62 |
22,40 |
|
62,16 |
201,11 |
|
201,11 |
|
RWANDA |
114,33 |
|
24,43 |
0,64 |
14,00 |
41,62 |
|
2,94 |
|
|
83,63 |
197,95 |
|
197,95 |
|
SENEGAL |
112,12 |
2,35 |
0,65 |
1,43 |
13,10 |
32,27 |
|
7,44 |
32,50 |
|
89,73 |
201,85 |
|
201,85 |
|
SEYCHELLES |
5,26 |
|
|
|
3,00 |
|
|
0,05 |
|
|
3,05 |
8,31 |
|
8,31 |
|
SIERRA LEONE |
73,15 |
|
9,53 |
0,81 |
8,00 |
10,01 |
0,18 |
2,48 |
11,90 |
|
42,91 |
116,06 |
|
116,06 |
|
SOMALIE |
|
|
|
|
|
|
|
18,64 |
|
|
18,64 |
18,64 |
|
18,64 |
|
SAO TOME & PRINCIPE |
7,97 |
|
|
|
5,60 |
2,89 |
|
0,07 |
2,07 |
|
10,63 |
18,60 |
|
18,60 |
|
SOUDAN |
|
|
39,97 |
|
|
103,83 |
|
0,24 |
|
|
144,05 |
144,05 |
|
144,05 |
|
SWAZILAND |
24,13 |
|
|
|
16,00 |
|
|
1,26 |
|
|
17,26 |
41,40 |
|
41,40 |
|
TANZANIE |
156,87 |
|
2,84 |
|
50,96 |
57,74 |
|
9,62 |
103,30 |
|
224,47 |
381,34 |
|
381,34 |
|
TOGO |
44,24 |
|
0,41 |
|
|
20,77 |
0,06 |
3,67 |
|
|
24,92 |
69,16 |
|
69,16 |
|
OUGANDA |
156,13 |
0,78 |
1,41 |
0,75 |
38,86 |
144,07 |
|
2,34 |
51,65 |
4,59 |
244,45 |
400,59 |
|
400,59 |
|
NIGERIA |
177,50 |
9,97 |
1,03 |
|
2,50 |
|
|
1,18 |
|
|
14,68 |
192,18 |
|
192,18 |
|
ZAMBIE |
100,98 |
|
1,25 |
1,10 |
49,85 |
|
60,16 |
6,82 |
96,41 |
|
215,59 |
316,57 |
|
316,57 |
|
ZIMBABWE |
87,23 |
13,72 |
0,64 |
1,78 |
16,15 |
26,97 |
0,09 |
7,49 |
36,00 |
|
102,86 |
190,09 |
|
190,09 |
|
REP. DEMOCRATIQUE CONGO |
91,55 |
|
13,54 |
5,30 |
|
|
|
23,62 |
|
|
42,46 |
134,01 |
|
134,01 |
|
* TOTAL AFRIQUE |
3 667,67 |
114,39 |
196,52 |
83,41 |
631,80 |
1 476,42 |
335,05 |
210,05 |
1 063,28 |
4,59 |
4 115,52 |
7 783,19 |
|
7 783,19 |
|
ANTIGUA-BARBUDA |
2,94 |
|
0,66 |
|
|
|
|
0,05 |
|
|
0,70 |
3,64 |
|
3,64 |
|
BARBADE |
2,93 |
5,40 |
|
|
|
|
|
0,95 |
|
|
6,34 |
9,27 |
|
9,27 |
|
BELIZE |
8,98 |
0,46 |
0,74 |
0,50 |
3,50 |
|
|
3,56 |
|
|
8,75 |
17,73 |
|
17,73 |
|
BAHAMAS |
4,30 |
6,91 |
|
|
|
|
|
0,43 |
|
|
7,33 |
11,63 |
|
11,63 |
|
REPUBLIQUE DOMINICAINE |
82,42 |
1,16 |
|
|
25,23 |
|
20,11 |
|
22,78 |
|
69,28 |
151,70 |
|
151,70 |
|
DOMINIQUE |
3,87 |
|
|
|
2,50 |
14,94 |
|
0,00 |
2,15 |
|
19,59 |
23,46 |
|
23,46 |
|
GRENADE |
5,38 |
0,68 |
|
|
1,50 |
10,59 |
|
0,02 |
1,98 |
|
14,78 |
20,16 |
|
20,16 |
|
GUYANE (ETAT) |
32,21 |
|
|
|
13,30 |
|
0,24 |
4,07 |
7,70 |
6,44 |
31,75 |
63,96 |
|
63,96 |
|
HAITI |
80,35 |
|
4,89 |
|
14,00 |
32,51 |
|
|
16,97 |
|
68,37 |
148,72 |
|
148,72 |
|
JAMAIQUE |
46,40 |
20,69 |
|
|
19,12 |
|
4,44 |
32,85 |
2,50 |
|
79,58 |
125,98 |
|
125,98 |
|
ST CHRISTOPHE (KITTS) & NEVI |
2,48 |
|
|
|
2,00 |
|
|
0,23 |
|
|
2,23 |
4,72 |
|
4,72 |
|
SAINTE LUCIE |
1,78 |
2,23 |
0,08 |
|
1,50 |
26,83 |
|
0,12 |
|
|
30,75 |
32,53 |
|
32,53 |
|
SURINAME |
16,52 |
|
|
0,50 |
0,65 |
|
0,16 |
4,71 |
|
|
6,02 |
22,54 |
|
22,54 |
|
SAINT VINCENT & GRENADINES |
3,22 |
|
|
|
5,00 |
31,57 |
|
0,12 |
|
|
36,69 |
39,91 |
|
39,91 |
|
TRINITE & TOBAGO |
9,27 |
15,46 |
|
|
10,07 |
|
|
1,00 |
6,20 |
|
32,73 |
42,00 |
|
42,00 |
|
* TOTAL CARAIBES |
303,03 |
52,97 |
6,36 |
1,00 |
98,37 |
116,46 |
24,94 |
48,10 |
60,28 |
6,44 |
414,92 |
717,95 |
|
717,95 |
|
FIDJI |
21,99 |
1,20 |
1,00 |
|
0,06 |
|
|
0,95 |
|
|
3,20 |
25,19 |
|
25,19 |
|
KIRIBATI |
5,88 |
|
|
|
1,00 |
0,63 |
|
0,15 |
|
|
1,78 |
7,65 |
|
7,65 |
|
PAPOUASIE NOUVELLE GUINEE |
45,01 |
4,97 |
0,11 |
|
21,33 |
84,58 |
|
3,48 |
20,50 |
|
134,97 |
179,98 |
|
179,98 |
|
SALOMON |
19,75 |
|
|
|
1,30 |
8,10 |
|
0,48 |
|
|
9,88 |
29,63 |
|
29,63 |
|
TONGA |
6,00 |
0,64 |
|
|
0,22 |
2,02 |
|
0,39 |
|
|
3,26 |
9,26 |
|
9,26 |
|
TUVALU |
1,06 |
|
|
|
0,50 |
0,03 |
|
0,04 |
|
|
0,58 |
1,64 |
|
1,64 |
|
VANUATU |
7,44 |
|
0,15 |
|
1,00 |
2,69 |
|
0,17 |
|
|
4,01 |
11,45 |
|
11,45 |
|
SAMOA |
8,92 |
|
0,30 |
|
5,50 |
5,78 |
|
0,04 |
|
|
11,62 |
20,54 |
|
20,54 |
|
* TOTAL PACIFIQUE |
116,04 |
6,80 |
1,57 |
|
30,91 |
103,82 |
|
5,70 |
20,50 |
|
169,30 |
285,34 |
|
285,34 |
|
BUDGET INTRA ACP |
|
|
|
|
|
|
|
|
|
|
|
|
50,00 |
50,00 |
|
COOPERATION REGIONALE ACP |
1 083,32 |
12,86 |
|
|
44,76 |
|
|
41,65 |
|
|
99,28 |
1 182,60 |
|
1 182,60 |
|
* TOTAL COOPER. REGIONALE ACP |
1 083,32 |
12,86 |
|
|
44,76 |
|
|
41,65 |
|
|
99,28 |
1 182,60 |
50,00 |
1 232,60 |
|
TOUS PAYS ACP |
|
13,12 |
198,82 |
|
12,25 |
|
0,21 |
8,92 |
|
28,97 |
262,29 |
262,29 |
|
262,29 |
|
FRAIS ADMINISTR. & FINANCIERS |
2,90 |
|
|
|
|
|
|
0,41 |
4,82 |
|
5,23 |
8,12 |
|
8,12 |
|
* TOTAL ACP |
5 172,96 |
200,15 |
403,28 |
84,41 |
818,10 |
1 696,69 |
360,21 |
314,82 |
1 148,88 |
40,00 |
5 066,54 |
10 239,50 |
50,00 |
10 289,50 |
|
MAYOTTE |
6,69 |
|
0,49 |
|
4,90 |
|
|
|
|
|
5,39 |
12,08 |
|
12,08 |
|
NOUVELLE CALEDONIE |
12,44 |
0,68 |
0,25 |
|
6,00 |
|
1,40 |
2,20 |
|
|
10,53 |
22,98 |
|
22,98 |
|
POLYNESIE FRANCAISE |
12,85 |
0,92 |
0,11 |
|
3,91 |
0,93 |
|
1,50 |
|
|
7,37 |
20,23 |
|
20,23 |
|
SAINT PIERRE & MIQUELON |
3,00 |
|
|
|
|
|
|
0,54 |
|
|
0,54 |
3,54 |
|
3,54 |
|
WALLIS & FUTUNA |
4,58 |
|
0,08 |
|
|
|
|
0,02 |
|
|
0,09 |
4,67 |
|
4,67 |
|
* TOTAL PTOM FRANCAIS |
39,57 |
1,61 |
0,92 |
|
14,81 |
0,93 |
1,40 |
4,26 |
|
|
23,93 |
63,50 |
|
63,50 |
|
ARUBA |
7,11 |
0,07 |
|
|
|
|
|
0,10 |
|
|
0,17 |
7,28 |
|
7,28 |
|
ANTILLES NEERLANDAISES |
14,53 |
0,67 |
|
|
6,59 |
|
|
3,68 |
|
|
10,93 |
25,47 |
|
25,47 |
|
* TOTAL PTOM NEERLANDAIS |
21,65 |
0,74 |
|
|
6,59 |
|
|
3,78 |
|
|
11,10 |
32,75 |
|
32,75 |
|
ANGUILLA |
2,72 |
|
|
|
|
|
|
0,35 |
|
|
0,35 |
3,07 |
|
3,07 |
|
CAIMANS |
|
1,07 |
|
0,09 |
|
|
|
|
|
|
1,17 |
1,17 |
|
1,17 |
|
FALKLAND |
|
0,62 |
|
|
|
5,07 |
|
0,01 |
|
|
5,69 |
5,69 |
|
5,69 |
|
MONTSERRAT |
3,79 |
|
0,38 |
0,20 |
|
|
|
0,01 |
|
|
0,59 |
4,38 |
|
4,38 |
|
SAINTE HELENE |
1,10 |
|
|
|
|
|
|
0,05 |
|
|
0,05 |
1,15 |
|
1,15 |
|
TURKS & CAICOS |
3,89 |
|
|
|
|
|
|
0,06 |
|
|
0,06 |
3,95 |
|
3,95 |
|
VIERGES (BRITANNIQUES) |
2,39 |
0,19 |
|
|
1,10 |
|
|
0,12 |
|
|
1,41 |
3,80 |
|
3,80 |
|
* TOTAL PTOM BRITANNIQUES |
13,89 |
1,88 |
0,38 |
0,29 |
1,10 |
5,07 |
|
0,59 |
|
|
9,31 |
23,20 |
|
23,20 |
|
COOPERATION REGIONALE PTOM |
8,14 |
|
|
|
|
|
|
0,44 |
|
|
0,44 |
8,57 |
|
8,57 |
|
* COOPERATION REGIONALE PTOM |
8,14 |
|
|
|
|
|
|
0,44 |
|
|
0,44 |
8,57 |
|
8,57 |
|
TOUS PTOM |
|
|
0,96 |
|
|
|
|
|
|
|
0,96 |
0,96 |
|
0,96 |
|
* TOTAL PTOM |
83,25 |
4,22 |
2,26 |
0,29 |
22,49 |
6,00 |
1,40 |
9,06 |
|
|
44,77 |
128,02 |
|
128,98 |
|
* TOTAL ACP + PTOM |
5 256,21 |
204,37 |
405,54 |
84,70 |
840,59 |
1 702,69 |
361,61 |
323,88 |
1 148,88 |
40,00 |
5 111,31 |
10 367,52 |
50,00 |
10 418,48 |
Table 3.2.6
7th EDF
Assigned funds annual 2004
SITUATION BY INSTRUMENT AND STATE
|
(million EUR) |
|||||||||||||
|
|
Lomé |
Total state |
|||||||||||
|
NIP |
Non NIP |
Total |
|||||||||||
|
Grants |
Interest subsidies |
Emergency aid |
Refugee aid |
Risk capital |
STABEX |
SYSMIN |
Transfers from others funds |
SAF |
Heavily indebted poor countries |
Total non NIP |
|||
|
ANGOLA |
22,13 |
|
|
|
- 1,15 |
|
|
|
|
|
- 1,15 |
20,98 |
20,98 |
|
BENIN |
0,93 |
|
|
|
|
|
|
0,21 |
|
|
0,21 |
1,14 |
1,14 |
|
BURKINA FASO |
1,48 |
|
- 0,11 |
|
|
|
- 0,05 |
|
|
|
- 0,16 |
1,32 |
1,32 |
|
BOTSWANA |
- 0,01 |
|
|
|
|
|
|
|
|
|
|
- 0,01 |
- 0,01 |
|
BURUNDI |
9,62 |
|
- 0,01 |
|
|
|
|
|
|
|
- 0,01 |
9,62 |
9,62 |
|
CENTRAFRIQUE |
- 0,01 |
|
|
|
|
|
|
- 0,00 |
|
|
- 0,00 |
- 0,01 |
- 0,01 |
|
TCHAD |
- 1,77 |
|
|
|
|
|
|
|
|
|
|
- 1,77 |
- 1,77 |
|
CAMEROUN |
- 0,62 |
|
|
|
|
|
|
0,06 |
|
|
0,06 |
- 0,55 |
- 0,55 |
|
CONGO |
0,11 |
|
|
|
|
|
|
|
|
|
|
0,11 |
0,11 |
|
COMORES |
- 0,32 |
|
|
|
- 0,55 |
|
|
|
|
|
- 0,55 |
- 0,87 |
- 0,87 |
|
CAP VERT |
- 0,02 |
|
|
|
|
|
|
|
|
|
|
- 0,02 |
- 0,02 |
|
DJIBOUTI |
- 0,38 |
|
|
- 0,13 |
|
|
|
|
|
|
- 0,13 |
- 0,51 |
- 0,51 |
|
GUINEE EQUATORIALE |
1,84 |
|
|
|
|
|
|
- 0,16 |
|
|
- 0,16 |
1,68 |
1,68 |
|
ERITHREE |
0,39 |
|
|
- 0,33 |
|
|
|
|
|
|
- 0,33 |
0,05 |
0,05 |
|
ETHIOPIE |
0,88 |
|
|
|
- 0,86 |
|
|
- 0,71 |
|
|
- 1,56 |
- 0,69 |
- 0,69 |
|
GABON |
0,11 |
|
|
|
|
|
- 0,00 |
- 0,00 |
|
|
- 0,00 |
0,11 |
0,11 |
|
GHANA |
1,26 |
|
|
|
|
|
|
0,04 |
|
|
0,04 |
1,30 |
1,30 |
|
GAMBIE |
|
|
|
|
|
|
|
0,00 |
|
|
0,00 |
0,00 |
0,00 |
|
GUINEE BISSAU |
0,13 |
|
|
|
|
|
|
0,60 |
|
|
0,60 |
0,73 |
0,73 |
|
GUINEE |
- 1,72 |
|
|
|
|
|
1,04 |
2,98 |
|
|
4,02 |
2,30 |
2,30 |
|
COTE D'IVOIRE |
- 0,24 |
|
|
|
|
|
|
|
|
|
|
- 0,24 |
- 0,24 |
|
KENYA |
0,91 |
|
|
|
|
|
|
0,00 |
|
|
0,00 |
0,91 |
0,91 |
|
LIBERIA |
|
|
|
- 0,13 |
|
|
|
|
|
|
- 0,13 |
- 0,13 |
- 0,13 |
|
LESOTHO |
- 0,00 |
- 3,21 |
|
|
|
|
|
- 0,04 |
|
|
- 3,25 |
- 3,25 |
- 3,25 |
|
MADAGASCAR |
0,15 |
|
|
|
- 0,47 |
|
|
- 0,19 |
|
|
- 0,65 |
- 0,50 |
- 0,50 |
|
MALAWI |
1,10 |
|
|
|
|
|
|
- 0,42 |
|
|
- 0,42 |
0,68 |
0,68 |
|
MAURICE |
0,15 |
|
|
|
|
|
|
- 0,02 |
|
|
- 0,02 |
0,13 |
0,13 |
|
MAURITANIE |
0,19 |
|
|
|
|
|
- 0,00 |
|
|
|
- 0,00 |
0,19 |
0,19 |
|
MALI |
- 0,94 |
|
|
|
|
|
- 0,38 |
|
|
|
- 0,38 |
- 1,33 |
- 1,33 |
|
MOZAMBIQUE |
0,30 |
|
|
- 0,00 |
|
|
|
|
|
|
- 0,00 |
0,30 |
0,30 |
|
NAMIBIE |
- 0,07 |
|
|
|
|
|
|
|
|
|
|
- 0,07 |
- 0,07 |
|
NIGER |
- 0,29 |
|
|
|
|
|
1,51 |
|
|
|
1,51 |
1,22 |
1,22 |
|
RWANDA |
16,19 |
|
|
|
|
|
|
- 0,03 |
|
|
- 0,03 |
16,16 |
16,16 |
|
SENEGAL |
- 0,47 |
|
|
|
|
|
|
|
|
|
|
- 0,47 |
- 0,47 |
|
SIERRA LEONE |
7,22 |
|
|
|
|
|
|
|
|
|
|
7,22 |
7,22 |
|
SOMALIE |
|
|
|
|
|
|
|
- 0,18 |
|
|
- 0,18 |
- 0,18 |
- 0,18 |
|
SAO TOME & PRINCIPE |
- 0,03 |
|
|
|
|
|
|
|
|
|
|
- 0,03 |
- 0,03 |
|
SOUDAN |
|
|
|
|
|
|
|
- 0,01 |
|
|
- 0,01 |
- 0,01 |
- 0,01 |
|
SWAZILAND |
- 0,09 |
|
|
|
|
|
|
|
|
|
|
- 0,09 |
- 0,09 |
|
TANZANIE |
- 1,58 |
|
|
- 0,10 |
- 0,41 |
|
|
0,04 |
|
|
- 0,48 |
- 2,06 |
- 2,06 |
|
TOGO |
6,44 |
|
|
|
|
|
|
0,22 |
|
|
0,22 |
6,66 |
6,66 |
|
OUGANDA |
2,02 |
|
|
|
|
|
|
|
|
|
|
2,02 |
2,02 |
|
NIGERIA |
23,31 |
|
|
|
|
|
|
- 0,04 |
|
|
- 0,04 |
23,27 |
23,27 |
|
ZAMBIE |
- 0,03 |
|
- 0,46 |
|
|
|
|
|
|
|
- 0,46 |
- 0,49 |
- 0,49 |
|
ZIMBABWE |
0,83 |
- 2,00 |
|
|
|
|
|
0,25 |
|
|
- 1,75 |
- 0,92 |
- 0,92 |
|
REP. DEMOCRATIQUE CONGO |
12,81 |
|
|
|
|
|
|
- 0,00 |
|
|
- 0,00 |
12,81 |
12,81 |
|
* TOTAL AFRIQUE |
101,91 |
- 5,21 |
- 0,58 |
- 0,70 |
- 3,43 |
|
2,12 |
2,61 |
|
|
- 5,18 |
96,72 |
96,72 |
|
ANTIGUA-BARBUDA |
- 0,09 |
|
|
|
|
|
|
|
|
|
|
- 0,09 |
- 0,09 |
|
REPUBLIQUE DOMINICAINE |
- 0,45 |
|
|
|
|
|
- 0,89 |
|
|
|
- 0,89 |
- 1,34 |
- 1,34 |
|
DOMINIQUE |
0,18 |
|
|
|
|
|
|
|
|
|
|
0,18 |
0,18 |
|
GUYANE (ETAT) |
- 0,03 |
|
|
|
|
|
|
- 0,10 |
|
|
- 0,10 |
- 0,12 |
- 0,12 |
|
HAITI |
- 0,89 |
|
|
|
|
|
|
|
|
|
|
- 0,89 |
- 0,89 |
|
JAMAIQUE |
0,01 |
|
|
|
|
|
- 0,13 |
0,10 |
|
|
- 0,03 |
- 0,03 |
- 0,03 |
|
SAINTE LUCIE |
- 0,01 |
|
|
|
|
|
|
|
|
|
|
- 0,01 |
- 0,01 |
|
SURINAME |
- 0,20 |
|
|
|
|
|
|
- 0,03 |
|
|
- 0,03 |
- 0,23 |
- 0,23 |
|
TRINITE & TOBAGO |
- 1,05 |
|
|
|
|
|
|
|
|
|
|
- 1,05 |
- 1,05 |
|
* TOTAL CARAIBES |
- 2,54 |
|
|
|
|
|
- 1,02 |
- 0,03 |
|
|
- 1,05 |
- 3,59 |
- 3,59 |
|
FIDJI |
9,14 |
|
|
|
|
|
|
|
|
|
|
9,14 |
9,14 |
|
KIRIBATI |
0,09 |
|
|
|
|
|
|
|
|
|
|
0,09 |
0,09 |
|
PAPOUASIE NOUVELLE GUINEE |
0,21 |
|
|
|
|
|
|
|
|
|
|
0,21 |
0,21 |
|
SALOMON |
- 0,01 |
|
|
|
|
|
|
|
|
|
|
- 0,01 |
- 0,01 |
|
TUVALU |
|
|
|
|
0,50 |
|
|
|
|
|
0,50 |
0,50 |
0,50 |
|
SAMOA |
0,03 |
|
|
|
|
|
|
|
|
|
|
0,03 |
0,03 |
|
* TOTAL PACIFIQUE |
9,45 |
|
|
|
|
|
|
|
|
|
0,50 |
9,95 |
9,95 |
|
COOPERATION REGIONALE ACP |
17,69 |
|
|
|
|
|
|
|
|
|
- 0,06 |
17,64 |
17,64 |
|
* TOTAL COOPER. REGIONALE ACP |
17,69 |
|
|
|
|
|
|
|
|
|
- 0,06 |
17,64 |
17,64 |
|
TOUS PAYS ACP |
|
|
- 0,14 |
|
|
|
|
|
|
|
- 0,14 |
- 0,14 |
- 0,14 |
|
* TOTAL ACP |
126,51 |
- 5,21 |
- 0,72 |
- 0,70 |
- 3,43 |
|
1,11 |
2,58 |
|
|
- 5,93 |
120,58 |
120,58 |
|
NOUVELLE CALEDONIE |
|
|
|
|
|
|
0,80 |
0,00 |
|
|
0,80 |
0,80 |
0,80 |
|
* TOTAL PTOM FRANCAIS |
|
|
|
|
|
|
|
0,00 |
|
|
0,80 |
0,80 |
0,80 |
|
ANTILLES NEERLANDAISES |
0,23 |
|
|
|
|
|
|
|
|
|
|
0,23 |
0,23 |
|
* TOTAL PTOM NEERLANDAIS |
0,23 |
|
|
|
|
|
|
|
|
|
|
0,23 |
0,23 |
|
MONTSERRAT |
- 0,10 |
|
|
|
|
|
|
|
|
|
|
- 0,10 |
- 0,10 |
|
* TOTAL PTOM BRITANNIQUES |
- 0,10 |
|
|
|
|
|
|
|
|
|
|
- 0,10 |
- 0,10 |
|
COOPERATION REGIONALE PTOM |
- 0,10 |
|
|
|
|
|
|
|
|
|
|
- 0,10 |
- 0,10 |
|
* COOPERATION REGIONALE PTOM |
- 0,10 |
|
|
|
|
|
|
|
|
|
|
- 0,10 |
- 0,10 |
|
* TOTAL PTOM |
0,03 |
|
|
|
|
|
|
|
|
|
0,80 |
0,84 |
0,84 |
|
* TOTAL ACP + PTOM |
126,55 |
- 5,21 |
- 0,72 |
- 0,70 |
- 3,43 |
|
1,11 |
2,58 |
|
|
- 5,12 |
121,42 |
121,42 |
Table 3.2.7
7th EDF
Payments — Cumulative 2004
SITUATION BY INSTRUMENT AND STATE
|
(million EUR) |
||||||||||||||
|
|
Lomé |
Cotonou |
Total state |
|||||||||||
|
NIP |
Non NIP |
Total |
||||||||||||
|
Grants |
Interest subsidies |
Emergency aid |
Refugee aid |
Risk capital |
STABEX |
SYSMIN |
Transfers from others funds |
SAF |
Heavily indebted poor countries |
Total non NIP |
||||
|
ANGOLA |
89,06 |
|
28,31 |
9,31 |
1,91 |
|
|
|
|
|
39,53 |
128,60 |
|
128,60 |
|
BENIN |
85,13 |
|
0,92 |
|
12,00 |
1,31 |
|
7,12 |
39,10 |
|
60,45 |
145,57 |
|
145,57 |
|
BURKINA FASO |
138,13 |
|
0,84 |
|
22,44 |
18,63 |
21,49 |
2,87 |
83,41 |
|
149,68 |
287,80 |
|
287,80 |
|
BOTSWANA |
30,08 |
16,45 |
|
0,23 |
2,53 |
|
33,71 |
2,23 |
|
|
55,15 |
85,23 |
|
85,23 |
|
BURUNDI |
65,07 |
|
17,05 |
|
|
45,53 |
|
2,56 |
11,92 |
|
77,06 |
142,13 |
|
142,13 |
|
CENTRAFRIQUE |
71,24 |
|
|
0,23 |
|
18,37 |
|
4,66 |
9,85 |
|
33,11 |
104,35 |
|
104,35 |
|
TCHAD |
98,54 |
|
0,98 |
|
|
11,31 |
|
2,20 |
19,58 |
|
34,07 |
132,61 |
|
132,61 |
|
CAMEROUN |
104,37 |
0,27 |
|
|
4,61 |
244,19 |
|
3,02 |
33,61 |
|
285,69 |
390,06 |
|
390,06 |
|
CONGO |
28,22 |
|
|
|
|
|
|
0,66 |
6,60 |
|
7,26 |
35,48 |
|
35,48 |
|
COMORES |
20,80 |
|
|
|
2,43 |
4,29 |
|
0,60 |
6,50 |
|
13,82 |
34,62 |
|
34,62 |
|
CAP VERT |
23,19 |
|
0,18 |
|
11,71 |
1,20 |
|
0,25 |
|
|
13,34 |
36,53 |
|
36,53 |
|
DJIBOUTI |
17,42 |
|
0,42 |
0,47 |
0,50 |
|
|
0,19 |
4,10 |
|
5,67 |
23,10 |
|
23,10 |
|
GUINEE EQUATORIALE |
11,60 |
|
|
|
|
7,60 |
|
0,13 |
|
|
7,73 |
19,33 |
|
19,33 |
|
ERITHREE |
39,33 |
|
1,75 |
3,73 |
8,00 |
|
|
|
|
|
13,48 |
52,81 |
|
52,81 |
|
ETHIOPIE |
171,96 |
|
6,95 |
7,07 |
43,51 |
179,49 |
|
3,80 |
78,07 |
|
318,89 |
490,84 |
|
490,84 |
|
GABON |
29,22 |
0,40 |
|
|
0,60 |
|
13,96 |
1,65 |
8,15 |
|
24,75 |
53,97 |
|
53,97 |
|
GHANA |
89,88 |
11,75 |
1,28 |
|
1,65 |
50,58 |
0,15 |
11,43 |
87,06 |
|
163,89 |
253,77 |
|
253,77 |
|
GAMBIE |
21,54 |
|
|
|
4,30 |
0,35 |
|
0,46 |
6,20 |
|
11,31 |
32,85 |
|
32,85 |
|
GUINEE BISSAU |
34,13 |
|
1,20 |
|
4,63 |
1,28 |
|
5,30 |
9,48 |
|
21,89 |
56,01 |
|
56,01 |
|
GUINEE |
121,05 |
3,28 |
2,37 |
1,49 |
48,06 |
|
61,59 |
4,56 |
25,66 |
|
147,01 |
268,06 |
|
268,06 |
|
COTE D'IVOIRE |
103,13 |
6,12 |
0,83 |
2,53 |
11,55 |
269,68 |
|
3,66 |
77,12 |
|
371,49 |
474,62 |
|
474,62 |
|
KENYA |
108,27 |
10,65 |
9,31 |
0,86 |
44,53 |
84,80 |
|
3,82 |
|
|
153,97 |
262,24 |
|
262,24 |
|
LIBERIA |
|
|
16,09 |
4,32 |
|
|
|
12,72 |
|
|
33,13 |
33,13 |
|
33,13 |
|
LESOTHO |
47,24 |
6,89 |
|
|
17,09 |
3,71 |
|
4,97 |
21,59 |
|
54,24 |
101,48 |
|
101,48 |
|
MADAGASCAR |
129,82 |
|
1,65 |
|
12,71 |
55,50 |
|
5,94 |
10,80 |
|
86,60 |
216,42 |
|
216,42 |
|
MALAWI |
121,96 |
|
1,30 |
14,34 |
44,79 |
8,69 |
|
11,60 |
52,34 |
|
133,06 |
255,02 |
|
255,02 |
|
MAURICE |
31,30 |
12,15 |
|
|
5,10 |
|
|
0,60 |
|
|
17,85 |
49,16 |
|
49,16 |
|
MAURITANIE |
62,09 |
3,47 |
1,36 |
0,08 |
18,40 |
16,15 |
57,82 |
6,00 |
24,46 |
|
127,75 |
189,84 |
|
189,84 |
|
MALI |
141,28 |
5,02 |
1,21 |
0,68 |
20,81 |
0,94 |
5,85 |
7,68 |
61,32 |
|
103,51 |
244,79 |
|
244,79 |
|
MOZAMBIQUE |
152,95 |
|
6,16 |
26,06 |
28,16 |
3,64 |
|
|
30,00 |
|
94,02 |
246,97 |
|
246,97 |
|
NAMIBIE |
46,61 |
9,42 |
0,17 |
|
6,42 |
|
37,60 |
|
|
|
53,61 |
100,22 |
|
100,22 |
|
NIGER |
138,24 |
|
0,46 |
0,09 |
3,22 |
|
28,91 |
4,48 |
22,40 |
|
59,56 |
197,80 |
|
197,80 |
|
RWANDA |
103,09 |
|
24,43 |
0,64 |
8,00 |
41,62 |
|
2,69 |
|
|
77,38 |
180,46 |
|
180,46 |
|
SENEGAL |
110,40 |
2,35 |
0,65 |
1,36 |
13,10 |
32,27 |
|
6,84 |
32,50 |
|
89,07 |
199,47 |
|
199,47 |
|
SEYCHELLES |
5,26 |
|
|
|
3,00 |
|
|
0,05 |
|
|
3,05 |
8,31 |
|
8,31 |
|
SIERRA LEONE |
59,13 |
|
9,53 |
0,81 |
8,00 |
10,01 |
0,18 |
2,48 |
11,90 |
|
42,91 |
102,05 |
|
102,05 |
|
SOMALIE |
|
|
|
|
|
|
|
18,34 |
|
|
18,34 |
18,34 |
|
18,34 |
|
SAO TOME & PRINCIPE |
7,89 |
|
|
|
4,89 |
2,89 |
|
0,07 |
2,07 |
|
9,92 |
17,81 |
|
17,81 |
|
SOUDAN |
|
|
39,83 |
|
|
|
|
0,24 |
|
|
40,07 |
40,07 |
|
40,07 |
|
SWAZILAND |
23,60 |
|
|
|
16,00 |
|
|
1,26 |
|
|
17,26 |
40,86 |
|
40,86 |
|
TANZANIE |
155,67 |
|
2,84 |
|
50,96 |
57,74 |
|
8,00 |
103,30 |
|
222,84 |
378,51 |
|
378,51 |
|
TOGO |
36,12 |
|
0,41 |
|
|
20,77 |
0,06 |
3,46 |
|
|
24,70 |
60,82 |
|
60,82 |
|
OUGANDA |
149,21 |
0,78 |
1,41 |
0,75 |
38,86 |
144,07 |
|
2,34 |
51,61 |
4,59 |
244,42 |
393,63 |
|
393,63 |
|
NIGERIA |
129,21 |
9,97 |
1,03 |
|
2,50 |
|
|
0,93 |
|
|
14,43 |
143,64 |
|
143,64 |
|
ZAMBIE |
99,97 |
|
1,25 |
1,10 |
49,85 |
|
60,16 |
6,81 |
96,41 |
|
215,58 |
315,55 |
|
315,55 |
|
ZIMBABWE |
83,91 |
13,72 |
0,64 |
1,78 |
16,15 |
26,97 |
0,09 |
7,18 |
36,00 |
|
102,55 |
186,46 |
|
186,46 |
|
REP. DEMOCRATIQUE CONGO |
78,63 |
|
13,54 |
5,30 |
|
|
|
20,99 |
|
|
39,83 |
118,46 |
|
118,46 |
|
* TOTAL AFRIQUE |
3 414,93 |
112,68 |
196,38 |
83,22 |
592,97 |
1 363,56 |
321,57 |
196,83 |
1 063,11 |
4,59 |
3 934,92 |
7 349,85 |
|
7 349,85 |
|
ANTIGUA-BARBUDA |
2,94 |
|
0,66 |
|
|
|
|
0,05 |
|
|
0,70 |
3,64 |
|
3,64 |
|
BARBADE |
2,87 |
5,40 |
|
|
|
|
|
0,95 |
|
|
6,34 |
9,21 |
|
9,21 |
|
BELIZE |
8,98 |
0,46 |
0,74 |
0,50 |
3,50 |
|
|
3,56 |
|
|
8,75 |
17,73 |
|
17,73 |
|
BAHAMAS |
4,29 |
6,91 |
|
|
|
|
|
0,36 |
|
|
7,27 |
11,57 |
|
11,57 |
|
REPUBLIQUE DOMINICAINE |
80,79 |
1,16 |
|
|
25,23 |
|
18,66 |
|
22,78 |
|
67,84 |
148,63 |
|
148,63 |
|
DOMINIQUE |
2,19 |
|
|
|
2,50 |
14,94 |
|
0,00 |
2,15 |
|
19,59 |
21,78 |
|
21,78 |
|
GRENADE |
5,38 |
0,68 |
|
|
1,50 |
10,59 |
|
0,02 |
1,98 |
|
14,78 |
20,16 |
|
20,16 |
|
GUYANE (ETAT) |
31,77 |
|
|
|
13,30 |
|
0,24 |
4,07 |
7,70 |
6,44 |
31,75 |
63,52 |
|
63,52 |
|
HAITI |
79,69 |
|
4,89 |
|
8,00 |
32,51 |
|
|
16,97 |
|
62,37 |
142,06 |
|
142,06 |
|
JAMAIQUE |
46,23 |
20,69 |
|
|
2,99 |
|
2,00 |
32,64 |
2,50 |
|
60,81 |
107,04 |
|
107,04 |
|
ST CHRISTOPHE (KITTS) & NEVI |
2,48 |
|
|
|
2,00 |
|
|
0,23 |
|
|
2,23 |
4,71 |
|
4,71 |
|
SAINTE LUCIE |
1,77 |
2,23 |
0,08 |
|
1,50 |
26,83 |
|
0,12 |
|
|
30,75 |
32,53 |
|
32,53 |
|
SURINAME |
15,94 |
|
|
0,50 |
0,65 |
|
0,16 |
4,42 |
|
|
5,73 |
21,67 |
|
21,67 |
|
SAINT VINCENT & GRENADINES |
3,22 |
|
|
|
5,00 |
31,57 |
|
0,11 |
|
|
36,68 |
39,90 |
|
39,90 |
|
TRINITE & TOBAGO |
9,27 |
15,46 |
|
|
6,07 |
|
|
0,98 |
6,20 |
|
28,71 |
37,98 |
|
37,98 |
|
* TOTAL CARAIBES |
297,80 |
52,97 |
6,36 |
1,00 |
72,24 |
116,46 |
21,07 |
47,50 |
60,28 |
6,44 |
384,32 |
682,12 |
|
682,12 |
|
FIDJI |
17,86 |
1,20 |
1,00 |
|
0,06 |
|
|
0,88 |
|
|
3,14 |
21,00 |
|
21,00 |
|
KIRIBATI |
5,75 |
|
|
|
1,00 |
0,63 |
|
0,15 |
|
|
1,78 |
7,53 |
|
7,53 |
|
PAPOUASIE NOUVELLE GUINEE |
42,74 |
4,97 |
0,11 |
|
21,33 |
84,58 |
|
3,47 |
20,50 |
|
134,97 |
177,70 |
|
177,70 |
|
SALOMON |
19,51 |
|
|
|
1,30 |
8,10 |
|
0,48 |
|
|
9,88 |
29,38 |
|
29,38 |
|
TONGA |
5,58 |
0,64 |
|
|
0,22 |
2,02 |
|
0,39 |
|
|
3,26 |
8,84 |
|
8,84 |
|
TUVALU |
1,06 |
|
|
|
|
0,03 |
|
0,04 |
|
|
0,08 |
1,14 |
|
1,14 |
|
VANUATU |
7,44 |
|
0,15 |
|
1,00 |
2,69 |
|
0,17 |
|
|
4,01 |
11,45 |
|
11,45 |
|
SAMOA |
8,92 |
|
0,30 |
|
5,00 |
5,78 |
|
0,04 |
|
|
11,12 |
20,04 |
|
20,04 |
|
* TOTAL PACIFIQUE |
108,86 |
6,80 |
1,57 |
|
29,91 |
103,82 |
|
5,63 |
20,50 |
|
168,23 |
277,08 |
|
277,08 |
|
BUDGET INTRA ACP |
|
|
|
|
|
|
|
|
|
|
|
|
50,00 |
50,00 |
|
COOPERATION REGIONALE ACP |
1 001,76 |
12,86 |
|
|
44,76 |
|
|
39,96 |
|
|
97,59 |
1 099,35 |
|
1 099,35 |
|
* TOTAL COOPER. REGIONALE ACP |
1 001,76 |
12,86 |
|
|
44,76 |
|
|
39,96 |
|
|
97,59 |
1 099,35 |
50,00 |
1 149,35 |
|
TOUS PAYS ACP |
|
13,12 |
198,82 |
|
12,25 |
|
0,21 |
6,70 |
|
28,97 |
260,07 |
260,07 |
|
260,07 |
|
FRAIS ADMINISTR. & FINANCIERS |
2,65 |
|
|
|
|
|
|
0,36 |
4,66 |
|
5,02 |
7,67 |
|
7,67 |
|
* TOTAL ACP |
4 826,00 |
198,44 |
403,13 |
84,22 |
752,14 |
1 583,83 |
342,85 |
296,98 |
1 148,54 |
40,00 |
4 850,14 |
9 676,14 |
|
9 726,14 |
|
MAYOTTE |
6,69 |
|
0,49 |
|
4,90 |
|
|
|
|
|
5,39 |
12,08 |
|
12,08 |
|
NOUVELLE CALEDONIE |
11,42 |
0,68 |
0,25 |
|
6,00 |
|
0,69 |
1,62 |
|
|
9,24 |
20,67 |
|
20,67 |
|
POLYNESIE FRANCAISE |
12,71 |
0,92 |
0,11 |
|
3,91 |
0,93 |
|
1,50 |
|
|
7,37 |
20,08 |
|
20,08 |
|
SAINT PIERRE & MIQUELON |
3,00 |
|
|
|
|
|
|
0,54 |
|
|
0,54 |
3,54 |
|
3,54 |
|
TERRES AUSTRALES FRANCAISES |
0,00 |
|
|
|
|
|
|
|
|
|
|
|
|
0,00 |
|
WALLIS & FUTUNA |
4,57 |
|
0,08 |
|
|
|
|
0,02 |
|
|
0,09 |
4,66 |
|
4,66 |
|
* TOTAL PTOM FRANCAIS |
38,39 |
1,61 |
0,92 |
|
14,81 |
0,93 |
0,69 |
3,67 |
|
|
22,64 |
61,02 |
|
61,03 |
|
ARUBA |
6,96 |
0,07 |
|
|
|
|
|
0,10 |
|
|
0,17 |
7,13 |
|
7,13 |
|
ANTILLES NEERLANDAISES |
12,34 |
0,67 |
|
|
6,59 |
|
|
3,19 |
|
|
10,45 |
22,79 |
|
22,79 |
|
* TOTAL PTOM NEERLANDAIS |
19,30 |
0,74 |
|
|
6,59 |
|
|
3,30 |
|
|
10,62 |
29,92 |
|
29,92 |
|
ANGUILLA |
2,72 |
|
|
|
|
|
|
0,35 |
|
|
0,35 |
3,07 |
|
3,07 |
|
CAIMANS |
|
1,07 |
|
0,09 |
|
|
|
|
|
|
1,17 |
1,17 |
|
1,17 |
|
FALKLAND |
|
0,62 |
|
|
|
5,07 |
|
0,01 |
|
|
5,69 |
5,69 |
|
5,69 |
|
MONTSERRAT |
3,65 |
|
0,38 |
0,20 |
|
|
|
0,01 |
|
|
0,59 |
4,24 |
|
4,24 |
|
SAINTE HELENE |
1,10 |
|
|
|
|
|
|
0,05 |
|
|
0,05 |
1,15 |
|
1,15 |
|
TURKS & CAICOS |
3,89 |
|
|
|
|
|
|
0,06 |
|
|
0,06 |
3,95 |
|
3,95 |
|
VIERGES (BRITANNIQUES) |
2,39 |
0,19 |
|
|
1,10 |
|
|
0,12 |
|
|
1,41 |
3,80 |
|
3,80 |
|
* TOTAL PTOM BRITANNIQUES |
13,75 |
1,88 |
0,38 |
0,29 |
1,10 |
5,07 |
|
0,59 |
|
|
9,31 |
23,06 |
|
23,06 |
|
COOPERATION REGIONALE PTOM |
8,02 |
|
|
|
|
|
|
0,44 |
|
|
0,44 |
8,46 |
|
8,46 |
|
* COOPERATION REGIONALE PTOM |
8,02 |
|
|
|
|
|
|
0,44 |
|
|
0,44 |
8,46 |
|
8,46 |
|
TOUS PTOM |
|
|
0,96 |
|
|
|
|
|
|
|
0,96 |
0,96 |
|
0,96 |
|
* TOTAL PTOM |
79,47 |
4,22 |
2,26 |
0,29 |
22,49 |
6,00 |
0,69 |
8,00 |
|
|
43,96 |
123,42 |
|
123,43 |
|
* TOTAL ACP + PTOM |
4 905,47 |
202,66 |
405,39 |
84,51 |
774,64 |
1 589,83 |
343,54 |
304,98 |
1 148,54 |
40,00 |
4 894,10 |
9 799,57 |
50,00 |
9 849,57 |
Table 3.2.8
7th EDF
Payments annual 2004
SITUATION BY INSTRUMENT AND STATE
|
(million EUR) |
|||||||||||||
|
|
Lomé |
Total state |
|||||||||||
|
NIP |
Non NIP |
Total |
|||||||||||
|
Grants |
Interest subsidies |
Emergency aid |
Refugee aid |
Risk capital |
STABEX |
SYSMIN |
Transfers from others funds |
SAF |
Heavily indebted poor countries |
Total non NIP |
|||
|
ANGOLA |
13,21 |
|
|
|
|
|
|
|
|
|
|
13,21 |
13,21 |
|
BENIN |
1,64 |
|
|
|
|
|
|
2,91 |
|
|
2,91 |
4,55 |
4,55 |
|
BURKINA FASO |
2,10 |
|
- 0,01 |
|
|
|
1,17 |
|
|
|
1,15 |
3,26 |
3,26 |
|
BOTSWANA |
0,07 |
|
|
|
|
|
|
0,22 |
|
|
0,22 |
0,29 |
0,29 |
|
BURUNDI |
- 1,86 |
|
|
|
|
- 9,03 |
|
|
|
|
- 9,03 |
- 10,89 |
- 10,89 |
|
CENTRAFRIQUE |
0,13 |
|
|
|
|
|
|
- 0,12 |
|
|
- 0,12 |
0,00 |
0,00 |
|
TCHAD |
- 0,34 |
|
|
|
|
|
|
|
|
|
|
- 0,34 |
- 0,34 |
|
CAMEROUN |
1,72 |
|
|
|
|
|
|
0,04 |
|
|
0,04 |
1,76 |
1,76 |
|
CONGO |
3,98 |
|
|
|
|
|
|
|
|
|
|
3,98 |
3,98 |
|
COMORES |
0,62 |
|
|
|
|
|
|
|
|
|
|
0,62 |
0,62 |
|
CAP VERT |
0,09 |
|
|
|
|
|
|
|
|
|
|
0,09 |
0,09 |
|
DJIBOUTI |
0,02 |
|
|
|
|
|
|
|
|
|
|
0,02 |
0,02 |
|
GUINEE EQUATORIALE |
2,12 |
|
|
|
|
|
|
|
|
|
|
2,12 |
2,12 |
|
ERITHREE |
2,17 |
|
|
- 0,03 |
|
|
|
|
|
|
- 0,03 |
2,14 |
2,14 |
|
ETHIOPIE |
15,94 |
|
|
|
3,63 |
|
|
|
|
|
3,63 |
19,57 |
19,57 |
|
GABON |
0,41 |
|
|
|
|
|
|
|
|
|
|
0,41 |
0,41 |
|
GHANA |
4,43 |
0,37 |
|
|
|
|
|
0,02 |
|
|
0,40 |
4,83 |
4,83 |
|
GAMBIE |
|
|
|
|
|
|
|
0,03 |
|
|
0,03 |
0,03 |
0,03 |
|
GUINEE BISSAU |
- 0,21 |
|
|
|
|
|
|
0,60 |
|
|
0,60 |
0,39 |
0,39 |
|
GUINEE |
0,17 |
|
|
|
|
|
11,48 |
- 0,00 |
|
|
11,48 |
11,65 |
11,65 |
|
COTE D'IVOIRE |
0,18 |
|
|
|
|
|
|
|
|
|
|
0,18 |
0,18 |
|
KENYA |
25,68 |
|
|
|
|
|
|
0,91 |
|
|
0,91 |
26,59 |
26,59 |
|
LIBERIA |
|
|
|
0,12 |
|
|
|
0,02 |
|
|
0,14 |
0,14 |
0,14 |
|
LESOTHO |
0,30 |
0,30 |
|
|
|
|
|
0,07 |
|
|
0,37 |
0,67 |
0,67 |
|
MADAGASCAR |
1,69 |
|
|
|
|
|
|
0,11 |
|
|
0,11 |
1,80 |
1,80 |
|
MALAWI |
2,48 |
|
|
|
|
|
|
- 0,01 |
|
|
- 0,01 |
2,47 |
2,47 |
|
MAURICE |
0,64 |
|
|
|
|
|
|
|
|
|
|
0,64 |
0,64 |
|
MAURITANIE |
0,09 |
|
|
|
|
|
1,99 |
|
|
|
1,99 |
2,08 |
2,08 |
|
MALI |
1,74 |
|
|
|
|
|
1,94 |
|
|
|
1,94 |
3,68 |
3,68 |
|
MOZAMBIQUE |
2,98 |
|
|
|
|
|
|
|
|
|
|
2,98 |
2,98 |
|
NAMIBIE |
0,96 |
|
|
|
|
|
|
|
|
|
|
0,96 |
0,96 |
|
NIGER |
- 0,02 |
|
|
|
3,22 |
|
0,87 |
|
|
|
4,10 |
4,08 |
4,08 |
|
RWANDA |
15,27 |
|
|
|
0,73 |
|
|
- 0,01 |
|
|
0,72 |
15,99 |
15,99 |
|
SENEGAL |
0,01 |
|
|
|
|
|
|
|
|
|
|
0,01 |
0,01 |
|
SIERRA LEONE |
11,15 |
|
|
|
|
|
|
|
|
|
|
11,15 |
11,15 |
|
SOMALIE |
- |
|
|
|
|
|
|
0,10 |
|
|
0,10 |
0,10 |
0,10 |
|
SAO TOME & PRINCIPE |
0,22 |
|
|
|
0,29 |
|
|
|
|
|
0,29 |
0,51 |
0,51 |
|
SWAZILAND |
0,16 |
|
|
|
|
|
|
|
|
|
|
0,16 |
0,16 |
|
TANZANIE |
1,53 |
|
|
- 0,05 |
|
|
|
2,09 |
|
|
2,04 |
3,57 |
3,57 |
|
TOGO |
2,94 |
|
|
|
|
|
|
0,24 |
|
|
0,24 |
3,18 |
3,18 |
|
OUGANDA |
2,00 |
|
|
|
|
|
|
|
0,12 |
|
0,12 |
2,12 |
2,12 |
|
NIGERIA |
20,65 |
|
|
|
|
|
|
|
|
|
|
20,65 |
20,65 |
|
ZAMBIE |
|
|
- 0,41 |
|
|
|
|
|
|
|
- 0,41 |
- 0,41 |
- 0,41 |
|
ZIMBABWE |
1,83 |
|
|
|
|
|
|
0,31 |
|
|
0,31 |
2,13 |
2,13 |
|
REP. DEMOCRATIQUE CONGO |
10,94 |
|
|
|
|
|
|
2,82 |
|
|
2,82 |
13,76 |
13,76 |
|
* TOTAL AFRIQUE |
149,84 |
0,67 |
- 0,42 |
0,04 |
7,87 |
- 9,03 |
17,45 |
10,34 |
0,12 |
|
27,05 |
176,89 |
176,89 |
|
BAHAMAS |
0,15 |
|
|
|
|
|
|
0,07 |
|
|
0,07 |
0,22 |
0,22 |
|
REPUBLIQUE DOMINICAINE |
1,70 |
|
|
|
|
|
2,34 |
|
|
|
2,34 |
4,04 |
4,04 |
|
DOMINIQUE |
0,76 |
|
|
|
|
|
|
|
|
|
|
0,76 |
0,76 |
|
GUYANE (ETAT) |
0,02 |
|
|
|
|
|
|
|
|
|
|
0,02 |
0,02 |
|
HAITI |
0,64 |
|
|
|
|
|
|
|
|
|
|
0,64 |
0,64 |
|
JAMAIQUE |
0,41 |
|
|
|
|
|
0,39 |
0,06 |
|
|
0,45 |
0,86 |
0,86 |
|
SAINTE LUCIE |
0,02 |
|
|
|
|
|
|
|
|
|
|
0,02 |
0,02 |
|
SURINAME |
0,29 |
|
|
|
|
|
|
- 0,03 |
|
|
- 0,03 |
0,25 |
0,25 |
|
TRINITE & TOBAGO |
- 1,05 |
|
|
|
1,00 |
|
|
|
|
|
1,00 |
- 0,05 |
- 0,05 |
|
* TOTAL CARAIBES |
2,93 |
|
|
|
1,00 |
|
2,73 |
0,10 |
|
|
3,83 |
6,76 |
6,76 |
|
FIDJI |
5,04 |
|
|
|
|
|
|
|
|
|
|
5,04 |
5,04 |
|
KIRIBATI |
0,93 |
|
|
|
0,20 |
|
|
|
|
|
0,20 |
1,13 |
1,13 |
|
PAPOUASIE NOUVELLE GUINEE |
- 0,66 |
|
|
|
|
|
|
|
|
|
|
- 0,66 |
- 0,66 |
|
SALOMON |
0,37 |
|
|
|
|
|
|
|
|
|
|
0,37 |
0,37 |
|
SAMOA |
0,03 |
|
|
|
1,00 |
|
|
|
|
|
1,00 |
1,03 |
1,03 |
|
* TOTAL PACIFIQUE |
5,71 |
|
|
|
1,20 |
|
|
|
|
|
1,20 |
6,91 |
6,91 |
|
COOPERATION REGIONALE ACP |
37,10 |
|
|
|
|
|
|
- 0,32 |
|
|
- 0,32 |
36,78 |
36,78 |
|
* TOTAL COOPER. REGIONALE ACP |
37,10 |
|
|
|
|
|
|
- 0,32 |
|
|
- 0,32 |
36,78 |
36,78 |
|
FRAIS ADMINISTR. & FINANCIERS |
0,01 |
|
|
|
|
|
|
|
|
|
|
0,01 |
0,01 |
|
* TOTAL ACP |
195,59 |
0,67 |
- 0,42 |
0,04 |
10,07 |
- 9,03 |
20,18 |
10,12 |
0,12 |
|
31,76 |
227,35 |
227,35 |
|
NOUVELLE CALEDONIE |
2,52 |
|
|
|
|
|
0,15 |
0,05 |
|
|
0,20 |
2,72 |
2,72 |
|
WALLIS & FUTUNA |
0,50 |
|
|
|
|
|
|
|
|
|
|
0,50 |
0,50 |
|
* TOTAL PTOM FRANCAIS |
3,02 |
|
|
|
|
|
0,15 |
0,05 |
|
|
0,20 |
3,22 |
3,22 |
|
ANTILLES NEERLANDAISES |
1,97 |
|
|
|
|
|
|
- 0,08 |
|
|
- 0,08 |
1,89 |
1,89 |
|
* TOTAL PTOM NEERLANDAIS |
1,97 |
|
|
|
|
|
|
- 0,08 |
|
|
- 0,08 |
1,89 |
1,89 |
|
ANGUILLA |
0,14 |
|
|
|
|
|
|
|
|
|
|
0,14 |
0,14 |
|
MONTSERRAT |
2,34 |
|
|
|
|
|
|
|
|
|
|
2,34 |
2,34 |
|
* TOTAL PTOM BRITANNIQUES |
2,48 |
|
|
|
|
|
|
|
|
|
|
2,48 |
2,48 |
|
* TOTAL PTOM |
7,47 |
|
|
|
|
|
0,15 |
- 0,03 |
|
|
0,12 |
7,59 |
7,59 |
|
* TOTAL ACP + PTOM |
203,06 |
0,67 |
- 0,42 |
0,04 |
10,07 |
- 9,03 |
20,33 |
10,09 |
0,12 |
|
31,88 |
234,94 |
234,94 |
Table 3.3.1
8th EDF
Cumulative 2004
GLOBAL SITUATION BY STATE
|
(million EUR) |
||||||||||||
|
|
Lomé |
|||||||||||
|
NIP |
National indicative programmes |
Other aid |
Total |
|||||||||
|
Decisions |
as % of NIP |
Payments |
as % of NIP |
Decisions |
as % of NIP |
Payments |
as % of NIP |
Decisions |
Assigned funds |
Payments |
||
|
ANGOLA |
87,84 |
87,84 |
100 |
37,55 |
43 |
27,56 |
31 |
21,65 |
25 |
115,41 |
83,03 |
59,19 |
|
BENIN |
119,91 |
119,91 |
100 |
93,63 |
78 |
71,88 |
60 |
59,49 |
50 |
191,79 |
178,97 |
153,12 |
|
BURKINA FASO |
179,65 |
179,65 |
100 |
116,50 |
65 |
105,60 |
59 |
100,55 |
56 |
422,15 |
387,68 |
307,14 |
|
BOTSWANA |
37,87 |
37,87 |
100 |
12,11 |
32 |
2,21 |
6 |
0,11 |
0 |
73,96 |
46,86 |
12,61 |
|
BURUNDI |
13,08 |
13,08 |
100 |
13,06 |
100 |
51,86 |
397 |
31,55 |
241 |
64,94 |
64,55 |
44,61 |
|
CENTRAFRIQUE |
61,82 |
61,82 |
100 |
43,34 |
70 |
29,62 |
48 |
29,19 |
47 |
91,43 |
82,87 |
72,53 |
|
TCHAD |
150,40 |
150,40 |
100 |
95,60 |
64 |
76,29 |
51 |
67,26 |
45 |
226,69 |
201,66 |
162,87 |
|
CAMEROUN |
140,11 |
140,11 |
100 |
74,70 |
53 |
134,66 |
96 |
109,66 |
78 |
274,77 |
222,21 |
184,35 |
|
CONGO |
21,99 |
21,99 |
100 |
2,05 |
9 |
5,00 |
23 |
3,70 |
17 |
26,98 |
8,28 |
5,74 |
|
COMORES |
12,48 |
12,22 |
98 |
7,46 |
60 |
5,66 |
45 |
5,60 |
45 |
17,88 |
15,06 |
13,06 |
|
CAP VERT |
32,80 |
32,80 |
100 |
14,73 |
45 |
26,86 |
82 |
22,58 |
69 |
59,66 |
51,46 |
37,32 |
|
DJIBOUTI |
19,62 |
19,62 |
100 |
11,41 |
58 |
11,00 |
56 |
9,98 |
51 |
30,62 |
26,12 |
21,39 |
|
GUINEE EQUATORIALE |
4,37 |
4,37 |
100 |
1,25 |
29 |
0,79 |
18 |
0,79 |
18 |
5,17 |
3,44 |
2,05 |
|
ERITHREE |
2,99 |
2,99 |
100 |
|
0 |
20,40 |
682 |
18,33 |
613 |
23,39 |
22,27 |
18,33 |
|
ETHIOPIE |
248,71 |
248,71 |
100 |
37,10 |
15 |
198,51 |
80 |
156,06 |
63 |
477,22 |
290,02 |
193,20 |
|
GABON |
37,47 |
37,47 |
100 |
31,88 |
85 |
40,90 |
109 |
35,69 |
95 |
113,37 |
77,64 |
70,33 |
|
GHANA |
129,85 |
129,85 |
100 |
61,39 |
47 |
105,29 |
81 |
94,85 |
73 |
275,14 |
229,04 |
157,43 |
|
GAMBIE |
22,02 |
22,02 |
100 |
14,72 |
67 |
17,81 |
81 |
12,40 |
56 |
39,83 |
36,48 |
27,13 |
|
GUINEE BISSAU |
48,51 |
48,51 |
100 |
20,64 |
43 |
13,90 |
29 |
4,09 |
8 |
97,41 |
46,70 |
27,67 |
|
GUINEE |
146,63 |
146,63 |
100 |
54,77 |
37 |
44,44 |
30 |
21,36 |
15 |
191,07 |
127,32 |
76,13 |
|
COTE D'IVOIRE |
61,78 |
61,78 |
100 |
11,35 |
18 |
109,62 |
177 |
60,08 |
97 |
171,39 |
127,51 |
71,43 |
|
KENYA |
84,63 |
84,63 |
100 |
18,21 |
22 |
128,48 |
152 |
115,21 |
136 |
213,12 |
178,08 |
133,42 |
|
LIBERIA |
|
|
|
|
|
25,00 |
|
11,47 |
|
25,00 |
19,73 |
11,47 |
|
LESOTHO |
54,25 |
54,25 |
100 |
41,41 |
76 |
19,60 |
36 |
15,87 |
29 |
73,84 |
66,29 |
57,28 |
|
MADAGASCAR |
171,37 |
171,37 |
100 |
100,05 |
58 |
112,36 |
66 |
92,98 |
54 |
338,73 |
322,88 |
248,03 |
|
MALAWI |
193,77 |
193,77 |
100 |
153,87 |
79 |
85,76 |
44 |
72,44 |
37 |
314,52 |
256,69 |
229,20 |
|
MAURICE |
33,45 |
33,45 |
100 |
29,62 |
89 |
17,31 |
52 |
3,12 |
9 |
50,76 |
49,50 |
32,73 |
|
MAURITANIE |
68,93 |
68,93 |
100 |
45,30 |
66 |
81,10 |
118 |
56,23 |
82 |
195,03 |
134,28 |
101,53 |
|
MALI |
208,88 |
208,88 |
100 |
146,17 |
70 |
92,61 |
44 |
89,69 |
43 |
301,49 |
270,27 |
235,85 |
|
MOZAMBIQUE |
193,27 |
193,27 |
100 |
102,04 |
53 |
223,38 |
116 |
185,12 |
96 |
566,65 |
489,18 |
397,39 |
|
NAMIBIE |
51,71 |
51,71 |
100 |
42,92 |
83 |
24,50 |
47 |
23,10 |
45 |
76,21 |
73,86 |
66,01 |
|
NIGER |
133,24 |
133,24 |
100 |
76,44 |
57 |
44,16 |
33 |
39,86 |
30 |
233,48 |
173,54 |
137,35 |
|
RWANDA |
103,82 |
103,82 |
100 |
55,03 |
53 |
80,60 |
78 |
74,99 |
72 |
184,42 |
151,84 |
130,02 |
|
SENEGAL |
113,17 |
113,17 |
100 |
66,21 |
59 |
160,45 |
142 |
120,58 |
107 |
273,62 |
241,70 |
186,79 |
|
SEYCHELLES |
5,63 |
5,63 |
100 |
4,66 |
83 |
1,77 |
31 |
1,77 |
31 |
7,40 |
6,74 |
6,43 |
|
SIERRA LEONE |
77,55 |
77,55 |
100 |
37,51 |
48 |
35,51 |
46 |
32,52 |
42 |
113,05 |
88,00 |
70,03 |
|
SOMALIE |
50,00 |
50,00 |
100 |
26,66 |
53 |
|
|
|
|
50,00 |
44,47 |
26,66 |
|
SAO TOME & PRINCIPE |
11,49 |
11,49 |
100 |
6,98 |
61 |
4,20 |
37 |
3,71 |
32 |
15,69 |
13,64 |
10,68 |
|
SOUDAN |
|
|
|
|
|
112,30 |
|
19,22 |
|
112,30 |
111,96 |
19,22 |
|
SWAZILAND |
28,23 |
28,23 |
100 |
15,85 |
56 |
36,99 |
131 |
22,51 |
80 |
69,22 |
64,57 |
39,03 |
|
TANZANIE |
206,77 |
206,77 |
100 |
97,90 |
47 |
281,34 |
136 |
206,79 |
100 |
488,11 |
475,46 |
304,69 |
|
TOGO |
|
|
|
|
|
13,41 |
|
1,24 |
|
13,41 |
1,24 |
1,24 |
|
OUGANDA |
202,45 |
202,45 |
100 |
115,52 |
57 |
224,41 |
111 |
171,34 |
85 |
426,86 |
404,17 |
286,87 |
|
NIGERIA |
|
|
|
|
|
5,00 |
|
4,54 |
|
5,00 |
5,00 |
4,54 |
|
ZAMBIE |
145,56 |
145,56 |
100 |
107,46 |
74 |
301,08 |
207 |
270,58 |
186 |
446,64 |
407,70 |
378,04 |
|
ZIMBABWE |
102,34 |
102,34 |
100 |
52,17 |
51 |
18,31 |
18 |
15,52 |
15 |
120,64 |
92,63 |
67,69 |
|
REP. DEMOCRATIQUE CONGO |
21,86 |
21,86 |
100 |
11,93 |
55 |
30,90 |
141 |
25,75 |
118 |
52,76 |
50,53 |
37,68 |
|
* TOTAL AFRIQUE |
3 842,25 |
3 841,99 |
100 |
2 109,14 |
55 |
3 260,38 |
85 |
2 541,11 |
66 |
7 758,23 |
6 523,11 |
4 937,49 |
|
ANTIGUA-BARBUDA |
0,65 |
0,65 |
100 |
0,20 |
30 |
|
|
|
|
0,65 |
0,39 |
0,20 |
|
BARBADE |
4,89 |
4,89 |
100 |
0,74 |
15 |
4,26 |
87 |
2,72 |
56 |
9,15 |
5,49 |
3,46 |
|
BELIZE |
11,34 |
11,34 |
100 |
10,39 |
92 |
8,70 |
77 |
6,54 |
58 |
20,18 |
19,56 |
17,05 |
|
BAHAMAS |
2,20 |
2,20 |
100 |
2,20 |
100 |
|
|
|
|
2,20 |
2,20 |
2,20 |
|
REPUBLIQUE DOMINICAINE |
108,35 |
108,35 |
100 |
33,49 |
31 |
40,68 |
38 |
32,26 |
30 |
149,03 |
114,74 |
65,74 |
|
DOMINIQUE |
6,26 |
6,52 |
104 |
2,14 |
34 |
31,92 |
510 |
26,52 |
424 |
38,43 |
35,96 |
28,66 |
|
GRENADE |
1,62 |
1,62 |
100 |
0,24 |
15 |
2,84 |
176 |
2,52 |
156 |
4,46 |
3,32 |
2,76 |
|
GUYANE (ETAT) |
31,76 |
31,76 |
100 |
3,35 |
11 |
45,09 |
142 |
14,84 |
47 |
76,85 |
48,99 |
18,19 |
|
HAITI |
70,88 |
70,88 |
100 |
32,89 |
46 |
24,80 |
35 |
14,80 |
21 |
95,67 |
77,55 |
47,69 |
|
JAMAIQUE |
55,40 |
55,40 |
100 |
30,47 |
55 |
90,81 |
164 |
73,01 |
132 |
176,21 |
155,93 |
115,17 |
|
ST CHRISTOPHE (KITTS) & NEVI |
2,72 |
2,72 |
100 |
2,72 |
100 |
4,00 |
147 |
2,22 |
82 |
6,72 |
6,72 |
4,94 |
|
SAINTE LUCIE |
1,39 |
1,39 |
100 |
0,88 |
63 |
51,60 |
3 701 |
34,36 |
2 465 |
53,00 |
52,95 |
35,24 |
|
SURINAME |
22,30 |
22,30 |
100 |
6,04 |
27 |
0,24 |
1 |
0,24 |
1 |
22,55 |
10,48 |
6,28 |
|
SAINT VINCENT & GRENADINES |
2,39 |
2,39 |
100 |
1,38 |
58 |
32,45 |
1 361 |
28,58 |
1 198 |
34,84 |
34,32 |
29,96 |
|
TRINITE & TOBAGO |
9,79 |
9,79 |
100 |
2,44 |
25 |
7,78 |
79 |
3,78 |
39 |
17,57 |
14,74 |
6,22 |
|
* TOTAL CARAIBES |
331,94 |
332,20 |
100 |
129,56 |
39 |
345,18 |
104 |
242,40 |
73 |
707,52 |
583,35 |
383,77 |
|
FIDJI |
17,85 |
17,85 |
100 |
9,89 |
55 |
2,41 |
14 |
2,41 |
14 |
20,26 |
19,17 |
12,30 |
|
KIRIBATI |
11,98 |
11,98 |
100 |
4,24 |
35 |
0,78 |
7 |
0,38 |
3 |
12,76 |
7,44 |
4,62 |
|
PAPOUASIE NOUVELLE GUINEE |
48,86 |
48,86 |
100 |
22,93 |
47 |
11,62 |
24 |
10,43 |
21 |
110,49 |
50,22 |
33,92 |
|
SALOMON |
14,67 |
14,67 |
100 |
11,27 |
77 |
78,21 |
533 |
46,68 |
318 |
92,87 |
89,42 |
57,95 |
|
TONGA |
6,58 |
6,58 |
100 |
4,58 |
70 |
0,46 |
7 |
0,38 |
6 |
7,04 |
6,36 |
4,96 |
|
TUVALU |
1,90 |
1,90 |
100 |
1,87 |
98 |
0,50 |
26 |
0,00 |
0 |
2,40 |
2,40 |
1,87 |
|
VANUATU |
10,23 |
10,23 |
100 |
10,18 |
100 |
5,55 |
54 |
5,54 |
54 |
21,11 |
19,61 |
18,13 |
|
SAMOA |
14,13 |
14,13 |
100 |
14,07 |
100 |
5,03 |
36 |
5,03 |
36 |
23,52 |
21,74 |
20,76 |
|
* TOTAL PACIFIQUE |
126,21 |
126,21 |
100 |
79,01 |
63 |
104,58 |
83 |
70,86 |
56 |
290,46 |
216,36 |
154,51 |
|
REGION AFRIQUE OCCIDENTALE |
225,98 |
225,98 |
100 |
136,20 |
60 |
59,57 |
26 |
59,57 |
26 |
285,55 |
234,39 |
195,77 |
|
REGION AFRIQUE CENTRALE |
78,41 |
78,41 |
100 |
55,35 |
71 |
5,30 |
7 |
1,25 |
2 |
83,71 |
77,61 |
56,60 |
|
REGION AFRIQUE ORIENTALE |
171,88 |
171,88 |
100 |
53,20 |
31 |
|
|
|
|
171,88 |
96,24 |
53,20 |
|
REGION AFRIQUE AUSTRALE |
77,82 |
77,82 |
100 |
34,22 |
44 |
16,40 |
21 |
16,40 |
21 |
94,22 |
69,55 |
50,62 |
|
REGION DE L'OCEAN INDIEN |
14,89 |
14,89 |
100 |
7,67 |
51 |
11,00 |
74 |
4,31 |
29 |
25,89 |
23,95 |
11,98 |
|
REGION DES CARAIBES |
50,14 |
50,14 |
100 |
28,73 |
57 |
26,30 |
52 |
10,64 |
21 |
76,44 |
61,25 |
39,37 |
|
REGION DU PACIFIQUE |
34,96 |
34,96 |
100 |
18,91 |
54 |
|
|
|
|
34,96 |
34,49 |
18,91 |
|
MULTI-REGIONAL (PALOP) |
11,91 |
11,91 |
100 |
5,09 |
43 |
|
|
|
|
11,91 |
7,83 |
5,09 |
|
BUDGET INTRA ACP |
784,56 |
784,56 |
100 |
408,39 |
52 |
|
|
|
|
784,56 |
600,81 |
408,39 |
|
* TOTAL COOPER. REGIONALE ACP |
1 450,56 |
1 450,56 |
100 |
747,76 |
52 |
118,57 |
8 |
92,18 |
6 |
1 569,13 |
1 206,11 |
839,94 |
|
TOUS PAYS ACP |
|
|
|
|
|
1 167,04 |
|
1 148,51 |
|
1 167,04 |
1 165,29 |
1 148,51 |
|
FRAIS ADMINISTR. & FINANCIERS |
|
|
|
|
|
|
|
|
|
38,15 |
33,52 |
29,92 |
|
* TOTAL ACP |
5 750,95 |
5 750,95 |
100 |
3 065,47 |
53 |
4 995,75 |
87 |
4 095,06 |
71 |
11 530,53 |
9 727,75 |
7 494,13 |
|
MAYOTTE |
1,78 |
1,78 |
100 |
0,44 |
25 |
1,18 |
66 |
1,18 |
66 |
2,96 |
2,42 |
1,62 |
|
NOUVELLE CALEDONIE |
10,20 |
10,20 |
100 |
4,50 |
44 |
2,83 |
28 |
0,68 |
7 |
13,04 |
9,39 |
5,18 |
|
POLYNESIE FRANCAISE |
10,25 |
10,25 |
100 |
9,26 |
90 |
5,29 |
52 |
3,29 |
32 |
15,54 |
15,52 |
12,55 |
|
SAINT PIERRE & MIQUELON |
3,59 |
3,59 |
100 |
3,47 |
97 |
|
|
|
|
3,59 |
3,47 |
3,47 |
|
WALLIS & FUTUNA |
2,52 |
2,52 |
100 |
1,26 |
50 |
|
|
|
|
2,52 |
1,48 |
1,26 |
|
* TOTAL PTOM FRANCAIS |
28,33 |
28,33 |
100 |
18,93 |
67 |
9,31 |
33 |
5,15 |
18 |
37,64 |
32,28 |
24,08 |
|
ARUBA |
0,55 |
0,55 |
100 |
0,40 |
72 |
0,50 |
91 |
|
|
1,05 |
0,94 |
0,40 |
|
ANTILLES NEERLANDAISES |
5,38 |
5,38 |
100 |
1,05 |
19 |
|
|
|
|
5,38 |
1,98 |
1,05 |
|
* TOTAL PTOM NEERLANDAIS |
5,93 |
5,93 |
100 |
1,45 |
24 |
0,50 |
8 |
0,00 |
0 |
6,43 |
2,92 |
1,45 |
|
ANGUILLA |
1,75 |
1,75 |
100 |
0,80 |
45 |
|
|
|
|
1,75 |
0,97 |
0,80 |
|
MONTSERRAT |
2,32 |
2,32 |
100 |
1,16 |
50 |
|
|
|
|
2,32 |
1,76 |
1,16 |
|
SAINTE HELENE |
0,06 |
0,06 |
100 |
0,06 |
100 |
|
|
|
|
0,06 |
0,06 |
0,06 |
|
TURKS & CAICOS |
|
|
|
|
|
3,00 |
|
1,83 |
|
3,00 |
3,00 |
1,83 |
|
VIERGES (BRITANNIQUES) |
|
|
|
|
|
0,51 |
|
0,51 |
|
0,51 |
0,51 |
0,51 |
|
* TOTAL PTOM BRITANNIQUES |
4,14 |
4,14 |
100 |
2,02 |
49 |
3,51 |
85 |
2,34 |
57 |
7,65 |
6,31 |
4,36 |
|
COOPERATION REGIONALE PTF |
5,45 |
5,45 |
100 |
2,28 |
42 |
|
|
|
|
5,45 |
5,37 |
2,28 |
|
COOPERATION REGIONALE PTN |
1,30 |
1,30 |
100 |
0,45 |
35 |
|
|
|
|
1,30 |
0,53 |
0,45 |
|
COOPERATION REGIONALE PTU |
1,64 |
1,64 |
100 |
|
|
|
|
|
|
1,64 |
|
|
|
* COOPERATION REGIONALE PTOM |
8,38 |
8,38 |
100 |
2,73 |
33 |
|
|
|
|
8,38 |
5,90 |
2,73 |
|
* TOTAL PTOM |
46,78 |
46,78 |
100 |
25,12 |
54 |
13,32 |
28 |
7,49 |
16 |
60,11 |
47,41 |
32,62 |
|
* TOTAL ACP + PTOM |
5 797,73 |
5 797,73 |
100 |
3 090,59 |
53 |
5 009,08 |
86 |
4 102,55 |
71 |
11 590,64 |
9 775,16 |
7 526,75 |
Table 3.3.2
8th EDF
Annual 2004
GLOBAL SITUATION BY STATE
|
(million EUR) |
||||||||||||
|
|
Lomé |
|||||||||||
|
NIP |
National indicative programmes |
Other aid |
Total |
|||||||||
|
Decisions |
as % of NIP |
Payments |
as % of NIP |
Decisions |
as % of NIP |
Payments |
as % of NIP |
Decisions |
Assigned funds |
Payments |
||
|
ANGOLA |
87,84 |
|
|
8,57 |
10 |
- 0,08 |
0 |
4,29 |
5 |
- 0,08 |
12,01 |
12,86 |
|
BENIN |
119,91 |
|
|
24,23 |
20 |
- 0,30 |
0 |
0,78 |
1 |
- 0,30 |
10,06 |
25,00 |
|
BURKINA FASO |
179,65 |
- 0,35 |
0 |
21,97 |
12 |
- 3,46 |
- 2 |
4,37 |
2 |
- 3,81 |
7,55 |
65,32 |
|
BOTSWANA |
37,87 |
- 0,03 |
0 |
5,79 |
15 |
|
|
|
|
- 0,03 |
33,22 |
6,17 |
|
BURUNDI |
13,08 |
|
|
13,00 |
99 |
3,43 |
26 |
3,53 |
27 |
3,43 |
3,66 |
16,53 |
|
CENTRAFRIQUE |
61,82 |
|
|
15,59 |
25 |
0,06 |
0 |
4,54 |
7 |
- 61,47 |
10,53 |
20,12 |
|
TCHAD |
150,40 |
- 0,04 |
0 |
30,61 |
20 |
|
|
2,73 |
2 |
- 0,04 |
10,55 |
33,34 |
|
CAMEROUN |
140,11 |
|
|
29,87 |
21 |
- 0,42 |
0 |
- 1,94 |
- 1 |
- 0,42 |
11,46 |
27,93 |
|
CONGO |
21,99 |
|
|
1,43 |
7 |
|
|
0,42 |
2 |
|
1,47 |
1,85 |
|
COMORES |
12,48 |
- 0,02 |
0 |
1,57 |
13 |
0,00 |
0 |
- 0,05 |
0 |
- 0,02 |
1,66 |
1,52 |
|
CAP VERT |
32,80 |
|
|
3,39 |
10 |
- 1,00 |
- 3 |
2,70 |
8 |
- 1,00 |
- 0,22 |
6,09 |
|
DJIBOUTI |
19,62 |
|
|
4,14 |
21 |
|
|
|
|
|
1,94 |
4,14 |
|
GUINEE EQUATORIALE |
4,37 |
- 0,00 |
0 |
0,61 |
14 |
|
|
|
|
- 0,00 |
0,86 |
0,61 |
|
ERITHREE |
2,99 |
|
|
|
|
|
|
4,38 |
147 |
|
0,63 |
4,38 |
|
ETHIOPIE |
248,71 |
|
|
2,61 |
1 |
0,37 |
0 |
- 4,31 |
- 2 |
0,37 |
38,94 |
- 1,67 |
|
GABON |
37,47 |
|
|
4,72 |
13 |
- 0,18 |
0 |
1,82 |
5 |
- 0,18 |
1,81 |
8,87 |
|
GHANA |
129,85 |
- 0,10 |
0 |
10,26 |
8 |
|
|
16,55 |
13 |
- 0,10 |
29,62 |
27,47 |
|
GAMBIE |
22,02 |
|
|
2,29 |
10 |
0,09 |
0 |
- 0,82 |
- 4 |
0,09 |
0,98 |
1,46 |
|
GUINEE BISSAU |
48,51 |
|
|
2,88 |
6 |
0,03 |
0 |
- 0,28 |
- 1 |
0,03 |
15,83 |
5,54 |
|
GUINEE |
146,63 |
- 0,17 |
0 |
10,32 |
7 |
|
|
|
|
- 0,17 |
16,25 |
10,32 |
|
COTE D'IVOIRE |
61,78 |
- 30,02 |
- 49 |
2,95 |
5 |
- 5,38 |
- 9 |
- 37,37 |
- 60 |
- 35,41 |
7,87 |
- 34,42 |
|
KENYA |
84,63 |
- 0,26 |
0 |
7,69 |
9 |
0,54 |
1 |
17,32 |
20 |
0,28 |
13,54 |
25,01 |
|
LIBERIA |
|
|
|
|
|
|
|
3,70 |
|
|
5,53 |
3,70 |
|
LESOTHO |
54,25 |
- 0,11 |
0 |
4,55 |
8 |
|
|
5,57 |
10 |
- 0,11 |
2,23 |
10,12 |
|
MADAGASCAR |
171,37 |
- 7,58 |
- 4 |
37,72 |
22 |
- 8,82 |
- 5 |
7,23 |
4 |
- 16,40 |
22,86 |
44,95 |
|
MALAWI |
193,77 |
- 0,08 |
0 |
29,75 |
15 |
- 3,98 |
- 2 |
4,95 |
3 |
- 4,05 |
11,38 |
37,58 |
|
MAURICE |
33,45 |
- 5,48 |
- 16 |
3,04 |
9 |
|
|
1,89 |
6 |
- 5,48 |
- 0,07 |
4,92 |
|
MAURITANIE |
68,93 |
|
|
7,48 |
11 |
- 2,74 |
-4 |
- 10,33 |
- 15 |
- 2,74 |
6,14 |
- 2,85 |
|
MALI |
208,88 |
|
|
30,21 |
14 |
- 0,08 |
0 |
7,69 |
4 |
- 0,08 |
19,01 |
37,90 |
|
MOZAMBIQUE |
193,27 |
- 0,31 |
0 |
37,76 |
20 |
- 6,86 |
- 4 |
0,04 |
0 |
- 7,17 |
34,20 |
76,96 |
|
NAMIBIE |
51,71 |
|
|
6,58 |
13 |
- 0,67 |
- 1 |
0,51 |
1 |
- 0,67 |
4,19 |
7,09 |
|
NIGER |
133,24 |
- 0,01 |
0 |
22,25 |
17 |
|
|
|
|
- 0,01 |
32,00 |
23,63 |
|
RWANDA |
103,82 |
|
|
13,77 |
13 |
0,52 |
1 |
- 5,10 |
- 5 |
0,52 |
2,62 |
8,67 |
|
SENEGAL |
113,17 |
- 0,25 |
0 |
10,46 |
9 |
- 3,20 |
- 3 |
21,98 |
19 |
- 3,45 |
- 2,94 |
32,44 |
|
SEYCHELLES |
5,63 |
- 0,09 |
- 2 |
0,24 |
4 |
- 0,23 |
- 4 |
|
|
- 0,32 |
0,10 |
0,24 |
|
SIERRA LEONE |
77,55 |
|
|
18,59 |
24 |
0,28 |
0 |
2,92 |
4 |
0,28 |
26,93 |
21,51 |
|
SOMALIE |
50,00 |
|
|
10,10 |
20 |
|
|
|
|
|
6,79 |
10,10 |
|
SAO TOME & PRINCIPE |
11,49 |
- 0,01 |
0 |
1,35 |
12 |
|
|
0,28 |
2 |
- 0,01 |
- 0,25 |
1,62 |
|
SOUDAN |
|
|
|
|
|
5,93 |
|
|
|
5,93 |
5,58 |
|
|
SWAZILAND |
28,23 |
- 0,06 |
0 |
5,69 |
20 |
- 3,37 |
- 12 |
3,02 |
11 |
- 3,43 |
7,32 |
9,38 |
|
TANZANIE |
206,77 |
- 0,18 |
0 |
43,78 |
21 |
- 4,97 |
- 2 |
- 0,10 |
0 |
- 5,15 |
17,09 |
43,68 |
|
OUGANDA |
202,45 |
- 0,03 |
0 |
58,04 |
29 |
2,77 |
1 |
- 4,97 |
- 2 |
2,74 |
124,32 |
53,07 |
|
NIGERIA |
|
|
|
|
|
|
|
0,77 |
|
|
|
0,77 |
|
ZAMBIE |
145,56 |
- 1,89 |
- 1 |
11,15 |
8 |
- 9,16 |
- 6 |
38,25 |
26 |
- 11,05 |
13,10 |
49,40 |
|
ZIMBABWE |
102,34 |
- 0,89 |
- 1 |
16,05 |
16 |
- 2,26 |
- 2 |
- 2,52 |
- 2 |
- 3,15 |
15,79 |
13,53 |
|
REP. DEMOCRATIQUE CONGO |
21,86 |
|
|
4,80 |
22 |
- 0,07 |
0 |
5,13 |
23 |
- 0,07 |
6,33 |
9,93 |
|
* TOTAL AFRIQUE |
3 842,25 |
- 47,96 |
- 1 |
577,84 |
15 |
- 43,20 |
- 1 |
99,55 |
3 |
- 152,69 |
590,47 |
766,78 |
|
ANTIGUA-BARBUDA |
0,65 |
|
|
0,13 |
19 |
|
|
|
|
|
0,16 |
0,13 |
|
BARBADE |
4,89 |
- 1,40 |
- 29 |
0,34 |
7 |
- 0,91 |
- 19 |
1,61 |
33 |
- 2,31 |
- 0,24 |
1,96 |
|
BELIZE |
11,34 |
- 0,10 |
- 1 |
0,19 |
2 |
|
|
|
|
- 0,10 |
0,08 |
0,23 |
|
REPUBLIQUE DOMINICAINE |
108,35 |
- 0,08 |
0 |
10,49 |
10 |
- 1,12 |
- 1 |
- 0,15 |
0 |
- 1,20 |
17,68 |
10,34 |
|
DOMINIQUE |
6,26 |
|
|
1,56 |
25 |
0,48 |
8 |
- 4,31 |
- 69 |
0,48 |
2,89 |
- 2,74 |
|
GRENADE |
1,62 |
- 0,01 |
- 1 |
0,12 |
8 |
0,03 |
2 |
- 0,29 |
- 18 |
0,02 |
0,03 |
- 0,17 |
|
GUYANE (ETAT) |
31,76 |
- 0,07 |
0 |
0,93 |
3 |
|
|
1,12 |
4 |
- 0,07 |
4,70 |
2,05 |
|
HAITI |
70,88 |
- 0,07 |
0 |
13,61 |
19 |
0,22 |
0 |
0,22 |
0 |
0,16 |
13,69 |
13,83 |
|
JAMAIQUE |
55,40 |
|
|
2,35 |
4 |
- 0,47 |
- 1 |
2,48 |
4 |
- 0,47 |
27,98 |
16,46 |
|
ST CHRISTOPHE (KITTS) & NEVI |
2,72 |
|
|
|
|
|
|
0,35 |
13 |
|
|
0,35 |
|
SAINTE LUCIE |
1,39 |
|
|
0,32 |
23 |
1,26 |
90 |
- 12,15 |
- 871 |
1,26 |
1,99 |
- 11,82 |
|
SURINAME |
22,30 |
|
|
1,57 |
7 |
|
|
|
|
- |
0,78 |
1,57 |
|
SAINT VINCENT & GRENADINES |
2,39 |
|
|
0,66 |
28 |
0,36 |
15 |
- 3,50 |
- 147 |
0,36 |
0,42 |
- 2,84 |
|
TRINITE & TOBAGO |
9,79 |
- 0,03 |
0 |
0,61 |
6 |
|
|
|
|
- 0,03 |
2,33 |
0,61 |
|
* TOTAL CARAIBES |
329,73 |
- 1,75 |
- 1 |
32,88 |
10 |
- 0,14 |
0 |
- 14,62 |
- 4 |
- 1,89 |
72,50 |
29,94 |
|
FIDJI |
17,85 |
|
|
6,28 |
35 |
- 0,01 |
0 |
0,08 |
0 |
- 0,01 |
9,97 |
6,36 |
|
KIRIBATI |
11,98 |
|
|
1,70 |
14 |
|
|
0,10 |
1 |
|
1,56 |
1,80 |
|
PAPOUASIE NOUVELLE GUINEE |
48,86 |
|
|
8,67 |
18 |
0,06 |
0 |
- 0,58 |
- 1 |
0,06 |
9,25 |
8,66 |
|
SALOMON |
14,67 |
|
|
1,66 |
11 |
2,83 |
19 |
- 26,67 |
- 182 |
2,83 |
2,49 |
- 25,01 |
|
TONGA |
6,58 |
|
|
1,91 |
29 |
0,01 |
0 |
- 0,08 |
- 1 |
0,01 |
0,74 |
1,83 |
|
TUVALU |
1,90 |
|
|
0,02 |
1 |
|
|
|
|
|
0,53 |
0,02 |
|
VANUATU |
10,23 |
- 0,21 |
- 2 |
0,12 |
1 |
|
|
0,01 |
0 |
- 0,21 |
1,20 |
1,11 |
|
SAMOA |
14,13 |
|
|
0,20 |
1 |
|
|
|
|
|
1,13 |
1,41 |
|
* TOTAL PACIFIQUE |
126,21 |
- 0,21 |
0 |
20,57 |
16 |
2,89 |
2 |
- 27,14 |
- 22 |
2,68 |
26,86 |
- 3,83 |
|
REGION AFRIQUE OCCIDENTALE |
225,98 |
- 1,76 |
- 1 |
33,18 |
15 |
|
|
|
|
- 1,76 |
15,86 |
33,18 |
|
REGION AFRIQUE CENTRALE |
78,41 |
|
|
13,96 |
18 |
|
|
|
|
- 8,50 |
2,98 |
13,96 |
|
REGION AFRIQUE ORIENTALE |
171,88 |
- 0,07 |
0 |
22,82 |
13 |
|
|
|
|
- 0,07 |
41,44 |
22,82 |
|
REGION AFRIQUE AUSTRALE |
77,82 |
|
|
8,72 |
11 |
|
|
|
|
|
17,65 |
8,72 |
|
REGION DE L'OCEAN INDIEN |
14,89 |
- 1,05 |
- 7 |
1,86 |
12 |
|
|
0,50 |
3 |
- 1,05 |
4,17 |
2,35 |
|
REGION DES CARAIBES |
50,14 |
- 0,04 |
0 |
5,42 |
11 |
|
|
0,77 |
2 |
- 0,04 |
7,94 |
6,19 |
|
REGION DU PACIFIQUE |
34,96 |
- 0,01 |
0 |
8,06 |
23 |
|
|
|
|
- 0,01 |
1,04 |
8,06 |
|
MULTI-REGIONAL (PALOP) |
11,91 |
- 0,07 |
- 1 |
1,75 |
15 |
|
|
|
|
- 0,07 |
1,83 |
1,75 |
|
BUDGET INTRA ACP |
784,56 |
- 2,02 |
0 |
61,00 |
8 |
|
|
|
|
- 2,02 |
63,19 |
61,00 |
|
* TOTAL COOPER. REGIONALE ACP |
1 450,56 |
- 5,02 |
0 |
156,77 |
11 |
|
|
1,27 |
0 |
- 13,52 |
156,10 |
158,04 |
|
TOUS PAYS ACP |
|
|
|
|
|
- 5,52 |
|
3,04 |
|
- 5,52 |
- 5,51 |
3,04 |
|
FRAIS ADMINISTR. & FINANCIERS |
|
|
|
|
|
|
|
|
|
|
6,74 |
16,44 |
|
* TOTAL ACP |
5 748,75 |
- 54,93 |
- 1 |
788,06 |
14 |
- 45,97 |
- 1 |
62,10 |
1 |
- 170,94 |
847,17 |
970,41 |
|
MAYOTTE |
1,78 |
|
|
0,01 |
1 |
|
|
|
|
|
0,02 |
0,01 |
|
NOUVELLE CALEDONIE |
10,20 |
|
|
3,52 |
35 |
|
|
0,31 |
3 |
|
0,67 |
3,83 |
|
POLYNESIE FRANCAISE |
10,25 |
|
|
3,69 |
36 |
- 0,26 |
- 3 |
2,06 |
20 |
- 0,26 |
- 0,26 |
5,75 |
|
SAINT PIERRE & MIQUELON |
3,59 |
|
|
0,58 |
16 |
|
|
|
|
|
- 0,05 |
0,58 |
|
WALLIS & FUTUNA |
2,52 |
|
|
0,42 |
17 |
|
|
|
|
|
0,38 |
0,42 |
|
* TOTAL PTOM FRANCAIS |
28,33 |
|
|
8,23 |
29 |
- 0,26 |
- 1 |
2,36 |
8 |
- 0,26 |
0,75 |
10,60 |
|
ARUBA |
0,55 |
- 0,01 |
- 3 |
0,15 |
28 |
- 0,26 |
- 48 |
|
|
- 0,28 |
- 0,27 |
0,15 |
|
ANTILLES NEERLANDAISES |
5,38 |
- 0,07 |
- 1 |
0,42 |
8 |
|
|
|
|
- 0,07 |
1,20 |
0,42 |
|
* TOTAL PTOM NEERLANDAIS |
5,93 |
- 0,09 |
- 1 |
0,57 |
10 |
- 0,26 |
- 4 |
|
|
- 0,35 |
0,93 |
0,57 |
|
ANGUILLA |
1,75 |
|
|
0,64 |
37 |
|
|
|
|
|
0,62 |
0,64 |
|
MONTSERRAT |
2,32 |
|
|
1,08 |
46 |
|
|
|
|
|
0,03 |
1,08 |
|
SAINTE HELENE |
0,06 |
- 0,02 |
- 25 |
|
|
|
|
|
|
- 0,02 |
- 0,00 |
- |
|
TURKS & CAICOS |
|
|
|
|
|
|
|
1,00 |
|
|
|
1,00 |
|
* TOTAL PTOM BRITANNIQUES |
4,14 |
- 0,02 |
0 |
1,72 |
42 |
|
|
1,00 |
24 |
- 0,02 |
0,64 |
2,72 |
|
COOPERATION REGIONALE PTF |
5,45 |
|
|
0,90 |
17 |
|
|
|
|
|
- 0,01 |
0,90 |
|
COOPERATION REGIONALE PTN |
1,30 |
|
|
0,14 |
11 |
|
|
|
|
|
- 0,11 |
0,14 |
|
* COOPERATION REGIONALE PTOM |
6,74 |
|
|
1,04 |
15 |
|
|
|
|
0,00 |
- 0,12 |
1,04 |
|
TOUS PTOM |
|
|
|
|
|
- 0,70 |
|
|
|
- 0,70 |
- 0,70 |
|
|
* TOTAL PTOM |
45,14 |
- 0,10 |
|
11,56 |
26 |
- 1,23 |
- 3 |
3,36 |
7 |
- 1,33 |
1,51 |
14,92 |
|
* TOTAL ACP + PTOM |
5 793,89 |
- 55,03 |
- 1 |
799,62 |
14 |
- 47,20 |
- 1 |
65,46 |
1 |
- 172,26 |
848,67 |
985,34 |
Table 3.3.3
8th EDF
Decisions — Cumulative 2004
SITUATION BY INSTRUMENT AND STATE
|
(million EUR) |
||||||||||||||||
|
|
Lomé |
Cotonou |
Total state |
|||||||||||||
|
NIP |
Non NIP |
Interests |
Total |
Envelope A |
Envelope B |
Total |
||||||||||
|
Grants |
Interest subsidies |
Emergency aid |
Refugee aid |
Risk capital |
STABEX |
SYSMIN |
SAF |
Heavily indebted poor countries |
Total non NIP |
|||||||
|
ANGOLA |
87,84 |
|
11,26 |
16,30 |
|
|
|
|
|
27,56 |
|
115,41 |
|
|
|
115,41 |
|
BENIN |
119,91 |
|
|
|
16,10 |
1,02 |
|
54,76 |
|
71,88 |
|
191,79 |
|
|
|
191,79 |
|
BURKINA FASO |
179,65 |
|
0,10 |
|
14,00 |
1,51 |
|
89,99 |
|
105,60 |
|
285,25 |
136,90 |
|
136,90 |
422,15 |
|
BOTSWANA |
37,87 |
2,10 |
|
|
|
|
0,11 |
|
|
2,21 |
|
40,08 |
3,88 |
30,00 |
33,88 |
73,96 |
|
BURUNDI |
13,08 |
|
|
25,00 |
|
17,26 |
|
9,60 |
|
51,86 |
|
64,94 |
|
|
|
64,94 |
|
CENTRAFRIQUE |
61,82 |
|
0,41 |
|
|
6,31 |
|
22,90 |
|
29,62 |
|
91,43 |
|
|
|
91,43 |
|
TCHAD |
150,40 |
|
0,89 |
|
22,30 |
|
|
53,10 |
|
76,29 |
|
226,69 |
|
|
|
226,69 |
|
CAMEROUN |
140,11 |
|
|
|
73,03 |
17,12 |
|
44,51 |
|
134,66 |
|
274,77 |
|
|
|
274,77 |
|
CONGO |
21,99 |
|
|
5,00 |
|
|
|
|
|
5,00 |
|
26,98 |
|
|
|
26,98 |
|
COMORES |
12,22 |
|
0,71 |
|
|
4,94 |
|
|
|
5,66 |
|
17,88 |
|
|
|
17,88 |
|
CAP VERT |
32,80 |
2,58 |
|
|
5,00 |
0,66 |
|
18,62 |
|
26,86 |
|
59,66 |
|
|
|
59,66 |
|
DJIBOUTI |
19,62 |
|
|
2,00 |
|
|
|
9,00 |
|
11,00 |
|
30,62 |
|
|
|
30,62 |
|
GUINEE EQUATORIALE |
4,37 |
|
|
|
|
0,79 |
|
|
|
0,79 |
|
5,17 |
|
|
|
5,17 |
|
ERITHREE |
2,99 |
|
10,77 |
9,62 |
|
|
|
|
|
20,40 |
|
23,39 |
|
|
|
23,39 |
|
ETHIOPIE |
248,71 |
|
2,15 |
6,67 |
66,00 |
5,25 |
|
118,45 |
|
198,51 |
|
447,22 |
30,00 |
|
30,00 |
477,22 |
|
GABON |
37,47 |
|
|
|
32,85 |
|
0,45 |
7,60 |
|
40,90 |
|
78,37 |
|
35,00 |
35,00 |
113,37 |
|
GHANA |
129,85 |
|
|
|
26,50 |
|
|
78,79 |
|
105,29 |
|
235,14 |
|
40,00 |
40,00 |
275,14 |
|
GAMBIE |
22,02 |
|
|
|
|
4,35 |
|
13,46 |
|
17,81 |
|
39,83 |
|
|
|
39,83 |
|
GUINEE BISSAU |
48,51 |
|
2,68 |
|
|
0,32 |
|
10,90 |
|
13,90 |
|
62,41 |
35,00 |
|
35,00 |
97,41 |
|
GUINEE |
146,63 |
|
|
|
12,00 |
|
|
32,44 |
|
44,44 |
|
191,07 |
|
|
|
191,07 |
|
COTE D'IVOIRE |
61,78 |
0,33 |
|
|
|
80,12 |
|
29,17 |
|
109,62 |
|
171,39 |
|
|
|
171,39 |
|
KENYA |
84,63 |
11,69 |
4,58 |
|
37,17 |
51,05 |
|
24,00 |
|
128,48 |
|
213,12 |
|
|
|
213,12 |
|
LIBERIA |
|
|
|
25,00 |
|
|
|
|
|
25,00 |
|
25,00 |
|
|
|
25,00 |
|
LESOTHO |
54,25 |
1,10 |
|
|
|
|
|
18,50 |
|
19,60 |
|
73,84 |
|
|
|
73,84 |
|
MADAGASCAR |
171,37 |
|
1,71 |
|
45,81 |
20,12 |
|
44,73 |
|
112,36 |
|
283,73 |
55,00 |
|
55,00 |
338,73 |
|
MALAWI |
193,77 |
|
1,40 |
|
23,01 |
11,42 |
|
49,92 |
|
85,76 |
|
279,52 |
35,00 |
|
35,00 |
314,52 |
|
MAURICE |
33,45 |
15,31 |
|
|
2,00 |
|
|
|
|
17,31 |
|
50,76 |
|
|
|
50,76 |
|
MAURITANIE |
68,93 |
3,92 |
|
0,22 |
30,08 |
17,39 |
0,15 |
29,34 |
|
81,10 |
|
150,03 |
|
45,00 |
45,00 |
195,03 |
|
MALI |
208,88 |
|
4,66 |
|
5,70 |
|
|
82,25 |
|
92,61 |
|
301,49 |
|
|
|
301,49 |
|
MOZAMBIQUE |
193,27 |
6,09 |
|
|
85,31 |
|
|
131,98 |
|
223,38 |
|
416,65 |
150,00 |
|
150,00 |
566,65 |
|
NAMIBIE |
51,71 |
18,83 |
|
1,24 |
4,23 |
|
0,20 |
|
|
24,50 |
|
76,21 |
|
|
|
76,21 |
|
NIGER |
133,24 |
|
0,28 |
|
|
|
0,14 |
43,74 |
|
44,16 |
|
177,40 |
1,08 |
55,00 |
56,08 |
233,48 |
|
RWANDA |
103,82 |
|
|
|
|
25,21 |
|
55,40 |
|
80,60 |
|
184,42 |
|
|
|
184,42 |
|
SENEGAL |
113,17 |
4,12 |
|
|
50,41 |
38,45 |
0,46 |
67,00 |
|
160,45 |
|
273,62 |
|
|
|
273,62 |
|
SEYCHELLES |
5,63 |
|
|
|
1,77 |
|
|
|
|
1,77 |
|
7,40 |
|
|
|
7,40 |
|
SIERRA LEONE |
77,55 |
|
|
|
|
5,11 |
|
30,40 |
|
35,51 |
|
113,05 |
|
|
|
113,05 |
|
SOMALIE |
50,00 |
|
|
|
|
|
|
|
|
|
|
50,00 |
|
|
|
50,00 |
|
SAO TOME & PRINCIPE |
11,49 |
|
|
|
|
|
|
4,20 |
|
4,20 |
|
15,69 |
|
|
|
15,69 |
|
SOUDAN |
|
|
19,22 |
|
|
93,09 |
|
|
|
112,30 |
|
112,30 |
|
|
|
112,30 |
|
SWAZILAND |
28,23 |
8,43 |
|
|
28,56 |
|
|
|
|
36,99 |
|
65,22 |
4,00 |
|
4,00 |
69,22 |
|
TANZANIE |
206,77 |
|
|
4,00 |
106,72 |
33,32 |
|
137,30 |
|
281,34 |
|
488,11 |
|
|
|
488,11 |
|
TOGO |
|
|
|
|
|
13,41 |
|
|
|
13,41 |
|
13,41 |
|
|
|
13,41 |
|
OUGANDA |
202,45 |
|
1,70 |
|
93,30 |
34,64 |
|
94,77 |
|
224,41 |
|
426,86 |
|
|
|
426,86 |
|
NIGERIA |
|
|
|
|
5,00 |
|
|
|
|
5,00 |
|
5,00 |
|
|
|
5,00 |
|
ZAMBIE |
145,56 |
|
3,64 |
|
103,50 |
|
97,70 |
96,24 |
|
301,08 |
|
446,64 |
|
|
|
446,64 |
|
ZIMBABWE |
102,34 |
|
|
|
3,25 |
14,91 |
0,15 |
|
|
18,31 |
|
120,64 |
|
|
|
120,64 |
|
REP. DEMOCRATIQUE CONGO |
21,86 |
|
1,92 |
23,48 |
|
|
|
5,50 |
|
30,90 |
|
52,76 |
|
|
|
52,76 |
|
* TOTAL AFRIQUE |
3 841,99 |
74,50 |
68,08 |
118,54 |
893,59 |
497,77 |
99,36 |
1 508,55 |
|
3 260,38 |
|
7 102,37 |
450,86 |
205,00 |
655,86 |
7 758,23 |
|
ANTIGUA-BARBUDA |
0,65 |
|
|
|
|
|
|
|
|
|
|
0,65 |
|
|
|
0,65 |
|
BARBADE |
4,89 |
4,26 |
|
|
|
|
|
|
|
4,26 |
|
9,15 |
|
|
|
9,15 |
|
BELIZE |
11,34 |
|
|
|
8,70 |
|
|
|
|
8,70 |
|
20,04 |
0,14 |
|
0,14 |
20,18 |
|
BAHAMAS |
2,20 |
|
|
|
|
|
|
|
|
|
|
2,20 |
|
|
|
2,20 |
|
REPUBLIQUE DOMINICAINE |
108,35 |
9,05 |
0,17 |
|
30,98 |
|
0,48 |
|
|
40,68 |
|
149,03 |
|
|
|
149,03 |
|
DOMINIQUE |
6,52 |
|
|
|
3,00 |
28,92 |
|
|
|
31,92 |
|
38,43 |
|
|
|
38,43 |
|
GRENADE |
1,62 |
|
|
|
|
2,84 |
|
|
|
2,84 |
|
4,46 |
|
|
|
4,46 |
|
GUYANE (ETAT) |
31,76 |
|
|
|
21,90 |
|
12,50 |
10,69 |
|
45,09 |
|
76,85 |
|
|
|
76,85 |
|
HAITI |
70,88 |
|
|
|
10,00 |
3,10 |
|
11,70 |
|
24,80 |
|
95,67 |
|
|
|
95,67 |
|
JAMAIQUE |
55,40 |
6,41 |
|
|
32,00 |
9,40 |
|
43,00 |
|
90,81 |
|
146,21 |
30,00 |
|
30,00 |
176,21 |
|
ST CHRISTOPHE (KITTS) & NEVI |
2,72 |
|
|
|
4,00 |
|
|
|
|
4,00 |
|
6,72 |
|
|
|
6,72 |
|
SAINTE LUCIE |
1,39 |
0,84 |
|
|
3,00 |
47,77 |
|
|
|
51,60 |
|
53,00 |
|
|
|
53,00 |
|
SURINAME |
22,30 |
0,24 |
|
|
|
|
|
|
|
0,24 |
|
22,55 |
|
|
|
22,55 |
|
SAINT VINCENT & GRENADINES |
2,39 |
0,28 |
|
|
|
32,17 |
|
|
|
32,45 |
|
34,84 |
|
|
|
34,84 |
|
TRINITE & TOBAGO |
9,79 |
0,78 |
|
|
7,00 |
|
|
|
|
7,78 |
|
17,57 |
|
|
|
17,57 |
|
* TOTAL CARAIBES |
332,20 |
21,86 |
0,17 |
|
120,58 |
124,19 |
12,98 |
65,39 |
|
345,18 |
|
677,38 |
30,14 |
0,00 |
30,14 |
707,52 |
|
FIDJI |
17,85 |
|
0,41 |
|
2,00 |
|
|
|
|
2,41 |
|
20,26 |
|
|
|
20,26 |
|
KIRIBATI |
11,98 |
|
|
|
0,50 |
0,28 |
|
|
|
0,78 |
|
12,76 |
|
|
|
12,76 |
|
PAPOUASIE NOUVELLE GUINEE |
48,86 |
|
0,08 |
|
|
0,64 |
0,50 |
10,40 |
|
11,62 |
|
60,49 |
|
50,00 |
50,00 |
110,49 |
|
SALOMON |
14,67 |
|
|
|
|
74,01 |
|
4,20 |
|
78,21 |
|
92,87 |
|
|
|
92,87 |
|
TONGA |
6,58 |
|
|
|
|
0,46 |
|
|
|
0,46 |
|
7,04 |
|
|
|
7,04 |
|
TUVALU |
1,90 |
|
|
|
0,50 |
0,00 |
|
|
|
0,50 |
|
2,40 |
|
|
|
2,40 |
|
VANUATU |
10,23 |
|
0,14 |
|
3,00 |
0,81 |
|
1,60 |
|
5,55 |
|
15,78 |
5,33 |
|
5,33 |
21,11 |
|
SAMOA |
14,13 |
|
|
|
5,00 |
0,03 |
|
|
|
5,03 |
|
19,17 |
4,35 |
|
4,35 |
23,52 |
|
* TOTAL PACIFIQUE |
126,21 |
|
0,64 |
|
11,00 |
76,24 |
0,50 |
16,20 |
|
104,58 |
|
230,78 |
9,68 |
50,00 |
59,68 |
290,46 |
|
REGION AFRIQUE OCCIDENTALE |
225,98 |
1,71 |
|
|
57,86 |
|
|
|
|
59,57 |
|
285,55 |
|
|
|
285,55 |
|
REGION AFRIQUE CENTRALE |
78,41 |
|
|
|
5,30 |
|
|
|
|
5,30 |
|
83,71 |
|
|
|
83,71 |
|
REGION AFRIQUE ORIENTALE |
171,88 |
|
|
|
|
|
|
|
|
|
|
171,88 |
|
|
|
171,88 |
|
REGION AFRIQUE AUSTRALE |
77,82 |
|
|
|
16,40 |
|
|
|
|
16,40 |
|
94,22 |
|
|
|
94,22 |
|
REGION DE L'OCEAN INDIEN |
14,89 |
|
|
|
11,00 |
|
|
|
|
11,00 |
|
25,89 |
|
|
|
25,89 |
|
REGION DES CARAIBES |
50,14 |
|
|
|
26,30 |
|
|
|
|
26,30 |
|
76,44 |
|
|
|
76,44 |
|
REGION DU PACIFIQUE |
34,96 |
|
|
|
|
|
|
|
|
|
|
34,96 |
|
|
|
34,96 |
|
MULTI-REGIONAL (PALOP) |
11,91 |
|
|
|
|
|
|
|
|
|
|
11,91 |
|
|
|
11,91 |
|
BUDGET INTRA ACP |
784,56 |
|
|
|
|
|
|
|
|
|
|
784,56 |
|
|
|
784,56 |
|
* TOTAL COOPER. REGIONALE ACP |
1 450,56 |
1,71 |
|
|
116,86 |
|
|
|
|
118,57 |
|
1 569,13 |
0,00 |
0,00 |
|
1 569,13 |
|
TOUS PAYS ACP |
|
6,97 |
69,64 |
|
30,43 |
|
|
|
1 060,00 |
1 167,04 |
|
1 167,04 |
|
|
|
1 167,04 |
|
FRAIS ADMINISTR. & FINANCIERS |
|
|
|
|
|
|
|
|
|
|
38,15 |
38,15 |
|
|
|
38,15 |
|
* TOTAL ACP |
5 750,95 |
105,04 |
138,53 |
118,54 |
1 172,46 |
698,21 |
112,84 |
1 590,14 |
1 060,00 |
4 995,75 |
38,15 |
10 784,85 |
490,68 |
255,00 |
745,68 |
11 530,53 |
|
MAYOTTE |
1,78 |
|
|
|
|
1,18 |
|
|
|
1,18 |
|
2,96 |
|
|
|
2,96 |
|
NOUVELLE CALEDONIE |
10,20 |
0,33 |
|
|
|
|
2,50 |
|
|
2,83 |
|
13,04 |
|
|
|
13,04 |
|
POLYNESIE FRANCAISE |
10,25 |
0,29 |
|
|
5,00 |
|
|
|
|
5,29 |
|
15,54 |
|
|
|
15,54 |
|
SAINT PIERRE & MIQUELON |
3,59 |
|
|
|
|
|
|
|
|
|
|
3,59 |
|
|
|
3,59 |
|
WALLIS & FUTUNA |
2,52 |
|
|
|
|
|
|
|
|
|
|
2,52 |
|
|
|
2,52 |
|
* TOTAL PTOM FRANCAIS |
28,33 |
0,63 |
|
|
5,00 |
1,18 |
2,50 |
|
|
9,31 |
|
37,64 |
|
|
|
37,64 |
|
ARUBA |
0,55 |
|
|
|
0,50 |
|
|
|
|
0,50 |
|
1,05 |
|
|
|
1,05 |
|
ANTILLES NEERLANDAISES |
5,38 |
|
|
|
|
|
|
|
|
|
|
5,38 |
|
|
|
5,38 |
|
* TOTAL PTOM NEERLANDAIS |
5,93 |
|
|
|
0,50 |
|
|
|
|
0,50 |
|
6,43 |
|
|
|
6,43 |
|
ANGUILLA |
1,75 |
|
|
|
|
|
|
|
|
|
|
1,75 |
|
|
|
1,75 |
|
MONTSERRAT |
2,32 |
|
|
|
|
|
|
|
|
|
|
2,32 |
|
|
|
2,32 |
|
SAINTE HELENE |
0,06 |
|
|
|
|
|
|
|
|
|
|
0,06 |
|
|
|
0,06 |
|
TURKS & CAICOS |
|
|
|
|
3,00 |
|
|
|
|
3,00 |
|
3,00 |
|
|
|
3,00 |
|
VIERGES (BRITANNIQUES) |
|
0,51 |
|
|
|
|
|
|
|
0,51 |
|
0,51 |
|
|
|
0,51 |
|
* TOTAL PTOM BRITANNIQUES |
4,14 |
0,51 |
|
|
3,00 |
|
|
|
|
3,51 |
|
7,65 |
|
|
|
7,65 |
|
COOPERATION REGIONALE PTF |
5,45 |
|
|
|
|
|
|
|
|
|
|
5,45 |
|
|
|
5,45 |
|
COOPERATION REGIONALE PTN |
1,30 |
|
|
|
|
|
|
|
|
|
|
1,30 |
|
|
|
1,30 |
|
COOPERATION REGIONALE PTU |
1,64 |
|
|
|
|
|
|
|
|
|
|
1,64 |
|
|
|
1,64 |
|
* COOPERATION REGIONALE PTOM |
8,38 |
|
|
|
|
|
|
|
|
|
|
8,38 |
|
|
|
8,38 |
|
* TOTAL PTOM |
46,78 |
1,14 |
|
|
8,50 |
1,18 |
2,50 |
|
|
13,32 |
|
60,11 |
|
|
|
60,11 |
|
* TOTAL ACP + PTOM |
5 797,73 |
106,18 |
138,53 |
118,54 |
1 180,96 |
699,39 |
115,34 |
1 590,14 |
1 060,00 |
5 009,08 |
38,15 |
10 844,96 |
490,68 |
255,00 |
745,68 |
11 590,64 |
Table 3.3.4
8th EDF
Decisions — Annual 2004
SITUATION BY INSTRUMENT AND STATE
|
(million EUR) |
||||||||||||||||
|
|
Lomé |
Cotonou |
Total state |
|||||||||||||
|
NIP |
Non NIP |
Interests |
Total |
Envelope A |
Envelope B |
Total |
||||||||||
|
Grants |
Interest subsidies |
Emergency aid |
Refugee aid |
Risk capital |
STABEX |
SYSMIN |
SAF |
Heavily indebted poor countries |
Total non NIP |
|||||||
|
ANGOLA |
|
|
- 0,08 |
|
|
|
|
|
|
- 0,08 |
|
- 0,08 |
|
|
|
- 0,08 |
|
BENIN |
|
|
|
|
|
0,05 |
|
- 0,34 |
|
- 0,30 |
|
- 0,30 |
|
|
|
- 0,30 |
|
BURKINA FASO |
- 0,35 |
|
- 0,07 |
|
|
0,07 |
|
- 3,46 |
|
- 3,46 |
|
- 3,81 |
|
|
|
- 3,81 |
|
BOTSWANA |
- 0,03 |
|
|
|
|
|
|
|
|
|
|
- 0,03 |
|
|
|
- 0,03 |
|
BURUNDI |
|
|
|
|
|
3,43 |
|
|
|
3,43 |
|
3,43 |
|
|
|
3,43 |
|
CENTRAFRIQUE |
|
|
|
|
|
0,06 |
|
|
|
0,06 |
|
0,06 |
- 61,53 |
|
- 61,53 |
- 61,47 |
|
TCHAD |
- 0,04 |
|
|
|
|
|
|
|
|
|
|
- 0,04 |
|
|
|
- 0,04 |
|
CAMEROUN |
|
- 0,74 |
|
|
- 0,17 |
0,49 |
|
|
|
- 0,42 |
|
- 0,42 |
|
|
|
- 0,42 |
|
COMORES |
- 0,02 |
|
|
|
|
0,00 |
|
|
|
0,00 |
|
- 0,02 |
|
|
|
- 0,02 |
|
CAP VERT |
|
- 1,00 |
|
|
|
|
|
|
|
- 1,00 |
|
- 1,00 |
|
|
|
- 1,00 |
|
ETHIOPIE |
|
|
|
|
|
0,37 |
|
|
|
0,37 |
|
0,37 |
|
|
|
0,37 |
|
GABON |
|
|
|
|
- 0,15 |
|
- 0,03 |
|
|
- 0,18 |
|
- 0,18 |
|
|
|
- 0,18 |
|
GHANA |
- 0,10 |
|
|
|
|
|
|
|
|
|
|
- 0,10 |
|
|
|
- 0,10 |
|
GAMBIE |
|
|
|
|
|
0,09 |
|
|
|
0,09 |
|
0,09 |
|
|
|
0,09 |
|
GUINEE BISSAU |
|
|
|
|
|
0,03 |
|
|
|
0,03 |
|
0,03 |
|
|
|
0,03 |
|
GUINEE |
- 0,17 |
|
|
|
|
|
|
|
|
|
|
- 0,17 |
|
|
|
- 0,17 |
|
COTE D'IVOIRE |
- 30,02 |
|
|
|
|
4,62 |
|
- 10,00 |
|
- 5,38 |
|
- 35,41 |
|
|
|
- 35,41 |
|
KENYA |
- 0,26 |
- 0,79 |
- 0,04 |
|
- 1,83 |
3,20 |
|
|
|
0,54 |
|
0,28 |
|
|
|
0,28 |
|
LESOTHO |
- 0,11 |
|
|
|
|
|
|
|
|
|
|
- 0,11 |
|
|
|
- 0,11 |
|
MADAGASCAR |
- 7,58 |
|
|
|
- 10,19 |
1,38 |
|
|
|
- 8,82 |
|
- 16,40 |
|
|
|
- 16,40 |
|
MALAWI |
- 0,08 |
|
- 0,10 |
|
- 3,96 |
0,08 |
|
|
|
- 3,98 |
|
- 4,05 |
|
|
|
- 4,05 |
|
MAURICE |
- 5,48 |
|
|
|
|
|
|
|
|
|
|
- 5,48 |
|
|
|
- 5,48 |
|
MAURITANIE |
|
- 2,02 |
|
|
- 2,10 |
1,53 |
|
- 0,14 |
|
- 2,74 |
|
- 2,74 |
|
|
|
- 2,74 |
|
MALI |
|
|
- 0,08 |
|
|
|
|
|
|
- 0,08 |
|
- 0,08 |
|
|
|
- 0,08 |
|
MOZAMBIQUE |
- 0,31 |
|
|
|
- 6,84 |
|
|
- 0,02 |
|
- 6,86 |
|
- 7,17 |
|
|
|
- 7,17 |
|
NAMIBIE |
|
- 0,67 |
|
|
|
|
|
|
|
- 0,67 |
|
- 0,67 |
|
|
|
- 0,67 |
|
NIGER |
- 0,01 |
|
|
|
|
|
|
|
|
|
|
- 0,01 |
|
|
|
- 0,01 |
|
RWANDA |
|
|
|
|
|
0,52 |
|
|
|
0,52 |
|
0,52 |
|
|
|
0,52 |
|
SENEGAL |
- 0,25 |
- 1,58 |
|
|
- 2,52 |
0,90 |
|
|
|
- 3,20 |
|
- 3,45 |
|
|
|
- 3,45 |
|
SEYCHELLES |
- 0,09 |
|
|
|
- 0,23 |
|
|
|
|
- 0,23 |
|
- 0,32 |
|
|
|
- 0,32 |
|
SIERRA LEONE |
|
|
|
|
|
0,28 |
|
|
|
0,28 |
|
0,28 |
|
|
|
0,28 |
|
SAO TOME & PRINCIPE |
- 0,01 |
|
|
|
|
|
|
|
|
|
|
- 0,01 |
|
|
|
- 0,01 |
|
SOUDAN |
|
|
- 0,01 |
|
|
5,94 |
|
|
|
5,93 |
|
5,93 |
|
|
|
5,93 |
|
SWAZILAND |
- 0,06 |
- 0,68 |
|
|
- 2,69 |
|
|
|
|
- 3,37 |
|
- 3,43 |
|
|
|
- 3,43 |
|
TANZANIE |
- 0,18 |
|
|
|
- 7,08 |
2,84 |
|
- 0,73 |
|
- 4,97 |
|
- 5,15 |
|
|
|
- 5,15 |
|
TOGO |
|
|
|
|
|
|
|
|
|
|
|
- |
|
|
|
0,00 |
|
OUGANDA |
- 0,03 |
|
|
|
|
2,77 |
|
|
|
2,77 |
|
2,74 |
|
|
|
2,74 |
|
ZAMBIE |
- 1,89 |
|
- 0,86 |
|
|
|
- 8,30 |
|
|
- 9,16 |
|
- 11,05 |
|
|
|
- 11,05 |
|
ZIMBABWE |
- 0,89 |
- 2,50 |
|
|
|
0,24 |
|
|
|
- 2,26 |
|
- 3,15 |
|
|
|
- 3,15 |
|
REP. DEMOCRATIQUE CONGO |
|
|
- 0,07 |
|
|
|
|
|
|
- 0,07 |
|
- 0,07 |
|
|
|
- 0,07 |
|
* TOTAL AFRIQUE |
- 47,95 |
- 9,97 |
- 1,32 |
|
- 37,77 |
28,88 |
- 8,33 |
- 14,70 |
|
- 43,20 |
|
- 91,16 |
- 61,53 |
|
- 61,53 |
- 152,69 |
|
BARBADE |
- 1,40 |
- 0,91 |
|
|
|
|
|
|
|
- 0,91 |
|
- 2,31 |
|
|
|
- 2,31 |
|
BELIZE |
- 0,10 |
|
|
|
|
|
|
|
|
|
|
- 0,10 |
|
|
|
- 0,10 |
|
REPUBLIQUE DOMINICAINE |
- 0,08 |
- 1,12 |
|
|
|
|
|
|
|
- 1,12 |
|
- 1,20 |
|
|
|
- 1,20 |
|
DOMINIQUE |
|
|
|
|
|
0,48 |
|
|
|
0,48 |
|
0,48 |
|
|
|
0,48 |
|
GRENADE |
- 0,01 |
|
|
|
|
0,03 |
|
|
|
0,03 |
|
0,02 |
|
|
|
0,02 |
|
GUYANE (ETAT) |
- 0,07 |
|
|
|
|
|
|
|
|
|
|
- 0,07 |
|
|
|
- 0,07 |
|
HAITI |
- 0,07 |
|
|
|
|
0,22 |
|
|
|
0,22 |
|
0,16 |
|
|
|
0,16 |
|
JAMAIQUE |
|
- 1,06 |
|
|
|
0,59 |
|
|
|
- 0,47 |
|
- 0,47 |
|
|
|
- 0,47 |
|
SAINTE LUCIE |
|
|
|
|
|
1,26 |
|
|
|
1,26 |
|
1,26 |
|
|
|
1,26 |
|
SAINT VINCENT & GRENADINES |
|
|
|
|
|
0,36 |
|
|
|
0,36 |
|
0,36 |
|
|
|
0,36 |
|
TRINITE & TOBAGO |
- 0,03 |
|
|
|
|
|
|
|
|
|
|
- 0,03 |
|
|
|
- 0,03 |
|
* TOTAL CARAIBES |
- 1,75 |
- 3,09 |
|
|
|
2,95 |
|
|
|
- 0,14 |
|
- 1,89 |
|
|
|
- 1,89 |
|
FIDJI |
|
|
- 0,01 |
|
|
|
|
|
|
- 0,01 |
|
- 0,01 |
|
|
|
- 0,01 |
|
PAPOUASIE NOUVELLE GUINEE |
|
|
|
|
|
0,06 |
|
|
|
0,06 |
|
0,06 |
|
|
|
0,06 |
|
SALOMON |
|
|
|
|
|
2,83 |
|
|
|
2,83 |
|
2,83 |
|
|
|
2,83 |
|
TONGA |
|
|
|
|
|
0,01 |
|
|
|
0,01 |
|
0,01 |
|
|
|
0,01 |
|
VANUATU |
- 0,21 |
|
|
|
|
|
|
|
|
|
|
- 0,21 |
|
|
|
- 0,21 |
|
* TOTAL PACIFIQUE |
- 0,21 |
|
- 0,01 |
|
|
2,90 |
|
|
|
2,89 |
|
2,68 |
|
|
|
2,68 |
|
REGION AFRIQUE OCCIDENTALE |
- 1,76 |
|
|
|
|
|
|
|
|
|
|
- 1,76 |
|
|
|
- 1,76 |
|
REGION AFRIQUE CENTRALE |
|
|
|
|
|
|
|
|
|
|
|
- |
- 8,50 |
|
- 8,50 |
- 8,50 |
|
REGION AFRIQUE ORIENTALE |
- 0,07 |
|
|
|
|
|
|
|
|
|
|
- 0,07 |
|
|
|
- 0,07 |
|
REGION DE L'OCEAN INDIEN |
- 1,05 |
|
|
|
|
|
|
|
|
|
|
- 1,05 |
|
|
|
- 1,05 |
|
REGION DES CARAIBES |
- 0,04 |
|
|
|
|
|
|
|
|
|
|
- 0,04 |
|
|
|
- 0,04 |
|
REGION DU PACIFIQUE |
- 0,01 |
|
|
|
|
|
|
|
|
|
|
- 0,01 |
|
|
|
- 0,01 |
|
MULTI-REGIONAL (PALOP) |
- 0,07 |
|
|
|
|
|
|
|
|
|
|
- 0,07 |
|
|
|
- 0,07 |
|
BUDGET INTRA ACP |
- 2,02 |
|
|
|
|
|
|
|
|
|
|
- 2,02 |
|
|
|
- 2,02 |
|
* TOTAL COOPER. REGIONALE ACP |
- 5,02 |
|
|
|
|
|
|
|
|
|
|
- 5,02 |
- 8,50 |
|
- 8,50 |
- 13,52 |
|
TOUS PAYS ACP |
|
- 5,38 |
- 0,14 |
|
|
|
|
|
|
- 5,52 |
|
- 5,52 |
|
|
|
- 5,52 |
|
* TOTAL ACP |
- 54,93 |
- 18,45 |
- 1,46 |
|
- 37,77 |
34,73 |
- 8,33 |
- 14,70 |
|
- 45,97 |
|
- 100,90 |
- 70,03 |
|
- 70,03 |
- 170,93 |
|
POLYNESIE FRANCAISE |
|
- 0,26 |
|
|
|
|
|
|
|
- 0,26 |
|
- 0,26 |
|
|
|
- 0,26 |
|
* TOTAL PTOM FRANCAIS |
|
- 0,26 |
|
|
|
|
|
|
|
- 0,26 |
|
- 0,26 |
|
|
|
- 0,26 |
|
ARUBA |
- 0,01 |
- 0,26 |
|
|
|
|
|
|
|
- 0,26 |
|
- 0,28 |
|
|
|
- 0,28 |
|
ANTILLES NEERLANDAISES |
- 0,07 |
|
|
|
|
|
|
|
|
|
|
- 0,07 |
|
|
|
- 0,07 |
|
* TOTAL PTOM NEERLANDAIS |
- 0,09 |
- 0,26 |
|
|
|
|
|
|
|
- 0,26 |
|
- 0,35 |
|
|
|
- 0,35 |
|
SAINTE HELENE |
- 0,02 |
|
|
|
|
|
|
|
|
|
|
- 0,02 |
|
|
|
- 0,02 |
|
* TOTAL PTOM BRITANNIQUES |
- 0,02 |
|
|
|
|
|
|
|
|
|
|
- 0,02 |
|
|
|
- 0,02 |
|
TOUS PTOM |
|
- 0,70 |
|
|
|
|
|
|
|
- 0,70 |
|
- 0,70 |
|
|
|
- 0,70 |
|
* TOTAL PTOM |
- 0,10 |
- 1,23 |
|
|
|
|
|
|
|
- 1,23 |
|
- 1,33 |
|
|
|
- 1,33 |
|
* TOTAL ACP + PTOM |
- 55,03 |
- 19,68 |
- 1,46 |
|
- 37,77 |
34,73 |
- 8,33 |
- 14,70 |
0,00 |
- 47,20 |
|
- 102,23 |
- 70,03 |
|
- 70,03 |
- 172,26 |
Table 3.3.5
8th EDF
Assigned funds cumulative 2004
SITUATION BY INSTRUMENT AND STATE
|
(million EUR) |
||||||||||||||||
|
|
Lomé |
Cotonou |
Total state |
|||||||||||||
|
NIP |
Non NIP |
Interests |
Total |
Envelope A |
Envelope B |
Total |
||||||||||
|
Grants |
Interest subsidies |
Emergency aid |
Refugee aid |
Risk capital |
STABEX |
SYSMIN |
SAF |
Heavily indebted poor countries |
Total non NIP |
|||||||
|
ANGOLA |
56,49 |
|
11,26 |
15,28 |
|
|
|
|
|
26,54 |
|
83,03 |
|
|
|
83,03 |
|
BENIN |
107,52 |
|
|
|
16,10 |
1,02 |
|
54,33 |
|
71,45 |
|
178,97 |
|
|
|
178,97 |
|
BURKINA FASO |
156,36 |
|
0,10 |
|
14,00 |
1,50 |
|
87,60 |
|
103,21 |
|
259,57 |
128,11 |
|
128,11 |
387,68 |
|
BOTSWANA |
23,14 |
2,10 |
|
|
|
|
0,11 |
|
|
2,21 |
|
25,35 |
0,02 |
21,48 |
21,51 |
46,86 |
|
BURUNDI |
13,06 |
|
|
25,00 |
|
17,22 |
|
9,28 |
|
51,50 |
|
64,55 |
|
|
|
64,55 |
|
CENTRAFRIQUE |
53,26 |
|
0,41 |
|
|
6,31 |
|
22,90 |
|
29,62 |
|
82,87 |
|
|
|
82,87 |
|
TCHAD |
127,08 |
|
0,89 |
|
22,30 |
|
|
51,39 |
|
74,58 |
|
201,66 |
|
|
|
201,66 |
|
CAMEROUN |
97,14 |
|
|
|
73,03 |
17,11 |
|
34,94 |
|
125,07 |
|
222,21 |
|
|
|
222,21 |
|
CONGO |
3,66 |
|
|
4,62 |
|
|
|
|
|
4,62 |
|
8,28 |
|
|
|
,8,28 |
|
COMORES |
9,41 |
|
0,71 |
|
|
4,94 |
|
|
|
5,66 |
|
15,06 |
|
|
|
15,06 |
|
CAP VERT |
25,11 |
2,58 |
|
|
5,00 |
0,66 |
|
18,11 |
|
26,35 |
|
51,46 |
|
|
|
51,46 |
|
DJIBOUTI |
15,12 |
|
|
2,00 |
|
|
|
9,00 |
|
11,00 |
|
26,12 |
|
|
|
26,12 |
|
GUINEE EQUATORIALE |
2,65 |
|
|
|
|
0,79 |
|
|
|
0,79 |
|
3,44 |
|
|
|
3,44 |
|
ERITHREE |
2,25 |
|
10,43 |
9,59 |
|
|
|
|
|
20,02 |
|
22,27 |
|
|
|
22,27 |
|
ETHIOPIE |
91,74 |
|
1,89 |
6,64 |
66,00 |
5,24 |
|
118,44 |
|
198,22 |
|
289,96 |
0,06 |
|
0,06 |
290,02 |
|
GABON |
36,43 |
|
|
|
32,85 |
|
0,45 |
2,70 |
|
36,00 |
|
72,43 |
|
5,21 |
5,21 |
77,64 |
|
GHANA |
120,94 |
|
|
|
26,50 |
|
|
78,35 |
|
104,85 |
|
225,79 |
|
3,25 |
3,25 |
229,04 |
|
GAMBIE |
19,06 |
|
|
|
|
4,35 |
|
13,08 |
|
17,43 |
|
36,48 |
|
|
|
36,48 |
|
GUINEE BISSAU |
27,98 |
|
2,68 |
|
|
0,32 |
|
7,21 |
|
10,21 |
|
38,20 |
8,50 |
|
8,50 |
46,70 |
|
GUINEE |
83,56 |
|
|
|
12,00 |
|
|
31,76 |
|
43,76 |
|
127,32 |
|
|
|
127,32 |
|
COTE D'IVOIRE |
19,33 |
0,33 |
|
|
|
80,05 |
|
27,80 |
|
108,18 |
|
127,51 |
|
|
|
127,51 |
|
KENYA |
49,60 |
11,69 |
4,57 |
|
37,17 |
51,05 |
|
24,00 |
|
128,48 |
|
178,08 |
|
|
|
178,08 |
|
LIBERIA |
|
|
|
19,73 |
|
|
|
|
|
19,73 |
|
19,73 |
|
|
|
19,73 |
|
LESOTHO |
47,91 |
1,10 |
|
|
|
|
|
17,28 |
|
18,38 |
|
66,29 |
|
|
|
66,29 |
|
MADAGASCAR |
155,53 |
|
1,71 |
|
45,81 |
20,10 |
|
44,73 |
|
112,34 |
|
267,88 |
55,00 |
|
55,00 |
322,88 |
|
MALAWI |
174,50 |
|
1,40 |
|
13,01 |
11,42 |
|
49,85 |
|
75,68 |
|
250,18 |
6,51 |
|
6,51 |
256,69 |
|
MAURICE |
32,19 |
15,31 |
|
|
2,00 |
|
|
|
|
17,31 |
|
49,50 |
|
|
|
49,50 |
|
MAURITANIE |
55,54 |
3,92 |
|
0,22 |
30,08 |
17,36 |
0,15 |
27,02 |
|
78,74 |
|
134,28 |
|
|
|
134,28 |
|
MALI |
178,86 |
|
4,66 |
|
5,70 |
|
|
81,05 |
|
91,41 |
|
270,27 |
|
|
|
270,27 |
|
MOZAMBIQUE |
151,56 |
6,09 |
|
|
50,31 |
|
|
131,21 |
|
187,61 |
|
339,18 |
150,00 |
|
150,00 |
489,18 |
|
NAMIBIE |
49,43 |
18,83 |
|
1,18 |
4,23 |
|
0,20 |
|
|
24,43 |
|
73,86 |
|
|
|
73,86 |
|
NIGER |
95,42 |
|
0,28 |
|
|
|
0,14 |
43,74 |
|
44,16 |
|
139,58 |
1,02 |
32,94 |
33,96 |
173,54 |
|
RWANDA |
71,24 |
|
|
|
|
25,20 |
|
55,40 |
|
80,59 |
|
151,84 |
|
|
|
151,84 |
|
SENEGAL |
95,54 |
4,12 |
|
|
50,41 |
38,43 |
0,46 |
52,73 |
|
146,15 |
|
241,70 |
|
|
|
241,70 |
|
SEYCHELLES |
4,97 |
|
|
|
1,77 |
|
|
|
|
1,77 |
|
6,74 |
|
|
|
6,74 |
|
SIERRA LEONE |
52,50 |
|
|
|
|
5,10 |
|
30,40 |
|
35,50 |
|
88,00 |
|
|
|
88,00 |
|
SOMALIE |
44,47 |
|
|
|
|
|
|
|
|
|
|
44,47 |
|
|
|
44,47 |
|
SAO TOME & PRINCIPE |
9,67 |
|
|
|
|
|
|
3,97 |
|
3,97 |
|
13,64 |
|
|
|
13,64 |
|
SOUDAN |
|
|
19,22 |
|
|
92,74 |
|
|
|
111,96 |
|
111,96 |
|
|
|
111,96 |
|
SWAZILAND |
25,27 |
8,43 |
|
|
28,56 |
|
|
|
|
36,99 |
|
62,26 |
2,31 |
|
2,31 |
64,57 |
|
TANZANIE |
194,60 |
|
|
3,78 |
106,72 |
33,27 |
|
137,09 |
|
280,86 |
|
475,46 |
|
|
|
475,46 |
|
TOGO |
|
|
|
|
|
1,24 |
|
|
|
1,24 |
|
1,24 |
|
|
|
1,24 |
|
OUGANDA |
179,91 |
|
1,69 |
|
93,30 |
34,61 |
|
94,65 |
|
224,25 |
|
404,17 |
|
|
|
404,17 |
|
NIGERIA |
|
|
|
|
5,00 |
|
|
|
|
5,00 |
|
5,00 |
|
|
|
5,00 |
|
ZAMBIE |
119,36 |
|
3,64 |
|
103,50 |
|
90,22 |
90,99 |
|
288,34 |
|
407,70 |
|
|
|
407,70 |
|
ZIMBABWE |
74,34 |
|
|
|
3,25 |
14,90 |
0,14 |
|
|
18,29 |
|
92,63 |
|
|
|
92,63 |
|
REP. DEMOCRATIQUE CONGO |
19,88 |
|
1,92 |
23,23 |
|
|
|
5,50 |
|
30,65 |
|
50,53 |
|
|
|
50,53 |
|
* TOTAL AFRIQUE |
2 973,57 |
74,50 |
67,46 |
111,27 |
848,59 |
484,94 |
91,86 |
1 456,50 |
|
3 135,13 |
|
6 108,70 |
351,53 |
62,89 |
414,41 |
6 523,11 |
|
ANTIGUA-BARBUDA |
0,39 |
|
|
|
|
|
|
|
|
|
|
0,39 |
|
|
|
0,39 |
|
BARBADE |
1,23 |
4,26 |
|
|
|
|
|
|
|
4,26 |
|
5,49 |
|
|
|
5,49 |
|
BELIZE |
10,73 |
|
|
|
8,70 |
|
|
|
|
8,70 |
|
19,43 |
0,14 |
|
0,14 |
19,56 |
|
BAHAMAS |
2,20 |
|
|
|
|
|
|
|
|
|
|
2,20 |
|
|
|
2,20 |
|
REPUBLIQUE DOMINICAINE |
74,20 |
9,05 |
0,17 |
|
30,98 |
|
0,34 |
|
|
40,54 |
|
114,74 |
|
|
|
114,74 |
|
DOMINIQUE |
4,05 |
|
|
|
3,00 |
28,91 |
|
|
|
31,91 |
|
35,96 |
|
|
|
35,96 |
|
GRENADE |
0,48 |
|
|
|
|
2,84 |
|
|
|
2,84 |
|
3,32 |
|
|
|
3,32 |
|
GUYANE (ETAT) |
6,36 |
|
|
|
21,90 |
|
10,04 |
10,69 |
|
42,63 |
|
48,99 |
|
|
|
48,99 |
|
HAITI |
52,75 |
|
|
|
10,00 |
3,10 |
|
11,70 |
|
24,80 |
|
77,55 |
|
|
|
77,55 |
|
JAMAIQUE |
36,29 |
6,41 |
|
|
32,00 |
9,40 |
|
43,00 |
|
90,81 |
|
127,10 |
28,83 |
|
28,83 |
155,93 |
|
ST CHRISTOPHE (KITTS) & NEVI |
2,72 |
|
|
|
4,00 |
|
|
|
|
4,00 |
|
6,72 |
|
|
|
6,72 |
|
SAINTE LUCIE |
1,37 |
0,84 |
|
|
3,00 |
47,74 |
|
|
|
51,58 |
|
52,95 |
|
|
|
52,95 |
|
SURINAME |
10,24 |
0,24 |
|
|
|
|
|
|
|
0,24 |
|
10,48 |
|
|
|
10,48 |
|
SAINT VINCENT & GRENADINES |
1,87 |
0,28 |
|
|
|
32,16 |
|
|
|
32,44 |
|
34,32 |
|
|
|
34,32 |
|
TRINITE & TOBAGO |
6,96 |
0,78 |
|
|
7,00 |
|
|
|
|
7,78 |
|
14,74 |
|
|
|
14,74 |
|
* TOTAL CARAIBES |
211,84 |
24,96 |
0,17 |
|
120,58 |
124,15 |
10,38 |
65,39 |
|
342,54 |
|
554,38 |
28,97 |
|
28,97 |
583,35 |
|
FIDJI |
16,76 |
|
0,41 |
|
2,00 |
|
|
|
|
2,41 |
|
19,17 |
|
|
|
19,17 |
|
KIRIBATI |
6,66 |
|
|
|
0,50 |
0,28 |
|
|
|
0,78 |
|
7,44 |
|
|
|
7,44 |
|
PAPOUASIE NOUVELLE GUINEE |
36,15 |
|
0,08 |
|
|
0,64 |
0,50 |
9,88 |
|
11,10 |
|
47,24 |
|
2,97 |
2,97 |
50,22 |
|
SALOMON |
13,29 |
|
|
|
|
73,95 |
|
2,18 |
|
76,13 |
|
89,42 |
|
|
|
89,42 |
|
TONGA |
5,90 |
|
|
|
|
0,46 |
|
|
|
0,46 |
|
6,36 |
|
|
|
6,36 |
|
TUVALU |
1,90 |
|
|
|
0,50 |
0,00 |
|
|
|
0,50 |
|
2,40 |
|
|
|
2,40 |
|
VANUATU |
10,23 |
|
0,14 |
|
3,00 |
0,81 |
|
1,59 |
|
5,54 |
|
15,77 |
3,84 |
|
3,84 |
19,61 |
|
SAMOA |
14,07 |
|
|
|
5,00 |
0,03 |
|
|
|
5,03 |
|
19,10 |
2,64 |
|
2,64 |
21,74 |
|
* TOTAL PACIFIQUE |
104,94 |
|
0,64 |
|
11,00 |
76,19 |
0,50 |
13,64 |
|
101,97 |
|
206,91 |
6,48 |
2,97 |
9,45 |
216,36 |
|
REGION AFRIQUE OCCIDENTALE |
174,81 |
1,71 |
|
|
57,86 |
|
|
|
|
59,57 |
|
234,39 |
|
|
|
234,39 |
|
REGION AFRIQUE CENTRALE |
72,31 |
|
|
|
5,30 |
|
|
|
|
5,30 |
|
77,61 |
|
|
|
77,61 |
|
REGION AFRIQUE ORIENTALE |
96,24 |
|
|
|
|
|
|
|
|
|
|
96,24 |
|
|
|
96,24 |
|
REGION AFRIQUE AUSTRALE |
53,15 |
|
|
|
16,40 |
|
|
|
|
16,40 |
|
69,55 |
|
|
|
69,55 |
|
REGION DE L'OCEAN INDIEN |
13,01 |
|
|
|
10,94 |
|
|
|
|
10,94 |
|
23,95 |
|
|
|
23,95 |
|
REGION DES CARAIBES |
39,95 |
|
|
|
21,30 |
|
|
|
|
21,30 |
|
61,25 |
|
|
|
61,25 |
|
REGION DU PACIFIQUE |
34,49 |
|
|
|
|
|
|
|
|
|
|
34,49 |
|
|
|
34,49 |
|
MULTI-REGIONAL (PALOP) |
7,83 |
|
|
|
|
|
|
|
|
|
|
7,83 |
|
|
|
7,83 |
|
BUDGET INTRA ACP |
600,81 |
|
|
|
|
|
|
|
|
|
|
600,81 |
|
|
|
600,81 |
|
* TOTAL COOPER. REGIONALE ACP |
1 092,60 |
1,71 |
|
|
111,80 |
|
|
|
|
113,52 |
|
1 206,11 |
|
|
|
1 206,11 |
|
TOUS PAYS ACP |
|
6,97 |
69,55 |
|
28,78 |
|
|
|
1 060,00 |
1 165,29 |
|
1 165,29 |
|
|
|
1 165,29 |
|
FRAIS ADMINISTR. & FINANCIERS |
|
|
|
|
|
|
|
|
|
|
33,52 |
33,52 |
|
|
|
33,52 |
|
* TOTAL ACP |
4 382,94 |
105,04 |
137,82 |
111,27 |
1 120,75 |
685,29 |
102,75 |
1 535,53 |
1 060,00 |
4 858,45 |
33,52 |
9 274,92 |
386,98 |
65,86 |
452,84 |
9 727,75 |
|
MAYOTTE |
1,24 |
|
|
|
|
1,18 |
|
|
|
1,18 |
|
2,42 |
|
|
|
2,42 |
|
NOUVELLE CALEDONIE |
8,34 |
0,33 |
|
|
|
|
0,72 |
|
|
1,05 |
|
9,39 |
|
|
|
9,39 |
|
POLYNESIE FRANCAISE |
10,22 |
0,29 |
|
|
5,00 |
|
|
|
|
5,29 |
|
15,52 |
|
|
|
15,52 |
|
SAINT PIERRE & MIQUELON |
3,47 |
|
|
|
|
|
|
|
|
|
|
3,47 |
|
|
|
3,47 |
|
WALLIS & FUTUNA |
1,48 |
|
|
|
|
|
|
|
|
|
|
1,48 |
|
|
|
1,48 |
|
* TOTAL PTOM FRANCAIS |
24,75 |
0,63 |
|
|
5,00 |
1,18 |
0,72 |
|
|
7,53 |
|
32,28 |
|
|
|
32,28 |
|
ARUBA |
0,44 |
|
|
|
0,50 |
|
|
|
|
0,50 |
|
0,94 |
|
|
|
0,94 |
|
ANTILLES NEERLANDAISES |
1,98 |
|
|
|
|
|
|
|
|
|
|
1,98 |
|
|
|
1,98 |
|
* TOTAL PTOM NEERLANDAIS |
2,42 |
|
|
|
0,50 |
|
|
|
|
0,50 |
|
2,92 |
|
|
|
2,92 |
|
ANGUILLA |
0,97 |
|
|
|
|
|
|
|
|
|
|
0,97 |
|
|
|
0,97 |
|
MONTSERRAT |
1,76 |
|
|
|
|
|
|
|
|
|
|
1,76 |
|
|
|
1,76 |
|
SAINTE HELENE |
0,06 |
|
|
|
|
|
|
|
|
|
|
0,06 |
|
|
|
0,06 |
|
TURKS & CAICOS |
|
|
|
|
3,00 |
|
|
|
|
3,00 |
|
3,00 |
|
|
|
3,00 |
|
VIERGES (BRITANNIQUES) |
|
0,51 |
|
|
|
|
|
|
|
0,51 |
|
0,51 |
|
|
|
0,51 |
|
* TOTAL PTOM BRITANNIQUES |
2,80 |
0,51 |
|
|
3,00 |
|
|
|
|
3,51 |
|
6,31 |
|
|
|
6,31 |
|
COOPERATION REGIONALE PTF |
5,37 |
|
|
|
|
|
|
|
|
|
|
5,37 |
|
|
|
5,37 |
|
COOPERATION REGIONALE PTN |
0,53 |
|
|
|
|
|
|
|
|
|
|
0,53 |
|
|
|
0,53 |
|
* COOPERATION REGIONALE PTOM |
5,90 |
|
|
|
|
|
|
|
|
|
|
5,90 |
|
|
|
5,90 |
|
* TOTAL PTOM |
35,86 |
1,14 |
|
|
8,50 |
1,18 |
0,72 |
|
|
11,54 |
|
47,41 |
|
|
|
47,41 |
|
* TOTAL ACP + PTOM |
4 418,81 |
106,18 |
137,82 |
111,27 |
1 129,25 |
686,47 |
103,47 |
1 535,53 |
1 060,00 |
4 869,99 |
33,52 |
9 322,32 |
386,98 |
65,86 |
452,84 |
9 775,16 |
Table 3.3.6
8th EDF
Assigned funds annual 2004
SITUATION BY INSTRUMENT AND STATE
|
(million EUR) |
||||||||||||||||
|
|
Lomé |
Cotonou |
Total state |
|||||||||||||
|
NIP |
Non NIP |
Interests |
Total |
Envelope A |
Envelope B |
Total |
||||||||||
|
Grants |
Interest subsidies |
Emergency aid |
Refugee aid |
Risk capital |
STABEX |
SYSMIN |
SAF |
Heavily indebted poor countries |
Total non NIP |
|||||||
|
ANGOLA |
7,74 |
|
- 0,06 |
4,33 |
|
|
|
|
|
4,27 |
|
12,01 |
|
|
|
12,01 |
|
BENIN |
10,02 |
|
|
|
|
0,05 |
|
- 0,01 |
|
0,04 |
|
10,06 |
|
|
|
10,06 |
|
BURKINA FASO |
4,16 |
|
|
|
|
0,07 |
|
- 0,11 |
|
- 0,04 |
|
4,12 |
3,43 |
|
3,43 |
7,55 |
|
BOTSWANA |
11,73 |
|
|
|
|
|
|
|
|
|
|
11,73 |
|
21,48 |
21,48 |
33,22 |
|
BURUNDI |
- 0,00 |
|
|
|
|
3,38 |
|
0,28 |
|
3,66 |
|
3,66 |
|
|
|
3,66 |
|
CENTRAFRIQUE |
6,06 |
|
|
|
|
0,06 |
|
4,40 |
|
4,46 |
|
10,53 |
|
|
|
10,53 |
|
TCHAD |
10,02 |
|
|
|
|
|
|
0,53 |
|
0,53 |
|
10,55 |
|
|
|
10,55 |
|
CAMEROUN |
11,45 |
- 0,74 |
|
|
0,17 |
0,48 |
|
0,09 |
|
0,01 |
|
11,46 |
|
|
|
11,46 |
|
CONGO |
1,27 |
|
|
0,20 |
|
|
|
|
|
0,20 |
|
1,47 |
|
|
|
1,47 |
|
COMORES |
1,65 |
|
|
|
|
0,00 |
|
|
|
0,00 |
|
1,66 |
|
|
|
1,66 |
|
CAP VERT |
0,59 |
- 1,00 |
|
|
|
|
|
0,19 |
|
- 0,82 |
|
- 0,22 |
|
|
|
- 0,22 |
|
DJIBOUTI |
1,94 |
|
|
|
|
|
|
|
|
|
|
1,94 |
|
|
|
1,94 |
|
GUINEE EQUATORIALE |
0,86 |
|
|
|
|
|
|
|
|
|
|
0,86 |
|
|
|
0,86 |
|
ERITHREE |
|
|
- 0,11 |
0,74 |
|
|
|
|
|
0,63 |
|
0,63 |
|
|
|
0,63 |
|
ETHIOPIE |
11,94 |
|
|
|
25,00 |
0,37 |
|
1,63 |
|
27,00 |
|
38,94 |
|
|
|
38,94 |
|
GABON |
1,59 |
|
|
|
- 0,15 |
|
|
|
|
- 0,15 |
|
1,44 |
|
0,37 |
0,37 |
1,81 |
|
GHANA |
29,00 |
|
|
|
|
|
|
0,40 |
|
0,40 |
|
29,40 |
|
0,21 |
0,21 |
29,62 |
|
GAMBIE |
0,88 |
|
|
|
|
0,09 |
|
0,00 |
|
0,09 |
|
0,98 |
|
|
|
0,98 |
|
GUINEE BISSAU |
1,94 |
|
|
|
|
0,03 |
|
5,81 |
|
5,84 |
|
7,78 |
8,05 |
|
8,05 |
15,83 |
|
GUINEE |
5,85 |
|
|
|
|
|
|
10,40 |
|
10,40 |
|
16,25 |
|
|
|
16,25 |
|
COTE D'IVOIRE |
3,50 |
|
|
|
|
4,54 |
|
- 0,17 |
|
4,37 |
|
7,87 |
|
|
|
7,87 |
|
KENYA |
10,95 |
- 0,79 |
|
|
0,17 |
3,20 |
|
|
|
2,58 |
|
13,54 |
|
|
|
13,54 |
|
LIBERIA |
|
|
|
5,53 |
|
|
|
|
|
5,53 |
|
5,53 |
|
|
|
5,53 |
|
LESOTHO |
2,19 |
|
|
|
|
|
|
0,04 |
|
0,04 |
|
2,23 |
|
|
|
2,23 |
|
MADAGASCAR |
31,71 |
|
|
|
- 10,19 |
1,35 |
|
|
|
- 8,84 |
|
22,86 |
|
|
|
22,86 |
|
MALAWI |
3,34 |
|
- 0,10 |
|
- 3,96 |
0,08 |
|
5,53 |
|
1,56 |
|
4,90 |
6,48 |
|
6,48 |
11,38 |
|
MAURICE |
- 0,07 |
|
|
|
|
|
|
|
|
|
|
- 0,07 |
|
|
|
- 0,07 |
|
MAURITANIE |
5,70 |
- 2,02 |
|
|
2,90 |
1,49 |
|
- 1,93 |
|
0,45 |
|
6,14 |
|
|
|
6,14 |
|
MALI |
19,01 |
|
- 0,01 |
|
|
|
|
0,01 |
|
- 0,00 |
|
19,01 |
|
|
|
19,01 |
|
MOZAMBIQUE |
41,32 |
|
|
|
- 6,84 |
|
|
- 0,28 |
|
- 7,12 |
|
34,20 |
|
|
|
34,20 |
|
NAMIBIE |
4,77 |
- 0,67 |
|
0,08 |
|
|
|
|
|
- 0,59 |
|
4,19 |
|
|
|
4,19 |
|
NIGER |
18,24 |
|
|
|
|
|
|
|
|
|
|
18,24 |
0,15 |
13,61 |
13,76 |
32,00 |
|
RWANDA |
2,11 |
|
|
|
|
0,51 |
|
|
|
0,51 |
|
2,62 |
|
|
|
2,62 |
|
SENEGAL |
12,79 |
- 1,58 |
|
|
- 2,52 |
0,88 |
|
- 12,51 |
|
- 15,73 |
|
- 2,94 |
|
|
|
- 2,94 |
|
SEYCHELLES |
0,33 |
|
|
|
- 0,23 |
- |
|
|
|
- 0,23 |
|
0,10 |
|
|
|
0,10 |
|
SIERRA LEONE |
21,03 |
|
|
|
|
0,28 |
|
5,63 |
|
5,91 |
|
26,93 |
|
|
|
26,93 |
|
SOMALIE |
6,79 |
|
|
|
|
|
|
|
|
|
|
6,79 |
|
|
|
6,79 |
|
SAO TOME & PRINCIPE |
- 0,07 |
|
|
|
|
|
|
- 0,18 |
|
- 0,18 |
|
- 0,25 |
|
|
|
- 0,25 |
|
SOUDAN |
|
|
- 0,01 |
|
|
5,59 |
|
|
|
5,58 |
|
5,58 |
|
|
|
5,58 |
|
SWAZILAND |
8,38 |
- 0,68 |
|
|
- 2,69 |
|
|
|
|
- 3,37 |
|
5,02 |
2,31 |
|
2,31 |
7,32 |
|
TANZANIE |
21,46 |
|
|
0,02 |
- 7,08 |
2,79 |
|
- 0,09 |
|
- 4,37 |
|
17,09 |
|
|
|
17,09 |
|
OUGANDA |
88,40 |
|
- 0,01 |
|
32,00 |
2,73 |
|
1,19 |
|
35,92 |
|
124,32 |
|
|
|
124,32 |
|
ZAMBIE |
8,88 |
|
- 0,20 |
|
|
|
4,40 |
0,03 |
|
4,22 |
|
13,10 |
|
|
|
13,10 |
|
ZIMBABWE |
18,05 |
- 2,50 |
|
|
|
0,24 |
|
|
|
- 2,26 |
|
15,79 |
|
|
|
15,79 |
|
REP. DEMOCRATIQUE CONGO |
5,92 |
|
- 0,07 |
0,49 |
|
|
|
|
|
0,42 |
|
6,33 |
|
|
|
6,33 |
|
* TOTAL AFRIQUE |
453,45 |
- 9,97 |
- 0,57 |
11,39 |
26,58 |
28,22 |
4,40 |
20,88 |
0,00 |
80,93 |
|
534,38 |
20,42 |
35,67 |
56,09 |
590,47 |
|
ANTIGUA-BARBUDA |
0,16 |
|
|
|
|
|
|
|
|
|
|
0,16 |
|
|
|
0,16 |
|
BARBADE |
0,67 |
- 0,91 |
|
|
|
|
|
|
|
- 0,91 |
|
- 0,24 |
|
|
|
- 0,24 |
|
BELIZE |
0,08 |
|
|
|
|
|
|
|
|
|
|
0,08 |
|
|
|
0,08 |
|
REPUBLIQUE DOMINICAINE |
18,88 |
- 1,12 |
|
|
|
|
- 0,08 |
|
|
- 1,20 |
|
17,68 |
|
|
|
17,68 |
|
DOMINIQUE |
2,41 |
|
|
|
|
0,47 |
|
|
|
0,47 |
|
2,89 |
|
|
|
2,89 |
|
GRENADE |
|
|
|
|
|
0,03 |
|
|
|
0,03 |
|
0,03 |
|
|
|
0,03 |
|
GUYANE (ETAT) |
1,43 |
|
|
|
|
|
3,27 |
|
|
3,27 |
|
4,70 |
|
|
|
4,70 |
|
HAITI |
13,47 |
|
|
|
|
0,22 |
|
|
|
0,22 |
|
13,69 |
|
|
|
13,69 |
|
JAMAIQUE |
- 0,29 |
- 1,06 |
|
|
|
0,59 |
|
|
|
- 0,47 |
|
- 0,76 |
28,75 |
|
28,75 |
27,98 |
|
SAINTE LUCIE |
0,75 |
|
|
|
|
1,24 |
|
|
|
1,24 |
|
1,99 |
|
|
|
1,99 |
|
SURINAME |
0,78 |
|
|
|
|
|
|
|
|
|
|
0,78 |
|
|
|
0,78 |
|
SAINT VINCENT & GRENADINES |
0,06 |
|
|
|
|
0,36 |
|
|
|
0,36 |
|
0,42 |
|
|
|
0,42 |
|
TRINITE & TOBAGO |
2,33 |
|
|
|
|
|
|
|
|
|
|
2,33 |
|
|
|
2,33 |
|
* TOTAL CARAIBES |
40,74 |
- 3,09 |
|
|
|
2,91 |
3,20 |
|
|
3,01 |
|
43,75 |
28,75 |
|
28,75 |
72,50 |
|
FIDJI |
9,98 |
|
- 0,01 |
|
|
|
|
|
|
- 0,01 |
|
9,97 |
|
|
|
9,97 |
|
KIRIBATI |
1,56 |
|
|
|
|
|
|
|
|
|
|
1,56 |
|
|
|
1,56 |
|
PAPOUASIE NOUVELLE GUINEE |
6,21 |
|
|
|
|
0,06 |
|
|
|
0,06 |
|
6,27 |
|
2,97 |
2,97 |
9,25 |
|
SALOMON |
- 0,28 |
|
|
|
|
2,78 |
|
- 0,01 |
|
2,77 |
|
2,49 |
|
|
|
2,49 |
|
TONGA |
0,74 |
|
|
|
|
0,01 |
|
|
|
0,01 |
|
0,74 |
|
|
|
0,74 |
|
TUVALU |
0,03 |
|
|
|
0,50 |
|
|
|
|
0,50 |
|
0,53 |
|
|
|
0,53 |
|
VANUATU |
- 0,01 |
|
|
|
|
|
|
- 0,01 |
|
- 0,01 |
|
- 0,02 |
1,22 |
|
1,22 |
1,20 |
|
SAMOA |
0,04 |
|
|
|
|
|
|
|
|
|
|
0,04 |
1,09 |
|
1,09 |
1,13 |
|
* TOTAL PACIFIQUE |
18,27 |
|
- 0,01 |
|
0,50 |
2,84 |
|
- 0,02 |
|
3,32 |
|
21,58 |
2,31 |
2,97 |
5,28 |
26,86 |
|
REGION AFRIQUE OCCIDENTALE |
15,86 |
|
|
|
|
|
|
|
|
|
|
15,86 |
|
|
|
15,86 |
|
REGION AFRIQUE CENTRALE |
2,98 |
|
|
|
|
|
|
|
|
|
|
2,98 |
|
|
|
2,98 |
|
REGION AFRIQUE ORIENTALE |
41,44 |
|
|
|
|
|
|
|
|
|
|
41,44 |
|
|
|
41,44 |
|
REGION AFRIQUE AUSTRALE |
17,65 |
|
|
|
|
|
|
|
|
|
|
17,65 |
|
|
|
17,65 |
|
REGION DE L'OCEAN INDIEN |
4,17 |
|
|
|
|
|
|
|
|
|
|
4,17 |
|
|
|
4,17 |
|
REGION DES CARAIBES |
7,94 |
|
|
|
|
|
|
|
|
|
|
7,94 |
|
|
|
7,94 |
|
REGION DU PACIFIQUE |
1,04 |
|
|
|
|
|
|
|
|
|
|
1,04 |
|
|
|
1,04 |
|
MULTI-REGIONAL (PALOP) |
1,83 |
|
|
|
|
|
|
|
|
|
|
1,83 |
|
|
|
1,83 |
|
BUDGET INTRA ACP |
63,19 |
|
|
|
|
|
|
|
|
|
|
63,19 |
|
|
|
63,19 |
|
* TOTAL COOPER. REGIONALE ACP |
156,10 |
|
|
|
|
|
|
|
|
|
|
156,10 |
|
|
|
156,10 |
|
TOUS PAYS ACP |
|
- 5,38 |
- 0,13 |
|
|
|
|
|
|
- 5,51 |
|
- 5,51 |
|
|
|
- 5,51 |
|
FRAIS ADMINISTR. & FINANCIERS |
|
|
|
|
|
|
|
|
|
|
6,74 |
6,74 |
|
|
|
6,74 |
|
* TOTAL ACP |
668,56 |
- 18,45 |
- 0,70 |
11,39 |
27,08 |
33,98 |
7,59 |
20,86 |
|
81,75 |
6,74 |
757,05 |
51,47 |
38,65 |
90,12 |
847,17 |
|
MAYOTTE |
0,02 |
|
|
|
|
|
|
|
|
|
|
0,02 |
|
|
|
0,02 |
|
NOUVELLE CALEDONIE |
|
|
|
|
|
|
0,67 |
|
|
0,67 |
|
0,67 |
|
|
|
0,67 |
|
POLYNESIE FRANCAISE |
|
- 0,26 |
|
|
|
|
|
|
|
- 0,26 |
|
- 0,26 |
|
|
|
- 0,26 |
|
SAINT PIERRE & MIQUELON |
- 0,05 |
|
|
|
|
|
|
|
|
|
|
- 0,05 |
|
|
|
- 0,05 |
|
WALLIS & FUTUNA |
0,38 |
|
|
|
|
|
|
|
|
|
|
0,38 |
|
|
|
0,38 |
|
* TOTAL PTOM FRANCAIS |
0,35 |
- 0,26 |
|
|
|
|
0,67 |
|
|
0,41 |
|
0,75 |
|
|
|
0,75 |
|
ARUBA |
- 0,01 |
- 0,26 |
|
|
|
|
|
|
|
- 0,26 |
|
- 0,27 |
|
|
|
- 0,27 |
|
ANTILLES NEERLANDAISES |
1,20 |
|
|
|
|
|
|
|
|
|
|
1,20 |
|
|
|
1,20 |
|
* TOTAL PTOM NEERLANDAIS |
1,19 |
- 0,26 |
|
|
|
|
|
|
|
- 0,26 |
|
0,93 |
|
|
|
0,93 |
|
ANGUILLA |
0,62 |
|
|
|
|
|
|
|
|
|
|
0,62 |
|
|
|
0,62 |
|
MONTSERRAT |
0,03 |
|
|
|
|
|
|
|
|
|
|
0,03 |
|
|
|
0,03 |
|
* TOTAL PTOM BRITANNIQUES |
0,64 |
|
|
|
|
|
|
|
|
|
|
0,64 |
|
|
|
0,64 |
|
COOPERATION REGIONALE PTF |
- 0,01 |
|
|
|
|
|
|
|
|
|
|
- 0,01 |
|
|
|
- 0,01 |
|
COOPERATION REGIONALE PTN |
- 0,11 |
|
|
|
|
|
|
|
|
|
|
- 0,11 |
|
|
|
- 0,11 |
|
* COOPERATION REGIONALE PTOM |
- 0,12 |
|
|
|
|
|
|
|
|
|
|
- 0,12 |
|
|
|
- 0,12 |
|
TOUS PTOM |
|
- 0,70 |
|
|
|
|
|
|
|
- 0,70 |
|
- 0,70 |
|
|
|
- 0,70 |
|
* TOTAL PTOM |
2,06 |
- 1,23 |
|
|
|
|
0,67 |
|
|
- 0,56 |
|
1,51 |
|
|
|
1,51 |
|
* TOTAL ACP + PTOM |
670,62 |
- 19,68 |
- 0,70 |
11,39 |
27,08 |
33,98 |
8,26 |
20,86 |
|
81,19 |
6,74 |
758,55 |
51,47 |
38,65 |
90,12 |
848,67 |
Table 3.3.7
8th EDF
Payments — Cumulative 2004
SITUATION BY INSTRUMENT AND STATE
|
(million EUR) |
||||||||||||||||
|
|
Lomé |
Cotonou |
Total state |
|||||||||||||
|
NIP |
Non NIP |
Interests |
Total |
Envelope A |
Envelope B |
Total |
||||||||||
|
Grants |
Interest subsidies |
Emergency aid |
Refugee aid |
Risk capital |
STABEX |
SYSMIN |
SAF |
Heavily indebted poor countries |
Total non NIP |
|||||||
|
ANGOLA |
37,55 |
|
11,26 |
10,38 |
|
|
|
|
|
21,65 |
|
59,19 |
|
|
|
59,19 |
|
BENIN |
93,63 |
|
|
|
5,76 |
0,97 |
|
52,76 |
|
59,49 |
|
153,12 |
|
|
|
153,12 |
|
BURKINA FASO |
116,50 |
|
0,10 |
|
12,09 |
0,76 |
|
87,60 |
|
100,55 |
|
217,05 |
90,09 |
|
90,09 |
307,14 |
|
BOTSWANA |
12,11 |
|
|
|
|
|
0,11 |
|
|
0,11 |
|
12,22 |
0,02 |
0,37 |
0,39 |
12,61 |
|
BURUNDI |
13,06 |
|
|
22,50 |
|
|
|
9,05 |
|
31,55 |
|
44,61 |
|
|
|
44,61 |
|
CENTRAFRIQUE |
43,34 |
|
0,41 |
|
|
6,31 |
|
22,47 |
|
29,19 |
|
72,53 |
|
|
|
72,53 |
|
TCHAD |
95,60 |
|
0,89 |
|
15,55 |
|
|
50,83 |
|
67,26 |
|
162,87 |
|
|
|
162,87 |
|
CAMEROUN |
74,70 |
|
|
|
63,32 |
11,85 |
|
34,48 |
|
109,66 |
|
184,35 |
|
|
|
184,35 |
|
CONGO |
2,05 |
|
|
3,70 |
|
|
|
|
|
3,70 |
|
5,74 |
|
|
|
5,74 |
|
COMORES |
7,46 |
|
0,71 |
|
|
4,89 |
|
|
|
5,60 |
|
13,06 |
|
|
|
13,06 |
|
CAP VERT |
14,73 |
2,58 |
|
|
1,47 |
0,66 |
|
17,87 |
|
22,58 |
|
37,32 |
|
|
|
37,32 |
|
DJIBOUTI |
11,41 |
|
|
0,98 |
|
|
|
9,00 |
|
9,98 |
|
21,39 |
|
|
|
21,39 |
|
GUINEE EQUATORIALE |
1,25 |
|
|
|
|
0,79 |
|
|
|
0,79 |
|
2,05 |
|
|
|
2,05 |
|
ERITHREE |
|
|
9,68 |
8,65 |
|
|
|
|
|
18,33 |
|
18,33 |
|
|
|
18,33 |
|
ETHIOPIE |
37,10 |
|
1,29 |
2,29 |
41,00 |
|
|
111,47 |
|
156,06 |
|
193,16 |
0,04 |
|
0,04 |
193,20 |
|
GABON |
31,88 |
|
|
|
32,54 |
|
0,45 |
2,70 |
|
35,69 |
|
67,57 |
|
2,76 |
2,76 |
70,33 |
|
GHANA |
61,39 |
|
|
|
17,05 |
|
|
77,80 |
|
94,85 |
|
156,25 |
|
1,18 |
1,18 |
157,43 |
|
GAMBIE |
14,72 |
|
|
|
|
3,37 |
|
9,04 |
|
12,40 |
|
27,13 |
|
|
|
27,13 |
|
GUINEE BISSAU |
20,64 |
|
2,68 |
|
|
|
|
1,41 |
|
4,09 |
|
24,73 |
2,93 |
|
2,93 |
27,67 |
|
GUINEE |
54,77 |
|
|
|
|
|
|
21,36 |
|
21,36 |
|
76,13 |
|
|
|
76,13 |
|
COTE D'IVOIRE |
11,35 |
0,33 |
|
|
|
38,11 |
|
21,64 |
|
60,08 |
|
71,43 |
|
|
|
71,43 |
|
KENYA |
18,21 |
8,09 |
3,90 |
|
35,17 |
51,05 |
|
17,00 |
|
115,21 |
|
133,42 |
|
|
|
133,42 |
|
LIBERIA |
|
|
|
11,47 |
|
|
|
|
|
11,47 |
|
11,47 |
|
|
|
11,47 |
|
LESOTHO |
41,41 |
1,10 |
|
|
|
|
|
14,77 |
|
15,87 |
|
57,28 |
|
|
|
57,28 |
|
MADAGASCAR |
100,05 |
|
1,71 |
|
39,97 |
6,57 |
|
44,73 |
|
92,98 |
|
193,03 |
55,00 |
|
55,00 |
248,03 |
|
MALAWI |
153,87 |
|
1,40 |
|
10,71 |
10,53 |
|
49,79 |
|
72,44 |
|
226,30 |
2,90 |
|
2,90 |
229,20 |
|
MAURICE |
29,62 |
1,23 |
|
|
1,89 |
|
|
|
|
3,12 |
|
32,73 |
|
|
|
32,73 |
|
MAURITANIE |
45,30 |
3,92 |
|
0,22 |
25,02 |
|
0,15 |
26,92 |
|
56,23 |
|
101,53 |
|
|
|
101,53 |
|
MALI |
146,17 |
|
4,66 |
|
5,70 |
|
|
79,33 |
|
89,69 |
|
235,85 |
|
|
|
235,85 |
|
MOZAMBIQUE |
102,04 |
4,18 |
|
|
49,73 |
|
|
131,21 |
|
185,12 |
|
287,16 |
110,23 |
|
110,23 |
397,39 |
|
NAMIBIE |
42,92 |
17,55 |
|
1,12 |
4,23 |
|
0,20 |
|
|
23,10 |
|
66,01 |
|
|
|
66,01 |
|
NIGER |
76,44 |
|
0,28 |
|
|
|
0,14 |
39,44 |
|
39,86 |
|
116,30 |
0,81 |
20,24 |
21,05 |
137,35 |
|
RWANDA |
55,03 |
|
|
|
|
19,59 |
|
55,40 |
|
74,99 |
|
130,02 |
|
|
|
130,02 |
|
SENEGAL |
66,21 |
4,12 |
|
|
34,83 |
28,59 |
0,37 |
52,67 |
|
120,58 |
|
186,79 |
|
|
|
186,79 |
|
SEYCHELLES |
4,66 |
|
|
|
1,77 |
|
|
|
|
1,77 |
|
6,43 |
|
|
|
6,43 |
|
SIERRA LEONE |
37,51 |
|
|
|
|
2,12 |
|
30,40 |
|
32,52 |
|
70,03 |
|
|
|
70,03 |
|
SOMALIE |
26,66 |
|
|
|
|
|
|
|
|
|
|
26,66 |
|
|
|
26,66 |
|
SAO TOME & PRINCIPE |
6,98 |
|
|
|
|
|
|
3,71 |
|
3,71 |
|
10,68 |
|
|
|
10,68 |
|
SOUDAN |
|
|
19,22 |
|
|
|
|
|
|
19,22 |
|
19,22 |
|
|
|
19,22 |
|
SWAZILAND |
15,85 |
2,70 |
|
|
19,81 |
|
|
|
|
22,51 |
|
38,36 |
0,67 |
|
0,67 |
39,03 |
|
TANZANIE |
97,90 |
|
|
2,83 |
64,02 |
3,05 |
|
136,89 |
|
206,79 |
|
304,69 |
|
|
|
304,69 |
|
TOGO |
|
|
|
|
|
1,24 |
|
|
|
1,24 |
|
1,24 |
|
|
|
1,24 |
|
OUGANDA |
115,52 |
|
1,63 |
|
61,30 |
14,91 |
|
93,50 |
|
171,34 |
|
286,87 |
|
|
|
286,87 |
|
NIGERIA |
|
|
|
|
4,54 |
|
|
|
|
4,54 |
|
4,54 |
|
|
|
4,54 |
|
ZAMBIE |
107,46 |
|
3,64 |
|
90,30 |
|
85,95 |
90,69 |
|
270,58 |
|
378,04 |
|
|
|
378,04 |
|
ZIMBABWE |
52,17 |
|
|
|
3,25 |
12,14 |
0,13 |
|
|
15,52 |
|
67,69 |
|
|
|
67,69 |
|
REP. DEMOCRATIQUE CONGO |
11,93 |
|
1,92 |
19,14 |
|
|
|
4,69 |
|
25,75 |
|
37,68 |
|
|
|
37,68 |
|
* TOTAL AFRIQUE |
2 109,14 |
45,80 |
65,37 |
83,28 |
641,02 |
217,51 |
87,49 |
1 400,63 |
|
2 541,11 |
|
4 650,24 |
262,69 |
24,55 |
287,24 |
4 937,49 |
|
ANTIGUA-BARBUDA |
0,20 |
|
|
|
|
|
|
|
|
|
|
0,20 |
|
|
|
0,20 |
|
BARBADE |
0,74 |
2,72 |
|
|
|
|
|
|
|
2,72 |
|
3,46 |
|
|
|
3,46 |
|
BELIZE |
10,39 |
|
|
|
6,54 |
|
|
|
|
6,54 |
|
16,93 |
0,13 |
|
0,13 |
17,05 |
|
BAHAMAS |
2,20 |
|
|
|
|
|
|
|
|
|
|
2,20 |
|
|
|
2,20 |
|
REPUBLIQUE DOMINICAINE |
33,49 |
1,10 |
0,17 |
|
30,64 |
|
0,34 |
|
|
32,26 |
|
65,74 |
|
|
|
65,74 |
|
DOMINIQUE |
2,14 |
|
|
|
2,78 |
23,74 |
|
|
|
26,52 |
|
28,66 |
|
|
|
28,66 |
|
GRENADE |
0,24 |
|
|
|
|
2,52 |
|
|
|
2,52 |
|
2,76 |
|
|
|
2,76 |
|
GUYANE (ETAT) |
3,35 |
|
|
|
1,44 |
|
2,71 |
10,69 |
|
14,84 |
|
18,19 |
|
|
|
18,19 |
|
HAITI |
32,89 |
|
|
|
|
3,10 |
|
11,70 |
|
14,80 |
|
47,69 |
|
|
|
47,69 |
|
JAMAIQUE |
30,47 |
6,41 |
|
|
14,78 |
8,83 |
|
43,00 |
|
73,01 |
|
103,49 |
11,68 |
|
11,68 |
115,17 |
|
ST CHRISTOPHE (KITTS) & NEVI |
2,72 |
|
|
|
2,22 |
|
|
|
|
2,22 |
|
4,94 |
|
|
|
4,94 |
|
SAINTE LUCIE |
0,88 |
|
|
|
|
34,36 |
|
|
|
34,36 |
|
35,24 |
|
|
|
35,24 |
|
SURINAME |
6,04 |
0,24 |
|
|
|
|
|
|
|
0,24 |
|
6,28 |
|
|
|
6,28 |
|
SAINT VINCENT & GRENADINES |
1,38 |
0,28 |
|
|
|
28,30 |
|
|
|
28,58 |
|
29,96 |
|
|
|
29,96 |
|
TRINITE & TOBAGO |
2,44 |
0,78 |
|
|
3,00 |
|
|
|
|
3,78 |
|
6,22 |
|
|
|
6,22 |
|
* TOTAL CARAIBES |
129,56 |
11,53 |
0,17 |
|
61,40 |
100,85 |
3,05 |
65,39 |
|
242,40 |
|
371,96 |
11,81 |
|
11,81 |
383,77 |
|
FIDJI |
9,89 |
|
0,41 |
|
2,00 |
|
|
|
|
2,41 |
|
12,30 |
|
|
|
12,30 |
|
KIRIBATI |
4,24 |
|
|
|
0,10 |
0,28 |
|
|
|
0,38 |
|
4,62 |
|
|
|
4,62 |
|
PAPOUASIE NOUVELLE GUINEE |
22,93 |
|
0,08 |
|
|
|
0,48 |
9,88 |
|
10,43 |
|
33,35 |
|
0,57 |
0,57 |
33,92 |
|
SALOMON |
11,27 |
|
|
|
|
44,50 |
|
2,18 |
|
46,68 |
|
57,95 |
|
|
|
57,95 |
|
TONGA |
4,58 |
|
|
|
|
0,38 |
|
|
|
0,38 |
|
4,96 |
|
|
|
4,96 |
|
TUVALU |
1,87 |
|
|
|
|
0,00 |
|
|
|
0,00 |
|
1,87 |
|
|
|
1,87 |
|
VANUATU |
10,18 |
|
0,14 |
|
3,00 |
0,81 |
|
1,59 |
|
5,54 |
|
15,72 |
2,41 |
|
2,41 |
18,13 |
|
SAMOA |
14,07 |
|
|
|
5,00 |
0,03 |
|
|
|
5,03 |
|
19,10 |
1,66 |
|
1,66 |
20,76 |
|
* TOTAL PACIFIQUE |
79,01 |
|
0,64 |
|
10,10 |
46,01 |
0,48 |
13,64 |
|
70,86 |
|
149,88 |
4,06 |
0,57 |
4,63 |
154,51 |
|
REGION AFRIQUE OCCIDENTALE |
136,20 |
1,71 |
|
|
57,86 |
|
|
|
|
59,57 |
|
195,77 |
|
|
|
195,77 |
|
REGION AFRIQUE CENTRALE |
55,35 |
|
|
|
1,25 |
|
|
|
|
1,25 |
|
56,60 |
|
|
|
56,60 |
|
REGION AFRIQUE ORIENTALE |
53,20 |
|
|
|
|
|
|
|
|
|
|
53,20 |
|
|
|
53,20 |
|
REGION AFRIQUE AUSTRALE |
34,22 |
|
|
|
16,40 |
|
|
|
|
16,40 |
|
50,62 |
|
|
|
50,62 |
|
REGION DE L'OCEAN INDIEN |
7,67 |
|
|
|
4,31 |
|
|
|
|
4,31 |
|
11,98 |
|
|
|
11,98 |
|
REGION DES CARAIBES |
28,73 |
|
|
|
10,64 |
|
|
|
|
10,64 |
|
39,37 |
|
|
|
39,37 |
|
REGION DU PACIFIQUE |
18,91 |
|
|
|
|
|
|
|
|
|
|
18,91 |
|
|
|
18,91 |
|
MULTI-REGIONAL (PALOP) |
5,09 |
|
|
|
|
|
|
|
|
|
|
5,09 |
|
|
|
5,09 |
|
BUDGET INTRA ACP |
408,39 |
|
|
|
|
|
|
|
|
|
|
408,39 |
|
|
|
408,39 |
|
* TOTAL COOPER. REGIONALE ACP |
747,76 |
1,71 |
|
|
90,47 |
|
|
|
|
92,18 |
|
839,94 |
|
|
|
839,94 |
|
TOUS PAYS ACP |
|
4,67 |
68,68 |
|
15,16 |
|
|
|
1 060,00 |
1 148,51 |
|
1 148,51 |
|
|
|
1 148,51 |
|
FRAIS ADMINISTR. & FINANCIERS |
|
|
|
|
|
|
|
|
|
|
29,92 |
29,92 |
|
|
|
29,92 |
|
* TOTAL ACP |
3 065,47 |
63,71 |
134,87 |
83,28 |
818,15 |
364,37 |
91,02 |
1 479,66 |
1 060,00 |
4 095,06 |
29,92 |
7 190,45 |
278,57 |
25,12 |
303,69 |
7 494,13 |
|
MAYOTTE |
0,44 |
|
|
|
|
1,18 |
|
|
|
1,18 |
|
1,62 |
|
|
|
1,62 |
|
NOUVELLE CALEDONIE |
4,50 |
0,33 |
|
|
|
|
0,34 |
|
|
0,68 |
|
5,18 |
|
|
|
5,18 |
|
POLYNESIE FRANCAISE |
9,26 |
0,29 |
|
|
3,00 |
|
|
|
|
3,29 |
|
12,55 |
|
|
|
12,55 |
|
SAINT PIERRE & MIQUELON |
3,47 |
|
|
|
|
|
|
|
|
|
|
3,47 |
|
|
|
3,47 |
|
WALLIS & FUTUNA |
1,26 |
|
|
|
|
|
|
|
|
|
|
1,26 |
|
|
|
1,26 |
|
* TOTAL PTOM FRANCAIS |
18,93 |
0,63 |
|
|
3,00 |
1,18 |
0,34 |
|
|
5,15 |
|
24,08 |
|
|
|
24,08 |
|
ARUBA |
0,40 |
|
|
|
|
|
|
|
|
|
|
0,40 |
|
|
|
0,40 |
|
ANTILLES NEERLANDAISES |
1,05 |
|
|
|
|
|
|
|
|
|
|
1,05 |
|
|
|
1,05 |
|
* TOTAL PTOM NEERLANDAIS |
1,45 |
|
|
|
|
|
|
|
|
|
|
1,45 |
|
|
|
1,45 |
|
ANGUILLA |
0,80 |
|
|
|
|
|
|
|
|
|
|
0,80 |
|
|
|
0,80 |
|
MONTSERRAT |
1,16 |
|
|
|
|
|
|
|
|
|
|
1,16 |
|
|
|
1,16 |
|
SAINTE HELENE |
0,06 |
|
|
|
|
|
|
|
|
|
|
0,06 |
|
|
|
0,06 |
|
TURKS & CAICOS |
|
|
|
|
1,83 |
|
|
|
|
1,83 |
|
1,83 |
|
|
|
1,83 |
|
VIERGES (BRITANNIQUES) |
|
0,51 |
|
|
|
|
|
|
|
0,51 |
|
0,51 |
|
|
|
0,51 |
|
* TOTAL PTOM BRITANNIQUES |
2,02 |
0,51 |
|
|
1,83 |
|
|
|
|
2,34 |
|
4,36 |
|
|
|
4,36 |
|
COOPERATION REGIONALE PTF |
2,28 |
|
|
|
|
|
|
|
|
|
|
2,28 |
|
|
|
2,28 |
|
COOPERATION REGIONALE PTN |
0,45 |
|
|
|
|
|
|
|
|
|
|
0,45 |
|
|
|
0,45 |
|
* COOPERATION REGIONALE PTOM |
2,73 |
|
|
|
|
|
|
|
|
|
|
2,73 |
|
|
|
2,73 |
|
* TOTAL PTOM |
25,12 |
1,14 |
|
|
4,83 |
1,18 |
0,34 |
|
|
7,49 |
|
32,62 |
|
|
|
32,62 |
|
* TOTAL ACP + PTOM |
3 090,59 |
64,85 |
134,87 |
83,28 |
822,98 |
365,55 |
91,36 |
1 479,66 |
1 060,00 |
4 102,55 |
29,92 |
7 223,06 |
278,57 |
25,12 |
303,69 |
7 526,75 |
Table 3.3.8
8th EDF
Payments annual 2004
SITUATION BY INSTRUMENT AND STATE
|
(million EUR) |
||||||||||||||||
|
|
Lomé |
Cotonou |
Total state |
|||||||||||||
|
NIP |
Non NIP |
Interests |
Total |
Envelope A |
Envelope B |
Total |
||||||||||
|
Grants |
Interest subsidies |
Emergency aid |
Refugee aid |
Risk capital |
STABEX |
SYSMIN |
SAF |
Heavily indebted poor countries |
Total non NIP |
|||||||
|
ANGOLA |
8,57 |
|
- 0,00 |
4,29 |
|
|
|
|
|
4,29 |
|
12,86 |
|
|
|
12,86 |
|
BENIN |
24,23 |
|
|
|
0,72 |
|
|
0,06 |
|
0,78 |
|
25,00 |
|
|
|
25,00 |
|
BURKINA FASO |
21,97 |
|
|
|
5,00 |
- 0,68 |
|
0,05 |
|
4,37 |
|
26,34 |
38,98 |
|
38,98 |
65,32 |
|
BOTSWANA |
5,79 |
|
|
|
|
|
|
|
|
|
|
5,79 |
0,01 |
0,37 |
0,38 |
6,17 |
|
BURUNDI |
13,00 |
|
|
8,31 |
|
- 13,84 |
|
9,05 |
|
3,53 |
|
16,53 |
|
|
|
16,53 |
|
CENTRAFRIQUE |
15,59 |
|
|
- |
|
0,06 |
|
4,47 |
|
4,54 |
|
20,12 |
|
|
|
20,12 |
|
TCHAD |
30,61 |
|
|
- |
2,15 |
|
|
0,58 |
|
2,73 |
|
33,34 |
|
|
|
33,34 |
|
CAMEROUN |
29,87 |
|
|
- |
2,51 |
- 4,78 |
|
0,32 |
|
- 1,94 |
|
27,93 |
|
|
|
27,93 |
|
CONGO |
1,43 |
|
|
0,42 |
|
|
|
|
|
0,42 |
|
1,85 |
|
|
|
1,85 |
|
COMORES |
1,57 |
|
|
|
|
- 0,05 |
|
|
|
- 0,05 |
|
1,52 |
|
|
|
1,52 |
|
CAP VERT |
3,39 |
1,15 |
|
|
1,47 |
|
|
0,08 |
|
2,70 |
|
6,09 |
|
|
|
6,09 |
|
DJIBOUTI |
4,14 |
|
|
|
|
|
|
|
|
|
|
4,14 |
|
|
|
4,14 |
|
GUINEE EQUATORIALE |
0,61 |
|
|
|
|
|
|
|
|
|
|
0,61 |
|
|
|
0,61 |
|
ERITHREE |
|
|
1,03 |
3,35 |
|
|
|
|
|
4,38 |
|
4,38 |
|
|
|
4,38 |
|
ETHIOPIE |
2,61 |
|
|
|
|
- 4,87 |
|
0,57 |
|
- 4,31 |
|
- 1,70 |
0,02 |
|
0,02 |
- 1,67 |
|
GABON |
4,72 |
|
|
|
1,82 |
|
|
|
|
1,82 |
|
6,54 |
|
2,33 |
2,33 |
8,87 |
|
GHANA |
10,26 |
|
|
|
0,57 |
|
|
15,98 |
|
16,55 |
|
26,81 |
|
0,66 |
0,66 |
27,47 |
|
GAMBIE |
2,29 |
|
|
|
|
- 0,89 |
|
0,07 |
|
- 0,82 |
|
1,46 |
|
|
- |
1,46 |
|
GUINEE BISSAU |
2,88 |
|
|
|
|
- 0,29 |
|
0,01 |
|
- 0,28 |
|
2,60 |
2,93 |
|
2,93 |
5,54 |
|
GUINEE |
10,32 |
|
|
|
|
|
|
|
|
|
|
10,32 |
|
|
|
10,32 |
|
COTE D'IVOIRE |
2,95 |
|
|
|
|
- 37,39 |
|
0,03 |
|
- 37,37 |
|
- 34,42 |
|
|
|
- 34,42 |
|
KENYA |
7,69 |
1,32 |
|
|
12,80 |
3,20 |
|
|
|
17,32 |
|
25,01 |
|
|
|
25,01 |
|
LIBERIA |
|
|
|
3,70 |
|
|
|
|
|
3,70 |
|
3,70 |
|
|
|
3,70 |
|
LESOTHO |
4,55 |
|
|
|
|
|
|
5,57 |
|
5,57 |
|
10,12 |
|
|
|
10,12 |
|
MADAGASCAR |
37,72 |
|
|
|
19,41 |
- 12,18 |
|
|
|
7,23 |
|
44,95 |
|
|
|
44,95 |
|
MALAWI |
29,75 |
|
0,10 |
|
|
- 0,81 |
|
5,66 |
|
4,95 |
|
34,70 |
2,88 |
|
2,88 |
37,58 |
|
MAURICE |
3,04 |
|
|
|
1,89 |
|
|
|
|
1,89 |
|
4,92 |
|
|
|
4,92 |
|
MAURITANIE |
7,48 |
0,92 |
|
|
0,25 |
- 15,86 |
|
4,37 |
|
- 10,33 |
|
- 2,85 |
|
|
|
- 2,85 |
|
MALI |
30,21 |
|
|
|
|
|
|
7,69 |
|
7,69 |
|
37,90 |
|
|
|
37,90 |
|
MOZAMBIQUE |
37,76 |
|
|
|
|
|
|
0,04 |
|
0,04 |
|
37,80 |
39,16 |
|
39,16 |
76,96 |
|
NAMIBIE |
6,58 |
0,23 |
|
0,27 |
|
|
|
|
|
0,51 |
|
7,09 |
|
|
|
7,09 |
|
NIGER |
22,25 |
|
|
|
|
|
|
|
|
|
|
22,25 |
0,38 |
0,99 |
1,38 |
23,63 |
|
RWANDA |
13,77 |
|
|
|
|
- 5,10 |
|
|
|
- 5,10 |
|
8,67 |
|
|
|
8,67 |
|
SENEGAL |
10,46 |
0,28 |
|
|
5,29 |
- 8,96 |
0,01 |
25,36 |
|
21,98 |
|
32,44 |
|
|
|
32,44 |
|
SEYCHELLES |
0,24 |
|
|
|
|
|
|
|
|
|
|
0,24 |
|
|
|
0,24 |
|
SIERRA LEONE |
18,59 |
|
|
|
|
- 2,71 |
|
5,63 |
|
2,92 |
|
21,51 |
|
|
|
21,51 |
|
SOMALIE |
10,10 |
|
|
|
|
|
|
|
|
|
|
10,10 |
|
|
|
10,10 |
|
SAO TOME & PRINCIPE |
1,35 |
|
|
|
|
|
|
0,28 |
|
0,28 |
|
1,62 |
|
|
|
1,62 |
|
SOUDAN |
|
|
|
|
|
|
|
|
|
|
|
- |
|
|
|
- |
|
SWAZILAND |
5,69 |
0,51 |
|
|
2,51 |
|
|
|
|
3,02 |
|
8,71 |
0,67 |
|
0,67 |
9,38 |
|
TANZANIE |
43,78 |
|
|
1,18 |
26,17 |
- 27,43 |
|
- 0,01 |
|
- 0,10 |
|
43,68 |
|
|
|
43,68 |
|
OUGANDA |
58,04 |
|
0,40 |
|
8,00 |
- 16,96 |
|
3,60 |
|
- 4,97 |
|
53,07 |
|
|
|
53,07 |
|
NIGERIA |
|
|
|
|
0,77 |
|
|
|
|
0,77 |
|
0,77 |
|
|
|
0,77 |
|
ZAMBIE |
11,15 |
|
0,21 |
|
32,54 |
|
5,41 |
0,09 |
|
38,25 |
|
49,40 |
|
|
|
49,40 |
|
ZIMBABWE |
16,05 |
|
|
|
|
- 2,52 |
|
|
|
- 2,52 |
|
13,53 |
|
|
|
13,53 |
|
REP. DEMOCRATIQUE CONGO |
4,80 |
|
0,15 |
4,98 |
|
|
|
|
|
5,13 |
|
9,93 |
|
|
|
9,93 |
|
* TOTAL AFRIQUE |
577,84 |
4,40 |
1,87 |
26,51 |
123,86 |
- 152,06 |
5,42 |
89,55 |
|
99,55 |
|
677,39 |
85,04 |
4,35 |
89,39 |
766,78 |
|
ANTIGUA-BARBUDA |
0,13 |
|
|
|
|
|
|
|
|
|
|
0,13 |
|
|
|
0,13 |
|
BARBADE |
0,34 |
1,61 |
|
|
|
|
|
|
|
1,61 |
|
1,96 |
|
|
|
1,96 |
|
BELIZE |
0,19 |
|
|
|
|
|
|
|
|
|
|
0,19 |
0,04 |
|
0,04 |
0,23 |
|
BAHAMAS |
|
|
|
|
|
|
|
|
|
|
|
- |
|
|
|
- |
|
REPUBLIQUE DOMINICAINE |
10,49 |
- 0,15 |
|
|
|
|
|
|
|
- 0,15 |
|
10,34 |
|
|
|
10,34 |
|
DOMINIQUE |
1,56 |
|
|
|
0,39 |
- 4,69 |
|
|
|
- 4,31 |
|
- 2,74 |
|
|
|
- 2,74 |
|
GRENADE |
0,12 |
|
|
|
|
- 0,29 |
|
|
|
- 0,29 |
|
- 0,17 |
|
|
|
- 0,17 |
|
GUYANE (ETAT) |
0,93 |
|
|
|
|
|
1,12 |
|
|
1,12 |
|
2,05 |
|
|
|
2,05 |
|
HAITI |
13,61 |
|
|
|
|
0,22 |
|
|
|
0,22 |
|
13,83 |
|
|
|
13,83 |
|
JAMAIQUE |
2,35 |
1,17 |
|
|
1,29 |
0,02 |
|
|
|
2,48 |
|
4,83 |
11,63 |
|
11,63 |
16,46 |
|
ST CHRISTOPHE (KITTS) & NEVI |
|
|
|
|
0,35 |
|
|
|
|
0,35 |
|
0,35 |
|
|
|
0,35 |
|
SAINTE LUCIE |
0,32 |
|
|
|
|
- 12,15 |
|
|
|
- 12,15 |
|
- 11,82 |
|
|
|
- 11,82 |
|
SURINAME |
1,57 |
|
|
|
|
|
|
|
|
|
|
1,57 |
|
|
|
1,57 |
|
SAINT VINCENT & GRENADINES |
0,66 |
|
|
|
|
- 3,50 |
|
|
|
- 3,50 |
|
- 2,84 |
|
|
|
- 2,84 |
|
TRINITE & TOBAGO |
0,61 |
|
|
|
|
|
|
|
|
|
|
0,61 |
|
|
|
0,61 |
|
* TOTAL CARAIBES |
32,88 |
2,63 |
|
|
2,02 |
- 20,39 |
1,12 |
|
|
- 14,62 |
|
18,26 |
11,67 |
|
11,67 |
29,94 |
|
FIDJI |
6,28 |
|
0,08 |
|
|
|
|
|
|
0,08 |
|
6,36 |
|
|
|
6,36 |
|
KIRIBATI |
1,70 |
|
|
|
0,10 |
|
|
|
|
0,10 |
|
1,80 |
|
|
|
1,80 |
|
PAPOUASIE NOUVELLE GUINEE |
8,67 |
|
|
|
|
- 0,58 |
|
|
|
- 0,58 |
|
8,09 |
|
0,57 |
0,57 |
8,66 |
|
SALOMON |
1,66 |
|
|
|
|
- 26,67 |
|
|
|
- 26,67 |
|
- 25,01 |
|
|
|
- 25,01 |
|
TONGA |
1,91 |
|
|
|
|
- 0,08 |
|
|
|
- 0,08 |
|
1,83 |
|
|
|
1,83 |
|
TUVALU |
0,02 |
|
|
|
|
|
|
|
|
|
|
0,02 |
|
|
|
0,02 |
|
VANUATU |
0,12 |
|
|
|
|
|
|
0,01 |
|
0,01 |
|
0,14 |
0,97 |
|
0,97 |
1,11 |
|
SAMOA |
0,20 |
|
|
|
|
|
|
|
|
|
|
0,20 |
1,21 |
|
1,21 |
1,41 |
|
* TOTAL PACIFIQUE |
20,57 |
|
0,08 |
|
0,10 |
- 27,33 |
|
0,01 |
|
- 27,14 |
|
- 6,57 |
2,18 |
0,57 |
2,75 |
- 3,83 |
|
REGION AFRIQUE OCCIDENTALE |
33,18 |
|
|
|
|
|
|
|
|
|
|
33,18 |
|
|
|
33,18 |
|
REGION AFRIQUE CENTRALE |
13,96 |
|
|
|
|
|
|
|
|
|
|
13,96 |
|
|
|
13,96 |
|
REGION AFRIQUE ORIENTALE |
22,82 |
|
|
|
|
|
|
|
|
|
|
22,82 |
|
|
|
22,82 |
|
REGION AFRIQUE AUSTRALE |
8,72 |
|
|
|
|
|
|
|
|
|
|
8,72 |
|
|
|
8,72 |
|
REGION DE L'OCEAN INDIEN |
1,86 |
|
|
|
0,50 |
|
|
|
|
0,50 |
|
2,35 |
|
|
|
2,35 |
|
REGION DES CARAIBES |
5,42 |
|
|
|
0,77 |
|
|
|
|
0,77 |
|
6,19 |
|
|
|
6,19 |
|
REGION DU PACIFIQUE |
8,06 |
|
|
|
|
|
|
|
|
|
|
8,06 |
|
|
|
8,06 |
|
MULTI-REGIONAL (PALOP) |
1,75 |
|
|
|
|
|
|
|
|
|
|
1,75 |
|
|
|
1,75 |
|
BUDGET INTRA ACP |
61,00 |
|
|
|
|
|
|
|
|
|
|
61,00 |
|
|
|
61,00 |
|
* TOTAL COOPER. REGIONALE ACP |
156,77 |
|
|
|
1,27 |
|
|
|
|
1,27 |
|
158,04 |
|
|
|
158,04 |
|
TOUS PAYS ACP |
|
1,85 |
0,50 |
|
0,68 |
|
|
|
|
3,04 |
|
3,04 |
|
|
|
3,04 |
|
FRAIS ADMINISTR.& FINANCIERS |
|
|
|
|
|
|
|
|
|
|
16,44 |
16,44 |
|
|
|
16,44 |
|
* TOTAL ACP |
788,06 |
8,88 |
2,45 |
26,51 |
127,94 |
- 199,79 |
6,54 |
89,57 |
0,00 |
62,10 |
16,44 |
866,60 |
98,89 |
4,92 |
103,81 |
970,41 |
|
MAYOTTE |
0,01 |
|
|
|
|
|
|
|
|
|
|
0,01 |
|
|
|
0,01 |
|
NOUVELLE CALEDONIE |
3,52 |
|
|
|
|
|
0,31 |
|
|
0,31 |
|
3,83 |
|
|
|
3,83 |
|
POLYNESIE FRANCAISE |
3,69 |
0,06 |
|
|
2,00 |
|
|
|
|
2,06 |
|
5,75 |
|
|
|
5,75 |
|
SAINT PIERRE & MIQUELON |
0,58 |
|
|
|
|
|
|
|
|
|
|
0,58 |
|
|
|
0,58 |
|
WALLIS & FUTUNA |
0,42 |
|
|
|
|
|
|
|
|
|
|
0,42 |
|
|
|
0,42 |
|
* TOTAL PTOM FRANCAIS |
8,23 |
0,06 |
|
|
2,00 |
|
0,31 |
|
|
2,36 |
|
10,60 |
|
|
|
10,60 |
|
ARUBA |
0,15 |
|
|
|
|
|
|
|
|
|
|
0,15 |
|
|
|
0,15 |
|
ANTILLES NEERLANDAISES |
0,42 |
|
|
|
|
|
|
|
|
|
|
0,42 |
|
|
|
0,42 |
|
* TOTAL PTOM NEERLANDAIS |
0,57 |
|
|
|
|
|
|
|
|
|
|
0,57 |
|
|
|
0,57 |
|
ANGUILLA |
0,64 |
|
|
|
|
|
|
|
|
|
|
0,64 |
|
|
|
0,64 |
|
MONTSERRAT |
1,08 |
|
|
|
|
|
|
|
|
|
|
1,08 |
|
|
|
1,08 |
|
TURKS & CAICOS |
|
|
|
|
1,00 |
|
|
|
|
1,00 |
|
1,00 |
|
|
|
1,00 |
|
* TOTAL PTOM BRITANNIQUES |
1,72 |
|
|
|
1,00 |
|
|
|
|
1,00 |
|
2,72 |
|
|
|
2,72 |
|
COOPERATION REGIONALE PTF |
0,90 |
|
|
|
|
|
|
|
|
|
|
0,90 |
|
|
|
0,90 |
|
COOPERATION REGIONALE PTN |
0,14 |
|
|
|
|
|
|
|
|
|
|
0,14 |
|
|
|
0,14 |
|
* COOPERATION REGIONALE PTOM |
1,04 |
|
|
|
|
|
|
|
|
|
|
1,04 |
|
|
|
1,04 |
|
* TOTAL PTOM |
11,56 |
0,06 |
|
|
3,00 |
|
0,31 |
|
|
3,36 |
|
14,92 |
|
|
|
14,92 |
|
* TOTAL ACP + PTOM |
799,62 |
8,94 |
2,45 |
26,51 |
130,93 |
- 199,79 |
6,84 |
89,57 |
|
65,46 |
16,44 |
881,52 |
98,89 |
4,92 |
103,81 |
985,34 |
Table 3.4.1
9th EDF
Cumulative 2004
GLOBAL SITUATION BY STATE
|
(million EUR) |
||||||||||
|
|
Cotonou |
|||||||||
|
NIP |
Envelope A |
Envelope B |
Implementation costs |
Total |
||||||
|
Decisions |
Payments |
Decisions |
Payments |
Decisions |
Payments |
Decisions |
Assigned funds |
Payments |
||
|
ANGOLA |
175,08 |
89,76 |
22,66 |
26,80 |
0,40 |
|
|
116,56 |
58,62 |
23,06 |
|
BENIN |
298,86 |
126,40 |
39,99 |
|
|
|
|
126,40 |
108,85 |
39,99 |
|
BURKINA FASO |
306,66 |
118,34 |
0,23 |
|
|
|
|
118,34 |
29,51 |
0,23 |
|
BOTSWANA |
62,28 |
2,17 |
|
|
|
|
|
2,17 |
|
|
|
BURUNDI |
227,58 |
74,24 |
1,34 |
43,17 |
22,54 |
|
|
117,41 |
61,73 |
23,88 |
|
CENTRAFRIQUE |
110,30 |
4,69 |
2,68 |
1,47 |
1,14 |
|
|
6,16 |
4,52 |
3,82 |
|
TCHAD |
250,73 |
115,33 |
2,74 |
9,80 |
3,01 |
|
|
125,13 |
61,93 |
5,75 |
|
CAMEROUN |
135,18 |
4,76 |
0,38 |
|
|
|
|
4,76 |
0,48 |
0,38 |
|
CONGO |
93,09 |
12,63 |
0,29 |
2,00 |
0,56 |
|
|
14,63 |
2,04 |
0,85 |
|
COMORES |
36,10 |
0,02 |
0,02 |
1,80 |
1,39 |
|
|
1,82 |
1,76 |
1,42 |
|
CAP VERT |
51,41 |
3,56 |
|
5,81 |
5,50 |
|
|
9,37 |
5,50 |
5,50 |
|
DJIBOUTI |
43,54 |
9,60 |
0,31 |
|
|
|
|
9,60 |
0,58 |
0,31 |
|
GUINEE EQUATORIALE |
11,81 |
3,36 |
0,28 |
|
|
|
|
3,36 |
1,59 |
0,28 |
|
ERITHREE |
152,84 |
57,35 |
0,21 |
|
|
|
|
57,35 |
2,09 |
0,21 |
|
ETHIOPIE |
472,45 |
116,98 |
45,17 |
7,50 |
0,93 |
|
|
124,48 |
93,73 |
46,11 |
|
GABON |
43,40 |
7,64 |
0,51 |
|
|
|
|
7,64 |
1,93 |
0,51 |
|
GHANA |
272,00 |
104,79 |
14,06 |
|
|
|
|
104,79 |
64,55 |
14,06 |
|
GAMBIE |
58,91 |
4,58 |
0,11 |
|
|
|
|
4,58 |
0,66 |
0,11 |
|
GUINEE BISSAU |
46,73 |
3,70 |
0,93 |
|
|
|
|
3,70 |
1,18 |
0,93 |
|
GUINEE |
69,74 |
1,95 |
|
|
|
|
|
1,95 |
|
|
|
COTE D'IVOIRE |
145,57 |
6,05 |
0,03 |
68,24 |
20,50 |
|
|
74,29 |
27,82 |
20,53 |
|
KENYA |
304,90 |
196,00 |
0,08 |
3,85 |
0,40 |
|
|
199,85 |
46,13 |
0,48 |
|
LIBERIA |
60,89 |
48,02 |
13,69 |
10,80 |
2,04 |
|
|
58,82 |
27,47 |
15,73 |
|
LESOTHO |
108,38 |
20,99 |
0,28 |
|
|
|
|
20,99 |
1,16 |
0,28 |
|
MADAGASCAR |
295,37 |
228,00 |
37,74 |
5,90 |
|
|
|
233,90 |
124,04 |
37,74 |
|
MALAWI |
264,99 |
49,06 |
4,58 |
|
|
|
|
49,06 |
7,27 |
4,58 |
|
MAURICE |
45,76 |
30,32 |
8,01 |
0,50 |
0,19 |
|
|
30,81 |
28,49 |
8,20 |
|
MAURITANIE |
144,72 |
53,39 |
0,37 |
7,50 |
5,95 |
|
|
60,89 |
8,31 |
6,32 |
|
MALI |
390,71 |
224,60 |
28,07 |
38,62 |
37,39 |
|
|
263,22 |
166,82 |
65,45 |
|
MOZAMBIQUE |
361,77 |
140,94 |
19,35 |
5,00 |
|
|
|
145,94 |
64,59 |
19,35 |
|
NAMIBIE |
96,02 |
86,51 |
9,10 |
1,00 |
0,80 |
|
|
87,51 |
24,30 |
9,90 |
|
NIGER |
340,54 |
131,53 |
52,65 |
2,50 |
2,05 |
|
|
134,03 |
102,76 |
54,70 |
|
RWANDA |
190,41 |
97,53 |
27,17 |
|
|
|
|
97,53 |
52,68 |
27,17 |
|
SENEGAL |
286,86 |
98,97 |
0,42 |
6,00 |
4,84 |
|
|
104,97 |
7,24 |
5,26 |
|
SEYCHELLES |
5,14 |
0,50 |
|
|
|
|
|
0,50 |
|
|
|
SIERRA LEONE |
228,20 |
60,50 |
2,34 |
57,00 |
6,09 |
|
|
117,50 |
25,58 |
8,43 |
|
SOMALIE |
153,81 |
103,09 |
8,67 |
|
|
|
|
103,09 |
45,22 |
8,67 |
|
SAO TOME & PRINCIPE |
12,71 |
9,40 |
0,07 |
|
|
|
|
9,40 |
1,43 |
0,07 |
|
SOUDAN |
100,43 |
5,68 |
0,25 |
17,70 |
1,52 |
|
|
23,38 |
4,87 |
1,76 |
|
SWAZILAND |
40,97 |
7,43 |
1,13 |
|
|
|
|
7,43 |
2,70 |
1,13 |
|
TANZANIE |
408,62 |
158,88 |
66,75 |
|
|
|
|
158,88 |
116,21 |
66,75 |
|
TOGO |
16,23 |
10,84 |
0,04 |
|
|
|
|
10,84 |
0,07 |
0,04 |
|
OUGANDA |
315,92 |
37,43 |
0,91 |
14,62 |
4,16 |
|
|
52,05 |
16,18 |
5,08 |
|
NIGERIA |
475,00 |
271,96 |
38,50 |
|
|
|
|
271,96 |
114,82 |
38,50 |
|
ZAMBIE |
372,86 |
205,98 |
40,21 |
13,49 |
11,49 |
|
|
219,47 |
127,20 |
51,70 |
|
ZIMBABWE |
31,27 |
9,46 |
0,05 |
|
|
|
|
9,46 |
0,68 |
0,05 |
|
REP. DEMOCRATIQUE CONGO |
489,50 |
126,28 |
111,85 |
30,90 |
11,14 |
|
|
157,18 |
138,51 |
122,99 |
|
* TOTAL AFRIQUE |
8 606,23 |
3 281,16 |
604,25 |
381,97 |
144,02 |
|
|
3 663,13 |
1 783,79 |
748,27 |
|
ANTIGUA-BARBUDA |
7,58 |
4,86 |
0,04 |
|
|
|
|
4,86 |
0,44 |
0,04 |
|
BARBADE |
13,03 |
12,23 |
0,03 |
|
|
|
|
12,23 |
0,03 |
0,03 |
|
BELIZE |
8,88 |
0,55 |
0,07 |
|
|
|
|
0,55 |
0,12 |
0,07 |
|
BAHAMAS |
7,58 |
0,15 |
|
|
|
|
|
0,15 |
|
|
|
REPUBLIQUE DOMINICAINE |
177,88 |
4,07 |
0,28 |
30,00 |
|
|
|
34,07 |
0,70 |
0,28 |
|
DOMINIQUE |
16,15 |
0,44 |
0,14 |
|
|
|
|
0,44 |
0,15 |
0,14 |
|
GRENADE |
17,37 |
0,83 |
0,02 |
|
|
|
|
0,83 |
0,26 |
0,02 |
|
GUYANE (ETAT) |
48,81 |
21,65 |
0,09 |
8,40 |
6,00 |
|
|
30,05 |
22,71 |
6,09 |
|
HAITI |
105,60 |
71,69 |
5,18 |
|
|
|
|
71,69 |
8,56 |
5,18 |
|
JAMAIQUE |
75,39 |
22,21 |
0,32 |
26,20 |
25,83 |
|
|
48,41 |
31,92 |
26,15 |
|
ST CHRISTOPHE (KITTS) & NEVI |
7,29 |
3,68 |
|
|
|
|
|
3,68 |
0,20 |
|
|
SAINTE LUCIE |
28,04 |
0,56 |
0,04 |
|
|
|
|
0,56 |
0,08 |
0,04 |
|
SURINAME |
44,60 |
34,31 |
0,09 |
|
|
|
|
34,31 |
0,13 |
0,09 |
|
SAINT VINCENT & GRENADINES |
26,90 |
7,38 |
|
|
|
|
|
7,38 |
0,82 |
|
|
TRINITE & TOBAGO |
42,03 |
9,98 |
|
|
|
|
|
9,98 |
|
|
|
* TOTAL CARAIBES |
627,13 |
194,58 |
6,29 |
64,60 |
31,83 |
|
|
259,18 |
66,11 |
38,12 |
|
FIDJI |
24,62 |
21,00 |
|
|
|
|
|
21,00 |
|
|
|
KIRIBATI |
11,03 |
8,80 |
|
|
|
|
|
8,80 |
|
|
|
PAPOUASIE NOUVELLE GUINEE |
98,54 |
6,19 |
|
|
|
|
|
6,19 |
0,07 |
|
|
SALOMON |
20,71 |
5,78 |
0,07 |
|
|
|
|
5,78 |
0,07 |
0,07 |
|
TONGA |
6,38 |
3,00 |
0,79 |
0,89 |
0,51 |
|
|
3,89 |
1,59 |
1,31 |
|
TUVALU |
5,17 |
3,97 |
1,62 |
|
|
|
|
3,97 |
2,08 |
1,62 |
|
VANUATU |
15,40 |
7,10 |
0,64 |
3,05 |
0,64 |
|
|
10,15 |
5,01 |
1,28 |
|
SAMOA |
22,92 |
2,50 |
0,27 |
|
|
|
|
2,50 |
0,48 |
0,27 |
|
NIUE |
2,60 |
0,20 |
|
|
|
|
|
0,20 |
|
|
|
ILES COOK |
3,10 |
2,00 |
1,48 |
|
|
|
|
2,00 |
1,55 |
1,48 |
|
MICRONESIE |
6,20 |
|
|
|
|
|
|
|
|
|
|
MARSHALL ISLANDS |
4,60 |
|
|
|
|
|
|
|
|
|
|
NAURU |
2,30 |
|
|
|
|
|
|
|
|
|
|
PALAU |
2,60 |
|
|
|
|
|
|
|
|
|
|
* TOTAL PACIFIQUE |
226,16 |
60,54 |
4,88 |
3,94 |
1,15 |
|
|
64,48 |
10,84 |
6,03 |
|
REGION AFRIQUE OCCIDENTALE |
246,49 |
40,71 |
1,30 |
|
|
|
|
40,71 |
3,44 |
1,30 |
|
REGION AFRIQUE CENTRALE |
67,99 |
8,16 |
4,60 |
|
|
|
|
8,16 |
5,65 |
4,60 |
|
REGION DES CARAIBES |
97,30 |
48,17 |
0,66 |
|
|
|
|
48,17 |
6,50 |
0,66 |
|
REGION DU PACIFIQUE |
29,55 |
29,00 |
3,18 |
|
|
|
|
29,00 |
23,87 |
3,18 |
|
MULTI-REGIONAL (PALOP) |
22,29 |
|
|
|
|
|
|
|
|
|
|
COOPERATION REGIONALE ACP |
1 688,98 |
1 173,42 |
329,25 |
|
|
|
|
1 173,42 |
592,50 |
329,25 |
|
REGION ESA |
302,57 |
145,21 |
3,14 |
|
|
|
|
145,21 |
23,32 |
3,14 |
|
REGION SADC |
170,95 |
24,82 |
0,61 |
|
|
|
|
24,82 |
2,53 |
0,61 |
|
* TOTAL COOPER. REGIONALE ACP |
2 626,11 |
1 469,49 |
342,73 |
|
|
|
|
1 469,49 |
657,83 |
342,73 |
|
TOUS PAYS ACP |
64,90 |
64,85 |
27,73 |
|
|
|
|
64,85 |
36,52 |
27,73 |
|
FRAIS DE MISE EN ŒUVRE |
268,17 |
|
|
|
|
218,76 |
55,17 |
218,76 |
157,50 |
55,17 |
|
RESERVE ALLOCATION NATIONALE |
820,34 |
|
|
|
|
|
|
|
|
|
|
RESERVE DEVELOPPEMENT LONG TERME |
371,77 |
|
|
|
|
|
|
|
|
|
|
* TOTAL ACP |
13 610,82 |
5 070,61 |
985,88 |
450,51 |
177,00 |
218,76 |
55,17 |
5 739,88 |
2 712,59 |
1 218,05 |
|
MAYOTTE |
23,43 |
0,09 |
|
|
|
|
|
0,09 |
|
|
|
NOUVELLE CALEDONIE |
21,53 |
21,50 |
6,17 |
|
|
|
|
21,50 |
21,50 |
6,17 |
|
POLYNESIE FRANCAISE |
17,26 |
3,65 |
|
|
|
|
|
3,65 |
|
|
|
SAINT PIERRE & MIQUELON |
0,41 |
|
|
|
|
|
|
|
|
|
|
TERRES AUSTRALES FRANCAISES |
0,32 |
|
|
|
|
|
|
|
|
|
|
WALLIS & FUTUNA |
4,43 |
0,67 |
0,12 |
|
|
|
|
0,67 |
0,37 |
0,12 |
|
* TOTAL PTOM FRANCAIS |
67,39 |
25,91 |
6,29 |
|
|
|
|
25,91 |
21,87 |
6,29 |
|
ARUBA |
10,19 |
4,40 |
|
|
|
|
|
4,40 |
|
|
|
ANTILLES NEERLANDAISES |
26,62 |
10,72 |
0,18 |
|
|
|
|
10,72 |
5,26 |
0,18 |
|
* TOTAL PTOM NEERLANDAIS |
36,82 |
15,12 |
0,18 |
|
|
|
|
15,12 |
5,26 |
0,18 |
|
ANGUILLA |
8,29 |
|
|
|
|
|
|
|
|
|
|
CAIMANS |
0,11 |
|
|
|
|
|
|
|
|
|
|
FALKLAND |
3,00 |
|
|
|
|
|
|
|
|
|
|
MONTSERRAT |
16,81 |
5,70 |
|
|
|
|
|
5,70 |
|
|
|
PITCAIRN |
2,35 |
|
|
|
|
|
|
|
|
|
|
SAINTE HELENE |
15,74 |
0,15 |
0,11 |
|
|
|
|
0,15 |
0,15 |
0,11 |
|
TURKS & CAICOS |
10,66 |
0,02 |
0,02 |
|
|
|
|
0,02 |
0,02 |
0,02 |
|
VIERGES (BRITANNIQUES) |
1,00 |
|
|
|
|
|
|
|
|
|
|
* TOTAL PTOM BRITANNIQUES |
57,96 |
5,87 |
0,13 |
|
|
|
|
5,87 |
0,17 |
0,13 |
|
COOPERATION REGIONALE PTOM |
26,47 |
7,10 |
0,25 |
|
|
|
|
7,10 |
0,84 |
0,25 |
|
* COOPERATION REGIONALE PTOM |
26,47 |
7,10 |
0,25 |
|
|
|
|
7,10 |
0,84 |
0,25 |
|
TOUS PTOM |
2,00 |
|
|
|
|
0,65 |
0,32 |
0,65 |
0,45 |
0,32 |
|
RESERVE DEVELOPPEMENT LONG TERME |
102,59 |
|
|
|
|
|
|
|
|
|
|
* TOTAL PTOM |
293,22 |
54,00 |
6,85 |
|
|
0,65 |
0,32 |
54,65 |
28,60 |
7,17 |
|
* TOTAL ACP + PTOM |
13 904,04 |
5 124,61 |
992,73 |
450,51 |
177,00 |
219,41 |
55,49 |
5 794,53 |
2 741,19 |
1 225,22 |
Table 3.4.2
9th EDF
Annual 2004
GLOBAL SITUATION BY STATE
|
(million EUR) |
||||||||||
|
|
Cotonou |
|||||||||
|
NIP |
Envelope A |
Envelope B |
Implementation costs |
Total |
||||||
|
Decisions |
Payments |
Decisions |
Payments |
Decisions |
Payments |
Decisions |
Assigned funds |
Payments |
||
|
ANGOLA |
175,08 |
23,92 |
22,66 |
0,80 |
0,40 |
|
|
24,72 |
58,58 |
23,06 |
|
BENIN |
298,86 |
6,23 |
39,99 |
|
|
|
|
6,23 |
108,85 |
39,99 |
|
BURKINA FASO |
306,66 |
3,23 |
0,23 |
|
|
|
|
3,23 |
29,51 |
0,23 |
|
BOTSWANA |
62,28 |
1,39 |
|
|
|
|
|
1,39 |
|
|
|
BURUNDI |
227,58 |
74,24 |
1,34 |
18,17 |
22,54 |
|
|
92,41 |
61,73 |
23,88 |
|
CENTRAFRIQUE |
110,30 |
4,61 |
2,68 |
0,47 |
0,64 |
|
|
5,08 |
3,52 |
3,32 |
|
TCHAD |
250,73 |
7,70 |
2,74 |
9,80 |
3,01 |
|
|
17,50 |
15,93 |
5,75 |
|
CAMEROUN |
135,18 |
4,48 |
0,38 |
|
|
|
|
4,48 |
0,35 |
0,38 |
|
CONGO |
93,09 |
12,47 |
0,26 |
2,00 |
0,56 |
|
|
14,47 |
1,96 |
0,82 |
|
COMORES |
36,10 |
- 0,00 |
0,02 |
1,80 |
1,39 |
|
|
1,80 |
1,76 |
1,42 |
|
CAP VERT |
51,41 |
3,56 |
|
5,81 |
5,50 |
|
|
9,37 |
5,50 |
5,50 |
|
DJIBOUTI |
43,54 |
9,60 |
0,31 |
|
|
|
|
9,60 |
0,58 |
0,31 |
|
GUINEE EQUATORIALE |
11,81 |
2,81 |
0,28 |
|
|
|
|
2,81 |
1,59 |
0,28 |
|
ERITHREE |
152,84 |
20,35 |
0,21 |
|
|
|
|
20,35 |
2,09 |
0,21 |
|
ETHIOPIE |
472,45 |
106,73 |
45,17 |
7,50 |
0,93 |
|
|
114,23 |
93,65 |
46,11 |
|
GABON |
43,40 |
7,39 |
0,50 |
|
|
|
|
7,39 |
1,85 |
0,50 |
|
GHANA |
272,00 |
99,48 |
14,06 |
|
|
|
|
99,48 |
63,75 |
14,06 |
|
GAMBIE |
58,91 |
4,58 |
0,11 |
|
|
|
|
4,58 |
0,66 |
0,11 |
|
GUINEE BISSAU |
46,73 |
2,46 |
0,63 |
|
|
|
|
2,46 |
0,08 |
0,63 |
|
GUINEE |
69,74 |
|
|
|
|
|
|
|
|
|
|
COTE D'IVOIRE |
145,57 |
5,83 |
0,03 |
30,00 |
17,51 |
|
|
35,83 |
17,98 |
17,53 |
|
KENYA |
304,90 |
146,00 |
0,08 |
3,85 |
0,40 |
|
|
149,85 |
46,13 |
0,48 |
|
LIBERIA |
60,89 |
|
10,17 |
10,80 |
2,04 |
|
|
10,80 |
19,77 |
12,21 |
|
LESOTHO |
108,38 |
1,99 |
0,27 |
|
|
|
|
1,99 |
0,66 |
0,27 |
|
MADAGASCAR |
295,37 |
130,00 |
37,49 |
5,90 |
|
|
|
135,90 |
123,74 |
37,49 |
|
MALAWI |
264,99 |
43,14 |
4,58 |
|
|
|
|
43,14 |
7,16 |
4,58 |
|
MAURICE |
45,76 |
0,42 |
8,01 |
|
0,19 |
|
|
0,42 |
28,49 |
8,20 |
|
MAURITANIE |
144,72 |
7,80 |
0,34 |
7,50 |
5,95 |
|
|
15,30 |
8,01 |
6,30 |
|
MALI |
390,71 |
123,88 |
27,97 |
5,70 |
4,47 |
|
|
129,58 |
38,95 |
32,44 |
|
MOZAMBIQUE |
361,77 |
20,40 |
19,35 |
5,00 |
|
|
|
25,40 |
48,19 |
19,35 |
|
NAMIBIE |
96,02 |
65,01 |
9,06 |
1,00 |
0,80 |
|
|
66,01 |
5,96 |
9,86 |
|
NIGER |
340,54 |
37,99 |
34,65 |
2,50 |
2,05 |
|
|
40,49 |
13,48 |
36,70 |
|
RWANDA |
190,41 |
10,73 |
13,27 |
|
|
|
|
10,73 |
2,89 |
13,27 |
|
SENEGAL |
286,86 |
98,18 |
0,42 |
6,00 |
4,84 |
|
|
104,18 |
7,21 |
5,26 |
|
SEYCHELLES |
5,14 |
0,50 |
|
|
|
|
|
0,50 |
|
|
|
SIERRA LEONE |
228,20 |
8,00 |
2,34 |
7,00 |
6,09 |
|
|
15,00 |
25,51 |
8,43 |
|
SOMALIE |
153,81 |
3,09 |
8,67 |
|
|
|
|
3,09 |
45,22 |
8,67 |
|
SAO TOME & PRINCIPE |
12,71 |
9,40 |
0,07 |
|
|
|
|
9,40 |
1,43 |
0,07 |
|
SOUDAN |
100,43 |
5,20 |
0,25 |
17,70 |
1,52 |
|
|
22,90 |
4,71 |
1,76 |
|
SWAZILAND |
40,97 |
2,70 |
1,12 |
|
|
|
|
2,70 |
2,14 |
1,12 |
|
TANZANIE |
408,62 |
42,06 |
35,75 |
|
|
|
|
42,06 |
7,21 |
35,75 |
|
TOGO |
16,23 |
1,26 |
0,04 |
|
|
|
|
1,26 |
0,07 |
0,04 |
|
OUGANDA |
315,92 |
25,45 |
0,91 |
12,62 |
3,02 |
|
|
38,07 |
14,57 |
3,93 |
|
NIGERIA |
475,00 |
271,88 |
38,50 |
|
|
|
|
271,88 |
114,82 |
38,50 |
|
ZAMBIE |
372,86 |
87,02 |
40,21 |
2,00 |
11,49 |
|
|
89,02 |
127,20 |
51,70 |
|
ZIMBABWE |
31,27 |
9,40 |
0,05 |
|
|
|
|
9,40 |
0,63 |
0,05 |
|
REP. DEMOCRATIQUE CONGO |
489,50 |
3,00 |
111,85 |
|
11,14 |
|
|
3,00 |
28,81 |
122,99 |
|
* TOTAL AFRIQUE |
8 606,23 |
1 555,53 |
537,05 |
163,92 |
106,46 |
|
|
1 719,45 |
1 192,87 |
643,51 |
|
ANTIGUA-BARBUDA |
7,58 |
0,40 |
0,04 |
|
|
|
|
0,40 |
0,44 |
0,04 |
|
BARBADE |
13,03 |
12,20 |
0,03 |
|
|
|
|
12,20 |
|
0,03 |
|
BELIZE |
8,88 |
0,55 |
0,07 |
|
|
|
|
0,55 |
0,12 |
0,07 |
|
BAHAMAS |
7,58 |
0,15 |
|
|
|
|
|
0,15 |
|
|
|
REPUBLIQUE DOMINICAINE |
177,88 |
2,90 |
0,25 |
30,00 |
|
|
|
32,90 |
0,50 |
0,25 |
|
DOMINIQUE |
16,15 |
0,30 |
0,14 |
|
|
|
|
0,30 |
0,15 |
0,14 |
|
GRENADE |
17,37 |
0,43 |
0,02 |
|
|
|
|
0,43 |
0,26 |
0,02 |
|
GUYANE (ETAT) |
48,81 |
21,47 |
0,09 |
8,40 |
6,00 |
|
|
29,87 |
22,71 |
6,09 |
|
HAITI |
105,60 |
37,74 |
5,18 |
|
|
|
|
37,74 |
8,56 |
5,18 |
|
JAMAIQUE |
75,39 |
20,96 |
0,32 |
26,20 |
25,83 |
|
|
47,16 |
31,92 |
26,15 |
|
ST CHRISTOPHE (KITTS) & NEVI |
7,29 |
0,50 |
|
|
|
|
|
0,50 |
0,20 |
|
|
SAINTE LUCIE |
28,04 |
0,45 |
0,04 |
|
|
|
|
0,45 |
0,08 |
0,04 |
|
SURINAME |
44,60 |
1,13 |
0,09 |
|
|
|
|
1,13 |
0,13 |
0,09 |
|
SAINT VINCENT & GRENADINES |
26,90 |
0,50 |
|
|
|
|
|
0,50 |
0,82 |
|
|
TRINITE & TOBAGO |
42,03 |
8,13 |
|
|
|
|
|
8,13 |
|
|
|
* TOTAL CARAIBES |
627,13 |
107,81 |
6,27 |
64,60 |
31,83 |
|
|
172,41 |
65,88 |
38,09 |
|
FIDJI |
24,62 |
21,00 |
|
|
|
|
|
21,00 |
|
|
|
KIRIBATI |
11,03 |
8,80 |
|
|
|
|
|
8,80 |
|
|
|
PAPOUASIE NOUVELLE GUINEE |
98,54 |
6,19 |
|
|
|
|
|
6,19 |
0,07 |
|
|
SALOMON |
20,71 |
5,70 |
0,06 |
|
|
|
|
5,70 |
0,04 |
0,06 |
|
TONGA |
6,38 |
|
0,79 |
|
0,51 |
|
|
|
1,59 |
1,31 |
|
TUVALU |
5,17 |
|
1,62 |
|
|
|
|
|
1,71 |
1,62 |
|
VANUATU |
15,40 |
0,57 |
0,64 |
1,70 |
0,64 |
|
|
2,27 |
4,58 |
1,28 |
|
SAMOA |
22,92 |
2,30 |
0,27 |
|
|
|
|
2,30 |
0,48 |
0,27 |
|
NIUE |
2,60 |
0,20 |
|
|
|
|
|
0,20 |
|
|
|
ILES COOK |
3,10 |
|
0,96 |
|
|
|
|
|
1,01 |
0,96 |
|
MICRONESIE |
6,20 |
|
|
|
|
|
|
|
|
|
|
MARSHALL ISLANDS |
4,60 |
|
|
|
|
|
|
|
|
|
|
NAURU |
2,30 |
|
|
|
|
|
|
|
|
|
|
PALAU |
2,60 |
|
|
|
|
|
|
|
|
|
|
* TOTAL PACIFIQUE |
226,16 |
44,76 |
4,35 |
1,70 |
1,15 |
|
|
46,46 |
9,46 |
5,50 |
|
REGION AFRIQUE OCCIDENTALE |
246,49 |
9,50 |
1,30 |
|
|
|
|
9,50 |
3,44 |
1,30 |
|
REGION AFRIQUE CENTRALE |
67,99 |
3,29 |
3,13 |
|
|
|
|
3,29 |
1,01 |
3,13 |
|
REGION DES CARAIBES |
97,30 |
22,00 |
0,53 |
|
|
|
|
22,00 |
5,94 |
0,53 |
|
REGION DU PACIFIQUE |
29,55 |
3,76 |
3,18 |
|
|
|
|
3,76 |
23,87 |
3,18 |
|
MULTI-REGIONAL (PALOP) |
22,29 |
|
|
|
|
|
|
|
|
|
|
COOPERATION REGIONALE ACP |
1 688,98 |
413,62 |
158,89 |
|
|
|
|
413,62 |
218,12 |
158,89 |
|
REGION ESA |
302,57 |
79,29 |
3,14 |
|
|
|
|
79,29 |
21,04 |
3,14 |
|
REGION SADC |
170,95 |
9,82 |
0,61 |
|
|
|
|
9,82 |
2,53 |
0,61 |
|
* TOTAL COOPER. REGIONALE ACP |
2 626,11 |
541,28 |
170,77 |
|
|
|
|
541,28 |
275,96 |
170,77 |
|
TOUS PAYS ACP |
64,90 |
26,97 |
27,73 |
|
|
|
|
26,97 |
36,52 |
27,73 |
|
FRAIS DE MISE EN ŒUVRE |
268,17 |
|
|
|
|
93,76 |
55,17 |
93,76 |
139,01 |
55,17 |
|
RESERVE ALLOCATION NATIONALE |
820,34 |
|
|
|
|
|
|
|
|
|
|
RESERVE DEVELOPPEMENT LONG TERME |
371,77 |
|
|
|
|
|
|
|
|
|
|
* TOTAL ACP |
13 610,82 |
2 276,35 |
746,17 |
230,22 |
139,44 |
93,76 |
55,17 |
2 600,33 |
1 719,70 |
940,78 |
|
MAYOTTE |
23,43 |
0,09 |
|
|
|
|
|
0,09 |
|
|
|
NOUVELLE CALEDONIE |
21,53 |
21,50 |
6,17 |
|
|
|
|
21,50 |
21,50 |
6,17 |
|
POLYNESIE FRANCAISE |
17,26 |
3,65 |
|
|
|
|
|
3,65 |
|
|
|
SAINT PIERRE & MIQUELON |
0,41 |
|
|
|
|
|
|
|
|
|
|
TERRES AUSTRALES FRANCAISES |
0,32 |
|
|
|
|
|
|
|
|
|
|
WALLIS & FUTUNA |
4,43 |
0,67 |
0,12 |
|
|
|
|
0,67 |
0,37 |
0,12 |
|
* TOTAL PTOM FRANCAIS |
67,39 |
25,91 |
6,29 |
|
|
|
|
25,91 |
21,87 |
6,29 |
|
ARUBA |
10,19 |
4,40 |
|
|
|
|
|
4,40 |
|
|
|
ANTILLES NEERLANDAISES |
26,62 |
1,00 |
0,07 |
|
|
|
|
1,00 |
5,07 |
0,07 |
|
* TOTAL PTOM NEERLANDAIS |
36,82 |
5,40 |
0,07 |
|
|
|
|
5,40 |
5,07 |
0,07 |
|
ANGUILLA |
8,29 |
|
|
|
|
|
|
|
|
|
|
CAIMANS |
0,11 |
|
|
|
|
|
|
|
|
|
|
FALKLAND |
3,00 |
|
|
|
|
|
|
|
|
|
|
MONTSERRAT |
16,81 |
|
|
|
|
|
|
|
|
|
|
PITCAIRN |
2,35 |
|
|
|
|
|
|
|
|
|
|
SAINTE HELENE |
15,74 |
|
0,11 |
|
|
|
|
|
|
0,11 |
|
TURKS & CAICOS |
10,66 |
|
|
|
|
|
|
|
|
|
|
VIERGES (BRITANNIQUES) |
1,00 |
|
|
|
|
|
|
|
|
|
|
* TOTAL PTOM BRITANNIQUES |
57,96 |
|
0,11 |
|
|
|
|
0,00 |
0,00 |
0,11 |
|
COOPERATION REGIONALE PTOM |
26,47 |
6,45 |
0,25 |
|
|
|
|
6,45 |
0,84 |
0,25 |
|
* COOPERATION REGIONALE PTOM |
26,47 |
6,45 |
0,25 |
|
|
|
|
6,45 |
0,84 |
0,25 |
|
TOUS PTOM |
2,00 |
|
|
|
|
|
0,06 |
|
|
0,06 |
|
RESERVE DEVELOPPEMENT LONG TERME |
102,59 |
|
|
|
|
|
|
|
|
|
|
* TOTAL PTOM |
293,22 |
37,75 |
6,72 |
|
|
|
0,06 |
37,75 |
27,78 |
6,78 |
|
* TOTAL ACP + PTOM |
13 904,04 |
2 314,11 |
752,89 |
230,22 |
139,44 |
93,76 |
55,23 |
2 638,08 |
1 747,48 |
947,56 |
Table 3.4.3
9th EDF
Decisions — Cumulative 2004
SITUATION BY INSTRUMENT AND STATE
|
(million EUR) |
|||||||||
|
|
Cotonou |
||||||||
|
Envelope A |
Envelope B |
Implementation Costs |
Total state |
||||||
|
Macroeconomic support |
Sectoral politic |
Total env. A |
Emergency aid |
Debt relief |
Loss on exportation compensation |
Total env. B |
|||
|
ANGOLA |
|
89,76 |
89,76 |
26,80 |
|
|
26,80 |
|
116,56 |
|
BENIN |
55,00 |
71,40 |
126,40 |
|
|
|
|
|
126,40 |
|
BURKINA FASO |
|
118,34 |
118,34 |
|
|
|
|
|
118,34 |
|
BOTSWANA |
|
2,17 |
2,17 |
|
|
|
|
|
2,17 |
|
BURUNDI |
32,84 |
41,40 |
74,24 |
32,39 |
7,60 |
3,18 |
43,17 |
|
117,41 |
|
CENTRAFRIQUE |
|
4,69 |
4,69 |
1,47 |
|
|
1,47 |
|
6,16 |
|
TCHAD |
50,00 |
65,33 |
115,33 |
9,80 |
|
|
9,80 |
|
125,13 |
|
CAMEROUN |
|
4,76 |
4,76 |
|
|
|
|
|
4,76 |
|
CONGO |
|
12,63 |
12,63 |
2,00 |
|
|
2,00 |
|
14,63 |
|
COMORES |
|
0,02 |
0,02 |
1,80 |
|
|
1,80 |
|
1,82 |
|
CAP VERT |
|
3,56 |
3,56 |
5,81 |
|
|
5,81 |
|
9,37 |
|
DJIBOUTI |
|
9,60 |
9,60 |
|
|
|
|
|
9,60 |
|
GUINEE EQUATORIALE |
|
3,36 |
3,36 |
|
|
|
|
|
3,36 |
|
ERITHREE |
|
57,35 |
57,35 |
|
|
|
|
|
57,35 |
|
ETHIOPIE |
95,00 |
21,98 |
116,98 |
7,50 |
|
|
7,50 |
|
124,48 |
|
GABON |
|
7,64 |
7,64 |
|
|
|
|
|
7,64 |
|
GHANA |
62,00 |
42,79 |
104,79 |
|
|
|
|
|
104,79 |
|
GAMBIE |
|
4,58 |
4,58 |
|
|
|
|
|
4,58 |
|
GUINEE BISSAU |
|
3,70 |
3,70 |
|
|
|
|
|
3,70 |
|
GUINEE |
|
1,95 |
1,95 |
|
|
|
|
|
1,95 |
|
COTE D'IVOIRE |
|
6,05 |
6,05 |
68,24 |
|
|
68,24 |
|
74,29 |
|
KENYA |
125,00 |
71,00 |
196,00 |
3,85 |
|
|
3,85 |
|
199,85 |
|
LIBERIA |
|
48,02 |
48,02 |
10,80 |
|
|
10,80 |
|
58,82 |
|
LESOTHO |
|
20,99 |
20,99 |
|
|
|
|
|
20,99 |
|
MADAGASCAR |
|
228,00 |
228,00 |
5,90 |
|
|
5,90 |
|
233,90 |
|
MALAWI |
|
49,06 |
49,06 |
|
|
|
|
|
49,06 |
|
MAURICE |
|
30,32 |
30,32 |
0,50 |
|
|
0,50 |
|
30,81 |
|
MAURITANIE |
|
53,39 |
53,39 |
7,50 |
|
|
7,50 |
|
60,89 |
|
MALI |
100,00 |
124,60 |
224,60 |
38,62 |
|
|
38,62 |
|
263,22 |
|
MOZAMBIQUE |
16,40 |
124,54 |
140,94 |
5,00 |
|
|
5,00 |
|
145,94 |
|
NAMIBIE |
|
86,51 |
86,51 |
1,00 |
|
|
1,00 |
|
87,51 |
|
NIGER |
90,00 |
41,53 |
131,53 |
2,50 |
|
|
2,50 |
|
134,03 |
|
RWANDA |
50,00 |
47,53 |
97,53 |
|
|
|
|
|
97,53 |
|
SENEGAL |
53,00 |
45,97 |
98,97 |
6,00 |
|
|
6,00 |
|
104,97 |
|
SEYCHELLES |
|
0,50 |
0,50 |
|
|
|
|
|
0,50 |
|
SIERRA LEONE |
|
60,50 |
60,50 |
32,00 |
|
25,00 |
57,00 |
|
117,50 |
|
SOMALIE |
|
103,09 |
103,09 |
|
|
|
|
|
103,09 |
|
SAO TOME & PRINCIPE |
|
9,40 |
9,40 |
|
|
|
|
|
9,40 |
|
SOUDAN |
|
5,68 |
5,68 |
17,70 |
|
|
17,70 |
|
23,38 |
|
SWAZILAND |
|
7,43 |
7,43 |
|
|
|
|
|
7,43 |
|
TANZANIE |
114,00 |
44,88 |
158,88 |
|
|
|
|
|
158,88 |
|
TOGO |
|
10,84 |
10,84 |
|
|
|
|
|
10,84 |
|
OUGANDA |
|
37,43 |
37,43 |
14,62 |
|
|
14,62 |
|
52,05 |
|
NIGERIA |
|
271,96 |
271,96 |
|
|
|
|
|
271,96 |
|
ZAMBIE |
117,00 |
88,98 |
205,98 |
2,00 |
|
11,49 |
13,49 |
|
219,47 |
|
ZIMBABWE |
|
9,46 |
9,46 |
|
|
|
|
|
9,46 |
|
REP. DEMOCRATIQUE CONGO |
106,00 |
20,28 |
126,28 |
30,90 |
|
|
30,90 |
|
157,18 |
|
* TOTAL AFRIQUE |
1 066,24 |
2 214,92 |
3 281,16 |
334,70 |
7,60 |
39,67 |
381,97 |
|
3 663,13 |
|
ANTIGUA-BARBUDA |
|
4,86 |
4,86 |
|
|
|
|
|
4,86 |
|
BARBADE |
|
12,23 |
12,23 |
|
|
|
|
|
12,23 |
|
BELIZE |
|
0,55 |
0,55 |
|
|
|
|
|
0,55 |
|
BAHAMAS |
|
0,15 |
0,15 |
|
|
|
|
|
0,15 |
|
REPUBLIQUE DOMINICAINE |
|
4,07 |
4,07 |
|
|
30,00 |
30,00 |
|
34,07 |
|
DOMINIQUE |
|
0,44 |
0,44 |
|
|
|
|
|
0,44 |
|
GRENADE |
|
0,83 |
0,83 |
|
|
|
|
|
0,83 |
|
GUYANE (ETAT) |
14,90 |
6,75 |
21,65 |
|
|
8,40 |
8,40 |
|
30,05 |
|
HAITI |
|
71,69 |
71,69 |
|
|
|
|
|
71,69 |
|
JAMAIQUE |
|
22,21 |
22,21 |
26,20 |
|
|
26,20 |
|
48,41 |
|
ST CHRISTOPHE (KITTS) & NEVI |
|
3,68 |
3,68 |
|
|
|
|
|
3,68 |
|
SAINTE LUCIE |
|
0,56 |
0,56 |
|
|
|
|
|
0,56 |
|
SURINAME |
|
34,31 |
34,31 |
|
|
|
|
|
34,31 |
|
SAINT VINCENT & GRENADINES |
|
7,38 |
7,38 |
|
|
|
|
|
7,38 |
|
TRINITE & TOBAGO |
|
9,98 |
9,98 |
|
|
|
|
|
9,98 |
|
* TOTAL CARAIBES |
14,90 |
179,68 |
194,58 |
26,20 |
|
38,40 |
64,60 |
|
259,18 |
|
FIDJI |
|
21,00 |
21,00 |
|
|
|
|
|
21,00 |
|
KIRIBATI |
|
8,80 |
8,80 |
|
|
|
|
|
8,80 |
|
PAPOUASIE NOUVELLE GUINEE |
|
6,19 |
6,19 |
|
|
|
|
|
6,19 |
|
SALOMON |
|
5,78 |
5,78 |
|
|
|
|
|
5,78 |
|
TONGA |
|
3,00 |
3,00 |
0,89 |
|
|
0,89 |
|
3,89 |
|
TUVALU |
|
3,97 |
3,97 |
|
|
|
|
|
3,97 |
|
VANUATU |
|
7,10 |
7,10 |
1,35 |
|
1,70 |
3,05 |
|
10,15 |
|
SAMOA |
|
2,50 |
2,50 |
|
|
|
|
|
2,50 |
|
NIUE |
|
0,20 |
0,20 |
|
|
|
|
|
0,20 |
|
ILES COOK |
|
2,00 |
2,00 |
|
|
|
|
|
2,00 |
|
* TOTAL PACIFIQUE |
|
60,54 |
60,54 |
2,24 |
|
1,70 |
3,94 |
|
64,48 |
|
REGION AFRIQUE OCCIDENTALE |
|
|
40,71 |
|
|
|
|
|
40,71 |
|
REGION AFRIQUE CENTRALE |
|
|
8,16 |
|
|
|
|
|
8,16 |
|
REGION DES CARAIBES |
|
|
48,17 |
|
|
|
|
|
48,17 |
|
REGION DU PACIFIQUE |
|
|
29,00 |
|
|
|
|
|
29,00 |
|
COOPERATION REGIONALE ACP |
|
|
1 173,42 |
|
|
|
|
|
1 173,42 |
|
REGION ESA |
|
|
145,21 |
|
|
|
|
|
145,21 |
|
REGION SADC |
|
|
24,82 |
|
|
|
|
|
24,82 |
|
* TOTAL COOPER. REGIONALE ACP |
|
|
1 469,49 |
|
|
|
|
|
1 469,49 |
|
TOUS PAYS ACP |
|
|
64,85 |
|
|
|
|
|
64,85 |
|
FRAIS ADMINISTR. & FINANCIERS |
|
|
|
|
|
|
|
218,76 |
218,76 |
|
* TOTAL ACP |
1 081,14 |
2 455,13 |
5 070,61 |
363,14 |
7,60 |
79,77 |
450,51 |
218,76 |
5 739,88 |
|
MAYOTTE |
|
0,09 |
0,09 |
|
|
|
|
|
0,09 |
|
NOUVELLE CALEDONIE |
|
21,50 |
21,50 |
|
|
|
|
|
21,50 |
|
POLYNESIE FRANCAISE |
|
3,65 |
3,65 |
|
|
|
|
|
3,65 |
|
WALLIS & FUTUNA |
|
0,67 |
0,67 |
|
|
|
|
|
0,67 |
|
* TOTAL PTOM FRANCAIS |
|
25,91 |
25,91 |
|
|
|
|
|
25,91 |
|
ARUBA |
|
4,40 |
4,40 |
|
|
|
|
|
4,40 |
|
ANTILLES NEERLANDAISES |
|
10,72 |
10,72 |
|
|
|
|
|
10,72 |
|
* TOTAL PTOM NEERLANDAIS |
|
15,12 |
15,12 |
|
|
|
|
|
15,12 |
|
MONTSERRAT |
|
5,70 |
5,70 |
|
|
|
|
|
5,70 |
|
SAINTE HELENE |
|
0,15 |
0,15 |
|
|
|
|
|
0,15 |
|
TURKS & CAICOS |
|
0,02 |
0,02 |
|
|
|
|
|
0,02 |
|
* TOTAL PTOM BRITANNIQUES |
|
5,87 |
5,87 |
|
|
|
|
|
5,87 |
|
COOPERATION REGIONALE PTOM |
|
|
7,10 |
|
|
|
|
|
7,10 |
|
* COOPERATION REGIONALE PTOM |
|
|
7,10 |
|
|
|
|
|
7,10 |
|
TOUS PTOM |
|
|
|
|
|
|
|
0,65 |
0,65 |
|
* TOTAL PTOM |
|
46,90 |
54,00 |
|
|
|
|
0,65 |
54,65 |
|
* TOTAL ACP + PTOM |
1 081,14 |
2 502,04 |
5 124,61 |
363,14 |
7,60 |
79,77 |
450,51 |
219,41 |
5 794,53 |
Table 3.4.4
9th EDF
DECISIONS ANNUAL 2004
SITUATION BY INSTRUMENT AND STATE
|
(million EUR) |
|||||||||
|
|
Cotonou |
||||||||
|
Envelope A |
Envelope B |
Implementation Costs |
Total state |
||||||
|
Macroeconomic support |
Sectoral politic |
Total env. A |
Emergency aid |
Debt relief |
Loss on exportation compensation |
Total env. B |
|||
|
ANGOLA |
|
23,92 |
23,92 |
0,80 |
|
|
0,80 |
|
24,72 |
|
BENIN |
|
6,23 |
6,23 |
|
|
|
|
|
6,23 |
|
BURKINA FASO |
|
3,23 |
3,23 |
|
|
|
|
|
3,23 |
|
BOTSWANA |
|
1,39 |
1,39 |
|
|
|
|
|
1,39 |
|
BURUNDI |
32,84 |
41,40 |
74,24 |
7,39 |
7,60 |
3,18 |
18,17 |
|
92,41 |
|
CENTRAFRIQUE |
|
4,61 |
4,61 |
0,47 |
|
|
0,47 |
|
5,08 |
|
TCHAD |
|
7,70 |
7,70 |
9,80 |
|
|
9,80 |
|
17,50 |
|
CAMEROUN |
|
4,48 |
4,48 |
|
|
|
|
|
4,48 |
|
CONGO |
|
12,47 |
12,47 |
2,00 |
|
|
2,00 |
|
14,47 |
|
COMORES |
|
|
|
1,80 |
|
|
1,80 |
|
1,80 |
|
CAP VERT |
|
3,56 |
3,56 |
5,81 |
|
|
5,81 |
|
9,37 |
|
DJIBOUTI |
|
9,60 |
9,60 |
|
|
|
|
|
9,60 |
|
GUINEE EQUATORIALE |
|
2,81 |
2,81 |
|
|
|
|
|
2,81 |
|
ERITHREE |
|
20,35 |
20,35 |
|
|
|
|
|
20,35 |
|
ETHIOPIE |
95,00 |
11,73 |
106,73 |
7,50 |
|
|
7,50 |
|
114,23 |
|
GABON |
|
7,39 |
7,39 |
|
|
|
|
|
7,39 |
|
GHANA |
62,00 |
37,48 |
99,48 |
|
|
|
|
|
99,48 |
|
GAMBIE |
|
4,58 |
4,58 |
|
|
|
|
|
4,58 |
|
GUINEE BISSAU |
|
2,46 |
2,46 |
|
|
|
|
|
2,46 |
|
COTE D'IVOIRE |
|
5,83 |
5,83 |
30,00 |
|
|
30,00 |
|
35,83 |
|
KENYA |
125,00 |
21,00 |
146,00 |
3,85 |
|
|
3,85 |
|
149,85 |
|
LIBERIA |
|
|
|
10,80 |
|
|
10,80 |
|
10,80 |
|
LESOTHO |
|
1,99 |
1,99 |
|
|
|
|
|
1,99 |
|
MADAGASCAR |
|
130,00 |
130,00 |
5,90 |
|
|
5,90 |
|
135,90 |
|
MALAWI |
|
43,14 |
43,14 |
|
|
|
|
|
43,14 |
|
MAURICE |
|
0,42 |
0,42 |
|
|
|
|
|
0,42 |
|
MAURITANIE |
|
7,80 |
7,80 |
7,50 |
|
|
7,50 |
|
15,30 |
|
MALI |
|
123,88 |
123,88 |
5,70 |
|
|
5,70 |
|
129,58 |
|
MOZAMBIQUE |
|
20,40 |
20,40 |
5,00 |
|
|
5,00 |
|
25,40 |
|
NAMIBIE |
|
65,01 |
65,01 |
1,00 |
|
|
1,00 |
|
66,01 |
|
NIGER |
|
37,99 |
37,99 |
2,50 |
|
|
2,50 |
|
40,49 |
|
RWANDA |
|
10,73 |
10,73 |
|
|
|
|
|
10,73 |
|
SENEGAL |
53,00 |
45,18 |
98,18 |
6,00 |
|
|
6,00 |
|
104,18 |
|
SEYCHELLES |
|
0,50 |
0,50 |
|
|
|
|
|
0,50 |
|
SIERRA LEONE |
|
8,00 |
8,00 |
7,00 |
|
|
7,00 |
|
15,00 |
|
SOMALIE |
|
3,09 |
3,09 |
|
|
|
|
|
3,09 |
|
SAO TOME & PRINCIPE |
|
9,40 |
9,40 |
|
|
|
|
|
9,40 |
|
SOUDAN |
|
5,20 |
5,20 |
17,70 |
|
|
17,70 |
|
22,90 |
|
SWAZILAND |
|
2,70 |
2,70 |
|
|
|
|
|
2,70 |
|
TANZANIE |
|
42,06 |
42,06 |
|
|
|
|
|
42,06 |
|
TOGO |
|
1,26 |
1,26 |
|
|
|
|
|
1,26 |
|
OUGANDA |
|
25,45 |
25,45 |
12,62 |
|
|
12,62 |
|
38,07 |
|
NIGERIA |
|
271,88 |
271,88 |
|
|
|
|
|
271,88 |
|
ZAMBIE |
|
87,02 |
87,02 |
2,00 |
|
|
2,00 |
|
89,02 |
|
ZIMBABWE |
|
9,40 |
9,40 |
|
|
|
|
|
9,40 |
|
REP. DEMOCRATIQUE CONGO |
|
3,00 |
3,00 |
|
|
|
|
|
3,00 |
|
* TOTAL AFRIQUE |
367,84 |
1 187,69 |
1 555,53 |
153,14 |
7,60 |
3,18 |
163,92 |
|
1 719,45 |
|
ANTIGUA-BARBUDA |
|
0,40 |
0,40 |
|
|
|
|
|
0,40 |
|
BARBADE |
|
12,20 |
12,20 |
|
|
|
|
|
12,20 |
|
BELIZE |
|
0,55 |
0,55 |
|
|
|
|
|
0,55 |
|
BAHAMAS |
|
0,15 |
0,15 |
|
|
|
|
|
0,15 |
|
REPUBLIQUE DOMINICAINE |
|
2,90 |
2,90 |
|
|
30,00 |
30,00 |
|
32,90 |
|
DOMINIQUE |
|
0,30 |
0,30 |
|
|
|
|
|
0,30 |
|
GRENADE |
|
0,43 |
0,43 |
|
|
|
|
|
0,43 |
|
GUYANE (ETAT) |
14,90 |
6,57 |
21,47 |
|
|
8,40 |
8,40 |
|
29,87 |
|
HAITI |
|
37,74 |
37,74 |
|
|
|
|
|
37,74 |
|
JAMAIQUE |
|
20,96 |
20,96 |
26,20 |
|
|
26,20 |
|
47,16 |
|
ST CHRISTOPHE (KITTS) & NEVI |
|
0,50 |
0,50 |
|
|
|
|
|
0,50 |
|
SAINTE LUCIE |
|
0,45 |
0,45 |
|
|
|
|
|
0,45 |
|
SURINAME |
|
1,13 |
1,13 |
|
|
|
|
|
1,13 |
|
SAINT VINCENT & GRENADINES |
|
0,50 |
0,50 |
|
|
|
|
|
0,50 |
|
TRINITE & TOBAGO |
|
8,13 |
8,13 |
|
|
|
|
|
8,13 |
|
* TOTAL CARAIBES |
14,90 |
92,91 |
107,81 |
26,20 |
|
38,40 |
64,60 |
|
172,41 |
|
FIDJI |
|
21,00 |
21,00 |
|
|
|
|
|
21,00 |
|
KIRIBATI |
|
8,80 |
8,80 |
|
|
|
|
|
8,80 |
|
PAPOUASIE NOUVELLE GUINEE |
|
6,19 |
6,19 |
|
|
|
|
|
6,19 |
|
SALOMON |
|
5,70 |
5,70 |
|
|
|
|
|
5,70 |
|
VANUATU |
|
0,57 |
0,57 |
|
|
1,70 |
1,70 |
|
2,27 |
|
SAMOA |
|
2,30 |
2,30 |
|
|
|
|
|
2,30 |
|
NIUE |
|
0,20 |
0,20 |
|
|
|
|
|
0,20 |
|
* TOTAL PACIFIQUE |
|
44,76 |
44,76 |
|
|
1,70 |
1,70 |
|
46,46 |
|
REGION AFRIQUE OCCIDENTALE |
|
|
9,50 |
|
|
|
|
|
9,50 |
|
REGION AFRIQUE CENTRALE |
|
|
3,29 |
|
|
|
|
|
3,29 |
|
REGION DES CARAIBES |
|
|
22,00 |
|
|
|
|
|
22,00 |
|
REGION DU PACIFIQUE |
|
|
3,76 |
|
|
|
|
|
3,76 |
|
COOPERATION REGIONALE ACP |
|
|
413,62 |
|
|
|
|
|
413,62 |
|
REGION ESA |
|
|
79,29 |
|
|
|
|
|
79,29 |
|
REGION SADC |
|
|
9,82 |
|
|
|
|
|
9,82 |
|
* TOTAL COOPER. REGIONALE ACP |
|
|
541,28 |
|
|
|
|
|
541,28 |
|
TOUS PAYS ACP |
|
|
26,97 |
|
|
|
|
|
26,97 |
|
FRAIS ADMINISTR. & FINANCIERS |
|
|
|
|
|
|
|
93,76 |
93,76 |
|
* TOTAL ACP |
382,74 |
1 325,36 |
2 276,35 |
179,34 |
7,60 |
43,28 |
230,22 |
93,76 |
2 600,33 |
|
MAYOTTE |
|
0,09 |
0,09 |
|
|
|
|
|
0,09 |
|
NOUVELLE CALEDONIE |
|
21,50 |
21,50 |
|
|
|
|
|
21,50 |
|
POLYNESIE FRANÇAISE |
|
3,65 |
3,65 |
|
|
|
|
|
3,65 |
|
WALLIS & FUTUNA |
|
0,67 |
0,67 |
|
|
|
|
|
0,67 |
|
* TOTAL PTOM FRANÇAIS |
|
25,91 |
25,91 |
|
|
|
|
|
25,91 |
|
ARUBA |
|
4,40 |
4,40 |
|
|
|
|
|
4,40 |
|
ANTILLES NEERLANDAISES |
|
1,00 |
1,00 |
|
|
|
|
|
1,00 |
|
* TOTAL PTOM NEERLANDAIS |
|
5,40 |
5,40 |
|
|
|
|
|
5,40 |
|
COOPERATION REGIONALE PTOM |
|
|
6,45 |
|
|
|
|
|
6,45 |
|
* COOPERATION REGIONALE PTOM |
|
|
6,45 |
|
|
|
|
|
6,45 |
|
* TOTAL PTOM |
|
31,31 |
37,75 |
|
|
|
|
|
37,75 |
|
* TOTAL ACP + PTOM |
382,74 |
1 356,66 |
2 314,11 |
179,34 |
7,60 |
43,28 |
230,22 |
93,76 |
2 638,08 |
Table 3.4.5
9th EDF
Assigned funds cumulative 2004
SITUATION BY INSTRUMENT AND STATE
|
(million EUR) |
|||||||||
|
|
Cotonou |
||||||||
|
Envelope A |
Envelope B |
Implementation Costs |
Total state |
||||||
|
Macroeconomic support |
Sectoral politic |
Total env. A |
Emergency aid |
Debt relief |
Loss on exportation compensation |
Total env. B |
|||
|
ANGOLA |
|
45,68 |
45,68 |
12,94 |
|
|
12,94 |
|
58,62 |
|
BENIN |
53,50 |
55,35 |
108,85 |
|
|
|
|
|
108,85 |
|
BURKINA FASO |
|
29,51 |
29,51 |
|
|
|
|
|
29,51 |
|
BURUNDI |
31,59 |
|
31,59 |
19,36 |
7,60 |
3,18 |
30,14 |
|
61,73 |
|
CENTRAFRIQUE |
|
3,05 |
3,05 |
1,47 |
|
|
1,47 |
|
4,52 |
|
TCHAD |
|
57,09 |
57,09 |
4,84 |
|
|
4,84 |
|
61,93 |
|
CAMEROUN |
|
0,48 |
0,48 |
|
|
|
|
|
0,48 |
|
CONGO |
|
0,57 |
0,57 |
1,47 |
|
|
1,47 |
|
2,04 |
|
COMORES |
|
0,02 |
0,02 |
1,74 |
|
|
1,74 |
|
1,76 |
|
CAP VERT |
|
|
|
5,50 |
|
|
5,50 |
|
5,50 |
|
DJIBOUTI |
|
0,58 |
0,58 |
|
|
|
|
|
0,58 |
|
GUINEE EQUATORIALE |
|
1,59 |
1,59 |
|
|
|
|
|
1,59 |
|
ERITHREE |
|
2,09 |
2,09 |
|
|
|
|
|
2,09 |
|
ETHIOPIE |
91,07 |
0,47 |
91,54 |
2,19 |
|
|
2,19 |
|
93,73 |
|
GABON |
|
1,93 |
1,93 |
|
|
|
|
|
1,93 |
|
GHANA |
60,01 |
4,54 |
64,55 |
|
|
|
|
|
64,55 |
|
GAMBIE |
|
0,66 |
0,66 |
|
|
|
|
|
0,66 |
|
GUINEE BISSAU |
|
1,18 |
1,18 |
|
|
|
|
|
1,18 |
|
COTE D'IVOIRE |
|
0,21 |
0,21 |
27,61 |
|
|
27,61 |
|
27,82 |
|
KENYA |
|
45,63 |
45,63 |
0,50 |
|
|
0,50 |
|
46,13 |
|
LIBERIA |
|
24,20 |
24,20 |
3,27 |
|
|
3,27 |
|
27,47 |
|
LESOTHO |
|
1,16 |
1,16 |
|
|
|
|
|
1,16 |
|
MADAGASCAR |
|
124,04 |
124,04 |
|
|
|
|
|
124,04 |
|
MALAWI |
|
7,27 |
7,27 |
|
|
|
|
|
7,27 |
|
MAURICE |
|
28,01 |
28,01 |
0,47 |
|
|
0,47 |
|
28,49 |
|
MAURITANIE |
|
0,81 |
0,81 |
7,50 |
|
|
7,50 |
|
8,31 |
|
MALI |
94,50 |
33,94 |
128,44 |
38,38 |
|
|
38,38 |
|
166,82 |
|
MOZAMBIQUE |
16,40 |
48,19 |
64,59 |
|
|
|
|
|
64,59 |
|
NAMIBIE |
|
23,30 |
23,30 |
1,00 |
|
|
1,00 |
|
24,30 |
|
NIGER |
88,00 |
12,26 |
100,26 |
2,50 |
|
|
2,50 |
|
102,76 |
|
RWANDA |
48,00 |
4,68 |
52,68 |
|
|
|
|
|
52,68 |
|
SENEGAL |
|
1,24 |
1,24 |
6,00 |
|
|
6,00 |
|
7,24 |
|
SIERRA LEONE |
|
6,64 |
6,64 |
18,93 |
|
|
18,93 |
|
25,58 |
|
SOMALIE |
|
45,22 |
45,22 |
|
|
|
|
|
45,22 |
|
SAO TOME & PRINCIPE |
|
1,43 |
1,43 |
|
|
|
|
|
1,43 |
|
SOUDAN |
|
0,40 |
0,40 |
4,47 |
|
|
4,47 |
|
4,87 |
|
SWAZILAND |
|
2,70 |
2,70 |
|
|
|
|
|
2,70 |
|
TANZANIE |
111,10 |
5,11 |
116,21 |
|
|
|
|
|
116,21 |
|
TOGO |
|
0,07 |
0,07 |
|
|
|
|
|
0,07 |
|
OUGANDA |
|
2,18 |
2,18 |
14,00 |
|
|
14,00 |
|
16,18 |
|
NIGERIA |
|
114,82 |
114,82 |
|
|
|
|
|
114,82 |
|
ZAMBIE |
110,00 |
3,71 |
113,71 |
2,00 |
|
11,49 |
13,49 |
|
127,20 |
|
ZIMBABWE |
|
0,68 |
0,68 |
|
|
|
|
|
0,68 |
|
REP. DEMOCRATIQUE CONGO |
105,70 |
15,38 |
121,08 |
17,43 |
|
|
17,43 |
|
138,51 |
|
* TOTAL AFRIQUE |
809,87 |
758,08 |
1 567,94 |
193,58 |
7,60 |
14,67 |
215,85 |
|
1 783,79 |
|
ANTIGUA-BARBUDA |
|
0,44 |
0,44 |
|
|
|
|
|
0,44 |
|
BARBADE |
|
0,03 |
0,03 |
|
|
|
|
|
0,03 |
|
BELIZE |
|
0,12 |
0,12 |
|
|
|
|
|
0,12 |
|
REPUBLIQUE DOMINICAINE |
|
0,70 |
0,70 |
|
|
|
|
|
0,70 |
|
DOMINIQUE |
|
0,15 |
0,15 |
|
|
|
|
|
0,15 |
|
GRENADE |
|
0,26 |
0,26 |
|
|
|
|
|
0,26 |
|
GUYANE (ETAT) |
13,93 |
0,38 |
14,31 |
|
|
8,40 |
8,40 |
|
22,71 |
|
HAITI |
|
8,56 |
8,56 |
|
|
|
|
|
8,56 |
|
JAMAIQUE |
|
5,74 |
5,74 |
26,19 |
|
|
26,19 |
|
31,92 |
|
ST CHRISTOPHE (KITTS) & NEVI |
|
0,20 |
0,20 |
|
|
|
|
|
0,20 |
|
SAINTE LUCIE |
|
0,08 |
0,08 |
|
|
|
|
|
0,08 |
|
SURINAME |
|
0,13 |
0,13 |
|
|
|
|
|
0,13 |
|
SAINT VINCENT & GRENADINES |
|
0,82 |
0,82 |
|
|
|
|
|
0,82 |
|
* TOTAL CARAIBES |
13,93 |
17,60 |
31,53 |
26,19 |
|
8,40 |
34,59 |
|
66,11 |
|
PAPOUASIE NOUVELLE GUINEE |
|
0,07 |
0,07 |
|
|
|
|
|
0,07 |
|
SALOMON |
|
0,07 |
0,07 |
|
|
|
|
|
0,07 |
|
TONGA |
|
0,79 |
0,79 |
0,79 |
|
|
0,79 |
|
1,59 |
|
TUVALU |
|
2,08 |
2,08 |
|
|
|
|
|
2,08 |
|
VANUATU |
|
2,17 |
2,17 |
1,21 |
|
1,63 |
2,84 |
|
5,01 |
|
SAMOA |
|
0,48 |
0,48 |
|
|
|
|
|
0,48 |
|
ILES COOK |
|
1,55 |
1,55 |
|
|
|
|
|
1,55 |
|
* TOTAL PACIFIQUE |
|
7,21 |
7,21 |
2,00 |
|
1,63 |
3,63 |
|
10,84 |
|
REGION AFRIQUE OCCIDENTALE |
|
|
3,44 |
|
|
|
|
|
3,44 |
|
REGION AFRIQUE CENTRALE |
|
|
5,65 |
|
|
|
|
|
5,65 |
|
REGION DES CARAIBES |
|
|
6,50 |
|
|
|
|
|
6,50 |
|
REGION DU PACIFIQUE |
|
|
23,87 |
|
|
|
|
|
23,87 |
|
COOPERATION REGIONALE ACP |
|
|
592,50 |
|
|
|
|
|
592,50 |
|
REGION ESA |
|
|
23,32 |
|
|
|
|
|
23,32 |
|
REGION SADC |
|
|
2,53 |
|
|
|
|
|
2,53 |
|
* TOTAL COOPER. REGIONALE ACP |
|
|
657,83 |
|
|
|
|
|
657,83 |
|
TOUS PAYS ACP |
|
|
36,52 |
|
|
|
|
|
36,52 |
|
FRAIS ADMINISTR. & FINANCIERS |
|
|
|
|
|
|
|
157,50 |
157,50 |
|
* TOTAL ACP |
823,80 |
782,89 |
2 301,03 |
221,77 |
7,60 |
24,70 |
254,07 |
157,50 |
2 712,59 |
|
NOUVELLE CALEDONIE |
|
21,50 |
21,50 |
|
|
|
|
|
21,50 |
|
WALLIS & FUTUNA |
|
0,37 |
0,37 |
|
|
|
|
|
0,37 |
|
* TOTAL PTOM FRANÇAIS |
|
21,87 |
21,87 |
|
|
|
|
|
21,87 |
|
ANTILLES NEERLANDAISES |
|
5,26 |
5,26 |
|
|
|
|
|
5,26 |
|
* TOTAL PTOM NEERLANDAIS |
|
5,26 |
5,26 |
|
|
|
|
|
5,26 |
|
SAINTE HELENE |
|
0,15 |
0,15 |
|
|
|
|
|
0,15 |
|
TURKS & CAICOS |
|
0,02 |
0,02 |
|
|
|
|
|
0,02 |
|
* TOTAL PTOM BRITANNIQUES |
|
0,17 |
0,17 |
|
|
|
|
|
0,17 |
|
COOPERATION REGIONALE PTOM |
|
|
0,84 |
|
|
|
|
|
0,84 |
|
* COOPERATION REGIONALE PTOM |
|
|
0,84 |
|
|
|
|
|
0,84 |
|
TOUS PTOM |
|
|
|
|
|
|
|
0,45 |
0,45 |
|
* TOTAL PTOM |
|
27,30 |
28,15 |
|
|
|
|
0,45 |
28,60 |
|
* TOTAL ACP + PTOM |
823,80 |
810,19 |
2 329,17 |
221,77 |
7,60 |
24,70 |
254,07 |
157,95 |
2 741,19 |
Table 3.4.6
9th EDF
Assigned funds — Annual 2004
SITUATION BY INSTRUMENT AND STATE
|
(million EUR) |
|||||||||
|
|
Cotonou |
||||||||
|
Envelope A |
Envelope B |
Implementation Costs |
Total state |
||||||
|
Macroeconomic support |
Sectoral politic |
Total env. A |
Emergency aid |
Debt relief |
Loss on exportation compensation |
Total env. B |
|||
|
ANGOLA |
|
45,64 |
45,64 |
12,94 |
|
|
12,94 |
|
58,58 |
|
BENIN |
53,50 |
55,35 |
108,85 |
|
|
|
|
|
108,85 |
|
BURKINA FASO |
|
29,51 |
29,51 |
|
|
|
|
|
29,51 |
|
BURUNDI |
31,59 |
|
31,59 |
19,36 |
7,60 |
3,18 |
30,14 |
|
61,73 |
|
CENTRAFRIQUE |
|
3,05 |
3,05 |
0,47 |
|
|
0,47 |
|
3,52 |
|
TCHAD |
|
11,09 |
11,09 |
4,84 |
|
|
4,84 |
|
15,93 |
|
CAMEROUN |
|
0,35 |
0,35 |
|
|
|
|
|
0,35 |
|
CONGO |
|
0,49 |
0,49 |
1,47 |
|
|
1,47 |
|
1,96 |
|
COMORES |
|
0,02 |
0,02 |
1,74 |
|
|
1,74 |
|
1,76 |
|
CAP VERT |
|
|
|
5,50 |
|
|
5,50 |
|
5,50 |
|
DJIBOUTI |
|
0,58 |
0,58 |
|
|
|
|
|
0,58 |
|
GUINEE EQUATORIALE |
|
1,59 |
1,59 |
|
|
|
|
|
1,59 |
|
ERITHREE |
|
2,09 |
2,09 |
|
|
|
|
|
2,09 |
|
ETHIOPIE |
91,07 |
0,40 |
91,47 |
2,19 |
|
|
2,19 |
|
93,65 |
|
GABON |
|
1,85 |
1,85 |
|
|
|
|
|
1,85 |
|
GHANA |
60,01 |
3,74 |
63,75 |
|
|
|
|
|
63,75 |
|
GAMBIE |
|
0,66 |
0,66 |
|
|
|
|
|
0,66 |
|
GUINEE BISSAU |
|
0,08 |
0,08 |
|
|
|
|
|
0,08 |
|
COTE D'IVOIRE |
|
0,21 |
0,21 |
17,77 |
|
|
17,77 |
|
17,98 |
|
KENYA |
|
45,63 |
45,63 |
0,50 |
|
|
0,50 |
|
46,13 |
|
LIBERIA |
|
16,49 |
16,49 |
3,27 |
|
|
3,27 |
|
19,77 |
|
LESOTHO |
|
0,66 |
0,66 |
|
|
|
|
|
0,66 |
|
MADAGASCAR |
|
123,74 |
123,74 |
|
|
|
|
|
123,74 |
|
MALAWI |
|
7,16 |
7,16 |
|
|
|
|
|
7,16 |
|
MAURICE |
|
28,01 |
28,01 |
0,47 |
|
|
0,47 |
|
28,49 |
|
MAURITANIE |
|
0,51 |
0,51 |
7,50 |
|
|
7,50 |
|
8,01 |
|
MALI |
|
33,49 |
33,49 |
5,46 |
|
|
5,46 |
|
38,95 |
|
MOZAMBIQUE |
|
48,19 |
48,19 |
|
|
|
|
|
48,19 |
|
NAMIBIE |
|
4,96 |
4,96 |
1,00 |
|
|
1,00 |
|
5,96 |
|
NIGER |
|
10,98 |
10,98 |
2,50 |
|
|
2,50 |
|
13,48 |
|
RWANDA |
|
2,89 |
2,89 |
|
|
|
|
|
2,89 |
|
SENEGAL |
|
1,21 |
1,21 |
6,00 |
|
|
6,00 |
|
7,21 |
|
SIERRA LEONE |
|
6,57 |
6,57 |
18,93 |
|
|
18,93 |
|
25,51 |
|
SOMALIE |
|
45,22 |
45,22 |
|
|
|
|
|
45,22 |
|
SAO TOME & PRINCIPE |
|
1,43 |
1,43 |
|
|
|
|
|
1,43 |
|
SOUDAN |
|
0,24 |
0,24 |
4,47 |
|
|
4,47 |
|
4,71 |
|
SWAZILAND |
|
2,14 |
2,14 |
|
|
|
|
|
2,14 |
|
TANZANIE |
2,10 |
5,11 |
7,21 |
|
|
|
|
|
7,21 |
|
TOGO |
|
0,07 |
0,07 |
|
|
|
|
|
0,07 |
|
OUGANDA |
|
2,18 |
2,18 |
12,39 |
|
|
12,39 |
|
14,57 |
|
NIGERIA |
|
114,82 |
114,82 |
|
|
|
|
|
114,82 |
|
ZAMBIE |
110,00 |
3,71 |
113,71 |
2,00 |
|
11,49 |
13,49 |
|
127,20 |
|
ZIMBABWE |
|
0,63 |
0,63 |
|
|
|
|
|
0,63 |
|
REP. DEMOCRATIQUE CONGO |
|
15,38 |
15,38 |
13,43 |
|
|
13,43 |
|
28,81 |
|
* TOTAL AFRIQUE |
348,26 |
678,13 |
1 026,39 |
144,20 |
7,60 |
14,67 |
166,47 |
|
1 192,87 |
|
ANTIGUA-BARBUDA |
|
0,44 |
0,44 |
|
|
|
|
|
0,44 |
|
BELIZE |
|
0,12 |
0,12 |
|
|
|
|
|
0,12 |
|
REPUBLIQUE DOMINICAINE |
|
0,50 |
0,50 |
|
|
|
|
|
0,50 |
|
DOMINIQUE |
|
0,15 |
0,15 |
|
|
|
|
|
0,15 |
|
GRENADE |
|
0,26 |
0,26 |
|
|
|
|
|
0,26 |
|
GUYANE (ETAT) |
13,93 |
0,38 |
14,31 |
|
|
8,40 |
8,40 |
|
22,71 |
|
HAITI |
|
8,56 |
8,56 |
|
|
|
|
|
8,56 |
|
JAMAIQUE |
|
5,74 |
5,74 |
26,19 |
|
|
26,19 |
|
31,92 |
|
ST CHRISTOPHE (KITTS) & NEVI |
|
0,20 |
0,20 |
|
|
|
|
|
0,20 |
|
SAINTE LUCIE |
|
0,08 |
0,08 |
|
|
|
|
|
0,08 |
|
SURINAME |
|
0,13 |
0,13 |
|
|
|
|
|
0,13 |
|
SAINT VINCENT & GRENADINES |
|
0,82 |
0,82 |
|
|
|
|
|
0,82 |
|
* TOTAL CARAIBES |
13,93 |
17,37 |
31,30 |
26,19 |
|
8,40 |
34,59 |
|
65,88 |
|
PAPOUASIE NOUVELLE GUINEE |
|
0,07 |
0,07 |
|
|
|
|
|
0,07 |
|
SALOMON |
|
0,04 |
0,04 |
|
|
|
|
|
0,04 |
|
TONGA |
|
0,79 |
0,79 |
0,79 |
|
|
0,79 |
|
1,59 |
|
TUVALU |
|
1,71 |
1,71 |
|
|
|
|
|
1,71 |
|
VANUATU |
|
1,85 |
1,85 |
1,09 |
|
1,63 |
2,72 |
|
4,58 |
|
SAMOA |
|
0,48 |
0,48 |
|
|
|
|
|
0,48 |
|
ILES COOK |
|
1,01 |
1,01 |
|
|
|
|
|
1,01 |
|
* TOTAL PACIFIQUE |
|
5,95 |
5,95 |
1,88 |
|
1,63 |
3,51 |
|
9,46 |
|
REGION AFRIQUE OCCIDENTALE |
|
|
3,44 |
|
|
|
|
|
3,44 |
|
REGION AFRIQUE CENTRALE |
|
|
1,01 |
|
|
|
|
|
1,01 |
|
REGION DES CARAIBES |
|
|
5,94 |
|
|
|
|
|
5,94 |
|
REGION DU PACIFIQUE |
|
|
23,87 |
|
|
|
|
|
23,87 |
|
COOPERATION REGIONALE ACP |
|
|
218,12 |
|
|
|
|
|
218,12 |
|
REGION ESA |
|
|
21,04 |
|
|
|
|
|
21,04 |
|
REGION SADC |
|
|
2,53 |
|
|
|
|
|
2,53 |
|
* TOTAL COOPER. REGIONALE ACP |
|
|
275,96 |
|
|
|
|
|
275,96 |
|
TOUS PAYS ACP |
|
|
36,52 |
|
|
|
|
|
36,52 |
|
FRAIS ADMINISTR. & FINANCIERS |
|
|
|
|
|
|
|
139,01 |
139,01 |
|
* TOTAL ACP |
362,19 |
701,45 |
1 376,12 |
172,27 |
7,60 |
24,70 |
204,57 |
139,01 |
1 719,70 |
|
NOUVELLE CALEDONIE |
|
21,50 |
21,50 |
|
|
|
|
|
21,50 |
|
WALLIS & FUTUNA |
|
0,37 |
0,37 |
|
|
|
|
|
0,37 |
|
* TOTAL PTOM FRANÇAIS |
|
21,87 |
21,87 |
|
|
|
|
|
21,87 |
|
ANTILLES NEERLANDAISES |
|
5,07 |
5,07 |
|
|
|
|
|
5,07 |
|
* TOTAL PTOM NEERLANDAIS |
|
5,07 |
5,07 |
|
|
|
|
|
5,07 |
|
COOPERATION REGIONALE PTOM |
|
|
0,84 |
|
|
|
|
|
0,84 |
|
* COOPERATION REGIONALE PTOM |
|
|
0,84 |
|
|
|
|
|
0,84 |
|
* TOTAL PTOM |
|
26,94 |
27,78 |
|
|
|
|
|
27,78 |
|
* TOTAL ACP + PTOM |
362,19 |
728,38 |
1 403,90 |
172,27 |
7,60 |
24,70 |
204,57 |
139,01 |
1 747,48 |
Table 3.4.7
9th EDF
Payments — Cumulative 2004
SITUATION BY INSTRUMENT AND STATE
|
(million EUR) |
|||||||||
|
|
Cotonou |
||||||||
|
Envelope A |
Envelope B |
Implementation Costs |
Total state |
||||||
|
Macroeconomic support |
Sectoral politic |
Total env. A |
Emergency aid |
Debt relief |
Loss on exportation compensation |
Total env. B |
|||
|
ANGOLA |
|
22,66 |
22,66 |
0,40 |
|
|
0,40 |
|
23,06 |
|
BENIN |
18,32 |
21,67 |
39,99 |
|
|
|
|
|
39,99 |
|
BURKINA FASO |
|
0,23 |
0,23 |
|
|
|
|
|
0,23 |
|
BURUNDI |
1,34 |
|
1,34 |
19,36 |
|
3,18 |
22,54 |
|
23,88 |
|
CENTRAFRIQUE |
|
2,68 |
2,68 |
1,14 |
|
|
1,14 |
|
3,82 |
|
TCHAD |
|
2,74 |
2,74 |
3,01 |
|
|
3,01 |
|
5,75 |
|
CAMEROUN |
|
0,38 |
0,38 |
|
|
|
|
|
0,38 |
|
CONGO |
|
0,29 |
0,29 |
0,56 |
|
|
0,56 |
|
0,85 |
|
COMORES |
|
0,02 |
0,02 |
1,39 |
|
|
1,39 |
|
1,42 |
|
CAP VERT |
|
|
|
5,50 |
|
|
5,50 |
|
5,50 |
|
DJIBOUTI |
|
0,31 |
0,31 |
|
|
|
|
|
0,31 |
|
GUINEE EQUATORIALE |
|
0,28 |
0,28 |
|
|
|
|
|
0,28 |
|
ERITHREE |
|
0,21 |
0,21 |
|
|
|
|
|
0,21 |
|
ETHIOPIE |
45,04 |
0,13 |
45,17 |
0,93 |
|
|
0,93 |
|
46,11 |
|
GABON |
|
0,51 |
0,51 |
|
|
|
|
|
0,51 |
|
GHANA |
12,00 |
2,06 |
14,06 |
|
|
|
|
|
14,06 |
|
GAMBIE |
|
0,11 |
0,11 |
|
|
|
|
|
0,11 |
|
GUINEE BISSAU |
|
0,93 |
0,93 |
|
|
|
|
|
0,93 |
|
COTE D'IVOIRE |
|
0,03 |
0,03 |
20,50 |
|
|
20,50 |
|
20,53 |
|
KENYA |
|
0,08 |
0,08 |
0,40 |
|
|
0,40 |
|
0,48 |
|
LIBERIA |
|
13,69 |
13,69 |
2,04 |
|
|
2,04 |
|
15,73 |
|
LESOTHO |
|
0,28 |
0,28 |
|
|
|
|
|
0,28 |
|
MADAGASCAR |
|
37,74 |
37,74 |
|
|
|
|
|
37,74 |
|
MALAWI |
|
4,58 |
4,58 |
|
|
|
|
|
4,58 |
|
MAURICE |
|
8,01 |
8,01 |
0,19 |
|
|
0,19 |
|
8,20 |
|
MAURITANIE |
|
0,37 |
0,37 |
5,95 |
|
|
5,95 |
|
6,32 |
|
MALI |
22,20 |
5,87 |
28,07 |
37,39 |
|
|
37,39 |
|
65,45 |
|
MOZAMBIQUE |
12,00 |
7,35 |
19,35 |
|
|
|
|
|
19,35 |
|
NAMIBIE |
|
9,10 |
9,10 |
0,80 |
|
|
0,80 |
|
9,90 |
|
NIGER |
45,25 |
7,40 |
52,65 |
2,05 |
|
|
2,05 |
|
54,70 |
|
RWANDA |
25,00 |
2,17 |
27,17 |
|
|
|
|
|
27,17 |
|
SENEGAL |
|
0,42 |
0,42 |
4,84 |
|
|
4,84 |
|
5,26 |
|
SIERRA LEONE |
|
2,34 |
2,34 |
6,09 |
|
|
6,09 |
|
8,43 |
|
SOMALIE |
|
8,67 |
8,67 |
|
|
|
|
|
8,67 |
|
SAO TOME & PRINCIPE |
|
0,07 |
0,07 |
|
|
|
|
|
0,07 |
|
SOUDAN |
|
0,25 |
0,25 |
1,52 |
|
|
1,52 |
|
1,76 |
|
SWAZILAND |
|
1,13 |
1,13 |
|
|
|
|
|
1,13 |
|
TANZANIE |
64,54 |
2,21 |
66,75 |
|
|
|
|
|
66,75 |
|
TOGO |
|
0,04 |
0,04 |
|
|
|
|
|
0,04 |
|
OUGANDA |
|
0,91 |
0,91 |
4,16 |
|
|
4,16 |
|
5,08 |
|
NIGERIA |
|
38,50 |
38,50 |
|
|
|
|
|
38,50 |
|
ZAMBIE |
39,50 |
0,71 |
40,21 |
|
|
11,49 |
11,49 |
|
51,70 |
|
ZIMBABWE |
|
0,05 |
0,05 |
|
|
|
|
|
0,05 |
|
REP. DEMOCRATIQUE CONGO |
105,70 |
6,14 |
111,85 |
11,14 |
|
|
11,14 |
|
122,99 |
|
* TOTAL AFRIQUE |
390,89 |
213,36 |
604,25 |
129,35 |
|
14,67 |
144,02 |
|
748,27 |
|
ANTIGUA-BARBUDA |
|
0,04 |
0,04 |
|
|
|
|
|
0,04 |
|
BARBADE |
|
0,03 |
0,03 |
|
|
|
|
|
0,03 |
|
BELIZE |
|
0,07 |
0,07 |
|
|
|
|
|
0,07 |
|
REPUBLIQUE DOMINICAINE |
|
0,28 |
0,28 |
|
|
|
|
|
0,28 |
|
DOMINIQUE |
|
0,14 |
0,14 |
|
|
|
|
|
0,14 |
|
GRENADE |
|
0,02 |
0,02 |
|
|
|
|
|
0,02 |
|
GUYANE (ETAT) |
|
0,09 |
0,09 |
|
|
6,00 |
6,00 |
|
6,09 |
|
HAITI |
|
5,18 |
5,18 |
|
|
|
|
|
5,18 |
|
JAMAIQUE |
|
0,32 |
0,32 |
25,83 |
|
|
25,83 |
|
26,15 |
|
SAINTE LUCIE |
|
0,04 |
0,04 |
|
|
|
|
|
0,04 |
|
SURINAME |
|
0,09 |
0,09 |
|
|
|
|
|
0,09 |
|
* TOTAL CARAIBES |
|
6,29 |
6,29 |
25,83 |
|
6,00 |
31,83 |
|
38,12 |
|
SALOMON |
|
0,07 |
0,07 |
|
|
|
|
|
0,07 |
|
TONGA |
|
0,79 |
0,79 |
0,51 |
|
|
0,51 |
|
1,31 |
|
TUVALU |
|
1,62 |
1,62 |
|
|
|
|
|
1,62 |
|
VANUATU |
|
0,64 |
0,64 |
0,64 |
|
|
0,64 |
|
1,28 |
|
SAMOA |
|
0,27 |
0,27 |
|
|
|
|
|
0,27 |
|
ILES COOK |
|
1,48 |
1,48 |
|
|
|
|
|
1,48 |
|
* TOTAL PACIFIQUE |
|
4,88 |
4,88 |
1,15 |
|
|
1,15 |
|
6,03 |
|
REGION AFRIQUE OCCIDENTALE |
|
|
1,30 |
|
|
|
|
|
1,30 |
|
REGION AFRIQUE CENTRALE |
|
|
4,60 |
|
|
|
|
|
4,60 |
|
REGION DES CARAIBES |
|
|
0,66 |
|
|
|
|
|
0,66 |
|
REGION DU PACIFIQUE |
|
|
3,18 |
|
|
|
|
|
3,18 |
|
COOPERATION REGIONALE ACP |
|
|
329,25 |
|
|
|
|
|
329,25 |
|
REGION ESA |
|
|
3,14 |
|
|
|
|
|
3,14 |
|
REGION SADC |
|
|
0,61 |
|
|
|
|
|
0,61 |
|
* TOTAL COOPER. REGIONALE ACP |
|
|
342,73 |
|
|
|
|
|
342,73 |
|
TOUS PAYS ACP |
|
|
27,73 |
|
|
|
|
|
27,73 |
|
FRAIS ADMINISTR. & FINANCIERS |
|
|
|
|
|
|
|
55,17 |
55,17 |
|
* TOTAL ACP |
390,89 |
224,53 |
985,88 |
156,33 |
|
20,67 |
177,00 |
55,17 |
1 218,05 |
|
NOUVELLE CALEDONIE |
|
6,17 |
6,17 |
|
|
|
|
|
6,17 |
|
WALLIS & FUTUNA |
|
0,12 |
0,12 |
|
|
|
|
|
0,12 |
|
* TOTAL PTOM FRANÇAIS |
|
6,29 |
6,29 |
|
|
|
|
|
6,29 |
|
ANTILLES NEERLANDAISES |
|
0,18 |
0,18 |
|
|
|
|
|
0,18 |
|
* TOTAL PTOM NEERLANDAIS |
|
0,18 |
0,18 |
|
|
|
|
|
0,18 |
|
SAINTE HELENE |
|
0,11 |
0,11 |
|
|
|
|
|
0,11 |
|
TURKS & CAICOS |
|
0,02 |
0,02 |
|
|
|
|
|
0,02 |
|
* TOTAL PTOM BRITANNIQUES |
|
0,13 |
0,13 |
|
|
|
|
|
0,13 |
|
COOPERATION REGIONALE PTOM |
|
|
0,25 |
|
|
|
|
|
0,25 |
|
* COOPERATION REGIONALE PTOM |
|
|
0,25 |
|
|
|
|
|
0,25 |
|
TOUS PTOM |
|
|
|
|
|
|
|
0,32 |
0,32 |
|
* TOTAL PTOM |
|
6,61 |
6,85 |
|
|
|
|
0,32 |
7,17 |
|
* TOTAL ACP + PTOM |
390,89 |
231,13 |
992,73 |
156,33 |
|
20,67 |
177,00 |
55,49 |
1 225,22 |
Table 3.4.8
9th EDF
Payments — Annual 2004
SITUATION BY INSTRUMENT AND STATE
|
(million EUR) |
|||||||||
|
|
Cotonou |
||||||||
|
Envelope A |
Envelope B |
Implementation Costs |
Total state |
||||||
|
Macroeconomic support |
Sectoral politic |
Total env. A |
Emergency aid |
Debt relief |
Loss on exportation compensation |
Total env. B |
|||
|
ANGOLA |
|
22,66 |
22,66 |
0,40 |
|
|
0,40 |
|
23,06 |
|
BENIN |
18,32 |
21,66 |
39,99 |
|
|
|
|
|
39,99 |
|
BURKINA FASO |
|
0,23 |
0,23 |
|
|
|
|
|
0,23 |
|
BURUNDI |
1,34 |
|
1,34 |
19,36 |
|
3,18 |
22,54 |
|
23,88 |
|
CENTRAFRIQUE |
|
2,68 |
2,68 |
0,64 |
|
|
0,64 |
|
3,32 |
|
TCHAD |
|
2,74 |
2,74 |
3,01 |
|
|
3,01 |
|
5,75 |
|
CAMEROUN |
|
0,38 |
0,38 |
|
|
|
|
|
0,38 |
|
CONGO |
|
0,26 |
0,26 |
0,56 |
|
|
0,56 |
|
0,82 |
|
COMORES |
|
0,02 |
0,02 |
1,39 |
|
|
1,39 |
|
1,42 |
|
CAP VERT |
|
|
|
5,50 |
|
|
5,50 |
|
5,50 |
|
DJIBOUTI |
|
0,31 |
0,31 |
|
|
|
|
|
0,31 |
|
GUINEE EQUATORIALE |
|
0,28 |
0,28 |
|
|
|
|
|
0,28 |
|
ERITHREE |
|
0,21 |
0,21 |
|
|
|
|
|
0,21 |
|
ETHIOPIE |
45,04 |
0,13 |
45,17 |
0,93 |
|
|
0,93 |
|
46,11 |
|
GABON |
|
0,50 |
0,50 |
|
|
|
|
|
0,50 |
|
GHANA |
12,00 |
2,06 |
14,06 |
|
|
|
|
|
14,06 |
|
GAMBIE |
|
0,11 |
0,11 |
|
|
|
|
|
0,11 |
|
GUINEE BISSAU |
|
0,63 |
0,63 |
|
|
|
|
|
0,63 |
|
COTE D'IVOIRE |
|
0,03 |
0,03 |
17,51 |
|
|
17,51 |
|
17,53 |
|
KENYA |
|
0,08 |
0,08 |
0,40 |
|
|
0,40 |
|
0,48 |
|
LIBERIA |
|
10,17 |
10,17 |
2,04 |
|
|
2,04 |
|
12,21 |
|
LESOTHO |
|
0,27 |
0,27 |
|
|
|
|
|
0,27 |
|
MADAGASCAR |
|
37,49 |
37,49 |
|
|
|
|
|
37,49 |
|
MALAWI |
|
4,58 |
4,58 |
|
|
|
|
|
4,58 |
|
MAURICE |
|
8,01 |
8,01 |
0,19 |
|
|
0,19 |
|
8,20 |
|
MAURITANIE |
|
0,34 |
0,34 |
5,95 |
|
|
5,95 |
|
6,30 |
|
MALI |
22,20 |
5,77 |
27,97 |
4,47 |
|
|
4,47 |
|
32,44 |
|
MOZAMBIQUE |
12,00 |
7,35 |
19,35 |
|
|
|
|
|
19,35 |
|
NAMIBIE |
|
9,06 |
9,06 |
0,80 |
|
|
0,80 |
|
9,86 |
|
NIGER |
27,25 |
7,40 |
34,65 |
2,05 |
|
|
2,05 |
|
36,70 |
|
RWANDA |
12,50 |
0,77 |
13,27 |
|
|
|
|
|
13,27 |
|
SENEGAL |
|
0,42 |
0,42 |
4,84 |
|
|
4,84 |
|
5,26 |
|
SIERRA LEONE |
|
2,34 |
2,34 |
6,09 |
|
|
6,09 |
|
8,43 |
|
SOMALIE |
|
8,67 |
8,67 |
|
|
|
|
|
8,67 |
|
SAO TOME & PRINCIPE |
|
0,07 |
0,07 |
|
|
|
|
|
0,07 |
|
SOUDAN |
|
0,25 |
0,25 |
1,52 |
|
|
1,52 |
|
1,76 |
|
SWAZILAND |
|
1,12 |
1,12 |
|
|
|
|
|
1,12 |
|
TANZANIE |
33,54 |
2,21 |
35,75 |
|
|
|
|
|
35,75 |
|
TOGO |
|
0,04 |
0,04 |
|
|
|
|
|
0,04 |
|
OUGANDA |
|
0,91 |
0,91 |
3,02 |
|
|
3,02 |
|
3,93 |
|
NIGERIA |
|
38,50 |
38,50 |
|
|
|
|
|
38,50 |
|
ZAMBIE |
39,50 |
0,71 |
40,21 |
|
|
11,49 |
11,49 |
|
51,70 |
|
ZIMBABWE |
|
0,05 |
0,05 |
|
|
|
|
|
0,05 |
|
REP. DEMOCRATIQUE CONGO |
105,70 |
6,14 |
111,85 |
11,14 |
|
|
11,14 |
|
122,99 |
|
* TOTAL AFRIQUE |
329,39 |
207,65 |
537,05 |
91,79 |
|
14,67 |
106,46 |
|
643,51 |
|
ANTIGUA-BARBUDA |
|
0,04 |
0,04 |
|
|
|
|
|
0,04 |
|
BARBADE |
|
0,03 |
0,03 |
|
|
|
|
|
0,03 |
|
BELIZE |
|
0,07 |
0,07 |
|
|
|
|
|
0,07 |
|
REPUBLIQUE DOMINICAINE |
|
0,25 |
0,25 |
|
|
|
|
|
0,25 |
|
DOMINIQUE |
|
0,14 |
0,14 |
|
|
|
|
|
0,14 |
|
GRENADE |
|
0,02 |
0,02 |
|
|
|
|
|
0,02 |
|
GUYANE (ETAT) |
|
0,09 |
0,09 |
|
|
6,00 |
6,00 |
|
6,09 |
|
HAITI |
|
5,18 |
5,18 |
|
|
|
|
|
5,18 |
|
JAMAIQUE |
|
0,32 |
0,32 |
25,83 |
|
|
25,83 |
|
26,15 |
|
SAINTE LUCIE |
|
0,04 |
0,04 |
|
|
|
|
|
0,04 |
|
SURINAME |
|
0,09 |
0,09 |
|
|
|
|
|
0,09 |
|
* TOTAL CARAIBES |
|
6,27 |
6,27 |
25,83 |
|
6,00 |
31,83 |
|
38,09 |
|
SALOMON |
|
0,06 |
0,06 |
|
|
|
|
|
0,06 |
|
TONGA |
|
0,79 |
0,79 |
0,51 |
|
|
0,51 |
|
1,31 |
|
TUVALU |
|
1,62 |
1,62 |
|
|
|
|
|
1,62 |
|
VANUATU |
|
0,64 |
0,64 |
0,64 |
|
|
0,64 |
|
1,28 |
|
SAMOA |
|
0,27 |
0,27 |
|
|
|
|
|
0,27 |
|
ILES COOK |
|
0,96 |
0,96 |
|
|
|
|
|
0,96 |
|
* TOTAL PACIFIQUE |
|
4,35 |
4,35 |
1,15 |
|
|
1,15 |
|
5,50 |
|
REGION AFRIQUE OCCIDENTALE |
|
|
1,30 |
|
|
|
|
|
1,30 |
|
REGION AFRIQUE CENTRALE |
|
|
3,13 |
|
|
|
|
|
3,13 |
|
REGION DES CARAIBES |
|
|
0,53 |
|
|
|
|
|
0,53 |
|
REGION DU PACIFIQUE |
|
|
3,18 |
|
|
|
|
|
3,18 |
|
COOPERATION REGIONALE ACP |
|
|
158,89 |
|
|
|
|
|
158,89 |
|
REGION ESA |
|
|
3,14 |
|
|
|
|
|
3,14 |
|
REGION SADC |
|
|
0,61 |
|
|
|
|
|
0,61 |
|
* TOTAL COOPER. REGIONALE ACP |
|
|
170,77 |
|
|
|
|
|
170,77 |
|
TOUS PAYS ACP |
|
|
27,73 |
|
|
|
|
|
27,73 |
|
FRAIS ADMINISTR. & FINANCIERS |
|
|
|
|
|
|
|
55,17 |
55,17 |
|
* TOTAL ACP |
329,39 |
218,26 |
746,17 |
118,77 |
|
20,67 |
139,44 |
55,17 |
940,78 |
|
NOUVELLE CALEDONIE |
|
6,17 |
6,17 |
|
|
|
|
|
6,17 |
|
WALLIS & FUTUNA |
|
0,12 |
0,12 |
|
|
|
|
|
0,12 |
|
* TOTAL PTOM FRANÇAIS |
|
6,29 |
6,29 |
|
|
|
|
|
6,29 |
|
ANTILLES NEERLANDAISES |
|
0,07 |
0,07 |
|
|
|
|
|
0,07 |
|
* TOTAL PTOM NEERLANDAIS |
|
0,07 |
0,07 |
|
|
|
|
|
0,07 |
|
SAINTE HELENE |
|
0,11 |
0,11 |
|
|
|
|
|
0,11 |
|
* TOTAL PTOM BRITANNIQUES |
|
0,11 |
0,11 |
|
|
|
|
|
0,11 |
|
COOPERATION REGIONALE PTOM |
|
|
0,25 |
|
|
|
|
|
0,25 |
|
* COOPERATION REGIONALE PTOM |
|
|
0,25 |
|
|
|
|
|
0,25 |
|
TOUS PTOM |
|
|
|
|
|
|
|
0,06 |
0,06 |
|
* TOTAL PTOM |
|
6,47 |
6,72 |
|
|
|
|
0,06 |
6,78 |
|
* TOTAL ACP + PTOM |
329,39 |
224,74 |
752,89 |
118,77 |
|
20,67 |
139,44 |
55,23 |
947,56 |
Table 3.5.1
ALL EDF
Cumulative 2004
SITUATION BY STATE
|
(million EUR) |
|||||||||
|
|
Decisions |
Assigned funds |
Payments |
||||||
|
Lomé |
Cotonou |
Total |
Lomé |
Cotonou |
Total |
Lomé |
Cotonou |
Total |
|
|
ANGOLA |
388,68 |
116,56 |
505,24 |
349,51 |
58,62 |
408,13 |
303,88 |
23,06 |
326,94 |
|
BENIN |
461,90 |
126,40 |
588,30 |
446,41 |
108,85 |
555,26 |
418,38 |
39,99 |
458,37 |
|
BURKINA FASO |
855,25 |
118,34 |
973,59 |
814,66 |
29,51 |
844,17 |
728,51 |
0,23 |
728,74 |
|
BOTSWANA |
216,71 |
2,17 |
218,88 |
188,21 |
|
188,21 |
153,71 |
|
153,71 |
|
BURUNDI |
395,63 |
117,41 |
513,04 |
391,00 |
61,73 |
452,73 |
336,49 |
23,88 |
360,37 |
|
CENTRAFRIQUE |
305,31 |
6,16 |
311,47 |
294,05 |
4,52 |
298,56 |
283,14 |
3,82 |
286,96 |
|
TCHAD |
496,62 |
125,13 |
621,75 |
467,06 |
61,93 |
528,98 |
427,78 |
5,75 |
433,52 |
|
CAMEROUN |
975,09 |
4,76 |
979,85 |
920,32 |
0,48 |
920,80 |
877,48 |
0,38 |
877,86 |
|
CONGO |
121,08 |
14,63 |
135,71 |
99,54 |
2,04 |
101,58 |
89,01 |
0,85 |
89,86 |
|
COMORES |
85,51 |
1,82 |
87,33 |
82,12 |
1,76 |
83,88 |
79,85 |
1,42 |
81,26 |
|
CAP VERT |
125,35 |
9,37 |
134,72 |
116,05 |
5,50 |
121,55 |
101,51 |
5,50 |
107,01 |
|
DJIBOUTI |
72,57 |
9,60 |
82,17 |
66,71 |
0,58 |
67,29 |
61,87 |
0,31 |
62,18 |
|
GUINEE EQUATORIALE |
52,00 |
3,36 |
55,36 |
49,37 |
1,59 |
50,97 |
47,44 |
0,28 |
47,72 |
|
ERITHREE |
84,44 |
57,35 |
141,78 |
82,85 |
2,09 |
84,94 |
71,14 |
0,21 |
71,35 |
|
ETHIOPIE |
1 400,08 |
124,48 |
1 524,56 |
1 182,51 |
93,73 |
1 276,24 |
1 041,13 |
46,11 |
1 087,24 |
|
GABON |
197,34 |
7,64 |
204,98 |
161,37 |
1,93 |
163,30 |
153,61 |
0,51 |
154,13 |
|
GHANA |
669,17 |
104,79 |
773,97 |
615,34 |
64,55 |
679,89 |
532,65 |
14,06 |
546,71 |
|
GAMBIE |
113,56 |
4,58 |
118,13 |
109,97 |
0,66 |
110,63 |
100,30 |
0,11 |
100,41 |
|
GUINEE BISSAU |
200,41 |
3,70 |
204,11 |
147,58 |
1,18 |
148,76 |
126,50 |
0,93 |
127,43 |
|
GUINEE |
676,82 |
1,95 |
678,77 |
592,26 |
|
592,26 |
526,82 |
|
526,82 |
|
COTE D'IVOIRE |
1 111,99 |
74,29 |
1 186,28 |
1 067,57 |
27,82 |
1 095,39 |
1 011,10 |
20,53 |
1 031,63 |
|
KENYA |
704,51 |
199,85 |
904,36 |
664,86 |
46,13 |
710,98 |
595,99 |
0,48 |
596,47 |
|
LIBERIA |
113,67 |
58,82 |
172,49 |
107,73 |
27,47 |
135,21 |
96,77 |
15,73 |
112,50 |
|
LESOTHO |
226,82 |
20,99 |
247,81 |
218,85 |
1,16 |
220,00 |
209,43 |
0,28 |
209,71 |
|
MADAGASCAR |
712,38 |
233,90 |
946,28 |
694,62 |
124,04 |
818,66 |
618,43 |
37,74 |
656,17 |
|
MALAWI |
743,69 |
49,06 |
792,75 |
683,02 |
7,27 |
690,29 |
649,71 |
4,58 |
654,29 |
|
MAURICE |
143,04 |
30,81 |
173,86 |
141,61 |
28,49 |
170,10 |
123,95 |
8,20 |
132,15 |
|
MAURITANIE |
489,94 |
60,89 |
550,83 |
426,74 |
8,31 |
435,05 |
393,18 |
6,32 |
399,50 |
|
MALI |
727,87 |
263,22 |
991,08 |
688,23 |
166,82 |
855,05 |
650,25 |
65,45 |
715,71 |
|
MOZAMBIQUE |
1 054,97 |
145,94 |
1 200,91 |
969,00 |
64,59 |
1 033,59 |
854,33 |
19,35 |
873,69 |
|
NAMIBIE |
176,69 |
87,51 |
264,19 |
174,16 |
24,30 |
198,46 |
166,23 |
9,90 |
176,13 |
|
NIGER |
581,82 |
134,03 |
715,85 |
519,63 |
102,76 |
622,39 |
480,13 |
54,70 |
534,82 |
|
RWANDA |
573,60 |
97,53 |
671,13 |
531,42 |
52,68 |
584,10 |
487,29 |
27,17 |
514,46 |
|
SENEGAL |
744,23 |
104,97 |
849,20 |
710,32 |
7,24 |
717,56 |
652,91 |
5,26 |
658,18 |
|
SEYCHELLES |
23,58 |
0,50 |
24,08 |
22,92 |
|
22,92 |
22,60 |
|
22,60 |
|
SIERRA LEONE |
305,56 |
117,50 |
423,06 |
276,50 |
25,58 |
302,08 |
244,46 |
8,43 |
252,89 |
|
SOMALIE |
258,58 |
103,09 |
361,67 |
250,48 |
45,22 |
295,70 |
230,80 |
8,67 |
239,48 |
|
SAO TOME & PRINCIPE |
44,34 |
9,40 |
53,74 |
42,26 |
1,43 |
43,68 |
38,52 |
0,07 |
38,58 |
|
SOUDAN |
494,48 |
23,38 |
517,86 |
490,83 |
4,87 |
495,71 |
285,14 |
1,76 |
286,90 |
|
SWAZILAND |
147,92 |
7,43 |
155,36 |
139,95 |
2,70 |
142,65 |
113,88 |
1,13 |
115,02 |
|
TANZANIE |
1 056,98 |
158,88 |
1 215,87 |
1 041,14 |
116,21 |
1 157,36 |
867,35 |
66,75 |
934,09 |
|
TOGO |
186,75 |
10,84 |
197,59 |
153,55 |
0,07 |
153,63 |
145,21 |
0,04 |
145,26 |
|
OUGANDA |
995,43 |
52,05 |
1 047,48 |
960,89 |
16,18 |
977,07 |
833,76 |
5,08 |
838,84 |
|
NIGERIA |
473,90 |
271,96 |
745,86 |
392,66 |
114,82 |
507,48 |
343,05 |
38,50 |
381,55 |
|
ZAMBIE |
868,02 |
219,47 |
1 087,49 |
827,77 |
127,20 |
954,97 |
796,78 |
51,70 |
848,48 |
|
ZIMBABWE |
399,62 |
9,46 |
409,08 |
368,02 |
0,68 |
368,70 |
339,45 |
0,05 |
339,50 |
|
REP. DEMOCRATIQUE CONGO |
427,04 |
157,18 |
584,22 |
357,77 |
138,51 |
496,27 |
314,42 |
122,99 |
437,41 |
|
* TOTAL AFRIQUE |
21 680,94 |
3 663,13 |
25 344,07 |
20 099,41 |
1 783,79 |
21 883,20 |
18 026,35 |
748,27 |
18 774,62 |
|
ANTIGUA-BARBUDA |
10,31 |
4,86 |
15,16 |
9,95 |
0,44 |
10,39 |
9,75 |
0,04 |
9,80 |
|
BARBADE |
24,43 |
12,23 |
36,66 |
20,68 |
0,03 |
20,71 |
18,58 |
0,03 |
18,61 |
|
BELIZE |
50,96 |
0,55 |
51,50 |
50,34 |
0,12 |
50,46 |
47,83 |
0,07 |
47,90 |
|
BAHAMAS |
19,82 |
0,15 |
19,97 |
19,82 |
|
19,82 |
19,75 |
|
19,75 |
|
REPUBLIQUE DOMINICAINE |
305,98 |
34,07 |
340,06 |
266,44 |
0,70 |
267,14 |
214,37 |
0,28 |
214,65 |
|
DOMINIQUE |
74,35 |
0,44 |
74,79 |
70,29 |
0,15 |
70,44 |
61,31 |
0,14 |
61,45 |
|
GRENADE |
35,33 |
0,83 |
36,16 |
34,19 |
0,26 |
34,44 |
33,63 |
0,02 |
33,65 |
|
GUYANE (ETAT) |
166,90 |
30,05 |
196,95 |
138,69 |
22,71 |
161,40 |
107,45 |
6,09 |
113,54 |
|
HAITI |
248,06 |
71,69 |
319,75 |
226,27 |
8,56 |
234,83 |
189,75 |
5,18 |
194,93 |
|
JAMAIQUE |
419,74 |
48,41 |
468,15 |
333,48 |
31,92 |
365,41 |
273,50 |
26,15 |
299,66 |
|
ST CHRISTOPHE (KITTS) & NEVI |
16,44 |
3,68 |
20,12 |
16,43 |
0,20 |
16,64 |
14,65 |
|
14,65 |
|
SAINTE LUCIE |
93,78 |
0,56 |
94,34 |
93,54 |
0,08 |
93,62 |
75,82 |
0,04 |
75,86 |
|
SURINAME |
67,54 |
34,31 |
101,85 |
53,79 |
0,13 |
53,92 |
48,44 |
0,09 |
48,53 |
|
SAINT VINCENT & GRENADINES |
84,91 |
7,38 |
92,28 |
84,19 |
0,82 |
85,01 |
79,73 |
|
79,73 |
|
TRINITE & TOBAGO |
78,64 |
9,98 |
88,62 |
75,00 |
|
75,00 |
62,45 |
|
62,45 |
|
* TOTAL CARAIBES |
1 697,20 |
259,18 |
1 956,37 |
1 493,11 |
66,11 |
1 559,23 |
1 257,03 |
38,12 |
1 295,15 |
|
FIDJI |
67,96 |
21,00 |
88,96 |
66,86 |
|
66,86 |
55,67 |
|
55,67 |
|
KIRIBATI |
30,31 |
8,80 |
39,11 |
24,86 |
|
24,86 |
21,41 |
|
21,41 |
|
PAPOUASIE NOUVELLE GUINEE |
475,57 |
6,19 |
481,76 |
409,05 |
0,07 |
409,12 |
390,24 |
|
390,24 |
|
SALOMON |
173,26 |
5,78 |
179,05 |
169,13 |
0,07 |
169,20 |
137,24 |
0,07 |
137,31 |
|
TONGA |
29,06 |
3,89 |
32,95 |
28,28 |
1,59 |
29,87 |
26,41 |
1,31 |
27,72 |
|
TUVALU |
6,26 |
3,97 |
10,23 |
6,26 |
2,08 |
8,34 |
5,23 |
1,62 |
6,85 |
|
VANUATU |
60,23 |
10,15 |
70,38 |
58,72 |
5,01 |
63,73 |
57,25 |
1,28 |
58,53 |
|
SAMOA |
68,63 |
2,50 |
71,13 |
66,84 |
0,48 |
67,32 |
65,36 |
0,27 |
65,63 |
|
NIUE |
|
0,20 |
0,20 |
|
|
|
|
|
|
|
ILES COOK |
|
2,00 |
2,00 |
|
1,55 |
1,55 |
|
1,48 |
1,48 |
|
* TOTAL PACIFIQUE |
911,28 |
64,48 |
975,76 |
830,00 |
10,84 |
840,84 |
758,80 |
6,03 |
764,83 |
|
REGION AFRIQUE OCCIDENTALE |
285,55 |
40,71 |
326,26 |
234,39 |
3,44 |
237,83 |
195,77 |
1,30 |
197,07 |
|
REGION AFRIQUE CENTRALE |
83,71 |
8,16 |
91,87 |
77,61 |
5,65 |
83,27 |
56,60 |
4,60 |
61,20 |
|
REGION AFRIQUE ORIENTALE |
171,88 |
|
171,88 |
96,24 |
|
96,24 |
53,20 |
|
53,20 |
|
REGION AFRIQUE AUSTRALE |
94,22 |
|
94,22 |
69,55 |
|
69,55 |
50,62 |
|
50,62 |
|
REGION DE L'OCEAN INDIEN |
25,89 |
|
25,89 |
23,95 |
|
23,95 |
11,98 |
|
11,98 |
|
REGION DES CARAIBES |
76,44 |
48,17 |
124,61 |
61,25 |
6,50 |
67,75 |
39,37 |
0,66 |
40,03 |
|
REGION DU PACIFIQUE |
34,96 |
29,00 |
63,96 |
34,49 |
23,87 |
58,36 |
18,91 |
3,18 |
22,08 |
|
MULTI-REGIONAL (PALOP) |
11,91 |
|
11,91 |
7,83 |
|
7,83 |
5,09 |
|
5,09 |
|
BUDGET INTRA ACP |
844,56 |
|
844,56 |
660,81 |
|
660,81 |
468,39 |
|
468,39 |
|
COOPERATION REGIONALE ACP |
2 180,68 |
1 173,42 |
3 354,10 |
2 115,08 |
592,50 |
2 707,58 |
2 022,79 |
329,25 |
2 352,04 |
|
REGION ESA |
|
145,21 |
145,21 |
|
23,32 |
23,32 |
|
3,14 |
3,14 |
|
REGION SADC |
|
24,82 |
24,82 |
|
2,53 |
2,53 |
|
0,61 |
0,61 |
|
* TOTAL COOPER. REGIONALE ACP |
3 809,81 |
1 469,49 |
5 279,30 |
3 381,19 |
657,83 |
4 039,02 |
2 922,73 |
342,73 |
3 265,46 |
|
TOUS PAYS ACP |
1 452,05 |
64,85 |
1 516,90 |
1 447,68 |
36,52 |
1 484,20 |
1 428,69 |
27,73 |
1 456,42 |
|
FRAIS ADMINISTR. & FINANCIERS |
62,28 |
218,76 |
281,04 |
55,56 |
157,50 |
213,06 |
50,72 |
55,17 |
105,90 |
|
* TOTAL ACP |
29 613,56 |
5 739,88 |
35 353,44 |
27 306,95 |
2 712,59 |
30 019,54 |
24 444,32 |
1 218,05 |
25 662,37 |
|
MAYOTTE |
20,94 |
0,09 |
21,03 |
20,40 |
|
20,40 |
19,60 |
|
19,60 |
|
NOUVELLE CALEDONIE |
49,29 |
21,50 |
70,79 |
44,55 |
21,50 |
66,05 |
38,01 |
6,17 |
44,18 |
|
POLYNESIE FRANCAISE |
51,64 |
3,65 |
55,29 |
51,48 |
|
51,48 |
48,25 |
|
48,25 |
|
SAINT PIERRE & MIQUELON |
10,59 |
|
10,59 |
10,47 |
|
10,47 |
10,46 |
|
10,46 |
|
TERRES AUSTRALES FRANCAISES |
0,28 |
|
0,28 |
0,28 |
|
0,28 |
0,28 |
|
0,28 |
|
WALLIS & FUTUNA |
10,42 |
0,67 |
11,09 |
9,39 |
0,37 |
9,76 |
9,15 |
0,12 |
9,27 |
|
RESERVE AIDE NAT. PROGR. PTF |
0,09 |
|
0,09 |
|
|
|
|
|
|
|
* TOTAL PTOM FRANCAIS |
143,26 |
25,91 |
169,16 |
136,56 |
21,87 |
158,43 |
125,74 |
6,29 |
132,03 |
|
ARUBA |
17,58 |
4,40 |
21,98 |
17,26 |
|
17,26 |
16,56 |
|
16,56 |
|
ANTILLES NEERLANDAISES |
50,37 |
10,72 |
61,09 |
43,56 |
5,26 |
48,82 |
39,66 |
0,18 |
39,84 |
|
* TOTAL PTOM NEERLANDAIS |
67,95 |
15,12 |
83,07 |
60,81 |
5,26 |
66,08 |
56,22 |
0,18 |
56,40 |
|
ANGUILLA |
8,00 |
|
8,00 |
7,22 |
|
7,22 |
7,05 |
|
7,05 |
|
CAIMANS |
3,15 |
|
3,15 |
3,15 |
|
3,15 |
3,15 |
|
3,15 |
|
FALKLAND |
6,89 |
|
6,89 |
6,84 |
|
6,84 |
6,84 |
|
6,84 |
|
MONTSERRAT |
11,05 |
5,70 |
16,75 |
10,38 |
|
10,38 |
9,63 |
|
9,63 |
|
SAINTE HELENE |
2,60 |
0,15 |
2,75 |
2,60 |
0,15 |
2,75 |
2,60 |
0,11 |
2,72 |
|
TURKS & CAICOS |
8,83 |
0,02 |
8,85 |
8,83 |
0,02 |
8,85 |
7,66 |
0,02 |
7,68 |
|
VIERGES (BRITANNIQUES) |
7,25 |
|
7,25 |
7,25 |
|
7,25 |
7,25 |
|
7,25 |
|
* TOTAL PTOM BRITANNIQUES |
47,78 |
5,87 |
53,65 |
46,28 |
0,17 |
46,45 |
44,19 |
0,13 |
44,32 |
|
COOPERATION REGIONALE PTF |
5,45 |
|
5,45 |
5,37 |
|
5,37 |
2,28 |
|
2,28 |
|
COOPERATION REGIONALE PTN |
1,30 |
|
1,30 |
0,53 |
|
0,53 |
0,45 |
|
0,45 |
|
COOPERATION REGIONALE PTU |
1,64 |
|
1,64 |
|
|
|
|
|
|
|
COOPERATION REGIONALE PTOM |
15,35 |
7,10 |
22,45 |
14,10 |
0,84 |
14,94 |
13,89 |
0,25 |
14,13 |
|
* COOPERATION REGIONALE PTOM |
23,74 |
7,10 |
30,83 |
19,99 |
0,84 |
20,84 |
16,62 |
0,25 |
16,86 |
|
TOUS PTOM |
1,39 |
0,65 |
2,04 |
1,39 |
0,45 |
1,84 |
1,39 |
0,32 |
1,70 |
|
* TOTAL PTOM |
284,10 |
54,65 |
338,75 |
265,03 |
28,60 |
293,63 |
244,15 |
7,17 |
251,32 |
|
* TOTAL ACP + PTOM |
29 897,66 |
5 794,53 |
35 692,19 |
27 571,98 |
2 741,19 |
30 313,17 |
24 688,47 |
1 225,22 |
25 913,69 |
Table 3.5.2
ALL EDF
Annual 2004
SITUATION BY STATE
|
(million EUR) |
|||||||||
|
|
Decisions |
Assigned funds |
Payments |
||||||
|
Lomé |
Cotonou |
Total |
Lomé |
Cotonou |
Total |
Lomé |
Cotonou |
Total |
|
|
ANGOLA |
- 1,28 |
24,72 |
23,44 |
32,96 |
58,58 |
91,54 |
26,39 |
23,06 |
49,45 |
|
BENIN |
- 0,30 |
6,23 |
5,94 |
11,20 |
108,85 |
120,05 |
29,55 |
39,99 |
69,54 |
|
BURKINA FASO |
- 4,02 |
3,23 |
- 0,79 |
8,87 |
29,51 |
38,37 |
68,58 |
0,23 |
68,80 |
|
BOTSWANA |
- 0,03 |
1,39 |
1,36 |
33,21 |
|
33,21 |
6,48 |
|
6,48 |
|
BURUNDI |
3,42 |
92,41 |
95,83 |
13,27 |
61,73 |
75,00 |
5,64 |
23,88 |
29,52 |
|
CENTRAFRIQUE |
- 61,47 |
5,08 |
- 56,39 |
10,52 |
3,52 |
14,04 |
20,02 |
3,32 |
23,35 |
|
TCHAD |
- 2,39 |
17,50 |
15,11 |
8,78 |
15,93 |
24,70 |
33,14 |
5,75 |
38,88 |
|
CAMEROUN |
- 0,58 |
4,48 |
3,90 |
10,91 |
0,35 |
11,26 |
29,69 |
0,38 |
30,08 |
|
CONGO |
- 1,29 |
14,47 |
13,18 |
1,58 |
1,96 |
3,54 |
5,83 |
0,82 |
6,65 |
|
COMORES |
- 1,41 |
1,80 |
0,39 |
0,79 |
1,76 |
2,55 |
2,14 |
1,42 |
3,56 |
|
CAP VERT |
- 1,00 |
9,37 |
8,37 |
- 0,25 |
5,50 |
5,25 |
6,18 |
5,50 |
11,68 |
|
DJIBOUTI |
- 0,13 |
9,60 |
9,47 |
1,43 |
0,58 |
2,01 |
4,16 |
0,31 |
4,47 |
|
GUINEE EQUATORIALE |
- 0,13 |
2,81 |
2,68 |
2,54 |
1,59 |
4,13 |
2,73 |
0,28 |
3,01 |
|
ERITHREE |
- 6,71 |
20,35 |
13,64 |
0,68 |
2,09 |
2,77 |
6,52 |
0,21 |
6,73 |
|
ETHIOPIE |
- 19,40 |
114,23 |
94,82 |
38,25 |
93,65 |
131,90 |
17,91 |
46,11 |
64,02 |
|
GABON |
- 0,18 |
7,39 |
7,21 |
1,91 |
1,85 |
3,76 |
9,45 |
0,50 |
9,95 |
|
GHANA |
- 1,42 |
99,48 |
98,06 |
30,30 |
63,75 |
94,05 |
32,59 |
14,06 |
46,64 |
|
GAMBIE |
- 0,64 |
4,58 |
3,94 |
0,98 |
0,66 |
1,64 |
1,49 |
0,11 |
1,60 |
|
GUINEE BISSAU |
- 0,09 |
2,46 |
2,37 |
16,56 |
0,08 |
16,65 |
5,93 |
0,63 |
6,56 |
|
GUINEE |
- 2,01 |
|
- 2,01 |
17,73 |
|
17,73 |
21,95 |
|
21,95 |
|
COTE D'IVOIRE |
- 35,65 |
35,83 |
0,18 |
7,61 |
17,98 |
25,59 |
- 34,21 |
17,53 |
- 16,67 |
|
KENYA |
- 0,79 |
149,85 |
149,06 |
14,41 |
46,13 |
60,54 |
53,66 |
0,48 |
54,14 |
|
LIBERIA |
- 0,01 |
10,80 |
10,79 |
5,39 |
19,77 |
25,16 |
3,89 |
12,21 |
16,10 |
|
LESOTHO |
- 3,57 |
1,99 |
- 1,58 |
- 1,02 |
0,66 |
- 0,36 |
10,78 |
0,27 |
11,06 |
|
MADAGASCAR |
- 19,06 |
135,90 |
116,84 |
20,49 |
123,74 |
144,24 |
46,63 |
37,49 |
84,12 |
|
MALAWI |
- 6,01 |
43,14 |
37,13 |
14,82 |
7,16 |
21,98 |
40,76 |
4,58 |
45,33 |
|
MAURICE |
- 5,94 |
0,42 |
- 5,52 |
0,06 |
28,49 |
28,55 |
5,70 |
8,20 |
13,90 |
|
MAURITANIE |
- 2,88 |
15,30 |
12,42 |
4,84 |
8,01 |
12,85 |
0,29 |
6,30 |
6,59 |
|
MALI |
- 0,19 |
129,58 |
129,38 |
17,69 |
38,95 |
56,63 |
41,58 |
32,44 |
74,01 |
|
MOZAMBIQUE |
- 7,27 |
25,40 |
18,13 |
43,10 |
48,19 |
91,29 |
80,12 |
19,35 |
99,48 |
|
NAMIBIE |
- 0,96 |
66,01 |
65,05 |
4,11 |
5,96 |
10,07 |
8,05 |
9,86 |
17,91 |
|
NIGER |
- 0,01 |
40,49 |
40,48 |
33,22 |
13,48 |
46,70 |
27,71 |
36,70 |
64,40 |
|
RWANDA |
0,52 |
10,73 |
11,25 |
20,00 |
2,89 |
22,89 |
28,23 |
13,27 |
41,50 |
|
SENEGAL |
- 4,05 |
104,18 |
100,13 |
- 4,13 |
7,21 |
3,08 |
32,57 |
5,26 |
37,83 |
|
SEYCHELLES |
- 0,34 |
0,50 |
0,16 |
0,10 |
|
0,10 |
0,24 |
|
0,24 |
|
SIERRA LEONE |
- 0,51 |
15,00 |
14,49 |
34,15 |
25,51 |
59,66 |
32,69 |
8,43 |
41,12 |
|
SOMALIE |
|
3,09 |
3,09 |
5,93 |
45,22 |
51,15 |
11,70 |
8,67 |
20,37 |
|
SAO TOME & PRINCIPE |
- 0,01 |
9,40 |
9,39 |
- 0,28 |
1,43 |
1,15 |
2,14 |
0,07 |
2,20 |
|
SOUDAN |
5,89 |
22,90 |
28,79 |
9,55 |
4,71 |
14,26 |
3,31 |
1,76 |
5,07 |
|
SWAZILAND |
- 3,87 |
2,70 |
- 1,17 |
7,24 |
2,14 |
9,38 |
9,54 |
1,12 |
10,66 |
|
TANZANIE |
- 13,90 |
42,06 |
28,16 |
15,03 |
7,21 |
22,24 |
47,25 |
35,75 |
83,00 |
|
TOGO |
- 1,43 |
1,26 |
- 0,17 |
6,66 |
0,07 |
6,74 |
3,18 |
0,04 |
3,22 |
|
OUGANDA |
1,93 |
38,07 |
40,01 |
130,08 |
14,57 |
144,65 |
56,05 |
3,93 |
59,99 |
|
NIGERIA |
- 3,51 |
271,88 |
268,37 |
23,13 |
114,82 |
137,95 |
21,43 |
38,50 |
59,93 |
|
ZAMBIE |
- 11,96 |
89,02 |
77,06 |
12,59 |
127,20 |
139,79 |
48,69 |
51,70 |
100,39 |
|
ZIMBABWE |
- 6,27 |
9,40 |
3,13 |
14,81 |
0,63 |
15,44 |
15,67 |
0,05 |
15,72 |
|
REP. DEMOCRATIQUE CONGO |
- 0,07 |
3,00 |
2,93 |
29,20 |
28,81 |
58,01 |
34,84 |
122,99 |
157,83 |
|
* TOTAL AFRIQUE |
- 220,95 |
1 719,45 |
1 498,50 |
711,04 |
1 192,87 |
1 903,91 |
968,86 |
643,51 |
1 612,37 |
|
ANTIGUA-BARBUDA |
- 0,08 |
0,40 |
0,32 |
0,07 |
0,44 |
0,51 |
0,13 |
0,04 |
0,17 |
|
BARBADE |
- 2,31 |
12,20 |
9,89 |
- 0,24 |
|
- 0,24 |
1,96 |
0,03 |
1,98 |
|
BELIZE |
- 0,21 |
0,55 |
0,34 |
0,08 |
0,12 |
0,20 |
0,23 |
0,07 |
0,30 |
|
BAHAMAS |
|
0,15 |
0,15 |
|
|
|
0,22 |
|
0,22 |
|
REPUBLIQUE DOMINICAINE |
- 1,20 |
32,90 |
31,70 |
16,34 |
0,50 |
16,84 |
14,38 |
0,25 |
14,63 |
|
DOMINIQUE |
0,44 |
0,30 |
0,74 |
3,06 |
0,15 |
3,21 |
- 1,98 |
0,14 |
- 1,85 |
|
GRENADE |
- 0,04 |
0,43 |
0,39 |
0,03 |
0,26 |
0,28 |
- 0,17 |
0,02 |
- 0,15 |
|
GUYANE (ETAT) |
- 0,66 |
29,87 |
29,21 |
4,58 |
22,71 |
27,29 |
2,13 |
6,09 |
8,21 |
|
HAITI |
- 0,25 |
37,74 |
37,50 |
12,80 |
8,56 |
21,36 |
14,47 |
5,18 |
19,65 |
|
JAMAIQUE |
- 2,88 |
47,16 |
44,28 |
27,96 |
31,92 |
59,88 |
17,33 |
26,15 |
43,48 |
|
ST CHRISTOPHE (KITTS) & NEVI |
|
0,50 |
0,50 |
|
0,20 |
0,20 |
0,35 |
|
0,35 |
|
SAINTE LUCIE |
1,26 |
0,45 |
1,71 |
1,97 |
0,08 |
2,05 |
- 11,81 |
0,04 |
- 11,76 |
|
SURINAME |
- 0,21 |
1,13 |
0,92 |
1,08 |
0,13 |
1,21 |
2,40 |
0,09 |
2,49 |
|
SAINT VINCENT & GRENADINES |
0,36 |
0,50 |
0,86 |
0,42 |
0,82 |
1,24 |
- 2,84 |
|
- 2,84 |
|
TRINITE & TOBAGO |
- 2,54 |
8,13 |
5,59 |
1,26 |
|
1,26 |
0,56 |
|
0,56 |
|
* TOTAL CARAIBES |
- 8,32 |
172,41 |
164,08 |
69,41 |
65,88 |
135,29 |
37,36 |
38,09 |
75,45 |
|
FIDJI |
- 0,01 |
21,00 |
20,99 |
19,71 |
|
19,71 |
12,03 |
|
12,03 |
|
KIRIBATI |
|
8,80 |
8,80 |
1,64 |
|
1,64 |
2,93 |
|
2,93 |
|
PAPOUASIE NOUVELLE GUINEE |
0,06 |
6,19 |
6,25 |
9,46 |
0,07 |
9,52 |
8,00 |
|
8,00 |
|
SALOMON |
2,83 |
5,70 |
8,53 |
2,45 |
0,04 |
2,48 |
- 24,62 |
0,06 |
- 24,56 |
|
TONGA |
0,01 |
|
0,01 |
0,74 |
1,59 |
2,33 |
1,83 |
1,31 |
3,14 |
|
TUVALU |
|
|
|
1,03 |
1,71 |
2,74 |
0,02 |
1,62 |
1,64 |
|
VANUATU |
- 0,21 |
2,27 |
2,07 |
1,20 |
4,58 |
5,78 |
1,11 |
1,28 |
2,39 |
|
SAMOA |
|
2,30 |
2,30 |
1,15 |
0,48 |
1,63 |
2,44 |
0,27 |
2,72 |
|
NIUE |
|
0,20 |
0,20 |
|
|
|
|
|
|
|
ILES COOK |
|
|
|
|
1,01 |
1,01 |
|
0,96 |
0,96 |
|
* TOTAL PACIFIQUE |
2,68 |
46,46 |
49,15 |
37,38 |
9,46 |
46,85 |
3,74 |
5,50 |
9,24 |
|
REGION AFRIQUE OCCIDENTALE |
- 1,76 |
9,50 |
7,74 |
15,86 |
3,44 |
19,31 |
33,18 |
1,30 |
34,48 |
|
REGION AFRIQUE CENTRALE |
- 8,50 |
3,29 |
- 5,21 |
2,98 |
1,01 |
3,99 |
13,96 |
3,13 |
17,09 |
|
REGION AFRIQUE ORIENTALE |
- 0,07 |
|
- 0,07 |
41,44 |
|
41,44 |
22,82 |
|
22,82 |
|
REGION AFRIQUE AUSTRALE |
|
|
|
17,65 |
|
17,65 |
8,72 |
|
8,72 |
|
REGION DE L'OCEAN INDIEN |
- 1,05 |
|
- 1,05 |
4,17 |
|
4,17 |
2,35 |
|
2,35 |
|
REGION DES CARAIBES |
- 0,04 |
22,00 |
21,96 |
7,94 |
5,94 |
13,88 |
6,19 |
0,53 |
6,72 |
|
REGION DU PACIFIQUE |
- 0,01 |
3,76 |
3,75 |
1,04 |
23,87 |
24,91 |
8,06 |
3,18 |
11,23 |
|
MULTI-REGIONAL (PALOP) |
- 0,07 |
- |
- 0,07 |
1,83 |
|
1,83 |
1,75 |
|
1,75 |
|
BUDGET INTRA ACP |
- 2,02 |
- |
- 2,02 |
63,19 |
|
63,19 |
61,00 |
|
61,00 |
|
COOPERATION REGIONALE ACP |
- 15,12 |
413,62 |
398,51 |
21,50 |
218,12 |
239,62 |
39,75 |
158,89 |
198,65 |
|
REGION ESA |
|
79,29 |
79,29 |
|
21,04 |
21,04 |
|
3,14 |
3,14 |
|
REGION SADC |
|
9,82 |
9,82 |
|
2,53 |
2,53 |
|
0,61 |
0,61 |
|
* TOTAL COOPER. REGIONALE ACP |
- 28,64 |
541,28 |
512,65 |
177,60 |
275,96 |
453,56 |
197,80 |
170,77 |
368,57 |
|
TOUS PAYS ACP |
- 5,66 |
26,97 |
21,31 |
- 5,65 |
36,52 |
30,87 |
3,04 |
27,73 |
30,77 |
|
FRAIS ADMINISTR. & FINANCIERS |
|
93,76 |
93,76 |
6,73 |
139,01 |
145,74 |
16,61 |
55,17 |
71,78 |
|
* TOTAL ACP |
- 260,88 |
2 600,33 |
2 339,45 |
996,51 |
1 719,70 |
2 716,22 |
1 227,40 |
940,78 |
2 168,18 |
|
MAYOTTE |
|
0,09 |
0,09 |
0,02 |
|
0,02 |
0,01 |
|
0,01 |
|
NOUVELLE CALEDONIE |
|
21,50 |
21,50 |
1,47 |
21,50 |
22,97 |
6,55 |
6,17 |
12,72 |
|
POLYNESIE FRANCAISE |
- 0,26 |
3,65 |
3,38 |
- 0,26 |
|
- 0,26 |
6,12 |
|
6,12 |
|
SAINT PIERRE & MIQUELON |
|
|
|
- 0,05 |
|
- 0,05 |
0,59 |
|
0,59 |
|
WALLIS & FUTUNA |
|
0,67 |
0,67 |
0,38 |
0,37 |
0,75 |
0,92 |
0,12 |
1,04 |
|
* TOTAL PTOM FRANCAIS |
- 0,26 |
25,91 |
25,64 |
1,56 |
21,87 |
23,43 |
14,19 |
6,29 |
20,48 |
|
ARUBA |
- 0,28 |
4,40 |
4,12 |
- 0,27 |
|
- 0,27 |
0,15 |
|
0,15 |
|
ANTILLES NEERLANDAISES |
- 0,32 |
1,00 |
0,68 |
1,38 |
5,07 |
6,44 |
2,28 |
0,07 |
2,35 |
|
* TOTAL PTOM NEERLANDAIS |
- 0,59 |
5,40 |
4,81 |
1,11 |
5,07 |
6,18 |
2,44 |
0,07 |
2,51 |
|
ANGUILLA |
|
|
|
0,62 |
|
0,62 |
0,79 |
|
0,79 |
|
MONTSERRAT |
|
|
|
- 0,07 |
|
- 0,07 |
3,42 |
|
3,42 |
|
SAINTE HELENE |
- 0,02 |
|
- 0,02 |
- 0,00 |
|
- 0,00 |
|
0,11 |
0,11 |
|
TURKS & CAICOS |
- |
|
|
- |
|
|
1,00 |
|
1,00 |
|
* TOTAL PTOM BRITANNIQUES |
- 0,02 |
|
- 0,02 |
0,54 |
|
0,54 |
5,20 |
0,11 |
5,31 |
|
COOPERATION REGIONALE PTF |
|
|
|
- 0,01 |
|
- 0,01 |
0,90 |
|
0,90 |
|
COOPERATION REGIONALE PTN |
|
|
|
- 0,11 |
|
- 0,11 |
0,14 |
|
0,14 |
|
COOPERATION REGIONALE PTOM |
- 0,47 |
6,45 |
5,98 |
- 0,13 |
0,84 |
0,71 |
0,01 |
0,25 |
0,25 |
|
* COOPERATION REGIONALE PTOM |
- 0,47 |
6,45 |
5,98 |
- 0,25 |
0,84 |
0,59 |
1,05 |
0,25 |
1,29 |
|
TOUS PTOM |
- 0,70 |
|
- 0,70 |
- 0,70 |
|
- 0,70 |
|
0,06 |
0,06 |
|
* TOTAL PTOM |
- 2,05 |
37,75 |
35,71 |
2,26 |
27,78 |
30,04 |
22,87 |
6,78 |
29,66 |
|
* TOTAL ACP + PTOM |
- 262,93 |
2 638,08 |
2 375,15 |
998,77 |
1 747,48 |
2 746,25 |
1 250,27 |
947,56 |
2 197,84 |
Table 3.5.3
Breakdown by country and type of aid granted under the Cotonou provisions (running total at 31.12.2004)
|
Country |
Decided |
||||
|
8th EDF |
6th & 7th EDF |
Total |
|||
|
A Envelope |
B Envelope |
Intra ACP Allocation |
|||
|
Macroeconomic support |
Sectoral Policies |
Compensation export earnings (24) |
|||
|
BOTSWANA |
|
3 880 000 |
30 000 000 |
|
33 880 000 |
|
BURKINA FASO |
125 000 000 |
11 900 000 |
|
|
136 900 000 |
|
ETHIOPIE |
|
30 000 000 |
|
|
30 000 000 |
|
GABON |
|
|
35 000 000 |
|
35 000 000 |
|
GHANA |
|
|
40 000 000 |
|
40 000 000 |
|
GUINEE BISSAU |
|
35 000 000 |
|
|
35 000 000 |
|
MADAGASCAR |
55 000 000 |
|
|
|
55 000 000 |
|
MAURITANIE |
|
|
45 000 000 |
|
45 000 000 |
|
MALAWI |
|
35 000 000 |
|
|
35 000 000 |
|
MOZAMBIQUE |
150 000 000 |
|
|
|
150 000 000 |
|
NIGER |
|
1 080 000 |
55 000 000 |
|
56 080 000 |
|
JAMAIQUE |
30 000 000 |
|
|
|
30 000 000 |
|
SWAZILAND |
|
4 000 000 |
|
|
4 000 000 |
|
PAPOUASIE NOUVELLE GUINEE |
|
|
50 000 000 |
|
50 000 000 |
|
BELIZE |
|
140 000 |
|
|
140 000 |
|
VANUATU |
|
5 329 000 |
|
|
5 329 000 |
|
SAMOA |
|
4 350 000 |
|
|
4 350 000 |
|
INTRA ACP |
|
|
|
60 000 |
60 000 |
|
Total |
360 000 000 |
130 679 000 |
255 000 000 |
60 000 000 |
805 679 000 |
|
Country |
Assigned |
||||
|
8th EDF |
6th & 7th EDF |
Total |
|||
|
A Envelope |
B Envelope |
Intra ACP Allocation |
|||
|
Macroeconomic support |
Sectoral Policies |
Compensation export earnings (24) |
|||
|
BURKINA FASO |
123 925 460 |
4 186 508 |
|
|
128 111 968 |
|
BOTSWANA |
|
23 100 |
21 484 000 |
|
21 507 100 |
|
ETHIOPIE |
|
59 100 |
|
|
59 100 |
|
GABON |
|
|
5 210 577 |
|
5 210 577 |
|
GHANA |
|
|
3 250 900 |
|
3 250 900 |
|
GUINEE BISSAU |
|
8 503 935 |
|
|
8 503 935 |
|
MADAGASCAR |
55 000 000 |
- |
|
|
55 000 000 |
|
MALAWI |
|
6 507 070 |
|
|
6 507 070 |
|
MOZAMBIQUE |
150 000 000 |
|
|
|
150 000 000 |
|
NIGER |
|
1 015 110 |
32 940 234 |
|
33 955 343 |
|
JAMAIQUE |
28 834 812 |
|
|
|
28 834 812 |
|
SWAZILAND |
|
2 309 000 |
|
|
2 309 000 |
|
PAPOUASIE NOUVELLE GUINEE |
|
|
2 973 700 |
|
|
|
BELIZE |
|
135 462 |
|
|
135 462 |
|
VANUATU |
|
3 838 072 |
|
|
3 838 072 |
|
SAMOA |
|
2 638 000 |
|
|
2 638 000 |
|
INTRA ACP |
|
|
|
60 000 |
60 000 |
|
Total |
357 760 272 |
29 215 357 |
65 859 410 |
60 000 |
449 921 339 |
|
Country |
Paid |
||||
|
8th EDF |
6th & 7th EDF |
Total |
|||
|
A Envelope |
B Envelope |
Intra ACP Allocation |
|||
|
Macroeconomic support |
Sectoral Policies |
Compensation export earnings (24) |
|||
|
BURKINA FASO |
88 487 119 |
1 606 992 |
|
|
90 094 111 |
|
BOTSWANA |
|
21 249 |
371 214 |
|
392 464 |
|
ETHIOPIE |
|
43 475 |
|
|
43 475 |
|
GABON |
|
|
2 755 077 |
|
2 755 077 |
|
GHANA |
|
|
1 183 123 |
|
1 183 123 |
|
GUINEE BISSAU |
|
2 932 910 |
|
|
|
|
MADAGASCAR |
55 000 000 |
|
|
|
55 000 000 |
|
MALAWI |
|
2 897 290 |
|
|
2 897 290 |
|
MOZAMBIQUE |
110 226 000 |
|
|
|
110 226 000 |
|
NIGER |
|
805 657 |
20 242 343 |
|
21 048 000 |
|
SWAZILAND |
|
671 470 |
|
|
|
|
PAPOUASIE NOUVELLE GUINEE |
|
|
568 249 |
|
|
|
BELIZE |
|
125 171 |
|
|
125 171 |
|
JAMAIQUE |
11 683 633 |
|
|
|
11 683 633 |
|
VANUATU |
|
2 408 360 |
|
|
2 408 360 |
|
SAMOA |
|
1 656 593 |
|
|
1 656 593 |
|
INTRA ACP |
|
|
|
60 000 |
60 000 |
|
Total |
265 396 752 |
13 169 168 |
25 120 006 |
60 000 |
299 573 297 |
Table 3.5.4
Breakdown by country of aid granted as budget support in accordance with Cotonou provisions (running total at 31.12.2004)
|
Country |
Decided |
||
|
8th EDF |
|||
|
A Envelope |
B Envelope |
Total |
|
|
Macroeconomic support |
Compensation export earnings (1) |
||
|
BURKINA FASO |
125 000 000 |
|
125 000 000 |
|
MADAGASCAR |
55 000 000 |
|
55 000 000 |
|
MOZAMBIQUE |
150 000 000 |
|
150 000 000 |
|
NIGER |
|
20 000 000 |
20 000 000 |
|
JAMAIQUE |
30 000 000 |
|
30 000 000 |
|
Total |
360 000 000 |
20 000 000 |
380 000 000 |
|
Country |
Assigned |
||
|
8th EDF |
|||
|
A Envelope |
B Envelope |
Total |
|
|
Macroeconomic support |
Compensation export earnings (1) |
||
|
BURKINA FASO |
122 500 000 |
|
122 500 000 |
|
MADAGASCAR |
55 000 000 |
|
55 000 000 |
|
MOZAMBIQUE |
150 000 000 |
|
150 000 000 |
|
NIGER |
|
19 624 674 |
19 624 674 |
|
JAMAIQUE |
28 834 812 |
|
28 834 812 |
|
Total |
356 334 812 |
19 624 674 |
375 959 486 |
|
Country |
Paid |
||
|
8th EDF |
|||
|
A Envelope |
B Envelope |
Total |
|
|
Macroeconomic support |
Compensation export earnings (1) |
||
|
BURKINA FASO |
88 487 119 |
|
88 487 119 |
|
MADAGASCAR |
55 000 000 |
|
55 000 000 |
|
MOZAMBIQUE |
110 226 000 |
|
110 226 000 |
|
NIGER |
|
19 339 993 |
19 339 993 |
|
JAMAIQUE |
11 683 633 |
|
11 683 633 |
|
Total |
265 396 752 |
19 339 993 |
284 736 745 |
(1) The unallocated resources from the previous EDFs include the balance of the Sysmin funds, which by decision 3/2000 of the ACP-EC Ambassadors' Committee was set at 410 926 million. Council Decision E410/2001 includes these resources in programming for the national indicative allocations (part B) under the financial protocol to the ACP-EC Partnership Agreement.
(2) Cotonou Agreement, Annex I, Art. 3.c and Annex II, Art. 2.8 and Internal Agreement, Art. 2 and 3 and 5.
(3) Transfer to 9th EDF following the entry in force of Cotonou (decision of the Commission of 16 April 2003).
(4) Transfer to 9th EDF following the entry in force of Cotonou (decision of the Commission of 16 April 2003).
(5) Transfer to 9th EDF following the entry in force of Cotonou (decision of the Commission of 16 April 2003).
(6) Interest earned on Stabex security accounts.
(7) Transfer to 9th EDF following the entry in force of Cotonou (decision of the Commission of 16 April 2003).
(8) signature of CSP for the country.
(9) increase of allocations following the MTR.
(10) decrease of allocations following the MTR.
(11) release of conditional billion.
(12) interest on EDF funds in 2004.
(13) Special Congo — Council decision 21.7.2003.
(14) interest on Congo funds in 2004.
(15) transfers from B enevelope.
(16) STABEX cash loss.
(17) % of appropriations.
(18) The financial situation refers to figures as at 31.12.2003 since the information as at 31.12.2004 were not available at the moment of the preparation of these provisional accounts. In the same respect the information has been provided for almost all the countries concerned.
(19) This item contains 17 361 104 ordinary shares in Kenmare Resources Plc received as commission on subordinated loan granted to Moma Titanium Minerals (see Note I).
The initial value of these shares (EUR 4 166 665) is based on the quoted share price in EUR at the date of transfer of ownership.
(20) Under the terms of the Facility and according to the Financial Regulation applicable to the 9th European Development Fund, the funds received by the EIB on behalf of the Facility are recorded separately. Interest on these deposits is not accounted for by the Facility but is payable by the EIB to European Commission.
Reflows and interest calculated on reflows belong to the Facility.
(21) Aggregate loans granted comprise both the disbursed portion of loans and the portion still to be disbursed.
(22) Of which EUR 114 372 333 are subordinated as follows:
|
— Disbursed |
66 890 317 |
|
— Undisbursed |
47 482 016 |
|
|
114 372 333 |
(23) Net interest payable on swap contract.
(24) The resources not allocated from previous EDFs included the unused balance of the SYSMIN funds which by Decision 3/2000 of the Committee of Ambassadors ACP-EC was established at 410 926 million. Council Decision E410/2001 includes these resources in programming of the indicative national envelopes (part B) under the financial protocol to the ACP-EC Partnership Agreement.