Contents
1.Introduction
1.1.The Ecodesign work on enterprise servers and data storage products
1.2.Structure of this impact assessment
2.Problem definition
2.1.What is the issue or problem that may require action?
2.2.What is the scale of the problem?
2.2.1.Data centre consumption share by servers and data storage products
2.2.2.Data centre locations
2.3.What are the underlying drivers of the problem?
2.3.1.Lack of functional information – energy related aspects
2.3.2.“Non-optimal economic behaviour” of the users
2.3.3.Lack of functional information - resource related aspects
2.4.Who is affected, in what ways and to what extent?
2.5.How are existing policies and legislation affecting the issue?
2.6.Baseline scenario: How will the issue evolve in absence of intervention?
2.6.1.Base Cases
2.6.2.Sales
2.6.3.Product lifetime and stock
2.6.4.Expenditure
2.6.1.Industry revenue
2.6.2.Employment
2.6.3.Energy consumption and GHG emissions
2.6.4.Improvement potential
2.7.Should the EU act?
3.Policy objectives
3.1.General objectives
3.2.Specific objectives
3.3.Consistency with other EU policies
4.Policy options
4.1.Introduction
4.2.General scope and definitions
4.3.Option 1: No action (Business-as-usual, BAU)
4.4.Option 3: Ecodesign requirements for servers and data storage products
4.4.1.Minimum efficiency requirements for power supply units
4.4.2.Operating temperature information requirements
4.4.3.Requirement on the idle mode energy consumption
4.4.4.Information or MEPS requirement on servers’ performance (e.g. SERT-based)
4.4.5.Information requirements
4.4.6.Material efficiency requirements
4.5.Option 5: Complementary regulatory approaches – compulsory Energy Star
4.6.Summary of policy scenarios
5.Analysis of impacts
5.1.Environmental impacts
5.1.1.Energy impacts of servers
5.1.1.Energy impacts of data storage products
5.1.2.Energy impact of servers and storage products
5.1.3.Greenhouse gas emission reduction of servers
5.1.4.Reduction of other environmental impacts due to material efficiency requirements
5.2.Economic impacts
5.2.1.Business revenue of servers
5.2.2.Business revenue of data storage products
5.2.3.Employment of servers industry
5.2.4.Employment of data storage products industry
5.2.5.User expenditure for servers
5.2.6.User expenditure for data storage products
5.2.7.Single user expenditure for 2 sockets rack server
5.2.8.Single user expenditure for Online 2 storage product
5.3.Other impacts
5.3.1.Administrative burden
5.3.2.Testing cost for the server industry
5.3.3.Cost associated with material efficiency requirements
5.3.4.Impact on innovation
5.3.5.Impact on SMEs
6.Comparison of options
6.1.Summary of impacts and options comparison
6.1.1.Sensitivity analysis on different adoption rates of operating conditions
6.1.2.Sensitivity analysis on the cloud utilisation
7.Evaluation and monitoring
7.1.Evaluation and revision
Annex 1: Procedural information
Annex 2: Synopsis Report
Annex 3: Who is affected by the initiative and how
Summary of costs and benefits
Annex 4: Inputs, assumptions, calculations
Annex 5: Definitions and glossary
Annex 6: Proposed metrics requirements
Annex 7: Additional graphs and tables
7.1.Greenhouse gas emission reduction
7.2.Sensitivity analysis – detailed tables
7.2.1.Detailed tables for sensitivity analysis of 15% data centre adoption of Operating condition for scenario 3.2
7.2.2.Detailed tables for sensitivity analysis of 45% data centre adoption for scenario 3.2 and 75% for scenario 3.3
7.2.3.Detailed tables for sensitivity analysis on the cloud utilisation
7.3.Cumulative savings by 2030 for the policy scenarios
7.4.Single user expenditure for a server and data storage product
Annex 8: Indicative benchmarks
Annex 9: Evaluation of an existing ecodesign/energy labelling measure
Annex 10: Procedural steps for Ecodesign measures
Annex 11: Existing Policies, Legislation and Standards on servers and Data storage products
EU legislation
Standards for servers and data storage products
Voluntary legislative tools in the EU
National programs inside the EU
National and global programs outside the EU
This report commits only the Commission’s services involved in its preparation and does not prejudge the final form of any decision to be taken by the Commission.
1.Introduction
In the European Union (EU), the Ecodesign Directive
requires product manufacturers to improve the environmental performance of their products by meeting minimum energy efficiency requirements, as well as other environmental requirements such as water consumption, emission levels or minimum durability of certain components. The Energy Labelling Regulation
complements Ecodesign by enabling end-consumers to identify the better-performing products, via the well-known A-G/green-to-red labelling grading. The legislative framework, which builds upon the synergic effect of the two aforementioned pieces of legislation, is central to making energy use in Europe more efficient, contributing especially to the 'Energy Union and Climate' priority, and also to the priority of a 'Deeper and fairer internal market with a strengthened industrial base'. This legislative framework is also of paramount importance for several aspects. First of all, it pushes industry to improve the energy efficiency of products and removes the worst-performing ones from the market. Secondly, it helps individuals, families and companies to reduce their utility bills. In the industrial and services sectors, this results in support to competitiveness and innovation. Thirdly, it ensures that the legal entities (typically manufacturers and importers) responsible for placing products on the EU markets only have to comply with a single EU-wide set of rules and standards.
It has been estimated
that by 2020 the Ecodesign and the Energy Labelling directives will deliver around 175 Mtoe (i.e about 2035 TWh) of energy savings per year in primary energy, roughly equivalent to Italy's energy consumption in 2010, close to half the EU 20% energy efficiency target by 2020 and about 11% of the expected EU primary energy consumption in 2020. Moreover, the average household saves annually on energy bills an amount growing to about €500 by 2020 whilst for industry, service and sale and retail sectors it will result in €55 billion per year of extra revenue. This legislative framework benefits from a broad support from competitive European industries, consumer organizations and environmental NGOs (non-governmental organization)
, as the transparent and regular consultation process in establishing implementing measures is largely appreciated.
The Ecodesign Directive and Energy Labelling Regulation include a built-in proportionality and significance test. For the Ecodesign Framework Directive, Articles 15(1) and 15(2) state that a product should be covered by an ecodesign or a self-regulating measure if the following conditions are met:
·The product should represents a significant volume of sales;
·The product should have a significant environmental impact within the EU;
·The product should present a significant potential for improvement without entailing excessive costs, while taking into account:
o an absence of other relevant Community legislation or failure of market forces to address the issue properly,
oa wide disparity in environmental performance of products with equivalent functionality;
The procedure for preparing such measures are described in Article 15(3). In addition, the criteria of Article 15(5) should be met:
·No significant negative impacts on user functionality of the product;
·No significant negative impacts on Health, safety and environment
·No significant negative impacts on affordability and life cycle costs
·No significant negative impacts on industry’s competitiveness (including SMEs).
The procedural steps prior to the finalisation of Ecodesign measures are described in detail in '
Annex 10: Procedural steps for Ecodesign measures
'.
1.1.The Ecodesign work on enterprise servers and data storage products
In the domain of information and communication technology (ICT), Ecodesign implementing measures already cover electronic displays
and computers
. A further group of ICT products is currently being investigated as part of the Ecodesign Working Plan 2012-14
: enterprise servers (referred to as ‘servers’ in this impact assessment) and data storage products. As described more in detail in the present report, the market figures related to these products are expected to continuously increase: trends such as the Internet of Things (objects and people interconnected through telecommunication), the Industry 4.0 (the trend of automation and data exchange in manufacturing technologies) and Cloud Computing (distribution of computational work and data storage on a number of sites connected in the Internet) are growing at a very fast pace and require more and more computing power and storage capacity.
Following the inclusion of servers and data storage products in the Ecodesign Working Plan 2012-14, an Ecodesign design preparatory study on these products (referred to as 'the preparatory study' in the remainder of the text) was concluded on September 2015
. The overall conclusion was that the primary environmental impact of servers and data storage products is related to the energy consumption in the use phase, and that the yearly electricity consumption related to the use of servers and data storage products in the EU is highly significant. For these reasons, an Ecodesign regulation on these products was recommended. More in detail, several policy recommendations for servers and data storage products were formulated, including information requirements, quantitative requirements at hardware level (in particular on the efficiency of internal power supply units), on the product operating conditions (mainly: higher temperature to save on cooling costs), and on product software components and configuration, such as virtualization. The preparatory study also proposed requirements on product materials efficiency, such as extraction of key-components and of critical raw materials, availability of built-in data deletion tools (while not jeopardizing data privacy) and of firmware updates. The study also concluded that, for the time being, it was not possible to outline requirements based on overall energy performance at computer server level, given the lack of a metric for the evaluation of such an evaluation. It was also concluded that any proposal for an energy label on computer servers was premature because of a) lack or a well-established metric and b) such energy label as a tool for informed choice is not considered as strong as in the case of domestic products, being servers a business-to-business products, where buyers usually have high level of technical knowledge and very peculiar needs. Following the conclusions of the preparatory study, a dedicated impact assessment was started. The present report constitutes the knowledge base for this impact assessment.
Specifically concerning the formulation and the analysis of impact of the material efficiency requirements, the main reference study is a JRC report on the analysis of material efficiency requirements of servers29 (named as 'JRC report' in the remainder of the text), which presented the Life Cycle Assessment (LCA) of servers as well as recommendations for potential ecodesign requirement on material efficiency.
The technical work prior to this impact assessment also entailed an analysis of the standards (or draft transitional methods, when needed) for the assessment of the compliance with regard to the potential ecodesign requirements for servers and data storage products under discussion; this is reported in the deliverables of the Technical Assistance Study for Enterprise Servers and Data Storage99 (named as 'the technical assistance study' in the remainder of the text).
1.2.Structure of this impact assessment
The present report basically consists of a policy analysis entailing technical, economic and environmental aspects. The structure of the report reflects the European Commission Better Regulation Guidelines. These Guidelines establish a set of questions, to which an impact assessment should answer:
1. What is the problem and why is it a problem?
2. Why should the EU act?
3. What should be achieved?
4. What are the various options to achieve the objectives?
5. What are their impacts and who will be affected?
6. How do the different options compare?
7. How will monitoring be organised?
To guide the reader throughout the report, the specific question (among those ones in the list above) which is dealt with is highlighted in the heading of each page of the report.
2.Problem definition
2.1.What is the issue or problem that may require action?
Servers and data storage products are very large energy consumers and the energy consumption of these devices is steadily increasing, because more services with increasing levels of sophistication and data and computing requirements are being created and subsequently demanded in increasing volumes by end-users in all sectors and by automated systems (such as video surveillance, financial systems, transportation etc.) .This is also leading to a shift from personal devices and smaller organisational servers to larger data centres including cloud services to manage the exponentially increasing amount of data being produced, processed and stored.
A server is a computing product that provides services and manages networked resources for client devices, such as desktop computers, notebook computers, desktop thin clients, smart phones, tablets, as well as telecommunication, automated systems or other servers. To fulfil their computing role, servers are designed to be more powerful and reliable, and are typically housed in data centres and office/corporate environments where primary access is via network connections, and not through direct user input devices such as a keyboard or a mouse. The specific technical characteristics that designate a computing product as server are given in Annex 5. Servers can have many types and forms; among the four different ones shown in the figure below, rack-mounted servers cover the largest share of the market. These forms are generally designed to enable as much computing performance to be housed in the available space.

Figure 1 Example images of pedestal servers, rack-mounted servers, multi-node servers and blade server
A data storage product is a storage system that supplies data storage services to clients and devices attached directly or through a network. A data storage product may be composed of an integrated storage controller, connected to the storage devices such as hard drives, or solid-state drives, as well as embedded network elements, and software etc. The specific technical characteristics that designate a computing product as data storage product are given in Annex 5. Data storage products can look similar to certain server forms, but they typically have more storage capacity, storage access interfaces and data retrieval and management utilities than servers. See figure below for examples of data storage products.


Figure 2 Example images of data storage products
Typically, slightly more than 50% of the electricity consumption related to data centres is due to direct energy consumption of critical ICT equipment: servers, data storage products and networking equipment. The rest is for the cooling and UPS demand associated. As established by the Lot 9 preparatory study, energy consumption in the use phase constitutes about 90 % of the total environmental impact of servers and storage.
Since services are required for all businesses, servers are purchased and operated by a wide range of businesses, but typically servers are used in one of the following three cases:
1) Where the users of all data centre equipment and service provider coincide: There are a few very large scale (hyper scale) global IT companies such as Google, Microsoft and Amazon operating up to a million servers in global networks. They have their own data centres and they pay the energy costs of running them, so they are aware of the energy consumption both due the high total energy costs and due to a growing use of “acting green” as part of their image and therefore they try to optimise. The end customers buying the services (rent of servers and rent of server services such as file storage, mail services, cloud services etc.) can be individuals, SMEs and larger companies. Additionally, there are also many smaller data centres and typically located nationally and with national customers.
2) Where the data centre owner provides the infrastructure such as area, racks, secure access system, cooling etc., and the servers and/or data storage products are owned either by the customer or by the data centre itself: these are known as colocation data centres. Most often, there is only little focus on the energy consumption, because the number of servers owned by a customer typically is low and the customers are not very conscious on the energy consumption. One factor that may push for energy awareness is the fact that colocation data centres often put a surcharge on the electricity price, when reselling to the server owners. However, the total size of electricity purchase may still be considered as insignificant for the customers and the invoice line for electricity purchase may be less visible because it is included in the overall bill for infrastructure. In addition, data centre costs are rarely passed on to the department within the customer organisation which has requested the particular server or service. This barrier of split incentives is typical for energy efficiency and seen in other sectors as well, as the buyers of a service or a product do not pay the yearly energy cost for operating the service or product, therefore little incentive to take the operating costs into account of initial purchase.
Therefore, there is no information or incentive to improve the efficiency of the service or a mechanism to consider whether a service provides value for money to the organisation. This can result in both inefficient services or unrestrained demand and growth of services with limited or no value to the business. Unrestrained growth is even more likely when they are assumed to be operating efficiently within a highly virtualised or private cloud environment.
3) Where the customers, typically SMEs – though larger companies and public organisations may also have their own data centres – use servers and/or data storage products owned by themselves and they are located in a dedicated IT equipment room or space with air conditioning or other cooling in the premises of the company: These customers usually have less focus on the energy consumption of servers and data storage products, because most often there is no dedicated electricity meter installed in the server equipment and the consumption is just one contributor of many to the overall electricity bill. Again, for organisation of all sizes there is rarely a mechanism to pass on the cost of operating the servers and service to the departments within the organisation using them. There are millions of SMEs in the EU operating as few as one server to provide basic file management and e-mail functions or operating as many as several hundred servers. The diverse range of operators means that the resources and knowledge to select, purchase, and manage the data server and data storage product varies just as much. Alternatively, instead of operating servers, the server services may be purchased directly, commonly from cloud and hosted services providers (e.g. e-mail, file and web services) and from providers of pure server capacity (e.g. for installation of own server software and special applications), see the first case above. This solution is increasingly popular, particularly for smaller businesses and the potential market is enormous and growing because also medium sized and larger companies are increasingly moving to cloud and hosted services partly due to improved high speed internet connections from the company to the data centre. The storage market is similarly increasing, because it is directly related to the growth in cloud and hosted services. A specific market for companies running their own servers or data centres is remote backup in order to secure the data in a remote location e.g. in relation to fire or theft. Moving services to cloud may be hindered by the technical difficulty as well security and data protection concerns and the legal issues by having other countries’ legal framework regulating your data, but there is much focus on reducing these barriers. The customers of hosting and cloud services are not directly billed their electricity consumption, but only indirectly where the electricity consumption is one of many costs that the hosting or cloud company has. Additionally, the price of the services is very much market based for standard products such as hosted exchange, Microsoft Office 365 and remote backup.
The most significant environmental impact from servers and data storage products is the in-use energy consumption. This is well understood by some parts of the industry but not an important purchasing consideration for some operators. For large scale IT operators, the energy costs are a significant part of total cost of ownership (TCO). They have the resources, skills and information to analyse and optimise the energy efficiency across the entire system and design the products to meet their specific requirements. However, energy efficiency is one of many factors when designing and constructing data centres and it may still not have same priority as other factors. Additionally, the market transformation due to ecodesign requirements will also result in more energy efficient equipment being available for the large scale IT operators and they will also benefit from this development.
For medium sized to smaller operators it is even more difficult to react on the size of the in-use energy consumption despite lifetime energy costs being a significant part of the products’ TCO. The energy consumption costs have big impact on the TCO due to servers and data storage products typically being always on; due to lifetime often being higher than e.g. client computer devices and due to need of removal of the heat dissipated from the products, which often will be removed by electricity powered mechanical cooling systems,
Since 2007, manufacturers have focused more heavily on energy efficiency, partially because data centres’ large energy consumption has caught much attention, especially due to the US report to congress on data centre energy consumption. While this is due in part to environmental awareness, many operators were also reaching their data centre power and cooling capacity limits, and increasing consumption was an unsustainable business model.
Server and data storage products continue to develop rapidly with new components and models being released on an annual basis. Smaller manufacturing techniques for CPUs (Central Processing Units), SSDs (Solid State Drives) and RAM (Random Access Memory) continue to reduce energy consumption and/or increase performance within the same power envelope. Design evolutions also continue to make progress, while whole new product niches promise new solutions and approaches to efficiency. Outside of the product design, virtualisation (i.e. by having many virtualised servers running on one hardware server) and cloud services enable greater efficiency by increasing the utilisation of the hardware. Additionally, highly optimised power supplies, UPS (uninterruptible power supply) systems and cooling in the data centre reduce associated power without sacrificing resiliency. Many of the large scale IT operators nowadays focus on low energy solutions when building new data centres e.g. by reducing most of the mechanical cooling (by using free ambient air for cooling) and using surplus heat to external purposes like heating water and space heating. This means that large data centre services can be an order of magnitude more efficient than in-house servers and storage. By use of efficient design and free cooling, some newly designed and constructed data centres could reduce the energy consumption by 10% - 20%, compared to older data centres.
For users who are seeking to maximise the efficiency of the server, there is a lack of unbiased, publicly available information available to make an informed comparison between different server products based on the users’ needs. Since technology changes so rapidly and there are millions of potential configurations of CPU, RAM, storage for a single server model, making an informed decision requires a lot of resources. As a result, users tend to ensure that the product is suitable for their requirements by over-configuring the product with more capable and power-consuming components which leads to low utilisation levels and inefficiency. Part of the reason is that under-capacity could create substantial issues for the core activities for an organisation, while over-capacity increases purchase and operating costs.
In spite of large potential, energy efficiency is often not the first priority for the users of servers and data storage product as described above and in the next sections, therefore the Business as Usual scenario will only release a smaller portion of the energy efficiency potential. This would mean an unnecessary and significant increase in energy consumption in the EU due to the increase in need of servers and data storage if the EU does not provide incentive or legislative measure to set energy efficiency as a higher priority.
In addition, in light of EU’s Circular Economy Action Plan, servers and data storage products should also contribute to circular economy objectives by promoting reuse and recycling and hence reduce GHG emissions as well as other environmental impacts.
2.2.What is the scale of the problem?
Electricity consumption of data centres (servers, storage and network equipment combined) in EU-28 in 2015 is estimated at 78 TWh by preparatory study for Lot 9, corresponding to a significant 2.5% of the total electricity final consumption in the EU. This total includes the network equipment, which is not included in the scope of current impact assessment.
The electricity consumption of servers and data storage products alone are estimated to be 53 TWh in 2015, corresponding to 2 % of the total consumption in the EU. This number is estimated to reach 55 TWh in 2020 and 78 TWh in 2030. In addition, sufficient cooling needs to be provided so that the equipment operates within its thermal limitations. This additional cooling is provided in data centres or server rooms and can be directly attributed to the server and data storage product. The additional cooling requires electricity and in this impact assessment will be referred to as electricity consumption for "infrastructure". The electricity consumption of servers and data storage product including infrastructure are expected to be 96 TWh in 2015, this corresponds to 3.2% of the EU total consumption; this is estimated to be 96 TWh in 2020 and 121 TWh in 2030.
Energy savings potentials have been estimated for the years 2020 – 2030 for different policy scenarios in this impact assessment. With a potential Ecodesign measure for servers and data storage products, the projected saving is 6.5 TWh (approximately the yearly electricity consumption of Latvia in 2014) in 2020 and 8.9 TWh (approximately the yearly electricity consumption of Estonia in 2014) in 2030 in the case of the preferred policy option (see section 6.1 for the in-depth analysis). More in detail, the effect of the ecodesign requirements for servers in the preferred policy option is estimated to result by 2030 in direct annual energy savings of approximately 2.4 TWh and indirect (i.e. related to infrastructure) annual energy savings of 3.7 TWh, summing up to a total saving of 6.1 TWh, corresponding to a total of 2.1 Mt of CO2 equivalent. The effect of the ecodesign requirements for data storage products in the preferred policy option is estimated to result by 2030 in direct annual energy savings of approximately 0.8 TWh and indirect (i.e. related to infrastructure) annual energy savings of 2 TWh, summing up to a total saving of 2.8 TWh, corresponding to 0.9 Mt of CO2 equivalent. Long-term assessments should however be viewed cautiously, as they can be uncertain due to the rapid technological development in the sector.
The 8,9 TWh/yr electricity savings (as of 2030) under the present initiative in the case of the preferred policy option would account for ~22,5TWh of primary energy, i.e. ~4% of the total savings under the Ecodesign Working Plan 2017-19. As a reference value, the overall electricity consumption at EU level in 2015 was ~3041TWh. Overall, it was estimated that all the measures (new ones and reviews) under the Ecodesign Working Plan 2016-2019 have an estimated potential to deliver a total in excess of 600 TWh (or 50 Mtoe, Megatonnes of oil equivalent) of annual primary energy savings in 2030. This is comparable to the annual primary energy consumption of Sweden, and is also equivalent to reducing CO2 emissions by approximately 100 million tonnes per year in 2030.
2.2.1.Data centre consumption share by servers and data storage products
Table 1
Table 1
shows the estimated proportion of energy consumed by IT and consumed by the rest of data centres i.e. the infrastructure, including cooling, ventilation, UPS, etc. The IT energy consumption share from 2010 to 2030 is expected to increase and the PUE is improved as a result of possible ecodesign regulation and general increase in focus for energy efficiency in data centres.
|
|
2010
|
2015
|
2020
|
2025
|
2030
|
|
IT (servers, storage and network equipment etc.)
|
52%
|
57%
|
65%
|
65%
|
65%
|
|
Infrastructure (mechanical and electrical systems)
|
48%
|
43%
|
35%
|
35%
|
35%
|
Table 1 Energy consumption shares in % by EU data centre systems.
The percentage of electricity consumption for the IT equipment was calculated from the percentage of IT and infrastructure in the US for period 2010 to 2020 estimated by the Lawrence Berkeley National Laboratory report. During the period from 2020 to 2030, the proportions were calculated based on an interpolation assuming a PUE factor of 1.55 (Business as Usual scenario) in 2030.
From the above, it can be concluded that any initiative aimed at decreasing the energy consumption at product level would certainly have a significant effect on the overall consumption at data centre level.
2.2.2.Data centre locations
According to a European survey, the majority (68%) of companies choose their own country when considering locations for their new data centres, and the most important factors when choosing the site are security and connectivity. Most locations considered for a new data centre are in the three largest countries in Europe, the UK (London), France (Paris) and Germany (Frankfurt).
More recently, relocation or expansion of data centre space to northern locations is occurring for a few known hyperscale data centres such as Facebook and Apple, but it is not a general visible trend for all. Although there might be a trend to build new data centres in colder regions, it also highly depends on other beneficial factors such as above-mentioned security, connectivity, accessibility, latency and power costs etc. for data centres. Data center relocation projects are expensive. The average data center relocation costs 10,000 USD/rack. It is therefore assumed not to be the first preferred option for an existing data centre that is already located in warmer regions.
2.3.What are the underlying drivers of the problem?
Servers and data storage products are not all standard off-the-shelf products, some of them are configured to the purpose of the customer regarding redundancy, number and type of processor sockets and processors installed at delivery, number of blades (for blade servers), disk capacity and number of disks at delivery etc.
The typical users for servers and data storage products are technical experts rather than common consumers as seen for household ICT equipment. Although they may have the competences to choose energy efficient devices, typically they do not include the energy consumption and energy efficiency as important purchasing requirements as argued previously in Section 2.1 but rather focus on other aspects. This market failure in terms of economic sound purchasing decision is due to the following reasons: split incentives due to the division between budgets for purchasing (typically a specific IT budget) and running costs (typically part of an administrative budget), lack of functional information, lack of tools for assessing the TCO and user prioritisation including traditions e.g. for selecting specific brands and specific solutions. These market failures are seen less for the large scale global IT companies, however, also here may be seen not fully optimised choice of solutions and brands. These large companies often have a data centre design concept including purchasing principles for servers and data storage product, which is followed when constructing new data centres.
Furthermore, a general market introduction of more efficient servers and data storage product due to ecodesign regulation would also push the energy efficiency of the products that the large scale IT companies purchase for their data centres.
In terms of material efficiency of servers and storage products, market failure lies in several aspects, which hinder a high rate of reuse and recycling: Difficulty in disassembly and separation of products, lack of information of embedded critical raw materials, lack of standardised data deletion method and unavailability of firmware updates. These problems can be addressed by the current initiative by introducing requirements regarding material efficiency.
Concerning the existing literature in support to the abovementioned problem drivers, in general terms it has been found that there can be multiple reasons why economic actors do not spontaneously choose the products which are the most cost-effective over the product's lifetime. In several cases companies (as well as some public services sectors) are less likely to undertake energy saving measures, even if they would have the same economic viability as other investments
,
.
Specifically in the case of servers and data storage products, given that it is a B2B (business to business) sector, gathering the information was possible thanks in particular to bilateral contacts occurred with industry, data center managers and users. The collection of available literature/reports was more challenging, as some stakeholders were not willing to publicly disclose sensitive commercial information; nevertheless, references are given for each of the market failures described in the next subsections.
2.3.1.Lack of functional information – energy related aspects
In the open public consultation (described with more detail in Annex 2) run in the context of this impact assessment, one of the questions was intended to understand how the respondents judged the information made available by manufacturers to 'users' (i.e. data centre/server rooms operators) in terms of energy consumption of servers and data storage products. Results were as follows:
·38% of the respondents think that information is available, however in a non-standardised way, with big differences between the various manufacturers
·31% of respondents declared that specific information is usually missing.
Only 15% of respondents was of the opinion that manufacturers already today provide users with the necessary information, while the rest of respondents did not reply, or replied 'don't know'.
Lack of functional information concerns the lack of a reliable parameter to measure the energy efficiency of the products. The problem is complex as energy consumption depends amongst others on two highly variable parameters – the type of work performed by the machine and the computing platform (server technology, operating system and applications). For large enterprise clients purchasing servers in high volume for specific purposes, it is possible to work with vendors to test configurations against actual work at the specific enterprise, by replicating the data processing through traces. However, this is not a realistic solution for the majority of users due to the costs of doing these specialised tests.
There are many different performance tests and a large range of information for servers, which are not functional for objective comparison. Many manufacturers have server and data storage product sizing and configuration tools but in terms of energy, they often only provide the maximum power and cooling needs. Sometimes efficiency benchmark data can be found for certain server models, but it cannot be used for comparison with products from other brands etc. Since there is no standardisation, all vendors will heavily optimise and select the tests, which show their products in the best possible light. This makes accurate and unbiased comparison impossible.
Concerning the first market failure (lack of functional information), relevant industry actors have been working for some time on the development of a standardized and appropriate testing methodology for energy efficiency (i.e. energy performance vs energy consumption), in particular the SERT (Server Efficiency Rating Tool) for servers developed by SPEC (Standard Performance Evaluation Corporation) and the SNIA (Storage Networking Industry Association) Emerald™ programme for data storage product. The task proved extremely complex since the energy consumption depends on several parameters, inter alia, the type of work performed by the machine, and the computing platform, which are both highly variable elements. Further development of such methods into standards would play a key role in addressing the provision of reliable functional information, which is one of the causes of market failure. However, two elements limit the degree of effectiveness of these standards: firstly, voluntary coordination among firms is difficult and costly for this class of products, due to the technical difficulties in defining a standardized measure of energy performance and energy consumption. Secondly, the uptake of such standards would likely be incomplete in case of voluntary participation. For these reasons, the effectiveness of such standards would be greatly limited if they were not accompanied by an obligation to use them to transparently publish energy performance data, among other environmental impacts.
2.3.2.“Non-optimal economic behaviour” of the users
Energy efficient products are already available on the EU market today, but many customers do not purchase energy efficient products as the majority of users prioritise low purchasing cost, to low electricity costs and environmental savings. The two market failures are mutually supportive and feed each other in the sense that the absence of interest from large sectors of customers allows for a continued lack of functional information which together result in an environment that does not stimulate investments and efforts towards designing more energy efficient products.
It emerged during the preparatory study that, DG GROW Lot 9 products, in particular servers and data storage products, are perceived by users only as components of a much more complex system - the data centre. Even if it is sometimes recognised that electricity costs are increasingly important, service availability, performance and security still have priority over energy (and resource) consumption. Moreover, service availability, performance and security dictate the technology, configuration and resulting product costs; the intended quality of service is setting the parameters for the products design including its options for power management and efficient resource utilisation. For these reasons, as emerged in the preparatory study (in particular in Task 3), customers tend to overlook possible (money and energy) savings over the product's life cycle deriving from increased energy efficiency, which does not put service availability, performance and security at risk. This “non-optimal economic behaviour” can be considered as a market failure.
Even though more efficient equipment exists, which is at least at the same level of reliability etc. as the less efficient equipment, many data centre owners and operators still neglect their consideration when taking purchasing decisions. In some cases, it is because of budgetary reasons that they choose less efficient instead of more efficient equipment, which is feasible over a lifetime, but is more expensive to buy. Other reasons include that it requires less resources to continue with the same choice of solutions, product brands and suppliers that to switch to other solutions, brands and suppliers. This is a fact, which is seen not only in the data centres, but also in other B2B markets.
Surveys such as those conducted for Digital Realty have shown that the importance of green issues is much lower than other factors in this product market. Power reliability and requirements and data centre operations/management were considered extremely important for over 34% of participants when planning a data centre, whereas green issues were considered extremely important for just 21% and the least important of 9 different issues. Similarly, for data centre expansion, security, disaster recovery and power issues were the most important reasons for expanding, while green issues were the 13th most important out of 15 factors.
Furthermore, a specific situation occurs for colocation centres, where the data centre owner provides the infrastructure, such as area, racks, secure access system, cooling etc., while the customers bring their own servers. The technical expertise of these customers for the purchase of servers and data storage products can be smaller, therefore they are more likely to choose cheaper and less efficient equipment.
2.3.3.Lack of functional information - resource related aspects
The identified market failures for enterprise servers and data storage products mainly concern incomplete information when customers and other stakeholders which play a role throughout the product lifecycle, such as repairers or recyclers, are given neither sufficient nor good-quality information for their purchase, reuse, disposal or recycling. The reasons for this incomplete information vary from case to case, being linked e.g. to lack of standardized methods (such as in the case of energy consumption, as shown earlier) or to overcautious end-of-life practices (as in the case of the sanitization of hard disk drives (HDDs)). Specifically, in the case of the (lack of) availability of firmware updates, which will be described in detail in the remainder of this section, this market failure is usually referred to as 'market power' (i.e., the ability of a firm to profitably raise the market price of a good or service over marginal cost).
Concerning data deletion issues, there are an increasing number of cases in the literature concerning personal data found in second hand components, like HDDs put back on the market (El Emam et al., 2007; NAID, 2017). In the context of reuse of enterprise servers, reuse operators need to grant the deletion of personal data contained in waste electrical and electronic equipment (WEEE) before their further treatments. The data privacy concerns, along with the lack of specific guidance, have led more customers to ask end-of-life operators to ensure that their devices are (physically) destroyed after their first use in order to avoid the threat of any potential access to personal information. In other cases operators are specifically paid by their clients to certify the destruction of data bearing equipment (e.g. by the physical destruction of the equipment). Alternatively, when such request did not occur, operators developed specific procedures to grant the sanitization of data bearing equipment. The physical destruction of the data storage device is therefore considered as “extreme”, whereas in most cases the proper sanitization of the storage media could, in many cases, suffice to ensure the proper erasure of personal data in the device.
The availability of firmware updates has been also highlighted by reuse operators as a crucial aspect for the reuse of servers. In the last decade original equipment manufacturers (OEMs) have decided to restrain the access to firmware updates for some ICT products, typically granting access only to the users who were signing a maintenance agreement with them. This practice of restricted access to firmware can hinder the reusability of products as enterprise servers and data storage products. The difficulty for third parties dealing with maintenance, reuse and upgrading of enterprise servers and data storage products to access the market of reused and refurbished products is the reason for which the market failure concerning the (lack of) availability of firmware updates has been classified as 'market power', by also taking into account that the enterprise servers and data storage products market is a highly concentrated one (e.g. in 2013, 78% of the market was covered by the top five international vendors)8. Moreover, the unavailability of firmware updates for buyers of second hand equipment does not only impact their interoperability with other hardware and software, but also endangers the security of these devices and the digital services they support
Finally, repair and end-of-life operators generally identified the ‘ease of disassembly’ of WEEE as an essential prerequisite for their reuse. WEEE need to be disassembled to permit their checking and to allow the repair and replacement of faulty and/or obsolete components. Barriers to disassembly have been observed29 mainly in the case of servers and are related to different aspects as: the use of welded or glued components; the use of several different fastening techniques (e.g. the used of several different screws and snap fits); the use of proprietary fastening systems (e.g. special screws that necessitate special tools); and in general the low visibility or accessibility of certain fastening (e.g. screws that are covered by labels). These difficulties have been also observed especially when the disassembly is performed by reuse operators, independent from OEMs, who do not know exactly the architecture of the server and the required disassembly procedures. That is why this market failure can be considered as a case of incomplete information. It is highlighted that the ease of disassembly of servers relates also to data privacy issues, since the extraction of data bearing components (e.g. HDDs and SSDs (Solid State Drives) can be necessary to grant their proper sanitization or destruction. The JRC study also indicates that there is a significant amount of critical raw materials (CRM) found in the servers and storage products e.g. Neodymium. As they are often contained in components that are boxed inside a casing, the lack of information of present critical raw materials and amount of the materials provides little incentive for recyclers to disassemble difficult casings for extraction.
2.4.Who is affected, in what ways and to what extent?
There is a complex global supply chain involved in the server and data storage product manufacturing industry that will be affected. There are a small number of large global product manufacturers (vendors) which sell products to the users (i.e. the customers). A few large contract manufacturers assemble the products for these manufacturers. The main components are sourced and supplied by a number of large specialised manufacturers.
Servers and data storage product provide services for all of society, however they are operated directly by businesses and the public sector. This means the private end consumer are not affected by the problem of servers and storage market failures.
Several types of stakeholders would be affected by the different options in this impact assessment:
Large Manufacturers (Vendors)
The main industry vendors include HPE (Hewlett Packard Enterprise) (US), Dell (US), Lenovo (China), IBM (US), Cisco (US) and Fujitsu (Germany). Hitachi also manufactures data storage products. There are also three other large Chinese manufacturers, which do not yet have significant European market share but may grow in future, Huawei, Inspur and Sugon. Fujitsu has manufacturing facilities in Augsburg, Germany, which produces up to 950 servers and storage products daily, that equals to approx. 250,000 units in a year
. Hitachi assembles storage products in The Netherlands and Lenovo has also disclosed plans to manufacture in Europe.
Manufacturers will be most affected since they directly implement policies and are responsible for showing compliance. The manufacturer designs the product, which will require greater focus on energy efficiency in research and development, and provides users with the appropriate information. However, around 75% or more of the energy consumption and efficiency opportunities are determined by the main components not produced by the server and storage manufacturers themselves, including the Power Supply Unit(PSU), central processing unit(CPU), random-access memory (RAM) and storage. Manufacturers will therefore also need to work with component manufacturers in their supply chains to help developing and source the most efficient parts and ensure future component design road maps meet future efficiency requirements.
Contract Manufacturers (CMs)
Contract Manufacturers are used by the majority of the large vendors. The main CMs are Hon Hai, Inventec, Wistron and Quanta, all Taiwanese companies. They are increasingly involved in the design of sub-assemblies, particularly the motherboard, and have started to design and sell products directly. Their manufacturing bases include Eastern Europe (mainly Czech republic), China and Mexico.
CMs assembling the final product will not be greatly affected by the policies policies (as long as they are not responsible for placing the product on the market) but will need to work with the vendor if they are designing the product. However, where the CMs are selling directly to the user (i.e. they are responsible for placing the product on the market), they will be responsible for compliance in the same way as other manufacturers.
Component manufacturers
Many components currently only have 3-4 major component manufacturers that supply to all the server and data storage product vendors. A large proportion of the efficiency gains are achieved through component efficiency and may require increased research and design (R&D). R&D costs, as well as new manufacturing facilities to produce more efficient components may increase component costs. It may also change the existing market structure where older, less efficient components which offer proven, reliable options and lower cost alternatives to the latest state of the art tend to remain on the market for a number of years.
System Integrators and independent manufacturers
There are a large number of local system integrators across Europe that use off the shelf components, which are then custom-assembled for the client. There are also a smaller number of independent manufacturers who design and manufacture products. The system integrator or manufacturers would be affected by the regulatory approaches envisaged in this impact assessment (in a direct way, when they would be responsible for placing servers and data storage products on the market).
Data centre and server operators
New policies should help operators select and purchase more efficient products, which lowers their energy consumption and operating costs, while possibly increasing one-off purchase costs.
2.5.How are existing policies and legislation affecting the issue?
At present, servers are partly covered by the Ecodesign regulation on computer and computer servers
, which quantitatively regulates only power supply efficiency for the servers, while there is no requirement on Minimum Energy Performance Standards (MEPS) for these products. The current Ecodesign regulation on computer and computer servers has also an exemption for blade server systems and components, which means that potentially excludes ca. 800,000 blade servers a year, equivalent to approx. 18% of the total server market. Other product groups are also exempted: server appliances, multi-nodes servers and computer servers with more than four processor sockets.
Several other pieces of EU and non EU legislation, as well as voluntary initiatives, affect at present servers and data storage products; they are described in detail in '
Annex 11: Existing Policies, Legislation and Standards on servers and Data storage products
'.
2.6.Baseline scenario: How will the issue evolve in absence of intervention?
Based on the current trend, it is predicted that with or without EU intervention, the following development in the servers and storage market can be expected:
·Server and storage sales increase more slowly than recent years. As indicated in the preparatory study, continuous growth of virtualisation is leading to dematerialisation and lower demand in physical servers and storage product alike. However, as shown more in detail in Annex 4, the effect of virtualisation on the decrease of server and storage sales is deemed to cease around 2016, and from this year onward the growth rates for these products are nevertheless assumed to be positive.
·Growth of cloud applications and workloads and fall in sales of hardware to be used by SMEs and large companies with own server and data centre facilities as well as fall in the number of SME manufactures of servers and storage due to lower demand of physical servers and mainly of low end physical servers. However, the growth will stagnate after reaching very high cloud workloads of approximately 90%.
This development is due to better and cheaper cloud services combined with faster data connections, making it attractive to move from own organisational servers and data centres to cloud and hosted services. There are however limits to the move to cloud services, see Annex 4, therefore the sales proportion of traditional to cloud servers is maintained at 30:70 for the baseline scenario.
The baseline assumes that current policy measures at Member State level will not change, that means impact of above mentioned national programmes as well as EU Energy Star have been included in baseline scenario and no further action at EU level will be introduced. No EU intervention would mean that there will be no realisation of the full saving potential and persistence of the mentioned market failures: lack of standardised methodology and not-optimised behaviour of users.
This implies that:
·Efficiency and performance improve due to natural improvement as follows the technical development but at a limited scale because of little focus by the users.
·Metrics may be developed for use by Energy Star and other schemes but without being implemented broadly and without achieving full impact compared to a MEPS regulation.
·The Energy Star server specification will continue to be in effect and further developed into new versions stimulating the development of more efficient servers but due to the voluntary nature of the scheme, the uptake would be rather limited.
·Energy consumption of servers and storage will continue to increase, because the increase of data centre service needs exceeds the limited efficiency improvements.
The baseline assumes the average power of servers is expected to decrease gradually from current level, depending on the type of the servers it can decrease by 1-18% by 2030. However, rack servers with 1 socket and 4 sockets as well as blade servers with 1 socket will increase 1 – 6% by 2030 as a result of higher utilisation rates and higher performance. Data storage product capacity doubles every 2-3 years, but storage density increases 20-30% every year, which means the average power consumption is assumed to increase ca. 6% annually up to 2020, and there onwards 2% increase up to 2030.
The baseline also assumes servers’ average PSU efficiency will increase by 7% point by 2030 from current level of 78% - 82% depending on the type, and data storage products’ average PSU efficiency will increase by 5% point by 2030 from the current level of 87%.
In terms of baseline operating conditions, most servers and data storage products can already operate at ASHRAE A2 conditions (max. 35 °C), but without a binding agreement to declare this information, most data centres and server rooms do not have the confidence to operate accordingly. Hence, average PUE was assumed 1.8 currently and will gradually decrease to 1.55 by 2030 due to the market development into more efficient new data centres. More detailed description of baseline assumptions can be found in
Annex 4: Inputs, assumptions, calculations
.
2.6.1.Base Cases
The base cases with major market share should be included in the baseline scenario to establish the energy consumption most representative of the sector. In this subsection, sensible base cases have been established in close consultation with the industry. It should be noted that the base cases identified for the Impact Assessment are different from the ones in Preparatory Study Lot 9 which defined 3 base cases: rack server, blade server and storage; there are now more sub-categories within rack and blade servers as well as data storage products in the current assessment in order to be more representative of the market.
Servers
The server base cases listed in
Table 2
were identified during consultation with industrial stakeholders.
Table 2: Server base cases
|
Form
|
Sockets/CPUs
|
Resilient
|
|
Tower
|
1
|
No
|
|
Rack
|
1
|
No
|
|
Rack
|
2
|
No
|
|
Rack
|
4
|
No
|
|
Rack
|
2
|
Yes
|
|
Rack
|
4
|
Yes
|
|
Blade, incl. enclosure
|
1
|
No
|
|
Blade, incl. enclosure
|
2
|
No
|
|
Blade, incl. enclosure
|
4
|
No
|
For tower servers only the one socket system is assessed separately from the rack systems. The 2 socket tower server is close to the two socket rack server in terms of resource requirements and components, and is thus covered by this base case.
3-socket servers were not included in the base cases, as they are not common and can largely be addressed by the evaluation of the 4-socket options. The base cases will be built on managed server technology, which is a suitable representation of unmanaged servers of the same type in assessing the impacts of the different scenarios. The base cases assumed all sockets to be used, and hence configurations such as two socket servers with one socket populated are assumed to be sufficiently covered by the ‘one socket, one processor’ and ‘two socket, two processors’ cases.
The two and four socket resilient servers comprise only a small share of the market, but are included as base cases, since their configuration and thus energy consumption differ significantly from the non-resilient servers. The three socket servers are not included as a base case, as they are even less common and largely addressed by the evaluation of two and four socket resilient servers.
With regards to multi-node blade server systems, the power and performance characteristics of a 2 socket or 4 socket blade servers are comparable to the performance of dual or multi-node blade server enabling the 2 and 4 socket blades to adequately represent the product set. Blade server base cases are assumed to include both the blades and the blade enclosures.
Storage
These base cases are chosen based on the Storage Networking Industry Association (SNIA) taxonomy of Online 1 – 6 products
. There are 3 base cases for data storage products; online 2, 3 and 4 products, which are the most common low-end and mid-range products. Online 1 products were omitted since these are consumer products whereas current initiative has a focus on enterprise products. Online 1 storage cover a small market, and are technically different from Online 2, 3 and 4 products, therefore would need a separate analysis. Online 5 and 6, usually high-end and mainframe products, only have limited sales due to the large size and more specialist roles. These systems have also a limited number of manufacturers and building and testing an Online-5 or 6 systems is specialised and very complex, therefore they were excluded from the Energy Star scope and likewise excluded here.
Table 3 Data storage product base cases
|
Storage Classification
|
|
Online 2
|
|
Online 3
|
|
Online 4
|
These base cases have been developed based on the different configuration, device details and SNIA Emerald test data of seven storage products Digital Europe has provided. The performance for each base case is averaged out of the performance of the seven products with different configurations, however it is difficult to determine a typical average product for each base case as it is possible to have a wide range of number of drives, which is a key determinant of energy consumption.
2.6.2.Sales
The market of servers and storage products is global, as a few very large international vendors cover the most of the market share. Generally, the market of these products in the EU is expected to follow the global market trend.
Servers
In 2015 the total sales of identified server base cases is estimated to be 3.2 million, this covers 80% of all servers in the EU, as some micro-servers, unmanaged servers, 3 socket servers and a small portion of resilient servers are not represented by the base cases. This total is expected to increase to around 5 million in 2030. This gives a collective growth rate of 1.2% per year. However, the growth is not distributed equally between the eight base cases.
Table 4
shows the predicted sales for each base case until 2030 and the compound annual growth rate (CAGR) from 2000 to 2030. See details about sale estimation in
Annex 4: Inputs, assumptions, calculations
.
For all server types, the sales show a decreasing trend from 2010 to 2016. For all but the 1 socket tower servers, this is expected to shift to an increasing trend from 2017, with the growth rates shown in
Table 4
. The sales forecast is based on sales data for servers in units in the EU-28 supplied by Digital Europe, which is higher than the sales figures found in the preparatory study Lot 9. The sales provided represents 77% of the EU market, therefore the total shown above is scaled up to the whole EU market.
Table 4: Sales for the server base cases
|
Base case
|
2010
|
2015
|
2020
|
2025
|
2030
|
CAGR 2000-2030
|
|
Tower 1 socket
|
258,148
|
231,269
|
198,599
|
170,544
|
146,452
|
-1.4%
|
|
Rack 1 socket
|
559,471
|
543,057
|
570,758
|
599,872
|
630,472
|
0.4%
|
|
Rack 2 socket
|
1,836,718
|
1,633,409
|
1,987,291
|
2,417,844
|
2,941,677
|
1.6%
|
|
Rack 4 socket
|
103,122
|
85,773
|
104,357
|
126,966
|
154,473
|
1.4%
|
|
Rack 2 socket
resilient
|
30,474
|
27,513
|
33,474
|
40,726
|
49,549
|
1.6%
|
|
Rack 4 socket
resilient
|
1,673
|
1,511
|
1,838
|
2,236
|
2,721
|
1.6%
|
|
Blade 1 socket
|
179,844
|
169,704
|
178,361
|
187,459
|
197,021
|
0.3%
|
|
Blade 2 socket
|
595,715
|
511,811
|
622,696
|
757,605
|
921,743
|
1.5%
|
|
Blade 4 socket
|
33,061
|
27,418
|
33,358
|
40,586
|
49,378
|
1.3%
|
|
Total
|
3,562,232
|
3,231,465
|
3,730,732
|
4,343,837
|
5,093,486
|
1.2 %
|
Storage
The three base cases Online 2, 3 and 4 should represent approx. 53% of the entire storage market. In 2015, the total sales for the identified base cases are estimated ca. 550,000 units. The annual growth rate of 2 % is assumed from 2017 onwards, due to the sales data from market research companies show that there are swings in sales during 2009 - 2014, so it is also reflected in the modelled sales. From 2000 to 2009, the sales are steadily increasing due to the growing demand. The compound annual growth rate (CAGR) in
Table 5
is the average growth rate per year from 2000 to 2030. It can be observed that there is currently a downward trend in 2010 -2015 period. While demand for more storage continued to increase, unit sales actually decreased. This is because the total storage capacity of each unit has increased and more than offset the drop in sales.
Table 5 Sales for storage base cases
|
Type
|
2010
|
2015
|
2020
|
2025
|
2030
|
CAGR 2000-2030
|
|
Online 2
|
305,314
|
282,603
|
308,957
|
341,114
|
376,617
|
4.5%
|
|
Online 3
|
190,289
|
135,778
|
148,440
|
163,890
|
180,948
|
3.2%
|
|
Online 4
|
39,083
|
35,419
|
38,722
|
42,753
|
47,202
|
3.9%
|
|
Total
|
534,687
|
453,800
|
496,120
|
547,757
|
604,767
|
4.0%
|
The sales are provided by Digital Europe via IDC for units sold in Western Europe. No information is obtained about the market share in proportion to the whole EU-market, so the data is not scaled up and these figures are considered conservative estimates. The sales data is higher than the figures supplied by market research companies in the preparatory study; however, in line with the model used by preparatory study and for the servers above, the sales data provided by Digital Europe is used for the Impact Assessment model. It is assumed Online 2 products account for 40% of the sales for the entire group of Online 1 and 2.
2.6.3.Product lifetime and stock
Servers
For calculating the stock of the base cases, a lifetime of 5 years with a standard deviation of 1 year was assumed. The lifetime is based on the findings from preparatory study Lot 9, that the economic lifetime varies according to user segment, primary users typically switch servers every 3 – 5 years and secondary users 5 – 7 years.
The stock for server base cases, seen in
Table 6
, is estimated to be 18 million in 2015 and is estimated to reach 26 million in 2030 based on the sales forecast and expected lifetimes. See details about stock estimation in
Annex 4: Inputs, assumptions
.
Table 6: Stock for the server base cases
|
Base case
|
2010
|
2015
|
2020
|
2025
|
2030
|
|
Tower 1 socket
|
1,221,844
|
1,299,250
|
1,173,436
|
1,008,941
|
866,412
|
|
Rack 1 socket
|
3,077,090
|
3,059,884
|
3,068,257
|
3,223,567
|
3,388,001
|
|
Rack 2 socket
|
10,101,948
|
9,422,302
|
10,004,073
|
12,155,464
|
14,788,981
|
|
Rack 4 socket
|
567,170
|
507,183
|
525,339
|
638,307
|
776,598
|
|
Rack 2 socket resilient
|
167,607
|
158,101
|
168,509
|
204,747
|
249,105
|
|
Rack 4 socket resilient
|
9,203
|
8,681
|
9,253
|
11,243
|
13,678
|
|
Blade 1 socket
|
989,141
|
963,702
|
958,826
|
1,007,357
|
1,058,742
|
|
Blade 2 socket
|
3,276,433
|
2,976,130
|
3,134,694
|
3,808,800
|
4,633,988
|
|
Blade 4 socket
|
181,837
|
161,603
|
167,928
|
204,040
|
248,245
|
|
Total
|
19,592,276
|
18,556,897
|
19,210,375
|
22,262,519
|
26,023,818
|
Storage
According to Digital Europe, data storage products such as hard disk drives, solid-state drives, hybrid drives and storage systems have an average economic lifetime of 5 to 7 years. The stock for the three base cases of data storage product is estimated with normal distribution by assuming an average lifetime of 7 years with a standard deviation of 1.
The stock for data storage product base cases, seen in
Table 7
, is estimated to be 3.4 million in 2015 and is estimated to reach 4.2 million in 2030.
Table 7 Stock for data storage product base cases
|
Base case
|
2010
|
2015
|
2020
|
2025
|
2030
|
|
Online 2
|
1,546,870
|
2,018,778
|
2,179,988
|
2,390,988
|
2,639,844
|
|
Online 3
|
979,636
|
1,151,388
|
1,059,698
|
1,148,765
|
1,268,329
|
|
Online 4
|
202,467
|
259,817
|
275,060
|
299,669
|
330,859
|
|
Total
|
2,728,973
|
3,429,983
|
3,514,746
|
3,839,422
|
4,239,032
|
2.6.4.Expenditure
Servers
The purchase price for the base case servers is shown in
Table 8
. The price ranges are from the preparatory study, where the typical purchase price was estimated by expert. There are large price variations within each group dependent on a number of factors such as number and speed of CPUs, capacity and speed of the memory, type, number and size of disk drives, operating system, years of warranty included.
Table 8: Purchase prices (excluding VAT) base cases in Euros/unit
|
Base cases
|
Range of purchase price (€/unit)
|
Estimated typical purchase price (€/unit)
|
|
Tower 1 socket
|
750 – 4,600
|
1,200
|
|
Rack 1 socket
|
700 – 1,300
|
1,000
|
|
Rack 2 socket
|
1,300 – 76,100
|
3,500
|
|
Rack 4 socket
|
|
30,500
|
|
Rack 2 socket resilient
|
|
35,000
|
|
Rack 4 socket resilient
|
3,400 – 72,050
|
37,500
|
|
Blade 1 socket
|
|
375
|
|
Blade 2 socket
|
|
3,500
|
|
Blade 4 socket
|
3,500 – 11,800
|
6,500
|
Storage
Price bands for Online 2, 3 and 4 base cases have been supplied by Digital Europe. An average purchase would be needed to calculate the user expenditure in later sections. However it is again difficult to determine a typical cost for the data storage products as it depends very much of the configurations, table below shows the price range and assumed price in the impact assessment. In preparatory study for Lot 9, the product price for storage is assumed € 23,000 regardless of storage classification, since current purchase price assumed for Online 3 and Online 4 products are much higher, the total storage turnover from product price would be higher than that of preparatory study.
Table 9: Purchase prices (excluding VAT) for each base case in Euros/unit.
|
Storage Classification
|
Range of purchase price (€/unit)
|
Assumed purchase price (€/unit)
|
|
Online 2
|
< 22,766
|
20,000
|
|
Online 3
|
13,659 – 91,066
|
50,000
|
|
Online 4
|
91,066 - 227,665
|
160,000
|
2.6.1.Industry revenue
The total revenue of servers and storage industry is estimated 55 billion euros in 2015, out of which 13 billion euros from OEM and 9 billion euros from the original design manufacturers (ODMs) for servers, and 19 billion from OEMs and 13 billion euros from ODMs for storage. As seen above the data storage products are in average much more expensive than servers and is a much less off-the-shelf product, therefore much higher revenue have been estimated.
2.6.2.Employment
Europe has a number of companies which carry out high volume final assembly of servers and storage products. These are mainly based in Eastern Europe (Czech Republic) as well as Germany and the Netherlands. Independent manufacturers and system integrators are located throughout Europe.
Fujitsu in 2013 manufactured 300,000 servers/storage units, and had 1,500 employees. Hon Hai in Czech Republic has 4000 employees and manufactures 12 million units per year, although it is not clear how many of them are servers/storage, as it manufactures various types of electronic equipment such as mobiles, smartphones, tablets, game consoles etc.
Based on the sales estimation and approximate average purchase prices of servers and storage, the employment due to the manufacturing and sales of servers and storage in baseline are estimated in the table below. It is assumed an average ratio of annual industry revenue per employee, because it requires a much higher level of detailed data from the industry stakeholders to establish a dynamic employment assessment of the sector. The table presents the employment of Original Equipment Manufacturers (OEMs) who sell and customise the servers to the users, SMEs are also included in the figures. In some cases, the Original Design Manufacturers (ODMs) sell the servers and storage directly to the users, but the result presented in this report assumes that ODMs produce, design and manufacture products, which are specified and branded later by the OEMs.
Table 10: Number of employees within EU in OEMs and ODMs for servers and storage in scope
|
|
2015
|
2020
|
2025
|
2030
|
|
OEM - servers
|
50,153
|
68,151
|
92,855
|
126,772
|
|
ODM - servers
|
48,147
|
65,425
|
89,140
|
121,701
|
|
OEM - storage
|
71,246
|
88,125
|
110,083
|
137,512
|
|
ODM - storage
|
68,396
|
84,600
|
105,680
|
132,012
|
2.6.3.Energy consumption and GHG emissions
Servers
The annual energy consumption and greenhouse gas (GHG) emissions for servers including infrastructure such as cooling is shown in
Table 11
. In a data centre, there will also be approx. 10-12% additional energy consumption for network equipment. This equipment is not a part of the IA scope and not included in the infrastructure. For rest of the report, network equipment is not included in any energy consumption, primary energy consumption and GHG emissions.
Table 11: Total energy consumption and GHG emissions from server stock in EU
|
|
2010
|
2015
|
2020
|
2025
|
2030
|
|
Energy consumption servers, TWh
|
45.8
|
37.9
|
35.7
|
40.7
|
47.9
|
|
Energy consumption including infrastructure, TWh
|
93.6
|
68.9
|
61.7
|
66.9
|
74.5
|
|
Total primary energy including infrastructure, PJ
|
842.6
|
620.0
|
554.9
|
601.7
|
670.2
|
|
GHG, including infrastructure, Mt CO2-eq
|
38.4
|
27.2
|
23.4
|
24.1
|
25.3
|
The annual energy consumption of servers is based on the stock model and data of energy consumption in idle and max on-modes for the eight base cases
. Energy consumption including infrastructure is calculated as the product of energy consumption of server and the average PUE factor in a given year, the PUE factor takes into account of autonomous development in data centre energy efficiency. The PUE factor is dependent on the climatic conditions and is an average of all the Member States. The climatic conditions are assumed to impact the PUE with less than 10%. See further in Annex 4.
The CO2 emission factor used in the calculation is decreasing as the renewable energy share in the grid electricity is anticipated to increase. See more details for the calculation in
Annex 4: Inputs, assumptions
.
Storage
The annual energy consumption and GHG emissions for servers including infrastructure such as cooling, is shown in table below.
Table 12 Total energy consumption and GHG emissions from data storage product stock in EU
|
|
2010
|
2015
|
2020
|
2025
|
2030
|
|
Energy consumption storage, TWh
|
11.0
|
14.7
|
19.7
|
25.0
|
29.9
|
|
Energy consumption including infrastructure, TWh
|
22.5
|
26.6
|
34.1
|
41.0
|
46.5
|
|
Total primary energy including infrastructure, PJ
|
202.7
|
239.7
|
307.0
|
369.3
|
418.4
|
|
GHG, including infrastructure, Mt CO2-eq
|
9.2
|
10.5
|
13.0
|
14.8
|
15.8
|
Similar modelling methodology applied to servers is applied to the data storage products. The annual energy consumption is based on the stock model and data of energy consumption in idle modes for storage base cases38. Idle mode consumption is used for calculation due to the small difference between idle and max on-mode consumptions for these base cases.
Total servers and data storage products
The total electricity consumption of servers and storage including infrastructure is estimated ca. 96 TWh in 2015 and this is estimated to increase to 121 TWh in 2030.
Table 13 Total energy consumption and GHG emissions from servers and data storage products in EU
|
|
2010
|
2015
|
2020
|
2025
|
2030
|
|
Energy consumption servers and storage, TWh
|
56.8
|
52.6
|
55.4
|
65.7
|
77.8
|
|
Energy consumption including infrastructure, TWh
|
116
|
96
|
96
|
108
|
121
|
|
Total primary energy including infrastructure, PJ
|
1045
|
860
|
862
|
971
|
1089
|
|
GHG, including infrastructure, Mt CO2-eq
|
47.6
|
37.7
|
36.4
|
38.8
|
41.1
|
2.6.4.Improvement potential
In consultation with stakeholders, the preparatory study identified a number of cost effective options for improving the energy efficiency of server and data storage product. It was established that the following options could reduce societal costs:
·Higher efficiency PSUs. Installing 80 Plus Platinum efficiency PSU in on/standby mode could reduce energy consumption by up to 7% compared to 80 Plus Silver PSUs in balanced mode.
·Using solid state drives (SSDs) rather than HDDs. SSDs are rapidly falling in price and in certain cases are becoming cost competitive with performance enterprise HDDs.
·ASHRAE thermal guideline A2 or A3 operating conditions. Extending the operating temperature and humidity range reduces the need for mechanical cooling of the data centre, if free air cooling is a possibility for the data centre. This allows the chillers and cooling units set points to be raised, or switched off when the outdoor air is sufficiently cool.
·Servers only - advanced processor and platform power management. By monitoring the utilisation and switching off, or lowering the operating frequency and voltage, it is estimated that power can be reduced by approximately 5%.
·Data storage products only - Capacity Optimization Method Software (COMS). COMS monitor the data and apply techniques such as deduplication and compression to maximise the use of available storage. Power savings can range between 20-30%.
2.7.Should the EU act?
Article 15.1 and 15.2 of the Directive 2009/125/EC provide guidance on when intervention at EU levels is justified. It states that in case a product represents a significant volume of sales, has a significant environmental impact within the Union, presents a significant potential for improvement (without entailing excessive costs), while taking into account an absence of other relevant Union legislation or failure of market forces to address the issue properly and with a wide disparity in environmental performance of products with equivalent functionality, the product can be covered by an implementing measure or by self-regulation.
The EU should not act if the objectives of the action can be achieved sufficiently by Member States acting along. However, action by Member States could not solve the problem for the following reasons:
·Servers and data storage products are a global market, and a few very large global companies are covering 2/3 of the EU market, and an EU action would be more cost-effective.
·Technology for these products is very complex; hence it would be highly difficult for Member States to develop national schemes and regulations, while an EU action would eliminate additional costs needed in each Member State to regulate a technology that does not vary from country to country.
·Manufacturers expressed views that national schemes and regulations would create more obstacles and administrative burden for entering national market, and would prefer to comply with an EU wide legislation.
The preceding sections showed that the sales volume is large enough to be significant, as is the environmental impact from energy consumption and emissions. The current trend in sales and characteristics of equipment placed on the EU market does not significantly reduce the overall energy consumption of these products.
The preparatory studies have established for the products within scope a significant potential for improvement (wide disparity in environmental performance), which can be achieved without excessive costs (improvement of average product results in lower life cycle costs). Moreover, it is expected in absence of regulatory interventions, the market failures analysed in chapter 2.3 could not be solved, and they would represent missed opportunities to move the market from a non-optimal situation.
3.Policy objectives
This impact assessment focuses on specific objectives, since the general ones have already been set out in the impact assessments for the Ecodesign Directives.
3.1.General objectives
The general objective of the initiative is to contribute to the EU climate and energy targets i.e. the 2030 targets, while ensuring the functioning of the internal market.
Following the legal basis of Directives 2009/125/EC and 2010/30/EU in the TFEU, the general objectives are to:
·ensure free circulation of (energy-related) products within the internal market;
·increase energy efficiency;
·ensure security of energy supply in the Union;
·contribute to sustainable development by increasing the level of protection of the environment.
·contribute to circular economy objectives by promoting reuse and recycling, in light of EU’s Circular Economy Action Plan
whilst ensuring (as from Directive 2009/125/EC, article 15) that there will not be :
·significant negative impacts on the functionality of the product
·significant negative impact on industry’s competitiveness
·excessive administrative burden imposed on manufacturers
·significant negative impact on product affordability and the life cycle cost of the product.
3.2. Specific objectives
The specific objectives for this impact assessment are:
·Raising awareness regarding energy efficiency and environmental performance of servers and data storage products and facilitating a comparison between corresponding products among users via inter alia establishing standard measurement methods of energy versus performance and providing product information.
·Complementing or integrating the provisions of the EU Energy Star program
·Gradually removing the worst-performing products from the EU market
·All the above, minimizing the increase in the purchase cost of products, also considering the specificities of the B2B sector of servers and data storage products.
3.3.Consistency with other EU policies
The improved energy efficiency of servers and data storage products will be in the framework of the initiatives which contribute to reduce the energy consumption at EU level by at least 30% by the year 2030, as foreseen in the ‘Proposal for a Directive of the European Parliament and of the Council amending Directive 2012/27/EU on energy efficiency’. At a more global level, the improved energy efficiency of servers and data storage products will contribute at enabling the EU to deliver on its Paris Agreement commitments in terms of emissions reduction.
4.Policy options
4.1.Introduction
In order to address the issues identified in Section 2 and to meet the targets defined as policy objectives in Section 3, several policy options and possible requirements described in the following table are considered.
Table 14 Policy options considered
|
Option 1
|
No EU action (“BAU”, Business-as-Usual)
|
|
Option 2
|
Self-regulation
|
|
Option 3
|
Ecodesign requirements for servers and data storage products
a.Minimum efficiency for power supply
b.Operating temperature information or minimum requirements according to ASHRAE
c.Minimum requirement for idle mode energy consumption
d.Requirements (information or MEPS
) on servers’ performance (e.g. based on SERT tool
)
e.Information requirements e.g. from Energy Star
f.Material efficiency
|
|
Option 4
|
Energy Labelling
|
|
Option 5
|
Regulatory approach such as the Energy Star Programme
|
Option 1 is the baseline where servers and storage business will continue without EU regulatory intervention, it will also serve as a reference for the assessments of the impacts of the different policy options.
Option 2 has been discarded, because the industry has so far not proposed any kind of self-regulation, which is a minimum condition in accordance with Article 17 and Annex VIII of the Directive 2009/125/EC to even consider this option.
Option 4 has also been discarded for a variety of reasons. First of all, there are no or very little direct sales to private household to whom the energy label would be normally targeted. Moreover, servers are B2B products; in order for the label to be a relevant tool for an informed choice when buying the product, it should be carefully designed in order to provide concise but at the same time relevant and effective information (and this can be a difficult task, e.g. considering that the already existing provisions on servers under Energy Star require an extensive list of information items). In any case, the lack of a well-established metric for the energy efficiency of servers, and of the necessary data on product performances and efficiencies would be the main obstacle for the existence of an energy label for servers: the preparation of the scaling and of the ranges of values of each energy class of a labelling system entails a knowledge of the efficiencies of products on the market, and of how they are split in the various potential energy classes, with a level of detail which is even higher of the one needed to set minimum threshold requirements for Ecodesign. That is why a minimum critical mass of data related on product performances and efficiencies would be needed, before proceeding with this option.
This means that policy Option 3 and Option 5 are the viable policy options to address the issues in Section 2 and the objectives given in Section 2. Details about these options are presented below.
4.2.General scope and definitions
The scope is based on the findings of preparatory study ENTR Lot 9, however a few more specific types of servers and data storage have been excluded, because they are not enterprise products or special products with very low sales volume.
The product scope for servers includes products that are:
Defined as computer servers according to the definition of the Energy Star® specification for computer servers (version 2.1). See recommended definition in
Annex 5: Definitions and glossary
.
The product scope for data storage products includes products that are:
Defined as storage product according to the definition of the Energy Star® specifications for data centre data storage product (version 1.0). See recommended definition in
Annex 5: Definitions and glossary
.
The product scope for servers excludes products that are:
·Intended for domestic users or embedded (machinery) applications
The product scope for data storage products excludes products that are:
·Domestic and portable data storage products such as SNIA Classification Online 1 data storage products
·SNIA Classification Online 5 and 6 storage products
4.3.Option 1: No action (Business-as-usual, BAU)
Option 1 is the business-as-usual scenario, where the EU takes no further action and where the users remain focusing on cost and reliability of the product group rather than also on energy. The option will serve as a reference baseline for the other policy options to compare with. This option follows largely the trend described for baseline scenario under Section 2.6.
The main assumptions for this option are detailed in
Annex 4: Inputs, assumptions
.
4.4.Option 3: Ecodesign requirements for servers and data storage products
This section is devoted to assess the possibility of setting Ecodesign Minimum Energy Performance requirements (MEPS) that can be imposed on servers and data storage products, and their economic, environmental and social impacts.
The analysis of ecodesign requirements feasibility for servers and data storage products, respectively, are carried out separately, as the characteristics are different for the two product groups and the conclusions may be too.
Several requirement options (presented in the following sub-sections) are considered across several areas. These are combined into several scenarios (3.1 to 3.3) that differ by stringency of the requirements (3.1 being the least and 3.3 the most stringent scenario).
4.4.1.Minimum efficiency requirements for power supply units
The power supply units (PSU) are used for both servers and data storage products. There are two types of PSUs, i.e. single output and multi-output PSUs. Both types can technically be used for servers and storage. Multi-output PSUs are however more stable and reliable for high power draw associated with a lot of hard drives motors spinning and therefore they are used in storage.
The proposed minimum efficiency requirements for power supply units used for servers and data storage products are shown in
Table 15
. The equivalent efficiencies of the different levels (Gold, Platinum, etc..) are shown in
Annex 4: Inputs, assumptions
,
Table 50
.
Table 15 Proposed minimum efficiency requirements for power supply units in tiers
|
Policy scenario
|
Tier 1
|
Tier 2
|
Tier 3
|
|
PO 3.1
|
2019: Gold for servers, silver for storage
|
2023: Platinum for servers and gold for storage
|
-
|
|
PO 3.2
|
2019: Gold for multi-output PSUs and Platinum for single-output PSUs
|
2023: Platinum for multi-output PSUs and Titanium for single-output PSUs
|
2026: Titanium
|
|
PO 3.3
|
2019: Platinum for servers and gold for storage
|
2021: Platinum for servers and storage
|
2026: Titanium for servers and storage
|
4.4.2.Operating temperature information requirements
4.4.2.1.Background information
Estimating the average operating temperature of data centres and server rooms is a challenging exercise, in particular due the variability of (EU) geographical conditions, together with the fact that these are business-to-business specific applications. Based on existing literature,, , it can be approximated that the server and data storage products are typically operated at temperature in the range of 20°C-22°C as any systematic (i.e. not only due to temporally limited variations) temperature increase is seen as potentially problematic concerning reliability issues. Despite this, some big companies explicitly declare higher temperature values (up to 29.4°C inlet temperature), proving that a proper thermal management of the data centre allows these solutions.
If the data centre or server room is cooled by energy driving cooling systems – which is the case for most of them – the energy consumption for cooling can be reduced by allowing a higher temperature. which again requires that the server and data storage product can withstand the higher temperatures. Increasing the range of operating temperature would typically result in energy savings at the cooling system level. First of all, if a mechanical cooling system (i.e. using compressors as in household refrigerators) is used, the cooling efficiency (COP – Coefficient of Performance) will increase as the temperature difference between the cold and the hot side of the system decreases. Furthermore, cold losses from the data centres reduce when temperature difference between outside and inside is reduced and if free cooling (e.g. using ambient air for cooling) is used, the amount would increase with an increase in allowable temperature. Furthermore, it allows the data centres to use a higher degree of free air cooling, i.e. using outside air for cooling instead of a mechanical cooling system. Finally, an increase of the date centre hot air temperature will increase the usefulness and the energy potential in the hot air, when used for other purposes such as water and space heating.
When setting potential requirements on operating conditions for servers and storages, it is important to assess whether this is being addressed by other initiatives already to avoid overlapping. One important initiative is the Commission’s publication “An EU Strategy on Heating and Cooling”
, but the possible effects it may specifically have on servers and data storage product, at product level, is limited. The publication mentions that the service building sector consumes a large amount of energy, and space cooling account for 25-60% of data centres’ operating costs. The overall recommendations that concern data centres are that:
·the Commission will look into making advanced tools for metering, control and automation based on real time information standard requirements for service sector buildings, and
·in general, the focus on lowering heating and cooling demand, deployment of district heating and new innovative approaches to low temperature heating (e.g. waste heat from data centres) in industry, which could complement a potential ecodesign requirement on servers and data storage products (being these products able to tolerate higher ambient temperature).
The organisation ASHRAE has established thermal guidelines for data centres and a possible operating temperature requirement can be based on thermal classes (A1, A2, A3 and A4) from these guidelines, see
Table 16
. Compliance with the requirements does not directly result in energy savings, but it allows the data centre operator to increase the set point temperature of the cold air, when all equipment in the data centre or in a specific zone of the data centre can withstand the higher temperatures. It also allows the operator to have a more flexible air handling due to the wider temperature and humidity ranges, which increases the opportunities for free air cooling.
Table 16 ASHRAE Classification of allowable temperature range and operating conditions
|
ASHRAE class
|
Dry bulb temp °C
|
Humidity range, non-condensing
|
Max dew point (°C)
|
Maximum rate of change (°C/hr)
|
|
A1
|
15- 32
|
–12°C DP and 8% RH to
17°C DP and 80% RH
|
17
|
5/20
|
|
A2
|
10-35
|
20% - 80% RH
|
21
|
5/20
|
|
A3
|
5-40
|
-12°C DP and 8% RH to 85% RH
|
24
|
5/20
|
|
A4
|
5-45
|
–12°C DP and 8% RH to 24°C DP and 90% RH
|
24
|
5/20
|
As seen in table above, the temperature range widens as the ASHRAE Class increases. However, it is important to note that an A2 capable or A3 capable server is not designed to operate continuously at 32 or 35 °C. The allowable temperature range is the range in which the server or storage product can be operated for a limited period of time while remaining reliable, however this limited period of time is not universally defined across the sector. Although the max temperature for A2 conditions and above seem too high for servers, the benchmarking results of maximum temperature in
Figure 3
show that a majority of them already declare that they can operate at A2 conditions, however without defining how long they could operate at this max temperature. Nearly 300 models of servers from 6 leading suppliers and nearly 200 models of disk storage from 7 leading suppliers show that a majority of servers and data storage products are capable to operate at A2 conditions.
However, this does not necessarily mean that data centres are already operating at A2 conditions, despite that they are willing to as some data centre installers have expressed. Even if a very small portion of the servers are not ready to operate at A2 conditions, the whole data centre would need to ensure the reliability of these servers and operate at ca. 21 °C (the standard operating temperature for data centres up until recently) continuously, instead of being able to utilise free cooling for a period of time before exceeding 35°C. However, it is possible to separate equipment with different operating requirements in different zones of data centres, so some equipment can be allowed higher surrounding temperatures, but this is not often done because 1) current data centre buildings are not designed in zones, 2) moving equipment is very difficult to coordinate when the space is rented out to many clients and 3) because of the risk of unexpected failure and limited time and resources to carry it out without incentives.
Figure 3 Benchmarking results of maximum temperature
4.4.2.2.Proposed requirements on servers and data storage products operating temperature
Against the background described in the previous section, a specific formulation for the Ecodesign requirements on operating temperature was studied. The Ecodesign requirement could consist of two reporting obligations:
·the first one is the idle power consumption at high operating temperature (only in the case of servers, for which a testing method is defined under SERT24, whereas similar methods for data storage products are currently not available),
·the second one is on the declared operating condition class, i.e. a temperature range in which the product (either a server or a data storage product) is expected to reliably perform its operations.
The Ecodesign requirement consisting in the compulsory presence of information on the product energy consumption and reliability at higher operating temperature is expected to foster the increase, when feasible, of the operating temperature of data centres and server rooms, without entailing risks on the system's reliability. The proposed approach would be to allow servers and data storage products to be placed on the EU market independently of their operating conditions class, but requiring information of the temperature range at which the product can work (leaving freedom to the manufacturer to choose such temperature range).
Moreover, the requirement would be at product level, whereas the environmental benefit would be realised at system level (data centre/server room). The proposed solution is judged to be the best trade-off between the aim of solving the identified market failures (in particular the one related to the lack of functional information) and a precautionary approach towards the specificities of servers and data storage products market.
Possible effects of the proposed information requirements on the operating temperature by servers and data storage products are shown in
Table 17
, together with the associated energy savings at infrastructure level in 2030. The associated Power Usage Effectiveness (PUE) factor is assumed based on the PUE factors given in the preparatory study. A1 level requirement is assumed to have no impact on PUE factor: as most servers and storage can already achieve A2 level in BAU, manufacturers would leave the products as they are and so data centres would continue to operate as in BAU scenario. The policy scenario 3.1 assumes no requirement on operating conditions, therefore the same PUE level as BAU are assumed. The policy scenario 3.2 assumes that 30% of the data centres and server rooms would adopt higher operating conditions, and therefore achieve the associated PUE factor, due to information requirement. The policy scenario 3.3 assumes a mandatory requirement to reach the levels in
Table 17
, therefore 100% adoption is considered. It is important to highlight that assuming 100% adoption (under option 3.3) is somehow overly optimistic, as it means assuming tout court that all (i.e. 100%) data centers would work at higher operating temperature, which is not realistic, as some specific users/applications will always require not to raise the operating temperature. Moreover, in legal terms making compulsory to place on the market only products capable to function at higher operating temperatures, does not automatically pose an obligation to use them in these temperature ranges in actual operations. The mandatory requirement applies only to the server/data storage devices manufacturers (who would be allowed to place on the market products capable to perform at a minimum operating temperature). The actual increase of the operating temperature in the data centers would be decided by the data center operators, who are expected to do so in presence of the relevant information at product level on its reliability and performance at higher operating temperature. Therefore, the actual realisation of the increase of the operating temperature lies in a behavioural change of data center operators, whose likelihood is more difficult to predict than ‘standard’ requirements based on a technical feature of the product and not relying in a change of the boundary conditions at system level (linked, in turn, to a behavioural change of a stakeholder). As shown more in detail in section 5 and in the sensitivity analysis of section 6.1.1, the difference between the environmental savings of option 3.2 and 3.3 lies in the adoption rate of data centers working at higher operating temperature. A very high adoption rate (100% hypothesis, with the limitations described above) is associated to the policy option 3.3, where the requirement on the higher operating temperature would be mandatory, whereas in the case of option 3.2 (compulsory information requirement) a much lower adoption rate (30%, see, Annex IV for the rationale) has been assumed. To conclude, on one side option 3.3 should be seen (from the specific point of view of the expected increase of the operating temperature) as an ‘extreme/overly optimistic’ scenario, as the actual adoption rate would be linked to a behavioural change of the data center operators, which is not easy to predict. On the other side, the adoption rate assumed under option 3.2 is judged as a plausible if not cautious value.
Table 17 Estimated operating temperature – and associated energy saving at infrastructure level
|
Policy scenario
|
2019
|
2023
|
2026
|
2030 Savings, TWh/year
|
|
Baseline
|
A1 (PUE = 1.75)
|
A1 (PUE = 1.68)
|
A1 (PUE = 1.56)
|
-
|
|
PO 3.1
|
A1 (PUE =1.75)
|
A1 (PUE = 1.68)
|
A1 (PUE = 1.56)
|
-
|
|
PO 3.2
|
A2 (PUE =1.45)
30% adoption
|
A3 (PUE = 1.30)
30% adoption
|
-
|
5.67
|
|
PO 3.3
|
A2 (PUE =1.45)
100% adoption
|
A3 (PUE = 1.30)
100% adoption
|
-
|
20.8
|
4.4.3.Requirement on the idle mode energy consumption
During use, servers spend a significant part of their operating life in 'idle state' (‘idle state’ means the operational state in which the operating system and other software have completed loading, the server is capable of completing workload transactions, but no active workload transactions are requested or pending by the system, i.e. the server is operational, but not performing any useful work). Full extensive reports or data on the utilization and load profile of servers are not available; based on existing reports8,, 99, it can be concluded that there are a large number of servers, in particular those ones operated in server rooms or small data centers, which are unused and others that are spending a considerable amount of time in idle mode waiting for transaction requests. A recent and complete analysis on the utilisation rate of servers in the EU has been finalised in the framework of a Horizon 2020 project, Eureca (www.dceureca.eu). Over 350 data centres of public administrations in the EU were investigated (ministries, universities, etc), the conclusion being that the average annual server utilisation rate (for the inspected data centres) is around 20%; in other terms, the rate of server time in idle mode is quite high, and this ‘pushes’ the average utilisation rate towards such a low value (20%). Comparable values in terms of the server utilisation rate can be found in other reports, related to sectors other than the public and to jurisdictions out of the EU.
For these reasons, the current analysis is, among other factors, on the consumption on idle power state.
Concerning servers, the most advanced example of requirements on the power consumption was given by the idle power requirements under the Energy Star Program, in the former version of the product specification for computer servers (see below). These quantitative requirements can vary, depending from one product to another one, and even from one product configuration to another one, as servers with certain characteristics or features (such as additional power supplies or additional memory) are given different – typically higher – thresholds. This is implemented by assigning a certain ‘allowance’, i.e. the product is allowed to use more energy when it has a certain performance or feature. More in detail, a minimum requirement for idle mode energy consumption is set in Energy Star specification version 2.0. However, the minimum requirement for idle mode energy consumption set out in the Energy Star specification version 2.0 is judged as too lenient when compared with typical idle mode consumptions of base case 1 and 2 socket servers. A draft of Energy Star specification version 3 for server has tightened the idle mode power requirement and the coverage of server types has been extended to blade and resilient servers as well as rack servers. The proposed requirement in this draft version would be considered for option 3.2, together with some modifications deriving from the dialogue with industrial stakeholders. The proposed idle power allowances and additional allowances are in
Table 58
and
Table 59
.
Industry experts have expressed that the idle mode consumption is not a good proxy for the overall energy efficiency of servers. Industrial stakeholders
have provided data showing that, in their view, improved idle power does not necessarily mean improved server efficiency. Idle consumption can be reduced greatly if the server is not executing tasks, however any work being done can spike the consumption. This means that servers spend very little time in the idle mode with very low consumption, according to industry. However, idle power is still a useful proxy for low load consumption at an individual product level, which is not virtualised or virtualised at a low load level. This is in particular relevant to SMEs purchasing less powerful equipment.
A requirement on the maximum energy consumption in idle mode was not proposed for policy options 3.1 and 3.3:
-in the case of policy option 3.1, as industry stakeholders oppose using the energy consumption in idle mode as a mean for decreasing the environmental impact of servers;
-in the case of policy option 3.3, as it has been assumed that a robust SERT-based minimum performance requirement could already take account of the idle consumption of servers (in the hypothesis that the supporting metric properly factors in the contribution from energy consumption in idle state), therefore an additional separate requirement on the maximum energy consumption in idle mode may be redundant.
4.4.4.Information or MEPS requirement on servers’ performance (e.g. SERT-based)
The Ecodesign Technical Assistance on Standards for Enterprise Servers and Data Storage99 carried out for DG GROW has developed efficiency metrics that could be used for possible ecodesign measures.
An information requirement could consist of mandatory information (e.g. on web pages and possibly also on servers’ name plates or product manuals and brochures) exhibiting a performance figure. An information requirement on SERT-based performance metrics will allow users to purchase servers better matched and more efficient for the required purpose, hence it will result in energy saving. This would remove one of the problem drivers (regarding lack of information). The proposed information requirements on server performance and efficiency would be calculated according to the equations in
Annex 6: Proposed metrics requirements
.
Minimum Efficiency Performance Standard (MEPS) based on the metrics developed from SERT results would set minimum limits for servers in order to remove the worst performing servers from the market. See table below for the proposed minimum server efficiency calculated according to the equations in
Annex 6: Proposed metrics requirements
.
Table 18 Proposed MEPS levels for server efficiency coming to effect in 2019 for scenario 3.3
|
Policy scenario
|
1 socket servers
|
2 socket servers
|
4 socket servers
|
|
|
Rack
|
Tower
|
Low performance
|
High performance
|
|
|
PO 3.3
|
20
|
40
|
30
|
50
|
45
|
4.4.5.Information requirements
Information requirements of a potential ecodesign regulation could mirror the information requirements from Energy Star or the current computer Regulation No 617/2013, i.e. information on PSU efficiencies, idle and max power consumption; at the same time, for some of the scenarios information requirements would be proposed for Operating conditions, and test result according to SERT. The difference of this requirement option of informing test result according to SERT from the above mentioned information requirement on servers’ performance is that this option can be adopted without using the metrics developed from the technical assistance study.
4.4.6.Material efficiency requirements
The European Commission adopted a Circular Economy Action Plan
, to stimulate Europe's transition towards a circular economy. To contribute to the targets proposed by the package, potential ecodesign requirements for servers and data storage products could include material efficiency elements.
In order to assess the impacts that material efficiency requirements would have on the reuse and recycling rate of servers and data storage products, of components and of critical raw materials (CRM) as well the cost implications, several different sources have been consulted. The main reference study is a JRC report on the analysis of material efficiency requirements of servers29, which presented the LCA of servers as well as recommendations for potential ecodesign requirement on material efficiency. In addition, LCA for storage products is presented in a report of the Product Environmental Footprint Category Rules (PEFCR); data from these two reports are used in this impact assessment to estimate the reduction due to potential material efficiency requirements.
The potential ecodesign requirements hereby proposed aim to solve the market failures highlighted in section '
Lack of functional information - resource related aspects
'. This is among the first experiences in Ecodesign on regulatory measures addressing circular economy aspects, and the interaction with stakeholders has been instrumental to their fine-tuning. The possible requirements are listed in the remainder of this section. The environmental impact reduction due to these requirements is estimated for all rack servers with 2 sockets and OL 2, 3 and 4 storage products within the EU, and presented in Section 5.1.4 .
a.Extraction of key-components
The JRC report indicated that reuse and recycling can have positive impacts on environment, additionally to savings of CO2 emissions and other GHG emission, reuse and recycling can reduce the number of other environmental impacts. The positive impacts of reusing servers can be reduced as a consequence of improving energy efficiency of new servers. The JRC report proved that the environmental impact of used servers with efficiency maximum 20% lower than the current efficiency of average servers can still be environmentally beneficial; below the 20% efficiency, the server would consume too much energy that would offset the other environmental benefits.
Industry stakeholders indicate that the recovery rate of servers and storage products is already very high for those that are collected back to the OEMs via asset recovery services or leasing programmes. Hence the proposed requirement could ensure the rest of the servers and storages is also sufficiently recovered via other channels. This requirement could be proposed based on the following formulation (or similar):
Manufacturers shall ensure that joining, fastening or sealing techniques do not prevent the disassembly of the following components, when present:
(a) HDD and SSD (b) Memory (c) Processor (CPUs) (d) Motherboard (e) Expansion cards/graphic cards (f) Power supply
The sequence of disassembly operations needed to access the targeted components shall be documented, including for each necessary operation, the type of joining, fastening or sealing techniques to be undone, and the tool(s) required.
Based on the evidence collected in support to this impact assessment report, it was not possible to identify specific components (among those listed above) for which ensuring compliance with the proposed requirement would entail trade-offs with functional aspects and/or product reliability.
The requirement on the extraction of key-components is expected to foster, in particular, the reparability and upgradability of servers and data storage products; nevertheless, the information on disassembly operations can be useful for other categories of stakeholders, such as the recyclers. The provision of disassembly information is already common practice for some manufacturers, therefore it is not expected that the practical implementation of this reporting obligation will entail excessively high costs.
b.Securing data deletion of reusable data storage devices
The absence of a guarantee that data contained in servers and data storage products will be completely deleted limits the number of these products and their components (in particular the data storage devices such as HDDs) being reused, due to the risk of misuse of confidential data previously stored in the products. Standards to ensure data deletion are crucial to facilitate more reuse. Data storage devices such as HDDs and memory cards cannot be reused without ensuring data deletion, so-called “data sanitisation”. Sanitisation is defined as the process of eliminating sensitive information from a document or other medium (i.e. digital media such as HDDs and SSDs). There are already existing standards on data sanitation available in USA (e.g. the 5220.22-M standard for clearing and sanitization developed by the US Department of Defence), Canada, Germany, the UK, New Zealand, Russia and Australia
as mentioned above and described in section 3.2.1.3 of JRC’s report. Currently, CENELEC is drafting a standard on preparation for reuse of electrical and electronic equipment.
This requirement could be proposed based on the following formulation (or similar):
A built-in secure data deletion built-in functionality shall be made available for the deletion of data contained in all the data storage devices of the product.
In operational terms, the requirement on a built-in functionality for secure data deletion could be implemented, at product level (i.e. server or data storage product):
- in the firmware, typically in the Basic Input/Output System (BIOS),
- in the software included in a self-contained bootable environment provided in a bootable CD, DVD or USB memory storage device included with the product,
- in software installable in the supported operating systems provided with the product.
Having used the concept of built-in 'secure data deletion built-in functionality' (see '
Annex 5: Definitions and glossary
' for the related definitions) leaves the manufacturer room of manoeuvre in how to comply with the requirement, rather than prescribing a specific technical solution. While enhancing the chances of improving reuse of data storage devices, this requirement is not expected to jeopardise data security in data centres (e.g. an attacker that has compromised already the entire system and has full admin or root access, could already directly access the HDDs and delete all the data; in the case of data deletion functionality at level of bootable CD/DVD/USB, physical access is required to make the system boot from removable media and the BIOS of enterprise servers supports access control so that only authorised personnel can boot the server from removable media. With or without the built-in secure data deletion functionality, any attacker with physical access to the enterprise server can already securely delete the data in the HDDs by using the existing tools (as long as there is no BIOS password or the attacker knows it).
c.Securing that firmware for product updates is available also to third parties
Firmware update availability is one of the major barriers for ICT products reuse according to the second-hand ICT organisation Free ICT Europe Foundation (FIE). A FIE study that without access to firmware updates developed by the OEMs, reuse operators cannot make components, servers or storage products to work as intended in their secondary lifetime, and therefore can only become e-waste. As firmware contains bug fixes that enables the customers to update firmware and make the equipment more reliable, and allow all parts of servers to function normally. Firmware update is sometimes not available to refurbishing companies due to intellectual property claimed by OEMs, which discourages reuse. Reuse centres would discard the option of reusing certain products if the firmware is not available, regardless of the reuse potential in the product. A potential requirement could be to prescribe that the firmware is made publicly available. Providing firmware should not be a burden for the manufacturers, or cause copyright and economic problems, as the firmware could be available to refurbishing companies for a fee covering the manufacturers cost of making it available. However if this fee is too high, refurbishing is no longer cost-effective any more.
This requirement could be proposed, based on the following formulation (or similar):
The latest version of the firmware valid for the server shall be made available for a minimum period of eight years after the placing on the market of the product, at a fair, transparent and non-discriminatory cost by manufacturers.
As said above, it is expected that the compliance with this requirement does not entail excessively complicated/burdensome technical solutions, as this is already common practice under the commercial agreements between OEM and customers.
d.Critical raw material information requirement, if one or more critical materials are present in the equipment.
The JRC report indicates that there is a significant amount of critical raw materials (CRM) found in the servers and storage products e.g. neodymium. Neodymium has ferromagnetic properties; this means that it would be lost in the ferrous fraction of WEEE if it is not separated in the early stages of the product disassembly. Technologies for the separation and recycling of neodymium are still at pilot scale because the difficulty to separate them from the product, the low amount of this material contained in products (such as HDD) in comparison to other materials as steel and aluminium, and the drop of price of rare earths discourages their recycling.
Once separated, neodymium scraps can be delivered to processes for the recovery of the metal. An information requirement could facilitate the recycling process by informing on the exact amount of CRM that the product contains and hereby encourage the separation at early stages of disassembly. Moreover this requirement complements the focus area of European Commission, highlights the importance of CRMs and makes use of the official list of CRMs
.
This requirement could be proposed, based on the following formulation (or similar):
The following product information on servers and data storage products shall be made available free of charge by manufacturers: weight range per product (less than 5g, between 5g and 50g, above 50g), at component level, of the following critical raw materials, if any:
(a) Cobalt in the batteries, expressed in grams rounded to the nearest integer, in case of weight ranges between 5g and 25g or above 25g, or in grams to one decimal place in case of weight range less than 5g;
(b) Neodymium in the HDDs, expressed in grams rounded to the nearest integer, in case of weight ranges between 5g and 25g or above 25g, or in grams to one decimal place in case of weight range less than 5g.
In operational terms, this requirement could be implemented e.g. via an electronic database with the prescribed information in the bill of material of the product (i.e. on the content of Cobalt and Neodymium), only at component level in case of the two components under analysis (batteries and HDDs). Also considering that the indication on the weight range (and not the exact weight) is required, it is expected that the compliance with this requirement does not entail excessively complicated/burdensome technical solutions. As a matter of fact, servers and data storage products are already in scope e.g. to the RoHS Directive171, and the use of these IT solutions (electronic databases) for compliance with this Directive is already common practice among manufacturers.
4.4.6.1.How enforceable are the requirements on material efficiency?
As already highlighted in section 4.4.6, the development of material efficiency requirements for servers and data storage products is among the first experiences in Ecodesign regulatory measures addressing circular economy aspects. The proposed requirements are judged as feasible and enforceable, even if they could require a bit more of effort by market surveillance authorities, in particular in the first experiences with these products, as they are up until now more acquainted to check compliance against energy efficiency requirements.
Moreover, at the time of the Consultation Forum a draft 'list of supporting standards for testing and calculation' has been circulated, together with the draft Ecodesign requirements, with the aim to help market surveillance authorities and manufacturers with information on how to test and calculate the relevant parameters for servers and data storage products. Finally, the deliverables under the horizontal standardisation mandate on material efficiency (M543) could be useful in the assessment of the compliance of material efficiency requirements.
More in detail:
(a)Requirement on extraction of key-components: the assessment of the compliance with this requirement will be based on an analysis of the joining, fastening or sealing techniques at product level, and on the presence of documentation on the sequence of disassembling operations. It is useful to remark that the formulation of this requirement for joining techniques is virtually identical to analogous draft requirements on other electronic products under review (e.g. electronic displays, computers) at the time of writing the present impact assessment report, and this could further help market surveillance authorities in the understanding of the requirement itself.
(b)Requirement on the secure data deletion functionality: the assessment of the compliance with this requirement will be based on the check of the presence of this functionality in the product
(c)Requirement on availability of latest version of firmware: the assessment of the compliance with this requirement will be based on the check of the availability of the latest version of firmware. It has to be noted that the Ecodesign Directive allows market surveillance authorities to make inspection on product at the time of their placing on the market, whereas the usefulness of this requirements is to foster maintenance/refurbishment, i.e., quite likely some years after the placing on the market of the product.
(d)Requirement on the critical raw material information: the assessment of the compliance with this requirement will be based on a check of the information reported by the manufacturer.
4.5.Option 5: Complementary regulatory approaches – compulsory Energy Star
In the EU, the Energy Star programme is currently compulsory only in the case of certain public procurement, as public procurers have to purchase equipment with Energy Star label or equivalent (within some limits defined by the Energy Star regulation and the Energy Efficiency Directive). This option explores the possibility of making Energy Star requirements compulsory for all servers and data storage product, so private and public procurers would have to purchase Energy Star compliant equipment to ensure energy efficiency.
In this option, there will be information requirements on operating conditions according ASHRAE, idle power consumption, test results according to SERT method, and minimum requirements on PSU and idle power consumption according to the current Energy Star server specification 2.1 or the coming specification 3.0 currently under development.
It is appropriate to issue certain caveats here. Making Energy Star requirements compulsory for all servers and data storage products, so private and public procurers would have to purchase Energy Star compliant equipment to ensure energy efficiency, can be seen as an interesting option, however it would be actually quite complicated in legal/procedural terms, making in the end easier to adopt an Ecodesign Regulation (Ecodesign measures are 'secondary legislation' depending on the 'framework' Ecodesign Directive, whereas the legal base/reference directive for option 5 should be created almost from scratch). Moreover, and most importantly, the legal basis for the EU Energy Star program, i.e. the 'Agreement between the Government of the United States of America and the European Union on the coordination of energy-efficiency labelling programs for office equipment' (OJ L 63, 6.3.2013, p. 1) remains in force until February 20th 2018. Based on the currently available information at the time of the writing of this part of the report (early February 2018), it is assumed that Agreement will naturally expire, without being renewed or prolonged.
4.6.Summary of policy scenarios
The scenarios assessed in this impact assessment relate to options considered in this chapter and are presented in table below. The main results are presented here, while for background and detail explanation of the modelling and calculation behind the results, please see
Annex 4: Inputs, assumptions
.
Table 19 Summary of policy scenarios
|
Scenarios
|
Requirement
|
Servers
|
Storage
|
Notes-explanations
|
|
Option 1: BAU
|
-
|
|
No action, this option serves as reference for other policy scenarios.
|
|
Option 3.1: Ecodesign requirements based proposal from industry
(4 socket and resilient servers and storage are excluded from the scope)
|
Information
|
Same as computer regulation 617/213: idle, max mode power and PSU efficiency
|
-
|
|
|
|
Operating condition
|
-
|
-
|
|
|
|
PSU min. efficiency
|
80Plus Gold by 2019 and Platinum by 2023
|
-
|
|
|
|
Max idle power
|
-
|
-
|
|
|
|
SERT metrics
|
Information
|
-
|
|
|
|
Material efficiency
|
-
|
-
|
|
|
Option 3.2: Ecodesign requirements based on consultation with industry and experts
|
Information
|
Idle and max mode power and PSU efficiency
|
PSU efficiency
|
Option 3.2 is more challenging than 3.1 as there are higher PSU efficiency requirements, material efficiency requirements maximum idle power requirements and information requirements on operating conditions
|
|
|
Operating condition
|
Declare operating condition class
|
Declare operating condition class
.
|
|
|
|
PSU min. efficiency
|
80Plus Gold by 2019, Platinum by 2023 and Titanium by 2026.
|
Gold by 2019, Platinum by 2023 and Titanium by 2026.
|
|
|
|
Max idle power
|
Energy Star draft version 3 level.
|
-
|
|
|
|
SERT metrics
|
Information
|
-
|
|
|
|
Material efficiency
|
See Section 4.4.6
|
See Section 4.4.6
|
|
|
Option 3.3: Most ambitious Ecodesign requirements
|
Information
|
Idle and max mode power and PSU efficiency
|
-
|
Option 3.3 is more challenging than 3.2 as the timeline of the PSU efficiency requirements is tighter, and there are quantitative requirements on servers efficiency and and operating conditions
|
|
|
Operating condition
|
Mandatory operating condition class: A2 by 2019, A3 by 2023.
|
Mandatory operating condition class: A2 by 2019, A3 by 2023.
|
|
|
|
PSU min. efficiency
|
80Plus Platinum by 2019 and Titanium by 2026.
|
Gold by 2019, Platinum by 2023 and Titanium by 2026.
|
|
|
|
Max idle power
|
-
|
-
|
|
|
|
SERT metrics
|
Information and MEPS
|
-
|
|
|
|
Material efficiency
|
See Section 4.4.6
|
See Section 4.4.6
|
|
|
Option 5: Complementary approach – compulsory Energy Star
|
Information
|
Idle and max mode power and PSU efficiency
|
PSU efficiency
|
This option is more lenient than 3.2 and 3.2, as there are no material efficiency requirements, nor requirements on the operating conditions
|
|
|
ASHRAE condition
|
Reporting requirement
|
-
|
|
|
|
PSU min. efficiency
|
80Plus Gold by 2019.
|
Silver by 2019.
|
|
|
|
Max idle power
|
Energy Star draft version 3 level.
|
-
|
|
|
|
SERT metrics
|
-
|
-
|
|
|
|
Material efficiency
|
-
|
-
|
|
5.Analysis of impacts
This chapter describes for each option the associated environmental, economic and social impacts on manufacturers, including SMEs, consumers and the general environment.
The assessment considers the following aspects:
1.Environmental impacts:
a.energy saving and security of supply,
b.greenhouse gas emission reduction,
c.reduction of other environmental impacts,
2.Economic impacts:
a.business economics and competitiveness,
b.employment,
c.user expenditure
3.Other impacts:
a.administrative burden
b.health, safety and other environmental aspects
5.1.Environmental impacts
5.1.1.Energy impacts of servers
The figure and table below give the results for the various policy scenarios. Note that in the graph also the BAU values are given for comparison. BAU is the trend expected without any measures on servers, while the computer regulation 617/2013 is maintained as it is.
The impact of information requirement have on users’ purchase behaviour have been investigated, and it is found that with information available, 19% are assumed to purchase more efficient servers or better suited to the purpose and therefore consume less unnecessary power. More about the impact of information requirement and detailed explanation of calculations can be found in Annex 4: Inputs and assumptions.
Figure 4 Server electricity consumption excluding infrastructure 2015-2030 for policy scenarios.
Table 20 Server electricity consumption excluding infrastructure (TWh electric) 2015-2030 for policy scenarios
|
Policy scenarios
|
Total excl. infrastructure, TWh/year
|
Saving vs. BAU, TWh/year
|
Cumulative saving, TWh
|
|
|
2015
|
2020
|
2025
|
2030
|
2015
|
2020
|
2025
|
2030
|
2015
|
2020
|
2025
|
2030
|
|
1
|
37.9
|
35.7
|
40.7
|
47.9
|
-
|
0.00
|
0.00
|
0.00
|
-
|
0.0
|
0.0
|
0.0
|
|
3.1
|
37.9
|
33.7
|
38.9
|
46.1
|
-
|
1.97
|
1.76
|
1.76
|
-
|
3.9
|
13.7
|
22.2
|
|
3.2
|
37.9
|
33.0
|
38.1
|
45.5
|
-
|
2.67
|
2.57
|
2.38
|
-
|
5.4
|
18.9
|
30.7
|
|
3.3
|
37.9
|
32.5
|
38.0
|
45.5
|
-
|
3.15
|
2.66
|
2.40
|
-
|
6.2
|
21.0
|
33.0
|
|
5
|
37.9
|
34.3
|
39.3
|
46.0
|
-
|
1.31
|
1.40
|
1.82
|
-
|
2.4
|
9.5
|
17.8
|
The figure and the table above show the total energy consumption, annual and cumulative energy savings for the policy scenarios without infrastructure, i.e. the energy needed for space cooling is not included here. Scenario 3.3 has the highest saving, but the difference with scenario 3.2 reduces over the years up to 2030.
The figure and the table below show the results including energy needed for the infrastructure, i.e. including cooling demand for servers. For policy scenario 3.1, there is no requirement for operating conditions; therefore the saving at infrastructure level is transferred from the reduction in energy consumption of servers' equipment. The model assumes for policy scenario 3.2 that 30% of the data centres and server rooms will operate at higher temperature and achieve the PUE factor associated with each ASHRAE temperature range shown in
Table 17
, hence yielding additional savings. The scenario 3.3 has the highest savings ( ~15 TWh including infrastructure) due to the assumptions on the adoption rate of higher operating temperatures (though, as discussed in section 4.4.2.2, this should be seen as a ‘extreme/overly optimistic’ scenario, as the actual adoption rate would be linked to a behavioural change of the data center operators, which is not easy to predict). A sensitivity analysis on the adoption rate is presented in Annex 7.
Figure 5 Server electricity consumption including infrastructure (TWh electric) 2015-2030 for policy scenarios.
Table 21 Server electricity consumption including infrastructure (TWh electric) 2015-2030 for policy scenarios
|
Policy scenarios
|
Total incl. infrastructure, TWh/year
|
Saving vs. BAU, TWh/year
|
Cumulative saving, TWh
|
|
|
2015
|
2020
|
2025
|
2030
|
2015
|
2020
|
2025
|
2030
|
2015
|
2020
|
2025
|
2030
|
|
1
|
68.9
|
61.7
|
66.9
|
74.5
|
-
|
0.00
|
0.00
|
0.00
|
-
|
0.0
|
0.0
|
0.0
|
|
3.1
|
68.9
|
58.2
|
64.0
|
71.7
|
-
|
3.41
|
2.90
|
2.73
|
-
|
6.7
|
23.3
|
36.8
|
|
3.2
|
68.9
|
56.3
|
60.0
|
68.4
|
-
|
5.31
|
6.86
|
6.09
|
-
|
10.3
|
42.3
|
76.6
|
|
3.3
|
68.9
|
53.9
|
53.7
|
59.1
|
-
|
7.71
|
13.12
|
15.35
|
-
|
14.1
|
69.9
|
146.0
|
|
5
|
68.9
|
57.3
|
62.5
|
69.6
|
-
|
4.34
|
4.34
|
4.86
|
-
|
8.4
|
30.5
|
53.8
|
5.1.1.Energy impacts of data storage products
The figure and the table below show data storage products’ total energy consumption, annual and cumulative energy savings for the policy scenarios without infrastructure i.e. the energy needed for space cooling is not included here.
Note that in the graph the BAU values are also given for comparison. There are no savings for scenario 3.1 as no new requirements for data storage products are foreseen in the policy scenario, so the scenario 3.1 yields exactly the same results as scenario 1, BAU. Options 3.2 and 3.3 have the same savings, because the difference between the two scenarios lies at the infrastructure level (i.e., information vs. mandatory operating conditions requirement)
Figure 6 Data storage products electricity consumption excluding infrastructure 2015-2030 for policy scenarios.
Table 22 Data storage products' electricity consumption excluding infrastructure (TWh electric) 2015-2030 for policy scenarios
|
Policy scenarios
|
Total excl. infrastructure, TWh/year
|
Saving vs. BAU, TWh/year
|
Cumulative saving, TWh
|
|
|
2015
|
2020
|
2025
|
2030
|
2015
|
2020
|
2025
|
2030
|
2015
|
2020
|
2025
|
2030
|
|
1
|
14.7
|
19.7
|
25.0
|
29.9
|
-
|
0.00
|
0.00
|
0.00
|
-
|
0.0
|
0.0
|
0.0
|
|
3.1
|
14.7
|
19.7
|
25.0
|
29.9
|
-
|
0.00
|
0.00
|
0.00
|
-
|
0.0
|
0.0
|
0.0
|
|
3.2
|
14.7
|
19.3
|
24.4
|
29.1
|
-
|
0.45
|
0.60
|
0.81
|
-
|
1.2
|
3.9
|
7.4
|
|
3.3
|
14.7
|
19.3
|
24.4
|
29.1
|
-
|
0.45
|
0.60
|
0.81
|
-
|
1.2
|
3.9
|
7.4
|
|
5
|
14.7
|
19.4
|
24.4
|
29.4
|
-
|
0.36
|
0.58
|
0.48
|
-
|
0.9
|
3.3
|
5.9
|
Figure and table below show the result including energy needed for infrastructure. Scenario 3.3 yields the highest savings due to mandatory requirements on the operating temperature (with all the limitations of this approach, highlighted in section 4.4.2.2 as well as in the previous one), with a cumulative saving of approx. 70 TWh by 2030 and annual saving of 8.7 TWh in 2030. The model assumes for policy scenario 3.2 that 30% of the data centres and server rooms will operate at higher temperature and achieve the PUE factor associated with each ASHRAE temperature shown in
Table 17
. A sensitivity analysis on the adoption rate (of higher operating temperatures) is presented in Annex 7.
Figure 7 Data storage product electricity consumption including infrastructure 2015-2030 for policy scenarios.
Table 23 Storage electricity consumption including infrastructure (TWh electric) 2015-2030 for policy scenarios
|
Policy scenarios
|
Total incl. infrastructure, TWh/year
|
Saving vs. BAU, TWh/year
|
Cumulative saving, TWh
|
|
|
2015
|
2020
|
2025
|
2030
|
2015
|
2020
|
2025
|
2030
|
2015
|
2020
|
2025
|
2030
|
|
1
|
26.6
|
34.1
|
41.0
|
46.5
|
-
|
0.00
|
0.00
|
0.00
|
-
|
0.0
|
0.0
|
0.0
|
|
3.1
|
26.6
|
34.1
|
41.0
|
46.5
|
-
|
0.00
|
0.00
|
0.00
|
-
|
0.0
|
0.0
|
0.0
|
|
3.2
|
26.6
|
32.9
|
38.4
|
43.7
|
-
|
1.18
|
2.67
|
2.78
|
-
|
2.6
|
13.1
|
28.5
|
|
3.3
|
26.6
|
32.0
|
34.4
|
37.8
|
-
|
2.12
|
6.59
|
8.69
|
-
|
4.0
|
28.2
|
70.1
|
|
5
|
26.6
|
33.5
|
40.1
|
45.7
|
-
|
0.62
|
0.95
|
0.74
|
-
|
1.5
|
5.6
|
9.7
|
5.1.2.Energy impact of servers and storage products
Together with servers and storage product, scenario 3.3 yields approx. 12 TWh in 2030 and scenario 3.2 yields approx. 9 TWh in 2030 including infrastructure.
Table 24 Servers and storage electricity consumption including infrastructure (TWh electric) 2015-2030 for policy scenarios
|
Policy scenarios
|
Total incl. infrastructure, TWh/year
|
Saving vs. BAU, TWh/year
|
Cumulative saving, TWh
|
|
|
2015
|
2020
|
2025
|
2030
|
2015
|
2020
|
2025
|
2030
|
2015
|
2020
|
2025
|
2030
|
|
1
|
95.5
|
95.8
|
107.9
|
121.0
|
-
|
-
|
-
|
-
|
-
|
-
|
-
|
-
|
|
3.1
|
95.5
|
92.4
|
105.0
|
118.2
|
-
|
3.4
|
2.9
|
2.7
|
-
|
6.7
|
23.3
|
36.8
|
|
3.2
|
95.5
|
89.3
|
98.4
|
112.1
|
-
|
6.5
|
9.5
|
8.9
|
-
|
13.0
|
55.4
|
105.1
|
|
3.3
|
95.5
|
85.9
|
88.2
|
96.9
|
-
|
9.8
|
19.7
|
24.0
|
-
|
18.1
|
98.1
|
216.1
|
|
5
|
95.5
|
94.0
|
104.4
|
115.2
|
-
|
5.0
|
5.3
|
5.6
|
-
|
10.0
|
36.2
|
63.5
|
5.1.3.Greenhouse gas emission reduction of servers
The main environmental emission impact is greenhouse gas (GHG) emissions from electricity consumption during the use phase. The expected reductions in GHG emissions for the various policy scenarios are given in Annex 7.1.
Greenhouse gas emission reduction
5.1.4.Reduction of other environmental impacts due to material efficiency requirements
For policy scenarios 3.2 and 3.3, there are proposed material efficiency requirements as described in Section 4.4.6. It is assumed that these requirements will assist and encourage the reuse and recycling of the whole EU to reach the level of Member States with well-stablished WEEE recovery facility and practice. Detailed assumptions are presented in
Annex 4: Inputs, assumptions
.
The additional environmental impacts saving from 2 socket rack servers alone and storage OL 2, OL3 and OL 4 products have been estimated and presented in the tables below. The calculation was made based on the data from a JRC report29 and consultation with industry and experts. The additional impact savings are estimated based on the difference of environmental impacts of average products reused and recycled at the current rate versus the environmental impacts of average products with increased reuse and recycling rate due to the implementation of the proposed material efficiency. It is assumed that the reuse of 2 socket rack servers will increase by 7% from the baseline of 60% and recycling by 3% from the baseline of 25%. It is then assumed that the reuse of OL 2, 3 and 4 products will increase by 10% from a baseline of 27 %, while recycling rate will remain at a similar level due to existing high recycling rate at 58%.
As seen in the tables below, additional impact savings in the policy scenario for Global Warning Potential (GWP) are high for servers due to the high sales figures, however for ozone depletion, acidification, freshwater eutrophication and mineral, fossil & renewable resource depletion, the saving is high from storage products due to higher increases in reuse rates as the reuse rate for storage products is lower than servers currently. Due to the lack of primary energy demand data for storage products, the impact of primary energy demand was only presented for 2 socket rack servers.
Table 25 Estimated EU reduction of environmental impacts due to material efficiency requirements on 2 socket rack servers
|
2 socket rack servers
|
|
Environmental impact savings
|
|
Impact category
|
Unit
|
2020
|
2025
|
2030
|
|
GWP
|
[kg CO2-eq/year]
|
75,443,143
|
91,788,119
|
111,674,281
|
|
Ozone depletion
|
[kg CFC-11eq/year]
|
0.78
|
0.95
|
1.16
|
|
Acidification
|
[kg SO2- eq./year]
|
597,062
|
726,417
|
883,797
|
|
Freshwater eutrophication
|
[kg Peq/year]
|
3,287
|
4,000
|
4,866
|
|
Mineral, fossil & renewable resource depletion
|
[kg Sb-eq/year]
|
17
|
21
|
25
|
|
Prim. energy demand (fossil)
|
[TJ/year]
|
1,016
|
1,237
|
1,504
|
Table 26 Estimated EU reduction of environmental impacts due to material efficiency requirements on storage products OL 2, OL 3 and OL 4
|
Storage OL 2, OL3 and OL4
|
|
Environmental impact savings
|
|
Impact category
|
Unit
|
2020
|
2025
|
2030
|
|
GWP
|
[kg CO2-eq/year]
|
19,548,569
|
61,635,050
|
106,913,895
|
|
Ozone depletion
|
[kg CFC-11eq/year]
|
14
|
45
|
78
|
|
Acidification
|
[kg SO2- eq./year]
|
3,002,153
|
9,465,544
|
16,419,200
|
|
Freshwater eutrophication
|
[kg Peq/year]
|
5,530
|
17,437
|
30,247
|
|
Mineral, fossil & renewable resource depletion
|
[kg Sb-eq/year]
|
10,435
|
32,901
|
57,071
|
Note that this assessment of material efficiency aspects is different from the assessment of energy efficiency aspects in use phase discussed in previous sections, however it can give an indication of the size of the savings. In terms of GWP impact savings from EU 2 socket rack servers alone would reduce an additional 5% for scenario 3.2 (2.1 Mt CO2-eq/year) and an additional 2% for scenario 3.3 (5.2 Mt CO2-eq/year) in 2030. In terms of primary energy savings, EU 2 socket rack servers would reduce an additional 3% from scenario 3.2 and 1% from scenario 3.3.
Based on the estimated environmental savings from material efficiency requirements, it can be concluded that these requirements could provide a contribution to the revised EU target proposal of increasing recycling rate of waste by 2030, and to provide concrete measure to promote re-use as part of the proposed action in Circular Economy Action Plan.
5.2.Economic impacts
5.2.1.Business revenue of servers
The increase in energy efficiency, which is realised by substitution of non-compliant models, results in an increase of the product purchase price. The figure and table below shows the increase in industry revenues for the scenarios that varies between 22 and 257 million euros in 2030. However due to the different tiers of requirement and the diminishing cost of improving energy efficiency as seen from other product groups covered by ecodesign measures, the increase in price is more significant at the time of introducing the requirements i.e. 2019 -2025, especially for scenario 3.3, where the increase in product cost is large due to minimum requirement on metrics and operating condition class. The business revenue increase only reflects the increase in product price due to the improvements made for complying with proposed requirements and the testing cost per product (some part of the testing costs are one-off investments in equipment and therefore not passed on to product price. A breakdown of testing cost is estimated in section 5.3.2). See details of calculation in
Annex 4: Inputs, assumptions
.
Table 27 Server industry revenue and increase vs. BAU (million euros) 2015-2030 for policy scenarios
|
Policy scenarios
|
Total, million €/year
|
Increase vs. BAU, million €/year
|
Cumulative increase, million €
|
|
|
2015
|
2020
|
2025
|
2030
|
2015
|
2020
|
2025
|
2030
|
2015
|
2020
|
2025
|
2030
|
|
1
|
22,537
|
27,068
|
32,596
|
39,333
|
-
|
-
|
-
|
-
|
-
|
-
|
-
|
-
|
|
3.1
|
22,537
|
27,083
|
32,643
|
39,355
|
-
|
15
|
48
|
22
|
-
|
39
|
209
|
375
|
|
3.2
|
22,537
|
27,167
|
32,939
|
39,382
|
-
|
100
|
343
|
49
|
-
|
205
|
1,453
|
2,252
|
|
3.3
|
22,537
|
31,071
|
33,742
|
39,604
|
-
|
4,003
|
1,146
|
271
|
-
|
8,496
|
21,548
|
22,984
|
|
5
|
22,537
|
27,167
|
32,714
|
39,382
|
-
|
100
|
118
|
49
|
-
|
205
|
758
|
958
|
The SMEs who sell and customise servers according to specific needs of clients are also included in the business revenues for OEMs. In some cases, ODMs sell directly to data centre owners or large companies, but in the results presented, it is assumed that ODM produces, designs and manufactures products which are specified and branded by the OEMs, so ODM’s revenue is derived as a share of OEM’s.
There is no revenue share for retailers, as servers are mainly B2B products. There are cost for installation and maintenance, but they are not considered to be affected by the proposed measures.
5.2.2.Business revenue of data storage products
The business revenue increase is lower for data storage products, as there is no proposed metrics requirement, and the improvement cost associated with achieving higher PSU and ASHRAE condition is relatively low.
Table 28 Data storage product industry revenue and increase vs. BAU (million euros) 2015-2030 for policy scenarios
|
Policy scenarios
|
Total, million €/year
|
Increase vs. BAU, million €/year
|
Cumulative increase, million €
|
|
|
2015
|
2020
|
2025
|
2030
|
2015
|
2020
|
2025
|
2030
|
2015
|
2020
|
2025
|
2030
|
|
1
|
32,015
|
35,001
|
38,644
|
42,666
|
-
|
-
|
-
|
-
|
-
|
-
|
-
|
-
|
|
3.1
|
32,015
|
35,001
|
38,644
|
42,666
|
-
|
-
|
-
|
-
|
-
|
-
|
-
|
-
|
|
3.2
|
32,015
|
35,004
|
38,678
|
42,702
|
-
|
3.1
|
34.1
|
35.9
|
-
|
7.9
|
119.8
|
290.0
|
|
3.3
|
32,015
|
35,004
|
38,683
|
42,715
|
-
|
3.1
|
39.1
|
49.8
|
-
|
7.9
|
132.8
|
389.2
|
|
5
|
32,015
|
35,002
|
38,646
|
42,668
|
-
|
1.2
|
2.0
|
2.7
|
-
|
3.6
|
12.1
|
24.3
|
5.2.3.Employment of servers industry
Direct employment effects are calculated from business revenues with a ratio of 0.254 million euro/employee in server industry for both OEM and ODM. Again, there is no employment effect calculated for retailers, installation and maintenance industry.
Table 29 Server industry jobs and increase vs. BAU 2015-2030 for policy scenarios
|
Policy scenarios
|
Total, jobs/year
|
Increase vs. BAU, jobs/year
|
|
|
2015
|
2020
|
2025
|
2030
|
2015
|
2020
|
2025
|
2030
|
|
1
|
110,337
|
132,519
|
159,583
|
192,569
|
-
|
-
|
-
|
-
|
|
3.1
|
110,337
|
132,593
|
159,817
|
192,678
|
-
|
66
|
208
|
97
|
|
3.2
|
110,337
|
133,006
|
161,264
|
192,807
|
-
|
434
|
1,497
|
212
|
|
3.3
|
110,337
|
152,118
|
165,196
|
193,894
|
-
|
17,462
|
5,000
|
1,180
|
|
5
|
110,337
|
133,006
|
160,162
|
192,807
|
-
|
434
|
516
|
212
|
5.2.4.Employment of data storage products industry
Since jobs created is directly related to the increase in revenue, the figure related to jobs created in the data storage products industry is also lower than servers due to there is no cost of complying with metrics requirement.
Table 30 Data storage product industry jobs and increase vs. BAU 2015-2030 for policy scenarios
|
Policy scenarios
|
Total, jobs/year
|
Increase vs. BAU, jobs/year
|
|
|
2015
|
2020
|
2025
|
2030
|
2015
|
2020
|
2025
|
2030
|
|
1
|
156,741
|
171,358
|
189,193
|
208,884
|
-
|
-
|
-
|
-
|
|
3.1
|
156,741
|
171,358
|
189,193
|
208,884
|
-
|
-
|
-
|
-
|
|
3.2
|
156,741
|
171,373
|
189,360
|
209,060
|
-
|
15
|
167
|
176
|
|
3.3
|
156,741
|
171,373
|
189,385
|
209,128
|
-
|
15
|
192
|
244
|
|
5
|
156,741
|
171,364
|
189,203
|
208,898
|
-
|
6
|
10
|
13
|
5.2.5.User expenditure for servers
The expenditure of the user is dominated by the energy costs of operating servers and storage, an even heavier share when infrastructure is included. Usually the users of servers and data storage products are private companies, SMEs or data centres.
The figure and table below show the expenditure which includes the running costs and acquisition costs, for BAU and scenarios. The 2030 savings are 614, 1374, 3367 and 1129 million euros for the scenario 3.1, 3.2, 3.3 and 5 respectively. The graph shows clearly that for scenario 3.3, there are negative savings for consumer in the first few years of proposed requirements coming into force, however as the cost of compliance diminishes i.e. the product prices reduces and the energy savings increases, the net expenditure savings increase as well.
Figure 8 Server user net cost savings (million euros/year) 2015-2030 for policy scenarios.
In 3.1 and 3.2 scenarios, the user net expenditure savings are immediately positive from 2019. The average PSU efficiency have a step-up improvement of almost 4% from 2018 to 2019, this is because all inefficient PSUs would be removed from the market by means of minimum threshold requirements. On top of this step up, the improvement of PUE factor is slightly quicker than BAU, and the cost for improving PSUs (removing inefficient PSUs) and improving servers operating temperature is not significant, so the energy cost saving from the first year already surpasses the improvement costs. Not shown clearly in the figure is that the net cost saving for 3.1 and 3.2 and 3.3 are negative before 2019, it is assumed that manufacturers change their products in order to meet requirements on time.
The significant cost in scenario 3.3 comes from the improvement cost to meet the MEPS on server efficiency (metrics); as it is compulsory, manufacturers would be obliged to change their products before requirements come into effect. Moreover, as the operating condition requirement is mandatory, the improvement cost for 100% adoption is also higher than other scenarios (as the calculation is not at product specific level, but it refers to the whole EU market). In 3.1, there is only testing cost to provide information on server efficiency, but there are still savings as efficiency is being driven by the industry itself, so there is no improvement cost associated. In 3.2, there are testing costs and a minor improvement cost to meet minimum idle requirement; server efficiency also increases in this scenario but again it is driven by the industry itself due to more information available.
Table 31
also shows that, until 2025, option 3.2 (and not 3.3) is the one which would potentially bring, overall, the largest benefits in terms of cumulative cost savings.
Table 31 Server user expenditure and saving vs. BAU (million euros) 2015-2030 for policy scenarios
|
Policy scenarios
|
Total, million €/year
|
Saving vs. BAU, million €/year
|
Cumulative saving, million €
|
|
|
2015
|
2020
|
2025
|
2030
|
2015
|
2020
|
2025
|
2030
|
2015
|
2020
|
2025
|
2030
|
|
1
|
22,027
|
25,472
|
31,773
|
40,209
|
-
|
-
|
-
|
-
|
-
|
-
|
-
|
-
|
|
3.1
|
22,027
|
24,952
|
31,255
|
39,596
|
-
|
520
|
518
|
614
|
-
|
1,002
|
3,773
|
6,545
|
|
3.2
|
22,027
|
24,708
|
30,683
|
38,843
|
-
|
764
|
1,090
|
1,367
|
-
|
1,451
|
6,321
|
13,100
|
|
3.3
|
22,027
|
26,632
|
29,976
|
36,850
|
-
|
-1,160
|
1,797
|
3,360
|
-
|
-2,847
|
-714
|
14,612
|
|
5
|
22,027
|
24,858
|
31,024
|
39,124
|
-
|
613
|
749
|
1,085
|
-
|
1,158
|
4,691
|
9,529
|
5.2.6.User expenditure for data storage products
The cost of compliance is lower for data storage products, as there is no proposed metrics requirement. From
Figure 9
, it can be seen that the net expenditure savings for scenario 3.3 are clearly higher than the ones of the other options. Differently from the servers, the net expenditure savings under option 3.3 are always positive, as no significant improvement costs are assumed for the data storage products, in order to have compliance with the requirements under option 3.3 (whereas in the case of servers the significant improvement costs in scenario 3.3 are related to the MEPS on server efficiency, as discussed in the previous section).
Figure 9 Data storage products' user net cost savings (million euros/year) 2015-2030 for policy scenarios.
Table 32 Data storage products' user expenditure and saving vs. BAU (million euros) 2015-2030 for policy scenarios
|
Policy scenarios
|
Total, million €/year
|
Saving vs. BAU, million €/year
|
Cumulative saving, million €
|
|
|
2015
|
2020
|
2025
|
2030
|
2015
|
2020
|
2025
|
2030
|
2015
|
2020
|
2025
|
2030
|
|
1
|
22,223
|
25,873
|
30,464
|
35,755
|
-
|
-
|
-
|
-
|
-
|
-
|
-
|
-
|
|
3.1
|
22,223
|
25,873
|
30,464
|
35,755
|
-
|
-
|
-
|
-
|
-
|
-
|
-
|
-
|
|
3.2
|
22,223
|
25,692
|
29,981
|
35,139
|
-
|
181
|
482
|
616
|
-
|
387
|
2,164
|
5,344
|
|
3.3
|
22,223
|
25,546
|
29,245
|
33,793
|
-
|
327
|
1,219
|
1,962
|
-
|
599
|
4,806
|
13,594
|
|
5
|
22,223
|
25,778
|
30,287
|
35,586
|
-
|
95
|
177
|
169
|
-
|
227
|
942
|
1,786
|
5.2.7.Single user expenditure for 2 sockets rack server
The table below shows the user expenditure for a single 2 sockets rack server purchased in 2030, for each policy scenario, purchase cost, annual energy cost saving and net expenditure over a lifetime of 5 years are listed. For policy scenarios 3.2 and 3.3, it is assumed that there are extra improvement costs (although diminishing over time) related to the more stringent requirements compared to scenario 3.1 and 5, however they yield higher energy savings per year that offset the higher initial purchase cost and hence the expenditure savings over a lifetime are highest for scenario 3.2 and 3.3 as well. However, due to the initial high investment from 2019 for mandatory operating condition requirement in scenario 3.3, the single user net expenditure over lifetime for a server purchased in 2020 for this scenario would be negative, because the energy cost saving cannot offset the large increase in product price (the delta in purchase cost between option 3.3 and the baseline is projected to decrease, as a 'learning curve' for the related technical solutions is expected between 2020 and 2030), as shown in
Table 80
with more detail.
Table 33 Single server user expenditure and saving vs. BAU (euros) for policy scenarios in 2030 and over a lifetime of 5 years
|
Policy scenarios
|
Purchase cost in 2030, €
|
Energy cost in 2030, €/year
|
Annual energy cost savings vs. BAU, €/year
|
Net expenditure over lifetime, €
|
|
1
|
4,160
|
662
|
-
|
-
|
|
3.1
|
4,163
|
638
|
24
|
119
|
|
3.2
|
4,196
|
611
|
52
|
223
|
|
3.3
|
4,373
|
528
|
134
|
459
|
|
5
|
4,180
|
622
|
41
|
185
|
5.2.8.Single user expenditure for Online 2 storage product
The table below shows the user expenditure for a single Online 2 storage product purchased in 2030, for each policy scenario, purchase cost, annual energy cost saving and net expenditure over a lifetime of 7 years are listed. Scenario 3.1 excludes storage products from the product scope, so there are no cost savings compared to BAU scenario. Scenario 3.2 has operating temperature information requirements, this is the only difference compared to scenario 3.3, however due to the compulsory operating temperature requirements in scenario 3.3, the storage product costs more in purchase, but it also yields the most savings annual and over the lifetime. Scenario 5 yields the least saving both annually and over the lifetime out of the policy scenarios that include storage products in scope of regulation.
Table 34 Single storage product user expenditure and saving vs. BAU (euros) for policy scenarios in 2030 and over a lifetime of 7 years
|
Policy scenarios
|
Purchase cost in 2030, €
|
Energy cost in 2030, €/year
|
Annual energy cost savings vs. BAU, €/year
|
Net expenditure over lifetime, €
|
|
1
|
20,800
|
2,544
|
-
|
-
|
|
3.1
|
20,800
|
2,544
|
-
|
-
|
|
3.2
|
20,835
|
2,393
|
151
|
1,020
|
|
3.3
|
20,848
|
2,070
|
474
|
3,271
|
|
5
|
20,803
|
2,505
|
39
|
273
|
5.3.Other impacts
5.3.1. Administrative burden
The form of the legislation is a Commission Regulation, which is directly applicable in all Member States. This ensures no costs for transposition of the implementing legislation into national legislation.
The Impact Assessment on the recast of the Energy Labelling Directive calculates the administrative burden of introducing a new implementing directive, similar to the proposed ecodesign implementing measure, in accordance with the EU Standard Cost Model. It estimates the administrative cost of implementing measures in the form of a Directive at €4.7 million of which €720.000 for administrative work on the amendment and development of the new directive and €4 million for transposition by Member States. It follows that the administrative cost of a Commission Regulation would be not more than €720.000, as transposition is not needed.
Enforcement could involve random spot-checks by MSAs, but from experience with other regulations of this type most spot-checks are often not random but follow indications of competitors or third parties (e.g. industry or specific complaints of users). In those cases, the probability of not only recuperating testing costs and legal costs, but also of collecting fines is high. Therefore, no further cost on enforcement is assumed.
The technical work prior to this impact assessment, in particular in the framework of the Technical Assistance Study for Enterprise Servers and Data Storage99, helped, among others, in identifying the potential standards (or draft transitional methods, when needed) for the assessment of the compliance with regard to the potential ecodesign requirements for servers and data storage products under discussion. This activity resulted in the preparation of a supporting document ('Draft list of standards and draft transitional methods with regard to potential ecodesign requirements for servers and data storage products') circulated at the time of the Consultation Forum meeting (see
Annex 2: Synopsis Report
).
The aim of this activity was to provide stakeholders, and in particular manufacturers and market surveillance authorities of the EU Member States, with the necessary testing and calculation tools in order to assess compliance of the servers and data storage products against the potential ecodesign requirements. One testing methodology which is not favoured by industrial stakeholders, is the one concerning the testing of the operating condition class, based on the ETSI EN300-019 series standards (Environmental conditions and environmental tests for telecommunications equipment). This method has been chosen, as it is based on European standards, and it is judged as suitable for the testing of servers and data storage products.
5.3.2.Testing cost for the server industry
The compliance cost for policy option 3.1, 3.2 and 3.3 includes improvement costs for modifying products and the server testing costs which depend on the number of models and configurations to be tested, and whether the manufacturer chooses to test internally or outsource testing. The chosen testing option would depend on the number of models and configurations to be tested, balanced against the cost of equipment, software licenses and technician time.
There is a lack of established information on the commercial costs of testing in an external laboratory, but one processor manufacturer has indicated their willingness to test servers containing their processors on behalf of the manufacturers for potentially a relatively small (200 to 300 EUR) fee.
For in-house testing, a breakdown of the resources required in terms of equipment and laboratory technician time are outlined in
Table 35
. Since most of the big manufacturers are involved in the development of SERT it is likely they already have the equipment and software license. These costs will therefore mainly impact SMEs.
Table 35 Example of test cost breakdown
|
Type of cost
|
Frequency
|
Detail
|
Number of
|
Approx. total cost (EUR)
|
|
Equipment
|
One off
|
Power analyser
|
1
|
€3,700
|
|
Equipment
|
One off
|
Power Supply
(AC mains conditioner providing standard voltage and harmonic content)
|
1
|
€3,500
|
|
Equipment
|
One off
|
Thermometer & Humidity meter
|
1
|
€1,000
|
|
Equipment
|
One off
|
Air speed meter
|
1
|
€900
|
|
Software License
|
One off
|
SERT software purchase
|
|
€2,450
|
|
Calibration
|
Annual
|
Per measurement instrument (varies by instrument and source)
|
1
|
€1,300
|
|
TOTAL initial outlay
|
€12,850
|
|
Labour
|
Per server
|
Set-up time
|
0.75 days
|
€375
|
|
Labour
|
Per server
|
Testing time
|
1.20 days
|
€600
|
|
Labour
|
Per server
|
Documentation
|
0.25 days
|
€
125
|
|
TOTAL per server model cost
|
€1,100
|
Note: Cost of technician time is based upon a 7 hour day at a typical rate of 500 Euros. Technician time includes a full storage drive configuration check (e.g. examination of RAID settings and reconfiguration as required), and installation of SERT, Java, and measurement instrumentation software. Labour associated with testing time assumes a confirmatory short worklet run (e.g. “storage random”) is performed and delivered with viable results before a complete SERT run. It is assumed that a complete run monitored occasionally allows the technician to perform other activities.
For SMEs, it is estimated that the compliance cost would be approx. €21,000 per company with 15 server models. For large companies, it is estimated that the compliance cost would be approx. €30,000 per companies with 25 server models.
The testing cost for the assessment of the operating conditions is based on the cost of thermal chamber testing. It is estimated to cost ca. 1050 EUR per unit, see assumptions in
Annex 4: Inputs, assumptions, calculations
.
5.3.3.Cost associated with material efficiency requirements
The cost associated with meeting the material efficiency requirements proposed in policy option 3.2 and 3.3 for manufacturers and recyclers has been assessed and summarised in the table below for each requirement. However, precedents of implemented material efficiency requirements, evidence of impacts as well as data are scarce in general, and some assessment has been based on expert opinions and assumptions. More details of the assessment (in particular on the costs) is given in
Annex 4: Inputs, assumptions
.
Table 36 Assessment and estimation of the costs associated with complying with the proposed material efficiency requirements
|
Requirements on material efficiency
|
Design for dismantling, reuse and recycling, and recovery
|
Securing data deletion
|
Securing firmware update availability
|
Critical raw material information
|
|
Estimated compliance costs for manufacturers
|
Zero to low cost
|
Zero to medium cost
|
Low cost
|
Low to medium cost
|
|
Rationale/assessment for estimated compliance cost for manufacturers
|
This is already done for majority of servers and storage. Therefore the cost of redesign is low at the whole EU level.
|
Some open source data deletion software are free, and some costs ca. €4 per wipe/drive for SMEs, much cheaper for larger enterprises. Both types of software comply with recognised data deletion standards.
|
Hosting firmware and updates on public website for 10 years costs ca. €0.2 per model. However increase in second hand market could lead to slower sales growth for OEMs.
|
Mostly documentation cost and cost for component suppliers to deliver material contents in weight. See more assessment below.
|
|
Estimated costs for recyclers, reuse and refurbish companies
|
Zero cost.
|
Low to medium cost.
|
Low to medium cost.
|
Low to medium cost.
|
|
Rationale/assessment for estimated cost for recyclers, reuse and refurbish companies
|
No need to invest in extra equipment if the design enables easy disassembly and extraction of components.
|
If the data deletion software is embedded or available to down from OEMs’ website, the primary user can carry out data deletion before sending to recyclers, therefore no cost.
|
There could be a fee associated, as the recyclers may need a license or service agreement with the OEMs to download the updates.
|
The recycling employees would need to look up information on critical raw materials and this also means longer time needed per product. However, this would also give an additional income through sale of CRMs.
|
|
Likelihood that the requirements can contribute to increase reuse/recycle/repair
|
Small contribution. ~1% increase in recycling servers.
|
Large contribution. 2~5% increase in reuse of servers and storage products.
|
Large contribution. 5~8% increase in reuse of servers and storage products.
|
Small contribution. ~1% increase in recycling servers.
|
|
Rationale/assessment for requirements’ contribution to reuse/recycle/repair
|
Majority of the products already comply with this. The requirement ensures the rest products will comply too, and hence increase the recycling rate very slightly.
|
By using data deletion software compliant with the recognised standards provides companies the confidence to allow reuse.
|
This requirement will remove one of the biggest barrier recyclers and second operators encountered currently.
|
Knowing the amount of valuable CRM contained, more products may be disassembled for material extraction rather than completely shredded.
|
5.3.4.Impact on innovation
The speed of technology innovation is one of the defining features of the market for servers and data storage products. The proposed ecodesign measures are formulated to be technology and performance neutral. Therefore, they do not hinder advances in performance and new technology approaches. Review periods allow new technologies to be addressed appropriately. Furthermore, they are likely to have a positive impact on innovation by pushing manufacturers to develop more efficient equipment.
When it comes to standardisation aspects, the work performed in the framework of the analysis on the environmental impact of servers and data storage will, without any doubt, have positive effects in terms of innovation. More in detail, during the technical assistance study a metric on the energy efficiency of servers was formulated, in the lack of an already existing approach to properly rank and qualify the products on the market (the metric hereby discussed is also the one described in this impact assessment, in particular in Annex 6: Proposed metrics requirements). The proposed metric resulted to be representative of the user pattern of servers, is scalable, technology neutral and does not entail excessive costs. This metric will be useful not only in the framework of potential Ecodesign initiatives, but, more in general, all policies aimed to improve the environmental impact of servers will highly benefit from this work. More in detail, the use of the proposed metric, in the first place, can potentially simplify legislative and compliance control activities, when compared to approaches considering allowances for different configurations and components included in servers (such as in the case of the idle power requirements in the Energy Star specification for servers). Moreover the regulatory work may be characterised by more longevity, as the metric is technology agnostic, a crucial aspect in the swiftly evolving ICT market. This metric will also be of importance for the activities under the standardisation mandate M/462, as a parallel approach between regulatory process and standardisation is surely beneficial for all stakeholders: the metric was finalised in early 2017, and it is incorporated in the ETSI standard EN 303470.
Futhermore, the potential ecodesign requirements on material efficiency are expected to create incentives for better recycling and reuse. It can lead to e.g. expanding market for second-hand products, new market for data deletion software, dedicated companies for executing data deletion, etc.. This would mean that the envisaged material efficiency requirements could have an impact for what concerns innovative business models, in particular (as just described) third parties dealing with maintenance, repair, reuse and upgrading of servers and data storage products.
In the context of the open public consultation on potential measures for regulating the environmental impact of enterprise servers and data storage products (referred to in Annex 2), stakeholders were asked which effects on the innovation in the sector of servers and data storage products could be expected, if in the EU there was an Ecodesign Regulation on servers and/or data storage products, addressing aspects concerning energy efficiency and resource efficiency. The majority of respondents (73%) was of the view that the Ecodesign requirements could promote innovation in this sector.
5.3.5.Impact on SMEs
A quali-quantitative evaluation on the effect on SMEs of potential regulatory measures for the environmental impact of servers and data storage products took place, in the framework of a dedicated SME consultation, trough the Enterprise Europe Network, which took place the first half of 2016. The aims of this consultation were to gather specific information on SMEs' role and importance on the market of servers and data storage products, and to acquire in-depth knowledge on how the aspects related to the environmental impacts of these products are seen/considered by SMEs. At the end of the consultation period, 195 replies were collected. Concerning the respondents repartition among sectors of activity, the table below shows the sample composition. It is worth noting that, if an Ecodesign regulation on servers and data storage products would be enforced in the EU, not all the SMEs which were interviewed would be legally affected by it, but only these ones responsible for placing products on the market (European Commission 2016), i.e. mainly the ones manufacturing the products or in charge of their final assembly. With regard to the usefulness of the results of the survey, a positive element consists in that 34% of respondents are involved in repair activities: there firms are very well placed to give their feedback concerning the potential resource efficiency requirements.
Table - Sector of activity for the SMEs of the sample
|
Activity
|
%age of SMEs working on this activity
(multiple replies were possible)
|
|
Manufacturing the products
|
7%
|
|
Final assembly of the product
|
16%
|
|
Manufacturing specific components
|
4%
|
|
Installation of the products
|
43%
|
|
Repairs
|
34%
|
|
Activities not at product level (software development, IT services..)
|
77%
|
The survey was divided into two sections, the first one being more general while the second one is focused on technical aspects, and on the expected impact on SMEs stemming from potential regulatory measures concerning the environmental impact of servers and data storage product. The results of the second part of the questionnaire are therefore of interest, to the extent of the current analysis. Question 13 of the questionnaire deals with the quantitative assessment of the performance of servers, by using a dedicated metric based on the Server Efficiency Rating Tool, an already available testing methodology by SPEC.
Only 17% of the sample is convinced of the feasibility of such an assessment, whereas most of the respondents do not know, or feel either that it is too complicated, or that the assessment would depend too much on the chosen metric. Similarly to question 13, in the case of question 14 (about a hypothetical user behaviour scenario following legislative measures on the operating temperature of servers and data storage products), 65% of the sample replied that the actual user behaviour was either difficult to predict, or too much dependent on a case by case situation. 20% of the respondents were of the opinion that, following potential requirement on the capability of servers to operate at higher temperature, at least half of the installations would actually operate at this temperature regime. An indication which can be derived is that rather than imposing a quantitative requirement, as in the case of question 13, information requirements on the servers operating conditions could be proposed.
The sample’s replies to the potential requirements laid down in question 15 (on energy efficiency aspect) and on question 16 (on resource efficiency aspects) helps in understanding which of these requirements are seen as useful by SMEs. It is interesting to see that for all the energy efficiency requirements, and for the requirements on accessibility and removability of components and on firmware availability, there is quite a clear result which confirms the perceived importance of these requirements (in all cases, at least 70% of the sample judged them as important or somewhat important). Potential requirements on the declaration of the presence of critical raw materials were less conclusive, as in this case 60% of respondents replied positively (i.e. considering them as important or somewhat important). Finally, the replies to question 17 (on the effect on the business of the respondents once an Ecodesign regulation on servers and data storage products would be in place) are shown in the table below.
Table - Expected impacts on SMEs business following an Ecodesign regulation on servers and data storage products
|
Effect
|
%age of replies
(multiple replies were possible)
|
|
My company would be more competitive
|
14%
|
|
A significant administrative burden
|
22%
|
|
A significant amount of testing activities to be performed
|
22%
|
|
An increased cost of the products could be expected
|
44%
|
The replies summarised in the table above show that a low share of respondents is expecting a positive effect on the business (in the sense of improved competitiveness). This can be linked to some initial scepticism from the side of companies who, quite likely, have not been affected, up to now, by Ecodesign Regulations. A recent study proved the overall positive effect of the Ecodesign legislative framework for businesses, which has been quantified in terms of some tens of billion euros of extra revenue for industry, the whole-sale sector and the retail sector. Concerning the expected negative effects, the increased cost of the product is the main reason for worry. From this point of view, specific attention in the chosen policy solution is to be paid to identify an approach which can deliver improvements on the environmental impact of servers and data storage products, without entailing excessive investment costs for businesses.
6.Comparison of options
6.1.Summary of impacts and options comparison
The impact analysis was performed on the basis of scenarios for the baseline (BAU) and four alternative options. The main results are summarised in the tables below, where the impacts of scenarios are expressed as difference to BAU in 2030.
Table 37
shows the estimated annual impacts (in terms of energy savings, greenhouse gases reduction, end-user expenditure, extra revenues and extra jobs) in the case of servers;
Table 38
has the same structure and purpose, while showing the results related to data storage products.
Table 37 Summary of annual impacts in 2030 for server policy scenarios
|
Changes in 2030 compared to BAU
|
Energy savings
|
GHG
|
End-user expenditure
|
Extra revenue
|
Extra jobs
|
|
|
Electricity excl. infra
|
Electricity incl. infra
|
Primary
|
CO2eq reduction
|
Extra purchase cost
|
Energy cost savings
|
Net cost savings
|
OEM
|
ODM
|
OEM
|
ODM
|
|
Policy scenarios
|
TWh
|
TWh
|
PJ
|
Mt
|
mln.€
|
mln.€
|
mln.€
|
mln.€
|
mln.€
|
Jobs
|
Jobs
|
|
3.1 PSU + Info (incl. Metrics)
|
1.76
|
2.7
|
25
|
0.9
|
-13
|
627
|
614
|
13
|
9
|
50
|
48
|
|
3.2 PSU + Info ASHRAE, Metrics + max. Idle
|
2.38
|
6.1
|
55
|
2.1
|
-29
|
1395
|
1367
|
29
|
20
|
108
|
104
|
|
3.3 PSU + Info + min. ASHRAE Metrics
|
2.40
|
15.3
|
138
|
5.2
|
-159
|
3519
|
3360
|
159
|
111
|
602
|
578
|
|
5 Compulsory Energy Star
|
1.82
|
4.9
|
44
|
1.7
|
-29
|
1114
|
1085
|
29
|
20
|
108
|
104
|
Table 38 Summary of annual impacts in 2030 for storage products policy scenarios
|
Changes in 2030 compared to BAU
|
Energy savings
|
GHG
|
End-user expenditure
|
Extra revenue
|
Extra jobs
|
|
|
Electricity excl. infra
|
Electricity incl. infra
|
Primary
|
CO2eq reduction
|
Extra purchase cost
|
Energy cost savings
|
Net cost savings
|
OEM
|
ODM
|
OEM
|
ODM
|
|
Policy scenarios
|
TWh
|
TWh
|
PJ
|
Mt
|
mln.€
|
mln.€
|
mln.€
|
mln.€
|
mln.€
|
Jobs
|
Jobs
|
|
3.1 Storage excluded (BAU)
|
0.00
|
0.0
|
0
|
0.0
|
0
|
0
|
0
|
0
|
0
|
0
|
0
|
|
3.2 PSU + info ASHRAE
|
0.81
|
2.8
|
25
|
0.9
|
-21
|
637
|
616
|
21
|
15
|
80
|
96
|
|
3.3 PSU + min. ASHRAE
|
0.81
|
8.7
|
78
|
3.0
|
-29
|
1992
|
1962
|
29
|
21
|
111
|
133
|
|
5 Compulsory Energy Star
|
0.48
|
0.7
|
7
|
0.3
|
-2
|
171
|
169
|
2
|
1
|
6
|
7
|
The table below is a check-list of items that according to the Directive 2009/125/EC, Art. 15.5 should not be subject to ‘significant negative impacts’, as well as a check against the specific objectives of this initiative.
|
Table 39 Evaluation of policy options in terms of their impacts compared to the base line
|
|
|
|
Options
|
|
|
3.1
|
3.2
|
3.3
|
5
|
|
Reduce energy consumption and related CO2 emissions
|
+
|
++
|
+++(*)
|
+
|
|
Reduce GHG emissions
|
+
|
++
|
+++(*)
|
+
|
|
No significant negative impacts on the functionality of the product from the perspective of the user
|
+
|
+
|
+
|
+
|
|
Health, safety and the environment shall not be adversely affected
|
0
|
+
|
+
|
0
|
|
No significant negative impact on consumers in particular as regards affordability and life-cycle costs
|
+
|
++
|
-
|
+
|
|
No significant negative impacts on industry's competitiveness
|
+
|
+
|
0
|
+
|
|
Setting of an ecodesign requirement shall not have the consequence of imposing proprietary technology on manufacturers
|
+
|
+
|
+
|
+
|
|
Impose no excessive administrative burden
|
+
|
+
|
0
|
++
|
|
Specific objectives
|
|
|
|
|
|
Awareness on energy efficiency and environmental aspects; facilitating comparison
|
++
|
++
|
++
|
+
|
|
Complementing/integrating the EU Energy Star Program
|
+
|
+
|
+
|
++
|
|
Gradually removing the worst performing products from the market
|
+
|
++
|
+++(*)
|
0
|
Legend:
++: very positive impact
+: small positive impact;
0: neutral impact
-: small negative impact
--: large negative impact
(*): high level of uncertainty in delivering the expected savings
The choice of the preferred policy option is driven by the analysis of the impacts of each options, as shown in
Table 39
.
Table 37
and
Table 38
quantify some of these impacts, based on the analysis of the previous sections.
As from
Table 39
, in terms of the impacts on functionality, all the policy options are expected to have a small positive impact (due to the improved availability of information on product performance and efficiency). Options 3.2 and 3.3 are superior for what concerns their expected environmental impact (with a predominance of the savings of option 3.3 which however suffers of an intrinsic high level of uncertainty), in that they would achieve much higher energy savings (as from
Table 37
and
Table 38
), when compared to the other two options (3.1 and 5); analogously these two options would lead to higher cost savings, when compared to options 3.1 and 5. Moreover, options 3.2 and 3.3 are expected to be the most effective for removing the worst performing products from the market.
In terms of affordability, due to the initial high investment for the mandatory requirement on the operating condition in scenario 3.3, the single user net expenditure over lifetime for a server purchased in 2020 for this scenario (see Table 78) would be negative (as the energy cost saving cannot offset the large increase in product price). In practical terms this means that in the first years of the implementation of an Ecodesign regulation based on option 3.3 the customers would realise a net economic loss as an effect of the increase in purchase price of the server, which would not be balanced by the savings throughout the product operating life.
No option is expected to impose proprietary technology on manufacturers.
In terms of administrative burden, option 5 scores better than the others, as manufacturers are already acquainted with the Energy Star compliance procedures. It has also to be noted that we assigned a ‘0’ (zero) score to option 3.3, because of the following reason. As described at length in Annex 4 and Annex 11, an ongoing legislative initiative, the 'Free flow of non-personal data', could eventually lead, as an effect of its implementation at EU member states level, to a ‘migration’ of data centers toward cold European regions (the likelihood of this event is currently very difficult to predict, given that this initiative still has to be finalised). In this scenario, the compulsory requirement on the operating temperature of option 3.3 could result in an unnecessary burden, as only products capable to perform in a minimum operating temperature could be placed on the market, but actually many of them would be installed in cold regions (where it’s much less probable to have high operating temperatures in the data center).
In terms of impact on industry competitiveness, all the policy options (with the exclusion of option 3.3) are expected to have a positive impact, due to the estimated extra revenues. Option 3.3 has not been associated with a positive impact, because of the reasons expressed about the potential issues linked to affordability and administrative, which could indirectly reflect on the competitiveness of manufacturers.
Finally, options 3.1, 3.2 and 3.3 score better than option 5 concerning the awareness on energy efficiency and environmental aspects, due to the fact that there aren't any material efficiency requirements under the latter option.
Further considerations specifically concerning option 5 are as follows:
- it is worth to reiterate, as from the previous sections, that Option 5 simplistically assumes to extend Energy Star to all purchasers, and not only to procurers of central authorities, as it is today. This would be procedurally very complicated.
- there are hiccups on the functioning of the EU Energy star programme, in particular concerning the need of third party certification (in order to be able to access the US market)
- (potentially linked to the previous item) still in 2016 at least 50% of the EU market of servers was composed of products without the Energy Star label, therefore significant improvements are still needed to increase the market coverage of this scheme
- the legal basis for the EU Energy Star program, i.e. the 'Agreement between the Government of the United States of America and the European Union on the coordination of energy-efficiency labelling programs for office equipment' (OJ L 63, 6.3.2013, p. 1) remains in force until February 20th 2018.
These motivations lead to the exclude option 5 from the choice of the preferred policy option.
Option 3.2 is consistent with the specific objectives of this initiative, as it would raise awareness on the environmental performance of servers and data storage products and it would facilitate a comparison between corresponding products among users (due in particular to the information requirements foreseen under this option, such as the one on the metric on the active state efficiency). As an effect of the minimum threshold requirements, it would also gradually remove the worst-performing products from the EU market (as shown more in detail in Annex 4).
Based on the considerations expressed above, the choice of the preferred policy option can be now restricted to a sub-set composed of options 3.2 and 3.3. When comparing the environmental and economic savings of options 3.2 and 3.3, it can be seen that option 3.3 is superior, both in the case of server and data storage products. However:
·it is important to remind that under option 3.3 the assumption on 100% data centers working at higher operating temperature is overoptimistic (as analised more in detail in section 4.4.2.2 and in section 6.1.1). The actual adoption rate of higher operating temperatures in data centers would be linked to a behavioural change of the data center operators, therefore the assumption of option 3.3 rests on some structural uncertainty. On the contrary, the adoption rate assumed under option 3.2 seems more plausible if not conservative. As shown in section 6.1.1, a variation on the adoption rate has a direct effect on the environmental and economic savings which can be realised. In particular, when comparing option 3.2 assuming a 45% adoption rate (an optimistic yet plausible value, if compared to the 30% adoption rate of the ‘standard’ option 3.2) and option 3.3 assuming a 75% adoption rate (a more ‘realistic’ adoption rate for this option), the cumulative cost savings by 2030 are higher for option 3.2 (23 billion euros) than for option 3.3 (20,5 billion euros).
·the purchase cost increase for servers is much more limited under option 3.2 than option 3.3, and this makes option 3.2 as preferable in terms of impact on business and more in line with the objectives of this initiative. More in detail, option 3.3 is the one which would entail the higher purchase cost increase for servers, in particular in the short term (+18% in server cost, as from Table 78); this cost increase is mainly due to the product technological changes needed to match the quantitative requirements in active state under this option. The cost increase in the case of option 3.2 is much more limited (less than 1%). Moreover, as discussed above, due to the initial high investment for the mandatory requirement on the operating condition in scenario 3.3, the customers would realise a net economic loss as an effect of the increase in purchase price of the server in the first years of implementation of the regulation. This does not happen for option 3.2, which is also profitable in terms of next expenditure for a server purchased in 2020.
·it is also worth to reiterate that Ecodesign Regulations are typically reviewed within five years, to evaluate the effectiveness of the measure and to update the requirements in light of the technology, market or legislative evolution. In the specific case of this initiative, assuming it is opted for an Ecodesign regulation on servers and data storage products published around late 2018, it would mean to have the review by 2025, or earlier. It would be therefore possible to assess if the approach of option 3.2 should remain, or if e.g. the requirements under option 3.3 would be, by that time, more effective. As discussed in the previous sections, the difference in saving potential among option 3.2 and 3.3 mainly lies in the assumed adoption rates for the increase in the data centers operating temperature (100% under option 3.3, 30% under option 3.2). The first years of implementation of a potential Ecodesign regulation (as from option 3.2) would show if the approach of an information requirement on the product operating temperature (as proposed under option 3.2) would prove – or not – as successful in terms of fostering the behavioural change on data center operators toward higher operating temperatures, and therefore providing the European Commission with more detailed information on how to choose between the approach of option 3.2 and 3.3 (information requirements vs mandatory requirement on the operating temperature). Moreover, option 3.3 can be considered, in terms of stringency of the requirements, as ‘incremental’ to option 3.2. (as from
Table 19
, the requirement on the product operating temperature is mandatory under option 3.3 and voluntary, i.e. information only, under option 3.2; the requirement on maximum energy consumption in idle state is foreseen under option 3.2, whereas option 3.3 envisages quantitative requirements based on the SERT metric, under the assumption that this metric properly factors in the contribution from energy consumption in active as well as idle state). In terms of investments by OEMs at product level, this means that the investments needed on the product to ensure compliance with the requirements under option 3.3 are ‘incremental’ to the investments needed for option 3.2, i.e. any effort to ensure compliance with option 3.2 is also useful to the extent of the compliance with option 3.3. Therefore, in the hypothetical scenario where, at the time of the 2025 review, it would be opted for a regulatory measure in line with option 3.3, there would be no harm to the competitiveness of manufacturers deriving from the investments already carried out for the compliance with the requirements under option 3.2.
·By 2025 it will be also clear if there will be any effect (stemming from the implementation of the 'Free flow of non-personal data' initiative) in terms of an actual ‘migration’ of data centers toward cold European regions (and this would allow, in turn, to judge if a compulsory requirement on the higher operating temperature would be burdensome, as argued in Annex 4).
Finally, it is highly recommended to adopt the same policy option for both servers and data storage products, for the following reasons:
·Servers and data storage products are typically operated in the same environment (i.e. the data center). For this reason it can be assumed that the two products will be functioning at the same operating temperature (managing different operating temperatures according to the product category would be very difficult in practical terms). Therefore, having e.g. on information requirement on the operating temperature for servers (as from option 3.2) and a compulsory requirement on the operating temperature for data storage products (as from option 3.3) would result in unnecessary red tape/duplication of legislative prescriptions, as the final choice would be the same for the two products, and typically driven by the product with the lowest operating temperature.
·Several components and subassemblies, such as the PSUs, are used both on servers and data storage products, therefore in presence of different requirements between option 3.2 and 3.3 it would be more difficult for manufacturers to manage component categories which would vary based on the product in which they are installed.
Based on the above rationale, the preferred policy option is the one under scenario 3.2 (Ecodesign regulation with both information81 and quantitative requirements), as this is the option which, in general, ranks better than the others against the impacts described in
Table 39
. This option results in the following overall net savings and impacts versus the BAU option in 2030:
·Electricity savings of ~9 TWh/yr and GHG emission abatement of 3 MtCO2eq/yr;
·Savings on annual end-user expenditure of ~€2 billion per year;
·Removal from the market of the less resource efficient products;
·Improved comparability of products on the market in terms of their environmental impacts (such as the energy efficiency of servers);
·Higher revenues and profits for independent companies (such as SMEs) working in the field of reparation and refurbishment of products.
6.1.1.Sensitivity analysis on different adoption rates of operating conditions
The operating condition requirements could be set at product level, but without the actual adoption in data centres (in the use phase of servers and data storage products) the reduced cooling demand associated with each ASHRAE class would not be achieved; the tables of the previous section show how important is the contribution to the energy savings stemming from requirements on the operating conditions, therefore a sensitivity analysis was carried out, in order to assess how the expected savings vary in presence of different adoption rates.
A first case specifically analised the impacts of the policy scenarios for servers and storage products if 15% of the data centres adopt the ASHRAE conditions based on the required operating condition class declaration of the policy scenario 3.2. The original savings shown in
Table 21
and
Table 23
were calculated for 30% adoption by the data centres for this policy option, therefore this sensitivity analysis reduces the adoption rate by half ('pessimistic' forecast). As it can be seen with more detail in Annex 7.2, the savings including infrastructure would be reduced by about 1/3 or more, when only 15% of the data centres would adopt the operating conditions over time. The preferred option 3.2 would yield 5.6 TWh in 2030 for both servers and storage products. See more details in Annex 7.2
Sensitivity analysis – detailed tables
.
An additional analysis was carried out, to evaluate the effects of:
- 45% data centre adoption for option 3.2 (instead of the 30% value of option 3.2), i.e. an 'optimistic' forecast.
- 75% for option 3.3 (instead of the 100% value of option 3.3), i.e a 'more prudent' forecast for this option.
The 75% for option 3.3 was evaluated, under the assumption that although there is minimum mandatory requirement at product level for the operating conditions class, at data centre level the adoption might not be 100% due to different restrictions of data centres, designs, investment etc(as an example, in some cases the service level agreements between data center operators and companies explicitly refer to predefined maximum levels of the operating temperature; moreover, as argued in section 2.3, psychological inertia of customers and data centers operators, as well as split incentives, will most probably lead to a situation where, even in presence of the proper information and/or compulsory requirements, not all data center operators would shift to higher operating temperatures).
As it can be seen in Annex 7.2
Sensitivity analysis – detailed tables
, the preferred option 3.2 with a 45% adoption rate yields 12,1 TWh for servers and data storage products including infrastructure in 2030, which is a 36% increase from the original saving of 8.9 TWh. Scenario 3.3 with a 75% adoption rate yields 18.6 TWh in 2030, a reduction of 23% compared to the original saving of 24 TWh.
In terms of cost savings,
Table 74
and
Table 75
show that, when comparing option 3.2 assuming a 45% adoption rate and option 3.3 assuming a 75% adoption rate, the cumulative cost savings by 2030 are higher for option 3.2 (23 billion euros) than for option 3.3 (20,5 billion euros)
Overall, in terms of energy savings the cases analised in this section show that:
- even under the 'pessimistic' forecast, the energy savings from option 3.2 would be significant, i.e. in the range of ~6TWh/year
- with the 'optimistic' forecast of option 3.2 and the 'more prudent' forecast of option 3.3., it is clear that the difference in savings between option 3.2 and 3.3 gradually decreases.
Table 40
resumes the findings of the analyses carried out in this subsection.
Table 40 Energy savings per year in 2030 vs BAU
|
Option/adoption rate of higher operating temperatures
|
Energy savings (TWh)
|
|
option 3.2 - 30% adoption rate
|
8,9
|
|
option 3.2 - 15% adoption rate
|
5,6
|
|
option 3.2 - 45% adoption rate
|
12,1
|
|
option 3.3 - 75% adoption rate
|
18,6
|
|
option 3.3 - 100% adoption rate
|
24
|
From
Table 40
it can be seen that the energy savings are almost proportional to the adoption rate, in a linear way (i.e. the higher the adoption rate, the higher the savings). This is due to the fact that, in particular for high adoption rates, the contribution to the energy savings stemming from the requirements not related to the operating temperature (such as the PSU efficiency, or the maximum energy consumption in idle power state for the servers in the case of option 3.2) is modest, when compared to the expected contribution deriving from requirements on the operating temperature. Once again, it is worth highlighting that option 3.3 should be seen, from the specific point of view of the expected increase of the operating temperature, as an ‘extreme/overly optimistic’ scenario, as the actual adoption rate would be linked to a behavioural change of the data center operators.
6.1.2.Sensitivity analysis on the cloud utilisation
As discussed more in detail in annex 4, in the present impact assessment report it is assumed that, beyond 2016, the sales proportion of traditional to cloud servers is unchanged at 30:70. This is based on the proportion of workloads being split between traditional and cloud is 11:89, i.e. approximately 89% of all data processed and transmitted is coming from the cloud. Based on the latest update of the Cisco Global Cloud Index (2015-2020), the proportion of traditional and cloud workloads was recalculated and found to be 10:90 (which is equivalent to 28:72 of traditional and cloud servers sales in 2015). A sensitivity analysis was run, with the aim to understand the impact on the projected savings, deriving from a variation in the workloads split between traditional and cloud servers. In general terms, it can be observed that an increase in cloud workloads will entail a decrease in energy consumption, as the PUE of cloud data centers is assumed to be better than the one of traditional data centers (see Annex 4 for the details).
For this analysis, the distribution of workloads is projected to increase to 5:95 traditional vs cloud workloads and 20:80 traditional vs cloud servers in sales by 2020 and 15:85 proportion in sales by 2030. These values are chosen as the maximum possible penetration of cloud computing and used purely for the purposes of understanding how the proportion of cloud could impact the projected savings. There are technical and business reasons for cloud computing (and high server utilisation) not reaching 100%, which are discussed more in Annex 4.
When modelling this increase in the uptake of cloud workloads, the energy saving including infrastructure from both servers and data storage products for the preferred option 3.2 is (see
Table 76
and
Table 77
) 7.1 TWh in 2030; this is a reduction of 20% in energy savings compared to the original saving of 8.9 TWh in 2030, nevertheless the saving would still be significant in absolute terms.
To conclude, it can be judged that, even in presence of a dramatic shift to cloud computing in the next years, the effectiveness of option 3.2 would not be harmed.
7.Evaluation and monitoring
7.1.Evaluation and revision
A revision of the measure is proposed within 4 years after entry into force. During the revision the effectiveness of the measure shall be evaluated, and options for modification, update or enhancement of requirements will be discussed.
The main issues for consideration for the review of the measure would include:
-the appropriateness to set specific ecodesign requirements on server efficiency, performance and power demand;
-the need to update the definitions or the scope of the Regulation;
-the appropriateness of set specific ecodesign requirements on operating condition class;
-the appropriateness to set specific ecodesign requirements on the efficiency, performance and power demand of data storage products.
The main monitoring element will be the tests carried out to verify compliance with the Ecodesign requirements. This monitoring should be done by market surveillance carried out by Member State authorities to ensure that requirements are met.
The main indicator for evaluating the impact of a potential Ecodesign regulation is the achievement of a market improvement towards servers and data storage products with a smaller environmental impact. An analysis of the products on the market (sales figures, performance, etc.) will determine if the shift towards more resource efficient products has happened as estimated, in particular based on the following sub-indicators, which reflect the specific objectives:
-Easier comparison of the environmental performance (e.g. energy efficiency) of servers and data storage products
-compliance with energy efficiency requirements
ominimum PSU efficiency
omaximum idle power consumption
opresence of information related to the operating temperature and the SERT metric result (server efficiency)
-compliance with material efficiency requirements
odisassemblability of key-components
opresence of a data deletion functionality in the product
oavailability of the latest firmware version
opresence of information related to content of Neodymium and Cobalt in certain components.
-user behaviour concerning operating temperature
-safeguarding the competitiveness of the European industry (manufacturing side), and increase of repairing and refurbishing activities
The evaluation should therefore assess these sub-indicators (the benchmarks related to the energy efficiency requirements are given in Annex 8; they refer to the best available technology on the market for servers and online data storage products at the time of drafting this impact assessment report (February 2018)).
Annex 1: Procedural information
Lead DG: DG GROW
Decide number of the underlying initiative: 2017/GROW/042 (inception impact assessment published on 20/06/2017 at
https://ec.europa.eu/info/law/better-regulation/initiatives/ares-2017-3069227_en
)
The following DGs (Directorates General) have been invited to contribute to this impact assessment: SG (Secretariat-General), ENER (Energy), ENV (Environment), CLIMA (Climate Action), RTD (Research and Innovation), CNECT (Communications Networks, Content and Technology), SANTE (Health and Food Safety), JRC (Joint Research Centre) and TRADE (Trade). The DG in the lead for this initiative, i.e. DG GROW (Internal Market, Industry, Entrepreneurship and SMEs), met with the other DGs 3 times during 2016-17, to give an update on the ongoing work and share the preliminary versions of the Impact assessment report, together with all the supporting documents.
For this impact assessment, the main supporting studies were as follows:
- The Ecodesign design preparatory study8 on enterprise servers and data storage devices, which was concluded on September 2015. The consultants envisaged some potential Ecodesign requirements for these products, such as quantitative requirements at hardware level, in particular concerning the efficiency of the internal power supply unit, information requirements on product's performance (both in idle and active state), requirements on some product operating conditions and requirements on product materials efficiency (reuse, recycling). As a result, the saving potential at the level of servers and data storage devices has been estimated to be in the order of 17TWh by 2030 (these figures have been reassessed, and consequently revised, in this impact assessment).
- the technical assistance study
on standardisation gaps (mainly related to the area of energy efficiency/product performance), ended in August 2016. This contract was aimed to develop measurement methods for the energy efficiency/product performance of servers as well as, more in general, to analyse the currently available standardised methods in the field of servers and data storage products.
- the JRC report on material efficiency requirements for servers29
This impact assessment also benefitted from the technical support of an external consultancy company, Viegand Maagøe.
Consultation of the Regulatory Scrutiny Board (RSB).
The present impact assessment report was submitted to the RSB on 06/12/2017. The impact assessment was discussed with the RSB on 10/01/2018, and the RSB issued a positive opinion with reservations on 12/01/2018.
The RSB expressed the recommendations resumed in the table below, which also shows briefly how the impact assessment report was adjusted, in order to integrate them.
|
Main RSB recommendations
|
Change(s) in the impact assessment report
|
|
The description of the problem linked to the market failure is not well-specified, which makes it difficult to define the exact scope of the intervention
|
An improved description, together with more evidence from existing literature/reports, has been added in the relevant sections (2.1, 2.2 and 2.3).
|
|
The baseline scenario requires more details and justifications on the assumptions with regard to market developments and to changes in the related policies.
|
More explanations to the baseline scenario assumptions and justification have been added, in particular in annex 4. Given the uncertainty around medium-long term forecasts for ICT trends, such as the cloud penetration, the sensitivity analysis in 6.1 has been improved with various case studies.
|
|
The criteria for comparing the options are not clear, making the choice of the preferred solutions unjustified in view of the analysis.
|
An improved and more in-depth description of the various options and of the criteria for comparison has been added in the relevant sections (4.5, 5.2, 6.1 and
Annex 11: Existing Policies, Legislation and Standards on servers and Data storage products
), in order to provide clearer information in support of the choice of the preferred option.
|
|
Further considerations and adjustment requirements
|
Change(s) in the impact assessment report
|
|
The report should be more explicit about the context and the conditions set by the Eco-design Directive for the adoption of an implementing regulation.
|
The conditions for the adoption of an implementing regulation have been added to the report (section 1)
|
|
The report should be more specific about the segment of the market the initiative is focusing on. It should provide more evidence on the market failure in that segment of the market.
|
An improved description, together with more evidence from existing literature/reports, has been added in the relevant sections (2.1, 2.2 and 2.3).
|
|
The overall context should present the energy saving potential of the analysed product group and to what extent it may contribute to the overall EU energy efficiency and climate targets for the period up to 2030.
|
The energy saving potential stemming from the present initiative has been framed in the overall context of the savings linked to the Ecodesign Directive (section 2.2)
|
|
The baseline scenario should be more explicit on the fundamental assumptions linked to the envisaged market developments
|
The description of the baseline scenario and of its underlying assumptions has been improved (Annex 4).
|
|
The report should also refer to related policy developments. This includes the proposal on the Free Flow of Data and the (probable) expiry of the EU-US agreement on the Energy Star programme.
|
References to the latest policy developments 'Free flow of data initiative, Green Public Procurement criteria for data centers, Energy Star Agrement) have been introduced in the report ('Annex 11: Existing Policies, Legislation and Standards on servers and Data storage products'
|
|
The report should describe in greater detail and analyse the proposed provisions on material efficiency for servers and data storage products, in particular as regards their enforceability.
|
The enforceability of the proposed material efficiency requirements has been analised in detail (section 4.4.6.1)
|
|
The report should further explain and justify the criteria for comparing options and their relative importance.
|
An improved and more in-depth analysis and comparison of the options (in relation to the objectives of the initiative) has been added in the relevant section (6.1).
|
|
As the modelling results heavily depend on the baseline assumptions, the report would benefit from a more elaborated sensitivity analysis.
|
The sensitivity analysis in section 6.1 has been improved with various case studies.
|
Annex 2: Synopsis Report
In the context of the initiative 'Potential measures for regulating the environmental impact of enterprise servers and data storage products', a wide range of consultations took place, with the aim to ensure that the interests of all relevant sectors, as well as citizens, non-governmental organisation, standardisation organisation, etc., were duly taken into account. The feedback obtained from stakeholders via the different tools mentioned below contributes to the analysis together with evidence from different sources including desk-research.
Stakeholder mapping
A wide range of stakeholders is concerned by this initiative:
• MS (Member States): MS representatives and National Governments
• Industry: large IT products manufacturers, which play an important role in the servers and data storage products market, have been very proactive in the discussion, in particular with the umbrella organisations Digital Europe and The Green Grid.
• SMEs (small and medium enterprises): In terms of market share they are certainly not the main player in the B2B IT sector, however there are several European SMEs working on services or activities related to servers and data storage products, such as product final assembly, installation and repair.
• Environmental and consumer NGOs (non-governmental organisations) are a typical stakeholder in the framework of the consultation process for Ecodesign, with the aim to promote citizen rights, environment and sustainable development.
• Standardisation organisations: raising awareness regarding energy efficiency and environmental performance of servers and data storage products is among the objectives of this initiative, and this can be obtained via (inter alia) establishing standard measurement methods, which would be developed in conjunction with standardisation organisations, where relevant. This shows the importance of this stakeholder category, which has been present in the debate both at the level of European standardisation organisations, such as CEN , CENELEC and ETSI, and at the level of global organisations, such as SPEC .
• 'Users": In the specific case of this product group, the data center operators (i.e. those ones responsible to manage/design/install/maintain the data centers) are to be considered the users. In fact, servers and data storage products are complex b2b (business-to-business) products, which are used in very specific environments, e.g., within data centers or server rooms. In other words, they are rather "arcane" b2b products which citizens would not relate to in their everyday lives.
Consultation methods and tools
In the context of the activities linked to the Ecodesign “DG GROW Lot 9” (Servers, data storage and ancillary equipment), an inclusive and articulated stakeholder consultation took place, with the aim to gather feedback from a very wide audience.
• during the preparatory study8, three stakeholder meetings were organised. The main participants have been from relevant industry actors, standardising organisations and environmental organisations
• during the technical assistance study99, two stakeholder meetings were organised. The main participants have been relevant industry actors and standardising organisations
• a SME consultation trough the Enterprise Europe Network took place the first half of 2016, with the aim to gather specific information on SMEs' role and importance on the market of servers and data storage products, and to acquire in-depth knowledge on how the aspects related to the environmental impacts of these products are seen/considered by SMEs.
• an Inception Impact Assessement was published in the period Feedback period 20 June 2017 - 18 July 2017; no feedback was received.
• a meeting of the Ecodesign Consultation Forum (as required by Article 18 of the Ecodesign Directive) has been convened on 17/02/2017.
• dedicated consultation activities on material efficiency requirements were organised (as described in the last part of Annex 4: inputs and assumptions)
• an online public consultation took place from 10 July 2017 to 23 October 2017, with the aim to collect stakeholders' views on issues such as the expected effect of potential legislative measures on businesses and on energy consumption trends.
The chart below shows the level of involvement of the identified stakeholder categories in the various consultations/meetings in the framework of this initiative.
|
√: the party has significantly contributed to the specific consultation
√: the party has contributed in a limited way to the specific consultation
|
Member States
|
Industry associations
|
SMEs
|
Environmental and consumer NGOs
|
Standardisation organisations
|
Data center operators
|
Others
|
|
Meetings – prep. study
|
√
|
√
|
|
√
|
√
|
√
|
|
|
Meetings – technical assistance study
|
√
|
√
|
|
√
|
√
|
√
|
|
|
SME consultation
|
|
|
√
|
|
|
|
|
|
Open public consultation
|
|
√
|
√
|
√
|
|
√
|
√
|
|
Consultation Forum
|
√
|
√
|
√
|
√
|
√
|
√
|
|
Minutes of stakeholder meetings – preparatory study and technical assistance study
The minutes of these meetings are available at:
http://ec.europa.eu/growth/industry/sustainability/ecodesign/product-groups_en
SME consultation
During the preparatory activities on servers and data storage products, a good stakeholder involvement occurred since the start of the process. From the industry point of view, large IT products manufacturers, which play an important role in the servers and data storage products market, have been very proactive in the discussion. Until 2016, only one stakeholder category was not reached by the consultation activities to a satisfactory level: the one of SMEs. In terms of market share they are certainly not the main player in the B2B IT sector, however there are numerous SMEs working on services or activities such as product final assembly, installation and repair. Therefore, it was deemed important to have a dedicated consultation of these firms, with the aims of: firstly, gathering specific information on SMEs' roles, and their importance on the market of enterprise servers and data storage products; secondly, to acquire in-depth knowledge of how the aspects related to the environmental impacts of these products are considered by SMEs. The approach chosen was to have the consultation after the end of the preparatory study, and before the Consultation Forum, i.e. during the impact assessment phase. On one side, the approach ensured that the analysis of the preparatory study was concluded, so that a proposal with a set of draft Ecodesign requirements was already available for discussion with stakeholders. On the other side, having the SME consultation during the impact assessment phase, and in particular before the Consultation Forum (when typically working documents on draft regulations are presented to stakeholders for discussion), allowed to take into account the feedback collected during the consultation in due time.
With this rationale, an Internet-based survey was launched in the period May-July 2016, via the EEN (Enterprise Europe Network), a support network for SMEs which helps them to innovate and grow internationally. The EEN provides targeted services such as partnership, advisory and innovation support, and has more than 600 member organisations, including chambers of commerce and industry, technology centres, universities and development agencies. The survey design was done according to the commonly recommended practices, e.g. avoiding leading, unbalanced and double-barrelled questions. In most cases it was opted for closed questions, leaving the respondent with the chance to give open replies only in a few specific cases. The survey was targeting European SMEs and SMEs organisations/consortia in the IT field, and the overall figure concerning the response rate was undoubtedly good: around 200 replies were received. The survey results (as well as the proposed questionnaire) are described in detail at:
http://ec.europa.eu/DocsRoom/documents/22983
Consultation Forum meeting on Servers and data storage products (GROW Lot9) - Minutes
The final minutes are available at:
http://ec.europa.eu/transparency/regexpert/index.cfm?do=groupDetail.groupDetailDoc&id=34952&no=2
Open public consultation
An open public consultation on potential measures for regulating the environmental impact of enterprise servers and data storage products took place from 10 July 2017 to 23 October 2017. This open public consultation was launched with the aim to collect stakeholders' views on issues such as the expected effect of potential legislative measures on businesses and on energy consumption in the sector of servers and data storage products. Before the closing on 23 October 2017, 26 replies were submitted through EU Survey. Out of the 26 replies, 1 was from a public administration, 12 were from companies (of which, 8 with less than 250 employees), 5 from individuals, 4 from consumer/environmental organisations and 4 from other types of organisations (trade associations, industry associations). A dedicated report, 'Brief factual summary of the replies received to the public consultation on potential measures for regulating the environmental impact of enterprise servers and data storage products', describes in detail the factual results.
Overall messages from the consultation process
All categories of stakeholders identified in the stakeholder mapping participated in various consultation activities, therefore the outcomes of the consultation process were of great help in the analysis and the formulation of the policy proposal.
The meetings in the framework of the preparatory study and of the technical assistance study provided an early opportunity to promote stakeholders engagement, and to collect technical data. The SME consultation and the open public consultation gave useful input for the modelling assumptions in this impact assessment, and the formulation of potential energy efficiency or material efficiency requirements under an Ecodesign regulation on enterprise servers and data storage devices. The Consultation Forum meeting helped the Commission in understanding in detail stakeholder views on the various aspects of potential Ecodesign requirements on enterprise servers and data storage devices; there was a general consensus in proceeding with the analysis and formulation of these requirements, however various caveats were expressed, in particular concerning the material efficiency requirements.
The stakeholders' opinions, with regard to potential regulatory measures on the environmental impact of servers and data storage products, can be summarised as follows:
- the EU Member States cautiously welcomed the Commission work on potential ecodesign requirements for servers and data storage products; some concerns on the enforceability of some of the proposed material efficiency requirements were raised.
- standardisation organisations were supportive throughout the process, in particular with the development of a testing standard
- industry main players, i.e, the most relevant stakeholders among manufacturers, were proactive and participative during the process. They highly supported, and actively contributed to, the work on a metric for the energy efficiency of server in active state. However, they expressed strong doubts on various other aspects, such as the quantitative requirements on idle power, the information requirement on the operating temperature and the material efficiency requirements.
- SMEs, mainly working in the field of installation, repair and IT services, judged as important most of identified energy efficiency and material efficiency requirements; they also raised concerns over the risk of increased costs of the products
- environmental and consumer NGOs, as well as repairers' organisation, welcomed the Commission work on potential ecodesign requirements for servers and data storage products.
Annex 3: Who is affected by the initiative and how
This annex explains the practical implications of a potential ErP regulation for servers and storage based on implementation of the preferred policy scenario 3.2.
Who is affected?
The regulations will apply to server and storage manufacturers, importers and authorised representatives. Since servers and storage are B2B products generally sold directly by the manufacturer, these will be the main group affected. As proposed requirement includes information on operating conditions and material efficiency requirement, the regulation would affect the data centres, data centre operators and installers, server and data storage product repairs as well as refurbishing and recycling companies. The SMEs sector of the industry that manufactures and assembles the final product would also be affected by the regulation; moreover, since more than 30% of the SMEs which answered the SME consultation indicated that they are involved in repair service, they would be expected to benefit from the material efficiency requirements.
How are they affected?
Manufacturer server and storage products will need to comply with the following requirements by the timeline (preferred policy scenario 3.2) summarised in the table below:
|
Scenarios
|
Requirement
|
Year
|
Servers
|
Storage
|
|
Option 3.2: Ecodesign requirements based on consultation with industry and experts
|
Information
|
2019
|
Idle and max mode power and PSU efficiency
|
PSU efficiency
|
|
|
ASHRAE class temperature and humidity
|
2019
|
Information on product operating temperature
|
Information on product operating temperature
|
|
|
PSU min. efficiency
|
2019
|
80Plus Gold
|
80Plus Gold
|
|
|
|
2023
|
80Plus Platinum
|
80Plus Platinum
|
|
|
|
2026
|
80Plus Titanium
|
80Plus Titanium
|
|
|
SERT metrics
|
2019
|
Information on server efficiency. See Section 4.4.4
|
-
|
|
|
Idle power
|
2019
|
Quantitative requirement on maximum idle power consumption. See Section4.4.3
|
-
|
|
|
Material efficiency
|
2019
|
Design for disassembly, data deletion, firmware update, CRM information.
See Section 4.4.6
|
Design for disassembly, data deletion, firmware update, CRM information.
See Section 4.4.6
|
Summary of costs and benefits
For the preferred option 3.2,
Table 42
and
Table 42
, below, present systematically the costs and benefits which will have been identified and assessed during the impact assessment process.
Table 41 Overview of Benefits (total for all provisions) – Preferred Option (3.2)
|
I. Overview of Benefits (total for all provisions) – Preferred Option (3.2)
|
|
Description
|
Amount
|
Comments
|
|
Direct benefits
|
|
Energy savings
|
3.2Twh
|
Energy savings at product (server and data storage product) level
|
|
Material efficiency improvements
|
10% increase in the recovery rate (both reuse and recycle) of servers and data storage products
|
Total benefit stemming from the implementation of the four proposed material efficiency requirements (disassembly, firmware availability, data deletion software and CRM information) described in chapter 5.3.3
|
|
Awareness on environmental aspects of servers and data storage products
|
Much improved
|
For quantitative analyses, please refer to Annex 4, in the 'effect of information requirements' section.
|
|
Extra revenues for OEM
|
59MEur
|
As from estimates of chapter 5.2
|
|
Extra revenues for OEM
|
41MEur
|
As from estimates of chapter 5.2
|
|
Indirect benefits
|
|
Energy savings
|
5,7Twh
|
Energy savings at infrastructure (i.e. data center/server room) level
|
Table 42 Overview of costs – Preferred option (3.2)
|
II. Overview of costs – Preferred option (3.2)
|
|
Reason
|
Cost
|
Affected stakeholder
|
|
Improvement cost associated with achieving higher PSU efficiency (for servers and data storage products)
|
- €10 per PSU unit to improve from 80 PLUS class Silver to Gold
- €17 from Gold to Platinum and € 23 to achieve Titanium
|
Business
|
|
Improvement cost associated with increased operating temperature (for servers and data storage products)
|
Cost associated with improving operating temperature is assumed € 150 per sale unit, which is approx. the price of a high performance fan kit
.
|
Business
|
|
Improvement cost associated with idle power reduction (for servers)
|
an additional of 0.2% up to 0.35% of the server price for improving CPU efficiency
|
Business
|
|
Testing cost (for servers)
|
- SERT metric: approx. €21,000 per company with 15 server models for SMEs. For large companies, it is estimated that the testing cost would be approx. €30,000 per company, for companies with 25 server models
- operating condition: approx. €1,000 per unit
|
Business
|
|
Testing cost (for servers)
|
- SERT metric approx. €1,100 per unit
- operating condition: approx. €1,000 per unit
|
Market Surveillance authorities
|
|
Cost associated to material efficiency requirements
|
The Cost associated with material efficiency requirements is estimated to be dominated by acquiring data deletion software and hosting firmware update on website. The maximum cost of data deletion software is € 2 - 4 per drive
, which may be much cheaper for large companies; the price will be decreasing as more software become available. It costs as little as less than € 1 to host firmware for 10 years
, therefore the estimated cost for material efficiency requirement is approx. € 8 per server or storage product.
|
Business
|
|
Costs related to the enforcement of the Ecodesign Regulation
|
Market surveillance cost
|
Market Surveillance authorities
|
See more details about cost assumptions in Annex 4.
Annex 4: Inputs, assumptions, calculations
Sales and stock
For the market estimation, a so-called “stock model” is used to estimate the EU stock of servers and storage products from sales data (2011 to 2012 for servers and 2012 to 2014 for storage) supplied by industry stakeholders. The stock model assumes a normal distribution with lifetime as the median and 1 as standard deviation. For servers, a lifetime of 5 years is assumed, and storage 7 years. Historic sales from 2000-2009 are assumed to be the same as 2010 as there was no reliable data before 2010. These are mainly used to ensure the model is in steady state as the typical lifetime of servers and storage vary between 5 to 7 years and the uncertainty of sales before 2010 only impacts total energy consumption figures and stock to a small degree, while it has no impact on the energy saving estimates.
For the servers, the preparatory study8 sales figures for blade, rack tower and multinodes servers have been used to establish the distribution of sales between the server types, and the sales figures for 1 socket, 2 sockets and 3- 4 sockets etc. It is assumed that 3 sockets are extremely uncommon, so the sales would distribute only to 4-sockets servers. See tables below.
Table 43 Distribution of sales by server types 2010-2013
|
|
Blade
|
Rack
|
Tower
|
Multinode
|
|
2010
|
16%
|
76%
|
7%
|
1%
|
|
2011
|
15%
|
75%
|
8%
|
3%
|
|
2012
|
14%
|
72%
|
7%
|
6%
|
|
2013
|
14%
|
71%
|
7%
|
8%
|
Table 44 Distribution of sales by number of sockets 2010-2013
|
|
1 socket
|
2 sockets
|
4 sockets
|
|
2010
|
22%
|
74%
|
4%
|
|
2011
|
23%
|
73%
|
4%
|
|
2012
|
23%
|
73%
|
4%
|
|
2013
|
24%
|
73%
|
4%
|
As the sales figures supplied by Digital Europe is representing 77% of the EU market, the sales figures have been scaled up to 100% to represent the whole EU market. There is no similar percentage given about sales figures of data storage products, therefore it is not scaled up, which may lead to an underestimation of the number of devices estimated; for this reason, the figures on data storage products are considered a conservative estimate.
For data storage products, sales figures for Online 1 and 2, Online 3, Online 4, Online 5 and 6 have been supplied by Digital Europe via The Green Grid (TGG). It is assumed that 40% of the sales for Online 1 and 2 are actually Online 2 products, based on preparatory study findings.
Annual growth rates are mainly obtained through the preparatory study8 by finding the difference between the sales from the previous year and by expert estimation for both servers and storage products. For servers, given that before 2010 there was no actual sales data obtained, it was assumed the same sales as for 2010. For data storage products, sales in 2000 are a rough estimation based on experts judgement, and sales between 2000 and 2010 were then interpolated. See the tables below for specific annual growth rates after 2016.
Table 45 Annual growth rates assumed for servers and storage based on preparatory study sales data, industry sales data and expert estimation
|
Type
|
2010 and before
|
2011
|
2012
|
2013
|
2014
|
2015
|
2016
|
2017
|
2018 and after
|
|
Tower 1 socket
|
0%
|
14%
|
-10%
|
-5%
|
0%
|
0%
|
-3%
|
-3%
|
-3%
|
|
Rack 1 socket
|
0%
|
6%
|
-5%
|
-3%
|
0%
|
0%
|
1%
|
1%
|
1%
|
|
Rack 2 socket
|
0%
|
1%
|
-3%
|
-6%
|
0%
|
0%
|
4%
|
4%
|
4%
|
|
Rack 4 socket
|
0%
|
-1%
|
-14%
|
-11%
|
0%
|
0%
|
4%
|
4%
|
4%
|
|
Rack 2 socket resilient
|
0%
|
2%
|
-5%
|
-6%
|
0%
|
0%
|
4%
|
4%
|
4%
|
|
Rack 4 socket resilient
|
0%
|
2%
|
-5%
|
-6%
|
0%
|
0%
|
4%
|
4%
|
4%
|
|
Blade 1 socket
|
0%
|
5%
|
-14%
|
-4%
|
0%
|
0%
|
1%
|
1%
|
1%
|
|
Blade 2 socket
|
0%
|
-1%
|
-12%
|
-7%
|
0%
|
0%
|
4%
|
4%
|
4%
|
|
Blade 4 socket
|
0%
|
-2%
|
-19%
|
-10%
|
0%
|
0%
|
4%
|
4%
|
4%
|
|
Online 2 storage
|
Interpolation
|
-8%
|
-9%
|
7%
|
4%
|
-1%
|
1%
|
2%
|
2%
|
|
Online 3 storage
|
Interpolation
|
-8%
|
-9%
|
-9%
|
-6%
|
-1%
|
1%
|
2%
|
2%
|
|
Online 4 storage
|
Interpolation
|
-8%
|
-9%
|
15%
|
-6%
|
-1%
|
1%
|
2%
|
2%
|
Virtualisation for servers and proportion cloud vs non-cloud
In addition to the base cases, the servers are split into traditional and cloud applications. This is not a strict definition but it is used to distinguish between servers with higher utilisation through cloud, High-performance computing (HPC) or highly virtualised environments and mainly very large cloud / hyperscale data centres. Traditional servers are less highly utilised and may not be virtualised or less highly virtualised. Under both cases, the virtualisation ratio is expected to increase over time as servers become more powerful.
All one socket servers are assumed to be operated in traditional data centres. Small companies can also have one socket servers, but they are assumed to operate servers either in traditional data centres, or very similar conditions.
The overall sales split between cloud and traditional is based on the CISCO Global Cloud Index forecast and methodology 2016-201998. The CISCO report uses the concept of workloads to calculate how much of the real work is being processed and delivered by cloud services. Because an individual cloud server is utilised more efficiently, the average number of workloads processed by the server is higher (when compared to a server for traditional application). The number of workloads per server is also projected in the CISCO report (
Table 46
). These are used to model the number of servers, and we expect the proportion of traditional servers to be higher than the proportion of workloads completed.
Table 46 Average workload per server for server sales
|
|
Traditional applications
|
Cloud applications
|
|
2010
|
2.2
|
7.3
|
|
2015
|
3.5
|
11.9
|
Based on this shift forecast for the stock, the shift in sales is assumed to occur 4 years earlier (see
Table 47
for the percentage shift).
Table 47 Percentage shift in sales between traditional and cloud applications
|
|
Traditional applications
|
Cloud applications
|
|
2010
|
58%
|
42%
|
|
2011
|
52%
|
48%
|
|
2012
|
46%
|
54%
|
|
2013
|
40%
|
60%
|
|
2014
|
35%
|
65%
|
|
2015
|
30%
|
70%
|
In 2000 it is assumed that 100% of servers are in traditional data centres and that the proportion changes linearly over time between 2001 and 2009.
Beyond 2016, it is assumed that the sales proportion of traditional to cloud servers is unchanged at 30:70. This is based on the proportion of workloads being split between traditional and cloud is 11:89, i.e. approximately 89% of all data processed and transmitted is coming from the cloud. This is a very high proportion and it is not expected that it will increase further by a large amount. There are a number of factors which will always restrict some workloads to lower utilisation or to traditional servers. as the need for high availability or backup sites requires servers or entire data centre sites to be operational but idle and ready to take over in the event of a disaster. Furthermore, low latency mainly for the financial sector requires smaller distances to the data centre, which cloud services may not comply with and strict company data protection policy requirements may not allow use of cloud services. Moreover, legacy applications, or simply inertia, particularly from smaller customers and users, also mean that workloads are not transferred to cloud environments. In addition, future networks are more likely to need edge servers ('Fog computing') which may not be as highly utilised, e.g. in light of the expected growth in data from new uses such as Internet of Things.
A utilisation percentage is applied to the servers, because utilisation is linked to the number of workloads but also the performance on the server. Since the number of CPU cores, RAM and storage is increasing rapidly, utilisation does not rise as quickly.
For traditional servers, the utilisation is 10% from 2000-2010, reflecting the very low interest and knowledge of virtualisation and similar technologies. This increases slowly at 1% a year to 30% utilisation in 2020. It remains at 30% until 2030. Except rack 1-socket servers, they are not virtualised much and growing very slowly, so it slowly reaches 30% by 2030.
For cloud servers, the utilisation starts at 35% in 2010 but increases at 2.5% a year until it reaches 60% in 2020. It remains at 60% until 2030.
Servers power consumption
Power consumption for servers is based on the base cases provided by Digital Europe38. Typical configurations for the base cases have been used and an average consumption interpolated from the max and idle consumption is used to calculate the annual energy consumption.
Power consumption is assumed to be unchanged from 2000-2010. From 2010 power tends to fall as the industry placed more focus on efficiency. Power is assumed to fall linearly from 2015 to 2020, with idle reducing by 30% and maximum power by 10%. This is based on the historic improvement trend and current BAT data centre performance from a variety of sources and assumptions including confidential data.
The power is then unchanged from 2020 to 2030. During the period it is assumed that the performance of the average server for each base case continues to change and improve rather than reducing power further. This is because data centres are generally designed for the current power consumption and power density of server racks, and therefore allows the space and available power to be best utilised. Discussions with industry have suggested that based on the current data centre designs, the current server power levels trend seem to give an optimum balance between computing/energy density, cooling and other operating factors. Increasing the power within the same physical space would result in higher temperatures and require more efficient cooling techniques which are hard to achieve with current air-cooled designs, since the volume of air needed would be higher, or the air temperatures lower. This means it is harder to achieve ASHRAE Class A3 or even A2 and results in more inefficiency. More radical designs, such as liquid cooling may achieve this, but most designs proposed would require significant investment to retrofit existing data centers as well as sourcing servers warrantied for this type of operation, and are therefore not considered.
It is assumed that there is a linear relationship between utilisation and power consumption. The power is then calculated based on the estimated utilisation levels of the traditional and cloud servers. While the preparatory study applies two modes, for in use and idle, they have been aggregated in this model for simplicity, which for the purpose of this study is assumed not to have any impact of the results.
The average power consumption for different base cases of servers used for calculating the annual energy consumption is presented in the table below.
Table 48 Estimated server average power consumption development 2000-2030 in kW
|
Server type
|
Application
|
2000
|
2005
|
2010
|
2015
|
2020
|
2025
|
2030
|
|
Tower 1 socket
|
Traditional
|
0.083
|
0.083
|
0.067
|
0.051
|
0.043
|
0.043
|
0.043
|
|
|
-
|
|
|
|
|
|
|
|
|
Rack 1 socket
|
Traditional
|
0.105
|
0.105
|
0.079
|
0.064
|
0.058
|
0.061
|
0.065
|
|
|
-
|
|
|
|
|
|
|
|
|
Rack 2 socket
|
Traditional
|
0.218
|
0.218
|
0.193
|
0.154
|
0.146
|
0.146
|
0.146
|
|
|
Cloud
|
0.218
|
0.239
|
0.238
|
0.192
|
0.187
|
0.187
|
0.187
|
|
Rack 4 socket
|
Traditional
|
0.440
|
0.440
|
0.280
|
0.399
|
0.398
|
0.398
|
0.398
|
|
|
Cloud
|
0.440
|
0.490
|
0.455
|
0.549
|
0.555
|
0.555
|
0.555
|
|
Rack 2 socket resilient
|
Traditional
|
0.650
|
0.650
|
0.604
|
0.515
|
0.379
|
0.379
|
0.379
|
|
|
Cloud
|
0.650
|
0.650
|
0.604
|
0.515
|
0.379
|
0.379
|
0.379
|
|
Rack 4 socket resilient
|
Traditional
|
0.640
|
0.640
|
0.598
|
0.566
|
0.526
|
0.526
|
0.526
|
|
|
Cloud
|
0.640
|
0.690
|
0.699
|
0.679
|
0.651
|
0.651
|
0.651
|
|
Blade 1 socket
|
Traditional
|
0.086
|
0.086
|
0.080
|
0.072
|
0.064
|
0.067
|
0.070
|
|
|
-
|
|
|
|
|
|
|
|
|
Blade 2 socket
|
Traditional
|
0.284
|
0.284
|
0.262
|
0.225
|
0.219
|
0.219
|
0.219
|
|
|
Cloud
|
0.284
|
0.314
|
0.321
|
0.295
|
0.293
|
0.293
|
0.293
|
|
Blade 4 socket
|
Traditional
|
0.640
|
0.640
|
0.604
|
0.586
|
0.549
|
0.549
|
0.549
|
|
|
Cloud
|
0.640
|
0.690
|
0.711
|
0.714
|
0.690
|
0.690
|
0.690
|
Storage power consumption
Power consumption for storage is based on power data from industry stakeholders, who provided information on idle, idle storage capacity per unit idle power (GB/W) and maximum power. 2013 power consumption is based on the Digital Europe base cases.
Analysis shows that idle power is closely related to the number of drives, while idle GB/W is related to the type and capacity of each drive. The difference between idle and max power is not very large, suggesting there is limited power management occurring or possible.
The model is based on the idle power since this is the most complete data and allows energy consumption to be calculated. There is no information to suggest storage operates close to the max power. While demand for storage is expected to increase exponentially, the actual change in power consumption is slower. Changes to hard drive technology, in particular increasing areal density or hard drives, and rapid developments in SSD competing with performance enterprise has given rationale for the power consumption projections
Therefore, power consumption is assumed to increase by 12% from 2013 to 2014 but slows down to 2% by 2020 and continues at that rate.
Table 49 Estimated storage average power consumption development 2000-2030 in kW
|
|
2000
|
2005
|
2010
|
2015
|
2020
|
2025
|
2030
|
|
Online 2
|
0.400
|
0.400
|
0.400
|
0.493
|
0.616
|
0.681
|
0.751
|
|
Online 3
|
0.450
|
0.450
|
0.450
|
0.554
|
0.693
|
0.766
|
0.845
|
|
Online 4
|
1.750
|
1.750
|
1.750
|
2.156
|
2.697
|
2.977
|
3.287
|
PSU efficiency distribution
80PLUS efficiency classification have been used for PSU market distribution, i.e. the percentage of PSUs on the market at a given year that can achieve the different 80 PLUS classes. Average PSU efficiency was calculated based on the requirements for each 80Plus certification class, see
Table 51
for the average efficiency.
Table 50 80Plus classification minimum requirements for PSU efficiency
|
80 PLUS class
|
10%
|
20%
|
50%
|
100%
|
|
80 Plus Standard
|
-
|
80%
|
80%
|
80%
Power factor : 0.90
|
|
Bronze
|
-
|
82%
|
85%
Power factor : 0.90
|
82%
|
|
Silver
|
-
|
85%
|
88%
Power factor : 0.90
|
85%
|
|
Gold
|
-
|
87%
|
90%
Power factor : 0.90
|
87%
|
|
Platinum
|
-
|
90%
|
92%
Power factor : 0.95
|
89%
|
|
Titanium
|
90%
|
92%
Power factor >0.95
|
94%
|
90%
|
Table 51 Average PSU efficiency for 80Plus classification
|
|
Average efficiency, %
|
|
Efficiency class
|
Server (1 socket rack, tower)
|
Server (2 socket rack, blade)
|
Servers (2 and 4 socket rack, resilient)
|
Storage
|
|
Non-certified
|
71%
|
75%
|
74%
|
81%
|
|
80 Plus
|
74%
|
78%
|
77%
|
84%
|
|
Bronze
|
78%
|
82%
|
81%
|
87%
|
|
Silver
|
79%
|
83%
|
82%
|
89%
|
|
Gold
|
82%
|
86%
|
85%
|
91%
|
|
Platinum
|
87%
|
89%
|
89%
|
93%
|
|
Titanium
|
90%
|
92%
|
91%
|
95%
|
The PSU efficiency distribution was based on data regarding the 80Plus certification, stating that in 2015, 85% of computers were sold with 80Plus certified PSUs. This is taken into account when assuming that 75% of the servers and storage stock are can achieve at least 80 PLUS standard efficiency. The assumed PSU efficiency distribution in BAU for majority of the stock is based on the power supply outlook inputs from the industry stakeholders.
Table 52 Estimated PSU efficiency for servers and storage in BAU scenario
|
Product type
|
Efficiency class
|
2015
|
2020
|
2025
|
2030
|
|
Server (1, 2 socket rack, tower)
|
Non-certified
|
25%
|
20%
|
15%
|
10%
|
|
|
80 Plus
|
5%
|
1%
|
0%
|
0%
|
|
|
Bronze
|
5%
|
1%
|
0%
|
0%
|
|
|
Silver
|
60%
|
20%
|
10%
|
5%
|
|
|
Gold
|
5%
|
50%
|
20%
|
15%
|
|
|
Platinum
|
0%
|
5%
|
50%
|
20%
|
|
|
Titanium
|
0%
|
3%
|
5%
|
50%
|
|
Servers (4 socket rack, resilient and blade)
|
Non-certified
|
25%
|
20%
|
15%
|
10%
|
|
|
80 Plus
|
5%
|
1%
|
0%
|
0%
|
|
|
Bronze
|
5%
|
1%
|
0%
|
0%
|
|
|
Silver
|
60%
|
15%
|
5%
|
5%
|
|
|
Gold
|
5%
|
30%
|
15%
|
5%
|
|
|
Platinum
|
0%
|
30%
|
40%
|
30%
|
|
|
Titanium
|
0%
|
3%
|
25%
|
50%
|
|
Storage
|
Non-certified
|
25%
|
20%
|
15%
|
10%
|
|
|
80 Plus
|
5%
|
1%
|
0%
|
0%
|
|
|
Bronze
|
5%
|
1%
|
0%
|
0%
|
|
|
Silver
|
60%
|
20%
|
10%
|
5%
|
|
|
Gold
|
5%
|
50%
|
20%
|
15%
|
|
|
Platinum
|
0%
|
5%
|
50%
|
20%
|
|
|
Titanium
|
0%
|
3%
|
5%
|
50%
|
For each of the policy options, the share of the servers and storage with PSU efficiency lower than the requirement will shift to the required level or above, i.e. when minimum requirement is silver, all of the market share for non-certified, 80Plus and Bronze would gradually move to Silver, Gold, Platinum, and Titanium. In the modelling, it was assumed that the entire stock takes approximately 5 years (average product lifetime) after the implementation to be replaced fully with PSUs that meet the requirements.
Modelling of infrastructure energy consumption
For calculating the annual energy consumption including infrastructure such as cooling, a PUE (Power Usage Effectiveness) factor (which is the ratio of amount of energy used by data centre including cooling demand to the actual energy consumption of the servers and storage products in this assessment) of 1.8 was used for 2015 based on industry inputs and online sources , this is lower than the BAU scenario in the preparatory study, which assumed a PUE of 2. Expert estimates the PUE for Online 2 storage and traditional servers is likely to be in range of 2.5 – 3, and the rest of the servers and storage around 1.8. The PUE estimation was based on industry inputs, the average PUE factor for data centres is expected to decrease to 1.55 by 2030 and the PUE factors are linearly interpolated between 2015 and 2030. It was estimated that PUE factor was 2.5 in 2000 and the development between 2000 and 2015 was also linearly interpolated.
In addition to the data centre PUE figures, the proportion of servers in data centres of different sizes was projected based on US data and adjusted based on expert assumptions. The main change is reducing the proportion of very large data centers. This is because the US has a higher number and proportion of very large cloud/hyperscale data centres and internet companies. The four largest public cloud companies with over 75% of the public cloud market are headquartered in the USA and at the end of 2017, excluding IBM, they combined had 44 data centers in USA compared to 24 in Europe.
Table 53
shows the projected proportion of data centers in the present impact assessment report.
Table 53 Estimated data centre distribution in BAU scenario
|
Data centre type
|
2015
|
2020
|
2030
|
|
SME data centres
|
20%
|
15%
|
13%
|
|
Mid-tier/older data centres
|
18%
|
15%
|
12%
|
|
Enterprise/Colocation data centres
|
34%
|
40%
|
40%
|
|
Hyperscale/ Cloud data centres
|
28%
|
30%
|
35%
|
For the sensitivity analysis where the assumption of sales proportion of 30:70 traditional and cloud servers beyond 2016 were tested, it is projected that the distribution of workloads would increase to 5:95 for traditional vs cloud workloads and this is equivalent of 20:80 traditional and cloud servers in sales by 2020 and 15:85 proportion by 2030. See
Table 54
for the changes in the projected proportion of data centres for this sensitivity analysis. The associated PUE by 2030 is estimated 1.50.
Table 54 Estimated data centre distribution in sensitivity analysis for sales proportion of 20:80 traditional and cloud servers by 2020 and 15:85 by 2030
|
Data centre type
|
2015
|
2020
|
2030
|
|
SME data centres
|
20%
|
14%
|
10%
|
|
Mid-tier/older data centres
|
18%
|
12%
|
9%
|
|
Enterprise/Colocation data centres
|
34%
|
42%
|
42%
|
|
Hyperscale/ Cloud data centres
|
28%
|
32%
|
39%
|
For the policy scenarios, it was assumed that requirements were formulated as minimum AHSRAE performance or information, which was then modelled as PUE improvement. The associated PUE factors have been adjusted according to industry inputs121. It is assumed that approx. 30% of the data centres and servers equipment rooms would adopt the high operating temperature in policy scenario 3.2, as the SME survey90 indicates that approx. 20% expect that requirement on minimum operation conditions would lead to an increase in operating temperature. Our assumption takes into consideration the SMEs survey result, but also the fact that the majority of the market is covered (see
Table 53
) by bigger companies who have increasing focus on energy consumption, therefore 30% is a reasonable if not rather conservative assumption.
The PUE figures provided in this report are average figures for all of EU. This corresponds to all other figures used in Impact Assessments, which may be different from Member State to Member State e.g. the electricity prices. For the PUE, there are some dependency of the climatic conditions at the data centre locations regarding the cooling needs and the cooling system efficiency. Typically, the climatic conditions have only smaller impact on the PUE. The reason is that the proportion of the total data centre consumption for cooling is around 30 % and even with a variation of 30 % due to the climatic conditions between the warmest and the coldest locations in EU, the variations of an average PUE of 1.8, would be 1.65-1.95 i.e. plus minus 8-9 %. This is based on the following assumptions:
·PUE: 1.8 (average PUE of data centres used in this report)
·Breakdown of assumed power consumption:
·Critical IT: 56 %
·Rest: 44 %, and typically around:
·Cooling max. 30 % (of total DC consumption)
·UPS, networks etc. rest: 14 %
·Estimated variation of the cooling consumption between the colder and warmer locations of EU is based on an estimate of average temperature difference between outside temperature and required DC cooling air inlet temperatures.
Table 55 PUE factors associated with Operating conditions and rationale for each
|
Condition
|
PUE factor
|
Rationale
|
|
ASHARE A1
|
1.8 (BAU)
|
Most servers are A2 today but the average PUE of data centres are still 1.8.
|
|
ASHARE A2
|
1.45
|
When min. requirement is A2, the data centres will have confidence to use free cooling and operate in the A1 conditions.
|
|
ASHARE A3
|
1.30
|
When min. requirement is A3, the data centres will have confidence to use free cooling and operate in the A2 conditions.
|
|
ASHARE A4
|
1.23
|
When min. requirement is A4, the data centres will have confidence to use free cooling and operate in the A3 conditions.
|
Effect of setting requirements on SERT-based metrics
Server efficiency has also been improving over time, resulting in power efficiency dropping by approximately 15-20% each generation. This has already been accounted for in the BAU scenario. Technology improvements are generally improving at the fastest possible rate (although lack of competition for Intel means that features are sometimes delayed) and it is unlikely it will be accelerated. The metric is described in
Annex 6: Proposed metrics requirements
.
There is a wide variation in server efficiencies within the current generation of servers, which can result in power consumption varying by a factor of four for the same performance, or 50 efficiency points. This variation encompasses all types and configuration of servers. This means that there is huge potential for improving efficiency; however, different configurations and form factors are designed for different purposes so it is not possible to achieve maximum efficiency in all cases.
It is assumed that minimum requirement and information of metrics available to users will not accelerate the development of new technologies but will allow users to purchase servers better matched and more efficient for the required purpose.
The current data shows that the most efficient servers are the more highly configured servers. While each server uses more energy, the increased performance means that fewer servers are needed in total. Within a class of servers, the variation in efficiency is approximately 15 points.
It is assumed that minimum requirement improves efficiency on average (i.e. across the whole stock of servers) by 3 points, information improves efficiency by 2 points.
Based on these assumptions it is possible to calculate the energy consumption reduction presented in the tables below and this is achieved by reduction in the number of servers and increase in power.
Table 56 Percentage energy consumption reduction from only information requirement on metrics
|
Server type
|
Application
|
2019
|
2020
|
2021
|
2022
|
2023
|
2024
|
2025
|
2026
|
|
Tower 1 socket
|
Traditional
|
5.49%
|
4.78%
|
4.25%
|
3.81%
|
2.76%
|
1.78%
|
0.86%
|
0.00%
|
|
Rack 1 socket
|
Traditional
|
6.19%
|
5.31%
|
4.60%
|
4.16%
|
3.02%
|
1.94%
|
0.94%
|
0.00%
|
|
Rack 2 socket
|
Traditional
|
5.48%
|
4.77%
|
4.24%
|
3.80%
|
2.74%
|
1.75%
|
0.84%
|
0.00%
|
|
|
Cloud
|
4.50%
|
3.97%
|
3.62%
|
3.27%
|
2.34%
|
1.49%
|
0.71%
|
0.00%
|
|
Rack 4 socket
|
Traditional
|
4.24%
|
3.79%
|
3.43%
|
3.16%
|
2.23%
|
1.39%
|
0.65%
|
0.00%
|
|
|
Cloud
|
4.24%
|
3.79%
|
3.43%
|
3.16%
|
2.23%
|
1.39%
|
0.65%
|
0.00%
|
Table 57 Percentage energy consumption reduction from information and minimum requirement on metrics
|
Server type
|
Application
|
2019
|
2020
|
2021
|
2022
|
2023
|
2024
|
2025
|
2026
|
|
Tower 1 socket
|
Traditional
|
6.83%
|
5.95%
|
5.34%
|
4.72%
|
3.46%
|
2.26%
|
1.10%
|
0.00%
|
|
Rack 1 socket
|
Traditional
|
7.80%
|
6.65%
|
5.86%
|
5.16%
|
3.78%
|
2.46%
|
1.20%
|
0.00%
|
|
Rack 2 socket
|
Traditional
|
6.91%
|
6.02%
|
5.32%
|
4.79%
|
3.50%
|
2.27%
|
1.11%
|
0.00%
|
|
|
Cloud
|
5.67%
|
5.05%
|
4.52%
|
4.18%
|
3.04%
|
1.97%
|
0.95%
|
0.00%
|
|
Rack 4 socket
|
Traditional
|
5.32%
|
4.78%
|
4.33%
|
3.97%
|
2.85%
|
1.82%
|
0.87%
|
0.00%
|
|
|
Cloud
|
5.32%
|
4.78%
|
4.33%
|
3.97%
|
2.85%
|
1.82%
|
0.87%
|
0.00%
|
Effect of setting requirements on max idle power
The tables below show the values for the proposed idle power state allowances (under option 3.2).
Table 58 Proposed base idle state power allowances
|
Product type
|
Base idle state power allowance, Pbase (W)
|
|
1-socket servers
|
25
|
|
2-socket servers
|
38
|
|
Blade or multi-node servers
|
40
|
Table 59 Proposed additional Idle Power Allowances for Extra Components
|
System characteristics
|
Applies to
|
Additional idle power allowance
|
|
CPU Performance
|
All servers
|
1 socket: 10 × CPUperf W
2 socket: 7 × CPUperf W
|
|
Additional power supplies
|
Power supplies installed explicitly for power redundancy
|
10 W per power supply
|
|
Drives (HDD or SSD)
|
Per installed HDD and SSD
|
4.0 W per HDD and SSD
|
|
Additional memory
|
Installed memory greater than 4 GB
|
0.12 W per GB
|
|
Additional buffered DDR channel
Additional I/O devices
|
Installed buffered DDR channels greater than 8 channels
Installed devices greater than two ports of ≥ 1 Gbit, onboard Ethernet
|
4.0 W per buffered DDR channel
|
|
|
|
< 1 Gb/s: No Allowance
|
|
|
|
= 1 Gb/s: 2.0 W / Active Port
|
|
|
|
> 1 Gb/s and < 10 Gb/s: 4.0 W/ Active Port
|
|
|
|
≥ 10 Gb/s and <25Gb/s: 15.0 W/Active Port
|
|
|
|
≥ 25 Gb/s and <50Gb/s: 20.0 W/Active Port
|
The saving from max idle power is calculated by finding how much the average idle power is reduced based on Energy Star data and SERT data after filtering the servers which exceeds the max idle power. The average idle power drops by 21%, assuming 15% of server time is in idle mode, and this equates to ca. a 3.1% saving, which is slowly diminishing as the average idle power is decreasing due to the effect or policy and technology advancement (see the assumed development of saving in table below). This estimate (15% of server time in idle mode) is in agreement with industry data (according to which idle time is between 5-25% depending on average utilisation); it is however very conservative, when compared to the findings in literature presented in section 4.4.3 of this impact assessment (where much higher figures on the actual rate of server time in idle mode where given, in particular concerning the actual utilisation of these products in the EU market). This is a cautious approach in terms of evaluation of the expected energy savings, i.e. if the actual rate of server time in idle mode would be higher, the expected energy savings would increase accordingly (making the whole proposal for a Regulation on the environmental impact of servers more effective).
Table 60 Percentage energy consumption reduction from max idle power requirement
|
|
2019
|
2020
|
2021
|
2022
|
2023
|
|
All servers
|
3.1%
|
2.657%
|
2.214%
|
1.771%
|
1.329%
|
At the time of drafting this part of the report (first half of 2018) it has been estimated that 50%-65% of server configurations can already meet the proposed maximum idle state power requirement.
CO2 conversion factor and primary energy factor
A primary energy factor of 2.5 PJ/TWh is assumed. It can be noted that there is no one-to-one ratio between energy consumption and CO2 equivalent GHG emissions, because the CO2 conversion factor is assumed to decrease from 0.43 Mt CO2/TWh in 2000 to 0.39 Mt CO2/TWh in 2016 and to 0.34 Mt CO2/TWh by 2030, the same trend estimated in the impact accounting report. This is due to the increasing share of renewable energy present in the grid electricity in EU countries.
Effect of information requirements
In the BAU scenario all users will buy the average technology. In policy scenarios with information requirements on power consumption, PSU efficiency or SERT-based metrics, some users will buy more efficient servers according to their preference of energy efficiency in the decision-making process. According to a 2015 study on the Impact of Sustainability Information on Consumer Decision Making, “direct users” (who look actively for the information) were most strongly influenced by sustainability information. The study shows that for the 'direct users', the purchase intention rate increases on average 1.15 percentage points for each point increase in product “sustainability” score, reported on a zero-to-ten scale.
For servers the 'direct user' segment is assumed to constitute 30% of the market. The Energy Star Market penetration report from Q1-Q2 2015, states that the EU market penetration of Energy Star products on the server market is 28%185, . Furthermore the Corporate IT Buying Behavior & Customer Satisfaction Study from 2013 shows that energy and efficiency have become increasingly important concern areas for Business customers, with 20%-30% mentioning energy consumption or energy efficiency as important for their satisfaction with current servers.
The sustainability score is considered to be, in this assessment, the server energy efficiency, where level zero has the lowest efficiency, equal to that in the BAU scenario (Average technology), and level ten is the Best Available Technology (BAT). The increasing purchase probability with increasing sustainability (Energy efficiency) rating, can be seen in
Table 61
, which is developed based on the studies mentioned above. Hence, 1,2% of 'direct users' would buy a server with energy efficiency one level better than BAU, 2.3% would by servers two levers better etc. In total 63% of the 'direct users' would end up purchasing a server with higher energy efficiency than BAU level.
Table 61 Assumed increase in purchase probability and total sales due to increasing sustainability rating
|
|
BAU
|
|
BAT
|
|
Sustainability rating
|
0
|
1
|
2
|
3
|
4
|
5
|
6
|
7
|
8
|
9
|
10
|
|
Purchase probability
|
36.8%
|
1.2%
|
2.3%
|
3.5%
|
4.6%
|
5.8%
|
6.9%
|
8.1%
|
9.2%
|
10.4%
|
11.5%
|
|
Share of total sales
|
81.0%
|
0.3%
|
0.7%
|
1.0%
|
1.4%
|
1.7%
|
2.1%
|
2.4%
|
2.8%
|
3.1%
|
3.5%
|
Since only 30% of servers are assumed to be purchased by 'direct users', 63% corresponds to 19% of all users purchasing a server with better energy efficiency, while 81% would still buy the average efficiency server.
Upcoming trends in the IT sector and their effect on the modelling assumption of this impact assessment
At the time of drafting this part of the report (i.e. first half of 2018), very recent trends (on top of the ones already described in section 1.1) are gradually gaining momentum – or are expected to gain it in the upcoming years - in the IT sector, notably the ‘fog computing’ and the ‘blockchain’.
'Fog computing' is an expression created by the company Cisco, and refers to extending computing to the edge of the network. More in detail, it means a decentralized computing infrastructure in which data, compute, storage and applications are distributed (e.g in computers at the proximity of users) in the most logical and efficient place between the data source and the cloud computing for achieving local process and storage, and reducing the amount of network transmission and latency.
A blockchain refers to a ‘cryptographically secured distributed ledger with a decentralized consensus mechanism’, typically used to record transactions, such in the case of the so called ‘cryptocurrencies’, across many computers so that the record cannot be altered retroactively without the alteration of all subsequent blocks and the collusion of the network. Despite its increasing popularity, doubts remain over the scalability, security and public acceptance of the blockchain technology. In particular, problems could be expected with energy consumption and transaction times for blockchains secured by a 'proof-of-work' algorithm, which is the principle behind the energy-intensive 'mining' of cryptocurrencies: the ‘miners’, i,e. the servers involved in the computations linked to the blockchain, contribute (by means of their computational power which is made available, quite often in exchange of newly minted cryptocurrency) to solve a complex mathematical puzzle that is part of the blockchain. The miners typically operate in large decentralised networks, can be energy-intensive and associated with slower transaction speeds.
Both trends are currently far from being stabilised in their evolution and market penetration; it is therefore very difficult – if not impossible - to make reliable forecasts on their effect(s), in particular concerning the measures analised in the present impact assessment.
Concerning the blockchain, if its market penetration will increase significantly, it could be expected that this will cause an increase of transactions over the internet, as well as of the energy consumption at product (i.e. server) level, due to the increased use of the miners for the computational work. In particular for the second aspect (increased use of servers as miners), having an Ecodesign regulation limiting the environmental impact at product level would certainly be beneficial.
Concerning the fog computing, two effects could potentially be expected, in case this emerging trend will be confirmed in the upcoming years. First, fog computing would certainly impact the network traffic. Second, fog computing is more likely to need edge servers, than other approaches such as the cloud computing; edge servers may not be as highly utilised as e.g. the servers in hyperscale data centers, with a relevant share of their operational life spent in idle mode. From this point of view, having an Ecodesign regulation limiting – among others – the energy consumption in idle mode would certainly be beneficial.
Finally, a legislative initiative at EU level, i.e. the 'Free flow of non-personal data' (described in Annex 11) could potentially have effects at system level, i.e. at data center level. Again, it is very difficult to make reliable forecasts, in particular because the initiative is still (at the time of writing this part of the impact assessment, i.e. first half of 2018) not finalised. Nevertheless, two potential effects are worth being mentioned. First, the easier switching of cloud service providers for professional users (which is one of the objectives of the 'Free flow of non-personal data' initiative) could imply a shift of computational work from SME data centers to cloud/hyperscale data centers, i.e from traditional to cloud workloads. A sensitivity analysis on the proportion of the cloud utilisation is presented in this impact assessment (see section 6.1.2), the conclusion being that, even in presence of a dramatic shift to cloud computing in the next years (i.e. even higher than the one already foreseen in the BAU option), the policy option 3.2 would be still effective, with significant energy savings. Second, it is expected that a free flow of data could have positive environmental impacts, as it would allow cloud service providers ‘to locate their data centres in locations where there are substantive energy efficiency gains to operate such infrastructures’, i.e typically locations in lower temperature zones. However, it is also recognised136 that ‘it is true that many factors play a role in the decision on where to situate a data centre (such as proximity to clients and access to a pool of human resources who have the skills to operate the data centre)’, in line with the information reported in this impact assessment19. In this context, having an Ecodesign regulation prescribing an information requirement on the product operating temperature, such as in the case of option 3.2, would in any case provide the customer with useful information on the product performance and reliability. In the case of option 3.3, it is foreseen to have the requirement on the product operating temperature as mandatory (i.e. only products capable to perform in a minimum operating temperature could be placed on the market). This requirement could result in an unnecessary burden in the event that, as an effect of the implementation of the 'Free flow of non-personal data', an actual ‘migration’ of data centers toward cold European regions (where it’s much less probable to have high operating temperatures in the data center) would occur (as said, the likelihood of this event is currently very difficult to predict).
COST ASSUMPTIONS (EXCEPT FOR MATERIAL EFFICIENCY ASPECTS)
Improvement cost for Operating conditions
Based on information from expert estimation, it is assumed that 150 EUR for a “high performance fan kit”, which can improve a server from A2 to A3. The same price is assumed form A3 to A4. No server was found for sale with less than A2 rating, so we assume no improvement cost from A1 to A2.
Improvement cost for PSU efficiency
The improvement cost for PSU is based on information received from Ecova and DigitalEurope:
Table 62 Improvement cost for PSU efficiency
|
Silver to gold
|
9.98 EUR
|
Extra cost for Gold PSU compared to silver
|
|
Gold to platinum
|
16.63 EUR
|
Extra cost for platinum PSU compared to gold
|
|
Platinum to titanium
|
23.28 EUR
|
Extra cost for titanium PSU compared to platinum
|
It was assumed that the improvement cost of levels below silver to gold is the same as the improvement cost from silver to gold (i.e. 9.98 EUR).
The improvement costs were estimated to be constant over the years, i.e. impact from inflation, technology development which reduces the cost over the years would more or less cancel each other out. It was assumed that with the PSU making up such small share of the total server price, the uncertainty would be negligible.
Improvement cost for setting SERT-based metrics requirement and maximum idle power
The SERT license costs around $2450, and it will need to be purchased, but for the large manufacturers they already have it since they are involved in SERT development. The main cost applies to SME manufacturers, who will buy it once and it will allow unlimited testing by the manufacturer. Therefore the license cost is presented in the report but negligible in terms of additional cost for improvement.
The cost for achieving higher metric efficiency is based on the assumption that a consumer will be sold the latest generation server and CPU with an optimal configuration, rather than a lower cost older generation server. These are shown below:
Table 63 Improvement cost for meeting SERT-based metrics requirement
|
|
Low performance
|
High performance
|
|
Performance
|
10
|
20
|
|
Average efficiency
|
30
|
50
|
|
Metric efficiency improvement
|
1.5
|
1.5
|
|
Energy savings
|
5%
|
3%
|
|
Additional CPU cost
|
1%
|
1%
|
|
Additional server cost
|
0.2% + 350 euro
|
0.35% + 600 euro
|
The costs were calculated based on Intel CPU cost data collected for the last three to four generations. The price difference was then compared to give an estimated cost difference between generations. It was found that there is virtually no price difference between the same model CPU from latest two generations, either during configuration of a server or purchasing the component separately. However, CPUs older than two generations were generally approximately 5-10% cheaper.
Limited data allowing the direct comparison of CPU efficiency for different generations, showed approximately a 15 point improvement in efficiency score. Using the high cost estimate, a linear scale is assumed and therefore a 1.5 point efficiency improvement entails a 1% higher cost. Since the CPU is approximately 20% of the total server cost for a low performance server and between 30-50% of a high performance server, this means the server costs increases by 0.2% and 0.35%. This is the same improvement cost assumed for complying with the max idle power requirement as the same technical improvement would be needed.
In addition, it is assumed that additional RAM is required to achieve the optimal efficiency configuration, 32GB (350euro) for low performance and 64GB (600euro) for high performance servers.
It is therefore assumed for every 1% of energy saving from BAU level, the server will cost approx. 135 euro additionally, which is the average of the additional server costs of a low performance and a high performance server. However, these costs are offset by the increased performance and the reduced number of servers required. This improvement cost is only applied to the Option 3.3 where minimum requirement of the metrics is proposed.
SERT testing cost assumptions
It is assumed that all companies have to do 2 configurations (high and low performance as proposed for the requirements) for each server model. There are 25 different models assumed for large companies, and 15 for SMEs, based on online research of company websites. Companies, in particular large ones, may carry out testing repetitions for quality checks; is it therefore assumed (and consequently factored in the total cost for testing for large companies), that large companies will repeat the testing 9 more times. It is presented in the report that testing cost per unit is around 200-300 euro, and therefore it is assumed 330 euro per unit for the large companies for the first test, and the repetition testing costs are considered much cheaper and assumed 30 euros per test because the test setup and configuration determination is done already for the first test. Commercial testing by laboratories costs 1100 euros per unit, it is therefore assumed that half SMEs carry out their own testing while half commission laboratories to test them. Lastly, it is assumed there are ca. 20 large companies and 100 SMEs (that put the final product on market) based on expert estimation due to the lack of exact data. This total cost is divided by the sold units in 2019 to obtain test cost per sale unit, which multiply by the sales of servers in scope of metrics requirement each year to find the total testing cost per year. As a result of these hypotheses, for SMEs it is estimated that the compliance cost would be €21,000 per company with 15 server models, and for large companies it is estimated that the compliance cost would be €30,000 per companies with 25 server models.
Operating condition testing cost assumptions
The testing costs for the operating condition are based on the cost of carrying out a thermal chamber test. As from estimates received from laboratories, this testing activity costs €680 per day, with an additional cost of preparation of €186 per hour. It is assumed that 2 hours of preparation and one day of testing would be needed, given that the prescribed test duration is 16h. The testing cost is therefore €1052 per unit.
Other economic assumptions
ODM or component sub-assembly cost of manufacturing or buying price is 93% (of price sold to OEM). ODM or component sub-assembly margin is 7% (of price sold to OEM). OEM buying price is 70% (of product price). OEM margin is 30% (of product price).
OEM revenue per employee in (million EUR/employee) is assumed 0.254 based on information from Eurostat. Size of ODM in terms of employee in comparison with OEM, currently we estimate 1.2 to 1 ratio. Estimate for typical product prices and a price increase per year of 2%.
ASSUMPTIONS ON MATERIAL EFFICIENCY ASPECTS
Inputs – material efficiency requirement on disassembly and on CRM
The environmental impacts of rack 2 socket servers and storage products have been found in the JRC report on material efficiency requirement of servers29 and EU Product Environmental Footprint Category Rules (PEFCR) report on data storage products. The authors of the JRC’ report largely collaborated with the team of the preparatory study for Lot 9 on servers and data storage products, and, as an effect, the data for environmental impacts are greatly aligned with data used in EcoReport tool. JRC’s environmental impacts result was used in this impact assessment for calculating additional savings along with the benefit rates of reuse and recycling presented in the report.
The BAU scenario presents the scenario where no material efficiency requirements will be set for servers and storage products, and it serves as a reference for the policy scenario, see assumptions in table below. The total recovery (reused and recycled) rate is assumed 85%. This assumption took into several considerations: firstly calculations based on Eurostat WEEE statistics showed that EU average for recovery out of the amount collected in tons is 83%, secondly industry stakeholders indicated that recovery rate is much higher than 75%, thirdly expert consultations indicated that 85% is a reasonable assumption, because although the servers and storage taken back to OEMs have a much higher recovery rate (~95%), the servers and storage that end up in public or private collection sites and recycling facilities may follow the same flow as OEMs but the recovery rate is not expected to be as high. Reuse and recycling rates presented below are based on inputs from Digital Europe.
Table 64 BAU recovery, reuse, recycling and disposal rates
|
BAU
|
Servers
|
Storage
|
|
Recovered (total of reused or recycling)
|
85.0%
|
85.0%
|
|
Reuse
|
59.5%
|
27.2%
|
|
Recycling
|
25.5%
|
57.8%
|
|
Disposal (incineration or landfill etc.)
|
15.0%
|
15.0%
|
In a policy scenario with proposed material efficiency requirements presented in Section 4.4.6, it is assumed that the recovery rate would be lifted to 95% from 85% in BAU scenario. For servers, reuse and recycling rates are increased proportionally, and for storage products, reuse rate is increased by 10% while recycling rate (as it is already quite high) remains at the same level. The assumptions took into several considerations: firstly industry stakeholders claim that recovery rate for servers and storage products taken back to OEMs via asset recovery or leasing programme is approx. 94% - 97%, secondly progressive recycling companies interviewed in Denmark claimed that 95% of the high-grade IT products are recovered (reused or recycled), thirdly proposed requirements for securing data deletion is carried out to a high standard and firmware availability for reused servers remove barriers for reusing storage products. See assumed recovery, reuse and recycling rates in table below.
Table 65 Policy scenario recovery, reuse, recycling and disposal rates
|
Policy scenario
|
Servers
|
Storage
|
|
Recovered (total of reused or recycling)
|
95.0%
|
95.0%
|
|
Reuse
|
66.5%
|
37.2%
|
|
Recycling
|
28.5%
|
57.8%
|
|
Disposal (incineration or landfill etc.)
|
5.0%
|
5.0%
|
An expert working in WEEE project in Denmark has been consulted along with summaries of interviews with a number of advanced recyclers in Denmark. High grade IT products such as computers, servers and data storage products in Denmark have a high recovery rate of 95 % (reused and recycled), however expert consultation indicated that the recovery rate for some other EU countries might not be as high, especially for servers and storage not part of the asset recovery / take back programme of the manufacturers. IT products can be difficult to open due to excessive amount of screws or use of materials that are glued tight together, this hinders valuable materials to be extracted. Finally, rare earth materials or critical raw materials (CRM) are typically not recovered before shredding. These barriers meant that there is a need for easy dismantling, reuse and recycling and recovery by ensuring that no gluing, welding fastening technique or excessive use of screws is used, and furthermore recovery of CRM and rare earth materials requires more incentives or a regulatory push to be realised. Other countries without such advanced recycling facilities could benefit from more guidance in extraction, dismantling procedures and the material contents, hence it could increase their recovery rates. During the review process of display regulation, recyclers expressed that a guide on dismantling and disassembly would be a good idea, Digital Europe expressed the same for server and storage in comments on the JRC report. However, design for easy dismantling is already done for a large share of server and storage products, the rest of products would need to change design for complying other ecodesign requirements anyway, therefore redesign cost should not be significant.
Consultation with industry indicated that servers and data storage products are highly valuable, and therefore they expect high recovery rate in this product group. For servers and data storage products taken back to the manufacturers as part of the leasing or asset recovery programme, their recovery rate is close to 100%. However industry has little knowledge in the end of life of servers and data storage products that are not taken back to the manufacturers, i.e. disposed or recycled through other channels. They estimate that the disposed (incinerated or landfilled) rate should be around 5 % - 10%. Based on consultation with industry, the average recycling, reuse and disposal rates for the EU in BAU scenario have been assumed, as from the previous tables. On the background of recovery rate in countries with progressive recycling companies such as Denmark and consultation with experts, it is assumed then the proposed material efficiency requirements could lift 10% of the recovery rate (with highest increase in reuse) to the level of 95% recovery rate.
A site visit to a Danish recycling company has been useful for understanding current reuse and recycling of servers and storage. It was confirmed that due to the sensitivity of data, hard disks and memories are often shredded, and the room for shredding is even prohibited for visiting. Apart from manual sorting of the known valuable parts of servers, the rest is sent or sold to subcontractors for shredding. There is little to no focus on the critical raw materials or rare earth materials during the recycling process, as there is no economic incentive due to the excessive costs it would be time-consuming to recover these. However the recycling company has mentioned that a German subcontractor company has equipment to more effectively sort out the metals and different materials after shredding. This does not necessarily support the requirement on CRM or design for easy dismantling, as the equipment collects valuable materials after shredding process. However during the 2016 Electronic Goes Green conference, experts in recycling sector have expressed that colour coding of CRM or other indication methods of easily identifying the content of CRM or rare earth material could be helpful during the sorting process.
Inputs – material efficiency requirements on data deletion and on firmware
The JRC report on material efficiency requirements for servers29 has been reviewed for assessing the rationale behind the proposed requirements and the authors have been contacted regularly to discuss the assumption for the effects of requirements and their experiences in consulting recyclers. The report identified (among others) two aspects that restrict reuse of servers and storage: availability of firmware and secure data deletion. A study from the Free ICT Europe Foundation (FIE) that without access to firmware updates developed by the OEMs, reuse operators cannot make components, servers or storage products to work as intended in their secondary lifetime, and therefore can only become e-waste. However the requirement of making firmware updates available does not mean that manufacturers should have to develop firmware for old products, but merely allow the most recent version of existing firmware and updates to be downloaded on a publicly available website – correspondingly to common practice for many consumer and small office/home office products.
Data storage devices such as HDDs, SSDs and memory cards cannot in practice be reused without securing data deletion, as servers and storage often contain sensitive data. Without a guarantee that these data would be able to be recovered, companies would not allow the data storage products to be reused. As an effect, quite often data destruction is ensured by recycling companies by repeatedly shredding the data storage devices, until it is physically impossible to get access to data.
Presentations at Electronics Goes Green 2016 from an American recycling company indicated that highly reliable data deletion standards are already available, and they are even used by the Department of Defence in the US. Furthermore there is more and more focus on protecting sensitive data, so there is a growing demand for data deletion certification, without which the companies would simply request the recycling companies to shred the components to ensure it. Currently, CENELEC is drafting a standard on preparation for reuse of electrical and electronic equipment, which describes that software and firmware and data sanitisation software required for reuse. Examples of data sanitisation standards, such as HMG IS Standard No.5 (UK), DIN 66399 (Germany) or NIST 800-88r1 (USA), have been mentioned. Free open source software as well as paid software such as WipeDrive can already comply with various international data deletion standards; software (not open source) costs approx. € 4 per wipe for SMEs, and likely much cheaper for larger enterprises. Furthermore, manufacturers such as Seagate have expressed intention to install data deletion tool when designing the data storage products. It is therefore assumed that the cost of incorporating data deletion software in servers and storage products, or making it available on a website, would not be significant, as the industry is leaning towards this solution and softwares are already available.
Based on consultation with JRC report authors, it is assumed that requirements on firmware availability and data deletion would remove much of the barrier for reusing servers, storage and components, therefore the reuse rate would grow sensibly, which JRC report authors estimate at about 5 -15%.
Cost assumptions
Potential requirement on disassembly
The majority of servers and storage products are already designed for easy disassembly, this is partially because they use commodity parts, so they have common interfaces to allow easy configuration, and gluing, welding and other more permanent fastening techniques would hinder this. Only a small portion of the market would need to change the design to comply with this requirement, and the cost of redesigning these products is judged as relatively small.
Potential requirement on data deletion
Software such as WipeDrive can already comply with various international data deletion standards, it costs approx. € 4 per wipe for small businesses, and likely much cheaper than € 4 for larger enterprises or data centres. It is therefore assumed average € 2 per wipe or drive for obtaining data deletion software. This multiplies 4 (assuming four drives per server) and 30% of servers and of storage products sold in 2019 to account for the share that would need data deletion software, it results in 10 million euros as a maximum compliance cost for EU manufacturers. 30% of servers and storage is assumed to need data deletion software based on the assumption that a large number of data centres would have their own wiping equipment already, and all large and hyper scale servers would not need the software due to the use of SSDs (which are set up encrypted), or would already have wiping software in place. To be noted that there is also open source free software that also claims to comply with US Department of Defence data deletion standard DoD 5220.22-M.
Potential requirement on firmware availability
To comply with requirement on making firmware updates available, the cost mostly lies in hosting firmware on a website as firmware was already developed for the existing products. A simple calculation is made for assessing cost of hosting firmware for 10 years, because the technical documentation for ecodesign is required to be available for 10 years after first placed on market and assuming second life extend the total lifetime of servers ( ~5 years) and storage products (~7 years) up to ~10 years. It is estimated that it costs € 0.2 to host a firmware for 10 years and 10 downloads per model.
Potential information requirement on CRMs
The practice of identifying the materials and substances contained and used in the products is not new to servers and storage products manufacturers, in particular due to the obligations of the RoHS Directive. The initial compliance costs should be already taken place since the introduction of RoHS (as well as REACH), therefore it is assessed that the cost of extending the practices to CRM should not be significant (an information requirement on the content of e.g. Neodymium, as assumed in the present impact assessment, is expected to be operationally implemented with IT solutions which should be already with the manufacturers, in order to show compliance with the RohS Directive). Moreover, it has to be noted that the proposed formulation for a potential information requirement on CRMs would not entail high administrative burden for manufacturers, as it would affect the content at component level (e.g the quantity of Neodymium in hard disk or of Cobalt in batteries), and the weight range per product (less than 5g, between 5g and 50g, above 50g) should be reported (rather than the specific quantity).
Annex 5: Definitions and glossary
Recommended definitions
Please note that the definitions hereby presented are the state-of-the-art when preparing this impact assessment, They may be subject to changes throughout the finalisation of potential regulatory measures on the environmental impact of servers and data storage products.
|
Energy Star v2 definition
|
ErP 617/2013 definition
|
Notes
|
Recommended definition
|
|
Computer Server: A computer that provides services and manages networked resources for client devices (e.g., desktop computers, notebook computers, thin clients, wireless devices, PDAs, IP telephones, other computer servers, or other network devices). A computer server is sold through enterprise channels for use in data centres and office/corporate environments. A computer server is primarily accessed via network connections, versus directly-connected user input devices such as a keyboard or mouse. For purposes of this specification, a computer server must meet all of the following criteria:
A. is marketed and sold as a Computer Server;
B. is designed for and listed as supporting one or more computer server operating systems (OS) and/or hypervisors;
C. is targeted to run user-installed applications typically, but not exclusively, enterprise in nature;
D. provides support for error-correcting code (ECC) and/or buffered memory (including both buffered dual in-line memory modules (DIMMs) and buffered on board (BOB) configurations).
E. is packaged and sold with one or more ac-dc or dc-dc power supplies; and
F. is designed such that all processors have access to shared system memory and are visible to a single OS or hypervisor.
|
‘Computer server’ means a computing product that provides services and manages networked resources for client devices, such as desktop computers, notebook computers, desktop thin clients, internet protocol (IP) telephones, or other computer servers. A computer server is typically placed on the market for use in data centres and office/corporate environments. A computer server is primarily accessed via network connections, and not through direct user input devices, such as a keyboard or a mouse;
A computer server has the following characteristics:
(a) is designed to support computer server operating systems (OS) and/or hypervisors, and targeted to run user-installed enterprise applications;
(b) supports error-correcting code (ECC) and/or buffered memory (including both buffered dual in-line memory modules (DIMMs) and buffered on board (BOB) configurations);
(c) is placed on the market with one or more AC-DC power supply(ies);
(d) all processors have access to shared system memory and are independently visible to a single OS or hyper visor;
|
ErP has already been cleared by lawyers, and includes essential definitions
|
‘Server’ means a computing product that provides services and manages networked resources for client devices, such as desktop computers, notebook computers, desktop thin clients, internet protocol (IP) tele-phones, smart phones, tablets, tele- communication, automated systems or other servers. A server is typically placed on the market for use in data centres and office and corporate environments. A server is primarily accessed via network connections, and not through direct user input devices, such as a keyboard or a mouse;
A server has the following characteristics:
(a) is designed to support server operating systems (OS) and/or hypervisors, and targeted to run user-installed enterprise applications;
(b) supports error-correcting code (ECC) and/or buffered memory (including both buffered dual in-line memory modules (DIMMs) and buffered on board (BOB) configurations);
(c) is placed on the market with one or more power supply(ies);
(d) all processors have access to shared system memory and are independently visible to a single OS or hypervisor;
|
|
Energy Star Definition
|
Notes
|
Recommended definition
|
|
A. Product Types:
1) Storage Product: A fully-functional storage system that supplies data storage services to clients and devices attached directly or through a network. Components and subsystems that are an integral part of the storage product architecture (e.g., to provide internal communications between controllers and disks) are considered to be part of the storage product. In contrast, components that are normally associated with a storage environment at the data centre level (e.g., devices required for operation of an external SAN) are not considered to be part of the storage product. A storage product may be composed of integrated storage controllers, data storage products, embedded network elements, software, and other devices. For purposes of this specification, a storage product is a unique configuration of one or more SKUs, sold and marketed to the end user as a Storage Product.
2) Storage Device: A collective term for disk drives (HDDs), solid state drives (SSDs), tapes cartridges, and any other mechanisms providing non-volatile data storage. This definition is specifically intended to exclude aggregating storage elements such as RAID array subsystems, robotic tape libraries, filers, and file servers. Also excluded are data storage products which are not directly accessible by user application programs, and are instead employed as a form of internal cache.
3) Storage Controller: A device for handling storage request via a processor or sequencer programmed to autonomously process a substantial portion of I/O requests directed to data storage products (e.g., RAID controllers, filers).
|
|
Data storage product' means A fully-functional storage system that supplies data storage services to clients and devices attached directly or through a network. Components and subsystems that are an integral part of the data storage product architecture (e.g., to provide internal communications between controllers and disks) are considered to be part of the data storage product. In contrast, components that are normally associated with a storage environment at the data centre level (e.g. devices required for operation of an external storage area network) are not considered to be part of the data storage product. A data storage product may be composed of integrated storage controllers, data storage products, embedded network elements, software, and other devices. A data storage product is a unique configuration of one or more stock keeping units, sold and marketed to the end user as a data storage product;
‘Data storage device’ means HDDs, SSDs, tapes cartridges, and any other mechanisms providing non-volatile data storage. This definition is specifically intended to exclude aggregating storage elements such as subsystems of redundant arrays of independent disks, robotic tape libraries, filers, and file servers. Also excluded are data storage products which are not directly accessible by user application programs, and are instead employed as a form of internal cache;
‘Online data storage product' means a data storage product designed for online, random-access of data. Online data storage products store user data accessible in a random or sequential pattern. The maximum time required to start receiving data from a storage system to satisfy a read request for arbitrary data (maximum time to first data) of an online data storage product is designed to be less than 80 milliseconds;
|
Glossary
· ‘Server with more than four processor sockets’ means a server containing more than four interfaces designed for the installation of a processor;
·‘Embedded application’ means a software application that permanently resides in an industrial or consumer device. Providing some type of control function and/or user interface, the software is typically stored in a non-volatile memory such as read-only memory or flash memory;
·‘Small data storage product’ means a portable data storage product intended for domestic use containing a maximum of one data storage product;
·‘Large data storage product’ means a high end or mainframe data storage product that product that supports more than 400 disks data storage products in its maximum configuration and with the following required attributes: no single point of failure, non-disruptive serviceability and integrated storage controller.
·‘Rack server’ means a server designed to be physically mounted and installed into a common rack framework.
·‘Socket’ means the connector on the motherboard that houses a CPU and forms the electrical interface and contact with the CPU.
·‘Managed server’ means a server that is designed for a high level of availability in a highly managed environment and must meet all of the following criteria: is designed to be configured with redundant power supplies; and contains an installed dedicated management controller (e.g., service processor).
·‘Unmanaged server’ means a server which does not meet the criteria for a managed server.
·'Blade server' means a server that is designed for use in a blade chassis. A blade server is a high-density device that functions as an independent server and includes at least one processor and system memory, but is dependent upon shared blade chassis resources (e.g., power supplies, cooling) for operation. A processor or memory module that is intended to scale up a standalone server is not considered a Blade Server.
·'Blade chassis' means an enclosure that contains shared resources for the operation of blade servers, blade storage, and other blade form-factor devices. Shared resources provided by a chassis may include power supplies, data storage, and hardware for direct current power distribution, thermal management, system management, and network services.
·'Resilient server' means a server designed with extensive reliability, availability, serviceability and scalability features integrated in the micro architecture of the system, CPU and chipset.
·'Multi-node server' means a server that is designed with two or more independent server nodes that share a single enclosure and one or more power supplies. In a multi-node server, power is distributed to all nodes through shared power supplies. Server nodes in a multi-node server are not designed to be hot-swappable.
·'Server appliance' means a server that is bundled with a pre-installed OS and application software that is used to perform a dedicated function or set of tightly coupled functions. Server appliances deliver services through one or more networks (e.g., IP or storage area network), and are typically managed through a web or command line interface. Server appliance hardware and software configurations are customized by the vendor to perform a specific task (e.g., name services, firewall services, authentication services, encryption services, and voice-over-IP (VoIP) services), and are not intended to execute user-supplied software.
·'Server product family' means a high-level description referring to a group of servers sharing one chassis and motherboard combination that may contain more hardware and software configurations. All configurations within a family must share the following common attributes:
a)be from the same model line or machine type;
b)either share the same form factor (i.e., rack-mounted, blade, pedestal) or share the same mechanical and electrical designs with only superficial mechanical differences to enable a design to support multiple form factors;
c)either share processors from a single defined processor series or share processors that plug into a common socket type;
d)share the power supply unit(s).
·'Power supply unit' (PSU) means a device that converts alternate current (AC) or direct current (DC) input power to one or more DC power outputs for the purpose of powering a server or a data storage product. A server or data storage product PSU must be self-contained and physically separable from the motherboard and must connect to the system via a removable or hard-wired electrical connection.
·‘Power factor’ means the ratio of the real power consumed in watts to the apparent, or reactive, power drawn in volt amperes.
·‘Non-redundant PSU’ means a PSU intended to be used in a server that is not designed for a redundant configuration
·‘Redundant PSU’ means a PSU designed and installed in a configuration capable of two or more PSUs, which provide alternative power routes to increase reliability.
·‘Idle state’ means the operational state in which the OS and other software have completed loading, the server is capable of completing workload transactions, but no active workload transactions are requested or pending by the system (i.e., the server is operational, but not performing any useful work).
·'Idle state power' (Pidle) is the power demand, in Watts, in idle state.
·‘I/O Device’ means a device, which provides data input and output capability between a server or a data storage product and other devices. An I/O device may be integral to the server motherboard or may be connected to the motherboard via expansion slots (e.g., PCI, PCIe).
·‘Motherboard’ means the main circuit board of the server. For purposes of this regulation, the motherboard includes connectors for attaching additional boards and typically includes the following components: processor, memory, BIOS, and expansion slots.
·‘Processor’ means the logic circuitry that responds to and processes the basic instructions that drive a server. For purposes of this regulation, the processor is the central processing unit (CPU) of the server. A typical CPU is a physical package to be installed on the server motherboard via a socket or direct solder attachment. The CPU package may include one or more processor cores.
·‘Memory’ means a part of a server external to the processor in which information is stored for immediate use by the processor.
·'Expansion card' means an internal component connected by an edge connection over a common/standard interface such as PCIe (Peripheral Component Interconnect Express) providing additional functionality. It does not include CPUs, RAM or storage modules.
·'Graphics card' means an expansion card containing one or more graphics processing units with a local memory controller interface and local graphics-specific memory
·'Buffered DDR channel' means a channel or memory port connecting a memory controller to a defined number of memory devices in a server. A typical server may contain multiple memory controllers, which may in turn support one or more buffered DDR channels. As such, each buffered DDR channel serves only a fraction of the total addressable memory space in a server.
·'Hard Drive' (HDD) means the primary computer data storage product which reads and writes to one or more rotating magnetic disk platters;
·‘Solid State Drive’ (SSD) means a data storage product that uses memory chips instead of rotating magnetic platters for data storage.
·'Buffered DDR channel' means a channel or memory port connecting a memory controller to a defined number of memory devices in a server. A typical server may contain multiple memory controllers, which may in turn support one or more buffered DDR channels. As such, each buffered DDR channel serves only a fraction of the total addressable memory space in a server.
·‘Low-end performance configuration’ of a server product family means the combination of two 10,000 rpm HDDs, processor with the lowest product of core count and frequency and memory capacity (in GB) equal to 0.5 to 0.75 times the product of the number of CPUs, cores and hardware threads that represents the lowest performance product model within the product family.
·‘High-end performance configuration’ of a server product family means the combination of two SSDs, processor with the highest product of core count and frequency and memory capacity (inGB) equal to 1.0 to 2.0 times the product of the number of CPUs, cores and hardware threads that represents the highest performance product model within the product family.
·'Hardware thread': means the hardware resources in a CPU core to execute a stream of software instructions. A CPU core may have the resources to execute more than one thread simultaneously.
·'Server efficiency' means the ration between server performance and server power demand in active state
·'Active state' means the operational state in which the server is carrying out work in response to prior or concurrent external requests (e.g., instruction over the network). Active state includes active processing and data seeking/retrieval from memory, cache, or internal/external storage while awaiting further input over the network.
·'Server performance' means the number of transactions per unit of time performed by the server under standardised testing of discrete system components (e.g. processors, memory and storage) and subsystems (e.g. RAM and CPU).
·'Secure data deletion' means the effective erasure of all traces of existing data from a data storage device, overwriting the data completely in such a way that access to the original data, or parts of them, becomes infeasible for a given level of effort.
·'Built-in functionality' means a functionality that does not require the installation or usage of additional software or hardware components not already present in the server or data storage product.
Annex 6: Proposed metrics requirements
Because servers provide a wide variety of services, the energy consumption and efficiency, can vary depending on the server configuration and service. Since it is not possible to measure efficiency under every configuration and scenario, the metric is designed to capture the general energy efficiency of a single server rather than represent any specific use-case.
The proposed requirements for the active state efficiency of servers are based on a metric, which is also incorporated in a European standard (EN 303470: ‘Environmental Engineering (EE); Energy Efficiency measurement methodology and metrics for servers’). The metric is based on the results from the SERT testing tool, which measures the power consumption and performance of the server under a variety of different worklets designed to test different workloads, CPU, memory and storage. For each worklet, the power and performance is tested at different load levels which allows efficiency to be measured under partial load conditions, which are more representative of real life situations.
Table 66 Worklet names and associated workloads and load levels
The final metric combines the power and performance test results at different utilisation levels and for different worklets to produce a final efficiency score. The formulae use the geometric mean (geomean) which is calculated by multiplying the values, rather than the more common arithmetic mean which adds the values together.
Stage 1 : Calculating the efficiency for each worklet
At the worklet level, the efficiency calculation is for a worklet with n utilisation levels is:
Since each worklet has a different number of utilisation levels, this needs to be taken into account.
Stage 2: Calculating the efficiency for each workload
For each workload, the subset of worklets given below are combined using the geometric mean of the worklet efficiency results (
Table 66
) to calculate the workload efficiency.
CPU workload – Compress, CryptoAES, LU, SHA256, SOR, SORT and SSJ worklets (n=7)
Memory workload – Flood and Capacity worklets (n=2)
Storage workload – Random and sequential worklets (n=2)
Stage 3: Combining workload components into an average server efficiency metric
The server average efficiency metric is calculated as the geometric mean of the workload efficiency, weighted based upon typical server work ratio of 65:30:5 CPU:Memory:Storage to according to industry recommendations.
Setting MEPS targets (under option 3.3)
Figure 10
below shows the performance and efficiency score, based on the low utilisation metric, for different server types and over different generations. Only optimal configurations are shown. This shows that a large step in performance and efficiency is made between each generation. It is also clear that the data dispersion in
Figure 10
is quite high, therefore data on more server generations should be included in order to derive a robust correlation between performance and efficiency. Since MEPS will most likely not come into effect before 2019, it is expected that efficiency will continue to make improvements and for the target to be effective, this must be taken into account. However, based on industry and independent analysis, the pace of improvements is not expected to continue at the same rate and therefore the MEPS targets are set at efficiency levels reached by the 2014 server generation, which are the most recent servers for which information is available. Bearing in mind the caveat concerning the data dispersion, based on
Figure 10
the quantitative requirements of
Table 67
on the server efficiency in active state are proposed (for inclusion under option 3.3).
Table 67 Proposed MEPS levels for server efficiency
|
1 socket
|
2 socket
|
4 socket
|
|
Rack
|
Tower
|
Low performance
|
High performance
|
|
|
100
|
150
|
150
|
200
|
200
|
Figure 10 Performance and efficiency score, for different server types and over different generations
Annex 7: Additional graphs and tables
7.1.Greenhouse gas emission reduction
The main environmental emission impact is greenhouse gas (GHG) emissions from electricity consumption during the use phase. Respectively the scenario with the highest electricity consumption saving i.e. scenario 3.3 has the largest reduction in GHG emissions.
Figure 11 Server GHG emission including infrastructure (Mt CO2-eq) 2015-2030 for policy scenarios.
Table 68 Server total GHG emission including infrastructure and savings (Mt CO2-eq) 2015-2030 for policy scenarios
|
Policy scenarios
|
Total incl. infrastructure, Mt CO2-eq/year
|
Saving vs. BAU, Mt CO2-eq/year
|
Cumulative saving, Mt CO2-eq
|
|
|
2015
|
2020
|
2025
|
2030
|
2015
|
2020
|
2025
|
2030
|
2015
|
2020
|
2025
|
2030
|
|
1
|
27.2
|
23.4
|
24.1
|
25.3
|
-
|
0.00
|
0.00
|
0.00
|
-
|
0.0
|
0.0
|
0.0
|
|
3.1
|
27.2
|
22.1
|
23.0
|
24.4
|
-
|
1.30
|
1.04
|
0.93
|
-
|
2.6
|
8.7
|
13.4
|
|
3.2
|
27.2
|
21.4
|
21.6
|
23.2
|
-
|
2.02
|
2.47
|
2.07
|
-
|
3.9
|
15.7
|
27.6
|
|
3.3
|
27.2
|
20.5
|
19.3
|
20.1
|
-
|
2.93
|
4.72
|
5.22
|
-
|
5.4
|
25.9
|
52.3
|
|
5
|
27.2
|
23.0
|
23.1
|
23.6
|
-
|
0.43
|
0.93
|
1.71
|
-
|
0.7
|
4.4
|
11.4
|
For data storage products, scenario 3.3 also presents the most saving, scenario 3.1 has no savings as it does not foresee any efficiency requirements for data storage products, so the energy consumption follows the BAU trend.
Figure 12 Storage GHG emission including infrastructure (Mt CO2-eq) 2015-2030 for policy scenarios.
Table 69 Data storage product total GHG emission including infrastructure and savings (Mt CO2-eq) 2015-2030 for policy scenarios
|
Policy scenarios
|
Total incl. infrastructure, Mt CO2-eq/year
|
Saving vs. BAU, Mt CO2-eq/year
|
Cumulative saving, Mt CO2-eq
|
|
|
2015
|
2020
|
2025
|
2030
|
2015
|
2020
|
2025
|
2030
|
2015
|
2020
|
2025
|
2030
|
|
1
|
10.5
|
13.0
|
14.8
|
15.8
|
-
|
0.00
|
0.00
|
0.00
|
-
|
0.0
|
0.0
|
0.0
|
|
3.1
|
10.5
|
13.0
|
14.8
|
15.8
|
-
|
0.00
|
0.00
|
0.00
|
-
|
0.0
|
0.0
|
0.0
|
|
3.2
|
10.5
|
12.5
|
13.8
|
14.9
|
-
|
0.45
|
0.96
|
0.94
|
-
|
1.0
|
4.8
|
10.2
|
|
3.3
|
10.5
|
12.2
|
12.4
|
12.9
|
-
|
0.81
|
2.37
|
2.95
|
-
|
1.5
|
10.4
|
25.0
|
|
5
|
10.5
|
12.7
|
14.4
|
15.6
|
-
|
0.23
|
0.34
|
0.25
|
-
|
0.6
|
2.1
|
3.5
|
7.2.Sensitivity analysis – detailed tables
7.2.1.Detailed tables for sensitivity analysis of 15% data centre adoption of Operating condition for scenario 3.2
Table 70 Sensitivity analysis of impacts for server policy scenarios with 15% data centre adopting required Operating conditions in policy scenario 3.2
Table 71 Sensitivity analysis of impacts for storage products policy scenarios with 15% data centre adopting required Operating conditions in policy scenario 3.2
7.2.2.Detailed tables for sensitivity analysis of 45% data centre adoption for scenario 3.2 and 75% for scenario 3.3
Table 72 Sensitivity analysis of impacts for server policy scenarios with 45% data centre adopting required operating conditions in policy scenario 3.2 and 75% adoption in policy scenario 3.3 – impacts in 2030
Table 73 Sensitivity analysis of impacts for data storage products policy scenarios with 45% data centre adopting required operating conditions in policy scenario 3.2 and 75% adoption in policy scenario 3.3 – impacts in 2030
Table 74 Sensitivity analysis of impacts for server policy scenarios with 45% data centre adopting required operating conditions in policy scenario 3.2 and 75% adoption in policy scenario 3.3 – cost savings and cumulative savings in the period 2015-2030
|
Policy scenarios
|
Total, million €/year
|
Saving vs. BAU, million €/year
|
Cumulative saving, million €
|
|
|
2015
|
2020
|
2025
|
2030
|
2015
|
2020
|
2025
|
2030
|
2015
|
2020
|
2025
|
2030
|
|
1
|
22,027
|
25,472
|
31,773
|
40,209
|
-
|
-
|
-
|
-
|
-
|
-
|
-
|
-
|
|
3.1
|
22,027
|
24,952
|
31,255
|
39,596
|
-
|
520
|
518
|
614
|
-
|
1,002
|
3,773
|
6,545
|
|
3.2
|
22,027
|
24,654
|
30,423
|
38,389
|
-
|
818
|
1,350
|
1,821
|
-
|
1,530
|
7,259
|
15,988
|
|
3.3
|
22,027
|
26,720
|
30,388
|
37,606
|
-
|
-1,248
|
1,385
|
2,603
|
-
|
-2,977
|
-2,214
|
9,951
|
|
5
|
22,027
|
24,858
|
31,024
|
39,124
|
-
|
613
|
749
|
1,085
|
-
|
1,158
|
4,691
|
9,529
|
Table 75 Sensitivity analysis of impacts for data storage products policy scenarios with 45% data centre adopting required Operating conditions in policy scenario 3.2 and 75% adoption in policy scenario 3.3 – cost savings and cumulative savings in the period 2015-2030
|
Policy scenarios
|
Total, million €/year
|
Saving vs. BAU, million €/year
|
Cumulative saving, million €
|
|
|
2015
|
2020
|
2025
|
2030
|
2015
|
2020
|
2025
|
2030
|
2015
|
2020
|
2025
|
2030
|
|
1
|
22,223
|
25,873
|
30,464
|
35,755
|
-
|
-
|
-
|
-
|
-
|
-
|
-
|
-
|
|
3.1
|
22,223
|
25,873
|
30,464
|
35,755
|
-
|
-
|
-
|
-
|
-
|
-
|
-
|
-
|
|
3.2
|
22,223
|
25,660
|
29,821
|
34,847
|
-
|
212
|
642
|
909
|
-
|
432
|
2,736
|
7,139
|
|
3.3
|
22,223
|
25,598
|
29,509
|
34,281
|
-
|
275
|
955
|
1,474
|
-
|
523
|
3,860
|
10,605
|
|
5
|
22,223
|
25,778
|
30,287
|
35,586
|
-
|
95
|
177
|
169
|
-
|
227
|
942
|
1,786
|
7.2.3.Detailed tables for sensitivity analysis on the cloud utilisation
Table 76 Sensitivity analysis of impacts for server policy scenarios with 20:80 proportion for traditional vs cloud servers in sales by 2020 and 15:85 proportion by 2030 as baseline
Table 77 Sensitivity analysis of impacts for data storage products policy scenarios with 20:80 proportion for traditional vs cloud servers in sales by 2020 and 15:85 proportion by 2030 as baseline
7.3.Cumulative savings by 2030 for the policy scenarios
Table 78 Summary of cumulative impacts by 2030 for server policy scenarios
Table 79 Summary of cumulative impacts by 2030 for storage products policy scenarios
7.4.Single user expenditure for a server and data storage product
Table 80 Single 2 socket rack server user expenditure and saving vs. BAU (euros) for policy scenarios in 2020 and over a lifetime of 5 years
|
Policy scenarios
|
Purchase cost in 2020, €
|
Energy cost in 2020, €/year
|
Annual energy cost savings vs. BAU, €/year
|
Net expenditure over lifetime, €
|
|
1
|
4,160
|
528
|
-
|
-
|
|
3.1
|
4,163
|
490
|
38
|
186
|
|
3.2
|
4,176
|
480
|
47
|
221
|
|
3.3
|
4,902
|
452
|
75
|
-366
|
|
5
|
4,176
|
489
|
38
|
175
|
Table 81 Single Online 2 data storage product user expenditure and saving vs. BAU (euros) for policy scenarios in 2020 and over a lifetime of 7 years
|
Policy scenarios
|
Purchase cost in 2020, €
|
Energy cost in 2020, €/year
|
Annual energy cost savings vs. BAU, €/year
|
Net expenditure over lifetime, €
|
|
1
|
20,800
|
1,632
|
-
|
-
|
|
3.1
|
20,800
|
1,632
|
-
|
-
|
|
3.2
|
20,839
|
1,577
|
56
|
351
|
|
3.3
|
20,839
|
1,531
|
101
|
667
|
|
5
|
20,801
|
1,604
|
29
|
199
|
Annex 8: Indicative benchmarks
The following indicative benchmarks refer to the best available technology on the market for servers and online data storage products at the time of drafting this impact assessment report (February 2018).
Benchmark for idle state power, server efficiency and operating condition
|
Product type
|
Idle power, W
|
Server efficiency
|
Operating condition class
|
|
Tower server, 1 socket
|
24
|
10
|
A3
|
|
Rack server, 1 socket
|
50
|
9
|
A4
|
|
Rack server, 2 socket, low performance
|
67
|
11
|
A4
|
|
Rack server, 2 socket, high performance
|
67
|
20
|
A4
|
|
Rack server, 4 socket
|
415
|
No available data
|
A4
|
|
Blade server, 2 socket
|
75
|
15
|
A3
|
|
Blade server, 4 socket
|
127
|
No available data
|
A3
|
|
Resilient server, 2 socket
|
234
|
No available data
|
A3
|
|
Data storage products
|
Not applicable
|
Not applicable
|
A3
|
Table 9 Benchmark for PSU efficiency at 10%, 20%, 50% and 100% load level and power factor at 50% load level
|
PSU nameplate power
|
10%
|
20%
|
50%
|
100%
|
|
< 750W
|
91.17%
|
93.76%
|
94.72%
Power factor >0.95
|
94.14%
|
|
≥ 750W
|
95.02%
|
95.99%
Power factor >0.95
|
96.09%
|
94.69%
|
Annex 9: Evaluation of an existing ecodesign/energy labelling measure
Please note that this impact assessment does not concern the review of an existing ecodesign and/or energy labelling regulation.
Annex 10: Procedural steps for Ecodesign measures
The preparatory work prior to any Ecodesign or Energy labelling policy measure
entails technical as well as procedural and legal steps, according to a well-defined procedure, which is shown in the figure below.
Potential candidate-products, for which the feasibility of proposing Ecodesign (and/or Energy Labelling) requirements will be investigated in detail, are normally listed in the Ecodesign Working Plan, a document prepared by the European Commission every three-five years. An Ecodesign working plan sets out an indicative list of prioritised product groups, mainly on the basis of the criteria of the expected energy savings in case of regulatory measures. Historically, the main criterion to prioritize inclusion of product groups in the successive working plans has been the potential for energy saving by pushing for more efficient products
.
Products listed in an Ecodesign working plan are first generally analysed in a preparatory study, which provides the necessary technical and economic information to orient more in depth analysis. Once, for a specific product group, the conditions for action are met
, an impact assessment takes place, where various policy options are analyzed, such as "no action
", voluntary agreement, Ecodesign requirements at various levels of stringency, energy labelling schemes or other alternative policy tools. The options are compared across different impact dimensions (economic, occupational, social and environmental aspects, on top of environmental savings) in order to identify the best one. During the impact assessment phase, potential regulatory approaches are discussed in the context of a Consultation Forum meeting with the EU member states, industrial organizations, the ESOs (European Standardization Organizations) and the consumer organizations and environmental NGOs. This meeting is among the most important consultations throughout the whole procedure, as stakeholders' objective and external critical comments are extremely useful to improve the scoping of the measures, product definitions, wider considerations and detailed text, practicality of enforcement, etc. Subsequently, an internal consultation of all the interested European Commission services (known as 'inter-service consultation') takes place, a notification of an advanced draft is provided to the World Trade Organization for comments and, finally a Regulatory Committee vote (for Ecodesign) or an Expert meeting (for Energy Labelling) further amends the draft, before a formal adoption by the Commission and a scrutiny by EU Parliament and the Council. The Ecodesign Directive, in its article 17, also offers the opportunity to manufacturers to sign voluntary agreements, with the commitment to reduce the energy consumption of their products. When appropriate
, the Commission formally recognises such agreements and monitors their implementation, and abstains from regulatory measures.
Ecodesign Regulations typically foresee requirements (e.g on minimum energy efficiency levels) which enter gradually in force following a two or three tiers scheme. The first tier is usually between one and three years after publication; the second usually applies after three-five years. Timing and stringency of each tier take into account the design cycle and the typical life-span of a specific product model. Ecodesign Regulations are typically reviewed within a certain number of years to cope with technology, market or legislative evolution. As of October 2017, a total of 29 Ecodesign and 16 Energy Labelling Regulations have been adopted. They all share a similar approach to their techno-economic analysis and the early stages of the regulatory process. On top of their contribution to the energy efficiency objectives under the Energy Union strategy, since the adoption of the Circular Economy Action Plan in December 2015, these regulations are also expected to contribute to the objectives on material efficiency and design for circularity.
Annex 11: Existing Policies, Legislation and Standards on servers and Data storage products
A number of directives and regulations affect servers and data storage products, and a number of voluntary agreements exist both inside and outside the EU. They are described in the remainder of this section.
EU legislation
The Ecodesign Regulation on computers and computer servers32 sets minimums energy efficiency standards for computers and computer servers, though only partly for servers – as mentioned above. The scope of the regulation explicitly includes small-scale servers and computer servers, thus partially overlapping with the scope of the current study and the intended scope of future ecodesign measures. However, to avoid overlapping, it is proposed that computer regulation would continue to cover small-scale servers, while the other server and storage products would be covered by current initiative. Small-scale servers are not proposed to be moved because they are hardware-wise closer to desktop computers than to servers.
The Ecodesign Standby Regulation 1275/2008 amended by Regulation 801/2013
sets minimum requirements for power consumption for products when operating on standby and off modes. Servers and data storage products are only covered if they are EMC class B products, which are intended primarily for domestic use and therefore there is no apparent overlapping.
Ecodesign Regulation on external power supplies
sets requirements on electric power consumption and efficiency of external power supplies in no-load and active conditions. This Regulation applies also to external power supplies used for server and data storage products up to 250 W and with certain other requirements to be in scope. There is no overlapping with the requirement of current initiative on internal PSU of servers.
Ecodesign Regulation for fans driven by motors
sets minimum standards for energy efficiency of fans (larger than 125 W), including fans used in information technology with the second tier, applying from January 1st 2015. Besides energy efficiency requirements, the regulation also sets information requirements for fans, including fans used in information technology. This Regulation covers also, in principle, fans used for servers and data storage products. However, is has to be noted that server fans are usually smaller than 125W, therefore these ones are out of scope of the fan Regulation.
The Energy Efficiency Directive
establishes a set of binding measures to help the EU reach its 20% energy efficiency target by 2020. Under this Directive, all EU countries are required to use energy more efficiently at all stages of the energy chain, from production to final consumption. New national measures, such as public procurement for energy efficient buildings, products and services, or efficiency improvement of heating systems, must ensure major energy savings for consumers and industry. On 30 November 2016 the Commission proposed42 an update to the Energy Efficiency Directive, including a new 30% energy efficiency target for 2030, and measures to update the Directive to make sure the new target is met (‘Proposal for a Directive of the European Parliament and of the Council amending Directive 2012/27/EU on energy efficiency’). This legislative proposal, together with others also belonging to the ‘Clean energy for all Europeans’ package, is currently (as with all legislative proposals under the EU's ordinary decision-making procedure) being discussed by the co-legislators - the European Parliament and the Council of the European Union.
The Low Voltage Directive (LVD)
regulates health and safety aspects including e.g. mechanical, chemical, noise related or ergonomic aspects. Apart from this, the directive seeks to ensure that the covered equipment benefits fully from the Single Market. The LVD covers electrical equipment operating with a voltage between 50 and 1000 V for alternating current and between 75 and 1500 V for direct current. Falling under this category, server and data storage products are covered by the scope of the LVD, but there is no overlapping in terms of the type of requirements.
The WEEE Directive
set requirements on e.g. recovery and recycling of Waste of Electrical and Electronic Equipment to reduce the negative environmental effects resulting from the generation and management of WEEE and from resource use. The WEEE directive applies directly to server and data storage products. Ecodesign implementing measures can complement the implementation of the WEEE directive by including e.g. measures for material efficiency, thus contributing to waste reduction, instructions for correct assembly and disassembly, thus contributing to waste prevention and others.
The RoHS Directive
restricts the use of six specific hazardous materials and four different phthalates found in EEE. Server and data storage products are directly covered by the RoHS Directive. Server and data storage products are also covered by one of the exemptions made in the directive, namely for the restriction of the use of lead in server and data storage products. There is no overlapping requirement with a proposed ecodesign regulation.
The REACH Directive
restricts the use of Substances of Very High Concern (SVHC) to improve protection of human health and the environment. The REACH Directive applies directly to server and data storage products. There is no overlapping requirement with a proposed ecodesign regulation.
The EMC Directive
sets requirements for the Electro-Magnetic Compatibility performance of electrical equipment to ensure that electrical devices will function without causing or being affected by interference to or from other devices. The EMC Directive applies directly to server and data storage products. There is no overlapping requirement with a proposed ecodesign regulation.
On May 2016 Regulation 2016/679 (EU, 2016), on the protection of natural persons with regard to the processing of personal data and on the free movement of such data (i.e. within EU), entered into force; it is also known as the General Data Protection Regulation (GDPR). One of the key principles introduced by the GDPR is that of the ‘data protection by design and by default’. This principle defined in article 25 of the GDPR is closely related to the ‘privacy by design’ principle, which establishes that privacy should be taken into account throughout the entire engineering lifecycle of a product or service, in particular during the design phase.
Another initiative linked to the GDPR, is the 'Free flow of non-personal data' initiative aimed to a) ensure a comprehensive and coherent approach to the free movement of data in the EU and b) assess the feasibility and effectiveness of removing all disproportionate restrictions to the movement of data across Member States and IT systems in Europe (such as unjustified data localisation restrictions by Member States' public authorities, legal uncertainty about legislation applicable to cross-border data storage and processing, lack of trust in cross-border data storage and processing and, finally, difficulties in switching service providers (such as cloud) due to vendor lock-in practices). To this extent, a draft regulation has been proposed by the European Commission in the second half of 2017.
Standards for servers and data storage products
The Technical Assistance Study for Enterprise Servers and Data Storage was initiated to investigate standardised server and storage test methods in support of the regulatory process related to the EU Ecodesign and Energy Labelling Directives. The study scope then expanded to include the development of efficiency metrics for servers.
The final report, published in July 2016, establishes that SERT is the most suitable test measurement for servers (although not sufficient alone to use for comparison of server efficiency and MEPS); concerning data storage products, it is not possible to recommend a test standard at this point. Based on SERT, a server metric was developed to enable the objective assessment and comparison of server efficiency, taking into account the varied power and performance levels as a result of different configurations. The metric is based on the power consumption and CPU and memory performance at various utilization levels, emphasizing a balanced server configuration with no performance bottlenecks.
NSF International’s Environmental Leadership Standard for Servers is currently being developed and it establishes product environmental performance criteria and corporate performance metrics that exemplify environmental leadership in the market. NSF is an independent, accredited organisation that develops standards, test and certify products and systems. This standard addresses multiple attributes and environmental performance categories including energy efficiency, management of substances, preferable materials use, product packaging, design for repair, reuse, and recycling, product longevity, responsible end-of-service and end-of-life management, life cycle assessments, and corporate responsibility. The finished standard can be used within an established system for the identification of environmentally preferable products by users and to provide market recognition for conforming products and brand manufacturers. A draft standard is available online.
Voluntary legislative tools in the EU
The EU Code of Conduct (CoC) on Data Centre Energy Efficiency
The EU Code of Conduct (CoC) on Data Centre Energy Efficiency is a voluntary scheme developed by the European Commission Joint Research Centre (JRC), Directorate Energy Transport and Climate in collaboration with a broad range of market actors including EU Member States, hardware manufacturers, data centre consultants, data centre owners and operators etc. The CoC targets companies owning or operating data centres to support reduction of energy consumption by applying best practices for energy efficiency and cost savings. The CoC partnership is issued for three years, and companies signing the CoC as participants commit to:
·Initial energy measurement and energy audit to identify the major energy saving opportunities.
·Prepare and submit an action plan
·Implement the action plan according to agreed timetable while monitoring energy consumption and energy efficiency development
Additionally, it is possible to sign as endorser, if you are supplier of products or services to the data centre owners.
The best practice measures are revised on a yearly basis by the JRC. They include considerations mostly dealing with: embedded energy and life cycle analysis, energy efficiency and power management, influence from environment during usage (temperature, humidity, and airflows), resilience, quality of service and performance monitoring and reporting capabilities. The Best Practice Guidelines require compliance with the Energy Star requirements for servers, storage and network equipment and compliance with EU Code of Conduct on Energy Efficiency and Quality of AC Uninterruptible Power Systems (UPS) for purchase of new equipment for signatories. Currently, the number of participants in the Code of Conduct is 115 covering approx. 331 data centres across many EU countries and the number of endorsers is 249. The Code of Conduct is acknowledged as a successful example of a non-regulatory policy to improve energy efficiency in data centres that has stimulated efficiency improvement is data centres.
Every year, the number of companies applying for the Participant Status increases.
Analysis shows that the average PUE (i.e. total facility energy consumption divided It energy consumption) of the facilities participating in the programme is declining year after year, reaching the value 1.64 in 2016, with some best examples reaching PUE of 1.1. The total energy consumption so far of all the approved Participants is approximately 3.7 TWh and the average annual electricity consumption has declined since the last survey in 2014.
There are about 1616 data centres in Europe according to an IT market research company, this represents 42% of the data centres in the world. The EU Code of Conduct covers approx. 17% of all data centres in Europe. The direct impact of it is difficult to monitor but indirectly it has influenced the overall efficiency market through establishing recognised best practices in operation. However, its impact at product level, i.e. on server design efficiency is considered as very limited.
The EU Energy Star programme
Energy Star started as a voluntary labelling program managed by the U.S. Environmental Protection Agency and the U.S. Department of Energy in 1992. The EU Energy Star programme for IT and office equipment results from an initial agreement between the US government and the European Commission in 2001 and the agreement now covers computers, displays, imaging equipment, UPS and servers. Additionally, Energy Star covers data storage product, small network equipment and large equipment and a broad range of other products not relevant for DG GROW Lot 9.
When a manufacturer is an Energy Star partner and their products comply with the performance criteria, they may use the Energy Star mark on those products after a registration (EU) or certification (US) process. Three different Energy Star product specifications are in effect for the server and data storage products in this study: Version 2.0 specification for Enterprise Servers (16 December 2013) and Version 1.0 specification for Data Centre Storage (2 December 2013). Only the specification for Enterprise Servers has been adopted in EU. Additionally, there are two specifications for network equipment. On the basis of the preparatory study, which concluded that the complexity of network equipment makes it unfeasible to be studied together with already complex product groups such as servers and storage, it was decided not to include network equipment in the scope of this initiative. The Energy Star specifications for servers include criteria on power supply efficiency, limits on idle power consumption, advanced power management features and requirements to disclose SERT results and other data. The Energy Star specifications for data storage products include criteria on power supply efficiency, energy efficiency features and requirements to disclose test results based on SNIA EmeraldTM Power Efficiency Measurement Specification.
There are requirements on the national governments and on the European Commission to procure products, which comply with Energy Star requirements for purchases over a certain limit.
The EU Energy Star programme involves also a web database on products, EU product registrations, data transfer of registered products in USA to EU and market survey including biannual market reports including penetration rates for product types included in the EU Energy Star programme.
In terms of Energy Star market penetration, the server market has the lowest sales penetration of the product groups covered by EU Energy Star. Market penetration survey reports that 28% of the EU server market is Energy Star labelled for the first two quarters of 2015. A more recent report on the Q1-Q2 2016 market situation show that a further increase occurred, so that 49% of sales in Q1-Q2 2016 consisted in Energy Star compliant equipment). This means that still in 2016 at least 50% of the EU market of servers was composed of products without the Energy Star label, therefore significant improvements are still needed to increase the market coverage (in comparison, displays and imaging equipment have EU market penetration for Energy Star labelled products of 67% and 71% respectively in 2015). Moreover, it has to be noted that all the servers compliant with Energy Star stem from registrations with the US Energy Star programme, and not with the EU Energy Star programme, where there are annually just a few (less than 10) registrations. This seems to be linked to a major issue: the compliance with the US Energy Star programme has to be shown with third party certification, which, on the contrary, is not required under the EU Energy Star Programme. As an effect of this divergence, US Energy Star does not validate the applications done under the EU Energy Star scheme (while the contrary is possible), and this could explain the low rate of EU registrations (EU server manufacturers seem to have almost no interest in a EU registration scheme as it is not mandatory for procurement in the EU and not recognised for servers exported to the US).
Green Public Procurement for Data Centres
A study which prepares the ground for the development of EU Green Public Procurement (GPP) environmental criteria for data centres is ongoing at the time of drafting the current impact assessment report (February 2018). The purpose of this project is to develop clear and ambitious EU GPP criteria at system level (data center), based on a life-cycle approach and a scientific evidence base, for public authorities which will be able to use them, on a voluntary basis. The study is carried out by the Joint Research Centre of the European Commission, and coordination with the content of the proposal in the current impact assessment report has been ensured by the responsible desk officers.
National programs inside the EU
Germany
The Blue Angel
is an award given to operators of “Energy-Conscious Data Centres”, fulfilling a list of defined criteria. The criteria include aspects such as energy conscious procurement (TCO calculations), energy efficiency (dynamic power saving technologies and at least meet 80 PLUS GOLD efficiency standard), use of virtualisation and consolidation, and load monitoring.
Future Thinking Initiative on data centres was established in 2010 and has three main objectives: to enhance innovation, knowledge transfer and networking. This exchange platform promotes energy efficient thinking and sustainable resource use. Furthermore, the German Data Centre Price was introduced in 2011 in order to further incentivize innovative thinking.
Ireland
The Triple E is a searchable listing of energy equipment fulfilling the Tripe E criteria, managed by the Sustainable Energy Authority of Ireland (SEAI)
. The Triple E minimum criteria are set for different products, including Rack Mounted Servers, Enterprise Storage Equipment, Blade Servers and enterprise communication equipment. The criteria are updated on a regular basis with the goal that only the top 10-15% of the most energy efficient products in any technology are listed. For the time being, the Triple E includes 52 technologies and is based on the existing Accelerated Capital Allowance (ACA) list of eligible products and eligibility criteria.
UK
CEEDA, the Certified Energy Efficient Data Centre Award provides an audited and certified assessment of the implementation of energy efficiency best practices within a data centre. CEEDA applies an assessment framework based on energy efficiency best practices in M&E (Mechanical and Electrical) and IT infrastructure, operational management and management of IT services and software. These best practices are principally those obtained from the EU CoC. CEEDA also validates the method of measurement and calculated values for a set of energy efficiency performance metrics, primarily those defined by the Green Grid, such as PUE, WUE (source, onsite) or ERE.
National and global programs outside the EU
EPEAT, the Electronic Product Environmental Assessment Tool
is a global rating system for electronics equipment, which covers the complete lifecycle and thus combines comprehensive criteria for design, production, energy use and recycling. It is managed by the Green Electronics Council in the USA. It rates products Bronze, Silver or Gold, based on how many of the optional criteria they meet (while meeting all required criteria). In particular, requirements of the Energy Star® programme are considered in the criteria. The EPEAT registry does not yet, but will soon include servers (computer servers as defined in the Energy Star® Server specifications), as work is in progress to develop criteria.
The 80 PLUS programme
is a voluntary certification programme launched by Ecos Consulting (now Ecova) in 2004, to promote energy efficiency of power supply units. The 80 PLUS performance specification requires power supplies in computers and servers to be 80% or greater energy efficient at 20%, 50% and 100% of rated load with a true power factor of 0.9 or greater. This makes an 80 PLUS certified power supply substantially more efficient than typical power supplies. The programme differentiates further levels of high efficiency, through the Bronze, Silver, Gold, Platinum and Titanium awards.
The Top Runner Program from Japan is a mandatory policy instrument that targets the energy consumption during the use phase through market transformation. The scope and targets for each product range are regularly revised. The basic principle is that the product with the highest energy efficiency on the market (the Top Runner) sets the standard, and all other appliances are required to reach that level within an agreed time scale (2-3 years). It currently covers servers under the specifications of “Computers and hard disk drives”
. Energy efficiency is in this program calculated in the unit Watts/giga calculations.
The Good Environmental Choice Australia Standard for computers
issued in 2008 provides specifications for the Australian Ecolabel Program, and servers are included in the scope of this standard. The criteria concerning servers include Material requirements for plastics and heavy metals, power management requirements, Spare parts, product take back and information provision.
The CQC certification is a voluntary product certification scheme in China, implemented by the China Environmental United Certification Centre.
The products shall be verified to conform to the requirements of the standards of quality, safety, environment and performance defined in the different rules. In particular, the scheme defines rules and criteria for servers (CQC3135-2011)
.
Concerning material efficiency aspects, legislation on the "Right to Repair" electronics is under analysis in some US states, such as Massachusetts and New York. These initiatives are aimed to ensure that:
·(New York) manufacturers make available diagnostic and repair information for digital electronic parts and machines to independent repair providers
·(Massachusetts) 'Manufacturers of digital electronic products shall make available to independent repair facilities or owners of products manufactured by the manufacturer the same diagnostic and repair information, including repair technical updates, diagnostic software, service access passwords, updates and corrections to firmware, and related documentation, free of charge and in the same manner the manufacturer makes available to its authorized repair providers'.


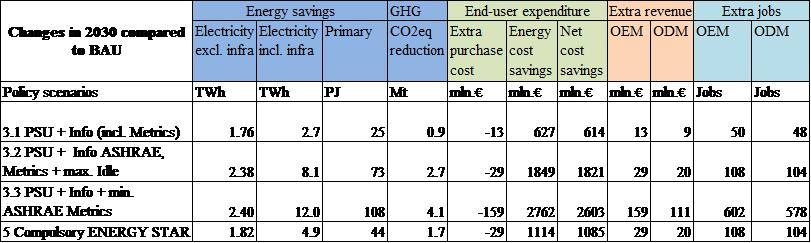


,_EU-27,_2010.png)