EUR-Lex Access to European Union law

Back to EUR-Lex homepage

This document is an excerpt from the EUR-Lex website

Document 52015SC0203

COMMISSION STAFF WORKING DOCUMENT Report on Single Market Integration and Competitiveness in the EU and its Member States Accompanying the document COMMUNICATION FROM THE COMMISSION TO THE EUROPEAN PARLIAMENT, THE COUNCIL, THE EUROPEAN ECONOMIC AND SOCIAL COMMITTEE AND THE COMMITTEE OF THE REGIONS Upgrading the Single Market: More Opportunities for People and Business

SWD/2015/0203 final

Brussels, 28.10.2015

SWD(2015) 203 final

COMMISSION STAFF WORKING DOCUMENT

Report on Single Market Integration and Competitiveness in the EU and its Member States

Accompanying the document

COMMUNICATION FROM THE COMMISSION TO THE EUROPEAN PARLIAMENT, THE COUNCIL, THE EUROPEAN ECONOMIC AND SOCIAL COMMITTEE AND THE COMMITTEE OF THE REGIONS

Upgrading the Single Market: More Opportunities for People and Business

{COM(2015) 550 final}
{SWD(2015) 202 final}


This report has been written by the staff of the Directorate-General for Internal Market, Industry, Entrepreneurship and SMEs, European Commission.

Any comments are welcome to the following e-mail address: GROW-A2@ec.europa.eu  

More information on the European Union is available on the internet ( http://europa.eu ).

© European Union, 2015
Reproduction of the text is authorised provided the source is acknowledged

Executive Summary3

Introduction6

1Investment obstacles and policy responses7

1.1Introduction7

1.2Barriers to investment10

1.3Investment Plan17

1.4Conclusions19

2The evolution of EU competitiveness and innovation20

2.1The evolution of sectoral performance20

2.2Overall evolution of productivity27

2.3Sources of productivity growth38

2.4Conclusions50

3The evolution of integration, performance and remaining barriers in the Single Market51

3.1The evolution of integration in the Single Market51

3.2Single Market Performance62

3.3Remaining barriers to integration in the Single Market87

4Financing the real economy98

4.1Single Market for Financial Services before the crisis: Financial convergence and increased cross-border capital flows during EMU98

4.2Significant divergences in economic fundamentals during EMU giving rise to imbalances and capital misallocation99

4.3Single Market for Financial Services in the wake of the financial crisis100

4.4Business financing remains a concern, although of a less pressing nature104

4.5Conclusions105

References107


The economic performance of the EU has improved in 2014 relative to the two previous years. While growth rates remain low and it will take time to reduce unemployment in some Member States, the EU is steadily recovering despite political and international economic uncertainties. The fall in oil prices is providing an additional boost to the EU economy which has presented record trade surplus figures in the first half of 2015.

There are encouraging signs suggesting that the EU has embarked on the path towards economic recovery. And yet, economic recovery does not necessarily ensure a better allocation of resources which would allow the EU to improve its productivity growth and higher competitiveness levels in the longer run. Unfortunately, the recent experiences of some EU Member States have shown that, even during periods of growth and capital inflows, resources can be misallocated, generating important unbalances that are costly to redress. In other cases, regulations in labour and product markets can block the reallocation of resources. 1  

Europe has accumulated a considerable productivity gap with the USA, especially as regards dynamic efficiency. According to the Conference Board, 2 EU labour productivity in 2014 was 70 % of the US level. Last year and contrary to previous years, the difference in productivity growth rates between the EU and the USA has not widened.

There is growing consensus on the existence of a slowdown in productivity growth affecting both advanced and emerging economies. 3 Differences in labour productivity and total factor productivity growth rates between Japan, the USA and the EU are getting narrower as a result of this slowdown. This opens a window of opportunity that could allow Europe to accelerate the catching up process in productivity if economic reforms are implemented.

The first big challenge to restore productivity and long term growth is to revitalize investment. A number of barriers have lowered the intensity of tangible and intangible capital accumulation in the EU. In 2014, Gross Fixed Capital Formation recovered by 2 percentage points of GDP, but this is still below the investment levels needed to cut down our productivity gap with respect to the USA. A subdued level of investment over several years has produced a significant accumulated lag in investment, especially in Information and Communication Technologies (ICT).

During the 2000-2014 period, EU investment in ICT and Intellectual Property products grew faster than any other form of investment, with annual rates of 3.5 % and 2.8 %, respectively. However, the process of digitisation of the EU economy started late and the accumulated levels in these types of investment are just one third of those in the US. 4  

This report also suggests that conditions are favourable to improve competitiveness if efforts are made to introduce reforms at both national and EU levels. Labour and total factor productivity growth could be increased in the EU if regulatory barriers to competitiveness and integration are removed thus allowing for improvements in the allocation of resources across firms and sectors in the Single Market.

The reallocation of resources will have to proceed along three axes. First, it will require moves of capital and human resources from low to high productivity firms within sectors in the Member States. This had been a major source of productivity growth before the crisis but its contribution has diminished recently. Cross-sectoral reallocation of resources, on the other hand, had not been a major source of productivity growth in the past. New technological developments, changes in input prices (shale gas in particular) and the emergence of new business models suggest that cross-sectoral reallocation of human and capital resources may take increasing importance in the future as a source of productivity growth. Improvements in productivity are possible by more investment in new digital and clean technologies in current production activities by the reallocation of more human, capital and technological resources towards higher value added activities. Finally, a third source of productivity growth will come from the geographic reallocation of resources within the Single Market and from a better insertion of EU firms in international value chains. This would also allow to better exploit backward and forward linkages in global value chains, e.g. by strengthening the integration in key sectors such as business services and logistics.

New technologies and stronger integration in EU and global value chains will create new business opportunities but there are regulatory, structural and behavioural obstacles that may frustrate the realisation of these opportunities. Structural reforms are needed at EU and Member State levels to remove these obstacles.

The review of the situation of the Single Market shows that a considerable effort is necessary to introduce structural changes to remove the remaining barriers hampering the performance of the Single Market. However, this review also reveals the potential of the Single Market as a major source of microeconomic reforms in the EU to deliver growth and jobs.

Both trade in goods with the whole of the EU and intra-EU investment of the EU-15 – i.e. Member States that acceded to the EU before 2004 –, seem to have stalled for over a decade. The more recent Member States (EU-13) have displayed a very dynamic process of integration and reached higher integration indicators than the EU-15. Integration proceeds in the services sectors albeit at a relatively slow rate. According to UNCTAD, global exchanges in services grew by 4 % while intra-EU exchanges in services increased by only 2.5 % in 2013. 5 There are significant differences across sectors and there is considerable potential for more exchanges in business services, especially those provided by services professions or in the construction area.

The current assessment of the benefits of the Services Directive makes apparent the need to improve the implementation and subsequent enforcement of this Directive that is critical for the overall performance of the Single Market in the services sectors and for the EU economy as a whole.

The analysis of efficiency in the allocation of labour presented in Chapter 3 shows very significant differences across sectors. While high levels of efficiency prevail in manufacturing, the situation is very different in services and construction. Furthermore, deteriorations in allocative efficiency can be reported in the construction sector in particular. This is an indication of the importance of the introduction of reforms to turn around the productivity performance of the Union in the coming years as suggested in Chapter 2.

The regulatory environment has improved but again, the EU-15 present a slow-down in this improvement since 2005. It is precisely after that year that more significant improvements can be found in the regulatory environment of the EU-13.

A number of important improvements and good practices can be detected in public procurement markets. However, Member States are progressing at very different speeds in the implementation of e-procurement, the level of publication of public tenders remains relatively low and the level of professionalization of buyers remains low. Additional work is also pending on the introduction of procurement procedures that can create incentives for innovation and SME participation in procurement.

Structural, behavioural and regulatory barriers remain present in the Single Market. Some of them have particular adverse effects on new dynamic and exporting "start-ups". Others have a particularly negative impact on the construction sector, especially as regards the cross-border circulation of construction materials, which remains an open building site for the Single Market. Financing issues are critical for SMEs and the new measures for the diversification of financing sources alternative to bank credit will be critical to enable investments and innovation.

In summary, the Single Market presents both symptoms of stagnation in the EU-15 in goods markets but integration is still making progress in the EU-13. In services and construction sectors, significant potential remains to be exploited. Over twenty years of integration have contributed to improving the allocation of production and resources in manufacturing markets and the fruits of these changes have been visible in those markets for several years now. However, this seems to have been a stepwise improvement that will not deliver further new gains unless new barriers are removed. In services and construction, the potential is there, but the partial results obtained so far in the implementation of the Services Directive can be significantly increased if further barriers to exchanges in services and establishment are removed.

Therefore, significant static gains in the allocation of resources are possible but more durable and lasting gains could be achieved if dynamic efficiency was improved. A higher competitive tension both in goods and services markets, more active innovation and a more favourable potential for the emergence and growth of start-ups could boost total factor productivity.

Ensuring practical delivery of reforms

As indicated by the Single Market Strategy, economic reforms deliver benefits in terms of growth and jobs but the cost of reforms must be taken into account when choosing the path to reform in the Member States and at EU level. In the EU context, three elements can help us maximise the difference between benefits and costs.

Complementarities. To minimise the regulatory fatigue, reforms at EU and Member State levels must be complementary. As Marinello et al (2015) 6 point out, the potential of the Single Market to deliver its expected positive impacts on productivity and growth faces several limitations related not only to the remaining barriers, but also to the lack of complementary policies and the lack of alignment of Member State policies with Single Market objectives. Only feasible, coordinated and relevant reforms with positive expected and actual impacts are likely to succeed in being implemented timely and successfully by Member States. Reforms at EU level must facilitate these changes by increasing the payoffs to reforms and minimising the joint cost of reforms.

Learning from common experiences. The process of reforms in the EU is a common process where Member States can learn from the experiences of others. Recent Commission studies and reports have made clear the broad differences in the costs of implementing similar EU directives by different Member States. Member States can learn from each other's experience to minimise the social and economic costs of reforms.

Coordination. The economic crisis has made apparent the close relationship and mutual dependence between financial, products and services markets. The relationship between labour, product and services markets is well known. 7 A closer integration of the existing instruments for economic policy coordination will surely improve the effectiveness and the efficiency of economic reform efforts in the EU.

The economic performance of the EU has improved in 2014 relative to the two previous years. Growth rates remain low and it will take time to reduce unemployment in some Member States, but the EU is steadily recovering despite political and international economic uncertainties. The low exchange rate of the euro and the fall in oil prices are providing an additional boost to the EU economy and particularly to the euro area that has presented record trade surplus figures in the first half of 2015.

Against this background, this report 8 presents both recent developments and pre-/post-crisis comparisons concerning the state of integration and competitiveness in the EU and its Member States. It also looks into some long-term trends because the crisis has brought into the open some major imbalances of the EU economy that were already present before 2008:

Integration in capital markets was put to the test and the seemingly high level of integration in financial markets could not withstand the shock of the international financial crisis. This experience has revealed the importance of governance issues for the performance of the Single Market.

Delays in the introduction of EU and national structural reforms in products, services and labour markets in some Member States have added to the cost of the crisis delaying the recovery. In general, countries that introduced structural reforms before the crisis have fared better than the rest. This shows the importance of structural reforms for the overall performance of the EU.

Despite the asymmetric shock of the crisis, the Single Market could not smoothen and compensate sufficiently the impact of the crisis on countries with structural current account imbalances. In addition, intra EU integration in products seems to have stalled well before 2008, especially in the 15 Member States that integrated the Union before 2004. Remaining obstacles to integration in services and construction still hold back the potential of the Single Market. These are important developments which require further work into their causes and possible remedies.

New studies of productivity at firm level call for important reallocations of resources within sectors, across sectors and across countries to boost productivity growth. The need for important improvements in the functioning of the Single Market in areas such as mutual recognition, public procurement and most importantly, in services is more evident now than before 2008. Technology developments will also trigger further resource reallocation. All this underlines the importance of flexibility and the elimination of barriers to resource mobility, giving a new dimension to the Single Market 9 and structural reforms.

The report presents an overview of the main issues that have been identified in the assessment of the competitiveness and integration performance of the EU and its Member States. The report consists of the following chapters: The first three deal with the key issues of (i) investment, (ii) competitiveness and innovation and (iii) the integration of EU firms in EU and international value chains. A fourth chapter looks into the financing of the real economy.


MS

1.1    Introduction

The financial crisis that hit the world economy at the end of the previous decade took a heavy toll on investment in Europe and other major economies like the US. This negative impact was more prominent in developed countries. The global average investment rate fell from its peak pre-crisis level of around 23.5 % in 2007, to less than 22 % in 2009 and 2010. 10 It has since regained some of the loss and is now around 22 %. However, unlike other big economies, the deviation from the global average investment rate in the EU continues to widen (see Figure 1.1). 11 According to Commission calculations this deviation has resulted in an investment shortfall of EUR 230 –370 billion 12 while the accumulated investment gap from 2009 to 2014 exceeds EUR 1.2 trillion. In order to reverse the trend, the EU has put in place the Investment Plan which aims to mobilise at least EUR 315 billion in the next three years by supporting investment in the real economy and creating an investment-friendly environment.

Figure 1.1:Gross fixed capital formation as a percentage of GDP - Deviation from the global average investment rate


Source:World Bank Data

Comparison by country, sectors and assets

Almost all countries experienced a fall in investment from their peak levels, driven particularly by a fall in private investment. 13 This drop was more pronounced in the economies of the euro area periphery than in core economies and particularly in Greece and Cyprus where private investment in recent years has been as little as 11 % of GDP.

At sectoral level, investment in the EU manufacturing sector was particularly affected in 2008 and it has since then, and unlike what has happened in the US, not managed to regain its losses (see Figure 1.2). Particularly affected sectors include the energy intensive industries. 14 On the other hand, computer and electronics, electrical equipment, motor vehicles and pharmaceuticals have proven to be more resilient to the negative effects of the crisis. In services, investment managed to rebound in most of the sectors to pre-crisis levels mainly due to the fact that services are less cyclical than manufacturing (see Figure 1.3). 15

Figure 1.2:Evolution of gross fixed capital formation in manufacturing sectors, 2001-2013 (Index)


Source:European Investment Bank; U.S. Bureau of Economic Analysis; Eurostat; BCG Analysis

Figure 1.3:Evolution of gross fixed capital formation in services, 2001-2012 (total EU, million Euro)


Note:EU-27+ Norway. Data for Romania, Latvia and Malta missing due to unavailability of data.

Source:Eurostat

Figure 1.4 shows the growth rates of investment by asset before 16 and after the financial crisis of 2009. All assets experienced a profound drop due to the crisis but investment in ICT proved to be more resilient to the negative effects of the crisis relative to investment in other assets.

Figure 1.4:Investment in the total economy by asset type in the EU-28: Growth rates


Source:Eurostat

Main impacts from low investment rates

The main result from this subdued investment in the EU is that the European economy is recovering much more slowly than its main competitors since the onset of the economic crisis of 2008. Other negative impacts are identified on employment and on the medium-term growth potential. According to European Commission estimates, the investment shortfall in Europe accounts for the largest proportion of the fall in GDP during the post crisis period. Unlike services, the impact of the 2008 crisis in manufacturing can still be felt in Europe, with production levels still nearly 10 percentage points below the peak achieved in the first quarter of 2008 (see Figure 1.5). This can be attributed, like in the case of investment ratios, to the fact that manufacturing is more cyclical than services. Moreover services are less tradable than manufacturing and therefore the impact of the world trade decrease following the crisis was more felt in the output of the manufacturing sector. 17  

Figure 1.5:Manufacturing output in the EU-28 (2000-2014)


Source:Eurostat

Adverse effects are also created on the EU international competitiveness, as companies in competitor countries like the US, who saw their productive investment rebound to pre-crisis levels, are gradually upgrading their equipment, something that does not happen in Europe. Finally, the decline in investment resulted in a slowdown in innovation too, not least because SMEs – as drivers of innovation and growth – face great financing challenges.

1.2    Barriers to investment

The scope of this chapter is to analyse the most important reasons for the low investment in the EU and identify the types of investment that are affected the most, by giving where possible some examples from Member States. 18 This analysis is not exhaustive and does not focus on the importance of input costs (like labour or energy costs) or infrastructure. 19 Drawing on the analysis of several surveys 20 and a collection of detailed evidence from Member States feedback, 21 it helps single out specific aspects in the barriers affecting a relevant number of Member States and sectors that negatively impact investment across the EU (see Figure 1.6). Empirical analysis 22 also corroborates the existence of the following barriers to investment:

1.Regulatory instability, regulatory unpredictability, overregulation or bad regulation

2.Financing constraints

3.Single Market barriers.

It is important to mention in this context that the Letter of Intent from President Juncker and First Vice-President Timmermans to the Presidents of the European Parliament and the Presidency of the Council accompanying the President's State of the Union speech 2015 indicated that the identification of key obstacles to investment at national level will be a priority of the 2016 European Semester.

Figure 1.6:Member States feedback on barriers to investment


Source:Final TF report on the Investment in the EU

1.2.1    Regulatory instability, regulatory unpredictability, overregulation or bad regulation

Several surveys point out that regulation in EU Member States is inefficient, impacting businesses and their investment decisions. For instance, the OECD ranks the EU average below the global average in regulatory efficiency and shows that the EU has lost significant positioning in the last 8 years (see Figure 1.7). The World Bank rankings 2015 on doing business report on how easy it is for a local entrepreneur to open and run a small to medium-sized business when complying with the relevant regulations. Results show that there are noticeable differences in the performance across Member States. 23 The magnitude of the problem for EU businesses is confirmed by the results of a flash Eurobarometer survey on European businesses and public administration. 24

The uncertainty of the general regulatory framework from frequent or unforeseen changes of the EU or national legislation results in a higher risk for investors. 25 As a consequence, companies may defer investment decisions particularly in sectors with typically longer term pay back periods. The life cycle of a long term project typically spans beyond any government administration or individual regulatory settlement period. Investors are therefore not only analysing the project-specific risks, but are also giving substantial consideration to political risk and stability of the regulatory framework.

Some investment projects submitted by Member States for the EU investment plan have also highlighted the importance of regulatory predictability at EU level. 26

Figure 1.7:Regulatory efficiency: The EU is below the world wide average in regulatory efficiency and has lost significant positioning in the last 8 years


Note:* Value 1-7 in 2014-2015 (1=extremely burdensome; 7=not burdensome at all)
* In 2006-2007, 120 countries in the ranking, while in 2014-2015 144 countries in the ranking

Source:OECD Global Competitiveness Report; BCG Analysis

Figure 1.8:Costs associated with EU legislation in three energy intensive industries – Refining, Metals and Chemicals


Source:Assessment of cumulative cost impact for the steel and aluminium industry; CEPS; Europia; 2014 Statistics; BCG analysis

Figure 1.9:Evolution of gross fixed capital formation by manufacturing value chain (2008-2011)


Source:Eurostat; U.S. Bureau of Economic Analysis; BCG analysis

Disproportionate regulatory burden at EU or at Member State level could increase the cost of doing business and thus have a negative impact on investment decisions or dislocate investment. The Fitness Check on the Refinery sector 27 shows that up to 25 % of the sector's margin decline can be attributed to the impact of 10 pieces of EU legislation. In metals, regulatory costs represented on average 8 % of total production costs over the entire period (2002-2012) but were in the area of 16 % to 39 % of profits. 28 In the chemical industry, some EU restrictions through REACH may contribute in making operating more costly in the EU than in competing locations. 29 Figure 1.8 depicts the costs associated with EU legislation in these industries while Figure 1.9 shows that some energy intensive industries like building materials, paper & wood, metals and chemicals, experienced a more pronounced drop in investment during the post 2009 crisis period than the same industries in the US. Of course this analysis is one side of the coin as it does not take into consideration the many benefits stemming up from EU legislation.

There are sectors like pharmaceuticals, where a harmonised and agile approval process to reduce the time to market and an efficient and predictable IPR framework are critical to attract innovative investments in the EU. In the pharmaceutical market conducting clinical trials entails considerable investment and growth in the EU. The Clinical Trials Directive is heavily criticised and also one of the possible reasons for part of the decrease in the number of applications for clinical trials in the EU 30 . In the market of veterinary medicinal products, the total annual administrative burden imposed on business by the veterinary medicines legislation was estimated to be around 13 % of the turnover of veterinary medicines sector - twice of that estimated for the human sector. In addition, there is a concern expressed both by regulators and the pharmaceutical industry, that the current veterinary pharmaceutical legislation is not suited to innovation. A reason behind this is that the current data protection provisions do not take into account the difficulty found by the veterinary sector in recovering investments spent in the development of new veterinary medicines. 31  

Uncertainties around intellectual property rights (IPRs) affect investment in innovation. High costs and complexity of litigation have a dissuasive impact on SME's using and enforcing IPRs. This leads to SME's in the EU under using IPRs as a means to ensure that they earn sufficient returns on their investment in innovation. Regulatory uncertainties and fragmentation across Member States may inhibit the development and growth of the new business models like for instance in the area of collaborative economy. Grey zones in the liability of service providers, business authorisation and registration requirements deters market access for platforms and limits investment opportunities estimated at around USD 15 billion. 32   33  

Regulatory fragmentation across the Single Market or disproportionate restrictions, hamper the opportunities to expand business at EU level especially for companies in the transport sector. In transport, logistic costs are very important and logistic restrictions can be as much as 10 % of total logistic costs. Unnecessary load and size limits, traffic restrictions, local restrictions in ports that hamper competition and administrative procedures that drive up costs, reduce freight attractiveness for firms. In road transport there are logistics related to regulatory differences or restrictions that impact on the growth opportunities of companies. 34 In rail transport, the lack of interoperability between systems (lack of full ERTMS deployment) holds back rail freight growth.

Excessive red tape impedes market entry but can also affect the prospects of companies', especially small businesses by limiting their possibilities to grow domestically and internationally or to export because transaction costs are increased by unnecessary administrative procedures. Particularly burdensome areas are related to time and cost to start a business and to acquire licenses. 35 In several EU countries like for instance in Slovenia, Spain and Italy, the time needed for an investor to obtain a building permit is particularly lengthy while costs are not negligible. 36  

It has to be noted that the effectiveness of justice systems and of public administrations is very important in order to reduce the above mentioned transaction costs for companies. The 2015 EU Justice Scoreboard shows that there are significant divergences in the effectiveness, i.e the quality, the independence and the efficiency of the justice systems in Member States, and some of them continue to face challenges relating to the functioning of their justice systems. 37 The effectiveness of the public administration is very important too. Despite the fact that many Member States are planning or even implementing ambitious reforms aiming at modernising public administrations and thus facilitating the general business environment, overall data shows that government effectiveness has not improved much across the EU over the past five years. 38 In addition, according to feedback received from Member States, 39 public administrations in general are suffering from insufficient administrative capacities to manage complex projects and lack of technical skills on evaluating, structuring and executing projects, especially PPPs or private-sector delivery models more generally.

1.2.2    Financing constraints

Financial flows to non-financial corporations in the EU are increasing but remain subdued. Financing discrepancies among Member States have been exacerbated, i.e. while certain countries have historically low financing costs, others - especially in the euro area periphery - are still struggling with prohibitively high costs of long term financing, which is a major hurdle for achieving a well-functioning Single Market. Across firms' size, there are significant discrepancies too. SMEs, the backbone of the EU economy, continue to be disadvantaged compared to large firms in terms of interest rates and the overall cost of borrowing, as European banks have increasingly differentiated the lending rates between small and large loans, in particular in the distressed countries of the euro area. 40 This impacted particularly small and newly established businesses.

Figure 1.10:Number of non-financial companies (medium-sized companies with a potential to use stock markets as a source of funding, 2012)


Source:European Commission (Staff Working Document 2015/13); ECB; Eurostat and FISMA calculations.

One of the main issues in the EU financial market is that European corporations are in general too dependent on bank lending and equity markets remain underdeveloped in comparison to other big economies. SME's particularly cannot tap capital markets due to, among others, their size, scant credit information and regulatory and other barriers to SME listing. Only a small minority of them reported having used (or considered using) alternatives to bank loans financing instruments, such as equity (16 %) or debt securities (4 %). Moreover, there are significant differences between Member states regarding access to stock markets as a source of funding (Figure 1.10). Alternative financing mechanisms like venture capital, private equity and other non-bank channels play a very limited role especially for EU SMEs. Private funding for start-ups in the EU is very limited compared to that of their US peers (see Figure 1.11).

Information asymmetries between lenders and borrowers and lack of credit information for potential investors also hinder financing. Around 25 % of all companies and around 75 % of owner-managed companies do not have a credit score. This lack of credit information is due to many factors, including: lack of clear accounting guidelines to value intangible assets which affects most start-ups and innovative businesses in the EU; differences in national laws that hinder the collection of information and lack of positive data sharing (e.g. on payment records) in many Member States; fragmentation on the provision of financial information to investors more generally (ex. the financial statements prepared by companies vary greatly from one Member State to another); expensive provision of good quality independent research leading to lack of investment research and analysis on SMEs 41 .

Given the stagnant public spending in ICT R&D, this gap in private funding limits growth opportunities for start-ups and affects investment in innovation too. Examples of how these financing constraints affect the growth of innovative companies can be found in some Member States 42 . For instance in Cyprus, there is a grant scheme for Entrepreneurial Innovation-Developing Innovative products and Services for the international market, supporting 39 innovative companies. Three of them cannot expand further although they have secured international patents because in Cyprus there is no venture capital market and the banks do not give loans to innovative companies that have only intellectual property as collateral. Financing constraints also affect long term investment: more than 75 % of the Member States pointed out the financing constraints (both in terms of public and private sources of financing) as barriers to long term investment 43 .

The uncertainty around IPRs mentioned before, acts as a burden to both bank lending and the flourishing of equity markets. The need to ensure that intellectual property assets are appropriately valorised so that innovative firms, in particular SMEs, can raise capital to enhance their economic performance is a key challenge for job creation and growth. According to a recent study undertaken for the European Observatory against IPR infringements by OHIM, intellectual property reliant industries account for 26 % of the EU’s employment and 39 % of EU’s GDP 44

Figure 1.11:Private funding for start-ups in the EU and US


Source:EC Digital Agenda Scoreboard 2014; Dow Jones Venture Source; The New York Times; BCG analysis

1.2.3    Single Market barriers

High levels of trade restrictiveness in business services 45 can hamper the cross border expansion of firms or the development of new business models. Cross border services within the Single Market as a percentage of total services (6-20 % total) are far below those in the US (27-32 %). Across Member States differences are significant too. Figure 1.12 shows that in several EU countries service trade restrictiveness on business services is high. The flash Eurobarometer survey on European businesses and public administration shows that currently only 8 % of SMEs engage in cross-border activities. As also noted in the Commission Staff Working Document ''A Single Market Strategy for Europe – Analysis and Evidence'' 46 despite a considerable reduction in authorisation, registration and licencing requirements following the implementation of the Services Directive, there are still multiple restrictions in place: 47 These are linked inter alia to the obligation of service providers to obtain authorisations in the country where they provide services even if they have already obtained the same or similar authorisations in their country of establishment, the limited validity of authorisations (territorial and/or time restrictions), and the requirement to register with a chamber or professional association. For retail services, in addition to the large number of obligations for authorisations and permits, conditions are often associated to the size and location of the establishment. Moreover, certain operational requirements may have significant effects on the competitiveness of the retail sector or on cross-border trade and investment.

Figure 1.12:Services Trade Restrictiveness for legal, accounting, engineering and architect services


Note:The chart shows the overall restrictiveness per country as the sum of the trade restrictiveness indicators for the four professions mentioned, based on an assessment by the Commission services. For further detail, see: European Commission, (2015), Staff Working Document, A Single Market Strategy for Europe – Analysis and Evidence, SWD(2015) 202 final.

Source:European Commission, own assessment

Several Member States have restrictions that limit the possibility for a company to expand cross border and grow (see Figure 1.13). For instance in Greece, significant restrictions exist for investment in sectors like maritime and air transport 48 . In the maritime transport sector, the limitation on foreign equity participation is set to less than 50 % and cabotage is not permitted for non-EU registered vessels, with the exception of cruise ships. In air transport, the air transport investment regime restricts foreign equity participation to less than 50 % and effective control of the airline must be in EU hands. Retail establishment rules are particularly restrictive in Denmark and Finland, in particular for the opening of new large retail outlets. Operational restrictions are also present in Hungary, with the presence of a food safety inspection tax, restrictions prohibiting Sunday and night opening for large shops and a provision prohibiting selling groceries by companies operating with a loss in two consecutive years.

Figure 1.13:Market entry restrictions in several Member States


Note:Restrictiveness (Index China 100)

Source:OECD Service Trade Restrictiveness Index

Inefficiencies in public procurement across EU Member States can also limit cross-border expansion or growth in the domestic market or even the development of new business models. 49 Uncompetitive practices (for instance non transparent public procurement procedures and fragmentation of calls) are an obstacle to companies' involvement in public procurement. 50 These restrictions prevent smaller companies to grow as they are more vulnerable to uncompetitive practices such as obstacles to involvement with public procurement. A recent study 51 indicates that the increased publicity requirements induce more entry into public procurement while increasing the likelihood that the winner would come from outside the region of the public administration. However transparency of below threshold procurement varies greatly: 52 National thresholds for publication range from less than €10,000 in Portugal to €134,000 in Italy for goods and services, and there is similar diversity in works. Finally, there are also divergences as regards the length of review procedures and costs of litigation, which may further discourage cross border participation. 53

Several barriers in the EU hamper the development of e-commerce though the establishment of new businesses or the expansion of existing ones or the development of new business models. For instance data localisation requirements force companies to store data on servers physically located inside a particular Member State not allowing them to keep processing facilities outside their territory. Processing of consumer data is extremely important for several industries and this situation limits their growth potential. Indeed it has been estimated that the negative impact of data localisation requirements on EU GDP is 0.4 %. 54 In the area of veterinary medicinal products some Member States introduced national controls on online sales of veterinary medicines (e.g.: United Kingdom, Germany, Ireland), and others have no controls or forbid it (Austria and Belgium). This fragmentation reduces the potential benefits that retailers of veterinary medicines (in particular SMEs and micro-enterprises) could have from operating on a larger, EU-wide market and from developing new services for consumers 55 .

Investment in innovation can be hampered by a non-harmonised Single Market in several sectors. For instance, digitisation of the health sector is hampered by several regulatory inefficiencies and non-harmonised rules linked to security (e.g. varying rules on secondary use of data), access and update of data (e.g. lack of harmonisation on patients’ consent as well as rights to erase and correct data and/or the lack of harmonisation of professionals having access to the data), barriers to cross-border transfer of data and the lack of a common strategy to coordinate deployment of e-prescriptions.

1.3    Investment Plan

Implementing the President's political guidelines, presented to the European Parliament in July 2014, the Commission proposed an Investment Plan which aims to mobilise at least EUR 315 billion in the next three years by supporting investment in the real economy and creating an investment-friendly environment. It will help maximising the impact of public spending and unlocking private investments. Its main objectives are to reverse the drop in investment, boost competitiveness in strategic areas and strengthen the European dimension of EU knowledge, human capital and physical infrastructure, and the interconnections that are vital to the EU Single Market. This is addressed through three mutually supportive strands.

The first strand (or financing strand) is about mobilising finance for investment through the European Fund for Strategic Investments (EFSI). An EU guarantee of EUR 16 billion aims at directing through the multiplier effect more than EUR 315 billion to the real economy. 56 The fund will focus its financing on investments in infrastructure and innovation, as well as finance for small- and medium- sized Enterprises (SMEs). The second strand is all about making this finance reach the real economy. The EU investment project portal (EU IPP) will give the possibility to project sponsors to submit their projects to an open and transparent system thus addressing a major obstacle to investments - the lack of information - by informing investors about available existing and potential future projects. The European Investment Advisory Hub (EIAH) which will be Europe's gateway to investment support, draws together existing expertise in technical assistance, project design and implementation in Member States, the EIB and the European Commission to create a single contact point for project sponsors and investors who need such assistance in order to improve their project plans 57 .

For the first two strands of the Investment Plan to be successful, improving the investment framework conditions in the European economies is crucial. As already mentioned, many obstacles for investment are linked inter alia to the regulatory framework but also to deficiencies in the product, services, and capital markets. The identification and removal of barriers to investment across EU Member States is the key objective of this strand. To improve the business environment and financing conditions, the Investment Plan will include progress towards a Digital Single Market, Energy Union and Capital Markets Union. The Digital Single Market will unlock on line opportunities by bringing down barriers. The Energy Union will create a fully integrated internal energy market by reducing technical and regulatory barriers. The Capital Markets Union (CMU) will create deeper and more integrated capital markets in the 28 Member States of the EU. The Capital Markets Union Action Plan launched in September 2015 is based on four key principles: creating more opportunities for investors; connecting financing to the real economy; fostering a stronger and more resilient financial system; deepening financial integration and increasing competition. The Action Plan foresees some key early actions. 58  

In addition, the Single Market Strategy targets at deepening of the Single Market by removing barriers to the free movement of goods and services and enhancing implementation of existing Single Market rules. The Better Regulation package adopted by the European Commission earlier this year sets the scene for better regulation in the coming years by having as main objectives the better assessment of impacts, more consultation with stakeholders and better evaluation.

Further to these initiatives, the Commission has started working on the identification of country and sector-specific barriers to investment that will be addressed in the context of the European Semester. Moreover, a set of investment barriers in chemicals, minerals and recycling, has been outlined as a result of consultations with potential investors. Specific obstacles concern for example difficulties with long-term electricity contracts, land-use planning and sometimes an inappropriate approach to the implementation of permitting, regulatory barriers for bio-nutrients, regulatory uncertainty for carbon capture and use, regulatory uncertainty for plastics recycling, or unfair competition on biomass markets or the functioning of waste markets. Work on identifying investment barriers in other industry sectors than the ones mentioned above is currently ongoing.

1.4    Conclusions

The fact that European economies (unlike in the US) did not manage to rebound to their pre-crisis investments levels shows that there are some consistent barriers that continue to hinder investment in the EU. This chapter tried to analyse these barriers and to identify their impact on specific sectors or types of investment by giving some specific examples where possible from Member States. The taxonomy proposed includes three types of obstacles:

First, barriers linked to regulatory instability, unpredictability, overregulation or bad regulation which impact all types of investment decisions but mostly longer term ones. Investments with longer pay back periods like the ones in the energy sectors need in general not only political but also regulatory stability. It was also shown that regulatory inefficiencies generally increase running costs for businesses especially for SMEs. The third strand of the investment plan aims at improving the investment framework conditions. The Better Regulation package adopted earlier this year, aims at making regulation more lean, consistent and agile.

Second, obstacles linked to financing constraints. Although there are significant discrepancies among EU Member States, European firms are in general too dependent on bank lending and equity markets remain underdeveloped in comparison to other big economies like the US. This coupled with information asymmetries and other restrictions, limit investment opportunities, expansion potential and innovation of EU firms. In this case, investment in innovation is particularly hit as smaller and more innovative companies face significant challenges in accessing seed stage and early stage venture capital. The financing strand of the Investment Plan will mobilise finance for additional investment through the European Fund for Strategic Investments (EFSI) while the Capital Markets Union will explore ways of reducing fragmentation in financial markets, diversifying financing sources, strengthening cross border capital flows and improving access to finance for businesses, particularly SMEs.

Third, Single Market barriers, like differences in business services across Member States, public procurement inefficiencies, other restrictions like in the area of acquisition of land or real estate and several barriers in the area of e-commerce. These obstacles can limit cross border expansion opportunities, creation of new business models and investment in innovation. The Single Market Strategy to which this report is attached, aims at deepening the Single Market by removing unnecessary barriers to the free movement of goods and services and above mentioned restrictions in order to favour investment inter alia in innovation.

The Letter of Intent from President Juncker and First Vice-President Timmermans to the Presidents of the European Parliament and the Presidency of the Council accompanying the President's State of the Union speech 2015 indicated that the identification of key obstacles to investment at national level will be a priority of the 2016 European Semester.

The economic recovery in Europe is gaining strength. While this is encouraging, we seem destined to return to weak growth rates. Economic expansion alone is not enough to guarantee lasting and sustainable growth. As the possibilities for accumulating capital and labour appear limited, the onus is on productivity to drive long-term growth. But the long-term trend of declining productivity growth has not been reversed yet. 59 The barriers that have hampered investment and lowered capital accumulation (see chapter 1) are also responsible for the slowdown of productivity growth. Revitalizing investment is needed to improve productivity.

The problem of low productivity remains therefore one of the greatest threats to improve competitiveness and raise living standards. The generalised productivity slowdown and the opportunities from a better allocation of resources and innovation offer a window of opportunity to the EU to improve global competitiveness. A strong commitment to productivity-enhancing structural reforms is needed. However, while common principles may apply, reforms should be country and sector specific.

2.1    The evolution of sectoral performance

2.1.1    GDP composition

Economic development has been characterised by a gradual shift of activity and resources from agriculture to manufacturing, followed by a shift from manufacturing towards the service sector. The tertiary sector has gained in importance, both in terms of employment and output, and all EU economies are becoming increasingly services economies, in terms of both the share of value-added and the share of employment generated in services sectors. However, there are still relevant differences across Member States. As shown in Figure 2.1 below, the weight of manufacturing is overall higher in Central and Eastern European (CEE) Member States and several EU-15 Member States. As concerns services, all CEE Member States have a share of total value added below the EU average.

Figure 2.1:Relative contributions to total value added in the EU and Member States (2014)


Note:2014 data for EU and all Member States but Luxembourg (2013) and Romania (2012. Data for Bulgaria not available.

Source:Own calculations based on Eurostat data

There are several possible explanations for the increasing importance of services in the economy. First, income elasticity of demand for certain services (education, health, leisure related, and personal services, among others) is higher than for most manufactured goods. This high income elasticity together with increases in income in the EU-28 during the period studied resulted in a disproportional increase in the share of services in the economy. Second, the use and relative cost of services as intermediate inputs in manufacturing increased during this period. Third, productivity increased faster and prices increased more slowly in manufacturing than in services. Finally, manufacturing was more exposed to competition from low cost producers outside EU, which could lead to reduction in manufacturing production and reallocation of resources within the EU towards services, which were less exposed to such competition.

Figure 2.2 below shows that during the period 2000 to 2014 the shares of agriculture, industry and construction in GVA decreased, while the shares of services increased. These changes resulted in services (market and non-market) 60 accounting for 74 % of the GVA in 2014. During the same period, the share of manufacturing decreased from 18.8 % to 15.3 %.

Figure 2.2:Shares in EU-28 GVA by sector (2000-2014)


Source:European Commission, EU Structural Change 2015, DG GROW.

The share of services in GVA has increased overall by 0.4 percentage points, with respect to 2009. Figure 2.3 below shows that the service sector accounts for more than 59 % in GVA in all Member States. In ten of them – Luxembourg, Cyprus, Malta, Greece, the United Kingdom, France, the Netherlands, Belgium, Portugal and Denmark – it even accounts for more than 75 % of GVA in 2014. Only six Member States – Germany, Estonia, Lithuania, Hungary, Slovenia, and the Czech Republic – have seen a reduction in the weight of the services sector. These are Member States were the relative importance of this sector was already below the EU average, while that of their manufacturing sector was well above the EU average.

Figure 2.3:Services as a percentage of gross value added (2009 and 2014)


Source:Eurostat

The relative importance of manufacturing has increased overall by 0.5 percentage points, with respect to 2009. However, performances vary slightly among Member States and across time, as shown in Figure 2.4. It is interesting to note that, with the exception of Germany, the seven Member States with a larger manufacturing sector (as percentage of GVA) — the Czech Republic, Hungary, Slovenia, Germany, Romania, Slovakia and Lithuania — mostly catching-up economies that are likely to grow more than the EU average in years to come.

Figure 2.4:Manufacturing as a percentage of gross value added (2009 and 2014)


Source:Eurostat

After several difficult years at the start of the century, EU manufacturing output expanded rapidly from 2003 to 2008, when it peaked. It then fell by almost 20 % in 2008 and 2009 as the full force of the recession required manufacturers to close down, or at any rate downsize in order to survive. From its lowest point in 2009, manufacturing has recovered more than half the output lost in 2008–2009 but remains lower than pre-recession peak production in most Member States. On average across all Member States, the negative gap is around 9 %, but in crisis-stricken economies such as Cyprus, Greece and Spain, manufacturing output only represents 60–75 % of pre-recession levels. In fact, in fifteen Member States manufacturing output remains lower than before the recession, in nine it is higher, and in the remaining four (Austria, Germany, Hungary, Netherlands) it is very close to pre-recession levels.

In other parts of the world, manufacturing has recovered more quickly than in the EU. Despite initially rebounding quicker than in the United States, EU manufacturing has since fallen behind in recovering from the recession. 61 In many Asian economies, manufacturing output plunged deeper than in the EU or the United States, but recovered much faster. 62 A case in point is South Korean manufacturing, which returned to pre-recession levels of production in less than 18 months. 63 Even in Japan — initially hit harder by the crisis than any of the other three economies — the economy recovered almost at a par with South Korea for some time, until the devastating earthquake and tsunami of 2011 dealt a second blow to the economy.

From a sectoral perspective, most sectors experienced growth in 2014 (see Figure 2.5). 64 However, in spite of recent strong output increases in certain sectors, only three sectors have exceeded their pre-crisis production levels (pharmaceuticals, other transport equipment and food and beverages) while motor vehicles is nearly at the same level of production as before the crisis. At the other extreme of the performance spectrum, other non-metallic products, textiles, basic metals and chemicals saw their production levels fall and are still far from their peak production.

Figure 2.5:Sectoral performance of manufacturing output in the EU-28 (2014 and 2008-2014)


Source:Eurostat

Given its importance in terms of upstream and downstream links to other sectors of the EU economy, as well as internationally in the global value chain, it is worth highlighting the motor vehicles, trailers and semitrailers sector and its remarkable recovery after the crisis. The initial impact was considerably more severe than in most other EU manufacturing sectors: from early 2008 to early 2009, output fell by more than 40 %, production plants were closed down or offshored, employees were laid off, and some manufacturers went out of business. However, the sector survived in a smaller, restructured and (presumably) more efficient form and rapidly expanded production. Two years after its lowest point in 2009, production had increased by 70 %, and since then it has edged within a few percent of its peak in early 2008. For 2014 as a whole, production reached an all-time high.

As concerns services, reliable data on output volumes are difficult to obtain except for retail trade, where trade volume grew rapidly and consistently until it peaked in 2008. After the crisis and throughout the recession it fell back but is now rising again. For all services apart from retail trade, only turnover data are available, showing a steady increase over time, although with no reliable way of distinguishing between the effects of price and volume changes.

2.1.2    Employment evolution

In EU manufacturing, both employment and production fell sharply during the longest and deepest recession in European post-war history but have since recovered somewhat and, in the case of manufacturing employment, returned to the same level as in 2010. Between 2013 and 2014 employment in manufacturing grew by 160 000 units. However, 1.7 million jobs still need to be recovered in the EU manufacturing sector with respect to 2009.

Figure 2.6:Production and employment in EU manufacturing (2000-2014)


Source:Eurostat

There is no contradiction between the long-term trends of falling manufacturing employment and cyclically growing output (see Figure 2.6), on the one hand, and the diminishing contribution of manufacturing to total value added on the other hand. Both are in fact driven by the higher productivity growth in manufacturing than in services. Being able to produce as much or more goods with less input (of labour, capital, energy, intermediate goods, raw material) means that output can increase even though employment goes down, while at the same time the relative prices of the goods are pushed down because of competition. 65 Therefore the value of the produced goods does not increase by as much as the volume and over time manufacturing tends to represent a smaller proportion of total value added.

Concerning services sectors, they now employ more people than ever before and are set to continue expanding their employment. Employment in services diminished in 2008 and 2009 as a result of the crisis but quickly recovered and is now higher than ever before.

2.1.3    The impact of changes in the economic structure of the EU on wages and the quality of jobs

The changes in the composition of GVA of the EU and its economic structure have impacts on the distribution of jobs across sectors and the absolute level of employment, but they also have an impact on the quality of those jobs and the distribution of wages. The new jobs created in manufacturing will not have the same characteristics as those destroyed during the crisis. Since 2011, net employment has been created mostly in the low and high-paid levels leading to a greater polarisation of employment (Figure 2.7). 66 This trend is repeated for manufacturing (Figure 2.8). However, high-tech industry has been capable of providing a wider range of mid and high paying jobs, corresponding to mid-paid technicians 67 and well-paid managerial administrative roles, while employment has been destroyed across all wage quintiles for low-tech industry. However, during 2014 the polarisation trend was somehow eased. While services continued creating jobs at the lower extreme of the wage distribution, manufacturing created jobs in the top three quintiles, contributing to a more even distribution of jobs along the pay scale.

Figure 2.7:Change in employment (1000 jobs) by wage quintiles for EU-27 by sectors (2011-2014)


Note:Wage quintiles are numbered from 1 (= lowest wage levels) to 5 (=highest wage levels).

Source:Eurofound

Figure 2.8:Change in employment (1000 jobs) by wage quintiles for EU-27 by industry sectors (2011-2014)


Note:Wage quintiles are numbered from 1 (= lowest wage levels) to 5 (=highest wage levels).

Source:Eurofound

The distribution of job creation across sectors and the quality of those jobs presents significant differences across Member States (Figures 2.9 and 2.10). Germany and France have experienced employment creation mainly in the lower quintiles of the wage distribution. While Germany has seen employment growth both in the manufacturing and services sector, France has only created net employment for the latter. On the other hand, employment losses continued across the board in the southern Member States, more so in Greece and Spain where no wage quintile has experienced net job gains during the period 2011-2014. Italy has only seen a significant growth of low-paid services jobs. Zooming into the creation of jobs in industry, high paid jobs are being created, or destroyed at a slower pace, in high-tech sectors.

Figure 2.9:Change in employment (1000 jobs) by wage quintiles for selected Member States and industry sectors (2011-2014)


Note:Wage quintiles are numbered from 1 (= lowest wage levels) to 5 (=highest wage levels).

Source:Eurofound

Figure 2.10:Change in employment (1000 jobs) by wage quintiles for selected Member States and sectors (2011-2014)


Note:Wage quintiles are numbered from 1 (= lowest wage levels) to 5 (=highest wage levels).

Source:Eurofound

This polarisation of jobs can also be seen in terms of tenure.  During the crisis, manufacturing job tenure increased showing that job destruction was centred in the late arrivals to the sector which should be the youngest and more qualified. 68    


(1) ()Cette G., Fernald J. and Mojon B., (2015) "The Pre-Global-Financial-Crisis Slowdown in Productivity", http://ec.europa.eu/economy_finance/events/2015/20151001_post_crisis_slump/documents/j._fernald.pdf
(2) ()The Conference Board Productivity Brief 2015, May, http://www.confeence-board.org
(3) ()There is an important and growing academic and political debate about long trends in productivity. While there is statistical evidence of a decline in productivity growth, this debate has raised relevant questions regarding the reliability of official statistics to measure investment and productivity growth, especially at a time when new technologies are being introduced. Actual growth and investment might be underestimated, at least in part, by traditional sectoral classifications and accounting methods (see for instance Fernald, J. “Productivity and Potential Output Before, During and after the Great Recession,” NBER, working paper n. 20248, 2014). While acknowledging the importance of this debate and in the absence of more reliable new indicators of productivity growth, this report will rely on standard indicators of productivity.
(4) ()The impact of this digitisation gap can be measured by the contribution of ICT to GDP growth. Since 1990 the slow uptake of ICTs has limited EU growth by nearly 5 percentage points. Considering the ICT investment levels and the contribution to GDP growth, the EU would have to invest 335 billion Euros in order to close the accumulated gap with the US. That would be 5 times the total ICT investment level of the EU in 2013. The impact of this digitisation gap can be measured by the contribution of ICT to GDP growth.
(5) ()Data for 2014 are more positive with a 7,5 % increase but for EU-24 (excluding, Croatia, Spain, Italy and Finland).
(6) ()Marinello, M.; Sapir, A.; Terzio, A. (2015). The long road towards the European Single Market. Bruegel W. P. 2015/01.
(7) ()Blanchard, Olivier. 2004. "The Economic Future of Europe." Journal of Economic Perspectives, 18(4): 3-26.
(8) ()This report replaces the Report on European Industrial Performance of Member States – produced in the past in the context of Art. 173 TFEU - and the Single Market Integration Report – previously annexed to the Annual Growth Survey. It also incorporates information produced by the Commission in 2014-2015 in the context of monitoring EU competitiveness (including the EU Structural Change Report 2015) and financial market integration (European Financial Integration Report).
(9) ()This report will not go in depth into many important Single Market issues because they are discussed in the Staff Working Document supporting the Single Market Strategy (SWD(2015) 202).
(10) ()Investment rates are given as a percentage of GDP. Source: World Bank Data.
(11) ()Total investment in the EU in the second quarter of 2014 was about 15 % below the 2007 figures. The decline in investment was even more significant in some MS: Italy (-25 %), Portugal (-36 %), Spain (-38 %), Ireland (-39 %), and Greece (-64 %). Source: European Commission, Communication on the Investment Plan, COM(2014) 903 final.
(12) ()Annual Growth Survey 2015 COM(2014) 902 final.
(13) ()European Commission (2015), EU Structural Change 2015 report.
(14) ()Investment in Building Materials, Paper & Wood, Metals and Chemicals dropped during the period 2008-2011 respectively by 15 %, 9 %, 8 % and 3 %. Source: Eurostat.
(15) ()Investment ratios as a percentage of GVA in several service sectors increased as well. For instance in legal accounting activities and architectural and engineering activities investment ratios increased between 2007 and 2012 by more than 13%. Source: Eurostat.
(16) ()An important part of GFCF spending before the crisis was the (over) investment in construction/dwellings. It created bubbles (together with irresponsible behaviour of financial markets participants etc.) and was one of the causes of the crisis in some MS (SP, IE).
(17) ()For services, only statistics for the evolution of output in ''Retail & Trade'' are available but not presented here as they would not be representative of the whole sector.
(18) ()Examples from Member States are given for illustrative purposes and are not representative.
(19) ()The increase in energy costs may lead to the relocation of investment across sectors or countries and labour market inflexibilities can also have negative impacts on companies' investment decisions.
(20) ()World Bank Doing Business, World Economic Forum Competitiveness Report, flash Eurobarometer Survey on European Businesses and Public Administration).
(21) ()Special Task Force (Member States, Commission, EIB) on Investment in the EU. Final Task Force Report (Annex 3).
(22) ()According to a study from IMF (), financial constraints, high uncertainty and corporate sector leverage are additional impediments to investment particularly in stressed economies, namely Italy, Portugal and Spain. Source: IMF working paper. Investment in the euro area, why it has been so weak?
(23) ()Three EU Member States are among the top 10 countries with the most business friendly climate; but more than half of the Member States are not in the top 30 and eight Member States are not even in the top 50. Source: World Bank Group (2015), Doing Business report.
(24) ()According to this survey, for more than three quarters of European companies (77 %) the lack of predictability and stability of legislation in their country is an obstacle to their company’s activity.
(25) ()According to Commission estimates, a 10 % reduction in administrative burdens can over time increase investments by 0.6 percentage points and GDP by 0.8 percentage points.
(26) ()For instance Austria has submitted a PPP project (an environmental friendly Pump Storage Hydro Power Plant Pfaffenboden in Moll). According to the Austrian authorities, the investment climate in the European electricity market is poor and the volatile regulatory framework conditions increase the risk for this long term investment. Source: Special Task Force (Member States, Commission, EIB) on Investment in the EU. Final Task Force Report (Annex 2), December 2014.
(27) ()European Commission (2015), Regulatory Fitness Check for the petroleum refining sector, Staff Working Document, forthcoming.
(28) ()Earnings before interest, taxes, depreciation and amortisation (EBITDA). Source: CEPS and Economisti Associati (2013), Assessment of cumulative cost impact for the steel and aluminium industry.
(29) ()The European Chemical Industry Council.
(30) ()European Commission, Impact assessment report on the revision of the “Clinical Trials Directive” 2001/20/EC Accompanying the document: Proposal for a Regulation of the European Parliament and of the Council on clinical trials on medicinal products for human use, and repealing Directive 2001/20/EC {COM(2012) 369 final}, SWD(2012) 200 final.
(31) ()European Commission, Impact Assessment accompanying the document Proposal for a Regulation of the European Parliament and of the Council on veterinary medicinal products {COM(2014) 558 final}, SWD(2014) 274 final.
(32) ()European Commission, (2015), A Single Market Strategy for Europe – Analysis and Evidence, SWD(2015) 202 final.
(33) ()PwC (2014), The sharing economy – sizing the revenue opportunity.
(34) ()Maximum weights for 5-axle articulated vehicles differ across Member States: Some of them (for instance Italy, Netherlands) have set the limit at 44 tons, while others (like Poland and Germany) do not allow loads over 40 tons.
(35) ()World Bank Group (2015), Doing Business 2015 Report.
(36) ()Slovenia ranks in the 90th place, Spain in the 105th place and Italy in the 116th place for the time needed to get a building permit. Source: 2015 World Bank Doing Business report. In Spain the case of environmental permits is very important since businesses organisation’s claim that current delays amount to 30 months on average.
(37) ()European Commission (2015), The 2015 EU Justice Scoreboard, COM(2015) 116 final.
(38) ()According to the government effectiveness indicator of the World Bank which captures the perception of the quality of public service, its independence from the political process, the quality of policy formation and the implementation and credibility of the government commitment to policies, the ranking of fourteen Member States fell in 2014 compared to 2008.
(39) ()Special Task Force (Member States, Commission, EIB) on Investment in the EU. Final Task Force Report (Annex 3), December 2014.
(40) ()2014 ECB SAFE data.
(41) ()European Commission, Initial reflections on the obstacles to the development of deep and integrated EU capital markets Accompanying the document Green Paper: Building a Capital Markets Union {COM(2015) 63 final}, SWD(2015) 13; ECB; Eurostat and FISMA calculations.
(42) ()Source: Special Task Force (Member States, Commission, EIB) on Investment in the EU. Final Task Force Report (Annex 3), December 2014.
(43) ()idem.
(44) ()https://oami.europa.eu/tunnel-web/secure/webdav/guest/document_library/observatory/documents/IPContributionStudy/executive_summary/executive%20summary-en.pdf.
(45) ()Since 2008, the definition of "business services" used by Eurostat is based on NACE Rev2. It includes NACE Rev 2 codes: J62, N78, J582,J631, M731, M691, M692, M702, M712, M732, M7111, M7112.
(46) ()European Commission, (2015), A Single Market Strategy for Europe – Analysis and Evidence, SWD(2015) 202 final.
(47) ()According to the 2015 Commission assessment, authorisation requirements and procedures in civil engineering, accounting and architecture are in place for one or more of these professions in 24 out of 28 Member States.
(48) ()The OECD Services Trade Restrictiveness Indices (STRI) for maritime and air transport are the highest in the country. Source: OECD.
(49) ()Only a very low proportion of public contracts published at EU level, (1.6 % or 13.4 % if subsidiaries are taken into account) are awarded to companies coming from different Member States.
(50) ()European Commission, Flash Eurobarometer 417.
(51) ()Decio Coviello and Mario Mariniello (2014). Publicity requirements in public procurement: Evidence from a regression discontinuity design,  Journal of Public Economics , 2014, vol. 109, issue C, pages 76-100.
(52) ()European Commission, (2015), A Single Market Strategy for Europe – Analysis and Evidence, SWD(2015) 202 final.
(53) ()European Commission (2015), The 2015 EU Justice Scoreboard, COM(2015) 116 final http://ec.europa.eu/justice/effective-justice/ files/justice_scoreboard_2015_en.pdf.
(54) ()ECIPE estimates (2014) – estimates for only 6 countries in addition to the EU. See: European Commission (2015), A digital Single Market Strategy for Europe – Analysis and Evidence, SWD(2015) 202 final; ECIPE (2014), 'The costs of data localisation: friendly fire on economic recovery'', and the European Commission workshop ''Facilitating cross border data flow in Europe - on data location restrictions''. BCG analysis.
(55) ()European Commission, Impact Assessment Accompanying the document Proposal for a Regulation of the European Parliament and of the Council on veterinary medicinal products {COM(2014) 558 final, SWD(2014) 274 final.
(56) ()The leverage effect of the EUR 21 billion capital (including an extra 5 billion from the EIB) of the EFSI is that each euro of capital generates EUR 15 worth of investment.
(57) ()Since September 2015, the European Investment Advisory Hub (EIAH) is operational. The Advisory Hub is a partnership between the Commission and the EIB and consists of three complementary components: 1) a single point of entry to a wide range of advisory and technical assistance programmes and initiatives for public and private beneficiaries, provided by high-level experts; 2) a cooperation platform to leverage, exchange and disseminate expertise among the EIAH partner institutions and beyond; and 3) an instrument to assess and address new needs by reinforcing or extending existing advisory services or creating new ones as demand arises.
(58) ()New rules on securitisation; new rules on Solvency II treatment of infrastructure projects; public consultation on venture capital; public consultation on covered bonds; assessment of cumulative impact of financial legislation.
(59) ()There is an ongoing debate on the measurement of productivity. Various economists have highlighted the limitations of the standard measures that may be biasing down productivity growth, such as: the incapacity for capturing quality improvements; time lags for capturing changes; and the existence of activities not captured by GDP. For instance, the United Kingdom has launched an independent review of economic statistics which is expected to address these issues among others. Adjusting for these measurement errors may indeed attenuate the decline in productivity growth. Yet, this report focuses on factors behind the productivity slowdown that are not related to measurement. On the debate on productivity measures, cf. Citi, Global Economics View – poor productivity, poor data, and plenty of polarisation, Citi Research, August 2015. On the UK independent review of economic statistics, cf. UK HM Treasury and Cabinet Office, Review of economic statistics: call for evidence, August 2015.
(60) ()Market services are those services produced for sale on the market at a price intended to cover production costs and to provide a profit for the producer (e.g. retail, financial intermediation). Non-market services are those services provided free of charge, or at a price that is not economically-significant i.e. does not reflect production costs (e.g. public health, education).
(61) ()US manufacturing output has grown consistently from its lowest point in 2009 — by 6.1 % in 2010, 3.4 % in 2011, 4.1 % in 2012, 2.6 % in 2013, and 3.6 % in 2014 — and now exceeds pre-crisis levels by a small margin.
(62) ()The corresponding average for Japanese manufacturing was more than 15 % below peak production, whereas South Korean manufacturing output was 20 % higher than its pre-crisis peak in 2008.
(63) ()Some of the main reasons for South Korea’s rapid recovery from the crisis are explained in OECD (2011).
(64) ()The fastest growing sectors over twelve months were pharmaceutical products and preparations; coke and refined petroleum products; computer, electronic and optical products; motor vehicles, trailers, semi-trailers and other transport equipment. The greatest output losses over the same twelve months occurred in tobacco.
(65) ()A measure that could take into account both productivity and competitiveness is profitability. Cf. Amoroso, Sara & Moncada-Paterno-Castello, Pietro (2015), Profits, R&D and the demand for labour, JRC-IPTS Working Papers on Corporate R&D and Innovation (forthcoming); and Brännback, Malin, Alan L. Carsrud, and Niklas Kiviluoto (2014), Understanding the Myth of High Growth Firms, Springer, New York.
(66) ()Eurofound (2015). Upgrading or polarisation? Long-term and global shifts in the employment structure, European Jobs Monitor 2015. 
(67) ()Jobs were allocated to quintiles in each country based on the job-wage ranking for that country. Mid-paid technicians correspond to quantile 3 and represent close to 20 % of employment in the relevant period. Cf. Eurofound, (2015). 
(68) ()RWI (2015). Labour market transitions in turbulent times. Research Project Report for Eurofound. 
Top

Brussels, 28.10.2015

SWD(2015) 203 final

COMMISSION STAFF WORKING DOCUMENT

Report on Single Market Integration and Competitiveness in the EU and its Member States

Accompanying the document

COMMUNICATION FROM THE COMMISSION TO THE EUROPEAN PARLIAMENT, THE COUNCIL, THE EUROPEAN ECONOMIC AND SOCIAL COMMITTEE AND THE COMMITTEE OF THE REGIONS

Upgrading the Single Market: More Opportunities for People and Business

{COM(2015) 550 final}
{SWD(2015) 202 final}


This limited capacity of generating mid-paid jobs will be of key importance for the digitisation of industry. Available estimates for the US conclude that in less than two decades up to 47 % of total employment will be at risk of disappearance due to computerisation, 1 with the risk increasing the lower the wage or the educational attainment. This means that there is a need to find other tasks and sectors capable of absorbing these employment losses, probably in areas which demand creativity and social intelligence. It is therefore necessary to eliminate obstacles to the reallocation of resources both within Member States and in the Single Market.

In this respect, it is important to consider not only the impact of the composition of the economic structure, but also the impact of regional specialisation on wages. Data from the European Cluster Observatory analysed in a recent study 2 not only illustrates the substantial variety in wages between sectors (at a more detailed level), but also that wages depend on the extent to which the employment is regionally concentrated and specialised in clusters. The wage gap between clusters and non-clusters shows that, overall, average wages are higher in clusters (EUR 25,672 compared to EUR 24,870 outside clusters), pointing to somewhat higher productivity levels. The wage differences can be particularly large in high-tech and medium-tech manufacturing industries such as chemicals, aerospace, biopharmaceuticals, communications equipment and medical devices. Also in high-wage services sectors, such as financial and business services and insurance services, the wage difference is substantial. 3  

2.2    Overall evolution of productivity

It is essential to boost productivity to make the recovery sustainable and avoid the risk of falling back to weak growth rates. A recovery based on factor accumulation may lead to an undesirable misallocation of production factors. The negative effects of such scenario became apparent in the case of Spain, where a period of economic expansion with negative total factor productivity (TFP) growth led to the deterioration of competitiveness and the emergence of significant imbalances. 4 Promoting productivity growth is therefore crucial to improving competitiveness in Europe.

Reducing the distortions hampering a more efficient allocation of resources towards most productive firms could lift productivity. There are indications that the productivity slowdown has been largely due to policy-induced misallocations within sectors. 5 The payoffs of structural reforms tackling these hurdles are potentially large. Yet there is no “one size fits all” solution and reforms should take into account the varying structural conditions of sectors and Member States.

2.2.1    Labour productivity in industry

Labour productivity 6 indicates how efficiently the production inputs related to workforce are combined to produce goods and services, offering a measure of economic growth, competitiveness and living standards.

Figure 2.11 depicts labour productivity in manufacturing on the horizontal axis, while the vertical axis shows growth from 2008 to 2013. 7 Denmark is the only country reporting both above-average productivity and sustained growth in the period 2008-2013. Countries in the upper left quarter show a convergence trend. Their productivity levels are still below average but have been growing consistently, reducing their gap with the best performers. A number of countries in this group are catching up rapidly (Estonia, Hungary, Lithuania, Latvia, Poland, and Romania). The other Member States in this group (Czech Republic, Portugal, Slovakia, Slovenia and Croatia) have also improved their performance with respect to the average; however, considering their initial level and the performance of other countries, there seems to be considerable scope for accelerating the convergence path in many of these countries. Most countries laying on the right hand side part of the figure report consistent and stable performance (Austria, Belgium, France, Germany, the Netherlands, and Sweden) but some of them have seen a reduction of their relative competitiveness (Finland and United Kingdom).

Finally, countries in the lower left quarter have experienced a deterioration of their relative productivity (Cyprus, Greece, Italy, Luxembourg, and Malta).

Figure 2.11:Performance and change in manufacturing productivity (2008-2013)


Note:Horizontal axis = value added per person employed in manufacturing (thousand EUR); Vertical axis = difference in percentage with respect to EU compound annual growth rate (2008-2013). Data for Ireland have been excluded from this chart. Data for Bulgaria and Spain were not available. Romania: last available data 2012.

Source:Eurostat

Figure 2.12 shows the evolution of labour productivity at sector level. 8 The growth rates are calculated as averages for the period 2003-2013. We show results for both the EU-28 and the euro area (18 countries). For manufacturing, there has been a moderate improvement for the EU-28 as a whole. But there are significant differences across sectors. The largest improvements for the EU-28 are observable in other transport equipment, as well as in computer, electronic and optical products. Note that both sectors are characterised by high technological intensity, but had a below the EU average productivity level until 2012. On the contrary, the lowest improvements are observable for low-tech industries producing tobacco, leather and wearing apparel.

But the pattern is different for the euro area. When considering this aggregate, the largest labour productivity gain was achieved in the manufacture of computers, electronic and optical products, followed by pharmaceutical products. This could be a reflection of the different specialisations of countries, as well as the outcome of delocalisation of plants in Eastern Europe (in particular for transport equipment).

Figure 2.12:Labour productivity growth in EU manufacturing, 2003-2013


Note:Labour productivity average annual growth rate, volume index of production per hours worked

Source:European Commission, EU Structural Change 2015, DG GROW.

2.2.2    Labour productivity in services

As shown in Figure 2.13 below, in 2013, labour productivity per person employed in services was the highest in Luxembourg, which may reflect the fact that it also has the highest GDP per capita in the EU, at 2.6 times the EU-28 average, and the important weight of its financial services sector. Productivity is closely related to wages. After Luxembourg there is a cluster of EU-15 Member States (Belgium, Italy, France), who have higher productivity and relatively high wages. At the other extreme, productivity in Bulgaria is the lowest as the GDP per capita in Bulgaria is less than half the EU average. Just ahead of Bulgaria we find a host of new Member States (Estonia, Romania, Hungary, Latvia and Lithuania), again reflecting lower GDP per capita feeding into their productivity results.

In the period between 2008 and 2013, there was a positive change in labour productivity per person employed in many Member States. This was particularly pronounced in the Member States which joined the EU since 2004, including Latvia, Lithuania, Poland, Bulgaria, and Slovakia. This development may be the result of the catching up of these countries relative to EU-15 Member States, despite the financial crisis. At the opposite end of the scale, Romania had the greatest negative change in labour productivity during this time period.

In the retail sector, the productivity gap vis-à-vis the United States has continued to widen. As indicated in the Commission Staff Working Document accompanying the Single Market Strategy, 9 the difference can be explained by less restrictive entry regulations, bigger investments in ICT and innovation and the creation of new retail formats in the US. The latter in particular forces incumbents to become more productive and replaces less productive firms with more productive ones. 

There is also a productivity gap between the retail sector and other sectors of the European economy. For example, the retail sector's wage-adjusted labour productivity is significantly lower than the one of manufacturing (119 % compared to 144 %). When compared at EU country-level, wage-adjusted labour productivity is significantly higher than the EU average in Estonia, Latvia, Luxembourg, Malta, Romania, Slovenia, Slovakia and the UK and significantly lower in Bulgaria, Greece, Italy, Hungary, Portugal and Sweden. 10

Figure 2.13:Labour productivity in services


Source:Own calculation on the basis of Eurostat data

2.2.3    Components of labour productivity

Figure 2.14 shows the result of a shift share analysis 11 examining the changes in labour productivity. 12 It shows that in the period 2002-07, labour productivity increased significantly more than in the period 2008-13 (8.75 % vs. 3.61 %). This is not surprising given that the latter period was characterised by the financial crisis and the subsequent recession. Interestingly, most of the change can be explained by a sharp reduction in the contribution of each sector (within effect) in the second period, which dropped from 7.92 to 2.93. In the period 2002-2007, the within effect accounted for 86 % of the total variation (in absolute value), while only 78 % in 2008-2013. This dynamic is mainly explained by the drop of productivity caused by the financial and economic crisis in sectors such as: industry; trade; transport; accommodation services; professional scientific, technical activities; and financial and insurance.

Figure 2.14:Decomposition of labour productivity, EU-28


Note:Shift-Share analysis for 10 sectors classification of economic activities.

Source:European Commission, EU Structural Change 2015, DG GROW.

At the same time, the productivity growth due to changes in labour shares across sectors with different levels of productivity (static shift) remained more stable in absolute value, slightly decreasing from a value of 1.21 % in 2002-2007 to 0.78 % in 2008-2013, but increasing substantially in terms of share (from 13 % to 21 %). This suggests an ongoing structural change in the European economy, for which a larger share of workers is employed in more productive sectors. Data suggests an outflow of employment from agriculture, forestry and fishing and industry to sectors with higher productivity, such as information and communication, finance and insurance, and services in general.

Figure 2.15:Evolution of labour productivity for the EU-28 (2000=100)


Note:Gross value added at basic prices (chain-linked volumes, reference year 2000) per person employed for the EU-28 aggregate.

Source:European Commission, EU Structural Change 2015, DG GROW.

Figure 2.15 shows the evolution of labour productivity across different sectors. The productivity growth due to changes in labour shares across sectors with different productivity growth (dynamic shift) is negative for both periods considered, but the effect is small in magnitude. This suggests that a small extra fraction of workers have been employed by sectors with declining productivity, in particular professional, scientific and technical activities (which includes also administrative and support service activities).

The same analysis can be repeated for individual Member States. For the period 2002-2007, most of the top performers in terms of total productivity changes are CEE Member States (Estonia, Latvia and Slovakia). But only Latvia managed to keep the same standard for the following period. For the period 2008-2013, one notable case is Ireland, whose performance was excellent. While most countries experienced improvements in labour productivity in the period 2002-2007, the crisis had negative consequences in the subsequent time frame, especially for countries like Greece, Finland and the United Kingdom.

In general, the within sector improvements explain most of the changes in labour productivity. This is probably due to the fact that we consider very large sectoral aggregations. But there are interesting exceptions, like Lithuania in the period 2002-2007, during which the static shift was positive and very large. This can be explained by a sharp decrease of the share of employment in the primary sector, matched by an increase both in industry and in trade, transport, accommodation and food service activities.

2.2.4    Convergence process

Convergence at sectoral level

There are huge differences in the productivity within the same sector across Member States (see introductory chapter). A recent IMF staff research on productivity trends 13 confirmed that even the most technologically advanced countries are lagging in certain sectors and could thus reap large gains from adopting existing best practices. For instance, Member States with leading performances in manufacturing such as Germany and Sweden are lagging in ICT and personal services respectively.

There are also large differences across subsectors within the same sector. For instance, in manufacturing, the Member States analysed 14 are simultaneously leaders and laggards in different industries (Figure 2.16). A clear example is the

Netherlands, which is leading on: food, beverages, tobacco; textiles, leather, footwear; chemicals; and basic, fabricated metals. Yet it is largely lagging on wood and cork; transport equipment, and recycling. Overall, there appears to be a larger margin for improvement in the following industries: rubber and plastics, transport equipment; and recycling.

Figure 2.16:Total Factor Productivity level in manufacturing (2000-2007 average, weighted by VA-share; normalized: leader in sector = 100)


Source:IMF (special thanks to Vikram Haksar and his colleagues for this information)

In the services sector, we encounter a similar situation (Figure 2.17). Only the Netherlands appears among the leaders in all subsectors analysed. Yet, even in this case, there are areas with margin for improvement such as renting of machinery and equipment, and other business activities. Overall, the analysed Member States outperform in finance and business services, but underperform in distribution services, particularly on transport and storage.

Figure 2.17:Total Factor Productivity level in services (2000-2007 average, weighted by VA-share; normalized: leader in sector=100)


Source:IMF (special thanks to Vikram Haksar and his colleagues for this information)

It should be noted that the ICT sector appears to offer the larger margin of improvement. Only Sweden is leading in this sector, with all other Member States showing a laggard performance.

To a certain extent, these productivity gaps can be anticipated due to factors such as sectoral R&D intensity or agglomeration spillovers (e.g. manufacturing in Germany). However, the above mentioned analysis suggests that policy distortions are playing a significant role. For instance, regulatory or tax exemptions, subsidies, size-dependent policies, labour and product market rigidities, may all lead firms to make inefficient choices and investment decisions. These policy distortions generate massive losses due to lost productivity gains. If they are tackled, productivity and thus economic growth would be boosted. The wide variation in the regulation of each sector across Member States seems to confirm this result. Fostering Single Market integration would decrease regulatory dispersion and contribute to reduce productivity gaps.

The productivity losses generated by policy distortions in the service sector are among the biggest. Indeed, the heaviest drags on productivity growth have come from service sectors which are often closed to competition, such as non-market, personal and business services. 15 The liberalisation of regulated services sectors could thus be an important source of job creation and output growth.

Convergence at national and regional level

The productivity growth of an economy depends on the productivity of each sector but also on whether the resources are allocated to those sectors with higher productivity growth. However, policy measures can alter that process and lead to the allocation of resources to less productive sectors, thus hampering economic growth. The analysis referred to above suggests that the payoffs from improving factor allocation across sectors are potentially large. Productivity gains from a better allocation within countries could already reach more than 10 % in some cases, boosting economic growth.

There is a wide dispersion between and within Member States as regards regional labour productivity growth from 2008 to 2012 (Figure 2.18). Within Member States, the range from lowest to highest labour productivity change was particularly wide in Greece, Poland and Romania, indicating growing internal competitiveness differentials and divergence.

Figure 2.18:Regional distribution of labour productivity changes (2008-2012)


Source:PWC, (2015), Exploring the potential role of human, physical and knowledge capital investments in a smart specialisation context, a study for the European Commission, DG GROW

While in most countries there were regions with increasing as well as regions with decreasing labour productivity from 2008 to 2012, in some Member States there was positive or negative labour productivity growth in all regions: Bulgaria, Ireland, Slovakia and Sweden (positive growth in all regions); Hungary, Italy and Slovenia (negative growth in all regions). Whilst this may generate convergence at the national level, it adds to the divergence between Member States.

Labour productivity growth took place mainly in regions of Bulgaria, Spain, Portugal, Ireland, Sweden, Poland, Slovakia and the Baltic States. In the central European Member States as well as in Finland, the UK, Greece and Cyprus, most regions experienced falling labour productivity. In many cases, this was due to output cuts greater than labour cuts. In other cases, output grew but not as much as the number of persons employed.

The process of convergence of productivity at regional level seems to have stalled given the wide dispersion in growth rates (Figure 2.18). Indeed divergence has been a stronger force than convergence in the last few years. Resuming the convergence process could produce huge economic gains. A recent study 16 suggests there are three main ways to improve the competitiveness of underperforming regions without hampering that of the best performing: internal and external R&D collaboration; investment in human capital, knowledge, R&D and innovation; and regional absorptive capacity. These areas could therefore be the focus of any regional cluster policies and smart specialisation strategies that need to also consider the strength and bottlenecks of their specific regional economic structure.

Convergence across firms

Recent OECD research 17 shows that there is a rising gap in productivity growth between different types of firms. Productivity growth of the globally most productive firms has remained strong, while that of the rest of firms has slowed. This performance is stronger in the services sector than in manufacturing. Effective measures facilitating the diffusion and adoption of technologies across firms could therefore boost productivity.

The above mentioned research also finds that even if the most advanced national firms have high levels of productivity, they may fail to significantly impact aggregate productivity due to their relative small size. A more efficient allocation of resources towards most productive firms would help them grow and thus boost productivity growth.

2.2.5    Comparison with global competitors: TFP and benchmarking with US

Total factor productivity (TFP) captures changes in productivity which are not accounted for by the changes in the quantities of capital and labour inputs, but rather by the way they are combined, i.e. the degree of their utilisation and the technology or organisation employed in the production. 18 Figure 2.19 shows the evolution of TFP from 2005 to 2014 for the EU-28 against that of some major competitors. During the crisis and in its immediate aftermath, TFP decreased everywhere, reaching its lowest level in 2009. This may be the effect of short run excess capacity due to the drop of demand following the crisis. The crisis hit overall EU TFP severely. The EU lost more than the US by 2009, and the US recovered much faster their pre-crisis levels and continued to grow. Japan – where the damage was similar to that of the EU – also managed to recover faster and to follow a recovery path similar to that of the US.

Figure 2.19:Evolution of Total Factor Productivity (2005-2014)


Note:Index 2005=100

Source:European Commission, EU Structural Change 2015, DG GROW.

Figure 2.20 analyses in more details changes of TFP for the EU Member States and the US. 19 The US has improved its TFP both with respect to 2000 and since the beginning of the crisis. This hints to a stronger resilience of the US economy as compared to Europe. A wide majority of the European Member States performs better compared to their 2000 level of productivity. This is particularly true for some of the new Member States (represented by blue circles), which is an evidence for convergence, in some cases from low starting levels. Yet, the convergence trend seems to be weaker since the beginning of the crisis.

Figure 2.20:Changes in Total Factor Productivity


Note:Solow Residuals in log, total changes for the periods considered

Source:European Commission, EU Structural Change 2015, DG GROW.

The crisis had different impacts on TFP across Member States. Today still more than half of EU Member States have not yet managed to recover their pre-crisis levels (i.e. they are in the left half of the figure), with Greece, Italy, Luxemburg and Cyprus being at or below their 2000 level. For Spain, Italy and Luxembourg, TFP started to decline or stagnated long before the crisis. In the case of Spain the positive development after the crisis could only just offset pre-crisis losses in productivity with regard to 2000. On the other end of the spectrum, some Member States have recorded considerable gains even during the crisis, such as Slovakia, Poland, the Baltic countries, Ireland and Denmark. Overall, the crisis did not interrupt their longer-term TFP performance. Romania stands out with large TFP gains relative to 2000, but the crisis seems to have put it on halt.

Benchmarking with the US

European producers face relatively high input prices, especially as labour and capital are concerned. A recent study by the Boston Consulting Group 20 compares the evolution of production costs in the EU and in 10 of the most dynamic US States and with relatively lower labour costs. The study shows that productivity increases can compensate higher input costs, especially as regards labour costs. Energy costs, especially higher gas cost prices, seem to be more difficult to offset than higher input prices.

Using a similar methodology, Figure 2.21 compares the cost competitiveness of 26 EU Member States (data are not available for Malta and Cyprus) with the US in 2014. We also use labour productivity per hour and different energy input prices from the International Energy Agency (IEA). This explains the differences in the results between the two studies. 21

Figure 2.21:Industry cost index by input components: EU vs US


Source:Own calculations with Eurostat and IEA data.

Figure 2.22:Changes in Industry Cost Index 2004-2014, labour component


Source:Own calculations with Eurostat and IEA data.

This comparison shows that lower labour costs still allow several Member States to remain below the US benchmark of competitiveness in 2014. The figure also shows the difference in total costs in 2014 with 2004. Total costs have increased in all Member States but these cost increases have been more limited in Germany, Austria, Spain, Hungary, Portugal, Sweden and the UK.

Figure 2.22 gives a more detailed account of the evolution of labour costs. In many Member States, the change between 2004 and 2014 in the labour component of production costs has been below the increase in hourly wages. The factors behind this evolution are very different across countries though. Reductions in wages per hour have contributed to smaller increases in the labour component of production costs in Greece, Luxembourg and the UK, and slightly less in Germany and Portugal. Improvements in the productivity per hour have been a major factor limiting labour costs in Bulgaria, Czech Republic, Estonia, Latvia, Lithuania, Hungary, Malta, Poland, Romania, Slovenia and Slovakia. The exchange rate has been a significant factor in Hungary and the UK, too.

Over the last ten years, reductions in the energy component of production costs have been limited. Energy prices are the main driver of this cost component. Only in very few cases, energy efficiencies have been capable of reducing the contribution of energy to production costs (Figures 2.23 and 2.24).

Thus, productivity growth and resource efficiency can compensate to some extent for higher input prices within Europe. However, this requires further investment. This may have an impact on the cross-sectoral reallocation of resources in the near future.

Figure 2.23:Changes in Industry Cost Index 2004-2014, electricity component


Source:Own calculations with Eurostat and IEA data.

Figure 2.24:Changes in Industry Cost Index 2004-2014, natural gas component


Source:Own calculations with Eurostat and IEA data.

2.3    Sources of productivity growth

2.3.1    Digitisation and other advanced technologies

The adoption of a particular technology may have an impact on how efficiently input factors are combined. Accordingly, the use of advanced technologies available may foster the long-term growth of a sector by lowering costs, improving quality and ultimately promoting competitiveness. In recent years, digital technologies are redefining traditional business and production models, resulting in a wide range of product and service innovations. In this way, digitisation has the potential to unfold a catalytic impact on the productivity of large companies and SMEs alike. Ensuring adequate standards in this area is important for keeping and enhancing the comparative advantage of the EU industries, as shown in the economic analysis underpinning the Single Market Strategy. 22  

While the digitisation of EU businesses and digital entrepreneurship have increased, significant differences remain across Member States. 23 Moreover, taking into account four advanced technologies (mobile internet, social networks, cloud and big data), overall only 2 % of EU enterprises make full use of all four, while 41 % are not using any of them. 24  

Also as regards other advanced technologies, EU companies are not adopting such technologies fast enough or in enough scale. A recent survey 25 shows that almost half of European manufacturing companies have not used advanced manufacturing technologies 26 in the past and do not plan to use them in the next year.

Europe is however a global leader in advanced manufacturing technologies in terms of the share of patents but also in terms of the share in total exports. Europe also has a high and increasing trade surplus compared to East Asia and North America in this sector. A main reason for the good performance of the EU in advanced manufacturing components is that new technological solutions in Advanced Manufacturing Technology rest on the integration of other technologies (such as micro- and nanoelectronics, advanced materials or photonics) into complex products where Europe has a comparative advantage. Moreover, the EU can benefit from its long history in developing and applying advanced technologies in manufacturing, and a dense network of Advanced Manufacturing Technology producers and users. 27

However, when considering a broader set of new technologies, the so-called Key Enabling Technologies (KETs) 28 , Europe's performance lacks the lustre it has in Advanced Manufacturing Technology, one of the six KETs. East Asian economies strongly develop their own scientific & technological assets in key enabling technologies, with a global share of KET-related patent applications reaching 44 % in 2011. Europe's share in KETs development has progressively declined from 32 % of patent applications in 2000 to 27 % in 2011 (23 % for North America). Also with regard to performance in trade, East Asia experienced a sharp increase in total exports of KETs-based components and intermediary systems during the last decade, holding now a share of about 57 % compared to 23 % for the EU-28 and 20 % for North America. Europe succeeded however in holding its trade share relatively constant over the past decade.

Among the EU Member States, Germany holds the strongest position in all KETs. In general, Germany performs well above the other European countries in terms of share of patents, share of production, share in total export, and share in turnover. France, Italy and the UK are often among the top five of each KET for several indicators, while Member States like Belgium and Denmark have excellent positions in individual KETs. In terms of trade balance, only Germany, the Netherlands, Belgium, Ireland and Austria have a trade surplus in all six KETs.

2.3.2    R&D and innovation

R&D expenditure as innovation input

In the monitoring of innovation processes, both inputs and outputs need to be considered. Research and development (R&D) expenditures can be regarded as the main input indicator. On the public sector side, government efforts in R&D investment have been largely upheld over the course of the crisis. In about half of EU Member States, the government budget for R&D grew faster (or decreased less) than GDP despite severe budgetary constraints. 29 In parallel, private R&D expenditure as a share of GDP slightly increased between 2008 and 2013. As a result, gross domestic expenditure on R&D (R&D intensity) increased from 1.85 % in 2008 to 2.02 % in 2013 (Figure 2.25). Indeed, at the onset of the economic crisis, EU R&D intensity increased to 1.94 % in 2009 as many EU Member States made an effort to maintain public R&D investment to counter the impacts of the crisis on private investment. This increase is remarkable as it followed a relative stagnation around 1.77 % for the period 2004 to 2007. R&D intensity has then continued to grow marginally since 2011. However, it still remains significantly below the target of 3 % by 2020, pointing to the need for additional investment efforts. 30 In absolute terms, investment in research and innovation has actually decreased during the crisis and remains too low.

Figure 2.25:R&D expenditure on GDP (%) in the EU


Note:For IE total R&D expenditure data refers to 2012; for EL government expenditure on R&D refers to 2007.

Source:Eurostat

Innovation performance in the aftermath of the crisis

In fact, the crisis has left a notable impact on the private sector's innovative activity, with the commercial uptake of innovations constituting a particular weakness. The number of innovative firms is in decline, as are SMEs’ innovations, patent applications, exports of high-tech products, venture capital investments, and sales of innovative products. While there have been improvements in human resources, business investments in research and development and the quality of science, these are not enough to result in an overall stronger innovation performance. This poses serious risks for the long-term growth potential of the EU, as do other aspects relevant to innovation performance.

The sharpest declines in the share of innovative businesses have been observed in Cyprus, Germany, Romania, the Czech Republic and Spain. On the other hand, the share of innovative enterprises increased the most in Malta, the Netherlands, Latvia and the United Kingdom. During the period 2010-2012, the highest share of enterprises with innovation activity was recorded in Germany (66.9 % of enterprises), Luxembourg (66.1 %) and Ireland (58.7 %). On the contrary, less than 30 % of enterprises had innovation activity in that period in Romania (20.7 %), Poland (23.0 %) and Bulgaria (27.4 %). 31

From the perspective of SMEs, a lack of financial resources is viewed as the main problem in the commercialisation of innovative products or services. In this context, the few innovative businesses that receive public financial support for R&D or other innovation activities consider it as not effective enough. 32 As explained in the Commission Staff Working Document accompanying the Single Market Strategy 33 , the difficulty in accessing and enforcing Intellectual Property Rights (IPR) also deters SMEs' investments in innovation. The significant cost exposure for IPR and patent litigation is a serious deterrent for SMEs to engage in patenting.

On EU level, the average annual growth rate of innovation performance (as measured by the Innovation Union Scoreboard) has reached 1.0 % with most Member States improving their innovation performance over the eight-year period 2007-2014. However, compared to last year, innovation performance has increased for only 15 Member States, while it has declined for 13 Member States. Overall, innovation performance has been converging across Member States but performance differences remain high. 34  

It is particularly noteworthy that the most innovative countries perform best on all dimensions: from research and higher education systems, through business innovation activities and intellectual assets up to innovation in SMEs and economic effects, reflecting balanced national research and innovation systems. Yet, the level of development and structural conditions of the relevant country, region and sector should be taken into account when designing innovation policies. These factors determine the capacities to access, absorb and create new technologies. 35 Effective innovation policies must therefore take into account the specificities of the relevant country, region and sector.

International comparison

When looking at the performance of innovation systems in a global context, South Korea, the US and Japan have a performance lead over the EU. While EU innovation performance has been improving at a higher rate than in the US and Japan, the innovation gap with South Korea is widening (Figure 2.26).

Figure 2.26:Innovation performance gap with non-EU countries (EU=100)


Source:European Commission, Innovation Union Scoreboard 2015, DG GROW.

South Korea, the US and Japan strongly outperform the EU in business R&D expenditure, and, to a lesser extent, in public-private co-publications. Firms in these countries invest more in research and innovation, and the collaborative knowledge-creation between public and private sectors is better developed. 36

The difference in the share of business R&D expenditure between the EU, on the one hand, and South Korea (222 % of EU value), Japan (199 %) and the US (151 %), on the other hand, is striking. As concerns the level of R&D intensity per sector, the EU shows a higher intensity than the US in very few sectors, in particular computer electronic and optical products, electrical equipment, and chemicals. Although the overall ranking across sectors is very similar, American firms, on average, tend to invest much more than European firms in innovation and technology. This is a matter of concern.

Manufacturing represents 64 % of total R&D expenditures in the EU, while the services sector accounts for 34 % of them. 37 In comparison with the US, the EU focuses more on motor vehicles while the former invests a larger share in high-tech sectors like computer, electronic and optical products, and pharmaceuticals. This signals a different type of specialisation. In other sectors, the differences are less relevant in magnitude, pointing to a more similar pattern.

2.3.3    The external competitiveness of EU firms

Driven by improvements in productivity in some Member States and by the internal devaluation, EU exports have increased considerably after the crisis with respect to the 2004-2008 period. This expansion applies equally to goods and services. However, there are big differences in the export performance of Member States within and outside the EU. The vigorous growth in global demand resulted in an increase of extra EU exports of goods of 28 % in the 2010-2014 period compared to the five years previous to the crisis. A more subdued internal demand limited sales to other Member States growing just at a 3.5 % rate within the Single Market.

Figure 2.27:Growth in total exports of goods to the EU and to the rest of the world (2004-2014)


Source:Eurostat

Figure 2.28:Growth in total exports of goods and services to the EU and to the rest of the world (2004-2014)


Source:Eurostat

There is a very clear distinction in the exporting performance of different Member States compared to their results in 2004 (Figures 2.27 and 2.28). Seven of the Central and Eastern European Member States have improved their performance in a remarkable way. Their exports to the EU and to the rest of the world have increased by over 20 percentage points. Ireland and the Netherlands are the only EU-15 countries exhibiting a comparable performance. These have and remain very open countries with a high degree in the internationalisation of their activities. There are just two EU Member States where exports have contracted in the last decade: Finland and Cyprus.

The situation looks similar when focussing on the exports of goods, but the growth rates are relatively more modest with a maximum growth of exports of around 30 percentage points in Lithuania. Obviously, this implies a relatively faster expansion in the exports of services. Finland and Sweden are the two countries reporting export contractions as far as goods are concerned.

As explained in the next chapter, the EU is now integrating faster with third countries than internally, which reflects the globalisation process and the faster demand growth in many emerging markets. There is however no trade-off between intra-EU trade and global trade. Member States which integrated further in the global economy are also those that have shown the highest integration dynamics within the EU. 38

Figure 2.29:EU manufacturing sectors: revealed comparative advantage (2013)


Note:Low technology (LT), Medium-low technology (MLT), Medium-high technology (MHT), High technology (HT) in accordance with Annex 3 of Eurostat (2014)

Source:EU Structural Change (2015)

Among the Member States with an increasing integration in the Single Market, most of them have experienced an improvement of their price competitiveness position. 39 Some of these countries (Estonia, Latvia, Romania as well as Luxembourg) benefited from improving the quality of their exports as well. 40 As regards the group with decreasing or stagnating integration, Belgium, Luxemboug, Malta, Finland and Greece suffered from cost competitiveness losses. Only Finland and Sweden exported less in 2010-2014 than in 2004-2008. Ireland leads the table in services exports, followed by Portugal, France, Malta and Belgium. Bulgaria, Cyprus, Italy, Slovakia and Croatia are the only countries presenting worse results in 2010-2013 than in 2004-2008.

The importance of export growth for the EU in recent years has been considerable. EU exports have been growing above the world trade index since the crisis. External demand has contributed by around 3 % to GDP in the early years of the recovery and has compensated the negative contribution of internal demand in 2012 and 2013. Although energy prices have been a disadvantage for the international competitiveness of EU firms, the evolution of unit labour costs has contributed to improve it. But this has not been the only factor supporting our export performance.

Figure 2.30:EU services sectors: revealed comparative advantage (2013)


Note:Knowledge-intensive services (KIS) are defined in accordance with Annex 8 of Eurostat (2014)

Source:Own calculations based on WTO data

As shown in Figure 2.29, the EU has a comparative advantage in high-tech sectors (pharmaceuticals), medium-high tech sectors such as machinery and transport equipment, including motor vehicles and low-tech sectors (paper, print and beverages). Over the last twenty years, European comparative advantage has remained stable in most sectors but some improvements can be reported in the motor vehicles, the paper and printed product and the machinery value chains. 41

Given their nature, revealed comparative advantages can only be reported for a limited number of traded services sectors in Figure 2.30. Europe has a high comparative advantage in personal, cultural and recreational services but it has also a strong specialisation in financial services. ICT and business services that have a crucial importance for manufacturing and other business activities seem to have a positive but relatively low comparative advantage level.

The evolution of comparative advantage is clearly path dependent and this is an important fact to take into account in the design of policies; a background study presents a detailed account of the evolution of specialisation at NUTS 2 level for low to high-tech sectors. A snapshot of this analysis for business services in presented in Box 2.1 below.

Box 2.1: Revealed advantages in value added exports of the business services sector 

Over a long time period, Europe has succeeded to be better than the USA and Japan in maintaining relatively high market shares in world trade. The share of the EU in global exports has fallen by 3.5 percentage points (ppt) between 1995 and 2013 while it has decreased by 8.9 ppt for Japan and 4.7 ppt for the USA. China with over 13 ppt gain in the share of global exports is the main beneficiary of the losses reported by the other main global trading partners. In some cases, such as transport equipment, the EU's world market share has increased by 5.2 ppt from 1995 to 2013. Europe has also succeeded in maintaining its comparative advantage in sectors such as machinery and chemicals, but not in the upcoming digital and communication technologies.

The graph shows the geographical distribution of regional revealed advantages in value added exports for business services in 2011. In the context of the analysis, business services are understood to comprise the following elements: a) the renting of machinery and equipment, b) computer and related activities, c) research and development and d) other business activities such as legal and accounting activities, tax and business consultancy, market research. They do not include financial services such as banking and insurance. In the EU, there is a clear geographical divide, as the high income countries and regions tend to have revealed advantages in the value added exports of business services, while the less developed countries and regions in the South (Greece, Portugal and Spain) as well as in the East have revealed disadvantages.

Exceptions to this are the capital city regions, especially in the CEE countries. Accordingly, revealed advantages in business services exports are highly correlated with GDP per capita levels. This correlation and the generally low competitiveness of business services in the peripheral regions are of direct policy relevance, as it opens up the possibility to design concrete policy measures targeting the development of such services in the less developed EU regions. Such policies not only would improve those regions’ competitiveness in business services, but at the same time would also create additional employment and contribute to the general economic development of those regions, as improved business services would have positive repercussions on the manufacturing industry sectors, via R&D and the transfer of knowledge, increases in the technological capacities, marketing etc. As a final consequence, such targeted policies would thus also contribute to economic cohesion of the EU regions.    

Revealed value added specialisation of exports (RXA) – Value added exports: Business services, 2011    
Source: Cordes et al. (2015)

This is a relatively good performance in a world with many and powerful emerging economies like China and stronger competition from the USA. Europe's export performance is particularly remarkable given its relative input price disadvantage.

Figure 2.31:Market shares in unit value segments


Source:Stehrer et al. (2015)

Quality competition and moving up the ladder in the value added contents of the activities carried out in medium-tech sectors seems to be contributing to sustain EU competitiveness. This appears to be confirmed by evidence provided by the analysis of the qualitative changes in the contents of our exports based on their unit values. These values can be interpreted as quality-adjusted price of products and provide a better insight of the changes in the composition of EU exports.

Figure 2.31 presents the market shares of the EU, USA, Japan and China in 1995, 2005 and 2013 for exports with high, medium and low unit value. Figure 2.32 shows the contribution to manufacturing exports and to high unit value export segment by Member State. The former figure shows a higher and even growing market share of EU exports in the high unit value export segment. These results point out in a similar direction as Vandenbussche H. (2014). However, the EU competitiveness could be further enhanced by reducing the existing barriers on allocative efficiency, which negatively impact competition in a number of Member States, as pointed out in the Staff working document accompanying the Single Market Strategy. 42

Figure 2.32:Contribution to total manufacturing exports and to high unit value export segment by country (2013)


Note:Countries ranked according to market shares in 2013

Source:Stehrer et al. (2015)

2.3.4    Other factors contributing to productivity

Infrastructure and networks

Efficient infrastructure and network industries (e.g. energy, transport and broadband) are fundamental for a competitive business environment. However, the quality and availability of these production inputs still varies considerably across the EU.

Overall, the quality of transport infrastructure in the EU increased slightly over the last five years. The new Member States continue to catch up and significant investment has taken place in the context of cohesion policy since 2007. By contrast, there are indications of under-investment in most advanced EU economies since 2009 (Austria, Belgium, Germany, Finland, France, Luxembourg, the Netherlands, Denmark, Sweden and the United Kingdom). 43 Member States' budgets allocated to maintenance were often not sufficient to prevent a deterioration of the existing network.

The availability of fixed broadband infrastructure, which is crucial for digital markets, has progressed moderately but steadily. However, fixed rural coverage is still below 80 % in five Member States, and remains a challenge in Member States such as Bulgaria, Finland, Latvia, Poland and Slovakia, with some progress registered in Croatia, Slovenia and Romania. Whilst more than two thirds of the EU households are covered by high speed broadband, Italy, Croatia and Greece need to upgrade most of their networks to keep pace.

Upgrading and better connecting the energy infrastructure are among the key objectives of the Energy Union Strategy. The work on infrastructure projects has accelerated in recent years and many Member States have launched large-scale projects which are now in the implementation phase, including the "Projects of Common Interest" identified in 2013 under the trans-European energy networks Regulation (TEN-E). 44

Cleantech economy

European manufacturing firms spend on average 40 % of their costs on raw materials, with energy and water pushing this to 50 % of total manufacturing costs, to be compared to a share of 20 % for labour costs. ( 45 ) Resource efficiency is thus an important driver of innovation and competitiveness and will play a crucial role for industry to open up new markets. Resource productivity varies considerably across Member States due to their different GDP levels, their stages of economic development, and the structure of their economies. Countries showing highest values in resource productivity include the Netherlands, Luxembourg, the UK, Spain and Italy. The lowest resource productivity can be observed in Finland, Latvia, Bulgaria, Estonia and Romania. Energy intensity in the industry is the lowest in Ireland and Denmark whilst Lithuania and Bulgaria have the highest energy intensity.

Boosting productivity, employment and economic growth, while exploiting the benefits of energy and resource efficiency and the green economy is a challenge and an opportunity in many Member States. For example as regards eco-innovation, the gap between the best performers (including Sweden, Finland, Germany, Denmark and the UK) and the Member States lagging behind (including Bulgaria, Poland and Cyprus) remains significant. Accelerating the market uptake of eco-innovations in all sectors could be effectively promoted by addressing the obstacles faced by eco-innovative businesses and through supporting market replication and clusters of SMEs, developing targeted financial instruments, and the public procurement of cleantech innovations.

Skills

Long-term growth can be achieved by improving the quality of labour input since highly qualified workers can help firms innovating and make the best use of high-tech processes. Human capital is not a perfectly substitutable input which can be transferred between sectors at no cost. It is therefore an input factor which can explain differences in growth across countries, although it is not easy to measure.

Most European countries are faced with skills challenges, as a consequence of the ongoing structural changes taking place in their economy. For instance, in the period 2008-2013, the share of low-skilled workers has decreased for all sectors 46 , whereas the share of high-skilled workers has slightly increased. The overall picture for medium-skilled workers is less clear, since roughly half of the sectors experienced a decrease. This finding might be explained in different ways. First of all, since the level of education is generally increasing in Europe, this can partly explain the general decrease of low-skilled workers. Secondly, the economic and financial crises may have hit stronger low pay jobs, determining an overall decrease of low-skilled workers (and medium-skilled workers in some sectors), while high-skilled ones managed to keep their position. Finally, labour hoarding is more likely to be observed for highly educated and specialised workers.

The availability of both high-skilled and medium-skilled workers is critical for companies:

Manufacturing sectors that produce goods requiring a high proportion of high-skilled labour are: pharmaceuticals; computer, electronic and optical industries; and coke and refined petroleum. While the first two are sectors with high technological intensity, coke and refined petroleum is classified as a mid-low-tech sector. However, this sector has an above average labour productivity, and is dominated by large enterprises (more than 250 employees), mostly operating in the global markets. 47

Service sectors among the most human-capital-intensive include: education, information and communication; professional, scientific and technical activities; and financial and insurance activities. Shortage of highly required professionals, such as ICT programmers, poses increased risks to EU competitiveness, especially in high-tech sectors, but the shortage of ICT specialists is generally affecting all sectors. 48  

The lowest proportion of low-skilled labour (4.67 %) is found in financial and insurance activities, closely followed by professional, scientific and technical activities (4.7 %). More than 25 % of the workforce in chemicals, other transport equipment, beverages and tobacco manufacturing are high-skilled. Low-technology manufacturing industries such as textiles, clothing, leather products and wood products employ small proportions of high-skilled labour. The same applies to labour-intensive service industries such as accommodation and food, and agriculture and forestry.

2.3.5    Integration in international value chains

The overall trends in EU outsourcing over the period 2004–2011 indicate that the role of intra-EU outsourcing has diminished both in industry and services (Figure 2.33). The level of intra-EU outsourcing in the industry has diminished in several Eastern European EU Member States (LT, LV, BG, EE, SK, SI, MT, CZ and HU) after the crisis. Similar developments, though at a much lower scale, given the lower starting point, were observed in services. Similar trends were observed for extra-EU industry outsourcing into Eastern EU Member States (Figure 2.34). On the contrary, the share of output supplied by third countries in services increased in almost all EU Member States, indicating increasing involvement of third countries services' providers into EU value chains.

Figure 2.33:Level of intra-EU direct outsourcing across the EU Member States


Note:Direct outsourcing only i.e. production inputs only from my suppliers but not from my suppliers' suppliers divided by total output in the destination country. An outlier with a very high level of trade outsourcing in services (LU) is omitted.

Source:WIOD

Figure 2.34:The level of extra-EU direct outsourcing across the EU Member States


Note:An outlier with a very high level of trade integration (LU) is omitted. Trade= Imports +Exports/2*GDP.

Source:WIOD

In general, larger countries use relatively less intra-EU production inputs, both from industry and from services, reflecting their sizeable domestic production capacities. The UK, Italy, France and Spain were the lowest users together with Greece of intra-EU industry inputs, and these countries (UK, IT, FR) together with Bulgaria and Germany were the lowest users of intra-EU services. In contrast Hungary, Belgium, Czech Republic, Malta and Slovakia were the top five Member States with the largest level of intra EU cross-border outsourcing of industry and Luxembourg, Ireland, Malta, Belgium and Denmark were the top five Member States with the largest level of intra EU cross-border outsourcing of services.

2.4    Conclusions

A major resource re-allocation across sectors is taking place in most developed economies. This structural transformation may lead to higher growth and competitiveness if it is driven by technological progress and efficient allocation of resources.

Yet, the convergence of productivity amongst EU economies is stalling. As product and process innovation may be running out of steam, this slowdown reduces growth prospects. For certain EU Member States the problems of declining or stagnating TFP date back to before the crisis. For countries like Italy, Spain and even France and Belgium, the stagnation in terms of TFP in manufacturing started long before the crisis, providing strong evidence for structural rather than cyclical problems. TFP performance is also affected by the quality of factors of production, as measured, for instance, by energy prices, infrastructures, skills and technology.

Productivity can be increased by technological progress (expansion of the technological frontier) and by the adoption of existing technology (catching up process by laggards). These processes take place along national lines and across sectors. However, policy distortions and regulatory fragmentation can hamper them and lead to an inefficient allocation of resources towards less productive firms.

Fostering the completion of the Single Market would facilitate the allocation of resources to the sectors with higher productivity growth. This could increase the competitiveness of EU industrial and service sectors thus boosting growth and job creation. There is room for policy and structural reforms to foster productivity growth by improving the use of productive inputs (adoption of best practices) and resource allocation (allocative efficiency) across sectors, countries and regions. Tackling the existing barriers in the Single Market with EU-wide actions such as those proposed by the Single Market Strategy will contribute to a better allocation of resources across firms and sectors. Yet, sector and country specific product market reforms should also be adopted by Member States in those cases where structural reforms must take into account national and regional specificities of the national or regional economic structure.

The innovation performance of Member States is converging but only gradually. It is noteworthy that more innovative Member States (Denmark, Finland, Germany, Sweden) are hardly converging amongst themselves, while innovation performance amongst more modest innovators (Bulgaria, Latvia, Romania) is even diverging. Moreover, several Member States show poor results in business innovation activity. Yet, it is precisely in this area where the gap vis-à-vis global competitors is larger, that one would expect more rapid growth. Effective innovation policies must take into account the specific conditions of the relevant country, region and sector.

(1) ()Frey, CB.; Osborne, M.A. (2013), The future of employment: how susceptible are Jobs to computerisation?, OMS Working Paper. 
(2) ()ECORYS et al. (2015), An empirical assessment of the contribution of clusters to smart specialisation, report for the European Commission, DG GROW.
(3) ()Clusters can be broadly defined as a group of firms, related economic actors, and institutions that are located near each other and have reached a sufficient scale to develop specialised expertise, services, resources, suppliers and skills. See European Commission, The concept of clusters and cluster policies and their role for competitiveness and innovation: Main statistical results and lessons learned, SEC (2008) 2637.
(4) ()Garcia-Santana, M., Moral-Benito, E., Pijoan-Mas, J., Ramos, R.: Growing like Spain: 1995-2007, May 2015.
(5) ()Cf. Dabla-Norris, E., Guo, S., Haksar, V., Kim, M., Kochhar, K., Wiseman, K., and Zdzienicka, A., The new normal: a sector-level perspective on productivity trends in advanced economies, Staff discussion note SDN/15/03, March 2015, International Monetary Fund.
(6) ()In this section labour productivity is measured by means of value added per person employed in manufacturing and is evaluated by taking into account variations in manufacturing workforce and profitability.
(7) ()The choice of the 2008-2013 period has been tested for robustness over a ten year period and provides a proxy of the labour productivity trends in the Member States. Figures for Ireland (EUR 132 030 in 2013) are the highest in the EU; however, as this result reflects the behaviour of a large number of foreign multinationals and contains effects of transfer pricing, it has been considered an outlier and excluded from Figure 2.11.
(8) ()Calculated as production per hour worked using more recently updated data from Eurostat Structural Business Statistics.
(9) ()Cf. European Commission, (2015), A Single Market Strategy for Europe – Analysis and Evidence, SWD(2015) 202 final.
(10) ()Eurostat data, 2012
(11) ()Figure 2.13 decomposes changes in labour productivity for the EU-28 into three effects: "within effect", "static shift" and "dynamic shift". The "within effect" measures the contribution of each sector to the total change of labour productivity, The "structural change effect" measures reallocation of resources across sectors. It can be further divided into the "static shift" and "dynamic shift". The "static shift" measures the structural shifts in the economy by considering the changes in labour shares across sectors with different levels of productivity, while the "dynamic shift" measures structural shifts in the economy by considering the changes in labour shares across sectors with different productivity growth.
(12) ()Cf. European Commission (2015), EU Structural Change 2015, DG GROW.
(13) ()Cf. Dabla-Norris, E., Guo, S., Haksar, V., Kim, M., Kochhar, K., Wiseman, K., and Zdzienicka, A., The new normal: a sector-level perspective on productivity trends in advanced economies, Staff discussion note SDN/15/03, March 2015, International Monetary Fund.
(14) ()Austria, Germany, Denmark, Spain, United Kingdom, Italy, the Netherlands, Sweden, and France.
(15) ()The economic analysis underpinning the Single Market Strategy confirms that reducing the main restrictions in the business services sector would significantly enhance the efficient allocation of resources within this subsector. Cf. European Commission, (2015), A Single Market Strategy for Europe – Analysis and Evidence, SWD(2015) 202 final.
(16) ()PwC, (2015), Exploring the potential role of human, physical and knowledge capital investments in a smart specialisation context, study for the European Commission, DG GROW.
(17) ()McGowan, M.A., Andrews, D., Criscuolo, C., Nicoletti, G., (2015), The future of productivity, OECD report, July 2015.
(18) ()The European Commission produces estimates of TFP based on the production function methodology approved by the ECOFIN Council (see European Commission (2014)). It accounts for the fact that first due to cyclical shifts of demand or other market frictions, the economy may not utilise its capacity fully; and second inputs can be combined in different ways, depending on the technologies available and the efficiency of the organization. These corrections are measured by total factor productivity, which should be interpreted as an indicator of both the degree of utilisation of inputs as well as the efficiency of their combination.
(19) ()The horizontal axis shows changes in the period 2008-2014, i.e. the evolution since the start of the financial crisis. The vertical axis shows the long-run change for the period 2000-2014.
(20) ()Sirkin, H.L., Zinser, M., Rose, J.R. (2014), The Shifting Economics of Global Manufacturing, Boston Consulting Group ('BCG study').
(21) ()Here we use a different sectoral definition to the one used by the BCG study taking industry defined as the difference between groups B and E in NACE. Prices for electricity and gas concern industrial consumers and exclude taxes.
(22) ()Cf. European Commission, (2015), A Single Market Strategy for Europe – Analysis and Evidence, SWD(2015) 202 final.
(23) ()As measured by the relevant sub-dimension of the indicator "Integration of Digital Technology" which is part of the Digital Economy and Society Index (DESI). Indeed, the DESI 2015 groups Member States according to their performance in four clusters:- High performance (Denmark, Sweden, the Netherlands and Finland): These countries are not only ahead in the EU, but they are world leaders in digital. - Medium-performance (Belgium, the United Kingdom, Estonia, Luxembourg, Ireland, Germany, Lithuania, Spain, Austria, France, Malta and Portugal): These countries are doing well in certain areas but still need to progress in others.- Low performance (The Czech Republic, Latvia, Slovenia, Hungary, Slovakia, Cyprus, Poland, Croatia, Italy, Greece, Bulgaria and Romania): These countries need to step up their performance in a number of areas and catch up with the rest of the EU. http://ec.europa.eu/digital-agenda/en/desi  
(24) ()IDC-EY 2013 Digital Entrepreneurship Monitor,
https://ec.europa.eu/growth/tools-databases/dem/monitor
(25) ()European Commission (2015), Innobarometer survey on innovation trends at EU enterprises, Flash Eurobarometer 415.
(26) ()"Advanced manufacturing technologies" comprise: Sustainable manufacturing technologies (i.e. technologies which use energy and materials more efficiently and drastically reduce emissions); ICT-enabled intelligent manufacturing (i.e. technologies which digitalise the production processes); High performance manufacturing which combines flexibility, precision and zero-defect (e.g. high precision machine tools, advanced sensors or 3D printers).
(27) ()First annual report of the KETs Observatory: https://ec.europa.eu/growth/tools-databases/ketsobservatory/sites/default/files/library/kets_1st_annual_report.pdf  
(28) ()Six Key Enabling Technologies have been identified as important for Europe's future competitiveness: Advanced Manufacturing Technologies, Advanced Materials, Nanotechnology, Micro- and Nanoelectronics, Industrial Biotechnology and Photonics. Cf. European Commission (2009), Preparing for our future: Developing a common strategy for key enabling technologies in the EU, COM(2009) 512 final.
(29) ()If the indirect efforts (e.g. in the form of tax incentives) are added, an even larger number of Member States have achieved genuine smart fiscal consolidation.
(30) ()The Europe 2020 strategy sets the aim of increasing combined public and private R&D investment to 3 % of GDP by 2020.
(31) ()Community Innovation Survey 2012.
(32) ()In the Innobarometer 2014, 91 % of surveyed companies said that they had not received public financial support for R&D or other innovation activities since January 2011. For companies that received public financial support of some kind there was an even split between those who said this support was important for developing innovations (48 %) and those who said the support was not important (49 %). Cf. Innobarometer 2014: The role of public support in the commercialisation of innovations, European Commission.
(33) ()Cf. European Commission, (2015), A Single Market Strategy for Europe – Analysis and Evidence, SWD(2015) 202 final.
(34) ()European Commission, Innovation Union Scoreboard 2015. The Innovation Union Scoreboard measures the performance of EU national innovation systems. It groups Member States into four different performance groups: - “Innovation leaders” with innovation performance well above the EU average (Denmark, Finland, Germany, Sweden); - “Innovation followers (Strong innovators)” with innovation performance above or close to the EU average (Austria, Belgium, France, Ireland, Luxembourg, Netherlands, Slovenia and the UK);- “Moderate innovators” with an innovation performance below the EU average (Croatia, Cyprus, Czech Republic, Estonia, Greece, Hungary, Italy, Lithuania, Malta, Poland, Portugal, Slovakia and Spain); and - “Modest innovators” with innovation performance well below the EU average (Bulgaria, Latvia and Romania).
(35) ()Cf. EBRD, (2014), Innovation in transition, Transition report 2014, November 2014.
(36) ()European Commission, Innovation Union Scoreboard 2015.
(37) ()2011 data for all EU Member States except: Malta, Bulgaria, Lithuania, Latvia, Cyprus, and Croatia. The remaining share corresponds to the energy sector (1 %), the primary sector and mining (0.5 %), and construction (0,5 %). Source: own calculations based on OECD statistics.
(38) ()There is indeed a positive correlation (0.5) between EU trade and extra-EU trade in goods (measured as change between 2004-2008 and 2010-2014 in percentage points of GDP) across the Member States.
(39) ()Measured as depreciation of real effective exchange rate vs. EU-28 with unit wage cost, manufacturing as deflator. See: http://ec.europa.eu/economy_finance/db_indicators/competitiveness/data_section_en.htm
(40) ()See Vandenbussche H. (2014), Quality in Exports, Economic Paper 528, DG ECFIN, European Commission.
(41) ()Timmer, M.P., Los, B., Stehrer, R. and de Vries, G.J. (2013), Fragmentation, incomes and jobs: an analysis of European competitiveness, Economic Policy, 28(76), 613–661.
(42) ()Cf. European Commission, (2015), A Single Market Strategy for Europe – Analysis and Evidence, SWD(2015) 202 final.
(43) ()European Commission, Infrastructure in the EU: Developments and Impacts on Growth, Occasional paper 203 (2014).
(44) ()European Commission, (2015), Energy Union Package: A Framework Strategy for a Resilient Energy Union with a Forward-Looking Climate Change Policy, COM(2015) 80 of 25 February 2015.
(45) ()Europe INNOVA, Guide to resource efficiency in manufacturing: experiences from improving resource efficiency in manufacturing companies, 2012.
(46) ()But a decrease of the share of low-skilled workers does not necessarily correspond to a decrease of the number of low pay jobs in employment. In fact, people can accept jobs for which they are overqualified. The fact that the share of medium-skilled workers increased in some low-skilled intensity sectors like Accommodation and food service activities or Agriculture, forestry and fishing may suggest that some low-skilled low pay jobs have been taken by more qualified workers.
(47) ()For more information, see
http://ec.europa.eu/eurostat/statistics-explained/index.php/Manufacture_of_coke_and_refined_petroleum_products_statistics_-_NACE_Rev._2 .
(48) ()European Commission, A Digital Single Market Strategy for Europe - Analysis and Evidence, SWD(2015) 100 final, May 2015, page 69-73.
Top

Brussels, 28.10.2015

SWD(2015) 203 final

COMMISSION STAFF WORKING DOCUMENT

Report on Single Market Integration and Competitiveness in the EU and its Member States

Accompanying the document

COMMUNICATION FROM THE COMMISSION TO THE EUROPEAN PARLIAMENT, THE COUNCIL, THE EUROPEAN ECONOMIC AND SOCIAL COMMITTEE AND THE COMMITTEE OF THE REGIONS

Upgrading the Single Market: More Opportunities for People and Business

{COM(2015) 550 final}
{SWD(2015) 202 final}


3 The evolution of integration, performance and remaining barriers in the Single Market

3.1    The evolution of integration in the Single Market

In 2014, intra-EU trade 1 performance improved relative to the two previous years, but it still remains short of what it would have taken to make a significant contribution to the economic recovery. As a percentage of GDP, the total of intra-EU trade in goods was 3 % higher in 2014 than in 2013. The change in trade in services in 2013 was 2.4 %. 2

Looking into the evolution of intra-EU trade in goods and services over the last decade is particularly relevant at the time of presentation of the new Single Market Strategy. An overview of the most salient trends in the integration of goods and services markets is helpful to identify those areas where the single market is most dynamic. It is also needed to find out whether the expansion of trade is stagnating due to structural developments or restrictions to the free movement of goods, services, capital or labour in the EU economy.

This section looks at trade issues and the next one will present the situation regarding investment and establishment. The rest of the chapter looks into performance and remaining barriers in the single market, presenting some of the main developments that are the subject of priority action by the Single Market Strategy.

3.1.1    Trade in goods: The importance of enlargement for integration in the EU

The crisis had a profound negative impact on the evolution of intra-EU flows of goods. Intra-EU trade in goods contracted by 3 percentage points as a proportion of GDP in 2009 with respect to 2008, while in services it only dropped slightly. After that year, and unlike the evolution of trade in services, trade in goods within the EU has been growing slightly above GDP accounting for around 20 % of EU GDP in 2014 (Figure 3.1).

Figure 3.1:Evolution of intra EU trade


Note:EU-28 minus Spain, Italy, Croatia and Malta for which full BOP time series are not available at this point, Trade= ½ (Imports + Exports) / GDP.

Source:Eurostat

These aggregated data conceal very different patterns in the integration of the incumbent Member States in 2004 (EU-15) and those that have joined since then (EU-13). Figure 3.2 shows that the share of trade over their GDP of the first group has remained basically flat since 2004, if we exclude the fall in 2009 due to the crisis (Figure 3.2). Intra-EU exchanges in goods between the Member States of the EU-15 and the rest of the Union have remained practically flat throughout the whole 2004–2014 period, accounting for less than 20 % of GDP (Figure 3.2). As a matter of fact, several of these countries have actually reduced their intra-EU exchanges in the five years from 2010 to 2014 from the previous period, albeit only by a small percentage of their GDP.

Figure 3.2:Intra-EU exchanges of goods as a share of GDP between Member States (2004–2008 and 2010–2014)


Note:EU-15 = Member States in the Union before 2004
EU-13 = Member States joining after 2004

Source:Eurostat

In contrast with this, the EU-13 group has displayed increasing integration in the EU-28 since 2004 if we exclude the worst days of the crisis. In fact, integration picked up momentum after the crisis. The intensity of intra-EU exchanges of goods between Hungary, Estonia, Lithuania, Latvia, Slovakia, Poland, Romania, the Czech Republic and Slovenia with the EU-28 has increased considerably. These nine of the EU-13 Member States account for much of the trade creation in the single market. Nonetheless, it must be noted that there has been an important increase in the trade in goods between the Netherlands and the rest of the EU-28. In contrast, Greece, UK, France and Italy show the lowest levels of integration in the trade in goods. Of the EU-13, only Cyprus shows a low level of integration in 2014.

Figure 3.3:Intra-EU trade in goods in % of GDP


Source:Eurostat

Table 3.1 gives a clear picture of the considerable turnaround in the ranking of integration in trade in goods of the Member States of the Union. In the last five years, two EU-13 countries, Slovakia and Slovenia have taken the lead in the ranking of trade integration in goods from Belgium, the leader in 2010. Large Member States of the EU-15 group remain at the bottom of the table with much lower and in some cases, falling trade integration indicators.

Table 3.1:Evolution in the openness to intra-EU trade in goods of EU-28 (2010–2014)


Source:Eurostat

There are reasons to believe that this subdued performance of intra-EU goods markets after the crisis of the EU-15 cannot be attributed to the impact of the crisis only. The stagnation of intra-EU trade between the EU-15 and the rest of the EU started around 2004, well before the crisis struck in late 2008 and 2009. Differences in the trends of integration patterns between the EU-15 and the EU-13 also seem to call for additional explanations. Thus, the causes of the relative stagnation of intra EU exchanges in goods seem to have been present already before the crisis struck the EU economy.

There is no doubt that adhesion has been a very important driver of the integration of the EU-13. The relatively smaller size of the EU-13 Member States could explain, at least in part, these higher integration levels in the EU-13. However, there must be other additional reasons explaining their higher levels of trade integration. For instance, Poland, the largest of these 13 economies with a GDP more than twice as big as the GDP of Ireland, shows a trade integration index greater than Ireland. The very high shares of countries such as Slovakia or Slovenia also point in the same direction. Thus, country size does not seem to be the only variable explaining the higher levels of integration of the EU-13 that joined the Union in or after 2004.

This stagnation of trade in goods between the EU-15 and the rest of the Union needs to be studied in detail in future reports. At this moment, a preliminary analysis of the intra-EU trade flows suggests some possible hypotheses for future work. The impact of the crisis, changing patterns in the geographic location of production activities, some degree of exhaustion of the possibilities of integration in sectors where the removal of obstacles has been successful, and remaining regulatory, structural and behavioural obstacles in other sectors can be included among the “a priori” plausible explanations to consider.

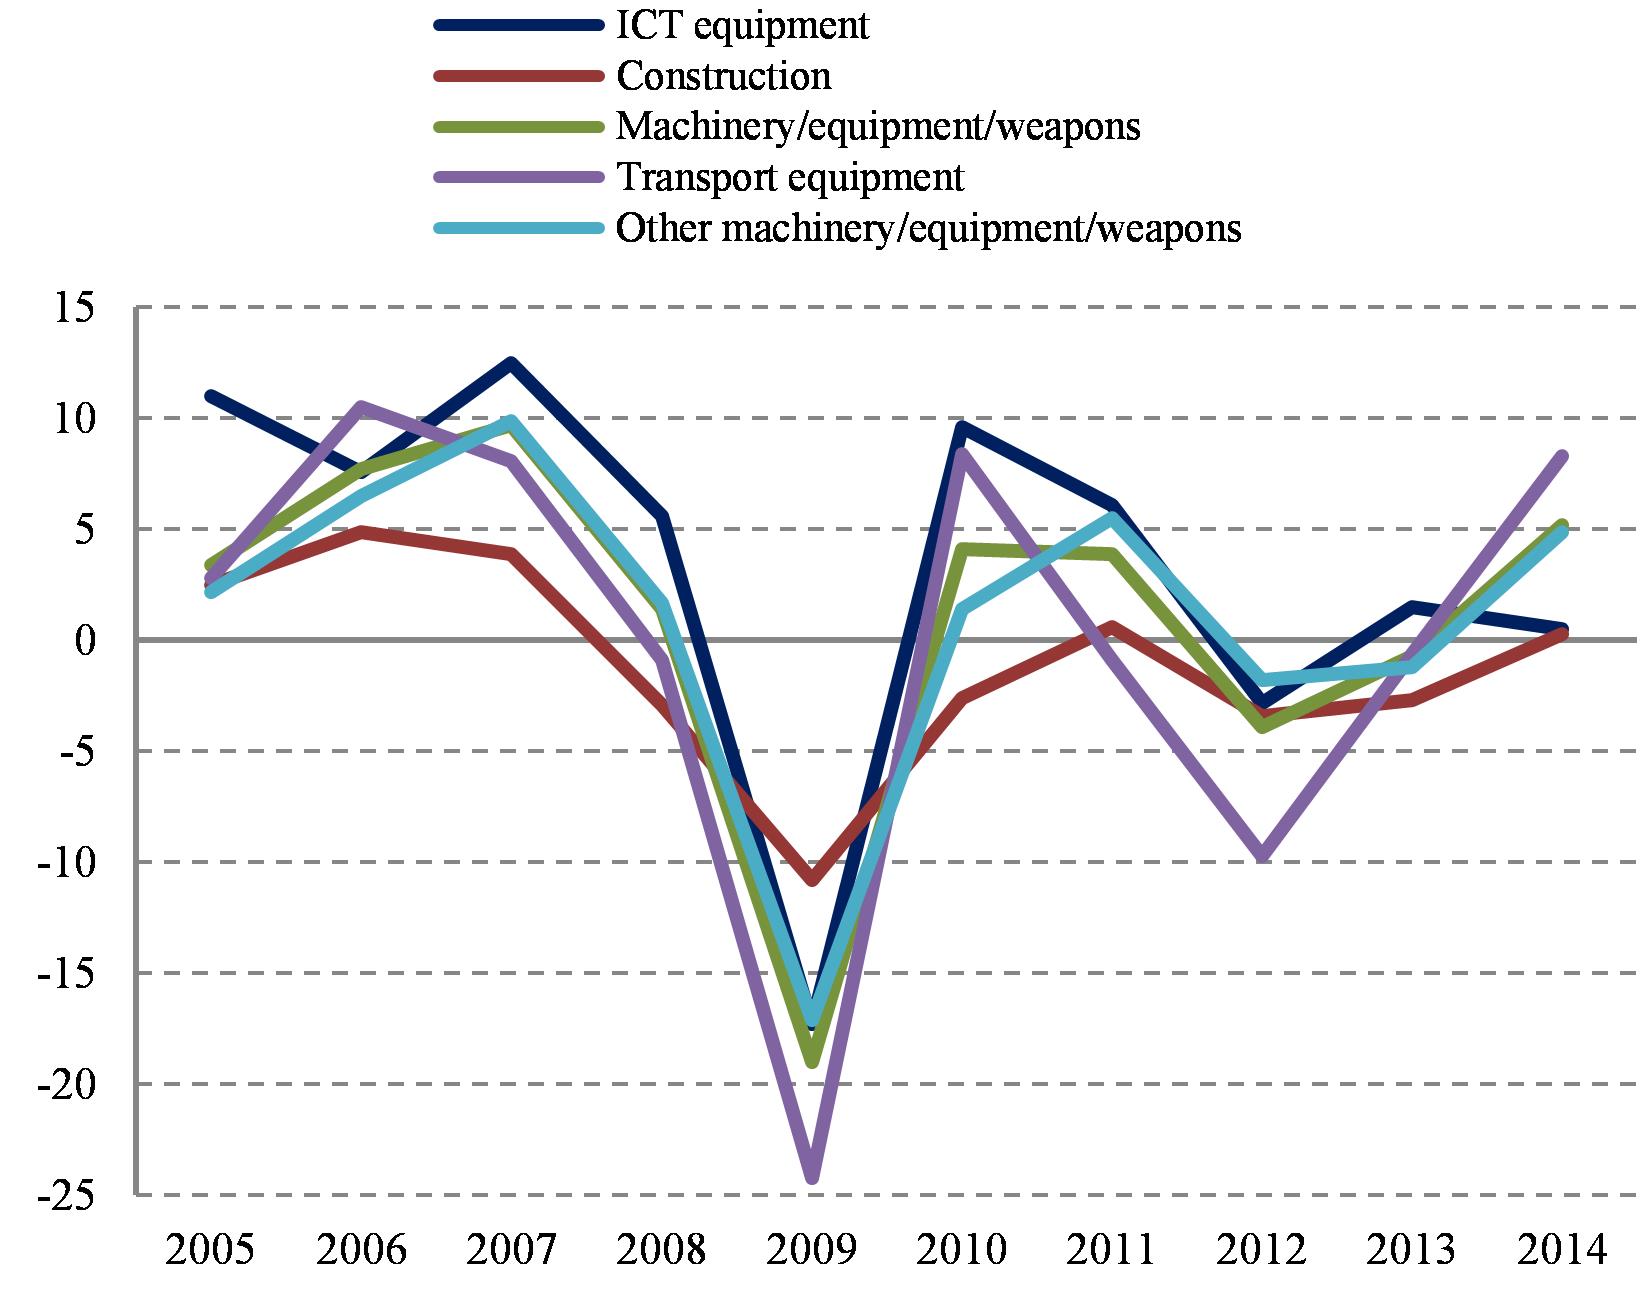
A look at the evolution of trade of different groups of products can also help to give a preliminary glimpse of the sectors driving these trends in the evolution of trade in goods. "Machinery and transport equipment" is by far the most important product group in intra-EU trade in goods with approximately 7 % of GDP for the EU-15. Intra-EU "imports" in this category have fallen by over 9 % between 2007 and 2013, although they recovered in 2014 to almost reach their 2008 level. This major product category includes durable consumption goods (e.g. automobiles) but most importantly, investment goods too. The particularly low level of investment in the EU in recent years may have played a major role in the evolution of intra-EU exchanges of goods for the EU-15. The demand for goods in the "Machinery and transport equipment" group has evolved differently across countries. In Germany, "imports" of these goods from other Member States increased by 48 % in the last 11 years while it fell in Spain and Italy.

Figure 3.4:Intra-EU "imports" of goods in the EU-15 by product groups (2004–2014, million Euro)


Source:Eurostat

Imports of other manufactured products have remained stable, as have raw materials and commodities, while other product groups – including chemicals – have expanded more than income for other product groups despite the impact of the crisis and slow growth rates of recent years. Thus, given the weight and evolution of "Machinery and transport equipment" imports until 2013, they appear to have played a determinant role in the stagnation of EU-15 "imports" of goods.

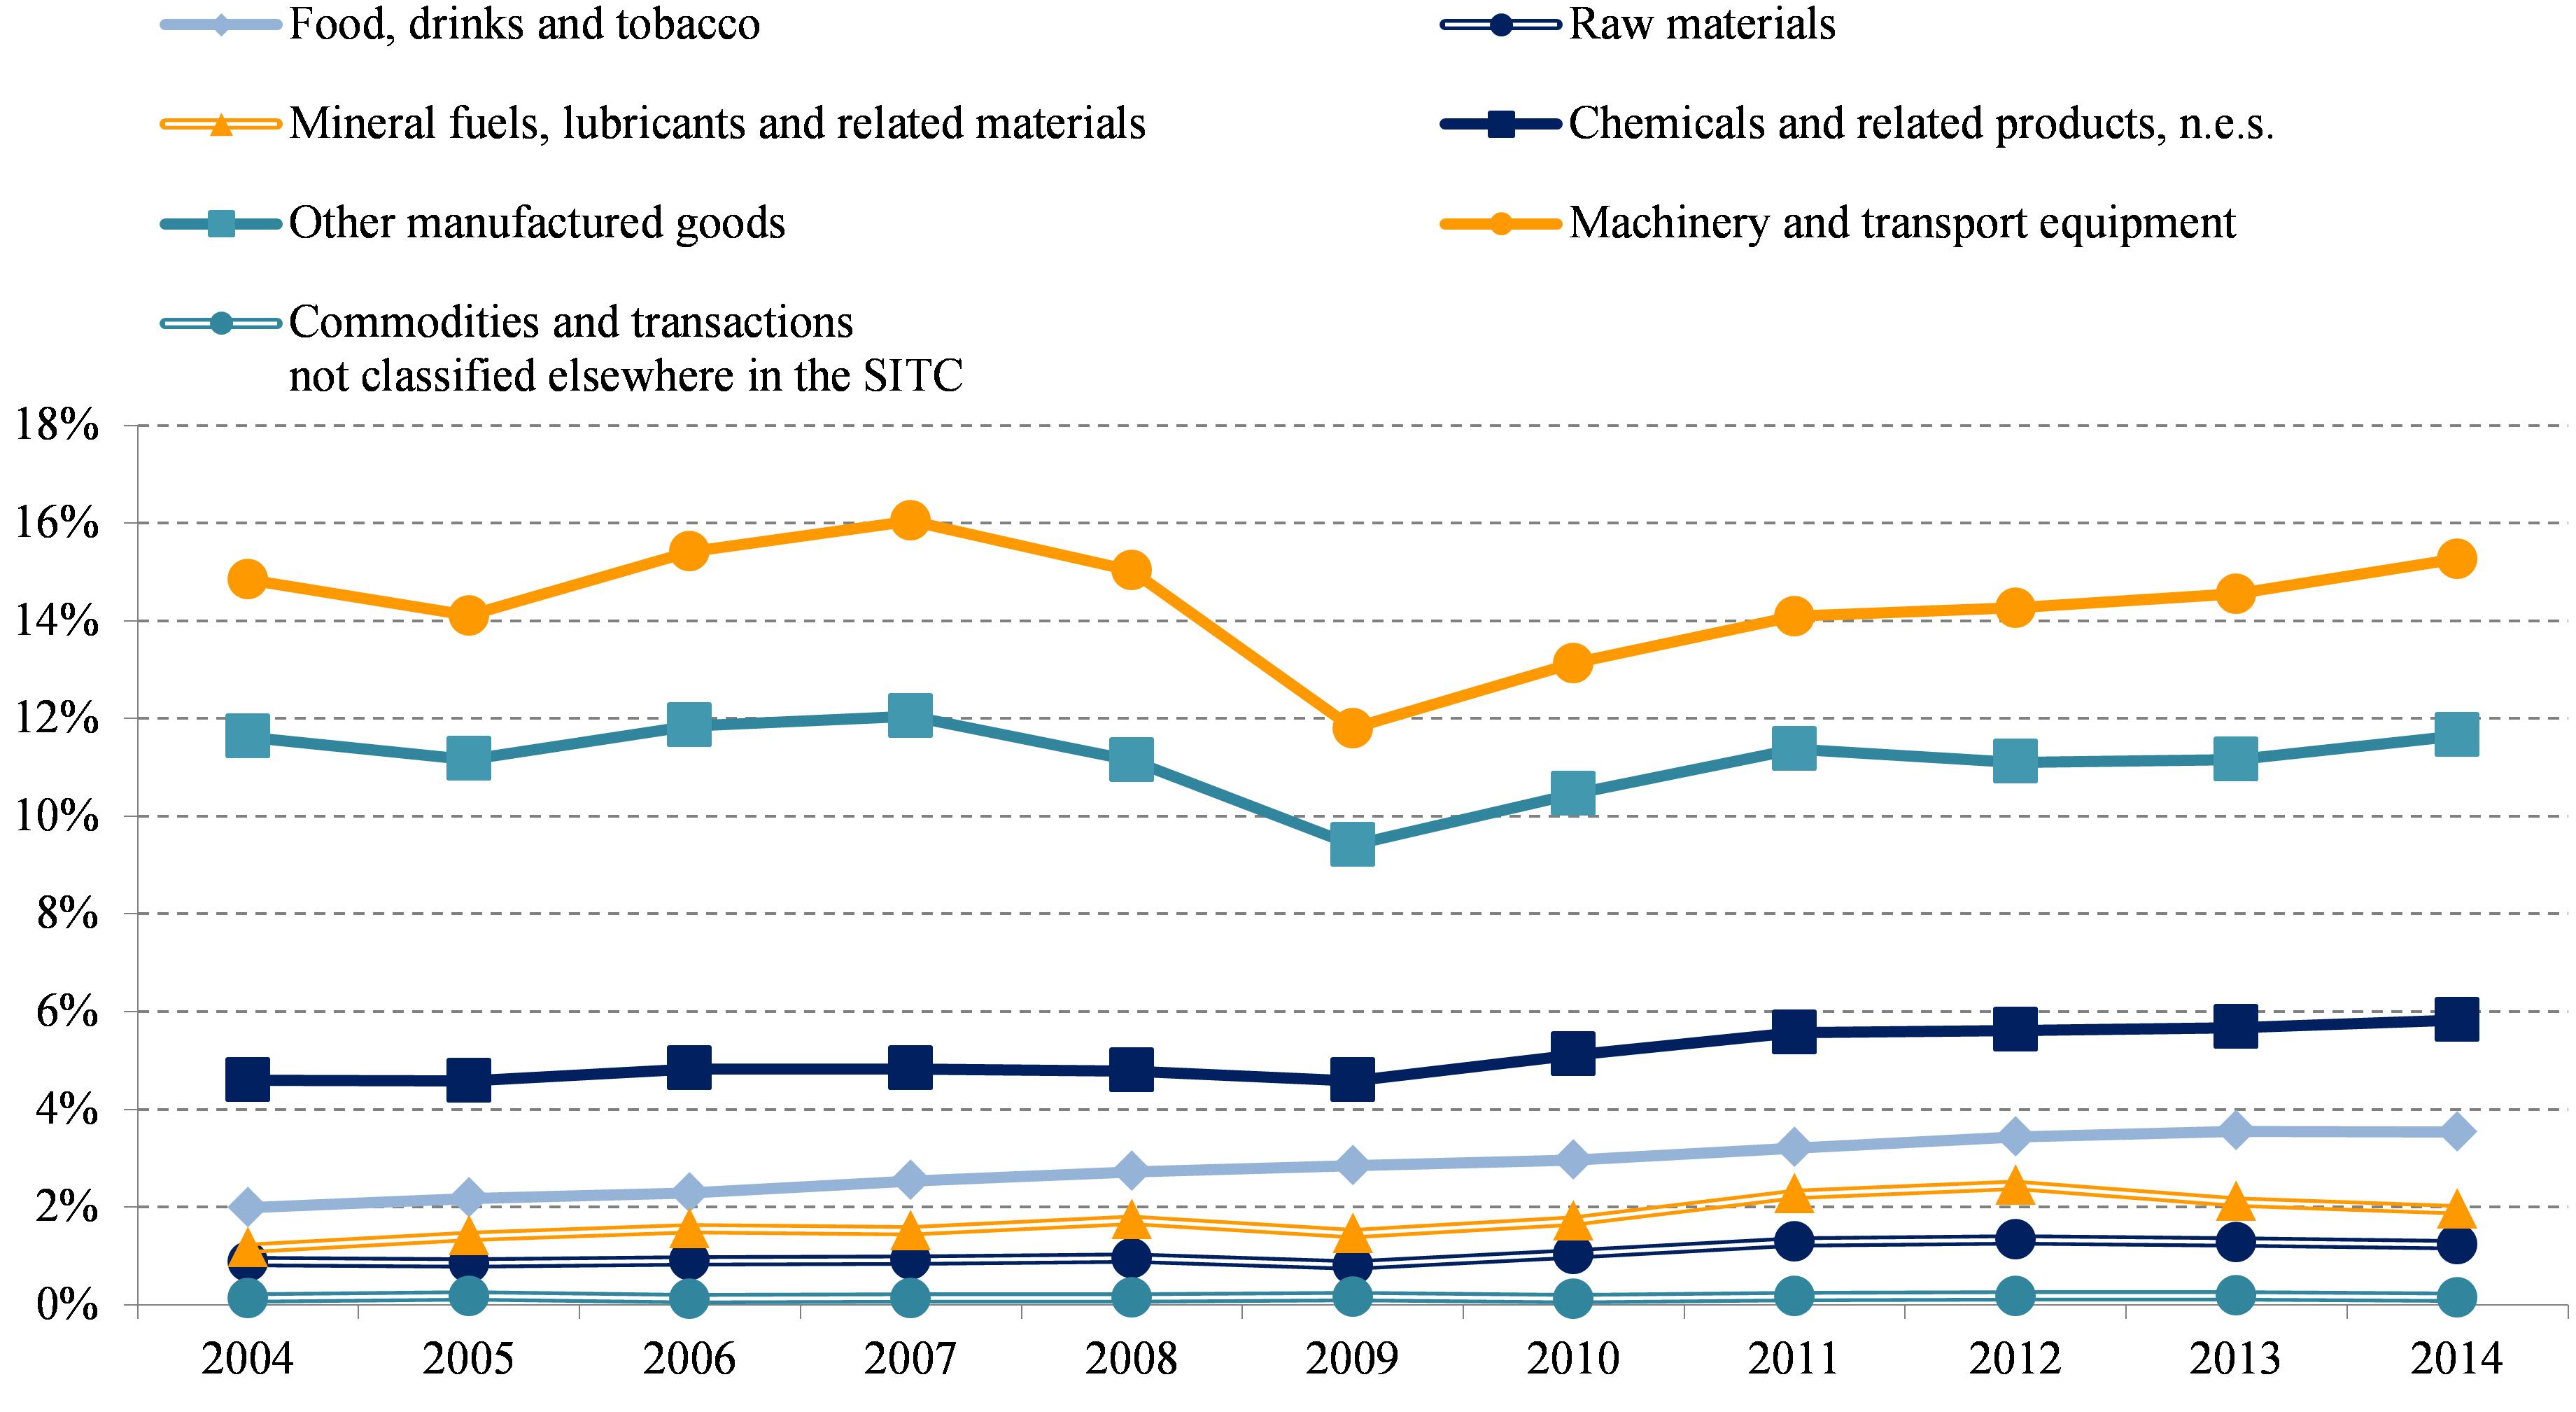
In the EU-13, the demand for "imported" goods suffered more severely the impact of the crisis in 2009 but it recovered quickly and vigorously after 2009. Intra-EU "imports" of the main product groups, machinery and transport equipment and other manufactured products, account for a much higher share of GDP than in the EU-15, since the beginning of this period, reaching almost 16 % of GDP for machinery and transport equipment.

Figure 3.5:Intra-EU "imports" of goods in the EU-13 by product groups (2004–2014, share of GDP)


Source:Eurostat

In summary, the analysis by Member State of the evolution of trade in goods shows two different patterns that seem to reflect the different stage of maturity in the single market: the incumbent Member States before 2004 (EU-15), where the impulse of integration seems to have dovetailed and a much more dynamic group of new Member States (EU-13) where the impulse of adhesion remains active. This distinction may be relevant for policy purposes.

A very preliminary look into the sectoral and geographic breakdown of intra-EU flows in goods suggests that the crisis, and in particular the subdued evolution of investment in the EU-15 analysed in Chapter 1, have certainly had a considerable impact. However, other structural and regulatory factors might contribute to explain this evolution of intra-EU exchanges in goods.

In the EU-15, the sluggish growth, a mediocre productivity performance in many countries and the prevalence of obstacles to integration in goods as well as in services sectors keep trade in goods subdued. The quantitative importance of the “Machinery and investment goods” sector seems to have been a key factor explaining the evolution of trade in goods in the EU 15. Low levels of demand for investment goods in these countries must have played an important factors explaining the relative fall in trade in this sectors among the EU-15. But evidence provided by a recent study (see section 3.3.1) points at remaining regulatory barriers in the railway equipment sector as an additional factor limiting exchanges in this rector. In addition, the importance of barriers and inefficiencies in services markets for the development of goods markets should not be underestimated.

Investment dynamics in the emerging EU economies and the consolidation of emerging new trading relations between the EU-15 and the EU-13 countries have supported the higher rates of integration of the relatively “newer” EU Member States. This seems to be confirmed by evidence provided in the foreign direct investment and establishment section below. The impact of a geographic redistribution of at least some production activities following the enlargement may explain the different behaviour of the EU-15 and EU-13 country groups as far a trade in goods is concerned.

However, all this must be considered as preliminary evidence calling for new detailed work to learn more about these patterns. The stagnation of trade flows in goods over a decade may also call for further work on the nature and effects of integration and dynamic efficiency in the single market.

3.1.2    Trade in services: the potential for further integration in the single market

Against this background, the situation of intra-EU exchanges in services is very different. First of all, the share of trade in services over GDP is much lower than in goods. In 2014, the share of total intra-EU exchanges in goods ("imports" plus "exports" divided by two) ranges between 18 % of GDP for EU-15 and more than 40 % for EU-13. For services, these shares go from 4.5 % to less than 7 % of GDP. The nature of services contributes to explain these differences. Services are less suitable to be traded cross-border. Many of them can only be provided if firms or consumers move cross-border. In those cases, establishment in other Member States is often the preferred way for the realisation of service provision. But there are other reasons at play: there remain considerable restrictions hindering cross-border exchanges of services as explained here below and in the Single Market Strategy.

Figure 3.6:Intra-EU exchanges of services between Member States (2004–2014)


Note:EU-15 = Member States in the Union before 2004
EU-13 = Member States joining after 2004

Source:Eurostat

There is a second interesting difference between intra-EU exchanges in goods and services. Cross-border exchanges in services as a share of GDP show a steady and progressive increase over time and they have not been seriously affected by the crisis. Figure 3.6 shows that both in the EU-15 and in the EU-13, the intra-EU exchanges of services have been growing steadily more than GDP over the 2004 to 2014 period. The 2009 shock of the financial crisis had a much smaller impact on the flows of services than on goods and this impact was short-lived.

Figure 3.7:Intra-EU trade in services in % of GDP


Source:Eurostat

The breakdown of intra-EU exchanges in services by sector reveals important differences for various services activities. Easily traded services such as travel and transport account for a significant part of the total transactions with over 24 % and 19 % of the total cross border trade in services in the EU-28. However, "Business services" are the main sector accounting for the largest share of intra-EU trade in services with over 25 % in 2013. Intra-EU exchanges in this sector have grown by 5.6 % between 2010 and 2013, but the fastest growing sector in intra-EU trade terms has been the Maintenance and repair sector with over 15 % growth in those years.

Figure 3.8:Sectoral composition of intra-EU exchanges of services (2010–2013)


Source:Eurostat

The signs of maturity or stagnation identified in the previous section for the single market for goods, reflected by different patterns displayed by trade in the EU-15 and EU-13 groups of Member States, are not found in the services markets. The differences in the levels of integration between the two groups of countries are much smaller and the turnaround in the ranking of integration in services across countries is not so clear in favour of the EU-13 countries. Over time, progressive albeit modest improvements in the development of intra-EU exchanges in services sectors can be observed for the EU-28. The most significant improvements are reported by Ireland, Belgium and Hungary. Only Cyprus and Bulgaria show lower trade intensity in the intra-EU exchanges in services in 2010–2013 compared with 2004–2008 (Figure 3.7).

Within services there are sectors with considerable potential of expansion in intra-EU trade. The study on the implementation of the Services Directive 3 and the Communication preparing the mutual evaluation exercise 4 point out the economic importance of business services and construction for employment and growth making those two service sectors priority for the Commission.

The “business services” 5 sector is particularly important because it has a considerable impact on the productivity growth of manufacturing and other services sectors. Trade in “maintenance and repair services” is often associated with the acquisition of capital equipment or consumer durables. In many cases, these activities are often present in the development of new business models or in the bundling of goods and services in "business solutions". They also require the contribution or cross-border operation of skilled labour and/or professionals considered as regulated professions. As explained in the Staff Working Document accompanying the Single Market Strategy, these activities are often subject to national regulations that often hinder the development of these cross-border activities. Despite these difficulties, the considerable growth and increasing trading activities reported by these sectors are evidence of their growth potential once these obstacles are removed.

Box 3.1. The importance of business services

In some Member States, the services value added content of manufacturing exports is as high as 30 %, of which 40 % corresponds to business services. An implication of a high use of services in manufacturing exports is that exports of countries with underperforming services would benefit from reform efforts targeting services sectors. In addition:

1.Professional services activities included in the "business service" category such as architects, engineering, legal advice, accounting or management consultancy stand out because of their ‘special’ characteristics: a) they rely greatly on professional knowledge, b) are sources of knowledge and c) are of competitive importance for their clients. They perform, mainly for other companies, ‘services encompassing a high intellectual value-added’ providing customised problem solving assistance, through tacit and codified knowledge exchange. Therefore, their role in the economy goes significantly beyond their shares in value added and employment.

2.They create significant spill-overs because they are used in the production of other goods and services in the economy (supply spillovers) and can thus have a strong impact on other sectors’ economic performance. This is particularly the case of professional services activities included in the business services categories. Thus, the benefits of reforms aiming at liberalising and improving the functioning of those professional services, will spread through the whole economy.

3.The increased fragmentation of production processes into parts that can be outsourced has led to more complex systems for manufacturing production and has enhanced the role of co-ordination and related professional-services. Successful business relies more and more on the value provided by services. Therefore, well-functioning business services contribute to business successes.

4.They can be a significant driver of non-price competitiveness. Business services, in particular professional services, are increasingly being used to differentiate products that can compete on the package of associated services (after-sales service, maintenance, training, etc.). Business services, among which professional services, are among the most important market services sectors for exports of manufacturing, as demonstrated by the 30 % and 40 % proportions referred to above. 6

Data on the composition and evolution of the very diverse activities included in the “Business services” category are scant and time series are short. However, Eurostat publishes information shedding light on the recent evolution of some of those activities for at least some Member States, although it does not cover the full EU-28. Among them, computer programming and consultancy, employment and data processing services have reported turnover growth since 2008.

Figure 3.9:Turnover of cross-border deliveries of "Business services" subsectors for several EU Member States: value and proportion of total sector turnover (2008–2012)


Note:EU-10: BG, DK, DE, ES, IT, AT, RO, FI, SE, UK
EU-13: BE, DK, DE, IE, ES, IT, CY, LU, AT, RO, SI, SK, UK
EU-16 (ADVERTISING): BG, DK, DE, IE, ES, IT, LV, LT, HU, AT, PT, RO, SI, SK, SE, UK (EU-10 – FI + IE + LV + LT + HU + PT + SI + SK)
EU-16 (COMPUTER): BE, BG, DE, ES, IT, LT, HU, AT, PL, PT, RO, SI, SK, FI, SE, UK (EU-10 – DK + BE + LT + HU + PL + PT + SI + SK)
EU-20: BE, BG, DK, DE, IE, ES, IT, CY, LV, LT, HU, AT, PL, PT, RO, SI, SK, FI, SE, UK (EU-16 + DK + IE + CY + LV)

Source:Eurostat

The evolution of cross-border activities of these subsectors was quite different. The bars in Figure 3.9 show the values of the cross-border deliveries of services to another Member State. The lines indicate the share of these intra-EU deliveries over the total turnover of these subsectors. 7  

Legal, accounting and consultancy services seem to be increasingly traded cross-border in the single market. This is due to the relative increase in the cross-border activities in accounting, audit and management consultancy while the value of cross-border deliveries of legal services remains stagnant over these five years. 8

The share of intra-EU cross-border deliveries of employment services is remarkably low, which probably reflects the relative degree of fragmentation of this market in the EU in national markets.

While data processing displays growth in cross-border services deliveries, the situation seems to be less clear for computer programming and consultancy services. This subsector is probably the fastest growing and largest of the business services activities included in the “business services” category. However, the growth of intra-EU cross-border transactions is barely keeping up with the growth rate of the overall growth of the sector and the share of deliveries over total turnover is relatively flat.

Although this statistical evidence should be taken with caution given the sparsely available data and the short time series, it seems to be well in line with the situation as described by the analysis of legal restrictions in the documentation accompanying the Single Market Strategy.

In summary, the resilience of intra-EU exchanges in services during the crisis shows their importance for the single market. The steady growth of the share of these flows over GDP is a sign of a latent potential for growth in cross-border exchanges in services. The factors limiting this potential are studied in more detail in the Staff Working Document accompanying the Single Market Strategy and the evidence presented here supports the direction the proposals included in the strategy. Given the importance of cross-border investment for services, this analysis must be complemented with a look into intra-EU foreign direct investment.

3.1.3    Foreign Direct Investment and establishment

Foreign direct investment (FDI) 9 has been a very important driver of Europe’s internationalisation and integration. It has also been a very important component of the total investment as measured by Gross Fixed Capital Formation (GFCF). In 2000, total inward FDI in the EU represented almost 40 % of EU GFCF according to Eurostat figures, and intra-EU FDI alone accounted for over 30 % 10 This was an exceptional year, but the level in the past decade was often above 10 % of total investment.

Figure 3.10:Inward and outward FDI in major trading areas of the world (2000–2013, % of GDP)


Source:UNCTAD and Eurostat

The fall in the outbound FDI flows has been important between 2004 and 2013. But the reduction in intra-EU investment flows has been much more significant and the evidence suggests that low intra-EU FDI is one of the reasons explaining why investments in the EU are below their long run trends (Figure 3.11).

Figure 3.11:Intra-EU FDI (1994–2012, as a percentage of total outward FDI)


Source:Copenhagen Economics for European Commission with UNCTAD and Eurostat data

Intra-EU inward FDI from other Member States can be an indirect indicator of, at least, part of cross-border establishment. 11 Figure 3.12 shows data of investment flows between Member States and the rest of the world, including other EU Member States. The latest data available show intra-EU capital inflows below 4 % of GDP for the last four years. This is about half of the levels reached before the crisis. With the main exceptions of Luxembourg and Ireland, the fall in inward FDI has been almost generalised between 2004 (the worst year for FDI before the crisis) and 2013. 12 In Luxembourg, there has been a steady investment inflow after the crisis that cannot be found in other countries. The Irish case is different: although the level of FDI in 2013 has been considerable, the comparison is distorted by the fall in FDI registered in 2004.

Figure 3.12:Inward FDI by Member State (2000–2013, % of GDP)


Source:UNCTAD and Eurostat

The evolution of intra-EU FDI presents some clear analogies with the evolution of trade in goods. Once more, there is a different evolution in the EU-15 and the EU-13 groups of countries. European FDI in EU-15 Member States reached peaks in 2007 and 2011 but it has fallen since 2011 presenting now levels below those attained in 2004. On the other hand, European investment in EU-13 Member States has been growing consistently since the beginning of this century and has been little affected by the crisis. 13

A look into the sectoral composition of FDI confirms the significance of establishment as a form of integration in other Member States. Eurostat statistics of the activities of foreign affiliates indicate that in 2012, services firms accounted for 74 % of all the foreign affiliates of firms from another Member State operating in the EU-28. These firms also accounted for the same turnover as all intra-EU foreign affiliates. These figures do not include firms in the financial services sectors where cross-border establishment is very frequent. 14

Figure 3.13:Inflows of intra-EU FDI into the EU-15 and EU-13 Member States (2001-2012, million Euro)


Source:European Commission; UNCTAD database

With over 49 000 firms, of wholesale and retail distribution hold the greater stock of foreign affiliates, followed by the real estate and the professional, scientific and technical activities with over 18 000 firms. Manufacturing only accounted for 18 of the total foreign affiliates of intra-EU origin. That percentage is around 4 % for construction.

Table 3.2:Number and turnover of Foreign Affiliates (FATs) of EU firms in other Member States (2012)


Note:* denotes 2011 data

Source:Eurostat

In summary, there seems to be some prima faciae correspondence or may be complementarities between the evolution of trade in goods and FDI in the EU. Intra-industry and intra-firm trade seem to account for a considerable volume of trade, especially in those sectors that account for a large share of the intra-EU exchanges. FDI in EU-13 countries triggers future trade flows as a result of integration after accession of the EU-13. In EU-15, both trade flows and FDI have remained relatively subdued but the causal links are less clear. 15 FATs figures suggest that the inter-linkages between trade and investment or establishment in integration are very important. More work is needed to understand these factors better because barriers in either cross-border trade or in establishment in other Member States have an impact along value chains distorting the allocation of resources and hampering the growth of firms.

3.2    Single Market Performance

The performance of markets can be measured according to different criteria. The same applies to the single market. This section presents a number of different overall assessments of the changes in the performance of the single market and the regulatory environment that defines it.

This is not an exhaustive assessment because it is not possible to present in this report a complete evaluation of the multiple dimensions of the economic performance of the single market as regards its impact on competitiveness, job creation, efficiency or growth effects as well as its social impacts in areas such as fairness, consumer welfare or cohesion. This is a first assessment focusing on some basic economic dimensions. These include allocative efficiency (goods producers as well as service providers), the performance of public procurement markets, the regulatory environment affecting product markets and the changes in the services sector after the introduction of the Services directive. Some of these assessments will be periodically repeated in the future and others covering additional areas will be developed in the future.

3.2.1    Brief review of the economic effects of the implementation of the Single Market legislation

Product markets

In January 2014, the Commission published a study conducted by CEES with an in-depth Evaluation of the Single Market Legislation for Industrial Products. This study was the basis for the Communication "A vision for the single market for industrial products" adopted on 22 January 2014. 16  

Among others, the objectives of the study included:

Examine how far the body of single market legislation for industrial products is fit for purpose and the extent to which they constitute an effective means of addressing barriers to the functioning of the single market for industrial products;

Identify and analyse any gaps, loopholes, inconsistencies and duplication in IM legislation for industrial products or in administrative requirements for economic operators;

Assess the costs and benefits of Union harmonisation legislation for economic operators and the impact on strengthening industrial competitiveness;

Assess the cumulative impacts of, and interaction between legislation and compliance requirements. 17

The study concluded that the single market legislation presents a high level of “fitness for purpose”. As stated in the Communication, “The overall conclusion is that single market legislation is relevant to meeting EU objectives relating to the need for technical harmonisation measures with high levels of protection for health and safety and consumers and, to the environment.” (page 7) However, the public consultation and the study also pointed out to a number of performance issues that led to 20 recommendations included in the Communication.

In particular, the study reviewed the efficiency and effectiveness of the implementation mechanisms and checked for compliance costs using a case study approach. Probably, one of the main results of the study was raising awareness about concerns among many stakeholders regarding the effectiveness of market surveillance. These concerns arise from: variations in the human and financial resources made available for market surveillance activities across different Member States, the low likelihood that more complex products such as industrial machinery will be checked and tested by market surveillance authorities for technical compliance due to the lack of adequate technical capacity and practical challenges in testing products against the requirements set out in more complex IM legislation such as the Ecodesign Directive and its implementing regulations.

There are also differences in approach to market surveillance between those authorities as to the degree of emphasis they place on checking products for technical compliance and administrative requirements respectively. There is a perception among economic operators that there remain unacceptably high levels of non-compliance, which undermines the level playing field and serves as a disincentive for firms to invest in meeting European compliance requirements. With regard to e-commerce, from a market surveillance perspective, difficulties were detected in preventing non-compliant products from entering the EU from third countries purchased on-line.

Regarding the costs of compliance, the study concluded that single market legislation does not pose excessive cost burdens, although some pieces of legislation were regarded as costly (especially those with other objectives than product safety). In most of harmonised product groups under review (e.g. electric motors, lifts, petrol pumps and air conditioners), annualised compliance costs do not exceed 1 % of annual turnover of the sector. However, the study encountered difficulties in getting firms to estimate substantive compliance costs at the design and R&D phase for many of the harmonised product groups examined, so the true costs of compliance may be somewhat higher. There was moreover some divergence in estimated compliance costs between different product groups, which does not easily facilitate cross-product comparisons.

There were only two exceptions where compliance costs were higher than 1 %, laptops (2 %) and gardening equipment (3.9 %). In the laptops sector, it was acknowledged that there were cost synergies from investment in compliance with European regulatory requirements when exporting to other global jurisdictions, even if there are differences in technical standards. In the case of gardening equipment, the higher level of compliance costs is mainly because the costs of compliance with environmental legislation (e.g. on outdoor noise, non-road mobile emissions) are relatively high. Administrative costs are still no more than 0.3 % of annual sectoral turnover. Nonetheless, there are concerns as regards the level of administrative costs and burdens associated with some single market compliance requirements. The Staff Working Document accompanying the Single Market Strategy presents detailed quantitative evidence of these case studies.

A further a detailed evaluation of the application of mutual recognition in services has been conducted more recently. Between June 2014 and May 2015, the European Commission commissioned an external evaluation with the view to examine the application of the principle of mutual recognition in the single market for goods. It also aimed at identifying sectors in which the application of the principle is economically most advantageous, but where its functioning remains insufficient or problematic. The evaluation has also been linked to the Regulatory Fitness and Performance (REFIT) Programme.

It pointed at significant barriers impeding the principle of mutual recognition to achieve an optimal application, among which:

Lack of trust among national authorities, which leads to authorities in some Member States adding requirements (such as extra tests) which are not in accordance with the mutual recognition principle.

Lack of knowledge of the application of the mutual recognition principle among competent authorities and businesses, often resulting in the latter abiding by the demands from national authorities to adapt their products that are already lawfully marketed in another Member State.

Lack of cooperation between national authorities, not infrequently leading to delays and incomplete and unhelpful information to the economic operators.

The valuation produced the following main recommendations:

Better monitoring of the implementation of the mutual recognition principle, including through active involvement of the Product Contact Points (PCPs). A strengthened role for PCPs, inter alia through grouping functions and activities related to Single Market issues within relevant Member State administrations to create better dynamics and a single access point for economic operators.

Setting up a mechanism for easier demonstration of “lawful marketing” for economic operators.

Better insight into the magnitude of an incorrect application of the mutual recognition principle for businesses, particularly for SMEs.

Improve dialogue among competent authorities, as well as between the competent authorities and the Commission, including an improved notification procedure that should overcome the current discrepancies between the number of notifications received by the Commission and the number of decisions denying or restricting mutual recognition made by the national authorities.

Awareness raising campaigns for economic operators, business associations and national authorities (including at regional level).

Last but not least, the evaluation identified a number of sectors where action particularly could be taken, most important of which construction and food sectors.

Services: the impact of the services directive

Covering over 45 % of EU GDP, the implementation of the Services Directive has so far been the largest recent reform effort in an area relatively to promote cross-border provision of services and the free establishment within the EU.

Its economic impacts have been assessed in detail in a study issued in 2012. 18 Based on econometric estimations using new data on specific barriers targeted by the Directive as well as simulation results obtained from the Commission’s general equilibrium model (QUEST3), this study estimated the EU-level long-term impact of different scenarios of implementing the Services Directive. The study concluded that the reforms carried out by Member States until the end of 2011 would contribute 0.8 % of EU GDP, with varying impacts across Member States (ranging from below 0.3 % to more than 1.5 %). The study further highlighted the growth potential of an ambitious implementation of the Services Directive and estimated its possible additional economic impact at 1.8 % EU GDP over 20 years, with most of the benefit occurring in the first five years. Within the sectors considered, FDI growth would be 8.8 percentage points higher and productivity 8.9 percentage points higher, on top of the pre-2011 gains referred to above. These effects are found to vary significantly across Member States (Fig 3.14), reflecting differences in sectoral compositions and export and FDI structures.

The study also underlined the importance of the domestic transmission channel. 19 It showed a direct impact on labour productivity of the reduction of specific regulatory barriers thanks to the Directive. For instance, a 10 % reduction of barriers to establishment was found to bring about a 1.6 % increase in labour productivity in services.

Figure 3.14:Impacts of barrier reductions within the analysed sectors in the EU


Source:Monteagudo et al. (2015), European Commission, European Economy Economic Papers 456, June 2012.

Additional work has been undertaken since to assess the progress made in implementing the various strands of the directive and update estimates of the related economic impacts. It showed that the pace of national reforms slowed considerably after 2011, compared to the period following the entry into force of the Services Directive, and that reform efforts have been uneven across Member States (Figure 3.15).

Figure 3.15:Number of restrictions in 2014 compared to 2011 by sectors


Note:* indicates MSs with economic adjustment programmes in 2012–2014, ° indicates MSs with one or more CSRs on services in 2012–2014.

Source:European Commission, own calculations

Based on an improved measurement of the changes in regulatory barriers, the 2015 assessment has shown that the largest reform efforts took place in the restrictions for accountants, hotels, tax advisers, and engineers, while legal services are still the most regulated sector in the EU followed by architects and retail trade (Figure 3.16).

Figure 3.16:Number of restrictions in 2014 compared to 2011 by sectors


Note:The black dots denote the total number of restrictions in 2011

Source:European Commission, own calculations

For most Member States, there is no evidence of further reductions in regulatory barriers in the period 2012–2014. In some cases this can be explained by the fact that regulatory regimes were already relatively light, but in other cases there has been little reform progress despite recommendations under the European Semester. For Ireland and Hungary, barrier levels are even found to have slightly increased which could have small negative impacts. In contrast, Greece, Estonia, Spain, Italy, and Portugal have made the largest efforts to reduce legal barriers in accordance with the directive, with positive growth impacts of up to 1 % for Greece and 0.3–0.7 % for the Estonia, Spain, Italy and Portugal.

The new assessment concludes that the economic gains of reforms carried out in 2012–2014 are limited, about 0.1 % of GDP growth, and falling short of the estimated potential impact of 1.8 % in the 2012 study. The detailed impacts on GDP, FDI and trade of the Member States are shown in figure 3.17 below.

Figure 3.17:New estimates of the economic impact of the implementation of the Services Directive


Source:European Commission, own calculations

The results of these studies indicate that further efforts are needed to ensure enforcement of the existing legislation. This will also foster resource reallocation in the single market through its expected positive impacts on productivity and FDI.

3.2.2    Allocative efficiency across sectors and Member States

Chapter 2 of this report underlined the importance of the reallocation of productive resources to improve the competitiveness of the EU. At present, the importance of this reallocation is enhanced by the digitisation of the economy, changing relative prices of inputs and the new redistribution of labour at global scale.

In this section, we present some simple indicators as a first approximation of the state of play of resource allocation and performance of the single market at present. These indicators and measures will be complemented in future editions of the report with other indicators addressing other dimensions of market performance.

Allocative efficiency (AE) is the most traditional criterion to assess market performance. It refers to the allocation, within or between firms, of productive factors to their most efficient uses. In that sense it is particularly relevant to assess productivity. 20   21

This section presents AE indicators for a number of aggregated industrial and services sectors across most Member States (Malta is often missing due to data availability). The productive factor of interest in this context is labour. Efficiency in the allocation of this key factor of production will be assessed against the distribution of labour productivity in the same sector. Expressed in simple terms, the question of allocative efficiency then boils down to analysing the extent to which labour is allocated to the segments of each sector with the highest labour productivity.

Figure 3.18:Allocative efficiency in manufacturing (2007–2013)


Note:Data for Luxembourg and Malta not available.

Source:Eurostat

The AE indicators presented here measure the efficiency of the current allocation of labour across firms within each sector by comparing it with a hypothetical efficiency level that would be achieved if labour would be uniformly distributed across firms. Insofar as the actual distribution of labour is the result of the functioning of the single market in that sector, this can be used as a proxy to measure the performance of the single market from the point of view of the efficient allocation of labour. A limited number of selected sectors are presented here.

Box 3.2. Measuring the efficient allocation of labour

To quantify AE for the purposes of this section, the product (θiθbase)(lpilptot) is calculated for each firm size class segment i of every national sector, after which the products are summed across all size classes (5 classes for industrial sectors; 6 for services following Eurostat classification). Following European Commission (2013), 22 the share of sector employment in size class i will be used for θi as a proxy for market share, while θbase represents the baseline hypothesis that market shares (employment proportions) are distributed equally across size classes: 20 % in each of the five size classes for the industrial sectors, 16.7 % in each of the six classes for services. lpi and lptot denote the logarithms of labour productivity in firm size class segment i of a sector and for the sector as a whole respectively. Using logarithms of labour productivity means that the resulting sum of products across all size classes can be given a straightforward interpretation as the percentage gain or loss in relation to the baseline scenario of the observed allocation of labour. If the sum is positive, the observed allocation is better than the hypothetical uniform distribution across firm size classes. If the sum is negative, the observed allocation is less efficient than the hypothetical uniform distribution. 23

Looking first at manufacturing, labour is more efficiently allocated than the baseline scenario in almost all Member States. Exceptions include Greece and Cyprus. For Ireland and Hungary, data suggest much higher allocative efficiency than in most other Member States. For some countries, data are available for three years (2007, 2010, 2013). Most efficiency gains are around 20 % and relatively stable over time; particularly significant improvements in AE can be reported in Denmark, Belgium and the Czech Republic while falling AE occurred over time in Lithuania, Finland and Cyprus (see Figure 3.18).

In contrast with the situation in manufacturing, in the construction sector, labour is allocated less efficiently than the baseline scenario. Prominent allocative efficiency losses are observed in Greece, Italy, Poland, Hungary and Slovakia. In 2013, the UK and Bulgaria were the only Member States with positive allocative efficiency. It is worth mentioning that this indicator shows a deterioration in the allocative efficiency for a number of countries, particularly in Greece, Spain, Portugal, Slovenia and Belgium in 2013 (see Figure 3.19).

Figure 3.19:Allocative efficiency in construction (2007–2013)


Note:Data for Malta not available.

Source:Eurostat

Carrying out the same calculations for distributive trades (retail as well as wholesale) and transportation and storage produces the AE values in figures 3.20 and 3.21. With some exceptions, AE values are generally negative in distributive trades (suggesting substantial scope for efficiency gains) and positive in transportation and storage. Germany is an exception, having allocative efficiency in trade but not in transportation and storage. Lithuania stands out as a Member State with allocative efficiency in trade as well as transportation and storage. The results differ slightly from those in European Commission (2013) 24 due to different aggregations of size classes. Over time, efficiency does not seem to be improving significantly in distributive trades, but rather the opposite. Some Member States report further deteriorations in this AE indicator.

Figure 3.20:Allocative efficiency in distributive trade (2007–2013)


Note:Data for Malta not available.

Source:Eurostat

Figure 3.21:Allocative efficiency in transportation and storage (2007–2013)


Note:Data for Malta not available.

Source:Eurostat

In professional, scientific and technical services 25 , AE values are generally negative (see Figure 3.22), while in information and communication services they are generally positive. In the former category, particularly low values – indicating scope for allocative efficiency gains – are found for Portugal, Hungary, Italy, Bulgaria and Greece. By contrast, Denmark and the UK are the only Member States with slightly positive AE values. In information and communication, the highest allocative efficiencies are found for Bulgaria, Spain, Croatia and Romania. The results differ slightly from those in European Commission (2013) due to different aggregations of size classes. Over time the situation seems to be worsening in both professional and information services (see Figure 3.23).

Figure 3.22:Allocative efficiency in professional, scientific and technical services (2007–2013)


Note:Data for Estonia, Latvia and Malta not available.

Source:Eurostat

Figure 3.23:Allocative efficiency in information and communication services (2007–2013)


Note:Data for Ireland, Luxembourg and Malta not available.

Source:Eurostat

The analysis in this section reveals a distinction between goods and services exposed to international competition and sectors catering mainly for their domestic market. In manufacturing, transportation and storage, and information and communication services, allocative efficiency is high in virtually all Member States. The output of these sectors is in many cases traded across borders and EU producers are often exposed to intense global competition.

By contrast, in sectors such as construction; distributive trades; professional, scientific and technical services, competition is more local and producers are under less competitive pressure. In these sectors, the assessment of allocative efficiency often resulted in negative values, indicating that an equal distribution of labour across the different size classes would be more efficient. In such cases there is scope for a more efficient allocation of labour, however it is not possible to predict how important such a reallocation would be for firms, sectors or the economy as a whole.

The evidence presented in this section also suggests that the direction of changes in allocative efficiency in recent years has been very diverse across sectors. While improvements can be detected in manufacturing, the services sectors mentioned in the second group above present further deterioration of their efficiency. The deterioration in allocative efficiency in the construction sector in several countries is an additional cause for concern. If confirmed with further analysis, this gives rise to additional concerns, especially at a time when an increasing volume of resources are being shifted from other sectors toward services.

3.2.3    Overall evolution of product market regulation in the Single Market

Despite the strong commitment to the creation of a competitive product market for goods and services in the EU, significant regulatory and non-regulatory barriers to the smooth functioning of the single market persist. After a period of crisis in which reforms in favour of single competition have stalled in many sectors, reviving the efforts to further eliminating these barriers appears to be a priority, as the single market is widely recognised as one of the main drivers of potential economic growth and competitiveness in the EU. A deeper and fairer single market could allow the EU to reduce the investment gap with respect to commercial partners and increase trade between Member States, facilitating a more efficient reallocation of resources across Member States and delivering at least EUR 521 billion and 4 % of GDP growth in the EU. 26

This section presents an overview of the evolution of product market regulation from 1998 to 2013 based on the Product Market Regulation indicators (PMRs) elaborated by the OECD. It must be said that these indicators measure the situation of markets taking into account the joint impact of regulations and legislation developed by the Member States in the implementation of EU directives and regulations as well as those developed at their own initiative.

To measure the evolution of obstacles raised by Member States to a deeper and fairer single market and the contribution of national measures, the evolution of economy-wide and sector regulations 27 has been compared with the performances of key indicators of competitiveness and integration. 28

The analysis shows that all Member States have made significant efforts over the years to improve market performance by reducing barriers and regulations. However, in the last ten years and in particular after the crisis, the momentum of reforms in this field has substantially slowed down, particularly in the EU-15. This is in contrast with the experience of Member States that accessed the EU in 2004 or later: they have made substantial efforts in the same period. These Member States appear to be reporting higher trade integration and faster convergence in terms of competitiveness.

Figure 3.24 shows the performance of Member States concerning barriers to trade and investment 29 . The majority of Member States were able to decrease the level of existing impediments between 2008 and 2013. In particular Hungary, Belgium, Greece, Slovakia, Italy and Poland report the largest weighted reductions. However, the average value in the EU increased with respect to 2008, mainly due to the above average barriers reported in Croatia, the Baltic countries, Cyprus and Malta, which were not included in the 2008 calculations. Moreover, performances in this domain are still heterogeneous in the EU: whilst the Netherlands reports the lowest aggregate score for existing barriers among all OECD countries in 2013, Croatia reports one of the highest absolute value.

Figure 3.24:Barriers to trade and investment (2008–2013)


Source:OECD (aggregate index ranging from 0 (no barriers) to 6)

Although the available data do not cover the totality of Member States, it is interesting to observe the evolution of regulation in key sectors such as energy, transport and communication. Whilst barriers have generally decreased for all countries, it can be observed that the largest reductions have occurred in the two decades between 1985 and 2005 for EU-15 member States (Figure 3.25), whilst among the 13 countries which have joined the Union after 2003, those for which the data are available show consistent reductions of the barriers in the 2000–2013 period, in view and after their accession to the Union (Figure 3.26). Moreover, new entrants show a convergence path and among them one group of countries seems to have converged to the frontier while another group seems to have converged towards the values of low performing EU-15 Member States.

Figure 3.25:Regulation in energy, transport and communication, EU-15 (1975–2013)


Source:OECD

Figure 3.26:Regulation in energy, transport and communication, EU-13 (1990–2013)


Source:OECD (for non-OECD countries only 2013 data is available)

Comparing these trends with data on intra EU-trade, it can be observed that for many Member States, and in particular new entrants in the EU, the generalised increased effort in reducing regulatory barriers corresponded to an increase in intra-EU trade growth. Although other factors certainly contributed to this evolution, this confirms the strong potential of the single market in increasing intra-EU trade and investment.

Figure 3.27:Regulation in professional legal services, EU-13 (2003–2013) vs. EU-15 (1998–2013)


Source:OECD (for non-OECD countries only 2013 data is available)

A number of existing barriers to the access and exercise of regulated professions 30 are impeding the full potential of services in the EU. In particular, professional services and retail regulations have been reported to be critical in some Member States, as well as being pointed out by the European Commission and the Council in the 2015 country-specific recommendations to Member States. As outlined in the SWD accompanying the Single Market Strategy, these services are essential to businesses and consumers, thus reducing these barriers could have a substantial effect on the integration and competitiveness of the EU. With respect to other energy, transport and communication sectors, progress in the elimination of barriers in regulated professions was subdued, as can be observed, for example, in figures 3.27 and 3.28 which depict the evolution of existing barriers in legal services and engineering services, showing neither convergence nor substantial progress in the last decade. 31 In addition the implementation of the Country Specific Recommendations (CSRs) by EU Member States dropped significantly in 2013. Member States put the greatest effort into addressing CSRs related to the financial sector whereas CSRs related to structural reforms had the highest percentage rate of non-implementation. 32

Figure 3.28:Regulation in professional engineering services, EU-13 (2003–2013) vs. EU-15 (1998–2013)


Source:OECD (for non-OECD countries only 2013 data is available)

Looking at the aggregate index for all analysed professional services (Figure 3.29), it can be observed that the most substantial progress between 2008 and 2013 has been achieved in Italy, Greece, Spain, Austria and Poland. However, overall policy initiatives in this field have been limited, leaving scope for further improvements that will particularly benefit integration and competitiveness.

Figure 3.29:Regulation in professional services (2008–2013)


Source:OECD (aggregate index; data for Latvia not available)

The performance of the retail sector is shown in Figure 3.30. It can be observed that this is one of the areas in which the EU has achieved substantial progress when compared to the 2008 situation. Competition in the retail sector has been fostered through reforms in many Member States and the trend has continued in 2014, with further Member States implementing reforms, offering better market conditions both to consumers and enterprises and improving the functioning of the single market. While the results of the reform process is a notable achievement, the data also show that in many Member States barriers are still high and the space for improvement is still substantial across the EU.

Figure 3.30:Regulation in retail trade (2008–2013)


Source:OECD (aggregate index; data for Ireland not available)

3.2.4    Economic convergence in the Single Market

One of the objectives of the European Union is to promote the economic convergence amongst Member States by fostering changes in economic structures and increasing the degree of market competition. Closer economic integration is expected to unleash competitive forces which would lead to further economic convergence. As shown in Box 3.3 below, we observe various degrees of convergence for the EU as a whole (EU-28) in prices, GDP per capita and labour productivity over the last 15 years. However, we do not detect any convergence on these parameters among the fifteen countries that joined the EU before 2004 (EU-15).

A properly functioning Single Market is expected to foster market integration and thus the convergence of prices among Member States. If there are low barriers to trade in goods and services, prices should be similar due to the unconstrained interaction of supply and demand as economic agents take advantage of arbitrage opportunities. We would thus expect to see a decrease in the dispersion of prices across EU Member States, yet this is not exactly what we observe. Indeed, there has been price convergence for the EU as a whole over the last twelve years, with a remarkable convergence among the Member States who joined as from 2004 (EU-13). However, there has been stagnation in the dispersion of prices across the EU-15 over this period. Moreover, we observe a change of trend among the price dispersion in the EU-15 since the onset of the crisis. Indeed, prices started to diverge in the last 5 years, reversing the slight progress achieved in previous years. This may signal a compartmentalisation of the single market with the onset of the crisis.

The effective functioning of the Single Market should also ease the mobility of production factors (labour, capital) across Member States. This enhance mobility of resources should contribute to their efficient reallocation from less productive firms and industries to more productive ones. Even if other factors play a significant role on resource allocation, we could expect that the disappearance of obstacles to the free movement of capital and labour would lead to a convergence in productivity levels.

Ultimately, a convergence in productivity levels should also stimulate the catching up process from less developed economies and therefore would be reflected in a convergence of GDP per capita. However, we see again different performances between the EU-28 and the EU-15. While there has been a slight convergence in the former, there has been divergence in the latter.

The above-described evolution in the dispersion of prices shows that there has been an overall economic convergence among EU Member States in the last 15 years. However, the analysed parameters seem to imply that the convergence has been driven by the dynamism of those Member States who joined as from 2004, since no convergence is observed amongst those who joined before. Indeed, a more granular analysis of sigma convergence in labour productivity at sectorial level clearly shows the distinct performance of the two groups of Member States. The overall stagnation in the dispersion of labour productivity among the EU-15 is in sharp contrast with a marked reduction among EU-13. This reduction is very sharp in the years just before accession and continues at a more moderate pace afterwards.

This analysis of economic convergence reconfirms the pattern observed in trade and investment. That is, the co-existence of a more sluggish performance of the EU-15 where the single market is relatively more mature, and a more dynamic evolution of the EU-13 resulting from their accession to EU. This validates the unquestionable benefits of joining the single market in terms of a reduction in the economic disparities. However, the dwindling of economic convergence dynamics after accession seems to imply that the single market does not generate endogenous factors that would guarantee the continuation of this convergence in the long term. Reforms of the single market could certainly lead to a higher degree of economic integration and convergence. Indeed, the disappointing performance of the EU-15 may be partly due to the unfinished status of the single market, particularly in the services sector, and the slow or incomplete implementation of reforms in this area. Yet, the challenge is to ensure that reforms establish appropriate mechanisms to maintain economic convergence dynamics amongst Member States in the long run.

Figure 3.31:Coefficient of variation in prices


Note:Purchasing power parities (PPPs), total goods, price level indices and real expenditures for ESA2010 aggregates

Source:Eurostat, European Commission's calculations

Box 3.3.: Sigma convergence in prices

Sigma convergence analysis measures the evolution of the dispersion of a variable to assess whether convergence is taking place. In this section we look at the evolution of the coefficient of variation (that is, standard variation of the variable divided by the mean) prices,. A decrease in the coefficient over time signals a reduction in the dispersion of data and thus a convergence in the analysed parameter. In the same way, an increase in the coefficient signals a surge in dispersion and thus increasing divergence.

The coefficient of variation of comparative price levels for goods in EU-28 sharply decreased after the enlargement of 2004 until the start of the crisis. Afterwards, price dispersion increased, although not fully reversing the previous gains. In contrast, there has been an overall stagnation in the price convergence across those countries that were EU Member States before 2004 (EU-15), with a perceptible increase in the dispersion in the last five years. (see Figure 3.31)

Similar analyses can be carried out for GDP and labour productivity convergence.

3.2.5    The role of the public sector: public procurement markets

The public sector is an important economic player in the EU economy. The size of public expenditures on works, goods, and services (representing more than 19 % of EU GDP) makes public procurement a critical area of single market integration, an important driver of both Member States' and businesses' competitiveness, and a critical lever to help achieve economic recovery and the creation of jobs.

Public procurement is also directly linked to many key policy challenges the EU is facing: growth and jobs, fiscal discipline, modernisation of public administration, trust of citizens in public authorities, innovation, and green and inclusive growth.

3.2.5.1    The untapped potential of public procurement for the integration of EU firms in the Single Market and the performance of public procurement markets

Transparent, fair and competitive procurement markets across the Single Market create business opportunities for European enterprises and contribute directly to economic growth and the creation of jobs. While steps towards a single European procurement market have been taken for decades, there are still significant inefficiencies in public procurement across Member States that limit cross-border expansion or growth in the domestic market.

These include for example:

the different procedures based on the Remedies Directive 2007/66/EC which provides legal tools to aggrieved bidders for breaches of EU procurement law by public bodies or utilities;

the low level of publication of public tenders at EU level (the estimated average of value of tenders with utilities corresponds to 4.7 % of EU GDP);

the varying speed of the implementation of e-procurement in the Member States;

the uneven level of professionalization of public buyers;

the remaining vulnerability to corruption;

the low number of Member States that have defined policies for socially responsible public procurement or for inclusion of innovation aspects, and the absence of consistent approaches in implementing these policies across Member States, especially when they result in (technical) requirements inhibiting access to national markets, may affect the functioning of the Single Market;

rare cases of aggregation of demand in public procurement (14 % of contract award notices at EU level established a framework agreement in 2009–2014, but it varies with type of product/service).

3.2.5.2    The level of publication of public tenders at EU level

One of the key policy issues on Single Market integration is the level of publication of public tenders at EU level. Although EU-wide publication of contracts above certain thresholds is one of the key obligations stemming from the EU rules on public procurement, there are some Members States where the value of procurement published in relation to GDP is far below the EU average of 4.7 % (2009–2013). As pointed out above, despite the fact that increased publicity requirement induces more entry, transparency of below-threshold procurement varies greatly across Member States (Figure 3.32). 33

Figure 3.32:Value of calls for tender published as a percentage of GDP by Member State (2009–2013)


Source:European Commission based on OJ/TED data

Member States in which the value of published tenders is relatively small in relation to their GDP, such as Germany (1.3 %), Luxembourg (1.5 %), Netherlands (2 %) or Austria (2 %), 34 also have a current account surplus, i.e. while benefitting from other countries’ market openness, these countries do not offer symmetric opportunities for European businesses from other Member States. An increase in the value of contracts published EU-wide would generate additional opportunities for European businesses in other Member States, including in Member States with current account deficits. 35

3.2.5.3    Participation of non-national operators in national public procurement

Other symptoms of deficiencies in the functioning of the Single Market include the low level of participation of non-national operators in the national public procurement markets, with striking inequalities among Member States. For EU-28, the average proportion of contracts which were awarded to foreign companies in 2009–2014 is 4 % and relatively stable, the best performers being Luxembourg (15 %), Malta (15 %), Ireland (13 %), while the countries far below the EU-28 average are Spain (0.6 %), Bulgaria (0.7 %), Poland (0.8 %) and France (0.9 %) (Figure 3.33). The reasons for the low level of participation of non-national operators in the national public procurement markets include indirect buying from branches or subsidiaries, where the differences between Member States in the value of indirect cross-border awards vary from nearly 0 % to 44 % (the EU average is around 13.4 %). 36 Such indirect buying distorts data on the proportion of contracts awarded to foreign companies.

Figure 3.33:Proportion of contracts awarded to foreign companies


Source:European Commission based on OJ/TED data

3.2.5.4    The procedures used in public procurement

One of the key elements that indicate the openness and the potential for competition in public procurement is the transparency level, which is mainly given by the type of procedures used. The main procedures, which could also indicate the level of transparency, are the open procedure for high openness and the negotiated-without-competition procedure (NOC) for low openness.

The EU-28 proportion of contract award notices where the NOC procedure was used is 7.6 % in 2009–2014, indicating that the observable part is fairly transparent. But there are certain countries with a very high proportion of contract award notices using the NOC procedure, such as Czech Republic (20 %), Romania (18 %), Slovakia (18 %) and Hungary (17 %). (See Figure 3.34)

Figure 3.34:Proportion of contract award notices where the NOC procedure was used


Source:European Commission based on OJ/TED data

3.2.5.5    Competition in public procurement

The final aim of public procurement policy is to achieve the best value for money through high levels of competition among bidders; the proportion of awards with just single bids is an indicator of low levels of competition.

At EU-28 level there were 21 % notices with just one bidder. The highest figures were for Slovakia (50 %), Poland (46 %), Croatia (32 %), Hungary (32 %), Estonia (31 %), Romania (30 %) and Latvia (32 %). The best performers were Ireland (6 %), UK, Netherlands and Denmark (each with 7 %). There is a high potential for improvement for many Member States (Figure 3.35).

Figure 3.35:Proportion of contracts for which there was a single bid (excl. frameworks) (2009–2014)


Source:European Commission based on OJ/TED data

3.2.5.6    Aggregation of demand

Aggregation of demand has a high potential to help public authorities obtain best value for money by incentivizing sellers to achieve economies of scale which could be shared with the authorities mainly if competition is strong (or by direct access to wholesale markets). Aggregation also has the potential to help public authorities achieve other important objectives such as social or green targets. There are two options of demand aggregation – buying through an established central purchasing body (CPB) and joint procurement with other entities. Commodities such as electricity are good examples.

At EU-28 level in 2009–2014, the average proportion of contract award notices where the contracting authority is purchasing on behalf of other contracting authorities was 9 %. There are Member States with much higher levels of aggregation than EU-28 such as Ireland (45 %) and UK (23 %), but there are also countries which much lower levels e.g. Bulgaria (1 %), Romania (1 %) and Portugal (2 %) (Figure 3.36).

Figure 3.36:Proportion of contracts award notices where the contracting authority is purchasing on behalf of other contracting authorities (either joint purchasing or central purchasing bodies) (2009–2014)


Source:European Commission base on OJ/TED data

3.2.5.7    Good practices

Aggregation of demand

Ireland – Savings in excess of €21 million have been achieved by the National Procurement Service (NPS) when purchasing electricity and natural gas for the public service in 2011. The NPS strategic approach to energy procurement will also ensure that the Irish public sector is on target to meet the national renewable (green) electricity requirements target of 40 % by 2020. Electricity contracts awarded in 2011 will deliver 51.9 % of electricity generated from renewable sources.

Scotland – National framework agreement for the supply of electricity for the Scottish public sector produced estimated savings of £40 million over an initial three year period; open to central government, health, local authorities, universities and colleges, other public bodies or NGOs; over 99 per cent of in-scope Scottish public sector volume is committed to this national agreement.

Italy – Consip acts as the Central Purchasing Body, procuring supplies and services for the entire Italian public sector. Following legislative measures introduced to rationalise public expenditure, the use of Consip tools is rapidly taking up (from € 3.3bn in 2012 to € 4.3bn in 2013). In 2013, the average savings generated by Consip, calculated comparing Consip prices with the average price paid by the PA for comparable goods and services, was 23 %.

Finland – Finland has an efficient central purchasing unit, Hansel Ltd, which generates savings for central government entities through easy and safe public procurement using framework agreements. In 2013, these savings amounted to approximately 240 million euros. 37

eProcurement

Over the years, public procurement has increasingly benefitted from electronic tools. eTools have proved to be important for simplifying the whole value-chain of public procurement, from preparing calls for tenders and uploading them for all European companies, to submitting bids and evaluating them. The simplification of the publication of notices has also made cross-border business opportunities much easier to find. Finally, an important benefit of electronic procurement, which has started to develop in recent years and is currently gaining momentum, is the use of procurement data to improve the governance of procurement systems and detect procurement anomalies. Whilst e-procurement has been introduced across the EU, the following are examples of good practices:

Czech Republic – zIndex is a tool created for benchmarking public procurement across ministries, municipalities, and other public institutions. Each institution has a graphically attractive profile with a score according to a transparent methodology and is given space to explain its performance. The tool has been created by researchers at the Charles University in Prague.

Portugal – Portugal has been a pioneer in the implementation of e-procurement. The Portuguese legislator made an effort to modernise public procurement, altering the public procurement regime to include new possibilities arising from technological developments. As a result the tender process was made almost completely electronic 38 and in most cases tender procedures do not use any paper documentation at all: in 2011, around 62 % of all tender procedures were carried out through e-platforms, out of which 92 % with a value above the EU Directives' thresholds. 39 Following the introduction of e-procurement, Portuguese hospitals were able to achieve price reductions of 18 % on their procurement contracts. In aggregate, the switch-over to e-procurement in Portugal is estimated to have generated savings of about €650 million in the first year but could have reached €1.2 billion if all contracting authorities had fully implemented it. The potential savings amount to between 6 % and 12 % of total procurement expenditure. Most of the savings were due to lower prices resulting from higher competition (more bids per procedure), although administrative savings were also achieved. 40

SMEs access to public procurement

Belgium – Belgium has introduced legislative measures to facilitate SME participation in public contracts. Contracting authorities are e.g. no longer allowed to request tenderers to provide facts or data which they can easily verify free of charge in an authenticated web-application database called Digiflow. The database was developed by the federal authority to facilitate the work of contracting authorities and to reduce the administrative burden of tenderers. The use of Digiflow is mandatory to the federal and regional authorities. According to a recent study conducted by DG GROW, the share of SMEs participating in public contracts is slightly higher in Belgium than the EU average (SBA Fact Sheet 2012 – Belgium). This tends to confirm that the measures taken by the Belgian authorities have at least to some extent strengthened the position of SMEs in public contracts.

3.2.6    The role of the public sector: modernisation of public administrations

Modernising public administrations is one of the priorities of the Europe 2020 strategy for growth and jobs. Public Administrations are policy makers, implementers, service providers, regulators but also investors and procurers. Thus their role in improving the competitiveness of the general business environment and creating a climate conducive to investment by the private sector, and growth for the purpose of job creation, is crucial. More specifically, a well-functioning administration facilitates investment by increasing stability, predictability and transparency and by reducing running costs for businesses through the streamlining of procedures and elimination of red tape. It also improves the business entry and exit conditions though the establishment of a simple and stable regulatory framework or through the adoption of transparent and fast insolvency procedures

Therefore, improving efficiency in public administration and the framework conditions for business investment are key priorities. This includes streamlining the regulatory environment in which companies operate, including combating corruption. Regarding national justice system this concerns efforts to improve the quality, the independence and the efficiency of judicial systems. 41 As discussed also in chapter 1 of the report, the 2015 EU Justice scoreboard 42 shows that there are significant divergences in the effectiveness of the judicial systems across Member States, and some of them continue to face challenges relating to the functioning of their justice systems.

While most Member States are implementing or planning to implement ambitious reforms aiming at modernising public administrations and the business environment, much remains to be done. In actual fact, data shows that, on average, government effectiveness has not improved across the EU over the past five years. According to the World Bank Governance Indicators, fifteen Member States' ranking fell in 2014 compared to 2009, while fifteen Member States achieved an index reading below the EU average. (see Figure 3.37)

Figure 3.37:Government effectiveness


Note:The Worldwide Governance Indicators summarise information from 30 data sources on views of citizens, businesspeople and experts in the public, private and NGO sectors. Government effectiveness captures the perceptions of the quality of public service, its independence from the political process, the quality of policy formulation and implementation, and the credibility of the government commitment to policies.

Source:World Bank – Worldwide Governance Indicators

Administrative reform measures undertaken in recent years in Member States cover a variety of areas. For example, in Bulgaria, Croatia, Hungary, Italy, Romania and Slovakia new strategies to modernise national public administrations are either being drafted or have been launched. In Spain, the 2013 law on transparency, public access to information and good governance at central government level entered into force in December 2014.

Administrative simplification is also high on the agenda. France and Germany have recently adopted better regulation work programmes, in Italy a Simplification Agenda has been adopted and in Portugal and some other Member States inventories of the most burdensome regulations are being made in an effort to reduce these burdens. Other key measures to reduce administrative burden include the introduction of the only-once principle and easy-submitting principles pursued by a number of Member States. Poland, Spain and Italy are implementing the common-commencement date principle where new regulations will enter into force only twice a year to increase regulatory predictability. Also, new initiatives to strengthen and promote digitisation of the public sector have also been launched in a number of Member States during the year such as Finland, Bulgaria, Germany and Poland.

Concerning the daily running and opening of businesses, Czech Republic and Denmark have reduced the minimum capital requirement to start a business, Greece lowered registration costs, Lithuania and the UK made tax registration faster while Malta and Spain introduced electronic systems which link government agencies, thereby simplifying procedures. In 2014 it took, on average, 3.5 days at a cost of EUR 313 to set up a private limited company in the EU (the SBA targets are 3 days and EUR 100).

Thus, while Member States are implementing or planning ambitious reforms, national administrations must keep in mind that the challenges to meeting the needs of the business community require enhancing the capacities of public administrations, a commitment to implement agreed policies and adopting a culture of continued improvement.

3.3    Remaining barriers to integration in the Single Market

The situation of the Single Market calls for attention. The stagnation of trading in the single market for goods is due to the fall in single demand in the EU following the crisis. However, there seem to be other underlying factors calling for more detailed analysis to explain why integration has stalled in this area for most countries that were part of the Union before 2004 and why trade flows have dwindled in some of them. Progress has been made in the process of integration in terms of the volume of the cross-border exchanges in services but these exchanges still represent a disproportionately low share of GDP. There is surely more potential for expansion in the cross-border trading in services within the EU.

This section presents results from recent work undertaken or commissioned by DG GROW to identify remaining barriers to integration in the single market with a significant impact of the performance of some sectors or value chains with a critical importance for the competitiveness of the EU. Other barriers are particularly harmful for the dynamic performance of the EU by limiting the growth of young and dynamic export-oriented SMEs.

The barriers presented here have a regulatory or structural nature. There are other barriers of a behavioural nature resulting from the conduct of firms and other economic agents. The most important of these are the barriers erected by firms in an attempt to fragment the single market using territorial restriction practices. The best-known case of these practices affecting e-commerce consumers is the so-called “geo-blocking”.

Geo-blocking has been defined as any practice or measure preventing online consumers from accessing a web-site or purchasing goods, audiovisual contents or services based on location of access and/or nationality. Geo-filtering refers to the practice when different sales terms and conditions are applied according to the residence/nationality of the customer. Part of these practices is legitimate. Addressing unjustified geo-blocking is part of the Commission's Digital Single Market (DSM) Strategy 43 of May 2015. Geo-blocking and other restrictions based on the geographical location of the customer also form the subject of a public consultation. 44 Studies cover this matter at length. 45 Commercial practices which discriminate recipients of goods and services on the basis of nationality or residence may result in fragmentation of the Single Market in forms that may or not be compatible with the Treaty and secondary legislation. 46

In this section, we shall not dwell on commercial practices but only on those regulatory or structural barriers that are identified as particularly important for competitiveness in a number of recent case studies. Further work on these and behavioural barriers will be conducted for future reports.

These obstacles to the cross border trade within the single market are often also generic barriers to entry affecting domestic firms too. In other words, the elimination of these barriers may require well-coordinated actions at EU level to complete the single market in services, but interventions at Member State level are also necessary to remove those obstacles presenting national specificities or particular difficulties. In some cases, these may be the most effective way of eliminating some of those obstacles. This is why it is important to ensure coordination and complementarities in the reform efforts undertaken at EU and national levels as well as in the monitoring and identification of those reforms.

Complementarities between actions at national and EU levels are important in the governance of economic integration. Integration is a complex process that requires not just the elimination of legal and regulatory barriers but actual and effective market integration that can allow an efficient allocation of resources. But in addition, it is also necessary to provide the right governance environment to ensure stability and a smooth market operation.

3.3.1    Regulatory barriers in economically significant sectors for competitiveness

A recent study 47 has identified a number of infrastructure bottlenecks in logistics that add significant costs to the internationalisation of exporting EU firms. These have been grouped in three categories: barriers hampering internal demand and infrastructures; regulatory barriers; and barriers limiting the free movement of skills in the single market.

3.3.1.1    Structural barriers limiting the potential of the Single Market at present: Low demand, vast volume and enabling infrastructures

On average, around three quarters of the EU's manufacturing output is not exported outside the EU and, hence, relies on internal demand. In this regard, three types of value chains can be identified. First, in value chains such as food & beverages and building materials, exports account for less than 20 % of total production value, which means they are highly dependent on EU demand. Second, some value chains export between 20 % and 40 % of their output outside the EU. Examples include the motor vehicles and chemicals value chains. Finally, machinery and pharma are the least dependent on internal EU demand since they export over 40 % of their production (Figure 3.38).

With the sharp drop in EU demand in all value chains since 2008 – except in aerospace, pharma, food & beverages and chemicals – those with limited access to external markets have struggled more. Paper & wood, metals and building materials have been affected the most by falling internal demand since they only export between 10 % and 15 % of their gross output. In short, declining internal consumption, together with more limited access to external markets, has severely affected EU-based companies (Figure 3.38).

Figure 3.38:Proportion of the EU's gross output that is exported and growth of apparent consumption, per value chain

Source:Eurostat, Oxford Economics, UN Comtrade, BCG analysis

Single market demand for innovative products also has a significant impact on the competitiveness of certain value chains. The early adoption of new technologies in the single market allows local companies to enhance their capabilities and situate themselves at the forefront of emerging and innovative market segments.

For example, early local adoption of new types of cars and trucks, such as autonomous vehicles (AVs), could strengthen the EU's global leadership. Manufacturers can develop top-tier capabilities to serve local customers, thereby becoming more competitive to serve export markets as soon as demand ramps up in other regions.

Similarly, in the EU's textile value chain, increasing demand for fast fashion could support the EU's recovery. Fast fashion retailers require a short time-to-market. If demand for fast fashion products is strong in the EU, manufacturing textile products in the EU may become more attractive for companies since they would be able to reduce their lead times to serve their customers. Proximity to demand is becoming increasingly relevant when deciding on the location of production facilities.

Finally, infrastructures are a critical factor in avoiding bottlenecks and spurring demand. There are currently inefficiencies affecting several value chains that may limit expected demand growth. Examples include the EU's electric car charging network, which is not harmonized nor does it have enough charging stations, air traffic management (ATM) capacity, which constrains air traffic and aircraft demand growth, and fuelling stations to guarantee supplies for LNG-powered ships.

3.3.1.2    Large pool of highly qualified talent that can move freely across the EU

The third major single market asset is the provision of highly qualified talent. There are nearly 225 million persons employed in the EU. Despite Europe's ageing population, the number of graduates per year in the highest skill levels – ISCED levels 5 and 6 – is rising considerably. In areas such as mathematics, computing and engineering, the number of new graduates per year has increased by 20–50 % since 2003.

In manufacturing alone, there are 31.5 million workers in the EU, which is more than Japan's and the US' manufacturing workforces combined. In tandem with the overall increasing number of highly skilled graduates, the European manufacturing workforce's average skills level has also increased in recent years.

Two elements need to be in place in order for this talent base to foster a knowledge-driven economy. Talent must have the skills that companies require, and they should be able to move freely across Member States.

Figure 3.39:Import/export balance in European OECD countries in the refining value chain (2013)

Source:Eurostat, European Commission, IEA, BCG analysis

Even though Europe's economy has been recovering from the recession, unemployment has continued to be significantly higher than before the recession. The overall unemployment rate has reached 10 %, an increase of 3 percentage points since 2008. More importantly, the youth unemployment rate is twice as high, with over 22 % of those under the age of 25 remaining unemployed (Fig 3.39). This problem is particularly severe in countries such as Spain or Greece, where more than half of the youth population does not have a job.

According to Eurofound's survey, the EU suffers from a severe skills mismatch. Only 57 % of EU employees hold jobs that match their skills. The remaining employees are either overeducated, which is a key issue in Greece and Lithuania, or undereducated, which mostly takes place in the most advanced countries. For example, approximately 30 % of employees are under-qualified in France, Ireland and Finland. In addition, the limited cross-national data available suggests that occupational mismatch still persists for tertiary graduates, with 25 % of them having jobs that would traditionally be viewed as not requiring a tertiary qualification. 48

Due to this mismatch, 39 % of firms in Europe have difficulties finding talent with the required skills; up from 35 % in 2005. When analyzing countries, the three Baltic States fall behind when compared to the rest of the EU. Moreover, manufacturing companies face more difficulties than the general economy's average. In European industry, 43 % of firms have skills matching issues, while the figure is only 30 % for companies from the financial services sector. Multiple factors explain these difficulties, including less attractive working conditions, such as geographical location, or poor recruiting policies.

3.3.2    Barriers affecting SMEs and the special case of exporting start-ups

Given their flexibility, number and weight in the economy, SMEs play a very important role in the EU. However, the relatively small size of many SMEs means many of them cannot venture beyond their regional or national market. Fixed costs of entry in export markets, difficulties to access capital and market failures specific to the activities of SMEs discourage many SMEs to internationalise.

The percentage of SMEs selling their goods and/or services to at least another Member State or to a third country reflects these difficulties. According to Eurostat figures, only 17 % of firms buy from another Member State and 9 % beyond EU borders. The share of SMEs selling in the single market is limited to 14 % while 10 % export to third countries. These percentages vary considerably across Member States, ranging from 39 % of SME intra-EU exporters in Estonia to 4.6 % in Malta. (see table 3.3)

Table 3.3:Internationalisation of SMEs in and beyond the Single Market


Source:Eurostat

The share of EU SMEs selling to another EU country did not increase between 2008 and 2012, while the share of exporters to the rest of the world went up to 10.2 % in 2012 from 9.09 % in 2008. The volumes of exports of SMEs have remained relatively stable since the 2010 recovery (see Figure 3.40). However, the evolution of EU-15 is different from the EU-13 minus Croatia. The latter display a steady growth while for the EU-15 SMEs exports have remained stagnant in recent years.

Figure 3.40:Exports of goods by SMEs to the EU-28 (million Euros)


Source:to be added

The EU has a clearly defined policy in support of SMEs to help them overcome the obstacles to trade, especially in the single market. Traditional theory about international business suggests that companies first establish a solid home market and go global only in later stages of their life cycle.

However, this view is challenged by research that shows that some firms internationalise quickly after start-up – so-called ‘born globals’. “Born global” (BG) start-ups are enterprises 49 that, soon after inception, intensively engage in international activities. They can be found in all sectors of the economy, but their product/service portfolio is characterised by a high level of innovation, technology and/or exclusive design. They fill important gaps in global value chains. Data from the Global Entrepreneurship Monitor (2011) show that they constitute about 2.5 % of all SMEs and 12 % of young enterprises. Similar results can also be shown from national data for Austria, Estonia and Sweden.

Born global start-ups are particularly important for the dynamic development of the EU economy.

Available data highlight that BG start-ups are more innovative than other SMEs. 50 More competitive firms that bring new products and services to market are also likely to outlast and outgrow their competitors. 45 % of European BG start-ups indicate to have none or only few competitors, compared to about one-third of SMEs. 37 % of born globals consider their products/services new for their customers while 26 % of SMEs do so. Finally, about 30 % of both BG and other start-ups assess that the technology required for their products has been available for a maximum of five years, while only 20 % of SMEs are confronted with such short life cycles. (See Figure 3.41) 51

Figure 3.41:Innovativeness by type of company, selected Member States (2011)


Source:GEM 2011 APS

BG start-ups are also comparatively dynamic job creators and likely to create high-quality and sustainable jobs and might also have some labour market integration effects, particularly for youth. GEM data from 2011 show that on average in European countries, these firms employ 9.6 staff, compared to 5.6 in other start-ups (up to 3.5 years) and 6.7 in SMEs in general. As shown by the examples of Estonia and Austria in graph 3.42 BG start-ups also show a greater employment potential than other start-ups or SMEs in general.

Figure 3.42:Employment change by company type, Austria and Estonia


Source:Survey of the Austrian Institute for SME Research on behalf of the Austrian Federal Economic Chamber, 2013; Statistics from Estonian foreign trade data combined with business registry data

The dynamism of the EU economy could be significantly improved if the single market provided a more favorable environment for the creation, expansion and growth of BG start-ups. A number of case studies at EU and EU level provide evidence of problems currently faced by this type of exporting start-ups. Born globals face some specific challenges that hamper their potential. Some of these problems are also common to SMEs in general, but they often present special for BG start-ups difficulties given the nascent nature or high export intensity of these firms. These problems affect not just to their exporting activities but also to their sourcing of key human and capital inputs.

Access to finance: the fragmentation of the single market for capitals is an additional handicap for the creation of BG start-ups. These companies often require specific financing products that take into account the provision of risk or other forms of venture capital with the risks associated to the exporting activities. These products are not equally available across the single market. Even in Member States with a diversified availability of financial products, these companies report special difficulties. For instance, 28 % of Swedish BG start-ups report limited access to loans as an obstacle for business development/growth, compared to 16 % of other start-ups and 13 % of companies in general. 52

Business environment: The fragmentation of the single market in national markets with different national regulations requires additional efforts for BG start-ups to market their products or services in different EU markets as well as beyond EU borders. These differences in legislations and regulations act as entry barriers limiting the extension of the activities of these firms. For example, among Swedish BG start-ups, laws and government regulations are mentioned as a large obstacle to business development and growth by almost 40 % of the entrepreneurs, compared to about 20 % for SMEs in general. This could refer to the number of legal pieces a company has to familiarise itself with and adhere to, their complexity and continuous changes which make it time consuming for a born global to stay updated. Furthermore, long procedures, e.g. for authorisations, might hamper the company development (see Figure 3.43).

Figure 3.43:Labour law related growth obstacles by company type, Sweden (2014)


Source:Survey of the Swedish Agency for Economic and Regional Growth, 2014

Migration legislation: Due to their international orientation and experienced lack of skills in the home market, BG start-ups often need to be open to hire foreign workers. As regards non-European candidates, several of the interviewed entrepreneurs mentioned unfavourable migration legislation as a barrier for job creation. Lengthy and difficult-to-understand application processes make it difficult for them to recruit international talents from outside the EU.

Labour law: The rigidity or lack of flexibility of labour legislation and the complexity and frequent changes make it difficult for SMEs to handle them in practice. The Austrian Working Time Act has been mentioned as a barrier for employees who are working abroad on a regular basis and may wish to work longer hours abroad to benefit of compensatory time-off when they return. Between one-tenth and one-third of Swedish SMEs report various elements of labour legislation to be an important obstacle for their business development and growth. 53 However, a lower share of start-ups that have been identified to be more dynamic in job creation than SMEs on average – encounter these problems. This includes both exporting and non-exporting start-ups.

3.3.3    Remaining barriers to the free circulation of construction products: Barriers created by national or quality marks

The construction sectors show relatively low levels of integration. Intra-EU exchanges in construction services represent a low percentage of total exchanges, well below the share of construction activities on GDP. The same applies to the cross-border presence of Foreign Affiliates in other Member States. The European Parliament (2014) study 54 includes a case study on the situation in construction materials. It reports on different barriers affecting in particular SME operators in this sector. A change from directives to regulations is estimated to have a non-negligible impact on the sector.

To improve the situation in the construction materials sector, the Construction Products Regulation (EU) No 305/2011 (CPR) entered into full force on the 1 July 2013, replacing the Construction Products Directive 89/106/EEC (CPD). A recent study has shown considerable improvements as a result of the Regulation. For instance, evidence indicates that clarifying the obligations of economic operators has been effective in terms of increasing legal certainty and transparency regarding the rules. In turn, the improved understanding of companies has facilitated their ability to comply with the CPR and made enforcement of the legislation easier for Market Surveillance Authorities (MSAs). The legal certainty provided by these provisions has also increased the respect of legal obligations by economic operators.

The main objective of the CPR – compared with the CPD – was to facilitate the consolidation of the Single market for construction products through, inter alia, simplification, clarification and increasing the credibility of the legislative framework for construction products. Under the CPR, the CE marking shall be the only mark to attest conformity of construction products with characteristics covered by harmonised standards. Furthermore, CE marked construction product must be allowed free movement onto the market of all EU Member States (Article 8(3) and 8(4) CPR).

Quality marks are permitted under the CPR, so long as they do not cover essential characteristics and fulfil a different function to the CE marking affixed under the CPR. Member States are not permitted to stipulate that a construction product must attain additional national marks or approvals, over and above those required by the CPR, before it can be legally marketed within their territory.

Prior to the CPR, it was evident that trade in construction products across Member States had been impeded in various countries, some of which had been referred to the ECJ. For instance, in 2008, the ECJ found that the practice of Belgian authorities encouraging economic operators to obtain Belgian marks of conformity prior to the marketing of construction products that had been manufactured/marketed in accordance with the CPD in another Member States, infringed the free movement of goods principle (Article 34, Treaty on the Functioning of the European Union).

More recently, a case was brought against Germany where the ECJ ruled in favour of the Commission with regard to the application of the German Ü mark administered by the German Institute for Construction Technology (DIBt).

A study recently conducted for the Commission concerning the implementation of the CPR (final report dated 15 September 2015, conducted by RPA) concludes that mandatory CE marking of construction products under the CPR has not enhanced the free movement of construction products, partially because national and quality marks are still in use in many Member States (mainly in DE, FR, NL and UK, but also in AT, BE, DK, PL, ES and SE). According to the study, stakeholders report the existence of marks linked with national standards, de facto mandatory marks (for example, cases where quality marks are requirements imposed under public procurement rules or by insurers) and of market-driven quality marks (which are recognised and highly rated by customers and consumers) which restrict market access to construction products. Where these practices exist, it is SMEs who are hit hardest, as larger companies can rely on their good reputation and resources to obtain additional marks.

Based on the study findings and on the ECJ judgements, it is recommendable that Member States analyse the situation in their territories to address the market access issues which could be created by national or quality marks.


4.1    Single Market for Financial Services before the crisis: Financial convergence and increased cross-border capital flows during EMU 

The creation of EMU and the successive enlargement of the euro area has given rise to rapid financial convergence since the late 1990s. Financial integration is a key element of the single market and has brought significant benefits to EU Member States. However, as pointed out elsewhere in this report, economic convergence has not progressed steadily over time and has been accompanied by significant imbalances. 55

Figure 4.1:Yields on 10-year government bonds (%)


Source:Bloomberg

In the run-up to the introduction of the euro, a remarkable convergence of interest rates towards the lowest level took place. The expectation was that ever-closer trade relations and increased coordination of economic policies would reduce remaining differences across Member States. 56 But whereas certain Member States based their growth model on competitiveness and growing export market shares, others opted for a model based on credit-driven domestic demand. As a result, the latter group of countries persistently lost competitiveness and experienced higher than average inflation rates, higher unit costs of labour, and higher deficits on their current account in that period. Economic fundamentals, country-specific risks, and national policies diverged increasingly and were not offset by correction mechanisms at the supranational level. Moreover, an inadequate perception and evaluation of risks by market participants, in some cases encouraged by statements from international organizations or prominent academics, also contributed to a lack of correction of growing macroeconomic imbalances that built up during the first decade of EMU.

As a result, sovereign debt interest rates of euro area countries converged remarkably in the run-up to EMU and continued to move in lockstep throughout EMU (until the September 2008 global financial crisis and more in particular the May 2010 euro area sovereign debt crisis) (Figure 4.1). At the same time, the introduction of the euro reinforced the global growth in cross-border capital flows, thanks to the elimination of exchange rate risk (Lane and Miles-Ferretti (2008)). The surge in cross-border capital flows occurred mainly through portfolio debt flows (bank-based debt driven capital flows).

4.2    Significant divergences in economic fundamentals during EMU giving rise to imbalances and capital misallocation

Since its creation and up to the global financial crisis of 2007/8 and the euro area sovereign debt crisis in 2011/12, EMU has been characterized by its unique institutional framework with a single monetary policy but primarily national fiscal, economic, and financial policies (including supervision of financial institutions, financial crisis management, and deposit insurance). In this setting, low labour and/or capital mobility and limited fiscal transfers across countries make Member States potentially vulnerable to asymmetric external shocks or persistent differences in current accounts, wages costs or inflation.

Figures 4.2 and 4.3 exhibit the divergences in Member States’ economic fundamentals, such as inflation rates and unit labour costs. As a result of the diverging economic fundamentals, significant imbalances in the current and capital account had been built up over the pre-crisis period (Figure 4.4).

Figure 4.2:Cumulative inflation since 2000


Source:ECB and own calculations.

Figure 4.3:Unit labour cost, 2000=100


Source:ECB and own calculations. ()

Figure 4.4:Current account balance (% GDP)


Source:Bloomberg

In some Member States growing current account deficits were financed by increasing and mostly short-term capital inflows, predominantly in the form of cross-border debt via the banking system. Moreover, longer-term capital flows were often financing activities such as real estate development that have strong immediate effects on economic activity but with limited impact on long-term growth; dynamic real estate investment also contributed and in some cases was driving growing credit bubbles in some countries. However, growth dynamics dominated by credit financed consumption spending and real estate investment successfully attracted savings from other parts of the monetary union as well as from the rest of the world, deepening the mis-allocation of resources towards the least productive uses.

When the international financial crisis broke in 2007-2008, market perceptions were reviewed, including financial and country risks. Short-term capital movements to countries with severe macroeconomic imbalances stopped and reversed, starting a severe and disruptive process of adjustment that would widen up further the gap in financing conditions among Member States. The apparently high level of integration in the Eurozone financial markets vanished and monetary policy transmission mechanisms stopped functioning adding to the difficulties of the recovery.

4.3    Single Market for Financial Services in the wake of the financial crisis

4.3.1    Dispersion and fragmentation in credit conditions

Interventions to rescue the banks pushed public deficits up significantly in 2009. The fiscal situation of some Member States became unsustainable and investors were no longer willing to finance the deficits and refinance the debt roll-overs. The problem was worsened by the lack of sovereign debt restructuring mechanisms, suggesting that a sovereign default would be disorderly. In addition, a sovereign default would give rise to major difficulties for domestic and foreign banks, and hence indirectly other Member States. Banks have a home bias towards holding sovereign debt of the home country but often hold sizeable portfolios of other countries bonds as well. Banks also are often exposed to each other.

Figure 4.5:Interest rates on mortgages (%)


Note:Data for new loans

Source:European Central Bank

Figure 4.6:Interest rates on loans to SMEs (%)


Note:Data for new loans

Source:European Central Bank

The fate of banks and Member States in the euro area turned out to be highly interconnected giving rise to a vicious circle between states and banks: Insolvent states threaten to take down their banks because banks hold large amounts of sovereign debt on their balance sheets (in particular of the home country) and because their stability depends on the public trust in the robustness of the public safety nets. Insolvent banks threaten to take down their sovereigns because of the disproportionate amount of required government interventions (capital injections and debt guarantees).

In sum, the global financial and euro area sovereign debt crisis has shown that financial integration also carries financial stability risks. An integrated and properly regulated financial system with a stable and predictable governance system can contribute very effectively to the adjustment process when asymmetric shocks hit by ensuring liquidity and more stable lending conditions in the economies in difficulty. Deprived of the right regulatory and governance conditions, financial integration turns fragile and renders financial markets less effective to contribute to the recovery.

Financial integration, if not properly regulated, may unravel and give rise to renewed fragmentation. Triggered by the crisis, cross-border bank exposures declined after 2008 and cross-border credit flows reversed again, in particular in interbank market. Banks focussed increasingly on “core” and home markets and meeting domestic lending commitments. Financing costs became increasingly dispersed across countries. The divergence of sovereign yields in a context of strong connection between banks and sovereigns resulted in financial fragmentation and segmentation of risks along national borders. Banks located in countries with difficulties found increasing difficulty in refinancing on the market, due to the perceived poorer quality of the collateral they were holding. Cross border activity dropped across the board. The segmentation of bank funding costs was passed on to retail borrowers and non-financial firms (Figure 4.5).

4.3.2    Importance of Banking Union to break the bank-state nexus

A number of extraordinary interventions and European financial assistance mechanisms provided an impressive safety net 57 for Member States, but these crisis mechanisms did not deal with the bank-sovereign nexus, the fragmentation of the EU banking sector, the heterogeneity in bank supervision, and the distortions arising from banks being European (global) in life, but national in death. Insolvent states threaten to take down their banks because banks hold large amounts of sovereign debt on their balance sheets 58 (in particular of the home country) and because their stability depends on the public trust in the robustness of the public safety nets.

Banking Union was announced on 29 June 2012, following a historical meeting of euro area heads of state. Banking Union refers to the framework in which banking sector policy decisions are taken and executed at the level of participating countries (euro zone and member states outside the euro zone that wish to participate), in particular regulation, supervision, and resolution. 59  

Banking Union is mainly defined by two of these policies, known as the Single Supervisory Mechanism (SSM) and the Single Resolution Mechanism (SRM). The SSM transfers the power to grant or withdraw banking licenses and related supervisory duties from national authorities to the ECB, effective since 4 November 2014 (after a rigorous Asset Quality Review and stress-test).

The objectives of Banking Union are to break the nexus between banks and states described above, to ensure that a common high-quality supervision is applied consistently to all banks, to ensure a stable cross-border EU banking system through supranational resolution, and to build the necessary trust between member states as a necessary condition to introduce common public financial safety nets (such as the European Stability Mechanism or ESM).

Figure 4.7:Sovereign spreads for selected countries over 10-year German bund, 1 January 2007 to 1 January 2015


Source:Bloomberg.

The political announcement of Banking Union was the game changer the ECB needed to, in turn, launch its unprecedented Outright Monetary Transactions (OMT) programme. 60 The OMT programme signalled the ECB’s readiness to buy sovereign bonds of distressed member states, under certain conditions, in order to ensure the effectiveness of monetary policy throughout the euro area. So, the major reversal in sovereign spreads on Italian and Spanish debt vis-à-vis German Bund, visible in Figure 4.7 in July 2012, can be attributed to the introduction of Banking Union and related flanking measures.

4.3.3    Importance of CMU for the financing of the EU real economy

The Capital Markets Union (CMU) is a complement to the regulatory financial reform agenda enacted after the financial crisis and to the Banking Union. While the latter provide stability and resilience to financial markets by creating a safer regulatory environment, CMU will make a critical contribution to the financing of the real economy of the EU. 61

The CMU is aimed at rebalancing the sources of financing in Europe by making capital markets stronger, which will complement Europe's strong tradition of bank financing. It will offer to both borrowers and investors a broader set of financial instruments to meet their needs, and better connect financing to companies and investment projects across the EU. The CMU wants to help complete the single market for financial services, which will foster competition and make capital markets deeper, more liquid and more efficient. This will bring three main advantages to companies seeking finance (Figure 4.8): (i) improve their access to finance, (ii) optimize their capital costs by creating competition among investors, and (iii) reduce the risk of disruption in financing by diversifying their funding sources. On the investors' side, the benefits come from more investment opportunities. Efficient capital markets offer investors a broader set of financial products to (i) meet their investment objectives, (ii) diversify and manage their risks, and (iii) optimize their risk-return profile, while respecting their investment constraints – whether in terms of risk, duration, or other assets' characteristics. This results in a greater mobilisation of resources and an optimized allocation of investors' capital.

Non-bank financing does not merely substitute for investment that was previously funded by banks, but it enables additional investment that banks would not be ready to fund. In fact, non-bank financing tends to be better suited to fund riskier investment projects (with a higher required rate of return), and is also generally more flexible than bank finance. Overall, capital markets (especially equity investment) facilitate entrepreneurial and other risk-taking activities, which have a positive effect on economic growth. Capital markets enlarge the potential investor base, because they act in complement to bank financing.

Figure 4.8:A stylised view of the economic benefits of integrated and well-functioning capital markets


Source:European Commission (Directorate General Financial Stability, Financial Services and Capital Markets Union)

The CMU goes beyond previous initiatives to foster the single market for financial services and deepen financial integration. The CMU shares some economic objectives with its predecessor, the Financial Services Action Plan (FSAP), which led to the adoption of 42 regulatory measures, including 24 legislative measures between 1999 and 2004. 62 The FSAP also aimed at reducing obstacles for cross-border financial investment, thereby unleashing efficiency gains through higher competition and realisation of scale effects and allowing better diversification of risks on integrated financial markets. The CMU focuses on remaining obstacles to cross-border investment and the role of non-banks in the EU financial system.

4.4    Business financing remains a concern, although of a less pressing nature

Access to finance remains a concern for European businesses, even if it is becoming a less pressing one. 63 Financial flows to SMEs are increasing but remain subdued. On the monetary side, Quantitative Easing (QE) by the European Central Bank (ECB) is having a stronger than expected impact on financial markets, contributing to lower interest rates and expectations of improving credit conditions.

SMEs continue to be disadvantaged compared with large firms in terms of interest rates and the overall cost of borrowing. Also, more innovative enterprises experience more problems than less innovative enterprises. 64

Financing conditions for SMEs continue to differ significantly across Member States. SMEs consider financing as the most pressing problem in Cyprus, Greece and Slovenia; and as the least pressing in Sweden, the Czech Republic and Denmark. Comparing across different types of enterprises, SMEs in the construction sector consider the problem of access to finance the most pressing.

4.4.1    Bank financing is improving overall, but difficulties subsist for several SMEs

There has been an overall improvement in bank financing conditions. On average, SMEs perceive bank loans to be available. Bank lending rates have been trending downwards since the third quarter of last year. The average loan duration remains stable and loan amounts are increasing overall.

Yet, there is a slight increase in the rejection of bank loans applications by SMEs. The highest rejection of loan application is reported by SMEs in the Netherlands (39 %), Lithuania (36 %), Greece (27 %), Latvia (30 %) and Slovenia (24 %). However, the relevance of bank loans as a source of financing may differ between member states, as well as the size of SME sector. The difficulties of accessing bank loans are particularly affecting smaller and younger companies. The highest rejection rate (20 %) is among micro enterprises employing fewer than 10 people. In addition to the problem of loan applications being rejected, 18 % of successfully applying companies received less than they applied for and 4 % declined the loan offer from the bank because they found its cost unacceptable. This means that more than a third of SMEs didn’t get all the financing they asked their banks for in 2014. 65  

SMEs also report a substantial net increase in collateral and other requirements for bank loans. Collateral requirements are considered as tightened by SMEs in all EU countries, with the highest average increase in Cyprus, Greece and Slovenia.

Figure 4.9:SMEs not receiving most of the amount of bank loan requested (as % of total SMEs requesting bank loans)


Source:European Commission - European Central Bank SAFE survey (2014)

Financial market fragmentation along national lines has diminished, but remains too high. This fragmentation hinders the development of deep and liquid markets, impeding the flow of finance within the EU and with the rest of the world. Bank lending rates have gradually showed less dispersion across Member States, yet significant spreads remains. Indeed, interest rates above 7 % are reported in Portugal and Greece, while SMEs in Austria, Belgium and Luxemburg report rates below 4 %. In dynamic terms, the highest net percentage of SMEs reporting an increase in interest rates were in Italy, Cyprus and Slovenia, while a net decrease was reported in Sweden, Belgium, Germany and France.

4.4.2    Policy response at national level

Loan guarantee systems have been the preferred policy measure to ease bank lending. Their scope and financial allocation have been broadened during the credit constraint. Furthermore, their efficiency has been enhanced by improving and speeding up administrative procedures. Yet, as bank financing conditions improve, it is expected that their role in supporting the financing of businesses will decrease.

In parallel, measures have been taken to facilitate the access and transfer of financial information (such as in the United Kingdom and Spain). Also, the establishment of development finance institutions in several Member States has continued. The institution being set up in Portugal received its financial company license in September 2014, while a single development bank has been established in Latvia this year. Malta is currently considering the possibility of creating a development bank.

Other policy measures to ease SME access to finance recently adopted by Member States include enhancing public venture capital funds (e.g. Finland, Malta, Spain) and establishing a regulatory framework for peer-to-peer lending (e.g. Finland, Netherlands, Spain).

4.5    Conclusions

The crisis has shown three things. First, there is a direct relationship between the financial markets and those for goods and services. Secondly, there are risks from incomplete integration and that governance structures must be adapted to market changes and the stage of integration achieved. Finally, failures in the process of integration in one area of the EU economy can have dear consequences for the rest, because a large economy needs to ensure high levels of efficiency in the allocation of resources to be competitive but also to remain stable and resilient to shocks.

Economic studies indicate clearly that the "…members of a union can share risk via cross-ownership of productive assets, facilitated by a developed market, and may smooth consumption by adjusting the composition and size of their asset portfolio." 66

To reap the full benefits of financial integration on a sustainable basis, the governance and institutional framework must evolve together with increased integration. Before the crisis, there were no supranational tools to monitor cross-border risks or to control the build-up of imbalances, and there were no tools to engage in coordinated crisis management and resolution. 67

Cross-border openness of private financial markets and highly mobile capital flows cannot be paired with incomplete national-based supervisory, regulatory and crisis management arrangements. This dichotomy is detrimental in two ways; it prevents, in normal conditions, a reaping of the full benefits of the removal of barriers to cross-border movements of capital and financial services; and it impedes, in crisis times, even-handed action to maintain financial stability that is consistent across the euro area. The resulting fragilities become more apparent under stress.

Financial integration, properly regulated, will remain a powerful tool to attain higher standards of freedom, equity and welfare for society as a whole. New investment and diversification opportunities should become available for households as well as firms. Financial integration should do away with impediments inherent in the current structure of the EU financial system that prevent further allocative efficiency and optimal risk sharing. In addition, more sound governance, supervisory and regulatory framework will transform integrated financial markets into useful instruments to provide stability and resilience to the real economy against asymmetric shocks. Breaking up the bond between public finances and the banking system will provide a more stable and reliable source of financing to the real economy.

The 5 Presidents Report of June 2015 68 outlines the ways through which closer coordination of economic policies can be achieved to ensure the smooth functioning of the Economic and Monetary Union. Progress must happen on four fronts: first, towards a genuine Economic Union that ensures each economy has the structural features to prosper within the Monetary Union. Second, towards a Financial Union that guarantees the integrity of our currency across the Monetary Union and increases risk-sharing with the private sector. This means completing the Banking Union and accelerating the Capital Markets Union. Third, towards a Fiscal Union that delivers both fiscal sustainability and fiscal stabilisation. And finally, towards a Political Union that provides the foundation for all of the above through genuine democratic accountability, legitimacy and institutional strengthening.

Several advances have been made and continue to be made. On 30 September 2015, the Commission presented its Action Plan towards Capital Markets Union (CMU), 69 along with several initiatives. 70 It sets out the steps that the Commission will take over the next years in order to establish a CMU by 2019. The CMU Action Plan foresees thirty three actions in six main areas: (i) Financing for innovation, start-ups and non-listed companies; (ii) Making it easier for companies to enter and raise capital on public markets; (iii) Investing for long-term, infrastructure and sustainable investment; (iv) Fostering retail and institutional investment; (v); Leveraging banking capacity to support the wider economy; (vi) Facilitating cross-border investment. The CMU will ensure more diversified sources of finance so that companies, including SMEs, can tap capital markets and access other sources of non-bank finance in addition to bank credit. At the same time, a well-functioning CMU will strengthen cross-border risk-sharing through deepening integration of bond and equity markets, the latter of which is a key shock absorber. Truly integrated capital markets will also provide a buffer against systemic shocks in the financial sector and strengthen private sector risk-sharing across countries.

Abiad, A., Leigh, D., Mody A., (2007), International Finance and Income Convergence: Europe is different, IMF Working Paper WP/07/64.

Allen, F., (1993), Stock markets and resource allocation, in: Colin Mayer and Xavier Vives (eds.) Capital Markets and Financial Intermediation, Cambridge University Press, pp. 81-108.

Allen, F. and Gale, D., (1999), Corporate Governance and Competition, Center for Financial Institutions Working Papers 99-28, Wharton School Center for Financial Institutions, University of Pennsylvania.

Amoroso, S., Moncada-Paterno-Castello, P. (2015), Profits, R&D and the demand for labour, JRC-IPTS Working Papers on Corporate R&D and Innovation (forthcoming).

Asdrubali, P., Sorensen B.E., Yosha, O. (1996), Channels of Interstate risk sharing: United States 1963-90, Quarterly Journal of Economics 111, 1081-1110.

Barkbu, B., Pelin Berkmen, S., Lukyantsau, P., Saksonovs, S., Schoelermann, H. (2015), Investment in the euro area, why it has been so weak?, IMF working paper WP/15/32, International Monetary Fund.

Bauer, M., Lee-Makiyama, H., van der Marel, E., Verschelde, B., (2014), The costs of data localisation: friendly fire on economic recovery, ECIPE OCCASIONAL PAPER No. 3/2014, European Centre for International Political Economy.

Bekaert, G., Campbell, H.R., Lundblad, C. (2005), Does financial liberalisation spur growth?, Journal of Financial Economics, 77, 1, 3-55.

Black, B. S. and Gilson, R. J. (1998), Venture capital and the structure of capital markets: Banks versus stock markets, Journal of Financial Economics, 47, 3, pp. 243-277.

Blanchard, O. (2004), The Economic Future of Europe, Journal of Economic Perspectives, 18(4): 3-26.

Bloomfield, M.J., Brüggemann, U., Christensen, H.B., Leuz, C. (2015), The Effect of Regulatory Harmonization on Cross-Border Labor Migration: Evidence from the Accounting Profession, Chicago Booth Research Paper No. 15-03, January 2015, http://ssrn.com/abstract=2551569 or http://dx.doi.org/10.2139/ssrn.2551569

Brännback, M., Carsrud, A.L., Kiviluoto, N. (2014), Understanding the Myth of High Growth Firms, Springer, New York.

Brynjolfsson, E. and McAfee, A. (2014), The second machine age: Work, progress, and prosperity in a time of brilliant technologies, W. W. Norton & Company.

Boston Consulting Group (2015), An Inventory of Europe's Industrial Assets for Growth: Identification of key assets in manufacturing value chains, Study carried out for the European Commission, DG GROW.

Cecchini, P., Catinat, M. and Jacquemin, A. (1988), The European Challenge – 1992, the benefits of a single market, Wildwood House Ltd.

Centre for European Policy Studies (CEPS) and Economisti Associati (2013), Assessment of cumulative cost impact for the steel and aluminium industry, Study for the European Commission, DG GROW

CEPR (2002), Financial market integration, corporate financing and economic growth, European Economy, Economic Papers No. 179, European Commission.

Citi (2015), Global Economics View – poor productivity, poor data, and plenty of polarisation, Citi Research, August 2015.

Cordes, A., Gehrke, B., Römisch, R., Rammer, C., Schliessler, P., Wassman, P. (2015), Identifying revealed comparative advantages in an EU regional context.

Coviello, D., Mariniello, M. (2014) Publicity requirements in public procurement: Evidence from a regression discontinuity design, , 2014, vol. 109, issue C, pages 76-100.

Dabla-Norris, E., Guo, S., Haksar, V., Kim, M., Kochhar, K., Wiseman, K., Zdzienicka, A. (2015), The New Normal: A Sector-level Perspective on Productivity Trends in Advanced Economies, IMF Staff Discussion Notes No. 15/3, March.

Demirgüç-Kunt, A., Feyen, E., Levine, R. (2013), The evolving importance of banks and securities markets, The World Bank Economic Review, 27, 3, pp. 476-490.

EAG (1996), The development of foreign direct investment flows in the EU due to the internal market programme, European Commission.

EBRD (2014), Innovation in transition, Transition report 2014, November 2014.

ECB (2012), The benefits of the EU’s single financial market revisited in the light of the financial crisis, Special feature on Financial integration in Europe, April 2012.

ECB (2015), Survey on the access to finance of enterprises (SAFE), October 2014 to March 2015, June 2015.

ECORYS et al. (2015), An empirical assessment of the contribution of clusters to smart specialisation, report for the European Commission, DG GROW.

Ernst & Young in cooperation with Danish Technological Institute (2014), Study on E-Government and the Reduction of Administrative Burden, Study prepared for the European Commission.

ESRB (2014), Is Europe Overbanked?, Reports of the Advisory Scientific Committee, No. 4, June.

ESRB (2015), ESRB report on the regulatory treatment of sovereign exposures.

Eurofound (2015), Upgrading or polarisation? Long-term and global shifts in the employment structure: European Jobs Monitor 2015, Publications Office of the European Union, Luxembourg.

Europe INNOVA (2012), Guide to resource efficiency in manufacturing: experiences from improving resource efficiency in manufacturing companies, Greenovate! Europe E.E.I.G., May 2012.

European Central Bank (2015), Financial integration in Europe, April 2015

European Commission (1997), Economic evaluation of the internal market, European Economy No. 63.

European Commission (2008), Staff Working Document, The concept of clusters and cluster policies and their role for competitiveness and innovation: Main statistical results and lessons learned, SEC (2008) 2637.

European Commission (2009), Communication on "Preparing for our future: Developing a common strategy for key enabling technologies in the EU, (COM(2009) 512 final.

European Commission (2013), Product Market Review 2013, Publications Office of the European Union, Luxembourg.

European Commission (2014), Economic review of the financial regulation agenda, SWD(2014) 158 final.

European Commission (2014), Infrastructure in the EU: Developments and Impact on Growth, Occasional paper 203.

European Commission (2014), European Cluster Panorama 2014, European Cluster Observatory

European Commission (2014), Public Procurement as a Driver of Innovation in SMEs and Public Services (guidebook).

European Commission (2014), Survey on the Access to Finance of Enterprises in the euro area, November 2014.

European Commission (2014), The economic impact of professional services liberalisation, DG ECFIN, Economic Paper 533/2014.

European Commission (2015), A digital Single Market Strategy for Europe – Analysis and Evidence, Staff Working Document, SWD(2015) 100 final.

European Commission (2015), A Single Market Strategy for Europe – Analysis and Evidence, SWD(2015) 202 final.

European Commission (2015), EU Structural Change 2015, DG GROW, Office for Official Publications of the European Communities, Luxembourg.

European Commission (2015), First annual report, Key Enabling Technologies (KETs) Observatory, May 2015.

European Commission (2015), Study on the compliance by Member States on the time needed to get licences and permits to take up and perform the specific activity of an enterprise, June 2015.

European Commission (2015), Innovation Union Scoreboard 2015, DG GROW, http://ec.europa.eu/growth/industry/innovation/facts-figures/scoreboards/index_en.htm .

European Commission (2015), Innobarometer survey on innovation trends at EU enterprises, Flash Eurobarometer 415.

European Commission (2015), Eurobarometer survey on European businesses and public administration, Flash Eurobarometer 417.

European Commission (2015), Regulatory Fitness Check for the Petroleum Refining Sector, Staff Working Document

European Commission (2015), Energy Union Package: A Framework Strategy for a Resilient Energy Union with a Forward-Looking Climate Change Policy, COM(2015) 80 of 25 February 2015, http://ec.europa.eu/priorities/energy-union/docs/energyunion_en.pdf

European Commission (2015), Energy Economic Developments: Investment perspectives in electricity markets, Institutional paper 003/July 2015, DG ECFIN

European Commission (2015), Country Report Slovenia 2015, Staff Working Document, SWD(2015) 43 final/2

European Parliamentary Research Service (EPRS) (2014), The Cost of Non-Europe in the Single Market - 'Cecchini Revisited': An overview of the potential economic gains from further completion of the European Single Market, by Zsolt Pataki, CoNE 1/2014

European Public Administration Network (EUPAN) (2015), EU Quality of Public Administration Toolbox.

European Union (2015), Quarterly Report on the Euro Area, 14(2), Publications Office of the European Union, Luxembourg.

Federal Ministry of Science, Research and Economy, Austria (2015), Investing in Europe's Future. Restarting the Growth Engine, Vienna, June 2015

Fernald, J. (2014), Productivity and potential output before, during and after the great recession, NBER, Working Paper no. 20248, 2014).

Frey, C.B., Osborne, M.A. (2013), The future of employment: how susceptible are Jobs to computerisation?, OMS Working Paper, 2013.

Garcia-Santana, M., Moral-Benito, E., Pijoan-Mas, J., Ramos, R. (2015), Growing like Spain: 1995-2007, ECARES, mimeo 21 July.

HM Treasury and Cabinet Office (2015), Review of economic statistics: call for evidence, August 2015

I-COM (2014), Conflitto tra poteri, rischio regolatorio e impatto sugli investimenti esteri, Istituto per la Competitività, Policy Paper 01/14.

IDC-EY (2013), Digital Entrepreneurship Monitor.

Kukenova, M. (2011), Financial liberalisation and allocative efficiency of capital, World Bank Research Working Paper, No. 5650.

Lane, P. and Milesi-Ferretti, G.M. (2008), The drivers of financial globalisation, The Institute for International Integration Studies Discussion Paper Series, No. 238.

Linklaters (2014), Set to revive: Investing in Europe’s infrastructure

http://www.linklaters.com/pdfs/mkt/london/6380_LIN_Infrastructure%20Report%20FINAL_WEB.PDF

London Economics (2012) Quantification of the macro-economic impact of integration of EU financial markets – Final report to the European Commission, Directorate General for the Internal Market and Financial Services.

Maican, F. and Orth, M. (2012), A Dynamic Analysis of Entry Regulations and Productivity in Retail Trade, IFN Working Paper No. 939, 2012

Marinello, M., Sapir, A., Terzio, A. (2015), The long road towards the European single market, Bruegel W. P. 2015/01.

McGowan, M.A., Andrews, D., Criscuolo, C., Nicoletti, G. (2015), The future of productivity, OECD report, July 2015.

Meng, C. and Pfau, W. D. (2010), The Role of Pension Funds in Capital Market Development, https://ideas.repec.org/p/ngi/dpaper/10-17.html

Miller, B. and Atkinson, R. (2014), Raising European Productivity Growth through ICT, Information Technology and Innovation Foundation Report, Washington, June.

Monteagudo, J., Rutkowski, A., Lorenzani, D. (2012) The economic impact of the Services Directive: A first assessment following implementation, European Commission, European Economy Economic Papers, No. 456, June 2012, http://ec.europa.eu/economy_finance/publications/economic_paper/2012/ecp456_en.htm .

NIW, wiiw, ZEW (2015), Identifying revealed comparative advantages in an EU regional context, Study carried out for the European Commission, DG GROW.

OECD (2009), Measuring Capital - OECD Manual, 2nd edition.

OECD (2014), Recommendations of the Council on Effective Public Investment Across Levels of Government.

OECD (2015), Going for growth: Breaking the vicious circle.

OECD (2015), Government at a Glance 2015, OECD Publishing, Paris.

http://dx.doi.org/10.1787/gov_glance-2015-en

Olley, G. S., Pakes, A. (1996), The dynamics of productivity in the telecommunications equipment industry, Econometrica 64: 1263–1297.

Piketty, T. (2014), Capital in the Twenty-First Century, Cambridge, MA: Belknap Press.

PwC (2014), The sharing economy – sizing the revenue opportunity.

PwC (2015), Exploring the potential role of human, physical and knowledge capital investments in a smart specialisation context, Study for the European Commission, DG GROW.

PwC, London Economics and Ecorys (2011), Public procurement in Europe: cost and effectiveness, Study prepared for the European Commission.

Ramboll Management (2011), Cross-border procurement above EU thresholds, study for the European Commission.

Rocholl, J. and Niggemann, T. (2010), Pension Funding and Capital Market Development, http://papers.ssrn.com/sol3/papers.cfm?abstract_id=1571126

RWI (2015), Labour market transitions in turbulent times, Research Project Report for EUROFOUND, RWI Projektberichte.

Saha, D., Fikri, K. and Marchio, N. (2014), FDI in U.S. metro areas: the geography of jobs in foreign-owned establishments, Brookings Institution, June 2014.

Sirkin, H.L., Zinser, M., Rose, J.R. (2014), The Shifting Economics of Global Manufacturing, How Cost Competitiveness is Changing Worldwide, Boston Consulting Group.

Sorensen, B. and Yosha, O. (1998), International Risk sharing and European Monetary Unification, Journal of International Economics, 45, 211-238.

Special task Force (Member states, Commission, EIB) on investment in the EU (2014), Final Task Force Report, December 2014

Stehrer, R., Leitner, S., Marcias, M., Mirza, D., Stöllinger, R. (2015), The future development of EU industry in a global context.

The Conference Board (2015), Productivity Brief 2015, Global Productivity Growth Stuck in the Slow Lane with No Signs of Recovery in Sight.

Timmer, M.P., Los, B., Stehrer, R. and de Vries, G.J. (2013), Fragmentation, incomes and jobs: an analysis of European competitiveness, Economic Policy, 28(76), 613–661.

Van Ark, B., O’Mahony, M. and Timmer, M.P. (2008), The Productivity Gap between Europe and the US. Trends and causes, Journal of Economic Perspectives, Volume 22, Number 1, Winter 2008, Pages 25–44

Vandenbussche H. (2014), Quality in Exports, Economic Paper 528, DG ECFIN, European Commission.

Vrontisi, Z., Kitous, A., Saveyn, B., Vandyck, T. (2015), Impact of low oil prices in the EU economy, European Commission, DG JRC, IPTS.

wiiw (2015), Identifying revealed comparative advantages in an EU regional context, study for the European Commission.

World Bank Group (2015), Doing Business 2015: Going Beyond Efficiency, World Bank.

World Economic Forum (2008), The Global Competitiveness Report 2008 – 2009, Global Competitiveness and Benchmarking Network, Geneva.

World Economic Forum (2013), The Global Competitiveness Report 2013 – 2014, Global Competitiveness and Benchmarking Network, Geneva.

World Economic Forum (2014), The Global Competitiveness Report 2014 – 2015, Global Competitiveness and Benchmarking Network, Geneva.

(1) ()Trade and Intra-EU exchanges are measured as imports plus exports divided by 2. In this report we refer to intra EU exchanges of goods and services as “imports” or “exports”.
(2) ()2013 is the last year for which data are available for EU-28. After a change in the methodology, 2014 data are available for most EU except for Croatia, Finland, Italy and Spain. For that group of EU-24 and with the new methodology, intra-EU trade in services increased by 7.5 % in 2014 with respect to 2013.
(3) () http://ec.europa.eu/internal_market/services/docs/services-dir/implementation/report/COM_2012_261_en.pdf (see pages 2 & 3).
(4) () http://eur-lex.europa.eu/resource.html?uri=cellar:be389bae-2cf4-11e3-8d1c-01aa75ed71a1.0001.01/DOC_1&format=PDF .(see page 9 and annex 2). See also Monteagudo at al. (2012) and European Commission (2015).
(5) ()Since 2008, the definition of "business services" used by Eurostat is based on NACE Rev2. It includes NACE Rev 2 codes: J62, N78, J582, J631, M731, M691, M692, M702, M712, M732, M7111, M7112.
(6) ()European Commission, The economic impact of professional services liberalisation, DG ECFIN, Economic Paper 533/2014.
(7) ()It is important to note that the total turnovers cannot be compared across subsector since they correspond to different EU aggregates. Only comparisons over time to each subsector are relevant here.
(8) ()Although accounting and audit are also subject to considerable professional regulations, their impact seems to be lessened by the harmonisation of accounting rules with international accounting reporting standards. See Bloomfield et al. (2015).
(9) ()Foreign direct investment is any cross-border investment by a resident entity in one economy with the objective of obtaining a lasting interest in an enterprise resident in another economy.
(10) ()2000 was an exceptional year indeed. The share of inward FDI over GFCF has been very variable over the years but it has consistently reached 2-digit levels except in 2004 and the last two years since 2000. It must be noted that the fall with respect to total trade, the fall in FDI is also remarkable, reaching just 3 % of trade in 3013.
(11) ()In this section, establishment includes investment resulting in the creation of branches, agencies and subsidiaries of EU companies in other member States.
(12) ()Small increases can be reported in Spain, the Netherlands and Austria.
(13) ()Most FDI into EU Member States has taken place in the form of mergers and acquisition of already existing enterprises; greenfield investments have taken a secondary importance. However, these greenfield investments have targeted EU-15 Member States instead of EU-13.
(14) ()Financial intermediation accounted for over 65 % of the FDI stock into services in that year.
(15) ()The complementarities between FDI and trade between goods and services sectors will be the subject of special attention in a future report.
(16) ()COM(2014) 25 Final. Both available at http://ec.europa.eu/energy/sites/ener/files/documents/2014_iem_communication.pdf.
(17) ()A typology and conceptual framework showing how cumulative impacts have been assessed through the research is provided in the CEES study.
(18) ()J. Monteagudo, A. Rutkowski, D. Lorenzani, The economic impact of the Services Directive: A first assessment following implementation, European Economy Economic Papers, No. 456, June 2012, http://ec.europa.eu/economy_finance/publications/economic_paper/2012/ecp456_en.htm .
(19) ()Measured as the direct impact on labour productivity of reduction of barriers affecting domestic establishment.
(20) ()The fact that this section focuses on allocative efficiency (AE) should not be interpreted as a suggestion that it is a more important determinant of productivity than productive or dynamic efficiency, the other two main dimensions of productivity. In fact, the relative importance of the three types of efficiency is likely to vary by product or service, firm and sector. It is also important to emphasise that the macroeconomic importance of high or low productive/dynamic/allocative efficiency depends on the importance of the sector to the rest of the economy: average efficiency in a vitally important sector will benefit the economy more than top efficiency in a sector of little economic importance, and vice versa for below-average efficiencies.
(21) ()This section follows the methodology of the European Commission’s Product Market Review 2013: Financing the real economy. European Economy 8/2013.
(22) ()European Commission, Product Market Review 2013: Financing the real economy. European Economy 8/2013.
(23) ()The publication European Commission (2013), Product Market Review 2013: Financing the real economy, European Economy 8/2013 includes a similar indicator of allocative efficiency which is slightly different of the one presented here because it has excluded self-employment. That methodology has also been used in SWD(2015) 202.
(24) ()European Commission, Product Market Review 2013: Financing the real economy. European Economy 8/2013.
(25) ()Scientific research and development; legal and accounting activities; architecture and engineering; technical testing and analysis; head offices; management consultancies; advertising and market research; veterinary activities; other professional, scientific and technical activities.
(26) ()Calculations based on the findings of EPRS (2014), The Cost of Non-Europe in the Single Market.
(27) ()In particular the PMR dataset, OECD.
(28) ()See chapter 2, in particular sections on intra-EU trade and productivity.
(29) ()Such barriers can limit the number of suppliers of a product or service; limit the ability of suppliers to compete or reduce their incentive to do so; or limit the choices and information available to customers.
(30) ()It must be underlined that the indicators used here for these regulated professions are those published by the OECD. The SWD accompanying the Single Market Strategy publishes an update of these indicators produced by the Commission services. In order to avoid changes in the methodology with respect to the data published by the OECD for previous years, these new estimates of the indicators are not used here.
(31) ()OECD methodology changed in 2008. Therefore data for 2003 and 1998 are estimates.
(32) ()Source: http://www.europarl.europa.eu/RegData/etudes/STUD/2015/547558/EPRS_STU(2015)547558_EN.pdf
(33) ()Research shows that increased publicity requirement induces more entry and higher winning rebates, which reduces the costs of procurement and rationalizes public spending. Increased publicity also selects different winners: it increases the likelihood that the winner hails from outside the region of the public administration and that the winner is a large company. See Decio Coviello and Mario Mariniello (2014), Publicity requirements in public procurement: Evidence from a regression discontinuity design,  Journal of Public Economics , 2014, vol. 109, issue C, pages 76-100.
(34) ()If the value of procurement published EU-wide is compared to public expenditure, the group of four low publication countries (DE, LU, NL, AT) remains unchanged.
(35) ()It should be emphasised that a low value in relation to GDP does not imply that rules are not respected, simply that other Member States publish tenders representing a higher proportion of their economy.
(36) ()Ramboll Management (2011), Cross-border procurement above EU thresholds, study for the European Commission.
(37) ()Hansel LTD, report of activities 2014.
(38) ()E-procurement is mandatory for all public contracts with a value above the PP Directives' thresholds.
(39) ()See Report on public procurement, page 10 ( http://www.base.gov.pt/oop/downloads/RelContr_Pub_2011.pdf ).
(40) ()A strategy for e-procurement, COM(2012) 179 final, page 4.
(41) ()The 2015 EU Justice Scoreboard, COM(2015) 116 final, http://ec.europa.eu/justice/effective-justice/files/justice_scoreboard_2015_en.pdf .
(42) ()Idem.
(43) ()European Commission, A Digital Single Market Strategy for Europe, COM(2015) 192 final.
(44) () Public consultation on Geo-Blocking and Other geographically based restrictions when shopping and accessing information in the EU at
http://ec.europa.eu/digital-agenda/en/newsroom/consultation/dsm
(45) ()See for instance European Parliament, Discrimination of Consumers in the Digital Single Market, 2013 and Cardona, M. and Martens, B., Supply side barriers to cross-border e-commerce in the EU, JRC/IPTS Digital Economy Working Paper No 2014-13, 2014.
(46) ()For a detailed presentation of these practices and their compatibility with EU law see European Commission, A partnership for new growth in services 2012-2015, COM(2012) 261 final.
(47) ()Boston Consulting Group (2015), Inventory of Europe's Industrial Assets for Growth, October.
(48) ()European Commission, Education and Training Monitor 2015, Staff Working Document,http://ec.europa.eu/education/tools/et-monitor_en.htm.
(49) ()There is no standardised/harmonised definition of BG start-ups,. Eurofound (2012) suggests a ‘European definition’ of born globals including among others the following elements: It has been started, is a spin-off, or has been a business transfer; it has an active, strategic intention to internationalise; it has an export share of at least 25 % of total sales during at least two of these first five years; it is active in at least two foreign countries, with ‘close markets’ (as regards geographic and cultural distance or language) also being considered as different markets. All served countries can be within Europe.
(50) ()Innovativeness was measured by managers’ and owners’ answers to three following questions: ‘Right now are there many, few, or no other business offering the same products or services to your potential customers?’, ‘Do all, some or none of your potential customers consider the product/service as new and unfamiliar?’, ‘Have the technologies or procedure required for this product or service been available for less than a year, or between one to five years. Or longer than five years?’.
(51) ()Similar results can also be shown by national data. In Austria, around three-quarters of BG star-ups introduced at least one new product, service or method between 2010 and 2012, compared to around 70 % of young enterprises and SMEs. In Sweden, around 70 % of these firms significantly improved or developed new products and/or services in the past three years, compared to around half of young enterprises and SMEs. Sources: Survey of the Austrian Institute for SME Research on behalf of the Austrian Federal Economic Chamber, 2013; Survey of the Swedish Agency for Economic and Regional Growth, 2014.
(52) ()Survey of the Swedish Agency for Economic and Regional Growth, 2014.
(53) ()Survey of the Swedish Agency for Economic and Regional Growth, 2014
(54) ()EPRS (2014), The Cost of Non-Europe in the Single Market, http://www.europarl.europa.eu/RegData/etudes/STUD/2014/510981/EPRS_STU(2014)510981_REV1_EN.pdf .
(55) ()This is a contribution of the Directorate General for Financial Stability, Financial Services and Capital Markets Union (DG FISMA).
(56) ()This was the expectation when the Council tasked the Commission in 2001 to monitor on a regular basis the evolution of financial integration in EMU; see the monitoring document published on an annual basis at: http://ec.europa.eu/finance/financial-analysis/reports/index_en.htm .
(57) ()Alongside the EFSM, EFSF and ESM, funding from the International Monetary Fund (IMF) and possible ECB (European Central Bank) purchases of sovereign debt on secondary markets was made available; for Member States that have not yet adopted the euro, the Balance-of-Payments (BoP) assistance was used.
(58) ()The zero risk weights and hence capital requirements on sovereign exposures, the exclusion of zero risk weighted sovereigns from existing limits within the applicable large exposure regime, and the categorisation of high-quality government bonds as highly liquid assets in the EU regulatory framework for banks have also promoted the nexus. See also the 2015 “ESRB report on the regulatory treatment of sovereign exposures”.
(59) ()A single deposit insurance is not part of the Banking Union framework, but it is highlighted in the 5 Presidents report of June 2015 ( http://ec.europa.eu/priorities/economic-monetary-union/docs/5-presidents-report_en.pdf ) as a crucial reform to complete the Economic and Monetary Union and to address the bank-sovereign negative feedback loops which were at the root of the financial .c 
(60) ()The OMT was announced in general terms on 2 August and in more technical detail on 6 September. It was alluded to already by ECB President Draghi in London on 26 July 2012, when he stated that “we think the euro is irreversible… Within its mandate, the ECB is ready to do whatever it takes to preserve the euro.” President of the European Council Herman Van Rompuy in a speech noted that “the European Central Bank was only able to take this OMT decision because of the preliminary political decision, by the EU’s Heads of State and Government to build a Banking Union. This was the famous European Council of June 2012, so just weeks before Mr Draghi’s statement in London; he himself said to me, during that Council, that this was exactly the game-changer he needed.”
(61) ()For a detailed analysis we refer to the CMU Action Plan published on 30 September 2015 as well as the accompanying economic analysis Staff Working Document (see http://ec.europa.eu/finance/capital-markets-union).
(62) ()FSAP was followed by the Commission White Paper on Financial services policy 2005-2010, which focused on implementation and enforcement of existing regulation and on delivering targeted improvements in the existing regulatory and supervisory frameworks.
(63) ()According to the European Commission’s and the ECB’s latest Survey on the Access to Finance of Enterprises (SAFE), access to finance moved down from being the third to being the fifth most pressing problem for euro area SMEs compared to the previous survey round.
(64) ()European Commission, Survey on the Access to Finance of Enterprises in the euro area, November 2014.
(65) ()European Commission, SME access to finance survey, November 2014.
(66) ()Sorensen and Yosha (1998). As a matter of fact, in the USA 62 % of shocks are absorbed by market transactions and only 13 % by federal tax transfers (Asdrubali et al. (1996))
(67) ()Financial prudential regulation has long been a subject of EU competence, but financial supervision and financial crisis resolution remained purely national prerogatives. This situation was even true in the euro area where the single currency resulted in even greater market integration than in the EU in general, yet financial stability policy was no more integrated there than in the EU. As a result, both the EU in general and the euro area in particular were ill-prepared to deal with the financial crisis.
(68) ()http://ec.europa.eu/priorities/economic-monetary-union/docs/5-presidents-report_en.pdf.
(69) ()COM(2015)468 final.
(70) () http://ec.europa.eu/finance/capital-markets-union/index_en.htm .
Top