Choose the experimental features you want to try

This document is an excerpt from the EUR-Lex website

Document 52015SC0169

COMMISSION STAFF WORKING DOCUMENT Situation of young people in the EU Accompanying the document Communication from the Commission to the European Parliament, the Council, the European Economic and Social Committee and the Committee of the Regions Draft 2015 Joint Report of the Council and the Commission on the implementation of the renewed framework for European Cooperation in the youth field (2010-2018)

SWD/2015/0169 final

Brussels, 15.9.2015

SWD(2015) 169 final

COMMISSION STAFF WORKING DOCUMENT

Situation of young people in the EU

Accompanying the document

Communication from the Commission to the European Parliament, the Council, the European Economic and Social Committee and the Committee of the Regions

Draft 2015 Joint Report of the Council and the Commission on the implementation of the renewed framework for European Cooperation in the youth field (2010-2018)

{COM(2015) 429 final}
{SWD(2015) 168 final}


Table of contents

1. Introduction3

2. Demography6

2.1. Introduction7

2.2. Trends in the European youth population7

2.3. Mobility among young Europeans12

3. Education and Training14

3.1. Introduction15

3.2. Formal education15

3.3. Non-formal education and youth work22

3.4. Learning mobility24

3.5. Transition from education to employment28

4. Youth Employment and Entrepreneurship30

4.1. Introduction31

4.2. Economically active young people31

4.3. Young people in the labour market33

4.4. Support for the transition to employment49

5. Social Inclusion55

5.1. Introduction56

5.2. Moving towards independence: young people leaving the parental home56

5.3. Levels of poverty and social exclusion58

5.4. Other aspects of poverty and social inclusion65

5.5. Groups at risk of social exclusion71

6. Health and Well-being77

6.1. Introduction78

6.2. Young people’s state of health78

6.3. Health risks79

6.4. Mental well-being91

7. Participation in democratic life95

7.1. Introduction96

7.2. Young people's interest in politics and their perception of EU citizenship96


7.3. Young people's participation in representative democracy: voting and joining a political

party……………….97

7.4. Other ways young people participate101

7.5. Engaging hard-to-reach young people in political and civic life105

8. Voluntary Activities107

8.1. Introduction108

8.2. Youth participation in voluntary activities108

8.3. Encouraging youth participation in voluntary activities112

9. Culture and Creativity114

9.1. Introduction115

9.2. Cultural participation115

9.3. Young people and their use of ICT120

9.4. Creativity123

10. Youth and the World125

10.1. Introduction126

10.2. Young people's engagement with global issues126

10.3. Cooperation among young people from different continents130

References132

Abbreviations141


1. INTRODUCTION

In 2009, the Council endorsed a renewed framework for European cooperation in the youth field (2010-2018), also known as the EU Youth Strategy ( 1 ). The period covered by the framework is divided into three-year work cycles. At the end of each cycle, a European Union (EU) Youth Report should be drawn up by the Commission. The Council specified that the report 'shall consist of two parts: A joint Council-Commission report (political part), and supporting documents (statistical and analytical part). The EU Youth Report will evaluate progress made towards the overall objectives of the framework, as well as progress regarding the priorities defined for the most recent work cycle and identify good practices'. At the same time, the report should serve as a basis for establishing priorities for the following work cycle.

The statistical part of the report presents data and information on the current situation of young people in Europe. Following an introductory chapter on demography, which presents the main trends in the youth population over the last few years, separate chapters are dedicated to the eight 'fields of action' identified in the Council Resolution on the EU Youth Strategy (2010-2018): Education and Training, Employment and Entrepreneurship, Social Inclusion, Health and Well-being, Participation, Voluntary Activities, Creativity and Culture, and Youth and the World.

This report builds on the dashboard of EU youth indicators ( 2 ), a selection of 41 indicators which measure the most crucial aspects of young people's lives in Europe. Wherever the report uses these indicators, this is highlighted in the text and in the layout of the relevant Figures.

The period when a person is considered to be 'young' differs across Europe according to the national context, the socio-economic development of society and time. Common to all countries is that the period of youth - the transition from being a child to being an adult - is marked by important life changes: from being in education to having a full-time job, from living in the family home to setting up one's own household, and from being financially dependent to managing one's own money.

Relying on Eurostat data, Eurobarometer surveys and other available sources, the population targeted in this report is primarily young people between 15 and 29 years of age. Where possible, the analysis distinguishes between subgroups aged 15 to 19, 20 to 24, and 25 to 29. In other cases, a more limited age range is used, either because of the specifications of survey data, or because the issue in question affects a particular age group (e.g. early school leaving). In addition, children (under 16 years of age) are also included when analysing indicators on poverty or social exclusion.

In line with the analytical part of the EU Youth Report ( 3 ), the information and analysis cover the EU Member States and, where the available data allows, the EU candidate countries (Albania, Montenegro, the former Yugoslav Republic of Macedonia, Serbia, and Turkey) and EEA EFTA States (Iceland, Liechtenstein, Norway).

The report focuses on the most recent years for which data are available and illustrates trends which have emerged since the publication of the previous Youth Report in 2012.

European youth: cross-cutting trends

Across the different topics covered in detail by each chapter, some general trends affecting young Europeans in these transition stages emerge.

In general, positive trends are registered in the field of education, where all the main indicators showed improvements for the EU as a whole. The proportion of young people with at least upper secondary level attainment and with tertiary degrees has risen, while the percentage of low achievers and early school leavers has declined. Evidence indicates that higher levels of education are associated with more positive conditions in other spheres of life. First of all, the positive relationship between higher levels of education and employment is confirmed. In the EU as a whole, the unemployment rate is much lower for young graduates from tertiary education than for those with the lowest levels of education. Data also illustrate that highly educated youth tend to be more motivated to participate in political elections and cast their vote.

However, challenges do exist for those who do not benefit from the improvements in terms of education. Many young people face difficulties in completing school education and acquiring necessary skills. Indeed, progress is mixed regarding reducing the share of 'low achievers' among 15 year olds. This compounds their socio-economic disadvantages and reduces their opportunities to participate more broadly in society.

Despite improvements in the level of competencies, skills and educational achievements, many young Europeans are facing serious threats such as marginalisation in the labour market, deterioration of living conditions, and obstacles to social integration and political participation.

The economic crisis which started in 2008 continues to limit young people's chances of success. Employment has become more difficult to find and retain, and, when a job is secured, the risk of being overqualified is high for many young graduates. Unemployment, including long-term unemployment, has continued to rise amongst the young, particularly in countries facing economic hurdles. Here, insecure work conditions linked to temporary contracts and involuntary part-time work continue to be widespread and, in some regions, have even deteriorated. Some signs of improvement in the situation for young people in the labour market emerged between 2013 and 2014, raising the hope that the negative trends provoked by the economic crisis have started to turn around.

However, the consequences of several years of great adversity in the labour market have significantly jeopardised the chances of social inclusion for vast numbers of young Europeans. The proportion of young employees unable to make ends meet and living in poverty despite having a job is particularly high in some European countries. Inability to find employment and gain appropriate remuneration clearly affects the possibility for significant numbers of young people to afford the costs of basic goods and services such as food, healthcare, and proper housing. Material deprivation rates for youth have increased in Europe, especially in countries where youth unemployment is high. It has become increasingly difficult for many young people to meet their housing costs (such as rent and utility bills), and, as a consequence, the rate of overcrowding has risen in many EU Member States. Also the possibility for many young people to look after their health and maintain their well-being has reduced: in countries where unemployment and social exclusion are particularly high, increasing proportions of young people report not being able to afford medical care when needed.

Over the last three years, deterioration in the working and living conditions of many young people in Europe has gone hand in hand with a growing detachment from political life and waning engagement in traditional civic activities. Electoral turn-out amongst young voters has declined since 2011 in the vast majority of countries, suggesting a widespread dissatisfaction with traditional modes of political engagement. At the same time, the propensity to dedicate time and energy to the activities of non-governmental organisations has weakened, especially in countries where unemployment and social exclusion are the highest.

Youth participation in cultural activities is also suffering from decreasing trends. Possibly because of reduced financial resources, some are unable to afford to attend cultural events or develop their artistic interests; many young people have refrained from visiting museums, going to the theatre, concerts and movies, and from pursuing their artistic vocations. Attendance at sports and youth clubs has also declined, indicating a withdrawal of many young people from socially inclusive activities.

All in all, despite improvements in the level of competencies, skills and educational achievements, many young Europeans are facing multiple challenges which increase the risk of economic and social exclusion. Marginalisation in the labour market, deterioration in living conditions, and challenges to social integration and political participation are serious threats to young people with fewer opportunities in Europe today.

2. DEMOGRAPHY

EU Youth Indicators

Share of young people in the total population on 1 January

Figure 2-A

2.1. Introduction

Understanding the demographic trends at play in the European youth population is conducive to appreciating the characteristics and behaviours of young people today, which will be described in detail in the other chapters of the report. The size, geographical distribution and demographic features of youth in Europe are related to the quality of life they enjoy, the opportunities at their disposal and their individual and social behaviours.

This chapter therefore introduces the subject matter of the current report. It illustrates the key demographic indicators for European youth, including its proportion in the general population, its projected development, its composition, and the patterns of youth mobility across the continent.

2.2. Trends in the European youth population

On 1 January 2014, almost 90 million young people aged between 15 and 29 years lived in the European Union ( 4 ). This represents around 18% of the total population of EU-28 (Figure 2-A).

Figure 2-A: EU youth indicator: Share of young people (aged 15-29) in the total population on 1 January, by age group and by country, 2014

EU youth indicator

%    %

Notes: The population corresponds to the number of persons having their usual residence in the country on 1st January. When 'usual residence' cannot be established, the countries can report of the legal or registered residence.

Source: Eurostat [demo_pjanind]

The proportion of young people in the total population varies across countries. While it is comparatively smaller in Greece, Spain, Italy, Portugal and Slovenia, it reaches the highest levels in Cyprus, Malta, and Slovakia. Albania and Turkey report the highest figures outside of the EU.

The proportion of young people in the European Union continues to decrease…

In line with the long term trend over the last three decades (see the previous edition of the Youth Report ( 5 )), the proportion of young people continued to decline between 2010 and 2014 (Figure 2-B). 


Figure 2-B: Share of young people (aged 15-29) in the total population, by age group, EU-28 average, 2010 and 2014

%    %

Source: Eurostat [demo_pjanind]

On average, the 15-19 age group is the most affected by the decline: it registered a 7% decrease over the three years considered. Over a period of only 4 years, it is evident that the proportion of teenagers who entered the 15-19 age group did not fully replace the proportion that moved out of the 25-29 group. This decline in the total numbers of young people in the European Union affects countries to a different extent (Figure 2-C).

Figure 2-C: Share of young people (aged 15-29) in the total population, by country, 2010 and 2014

Source: Eurostat [demo_pjanind]

Central, eastern and southern European countries have seen comparatively larger drops in their youth populations than northern ones. However, Ireland is the country recording the highest fall in percentage points since 2010 (-4 pp.). On the other hand, a few countries (Denmark, Luxembourg, and the Netherlands) have witnessed slight increases in the proportion of young people in their population.


There are several reasons behind the decline in the youth population in the vast majority of European countries. While fertility rates rose modestly during the first decade of the century, they remained below what is considered to be the replacement level ( 6 ). Since 2008, they have recorded a further decline, perhaps partly due to the effects of the economic crisis where it impacted on the level of unemployment and family income, at least in those countries most severely hit by the economic downturn ( 7 ). In addition, a tendency for women to give birth to fewer children and at a later age in life is observed, which further reduces the proportion of children being born ( 8 ). These trends are expected to continue in the coming decades, leading to further reductions in the size of the EU youth population (Figure 2-D).

Figure 2-D: Projected share of the youth population (aged 15-29), EU-28 average, 2013-2050

%    %

Source: Eurostat [proj_13npms]

Figure 2-E: Projected young-age and old-age dependency ratios, EU-28 average, 1990-2080

%    %

Note: The old-age-dependency ratio is the ratio of the number of elderly people at an age when they are generally economically inactive (i.e. aged 65 and over), compared to the number of people of working age (i.e. 15-64 years old). The young-age-dependency ratio is the ratio of the number of young people at an age when they are generally economically inactive, (i.e. under 15 years of age), compared to the number of people of working age (i.e. 15-64).

Source: Eurostat [demo_pjanind] [proj_13ndbims]

… and the decline is expected to continue in the future.

According to population projections developed by Eurostat (Europop2013), while the total EU population is expected to grow through 2050 reaching approximately 525 million in that year, the proportion of young people will decrease from almost 18% in 2013 to below 16% in 2050, equal to over 7 million individuals ( 9 ). The progressive decline in the share of young people, in a context of gradual growth in the total population and of ever-increasing life expectancy rates, indicates that the EU population is progressively ageing. This is expected to substantially boost the old-age dependency ratio, a measure of the extent to which the working-age segment of the population has to support older age groups through, for example, sustaining public healthcare and pension schemes (Figure 2-E) ( 10 ). As a result, younger generations will face an increased burden in supporting the remainder of the population as they move into work.

The increase in the numbers of young immigrants from outside the EU partially offsets the decrease in EU youth population

The steady decrease in the youth population living in the EU over the last decades and the related augmentation of the old-age dependency ratio has been subdued by the growth of immigration from non-EU ( 11 ). This has occurred in two main ways. On the one hand, the influx of immigration from third countries ( 12 ) compensated for the overall natural change in the general population and reversed an otherwise declining trend in the total population. This phenomenon has occurred during the last two decades and has continued over most recent years (Figure 2-F). Data illustrated in the chart show how the crude rate of total population change rose owing to the growth in the crude rate of net migration plus adjustment, especially since 2012.

Figure 2-F: Crude rates of population change, EU-28 average, 2010-2013

%    %

Notes: A crude rate is calculated as the ratio of the number of events to the average population of the respective area in a given year. The natural change of population corresponds to the difference between the number of live births and the number of deaths during the year. Net migration plus statistical adjustment is calculated as the difference between total population change and natural change.

Source: Eurostat [demo_gind]

On the other hand, young people aged between 20 and 29 are over-represented in the age structure of immigrants coming into EU countries from outside the Union (Figure 2-G).  


Figure 2-G: Young people (aged 15-29) as a proportion of total EU citizens and non-EU citizens living in the EU, by age group, EU-27 average, 2013

%    %

Notes: Citizenship denotes the particular legal bond between an individual and his or her State, acquired by birth or naturalisation, whether by declaration, choice, marriage or other means, according to national legislation.

15-19

20-24

25-29

Source: Eurostat [migr_pop1ctz]

As it appears from the trend illustrated in the first part of the chapter, the contribution of non-EU immigration is not enough to reverse the general decline in the youth population living in the EU, but has nonetheless made it less sharp. The proportion of young people from non-EU countries residing in EU Member States varies across countries (Figure 2-H).

Figure 2-H: Share of young immigrants (aged 15-29) from non-European countries, by country, 2012

%    %

Notes: Immigration denotes the action by which a person establishes his or her usual residence in the territory of a Member State for a period that is, or is expected to be, of at least 12 months, having previously been usually resident in another Member State or a third country.

Source: Eurostat [yth_demo_070]

Most recent data available indicate that in some EU Member States young non-EU residents account for at least one fifth of the total youth population (Belgium, the Czech Republic, France, Spain, Croatia, Italy, Hungary Malta, Slovenia and Sweden). In the United Kingdom the proportion reaches 40%. On the contrary, in Latvia, Lithuania, Luxembourg, Poland and Romania, the share of non-EU young people is below 10%.


2.3. Mobility among young Europeans

Thanks to the increasing opportunities for EU citizens to travel and set up residence across EU Member States, young Europeans have become increasingly mobile and likely to go work or study in another European country ( 13 ). Crossing geographical and cultural borders and gaining life and work experience in a different context is a great opportunity for a young person to acquire personal skills, learn new languages and appreciate the diversity of European culture.

With over 20% of the immigrants (aged 15-29) coming from another EU Member State, Ireland, Cyprus, Luxembourg and Austria stand out as the countries whose youth population receives in 2012 the highest proportion of young immigrants from other EU countries (Figure 2-I-a). In most of the countries, the share of young immigrants coming from another EU Member State has not changed radically compared to 2010.

However, some exceptions exist. The most significant increase has occurred in Greece, where the percentage of young European immigrants from other EU countries has doubled, although the overall level is relatively low (6%). In contrast, in Estonia and Romania the resident youth population from other EU States has significantly decreased.

Figure 2-I: Share of young (aged 15-29) EU immigrants and emigrants, by country, 2010 and 2012

a) EU immigrants from another EU Member State

%    %

b) EU emigrants to another EU Member State

%    %

Notes: According to the definitions provided by Eurostat, 'Immigration' denotes the action by which a person establishes his or her usual residence in the territory of a Member State for a period that is, or is expected to be, of at least 12 months, having previously been usually resident in another Member State or a third country; 'Emigration' denotes the action by which a person, having previously been usually resident in the territory of a Member State, ceases to have his or her usual residence in that Member State for a period that is, or is expected to be, of at least 12 months. Source: Eurostat [yth_demo_070] [yth_demo_080]

The largest proportions of young EU citizens leaving their own country of residence to settle in another EU Member State in 2012 are recorded in Bulgaria, Estonia, Ireland, Latvia (where one in four young people have emigrated) and remarkably in Lithuania (where the share reaches 45%) (Figure 2-I-b). The biggest increase in the proportion of young people emigrating over the two years in question is observed in Slovenia. Lichtenstein and Iceland have also seen increases in the share of young people choosing to live in another EU Member State. The opposite trend is illustrated in Ireland, where the proportion of young residents leaving the country to settle in another EU country has declined by almost one third.

Overall, looking at the countries for which data are available for both EU immigrants and emigrants, some are clearly shown to be either countries from which many young Europeans go abroad (for example, Bulgaria, Estonia, Latvia, Lithuania, and Hungary) or countries which receive large numbers of young people (in particular Denmark, Germany, Spain, Luxembourg and Austria).


3. EDUCATION AND TRAINING

EU Youth Indicators

Young people (aged 20-24) who have completed at least upper secondary education (ISCED 3-4)

Figure 3-A

Tertiary educational attainment of people aged 30-34

Figure 3-B

Early leavers from education and training

Figure 3-C

Young people in upper general secondary education (ISCED 3gen) learning two or more foreign languages

Figure 3-E

3.1. Introduction

The importance of education is unquestioned in today's world. Throughout the years spent in formal education and by means of the opportunities made available through the non-formal and informal sector and through youth work, children and young people have the chance to develop their personal potential, acquire basic skills and qualifications, and become integrated into society at large. Indeed, high-quality and inclusive education for all is one of the most effective defences against the risks of social marginalisation, poverty and exclusion, especially at times of crisis ( 14 ).

Moreover, education is not only a fundamental determinant of individual life chances, but also of economic development ( 15 ). Accordingly, obtaining a high-quality education gives the opportunity for young people to succeed in the labour market and find meaningful employment, while spurring long-term economic growth.

This chapter discusses the provision of learning opportunities for young people in Europe in both formal and non-formal settings. Taking a brief look first at the average number of years young Europeans spend in formal education, the chapter then goes on to examine attainment in terms of the educational level completed and student achievement in reading, mathematics and science. The chapter then gives an insight into the participation of young people in non-formal education, including youth work activities, and then turns to analysing how many young Europeans have had the opportunity to widen their learning experiences by going abroad during their studies. Finally, the last section examines the transition of young people to the world of work.

3.2. Formal education

Formal education refers to the structured system of education from pre-primary to tertiary level. This section considers some of the aspects most relevant to young people: the qualifications they attain – or fail to attain if they leave school prematurely – and the skills they acquire in the education system.

3.2.1. Participation and attainment

European children and young people on average spend more than 17 years in formal education, and this period has been increasing in recent years ( 16 ). Variations between countries are, however, quite significant, with the expected time spent in education ranging from 14 years in the former Yugoslav Republic of Macedonia and around 15 years in Cyprus and Luxembourg, to more than 20 years in Finland and Iceland ( 17 ). As was explained in the 2012 EU Youth Report ( 18 ), this is partly due to countries bringing forward the starting age of compulsory education; nevertheless, young people also stay longer in education beyond the compulsory school years (see also Section 3.5).

Young people are also more highly-qualified than older generations. In 2013 ( 19 ) in the EU-28, 81.1 % of young people aged 20-24 had completed at least upper secondary education; whereas only 66 % of people aged 55 to 64 had similar qualification levels ( 20 ).

Young people are increasingly highly educated. The share of young Europeans attaining upper-secondary qualifications continues to increase.

The proportion of young people aged 20 to 24 with upper secondary or higher educational attainment increased between 2011 and 2014 in the EU-28 and in almost every country except Bulgaria, the Czech Republic, Slovakia and Sweden (Figure 3-A-a). The Czech Republic and Slovakia are nevertheless still among the countries with a very high share of at least medium-educated young people: together with Ireland, Croatia, Cyprus, Lithuania, Poland and Slovenia, these are the countries where 90 % or more of young people aged 20-24 completed at least upper secondary education. Conversely, the percentage of young people with upper secondary or tertiary attainment levels is less than 70 % in Spain, Iceland and Turkey. However, it has to be noted that a high share of young people with at least upper secondary education does not mean that tertiary attainment is also high in a country (see for example the cases of the Czech Republic, Croatia and Slovakia on Figure 3-B-a).

Women generally have higher educational attainment levels than men. As Figure 3-A-b shows, in the EU-28, on average 84.7 % of women completed at least upper secondary education, while the percentage of men with the same attainment level is 79.9 %. This pattern holds true for all countries with available data, with the exception of the former Yugoslav Republic of Macedonia and Turkey, where the share of young men with at least upper secondary educational attainment is 3.9 and 4.4 percentage points higher than that of women, respectively. Gender differences are the largest in Estonia, Spain, Cyprus, and Iceland, with differences of more than 10 percentage points.

Figure 3-A: EU youth indicator: young people (aged 20-24) who have completed at least upper secondary education, by country

a) 2011 and 2014

EU youth indicator

b) by sex, 2014

EU youth indicator

Notes: For data on educational attainment based on the EU Labour Force Survey (EU-LFS) the International Standard Classification of Education 2011 (ISCED 2011) is applied as from 2014. Up to 2013 ISCED 1997 is used. Nevertheless, data are comparable over time for all available countries except Austria due to the reclassification of higher technical and vocational colleges. However, in the case of this particular indicator, which includes both upper secondary and tertiary levels, data for Austria are also comparable.

Source: Eurostat LFS [edat_lfse_08]

Among higher qualifications, the attainment of tertiary education degrees helps young people the most in securing a job in a high-skilled labour market (as illustrated in the chapter on Employment and Entrepreneurship) ( 21 ). Indeed, according to recent skills forecasts, the demand for high-skilled labour will continue to grow until 2020, when about 31 % of jobs in Europe will require high-level qualifications ( 22 ).

On average, over a third of Europeans between 30 and 34 years of age have achieved a tertiary degree
(Figure 3-B-a) (
23 ). Several countries reveal percentages much lower than the EU average, in particular the Czech Republic, Italy, Malta, Romania, Slovakia, and, outside the EU, the former Yugoslav Republic of Macedonia and Turkey, where around one in four 30-34 year-olds has a tertiary qualification.

Figure 3-B: EU youth indicator: Tertiary education attainment of people aged 30-34, by country and by sex, a) 2011 and 2014

EU youth indicator

b) by sex, 2014

EU youth indicator

Notes: For data on educational attainment based on the EU Labour Force Survey (EU-LFS) the International Standard Classification of Education 2011 (ISCED 2011) is applied as from 2014. Up to 2013 ISCED 1997 is used. Nevertheless, data are comparable over time for all available countries except Austria due to the reclassification of higher technical and vocational colleges.

Source: Eurostat LFS [edat_lfse_07]

Increasing shares of young Europeans gain tertiary degrees.

In line with the gradual increase since 2000 ( 24 ), the proportion of people aged 30-34 with tertiary level education attainment has grown over the last three years, although at a different pace across European countries (Figure 3-B-a). The most significant relative increases have taken place in Greece and Croatia, with an increase of more than 8 percentage points.

In accordance with the general educational attainment trends described above, women attain tertiary degrees in higher percentages than men (Figure 3-B-b). Men are furthest behind in Estonia, Latvia, Lithuania, Slovenia and Norway, while the gender gap is narrowest in Germany and Austria. In Germany, together with Turkey, fewer women than men complete tertiary degrees.

Despite this positive trend in educational attainment, a significant share of young Europeans still face significant difficulties in the education system and feel compelled to leave prematurely without having gained relevant qualifications or a school certificate. This is the case with early leavers from education and training (also referred to as 'early school leavers') – people aged 18-24 with at most lower secondary education and who were not in further education or training during the last four weeks preceding the survey. Amongst the factors contributing to young people leaving education early, their socio-economic status and that of their families proves to have significant weight ( 25 ). Indeed, early leavers are much more likely to come from families with a low socio-economic status (i.e. where parents are unemployed, have low income and low levels of education), or from vulnerable social groups such as migrants ( 26 ). Early school leavers are exposed to a particularly high risk of deprivation and social exclusion. In addition, not only does leaving school early result in longer and more frequent spells of unemployment, it also engenders considerable public and social costs ( 27 ).

On average, about 11 % of Europeans aged 18-24 in 2014 left education having completed lower secondary education at most (Figure 3-C-a) ( 28 ). Several countries report much higher percentages (especially Spain, Italy, Malta, Portugal, Romania, Iceland and Turkey), while the lowest shares are registered in the Czech Republic, Croatia, Poland, and Slovenia.

Across the EU, the proportion of early leavers from education and training is declining.

Since 2000, there has been a general decline in the proportion of young people leaving school early in Europe. In line with this long-term trend, fewer people left education prematurely in the majority of European countries between 2011 and 2014 (Figure 3-C-a). Spain, Cyprus, Portugal and Norway are the countries where the decrease has been most significant. Among the countries with the highest proportions of early school leavers, Italy and Malta have also shown improvement. However, there are still more than 5 million early school leavers in Europe, and an increase in their share has taken place in Bulgaria and Estonia, and there has been a stagnation in Hungary and Romania, where percentages still higher than the EU benchmark of 10 %.

Figure 3-C: EU youth indicator: Early leavers from education and training (population aged 18-24 with lower secondary education at most and not in further education or training), by country

a) 2011 and 2014

EU youth indicator

b) by sex, 2014

EU youth indicator

Notes: For data on educational attainment based on the EU Labour Force Survey (EU-LFS) the International Standard Classification of Education 2011 (ISCED 2011) is applied as from 2014. Up to 2013 ISCED 1997 is used. Nevertheless, data are comparable over time for all available countries except Austria due to the reclassification of higher technical and vocational colleges.

Source: Eurostat LFS [edat_lfse_14]

The risk of leaving education prematurely and with low qualification levels is higher amongst men than women (Figure 3-C-b). This gender gap applies to most European countries, and is widest in Estonia, Spain, Cyprus and Iceland. On the other hand, some countries show similar percentages for men and women (Bulgaria, the Czech Republic, Croatia and Slovakia). Only in the former Yugoslav Republic of Macedonia and in Turkey, and to much a lesser extent in Bulgaria, there are more young women leaving early from education and training.

Young people who have left school prematurely are typically those students who perform poorly in the classroom and on standardised tests, and can be helped to re-enter mainstream education and subsequently to gain higher qualifications through the recognition and validation of learning outcomes achieved by means of non-formal education (discussed in Section 3.3).


3.2.2.    Skills

During the years spent in formal education, young people can acquire the skills that are essential if they are to achieve their full potential and be successful in their personal and social lives as well as in their career. Indeed, good levels of basic skills represent the foundation for professional development and social inclusion ( 29 ). Specifically, reading, mathematics, and science have been recognised as the core competencies to be developed in schools ( 30 ).

Since 2009, the share of low-achievers in reading, mathematics and science has declined in the majority of European countries.

On average, about one in five young people aged 15 demonstrates low levels of proficiency in the three core competencies (Figure 3-D). Figures clearly indicate that pupil performance in these three skills correlate strongly with each other. Countries that show a certain level of performance in one of these basic skills tend to perform similarly in the others. For example, Bulgaria, Cyprus, Romania, Albania, Montenegro and Turkey, show higher proportions of low-achievers in all three areas.

Since 2009, the share of low-achievers has declined in the majority of European countries, with the exception of Greece, Hungary, Portugal, Slovakia, Sweden, Norway and Iceland where the opposite trend is recorded. However, Europe still counts a worrying number of pupils with very low basic skills and progress is lacking behind, particularly in mathematics.

Figure 3-D: Low-achieving 15 year-old students in reading (a), mathematics (b) and science (c), by country, 2009 and 2012

a) Reading

%    %

b) Mathematics

%    %


c) Science

%    %

Notes: 'UK' stands for United Kingdom – England, Wales and Northern Ireland. Scotland is not included.

Source: OECD, PISA

In addition to basic skills, knowledge of foreign languages is a significant advantage for young people. It enables them to discover and understand different cultures, and expand their educational and professional prospects by opening up opportunities to study and work abroad.

One in two young students enrolled in general secondary education learns two or more foreign languages in the European Union (Figure 3-E). In some countries, the proportion is much higher, reaching 100 % or nearly 100% in the Czech Republic, Luxembourg, Romania, Slovenia, Slovakia, Finland and Lichtenstein. Conversely, Ireland, the United Kingdom and some southern European Member States show particularly low proportions of young people learning at least two foreign languages.

Figure 3-E: EU Youth indicator: Share of young people in upper general secondary education (ISCED 3gen) learning two or more foreign languages, by country, 2010 and 2012

EU youth indicator

%    %

Notes: EU-28 totals are calculated on the basis of the countries for which data are available. Where possible the previous/following year data have been used to compute the EU aggregates.

Germany: data are not available due to a derogation.

Source: Eurostat UOE [educ_ilang]

Over the two years for which data are available, the noticeable variations that have occurred have been decreases in Greece, Malta and Sweden.

The level of skills in foreign languages acquired by young Europeans is not yet being systematically measured across all EU countries. However, the first round of the European Survey on Language Competencies (ESLC) conducted in 2011 in 13 Member States shows wide variations exist across participating countries in the levels of proficiency demonstrated by 15-year-old students in reading, listening and writing in foreign languages ( 31 ).

3.3. Non-formal education and youth work

Non-formal education and training covers any organised and sustained learning activities that do not take place within the framework of the formal education system ( 32 ). Non-formal learning is undertaken intentionally but participation in the courses or activities is voluntary ( 33 ). This type of learning experience usually addresses the needs of specific target groups such as adults wishing to re-enter education, employed or employment-seeking individuals active in the labour market in need of further qualifications, and young people trying to improve specific skills in parallel or as an alternative to formal education.

As acknowledged by the Council of the European Union, non-formal learning can greatly contribute to increasing the motivation of young Europeans to undertake lifelong learning as well as improving their employability and job mobility, provided that mechanisms for recognising the skills acquired are widely available ( 34 ).

Indeed, non-formal learning can help release the potential of many young people by uncovering and developing their knowledge, skills and competencies and by encouraging the acquisition of new kinds of capacities. While these opportunities are important for all young people, they can be particularly beneficial to those who are at an educational disadvantage ( 35 ).

European countries differ widely in the level of participation of young people in non-formal education and training.

Countries differ greatly in terms of the share of young people involved in non-formal education (Figure 3-F). While at least one in five young individuals participate in non-formal education activities in Denmark, France, Cyprus, Sweden and the United Kingdom, other countries register much lower percentages; in particular, Bulgaria, Croatia, Romania, Slovakia and the former Yugoslav Republic of Macedonia. Overall, in individual European countries between 2011 and 2014 only minor variations occurred in the proportions of young people undertaking non-formal learning.


Figure 3-F: Share of young people (aged 15-29) participating in non-formal education and training, by country, 2011 and 2014

a) 2011 and 2014

%    %

Notes: the Czech Republic, Spain, France, the Netherlands, Poland and Turkey: breaks in time series in 2013 (2014 for Spain and Turkey) make data not comparable with those from 2011.

EU average: data are not shown due to a break in series in data collection (2013).

b) by sex, 2014

%    %

Men

Women

Notes: Data are not reliable for Bulgaria (men) and Croatia (both men and women). 

Source: Eurostat LFS [trng_lfs_09]


By providing opportunities for non-formal learning, youth work contributes to the acquisition and enhancement of personal and learning skills that prove essential in promoting youth's education attainment.

As illustrated by Figure 3-F-b, the average share of young women and young men engaging in non-formal learning are very similar. Yet, in most countries, women tend to report somewhat higher rates of participation, with gender differences being the largest (more than 30 %) in Bulgaria, Estonia, Ireland and Finland.

Non-formal learning might take place in the context of youth work. According to the Resolution of the Council of the EU on youth work from 2010, youth work encompasses activities for and by young people, taking place in the extracurricular and leisure areas, and based on voluntary participation. Such activities see the cooperation of professional and voluntary youth workers, youth leaders, and the active engagement and contribution of young participants ( 36 ).

Youth work has been shown to exert positive influence on student achievements in education by fostering non-cognitive skills such as persistence, motivation, and self-efficacy ( 37 ). In particular, young people at risk of dropping out prematurely from education and training may obtain support from youth workers, gaining access to learning resources and individualised assistance and becoming motivated to learn again through participation in the various activities organised for them ( 38 ). Some youth work programmes have also proven effective in bringing young people who have left school early back into education by, for example, offering preparatory courses for re-insertion into mainstream education or second chance programmes ( 39 ).

Providing information, advice and guidance to support young people in their decision making during their education and training is another important aspect of youth work ( 40 ). Indeed, in some European countries, central authorities place guidance services for students under the auspices of youth work organisations, delivered by nation-wide networks independent from schools ( 41 ).

Because youth work is such a wide field encompassing voluntary leisure-time as well as extra-curricular activities, its contribution goes well beyond supporting young people in their educational experiences. Studies which have investigated the effects of young people's participation in youth work activities show that young people can acquire and reinforce personal skills such as conflict resolution, decision making, goal setting and interpersonal communication that can prove useful in all spheres of life ( 42 ). Although data on young people's participation in activities organised by youth workers is limited, Chapter 8 of this report provides some insight into the level of participation in organised voluntary activities (Figure 8-A) while Chapter 9 examines their involvement in youth organisations, cultural organisations and sports clubs (Figure 9-C).

3.4. Learning mobility

Learning mobility is generally seen as contributing to the development of a wide range of skills and competences among young people. Most importantly, transversal skills such as language competences, communication, problem-solving, and intercultural understanding are found to be improved by study periods abroad ( 43 ). According to the Erasmus Impact Study, students participating in the Erasmus mobility programme improve their employability skills more than non-mobile students ( 44 ). In addition, student mobility programmes also have the potential to contribute to the overall quality of education ( 45 ).

However, while mobility contributes to the skills development and labour market prospects of individuals, many do not have the possibility to experience learning mobility. First of all, most learning mobility occurs during higher education studies. While data on mobility outside higher education settings are scarce, young people not entering tertiary education clearly have fewer opportunities for learning mobility. In addition, even among higher education students, disadvantaged students participate less in mobility programmes ( 46 ).

Figure 3-G depicts the proportion of people who, in a recent Eurobarometer survey, declared they had spent time abroad studying. The figure covers all respondents, thus not only young people, but nevertheless gives a useful overview on learning mobility in the different European countries across different age groups.

Figure 3-G: Proportion of people who have spent time abroad (in another EU Member State or outside the EU) studying, by country, 2014

%    %

Notes: The question was: 'Have you ever spent time in another EU Member State or outside of the EU…? Studying'.

Base: all respondents, % by country

Source: Special Eurobarometer 417, European area of Skills and Qualifications, 2014

Today's young people participate in learning mobility more than older generations. However, differences across countries are substantial.

According to the Eurobarometer survey, in the EU-28 in general, the age group with the highest share of people who have studied abroad is the 25-39 age group (12 %), followed by the 40-54 year-olds (9 %) ( 47 ). In contrast, only 5 % of respondents over the age of 55 had experienced learning abroad ( 48 ). This indicates that learning mobility is increasing in Europe with each generation. This trend would appear to be contradicted by the figures for the youngest age group (those aged 15-24), where only 9 % of respondents have studied abroad. However, since most young people undertake a period of learning abroad during their higher education studies, many respondents in this age group may not yet have had the opportunity to do so.

The country with the largest proportion of respondents that has spent time abroad studying is Luxembourg, where until 2003, when the first and only university was founded, everyone went abroad for higher education studies, and even today all higher education students have some experience of learning mobility. Luxembourg is followed by Cyprus, where the proportion of higher education graduates receiving their degrees abroad is also relatively high (see Figure 3-H). Besides these two countries, learning mobility is most widespread in northern European countries: Sweden, Denmark, Estonia and Finland, with 18 %, 16 %, 14 % and 13 % respectively. On the other hand, the survey indicates that people are the least mobile in Bulgaria, with only 2 % of respondents declaring they had spent time abroad studying.

Given that most learning mobility occurs during higher education studies, more specific data are available on the mobility of higher education students. There are two main types of learning mobility in higher education: credit mobility, which refers to a short period of study in another country when a student may earn credits towards their home-based degree programme; and degree mobility, where a student moves to an institution abroad to take their entire degree course ( 49 ).

Figure 3-H depicts the latest Eurostudent survey data on temporary enrolments abroad (credit mobility) by higher education students. Among the countries with available data, the Nordic countries – Finland (18 %), Norway (16 %), Sweden (13 %) and Denmark (12 %) – as well as Slovenia (12 %) stand out with the highest credit mobility rates in 2013/14. Conversely, credit mobility rates were the lowest (around 2 %) in Croatia, Slovakia and Serbia.

Figure 3-H: Proportion of higher education students who have been temporarily enrolled abroad (credit mobility), 2013/14

%    %

Notes: EUROSTUDENT Question: 4.1 Have you been enrolled abroad as a student in higher education?

Data relate only to temporary international student mobility and therefore only take into account students who resume their studies in the country from which they came prior to their study period abroad.

Deviations from EUROSTUDENT survey conventions: Austria, Switzerland, Finland and France. Deviations from EUROSTUDENT standard target group: Germany and Italy.

Source: EUROSTUDENT V, K.1, K.16.

These data also illustrate that despite the benefits of learning mobility, the majority of higher education students did not report having spent time abroad. This is partly due to a selection bias, since the sample of the survey includes all higher education students, some of whom might not have reached the point in their study course when the opportunity to study abroad had arisen. Nevertheless, when asking about the intention to go abroad, data still show that in the majority of European countries, more than half of students do not even plan to study abroad, especially those from a lower socio-economic background ( 50 ). The most important obstacles to credit mobility, as indicated by the students not planning a study period abroad, are the additional financial burden (63 %), and the separation from partners, children and friends (47 %) ( 51 ).

Public funding for learning mobility can reduce the additional financial burden students have to face when going abroad to study. In Europe, the most important source of funding is the Erasmus Student Mobility programme. In fact, most of the European students undertaking short-term periods abroad to earn credits towards a home-based degree (credit mobility) do so through the Erasmus programme, especially in countries where national sources are less available ( 52 ). In the academic year 2012/13, 212 522 students participated in the programme, and the numbers have been growing each year ( 53 ). The largest numbers of participating students are from Spain, Germany, France, Italy and Turkey, though the relative share of students participating is the highest in Luxembourg, Liechtenstein, Spain, Lithuania and Latvia ( 54 ). Interestingly, whilst credit mobility is highest in the Nordic countries, the relative proportion of Erasmus students in Denmark, Sweden and Norway is among the lowest ( 55 ), pointing towards the availability of other sources of funding for these students.

Students who move to another country to take an entire degree programme (degree mobility), as depicted in Figure 3-I ( 56 ), mostly stay within the European Higher Education Area (EHEA) ( 57 ). The majority of students from Liechtenstein, Luxembourg and Cyprus study outside their country, but almost all of them within the EHEA. Besides these three small countries, degree mobility is the highest in Slovakia, Iceland and Malta, with more than 10 % of students studying abroad. At the other end of the scale, the proportion of students leaving their country to get a higher education degree is lowest (below 2 %) in Turkey, the United Kingdom and Spain.

Figure 3-I: Proportion of tertiary education students enrolled abroad (degree mobility), by country of origin, 2011/12

EHEA

Non-EHEA

Notes: Destinations outside of the EHEA considered are Bahrain, Jordan, Morocco (reference year 2010), Oman (reference year 2011), Qatar, Saudi Arabia, United Arab Emirates, China – Hong Kong Special Administrative Region, China – Macao Special Administrative Region (reference year 2011), Malaysia, Thailand, Israel, India, Ghana, Brazil, Chile, Korea, Australia, Canada, Japan, New Zealand and the United States.

Japan: data refer to foreign students instead of mobile students.

Czech Republic, Greece, France, Italy, Finland, Norway, the former Yugoslav Republic of Macedonia, Turkey, and Serbia: data refer to foreign students instead of mobile students.

Source: European Commission/ EACEA/Eurydice 2015, p. 236.

Among the countries with comparable data, the countries with the highest relative share of mobile students studying outside the EHEA are the United Kingdom, where around half of all mobile students leave the EHEA; and Denmark and Sweden, where around one third do so. Looking at the share of mobile students going outside the EHEA within all (including non-mobile) students, more than 1 % of all students go abroad to study outside the EHEA in Cyprus, Sweden, Liechtenstein, Switzerland and Iceland.

3.5. Transition from education to employment

Completing education and entering the labour market represents an important step in young people's lives. It is the time when the knowledge and skills learnt and aspirations developed during the years spent in education are put to the test, with the objective of gaining meaningful employment and financial independence. This transition has become increasingly complex and individualised for today's young people, as many of them move regularly in and out of work, often having part-time or temporary jobs, or even returning to education after a period of employment ( 58 ) (see also the chapter on Employment and Entrepreneurship) .

For most young Europeans, the passage from education to employment occurs between the ages of 20 and 24 (Figure 3-J). During these ages, the share of young individuals in formal education is overtaken by the share in employment.

This transition occurs later for women than for men. The gender gap in this particular regard is a consequence of the higher percentage of women in the age group 20-24 who continue their studies and postpone joining the labour force without continuing their education.

Figure 3-J: Share of young people (aged 15-29) either in formal education or in employment (but not in both), by age group, EU-28 average, 2013

In formal education and training, but not in employment

Women

Men

In employment, but not in education and training

Women

Men

15-19

20-24

25-29

Source: Eurostat [edat_lfse_19]


Figure 3-K: Share of young people (aged 20 to 24) either in formal education or in employment (but not in both), EU-28 average, 2011 and 2014

In employment, but not in formal education

In formal education, but not in employment

Source: Eurostat [edat_lfse_19]

While the transition from education to employment continues to take place between 20 and 24 years of age for most young Europeans, the share of young people staying in education has increased since 2011.

The rates of participation in formal education amongst young people in the age of transition (20-24) have gradually increased since 2000, with a significant surge after the start of the economic crisis in 2008 ( 59 ). Alongside this, the rate of employment for the same age group has progressively declined. These trends are confirmed between 2011 and 2014. As an increasing share of young Europeans aged 20 to 24 remains in education, a smaller portion enters the labour market without continuing their education (Figure 3-K).

Data presented in the chart indicate that the decrease in the proportion of young people solely in employment has been greater than the increase in the percentage of those solely in formal education. There is therefore a segment of the youth population aged 20-24 that appears to have left education without having been integrated into the labour force. The challenges encountered by young people experiencing unemployment, and by those who are not in employment, education or training (NEETs) will be illustrated in the chapters on Employment and Social Inclusion respectively.

(1) ()Council resolution of 27 November 2009 on a renewed framework for European cooperation in the youth field (2010-2018), OJ C 311, 19.12.2009, p. 1-11.
(2) ()Commission Staff Working Document on EU indicators in the field of youth, SEC(2011) 401 final.
(3) ()All EU Member States, EU candidate countries and EEA EFTA States were invited to submit National Youth Reports.
(4) () Eurostat collects information on the population living in each European country on the 1st of January of each year. Data on young people are available at http://ec.europa.eu/eurostat/web/youth/data/database .
(5) ()European Commission, 2012.
(6) ()Eurostat, 2015a. The replacement level is the level of the fertility rate which is necessary to compensate for the mortality rate. Its value should be 2.1.
(7) ()Ibid.
(8) ()Ibid.
(9) ()Ibid.
(10) ()Bloom et al., 2008.
(11) ()Bloom et al., 2008; Lanzieri, 2013.
(12) ()'Non-EU country' and 'third country' are used interchangeably to indicate any country outside the current 28 EU Member States.
(13) ()European Commission, 2012a and 2014d.
(14) () European Commission 2014a.
(15) () EENEE, 2014.
(16) () In the EU-28, while school expectancy was 17 years in 2003, it increased to 17.6 by 2012. Source: Eurostat, online data code: educ_igen (School expectancy of pupils and students (ISCED 0-6)).
(17) () Ibid.
(18) () European Commission, 2012a.
(19) () In Section 3.2.1, given the application of the new ISCED 2011 categories by Eurostat from 2014, we rely on data from 2013 for being able to make comparisons over time.
(20) () Eurostat, online data code: edat_lfse_08. Data extracted on 16/03/2015.
(21) () European Commission/EACEA, 2013.
(22) () European Commission 2014a.
(23) () The Europe 2020 Strategy includes a target set by the European Council to raise the level of tertiary attainment amongst 30-34 year-olds to 40 % by 2020.
(24) () European Commission, 2012a.
(25) () European Commission/EACEA/Eurydice/Cedefop, 2014.
(26) () Ibid.
(27) () European Commission, 2014a.
(28) () The ET 2020 Strategic framework includes a target set by the European Council of reducing the share of early school leavers to below 10 % by 2020.
(29) () European Commission 2014a.
(30) () The Europe 2020 Strategy includes a target set by the European Council to reduce the share of low achievers in reading, mathematics and science amongst 15 year-olds to below 15 % by 2020.
(31) () European Commission, 2012b. The European Survey on Language Competences (ESLC) was conducted for the first time in 2011 in Belgium, Bulgaria, Estonia, Greece, Spain, France, Croatia, Malta, the Netherlands, Poland, Portugal, Slovenia and Sweden. In accordance with the Common European Framework of Reference for Languages (CEFR), the survey tests 15-year-old students' abilities in their first and second foreign languages.
(32) () This definition is provided by Eurostat in the context of its lifelong learning statistics and is also applied in the EU LFS which collects data on participation in non-formal education and training during the four weeks preceding the survey.
(33) () Salto, 2005.
(34) () European Council Recommendation of 20 December 2012 on the validation of non-formal and informal learning (2012/C 398/01).
(35) () Council of Europe, 2005.
(36) () Resolution of the Council and of the representatives of the governments of the Member States, meeting within the Council on youth work, Brussels, 18 and 19 November 2010.
(37) () Shernoff and Lowe Vandell, 2007.
(38) () European Commission, 2014h. The study offers a detailed and comprehensive assessment of the various traditions and developments of youth work in Europe. It presents both secondary analysis of previous literature and data on the topic, and first-hand evidence collected through interviews. Most of the information presented in this section draws from this study's findings.
(39) () Ibid.
(40) () Ibid.
(41) () Ibid.
(42) () Ibid.
(43) () European Commission, 2014c.
(44) () Ibid, p.14.
(45) () Council of the European Union, 2011.
(46) () Hauschildt et al., 2015.
(47) () European Commission, 2014f.
(48) () Ibid.
(49) () European Commission/EACEA/Eurydice, 2013b.
(50) () Hauschildt et al. 2015, p. 193. Lower socio-economic background here refers to having parents with no higher education qualifications.
(51) () Ibid., p. 194.
(52) () Ibid., p. 198.
(53) () European Commission 2014c, p.8.
(54) () Ibid.
(55) () Hauschildt et al. 2015, p. 198.
(56) () Data presented here need to be treated with caution due to two main limitations. First, the list of destinations outside the EHEA is limited. Second, mobility data may rely on different criteria (i.e. citizenship, prior/permanent residence, prior education), which do not measure exactly the same phenomenon. For example, where data refers to foreign students instead of mobile students, it also includes non-national students who were already living in the country of destination before they began their higher education studies.
(57) () A more detailed analysis on degree mobility can be found in the latest Bologna Implementation Report (European Commission/ EACEA/Eurydice, 2015).
(58) () Buchmann, 2011; Eurofound, 2012.
(59) () European Commission, 2012a.
Top

Brussels, 15.9.2015

SWD(2015) 169 final

COMMISSION STAFF WORKING DOCUMENT

Situation of young people in the EU

Accompanying the document

Communication from the Commission to the European Parliament, the Council, the European Economic and Social Committee and the Committee of the Regions

Draft 2015 Joint Report of the Council and the Commission on the implementation of the renewed framework for European Cooperation in the youth field (2010-2018)

{COM(2015) 429 final}
{SWD(2015) 168 final}


4. YOUTH EMPLOYMENT AND ENTREPRENEURSHIP

EU Youth Indicators

Unemployment rates among young people

Figures 4-D and 4-E

Long term youth unemployment rate

Figure 4-F

Unemployment ratio of young people

Figure 4-J

Young employees with a temporary contract

Figure 4-P

Young people who would like to set up their own business

Figure 4-S

Self-employed rate of young people

Figure 4-T

4.1. Introduction

The economic crisis in the European Union has dramatically changed the youth labour market to a degree that in almost all European countries, several years since the start of the crisis, young people are still facing unprecedented difficulties in finding a job. While youth unemployment was already quite high in 2011, during the following two years the situation deteriorated even further in most countries, with eleven of these registering their highest youth unemployment rate for the 15-24 age group either in 2012 or in 2013 ( 1 ). The crisis has also had an important negative impact on young people aged between 25 and 29.

Analysing the situation of the 15-29 age group as a whole between 2011 and 2014, a significant contraction in employment is evident. Indeed, employment among those aged 15-29 decreased by more than 1.8 million, from 42.2 million in 2011 to 40.4 million in 2014 ( 2 ). In parallel, young people increased their participation in education and training (for more details see Chapter 3), and they are equally more likely to become unemployed. In 2014, more than 8.5 million young people aged 15-29 were unemployed.

Moreover, an increasing percentage of young people in 2014 had only temporary, part-time work or other non-standard form of employment in comparison to 2011.

The aim of this chapter is to describe both the current situation of the youth labour market as well as the changes that took place between 2011 and 2014. The chapter focuses firstly on economically active young people; it then presents a deeper analysis of young people's position in the labour market; and finally it gives a brief overview of the support available to assist young people in making the transition from education to employment.

4.2. Economically active young people

During the period 2011-2014, activity rates among young people aged 20-24 and 25-29 remained stable

The economically active population is broadly defined as those who are either in employment or unemployed ( 3 ). Figure 4-A shows the proportion of economically active young people in the total population, in 2011 and 2014. During the last three years there has been little change for the older age groups (young people aged 20-24 and 25-29), while the youngest age group (those aged 15-19) recorded a small decrease.


Figure 4-A: Activity rates among young people (aged 15-29), EU28 average, by age group, 2011 and 2014

Aged
15-19

Aged
20-24

Aged
25-29

Source: Eurostat LFS [lfsa_argan]

Young people aged 15 to 19 have always been the least active within the broader youth population, as most are still enrolled in education or training programmes. In 2011, just over one in five of those aged between 15 and 19 were economically active. The 2014 value shows a reduction of 4.7 % compared to 2011.

The EU28 average hides some significant differences at country level (Figure 4-B-a). Indeed, in approximately a third of countries the youth population aged 15-19 show activity rates significantly above the EU average. The highest values are recorded in Denmark (51.4 %), the Netherlands (59.6 %) and Iceland (71 %). Moreover, in these three countries the 15-19 age group's activity rates are much closer to those of the other groups in the youth population, suggesting an earlier entry to the labour market than in the other countries.

Figure 4-B: a) Activity rates among young people (aged 15-29), by age group and by country, 2014

Aged 15-19

Aged 20-24

Aged 25-29

Source: Eurostat LFS [lfsa_argan]

Similar variations between countries are observed among young people aged 20-24. In 2014, the highest values are recorded in Iceland (80.9 %) and the Netherlands (76.2 %), while Bulgaria (42.8 %) and Luxembourg (42.5 %) show the lowest activity rates. The EU28 activity rate is equal to 61.1 %.

As for the oldest age group (young people aged 25-29), the EU28 activity rate is higher than that of the previous group at 82.5 %. Cyprus (90.2 %) and Lithuania (88.7 %) are the countries with the highest activity rates. Conversely Italy (67.6 %) and Turkey (66.9 %) are those with the lowest values.

Figure 4-B (b) shows the relative changes in the activity rates over the period 2011-2014. Few countries (Croatia, Luxembourg and Hungary) registered a significant increase in activity rate among young people (particularly those aged 15-19). Other countries, conversely, had a significant decrease (Belgium, Estonia, Spain, and Portugal).

Figure 4-B: b) Change in activity rates among young people (aged 15-29), by age group andby country, 2011 and 2014

Aged 15-19

Aged 20-24

Aged 25-29

Source: Eurostat LFS [lfsa_argan]

4.3. Challenges to young people in the labour market

4.3.1. Unemployment

As illustrated in the previous Youth Report of 2012, since the start of the financial and economic crisis in spring 2008 the increase in youth unemployment (in all the three age groups considered: 15-19, 20-24 and 25-29) has been significantly greater than for the older active population (aged 25-64). This situation is also confirmed for the period 2011-2014.

Unemployment rates among young people

The EU28 unemployment rate among young people ( 4 ) in 2014 was 26.3 % for those aged 15-19, 20.6 % for those aged 20-24 and 13.6 % for the oldest age group (25-29).

The EU28 unemployment rates among young people aged 20-24 and 25-29 registered a further increase during the period 2011-2014

It is worth noting that the unemployment rates among young people were already quite high in 2011. The rates then increased (Figure 4-C) during the period 2011-2014 for the two older age groups (aged 20-24 and 25-29), while for the youngest group (15-19 year-olds), the change shows a moderate improvement (-1.9 %). For the two older age groups the change represents an increase of 4.0 % for young people aged 20-24, and of 7.9 % for those aged 25-29.


Figure 4-C: Unemployment rates among young people (aged 15-29) compared to the 25-64 age group, EU28 average, by age group, 2011 and 2014

15-19

20-24

25-29

25-64

Source: Eurostat LFS [lfsa_urgan]

The high level of unemployment recorded for the 25-29 age group shows an increasing difficulty in entering the labour market for young people who have completed their education (or those who have reached the age where they are expected to have completed it).

As indicated in the Education chapter, the rates of participation in full-time education amongst young people, in the age of transition from education to employment (ages 20-24), have gradually increased since 2000, with a significant surge after the start of the economic crisis in 2008. This change means that there is now greater homogeneity across the two lower age groups comprising young people from age15 through to 24. For this reason, and also to be in line with the indicator on youth unemployment on the EU youth dashboard, the analysis which follows will compare this wider group with the older age group of 25-29 year-olds.

From a gender perspective, over the period 2011-2014 at EU28 level, the unemployment rates of men and women have followed similar trends (Figure 4-D). The unemployment rate for young men aged 15-24 increased by 3.2 % while for young women it increased by 1.9 %. For the older age group (young people aged 25-29) the increase was roughly 7 %. Rates rose for both age groups until 2013 (for men and women alike) and subsequently fell between 2013 and 2014.

Figure 4-D: Unemployment rates for young people (aged 15-29), EU28 average, by age group and by sex, 2011 and 2014

EU youth indicator

Male

Female

Male

Female

15-24

25-29

Source: Eurostat LFS [lfsa_urgan]

The fact that the crisis hit mainly male-dominated economic sectors (such as the construction sector) contributed to the higher youth unemployment rate amongst young men (particularly for the 15-24 age group). Accordingly, in 2014, the unemployment rate for young men aged 15-24 is slightly higher than that for young women in the same age group (22.6 % and 21.2 % respectively).

At country level, the situation differs considerably. Moreover, important differences exist between young people aged 15-24 and those aged 25-29 (Figure 4-E). On average, the unemployment rate for young people aged 25-29 was 9.8 percentage points lower than the value for young people aged 15-24.

Figure 4-E: EU Youth Indicator: Unemployment rates for young people (aged 15-24 and 25-29), by country, 2014

a) 15-24 age group

EU youth indicator

<10 %

10-20 %

20-30 %

>30 %

Not available

Source: Eurostat LFS [lfsa_urgan]

b) 25-29 age group

EU youth indicator

<10 %

10-20 %

20-30 %

>30 %

Not available

Source: Eurostat LFS [lfsa_urgan]

The younger age group (those aged 15-24) is more affected by unemployment. For seven countries the unemployment rate for this age group is above 30 %. Among these countries, particularly high values are recorded in Greece and Spain, which in 2014 had youth unemployment rates for those aged 15-24 of 52.4 % and 53.2 % respectively. On the other hand, only three countries (Germany, Iceland, and Norway) had unemployment rates of below 10 % for young people aged 15-24.

As for the 25-29 age group, the unemployment rate exceeds 30 % in only three countries, Greece (40.8 %), Spain (30.3 %), and the former Yugoslav Republic of Macedonia (39.3 %). For thirteen countries the unemployment rate is below 10 %.

To better understand how the increases in unemployment rates registered in 2014 came about, it is necessary to examine the changes that occurred in the period immediately before, i.e. from 2011 onwards.

The most significant decrease in the unemployment rate among young people aged 15-24 between 2011 and 2014 is registered in Latvia, Lithuania, Estonia and Iceland. Conversely, for seven countries (Belgium, Croatia, Italy, Cyprus, Luxembourg, the Netherlands, and Slovenia) the change represented an increase of at least 24 %.

In Greece, Spain, Croatia, Italy, particularly Cyprus, and Portugal, the youth unemployment rate for the 15-24 age group was already very high in 2011. In these countries the situation for young people deteriorated over the three-year period, although at a slower pace.

The trend for young people aged 25-29 indicates changes of a greater magnitude in many countries. In this age group, the greatest reductions occurred in Estonia, Latvia, Lithuania and Hungary, while the highest increases were recorded in Greece, Italy, and Cyprus (+106 %). Large increases were also registered for Luxembourg and the Netherlands, but both countries had a very low unemployment rate in 2011 (and this is still the case in 2014).


Despite the changes shown over the 2011-2014 period, it should be pointed out that 2013 represented a turning point for almost all countries. Indeed, 25 countries in 2014 recorded a lower unemployment rate for young people aged 15-24 than in 2013 (apart from Finland, Italy, Luxembourg, Austria, Romania, the former Yugoslav Republic of Macedonia and Turkey). Similarly, 23 countries registered a lower unemployment rate in 2014 for the older age group (ages 25-29), in comparison with 2013.

Youth long-term unemployment

The employment situation for young people is further complicated by the phenomenon of long-term unemployment ( 5 ), which applies to an increasing proportion of young men and women.

In 2014, the youth long-term unemployment rate continued to be higher for young men (aged 15-24) than for young women in the same age group.

The youth long-term unemployment rate differs between age groups (15-19, 20-24 and 25-29 years). The EU28 average value for the youngest group (15-19 years) in 2014 was 5.8 %, corresponding to a 3.6 % increase in comparison with 2011 (5.6 %).

For young people aged 20-24, the long-term unemployment rate (EU28 average) increased from 6.5 % in 2011 to 7.7 % in 2014 (+18.5 %). For the 25-29 age group, the increase was from 4.9 % in 2011 to 5.9 % in 2014 (+ 20.4 %). The following analysis of youth long-term unemployment focuses on the older age groups (20-24 and 25-29 years).

In 2011, in both age groups, the proportion of long-term unemployed young men was higher than for young women (see Figure 4-F).


Figure 4-F: Long term youth unemployment rate, 20-24 and 25-29 age groups, EU28 average, 2011 and 2014

EU youth indicator

Male

Female

Male

Female

20-24

25-29

Source: Eurostat LFS [yth_empl_120]

The gender gap further increased over the three years in question. In 2011 the difference between unemployed young men and women was 1.2 percentage points for the 20-24 age group and 0.2 percentage points for the 25-29 age group; in 2014 these values were 1.4 and 0.5 percentage points respectively.

The EU28 average conceals variations across Europe in relation to this indicator (see Figure 4-G). In the 20-24 age group, high rates of long-term unemployment were recorded in Greece, Spain, Croatia, Italy and the former Yugoslav Republic of Macedonia.

From 2011, a dramatic increase was registered in Cyprus where the long-term youth unemployment rate for those aged 20-24 surged by 172.5 %. Greece, Italy and Portugal registered an increase equal to or higher than 70 %.

Young people aged between 25 and 29 have been particularly affected by long-term unemployment in Greece and in the former Yugoslav Republic of Macedonia, with values around 30 %. Since 2011, two-thirds of countries recorded an increase in long-term youth unemployment for this age group. The largest increases were registered in Greece (+86.8 %), Italy (+94.4 %), Cyprus (+313.6 %) and the Netherlands (+144.4 %).

On a positive note, significant reductions have been registered in the long-term unemployment rate of those aged 25-29 in Lithuania, Latvia, and Estonia. The three Baltic countries have markedly improved their labour market situation in the last three years, after several years of negative trends.

Figure 4-G: Long-term unemployment rates among young people (aged 20-24 and 25-29), by country, 2011 and 2014

a) 20-24 age group

b) 25-29 age group

Source: Eurostat LFS [yth_empl_120]

Youth unemployment and educational attainment

The youth unemployment rate in 2014 across the EU28 was much lower for young graduates from tertiary education than for those with the lowest levels of education.

The level of educational attainment is a relevant factor in young people's chances of success in finding work. Indeed, Figure 4-H suggests that the higher the education level completed, the lower the youth unemployment rate registered.

In 2014 the EU28 average unemployment rate was 10.5 % among the active population aged 25 to 29 years who had completed tertiary education (ISCED 5-8), and 12.1 % for those with only upper secondary education (ISCED 3-4). For young people aged 20-24, the youth unemployment rates are comparatively higher, but still show a stronger incidence of unemployment amongst those with a lower level of educational attainment.

However, from a comparative perspective, between 2011 and 2014 the EU28 average unemployment rate increased most amongst those young people (aged 25-29) who had completed tertiary education (+12.9 %).

Figure 4-H: Youth unemployment rate by the highest educational level attained, 20-24 and 25-29 age groups, EU28 average, 2011 and 2014

20-24

25-29

ISCED 0 - 2

ISCED 3 - 4

ISCED 5 - 8

Source: Eurostat LFS [yth_empl_120]

For data on educational attainment based on the EU Labour Force Survey (EU-LFS) the International Standard Classification of Education 2011 (ISCED 2011) is applied as from 2014. Up to 2013 ISCED 1997 is used.

For details see http://ec.europa.eu/eurostat/documents/1014465/6636845/EN-Implementation-ISCED2011.pdf  

Indeed, the economic crisis has affected young people attaining higher education too, especially in some European countries. Greece, Spain, Croatia, Italy, Cyprus, Portugal, and outside the EU, the former Yugoslav Republic of Macedonia have the highest youth unemployment rates among 25-29 year-olds with an ISCED 5-8 qualification (from 20.1 % for Portugal to 42.4 % for Greece) (Figure 4-I-a).

Figure 4-I-a: Unemployment rate for the 25-29 age group according to the highest educational level attained, by country, 2014

ISCED 0 - 2

ISCED 3 - 4

ISCED 5 - 8

Source: Eurostat LFS [yth_empl_090]

Moreover, the economic crisis has created a difficult challenge for young graduates in many countries: they often find themselves overqualified for the opportunities available in the labour market ( 6 ). This is grasped by Figure 4-I-b, showing the percentage changes in youth unemployment (young people aged 25-29) by education level. What emerges is that in a third of countries between 2011 and 2014, the youth unemployment rate increased more for those with a higher level of attainment (ISCED 5-8) than for those with a lower level (ISCED 0-2) (see also Section 4.4.1 which is devoted to the skills mismatch).

Figure 4-I-b: Changes in the youth unemployment rate of young people aged 25-29, by education level and by country, 2011 and 2014

ISCED 0 - 2

ISCED 3 - 4

ISCED 5 - 8

Note: For Cyprus end of the bar for ISCED 3-4 is not shown in the graph. The value is equal to 178.6 %.

Source: Eurostat LFS [yth_empl_090]


The largest increase for young people with low educational attainment (ISCED 0-2) is registered in Slovenia (79 %), while Cyprus has seen its youth unemployment rate for young people aged 25-29 increase more than in any other country over the period 2011-2014. The changes account for an increase of 178.6 % for young people with educational attainment at ISCED level 3-4 and 78.9 % for the more highly educated at ISCED level5-8.

Youth unemployment ratio

Youth unemployment ratios in the EU are much lower than youth unemployment rates; they have, however, also risen since 2008 due to the effects of the crisis on the labour market.

High youth unemployment rates reflect the difficulties faced by young people in finding jobs. However, many young people – in particular in the 15-24 age group – are still studying full-time and are therefore neither working nor looking for a job. In other words, they are economically inactive and not part of the total labour force figure which is used as the denominator for calculating the unemployment rate. For this reason, the youth unemployment ratio, which is an EU dashboard youth indicator, is used to show the proportion of unemployed youth in relation to the total youth population (employed, unemployed and inactive).

Figure 4-J shows the unemployment ratios for the 15-24 and 25-29 age groups in European countries in 2011 and 2014. Although the youth unemployment ratios are by definition much lower than youth unemployment rates, as they include economically inactive youth, they have, however, also risen since 2008 due to the effects of the crisis on the labour market ( 7 ). A positive sign is, however, represented by the decrease (-8 %) in the EU28 youth unemployment ratio registered between 2013 and 2014. This is the case for 26 countries, while only five countries recorded a further increase. The data analysis reveals how the situation in Europe differs greatly from one country to another.

In a few countries, unemployment affects only a small minority of the 15-24 age group, with ratios below or close to 6 %. This is true for the Czech Republic, Estonia, Germany, Luxembourg, Hungary, Austria, and Norway. The dual education system in some of these countries, which combines courses at school with company apprenticeships, helps to account for the low unemployment ratios among those aged between 15 and 24. At the other end of the spectrum, Spain continues to have the highest proportion of jobless young people in the 15-24 population (19 %), followed by eleven countries in which the unemployment ratio is above the EU28 average of 9.1 %.

Over the period 2011-2014, the situation has considerably worsened in Croatia (+28.6 %), Italy (+46.8 %), Cyprus (+66.7 %), Luxembourg (+42.9 %) and the Netherlands (+45.3 %). However, despite the recent increase, in Luxembourg and the Netherlands, youth unemployment ratios continue to be relatively low (below 7.1 %).

Figure 4-J: EU youth indicator: unemployment ratio of young people (aged 15-29), by age and by country, 2011 and 2014

a) age 15-24

EU youth indicator

b) age 25-29

EU youth indicator

Source: Eurostat LFS [yth_empl_140]

The unemployment ratio for young people aged 25-29 (Figure 4-J-b) in 2014 was higher than that recorded for those aged 15-24 in two-thirds of countries. The highest values in 2014 are registered in Greece (34.9 %) and the former Yugoslav Republic of Macedonia (31.3 %). Norway (4.7 %) and Germany (5.1 %) are the countries with the lowest youth unemployment ratio for the 25-29 age group.

From a comparative perspective, the situation during the period 2011-2014 worsened particularly in Greece (+39.6 %), Italy (+60.6 %), Cyprus (+101.1 %) and the Netherlands (+50.0 %).

A comparison between unemployment rates and ratios indicates a very difficult situation in Greece, Spain, Croatia, Italy, Cyprus and Portugal. Jobless young people in these countries constitute a relatively high proportion of both the entire labour force and the 15 to 24 age group.

Young people's confidence in finding a job

One young European in four is not confident that they be able to find a job when they finish education

This difficult youth labour market situation is well known by young people of different age groups and it has an impact on their confidence in finding a job once they have finished their education. A recent Eurobarometer ( 8 ) survey addressed also this issue (Figure 4-K). One respondent in four (24 % of the total participants) expressed concerns about finding a job after finishing their education (18 % 'Not very confident' and 6 % 'Not at all confident').

Figure 4-K: Young people's confidence in finding a job after finishing education, age group 15-29, EU 28 average, 2014

Notes: The question was 'How confident are you that you will find a job after finishing education?' Base: all respondents. Very confident; Fairly confident; Not very confident; Not at all confident; Don't know; Total 'Confident'; Total 'Not confident'.

Source: 2015 Flash Eurobarometer 408 – 'European Youth'.

Very confident

Fairly confident

Not very confident

Not at all confident

Don't know

When looking at country variations, those most affected by the current economic crisis have a relatively high percentage of respondents feeling 'not confident' in finding a job after finishing education. This is the case in Greece (67 %), Spain (61 %), Cyprus (48 %), and to a lesser extent, Italy (35 %). The highest percentages of people feeling 'very confident' are recorded in countries with very low youth unemployment rates. High levels of confidence are also registered in Estonia (40 %) and Latvia (40 %), two countries that had a severe crisis in 2010 but which have implemented important measures since ( 9 ).

An additional question in the Eurobarometer ( 10 ) (Figure 4-L) focused on the main concerns young people have when thinking about getting a job. For one respondent in three (31 %), 'not finding a long term contract or a stable job' is not among their main concerns. This response seems justified considering the increasing number of temporary contracts offered to young people in Europe in recent years (see Figure 4-P) as well as the high percentage of young people working on a part-time basis (see Figure 4-M and Figure 4-N).

Only 13 % of respondents considered 'lacking the right knowledge or skills' as an issue, while 16 % saw 'having to move to find a job' as a potential problem.


Figure 4-L: Young people's main concerns when thinking about getting a job, age group 15-29, EU-28 average, 2014

 %

Notes: The question was 'What would be your concerns when you think about getting a job? Firstly (main reason)? Base: respondents who are still studying. Not finding a long term contract or a stable job; Lacking the right knowledge or skills; Having to move to find a job; The level of salary; Other; I don't have any concerns; Don't know.

Source: 2015 Flash Eurobarometer 408 – 'European Youth'.

Not finding a long term contract or a stable job

Lacking the right knowledge or skills

Having to move to find a job

The level of salary

Other

I don't have any concerns

Don't Know

4.3.2. Working patterns of young employees

Young people are more likely to be employed on a temporary contract or on a part-time basis than older workers. Young people in Europe also tend to register higher rates of jobs with atypical and unusual schedules, including shifts and weekend or night-time work ( 11 ).

Working patterns among young people in Europe have been directly affected by the crisis ( 12 ). As a consequence, more young Europeans might begin their employment career with a traineeship or by taking on part-time or temporary employment contracts interrupted by periods of unemployment or further education and training, thereby moving frequently in and out of the labour market.

Part-time employment among young people

The part-time employment rate among young people aged 15-24 increased almost everywhere during the period 2011-2014

One characteristic of part-time contracts is that it allows young people to combine employment and education. The most recent Eurostat data for 2014 confirm the increasing trend registered over recent years in the proportion of the 15-24 age group working on a part-time basis ( 13 ).

In 2014, nearly one in three 15- to 24-year-olds in employment worked part-time (Figure 4-M). Huge differences exist between countries. Denmark, Ireland, Spain, the Netherlands, Slovenia, Finland, Sweden, the United Kingdom, Norway, and Iceland are the countries where part-time employment as a percentage of the total employment for young people is higher than the EU28 average (31.9 %). Conversely, Bulgaria, the Czech Republic, Latvia and Hungary have the lowest part-time employment rates for this group.

Similar patterns are also recorded for young people aged 25-29. Denmark and the Netherlands register the highest rates, while Bulgaria and Slovakia have the lowest. As a general rule, the part-time employment rate of those aged 25-29, for which the EU28 average is 17.0 %, is between two and three times lower than for younger people aged 15-24 (EU28 average 31.9 %).

Figure 4-M: Part-time employment rates for the 15-24 age group, by country, 2011 and 2014

Source: Eurostat LFS [yth_empl_060]

Between 2011 and 2014, the part-time employment rate among young people aged 15-24 increased almost everywhere. In Bulgaria, the Czech Republic, Croatia, Cyprus, Luxembourg, and Slovakia the increase was higher than 30 %.

In reading these data, it is important to bear in mind that part-time work among young people may imply apprenticeship either in the context of a vocational education programme or directly with an employer. Other reasons for choosing part-time work relate to the possibility of combining work and studies, and to accommodate family needs. In many cases, however, part time work is not a deliberate choice for young people.

Indeed, many young people work part-time because they cannot find full-time employment. Figure 4-N shows the high rates of involuntary part-time employment among the 15-24 and 25-29 age groups in several European countries.

Figure 4-N: Involuntary part-time employment as a percentage of total part-time employment for young people (15-29), by age and by country, 2011 and 2014

a) 15-24 age group

b) 25-29 age group

Source: Eurostat LFS [yth_empl_080]

Notes: For Bulgaria, Estonia, Croatia, Latvia, Lithuania, the Netherlands, Austria, Slovenia, Sweden, Iceland and Norway data have low reliability.

In Greece, Spain, France, Italy, Cyprus and Romania, at least one in two young people aged under 25 worked part-time because they had no other choice. In these countries, involuntary part-time work increased by at least 13 % from 2011 to 2014. Significant reductions were, conversely, registered in the Czech Republic, Germany, Malta and Iceland.

Involuntary part-time employment is higher among people aged 25-29 in all countries. The highest values are recorded in Greece, Italy, Cyprus and Spain, where two in three part-time workers aged 25-29 may be considered as being in involuntary part-time work.

By reading together Figure 4-M and Figure 4-N, it is appears evident that for some countries, which record by far the highest share of part-time workers (namely Denmark, the Netherlands and Norway), this it is not really an issue, because working part-time is a choice.

For the first time since 2011, more young men were in involuntary part-time work in 2014 than young women (Figure 4-O). The largest differences between young men and women are registered in Romania, the United Kingdom and the former Yugoslav Republic of Macedonia. Conversely, in France, the Netherlands and Finland, young women have a higher involuntary part-time work rate than men.

Figure 4-O: Involuntary part-time employment as a percentage of total part-time employment for young people (aged 15-24), by country and by sex, in 2014

Male

Female

Source: Eurostat LFS [yth_empl_080]

Temporary contracts for young people

Another characteristic of the youth labour market is the high percentage of temporary contracts ( 14 ) in comparison to other age categories. Temporary employment can be an important step in the transition from education into the labour market ( 15 ). It gives young people work experience and makes it easier to enter the labour market, and it provides stepping-stones to permanent jobs. Temporary employment also gives employers an opportunity to assess young people's suitability and capacity to perform the tasks required.

However, relatively high rates of temporary employment among young people can also be seen as an indication of career insecurity. Where this is the case, young people may lack the stability needed to allow them to live independently. They can be trapped in a cycle of alternating periods of temporary employment and unemployment, which may adversely affect their status into their thirties and beyond.

After having remained stable over the period 2011 and 2013, the percentage of young people aged 20-29 in temporary employment increased in 2014 (+2.4 % in comparison to 2011). Despite the relatively small change at EU level, at country level, some marked differences exist. Indeed, over the period 2011-2014, Bulgaria (+68.6 %), Cyprus (+48.9 %) and Slovakia (+48.7 %) registered the highest increases. At the other end of the spectrum, Estonia (-18.2 %) and Latvia (-36.5 %) recorded the most significant falls.

In 2014 (Figure 4-P), Spain, France, Croatia, Italy, the Netherlands, Poland, Portugal, Slovenia, Finland and Sweden had a very high percentage of young people aged 20-29 working under temporary contract (more than 30 %).

Figure 4-P: EU Youth Indicator: Young employees aged 20-29 with a temporary contract as a percentage of total number employees, by country, 2011 and 2014

EU youth indicator

Source : Eurostat LFS [yth_empl_050]

The difference at EU28 level for young men and women aged 20-29 with temporary contracts is small.

From a gender perspective, the difference at the EU28 level between the rate of young women and young men aged 20-29 with temporary contracts is not large (Figure 4-Q). However, more significant differences exist in some countries, and in the Czech Republic, Croatia, Cyprus, Lithuania, Finland, Sweden, and Norway, young women have a higher percentage of temporary employment than young men.

Figure 4-Q: Young employees aged 20-29 with a temporary contract as a percentage of total number employees, by country and by sex, 2014

Male

Female

Source : Eurostat LFS [yth_empl_050]

Atypical working hours for young people

In 2014, the proportion of employed young people in the 15 to 24 age group which had atypical working hours was much higher than for those aged 25-64. This was particularly true in the case of Saturday working (Figure 4-R).

Figure 4-R: Share of employees working atypical and asocial working hours, EU28 average, by age, 2014

Shifts

Saturday

Sunday

Evening

Night

Source: Eurostat LFS [lfsa_ewpshi] [lfsa_ewpsat] [lfsa_ewpsun] [lfsa_ewpeve] [lfsa_ewpnig]

There are important variations in these trends from one EU country to the next, in particular for shift work and working on public holidays. The countries where the largest proportions of young employees are doing shift work (over 40 %) are recorded in the Czech Republic, Croatia, Romania, Slovakia, and, outside the EU, in Iceland and the former Yugoslav Republic of Macedonia. Conversely, in Belgium, and Denmark, the corresponding proportion was below 10 %.

As for working on Saturdays, the highest percentages (over 50 %) are recorded in Ireland, Greece and the former Yugoslav Republic of Macedonia. Conversely, the lowest value is recorded in Portugal, where less than one young employee in ten (9.1 %) worked on Saturday.

4.3.3. Young entrepreneurs

Young people can be confronted with significant barriers in their efforts to turn ideas into projects. Such barriers often comprise social attitudes, lack of skills, inadequate entrepreneurship education, lack of work experience, insufficient capitalisation, lack of networks, and market obstacles ( 16 ).

Furthermore, a recent Eurobarometer survey ( 17 ) notes that for many young Europeans entrepreneurship does not constitute a possible response to the jobs crisis. Indeed (Figure 4-S), more than half of the respondents declared having no wish to start their own business (52 %). Just one in five (22 %) would like to start a business but considered it too difficult.

Only a quarter of young Europeans are more proactive about starting a business (5 % have done so, 17 % intend to do so in the near future and 3 % tried to start a business but gave up because it was too difficult) ( 18 ).

The highest percentage of respondents willing to become entrepreneurs is registered in Lithuania (32 % 'intend to start a business in the coming years') and Romania (33 %). Conversely, the lowest values are recorded in Germany (11 %) and Greece (11 %). The country with the lowest percentage of young people that have started a business is Ireland (only 2 %).

Figure 4-S: EU Youth indicator: Young people (aged 15-29) who would like to set up their own business, EU-28 average, 2014

Regarding the start-up of a business, which of the following is closer to your situation?

EU youth indicator

 %

Base: all respondents.

Source: Flash Eurobarometer of the European Parliament (EP EB395) on 'European Youth in 2014'.

You have started a business

You intend to start a business in the coming years

You would like to start a business, but you think it is too difficult

You tried to start a business, but gave up because it was to difficult

You do not want to start a business

Don't know

Eurostat data on self-employed ( 19 ) young people identify similar patterns. Indeed, as shown in Figure 4-T, the lowest percentages of self-employed young people among the employed population aged 20-24 are recorded in Germany (1.8 %), and Ireland (1.7 %). On the other side of the spectrum, Italy (11.8 %) and Romania (11.6 %) have the highest percentage of self-employed young people among the employed.

Regarding the 25-29 age group, Luxembourg (3.7 %) and Norway (4.2 %) have the lowest values, while Greece (16.3 %) and Italy (17.3 %) show the highest percentage of self-employed young people among those employed.

Figure 4-T: EU Youth Indicator: Self-employed rate of young people (aged 20-29), by age and by country, 2013

EU youth indicator

Source: Eurydice calculation on Eurostat data on self-employed young people [yth_empl_040]

4.4. Support for the transition to employment

4.4.1. Career guidance and skills forecasting

Young people have not only had to face higher unemployment since the onset of the economic crisis, but those who are in employment are also now more likely to accept jobs for which they are overqualified. 'Vertical mismatch' refers to the situation where there is a discrepancy between young people's education or skills and the level of education or skills required by their job ( 20 ). Such vertical mismatch can occur in terms of qualifications or skills, and over-qualification and over-skilling do not always go together ( 21 ).

Evidence indicates that younger workers, as new entrants into the labour market, tend to experience a higher degree of vertical mismatch ( 22 ); and this vertical mismatch in the EU is increasing. This is apparent in the collapse in the demand for low-skilled workers and in the greater number of highly educated people taking up jobs that are not commensurate with their qualifications. In parallel to this increase in over-qualified young people, recent research also points towards the danger of skill loss between generations, showing that in certain countries – particularly in Denmark, Sweden or the United Kingdom – younger cohorts have lower level of skills than their older peers, despite having to face a more competitive labour market requiring higher level of skills ( 23 ).

Figure 4-U depicts 'vertical mismatch' in terms of a qualification mismatch. The figure shows young people's qualifications in relation to their jobs as classified in the International Classifications of Occupations (ISCO ( 24 )). The over-qualification rate is defined as the percentage of young people (aged 25-34) with tertiary education occupying a post not regarded as necessitating a tertiary qualification (ISCO level 4 to 9).

Figure 4-U: Distribution of people with tertiary education (ISCED 5-6) aged 25-34 and employed in ISCO 1 or 2 (legislators, senior officials, managers and professionals), in ISCO 3 (technicians and associate professionals) and not in ISCO 1, 2 or 3, by country, 2013

ISCO 1 or 2

ISCO 3

25-29

Not in ISCO 1, 2 or 3

Notes: ISCO 0 (armed forces) and ISCO missing excluded.

Source: Eurostat LFS and additional collection for the other EHEA countries.

In the EU28, approximately a quarter of highly qualified young people aged 25-34 are overqualified for their job. In 2013, the countries with the highest over-qualification rates (above 30 %) were Bulgaria, Ireland, Greece, Spain, Cyprus and Turkey. By comparing these data with the unemployment rates discussed in Section 4.3, it emerges that those countries with the highest youth unemployment rates also show the highest over-qualification rates. This implies that when young graduates face difficulties in finding a suitable job matching their qualification levels, they are more likely to accept one with lower-level requirements.

Career guidance is an important service that can support young people facing a difficult transition to employment. Relying on skills forecasting, career guidance can potentially help in directing young people towards professions for which there is greater demand. In addition, career guidance can equip young people with the skills necessary to successfully search for a job.

Only one in four young Europeans report having used a career guidance service at some point.

Career guidance services are available in higher education institutions in almost all European countries ( 25 ). However, evidence from a recent Eurobarometer survey ( 26 ) suggests that a majority of respondents received no guidance during education. Indeed, only around one in four respondents (24 %) reported having used a career guidance service at some point. In many cases the reason behind this is the lack of access to services (45 % of all respondents).

4.4.2. High-quality traineeships

The extensive use of temporary employment contracts described in Section 4.3 goes hand in hand with the increased use of traineeships as a way for employers to assess the capabilities of new recruits before offering them permanent positions ( 27 ).

Traineeships provide important opportunities for young people to acquire the experience needed to find a job in the future. According to the Flash Eurobarometer 'The experience of traineeships in the EU' ( 28 ), around half of the respondents aged 18-35 report having had a traineeship (Figure 4-V) ( 29 ). The highest percentage was registered in Germany, Cyprus and the Netherlands. At the other end of the spectrum, the Czech Republic, Lithuania and Slovakia had the lowest percentages of respondents who reported having undertaken a traineeship.

Figure 4-V: Proportion of respondents (aged 18-35) who have completed a traineeship, by country, 2013

Note: The Question was: Have you ever had any of the following experiences…Traineeship? Base: all respondents.

Source: 2013 Flash EB378, ‘The experience of traineeships in the EU’.

Looking at the gender dimension, 49 % of female respondents have had a traineeship compared with 43 % of males. The highest number of respondents undertaking a traineeship belongs to the 25-29 age group (50 %), while only 43 % of respondents aged between 30 and 35 have done so.

Undoubtedly, one of the aims of traineeships is to provide young people with the skills needed to enter the labour market and to facilitate this process. The Eurobarometer asked, among other things, whether young people had learned things that were useful professionally during their most recent traineeship. The vast majority of respondents (89 %) agreed that they had learned useful things.

Furthermore, respondents were asked whether the traineeship had been or would be helpful in order to find a regular job. On average (EU27) the majority of young people (aged 18-35) with traineeship experience (71 %) believed this had been the case. The socio-demographic analysis of this data shows that gender, age, university graduation and education, occupation and time when the traineeship was completed, had no significant impact on the percentages recorded.

The majority of trainees were not offered an employment contract when they finished their most recent traineeship.

Unfortunately, a further Eurobarometer question revealed that the majority of trainees (71 %) were not offered an employment contract when they finished their most recent traineeship. In this case, gender data suggests that more men were offered an employment contract at the end of their traineeship than women (31 % versus 24 %).

Conditions of traineeships

The conditions under which traineeships were offered reveal interesting differences between countries. Over one third of young Europeans did not sign an agreement or contract with the hosting organisation that provided the traineeship (Figure 4-W(a)). A more positive aspect is, however, the percentage of young people covered by a health insurance during their traineeship (Figure 4-W (b)): according to the EU27 average, 76 % of the respondents reported being covered in the event of illness or accident.

Figure 4-W: Share of young people (aged 18-35) who signed a written contract and received health insurance during the traineeship, EU27 average, 2013

You signed a written agreement or contract
with the organisation or company

In the event of illness or accident,
you would have been covered by insurance

Base: respondents who had undertaken at least one traineeship.

Source: 2013 Flash EB378, 'The experience of traineeships in the EU'.

An additional question from the same Eurobarometer investigated whether respondents who had completed more than one traineeship had received financial compensation during one of these. Over two-thirds of respondents (67 %) had not received any compensation, while a third of respondents (32 %) had. Moreover, for 58 % of the respondents, the compensation they received was not sufficient to cover basic living costs such as rent, food, etc. (Figure 4-X). Only slightly more than two in five respondents (41 %) say the financial compensation they received had been sufficient.

Figure 4-X: Share of young people (aged 18-35) who received financial compensation during traineeships and whether it was sufficient to cover basic living costs, EU27 average, 2013

You received financial compensation

This financial compensation was sufficient
to cover basic costs such as rent, food, etc.

Base: respondents who had at least one traineeship.

Source: 2013 Flash EB378, 'The experience of traineeships in the EU'.

Figure 4-Y: Proportion of respondents (aged 18-35) who received a certificate at the end of their traineeship,  EU27 average, 2013

At the end of your traineeship the organisation or company gave you a certificate or a letter of reference describing what you had done

Base: respondents who had at least one traineeship.

Source: 2013 Flash EB378, 'The experience of traineeships in the EU'.

Finally, it is worth noting that not all trainees are awarded a certificate or reference at the end of a training period. Indeed, only 64 % of trainees reported that at the end of the traineeship, the organisation or company gave them a certificate or reference describing what they had done. For 34 % of the respondents, this was not the case
(Figure 4-Y).


4.4.3. Geographical career mobility

Geographical career mobility within the EU is an important dimension of the EU youth labour market. During the period 2009-2013, intra-EU movers were predominantly young people.

Indeed, young people aged 15-34 represented 63 % of all intra-EU movers, even though this age category only accounted for around 34 % of the labour force in the EU (average over 2009-2013). Within this broad age group, the youngest cohort (15-24) is the least represented. The majority of those relocating are young adults between 25 and 34 who move to another EU Member State to work ( 30 ).

Among its many findings, the Flash Eurobarometer survey 'European area of skills and qualifications' from 2014 ( 31 ) contains information on young people's experience of working or studying in another EU country and/or outside the EU.

According to this survey, less than one in ten respondents (8 %) aged 15-24 say they have spent time working in another EU Member State and/or outside the EU. This percentage is relatively low in comparison to older age groups – the highest being in the 25-39 age group at 20 %, with 13 % for the 55+ group.

The percentage of respondents aged 15-24 who have studied in another EU country or outside the EU is slightly higher (9 %) and more in line with figures for the older age groups (12 % for 25-39 year-olds, 9 % for those aged 40-54 and 5 % for the 55+ group).

Another Flash Eurobarometer ( 32 ) addresses the issue of traineeships abroad either in another EU country or elsewhere (Figure 4-Z). Approximately nine in ten of the respondents (89 %) had never undertaken a traineeship abroad.

Figure 4-Z: Proportion of young people (aged 18-35) who have had at least one traineeship abroad, by country, 2013

Note: the question was: Overall, how many traineeships have you had abroad? 0 stage, 1 stage, 2 stages, 3 stages, 4 stages. Base: all respondents.

Source: 2014 Flash EB378, 'The experience of traineeships in the EU'. Base: Those EU respondents who have had at least one traineeship.

Across the EU, respondents in Slovakia, Lithuania, the Czech Republic and Latvia are most likely to report that they had undertaken at least one traineeship abroad. Respondents are least likely to have had this experience in Greece, Spain, the United Kingdom, and Italy.

(1) () Eurofound 2014a, p. 4-5.
(2) () Eurostat, Labour Force Survey (LFS) data, online code: lfsa_egan and lfsa_ugan. Accessed on 28/04/2015.
(3) ()According to the definition provided by the ILO (International Labour Organisation) and used by Eurostat for collecting data, the economically active population comprises employed and unemployed persons. Inactive persons are those who are classified neither as employed nor unemployed. Those 'not in employment, education or training' (NEET) are not dealt with in this chapter. A full analysis of this very vulnerable group can be found in Chapter 5.
(4) ()The unemployment rate for a given age group expresses unemployed people in that age group as a percentage of the total labour force (both employed and unemployed). An unemployed person is defined by Eurostat, in accordance with ILO guidelines, as someone aged 15 to 74 (or 16 to 74 in Spain, Italy, the United Kingdom, Iceland and Norway) who is a) without work during the reference week; b) available to start work within the following two weeks (or has already found a job to start within the next three months), and c) who has actively sought employment at some time during the preceding four weeks.
(5) ()The long-term unemployment rate is the proportion of persons who have been unemployed for 12 months or more, in the total number of unemployed persons in the labour market.
(6) ()Eurofound 2011b.
(7) () See Eurostat, Unemployment statistics: http://ec.europa.eu/eurostat/statistics-explained/index.php/ Unemployment_statistics (accessed on 05/03/2015).
(8) () European Commission, 2015b.
(9) () European Commission, 2013a.
(10) () European Commission, 2015b.
(11) ()Eurofound, 2013a.
(12) () Ibid.
(13) ()As explained when defining full-time employment, the distinction between full- and part-time work is based on a spontaneous response by the respondent (except in the Netherlands, Iceland and Norway where part-time is used if the usual hours are fewer than 35 hours, and full-time if the usual hours are 35 hours or more; and in Sweden where this criterion is applied to the self-employed). It is not possible to establish a more precise distinction between full-time and part-time employment, since working hours differ between Member States and between branches of activity.
(14) ()A temporary contract is a fixed-term contract which will terminate if certain objective criteria are met such as the completion of an assignment or the return of the employee who has been temporarily replaced (Eurostat). 
(15) ()Eurofound, 2013b.
(16) ()OECD, 2012a.
(17) () European Parliament, 2014.
(18) () Ibid.
(19) () Eurostat definition: Self-employed persons are the ones who work in their own business, farm or professional practice. A self-employed person is considered to be working if she/he meets one of the following criteria: works for the purpose of earning profit, spends time on the operation of a business or is in the process of setting up his/her business.
(20) () The literature usually distinguishes between vertical and horizontal mismatch. The former occurs when there is a discrepancy between young people's education or skills and the level of education or skills required by their job. Horizontal mismatch refers to a situation where the worker has an adequate qualification level, but in a different field of study to that required by the job (Cedefop, 2010).
(21) ()See for example Flisi et al, 2014.
(22) () Cedefop, 2010.
(23) () Flisi et al, 2015.
(24) ()International Standard Classification of Occupations.
(25) ()European Commission/EACEA/Eurydice, 2014.
(26) () European Commission, 2014f.
(27) ()Eurofound, 2013b.
(28) () European Commission, 2014g. This survey interviewed EU citizens aged 18-35 about their experience with traineeships and the benefits they felt they had received from them.
(29) ()The question was 'I would like you to think about traineeships. Did you complete one or more traineeships either during or immediately after you completed your education?'
(30) () European Commission, 2014g.
(31) ()European Commission, 2014f.
(32) ()European Commission, 2014g
Top

Brussels, 15.9.2015

SWD(2015) 169 final

COMMISSION STAFF WORKING DOCUMENT

Situation of young people in the EU

Accompanying the document

Communication from the Commission to the European Parliament, the Council, the European Economic and Social Committee and the Committee of the Regions

Draft 2015 Joint Report of the Council and the Commission on the implementation of the renewed framework for European Cooperation in the youth field (2010-2018)

{COM(2015) 429 final}
{SWD(2015) 168 final}


5. SOCIAL INCLUSION

EU Youth Indicators

Average age of young people when leaving the parental household

Figure 5-A

At-risk-of-poverty or social exclusion rate for children and young people

Figures 5-B, 5-C and 5-D

At-risk-of-poverty rate for children

Figures 5-E and 5-F

Severe material deprivation rate for children and young people

Figures 5-H and 5-I

Children and young people living in households with very low work intensity

Figures 5-J and 5-K

Self-reported unmet needs for medical care

Figures 5-O and 5-P

Share of young people not in employment, education or training (NEET rate)

Figure 5-S and 5-T

5.1. Introduction

The economic crisis and the subsequent recession continue to have an impact on young people in terms of poverty and social inclusion. According to a recent Eurobarometer survey ( 1 ), the majority of young Europeans – especially in countries hardest hit by the economic recession – feel that young people have been marginalised by the economic crisis and are being excluded from economic and social life ( 2 ). Changing labour markets, increasing uncertainty ( 3 ) and high youth unemployment rates (see Chapter 4) influence many aspects of young people's lives including their levels of poverty and deprivation, their living conditions, their health and well-being (see Chapter 6), and even their political and cultural participation (see Chapters 7 and 9). All these aspects contribute to young people's feelings of social exclusion, especially amongst the most vulnerable groups.

This chapter focuses on the main indicators of social exclusion and poverty and examines the most recent trends. Given the importance of living arrangements in determining poverty levels, a distinction is made between young people living independently and those living with their parents. The chapter also examines some specific aspects of poverty and social exclusion including housing, access to health care and in-work poverty. Finally, the last section focuses on the groups most at risk of poverty and social exclusion: young people not in employment, education or training (NEETs), as well as young people from a migrant background.

Given how determining childhood poverty is for the risk of poverty later in life, for several indicators, the EU Dashboard covers both young people and children. The age breakdown used in the chapter for each of these groups reflects the available data provided by Eurostat. In most cases, the reference age groups are 0-16 for children and 15-29 for young people, although for a few indicators only, slightly different age ranges are provided. While an overlap is evident between the two age groups, the data currently available does not allow for further refinement.

5.2. Moving towards independence: young people leaving the parental home

Young people's lives are characterised by phases and episodes of transition towards independence: they move from education to work, and from living with and being supported by their families towards establishing their own household. As Chapters 3 and 4 have already described, this road towards independence is often bumpy, and usually takes many turns before leading to financial independence. As a result, young people are particularly vulnerable to social exclusion and poverty.

The risk of becoming poor is closely linked to a crucial move: leaving the parental home. In fact, moving out of the parental household is found to be the 'strongest predictor behind youth poverty' ( 4 ). Though moving out of the parental home might not be definitive for many (young people often 'boomerang' back to the parental household if they cannot afford to live independently), the timing of this move differs widely in European countries, influencing the social exclusion and poverty levels among young people.

Young people in northern and western Europe generally leave the parental home earlier than their peers from southern and eastern European countries.

On average, young Europeans leave the parental home around the age of 26 ( 5 ). However, as Figure 5-A depicts, there are substantial differences across European countries, as well as between young men and women. Regarding country differences, there is a clear north-west vs. south-east divide in Europe: young people in northern and western Europe generally leave the parental household earlier than their peers from southern and eastern European countries. The average age of leaving the parental home ranges from 19.6 years in Sweden to 31.9 years in Croatia ( 6 ). As was discussed in the 2012 Youth Report, such differences are partly cultural and partly linked to the economic environment, and have the effect of either encouraging young people to make an early start in independent living or persuading them to postpone this step ( 7 ).

Figure 5-A: EU youth indicator: Average age of young people when leaving the parental household, by country and by sex, 2013

EU youth indicator

Men

Women

Age 19 - 24.9

Age 25 - 27.5

Age 27.6 - 29.9

Age 30+

Source: Eurostat [yth_demo_030]

Common to all European countries, however, is that young women leave their parents earlier than young men, partly due to the fact that women starting to cohabit with their partners at an earlier age than men ( 8 ). The gender difference was 2.2 years on average in the EU-28 in 2013 ( 9 ). Differences between men and women are generally smaller in countries where young people tend to establish their own household earlier (only around seven months in Sweden, and around a year in Denmark and Luxembourg), in part because leaving home is not necessarily connected to moving in with a partner. Conversely, gender differences are greater in countries where young people arrive at the crucial point of establishing their own household later in their lives (the gap is almost five years in Bulgaria, Romania and Turkey and 8.4 years in the former Yugoslav Republic of Macedonia ( 10 )), and where leaving the parental household coincides more with moving in with a partner ( 11 ). In some countries in this group, young people tend to stay with their parents even after starting to cohabit with their partner ( 12 ).

Differences between countries in the average age of leaving the parental home also influences the poverty rates shown in the indicators, as they usually combine the data for both independent young people and those living with their parents, and, as will be shown later, moving out of the family home increases the risk of poverty for young people. For this reason, where possible, the next section will make distinctions between these two groups when comparing levels of poverty and social exclusion.

5.3. Levels of poverty and social exclusion

The main indicator of poverty and social exclusion is the composite indicator of 'at-risk-of-poverty or social exclusion'. This indicator is based on three sub-indicators of poverty: the at-risk-of-poverty rate; the severe material deprivation rate; and the rate of living in a household with very low work intensity. People at risk of poverty or social exclusion are defined as the proportion of the population that falls into at least one of the categories described by the three sub-indicators. While each of these sub-indicators will be defined and illustrated in the following sections, the analysis focuses first on the composite indicator.

The at-risk-of-poverty or social exclusion rate continues to rise for young people.

As Figure 5-B-a shows, on average in the EU-28, the at-risk-of-poverty or social exclusion rate for young people aged 15 to 29 (29.0 % in 2013) is higher than that for children under the age of 16 (27.3 %) or for the total population (24.5 %). Moreover, the at-risk-of-poverty or social exclusion rates in 2013 stopped increasing for both the total population and children (for children, there had even been small decrease between 2010 and 2011), but continued to rise for young people, widening the poverty gap between young people and the total population. This disparity is mostly due to an increasing proportion of young people living in households with very low work intensity – thus to rising levels of unemployment until 2013 (see Figure 5-J as well as Chapter 4). Within the group of young people, the at-risk-of-poverty or social exclusion rate was the highest for the 20 to 24 age group (31.5 %) in 2013 ( 13 ), since most young people complete education, enter the job market and strive to become independent at this age (see Chapter 3, Section 3.5).

On analysing the gender differences, Figure 5-B-b shows that young women are in a more difficult situation than men – partly because they move out of the parental household earlier – though their at-risk-of-poverty or social exclusion rates have shown a slight decline since 2012, while the rates for men have continued to increase.


Figure 5-B: EU youth indicator: At-risk-of-poverty or social exclusion rate, EU-28 average, 2010-2013

EU youth indicator

by age

15-29 year olds, by sex

%    %

%    %

Source: Eurostat, Statistics on income and living conditions (SILC) [yth_incl_010 and ilc_peps01]

Figure 5-C: EU youth indicator: At-risk-of-poverty or social exclusion rate for young people (aged 16-29), EU-28 average, by living arrangements and by age, 2013

EU youth indicator

%    %

Aged 16-19

20-24

25-29

Source: Eurostat, Statistics on income and living conditions (SILC) [yth_incl_030]


As discussed above, moving out of the parental household increases the risk of poverty for young people. Indeed, as Figure 5-C illustrates, the differences between young people living with their parents or living independently are substantial, especially in the younger age groups. In 2013, the gap between young people living with their parents or not was 39.0 percentage points in the 16 to 19 age group, 17.4 percentage points among 20 to 24 year olds, while it was only 2.5 percentage points in the favour independent young people in the oldest, 25 to 29 age group.

Other important factors influencing the risk of poverty or social exclusion of young people include their level of education (the more educated young people are, the lower their risk of poverty ( 14 )), or their immigrant status (see Section 5.5.2).


Figure 5-D shows differences across European countries in the at-risk-of-poverty or social exclusion rate. As the figure depicts, for children, the at-risk-of-poverty or social exclusion rate is the highest in Bulgaria, Hungary, Romania, the former Yugoslav Republic of Macedonia and Serbia, exceeding 40 % in all five countries, and even 50 % in Bulgaria and the former Yugoslav Republic of Macedonia. The proportion of young people (aged 15 to 29) at risk of poverty or social exclusion surpasses 40 % in Bulgaria, Greece, Romania and Serbia. The rates for children are the lowest in Finland and Norway; and for young people in the Czech Republic, the Netherlands, Austria, Slovenia and Iceland.

Figure 5-D: EU youth indicator: At-risk-of-poverty or social exclusion rate, by country and by age, 2013

EU youth indicator

%    %

Source: Eurostat, Statistics on income and living conditions (SILC) [yth_incl_010 and ilc_peps01]

Figure 5-D also illustrates the relatively more vulnerable position of young people in most European countries. Differences between the at-risk-of-poverty or social exclusion rates of young people and the total population are the largest in the Nordic countries, especially in Denmark and Norway, where the share of young people at risk of poverty or social exclusion is more than double that of the total population. This is partly because young people leave the parental home much earlier in this region than in other parts of Europe, thus putting themselves at greater risk. However, as will be discussed below, when taking into account only those not living with their parents, young people in these countries still face a higher risk of being in poverty.

5.3.1. The at-risk-of-poverty rate

The sub-indicator of the composite 'at-risk-of-poverty or social exclusion rate' that measures poverty in relative terms is the at-risk-of-poverty rate. For this indicator, a relative poverty threshold is defined at 60 % of the net median equivalised disposable income ( 15 ), and the population with income below this threshold is regarded as being at risk of poverty ( 16 ).

Given the differences across countries in the average age when young people leave the parental household, the at-risk-of-poverty rate can be misleading if used for international comparisons of 15-29 year-olds. For this reason, the Dashboard of Youth Indicators only considers the at-risk-of-poverty rate for children in comparison to the total population (Figure 5-E and 5-F). Nevertheless, it is still helpful to look at the at-risk-of-poverty rates across Europe for young people not living with their parents (Figure 5-G).

On average in the EU-28, the at-risk-of-poverty rate has been decreasing for children since 2010, and for the total population the increasing trend also reversed between 2012 and 2013 (Figure 5-E). Nevertheless, the average at-risk-of-poverty rate for the total population was still higher in 2013 than in 2010.

Figure 5-E: EU youth indicator: At-risk-of-poverty rate, EU-28 average, by age, 2010-2013

EU youth indicator

%    %

Source: Eurostat, Statistics on income and living conditions (SILC) [ilc_li02]

In the EU-28 on average and in the majority of European countries, the average at-risk-of-poverty rate is higher for children than for the total population (Figure 5-F). The exceptions are Denmark, Germany, Estonia, Finland and Norway, where children have a relatively lower risk of poverty. In 2013, the at-risk-of-poverty rate for children was highest in Bulgaria, Greece, Romania, the former Yugoslav Republic of Macedonia and Serbia, while it was lowest in the Czech Republic, Denmark, Finland and Norway. In contrast to the European trend, the at-risk-of-poverty rates for children grew by more than 3 percentage points between 2010 and 2013 in Greece and Hungary ( 17 ).

Figure 5-F: EU youth indicator: At-risk-of-poverty rate, by country and by age, 2013

EU youth indicator

%    %

Source: Eurostat, Statistics on income and living conditions (SILC) [ilc_li02]

In assessing the risk of poverty for young people, it is useful to examine the extent of the problem for those no longer living with their parents. Figure 5-G therefore includes young people aged 20 to 29 who have moved out of the parental household. This wider age group has been chosen to take into account the differences across Europe in the average age of leaving the parental home. However, it has to be kept in mind that young people aged 20 to 24 living independently are on average twice as likely to be at risk of poverty as their older peers aged 25 to 29 ( 18 ).

Figure 5-G: At-risk-of-poverty rate for young people (aged 20-29) not living with parents, by country, 2010 and 2013

%    %

Source: Eurostat, Statistics on income and living conditions (SILC) [yth_incl_060]

At-risk-of-poverty rates for young people not living with their parents are relatively high across the EU and, in the majority of countries, increased between 2010 and 2013.

In 2013, the highest risk of poverty for young people aged 20 to 29 not living with their parents was found in Denmark – more than 40 %; and the rate also exceeded 30 % in Greece and Norway. Though young people move out of the parental household at different ages in these countries, data still show that young people face much lower income levels than the total population if they choose to live independently. In contrast, the lowest risk of poverty amongst this group in 2013 (below 15 %) was found in the Czech Republic, Latvia and Slovakia.

When comparing the proportion of young people aged 20 to 29 living independently and at risk of poverty in 2010 and 2013, data show that in the EU-28 as well as in the majority of countries, this proportion increased in this period. The most significant increases took place in Croatia (6.5 percentage points), Hungary (5 percentage points), Portugal (9.2 percentage points) and Slovenia (5.6 percentage points).

5.3.2. Severe material deprivation

The severe material deprivation rate ( 19 ) complements the at-risk-of-poverty rate in two important respects. First, instead of defining a poverty threshold that varies between countries, it is based on a single European threshold. For this reason, it is a more absolute measure of poverty, and can capture the differences in living standards between countries. Second, while the relative poverty indicator is based on current income, the severe material deprivation rate takes non-monetary resources into account.

As with the indicators discussed above, in 2013, the severe material deprivation rate was the highest for young people (aged 15 to 29), followed by children (under 16 years of age), while the rate for the total population was lower than either sub-group. As Figure 5-H shows, after substantial increases between 2010 and 2012, material deprivation rates started falling across the board. This decline was the largest for children under 16, from 11.7 % to 11 %.

Figure 5-H: EU youth indicator: Severe material deprivation rate, EU-28 average, by age, 2010-2013

EU youth indicator

%    %

Source: Eurostat, Statistics on income and living conditions (SILC) [yth_incl_070 and ilc_mddd11]

Severe material deprivation rates vary considerably across European countries, ranging from below 1 % to over 40 %.

The severe material deprivation rate is higher for children and young people than for the total population also in the majority of European countries (Figure 5-I). In the EU-28 in 2013, the severe material deprivation rate was the highest in Bulgaria (exceeding 40 % for both children and young people), followed by Hungary and Romania (exceeding 30 % for the youngest age groups). Conversely, the proportion of both children and young people experiencing severe material deprivation was below 5 % in Luxembourg, the Netherlands, Finland, Sweden, Iceland and Norway.

Figure 5-I: EU youth indicator: Severe material deprivation rate, by country and by age, 2013

EU youth indicator

%    %

Source: Eurostat, Statistics on income and living conditions (SILC) [yth_incl_070 and ilc_mddd11]


5.3.3. Households with very low work intensity

Since unemployment influences poverty and social exclusion levels to a great extent, this section focuses on children and young people living in households with very low work intensity. This is the third sub-indicator of the main composite indicator of poverty or social exclusion. The indicator on persons living in households with low work intensity is defined as the share of the population living in a household having work intensity which equals or is below the threshold of 0.20 ( 20 ).

An increasing proportion of young people live in households with very low work intensity, showing the impact of rising youth unemployment rates.

Figure 5-J: EU youth indicator: Proportion of people living in households with very low work intensity, EU-28 average, by age, 2010-2013

EU youth indicator

%    %

Source: Eurostat, Statistics on income and living conditions (SILC) [yth_incl_100 and ilc_lvhl11]

The changes in the proportion of the population living in households with very low work intensity have not been consistent across the different age groups in recent years. For young people and the total population (people below the age of 60), the proportion has been increasing since 2008 ( 21 ). However, the rate for young people has been rising faster, to the extent that in 2012, the proportion of young people aged 15-29 living in households with very low work intensity reached the same level as that for the total population under 60 years of age (Figure 5-J). This shows the impact of rising levels of youth unemployment on the poverty levels of young people ( 22 ). In contrast, the share of children under the age of 18 living in households with very low work intensity decreased between 2010 and 2012 but started rising again in 2013.

Figure 5-K depicts the wide differences across Europe in the proportions of people living in households with very low work intensity. Different patterns exist regarding the relative position of children (aged under 18), young people and the total population under 60 years of age. In six countries, it is children who are in the most vulnerable position, (Bulgaria, Hungary, Malta, Slovakia, the United Kingdom and Iceland); while in eight others, it is young people aged 15 to 29 (Denmark, Germany, Ireland, Spain, France, Italy, Sweden, Norway). However, in 17 other countries, the proportions of both children and young people living in households with very low work intensity are lower than in the total population under the age of 60.

Figure 5-K: EU youth indicator: Proportion of people living in households with very low work intensity, by country and by age, 2013

EU youth indicator

%    %

Source: Eurostat, Statistics on income and living conditions (SILC) [yth_incl_100 and ilc_lvhl11]

The share of young people aged 15 to 29 living in households with very low work intensity is the highest in Ireland (26.4 %), followed by Greece (18 %), Spain and Serbia (17 %), and Denmark (15.3 %). This proportion is the lowest in Luxembourg, Romania and Iceland.

Nevertheless, given that this indicator is based on household composition, whether young people are living with their parents or not makes a difference. In most European countries, the proportion of young people living in households with very low work intensity is much higher for those not sharing a household with their parents. In 2013, in the 20 to 29 age group, the difference was greatest in Denmark, where the proportion of young people living in households with very low work intensity was 3.5 times higher for those living outside the family home than for those who were still living with their parents ( 23 ). Differences were also relatively large in Bulgaria, Croatia and Hungary. However, in twelve other countries, particularly in Greece, Spain and Serbia, the proportion of young people living in low-work intensity households was higher among those living with their parents than among those living independently.

5.4. Other aspects of poverty and social inclusion

Poverty and social exclusion are multi-dimensional phenomena which cannot be understood solely in terms of people's income. The other dimensions that should be taken into account include access not only to basic services such as housing and healthcare, but also to good, well-paid jobs. Limited access to these basic necessities forms part of the root cause of poverty and helps to explain how individuals and families become socially excluded.

Homelessness and housing exclusion represents one of the most extreme forms of poverty and deprivation in society today ( 24 ). One of the key challenges of the Europe 2020 strategy is to provide decent (in terms of quality and cost) housing for everyone. The cost and quality of housing is key to providing adequate living standards as well as promoting young people's well-being; however a shortage of adequate housing is a long-standing problem in most European countries ( 25 ).

Furthermore, limited access to healthcare contributes to deterioration in people's health and can have repercussions on their ability to work. The relatively high cost of medical examinations and treatments (both important aspects of healthcare) represents a barrier to individuals on low incomes obtaining healthcare and as such becomes a main driver of social exclusion.

Finally, when assessing poverty and social exclusion, it must be remembered that these phenomena do not only affect those who are economically inactive or unemployed. Indeed employment does not necessarily make the risk of poverty disappear. Consequently, young people's employment conditions should be looked at carefully, as in-work-poverty, that is poverty among the employed population, is a key indicator in understanding young people's susceptibility to poverty and social inclusion.

5.4.1. Housing conditions and homelessness

The cost and quality of housing are extremely important for living standards and well-being. Having access to decent housing and being part of a community is crucial if people are to realise their full economic potential and to contribute productively to society ( 26 ). However, most European countries continue to have a shortage of adequate housing for their population. Currently, there is no single definition of homelessness that is accepted in all EU Member States. In 2010, a range of stakeholders and the European Commission agreed on the European Typology of Homelessness and Housing Exclusion (ETHOS). This typology distinguishes four main concepts of homelessness: 'rooflessness', 'houselessness', 'insecure housing' and 'inadequate housing' ( 27 ). The attention in this section is on the last concept: inadequate housing.

A useful indicator to measure inadequate housing is the severe housing deprivation rate. Housing deprivation is a measure of poor amenities and is calculated by referring to those households with a leaking roof, no bath/shower and no indoor toilet, or a dwelling considered too dark. Severe housing deprivation is defined as the percentage of the population living in a dwelling which is considered as overcrowded whilst also manifesting at least one of the other shortcomings listed above ( 28 ).

The housing deprivation rate of young people aged 15-29 was 7.7 % in 2013 at EU-28 level. At country level, the severe housing deprivation rate among young people was the highest in Latvia (22.5 %), Hungary (24.4 %) and Romania (30.2 %). Conversely, Finland (1.3 %) and Belgium (1.5 %) recorded the lowest values (Figure 5-L).

Figure 5-L indicates a decrease (from 8.5 % to 7.7 %) in the housing deprivation rate among young people (15-29) in the EU between 2010 and 2013. Indeed, in two-thirds of countries, the rate fell between 2010 and 2013. The biggest reductions are recorded in Slovenia (10.3 percentage points), Estonia (6.5 percentage points) and Lithuania (6.0 percentage points); while the countries with the highest increase over the period are Denmark (4.1 percentage points), Italy (3.1 percentage points) and the Ireland (2.8 percentage points).

Figure 5-L: Severe housing deprivation rate for young people (aged 15-29), by country, 2010 and 2013

Source: Eurostat, Statistics on income and living conditions (SILC) [yth_incl_140]

The overcrowding rate, which focuses on the availability of sufficient space in the dwelling, can shed further light on the housing conditions of young people. The overcrowding rate is defined by the number of rooms available to the household, the household's size, as well as its members' ages and family situation ( 29 ).

In 2013, as Figure 5-M shows, the EU-28 average overcrowding rate for young people aged 15-29 was 26.6 %. In comparison to 2010, when the overcrowding rate of young people accounted for 27.2 %, the new rate in 2013 represents a small improvement.

The highest overcrowding rates for young people in 2013 were observed in Bulgaria (60.0 %), Hungary (62.4 %), Romania (69.1 %) and Serbia (67.9%), while the lowest were recorded in Belgium (3.0 %), Cyprus (4.1 %), and Malta (5.8 %). During the period between 2010 and 2013, important improvements were registered in Slovenia (-23.3 percentage points), Estonia (-23.1 percentage points) and Lithuania (-21.8 percentage points).

Figure 5-M: Overcrowding rate among young people (aged 15-29), by country, 2010 and 2013

Source: Eurostat, Statistics on income and living conditions (SILC) [yth_incl_150]

As explained in earlier sections, leaving the parental home and establishing a separate household is a crucial moment in young people's lives and has a strong influence on their risk of poverty (see Section 5.3.2). In this respect, housing costs have a significant impact on young people's living conditions. Given that young people have to face many hurdles in their transition from education to work (see Chapter 3), the question of affordable housing is becoming even more important.

The 'housing cost overburden rate' shows the percentage of the population living in households where the total housing costs ('net' of housing allowances) represent more than 40 % of disposable income ( 30 ). In 2013, 12.7 % of the EU-28 population aged 15-29 lived in households where they spent more than 40 % of their disposable income on housing (Figure 5-N).

Figure 5-N: Housing cost overburden rate for young people (aged 15-29), by country, 2010 and 2013

Source: Eurostat, Statistics on income and living conditions (SILC) [yth_incl_160]

The housing cost overburden rate for young people increased between 2010 and 2013.

The 'housing cost overburden rate' for young people aged 15-29 for the EU-28 rose in comparison to 2010. At country level, over the period between 2010 and 2013, the largest increases in the rate for the age group 15-29 are recorded in Greece (19.8 percentage points), Bulgaria (5.4 percentage points) and Portugal (5.2 percentage points).

A deeper analysis into age sub-groups reveals that the relative increase is much higher for young people aged 25-29 (+1.1 percentage points) than for the younger age group 20-24 (+0.2 percentage points). Maintaining their own household was the most burdensome for the younger age group, in Denmark (43.6 %), Greece (49.3 %), and Serbia (32.1 %). Also for the 25 to 29 year-olds, the housing cost overburden rate was the highest in Denmark (25.1 %), Greece (40.6 %) and Serbia (26 %). As was discussed above, Denmark and Greece are among the countries with the highest at-risk-of-poverty rates for young people not living with their parents (see Figure 5-G).

5.4.2. Access to health care

Another important aspect of social inclusion for young people is their access to health care. The self-reported unmet need for medical care is a good indicator with which to assess it. Accordingly, the self-reported unmet need for medical care was included among the EU youth indicators as a further pointer to social exclusion among young people.

In 2013, the proportion of young people aged 16 to 24 reporting unmet needs for medical examination (due to its being too expensive, having to travel too far, or as a result of waiting lists) was 1.5 % at EU-28 level (Figure 5-O). This value is around half the rate for the total population (3.6 %), and is due partly to young people having fewer health-related problems than older age groups (see Chapter 6).


Figure 5-O: EU youth indicator: Self-reported unmet needs for medical examination due to access barriers, by country and by age, 2013

EU youth indicator

%    %

Notes: Czech Republic: data not reliable for young people aged 16-24.

Source: Eurostat, Statistics on income and living conditions (SILC) [hlth_silc_03]

Figure 5-P: EU youth indicator: Self-reported unmet needs for medical examinations among young people (aged 16-24) because of barriers to access, EU-28 average, by sex, 2010-2013

EU youth indicator

%    %

Source: Eurostat, Statistics on income and living conditions (SILC) [ilc_iw01]

In the EU-28, the proportion of young people (aged 16-24) with unmet medical needs has on average been stable since 2010 (Figure 5-P). In 2013, the highest proportion of young people reporting unmet needs for medical examination was recorded in Latvia (4.9 %) and Iceland (4.7 %). Conversely, Spain (0.3 %) had the lowest proportion of young people reporting unmet needs for medical examination (Figure 5-O). Over the period 2010-2013, the biggest increases in the proportion of young people reporting unmet needs for medical examination were recorded in Estonia (3.0 percentage points) and Greece (2.1 percentage points).

The proportion of young people (aged 16-24) with unmet needs for medical care has been stable on average at the EU-28 level since 2010.

Between 2010 and 2013, young women reported higher levels of unmet medical needs than young men (Figure 5-P). In 2013, the proportion of young women aged 16-24 reporting unmet medical needs was 0.4 percentage points higher than the one recorded for young men in the same age group.

5.4.3. In-work poverty

Poverty among those of working age can reflect both labour market exclusion (not having access to jobs) and in-work poverty (being in employment, but not earning enough to make a living) ( 31 ). Given the difficulties for young people in the labour market (see Chapter 4), it is particularly important to examine the effect this has on their risk of poverty and social exclusion. The EU-28 average in-work at-risk-of-poverty rate for young people aged 15-29 in 2013 was 9.5 % (Figure 5-Q).

At country level, the highest in-work at-risk-of-poverty rates for young people aged 15-29 were recorded in Romania (21.4 %), Norway (16.7 %), and Greece (14.6 %). On the other side of the spectrum, Belgium (3.6 %), Czech Republic (2.5 %) and Slovakia (2.8 %) showed the lowest rates.

Figure 5-Q: In-work at-risk-of-poverty rate for young people (aged 15-29) by country, 2010 and 2013

Source: Eurostat, Statistics on income and living conditions (SILC) [yth_incl_130]

Over the period 2010-2013, the EU-28 in-work-at-risk-of-poverty rate for young people (aged 15-29) increased by 0.8 percentage points from 8.7 % in 2010 to 9.5 % in 2013. However, as Figure 5-R shows, the increase took place between 2010 and 2011; since 2011, the in-work-at-risk-of-poverty rate of young people has been falling in the EU-28. Nevertheless, the situation varies at country level: the in-work-at-risk-of-poverty rate for young people increased significantly in Greece (by 6.0 percentage points), Portugal (by 4.2 percentage points), and Romania (by 3.6 percentage points); while it decreased considerably in Denmark (by 7.1 percentage points), Lithuania (by 4.1 percentage points) and the Netherlands (by 2.3 percentage points).


From a gender perspective, the EU-28 average in-work at-risk-of-poverty rate was slightly higher for young men than women in 2013 (Figure 5-R). At country level, the highest gender gap in 2013 (where the rate for men was higher than for women) is recorded in Romania (7.1 percentage points) and Serbia (7.4 percentage points). However, for some countries the gender gap is reversed, with a higher in-work at-risk-of-poverty rate for women than men. This is case in Italy (3.2 percentage points higher for women than men), Lithuania (4.4 percentage points) and Iceland (4.8 percentage points) ( 32 ).


Figure 5-R: In-work at-risk-of-poverty rate for young people (aged 15-29), EU-28 average, 2010- 2013

%    %

Source: Eurostat, Statistics on income and living conditions (SILC) [yth_incl_130]

5.5. Groups at risk of social exclusion

After discussing the main poverty and social exclusion indicators as well as specific aspects of poverty, the last section of this chapter turns to specific groups of young people who are more vulnerable to poverty and social exclusion than others. Specific groups of young people most affected by poverty or social exclusion include women, lower educated young people and migrants ( 33 ). Since the situation of young women was discussed above, two groups of young people were selected for this section: young people who are not in employment, education or training (NEETs) and young people from a migrant background.

5.5.1. Young people not in employment, education or training (NEETs)

The indicator on NEETs aims to capture the predicament of a vulnerable group of young people in transition between education and the labour market. This transition between school and work is increasingly complex and individualised for today's young people (see Chapter 4). Those most at risk are young people having disabilities, coming from a migrant background, having a low level of education, living in remote areas, having a low household income, as well as young people with parents who experienced unemployment, have low levels of education or are divorced ( 34 ).

The difficulties faced in entering the labour market can lead to young people's disengagement from the world of work, making them vulnerable to social exclusion. The NEET group therefore includes not only the conventional unemployed job-seekers, but also those who are disengaged from both education and work and are therefore not looking for a job ( 35 ). Being economically inactive, nevertheless, does not always imply disengagement: NEETs also include those unavailable for work (e.g. young carers or those who are sick or disabled), the 'opportunity-seekers' (those who are waiting for better opportunities), and the 'voluntary NEETs' (those who choose to be inactive while travelling or engaging in activities such as arts or self-directed learning) ( 36 ). Yet, by not accumulating the human capital needed for work, even these last three subgroups are at risk of future social exclusion ( 37 ).

Following increases up to 2012, small decreases in the share of NEETs were recorded in 2013 and 2014, mainly due to the decline in the share of unemployed NEETs between 2013 and 2014.

After a steady rise in NEET rates of those aged 15-24 in the EU-28 from 2009 due to the economic crisis ( 38 ), the NEET rate reached its peak of 13.1 % in 2012 and then started to decline (Figure 5-S). As Figure 5-S-b shows, this small decrease is due to a decline in the share of unemployed NEETs between 2013 and 2014, and, to a lesser degree, of inactive young people. In addition, looking at the educational background of NEETs reveals that, over the four years considered, the gap between young people with low levels of education and their peers with medium to high levels of education has widened to the disadvantage of the latter group (see Figure 5-S-d).

In general in the EU-28, NEET rates are higher for women than for men (Figure 5-S-a). However, women are also the group for which the decline in the share of NEETs has been more relevant. Countries show great variation in regard to gender differences: NEET rates are actually higher for men in about half of EU-28 countries. Within the EU-28, differences between women and men exceed three percentage points in the Czech Republic, Hungary, Malta and Romania on the one hand (with higher NEET rates for women), and in Croatia, Cyprus, Luxembourg and Finland on the other hand (with higher NEET rates for men) ( 39 ). With the exception of Malta, countries in the first group have periods of parental leave that are among the longest in Europe ( 40 ), which can partly explain the relatively high share of inactive young women. Outside the EU-28, gender differences are the largest in Turkey, where NEET rates for women are exceptionally high (35 %, in contrast to the 14.6 % NEET rate for men), due to their very high inactivity rate ( 41 ).


Figure 5-S: EU youth indicator: Proportion of young people (aged 15-24) not in employment, education or training (NEET rate), EU-28 average, 2011-2014

a) by sex

b) by labour market status

%    %

%    %

EU youth indicator

c) by attitudes towards work

d) by educational attainment

%    %

%    %

Source: Eurostat LFS [yth_empl_150 and yth_empl_160]

Looking at the differences between countries reveals that in 2014, NEET rates were the highest Bulgaria, Italy, the former Yugoslav Republic of Macedonia and Turkey, all exceeding 20 % (Figure 5-T). On the other hand, NEET rates were around 6 % or below in Denmark, the Netherlands, Iceland and Norway.

Between 2011 and 2014, NEET rates increased by more than 30 % in Luxembourg, the Netherlands and Slovenia (although from a relatively low level) and by more than 20 % in Croatia and Finland, with Croatia registering quite high proportions of NEETs in 2014 (19.3 %). In contrast, NEET rates decreased by more than 15 % in Ireland, Latvia, Lithuania, the United Kingdom and Turkey in this period (Figure 5-U).

Figure 5-T: EU youth indicator: Proportion of young people (aged 15 to 24) not in employment, education or training (NEET rate), by country, 2011 and 2014

EU youth indicator

%    %

Notes: Break in series: France (2013)

Source: Eurostat LFS [edat_lfse_20]

5.5.2. Young people from a migrant background

Figure 5-U: At-risk-of poverty or social exclusion rate of young people (aged 16-29) by country of birth, EU-28 average, 2010-2013

%    %

Source: Eurostat [yth_incl_020]

Migrants and ethnic minorities are among the groups most vulnerable to poverty and social exclusion. They usually face multiple disadvantages leading to persistent poverty and a marginalised position in society. As the 2012 EU Youth Report pointed out, immigrants often lack the social capital (networks and information) needed for being fully included in society ( 42 ). As a result, migrants tend to be more at risk of poverty and social exclusion than the native-born population.

Figure 5-U shows the at-risk-of-poverty or social exclusion rates of foreign- and native-born young people. The differences between these two groups are telling: foreign-born young people are considerably more likely to be at risk of poverty or social exclusion than native-born youth in the EU-28 (43.8 % vs. 28.1 % in 2013). Nevertheless, while the rate for native-born young people has continued to grow since 2010, it has slightly declined since 2011 for their foreign-born peers.

The greater risk of poverty or social exclusion for young immigrants is evident in almost all European countries (Figure 5-V). The risks for immigrant youth are especially large in Belgium, Austria and Slovenia, where the share of foreign-born young people who are at risk of poverty or social exclusion is about three times as high as for native-born youths. The smallest gaps in the poverty risk between native- and foreign-born youth are registered in the Czech Republic, Denmark, Ireland, Malta and the United Kingdom. Though the reliability of the data on foreign-born young people is open to question, Hungary appears to be the only country where native-born young people are more vulnerable to the risk of poverty or social exclusion than the foreign-born, mostly due to the composition of the foreign-born population ( 43 ). The at-risk-of-poverty or social exclusion rates of foreign-born youth are highest in Greece (72.3 %), Belgium (52.9 %), Spain (53.9 %), and Finland (50 %).

Figure 5-V: At-risk-of poverty or social exclusion rate of native- and foreign-born young people (aged 16-29), by country, 2013

%    %

Foreign-born

Native-born

Notes: Data on foreign-born young people: Data not reliable and not publishable for Bulgaria, Lithuania, Poland, Romania and Slovakia. Data not reliable for Estonia, Latvia and Hungary.

Data on native-born young people: Serbia: not reliable and not publishable.

Source: Eurostat [yth_incl_020]

The situation looks similar when looking at second generation immigrants – the children of foreign-born parents. As Figure 5-W shows, the children of foreign-born parents are almost twice as likely to be at risk of poverty as the children of native-born parents in the EU-28 (31.1 % vs. 17.8 %). In addition, in contrast to the trends described above for young people, while the at-risk-of-poverty rates for children from native-born families decreased between 2010 and 2013, they increased slightly for the children of foreign-born parents ( 44 ).

The risk for immigrant children is the largest again in Belgium, but it is also high in Denmark and Sweden, where the proportion of children from foreign-born families who are at risk of poverty is more than three times as high as the relevant share of the children of native-born parents. Conversely, in Hungary and Iceland, children from foreign-born families are at lower risk of poverty than children from native-born families. The at-risk-of-poverty rates of immigrant children are the highest in Greece (52.7 %), Spain (46 %), France (37.8 %) and Croatia (37.2 %), while they are lowest in Hungary (9.6 %) and Iceland (11.1 %).


Figure 5-W: At-risk-of poverty rate of children (aged 0 to 17 years) by parental origin and by country, 2013

%    %

Foreign-born

Native-born

Notes: Data on children with foreign-born parents: EU-28 average: estimate. Data not reliable and not publishable for Bulgaria and Romania. Data not reliable for Poland and Slovakia.

Data on children with native-born parents: Serbia: not applicable.

Source: Eurostat, Statistics on income and living conditions (SILC) [ilc_li34]

Given the trans-generational transmission of poverty, children from poor families are also more likely to stay in poverty when they become adults ( 45 ). Immigrant children and those from poorer families are more likely to leave school early and have fewer chances to attain higher education qualifications ( 46 ), leading to further disadvantages in their working lives. Therefore, special attention must be paid to the issue of educational integration for young people from immigrant families.

(1) () Flash Eurobarometer of the European Parliament (EP EB395) on the 'European Youth in 2014'.
(2) () European Parliament, 2014.
(3) () On inequalities and marginalisation among young people in ten European cities, see the 'CITISPYCE' project: http://www.aston.ac.uk/lss/research/research-centres/interland/citispyce/ .
(4) () Aassve et al. 2007, p. 331.
(5) () EU-28 average. Source: Eurostat [yth_demo_030].
(6) () Ibid.
(7) () European Commission, 2012a.
(8) () Iacovou, 2011.
(9) () Source: Eurostat [yth_demo_030].
(10) () Ibid.
(11) () Iacovou, 2011.
(12) () Ibid.
(13) () Source: Eurostat SILC [yth_incl_010].
(14) () Source: Eurostat SILC [ilc_peps04].
(15) () The equivalised disposable income is the total income of a household, after tax and other deductions, that is available for spending or saving, divided by the number of household members converted into equalised adults; household members are equalised or made equivalent by weighting each according to their age, using the so-called modified OECD equivalence scale (Eurostat, 2015b).
(16) () Eurostat, 2015c.
(17) () Source: Eurostat SILC [ilc_li02].
(18) () 2013. Source: Eurostat SILC [yth_incl_060].
(19) () The severe material deprivation rate is defined as the percentage of the population that cannot afford at least four of the following nine pre-defined deprivation items: 1) to pay their rent, mortgage or utility bills, 2) to keep their home adequately warm, 3) to face unexpected expenses, 4) to eat meat or proteins regularly, 5) to go on holiday, or to buy a: 6) TV, 7) refrigerator, 8) car, or a 9) telephone (Eurostat, 2015d).
(20) () The work intensity of a household is the ratio of the total number of months that all working-age household members have worked during the income reference year and the total number of months the same household members theoretically could have worked in the same period (Eurostat, 2015e).
(21) ()European Commission, 2012a.
(22) () As the chapter on Employment and Entrepreneurship showed, youth unemployment rates started declining after 2013. However, poverty and social exclusion data are only available up to 2013.
(23) () Source: Eurostat SILC, [yth_incl_120].
(24) () European Commission, 2010a.
(25) () Eurostat, 2015f.
(26) () European Commission, 2013c.
(27) () On ETHOS (Typology on Homelessness and Housing Exclusion), see http://www.feantsa.org/spip.php?article120&lang=en , accessed on 23/03/2015.
(28) ()Eurostat, 2015g.
(29) () Eurostat, 2015h.
(30) ()Eurostat, 2015i.
(31) ()European Commission, 2014b.
(32) () Eurostat, (SILC) [yth_incl_130].
(33) ()Eurostat, 2015j.
(34) () Eurofound 2012, p. 55-56.
(35) () Ibid, p. 23.
(36) () Ibid, p. 24-25.
(37) () Ibid.
(38) () European Commission, 2012a.
(39) () Source: Eurostat LFS [yth_empl_150].
(40) () European Commission/EACEA/Eurydice/Eurostat 2014, p. 37.
(41) () Source: Eurostat LFS [edat_lfse_20].
(42) () European Commission 2012a, p. 213-214.
(43) () On the typology of countries with respect to the type of migration inflow, see OECD, 2014a.
(44) () Source: Eurostat SILC [ilc_li34].
(45) () See e.g. Bellani and Bia, 2013.
(46) () European Commission/EACEA/Eurydice, 2015.
Top

Brussels, 15.9.2015

SWD(2015) 169 final

COMMISSION STAFF WORKING DOCUMENT

Situation of young people in the EU

Accompanying the document

Communication from the Commission to the European Parliament, the Council, the European Economic and Social Committee and the Committee of the Regions

Draft 2015 Joint Report of the Council and the Commission on the implementation of the renewed framework for European Cooperation in the youth field (2010-2018)

{COM(2015) 429 final}
{SWD(2015) 168 final}


6. HEALTH AND WELL-BEING

EU Youth Indicators

Share of daily smokers

Figures 6-B and 6-C

Last 12 months prevalence of cannabis use

Figure 6-E

Death by intentional self-harm

Figures 6-N and 6-O

6.1. Introduction

Young people in Europe have higher levels of life satisfaction and report a higher frequency of 'being happy' than older age groups ( 1 ). Nevertheless, difficulties in their transition to adulthood and independence have an influence on their health and well-being. Vulnerable groups of young people facing unemployment, poverty or social exclusion can especially experience more serious problems in their physical and mental health. For this reason, it is necessary to pay attention to young people's state of health, particularly in the current economic climate.

This chapter examines firstly the general health of young people; it then looks at recent trends in their susceptibility to 'risk behaviour' in terms of smoking, drug and alcohol use, sexual behaviour and physical inactivity. The last section addresses young people's mental well-being. Since the publication of the last EU Youth Report ( 2 ), no updates have been published on the EU youth indicators on obesity, drunkenness, road accidents and psychological distress; hence, no new analysis is provided on these indicators in this chapter ( 3 ). Therefore, in order to show progress, where possible, some of these issues are broached in relation to other indicators.

6.2 Young people's state of health

Young people are not only more satisfied with their life than older age groups, but they also feel healthier. As Figure 6-A-a shows, the proportion of young people aged 16 to 24 in the EU-28 who perceive their health to be 'bad' and 'very bad' is 8.4 percentage points lower than for the general population.

Differences between the proportion of young people and the total population feeling 'bad' and 'very bad' are especially wide in Estonia, Latvia, Lithuania, Portugal, Montenegro and Serbia, while they are narrowest in Ireland and Sweden. The proportion of young people feeling to be in 'bad' and 'very bad' health is the highest in Denmark (2.4 %), France (2.3 %), Latvia and the United Kingdom (2.6 %) and Norway (2.7 %), while the lowest in Greece and Spain (0.5 %) and Malta (0.4 %).

However, though the share of young people perceiving to be in 'bad' and 'very bad' health is quite low, there has been a 0.3 percentage points increase in this proportion in the EU-28 since 2010 (Figure 6-A-b). The largest increases took place in France (1.0 percentage points) and the United Kingdom (1.4 percentage points). On the other hand, the share of young people in bad and very bad health decreased substantially in Denmark and Slovenia (by 1.3 percentage points) and Portugal (by 1.4 percentage points).

Figure 6-A: Self-perceived health: feeling 'bad' and 'very bad', by country and by age

a) by age, 2013

%    %

Aged 16-24

Total population

Source: Eurostat, Statistics on income and living conditions (SILC) [hlth_silc_01]

b) young people (aged 16-24), 2010 and 2013

%    %

Notes: Data on young people aged 16-24 are not reliable and not publishable for the Czech Republic (2013) and Croatia (2010 and 2013). Data are not reliable for the Czech Republic (total population), Estonia (young people, 2010 and 2013), Croatia (total population), Lithuania (total population and young people, 2010 and 2013), the United Kingdom (young people, 2013), and Serbia (total population and young people, 2013).

Data on young people feeling 'very bad' are not available for Ireland (2010), Lithuania (2010), Malta (2010 and 2013), the Netherlands (2010), Finland (2010) and Iceland (2013. In these cases, data displayed on the figure is the proportion of young people reporting to feel 'bad'.

Source: Eurostat, Statistics on income and living conditions (SILC) [hlth_silc_01]

6.3 Health risks

Youth transitions are becoming longer, more complex and more individualised. This impacts on health-related behaviours and has long-term consequences for young people's health.

Despite their generally good health, young people are more prone to risk behaviour than older age groups. Risk behaviours such as smoking, alcohol consumption, drug use, physical inactivity and unsafe sexual practices often cluster together and reinforce each other ( 4 ). They are all influenced by the same social factors: the level of deprivation and social exclusion, access to education, as well as the family, school and living environment ( 5 ). Moreover, these behaviours do not only have a strong influence on young people's health and well-being at the time they occur, but also have life-long effects ( 6 ).

Young people are the most vulnerable to risk behaviours when their life is in transition ( 7 ). As has been discussed in earlier chapters, young people undergo various transition periods as they grow up: from childhood to adolescence, from education to work, and from living with their parents to living with their peers or alone. In this context, barriers to accessing higher levels of education, leaving school prematurely, long periods of unemployment or insecure housing situations all increase the probability of young people engaging in risk behaviours ( 8 ). Moreover, as was shown in Chapters 4 and 5, these transition periods are becoming longer and more complex, thus increasing young people's vulnerability ( 9 ).

This section provides an overview of the behaviours that may put young Europeans' health at risk. Yet, it has to be noted that data are often limited to only a few countries, or are based on surveys for which no time series is available. This hampers the possibility to make comprehensive comparisons across European countries and through time. Nevertheless, this section provides an analysis based on the most up-to-date comparative data in the relevant fields.

6.3.1. Smoking

Smoking is a well-known health risk and is the leading cause of preventable death ( 10 ). However, as Figure 6-B-a shows based on data from 2012 and 2013, a relatively large percentage of young people aged 15 to 24 still smoke daily in European countries, especially in the Czech Republic (33.2 %) and France (27.9 %). These are also the two countries with available data where young people smoke more than older age groups. Young men are particularly prone to daily smoking – with more of them smoking on a daily basis than young women in all countries with available data (Figure 6-B-b). Nevertheless, gender differences are quite small in most Nordic countries (Denmark, Sweden, Norway and Iceland) and Luxembourg; whereas almost six times more young men than young women smoke daily in Turkey.

Figure 6-B: EU youth indicator: Share of daily smokers, by country and by age, 2012/2013

a) by age

EU youth indicator

%    %


b) Share of daily smokers among young people (aged 15-24), by sex

EU youth indicator

%    %

Notes: CZ, EE, FR, NL, SI, FI, SE, TR: 2012; DK, IT, LU, NO, IS: 2013

Source: OECD Health Statistics

The proportion of young people smoking daily has been in decline since the early 2000s, though not in all countries.

The proportion of people who smoke daily has been steadily decreasing since the beginning of the 2000s in almost all European countries with available data (Figure 6-C), pointing towards the effectiveness of anti-smoking campaigns and smoke-free legislation ( 11 ). Countries registering the greatest decreases in the proportion of young people who smoke daily between 2002 and 2013 are shown on Figure 6-C-a: they are Luxembourg and Norway, with a fall of around 23 and 19 percentage points respectively, followed by the Netherlands, Finland and Iceland. In Luxembourg, Norway, Finland and Iceland, the proportion is now below 15 %. On the other hand, the countries where the proportion of young people smoking daily has remained relatively stable (with a decrease of less than 6 percentage points) are Estonia, France, Italy and Sweden, though France registered a recent increase of 2.3 percentage points between 2010 and 2012 (depicted on Figure 6-C-b).

Among the countries with available data, the only country where the proportion of young people smoking daily has been on the rise since 2002 is the Czech Republic (Figure 6-C-b). This increase has been especially striking in the case of women: the proportion of young female smokers in 2012 was almost the double of the same ratio in 2002 ( 12 ). Differences between the smoking trends of women and men have also been registered in Estonia and Sweden. In Estonia, the proportion of young women smoking daily has been increasing since 2002; while in Sweden, the proportion of young men smoking daily was growing in this period ( 13 ).


Figure 6-C: EU youth indicator: Share of daily smokers among young people (aged 15-24), by country, 2002-2013

EU youth indicator

a)

b)

%    %

%    %

Notes: EE, FR: data not available for 2003, 2005, 2007, 2009 and 2011; IT: data not available for 2004.

Source: OECD Health Statistics

This decreasing trend is also confirmed by a recently released Eurobarometer survey on the attitudes of European towards tobacco ( 14 ). In comparison to previous surveys, the proportion of smokers (not daily smokers, but smokers in general) decreased in almost all EU-28 countries ( 15 ). However, no data on young people are available by country in these Eurobarometer surveys.

6.3.2. Alcohol consumption

Alcohol is the most consumed psychoactive substance ( 16 ). Despite its links with health problems, unsafe sex and violent behaviour, young people do not perceive the occasional drink as a health risk: 77 % of respondents in a recent Eurobarometer survey believed that drinking alcohol once or twice poses 'no risk' or only a 'low risk' ( 17 ). Nevertheless, regular drinking was perceived differently: 57 % of young respondents thought that regular alcohol consumption posed a high risk to their health ( 18 ). However, the limits between drinking 'once or twice' and 'regularly' are often drawn arbitrarily and can become blurred.

This section relies on the indicator on the last month prevalence of alcohol use among young people ( 19 ), based on national survey data collected by the European Monitoring Centre for Drugs and Drug Addiction (EMCDDA). This indicator has to be treated with caution, since it does not distinguish between occasional and regular drinking; neither does it indicate the amount of alcohol drunk on any occasion. Nevertheless, past surveys suggest that young people are less likely to drink daily and more likely to drink 5 or more drinks (heavy episodic or binge drinking) once a week than people above the age of 55 ( 20 ).

Figure 6-D-a confirms the widespread consumption of alcohol by young Europeans. In almost all countries with available data, more than 50 % of young people (and people from older age groups) reported having drunk alcohol in the past month. Alcohol consumption is slightly less prevalent in Portugal and Romania, where just over 40 % of young people aged 15-24 drink regularly (at least once in the past month), and very low in Turkey, where only 12 % of young people reported drinking alcohol in the month before the data collection. In contrast, drinking alcohol is the most widespread – with more than 70 % of young people reporting recent alcohol consumption – in Germany, Estonia, Cyprus, the Netherlands and Slovenia.

Different patterns of alcohol consumption are evident across Europe. In about a third of countries with available data, consumption increases with age; in another third, the 15-34 age group is the most prone to regular drinking; and in the final third of countries, consumption decreases with age. Countries in this latter group – where young people drink more than older age groups – are Italy, Cyprus, Hungary, Austria, Slovenia and Turkey.

As with smoking, drinking alcohol is more of a habit among men than women ( 21 ). As Figure 6-D-b depicts, with the exception of the Czech Republic and Norway, alcohol consumption is higher among men than women in all countries with available data. Differences between the sexes are the widest in Turkey, followed by Romania, Bulgaria and Portugal; while they are narrowest in the Czech Republic, Lithuania, Finland and Norway.

Figure 6-D: Last month prevalence of alcohol use, by country and by age, year of the last available national survey

a) by age

%    %

Aged 15-24

Aged 15-34

Aged 15-64

b) Last month prevalence of alcohol use of young people (aged 15-24), by sex

%    %

Men

Women

Notes: EL: 2004; HU: 2007; AT, EE: 2008; NL: 2009; RO, SK, FI: 2010; IE, ES, LV, TR: 2011; BG, CZ, DE, HR, IT, CY, LT, PT, SI, NO: 2012 - Source: EMCDDA.

6.3.3. Drug use

Young people – especially in adolescence – are particularly vulnerable to substance use and substance use disorders ( 22 ). As mentioned above, the insecurity experienced in this transition period, together with factors such as the experience of deprivation, an insecure family environment or peer pressure all increase the likelihood of risk behaviour.

This section focuses in the first place on cannabis, the most popular drug used by young people aged 15 to 24 ( 23 ). It also examines data on 'legal highs': new synthetic psychoactive substances that imitate the effects of illicit drugs, but, as yet, are still legal or not controlled. According to the EMCDDA, although the use of such legal highs is still relatively low in Europe, they are growing rapidly. In addition, though they are not perceived as such (see Figure 6-G), accessing them is fairly easy, since they are available online ( 24 ).

According to the 2014 Eurobarometer survey on drugs, in comparison to alcohol, fewer young people think that using cannabis once or twice poses 'no risk' or only a 'low risk' to health, but this proportion is still relatively high, 50 % ( 25 ). A majority of respondents (63 %) thought that regular cannabis use posed a high health risk (as discussed above, the same percentage for alcohol was 57 %) ( 26 ). In contrast, the new synthetic substances are perceived to be much more dangerous: 57 % of respondents thought that using them even once or twice posed a high health risk, while regular use was perceived to be highly risky by 87 % of young respondents ( 27 ).

Young people are more likely to use cannabis than older age groups. Young men are more prone to substance use than young women.

Young people are more prone to using cannabis than older age groups. According to national surveys collected by the EMCDDA, in all countries with available data, the likelihood of using cannabis decreases with age, thus young people aged 15 to 24 are much more likely to use this substance than older age groups (Figure 6-E-a). Late adolescence and young adulthood is often described as the age of 'experimentation', when young people try new substances, often without becoming addicted to them.

As Figure 6-E-a depicts, the greatest differences between cannabis use among young adults and that of the wider population (between 15 and 64 years of age) are in Hungary, where young adults are more than four times more likely to have used cannabis in the past year than the wider adult population, followed by Denmark, Italy and Norway, where this ratio is almost 3.5.

Figure 6-E: EU youth indicator: Last 12 months prevalence of cannabis use, by country and by age, year of the last available national survey

a) by age

EU youth indicator

%    %

b) Last 12 months prevalence of cannabis use of young people (aged 15-24), by sex

EU youth indicator

%    %

Notes: EL: 2004; HU: 2007; BE, AT, EE: 2008; NL: 2009; FR, RO, SK, FI: 2010; IE, ES, LV, TR: 2011; BG, CZ, DE, HR, IT, CY, LT, PL, PT, SI, SE, UK, NO: 2012; DK: 2013; UK: England and Wales only.

Source: EMCDDA

As with smoking and alcohol consumption, men are more prone to cannabis use than women in all countries with available data (see Figure 6-E-b). The difference between the sexes is the largest again in Turkey, though cannabis consumption is very low for both sexes. Men are more than 2.5 times more likely to use cannabis than women in Greece, Cyprus, Lithuania and Poland. There is no difference between men and women in Romania in their use of cannabis, which is at a very low level in this country, as well as in Finland.

The Eurobarometer surveys on drugs allow for comparing cannabis use in 2011 and 2014, indicating an increase in the European Union from 7.6 % to 10 % (Figure 6-F) ( 28 ). Countries registering significant increases were Denmark, Germany, Italy, Cyprus, Austria and Finland, while cannabis consumption decreased significantly in Lithuania.

The 2014 survey shows that cannabis use was the most widespread in the Czech Republic (15 %), Denmark, Estonia and Spain (13 %), while its use was reported to be the lowest in Hungary (3 %), Cyprus and Romania (2 %).

In contrast, as Figure 6-F also shows, new substances are rarely used by young Europeans, only 3 % of respondents report using the new synthetic substances. These new drugs were used the most in Ireland, Spain and France (5 %). They are typically used in social settings: 68 % of users reported to have obtained them from their friends, 60 % used them together with friends and 65 % at a party or an event ( 29 ).

Figure 6-F: Last 12 months prevalence of cannabis and 'new substances' use of young people (aged 15-24), by country, 2011 and 2014

%    %

Cannabis, 2014

New substances, 2014

Cannabis, 2011

Notes: Questions: 'Have you used cannabis yourself?' and 'New substances that imitate the effects of illicit drugs such as cannabis, ecstasy, cocaine, etc. may now sometimes be available. They are sometimes called (…) 'legal highs', or 'research chemicals' and can come in different forms, for example herbal mixtures, powders, crystals or tablets. Have you ever used such substances?'

Base: all respondents, % of 'yes, in the last 12 months' answers by country, EU-28 in 2014 and EU-27 in 2011

Source: Flash Eurobarometer 401, 'Young people and drugs', 2014 and Flash Eurobarometer 330, 'Youth attitudes on drugs', 2011


Figure 6-G: Young people's (aged 15-24) perception of the difficulty in obtaining drugs within 24 hours, EU-28 average, 2014

Cannabis

New substances

Impossible

Very difficult

Fairly difficult

Fairly easy

Very easy

Do not know/Not available

Notes: Question: 'Q11. How difficult or easy do you think it would be for you personally to obtain the following substances within 24 hours?' – 'Cannabis'; 'New substances that imitate the effects of illicit drugs'

Base: all respondents, EU-28

Source: Flash Eurobarometer 401, 'Young people and drugs', 2014

Differences in the consumption of these two substances are in line with their perceived danger to health as well as the perceived difficulty in accessing them. Figure 6-G depicts young people's perception of the difficulty in obtaining different drugs within 24 hours (15-24 age group). Data show that while the majority of young people (59 %) thought that getting access to cannabis was easy, new substances were perceived to be rather difficult to get hold of: 21 % of respondents thought it impossible to obtain them within 24 hours, and 50 % thought this would be difficult.

6.3.4. Sexual risk behaviour

High-risk sexual behaviour (most notably early first intercourse, multiple sexual partners, or inconsistent condom use) is influenced by the same social factors as the various types of substance use and is even associated with them ( 30 ). Such risky behaviour carries the danger of contracting sexually transmitted diseases like HIV/AIDS and can result in unplanned pregnancies.

Collecting data on the sexual risk behaviour of young people or on its consequences is difficult and complex. For example, the true incidence of sexually transmitted infections (STIs) is likely to be considerably higher than data suggest, since due to differences in testing methods, screening programmes and surveillance systems across Europe, many cases remain unreported or misdiagnosed.


Fertility rates as well as the percentage of legally induced abortions are decreasing among girls aged 15 to 19.

In the absence of more accurate data, fertility and abortion rates are indications of sexual activity without contraception. Figure 6-H shows the fertility rates of young women aged 15 to 19 in 2010 and 2013. In 2013, fertility rates of 15 to 19 year-old girls were the highest in Bulgaria (4.2 live births per 100 women) and Romania (3.3), and the lowest in the Netherlands (0.4) and Liechtenstein (no live births per 100 women aged 15-19). Almost every country shows declining trends since 2010 for this indicator, with the exception of Bulgaria (no change since 2010), the Czech Republic, Latvia, Lithuania and Hungary. In the EU-28, fertility rates among young women show a 15 % decrease in 2013 compared to 2010.

Figure 6-H: Fertility rate among young women (aged 15-19), by country, 2010 and 2013 (live births per 100 women)

Source: Eurostat [demo_frate]

Similar trends can also be observed based on available data on the percentage of legally induced abortions in the same age group (young women aged 15 to 19). The percentage of young women's abortions declined in every country except Bulgaria, the Czech Republic and Lithuania, though absolute numbers decreased even in these three countries. The decline is especially pronounced in Germany, Romania and the United Kingdom (Figure 6-I). In 2013, the percentage of legally induced abortions for very young women was the highest in Bulgaria, Estonia, Hungary and the United Kingdom.

Figure 6-I: Percentage of legally induced abortions among young women (aged 15-19), by country, 2010 and 2013

%    %

Notes: For Spain, Italy, Slovenia and the United Kingdom, data are from 2012 instead of 2013. Average populations were calculated as the arithmetic averages between the population on the 1 January in the given year, and on 1 January in the following year.

Source: Eurostat [demo_fabort and demo_pjangroup] and own calculations.

6.3.5. Physical inactivity

Physical inactivity is the fourth leading risk factor for global mortality ( 31 ). Physical inactivity is one of the main causes of obesity, which has long-lasting health consequences if it develops early in childhood ( 32 ).

Recent Eurobarometer surveys indicate that young people aged 15-24 are the most physically active of the age groups investigated ( 33 ). As Figure 6-J depicts, only 36 % of young people aged 15-24 seldom or never take exercise or play sport, as opposed to 54 % in the 25-39 age group, 61 % of those aged 40-54 and 70 % of people over 55. Yet, differences between the age groups are much smaller when it comes to engaging in less formalised physical activities like cycling, dancing or gardening: 44 % of young people seldom or never engage in such activities, while the corresponding proportion is 57 % in the oldest (55+) age group (see Figure 6-K).

Almost half of young women seldom or never engage in physical activity.

Similarly, while relatively large differences exist between young women and men in the frequency of taking exercise or playing sport, differences are much smaller when it comes to their engagement in other physical activities (see Figure 6-J and 6-K). Nonetheless, women are more likely to be physically inactive than men: 44 % of young women seldom or never take exercise or play sport, and 49 % seldom or never engage in other physical activities (as opposed to the 26 % and 40 % of men respectively).

Figure 6-J: Proportion of people seldom or never taking exercise or playing sport, by age and by sex, EU-28 average, 2013

Notes: Question: 'How often do you exercise or play sport?'

Base: all respondents, % of 'less than 1 to 3 times a month' and 'never' answers, EU-28

Source: Special Eurobarometer 412, 'Sport and physical activity', 2014

Figure 6-K: Proportion of people seldom or never engaging in physical activities such as cycling, dancing or gardening, by age and by sex, EU-28 average, 2013

Notes: Question: 'And how often do you engage in other physical activity such as cycling from one place to another, dancing, gardening, etc.?'

Base: all respondents, % of 'less than 1 to 3 times a month' and 'never' answers, EU-28

Source: Special Eurobarometer 412, 'Sport and physical activity', 2014

Although a direct comparison between the Eurobarometer surveys conducted in 2009 and 2013 is not possible due to a change in the question on physical activity (in 2009, it also included 'walking from one place to another'), the direction of change between the surveys is not encouraging ( 34 ). While the proportion of young people seldom or never taking exercise or playing sport has decreased since 2009 (especially among young women), data on the share of young people, and primarily on the share of young women seldom or never engaging in other physical activities point towards increasing inactivity.

While sample sizes in Eurobarometer surveys do not allow for analysing young people's inactivity by country, data are available from the European Quality of Life Survey (EQLS) conducted by Eurofound ( 35 ). As Figure 6-L shows, physical inactivity among young respondents aged between 18 and 24 was particularly high (more than 50 %) in Bulgaria, Cyprus, Romania and Turkey. Young people were the most physically active in the Czech Republic, Austria and Finland.

Figure 6-L: Proportion of young people (aged 18-24) seldom or never taking part in sports or physical exercise, by country, 2011

%    %

Source: Eurofound, EQLS

6.4 Mental well-being

The transition from childhood to adulthood and the societal and family pressures that young people face in such contexts also influence their mental health. Though mental and psychological distress is still less prevalent among young people than older age groups, special attention has to be paid to young people and the factors influencing their vulnerability. As with risk behaviour, mental health is also influenced by the socio-economic conditions of young people's lives – their level of social exclusion and degree of poverty. For this reason, the economic crisis may also have had an impact on the mental health of young people due to their parents' circumstances as well as their own difficulties ( 36 ). As Chapters 4 and 5 of this report showed, youth unemployment and social exclusion rates have grown considerably, which certainly influences young people's mental health and psychological well-being.

The mental well-being index developed by the World Health Organization (WHO) is compiled on the basis of five questions ( 37 ) related to a person's mental well-being. The European Quality of Life Survey includes information on this well-being index, and allows for comparisons between countries, age groups, social groups and over time. The higher the average mental well-being score, the better the respondents' perception of their own psychological well-being. For example, as the EQLS survey shows, the mental well-being index is higher for those in employment than for both the unemployed and the inactive ( 38 ).

Figure 6-M compares the mental well-being index of young people with the total population in European countries. In 2011/12, the mental well-being index of young people aged 18-29 had the highest average scores in the former Yugoslav Republic of Macedonia, Bulgaria and Montenegro, while the lowest were in Sweden, the United Kingdom, Malta and Luxembourg.

Figure 6-M: Mental well-being index, by country and by age, 2007 and 2011/12

%    %

Aged 18-29, 2011/12

Total population, 2011/12

Aged 18-29, 2007

Source: Eurofound, EQLS

The figure also shows that young people have higher average scores than the total population almost everywhere. The exceptions are the Nordic countries (Denmark, Finland, Sweden and Iceland), as well as Ireland and Luxembourg, though to different degrees. It is in Sweden in particular (with a difference of more than 6 percentage points), as well as in Iceland (4.5 percentage points) and Finland (2.5 percentage points) where young people's mental well-being is worse than in the total population. In contrast, young people have much higher mental well-being scores than the total population – with a difference of more than 10 percentage points – in south-eastern countries such as Bulgaria, the former Yugoslav Republic of Macedonia and Serbia, and to a lesser extent in Greece, Croatia, Romania, Slovenia and Montenegro.

Looking at recent trends in the mental well-being of young people, while the average EU mental well-being index stayed relatively stable between 2007 and 2011, country variations exist (see Figure 6-M). Among the countries with available data, more countries experienced increases in the average mental well-being index scores of young people than decreases. Average mental well-being scores decreased the most in Ireland, Sweden and Slovakia in this period, while the largest increases were registered in the former Yugoslav Republic of Macedonia, Turkey and Italy.

6.4.2. Suicide

As the 2012 Youth Report showed ( 39 ), suicide rates were relatively stable in the EU-28, but with a slight increase from 2008, both among young people and in the total population. This increase – and more notable increases in some countries, for example in Greece – can at least partly be linked to the economic crisis ( 40 ).

Figure 6-N: EU youth indicator: Death by intentional self-harm, crude death rate (per 100000 inhabitants), by age and by sex, EU-28 average

EU youth indicator

a) by age, 2009-2012

%    %

b) by age and by sex, 2012

a

Aged 15-19

b

Aged 20-24

c

Aged 25-29

d

Total

Notes: 2011: break in series; 2012: estimates.

Source: Eurostat [yth_hlth_030, hlth_cd_acdr2]

More recent data, as shown on Figure 6-N-a, confirm the relative stability of suicide rates at the EU-28 level. However, since the method for data collection changed in 2011, conclusions can be drawn only regarding the most recent changes. Between 2011 and 2012, suicide rates slightly increased among young people aged 25 to 29 and among the total population, while stayed relatively stable among young people aged 15 to 19 and 20 to 24.

Suicide rates increase with age. In addition, as Figure 6-N-b shows, suicide rates are much higher among young men than young women in all age groups. More than three times more young men than young women aged 15 to 19 committed suicide in 2012, and this ratio reaches to almost five times more for the 20-24 and 25-29 age groups.

As Figure 6-O depicts, among young men aged 15 to 24, suicide rates were the highest in Ireland, Latvia, Lithuania and Finland. Among young women in the same age group, suicide rates were the highest in Ireland, Finland, Sweden and Norway. Suicide rates were quite low for both sexes in southern countries like Greece, Spain, Italy, Portugal and Turkey. However, in Greece, though suicide rates remain comparatively low, a more than 50% increase took place between 2007 and 2012 ( 41 ).

Figure 6-O: EU youth indicator: Death by intentional self-harm among young people (aged 15-24), crude death rate (per 100 000 inhabitants), by country and by sex, 2012

EU youth indicator

%    %

Notes: EU-28: estimates. France: 2011. Malta and Liechtenstein: confidential.

Source: Eurostat [hlth_cd_acdr2]

(1) () Eurostat 2013, SILC ad-hoc module on personal well-being [ilc_pw01 and ilc_pw08].
(2) () European Commission, 2012a.
(3) ()These indicators can also be consulted on the website of the European Core Health Indicators (European Commission, 2015a).
(4) () Jackson et al., 2012.
(5) () Ibid.; Viner et al., 2012.
(6) () Sawyer et al., 2012.
(7) () Furlong et al., 2003; Jackson et al., 2012.
(8) () Furlong, 2002; Jackson et al., 2012.
(9) () Furlong, 2002; Jackson et al., 2012.
(10) () WHO Regional Office for Europe 2012, p. 141.
(11) () See e.g. WHO, 2014.
(12) () See OECD Health Statistics, available at: http://stats.oecd.org/Index.aspx?DataSetCode=HEALTH_LVNG# [Accessed 22 January 2015].
(13) () Ibid.
(14) ()Special Eurobarometer 429, 'Attitudes of Europeans towards tobacco and electronic cigarettes', 2015 (European Commission, 2015c).
(15) ()European Commission 2015c, p. 15.
(16) () WHO Regional Office for Europe 2009, p. 82.
(17) () Flash Eurobarometer 401, 'Young people and drugs', 2014 (European Commission 2014i).
(18) () Ibid. No definitions of 'once or twice' or 'regularly' were given in the questionnaire.
(19) () No new data on drunkenness based on the ESPAD survey used in the last EU Youth Report (European Commission, 2012a) were published since 2012.
(20) () Special Eurobarometer 331, 'EU citizens' attitudes towards alcohol', 2010 (European Commission, 2010b).
(21) () For gender differences regarding the frequency of getting drunk, see the 2012 EU Youth Report (European Commission, 2012a).
(22) () WHO Regional Office for Europe 2009, p. 80.
(23) () Ibid, p. 84.
(24) () EMCDDA, 2012, 2014.
(25) () Flash Eurobarometer 401, 'Young people and drugs', 2014 (European Commission 2014i).
(26) () Ibid.
(27) () Ibid.
(28) () Longer-term time series are available regarding the consumption of cannabis and amphetamines in the framework of the European Core Health Indicators (indicator 48 on the 'use of illicit drugs') on the website of the European Commission, DG Health and Food Safety (European Commission, 2015a).
(29) () Ibid.
(30) () Jackson et al., 2012.
(31) () WHO 2010, p. 10.
(32) () On obesity, see European Commission, 2012a.
(33) ()Special Eurobarometer 412, 'Sport and physical activity', 2014 (European Commission, 2014j).
(34) () Special Eurobarometer 412, 'Sport and physical activity', 2014 (European Commission, 2014j), and Special Eurobarometer 334, 'Sport and physical activity', 2010 (European Commission, 2010c).
(35) () See: https://www.eurofound.europa.eu/european-quality-of-life-surveys-eqls [Accessed 27 July 2015].
(36) () EPHA, 2014; WHO Regional Office for Europe, 2011.
(37)

()    The index is based on respondents' evaluations of the following items: 1) 'I have felt cheerful and in good spirits'; 2) 'I have felt calm and relaxed'; 3) 'I have felt active and vigorous'; 4) 'I woke up feeling fresh and rested'; 5) 'My daily life has been filled with things that interest me'. See: http://www.who-5.org [Accessed 4 June 2015].

(38) ()Eurofound, 2014b.
(39) () European Commission 2012a, p. 230.
(40) () Thomson et al. 2014, p. 37. See also Branas et al., 2015.
(41) ()OECD 2014b, p. 28.
Top

Brussels, 15.9.2015

SWD(2015) 169 final

COMMISSION STAFF WORKING DOCUMENT

Situation of young people in the EU

Accompanying the document

Communication from the Commission to the European Parliament, the Council, the European Economic and Social Committee and the Committee of the Regions

Draft 2015 Joint Report of the Council and the Commission on the implementation of the renewed framework for European Cooperation in the youth field (2010-2018)

{COM(2015) 429 final}
{SWD(2015) 168 final}


7. PARTICIPATION IN DEMOCRATIC LIFE

EU Youth Indicators

Participation of young people in elections at the local, regional, national or EU level

Figure 7-E

Young people's participation in political or community/environmentally-oriented NGOs

Figure 7-H and Figure 7-I

Proportion of the population who have used the Internet for interaction with public authorities

Figure 7-K

Proportion of the population who have used the Internet to post opinions on civic and political issues via websites

Figure 7-L

Young people elected to the European Parliament

Figure 7-G-bis

7.1. Introduction

Young people are often described as being more disenchanted with politics and less keen on participating, in comparison with older groups in the general population. In this chapter, this view will be challenged using data and information on various forms of political participation and social engagement, and it will be shown how different ways of participating can appeal to young people and motivate them to become more engaged. Indeed, as any other group in society, they develop a desire to become involved in political life when they perceive that their opinions count. Young citizens, therefore, need to have a real stake in political decision-making processes in order to be willing to participate.

This chapter will focus initially on young people's general level of interest in politics, and on their perception of citizenship. It will then examine how young citizens take advantage of different opportunities to actively participate in politics, from the more traditional means such as voting and joining political parties, to the less mediated experiences of engaging in local and non-governmental organisations and social movements. The use of the Internet as a 'new' resource for political participation will then be addressed before concluding with a discussion of the issue of youth exclusion from political engagement.

7.2. Young people's interest in politics and their perception of EU citizenship

About one third of young Europeans report to be very or quite interested in politics

Interest in the political life of society is a stepping stone to involvement in community life, and vice versa. Interest prompts an individual to become informed about how decisions are made in the policy-making process, what the opinions of different stakeholders are, and what means of participation are available. Ultimately, interest can engender willingness to actively participate and address shared problems together with other members of the community.

Results from the European Social Survey conducted in 2012 indicate that, on average, about 33 % of respondents declare to be very or quite interested in politics (Figure 7-A). Some differences exist between countries. Northern and Scandinavian Member States register above average levels of interest. On the other hand, several southern and eastern European countries display comparatively low levels of concern with political issues.

Figure 7-A: Share of young people (aged 15-29) claiming to be 'very' or 'quite' interested in politics, by country, 2002 and 2012

%    %

Note: The chart covers the countries for which data exist for 2002 and 2012.

Source: European Social Survey 2002 and 2012

Contrary to the claim that young people are disaffected with politics, interest in political issues amongst young people in Europe has remained stable over the last decade, with approximately one third of respondents reporting to be very or quite interested. Yet, significant changes have occurred in some countries since 2002: while substantial increases have been registered in Germany (+19.9 %), Spain (+117.3 %), Croatia (+51.8 %) and Finland (+29.8 %), rates have dropped in the Czech Republic (-56.7 %), Hungary (-59.7 %), the Netherlands (-22.3 %) and Portugal (-22.6 %).

In order to fully appreciate the figures reported above, it is useful to compare the general level of interest in politics expressed by young people with that reported by other age groups in the general population (Figure 7-B). Within the younger age groups, levels of concern with political issues are highest amongst individuals at the older end of the spectrum (around 40 % of respondents aged 25 to 29 on average declare to be very or quite interested).

Figure 7-B: Level of interest in politics among different age groups, EU-27 average, 2012

%    %

Note: The average showed on the chart was calculated on the basis of the countries for which data exist for 2012.

Source: European Social Survey, 2012

Not at all interested

Very + quite interested

This tendency is confirmed when considering the older age cohorts, from 30 to over 60 years. As the figure above illustrates, the degree of attention to political issues increases as individuals grow older. Within the boundaries of the snapshot offered by the 2012 data here illustrated, the notion that young people are comparatively less engaged in following political developments is therefore confirmed.

Young people's lower levels of interest in politics are partly explained by the fact that political awareness and socialisation take time and reach their highest at older age.

However, this phenomenon is, at least partly, intrinsic to each generation: individuals tend to become more aware of the political environment as they grow into mature adulthood, become politically socialised, and acquire a larger 'stake' in the social, political and economic life of their community. Therefore, this lower level of interest in politics should not be labelled as a specific characteristic of the current generation of young people but rather as an inherent phase in the average life trajectory ( 1 ).

Besides a general interest in politics, identification with a political entity is essential in determining the degree of engagement in political life. Indeed, perceptions of citizenship are crucial in motivating people to participate. Young people report stronger feelings of citizenship towards the European Union than older cohorts (Figure 7-C). It is therefore possible that, compared to older generations, young people might be more inclined to participate at European rather than at national level.

Figure 7-C: Sense of European citizenship, by age group, EU-28 average, 2014

%    %

Notes: the question was: 'For each of the following statements, please tell me to what extent it corresponds or not to your own opinion - You feel you are a citizen of the EU'. Base: all respondents. The chart does not show the share of respondents answering 'I don't know'.

Source: Standard Eurobarometer 81, Spring 2014

15-24

25-39

40-54

55+

Total YES

Total NO

Data presented in this section shed some light on young people's interest in politics as well as their political identity. Whilst these are important motivational factors, young people must also have the means to actively participate. As in a virtuous circle, the existence of effective means for participation encourages people to become interested in the public sphere, which in turn fosters the desire to take advantage of those means. It is therefore important to identify which forms of participation best meet the needs of young people, keeping in mind that the means young people choose today may not necessarily be those traditionally used by previous generations.

7.3. Young people's participation in representative democracy: voting and joining a political party

Genuine elections with political parties competing on alternative political programmes provide the basis for the functioning of representative democracy. Choosing between the programmes of various parties and candidates, and selecting representatives for public office are the basic actions by which citizens participate in the management of public affairs. This is why election turnout is usually referred to as a relevant measure of citizens' participation.

Traditional forms of political engagement such as voting and becoming members of political parties have limited appeal for young citizens

However, electoral and party engagement seems to have limited appeal for young citizens. A Eurobarometer survey from 2012 indicates that only about one in two young people consider elections as one of the most valuable ways to express their political preferences (Figure 7-D). According to their responses, 47 % among 15-24 year-olds, and 50 % among 25-34 year-olds, believe that voting is one of the two best ways to ensure that their voice is heard by decision-makers. This result is in line with what is indicated in a survey asking young respondents what they consider to be the most effective way for participating in public life in the European Union: voting in elections to the European Parliament was chosen by only 44 % of the sample ( 2 ).

Figure 7-D: Percentage of young people including 'voting in elections' and 'joining a political party' as one of the two best ways to ensure 'that one's voice is heard by decision-makers', by age group (15-24 and 25-34), EU-27 average, 2012

%    %

Notes: the question was: 'Which two of the following do you think are the best ways of ensuring one's voice is heard by decision-makers?'. Base: all respondents.

Source: Standard Eurobarometer 77, 2012

15-24

25-34

Voting in elections

Joining a political party

Joining a political party is viewed as an effective way of channelling their views by a much lower proportion of young people: only 13 % in both age groups.

Along with these results, low levels of turnout have been registered amongst young people in recent years. According to the Eurobarometer's results illustrated below, on average about 60 % of young respondents have cast their vote in an election between 2011 and 2014 (Figure 7-E).

Figure 7-E: EU youth indicator: Participation of young people (aged 15-30) in elections at the local, regional, national or EU level, by country, 2011 and 2014

EU youth indicator

%    %

Notes: The question was 'During the last 3 years, did you vote in any political election at the local, regional, national or EU level? If you were, at that time, not eligible to vote, please say so'. Base: respondents who were eligible to vote at the time of the election. EU-27 (2011) and EU-28 (2014)

Source: 2011 Flash Eurobarometer319a 'Youth on the Move', 2015 Flash Eurobarometer 408 'European Youth'

Turnout amongst young voters has declined over recent years. In 2011, an average of almost 80 % of young respondents to the survey declared they had participated in an election in the previous three years. This trend is common to the vast majority of EU Member States, the exceptions being the Czech Republic and Lithuania where a slight increase has occurred ( 3 ).

The propensity to vote seems to be influenced by the age at which respondents completed their education, indicating that higher levels of education are associated with higher turnout in elections (Figure 7-F).

Figure 7-F: Participation of young people (aged 15-29 who are eligible to vote) in elections at the local, regional, national or EU level, by the age at which they stopped full-time education, EU-28 average, 2014

%    %

Notes: questions were 'During the last 3 years, did you vote in any political election at the local, regional, national or EU level? If you were, at that time, not eligible to vote, please say so'; 'How old were you when you stopped full-time education?'. Base: respondents who were eligible to vote at the time of the election.

Source: Flash Eurobarometer 408 'European Youth', 2015

15

16-19

20+

Both the political level at which elections take place, and the gender of young voters play a role in determining how liklely they are to cast their vote in a ballot (Figure 7-G). Young voters tend to favour local elections, followed by national ones, while regional and European elections attract less interest. In addition, there is a higher turnout among male voters than females, in all types of elections.

Figure 7-G: Participation in elections of young people (aged 15-29), by type of election and by sex, EU-28 average, 2014

%    %

Notes: questions were 'During the last 3 years, did you vote in any political election at the local, regional, national or EU level? If you were, at that time, not eligible to vote, please say so'. Base: respondents who were eligible to vote at the time of the election.

Source: Flash Eurobarometer 408 'European Youth', 2015

Male

Female

Yes, at local level

Yes, at national level

Yes, at regional level

Yes, at EU level

Besides their limited participation in elections, the proportion of people from the younger age groups elected to public office is low, at least at European Union level. Figure 7-H depicts the proportion of Members of the European Parliament aged 30 or under, who were elected to the European Parliament in May 2014. The percentage on the total of the MEPs is minimal, and, what is more, it has almost halved since the previous European elections in 2009.


Figure 7-H: EU Youth Indicator: Members of the European Parliament aged 30 or under, 2009 and 2014

EU youth indicator

%    %

2009

2014

Source: European Parliament

In line with these results, joining a political party appeals to a rather small proportion of young people (Figure 7-I). Between 2011 and 2014, levels of membership have remained stable at around an average of 5 % in Europe. Significant drops in membership figures since 2011 have been registered in Bulgaria, Estonia, Greece, Cyprus, Lithuania and Poland, while the Czech Republic, Spain, Luxembourg, and Hungary have seen significant increases.

Figure 7-I: Membership of political parties amongst young people (aged 15-29), by country, 2011 and 2014

Notes: question was ‘In the last 12 months, have you participated in any activities of the following organisations? (Political Party)’. Base: all respondents. EU-27 (2011) and EU-28 (2014)

Source: 2011 Flash Eurobarometer319a ‘Youth on the Move’, 2015 Flash Eurobarometer 408 ‘European Youth’

Membership of political parties is even more limited amongst young women: on average, they are 50 % less likely to become active in such organisations than men of the same age ( 4 ).

The limited levels of participation in traditional activities like voting and being active within political parties should not immediately be interpreted as signals that young people are disenchanted with democracy. Indeed, as an on-going research project suggests, 'young people show general support for democratic systems although are often critical of how they work in practice and for them' ( 5 ). Collecting the views of young individuals from 30

Young people show general support for democratic systems but are often critical of how they work in practice.

different regions in Europe through surveys, interviews and ethnographic observation, the study indicates that youth dissatisfaction is often with associated political choices (parties, leaders, manifestoes) rather than with democracy and participation per se. It is also to be considered that, though elections and political parties have a pivotal role in democratic societies, they are not the only activities to be taken into account when evaluating political participation. Many other channels are open to people to have their say and to influence political decision-makers and policies, and these may be more attractive to younger citizens.

7.4. Other ways young people participate

Young people tend to favour flexible and issue-based forms of active participation such as contributing to the projects of non-governmental associations, participating in community-driven initiatives, joining social movements and expressing political opinions in public spaces ( 6 ).

Data presented here confirm young people's preference for being active in non-governmental organisations and/or local organisations which address local issues, rather than in political parties. On average, twice as many respondents as those who have been active in a political party stated they had participated in the activities of a local organisation aimed at improving the local community (Figure 7-J).

Figure 7-J: EU youth indicator: Proportion of young people (aged 15-30) who have participated in the activities of organisations aimed at improving their local community, by country, 2011 and 2014

EU youth indicator

%    %

Notes: the question was 'In the last 12 months, have you participated in any activities of the following organisations? (A local organisation aimed at improving the local community)'. Base: all respondents. EU-27 (2011) and EU-28 (2014)

Source: 2011 Flash Eurobarometer319a 'Youth on the Move', 2015 Flash Eurobarometer 408 'European Youth'

On average, the figures remained relatively stable between 2011 and 2014, although important changes occurred in some Member States. Levels of participation fell significantly in Estonia, Greece, and Romania. The proportion of young people taking part in local organisations aimed at improving local communities also declined in Bulgaria, Cyprus, Lithuania, Poland and Slovenia. In contrast, it rose in Denmark, Latvia and the Netherlands.

Frustration with traditional and institutionalised forms of political participation can also result in people choosing to show their interest in issues or express their concerns without any (or with little) mediation by organised bodies, be they political parties or nongovernmental organisations.

Petitions, public demonstrations, boycotts, wearing political symbols such as badges and stickers, become the means of more loose and informal participation in society and in politics, which many young people find worth experiencing.

In this context, petitions, public demonstrations, boycotts, wearing political symbols such as badges and stickers, become the means of more loose and informal participation in society and in politics, which many young people find worth experiencing ( 7 ). The 2012 European Social Survey shows that on average about 20 % of young people have recently signed a petition and about 10 % respectively have joined a public demonstration and worn a badge or sticker (Figure 7-K).

Figure 7-K: Participation of young people (aged 15-29) in various activities during the three years before the survey, by country, 2010 and 2012

Taken part in a lawful public demonstration

%    %

Boycotted certain products

%    %

Signed a petition

%    %

Worn or displayed campaign badge/sticker

%    %

Source: European Social Survey, 2010 and 2012

Some countries appear to register higher levels of youth participation in these activities than others. In general, young people in Germany, Denmark, Ireland, Spain, France, the Scandinavian countries (Finland, Sweden, and Norway) and Iceland tend to engage more in these modes of political participation than their peers in the rest of Europe. Differences between these countries exist: while in Scandinavia higher figures are reported for signing a petition, boycotting products and especially wearing political symbols, in Ireland, Spain and Italy a higher propensity is shown for participating in public demonstrations.

A wide array of opportunities for political participation is also offered by the Internet and its applications, and young people have been in the forefront of using these means of interpersonal communication. The virtual spaces frequented by young people such as online forums, chat rooms, social networks and blogs, serve the same basic function as the physical ones they sometimes replace: establishing collective interaction around common interests. In this sense, they constitute a great resource for political and social engagement, which young people haves been the quickest to recognise and use. For example, the Internet plays a significant role in fostering social contact between young citizens as well as facilitating their interactions with their political representatives and public authorities.

Many young people resort to the Internet and its social media to interact with public authorities and exchange opinions on political issues

Data collected by Eurostat show that, on average, roughly 50 % of young Europeans have used the Internet to contact or interact with public authorities in 2014, and this figure has increased over the last 4 years (Figure 7-L). In some countries, this percentage is extremely high, indicating a widespread use of online instruments to obtain information from public authorities' websites (Denmark, the Netherlands, Slovenia, Finland, Sweden, Iceland and Norway). Significant increases have been registered in the Czech Republic, Greece, the Netherlands, Portugal, Slovenia, the former Yugoslav Republic of Macedonia and Turkey.


Figure 7-L: EU youth indicator: Share of young people (aged 16-24) who used the Internet for interaction with public authorities in the twelve months before the survey, by country, 2010 and 2014

EU youth indicator

%    %

Notes: Data presented in the chart refer to the 16-24 age group, for which figures are available for both 2010 and 2014

Source: Eurostat [isoc_ciegi_ac], 2010 and 2014

On the other hand, young people in some European countries seem less familiar with this form of interaction with public authorities: the Czech Republic, Italy, Poland, Romania and Turkey report levels of interaction with public authorities through the Internet well below the European average. According to the breakdown by sex of the same data collected by Eurostat, young women tend to use the Internet to contact public authorities more than men.

Besides making contact with public authorities, around 18 % of young Europeans take to the Internet to exchange their political opinions through messages and posts on websites (Figure 7-M).

Figure 7-M: EU youth indicator: Share of young people (aged 16-24) who have used the Internet in the last three months to post opinions on civic and political issues via websites, by country, 2013

EU youth indicator

%    %

Source: Eurostat [isoc_bde15cua], 2013

Differences between some countries are significant: while young people in Belgium, the Czech Republic, Austria, Romania, Slovakia and Finland do not often resort to this means of communication, a larger proportion of their peers in Spain, Italy, the Netherlands and Iceland do so.

Results for the age group 15-24 and for a longer reference period from a Eurobarometer survey conducted in 2013 show that, on average, young people clearly prefer to express their opinions and ideas through online fora, rather than participating in person in public debates (Figure 7-N). The Internet therefore proves to be an important means for political communication amongst young Europeans.

Figure 7-N: Share of young people (aged 15-24) who participated in off-line and on-line public debates during the two years before the survey, by age groups, EU-28 average, 2013

%    %

A =    Taken part in a public debate at local/regional level

B =    Taken part in a public debate at national level

C =    Taken part in a public debate at EU level

D =    Expressed views on public issues on the Internet or in social media

Notes: question was 'Have you done any of the following in the last two years?'. Base: all respondents.

Source: Flash Eurobarometer 373, 2013

A

B

C

D

Evidence offered by the figures illustrated so far help build a picture of the diverse and multi-layered nature of young people's engagement in political and civic activities. As some of the more traditional modes of participation lose their appeal for young Europeans, other more innovative and fluid ways to communicate and interact in the political sphere develop. Overall, the picture that emerges is far from being pessimistic: many young people manifest a desire to have their voice heard and show an interest in engaging in society, through various channels of communication.

7.5. Engaging hard-to-reach young people in political and civic life

Despite the encouraging signs described so far with respect to young people's participation, it is also evident that certain segments of the youth population remain excluded from any form of engagement in the life of their community and must overcome significant obstacles in order to participate. This form of exclusion is closely linked to other aspects of marginalisation; for example, to difficulties in finding employment or accessing vital social services (youth unemployment and social exclusion are discussed respectively in Chapters 4 and 5).

Unfortunately, the absence of quantitative information prevents an examination of the extent and nature of such political exclusion. Therefore, qualitative research investigating the beliefs and behaviours of young people represents an essential source of information in understanding the fundamental reasons behind their exclusion from the political sphere. A recent study on political participation among young people has addressed this topic through extensive interviews and focus groups with young Europeans from six EU Member States ( 8 ). The results indicated a widespread belief amongst young people that political engagement requires a particular set of skills including aptitude in interpersonal relations, rhetorical dexterity, and networking ability. This opinion was shared by both individuals who did not consider they possessed such skills as well as by those who did. The perceived requirement for political skills was even more evident amongst young people experiencing social and political exclusion, for which a highly formalised model of political engagement was perceived as alien and intimidating. In addition, young respondents from disadvantaged backgrounds reported encountering material obstacles to political participation. Pressing daily concerns left very little time and resources for engagement in civic or political activities, which increased feelings of alienation and ineffectiveness in the social environment ( 9 ). Last but not least, it is important to acknowledge the challenges posed by a potential digital divide in the use of communication technologies for participative purposes. While the new media offer opportunities for involvement in and information about political processes, they can also restrict access to knowledge and networks to those who have the opportunity to use a computer and surf the internet, thereby replicating the social inequalities existing in the 'non-virtual' environment (data on the use of the Internet amongst young people are discussed in Chapter 9).

(1) ()Jaime-Castillo, 2008; Wass, 2008
(2) ()European Parliament, 2014.
(3) ()It has to be kept in mind that electoral turnout is also influenced by the specific legal regulations in effect in countries. An obligation for citizens to vote currently exists in Belgium, Cyprus, Greece, France, Luxembourg, Liechtenstein and Turkey, although levels of enforcement vary ( http://www.idea.int/vt/compulsory_voting.cfm ).
(4) ()European Commission, 2015b.
(5) ()Further information on the research project, funded under the European 7th Framework Programme, can be retrieved at www.fp7-myplace.eu . 
(6) ()Hoikkala, 2009; Barber, 2010; Gaisel et al., 2010; Santo et al., 2010.
(7) ()Feixa et al., 2009.
(8) ()EACEA, 2013
(9) ()Ibid.
Top

Brussels, 15.9.2015

SWD(2015) 169 final

COMMISSION STAFF WORKING DOCUMENT

Situation of young people in the EU

Accompanying the document

Communication from the Commission to the European Parliament, the Council, the European Economic and Social Committee and the Committee of the Regions

Draft 2015 Joint Report of the Council and the Commission on the implementation of the renewed framework for European Cooperation in the youth field (2010-2018)

{COM(2015) 429 final}
{SWD(2015) 168 final}


8. VOLUNTARY ACTIVITIES

EU Youth Indicators

Participation of young people in organised voluntary activities

Figure 8-A

Voluntary activities aimed at changing young people's local communities

Figure 8-D

Young people volunteering abroad

Figure 8-F

Young people receiving a certificate or diploma for voluntary activities

Figure 8-H


8.1. Introduction

Participating in voluntary activities greatly contributes to a young person's human capital and personal development. The personal benefits volunteering brings to young people are numerous. Research has shown how it helps to discourage young people from leaving school prematurely and improves their self-confidence, sense of social responsibility, and level of psychological wellbeing ( 1 ). In terms of the development of human capital, volunteering provides young individuals with effective opportunities for non-formal learning which enhance their personal and professional skills and can greatly contribute to their employability. The improvement of interpersonal skills, communication skills, knowledge, organisational and managerial skills, fundraising, technical and office skills are examples of practical gains reported by young volunteers ( 2 ).

Volunteering also represents an important contribution to the promotion of social and economic cohesion. Indeed, by engaging in projects to tackle current social problems, young volunteers become key agents of social reform and develop a sense of belonging in and ownership of their community. More specifically, peer-mentoring (voluntary mentoring by a young person who has lived through similar experiences) has been shown to be effective in helping young people at risk of exclusion ( 3 ).

This chapter provides an overview of young people's participation in voluntary activities; it examines recent trends in terms of participation rates, areas of activity and the tendency for young people to undertake voluntary work abroad. The second part of the chapter highlights some of the key factors in supporting youth volunteering and encouraging more widespread participation.

8.2. Youth participation in voluntary activities

According to the results of the Flash Eurobarometer 'European Youth' conducted in 2014, around one young European in four has engaged in voluntary activities (Figure 8-A). In some countries (Denmark, Germany, Ireland, the Netherlands and the United Kingdom), this percentage rises to over one in three, while other countries register much lower rates of participation (in particular, Bulgaria, Greece and Sweden). At the European level, figures have remained stable since 2011, although some variations have occurred in certain Member States. For example, the share of young people participating in volunteering has halved in Bulgaria and significantly diminished in Romania, while it has increased in Italy and Cyprus.


Figure 8-A: EU Youth Indicator: Participation of young people (aged 15-30) in organised voluntary activities, by country, 2011 and 2014

EU youth indicator

%    %

Note: the question was: 'In the last 12 months, have you been involved in any organised voluntary activities?'. Base: all respondents. EU-27 (2011) and EU-28 (2014)

Source: Flash Eurobarometer 319, 'Youth on the Move', 2011 and Flash Eurobarometer 408, 'European Youth', 2014

The younger groups of young people tend to be more active in voluntary activities (Figure 8-B). Comparison with rates of participation in the general population does not signal substantial differences between generations, nor does comparison between men and women ( 4 ).

Figure 8-B: Participation of young people (aged 15-30) in organised voluntary activities, EU-28 average, by age group, 2014

%    %

Note: the question was: 'In the last 12 months, have you been involved in any organised voluntary activities?'. Base: all respondents.

Source: Flash Eurobarometer 408, 'European Youth', 2014

15-19

20-24

25-29

Volunteering is often inspired by previous experiences of engagement in the community. Participation in services organised by families, schools, religious communities, and sporting organisations have been indicated as a strong factor in fostering youth involvement in voluntary projects ( 5 ). Indeed, data show that young people seem to be more active in volunteering when they participate in other collective political and cultural activities (Figure 8-C). In particular, engagement in a youth club is very closely related to involvement in voluntary experiences.

Figure 8-C: Participation of young people (aged 15-30) in organised voluntary activities, EU-28 average, by participation in other activities, 2014

%    %

Note: the questions were: 'In the last 12 months, have you been involved in any organised voluntary activities?' and 'In the last 12 months, have you participated in any activities of the following organisations? (Multiple answers possible)'. Base: all respondents.

Source: Flash Eurobarometer 408, 'European Youth', 2014

At least one political or cultural activity

A
youth club

None

The majority of those involved in voluntary activities choose projects and services aimed at bringing benefits to their local community (Figure 8-D). The proportion of young Europeans who have undertaken these types of activity have registered an increase since 2011, especially in Spain, France and Poland.

Figure 8-D: EU Youth Indicator: Share of young people (aged 15-30) who undertook voluntary activities aimed at changing their local communities, by country, 2011 and 2014

EU youth indicator

%    %

Note: the question was: 'Were these voluntary activities aimed at changing something in your local community?'. Base: all respondents. EU-27 (2011) and EU-28 (2014)

Source: Flash Eurobarometer 319, 'Youth on the Move', 2011 and Flash Eurobarometer 408, 'European Youth', 2014

Despite the local focus favoured by many young volunteers, others are involved in charitable activities with a particular focus on humanitarian and development aid – causes which have a definite global dimension (Figure 8-E). Education, training and sports are also popular activities. Conversely, other issues such as the environment, animal welfare, as well as political, cultural and religious causes seem to have less appeal.


Figure 8-E: Main themes of the voluntary activities undertaken by young people (aged 15-30), EU-28 average, 2014

%

Charity, humanitarian and development aid

Education, training or sport

Culture or art

Human rights

Religion

Animal welfare

Climate change or the environment

Politics

%

Note: the question was: 'In the last 12 months, which of the following were your voluntary activities related to? (Multiple answers possible)'. Base: all respondents.

Source: Flash Eurobarometer 408, 'European Youth', 2014

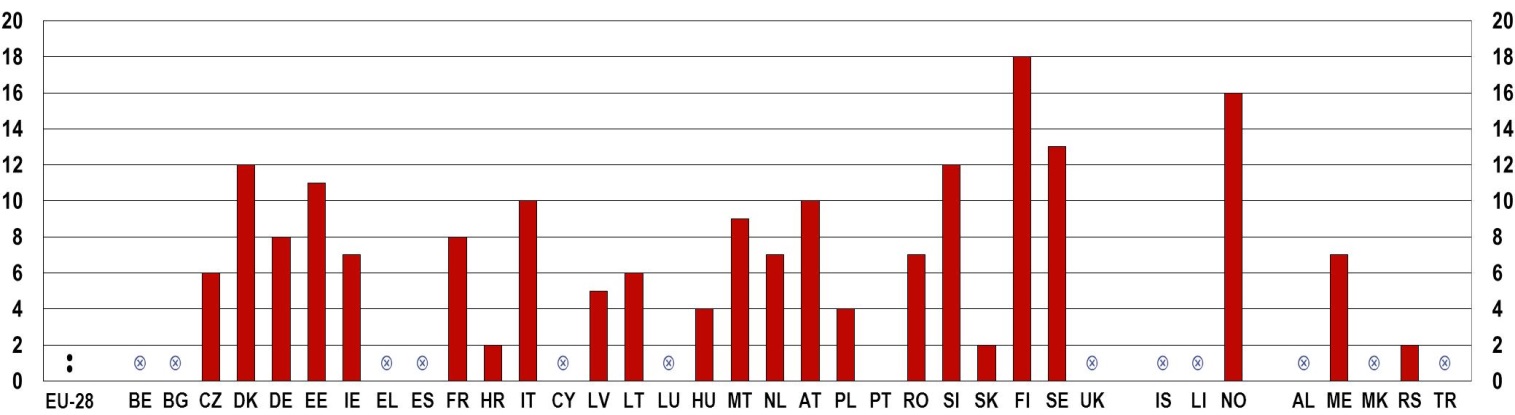
Young volunteers are mostly engaged in activities within their own country, a finding in line with their propensity to engage in actions which benefit their local community, as illustrated above. Although young people's international mobility has increased over recent years bringing many young Europeans to live, study and work in other European countries, as discussed in the first chapter of this report, serving in cross-border voluntary organisations does not seem to be a major reason for young people to leave their country of origin: only around 2% of individuals in the European Union report having volunteered abroad (Figure 8-F).

Figure 8-F: EU youth indicator: Share of young people (aged 15-30) going abroad to do voluntary work, by country, 2011 and 2014

EU youth indicator

%    %

Note: the question was: 'Have you ever had the opportunity to stay abroad for the purpose of volunteering?'. Base: all respondents. EU-27 (2011) and EU-28 (2014)

Source: Flash Eurobarometer 319, 'Youth on the Move', 2011 and Flash Eurobarometer 408, 'European Youth', 2014

Even in those countries where the percentage of young volunteers going abroad is highest (Bulgaria, Denmark, Ireland, Lithuania, Hungary, the Netherlands) the figure does not exceed 6% of the total number of respondents. Significant variations have occurred in several countries since 2011. While Belgium, Ireland, Luxembourg and the United Kingdom have experienced a sharp decline in the number of young people going abroad to volunteer, Lithuania, Hungary, and the Netherlands have seen a substantial increase.

Overall, data show that participation in voluntary activities either at home or abroad involves around a quarter of young Europeans. While this figure is encouraging, the potential for non-formal learning and personal growth attached to voluntary work can be further appreciated and exploited by young generations. To this end, it is interesting to shed some light on the barriers which prevent more widespread access to voluntary projects.

8.3. Encouraging youth participation in voluntary activities

Two of the most important factors which facilitate the participation of young people in voluntary activities are the possibility of receiving financial compensation for the expenses incurred during their period of volunteering, and the right to obtain formal recognition of the personal and professional experience acquired ( 6 ).

Almost one in three young volunteers does not receive any contribution towards the living and travelling costs incurred.

The fact that the costs of volunteering activities must usually be borne by the individual concerned can represent a powerful disincentive for those who do not possess enough personal or family resources to bear the financial burden arising from a sustained period of non-remunerated work. This is even more crucial when considering volunteering abroad, which generally involves higher personal expenses. Furthermore, leaving the country of origin often means the loss of social benefits (such as unemployment benefits) and insurance, which can mean that going abroad is even more difficult ( 7 ). In this respect, contributions to expenses incurred such as living and travel costs can open volunteering up to a wider audience, particularly to individuals from to disadvantaged social groups who, perhaps, could benefit most in terms of improving their educational and professional skills.

Available data from the Eurobarometer survey of 2014 indicate that half of young volunteers in the European Union have incurred expenses to cover living and travel costs during their volunteering experiences (Figure 8-G).

Figure 8-G: Contributions towards living expenses received by young people (aged 15-30) during voluntary activities, EU-28, 2014

%

You haven't incurred any expenses

You incurred expenses,
but you haven't received any contributions

You incurred expenses and you have received contributions from organisation(s) or group(s) of people you have volunteered for

You incurred expenses and you have received contributions from a government or other public body

You incurred expenses and you have received contributions from family or relatives or friends

You incurred expenses and
you have received contributions from a commercial organisation

Note: the question was: 'Have you incurred any expenses in relation to your voluntary activities and have you received any contributions for these expenses?'. Base: all respondents who have participated in a voluntary activity.

Source: Flash Eurobarometer 408, 'European Youth', 2014

Almost one third of young volunteers have not received any contributions towards expenses incurred. This finding might be linked with the propensity of young volunteers to engage in activities for the benefit of their local communities instead of taking up opportunities to volunteer abroad. Amongst those who have received support, the majority did so from the organisations for which they volunteered. Contributions from public bodies and families and/or friends account for only a small percentage.

Formal recognition of volunteering experiences also plays a major role in encouraging young people to engage ( 8 ). As mentioned above, by participating in voluntary activities, volunteers acquire skills or enhance their personal and professional capabilities through non-formal learning. Such skills can later be useful in either continuing education or entering the labour market, especially when they are formally recognised through qualifications that can enrich their curriculum vitae.

On average, only a quarter of young people who have participated in voluntary activities have received a certificate or diploma formally recognising their experience and the skills they have demonstrated, a percentage that has slightly increased since 2011 (Figure 8-H).

Figure 8-H: EU Youth Indicator: Share of young people (aged 15-30) who received a certificate or diploma for their voluntary activities, by country, 2011 and 2014

EU youth indicator

%    %

Note: the question was: 'Did you receive a certificate, diploma or other formal recognition for your participation in these voluntary activities?'. Base: all respondents. EU-27 (2011) and EU-28 (2014)

Source: Flash Eurobarometer 319, 'Youth on the Move', 2011 and Flash Eurobarometer 408, 'European Youth', 2014

Only a quarter of young people who have participated in voluntary activities have received a certificate or diploma formally recognising their experience and the skills they have demonstrated.

This percentage has grown significantly in Denmark, France, Latvia and Luxembourg, while it has declined in the Czech Republic. The latter is one of the European countries where, in general, a very small proportion of young people receive formal recognition for their volunteering experience; the others are Belgium, France, the Netherlands, Slovakia and Sweden. The highest percentages are found in Germany, Cyprus, Luxembourg, Poland and Romania.

Recognition of the skills acquired through volunteering can be particularly complicated when the activity has been carried out in a country different from the one where the individual wishes to either continue his/her education or seek employment, due to differences between national validation systems ( 9 ). The combination of challenges such as these can make volunteering abroad all the more difficult.


9. CULTURE AND CREATIVITY

EU Youth Indicators

Share of young people who have undertaken
one or more cultural activities at least once in the preceding 12 months

Figure 9-A

Share of young people who have undertaken
an amateur artistic activity at least once in the preceding 12 months

Figure 9-B

Share of young people who have been active in
a sports club, youth club or cultural organisation at least once in the preceding 12 months

Figure 9-C

Share of young people (aged 15-30) who say that they have been active in a sports club,
youth club or cultural organisation at least once in the preceding 12 months

Figure 9-E

Daily computer and Internet use among young people

Figure 9-G

9.1. Introduction

Participation in cultural, artistic and recreational activities is a vital part of young people's lives. Besides providing an opportunity for enjoyment and stimulating creativity, involvement in these activities is an important way for young people to develop their personal, social and professional skills. Cultural engagement can provide them with the opportunities to acquire non-formal competencies that can be used in further education and vocational training as well as in professional development. In addition, involvement in cultural and artistic activities facilitates socialisation and integration into the community and therefore encourages active participation and social inclusion ( 10 ).

The development and increased use of new technologies applied to social communication and cultural enjoyment rapidly transform the way young people experience culture and the arts. This therefore offers an interesting perspective to observe what the general trends are in the way young people get involved in cultural activities and to what extent they have taken advantage of existing opportunities to be active participants in creative experiences.

The chapter firstly presents data on youth participation in a variety of cultural and recreational activities, and explores the most widespread obstacles to access to culture. The second part deals with young people's use of the new information and communications technologies for cultural purposes, as well as more generally in terms of frequency of use and level of skills. The final section addresses young people's views about creativity and looks at the types of creative activities they engage in online.

9.2. Cultural participation

Between 2011 and 2014, a general decline in youth participation in cultural and artistic activities has taken place.

Results from two Eurobarometer surveys, conducted in 2011 and 2014 respectively, shed light on the levels of and variations in young people's participation in various cultural activities. The main trend that emerges is a general decline in the extent to which young Europeans have taken part in these experiences over the three years in question. For each of the activities examined (visits to historical monuments, museums and galleries, going to the cinema or concerts, or attending live performances), the proportion of young individuals who have participated at least once in the 12 months prior to the survey has declined in the majority of countries (Figure 9-A).

Figure 9-A: EU Youth Indicator: Share of young people (aged 15-30) who have undertaken one or more of the following cultural activities at least once in 12 months preceding the survey, by country, 2011 and 2014

a) Visited historical monuments (palaces, castles, churches, gardens, etc.), museums or galleries

EU youth indicator

 %     %

b) Been to the cinema or a concert

EU youth indicator

 %     %

c) Been to a theatre, a dance performance or an opera

EU youth indicator

 %      %

Note: the question was 'In the last 12 months, have you undertaken any of the following cultural activities?' (MULTIPLE ANSWERS POSSIBLE). Base: all respondents. EU-27 (2011) and EU-28 (2014)

Source: Flash Eurobarometer 'Youth on the Move' 319, 2011 and Flash Eurobarometer 'European Youth' 408, 2014

On average, the strongest decline is registered in the proportion of young people going to the theatre, dance performance or opera (-14 %), followed by going to the cinema and concerts (-9 %) and visiting historical monuments, museums and galleries (-6 %).

The decline in participation is significant and consistent across the three types of activity amongst young people in Bulgaria, Hungary, Romania and Slovenia. Drops in the share of young people going to the cinema and concerts and to the theatre, dance performances and opera is notable also in Greece, Italy, Cyprus, and Malta. Similar reductions in the proportion of young people going to live performances can be observed in Germany, Ireland and Austria.

The declining trend in participation in cultural activities is similar to that for undertaking an amateur artistic activity. The most significant fall in the level of involvement is registered again in Bulgaria, Greece, Italy, Cyprus, Hungary, Romania and Slovenia (Figure 9-B).

Figure 9-B: EU Youth Indicator: Share of young people (aged 15-30) who have undertaken an amateur artistic activity at least once in the 12 months preceding the survey, by country, 2011 and 2014

EU youth indicator

 %     %

Note: the question was 'In the last 12 months, have you participated in an amateur artistic activity (playing a musical instrument, singing, acting, dancing, writing poetry, photography, film making)?'. Base: all respondents. EU-27 (2011) and EU-28 (2014)

Source: Flash Eurobarometer 'Youth on the Move' 319, 2011 and Flash Eurobarometer 'European Youth' 408, 2014

In addition, a smaller proportion of young people have joined cultural and recreational organisations, such as youth organisations, sports clubs and cultural associations over the last three years. Again, the most notable decrease has taken place in the same group of countries as above (Bulgaria, Ireland, Greece, Italy, Hungary, Romania and Slovenia) to which Estonia, Lithuania, Austria, and Slovakia must also be added (Figure 9-C).

Figure 9-C: EU Youth Indicator: Share of young people (aged 15-30) who have been active in a sports club, youth club or cultural organisation at least once in the 12 months preceding the survey, by country, 2011 and 2014

a) Sport club

EU youth indicator

 %     %

b) A youth club, leisure-time club or any kind of youth organisation

EU youth indicator

 %     %

c) A cultural organisation

EU youth indicator

 %     %

Note: the question was 'In the last 12 months, have you participated in any activities of the following organisations?'. Base: all respondents. EU-27 (2011) and EU-28 (2014)

Source: Flash Eurobarometer 'Youth on the Move' 319, 2011 and Flash Eurobarometer 'European Youth' 408, 2014

The consistent drop in figures for all indicators in the EU in general, and in several Member States in particular, hints at the existence of general underlying causes for the decline in the numbers of young Europeans becoming involved in cultural activities. It seems likely that the economic crisis affecting the European continent over recent years, which has exacted a high economic and social price in several countries, has played a part. Plummeting levels of employment and the growing financial insecurity suffered by many Europeans, in particular the younger generation, have meant that many do not have the means to enjoy cultural events ( 11 ). As discussed in the chapter on Social Inclusion, the last few years have seen a dramatic worsening in the social conditions of significant segments of the youth population, which reflects in all areas of life.

The findings of a recent survey exploring the main reasons for young people not participating in cultural activities is in line with this argument. Over a third of respondents felt the cost of going to the cinema or concerts (the most popular forms of entertainment for young audiences) to be the most important obstacle (Figure 9-D). For other cultural activities such as the theatre, dance performances, and visits to museums and monuments, a lack of interest and time appear as the main reasons for not taking part.


Figure 9-D: Reasons for young people (aged 15-24) not attending various cultural activities in the 12 months preceding the survey, EU-28 average, 2013

 %     %

Too
expensive

Lack of
time

Lack of
interest

Lack of
information

Limited choice or poor quality of this activity in the place where you live

Concerts

Cinema

Theatre

Ballet

Monument

Museum

Note: the question was 'For each of the following activities, please tell me why you haven't done it or haven't done it more often in the last 12 months'. Base: all respondents.

Source: Special Eurobarometer 399, 'Cultural access and participation', 2013

In terms of gender, being active in a sports club is the activity where differences between young men and women are most apparent (Figure 9-E). According to Eurobarometer data, men tend to participate more than women, a result in line with men's higher propensity to play sports, as illustrated in the chapter on Health and Well-being.

Figure 9-E: EU youth indicator: Share of young people (aged 15-30) who have been active in a sports club, youth club or cultural organisation at least once in the 12 months preceding the survey, by sex, EU-28 average, 2014

EU youth indicator

 %     %

Note: the question was 'In the last 12 months, have you participated in any activities of the following organisations?'. Base: all respondents.

Source: Flash Eurobarometer 'European Youth' 408, 2015

The trends discussed so far pertain to certain cultural activities that are not immediately influenced by the growth of new developments in information and communications technology. Yet, the latter play an ever larger role in shaping the ways people can access and enjoy cultural experiences, especially young people who are the most receptive to the developments these new media bring about. The next section will therefore address the extent and nature of use of these media by young Europeans, in general, and as a medium for accessing cultural experiences.

9.3. Young people and their use of ICT

According to the results reported by a Eurobarometer survey from 2013, young people are the group in the general population which uses the internet the most for cultural purposes (Figure 9-F).

Figure 9-F: Share of the population using the Internet for cultural purposes at least once a week, by age, EU-28 average, 2013

 %     %

Note: the question was 'How often do you use the Internet for cultural purposes like, for instance, searching for cultural information, buying cultural products or reading articles related to culture?'. Base: all respondents.

Source: Special Eurobarometer 399 'Cultural access and participation', 2013

15-24

25-39

40-54

55+

Daily use of computers by young people aged 16-24 has slightly declined while access to the Internet has grown in almost all Member States.

As in the case of political participation (discussed in Chapter 7), young people have been the first to apply communication technologies to their social interactions. This also reflects on the way they access, enjoy and initiate cultural experiences. To this end, access to and proficiency in the use of computers and the Internet are essential. According to data collected by Eurostat, between 2011 and 2014 the level of use of computers and the Internet amongst young Europeans have followed different trends (Figure 9-G). While levels of daily access to computers have generally decreased in the majority of countries, rates of daily use of the Internet have increased. This situation can be explained by the growth in alternative channels to access the Internet such as mobile or smart phones which are heavily used by young people ( 12 ). They probably have partially replaced the desktop type of personal computer as a main gateway to online connectivity at home.

The biggest decreases in daily computer use are observed in Spain, Croatia, Luxembourg, the Netherlands, Finland and Sweden. Conversely, higher rates have been recorded in the Czech Republic, Greece, Malta, and especially in Romania. These latter countries (Czech Republic, Greece, Malta and Romania) are, together with Hungary and Portugal, also those where the proportion of young people who have daily access to the Internet has increased the most since 2011.

Figure 9-G: EU Youth Indicator: Daily computer and Internet use among young people (aged 16-24), by country, 2011 and 2014

a) Daily computer use

EU youth indicator

 %     %

b) Daily Internet use

EU youth indicator

 %     %

Source: Eurostat [isoc_ci_cfp_fu]

On average, the proportion of young people with a good level of computer skills (measured by Eurostat as the ability to perform five or six tasks, that means all or almost all tasks from a list of six selected computer-related activities in the survey) has remained stable at around 45 % in Europe (Figure 9-H). Significant improvements have been observed in some countries (Bulgaria, Germany, Estonia, France, Malta, Portugal and Poland), while negative trends appear in particular in Croatia, Hungary, Austria and Sweden.

Figure 9-H: Share of young people (aged 16-29) who have carried out at least five of the specified computer-related activities, by country, 2011 and 2014

 %     %

Note: the computer related activities surveyed and used for skills aggregation were: copying or moving a file or folder; using copy and paste tools to duplicate or move information within a document; using basic arithmetic formulas in a spreadsheet; compressing (or zipping) files; connecting and installing new devices, e.g. a modem; writing a computer programme using a specialised programming language.

Source: Eurostat [isoc_sk_cskl_i]

Eurostat data also show that the gap in the use of ICT between young people who have acquired different levels of education has reduced. Indeed, the decline in the daily use of computers recorded since 2011 has been lower among young people with a low level of formal education than for those with higher level formal qualifications (Figure 9-I-a). In parallel, the growth in the share of young people having daily access to the Internet has been more remarkable amongst those who have only a low level of educational attainment (Figure 9-I-b).

Figure 9-I: Daily computer and Internet use among young people (aged 16-24) by level of education, EU-28 average, 2011 and 2014

a) Computer daily use

b) Internet daily use

 %     %

 %     %

A

Low-level formal education

B

Medium-level formal education

C

High-level formal education

Note: According to Eurostat's Statistics Manual, a low level of formal education corresponds to no formal education or the completion of primary or lower secondary education only (corresponding to ISCED 0, 1 or 2); medium-level formal education corresponds to upper secondary education (ISCED 3 and 4); and high-level formal education corresponds to tertiary education (ISCED 5, 6, 7 or 8). For data on educational attainment based on the EU Labour Force Survey (EU-LFS) the International Standard Classification of Education 2011 (ISCED 2011) is applied as from 2014. Up to 2013 ISCED 1997 is used

Source: Eurostat [isoc_ci_ifp_fu]

However, evident disparities still exist in terms of the computer skills demonstrated by high- and low-attaining young people. On average, almost twice as many young individuals who have attained a high level of formal education possess good computer skills compared to individuals with a lower level of attainment (Figure 9-J). The biggest differences between the two groups are found in Belgium, Bulgaria, Ireland, Greece, Malta and Romania.


Figure 9-J: Share of young people (aged 16-24) who have carried out at least five computer related activities, by country and level of education, 2014

 %     %

Level of formal education:

Low

Medium

High

Note: According to Eurostat's Statistics Manual, a low level of formal education corresponds to no formal education or the completion of primary or lower secondary education only (corresponding to ISCED 0, 1 or 2); medium-level formal education corresponds to upper secondary education (ISCED 3 and 4); and high-level formal education corresponds to tertiary education (ISCED 5, 6, 7 or 8). Computer related activities surveyed and used for skills aggregation were: copying or moving a file or folder; using copy and paste tools to duplicate or move information within a document; using basic arithmetic formulas in a spreadsheet; compressing (or zipping) files; connecting and installing new devices, e.g. a modem; writing a computer programme using a specialised programming language.

Source: Eurostat [isoc_sk_cskl_i]

9.4. Creativity

Young people's creativity and capacity for innovation are important skills for their active participation in society. Engaging in creative experiences also fosters the development of transversal soft-skills such as finding new ways to tackle problems, being able to handle risk and learn from failure, and adapting knowledge to new applications, which in turn help improve employability and entrepreneurial potential ( 13 ).

When asked about the perceived importance of being creative, a majority of young respondents to a survey conducted in 2012 indicated that they valued the ability to develop innovative ideas and creative thinking (Figure 9-K).

Figure 9-K: Share of young people (aged 15-29) saying that it is important to think new ideas and be creative, EU-27 average, 2012

 %     %

Note: the question asked respondents to what extent the statement 'It is important to think new ideas and being creative' was similar to their own opinion. Base: all respondents.

Source: European Social Survey, 2012

Very much like me

Like
me

Somewhat like me

A little like me

Not like
me

Not like me
at all

Unfortunately, evidence about the ways in which young people actually participate in creative activities is still limited. A Eurobarometer survey conducted in 2013 sheds some light on young people's use of the internet for creative activities. According to the results, young respondents tend to be engaged in such activities more than older ones (Figure 9-L). In particular, filming, photography, and sharing their own creative content online appear to be the most common activities amongst young people.

Figure 9-L: Share of the population undertaking creative activities during the 12 months preceding the survey, by age group, EU-28 average, 2013

 %     %

Made a film,
done some photography

Put own cultural content online, e.g. on an online social network or on a sharing site

Done creative computing such designing websites or blogs

Written a poem, an essay, a novel, etc.

Created own website or blog with cultural content

Note: questions were: 'What do you use the Internet for, in terms of cultural purposes?' and 'Please tell me if, in the last 12 months, you have either on your own or as part of an organised group or classes…'. Base: all respondents.

Source: Special Eurobarometer 399 'Cultural access and participation', 2013


10. YOUTH AND THE WORLD

EU Youth Indicators

Participation of young people in non-governmental organisations
active in the domain of climate change/environmental issues

Figures 10-B, 10-D and 10-E

Participation of young people in non-governmental organisations
promoting human rights or global development

Figure 10-C, 10-D and 10-E

Participation of young people in activities or projects aimed at fostering cooperation with young people from other continents

Figures 10-F and 10-G

10.1. Introduction

Today, young people are growing up in a world substantially different from the one in which their parents were raised. Globalisation shapes all aspects of their lives: they live in increasingly diverse societies, consume global goods and culture, and have jobs in globally integrated economies. While this presents new opportunities, it also carries high levels of uncertainties and risks ( 14 ). Globalisation affects not only young people's work prospects, but also their identity, sense of citizenship and patterns of political engagement ( 15 ) (see also Chapter 7). In this respect, their experiences could make them more prone to engage with global issues such as human rights, climate change or environmental protection ( 16 ).

Based on Eurobarometer surveys, this section therefore looks at the extent to which young Europeans are actually engaged with global issues, as well as at how much they participate in activities designed to foster cooperation between young people from different continents.

10.2. Young people's engagement with global issues

Young people's engagement with global issues can take various forms. Organised action, for example through non-governmental organisations (NGOs), requires the most active commitment. However, young people can also contribute to global issues through small-scale, individual and everyday activities ( 17 ). As a recent Eurobarometer survey on young people demonstrates, a large proportion of young people are indeed engaged with global issues like sustainable development and climate change at various different levels (Figure 10-A).

Figure 10-A: Proportion of young people (aged 16-30) taking actions in everyday life to protect the environment and combat climate change, EU-28 average, 2014

 %

Systematically sorting waste

Reducing water and energy consumption at home

Reducing consumption of disposable items

Using more environmentally-friendly means of transport

Systematically buying local products

Using the car less often and more efficiently

Better insulating the home/place of living

Avoiding going by plane for short-haul flights

None

 %

Notes: Question: 'Which of the following steps to protect the environment and combat climate change have you taken personally?' – 'Systematically sorting your waste'; 'Reducing your water and energy consumption at home (electricity, heating, household appliances)'; 'Reducing your consumption of disposable items (plastic bags, useless packaging)'; 'Changing your mode of transport to use a more environmentally-friendly means of transport'; 'Systematically buying local products'; 'Using your car less often and more efficiently (e.g. car-sharing)'; Carrying out the necessary work to better insulate your home/place where you live'; 'Avoiding going by plane for short-haul flights' (Multiple answers possible). Base: all respondents. Source: Flash Eurobarometer of the European Parliament (EP EB395) on 'European Youth in 2014', 2014

As Figure 10-A shows, a large majority of European youth has adopted certain lifestyle changes in order to protect the environment and combat climate change. The most common actions include sorting waste systematically (74 %), reducing water and energy consumption at home (65 %), and reducing the consumption of disposable items like plastic bags (58 %).

While many young Europeans take actions in everyday life to combat global problems, only a small fraction are actively engaged in organisations that pursue globally relevant issues.

Nevertheless, when it comes to young Europeans' active engagement with global issues through more organised activities, their commitment is relatively low. Another recent Eurobarometer survey on 'European Youth' finds that only 3.1 % participate in NGOs active in the domain of climate change or other environmental issues, while 4.7 % do so in the areas of promoting human rights or global development (Figures 10-B and 10-C). In contrast, 11 % of young people participate in NGOs aimed at improving their local community (see Figure 7-I).

Figure 10-B: EU youth indicator: Participation of young people (aged 15-30) in non-governmental organisations active in the domain of climate change/environmental issues, self-reported participation in the 12 months preceding the survey, by country, 2011 and 2014

EU youth indicator

%    %

Notes: Question: 'Have you in the past year participated in any activities of the following organisations?' - 'An organisation active in the domains of global climate change/global warming' (2011), 'An organisation active in the domain of climate change/environmental issues' (2014) (Multiple answers possible.)

Base: all respondents, % of 'yes' answers by country, EU-27 (2011) and EU-28 (2014)

Source: Flash Eurobarometer 319a, 'Youth on the Move', 2011 and Flash Eurobarometer 408, 'European Youth', 2015


Figure 10-C: EU youth indicator: Participation of young people (aged 15-30) in non-governmental organisations promoting human rights or global development, self-reported participation in the 12 months preceding the survey, by country, 2011 and 2014

EU youth indicator

%    %

Notes: Question: 'Have you in the past year participated in any activities of the following organisations?' - 'An organisation promoting human rights or global development' (Multiple answers possible.)

Base: all respondents, % of 'yes' answers by country, EU 27 (2011) and EU 28 (2014)

Source: Flash Eurobarometer 319a, 'Youth on the Move', 2011 and Flash Eurobarometer 408, 'European Youth', 2015

In general, across the EU-28, more young people participate in NGOs working in the field of human rights or global development than in climate change or environmental issues. However, there are large differences between countries. Young people's participation in both fields tends to be higher in western (and especially northern) European countries than in eastern Europe, though not without exceptions. Regarding climate change and environmental issues, young people's participation rates range from zero or nearly zero per cent in Croatia and Romania to over 6 % in Luxembourg (6.2 %) and Sweden (7.2 %). With respect to human rights and global development, young people participate the least in NGOs in Bulgaria (0.8 %), Croatia and Romania (both at 1.4 %), while they tend to be the most active in Denmark (10.4 %), Ireland (11.7 %) and Sweden (16.2 %). The active engagement of young people in Sweden is exceptionally high within the EU-28.

As Figures 10-B and 10-C show, young people's participation in NGOs in these globally relevant areas stayed relatively stable across the EU ( 18 ) between 2011 and 2014, with a small decrease in the field of human rights promotion and global development (from 5.2 % to 4.7 %). Due to small sample sizes, comparisons across time by country should be made cautiously. Nevertheless, relatively significant falls in young people's participation in NGOs across both fields occurred in Bulgaria, France and Romania; in Spain, however, there was a substantial increase. In the area of promoting human rights and global development, significant changes took place in Greece and Italy (a decrease) as well as in Ireland and Sweden (an increase).

But who are these young people who are actively engaged with global issues? The Eurobarometer on 'European Youth' indicates that while young women and men are equally active in NGOs dealing with global problems, women tend to be more interested in human rights promotion and global development, while men are relatively more likely to engage with environmental issues (Figure 10-D-b). Furthermore, young people over the age of 25 are more likely to be active in these fields than their younger peers: 43 % of young respondents participating in relevant NGOs were between 25 and 30 years of age (Figure 10-D-a).

Figure 10-D: EU youth indicator: Young people (aged 15-30) participating in non-governmental organisations active in the domains of climate change/environmental issues, human rights or global development in the 12 months preceding the survey, EU-28 average, 2014

EU youth indicator

a) by age

b) by issue and by sex

Climate Change

Aged

Female

15-19

Male

20-24

Human rights

25-30

Female

Male

Notes: Question: Have you in the past year participated in any activities of the following organisations?' 'An organisation active in the domain of climate change/environmental issues'; 'An organisation promoting human rights or global development' (Multiple answers possible.)

Base: all respondents, % of 'yes' answers, EU-28

Source: Flash Eurobarometer 408, 'European Youth', 2015

In addition, despite young people in their late twenties being more likely to be engaged with global issues, a large proportion of active young people are still in education: one third of those active in the field of climate change or environmental issues; and half of those engaged with human rights promotion or global development (Figure 10-E). Among the young people who have finished their education, the longer they studied, the more likely it is that they actively participate in NGOs dealing with global challenges. This suggests that active engagement with globally relevant topics increases with the level of education.

Figure 10-E: EU youth indicator: Young people (aged 15-30) participating in non-governmental organisations active in the domain of climate change/environmental issues, human rights or global development, in the 12 months preceding the survey by education status (still in education or age of completion), EU-28 average, 2014

EU youth indicator

Climate change/environmental issues

Human rights or global development

Completed education at age :

15-

16-19

20+

Still in education

Notes: Questions: 'Have you in the past year participated in any activities of the following organisations?' - 'An organisation active in the domain of climate change/environmental issues'; 'An organisation promoting human rights or global development' (Multiple answers possible.); 'How old were you when you stopped full-time education?'

Base: all respondents, % of 'yes' answers, EU-28

Source: Flash Eurobarometer 408, 'European Youth', 2015

10.3. Cooperation among young people from different continents

At 3 %, the participation of European young people in activities or projects fostering cooperation with young people from other continents is also relatively low in the EU-28, and has even fallen from the 4 % reported in 2011 (Figure 10-F). For comparison, in 2014, 5 % (6 % in 2011) of young people reported having participated in activities and projects together with young people from other European countries ( 19 ).

Nevertheless, differences between countries are again substantial, with young people from eastern and southern European countries participating less in such activities than their peers from western and northern Europe. Participation rates of respondents are the lowest in Greece (0.3 %), Cyprus (1.3 %) and Romania (1.4 %), and the highest in Finland (7 %), Belgium (7.4 %) and Luxembourg (9.2 %). Luxembourg is the only country with a significant increase since 2011 in young people's participation in activities together with young people from other continents. The countries with the largest falls in participation rates are Germany, Greece and Austria (see Figure 10-F).

Figure 10-F: EU Youth Indicator: Participation of young people (aged 15-30) in activities or projects aimed at fostering cooperation with young people from other continents, self-reported participation in the 12 months preceding the survey, by country, 2011 and 2014

EU youth indicator

%    %

Notes: Question: 'Have you participated in any activities or projects during the past year aimed at fostering cooperation with youth from other countries?' – 'Yes, in activities or projects with young people from other continents' (Multiple answers possible.)

Base: all respondents, % of 'yes' answers by country, EU-27 (2011) and EU-28 (2014)

Source: Flash Eurobarometer 319a, 'Youth on the Move', 2011 and Flash Eurobarometer 408, 'European Youth', 2015


Figure 10-G: EU youth indicator: Young people (aged 15-30) participating in activities or projects aimed at fostering cooperation with young people from other continents in the 12 months preceding the survey, EU-28 average, 2014

EU youth indicator

a) by age

b) by education status

Completed education at age:

Aged

15-

15-19

16-19

20-24

20+

25-30

Still in education

Notes: Question: 'Have you participated in any activities or projects during the past year aimed at fostering cooperation with youth from other countries?' – 'Yes, in activities or projects with young people from other continents' (Multiple answers possible.); 'How old were you when you stopped full-time education?'

Base: all respondents, % of 'yes' answers, EU-28

Source: Flash Eurobarometer 408, 'European Youth', 2015


The majority of young people participating in projects together with young people from other continents are still in education.

In contrast to NGO participation in globally relevant domains, the likelihood of participating in activities or projects together with young people from other continents does not increase with age: the young people most likely to be involved in such activities are in their early twenties (Figure 10-G-a). In addition, a large majority of respondents (58 %) are still studying, and only 16 % of participating young people completed their education before they turned 20 (Figure 10-G-b). This suggests that many of the cooperation activities are linked to higher education studies and exchanges.


REFERENCES

Aassve, A., Davia, M.A., Iacovou, M. and Mazzuco, S., 2007. Does leaving home make you poor? Evidence from 13 European countries. European Journal of Population 23(3), p. 315-338.

Barber, T., 2010. Participation, Citizenship and Well-Being: Engaging with Young People, Making a Difference. In: Young, 17, p. 25-40.

Bellani, L. and Bia, M., 2013. Measuring intergenerational transmission of poverty. Paper presented at the fifth meeting of the Society for the Study of Economic Inequality (ECINEQ), Bari (Italy), July 22-24, 2013. Available at: www.ecineq.org/ecineq_bari13/FILESxBari13/CR2/p72.pdf [Accessed 1 April 2015].

Bloom, D.E., Canning, D., Fink, G. and Finlay, J.E., 2008. The high cost of low fertility in Europe. In: Working Paper Series. Harvard University Programme on the Global Demography of Ageing. Working Paper 32.

Bourn, D., 2008. Young people, identity and living in a global society. In: Policy & Practice – A Development Education Review, 7, p. 48-61.

Branas, C.C., Kastanaki, A.E., Michalodimitrakis, M., Tzougas, J., Kranioti, E.F., Theodorakis, P.N., Carr, B.G. and Wiebe, D.J., 2015. The impact of economic austerity and prosperity events on suicide in Greece: a 30-year interrupted time-series analysis. In: BMJ Open, 5(1), e005619.

Broh, B.A., 2002. Linking Extracurricular Programming to Academic Achievement: Who Benefits and Why? In: Sociology of Education, Jan 2002, 75, p.69-95.

Buchmann, M.C. and Kriesi, I., 2011. Transition to Adulthood in Europe. In: Annual Review of Sociology, 37, p. 481-503.

CEDEFOP (European Centre for the Development of Vocational Training), 2010. The skill matching challenge. Analysing skill mismatch and policy implications. Luxembourg: Publications Office of the European Union. Available at http://www.cedefop.europa.eu/en/publications-and-resources/publications/3056 [Accessed 4 June 2015].

Coombs, P.H., Prosser, C. and Ahmed, M., 1973. New Paths to Learning for Rural Children and Youth. New York: International Council for Educational Development.

Council of Europe, 2005. Trading up Potential and performance in non-formal learning. Strasbourg: Council of Europe.

Council of the European Union, 2011. Council conclusions on a benchmark for learning mobility, 3128th EDUCATION, YOUTH, CULTURE and SPORT Council meeting, Brussels, 28 and 29 November 2011. Available at: http://www.consilium.europa.eu/uedocs/cms_data/docs/pressdata/en/educ/126380.pdf [Accessed 9 March 2015].

EACEA (Education, Audio-visual and Culture Executive Agency), 2011. Volunteering in the European Union. Luxembourg: Publications Office of the European Union. Available at: http://ec.europa.eu/citizenship/pdf/doc1018_en.pdf [Accessed 27 May 2015].

EACEA, 2013. Youth Participation in Democratic Life. [Online]. Available at: http://eacea.ec.europa.eu/youth/tools/documents/lse_study_on_youth_participation_2013.pdf [Accessed 4 June 2015].

EENEE (European Expert Network on Economics of Education), 2014. The economic case for education. EENEE Analytical Report No. 20. Prepared for the European Commission.

EMCDDA (European Monitoring Centre for Drugs and Drug Addiction), 2012. EU Drug Markets Report: A Strategic Analysis. Case study 3: New psychoactive substances: 73 detected in 2012. Available at: http://www.emcdda.europa.eu/attachements.cfm/att_194349_EN_Case%20study%203_New%20psychoactive%20subst_Final.pdf [Accessed 26 January 2015].

EMCDDA, 2014. European Drug Report: Trends and Developments. Luxembourg: Publications Office of the European Union.

EPHA (European Public Health Alliance), 2014. Growing up in the unhappy shadow of the economic crisis: Mental health and well-being of the European child and adolescent population. Brussels: EPHA.

ETUI (European Trade Union Institute) 2015, Benchmarking Working Europe 2014, Brussels: ETUI aisbl.

Eurofound (European Foundation for the Improvement of Living and Working Conditions), 2011a. Foundation findings: Youth and Work. Luxembourg: Publications Office of the European Union.

Eurofound, 2011b. Young people and NEETs in Europe: First Findings. Luxembourg: Publications Office of the European Union.

Eurofound, 2012. NEETs: Young people not in employment, education or training: Characteristics, costs and policy responses in Europe. Luxembourg: Publications Office of the European Union.

Eurofound, 2013a. Working conditions of young entrants to the labour market, Luxembourg: Publications Office of the European Union.

Eurofound, 2013b. Young People and temporary employment in Europe. Luxembourg: Publications Office of the European Union.

Eurofound, 2014a. Mapping youth transitions in Europe. Luxembourg: Publications Office of the European Union.

Eurofound, 2014b. Social situation of young people in Europe. Luxembourg: Publications Office of the European Union.

European Commission, 2010a. COM(2010) 758 final, Communication From The Commission To The European Parliament, The Council, The European Economic And Social Committee And The Committee Of The Regions - The European Platform against Poverty and Social Exclusion: A European framework for social and territorial cohesion. Brussels.

European Commission, 2010b. Special Eurobarometer 331. EU citizens' attitudes towards alcohol. [pdf] Available at: http://ec.europa.eu/health/alcohol/docs/ebs_331_en.pdf [Accessed 4 June 2015].

European Commission, 2010c. Special Eurobarometer 334. Sport and physical activity. [pdf] Available at: http://ec.europa.eu/public_opinion/archives/ebs/ebs_334_en.pdf [Accessed 4 June 2015].

European Commission, 2012a. EU Youth Report. Luxembourg: Publications Office of the European Union.

European Commission, 2012b. First European Survey on Language Competencies: Final Report. Luxembourg: Publication Office of the European Union. Available at: http://ec.europa.eu/languages/policy/strategic-framework/documents/language-survey-final-report_en.pdf [Accessed 25 March 2015].

European Commission, 2012c. Flash Eurobarometer 354. Entrepreneurship in the EU and beyond. [pdf] Available at http://ec.europa.eu/public_opinion/flash/fl_354_en.pdf [Accessed 2 February 2015].

European Commission, 2013a. Commission Staff Working Document. Assessment of the 2013 national reform programme and convergence programme for Latvia, SWD(2013) 364 final Brussels, 29.05.2013.

European Commission, 2013b. Commission Staff Working Document. Assessment of the 2013 national reform programme and convergence programme for Lithuania, SWD(2013) 365 final, Brussels, 29.05.2013.

European Commission, 2013c. Commission Staff Working Document. Confronting Homelessness in the European Union, SWD(2013) 42 final, Brussels, 20.2.2013.

European Commission, 2013d. Developing the creative and innovative potential of young people through non-formal learning in ways that are relevant to employability. Expert Group Report, May 2013.

European Commission 2014a. Education and Training Monitor. Luxembourg: Publication Office of the European Union.

European Commission, 2014b. Employment and Social Developments in Europe 2013. Luxembourg: Publications Office of the European Union.

European Commission, 2014c. Erasmus Impact Study: Effects of mobility on the skills and employability of students and the internationalisation of higher education institutions. Luxembourg: Publications Office of the European Union.

European Commission, 2014d. Erasmus: Facts, Figures & Trends. The European Union support for student and staff exchanges and university cooperation in 2012-2013. Luxembourg: Publications Office of the European Union.

European Commission, 2014e. EU Employment and Social Situation. Quarterly Review. Luxembourg: Publications Office of the European Union.

European Commission, 2014f. Special Eurobarometer 417. European Area of Skills and Qualifications. [pdf] Available at: http://ec.europa.eu/public_opinion/archives/ebs/ebs_417_en.pdf [Accessed 5 June 2015].

European Commission, 2014g. Flash Eurobarometer 378. The Experience of Traineeships in the EU. [pdf] Available at http://ec.europa.eu/public_opinion/flash/fl_378_en.pdf [Accessed 2 February 2015].

European Commission, 2014h. Working with young people: The value of youth work in the EU. Luxembourg: Publication Office of the European Union.

European Commission, 2014i. Flash Eurobarometer 401. Young people and drugs. [pdf] Available at: http://ec.europa.eu/public_opinion/flash/fl_401_en.pdf [Accessed 4 June 2015].

European Commission, 2014j. Special Eurobarometer 412. Sport and physical activity. [pdf] Available at: http://ec.europa.eu/public_opinion/archives/ebs/ebs_412_en.pdf [Accessed 4 June 2015].

European Commission, 2015a. ECHI – European Core Health Indicators. [Online] Available at: http://ec.europa.eu/health/indicators/echi/list/index_en.htm [Accessed 1 June 2015].

European Commission, 2015b. Flash Eurobarometer 408. European Youth. [pdf] Available at http://ec.europa.eu/public_opinion/flash/fl_408_en.pdf [Accessed 3 June 2015].

European Commission, 2015c. Special Eurobarometer 429. Attitudes of Europeans towards tobacco and electronic cigarettes. [pdf] Available at: http://ec.europa.eu/public_opinion/archives/ebs/ebs_429_en.pdf [Accessed 16 June 2015].

European Commission/EACEA, 2013. Youth Social Exclusion and Lessons from Youth Work. Available at: http://ec.europa.eu/youth/library/reports/eurydice-study-social-exclusion-2013_en.pdf [Accessed 17 March 2015].

European Commission/EACEA/Eurydice, 2013a. Political Participation and EU Citizenship: Perceptions and Behaviours of Young People. Evidence from Eurobarometer surveys. Available at: http://eacea.ec.europa.eu/youth/tools/documents/perception-behaviours.pdf [Accessed 16 January 2015].

European Commission/EACEA/Eurydice, 2013b. Towards a Mobility Scoreboard: Conditions for Learning Abroad in Europe. Luxembourg: Publications Office of the European Union.

European Commission/EACEA/Eurydice/Cedefop, 2014. Tackling Early Leaving from Education and Training in Europe: Strategies, Policies and Measures. Eurydice and Cedefop Report. Luxembourg: Publications Office of the European Union.

European Commission/EACEA/Eurydice/Eurostat, 2014. Key Data on Early Childhood Education and Care in Europe. 2014 Edition. Eurydice and Eurostat Report. Luxembourg: Publications Office of the European Union.

European Commission/EACEA/Eurydice, 2015. The European Higher Education Area in 2015: Bologna Process Implementation Report. Luxembourg: Publications Office of the European Union.

European Parliament, 2014. European Youth in 2014. Flash Eurobarometer of the European Parliament (EP EB395). [pdf] Available at: http://www.europarl.europa.eu/pdf/eurobarometre/2014/youth/eb_395_synthesis_youth_en.pdf [Accessed 5 February 2015].

Eurostat, 2015a. Being young in Europe today. Luxembourg: Publications Office of the European Union. Available at: http://ec.europa.eu/malta/pdf/being_young_in_europe_today.pdf [Accessed 27 July 2015].

Eurostat, 2015b. Glossary: At-risk-of-poverty rate. [Online] Available at: http://ec.europa.eu/eurostat/statistics-explained/index.php/Glossary:At-risk-of-poverty_threshold [Accessed 30 March 2015].

Eurostat, 2015c. Glossary: Equivalised disposable income. [Online] Available at: http://ec.europa.eu/eurostat/statistics-explained/index.php/Glossary:Equivalised_disposable_income [Accessed 30 March 2015].

Eurostat, 2015d. Glossary: Housing cost overburden rate. [Online] Available at: http://ec.europa.eu/eurostat/statistics-explained/index.php/Glossary:Housing_cost_overburden_rate [Accessed 23 March 2015].

Eurostat, 2015e. Glossary: Material deprivation. [Online] Available at: http://ec.europa.eu/eurostat/statistics-explained/index.php/Glossary:Material_deprivation [Accessed 30 March 2015].

Eurostat, 2015f. Glossary: Overcrowding rate. [Online] Available at: http://ec.europa.eu/eurostat/statistics-explained/index.php/Glossary:Overcrowding_rate [Accessed 23 March 2015].

Eurostat, 2015g. Glossary: Persons living in households with low work intensity. [Online] Available at: http://ec.europa.eu/eurostat/statistics-explained/index.php/Glossary:Work_intensity [Accessed 30 March 2015].

Eurostat, 2015h. Glossary: Severe Housing deprivation rate. [Online] Available at: http://ec.europa.eu/eurostat/statistics-explained/index.php/Glossary:Severe_housing_deprivation_rate [Accessed 23 March 2015].

Eurostat, 2015i. Housing conditions. [Online] Available at: http://ec.europa.eu/eurostat/statistics-explained/index.php/Housing_conditions [Accessed 27 March 2015].

Eurostat, 2015j. Europe 2020 indicators - poverty and social exclusion. [Online] Available at: http://ec.europa.eu/eurostat/statistics-explained/index.php/Europe_2020_indicators_-_poverty_and_social_exclusion [Accessed 4 June 2015].

Feixa, C, Pereira, I. and Juris, J.S., 2009. Global citizenship and the 'New, New' social movements: Iberian connections. In: Young, 17, p. 421-442.

Flisi, S., Goglio, V., Meroni, E.C., Rodrigues, M. and Vera-Toscano, E., 2014. Occupational mismatch in Europe: Understanding overeducation and overskilling for policy making. JRC Science and Policy Reports. Luxembourg: Publications Office of the European Union.

Flisi, S., Goglio, V., Meroni, E.C., Vera-Toscano, E. and Dragomirescu-Gaina, C., 2015. Skills beyond education: An analysis of cognitive skill evolution and its implications for employment chances. JRC Science and Policy Reports. Luxembourg: Publications Office of the European Union.

Furlong, A., 2002. Youth transitions and health: a literature review. Edinburgh: NHS Health Scotland.

Furlong, A., Cartmel, F., Biggart, A., Sweeting, H. and West, P., 2003. Youth Transitions: Patterns of Vulnerability and Processes of Social Inclusion. Edinburgh: NHS Health Scotland.

Gaiser, W., De Rijke, J., and Spannring, N., 2010. Youth and Political Participation. Empirical Results from Germany in an European Context. In: Young, 18, p. 9-32.

Hall, G., 2008. Civic connections: practicing democracy through debate clubs in the out-of-school time hours. In: S.L. Hill, ed., After School Matters: Creative Programs that Connect Youth Development and Student Achievement. Thousand Oaks: Corwin Press.

Harris, A., Wyn, J. and Younes, S., 2010. Beyond apathetic or activist youth. In: Young, 18(1), p. 9-32.

Haski-Leventhal, D., 2008. Youth volunteering for youth: Who are they serving? How are they being served? In: Children and Youth Services Review 30, p. 834-846.

Hauschildt, K., Gwosć, C., Netz, N. and Mishra, S., 2015. Social and Economic Conditions of Student Life in Europe. Synopsis of Indicators, EUROSTUDENT V 2012-2015. Bielefeld: W. Bertelsmann Verlag.

Hoikkala, T., 2009. The diversity of youth citizenships in the European Union. In: Young, 17(1), p. 5-24.

Iacovou, M., 2011. Leaving home: independence, togetherness and income in Europe. United Nations Department of Economic and Social Affairs, Population Division, Expert Paper no. 2011/10. [pdf] Available at: http://www.un.org/en/development/desa/population/publications/pdf/expert/2011-10_Iacovou_Expert-paper.pdf [Accessed 26 March 2015].

Inkei, P., 2010. The Effects of the Economic Crisis on Culture. Culture Watch Europe Conference, Brussels, 6-7 September 2010.

Jackson, C.A., Henderson, M., Frank, J.W. and Haw, S.J., 2012. An overview of prevention of multiple risk behaviour in adolescence and young adulthood. In: Journal of Public Health, 34(s1), p. i31-i40.

Jaime-Castillo, A. M., 2008. Young People's Trajectories of Political Participation in Europe: Cohort Effects or Life-Cycle Effects? In: Young People's Studies Magazine, 81. Available at: http://www.academia.edu/152115/Young_Peoples_Trajectories_of_Political_Participation_in_Europe_Cohort_Effects_or_Life-Cycle_Effects [Accessed 27 May 2015].

Lanzieri, G., 2013. Long-term contribution of migration in ageing populations: Japan compared with Europe. Eurostat Statistical working papers. Luxembourg: Publications Office of the European Union. Available at: http://ec.europa.eu/eurostat/documents/3217494/5784765/KS-TC-13-001-EN.PDF/0b6d2393-11b1-4fb8-9d6a-b186636b7e8c?version=1.0 [Accessed 27 July 2015].

Madden, C., 2009. Global financial crisis and recession: Impact on the arts. In: D'Art Topics in Arts Policy, 37.

Moldoveanu, M. and Ioan-Franc, V., 2011. The impact of the economic crisis on culture. In: Review of General Management, Volume 14 (2).

OECD (Organisation for Economic Cooperation and Development), 2014a. International Migration Outlook 2014. Paris: OECD Publishing. Available at: http://dx.doi.org/10.1787/migr_outlook-2014-en [Accessed 4 June 2015].

OECD, 2014b. Health at a Glance: Europe 2014. Paris: OECD Publishing. Available at: http://dx.doi.org/10.1787/health_glance_eur-2014-en [Accessed 16 June 2015].

Partnership between the European Commission and the Council of Europe in the field of Youth, 2011. Final Report of the Research Seminar “Mobility of young people – Opportunities and obstacles for cross-border volunteering for young people, particularly with fewer opportunities”. Strasbourg, 11-13 December 2011.

Piliavin, J.A., 2003. Doing well by doing good: Benefits for the benefactor. In: C. Keyes and J. Haidt, eds., Flourishing: Positive psychology and the life well-lived. Washington, DC: American Psychological Association, p. 227-247.

Sacco, P.L., 2011. Culture 3.0: A new perspective for the EU 2014-2020 structural funds programming on behalf of the European Expert Network on Culture (EENC), Produced for the OMC Working Group on Cultural and Creative Industries, April 2011.

Salto, 2005. Bridges for Recognition: Promoting Recognition of Youth Work across Europe. Brussels: SALTO-YOUTH Inclusion Resource Centre. Available at: http://pjp-eu.coe.int/documents/1017981/3084932/Bridges_for_recognition_n.pdf/1e7ebb5c-4edb-4bce-8fe0-db42605938c2 [Accessed 10 March 2015].

Santo, C.A., Ferguson, N. and Trippel, A., 2010. Engaging Urban Youth through Technology: the Youth Neighbourhood Mapping Initiative. In: Journal of Planning Education and Research, 30, p. 52-65.

Sawyer, S.M., Afifi, R.A., Bearinger, L.H., Blakemore, S-J., Dick, B., Ezeh, A.C. and Patton, G.C., 2012. Adolescence: a foundation for future health. In: Lancet, 379(9826), p. 1630-1640.

Shernoff, D.J. and Lowe Vandell, D., 2007. Engagement in after-school program activities: quality of experience from the perspective of participants. In: Journal of Youth Adolescence, 36, p. 891-903.

Smith, M. K., 2002. Informal, non-formal and formal education: a brief overview of different approaches. In: The encyclopedia of informal education. [Online] Available at http://www.infed.org/foundations/informal_nonformal.htm [Accessed 11 March 2015].

Thomson, S., Figueras, J., Evetovits, T., Jowett, M., Mladovsky, Ph., Maresso, A., Cylus, J., Karanikolos, M. and Kluge, H., 2014. Policy Summary 12: Economic crisis, health systems and health in Europe: impact and implications for policy. Copenhagen: WHO Regional Office for Europe and European Observatory on Health Systems and Policies.

UNESCO (United Nations Educational, Scientific and Cultural Organization), 2009. Measuring cultural participation

Vanhuysse, P., 2014. Intergenerational Justice and Public Policy in Europe. In: European Social Observatory, OSE Opinion Paper No.16.

Viner, R.M., Ozer, E.M., Denny, S., Marmot, M., Resnick, M., Fatusi, A. and Currie, C., 2012. Adolescence and the social determinants of health. In: Lancet, 379(9826), p. 1641-1652.

WHO (World Health Organization), 2010. Global recommendations on physical activity for health. Switzerland: WHO.

WHO, 2014. Literature Review on the Health Effects of Smoke-free Policies in Light of the WHO FCTC. [pdf] Available at: http://ec.europa.eu/health/archive/ph_information/documents/tobacco_control_en.pdf [Accessed 17 February 2015].

WHO Regional Office for Europe, 2009. A Snapshot of the Health of Young People in Europe. A report prepared for the European Commission Conference on Youth Health, Brussels, Belgium, 9-10 July 2009. Copenhagen: WHO Regional Office for Europe.

WHO Regional Office for Europe, 2011. Impact of Economic Crises on Mental Health. Copenhagen: WHO Regional Office for Europe.

WHO Regional Office for Europe, 2012. Social Determinants of Health and Well-being among Young People. Health Behaviour in School-aged Children (HBSC) Study: International Report from the 2009/2010 Survey. Copenhagen: WHO Regional Office for Europe.

Williamson, H., Hoskins, B., and Boetzelen, P., eds., 2005. Charting the landscape of European youth voluntary activities. Strasbourg: Council of Europe.


ABBREVIATIONS

Statistical codes

:    Data not available

   Country not participating in data collection

Country codes

EU Member States ( 20 )

BE

Belgium

BG

Bulgaria

CZ

Czech Republic

DK

Denmark

DE

Germany

EE

Estonia

IE

Ireland

EL

Greece

ES

Spain

FR

France

HR

Croatia

IT

Italy

CY

Cyprus

LV

Latvia

LT

Lithuania

LU

Luxembourg

HU

Hungary

MT

Malta

NL

Netherlands

AT

Austria

PL

Poland

PT

Portugal

RO

Romania

SI

Slovenia

SK

Slovakia

FI

Finland

SE

Sweden

UK

United Kingdom

Non-EU Member States

IS

Iceland

LI

Liechtenstein

NO

Norway

ME

Montenegro

MK

The former Yugoslav Republic of Macedonia

RS

Serbia

TR

Turkey

Other Abbreviations

EACEA

Education, Audiovisual and Culture Executive Agency

EEA

European Economic Area

EFTA

European Free Trade Association

EHEA

European Higher Education Area

EMCDDA

European Monitoring Centre for Drugs and Drug Addiction

EQLS

European Quality of Life Survey

ESPAD

European School Survey Project on Alcohol and Other Drugs

ESS

European Social Survey

EU

European Union

EU-15

15 Member States of the EU before 1 May 2004

EU-27

27 Member States of the EU before 1 July 2013

EU-28

28 Member States of the EU

HBSC

Health Behaviour In School-aged Children, WHO Collaborative Cross-National Survey

ICT

Information and communication technology

ILO

International Labour Organisation

ISCED

International Standard Classification of Education

ISCO

International Classifications of Occupations

LFS

Labour Force Survey

NEET

Not in Employment, Education or Training

OECD

Organisation for Economic Co-operation and Development

SALTO

Support, Advanced Learning and Training Opportunities within the European YOUTH programme – a network of eight resource centres

SILC

Statistics on Income and Living Conditions

TFEU

Treaty on the Functioning of the European Union

UN

United Nations

UNICEF

United Nations Children's Fund

UOE

United Nations Educational, Scientific, and Cultural Organisation Institute for Statistics (UNESCO-UIS), the Organisation for Economic Co-operation and Development (OECD), and the Statistical Office of the European Union (Eurostat)

WHO

World Health Organization

(1) ()Hall, 2008; Piliavin, 2003; Haski-Leventhal et al., 2008.
(2) ()Hall, 2008.
(3) ()Haski-Leventhal et al., 2008.
(4) ()Data on participation in voluntary activities by age groups and gender are provided by the European Social Survey, 2012.
(5) ()Haski-Leventhal et al. 2008.
(6) ()Williamson, Hoskins and Boetzelen, 2006.
(7) ()Ibid.
(8) ()Partnership between the European Commission and the Council of Europe in the field of Youth, 2011.
(9) ()Williamson, Hoskins and Boetzelen, 2005.
(10) ()Sacco, 2011.
(11) ()Inkei, 2010; Moldoveanu and Ioan-Franc, 2011.
(12) () Eurostat, 2014a.
(13) ()European Commission, 2013d.
(14) () Bourn, 2008.
(15) () Ibid.
(16) () European Commission/EACEA/Eurydice, 2013a.
(17) () Harris, Wyn and Younes, 2010.
(18) () The 2011 average refers to the EU-27. The 2014 average is the same for the EU-27 and the EU-28.
(19) () Flash Eurobarometer 408, 'European Youth', 2015 and Flash Eurobarometer 319a, 'Youth on the Move', 2011.
(20) () Roman alphabetical order of the countries' geographical names in the original language(s).
Top