ISSN 1725-2423
Official Journal
of the European Union
C 277

English edition
Information and Notices
Volume 51
31 October 2008
|
ISSN 1725-2423 |
||
|
Official Journal of the European Union |
C 277 |
|
|
|
||
|
English edition |
Information and Notices |
Volume 51 |
|
Notice No |
Contents |
page |
|
|
IV Notices |
|
|
|
NOTICES FROM EUROPEAN UNION INSTITUTIONS AND BODIES |
|
|
|
Commission |
|
|
2008/C 277/01 |
Final accounts for the financial year 2007 of the 7th, 8th and 9th European Development Funds |
|
|
2008/C 277/02 |
||
|
|
||
|
2008/C 277/03 |
||
|
EN |
|
IV Notices
NOTICES FROM EUROPEAN UNION INSTITUTIONS AND BODIES
Commission
|
31.10.2008 |
EN |
Official Journal of the European Union |
C 277/1 |
FINAL ACCOUNTS FOR THE FINANCIAL YEAR 2007 OF THE 7th, 8th AND 9th EUROPEAN DEVELOPMENT FUNDS
(2008/C 277/01)
TABLE OF CONTENTS
|
1. |
FINANCIAL STATEMENTS |
|
1.1. |
European Development Fund |
|
1.2. |
Financial statements |
|
1.3. |
Notes to the financial statements |
|
1.4. |
Off balance sheet items |
|
2. |
REPORT ON FINANCIAL IMPLEMENTATION |
|
2.1. |
Allocations at 31.12.2007 |
|
2.2. |
Aggregated accounts |
|
2.3. |
Situation by country and by instrument |
|
2.4. |
Other management information |
|
3. |
FINANCIAL INFORMATION EIB |
|
3.1. |
Income statement investment facility |
|
3.2. |
Balance sheet investment facility |
|
3.3. |
Cash flow statement investment facility |
|
3.4. |
Statement of changes in equity investment facility |
|
3.5. |
Notes to the financial statements |
|
4. |
APPENDIX — Situation by country and by instrument |
1. FINANCIAL STATEMENTS
1.1. EUROPEAN DEVELOPMENT FUND
The European Development Fund (EDF) is the main instrument for providing community aid for development cooperation in the African, Caribbean and Pacific (ACP) States and Overseas Countries and Territories (OCTs). The 1957 Treaty of Rome made provision for its creation with a view to granting technical and financial assistance, initially to African countries which at that time were still colonised and with which some Member States had historical links.
Even though a heading has been reserved for the Fund in the Community budget since 1993 following a request by the European Parliament, the EDF does not yet come under the Community's general budget. It is funded by the Member States, is subject to its own financial rules and is managed by a specific committee. The geographic aid granted to ACP States and OCTs will continue to be mainly funded by the EDF for the period 2008-2013.
Each EDF is concluded for a period of around five years. Since the conclusion of the first partnership convention in 1964, the EDF cycles have generally followed the partnership agreement/convention cycles. The present 9th EDF will expire on the entry into force of the 10th EDF during 2008. Council decision 2007/792/EC (1) of 26 November 2007 establishes a transitory period for the prolongation of the 9th EDF from 1st January 2008 until the entry into force of the 10th EDF. Each EDF is governed by its own Financial Regulation which imposes the preparation of financial statements for each individual EDF. Accordingly, financial statements are prepared separately for each EDF in respect of the part that is managed by the European Commission. These financial statements are also presented in an aggregated way so as to provide a global view of the financial situation of the resources for which the European Commission is responsible.
Given the clear division of responsibilities set out in Article 1 of the 9th EDF Financial Regulation (2), the financial statements of the Commission and the European Investment Bank — the entities entrusted with the management of EDF resources — have not been consolidated.
1.1.1. CLOSURE OF THE 6th EDF
Given the state of progress of the 6th EDF, the Authorising Officer decided to close this fund on 31st July 2006. In the absence of a legal basis for the closure of EDFs, the balance remaining was transferred to the 9th EDF according to the provisions of Part 3 of the Financial regulation applicable to the 9th EDF.
1.1.2. PRESENTATION OF ANNUAL ACCOUNTS
The annual accounts for 2007 are presented as follows:
|
— |
The financial statements |
|
— |
The reports on financial implementation |
|
— |
The financial statements and information supplied by the European Investment Bank (EIB) |
1.2. FINANCIAL STATEMENTS
BALANCE SHEET FOR THE 7th, 8th AND 9th EDF
|
(EUR million) |
|||
|
|
Notes |
31.12.2007 |
31.12.2006 |
|
CURRENT ASSETS |
|||
|
Receivables |
1 |
8,50 |
216,83 |
|
Net Pre-financing |
2 |
955,52 |
2 808,88 |
|
Other current assets |
3 |
– 2,65 |
0,95 |
|
Cash and cash equivalents |
|
388,22 |
291,50 |
|
STABEX security accounts |
5 |
99,61 |
191,60 |
|
RD Congo special fund |
6 |
3,36 |
3,42 |
|
Cash at bank |
7 |
285,24 |
96,48 |
|
Total assets |
|
1 349,58 |
3 318,17 |
|
CURRENT LIABILITIES |
|||
|
Payables |
8 |
703,98 |
2 095,86 |
|
Total liabilities |
|
703,98 |
2 095,86 |
|
Net assets |
|
645,60 |
1 222,31 |
|
FUNDS & RESERVES |
|||
|
Called fund capital |
9 |
25 019,17 |
29 900,00 |
|
Results carried forward from previous years |
|
– 22 410,59 |
– 26 787,49 |
|
Result for the year |
|
– 3 255,88 |
– 2 924,04 |
|
Reserves |
10 |
1 292,89 |
1 033,84 |
|
Net assets |
|
645,60 |
1 222,31 |
ECONOMIC OUTTURN ACCOUNT FOR THE 7th, 8th AND 9th EDF
|
(EUR million) |
|||||
|
|
Notes |
Cash basis expenditure 2007 |
Accrual adjustments |
Accrual basis expenditure 2007 |
Accrual basis expenditure 2006 |
|
Operating interest |
1.1 |
0,02 |
|
0,02 |
0,06 |
|
OPERATING REVENUE (1) |
|
0,02 |
|
0,02 |
0,06 |
|
Programmable aid |
|
495,57 |
141,96 |
637,53 |
749,57 |
|
Macro-economic support |
|
421,36 |
5,23 |
426,59 |
407,82 |
|
Sectoral policy |
|
1 211,70 |
– 62,84 |
1 148,85 |
911,24 |
|
Intra ACP Projects |
|
277,97 |
103,69 |
381,66 |
339,36 |
|
Interest-rate subsidies |
|
0,95 |
|
0,95 |
1,20 |
|
Emergency aid |
|
153,00 |
1,80 |
154,81 |
130,12 |
|
Refugee aid |
|
1,31 |
– 6,89 |
– 5,58 |
6,68 |
|
Risk Capital |
|
57,81 |
|
57,81 |
63,11 |
|
STABEX |
|
98,37 |
|
98,37 |
189,52 |
|
Sysmin |
|
23,36 |
8,22 |
31,58 |
29,80 |
|
Transfers from former EDFs |
|
6,18 |
– 1,36 |
4,82 |
15,16 |
|
Structural adjustment |
|
0,02 |
– 6,31 |
– 6,30 |
0,89 |
|
Debt relief -HIPC and World Bank |
|
– 12,62 |
192,49 |
179,87 |
17,42 |
|
Institutional Support |
|
42,40 |
– 11,99 |
30,41 |
32,34 |
|
Compensation export receipts |
|
57,63 |
26,28 |
83,91 |
52,82 |
|
R.D. Congo Fund |
|
0,19 |
17,06 |
17,25 |
– 13,39 |
|
Operating expenses |
|
2 835,19 |
407,33 |
3 242,52 |
2 933,67 |
|
Administrative and financial expenses |
11 |
38,78 |
– 7,10 |
31,68 |
23,79 |
|
Total Expenses (cash basis) |
12 |
2 873,97 |
|
|
|
|
Accrual adjustments |
13 |
399,89 |
|
– 0,34 |
– 0,14 |
|
TOTAL EXPENSES/Accrual basis (2) |
14 |
3 273,86 |
|
3 273,86 |
2 957,31 |
|
SURPLUS/(DEFICIT) FROM OPERATING ACTIVITIES (2-1) |
|
3 273,83 |
|
3 273,83 |
2 957,26 |
|
Financial revenue |
15 |
18,65 |
|
18,65 |
31,61 |
|
Financial expenses |
16 |
– 0,34 |
|
– 0,34 |
– 0,14 |
|
Impairment of receivables |
1.6 |
– 0,35 |
|
– 0,35 |
1,75 |
|
Surplus/(deficit) from financial activities (3) |
|
17,96 |
|
17,96 |
33,22 |
|
ECONOMIC RESULT (1-2+3) |
|
– 3 255,88 |
|
– 3 255,88 |
– 2 924,04 (3) |
CASH FLOW STATEMENT FOR THE 7th, 8th AND 9th EDF
|
(EUR million) |
|||
|
|
Notes |
31.12.2007 |
31.12.2006 |
|
Economic result |
|
– 3 255,88 |
– 2 924,04 |
|
Impairment of receivables |
1.6 |
0,35 |
– 1,75 |
|
Financial revenue adjustment |
15 |
– 0,11 |
0,07 |
|
Operational revenue adjustment |
1.1 |
2,88 |
0,04 |
|
Accrual adjustments |
13 |
399,89 |
195,39 |
|
Financial expenses |
16 |
0,34 |
0,14 |
|
Bank charges to be refund |
1 |
0,02 |
– 0,04 |
|
Decrease in advances for study grants and other current assets |
3 & 2.2 |
3,81 |
2,73 |
|
Cash flows from operating activities |
|
– 2 848,69 |
– 2 727,46 |
|
Contributions from member states |
|
2 886,76 |
2 525,82 |
|
Cash flows from financing activities |
|
2 886,76 |
2 525,82 |
|
Net increase/decrease in cash and cash equivalents |
|
38,07 |
– 201,64 |
|
Treasury balance at beginning of period |
7 |
96,48 |
270,55 |
|
Stabex security accounts at beginning of period |
5 |
191,60 |
371,88 |
|
Congo Account |
6 |
3,42 |
19,67 |
|
SWIFT Account |
8.2 |
49,73 |
– 119,23 |
|
Cash and cash equivalent at beginning of period |
|
341,23 |
542,87 |
|
Treasury balance at end of period |
7 |
285,24 |
96,48 |
|
Stabex security accounts at end of period |
5 |
99,61 |
191,60 |
|
Congo Account |
6 |
3,36 |
3,42 |
|
SWIFT Account |
8.2 |
– 8,92 |
49,73 |
|
Cash and cash equivalent at end of period |
|
379,30 |
341,23 |
STATEMENT OF CHANGES IN NET ASSETS FOR THE 7th, 8th AND 9th EDF
|
(EUR million) |
||||||
|
|
Fund Capital |
Uncalled Funds |
Called funds capital |
Cumulative reserves |
Reserves |
Total Net Assets |
|
|
(a) |
(b) |
(c)=(a)–(b) |
(e) |
(d) |
(h)=(e)+(d)+(c) |
|
Notes |
9 |
9 |
9 |
|
10 |
|
|
Closing balance 2005 |
42 877,15 |
15 487,15 |
27 390,00 |
– 26 787,49 |
1 033,84 |
1 636,35 |
|
Contributions |
|
– 2 510,00 |
2 510,00 |
|
|
2 510,00 |
|
Capital increase |
122,00 |
122,00 |
|
|
|
|
|
Transfers from former EDF |
|
|
|
|
|
|
|
Economic result |
|
|
|
– 2 924,04 |
|
– 2 924,04 |
|
Closing balance 2006 |
42 999,15 |
13 099,15 |
29 900,00 |
– 29 711,53 |
1 033,84 |
1 222,31 |
|
Contributions |
|
– 2 640,00 |
2 640,00 |
|
|
2 640,00 |
|
Capital increase |
40,17 |
1,00 |
39,17 |
|
|
39,17 |
|
Transfers from former EDF |
|
|
|
|
|
|
|
Economic result |
|
|
|
– 3 255,88 |
|
– 3 255,88 |
|
Closure of 6th EDF |
– 7 560,00 |
|
– 7 560,00 |
7 300,94 |
259,06 |
0,00 |
|
Closing balance 2007 |
35 479,32 |
10 460,15 |
25 019,17 |
– 25 666,46 |
1 292,89 |
645,60 |
7th EDF BALANCE SHEET
|
(EUR million) |
|||
|
|
Notes |
31.12.2007 |
31.12.2006 |
|
CURRENT ASSETS |
|||
|
Receivables |
1 |
2,12 |
17,06 |
|
Net Pre-financing |
2 |
75,36 |
203,75 |
|
Other current assets |
3 |
|
|
|
Liaison accounts |
4 |
2 279,31 |
2 279,31 |
|
Cash and cash equivalents |
|||
|
STABEX security accounts |
5 |
|
|
|
RD Congo special fund |
6 |
|
|
|
Cash at bank |
7 |
|
|
|
Total assets |
|
2 356,78 |
2 500,12 |
|
CURRENT LIABILITIES |
|||
|
Payables |
8 |
19,59 |
92,62 |
|
Liaison accounts |
4 |
2 037,08 |
1 868,50 |
|
Total liabilities |
|
2 056,67 |
1 961,12 |
|
Net assets |
|
300,11 |
539,00 |
|
FUNDS & RESERVES |
|||
|
Called fund capital |
9 |
10 940,00 |
10 940,00 |
|
Results carried forward from previous years |
|
– 9 715,19 |
– 9 527,36 |
|
Result for the year |
|
– 166,97 |
– 187,83 |
|
Reserves |
10 |
– 757,73 |
– 685,81 |
|
Net assets |
|
300,11 |
539,00 |
7th EDF ECONOMIC OUTTURN ACCOUNT
|
(EUR million) |
|||||
|
|
Notes |
Cash basis expenditure 2007 |
Accrual adjustments |
Accrual basis expenditure 2007 |
Accrual basis expenditure 2006 |
|
Operating interest |
1.1 |
|
|
|
|
|
OPERATING REVENUE (1) |
|
|
|
|
|
|
Programmable aid |
|
63,04 |
61,52 |
124,56 |
105,55 |
|
Macro-economic support |
|
|
|
|
|
|
Sectoral policy |
|
|
|
|
|
|
Intra ACP Projects |
|
|
|
|
8,67 |
|
Interest-rate subsidies |
|
– 0,49 |
|
– 0,49 |
– 0,01 |
|
Emergency aid |
|
0,00 |
0,28 |
0,28 |
– 0,21 |
|
Refugee aid |
|
|
0,28 |
0,28 |
– 0,66 |
|
Risk Capital |
|
5,28 |
|
5,28 |
5,46 |
|
STABEX |
|
8,23 |
|
8,23 |
51,71 |
|
Sysmin |
|
20,21 |
6,80 |
27,01 |
16,59 |
|
Transfers from former EDFs |
|
0,39 |
3,17 |
3,56 |
0,46 |
|
Structural adjustment |
|
|
– 6,62 |
– 6,62 |
0,03 |
|
Debt relief -HIPC and World Bank |
|
|
4,96 |
4,96 |
0,06 |
|
Institutional Support |
|
|
|
|
|
|
Compensation export receipts |
|
|
|
|
|
|
R.D. Congo Fund |
|
|
|
|
|
|
Operating expenses |
|
96,66 |
70,39 |
167,05 |
187,66 |
|
Administrative and financial expenses |
11 |
|
|
|
|
|
Total Expenses (cash basis) |
12 |
96,66 |
|
|
|
|
Accrual adjustments |
13 |
70,39 |
|
|
|
|
TOTAL EXPENSES/Accrual basis (2) |
14 |
167,05 |
|
167,05 |
187,66 |
|
SURPLUS/(DEFICIT) FROM OPERATING ACTIVITIES (2-1) |
|
167,05 |
|
167,05 |
187,66 |
|
Financial revenue |
15 |
|
|
|
|
|
Financial expenses |
16 |
|
|
|
|
|
Impairment of receivables |
1.6 |
0,08 |
|
0,08 |
– 0,18 |
|
Surplus/(deficit) from financial activities (3) |
|
0,08 |
|
0,08 |
– 0,18 |
|
ECONOMIC RESULT (1-2+3) |
|
– 166,97 |
|
– 166,97 |
– 187,83 |
STATEMENT OF CHANGES IN NET ASSETS FOR THE 7th EDF
|
(EUR million) |
||||||
|
|
Fund Capital |
Uncalled Funds |
Called funds capital |
Cumulative reserves |
Reserves |
Total Net Assets |
|
|
(a) |
(b) |
(c)=(a)-(b) |
(e) |
(d) |
(h)=(e)+(d)+(c) |
|
Notes |
9 |
9 |
9 |
|
10 |
|
|
Closing balance 2005 |
10 940,00 |
0,00 |
10 940,00 |
– 9 527,36 |
– 559,14 |
853,50 |
|
Contributions |
|
|
|
|
|
|
|
Capital increase |
|
|
|
|
|
|
|
Transfers to 9th EDF |
|
|
|
|
– 126,67 |
– 126,67 |
|
Economic result |
|
|
|
– 187,83 |
|
– 187,83 |
|
Closing balance 2006 |
10 940,00 |
0,00 |
10 940,00 |
– 9 715,19 |
– 685,81 |
539,00 |
|
Contributions |
|
|
|
|
|
|
|
Capital increase |
|
|
|
|
|
|
|
Transfers to 9th FED |
|
|
|
|
– 71,91 |
– 71,91 |
|
Economic result |
|
|
|
– 166,97 |
|
– 166,97 |
|
Closing balance 2007 |
10 940,00 |
0,00 |
10 940,00 |
– 9882,16 |
– 757,73 |
300,11 |
8th EDF BALANCE SHEET
|
(EUR million) |
|||
|
|
Notes |
31.12.2007 |
31.12.2006 |
|
CURRENT ASSETS |
|||
|
Receivables |
1 |
2,64 |
70,61 |
|
Net Pre-financing |
2 |
126,98 |
888,93 |
|
Other current assets |
3 |
|
|
|
Liaison accounts |
4 |
3 301,13 |
2 450,58 |
|
Cash and cash equivalents |
|||
|
STABEX security accounts |
5 |
|
|
|
RD Congo special fund |
6 |
|
|
|
Cash at bank |
7 |
|
|
|
Total assets |
|
3 430,74 |
3 410,12 |
|
CURRENT LIABILITIES |
|||
|
Payables |
8 |
124,35 |
651,73 |
|
Liaison accounts |
4 |
2 065,45 |
2 065,45 |
|
Total liabilities |
|
2 189,80 |
2 717,19 |
|
Net assets |
|
1 240,94 |
692,93 |
|
FUNDS & RESERVES |
|||
|
Called fund capital |
9 |
12 840,00 |
11 295,00 |
|
Results carried forward from previous years |
|
– 8 724,21 |
– 7 851,95 |
|
Result for the year |
|
– 779,79 |
– 872,26 |
|
Reserves |
10 |
– 2 095,06 |
– 1 877,85 |
|
Net assets |
|
1 240,94 |
692,93 |
8th EDF ECONOMIC OUTTURN ACCOUNT
|
(EUR million) |
|||||
|
|
Notes |
Cash basis expenditure 2007 |
Accrual adjustments |
Accrual basis expenditure 2007 |
Accrual basis expenditure 2006 |
|
Operating interest |
1.1 |
|
|
|
|
|
OPERATING REVENUE (1) |
|
|
|
|
|
|
Programmable aid |
|
298,39 |
95,13 |
393,52 |
575,43 |
|
Macro-economic support |
|
1,73 |
1,06 |
2,79 |
13,07 |
|
Sectoral policy |
|
18,83 |
2,12 |
20,95 |
23,21 |
|
Intra ACP Projects |
|
|
|
|
|
|
Interest-rate subsidies |
|
1,45 |
|
1,45 |
1,21 |
|
Emergency aid |
|
– 0,15 |
|
– 0,15 |
0,98 |
|
Refugee aid |
|
1,31 |
– 7,17 |
– 5,86 |
7,29 |
|
Risk Capital |
|
52,52 |
|
52,52 |
57,65 |
|
STABEX |
|
90,14 |
|
90,14 |
137,80 |
|
Sysmin |
|
3,15 |
1,42 |
4,57 |
13,17 |
|
Transfers from former EDFs |
|
|
|
|
|
|
Structural adjustment |
|
0,02 |
0,31 |
0,32 |
0,86 |
|
Debt relief -HIPC and World Bank |
|
– 14,22 |
187,53 |
173,31 |
15,36 |
|
Institutional Support |
|
|
|
|
|
|
Compensation export receipts |
|
29,51 |
19,98 |
49,49 |
30,80 |
|
R.D. Congo Fund |
|
|
|
|
|
|
Operating expenses |
|
482,67 |
300,37 |
783,04 |
876,83 |
|
Administrative and financial expenses |
11 |
0,75 |
1,20 |
1,95 |
4,64 |
|
Total Expenses (cash basis) |
12 |
483,42 |
|
|
|
|
Accrual adjustments |
13 |
301,57 |
|
|
|
|
TOTAL EXPENSES/Accrual basis (2) |
14 |
784,99 |
|
784,99 |
881,47 |
|
SURPLUS/(DEFICIT) FROM OPERATING ACTIVITIES (2-1) |
|
784,99 |
|
784,99 |
881,47 |
|
Financial revenue |
15 |
6,18 |
|
6,18 |
9,13 |
|
Financial expenses |
16 |
|
|
|
|
|
Impairment of receivables |
1.6 |
– 0,97 |
|
– 0,97 |
0,08 |
|
Surplus/(deficit) from financial activities (3) |
|
5,20 |
|
5,20 |
9,20 |
|
ECONOMIC RESULT (1-2+3) |
|
– 779,79 |
|
– 779,79 |
– 872,26 |
STATEMENT OF CHANGES IN NET ASSETS FOR THE 8th EDF
|
(EUR million) |
||||||
|
|
Fund Capital |
Uncalled Funds |
Called funds capital |
Cumulative reserves |
Reserves |
Total Net Assets |
|
|
(a) |
(b) |
(c)=(a)-(b) |
(e) |
(d) |
(h)=(e)+(d)+(c) |
|
Notes |
9 |
9 |
9 |
|
10 |
|
|
Closing balance 2005 |
12 840,00 |
4 055,00 |
8 785,00 |
– 7 851,95 |
– 1 603,43 |
– 670,38 |
|
Contributions |
|
– 2 510,00 |
2 510,00 |
|
|
2 510,00 |
|
Capital increase |
|
|
|
|
|
|
|
Transfers to 9th EDF |
|
|
|
|
– 274,42 |
– 274,42 |
|
Economic result |
|
|
|
– 872,26 |
|
– 872,26 |
|
Closing balance 2006 |
12 840,00 |
1 545,00 |
11 295,00 |
– 8 724,21 |
– 1 877,85 |
692,93 |
|
Contributions |
|
– 1 545,00 |
1 545,00 |
|
|
1 545,00 |
|
Capital increase |
|
|
|
|
|
|
|
Transfers to 9th EDF |
|
|
|
|
– 217,21 |
– 217,21 |
|
Economic result |
|
|
|
– 779,79 |
|
– 779,79 |
|
Closing balance 2007 |
12 840,00 |
0,00 |
12 840,00 |
– 9 504,00 |
– 2 095,06 |
1 240,94 |
9th EDF BALANCE SHEET
|
(EUR million) |
|||
|
|
Notes |
31.12.2007 |
31.12.2006 |
|
CURRENT ASSETS |
|||
|
Receivables |
1 |
3,75 |
129,17 |
|
Net Pre-financing |
2 |
753,18 |
1 716,20 |
|
Other current assets |
3 |
– 2,65 |
0,95 |
|
Liaison accounts |
4 |
2 037,08 |
1 868,50 |
|
Cash and cash equivalents |
|
388,22 |
291,50 |
|
STABEX security accounts |
5 |
99,61 |
191,60 |
|
RD Congo special fund |
6 |
3,36 |
3,42 |
|
Cash at bank |
7 |
285,24 |
96,48 |
|
Total assets |
|
3 179,57 |
4 006,32 |
|
CURRENT LIABILITIES |
|||
|
Payables |
8 |
560,05 |
1 351,51 |
|
Liaison accounts |
4 |
3 514,98 |
2 664,43 |
|
Total liabilities |
|
4 075,03 |
4 015,94 |
|
Net assets |
|
– 895,45 |
– 9,62 |
|
FUNDS & RESERVES |
|||
|
Called fund capital |
9 |
1 239,17 |
105,00 |
|
Results carried forward from previous years |
|
– 3 971,18 |
– 2 117,60 |
|
Result for the year |
|
– 2 309,12 |
– 1 853,59 |
|
Reserves |
10 |
4 145,68 |
3 856,56 |
|
Net assets |
|
– 895,45 |
– 9,62 |
9th EDF ECONOMIC OUTTURN ACCOUNT
|
(EUR million) |
|||||
|
|
Notes |
Cash basis expenditure 2007 |
Accrual adjustments |
Accrual basis expenditure 2007 |
Accrual basis expenditure 2006 |
|
Operating interest |
1.1 |
0,02 |
|
0,02 |
0,06 |
|
OPERATING REVENUE (1) |
|
0,02 |
|
0,02 |
0,06 |
|
Programmable aid |
|
134,14 |
– 14,69 |
119,44 |
56,78 |
|
Macro-economic support |
|
419,63 |
4,17 |
423,80 |
394,75 |
|
Sectoral policy |
|
1 192,87 |
– 64,96 |
1 127,91 |
888,03 |
|
Intra ACP Projects |
|
277,97 |
103,69 |
381,66 |
328,96 |
|
Interest-rate subsidies |
|
|
|
|
|
|
Emergency aid |
|
153,16 |
1,52 |
154,68 |
129,35 |
|
Refugee aid |
|
|
|
|
|
|
Risk Capital |
|
|
|
|
|
|
STABEX |
|
|
|
|
|
|
Sysmin |
|
|
|
|
|
|
Transfers from former EDFs |
|
5,79 |
– 4,53 |
1,26 |
14,49 |
|
Structural adjustment |
|
|
|
|
|
|
Debt relief -HIPC and World Bank |
|
1,60 |
|
1,60 |
2,00 |
|
Institutional Support |
|
42,40 |
– 11,99 |
30,41 |
32,34 |
|
Compensation export receipts |
|
28,12 |
6,30 |
34,42 |
22,02 |
|
R.D. Congo Fund |
|
0,19 |
17,06 |
17,25 |
– 13,39 |
|
Operating expenses |
|
2 255,86 |
36,58 |
2 292,43 |
1 855,34 |
|
Administrative and financial expenses |
11 |
38,03 |
– 8,30 |
29,73 |
19,15 |
|
Total Expenses (cash basis) |
12 |
2 293,89 |
|
|
|
|
Accrual adjustments |
13 |
27,93 |
|
– 0,34 |
– 0,14 |
|
TOTAL EXPENSES/Accrual basis (2) |
14 |
2 321,82 |
|
2 321,82 |
1 874,34 |
|
SURPLUS/(DEFICIT) FROM OPERATING ACTIVITIES (2-1) |
|
2 321,80 |
|
2 321,80 |
1 874,29 |
|
Financial revenue |
15 |
12,47 |
|
12,47 |
22,49 |
|
Financial expenses |
16 |
– 0,34 |
|
– 0,34 |
– 0,14 |
|
Impairment of receivables |
1.6 |
0,54 |
|
0,54 |
– 1,65 |
|
Surplus/(deficit) from financial activities (3) |
|
12,67 |
|
12,67 |
20,70 |
|
ECONOMIC RESULT (1-2+3) |
|
– 2 309,12 |
|
– 2 309,12 |
– 1 853,59 |
STATEMENT OF CHANGES IN NET ASSETS FOR THE 9th EDF
|
(EUR million) |
||||||
|
|
Fund Capital |
Uncalled Funds |
Called funds capital |
Cumulative reserves |
Reserves |
Total Net Assets |
|
|
(a) |
(b) |
(c)=(a)-(b) |
(e) |
(d) |
(h)=(e)+(d)+(c) |
|
Notes |
9 |
9 |
9 |
|
10 |
|
|
Closing balance 2005 |
11 537,15 |
11 432,15 |
105,00 |
– 2 117,60 |
3 379,41 |
1 366,81 |
|
Contributions |
|
|
|
|
|
|
|
Capital increase |
122,00 |
122,00 |
|
|
|
|
|
Transfers from other EDF |
|
|
|
|
477,15 |
477,15 |
|
Economic result |
|
|
|
– 1 853,59 |
|
– 1 853,59 |
|
Closing balance 2006 |
11 659,15 |
11 554,15 |
105,00 |
– 3 971,18 |
3 856,56 |
– 9,62 |
|
Contributions |
|
– 1 095,00 |
1 095,00 |
|
|
1 095,00 |
|
Capital increase |
40,17 |
1,00 |
39,17 |
|
|
39,17 |
|
Transfers from other EDF |
|
|
|
|
289,12 |
289,12 |
|
Economic result |
|
|
|
– 2 309,12 |
|
– 2 309,12 |
|
Closing balance 2007 |
11 699,32 |
10 460,15 |
1 239,17 |
– 6 280,30 |
4 145,68 |
– 895,45 |
1.3. NOTES TO THE FINANCIAL STATEMENTS
1.3.1. ACCOUNTING POLICIES
1.3.1.1. Legal provisions and the financial regulation
The financial statements were drawn up in accordance with the Financial Regulation applicable to the 9th European Development Fund (4) (EDF).
The relevant documents must be presented to the Court of Auditors as provided for in Articles 69, 70 and 71 of the Financial Regulation applicable to the 7th EDF (5), Articles 66, 67 and 68 of the Financial Regulation applicable to the 8th EDF (6) and Articles 102 and 103 of the Financial Regulation applicable to the 9th EDF. Article 102 (9th EDF) stipulates that the Commission shall send the provisional accounts to the Court of Auditors by 31 March of the following year. The Court of Auditors shall in turn make its observations on the accounts known to the Commission by 15 June (Article 103). On the basis of these observations, the Commission approves the final accounts by 31 July and sends them to the European Parliament, the Council and the Court of Auditors. The accounts are then published in the Official Journal by 31 October together with the statement of assurance given by the Court of Auditors in respect of the part of the EDF resources for which the Commission is responsible for financial management.
In accordance with the provisions of article 99 of the 9th EDF Financial Regulation, financial statements are prepared in respect of the principle of accrual based accounting.
The accounting information provided by the present IT accounting system (OLAS) has been adjusted, where necessary, in order to provide figures which comply with accrual accounting principles. Additional information in respect of income and expenditure items has also been provided by the Authorising Officer.
These financial statements have been drafted in conformity with accounting rules and methods for the EDF drawn up on the basis of International Public Sector Accounting Standards (IPSAS) or by default, International Financial Reporting Standards (IFRS) as respectively issued by the International Public Sector Accounting Standard Board (IPSASB) and International Accounting Standard Board (IASB). The rules of valuation and accounting methods adopted by the Accounting Officer of the European Development Fund have been applied in respect of the part of the EDF resources for which the European Commission is responsible for financial management.
1.3.1.2. Accounting principles
The objectives of financial statements are to provide information about the financial position, performance and cash flows of an entity that is useful to a wide range of users. For a public sector entity, the objectives are more specifically to provide information useful for decision making, and to demonstrate the accountability of the entity for the resources entrusted to it.
If they are to present a true and fair view, financial statements must not only supply relevant information to describe the nature and range of the activities, explain how it is financed and supply definitive information on its operations, but do so in a clear and comprehensible manner which allows comparisons between financial years. It is with these goals in mind that the present document has been drawn up.
The accounting system of the European Development Fund comprises general accounts and financial accounts. Both sets of accounts are kept in euro on the basis of the calendar year. The general accounts allow for the preparation of the financial statements as they show all charges and incomes for the financial year and are designed to establish the financial position in the form of a balance sheet at 31 December. The financial accounts give a detailed picture of the use of EDF resources. They are based on the cash accounting principle.
Article 98 of the 9th EDF Financial Regulation sets out the accounting principles to be applied in drawing up the financial statements, as follows:
|
— |
going concern basis; |
|
— |
prudence; |
|
— |
consistent accounting methods; |
|
— |
comparability of information; |
|
— |
materiality; |
|
— |
no netting; |
|
— |
reality over appearance, and |
|
— |
accrual-based accounting. |
1.3.1.3. Currency and basis for conversion
The financial statements are presented in millions of euros, which is the European Communities' functional and reporting currency. Values in the tables may not add up, due to rounding.
Foreign currency transactions are translated into euros using the exchange rates prevailing at the dates of the underlying transactions.
Year-end balances of monetary assets and liabilities denominated in foreign currencies are converted into euros on the basis of the exchange rates applying on 31 December:
|
EURO Exchange Rate |
|
|
31.12.2007 |
31.12.2006 |
|
GBP 0,7148 |
GBP 0,6743 |
1.3.2. BALANCE SHEET
1.3.2.1. Receivables
Receivables are carried at original amount less write-down for impairment. A write-down for impairment of receivables is established when there is objective evidence that the EDF will not be able to collect all amounts due according to the original terms of the receivables. The amount of the write-down is the difference between the asset's carrying amount and the recoverable amount, being the present value of expected future cash flows, discounted at the market rate of interest for similar borrowers. The amount for write-down is recognised in the economic outturn account. Also recognised is a general write-down in value of 20 % per year for outstanding recovery orders not already subject to a specific write-down.
1.3.2.2. Pre-financing amounts
Pre-financing is a payment intended to provide the beneficiary with a cash advance, i.e. a float. It may be split into a number of payments over a period defined in the particular pre-financing agreement. The float or advance is repaid or used for the purpose for which it was provided during the period defined in the agreement. If the beneficiary does not incur sufficient eligible expenditure, he has the obligation to return, in whole or in part, the pre-financing advance to the European Development Fund. The amount of the pre-financing is reduced (wholly or partially) by the acceptance of eligible costs and amounts returned.
At year-end outstanding pre-financing amounts are valued at the original amount(s) paid to the beneficiary less: any amounts returned, eligible amounts cleared and the estimated eligible amounts not yet cleared at year-end (see note 2.3).
Guarantees related to pre-financing amounts are disclosed as contingent assets (see point 1.4) and as such they are not accounted for in the financial statements (IPSAS 19).
1.3.2.3. Cash & cash equivalents
Cash and cash equivalents include accounts held with financial institutions in the ACP states and the OCTs, and with financial institutions in the Member States.
For the purpose of the cash flow statement, cash and cash equivalents include the current account with the general budget of the EU presented under accounts payable in the balance sheet (see note 8).
1.3.2.4. Payables
A significant amount of payables of the EDF are not related to the purchase of good or services — instead they are unpaid cost claims from beneficiaries of grants or other funding. They are recorded as payables for the requested amount when the cost claim/request for payment is received and, after verification, accepted as eligible by the relevant financial agents. At this stage they are valued at the accepted and eligible amount.
The EDF has current liabilities for amounts already due to beneficiaries for which no invoices were received at the reporting date. The recognition criteria foresee that a charge is recognised by the EDF for the amount of the estimated payment due for the period, that is to say the portion of the incurred eligible expenses due to the beneficiaries at the reporting date. Material amounts are recognised as an accrued expense (accrued expenditure) on the basis of estimates (e.g. the degree of execution of contracts) provided by the Authorising Officer.
1.3.3. ECONOMIC OUTTURN ACCOUNT
1.3.3.1. Revenue
The only source of income for the funds is derived from interest generated on various cash balances held with commercial Banks (see notes to the accounts) or on late payment of entitlements to the EDF.
1.3.3.2. Expenditure
Expenditure should be recognised in the EDF financial statements as expenditure of the period that the events giving rise to a payment occurred, as long as:
|
— |
A contract has been signed which authorises the payment; |
|
— |
Eligibility criteria, if any, have been met by the beneficiary; and, |
|
— |
A reasonable estimate of the amount due can be made based on, for example, invoices sent by the beneficiary, degree of execution of contracts etc.. |
As expenditure incurred by Commission Delegations is not finally entered into the EDF accounts until it has been validated by both the Authorising Officer and the Accounting Officer, any expenditure which was not validated at year end is shown under the heading of ‘unallocated expenses’ on the balance sheet (see table 3).
Cash basis expenditure includes all payment orders executed by the banks up to 31 December 2007.
In order to comply with accrual accounting principles the cash basis expenditure provided by the present IT accounting system (OLAS) has been adjusted with the additional information provided by the Authorising Officer about pre-financing and accrued expenditure.
1.3.4. CONTINGENT ASSETS AND LIABILITIES
1.3.4.1. Contingent assets
A contingent asset is a possible asset that arises from past events and of which the existence will be confirmed only by the occurrence or non-occurrence of one or more uncertain future events not wholly within the control of the European Communities. A contingent asset is disclosed when an inflow of economic benefits or service potential is probable.
Contingent assets are assessed continually to ensure that developments are appropriately reflected in the financial statements. If it has become virtually certain that an inflow of economic benefits or service potential will arise and the asset's value can be measured reliably, the asset and the related revenue are recognised in the financial statements of the period in which the change occurs.
1.3.4.2. Guarantees
Guarantees are possible assets or obligations that arise from past events and whose existence will be confirmed by the occurrence or non-occurrence of the object of the guarantee. Guarantees thus qualify as contingent assets or liabilities. A guarantee is settled when the object of the guarantee no longer exists. It is crystallised when the conditions are fulfilled for calling a payment from the guarantor.
1.3.5. RECORDING OF OPERATIONS
Entitlements due from the Member States (mainly contributions which have not yet been called or interest due on the late payment of called funds) must be entered in the accounts. These items are set out in the balance sheets for the various EDFs.
In accordance with the principles of accrual-based accounting, the financial statements show the financial charges and income for the financial year regardless of the date of payment or collection.
1.3.6. USE OF ESTIMATES
In accordance with generally accepted accounting principles, the financial statements necessarily include amounts based on estimates and assumptions by management based on the most reliable information available. Significant estimates include, but are not limited to, provisions for future charges, financial risk on accounts receivable, accrued income and charges. Actual results could differ from those estimates. Changes in estimates are reflected in the period in which they become known.
1.3.7. NOTES TO THE BALANCE SHEET
(1) RECEIVABLES
Table 1
|
(EUR million) |
||||||||
|
Receivables |
Notes |
7th |
8th |
9th |
Total at 31.12.2007 |
Total at 31.12.2006 |
||
|
Contributions to be received |
|
|
|
|
0,00 |
0,00 |
||
|
Interest receivable on late contributions |
1.1 |
|
|
|
0,00 |
2,09 |
||
|
Interest receivable on late contributions — STABEX |
1.1 |
|
|
|
0,00 |
0,79 |
||
|
Interest receivable — European banks |
1.2 |
|
|
1,19 |
1,19 |
0,88 |
||
|
Interest receivable — STABEX security |
1.3 |
|
|
0,41 |
0,41 |
0,61 |
||
|
Banks charges to be refund |
|
|
|
|
0,00 |
0,02 |
||
|
Recovery orders to be issued (2006) |
1.4 |
|
|
|
0,00 |
196,58 |
||
|
Open recovery orders |
1.5 |
4,90 |
3,72 |
3,25 |
11,88 |
20,48 |
||
|
1.6 |
– 2,79 |
– 1,09 |
– 1,10 |
– 4,98 |
– 4,63 |
||
|
Total |
|
2,12 |
2,64 |
3,75 |
8,50 |
216,83 |
||
In accordance with the provisions of the Cotonou Agreement, interest income relates to the 9th EDF. Such funds can be used according to the provisions of articles 1.3, 4 and 9 of the Internal Agreement applicable to 9th EDF (see note 11). The sole exception is the interest earned in STABEX security accounts which relates to the 8th EDF as this aid instrument does not feature in the 9th EDF (see notes 5 and 15).
(1.1) Interest receivable on late contributions
In accordance with Article 40(4) of the 9th EDF Financial Regulation, interest is charged to the Member States in the event of late payment of the called-up contributions. This interest results in an effective increase in the Funds' overall appropriations and represents its only source of operating revenue (see economic outturn account).
Table 1.1
|
(EUR million) |
||||
|
Interest on late payment of EDF contributions |
Balance at 31.12.2006 |
Late interest revenue 2007 |
Interest received 2007 |
Balance at 31.12.2007 |
|
France |
1,00 |
|
– 1,00 |
0,00 |
|
Netherlands |
|
0,02 |
– 0,02 |
0,00 |
|
Spain |
0,06 |
0,00 |
– 0,06 |
0,00 |
|
United Kingdom |
1,02 |
|
– 1,02 |
0,00 |
|
Total |
2,09 |
0,02 |
– 2,11 |
0,00 |
(1.2) Interest receivable European banks
This amount represents interest earned on the European bank accounts and the STABEX current account during the financial year 2007, for which the payment will be received in 2008.
(1.3) Interest receivable STABEX security accounts
This amount represents interest earned on the STABEX security accounts during the financial year 2007, for which the payment will be received in 2008. This interest is the property of the relevant beneficiary countries.
(1.4) Recovery orders to be issued
For the first time in 2007 and to improve transparency, recovery orders to be issued against prefinancing paid are not presented as receivables but instead they are classified as prefinancing. To allow comparison with previous years, the estimations calculated by the Authorising Officer are presented in the table below (see also note 2).
Table 1.4
|
(EUR million) |
||||
|
Recovery orders to be issued |
7th EDF |
8th EDF |
9th EDF |
TOTAL |
|
Total at 31.12.2007 |
9,90 |
24,95 |
144,97 |
179,82 |
|
Total at 31.12.2006 |
14,54 |
62,38 |
119,67 |
196,58 |
|
Increase (Decrease) |
– 4,64 |
– 37,42 |
25,30 |
– 16,76 |
(1.5) Open recovery orders
The closing balance for recovery orders represents the value of recovery orders issued but unpaid at the year end.
(1.6) Impairment of receivables
In compliance with IPSAS 19, the Accounting Officer has established a provision for doubtful debts based on two variables:
|
— |
Age of the debt, applying a provision of 20 % of the euro value for each year the debt is outstanding |
|
— |
The evaluation of the non recovery risk, in collaboration with the Authorising Officer. |
Potential exchange rate losses (on recovery orders not issued in euro) are not taken into account for this calculation, as these are not considered to be material.
Table 1.6
|
(EUR million) |
||||
|
Impairment of receivables |
7th EDF |
8th EDF |
9th EDF |
Total |
|
Balance at 31.12.2007 |
2,79 |
1,09 |
1,10 |
4,98 |
|
Balance at 31.12.2006 |
2,87 |
0,11 |
1,65 |
4,63 |
|
Increase (Decrease) |
– 0,08 |
0,97 |
– 0,54 |
0,35 |
(2) NET PRE-FINANCING
Following the principles of accrual accounting, advance payments made by the EDF are classified as assets. The figures for open pre-financing have been provided by the Authorising Officer (see table 2.1). The pre-financing is presented net of the open recovery orders concerning advances and the estimated amounts not yet cleared at year end.
To improve transparency, and for the first time in 2007, prefinancing is not netted of recovery orders to be issued (see note 1.4). This reclassification has no impact in the net assets of the funds.
Table 2
|
(EUR million) |
||||||||
|
Net pre-financing |
Notes |
7th EDF |
8th EDF |
9th EDF |
Total 31.12.2007 |
Total 31.12.2006 |
||
|
Pre-financing (gross) |
2.1 |
152,34 |
383,89 |
2 230,29 |
2 766,52 |
3 024,37 |
||
|
Advances for study grants management |
2.2 |
|
|
1,38 |
1,38 |
1,58 |
||
|
2.3 |
– 72,08 |
– 253,19 |
– 1 475,24 |
– 1 800,51 |
|
||
|
1.5 |
– 4,90 |
– 3,72 |
– 3,25 |
– 11,88 |
– 20,48 |
||
|
1.4 |
|
|
|
0,00 |
– 196,58 |
||
|
Total |
|
75,36 |
126,98 |
753,18 |
955,52 |
2 808,88 |
||
(2.1) Pre-financing(gross)
Many contracts provide for payments of advances before the commencement of works, deliveries of supplies or the provision of services. Sometimes the payment schedules of contracts foresee payments on account on the basis of progress reports. Advances, which normally are paid in the currency of the country or territory where the project is executed, are kept separate in the accounts of the Authorising Officer to allow them to be cleared.
The table below summarises outstanding advances (except for structural adjustment programmes and direct budgetary support programmes) registered in the Authorising Officer's accounts at the end of the year. Conversion into EUR is made using the official exchange rate of December 31 (see point 1.3.1.3).
Table 2.1
|
(EUR million) |
||||
|
Pre-financing (gross) |
7th EDF |
8th EDF |
9th EDF |
Total |
|
Total at 31.12.2007 |
152,34 |
383,89 |
2 230,29 |
2 766,52 |
|
Total at 31.12.2006 |
223,67 |
959,66 |
1 841,04 |
3 024,37 |
|
Increase (Decrease) |
– 71,34 |
– 575,76 |
389,26 |
– 257,84 |
(2.2) Advances for study grants management
This amount corresponds to advances paid to external bodies for the management of study awards.
(2.3) Estimated clearing of prefinancing
This amount represents the accrued charges calculated by the Authorising Officer corresponding to the amount of eligible costs that were incurred by the beneficiaries of the outstanding prefinancing at year end, but not yet reported. These amounts are treated as expenditure in the Economic Outturn Account and have been reclassified from accounts payables to prefinancing for the first time in 2007. This reclassification has no impact on the aggregated net assets and therefore the opening balance has not been restated.
For information purposes, the impact of the reclassification on the 2006 aggregated current assets and liabilities is detailed below.
|
(EUR million) |
||||
|
|
Notes |
As presented in 2006 final accounts |
Reclassification |
Adjusted balance 31.12.2006 |
|
CURRENT ASSETS |
||||
|
Receivables |
1 |
216,83 |
|
216,83 |
|
Net Pre-financing |
2 |
2 808,88 |
– 1 789,36 |
1 019,53 |
|
Other current assets |
3 |
0,95 |
|
0,95 |
|
Cash and cash equivalents |
|
291,50 |
|
291,50 |
|
STABEX security accounts |
5 |
191,60 |
|
191,60 |
|
RD Congo special fund |
6 |
3,42 |
|
3,42 |
|
Cash at bank |
7 |
96,48 |
|
96,48 |
|
Total assets |
|
3 318,17 |
– 1 789,36 |
1 528,81 |
|
CURRENT LIABILITIES |
||||
|
Payables |
8 |
2 095,86 |
– 1 789,36 |
306,50 |
|
Total liabilities |
|
2 095,86 |
– 1 789,36 |
306,50 |
|
Net assets |
|
1 222,31 |
0,00 |
1 222,31 |
(3) OTHER CURRENT ASSETS
This amount comprises all payments/receipts awaiting final allocation to the appropriate projects and economic outturn account.
Table 3
|
(EUR million) |
|||
|
Other current assets |
9th EDF |
Total at 31.12.2007 |
Total at 31.12.2006 |
|
Unallocated expenses |
1,19 |
1,19 |
2,65 |
|
Devaluation |
0,00 |
0,00 |
0,00 |
|
Unallocated revenue |
– 4,55 |
– 4,55 |
– 2,12 |
|
Partial off-settings |
0,70 |
0,70 |
0,42 |
|
Total |
– 2,65 |
– 2,65 |
0,95 |
(4) LIAISON ACCOUNTS
For reasons of efficiency, there is a single treasury for all the EDFs being implemented; this leads to operations between the various EDFs, which are balanced out in the liaison accounts between the various balance sheets.
Table 4
|
(EUR million) |
|||||
|
Liaison accounts |
7th EDF |
8th EDF |
9th EDF |
Total at 31.12.2007 |
Total at 31.12.2006 |
|
To/from 6th EDF |
2 279,31 |
– 2 065,45 |
– 213,85 |
0,00 |
|
|
To/from 7th EDF |
|
|
2 037,08 |
2 037,08 |
– 410,80 |
|
To/from 8th EDF |
|
|
– 3 301,13 |
– 3 301,13 |
– 385,12 |
|
To/from 9th EDF |
– 2 037,08 |
3 301,13 |
|
1 264,05 |
795,93 |
|
|
242,23 |
1 235,68 |
– 1 477,91 |
0,00 |
0,00 |
Table 4.1
|
(EUR million) |
||||
|
Liaison accounts |
7th EDF |
8th EDF |
9th EDF |
Total |
|
2007 |
||||
|
Assets |
2 279,31 |
3 301,13 |
2 037,08 |
7 617,51 |
|
Liabilities |
2 037,08 |
2 065,45 |
3 514,98 |
7 617,51 |
|
Total 2007 |
242,23 |
1 235,68 |
– 1 477,91 |
0,00 |
|
2006 |
||||
|
Assets |
2 279,31 |
2 450,58 |
1 868,50 |
6 598,39 |
|
Liabilities |
1 868,50 |
2 065,45 |
2 664,43 |
6 598,39 |
|
Total 2006 |
410,80 |
385,12 |
– 795,93 |
0,00 |
(5) STABEX SECURITY ACCOUNTS
The STABEX is the acronym for a European Commission compensatory finance scheme to stabilise export earnings of the ACP countries. It was first introduced in the first Lomé Convention (1975) with the purpose of remedying the harmful effects of the instability of export revenue from agricultural products.
The balance on the STABEX security accounts represents the total of STABEX funds available and which will be transferred to the relevant beneficiary ACP State at a future date. This total amount concerns the 8th EDF, with the exception of EUR 2,51 million allocated to Sudan, which fell under the 7th EDF.
Table 5
|
(EUR million) |
|||||
|
STABEX security accounts |
EDF |
Balance at 31.12.2006 |
Interest |
Payments |
Balance at 31.12.2007 |
|
BENIN |
8th |
0,05 |
0,00 |
|
0,05 |
|
BURKINA FASO |
8th |
0,78 |
0,01 |
0,78 |
0,01 |
|
BURUNDI |
7th/8th |
26,62 |
1,05 |
26,99 |
0,68 |
|
CAMEROUN |
8th |
5,52 |
0,04 |
5,54 |
0,02 |
|
COMOROS |
8th |
0,06 |
0,00 |
|
0,06 |
|
DOMINICA |
8th |
0,26 |
0,01 |
0,19 |
0,08 |
|
ETHIOPIA |
8th |
0,93 |
0,04 |
|
0,96 |
|
GAMBIA |
8th |
1,03 |
0,04 |
|
1,07 |
|
GRENADA |
8th |
0,34 |
0,01 |
|
0,35 |
|
GUINEA-BISSAU |
8th |
0,34 |
0,01 |
|
0,35 |
|
COTE D'IVOIRE |
8th |
15,85 |
0,44 |
14,73 |
1,57 |
|
JAMAICA |
8th |
0,60 |
0,02 |
|
0,62 |
|
MADAGASCAR |
8th |
0,65 |
0,03 |
|
0,68 |
|
MALAWI |
8th |
0,94 |
0,04 |
|
0,97 |
|
MAURITANIA |
8th |
18,22 |
0,72 |
18,56 |
0,38 |
|
PAPUA-NEW GUINEA |
8th |
0,68 |
0,03 |
|
0,70 |
|
RWANDA |
8th |
5,89 |
0,23 |
|
6,12 |
|
SENEGAL |
8th |
10,33 |
0,41 |
|
10,74 |
|
SIERRA LEONE |
8th |
3,13 |
0,12 |
3,19 |
0,07 |
|
SAINT LUCIA |
8th |
14,05 |
0,56 |
|
14,60 |
|
SOLOMON ISLANDS |
8th |
0,08 |
0,00 |
0,08 |
0,00 |
|
SUDAN |
7th/8th |
54,52 |
1,94 |
7,83 |
48,62 |
|
ST VINCENT & GRENADINES |
8th |
4,05 |
0,16 |
|
4,21 |
|
TANZANIA |
8th |
14,00 |
0,26 |
10,70 |
3,56 |
|
TONGA |
8th |
0,09 |
0,00 |
|
0,09 |
|
UGANDA |
8th |
9,72 |
0,07 |
9,78 |
0,00 |
|
ZIMBABWE |
8th |
2,90 |
0,11 |
|
3,01 |
|
Total STABEX |
|
191,60 |
6,38 |
98,37 |
99,61 |
In addition to these funds, there are other STABEX funds held by beneficiary ACP States. Once the Commission and the beneficiary (ACP) State have reached agreement on how the STABEX funds are to be utilised, a transfer convention is signed by both parties. In accordance with the provisions of Article 211 of the Lomé IV Agreement (7) (as revised), the funds are transferred into an interest bearing double signature account (Commission official and Beneficiary State) opened in the name of the ACP State. The Commission official retains the power of signature over the account in order to ensure that the funds are disbursed as intended.
As these funds are the property of the ACP State, they are not recorded as assets in the EDF Annual Accounts and the transfers to these accounts are recorded as STABEX payments. Details on these accounts are however provided in the annual EDF Financial Management Report (8).
(6) SPECIAL D.R. CONGO ACCOUNT
This balance represents the amounts available for D.R. Congo in accordance with the provisions of Council Decision 2003/583/EC (9).
(7) CASH AT BANKS
In accordance with Article 129 of the 9th EDF Financial Regulation the treasury is presented in the balance sheet of the 9th EDF.
Table 7
|
(EUR million) |
|||
|
Cash and cash equivalents |
Notes |
Balance at 31.12.2007 |
Balance at 31.12.2006 |
|
Treasury accounts |
7.1 |
208,09 |
3,55 |
|
Local Paying Agents |
7.2 |
54,67 |
59,37 |
|
European Paying Agents |
7.3 |
13,06 |
21,29 |
|
STABEX current account |
7.4 |
8,47 |
12,17 |
|
Cash in transit |
7.5 |
0,95 |
0,10 |
|
Total |
|
285,24 |
96,48 |
(7.1) Treasury accounts
These are accounts held with the central banks of the Member States into which EDF contributions are paid. The Accounting Officer makes transfers from these accounts to the European paying agents.
(7.2) Local paying agents
These are amounts held in bank accounts within ACP States and OCTs used for making payments in local currency within the beneficiary state. The accounts are generally kept in euros, but may also be kept in a currency of a Community Member State.
(7.3) European paying agents
These accounts are held with commercial banks established in the EU-15 Member States and with the EIB. The accounts are kept in euros and are used for payments to beneficiaries within the Union and elsewhere. Payments are generally made in euros, but may also be made in other currencies. These funds are also used to replenish local paying agent accounts and the liaison account with the General Budget of the EU.
(7.4) STABEX current account
This amount represents the cash balance remaining on the STABEX main account which will be made available for Togo by way of transfer to a security account, once instructions have been received from the Authorising Officer. The decrease of EUR 3,70 million compared to 2006 represents the transfer to the EDF main account (allocation to the general long term development reserve) in the course of 2007 following the instructions from the Authorising Officer.
The interest earned in this account is periodically transferred to the EDF main account to be used in accordance with Articles 1.3 and 9 of the Internal Agreement applicable to 9th EDF.
(7.5) Cash in transit
Some replenishment sent before the year end were only registered by the beneficiary bank in 2008.
(8) PAYABLES
Table 8
|
(EUR million) |
||||||||
|
Payables |
Notes |
7th EDF |
8th EDF |
9th EDF |
Total at 31.12.2007 |
Total at 31.12.2006 |
||
|
Deferred income |
8,1 |
|
|
211,08 |
211,08 |
3,49 |
||
|
Liaison a/c with General Budget of the EU |
8,2 |
|
|
8,92 |
8,92 |
– 49,73 |
||
|
Accrued Expenses |
|
19,59 |
124,35 |
340,04 |
483,98 |
2 142,10 |
||
|
Non finalised payments |
8,3 |
4,22 |
15,85 |
62,04 |
82,11 |
110,29 |
||
|
Eligibility to be confirmed |
8,4 |
3,76 |
30,00 |
81,19 |
114,96 |
107,19 |
||
|
Invoices to be received |
8,5 |
83,69 |
331,69 |
1 672,04 |
2 087,42 |
1 924,62 |
||
|
2,3 |
– 72,08 |
– 253,19 |
– 1 475,24 |
– 1 800,51 |
0,00 |
||
|
Total |
|
19,59 |
124,35 |
560,05 |
703,98 |
2 095,86 |
||
(8.1) Deferred income
Table 8.1
|
(EUR million) |
||
|
Contributions received in advance |
Balance at 31.12.2007 |
Balance at 31.12.2006 |
|
Ireland |
1,00 |
3,49 |
|
United Kingdom |
208,09 |
|
|
Finland |
2,00 |
|
|
Total |
211,08 |
3,49 |
(8.2) Liaison account with the General Budget of the EU
As from the beginning of financial year 2005, payments to beneficiaries within the Union are executed through SWIFT by the General Budget of the European Union. For this purpose, a current account has been opened. This account is presented in the cash flow statement as cash equivalent.
Accrued expenses
The accounting information provided by the present IT accounting system (OLAS) has been adjusted in order to provide figures which comply with accrual accounting principles. Additional information has been provided by the Authorising Officer. This item includes non finalised payments, eligibility to be confirmed and an estimation of invoices to be received based in the degree of advancement of projects.
In 2007 the methodology for the determination of the accrued expenditure has been refined to incorporate to the analysis the type of contract.
The estimated amount of eligible costs incurred by the beneficiaries of outstanding prefinancing amounts but not yet reported at year is now classified under prefinancing (see note 2.3).
(8.3) Non finalised payments
These are payments authorised before 31 December 2007 but executed by the bank in 2008. The amounts registered in the accounts of the Authorising Officer are shown in table 8.3.
Table 8.3
|
(EUR million) |
||||
|
Non finalised payments |
7th EDF |
8th EDF |
9th EDF |
Total |
|
Total at 31.12.2007 |
4,22 |
15,85 |
62,04 |
82,11 |
|
Total at 31.12.2006 |
4,02 |
26,58 |
79,69 |
110,29 |
|
Increase (Decrease) |
0,19 |
-10,72 |
-17,65 |
-28,18 |
(8.4) Eligibility to be confirmed
These are invoices which arrived before the end of the financial year 2007 but which had still not been analysed at the yearly closure. The amounts registered in the accounts of the Authorising Officer are shown in table 8.4.
Table 8.4
|
(EUR million) |
||||
|
Eligibility to be confirmed |
7th EDF |
8th EDF |
9th EDF |
Total |
|
Total at 31.12.2007 |
3,76 |
30,00 |
81,19 |
114,96 |
|
Total at 31.12.2006 |
9,31 |
42,99 |
54,89 |
107,19 |
|
Increase (Decrease) |
– 5,55 |
– 12,99 |
26,30 |
7,77 |
(8.5) Invoices to be received
These figures reflect expenditure which has been incurred but has not yet been invoiced (e.g. work in progress on capital projects). The amounts estimated by the Authorising Officer are shown in table 8.5.
Table 8.5
|
(EUR million) |
||||
|
Invoices to be received |
7th EDF |
8th EDF |
9th EDF |
Total |
|
Total at 31.12.2007 |
83,69 |
331,69 |
1 672,04 |
2 087,42 |
|
Total at 31.12.2006 |
79,29 |
582,17 |
1 263,17 |
1 924,62 |
|
Increase (Decrease) |
4,40 |
– 250,48 |
408,87 |
162,80 |
Funds and Reserves
(9) CALLED FUND CAPITAL
Table 9
|
(EUR million) |
|||||
|
|
6th EDF |
7th EDF |
8th EDF |
9th EDF |
Total EDF |
|
Capital 2007 |
|
0,00 |
0,00 |
10 460,15 |
10 460,15 |
|
Funds Capital (a) |
|
10 940,00 |
12 840,00 |
11 699,32 |
35 479,32 |
|
Uncalled funds (b) |
|
0,00 |
0,00 |
10 460,15 |
10 460,15 |
|
Called fund capital (a)-(b) |
|
10 940,00 |
12 840,00 |
1 239,17 |
25 019,17 |
|
Capital 2006 |
|
|
|
|
|
|
Funds Capital (a) |
7 560,00 |
10 940,00 |
12 840,00 |
11 659,15 |
42 999,15 |
|
Uncalled funds (b) |
0,00 |
0,00 |
1 545,00 |
11 554,15 |
13 099,15 |
|
Called fund capital (a)-(b) |
7 560,00 |
10 940,00 |
11 295,00 |
105,00 |
29 900,00 |
The fund capital represents the total amount receivable from the Member States for the relevant EDF fund as laid down in each of the Internal Agreement (10) between the Member States and the beneficiary ACP States and OCTs.
The initial allocation for the (current) 9th EDF, which originally totalled EUR 10,555 million, has since been increased by an amount of EUR 105 million in 2004, which was released by the EIB in accordance with the provisions of Council Decision 2003/583/EC. This additional allocation is in favour of actions to be undertaken in the Democratic Republic of the Congo.
Article 2(2) of the Internal Agreement for the 9th EDF set a EUR 1,000 million reserve. Since 2004 a set of Council decisions (11) allowed the release of EUR 999 million. The remaining amount of EUR 1 million has been released during 2007.
Following the decision of the joint ACP/EU Council on 25th May 2007 (12), the Commission has decided to launch a call for additional voluntary contributions to support the African Peace Facility in the framework of the intra ACP cooperation. Detailed amounts by country are shown in table 9.1.
The 2007 aggregated financial statements include the 7th, 8th and 9th EDFs. The aggregated statement of changes in net assets reflects the closure of the 6th EDF as a 2007 event. The closure of the 6th EDF had not been reflected in 2006, which was when the closure effectively took place. As the net assets of the 6th EDF were nil at the end of 2006, an exclusion of the 6th EDF would not have had any impact on the aggregated net assets. For information purposes, the impact of the closure of the 6th EDF on the 2006 aggregated funds and reserves is detailed below.
|
(EUR million) |
|||
|
|
As presented in 2006 final accounts |
Adjustment to exclude the 6th EDF |
Adjusted balance 31.12.2006 |
|
FUNDS & RESERVES |
|||
|
Called fund capital |
29 900,00 |
– 7 560,00 |
22 340,00 |
|
Results carried forward from previous years |
– 26 787,49 |
7 300,94 |
– 19 486,54 |
|
Result for the year |
– 2 924,04 |
0,00 |
– 2 924,04 |
|
Reserves |
1 033,84 |
259,06 |
1 292,89 |
|
Net assets |
1 222,31 |
0,00 |
1 222,31 |
Uncalled funds represent the initial allocation not yet receivable from Member States.
Called funds capital represents the amount of the initial allocations which has been called up for transfer to the treasury accounts by the Member States in accordance with the procedure in Article 8 of the Financial Regulation, whereby each year the Commission must establish and communicate to the Council a statement of the payments to be made in the following year and a schedule of calls for contributions. The Commission must justify the amount requested on the basis of its capacity to deliver the proposed level of resources effectively.
Details of contributions called up and received during the year 2007 are shown in table 9.1. In 2007 the contributions due under the 8th EDF were fully exhausted and the Authorising Officer started the call for the 9th EDF contributions which were increased by the voluntary contributions.
Table 9.1
|
(EUR million) |
|||||||||
|
Contributions |
% |
Called up in 2006 |
Received in 2006 |
Called up in 2007 (8th EDF) |
Called up in 2007 (9th EDF) |
Voluntary contributions 2007 |
Received in 2007 |
Total called up 8th EDF |
Uncalled 9th EDF |
|
Austria |
2,65 |
66,52 |
66,52 |
40,68 |
29,28 |
|
69,96 |
289,12 |
276,93 |
|
Belgium |
3,92 |
98,39 |
98,39 |
60,24 |
43,25 |
1,25 |
104,74 |
427,74 |
409,71 |
|
Denmark |
2,14 |
53,71 |
53,71 |
33,29 |
23,21 |
|
56,50 |
233,91 |
224,07 |
|
Finland |
1,48 |
37,15 |
37,15 |
22,83 |
16,24 |
|
39,07 |
161,58 |
154,78 |
|
France |
24,30 |
609,93 |
623,65 |
375,32 |
266,21 |
10,00 |
651,52 |
2 653,44 |
2 541,70 |
|
Germany |
23,36 |
586,34 |
586,34 |
361,49 |
255,22 |
25,00 |
641,70 |
2 551,49 |
2 444,07 |
|
Greece |
1,25 |
31,38 |
31,38 |
18,81 |
14,19 |
0,50 |
33,50 |
136,00 |
130,25 |
|
Ireland |
0,62 |
15,56 |
15,56 |
9,97 |
6,40 |
2,00 |
18,37 |
68,10 |
65,24 |
|
Italy |
12,54 |
314,75 |
314,75 |
193,61 |
137,45 |
|
331,06 |
1 369,23 |
1 311,57 |
|
Luxemburg |
0,29 |
7,28 |
7,28 |
4,24 |
3,41 |
0,20 |
7,86 |
31,43 |
30,10 |
|
Netherlands |
5,22 |
131,02 |
131,02 |
80,40 |
57,41 |
|
137,81 |
569,78 |
545,77 |
|
Portugal |
0,97 |
24,35 |
24,35 |
15,44 |
10,17 |
|
25,61 |
106,38 |
101,92 |
|
Spain |
5,84 |
146,58 |
146,58 |
90,37 |
63,80 |
|
154,18 |
637,87 |
611,02 |
|
Sweden |
2,73 |
68,52 |
68,52 |
41,65 |
30,43 |
|
72,07 |
297,58 |
285,03 |
|
United Kingdom |
12,69 |
318,52 |
318,52 |
196,66 |
138,35 |
|
335,02 |
1 386,35 |
1 328,00 |
|
Estonia |
N.A. |
|
|
|
|
0,03 |
0,03 |
N.A. |
N.A. |
|
Czech Republic |
N.A. |
|
|
|
|
0,18 |
0,18 |
N.A. |
N.A. |
|
EIB 8th EDF |
|
|
|
|
|
|
|
120,00 |
N.A. |
|
STABEX |
|
|
|
|
|
|
|
1 800,00 |
N.A. |
|
Total |
100,00 |
2 510,00 |
2 523,72 |
1 545,00 |
1 095,00 |
39,17 |
2 679,17 |
12 840,00 |
10 460,15 |
(10) RESERVES
Since the entry into force of the Cotonou Agreement, all the unspent funds in previous EDFs are transferred to the 9th EDF after decommitment. The resources transferred from other EDFs increase the appropriation of the receiving fund and reduce that of the fund of origin.
Table 10
|
(EUR million) |
|||||
|
Inter-EDF transfers |
7th EDF |
8th EDF |
9th EDF |
Consolidate |
Total at 31.12.2007 |
|
To/from 5th EDF |
526,78 |
|
|
|
526,78 |
|
To/from 6th EDF |
181,76 |
94,00 |
490,36 |
|
766,12 |
|
To/from 7th EDF |
|
532,82 |
933,45 |
1 466,26 |
1 466,26 |
|
To/from 8th EDF |
– 532,82 |
|
2 721,88 |
2 189,06 |
2 189,06 |
|
To/from 9th EDF |
– 933,45 |
– 2 721,88 |
|
– 3 655,33 |
– 3 655,33 |
|
Total |
– 757,73 |
– 2 095,06 |
4 145,68 |
0,00 |
1 292,89 |
1.3.8. NOTES TO THE ECONOMIC OUTTURN ACCOUNT
(11) ADMINISTRATIVE AND FINANCIAL EXPENSES
This heading includes administrative and financial expenditure financed by interest and related to the devolution process in application of the provisions of articles 1.3, 4 and 9 of the Internal Agreement applicable to 9th EDF.
In addition, following Council Decision 599 on 21st June 2005, a complementary amount of EUR 90 million from the intra ACP allocation has been reallocated to finance devolution. In 2006, expenditure for personnel and infrastructure costs in this heading amounted to EUR 63 million and to EUR 26 million in 2007.
(12) TOTAL EXPENSES (CASH BASIS)
These amounts represent total payments for the Fund(s) in question during the 2007 financial year on a cash accounting basis, including advance payments and recovery orders. Cumulative figures are shown in the Report on Financial Implementation prepared by the Authorising Officer.
(13) ACCRUAL ADJUSTMENTS
Total expenditure has been restated to comply with the international accounting standard, IPSAS 3. The accounting information provided by the EDF accounting system has been adapted, where necessary, in order to provide figures which comply with accrual accounting principles. Additional information in respect of income and expenditure items has also been provided by the Authorising Officer.
Table 13
|
(EUR million) |
|||||||
|
Accrual adjustments annual increase 2007 |
Notes |
7th EDF |
8th EDF |
9th EDF |
Increase 2007 |
||
|
2 |
– 143,41 |
– 828,96 |
– 1 085,98 |
– 2 058,35 |
||
|
16 |
|
|
0,34 |
0,34 |
||
|
Accrued Expenses |
|
– 73,03 |
– 527,38 |
– 1 057,71 |
– 1 658,12 |
||
|
Non finalised payments |
8.3 |
0,19 |
– 10,72 |
– 17,65 |
– 28,18 |
||
|
Eligibility to be confirmed |
8.4 |
– 5,55 |
– 12,99 |
26,30 |
7,77 |
||
|
Invoices to be received |
8.5 |
4,40 |
– 250,48 |
408,87 |
162,80 |
||
|
2.3 |
– 72,08 |
– 253,19 |
– 1 475,24 |
– 1 800,51 |
||
|
Total accruals |
|
70,39 |
301,57 |
27,93 |
399,89 |
||
(14) TOTAL EXPENSES ON AN ACCRUAL BASIS
Project expenditure by EDF has been restated in accordance with the relevant international accounting standards. The expenditure for each aid instrument will be presented on a full accrual basis as and from the 2009 financial year, once the accounts have been migrated to the new IT (ABAC) system.
(15) FINANCIAL REVENUE
Interest revenue is related to the 9th EDF. The sole is STABEX security interest which is related to the 8th EDF due to absence of this aid instrument in the 9th EDF.
Table 15
|
(EUR million) |
|||||
|
Interest earned during 2007 |
Notes |
8th EDF |
9th EDF |
Total at 31.12.2007 |
Total at 31.12.2006 |
|
EIB |
15.1 |
|
2,49 |
2,49 |
10,56 |
|
European banks |
15.1 |
|
9,80 |
9,80 |
11,44 |
|
Recovery orders |
15.2 |
|
0,04 |
0,04 |
0,00 |
|
STABEX security accounts |
15.3 |
6,18 |
|
6,18 |
9,13 |
|
Special D R Congo contribution |
15.3 |
|
0,14 |
0,14 |
0,49 |
|
Total interest |
|
6,18 |
12,47 |
18,65 |
31,61 |
(15.1) EIB and European banks interest revenue
The interest earned on accounts with European paying agents (including the main STABEX account) can be used to finance projects in accordance with Articles 1.3 and 9 of the Internal Agreement applicable to 9th EDF. This interest results in an effective increase in the Funds' overall appropriations.
(15.2) Interest revenue on late payments of recovery orders
This is interest earned on late payments of recovery orders by debtors. Such funds can be used for financing projects in accordance with Articles 1.3 and 9 of the Internal Agreement applicable to 9th EDF. This interest results in an effective increase in the Funds' overall appropriations.
(15.3) Interest revenue on the STABEX security accounts and the Special D. R. Congo account
This represents the income generated by the STABEX security accounts and the Special Democratic Republic of the Congo account. Whilst such income appears to increase the total of the Fund it should be borne in mind that any income generated by these accounts is earmarked for a specific purpose and beneficiary state (see note 5).
(16) FINANCIAL EXPENSES
In the present IT system (OLAS), this category of expenditure is booked as a part of administrative costs. In the interests of transparency these costs are now presented under a separate heading. In 2007 financial expenses amount to EUR 0,34 million.
1.4. OFF BALANCE SHEET ITEMS
Guarantees are held to secure pre-financing and released when the final claim under a project is paid. In accordance with the ‘prudence’ concept and in compliance with the provisions of IPSAS 19, contingent assets are not accounted for in the financial statements. They are disclosed here by way of note in the interests of transparency. There are two values to disclose for this type of guarantee: the ‘nominal’ and the ‘on-going values’. For the ‘nominal’ value the generating event is linked to the existence of the guarantee. The nominal value is disclosed as contingent asset. For the ‘on-going’ value, the guarantee's generating event is the prefinancing payment and/or subsequent clearings.
At 31st December 2007 the ‘nominal’ value of guarantees received in respect of prefinancing amounts EUR 576,79 million (see table below) compared to EUR 310,61 million for the ‘on-going’ value.
|
Guarantees |
On pre-financing |
On guarantee withholding |
On performance |
Total 31.12.2007 |
Total 31.12.2006 |
|
7th EDF |
56,52 |
17,19 |
32,09 |
105,80 |
111,70 |
|
8th EDF |
145,58 |
38,35 |
75,42 |
259,36 |
308,71 |
|
9th EDF |
374,68 |
104,75 |
159,60 |
639,04 |
302,62 |
|
Total |
576,79 |
160,30 |
267,11 |
1 004,20 |
723,02 |
2. REPORT ON FINANCIAL IMPLEMENTATION
INTRODUCTORY NOTE
Previous EDFs
Decision 1/2000 of the ACP-EC Council of 27 July 2000 regarding transitional measures provides for some of the unallocated resources from previous EDFs to be used for programmes consistent with the relevant provisions of the Cotonou Agreement and put into early application under transitional measures.
Commission Decision 410/2001 of 16 March 2001, which fixes the allocations for the indicative programmes of the ACP countries under the ACP-EC Partnership Agreement, stipulates that the unallocated resources from previous EDFs up to a maximum of EUR 1,2 billion are to be used for implementation in accordance with the rules and procedures of the relevant EDFs, pending the entry into force of the Financial Protocol to the 9th EDF.
Commission Decision 1033/2001 of 15 June 2001 fixed the allocations for regional programmes and intra-ACP cooperation under the Financial Protocol to the ACP-EC Partnership Agreement.
Commission Decision 1252/2002 of 11 July 2002 increased the envelope intended for intra-ACP cooperation by EUR 60 million, from the general reserves of the 6th and 7th EDFs, and also provided for the use of these additional funds pending the entry into force of the Financial Protocol to the 9th EDF, in accordance with the rules and procedures applicable to the original EDFs.
Lastly, Decision 3/2002 of the ACP-EC Council of Ministers of 23 December 2002 took an amount of €25 million from the unallocated resources of the 8th EDF (general reserve) and allocated it to regional cooperation under the ACP-EC Partnership Agreement.
As in past years, to ensure transparency in the presentation of the accounts for 2007, the tables below set out separately for each of the EDFs (7th and 8th) the part used for Lomé Convention programming and the part used for programming under the Cotonou Agreement. Entry in the accounts and the presentation of accounts in connection with the Cotonou Agreement is based on Article 3(2) of Annex IV to the ACP-EC Partnership Agreement, as regards countries. That Article gives the ACP countries an A envelope to cover macroeconomic support and support for programmes and projects and a B envelope to cover unforeseen needs such as emergency assistance, debt relief initiatives and support to offset the adverse effects of instability in export earnings (13). For the regions, the accounts are set out according to the regional programming as referred to in Chapter 2 of the ACP-EC Partnership Agreement (i.e. regional indicative programmes and intra-ACP cooperation).
Pursuant to Commission Decision C(2003)1904 of 16 June 2003 as amended by Decisions C(2006) 3862 of 24 August 2006 and C(2007)2149 of 24 May 2007, any balances remaining from previous EDFs on the date of entry into force of the Cotonou Agreement and any amounts decommitted at a later date from projects charged to these Funds were transferred to the 9th EDF. Any resource thus transferred to the 9th EDF after previously having been allocated to the indicative programme of an ACP State or region has been allocated to that State or region. On the other hand, the unallocated resources were transferred to reserves which have been reprogrammed under the 9th EDF. As the 6th EDF was closed in 2006, the annual accounts no longer contain implementation tables for that EDF. However, implementation of the transferred balances can be found in the 9th EDF.
9th EDF
The ACP-EC Partnership Agreement signed on 23 June 2000 in Cotonou by the Member States of the European Community and the States of Africa, the Caribbean and the Pacific (ACP States) entered into force on 1 April 2003.
The EU Council Decision of 27 November 2001 (2001/822/EC) on the association of the overseas countries and territories (OCT) with the European Community entered into force on 2 December 2001.
The Cotonou Agreement was concluded for a twenty-year period with a review clause and a Financial Protocol for each five-year period. For the first Financial Protocol (financed by the 9th EDF), once the unexpended balances of previous EDFs (14) have been taken into account, the Agreement covered the period up to the end of 2007 (15); for the second Financial Protocol (to be financed by the 10th EDF), it may be amended (and will in fact cover six years (16)).
The 9th EDF was set at EUR 13 800 million, including EUR 13 500 million allocated to the ACP States in accordance with the first Financial Protocol included in the Cotonou Agreement, EUR 175 million allocated to the OCT (provided for by the EU Council Decision on the association of the OCT) and EUR 125 million reserved for the European Commission to cover expenses in connection with implementing the 9th EDF resources (provided for in the internal agreement for the 9th EDF).
The long-term development budget for ACP States has two components:
The A envelope for macroeconomic support, sectoral policies, and programmes and projects supporting Community aid: this corresponds to the allocation for the NIPs and structural adjustment in previous EDFs.
The B envelope, intended to cover unforeseen needs such as emergency aid, contributions to debt relief initiatives and support to offset adverse fluctuations in export earnings, generally corresponds to the Stabex, Sysmin and emergency aid allocations in previous EDFs.
Of the total 9th EDF budget for the ACP States, EUR 1 000 million was released in 2004 and 2005 after examination by the EU Council, on the basis of a proposal from the European Commission:
|
— |
EUR 250 million was released in accordance with Council Decision 2004/289/EC of 22 March 2004 and allocated to the Intra-ACP Fund (natural resources) to finance the Water Facility operation. |
|
— |
EUR 18 million was released in accordance with Council Decision 10752/05 of 19 July 2005 and allocated to the envelope for long-term development support to cover the financing of the National Indicative Programme of Timor Leste for the period 2006-2007. |
|
— |
EUR 482 million was released in accordance with ACP-EC Council of Ministers Decision 6/2005 of 22 November 2006 and allocated to the envelope for long-term development support (EUR 352 million), the envelope for regional cooperation and integration (EUR 48 million) and the Investment Facility (EUR 82 million). These resources were released to contribute to financing of the EU Energy Initiative (EUR 220 million), the International Commodity Risk Management Financing Facility (EUR 25 million), adaptation to the new EU feed and food health and plant health rules (EUR 30 million), strengthening the African Union (EUR 50 million), the ‘Education for All’ Fast Track Initiative (EUR 63 million), tackling HIV/AIDS, tuberculosis and malaria (EUR 62 million), and the operating costs of the CDE/CTA (EUR 32 million). |
|
— |
EUR 250 million was released in accordance with ACP-EC Council of Ministers Decision 7/2005 of 22 November 2005 and the corrigendum of 1 February 2006 and allocated to the envelope for long-term development support (EUR 185 million), the envelope for regional cooperation and integration (EUR 24 million) and the Investment Facility (EUR 41 million). These resources were allocated to financing the Water Facility operation. |
The breakdown of 9th EDF allocations for ACP States, including the ‘conditional billion’ and allocations managed directly by the European Investment Bank (EIB), is as follows:
|
(EUR million) |
|||
|
|
9th EDF allocation |
Unopened allocations (EIB-managed) |
Open allocations OLAS (EC-managed) |
|
Long-term development budget |
10 000,00 |
(186,85) (17) |
9 813,15 |
|
Regional budget |
1 300,00 |
|
1 300,00 |
|
Investment facility |
2 200,00 |
(2.037,00) |
163,00 |
|
Total |
13 500,00 |
(2 223,85) |
11 276,15 |
The 9th EDF allocations for OCTs, including those managed directly by the European Investment Bank (EIB), break down as follows:
|
(EUR million) |
||||
|
|
9th EDF allocation |
Reduction/conditional billion |
Unopened allocations (EIB-managed) |
Open allocations OLAS (EC-managed) |
|
Long-term development budget |
127,10 |
|
127,10 |
127,10 |
|
C reserve |
17,90 |
(1,00) (18) |
16,90 |
17,90 |
|
Regional budget |
8,00 |
|
8,00 |
8,00 |
|
Budget for studies and technical assistance |
2,00 |
|
2,00 |
2,00 |
|
Investment facility |
20,00 |
(20,00) |
0,00 |
20,00 |
|
Total |
175,00 |
(21,00) |
154,00 |
175,00 |
The unallocated C reserve for OCTs is maintained to finance humanitarian aid, emergency aid, refugee assistance and fluctuations in export earnings, and corresponds to the B allocation for the ACP countries
Council Decision 2005/599/EC of 21 June 2005 allocated EUR 90 million within the intra-ACP envelope to financing devolution.
Pursuant to Commission Decision E/982/2003 of 16 June 2003, any balances remaining from previous EDFs on the date of entry into force of the Cotonou Agreement and any amounts decommitted at a later date from projects charged to these Funds were transferred to the 9th EDF. Any resource thus transferred to the 9th EDF after previously having been allocated to the indicative programme of an ACP State or region has been allocated to that State or region. On the other hand, the unallocated resources were transferred to reserves which have been reprogrammed under the 9th EDF. The total amount transferred since the entry into force of the 9th EDF is EUR 4,1 billion.
Pursuant to Decision 2/2007 of the ACP-EC Council of Ministers of 25 May 2007 designed to allow additional bilateral contributions for intra-ACP cooperation in support of the objectives of the African Peace Facility, to be managed by the Commission, the 9th EDF was increased by EUR 39,17 million, which is shown separately on a specific financial instrument.
As the funds of the 9th EDF, including the expected decommitments, could no longer be committed after 31 December 2007 (19), a mechanism had to be found to commit the outstanding balances available before that date, in an effective manner, in support of the overall objectives of the ACP-EC partnership. Decision 1/2007 of the ACP-EC Council of Ministers of 25 May 2007 provides for reassigning part of the reserve of the 9th EDF envelope for long-term development to intra-ACP cooperation in the 9th EDF envelope for regional cooperation and integration. The funds transferred to the long-term development reserve on the basis of the end-of-term reviews of the national indicative programmes and the amounts available for intra-ACP cooperation have been mobilised in accordance with Decision 1/2007 as follows:
|
(a) |
one intra-ACP reserve of EUR 26,7 billion open to all ACP States for emergency assistance under Article 72(3)(a) and (b) of the ACP-EC Partnership Agreement; |
|
(b) |
five regionalised B-envelopes amounting to EUR 17,5 million for the Southern African region, EUR 48,9 million for the region of Eastern and Southern Africa and the Indian Ocean, EUR 31,9 million for the West African region, EUR 16,1 million for the Central African region and EUR 35,4 million for the Caribbean region, mobilised for contributions to internationally agreed debt relief initiatives and for humanitarian and emergency assistance in accordance with Articles 72 and 73 of the ACP-EC Partnership Agreement on the basis of regional solidarity; |
|
(c) |
an intra-ACP FLEX programme of EUR 50 million for 2006 (application year 2005) and an intra-ACP FLEX programme of EUR 50 million for 2007 (application year 2006) in order to ensure minimum support to countries subject to the adverse effects of instability in export earnings; |
|
(d) |
replenishment of the African Peace Facility with EUR 100 million for various peace support, training and capacity-building activities; |
|
(e) |
institutional support to the ACP Secretariat in order to bridge the period until the entry into force of the 10th EDF and to contribute to the running costs of the ACP Secretariat for 2008 (EUR 1 million); |
|
(f) |
addition of EUR 2,5 million to the intra-ACP technical cooperation facility; |
|
(g) |
EUR 4 million as an urgent carry-over of the rinderpest eradication programme in Africa (PACE); |
|
(h) |
additional contribution of EUR 5 million to the Caribbean Knowledge and Learning Network (CKLN); |
|
(i) |
cover of EUR 14,87 million for new and unexpected needs that cannot be financed from the B envelopes (amount used for an additional contribution of EUR 3 million for the CTA and the financing of specific projects (African Outlook — EUR 1,3 million; Microfinances — EUR 2,8 million, Pesticides Programme — EUR 5 million; Investment Observatory — EUR 2,8 million)); |
|
(j) |
additional support of EUR 38 million for the Global Fund against HIV/AIDS, Tuberculosis and Malaria (GFATM); |
|
(k) |
top-up of EUR 48,7 million for the EU-ACP Infrastructure Trust Fund as an advance on the allocations scheduled under the 10th EDF. |
The tables annexed, concerning the amounts decided, contracted and paid, show net figures. Only Table 2.7 shows separately the amounts committed and decommitted and the amounts paid and recovered.
2.1. ALLOCATIONS AT 31.12.2007
Table 1.1
7th EDF
Situation of appropriations: 31 December 2007
ANALYSIS OF FUND BY INSTRUMENT
|
(EUR million) |
||||
|
Instrument |
Initial appropriation |
Accumulated increases or reductions in resources at 31 December 2006 |
Increases or reductions in resources during 2007 |
Current appropriation |
|
ACP |
||||
|
Lomé |
||||
|
Grants |
6 215,00 |
– 884,60 |
– 50,80 |
5 279,60 |
|
Interest-rate subsidies |
280,00 |
– 81,51 |
0,00 |
198,49 |
|
Emergency aid |
250,00 |
153,35 |
– 0,07 |
403,27 |
|
Refugee aid |
100,00 |
– 16,05 |
– 0,10 |
83,86 |
|
Risk capital |
825,00 |
– 8,49 |
– 3,13 |
813,38 |
|
Stabex |
1 500,00 |
196,69 |
0,00 |
1 696,69 |
|
Sysmin |
480,00 |
– 39,39 |
– 10,08 |
430,54 |
|
Transfer 5th EDF — 7th EDF |
0,00 |
312,85 |
– 3,85 |
309,00 |
|
Structural adjustment |
1 150,00 |
– 0,83 |
– 0,50 |
1 148,67 |
|
Heavily indebted poor countries |
0,00 |
40,00 |
0,00 |
40,00 |
|
Intra ACP Allocation |
0,00 |
50,00 |
0,00 |
50,00 |
|
TOTAL ACP |
10 800,00 |
– 277,96 |
– 68,54 |
10 453,51 |
|
OCT |
||||
|
Grants |
97,50 |
– 11,92 |
– 2,41 |
83,17 |
|
Interest-rate subsidies |
6,00 |
– 1,82 |
0,00 |
4,18 |
|
Emergency aid |
2,50 |
– 0,24 |
0,00 |
2,26 |
|
Refugee aid |
0,50 |
– 0,21 |
0,00 |
0,29 |
|
Risk capital |
25,00 |
– 2,51 |
0,00 |
22,49 |
|
Stabex |
6,00 |
0,00 |
0,00 |
6,00 |
|
Sysmin |
2,50 |
0,00 |
0,00 |
2,50 |
|
Transfer 5th EDF — 7th EDF |
0,00 |
9,58 |
– 0,97 |
8,61 |
|
TOTAL OCT |
140,00 |
– 7,12 |
– 3,38 |
129,50 |
|
TOTAL 7th EDF |
10 940,00 |
– 285,08 |
– 71,91 |
10 583,01 |
Table 1.2
7th EDF
Situation of appropriations: 31 December 2007
ANALYSIS OF MOVEMENTS DURING THE YEAR
|
(EUR million) |
||||||||||||
|
ACP |
Lomé |
Cotonou |
Total ACP |
|||||||||
|
Grants |
Interest-rate subsidies |
Emergency aid |
Refugee aid |
Risk capital |
Stabex |
Sysmin |
Transfer 5th EDF — 7th EDF |
Structural adjustment |
Heavily indebted poor countries |
Intra-ACP |
||
|
Situation 31.12.2006 |
5 330,40 |
198,49 |
403,35 |
83,95 |
816,51 |
1 696,69 |
440,61 |
312,85 |
1 149,17 |
40,00 |
50,00 |
10 522,04 |
|
Transfer to 9th EDF (1) |
– 50,80 |
0,00 |
– 0,07 |
– 0,10 |
– 3,13 |
0,00 |
– 10,08 |
– 3,85 |
– 0,50 |
0,00 |
0,00 |
– 68,54 |
|
Situation at 31.12.2007 |
5 279,60 |
198,49 |
403,27 |
83,86 |
813,38 |
1 696,69 |
430,54 |
309,00 |
1 148,67 |
40,00 |
50,00 |
10 453,51 |
|
OCT |
Grants |
Interest-rate subsidies |
Emergency aid |
Refugee aid |
Risk capital |
Stabex |
Sysmin |
Transfer 5th EDF — 7th EDF |
Total OCT |
|
Situation 31.12.2006 |
85,58 |
4,18 |
2,26 |
0,29 |
22,49 |
6,00 |
2,50 |
9,58 |
132,88 |
|
Transfer to 9th EDF (20) |
– 2,41 |
0,00 |
0,00 |
0,00 |
0,00 |
0,00 |
0,00 |
– 0,97 |
– 3,38 |
|
Situation at 31.12.2007 |
83,17 |
4,18 |
2,26 |
0,29 |
22,49 |
6,00 |
2,50 |
8,61 |
129,50 |
Table 1.3
8th EDF
Situation of appropriations: 31 December 2007
ANALYSIS OF FUND BY INSTRUMENT
|
(EUR million) |
||||
|
Instrument |
Initial appropriation |
Accumulated increases or reductions in resources at 31 december 2006 |
Increases or reductions in resources during 2007 |
Current appropriation |
|
ACP |
||||
|
Lomé |
||||
|
Grants |
7 562,00 |
– 2 170,39 |
– 134,77 |
5 256,84 |
|
Interest-rate subsidies |
370,00 |
– 275,44 |
– 0,85 |
93,70 |
|
Emergency aid |
140,00 |
– 3,48 |
– 0,14 |
136,38 |
|
Refugee aid |
120,00 |
– 3,40 |
– 5,36 |
111,24 |
|
Risk capital |
1 000,00 |
127,77 |
– 48,99 |
1 078,78 |
|
Stabex |
1 800,00 |
– 1 083,83 |
2,48 |
718,65 |
|
Sysmin |
575,00 |
– 463,26 |
– 0,02 |
111,71 |
|
Structural adjustment |
1 400,00 |
114,55 |
– 16,09 |
1 498,45 |
|
Heavily indebted poor countries |
0,00 |
1 060,00 |
0,00 |
1 060,00 |
|
Utilisation of interest income |
0,00 |
37,38 |
0,00 |
37,38 |
|
Cotonou |
||||
|
A envelope |
0,00 |
433,59 |
– 3,02 |
430,57 |
|
B envelope |
0,00 |
254,58 |
0,00 |
254,58 |
|
TOTAL ACP |
12 967,00 |
– 1 971,93 |
– 206,77 |
10 788,30 |
|
OCT |
||||
|
Grants |
115,00 |
– 71,09 |
– 4,26 |
39,65 |
|
Interest-rate subsidies |
8,50 |
– 7,36 |
0,00 |
1,14 |
|
Emergency aid |
3,00 |
– 3,00 |
0,00 |
0,00 |
|
Refugee aid |
0,50 |
– 0,50 |
0,00 |
0,00 |
|
Risk capital |
30,00 |
– 23,50 |
0,00 |
6,50 |
|
Stabex |
5,50 |
– 4,32 |
0,00 |
1,18 |
|
Sysmin |
2,50 |
– 0,01 |
0,00 |
2,49 |
|
TOTAL OCT |
165,00 |
– 109,78 |
– 4,26 |
50,96 |
|
TOTAL 8TH EDF |
13 132,00 |
– 2 081,71 |
– 211,03 |
10 839,26 |
Table 1.4
8th EDF
Situation of appropriations: 31 December 2007
ANALYSIS OF MOVEMENTS DURING THE YEAR
|
(EUR million) |
|||||||||||||
|
ACP |
Lomé |
Cotonou |
Total ACP |
||||||||||
|
Grants |
Interest-rate subsidies |
Emergency aid |
Refugee aid |
Risk capital |
Stabex |
Sysmin |
Structural adjustment |
Heavily indebted poor countries |
Utilisation of interest income |
A envelope |
B envelope |
||
|
Situation 31.12.2006 |
5 391,61 |
94,56 |
136,52 |
116,60 |
1 127,77 |
716,17 |
111,74 |
1 514,55 |
1 060,00 |
37,38 |
433,59 |
254,58 |
10 995,07 |
|
Transfer to 9th EDF (1) |
134,77 |
0,85 |
0,14 |
5,36 |
48,99 |
3,69 |
0,02 |
16,09 |
0,00 |
0,00 |
3,02 |
0,00 |
212,95 |
|
Stabex security interest |
|
|
|
|
|
6,18 |
|
|
|
|
|
|
6,18 |
|
Situation at 31.12.2007 |
5 256,84 |
93,70 |
136,38 |
111,24 |
1 078,78 |
718,65 |
111,71 |
1 498,45 |
1 060,00 |
37,38 |
430,57 |
254,58 |
10 788,30 |
|
OCT |
Grants |
Interest-rate subsidies |
Emergency aid |
Refugee aid |
Risk capital |
Stabex |
Sysmin |
Total OCT |
|
Situation 31.12.2006 |
43,91 |
1,14 |
0,00 |
0,00 |
6,50 |
1,18 |
2,49 |
55,22 |
|
Transfer to 9th EDF (21) |
– 4,26 |
0,00 |
0,00 |
0,00 |
0,00 |
0,00 |
0,00 |
– 4,26 |
|
Situation at 31.12.2007 |
39,65 |
1,14 |
0,00 |
0,00 |
6,50 |
1,18 |
2,49 |
50,96 |
Table 1.5
9th EDF
Situation of appropriations: 31 December 2007
ANALYSIS OF FUND BY INSTRUMENT
|
(EUR million) |
||||
|
Instrument |
Initial appropriation |
Accumulated increases or reductions in resources at 31 December 2006 |
Increases or reductions in resources during 2007 |
Current appropriation |
|
ACP |
||||
|
A envelope |
5 318,30 |
3 861,95 |
351,63 |
9 531,87 |
|
B envelope |
2 107,90 |
– 632,60 |
– 166,67 |
1 308,64 |
|
National allocation reserve |
1 224,10 |
– 1 095,30 |
– 128,80 |
0,00 |
|
CDE+CTA+Joint Assistance |
164,00 |
– 22,98 |
35,07 |
176,09 |
|
Long-term dev. reserve |
257,85 |
– 60,10 |
– 197,75 |
0,00 |
|
Regional allocations |
904,00 |
48,77 |
– 23,33 |
929,43 |
|
INTRA ACP |
300,00 |
2 541,52 |
422,37 |
3 263,89 |
|
Implementation costs |
125,00 |
0,00 |
0,00 |
125,00 |
|
Interest and other receipts |
0,00 |
76,47 |
12,36 |
88,83 |
|
Special Congo allocation |
0,00 |
108,47 |
0,14 |
108,61 |
|
Transfer 6th — 9th EDF |
0,00 |
36,14 |
– 10,03 |
26,11 |
|
Voluntary Peace Facility Contributions |
0,00 |
0,00 |
39,17 |
39,17 |
|
TOTAL ACP |
10 401,15 |
4 862,34 |
334,15 |
15 597,63 |
|
OCT |
||||
|
A envelope |
0,00 |
210,15 |
40,01 |
250,16 |
|
Use of C reserve |
0,00 |
3,70 |
3,30 |
7,00 |
|
Long-term dev. reserve |
144,00 |
– 86,96 |
– 57,04 |
0,00 |
|
Regional allocations |
8,00 |
19,51 |
22,14 |
49,65 |
|
Technical assistance envelope |
2,00 |
0,00 |
0,00 |
2,00 |
|
Transfer 6th — 9th EDF |
0,00 |
0,70 |
– 0,76 |
– 0,06 (22) |
|
TOTAL OCT |
154,00 |
147,11 |
7,64 |
308,75 |
|
TOTAL 9TH EDF |
10 555,15 |
5 009,45 |
341,78 |
15 906,38 |
Table 1.6
9th EDF
Situation of appropriations: 31 December 2007
ANALYSIS OF MOVEMENTS DURING THE YEAR
|
(EUR million) |
|||||||||||||
|
ACP |
A envelope |
B envelope |
National allocation reserve |
CDE+CTA+Joint Assembly |
Long-term dev. reserve |
Regional allocations |
INTRA ACP |
Implementation costs |
Interest and other receipts |
Special Congo allocation |
Transfer 6th — 9th EDF |
Voluntary Contribution to Peace Facility |
TOTAL ACP |
|
Situation at 31.12.2006 |
9 180,25 |
1 475,30 |
128,80 |
141,02 |
197,75 |
952,77 |
2 841,52 |
125,00 |
76,47 |
108,47 |
36,14 |
0,00 |
15 263,49 |
|
Transfer to 9th EDF (1) |
154,64 |
|
|
0,07 |
90,60 |
24,03 |
12,14 |
|
|
|
|
|
281,48 |
|
Release of conditional billion |
|
|
|
|
0,00 |
|
1,00 |
|
|
|
|
|
1,00 |
|
Transfer from lg. trm dev. res. to intra acp res (2) |
36,14 |
|
|
35,00 |
– 431,52 |
|
360,38 |
|
|
|
|
|
0,00 |
|
2007 EFD interest + Special Congo allocation |
|
|
|
|
0,00 |
|
|
|
12,36 |
0,14 |
|
|
12,50 |
|
Transfer from A & B envelope to LTDR (ETR) |
85,72 |
– 216,37 |
|
|
130,64 |
– 36,69 |
36,69 |
|
|
|
|
|
– 0,00 |
|
Amendment of A & B envelopes (ETR) |
– 0,08 |
19,50 |
– 128,80 |
|
109,38 |
|
|
|
|
|
|
|
0,00 |
|
Mid term review Regional allocations Transfers |
|
|
|
|
|
– 10,68 |
10,68 |
|
|
|
|
|
0,00 |
|
Transfers — ad hoc review, 1 Dec. 2007 |
67,50 |
30,20 |
|
|
– 97,70 |
|
|
|
|
|
|
|
0,00 |
|
Transfer 6th — 9th EDF |
7,70 |
|
|
|
0,85 |
|
1,48 |
|
|
|
– 10,03 |
|
0,00 |
|
Voluntary Contribution to Peace Facility (3) |
|
|
|
|
|
|
|
|
|
|
|
39,17 |
39,17 |
|
Situation at 31.12.2007 |
9 531,87 |
1 308,64 |
0,00 |
176,09 |
0,00 |
929,43 |
3 263,89 |
125,00 |
88,83 |
108,61 |
26,11 |
39,17 |
15 597,63 |
|
OCT |
A envelope |
C envelope |
Long-term dev. reserve |
Regional allocations |
Technical assistance envelope |
Transfer 6th — 9th EDF |
TOTAL OCT |
|
Situation at 31.12.2006 |
210,15 |
3,70 |
57,04 |
27,51 |
2,00 |
0,70 |
301,11 |
|
Transfer to 9th EDF (23) |
7,05 |
|
|
0,59 |
|
0,00 |
7,64 |
|
Reserve allocation (24) |
32,27 |
3,30 |
-57,04 |
21,48 |
|
|
0,00 |
|
Transfer 6th — 9th EDF |
0,69 |
|
|
0,07 |
|
– 0,76 |
0,00 |
|
Situation at 31.12.2007 |
250,16 |
7,00 |
0,00 |
49,65 |
2,00 |
– 0,06 |
308,75 |
Table 1.7
7th-8th-9th EDF
INCREASES, REDUCTIONS AND TRANSFER OF RESOURCES DURING 2007
|
(EUR million) |
||||
|
ACP |
TOTAL 7th EDF |
TOTAL 8th EDF |
TOTAL 9th EDF |
Net variation |
|
SITUATION AT 31.12.2006 |
10 522,04 |
10 995,07 |
15 263,49 |
|
|
Transfer to 9th EDF (1) |
– 68,54 |
– 212,95 |
281,48 |
0,00 |
|
Interest earned on Stabex security accounts |
|
6,18 |
|
6,18 |
|
Release of conditional billion |
|
|
1,00 |
1,00 |
|
2007 interest on EDF funds and special Congo allocation |
|
|
12,50 |
12,50 |
|
Voluntary Peace Facility Contributions |
|
|
39,17 |
39,17 |
|
SITUATION AT 31.12.2007 |
10 453,51 |
10 788,30 |
15 597,63 |
58,84 |
|
OCT |
TOTAL 7th EDF |
TOTAL 8th EDF |
TOTAL 9th EDF |
Net variation |
|
SITUATION AT 31.12.2006 |
132,88 |
55,22 |
301,11 |
|
|
Transfer to 9th EDF (25) |
– 3,38 |
– 4,26 |
7,64 |
0,00 |
|
SITUATION AT 31.12.2006 |
129,50 |
50,96 |
308,75 |
0,00 |
|
TOTAL ACP + OCT |
10 583,01 |
10 839,26 |
15 906,38 |
58,84 |
|
TOTAL TRANSFER TO 9th EDF |
– 71,91 |
– 217,21 |
289,12 |
0,00 |

2.2. AGGREGATED ACCOUNTS
Table 2.1
EDF aggregated accounts at 31.12.2007
PROGRESS REPORT
|
(EUR million) |
|||||
|
|
Appropriations |
7th EDF |
8th EDF |
9th EDF |
7th, 8th and 9th |
|
Lomé |
Programmable aid |
5 362,77 |
5 296,49 |
|
10 659,25 |
|
Non-programmable aid |
4 852,63 |
4 820,24 |
|
9 672,87 |
|
|
Transfers to other Funds |
317,61 |
|
26,05 |
343,66 |
|
|
Sundry revenue |
|
37,38 |
|
37,38 |
|
|
Cotonou |
A envelope |
|
430,57 |
9 782,03 |
10 212,61 |
|
B envelope |
|
254,58 |
1 315,64 |
1 570,21 |
|
|
Regional Allocation |
|
|
979,08 |
979,08 |
|
|
Intra ACP allocation |
50,00 |
|
3 262,87 |
3 312,87 |
|
|
|
Intra ACP reserve |
|
|
1,02 |
1,02 |
|
|
CDE, CTA and Joint Assembly |
|
|
176,09 |
176,09 |
|
|
Special allocation Counc.dec.4/04 |
|
|
108,61 |
108,61 |
|
|
Voluntary contribution Peace facility |
|
|
39,17 |
39,17 |
|
|
Implementation costs and interest |
|
|
215,83 |
215,83 |
|
|
TOTAL |
10 583,01 |
10 839,26 |
15 906,38 |
37 328,65 |
|
(EUR million) |
||||||||||
|
|
EDF |
Aggregate total |
Annual figures |
|||||||
|
As at 31.12.2007 |
% of appropriation |
2003 |
2004 |
2005 |
2006 |
2007 |
||||
|
DECISIONS |
||||||||||
|
|
7 |
10 583,01 |
100 % |
– 2,60 |
– 58,42 |
– 86,09 |
– 126,67 |
– 71,91 |
||
|
|
8 |
10 839,26 |
100 % |
255,11 |
– 172,26 |
– 275,05 |
– 265,29 |
– 211,03 |
||
|
|
9 |
15 857,10 |
100 % |
3 156,44 |
2 638,08 |
3 420,76 |
3 186,70 |
3 455,11 |
||
|
TOTAL |
|
37 279,37 |
|
3 408,96 |
2 407,40 |
3 059,62 |
2 794,74 |
3 172,17 |
||
|
ASSIGNED FUNDS |
||||||||||
|
|
7 |
10 517,15 |
99 % |
311,69 |
121,42 |
110,52 |
– 6,34 |
– 5,51 |
||
|
|
8 |
10 484,62 |
97 % |
1 406,57 |
848,67 |
471,95 |
202,48 |
35,03 |
||
|
|
9 |
11 044,21 |
69 % |
993,70 |
1 747,48 |
2 070,90 |
2 914,80 |
3 317,33 |
||
|
TOTAL |
|
32 045,98 |
|
2 711,97 |
2 717,58 |
2 653,36 |
3 110,94 |
3 346,85 |
||
|
PAYMENTS |
||||||||||
|
|
7 |
10 340,78 |
98 % |
382,21 |
234,94 |
235,31 |
159,24 |
96,66 |
||
|
|
8 |
9 605,45 |
89 % |
1 472,56 |
985,34 |
858,47 |
736,81 |
483,42 |
||
|
|
9 |
6 753,74 |
42 % |
277,66 |
947,56 |
1 373,70 |
1 860,93 |
2 293,89 |
||
|
TOTAL |
|
26 699,96 |
|
2 132,43 |
2 167,84 |
2 467,48 |
2 756,98 |
2 873,97 |
||
|
||||||||||
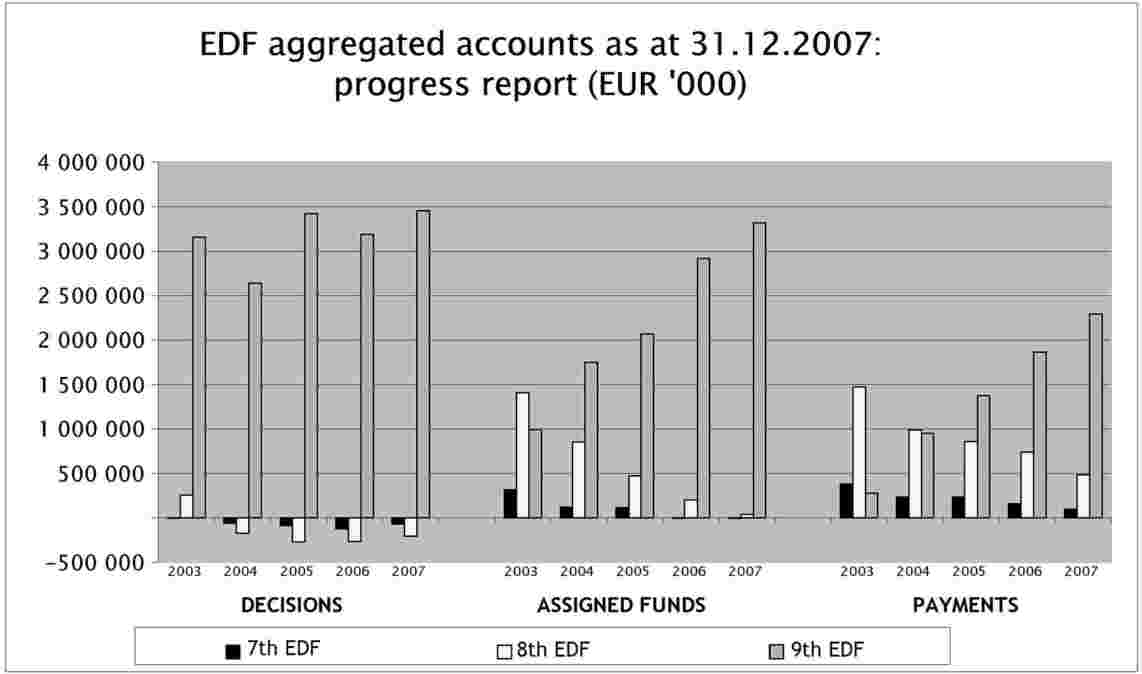
Table 2.2
EDF aggregated accounts at 31.12.2007
CLASS OF AID
|
(EUR million) |
|||||||||
|
|
|
7th EDF |
% |
8th EDF |
% |
9th EDF |
% |
TOTAL |
% |
|
Lomé |
PROGRAMMABLE AID (NIP) |
|
|
|
|
|
|
|
|
|
Appropriation |
5 362,77 |
|
5 296,49 |
|
|
|
10 659,25 |
|
|
|
Decisions |
5 362,77 |
100 % |
5 296,49 |
100 % |
|
|
10 659,25 |
100 % |
|
|
Assigned funds |
5 303,11 |
99 % |
5 062,12 |
96 % |
|
|
10 365,23 |
97 % |
|
|
Payments |
5 216,32 |
97 % |
4 531,90 |
86 % |
|
|
9 748,22 |
91 % |
|
|
NON-PROGRAMMABLE AID |
|
|
|
|
|
|
|
|
|
|
Appropriation |
4 852,63 |
|
4 820,24 |
|
|
|
9 672,87 |
|
|
|
Decisions |
4 852,63 |
100 % |
4 820,24 |
100 % |
|
|
9 672,87 |
100 % |
|
|
Assigned funds |
4 850,59 |
100 % |
4 787,55 |
99 % |
|
|
9 638,14 |
100 % |
|
|
Payments |
4 764,01 |
98 % |
4 544,05 |
94 % |
|
|
9 308,05 |
96 % |
|
|
TRANSFERS FROM OTHER FUNDS |
|
|
|
|
|
|
|
|
|
|
Appropriation |
317,61 |
|
|
|
26,05 |
|
343,66 |
|
|
|
Decisions |
317,61 |
100 % |
|
|
26,05 |
100 % |
343,66 |
100 % |
|
|
Assigned funds |
313,45 |
99 % |
|
|
21,06 |
81 % |
334,51 |
97 % |
|
|
Payments |
310,45 |
98 % |
|
|
10,06 |
39 % |
320,51 |
93 % |
|
|
SUNDRY REVENUE |
|
|
|
|
|
|
|
|
|
|
Appropriation |
|
|
37,38 |
|
|
|
37,38 |
|
|
|
Decisions |
|
|
37,38 |
100 % |
|
|
37,38 |
11 % |
|
|
Assigned funds |
|
|
35,54 |
95 % |
|
|
35,54 |
10 % |
|
|
Payments |
|
|
33,20 |
89 % |
|
|
33,20 |
10 % |
|
|
TOTAL |
|
|
|
|
|
|
|
|
|
|
Appropriation |
10 533,01 |
|
10 154,11 |
|
26,05 |
|
20 713,17 |
|
|
|
Decisions |
10 533,01 |
100 % |
10 154,11 |
100 % |
26,05 |
100 % |
20 713,17 |
100 % |
|
|
Assigned funds |
10 467,15 |
99 % |
9 885,21 |
97 % |
21,06 |
81 % |
20 373,42 |
98 % |
|
|
Payments |
10 290,78 |
98 % |
9 109,14 |
90 % |
10,06 |
39 % |
19 409,98 |
94 % |
|
|
Cotonou |
A Envelope |
|
|
|
|
|
|
|
|
|
Appropriation |
|
|
430,57 |
|
9 782,03 |
|
10 212,61 |
|
|
|
Decisions |
|
|
430,57 |
100 % |
9 764,04 |
100 % |
10 194,62 |
100 % |
|
|
Assigned funds |
|
|
418,60 |
97 % |
6 785,47 |
69 % |
7 204,07 |
71 % |
|
|
Payments |
|
|
392,61 |
91 % |
4 318,73 |
44 % |
4 711,34 |
46 % |
|
|
B Envelope |
|
|
|
|
|
|
|
|
|
|
Appropriation |
|
|
254,58 |
|
1 315,64 |
|
1 570,21 |
|
|
|
Decisions |
|
|
254,58 |
100 % |
1 315,64 |
100 % |
1 570,21 |
100 % |
|
|
Assigned funds |
|
|
180,81 |
71 % |
872,77 |
66 % |
1 053,58 |
67 % |
|
|
Payments |
|
|
103,70 |
41 % |
650,65 |
49 % |
754,34 |
48 % |
|
|
CDE, CTA and Joint Assembly |
|
|
|
|
|
|
|
|
|
|
Appropriation |
|
|
|
|
176,09 |
|
176,09 |
|
|
|
Decisions |
|
|
|
|
176,00 |
100 % |
176,00 |
100 % |
|
|
Assigned funds |
|
|
|
|
167,21 |
95 % |
167,21 |
95 % |
|
|
Payments |
|
|
|
|
134,24 |
76 % |
134,24 |
80 % |
|
|
Regional Allocation |
|
|
|
|
|
|
|
|
|
|
Appropriation |
|
|
|
|
979,08 |
|
979,08 |
|
|
|
Decisions |
|
|
|
|
978,91 |
100 % |
978,91 |
100 % |
|
|
Assigned funds |
|
|
|
|
606,96 |
62 % |
606,96 |
62 % |
|
|
Payments |
|
|
|
|
219,63 |
22 % |
219,63 |
22 % |
|
|
Intra ACP Allocation |
|
|
|
|
|
|
|
|
|
|
Appropriation |
50,00 |
|
|
|
3 262,87 |
|
3 312,87 |
|
|
|
Decisions |
50,00 |
100 % |
|
|
3 261,85 |
100 % |
3 311,85 |
100 % |
|
|
Assigned funds |
50,00 |
100 % |
|
|
2 276,62 |
70 % |
2 326,62 |
70 % |
|
|
Payments |
50,00 |
100 % |
|
|
1 132,75 |
35 % |
1 182,75 |
36 % |
|
|
Voluntary contribution Peace Facility |
|
|
|
|
|
|
|
|
|
|
Appropriation |
|
|
|
|
39,17 |
|
39,17 |
|
|
|
Decisions |
|
|
|
|
39,17 |
1 % |
39,17 |
1 % |
|
|
Assigned funds |
|
|
|
|
37,01 |
1 % |
37,01 |
1 % |
|
|
Payments |
|
|
|
|
29,22 |
1 % |
29,22 |
1 % |
|
|
Spec. Alloc Counc.dec.4/04 |
|
|
|
|
|
|
|
|
|
|
Appropriation |
|
|
|
|
108,61 |
|
108,61 |
|
|
|
Decisions |
|
|
|
|
108,47 |
3 % |
108,47 |
3 % |
|
|
Assigned funds |
|
|
|
|
108,19 |
3 % |
108,19 |
3 % |
|
|
Payments |
|
|
|
|
105,24 |
3 % |
105,24 |
3 % |
|
|
Implementation costs and interest |
|
|
|
|
|
|
|
|
|
|
Appropriation |
|
|
|
|
215,83 |
|
215,83 |
|
|
|
Decisions |
|
|
|
|
186,97 |
87 % |
186,97 |
87 % |
|
|
Assigned funds |
|
|
|
|
168,92 |
78 % |
168,92 |
78 % |
|
|
Payments |
|
|
|
|
153,23 |
71 % |
153,23 |
71 % |
|
|
TOTAL |
|
|
|
|
|
|
|
|
|
|
Appropriation |
50,00 |
|
685,15 |
|
15 879,31 |
|
16 614,46 |
|
|
|
Decisions |
50,00 |
100 % |
685,15 |
100 % |
15 831,05 |
100 % |
16 566,20 |
100 % |
|
|
Assigned funds |
50,00 |
100 % |
599,41 |
87 % |
11 023,16 |
69 % |
11 672,57 |
70 % |
|
|
Payments |
50,00 |
100 % |
496,30 |
72 % |
6 743,68 |
42 % |
7 289,98 |
44 % |
|
|
|
INTRA ACP RESERVE |
|
|
|
|
1,02 |
|
1,02 |
|
|
|
TOTAL |
|
|
|
|
|
|
|
|
|
|
Appropriation |
10 583,01 |
|
10 839,26 |
|
15 906,38 |
|
37 328,65 |
|
|
|
Decisions |
10 583,01 |
100 % |
10 839,26 |
100 % |
15 857,10 |
100 % |
37 279,37 |
100 % |
|
|
Assigned funds |
10 517,15 |
99 % |
10 484,62 |
97 % |
11 044,21 |
69 % |
32 045,98 |
86 % |
|
|
Payments |
10 340,78 |
98 % |
9 605,45 |
89 % |
6 753,74 |
42 % |
26 699,96 |
72 % |
Table 2.3
EDF aggregated accounts at 31.12.2007:
ANALYSIS BY AID INSTRUMENT
ACP + OCT — 7th EDF
|
(EUR million) |
||||||||||
|
|
Appropriations |
Decisions |
Assigned funds |
Payments |
||||||
|
Agg. total |
Annual |
% |
Agg. total |
Annual |
% |
Agg. total |
Annual |
% |
||
|
(1) |
(2) |
|
(2) : (1) |
(3) |
|
(3) : (2) |
(4) |
|
(4) : (3) |
|
|
ACP |
||||||||||
|
LOME |
||||||||||
|
Total indicative programmes |
5 279,60 |
5 279,60 |
– 50,80 |
100 % |
5 220,07 |
4,36 |
99 % |
5 133,82 |
62,80 |
98 % |
|
Total non-programmable aid |
4 814,91 |
4 814,91 |
– 13,88 |
100 % |
4 813,07 |
– 3,78 |
100 % |
4 726,73 |
32,47 |
98 % |
|
Interest-rate subsidies |
198,49 |
198,49 |
|
100 % |
198,00 |
– 0,49 |
100 % |
198,00 |
– 0,49 |
100 % |
|
Emergency aid |
403,27 |
403,27 |
– 0,07 |
100 % |
403,27 |
– 0,00 |
100 % |
403,13 |
– 0,00 |
100 % |
|
Aid for refugees |
83,86 |
83,86 |
– 0,10 |
100 % |
83,67 |
– 0,18 |
100 % |
83,57 |
|
100 % |
|
Risk capital |
813,38 |
813,38 |
– 3,13 |
100 % |
813,38 |
– 3,13 |
100 % |
775,11 |
5,28 |
95 % |
|
Stabex |
1 696,69 |
1 696,69 |
|
100 % |
1 696,69 |
|
100 % |
1 694,18 |
8,23 |
100 % |
|
Sysmin |
430,54 |
430,54 |
– 10,08 |
100 % |
429,37 |
0,11 |
100 % |
384,13 |
19,45 |
89 % |
|
Structural adjustment |
1 148,67 |
1 148,67 |
– 0,50 |
100 % |
1 148,67 |
– 0,08 |
100 % |
1 148,61 |
|
100 % |
|
Heavily indebted poor countries |
40,00 |
40,00 |
|
100 % |
40,00 |
|
100 % |
40,00 |
|
100 % |
|
Transfer 5th EDF — 7th EDF |
309,00 |
309,00 |
– 3,85 |
100 % |
304,88 |
– 4,86 |
99 % |
301,88 |
0,39 |
99 % |
|
Sundry Revenue |
|
|
|
|
|
|
|
|
|
|
|
COTONOU |
||||||||||
|
Intra ACP Allocation |
50,00 |
50,00 |
|
100 % |
50,00 |
|
100 % |
50,00 |
|
100 % |
|
General Reserve |
|
|
|
|
|
|
|
|
|
|
|
TOTAL ACP (a) |
10 453,51 |
10 453,51 |
– 68,54 |
100 % |
10 388,02 |
– 4,28 |
99 % |
10 212,43 |
95,66 |
98 % |
|
OCT |
||||||||||
|
Total indicative programmes |
83,17 |
83,17 |
– 2,41 |
100 % |
83,04 |
– 0,97 |
100 % |
82,50 |
0,24 |
99 % |
|
Total non-programmable aid |
37,73 |
37,73 |
0,00 |
100 % |
37,52 |
0,01 |
99 % |
37,27 |
0,76 |
99 % |
|
Interest-rate subsidies |
4,18 |
4,18 |
|
100 % |
4,18 |
|
100 % |
4,18 |
|
100 % |
|
Emergency aid |
2,26 |
2,26 |
|
100 % |
2,26 |
|
100 % |
2,26 |
|
100 % |
|
Aid for refugees |
0,29 |
0,29 |
|
100 % |
0,29 |
|
100 % |
0,29 |
|
100 % |
|
Risk capital |
22,49 |
22,49 |
|
100 % |
22,49 |
|
100 % |
22,49 |
|
100 % |
|
Stabex |
6,00 |
6,00 |
|
100 % |
6,00 |
|
100 % |
6,00 |
|
100 % |
|
Sysmin |
2,50 |
2,50 |
|
100 % |
2,29 |
0,01 |
92 % |
2,05 |
0,76 |
89 % |
|
Transfer 5th EDF — 7th EDF |
8,61 |
8,61 |
– 0,97 |
100 % |
8,57 |
– 0,27 |
100 % |
8,57 |
|
100 % |
|
TOTAL OCT (b) |
129,50 |
129,50 |
– 3,38 |
100 % |
129,13 |
– 1,23 |
100 % |
128,34 |
1,00 |
99 % |
|
TOTAL (a) + (b) |
10 583,01 |
10 583,01 |
– 71,91 |
100 % |
10 517,15 |
– 5,51 |
99 % |
10 340,78 |
96,66 |
98 % |
Table 2.4
EDF aggregated accounts at 31.12.2007
ANALYSIS BY AID INSTRUMENT
ACP + OCT — 8th EDF
|
(EUR million) |
||||||||||
|
|
Appropriations |
Decisions |
Assigned funds |
Payments |
||||||
|
Agg. total |
Annual |
% |
Agg. total |
Annual |
% |
Agg. total |
Annual |
% |
||
|
(1) |
(2) |
|
(2): (1) |
(3) |
|
(3): (2) |
(4) |
|
(4): (3) |
|
|
ACP |
||||||||||
|
LOME |
||||||||||
|
Total indicative programmes |
5 256,84 |
5 256,84 |
– 134,77 |
100 % |
5 025,52 |
59,32 |
96 % |
4 498,08 |
296,73 |
90 % |
|
Total non-programmable aid |
4 846,31 |
4 846,31 |
– 68,99 |
100 % |
4 811,84 |
– 52,51 |
99 % |
4 567,01 |
134,53 |
95 % |
|
Interest-rate subsidies |
93,70 |
93,70 |
– 0,85 |
100 % |
93,70 |
– 0,85 |
100 % |
66,64 |
1,45 |
71 % |
|
Emergency aid |
136,38 |
136,38 |
– 0,14 |
100 % |
136,37 |
– 0,15 |
100 % |
136,37 |
– 0,15 |
100 % |
|
Aid for refugees |
111,24 |
111,24 |
– 5,36 |
100 % |
109,16 |
– 2,88 |
98 % |
100,54 |
1,31 |
92 % |
|
Risk capital |
1 078,78 |
1 078,78 |
– 48,99 |
100 % |
1 078,78 |
– 48,99 |
100 % |
974,50 |
52,52 |
90 % |
|
Stabex |
718,65 |
718,65 |
2,48 |
100 % |
692,93 |
5,63 |
96 % |
612,67 |
90,14 |
88 % |
|
Sysmin |
111,71 |
111,71 |
– 0,02 |
100 % |
108,41 |
1,99 |
97 % |
100,74 |
2,72 |
93 % |
|
Structural adjustment |
1 498,45 |
1 498,45 |
– 16,09 |
100 % |
1 496,94 |
– 7,76 |
100 % |
1 496,58 |
0,02 |
100 % |
|
Heavily indebted poor countries |
1 060,00 |
1 060,00 |
0,00 |
100 % |
1 060,00 |
0,00 |
100 % |
1 045,78 |
– 14,22 |
99 % |
|
Utilisation of interest income |
37,38 |
37,38 |
|
100 % |
35,54 |
0,51 |
95 % |
33,20 |
0,75 |
93 % |
|
TOTAL |
10 103,15 |
10 103,15 |
– 203,75 |
100 % |
9 837,36 |
6,81 |
97 % |
9 065,09 |
431,25 |
92 % |
|
COTONOU |
||||||||||
|
A Envelope |
430,57 |
430,57 |
– 3,02 |
100 % |
418,60 |
6,42 |
97 % |
392,61 |
20,55 |
94 % |
|
B Envelope |
254,58 |
254,58 |
|
100 % |
180,81 |
21,40 |
71 % |
103,70 |
29,51 |
57 % |
|
Regional allocation |
|
|
|
|
|
|
|
|
|
|
|
TOTAL |
685,15 |
685,15 |
– 3,02 |
100 % |
599,41 |
27,82 |
87 % |
496,30 |
50,07 |
83 % |
|
TOTAL ACP (a) |
10 788,30 |
10 788,30 |
– 206,77 |
100 % |
10 436,77 |
34,62 |
97 % |
9 561,39 |
481,32 |
92 % |
|
OCT |
||||||||||
|
Total indicative programmes |
39,65 |
39,65 |
– 4,26 |
100 % |
36,60 |
0,10 |
92 % |
33,82 |
1,66 |
92 % |
|
Total non-programmable aid |
11,31 |
11,31 |
0,00 |
100 % |
11,25 |
0,30 |
99 % |
10,23 |
0,43 |
91 % |
|
Interest-rate subsidies |
1,14 |
1,14 |
|
100 % |
1,14 |
|
100 % |
1,14 |
|
100 % |
|
Emergency aid |
|
|
|
|
|
|
|
|
|
|
|
Aid for refugees |
|
|
|
|
|
|
|
|
|
|
|
Risk capital |
6,50 |
6,50 |
|
100 % |
6,50 |
|
100 % |
6,00 |
|
92 % |
|
Stabex |
1,18 |
1,18 |
|
100 % |
1,18 |
|
100 % |
1,18 |
|
100 % |
|
Sysmin |
2,49 |
2,49 |
|
100 % |
2,43 |
0,30 |
|
1,91 |
0,43 |
|
|
TOTAL OCT (b) |
50,96 |
50,96 |
– 4,26 |
200 % |
47,85 |
0,40 |
94 % |
44,05 |
2,09 |
92 % |
|
TOTAL (a) + (b) |
10 839,26 |
10 839,26 |
– 211,03 |
100 % |
10 484,62 |
35,03 |
97 % |
9 605,45 |
483,42 |
92 % |
Table 2.5
EDF aggregated accounts at 31.12.2007:
ANALYSIS BY AID INSTRUMENT
ACP + OCT — 9th EDF
|
(EUR million) |
||||||||||
|
|
Appropriations |
Decisions |
Assigned funds |
Payments |
||||||
|
Agg. total |
Annual |
% |
Agg. total |
Annual |
% |
Agg. total |
Annual |
% |
||
|
(1) |
(2) |
|
(2): (1) |
(3) |
|
(3): (2) |
(4) |
|
(4): (3) |
|
|
ACP |
||||||||||
|
A Envelope |
9 531,87 |
9 531,75 |
1 787,75 |
100 % |
6 666,60 |
1 908,48 |
70 % |
4 242,35 |
1 581,62 |
64 % |
|
Macroeconomic support |
|
2 278,21 |
314,29 |
|
1 999,78 |
356,36 |
|
1 597,30 |
411,12 |
|
|
Sectoral Policies |
|
7 253,54 |
1 473,47 |
|
4 666,82 |
1 552,12 |
|
2 645,05 |
1 170,50 |
|
|
B Envelope |
1 308,64 |
1 308,64 |
252,87 |
100 % |
869,32 |
222,91 |
66 % |
650,65 |
182,87 |
75 % |
|
Compensation export earnings |
|
170,17 |
50,53 |
|
116,70 |
25,84 |
|
90,27 |
28,12 |
|
|
Emergency aid |
|
1 127,27 |
200,74 |
|
741,42 |
195,47 |
|
549,18 |
153,16 |
|
|
Heavily indebted poor countries |
|
11,20 |
1,60 |
|
11,20 |
1,60 |
|
11,20 |
1,60 |
|
|
Regional Allocation |
929,43 |
929,33 |
202,47 |
100 % |
600,33 |
307,27 |
65 % |
215,54 |
132,61 |
36 % |
|
Intra ACP Allocation |
3 262,87 |
3 261,85 |
931,57 |
100 % |
2 276,62 |
725,47 |
70 % |
1 132,75 |
248,74 |
50 % |
|
Other |
176,09 |
176,00 |
67,00 |
100 % |
167,21 |
60,26 |
95 % |
134,24 |
42,40 |
80 % |
|
Implementation costs |
125,00 |
125,00 |
7,63 |
100 % |
120,45 |
7,74 |
96 % |
120,19 |
9,37 |
100 % |
|
Interest and other receipts |
88,83 |
59,97 |
31,62 |
68 % |
47,76 |
36,00 |
80 % |
32,58 |
28,50 |
68 % |
|
Special allocation Congo |
108,61 |
108,47 |
0,32 |
100 % |
108,19 |
0,42 |
100 % |
105,24 |
0,19 |
97 % |
|
Voluntary contribution Peace facility |
39,17 |
39,17 |
39,17 |
100 % |
37,01 |
37,01 |
94 % |
29,22 |
29,22 |
79 % |
|
Transfers from 6th EDF |
26,11 |
26,11 |
– 10,03 |
100 % |
21,12 |
– 3,40 |
81 % |
10,12 |
5,77 |
48 % |
|
TOTAL |
15 596,61 |
15 566,28 |
3 310,35 |
100 % |
10 914,60 |
3 302,15 |
70 % |
6 672,87 |
2 261,29 |
61 % |
|
RESERVE INTRA ACP |
1,02 |
|
|
|
|
|
|
|
|
|
|
TOTAL ACP (a) |
15 597,63 |
15 566,28 |
3 310,35 |
100 % |
10 914,60 |
3 302,15 |
70 % |
6 672,87 |
2 261,29 |
61 % |
|
OCT |
||||||||||
|
A Envelope |
250,16 |
232,30 |
106,27 |
93 % |
118,87 |
10,92 |
51 % |
76,38 |
30,88 |
64 % |
|
Macroeconomic support |
|
14,64 |
4,00 |
|
10,52 |
|
|
8,52 |
8,52 |
|
|
Sectoral Policies |
|
217,66 |
102,27 |
|
108,36 |
10,92 |
|
67,86 |
22,37 |
|
|
B Envelope |
7,00 |
7,00 |
3,30 |
|
3,46 |
3,46 |
|
|
|
|
|
Regional Allocation |
49,65 |
49,58 |
35,26 |
100 % |
6,63 |
0,46 |
13 % |
4,09 |
1,53 |
62 % |
|
Support expenditure |
2,00 |
2,00 |
|
100 % |
0,71 |
0,41 |
36 % |
0,46 |
0,16 |
65 % |
|
Transfers from 6th EDF |
– 0,06 |
– 0,06 |
– 0,07 |
100 % |
– 0,06 |
– 0,07 |
101 % |
– 0,06 |
0,02 |
100 % |
|
TOTAL OCT (b) |
308,75 |
290,82 |
144,76 |
94 % |
129,61 |
15,18 |
45 % |
80,87 |
32,60 |
62 % |
|
TOTAL (a) + (b) |
15 906,38 |
15 857,10 |
3 455,11 |
100 % |
11 044,21 |
3 317,33 |
70 % |
6 753,74 |
2 293,89 |
61 % |
Table 2.6
ANNUAL 2007 GROSS FIGURES BY INSTRUMENT FOR DECISIONS AND PAYMENTS
Annual Decision 2007
|
(EUR million) |
||||
|
|
Commitments |
Decommitments |
Net |
|
|
Lomé |
Grants |
0,00 |
(192,24) |
(192,24) |
|
Total indicative programme |
0,00 |
(192,24) |
(192,24) |
|
|
Interest-rate subsidies |
0,00 |
(0,85) |
(0,85) |
|
|
Emergency aid |
0,00 |
(0,22) |
(0,22) |
|
|
Aid for refugees |
0,00 |
(5,46) |
(5,46) |
|
|
Risk capital |
0,00 |
(52,12) |
(52,12) |
|
|
Stabex (interets) |
6,18 |
(3,69) |
2,48 |
|
|
Sysmin |
0,00 |
(10,10) |
(10,10) |
|
|
Transfer from other funds |
0,00 |
(4,82) |
(4,82) |
|
|
Structural adjustment |
0,00 |
(16,60) |
(16,60) |
|
|
Total non programmable aid |
6,18 |
(93,86) |
(87,69) |
|
|
Transfer from 6th EDF |
0,00 |
(10,10) |
(10,10) |
|
|
Total |
6,18 |
– 296,21 |
– 290,03 |
|
|
Cotonou |
A envelope |
1 981,08 |
(90,07) |
1 891,00 |
|
B envelope |
295,63 |
(39,46) |
256,17 |
|
|
CDE + CTA + joint assembly |
67,00 |
0,00 |
67,00 |
|
|
Regional allocation |
251,92 |
(14,19) |
237,73 |
|
|
Intra acp allocation |
946,45 |
(14,88) |
931,57 |
|
|
Voluntary contributions peace facility |
39,17 |
0,00 |
39,17 |
|
|
Special congo allocation |
0,32 |
0,00 |
0,32 |
|
|
Use of interest/implem.costs |
48,59 |
(9,35) |
39,24 |
|
|
Total |
3 630,15 |
– 167,95 |
3 462,20 |
|
|
Total |
3 636,33 |
– 464,16 |
3 172,17 |
|
Annual Payments 2007
|
(EUR million) |
||||
|
|
Paid |
Recovered (27) |
Net |
|
|
Lomé |
Grants |
388,34 |
(26,91) |
361,43 |
|
Total indicative programme |
388,34 |
(26,91) |
361,43 |
|
|
Interest-rate subsidies |
1,47 |
(0,52) |
0,95 |
|
|
Emergency aid |
0,00 |
(0,15) |
(0,15) |
|
|
Aid for refugees |
1,78 |
(0,47) |
1,31 |
|
|
Risk capital |
57,81 |
0,00 |
57,81 |
|
|
Stabex |
98,37 |
0,00 |
98,37 |
|
|
Sysmin |
23,39 |
(0,03) |
23,36 |
|
|
Transfer from other funds |
0,41 |
(0,02) |
0,39 |
|
|
Structural adjustment |
0,06 |
(0,04) |
0,02 |
|
|
Total non programmable aid |
183,28 |
(1,22) |
182,05 |
|
|
Use of interest |
0,75 |
0,00 |
0,75 |
|
|
Transfer from 6th EDF |
6,66 |
(0,87) |
5,79 |
|
|
Total |
579,02 |
(29,00) |
550,02 |
|
|
Cotonou |
A envelope |
1 641,69 |
(8,63) |
1 633,06 |
|
B envelope |
217,15 |
(4,77) |
212,39 |
|
|
CDE + CTA + joint assembly |
43,43 |
(1,03) |
42,40 |
|
|
Regional allocation |
135,77 |
(1,63) |
134,14 |
|
|
Intra acp allocation |
234,83 |
(0,30) |
234,52 |
|
|
Technical assistance — OCTS |
0,16 |
0,00 |
0,16 |
|
|
Voluntary contributions peace facility |
29,22 |
0,00 |
29,22 |
|
|
Special congo allocation |
0,19 |
0,00 |
0,19 |
|
|
Use of interest/implem.costs |
38,04 |
(0,17) |
37,87 |
|
|
Total |
2 340,49 |
(16,54) |
2 323,95 |
|
|
Total |
2 919,51 |
(45,54) |
2 873,97 |
|
2.3. SITUATION BY COUNTRY AND BY INSTRUMENT
The tables are in Annex 2.
Notes to the management accounts:
|
— |
In the tables, the figure ‘0,00’ indicates that the corresponding amount is between EUR –4 999 and EUR 4 999. |
Where no figure is given, the amount is zero.
Countries with a nil balance in all columns are not listed in the tables.
|
— |
The heading ‘All countries’ refers to projects which cover a number of countries but are not financed by regional cooperation. |
|
— |
The heading ‘Financial and administrative expenses’ represents projects financed by EDF interest which have been transferred to a financial instrument (grants, Structural Adjustment Facility). |
2.3.1. 7th EDF
In the first column of tables 3.2.1 and 3.2.2, the allocation for ‘Regional cooperation’ (EUR 1 081,31 million) comprises the following:
|
Commission's regional cooperation target (ACP states only) |
1 125,00 |
|
Target overrun |
(5,92) |
|
Transfers from unallocated resources in order to finance the programme of assistance to ACP countries for integration within the WTO |
67,90 |
|
Amount transferred to the general reserve during 2000 in accordance with the transitional measures |
10,00 |
|
Amount transferred to the general reserve during 2001 in accordance with the transitional measures |
(8,50) |
|
Amount transferred to the general reserve during 2002 in accordance with the transitional measures |
(2,20) |
|
Amount transferred to the 9th EDF during 2003 following the entry into force of Cotonou |
(0,70) |
|
Amount transferred to the 9th EDF during 2004 following the entry into force of Cotonou |
(49,10) |
|
Amount transferred to the 9th EDF during 2005 following the entry into force of Cotonou |
(8,26) |
|
Amount transferred to the 9th EDF during 2006 following the entry into force of Cotonou |
(34,41) |
|
Amount transferred to the 9th EDF during 2007 following the entry into force of Cotonou |
(12,44) |
|
Total at 31.12.2007 |
1081,31 |
All the amounts of allocations correspond to the decisions, as the amounts not committed were transferred to the 9th EDF following the entry into force of Cotonou (Commission decision of 16 April 2003).
2.3.2. 8th EDF
In the second column of tables 1 and 2, the allocation for ‘Regional cooperation’ (EUR 1 374,31 million) comprises the following:
|
Commission's regional cooperation target (ACP states only) |
1 300,00 |
|
Council Decision 3/2000 in order to ensure the continuity of several activities pending the entry into force of the 9th EDF |
306,00 |
|
Council Decision 10/2001 of 20.12.2001 on the use of unallocated resources from the 8th EDF |
180,70 |
|
In accordance with the transitional measures |
(68,00) |
|
Council Decision 3/2002 of 23.12.2002 on the use of unallocated resources from the 8th EDF |
54,20 |
|
Amount transferred to the 9th EDF during 2003 following the entry into force of Cotonou |
(317,33) |
|
Amount transferred to the 9th EDF during 2004 following the entry into force of Cotonou |
(5,01) |
|
Amount transferred to the 9th EDF during 2005 following the entry into force of Cotonou |
(31,62) |
|
Amount transferred to the 9th EDF during 2006 following the entry into force of Cotonou |
(20,83) |
|
Amount transferred to the 9th EDF during 2007 following the entry into force of Cotonou |
(23,81) |
|
Total at 31.12.2007 |
1 374.31 |
All the amounts of allocations correspond to the decisions, as the amounts not committed were transferred to the 9th EDF following the entry into force of Cotonou (Commission decision of 16 April 2003).
2.3.3. 9th EDF
In all tables the presentation takes into account the financial resources (envelope A, envelope B and implementation costs) used and the nature of the project (macroeconomic support, sectoral policies, emergency assistance, etc.).
2.4. OTHER MANAGEMENT INFORMATION
Table 4.1.1
SITUATION CONCERNING ‘DORMANT’ COMMITMENTS
The tables below show, for each of the allocations of the seventh, eighth and ninth EDFs, the commitments for which implementation is slow. A commitment is considered ‘dormant’ or ‘slow’ if, in the course of the 24 months preceding the end of the financial year 2007:
|
— |
no new contract has been concluded |
|
— |
no existing contract has been revised |
|
— |
no payment or advance has been made. |
Pre-2002 dormant projects (old RAL) are not included in the table.
Slow commitments are in three categories:
Projects which must remain open, projects to be closed, projects whose staus is not known.
The book values shown are the sum of the amounts committed but not paid, commonly known as the ‘RAL’.
For projects with a book value of over €1 million which must remain open even though apparently inactive or for which no evidence of their status has been obtained, certain comments appear in the notes below
|
Appropriations |
7 |
8 |
9 |
Total |
|||||||||||
|
Amount not paid against commitment |
Balance to be left open |
Balance to be closed |
Amount not paid against commitment |
Balance to be left open |
Balance to be closed |
Status unknown |
Amount not paid against commitment |
Balance to be left open |
Balance to be closed |
Status unknown |
Amount not paid against commitment |
Balance to be left open |
Balance to be closed |
Status unknown |
|
|
Programmable aid |
0,10 |
0,07 |
0,03 |
0,45 |
0,00 |
0,11 |
0,34 |
39,46 |
37,39 |
1,31 |
0,77 |
40,02 |
37,46 |
1,45 |
1,11 |
|
Saf |
|
|
|
0,00 |
|
0,00 |
|
|
|
|
|
0,00 |
|
0,00 |
|
|
Aid for refugees |
|
|
|
1,80 |
1,21 |
0,59 |
|
|
|
|
|
1,80 |
1,21 |
0,59 |
|
|
Interest subsidies |
|
|
|
19,67 |
16,24 |
|
3,43 |
|
|
|
|
19,67 |
16,24 |
|
3,43 |
|
Risk capital |
0,20 |
0,20 |
|
37,98 |
37,98 |
|
|
|
|
|
|
38,18 |
38,18 |
|
|
|
Previous edfs |
|
|
|
|
|
|
|
0,01 |
|
0,01 |
|
0,01 |
|
0,01 |
|
|
Grand total |
0,30 |
0,27 |
0,03 |
59,91 |
55,43 |
0,70 |
3,77 |
39,47 |
37,39 |
1,31 |
0,77 |
99,67 |
93,09 |
2,04 |
4,54 |
Table 4.1.2
CLASSIFICATION OF ‘TO REMAIN OPEN’ DORMANT PROJECTS
1. Commission projects
|
(EUR million) |
|||
|
EDF |
Country |
Project |
RAL |
|
7 |
Angola |
Support for production of film ‘Comboio da Canhoca’ |
0,07 |
|
Sao Tome |
Programme Of support for cultural initiatives |
0,00 |
|
|
8 |
Eritrea |
Inf. programme to support refugees and internally displaced |
0,73 |
|
Eritrea |
Inf. support for voluntary repatriation and reintegration |
0,47 |
|
|
Burkina Faso |
Support for decentralised cultural initiatives — Phase 2 |
0,00 |
|
|
9 |
Benin |
Rehabilitation of flood-prone districts of west cotonou |
20,00 |
|
Burkina Faso |
Capacity-building civil society organisations (PROS) |
15,00 |
|
|
Togo |
4th general census of population and housing |
1,98 |
|
|
Centrafrica |
Support for democratic transition |
0,30 |
|
|
Bahamas |
Technical Cooperation Facility (TCF) |
0,07 |
|
|
Malawi |
Increase in ceiling 8 acp may 14, note 28571 of 24.12.2003 |
0,04 |
|
|
Total |
38,67 |
||
2. EIB projects
|
(EUR million) |
|||
|
EDF |
Country |
Project |
RAL |
|
7 |
ACP TV |
DBT II global loan (8 TV 3) (22440, 22441) |
0,20 |
|
8 |
ACP MAS |
Plaines wilhems sewerage project (21396) |
7,46 |
|
ACP SW |
Seb iii maguga (22105) |
7,00 |
|
|
ACP DO |
Financial sector gl ii a (21889) |
4,51 |
|
|
ACP DO |
Financial sector gl ii b (21993) |
3,44 |
|
|
ACP SLU |
Bank of st. lucia gl (21432) |
3,00 |
|
|
ACP SW |
Motraco ii |
1,75 |
|
|
ACP SLU |
Bank of st. lucia gl (21435) |
0,84 |
|
|
ACP MOZ |
Motraco II |
0,58 |
|
|
ACP CD |
Global loan financial sector (22120) |
0,50 |
|
|
ACP ET |
Development of Bank of Ethiopia (DBE) GL II (22424) |
25,00 |
|
|
ACP TV |
DBT II Global loan |
0,15 |
|
|
Total |
54,43 |
||
Table 4.2.1
UNFINALISED PAYING AGENTS' CASHFLOWS
Revenue and expenditure on paying agents' accounts still to be entered in the authorising officer's accounts at the end of 2007 (shown by beneficiary country).
|
(amounts in EUR '000) |
|
|
Country |
Total |
|
Total ACP states |
1 216,92 |
|
BARBADOS |
32,14 |
|
CHAD |
5,23 |
|
CAMEROON |
75,78 |
|
CONGO BRAZZAVILLE |
39,76 |
|
DOMINICA |
0,52 |
|
ETHIOPIA |
0,74 |
|
GAMBIA |
29,17 |
|
GUINEA BISSAU |
119,62 |
|
GUINEA |
21,81 |
|
MADAGASCAR |
405,94 |
|
MALAWI |
174,02 |
|
MAURITANIA |
121,67 |
|
NAMIBIA |
210,50 |
|
SAO TOME PRINCIPE |
63,20 |
|
TANZANIA |
41,60 |
|
UGANDA |
7,93 |
|
Other ACP (regional, fed gpr.) |
21,47 |
|
OCT |
4,69 |
|
Total |
1 221,61 |
|
Situation at 31 December 2006: |
2 682,82 |
|
Annual change: |
(54,47 %) |
Table 4.2.2
ADVANCES FOR STUDY AWARDS AND TECHNICAL ASSISTANCE CONTRACTS AT 31.12.2007
Advances are paid to Commission delegations and agencies in Member States administering study awards and technical assistance contracts on behalf of the Commission. These advances are cleared regularly, when expense reports are received, and replenished based on the volume of study awards and technical assistance contracts handled.
The amount of outstanding advances at the end of 2006 and 2007 respectively is shown below.
|
(amounts in EUR '000) |
||
|
|
31.12.2006 |
31.12.2007 |
|
STUDY AWARDS |
1 145,4 |
940,8 |
|
Commission Delegations |
755,9 |
572,3 |
|
BURKINA FASO |
46,9 |
|
|
CAMEROUN |
30,7 |
0,1 |
|
IVORY COAST |
133,0 |
106,5 |
|
JAMAICA |
26,3 |
19,8 |
|
KENYA |
41,5 |
1,8 |
|
LIBERIA |
45,0 |
45,0 |
|
MAURITIUS |
23,5 |
|
|
RWANDA |
53,6 |
53,6 |
|
SENEGAL |
43,1 |
43,1 |
|
TANZANIA |
77,2 |
77,2 |
|
NIGERIA |
78,7 |
78,7 |
|
ZAMBIA |
28,4 |
28,4 |
|
OTHER COMMISSION DELEGATIONS |
198,6 |
118,1 |
|
Member State agencies |
389,5 |
368,5 |
|
FRANCE/CIES |
0,8 |
7,2 |
|
GERMANY/INWENT |
0,9 |
0,9 |
|
NETHERLANDS/NUFFIC |
13,0 |
|
|
PORTUGAL/INSTITUTO DA COOPERAÇAO PORTUGUESA |
50,3 |
50,3 |
|
UK/BRITISH COUNCIL |
324,5 |
324,5 |
|
TECHNICAL ASSISTANCE* |
437,2 |
436,2 |
|
AEC |
437,2 |
436,2 |
|
Total |
1 582,6 |
1 376,9 |
Table 4.2.3
ITALIAN CO-FINANCING
In 1985 the European Commission signed an agreement with the Italian Government providing for the co-financing of development projects managed by the Commission.
The agreement was regularly extended by means of exchanges of letters between the Italian Government and the Development Commissioner until 31 December 2004.
Then by written procedure E/1588/2004 the Commission took a decision on implementation of the co-financing framework agreement. The purpose of the decision was to lay down the budgetary and regulatory framework for commitments made under the agreement. The Commission decision accordingly provided that this co-financing should be implemented in accordance with the provisions of the EDF financial regulation. The decision empowered the EDF authorising officers by delegation or subdelegation to manage Italy's contribution to this co-financing. They were also empowered to determine the final date for its implementation in compliance with the relevant rules.
In accordance with Article 4, point 4 of the July 1985 agreement between the European Commission and the Italian Government, a provision confirmed in Article 3, point 3 of decision E/1588/2004, the Italian Government requested by letter of 15 December 2006 that the Commission repay the account balances of the closed projects. These balances totalled EUR 4 708 867,66 (* — see table below). This amount was placed on an interim account and will be reimbursed to the Italian Government in the course of 2008. The interest yielded by these accounts amounted to EUR 6 153,92 and has been transferred to the interest account.
At the end of 2007, the situation concerning the Italian funds managed by the Commission for projects in the ACP countries was as follows (EUR):
|
Project No |
Country |
Project |
Balance 31.12.2006 |
Contribution |
Closure of account (*) |
Payments |
Balance 31.12.2007 |
|
|
ITA COF |
9 |
ZAMBIA |
Sysmin II |
438 254,02 |
|
– 438 254,02 |
0,00 |
0,00 |
|
ITA COF |
11 |
ZAIRE |
Parco Virunga |
155 561,80 |
|
– 155 561,80 |
0,00 |
0,00 |
|
ITA COF |
12 |
GUINEE BISSAU |
Farim bridge |
3 034,20 |
|
– 3 034,20 |
0,00 |
0,00 |
|
ITA COF |
15 |
ZAIRE |
A.T. Kivu |
202 332,84 |
|
– 202 332,84 |
0,00 |
0,00 |
|
ITA COF |
20 |
BURKINA FASO |
DIAPER II |
35 326,10 |
|
– 35 326,10 |
0,00 |
0,00 |
|
ITA COF |
22 |
BOTSWANA |
K. airport |
160 586,01 |
|
– 160 586,01 |
0,00 |
0,00 |
|
ITA COF |
23 |
SOMALIA |
Somalia — Rinderpest |
1 694 318,41 |
|
– 1 694 318,41 |
0,00 |
0,00 |
|
ITA COF |
24 |
GUINEA BISSAU |
Oil imports |
194 860,96 |
|
– 194 860,96 |
0,00 |
0,00 |
|
ITA COF |
25 |
MALI |
Nioro |
169 812,57 |
|
– 169 812,57 |
0,00 |
0,00 |
|
ITA COF |
26 |
ANGOLA |
Boavida hosp. |
161 422,54 |
|
– 161 422,54 |
0,00 |
0,00 |
|
ITA COF |
27 |
TANZANIA |
Hospital P. |
9 592,49 |
|
– 9 592,49 |
0,00 |
0,00 |
|
ITA COF |
28 |
DJIBOUTI |
IGADD food project |
3 031,61 |
|
– 3 031,61 |
0,00 |
0,00 |
|
ITA COF |
29 |
SEYCHELLES |
Technical assistance |
51 073,21 |
|
– 51 073,21 |
0,00 |
0,00 |
|
ITA COF |
31 |
BURUNDI |
Rutana Kankuzo |
154 846,04 |
|
– 154 846,04 |
0,00 |
0,00 |
|
ITA COF |
33 |
GUI. CONAKRY |
Fouta Djalon |
305 162,33 |
|
– 305 162,33 |
0,00 |
0,00 |
|
ITA COF |
36 |
BURKINA FASO |
Technical assistance |
89 763,43 |
|
– 89 763,43 |
0,00 |
0,00 |
|
ITA COF |
37 |
|
Interest from co-financing |
9 707 352,99 |
987 770,10 |
0,00 |
154 639,00 |
10 540 484,09 |
|
ITA COF |
39 |
ANGOLA |
Lubango road |
200 500,00 |
|
– 200 500,00 |
0,00 |
0,00 |
|
ITA COF |
40 |
Administrative expenditure |
484 551,70 |
4 832 181,80 |
0,00 |
0,00 |
5 316 733,50 |
|
|
ITA COF |
41 |
MOZAMBIQUE |
Technical assistance |
78 963,69 |
|
– 78 963,69 |
0,00 |
0,00 |
|
ITA COF |
42 |
MOZAMBIQUE |
Maputo |
14 387,00 |
|
– 14 387,00 |
0,00 |
0,00 |
|
ITA COF |
44 |
MADAGASCAR |
Manambery bridge |
65 250,91 |
|
– 65 250,91 |
0,00 |
0,00 |
|
ITA COF |
45 |
MOZAMBIQUE |
Children assistance |
11 295,81 |
|
– 11 295,81 |
0,00 |
0,00 |
|
ITA COF |
46 |
ANGOLA |
Minors assistance |
497,94 |
|
– 497,94 |
0,00 |
0,00 |
|
ITA COF |
47 |
ACP |
ACP-Conf. after Lome IV |
2 708,00 |
|
– 2 708,00 |
0,00 |
0,00 |
|
ITA COF |
48 |
ANGOLA |
SME |
27 750,00 |
|
– 27 750,00 |
0,00 |
0,00 |
|
ITA COF |
50 |
SOMALIA |
Rehabilitation |
17 271 593,98 |
154 639,00 |
0,00 |
5 936 100,18 |
11 490 132,80 |
|
ITA COF |
51 |
TANZANIA |
Bogamoyo road |
1 386 304,54 |
|
0,00 |
0,00 |
1 386 304,54 |
|
ITA COF |
52 |
SOMALIA |
PACE |
478 535,75 |
|
– 478 535,75 |
0,00 |
0,00 |
|
TOTAL |
|
|
33 558 670,87 |
5 974 590,90 |
– 4 708 867,66 |
5 120 587,18 |
28 733 654,93 |
|
In all, 52 projects implemented in the ACP countries have been co-financed by Italy since the signing of the above agreement, only one of which, ‘4th rehabilitation programme — Somalia’, is still in progress.
3. FINANCIAL INFORMATION EIB
3.1. INCOME STATEMENT INVESTMENT FACILITY
|
|
Notes |
Year to 31.12.2007 |
Year to 31.12.2006 |
|
Interest and similar income |
5 |
46 580 |
23 816 |
|
Interest and similar expense |
5 |
(1 218) |
(2 493) |
|
Net interest and similar income |
|
45 362 |
21 323 |
|
Net fees and commission income |
6 |
1 396 |
4 366 |
|
Net fees and commission income |
|
1 396 |
4 366 |
|
Net result on financial operations |
7 |
(8 005) |
(283) |
|
Impairment charge for credit loss |
11 |
(2 770) |
(1 693) |
|
Member States special contribution to general administrative expenses |
8 |
32 756 |
33 913 |
|
General administrative expenses |
8 |
(32 756) |
(33 913) |
|
Profit for the year |
|
35 983 |
23 713 |
3.2. BALANCE SHEET INVESTMENT FACILITY
|
|
Notes |
2007 |
2006 |
|
ASSETS |
|||
|
Cash and cash equivalents |
9 |
184 772 |
190 780 |
|
Derivative financial instruments |
10 |
25 279 |
8 592 |
|
Loans and receivables |
11 |
572 530 |
338 997 |
|
of which accrued interest |
|
10 779 |
3 784 |
|
Financial investments — available-for-sale |
12 |
|
|
|
Equity investment — available-for-sale |
|
109 363 |
66 449 |
|
Amounts receivable from contributors |
13 |
181 183 |
103 913 |
|
Other assets |
14 |
4 291 |
1 813 |
|
Total assets |
|
1 077 418 |
710 544 |
|
LIABILITIES AND EQUITY |
|||
|
LIABILITIES |
|||
|
Derivative financial instruments |
10 |
841 |
119 |
|
Deferred income |
15 |
18 030 |
7 908 |
|
Amount owed to third parties |
16 |
131 152 |
134 425 |
|
Other liabilities |
17 |
916 |
1 911 |
|
Total Liabilities |
|
150 939 |
144 363 |
|
EQUITY |
|||
|
Facility Member States Contribution called |
18 |
830 000 |
515 000 |
|
Retained earnings |
|
77 167 |
41 184 |
|
Fair value reserve |
|
19 312 |
9 997 |
|
Total Equity |
|
926 479 |
566 181 |
|
Total Liabilities and Equity |
|
1 077 418 |
710 544 |
3.3. CASH FLOW STATEMENT INVESTMENT FACILITY
|
|
2007 |
2006 |
|
OPERATING ACTIVITIES |
||
|
Profit for the financial year |
35 983 |
23 713 |
|
Adjustments |
|
|
|
Impairment on equity investment available-for-sale |
366 |
130 |
|
Impairment on loans |
2 770 |
1 693 |
|
Interest capitalised |
(6 747) |
(4 303) |
|
Increase in accruals and deferred income |
4 150 |
8 038 |
|
Profit on operating activities before changes in operating assets and liabilities |
36 522 |
29 271 |
|
Net loan disbursements |
(286 028) |
(157 004) |
|
Repayments |
34 214 |
3 585 |
|
Fair value movement on derivatives |
(15 965) |
(14 057) |
|
Increase in prepayments and accrued income on loans |
— |
(1 062) |
|
Increase in equity investments available-for-sale |
(43 143) |
(31 965) |
|
Proceeds from equity investments available-for-sale |
8 248 |
25 |
|
Increase in other assets |
(2 456) |
(1 014) |
|
Increase in other liabilities |
(518) |
1 463 |
|
Net cash flows from operating activities |
(269 126) |
(170 758) |
|
FINANCING ACTIVITIES |
||
|
Paid in by Facility Member States |
315 000 |
145 000 |
|
Increase/(decrease) in amount receivable from contributors |
(77 271) |
(11 458) |
|
Net increase in amount payable from interest subsidies |
(3 273) |
17 312 |
|
Increase in amount payable to third parties |
(538) |
1 458 |
|
Net cash flows from/(used in) financing activities |
233 918 |
152 312 |
|
Net increase in cash and cash equivalents |
(35 208) |
(18 446) |
|
Cash and cash equivalents at beginning of financial year |
190 780 |
194 916 |
|
Effect of exchange rate changes on loans and equity investments |
29 200 |
14 310 |
|
Cash and cash equivalents at end of financial year |
184 772 |
190 780 |
3.4. STATEMENT OF CHANGES IN EQUITY INVESTMENT FACILITY
|
For the year ended 31 December 2007 |
Facility Member States Contribution |
Retained earnings |
Fair value reserve on AFS investments |
Total Equity |
|
At 1 January 2007 |
515 000 |
41 184 |
9 997 |
566 181 |
|
Net changes in equity investments — available-for-sale |
— |
— |
9 315 |
9 315 |
|
Facility Member States contribution called during the year |
315 000 |
— |
— |
315 000 |
|
Profit for the year |
— |
35 983 |
— |
35 983 |
|
Changes in contributors' resources |
315 000 |
35 983 |
9 315 |
360 298 |
|
At 31 December 2007 |
830 000 |
77 167 |
19 312 |
926 479 |
|
At 1 January 2006 |
370 000 |
17 471 |
6 443 |
393 914 |
|
Net changes in equity investments — available-for-sale |
— |
— |
3 554 |
3 554 |
|
Facility Member States contribution called during the year |
145 000 |
— |
— |
145 000 |
|
Profit for the year |
— |
23 713 |
— |
23 713 |
|
Changes in contributors' resources |
145 000 |
23 713 |
3 554 |
172 267 |
|
At 31 December 2006 |
515 000 |
41 184 |
9 997 |
566 181 |
3.5. NOTES TO THE FINANCIAL STATEMENTS
1. GENERAL INFORMATION
The Investment Facility has been established within the framework of the Cotonou Agreement (the ‘Agreement’) on co-operation and development assistance negotiated between the African, Caribbean and Pacific Group of States (the ‘ACP States’) and the European Union and its Member States on 23 June 2000 and revised on 25 June 2005.
The Investment Facility is managed by the European Investment Bank (the ‘EIB’ or the ‘Bank’). Under the terms of the Agreement up to EUR 2,200 million for ACP and EUR 20 million for OCT (as agreed by the Council Decision of 27 November 2001 on the association of the Overseas Countries and Territories with the European Community) may be allocated to finance the Investment Facility. Within the framework of the Agreement, the EIB also manages loans granted from its own resources. All other financial resources and instruments under the Agreement are administered by the European Commission.
2. SIGNIFICANT ACCOUNTING POLICIES
Basis of preparation
In line with the Investment Facility Management Agreement the preparation of the financial statements of the Facility is guided by International Public Sector Accounting Standards or International Financial Reporting Standards, as appropriate. The Facility's financial statements have been prepared on the basis of the following significant accounting principles:
Significant accounting judgments and estimates
The preparation of financial statements requires the use of certain critical accounting estimates. It also requires management to exercise its judgment in the process of applying the Investment Facility's accounting policies. The areas involving a higher degree of judgment or complexity, or areas where assumptions and estimates are significant to the financial statements are disclosed.
The most significant use of judgments and estimates are as follows:
|
|
Fair value of financial instruments Where the fair values of financial assets and financial liabilities recorded on the balance sheet cannot be derived from active markets, they are determined using a variety of valuation techniques that include the use of mathematical models. The input to these models is taken from observable markets where possible, but where this is not feasible, a degree of judgment is required in establishing fair values. The judgments include considerations of liquidity and model inputs such as correlation and volatility for longer dated derivatives. |
|
|
Impairment losses on loans and receivables The Investment Facility reviews its problem loans and receivables at each reporting date to assess whether an allowance for impairment should be recorded in the income statement. In particular, judgment by management is required in the estimation of the amount and timing of future cash flows when determining the level of allowance required. Such estimates are based on assumptions about a number of factors and actual results may differ, resulting in future changes to the allowance. In addition to specific allowance against individually significant loans and receivables, the Investment Facility also makes a collective impairment allowance against exposures which, although not specifically identified as requiring a specific allowance, have a greater risk of default than when originally granted. This collective allowance is based on any deterioration in the internal rating of the loan or investment since it was granted or acquired. These internal ratings take into consideration factors such as any deterioration in country risk, industry, and technological obsolescence, as well as identified structural weaknesses or deterioration in cash flows. |
|
|
Valuation of unquoted available-for-sale equity investments Valuation of unquoted available-for-sale equity investments is normally based on one of the following:
The determination of the cash flows and discount factors for unquoted available-for-sale equity investments requires significant estimation. The Investment Facility calibrates the valuation techniques periodically and tests them for validity using either price from observable current market transactions in the same instrument or from other available observable market data. |
|
|
Impairment of available-for-sale financial investments The Investment Facility treats available-for-sale equity investments as impaired when there has been a significant or prolonged decline in the fair value below its cost or where other objective evidence of impairment exists. The determination of whether a decline is significant or prolonged is based on a judgmental appreciation. |
Change in accounting policies
The accounting policies adopted are consistent with those used in the previous financial years.
Summary of significant accounting policies
The balance sheet represents assets and liabilities in decreasing order of liquidity and does not distinguish between current and non-current items.
1) Foreign currency translation
The Investment Facility uses the Euro (EUR) for presenting its financial statements, which is also the functional and presentational currency.
Foreign currency transactions are translated, in accordance with IAS 21, at the exchange rate prevailing on the date of the transaction.
Monetary assets and liabilities denominated in currencies other than in Euro are translated into Euro at the exchange rate prevailing at the balance sheet date. The gain or loss arising from such translation is recorded in the income statement.
Non-monetary items that are measured in terms of historical cost in a foreign currency are translated using the exchange rates at the dates of the initial transactions. Non-monetary items measured at fair value in a foreign currency are translated using the exchange rates at the date when the fair value was determined.
Exchange differences arising on the settlement of transactions at rates different from those at the date of the transaction, and unrealized foreign exchange differences on unsettled foreign currency monetary assets and liabilities, are recognized in the income statement.
The elements of the income statement are translated into Euro on the basis of the exchange rates prevailing at the end of each month.
2) Cash and cash equivalents
The Investment Facility defines cash equivalents as current accounts or short-term deposits with original maturities of three months or less.
3) Financial assets other than derivatives
Financial assets are accounted for using the settlement date basis.
Loans
Loans originated by the Investment Facility are recognized in the assets of the Investment Facility when cash is advanced to borrowers. They are initially recorded at cost (net disbursed amounts), which is the fair value of the cash given to originate the loan, including any transaction costs, and are subsequently measured at amortized cost, using the effective yield method, less any provision for impairment or uncollectability.
Available-for-sale financial investments
Available-for-sale financial investments are those which are designated as such or do not qualify to be classified as designated at fair value through profit or loss, held-to-maturity or loans and receivables. They include equity instruments, investments in venture capital funds and other debt instruments.
After initial measurement, available-for-sale financial investments are subsequently carried at fair value. Note the following details for the fair value measurement of equity investments, which can not be derived from active markets:
|
(a) |
Venture capital funds The fair value of each venture capital fund will be based on the Net Asset Value (NAV), reported by the fund, if calculated based on international valuation standards. The Investment Facility may however decide to adjust the NAV reported by the fund if there are issues that may affect the valuation. If no internationally recognized fair valuation standard is applied, the valuation will be conducted on the basis of the underlying portfolio. |
|
(b) |
Direct equity investments The fair value of the investment will be based on the latest set of financial statements available, re-using, if applicable, the same model as the one used at the acquisition of the participation. Unrealized gains or losses on equity investments are reported in equity until such investments are sold, collected or disposed of, or until such investment are determined to be impaired. If an available-for-sale investment is determined to be impaired, the cumulative unrealized gain or loss previously recognized in equity is included in the income statement. For unquoted investment, the fair value is determined by applying recognized valuation technique. These investments are accounted for at cost when the fair value cannot be reliably measured. |
Guarantees
Financial guarantees are initially recognized at fair value in the balance sheet under item ‘Financial guarantees’. Subsequent to initial recognition, the Investment Facility's liabilities under each guarantee are measured at the higher of the amortized premium and the best estimate of expenditure required to settle any financial obligation arising as a result of the guarantee.
Any increase in the liability relating to financial guarantees is taken to the income statement under item ‘Impairment charge for credit loss’. The premium received is recognized in the income statement under item ‘Net fee and commission income’ using the effective interest rate method over the life of the guarantee.
4) Impairment of financial assets
The Investment Facility assesses at each balance sheet date whether there is any objective evidence that a financial asset is impaired. A financial asset or a group of financial assets is deemed to be impaired if, and only if, there is objective evidence of impairment as a result of one or more events that has occurred after the initial recognition of the asset (an incurred ‘loss event’) and that loss event has an impact on the estimated future cash flows of the financial asset or the group of financial assets that can be reliably estimated. Evidence of impairment may include indications that the borrower or a group of borrowers is experiencing significant financial difficulty, default or delinquency in interest or principal payments, the probability that they will enter bankruptcy or other financial reorganization and where observable data indicate that there is a measurable decrease in the estimated future cash flows, such as changes in arrears or economic conditions that correlate with defaults.
For the loans outstanding at the end of the financial year and carried at amortized cost, impairments are made when presenting objective evidence of risks of non recovery of all or part of their amounts according to the original contractual terms or the equivalent value. If there is objective evidence that an impairment loss has been incurred, the amount of the loss is measured as the difference between the assets carrying amount and the present value of estimated future cash flows. The carrying amount of the asset is reduced through the use of an allowance account and the amount of the loss is recognized in the income statement. Interest income continues to be accrued on the reduced carrying amount based on the effective interest rate of the asset. Loans together with the associated allowance are written off when there is no realistic prospect of future recovery. If, in a subsequent year, the amount of the estimated impairment loss increases or decreases because of an event occurring after the impairment was recognized, the previously recognized impairment loss is increased or reduced by adjusting the allowance account.
The Investment Facility conducts credit risk assessments based on which there is no need for a collective impairment provision.
For the available-for-sale financial investments, the Investment Facility assesses at each balance sheet date whether there is objective evidence that an investment is impaired. Objective evidence would include a significant or prolonged decline in the fair value of the investment below its costs. Where there is evidence of impairment, the cumulative loss (measured as the difference between the acquisition cost and the current fair value, less any impairment loss on that investment previously recognized in the income statement) is removed from equity and recognized in the income statement. Impairment losses on available-for-sale financial investments are not reversed through the income statement; increases in their fair value after impairment are recognized directly in equity.
For held-to-maturity investments the Investment Facility assesses individually whether there is objective evidence for impairment. If there is objective evidence that an impairment loss has been incurred, the amount of the loss is measured as the difference between the asset's carrying amount and the present value of the estimated future cash flows. The carrying amount of the asset is reduced and the amount of the loss is recognised in the income statement. If, in a subsequent year, the amount of the estimated impairment loss decreases because of an event occurring after the impairment was recognised, any amount formerly charged are credited to the ‘Net result on financial operations’.
The European Investment Bank's Risk Management reviews financial assets for impairment at least once a year. Resulting adjustments include the unwinding of the discount in the income statement over the life of the asset, and any adjustments required in respect of a reassessment of the initial impairment.
5) Derivative financial instruments
Derivatives include cross currency swaps and cross currency interest rate swaps.
In the normal course of its activity, the Investment Facility may enter into swap contracts with a view to hedge specific lending operations, denominated in actively traded currencies other than the Euro, in order to offset any gain or loss caused by foreign exchange rate fluctuations.
However, the Investment Facility has not entered into any hedge accounting transactions as at December 31, 2007. Therefore, all derivatives are measured at fair value through the income statement. Fair values are derived primarily from discounted cash flow models, option-pricing models and from third party quotes.
Derivatives are recorded at fair value and carried as assets when their fair value is positive and as liabilities when their fair value is negative. Changes in the fair value of derivative financial instruments are included in ‘Net result on financial operations’.
6) Contributions
Contributions from Member States are recognized as receivable in the balance sheet on the date of the Council Decision fixing the financial contribution to be paid by the Member States to the Investment Facility.
7) Interest income on loans
Interest on loans originated by the Investment Facility is recorded in the profit and loss account (‘Interest and similar income’) and on the balance sheet (‘Loan and receivables’) on an accrual basis using the effective interest rate, which is the rate that exactly discounts estimated future cash payments or receipts through the expected life of the loan to the net carrying amount of the loan. Once the recorded value of a loan has been reduced due to impairment, interest income continues to be recognized using the original effective interest rate applied to the new carrying amount.
8) Interest subsidies
As part of its activity, the Investment Facility manages interest subsidies on behalf of the Member States.
The part of the Member States contributions allocated to the payment of interest subsidies is not accounted for in the Investment Facility's equity but is classified as an amount owed to third parties.
9) Interest income on treasury
Under the terms of the Investment Facility and according to the Financial Regulation applicable to the 9th European Development Fund, the funds received by the EIB on behalf of the Investment Facility are recorded in an account in the Commission's name. Interest on these deposits, placed by the Investment Facility with the EIB, is not accounted for by the Investment Facility as it is payable directly to the European Commission.
Reflows, being repayment of principal, interest or commissions stemming from financial operations, and interest calculated on these reflows are accounted for within the Investment Facility.
10) Fees, commissions and dividends
Fees received in respect of services provided over a period of time are recognized as income as the services are provided. Commitment fees are deferred and recognized in income using the effective interest method over the period from disbursement to repayment of the related loan.
Dividends relating to available-for-sale equity investments are recognized when received.
11) Taxation
The Protocol on the Privileges and Immunities of the European Communities, appended to the Treaty of 8 April 1965 establishing a Single Council and a Single Commission of the European Communities, stipulates that the assets, revenues and other property of the Institutions of the Union are exempt from all direct taxes.
12) Reclassification of prior years figures
Where necessary, certain prior years figures have been reclassified to conform to changes to the current year's presentation for comparative purpose.
3. RISK MANAGEMENT
Credit risk
This section presents financial information about the investments made by the Facility.
1) Exposure disbursed by nature of borrower
The table hereafter analyses the Investment Facility exposure disbursed by nature of borrower.
|
(in EUR '000) |
||
|
|
2007 |
2006 |
|
Banks/Financial Institut. |
190 218 |
88 951 |
|
Proj. Fin./Struct. Op. |
320 670 |
227 231 |
|
Sovereign |
58 852 |
23 235 |
|
Venture Capital Fund |
65 583 |
34 551 |
|
Corporates |
35 791 |
27 694 |
|
Total |
671 114 |
401 662 |
2) Exposure disbursed by nature of instrument
The table hereafter analyses the Investment Facility exposure disbursed by nature of investment instrument used.
|
(in EUR '000) |
||
|
|
2007 |
2006 |
|
Senior Loans (exposure disbursed) |
409 765 |
226 392 |
|
of which Global Loans |
144 265 |
96 841 |
|
Subordinated Loans and Quasi Equity |
151 986 |
108 821 |
|
Equity |
109 363 |
66 449 |
|
Total |
671 114 |
401 662 |
3) Risk concentrations of the exposure disbursed to credit risk
The table below analyses the Investment Facility exposure disbursed by sector.
|
(in EUR '000) |
||
|
|
2007 |
2006 |
|
Global loans |
104 418 |
61 663 |
|
Energy |
107 096 |
38 291 |
|
Industry |
235 274 |
184 475 |
|
Services |
165 683 |
72 699 |
|
Transports |
9 199 |
- |
|
Water, sewerage |
2 000 |
- |
|
Agriculture, fisheries, forestry |
7 590 |
9 349 |
|
Agency agreements |
39 854 |
35 185 |
|
Total |
671 114 |
401 662 |
Liquidity risk and funding management
1) Analysis of financial liabilities by remaining contractual maturities
The table below sets out the Facility's assets and liabilities by relevant maturity groupings based on the remaining period to the contractual maturity date.
|
(in EUR '000) |
|||||
|
Financial liabilities |
Up to 3 months |
3 to 12 months |
1 to 5 years |
Over 5 years |
Total |
|
ASSETS |
|||||
|
Cash and cash equivalents |
184 772 |
— |
— |
— |
184 772 |
|
Derivative financial instruments |
— |
433 |
11 803 |
13 043 |
25 279 |
|
Loans and receivables |
7 735 |
3 082 |
85 010 |
476 703 |
572 530 |
|
Financial investments — available-for-sale |
|
|
|
|
|
|
Equity investment — available-for-sale |
— |
— |
— |
109 363 |
109 363 |
|
Amounts receivable from contributors |
181 183 |
— |
— |
— |
181 183 |
|
Other assets |
3 783 |
— |
— |
508 |
4 291 |
|
Total assets |
377 473 |
3 515 |
96 813 |
599 617 |
1 077 418 |
|
LIABILITIES |
|||||
|
Derivative financial instruments |
532 |
5 |
140 |
164 |
841 |
|
Deferred income |
— |
— |
— |
18 030 |
18 030 |
|
Amount owed to third parties |
131 152 |
— |
— |
— |
131 152 |
|
Other liabilities |
408 |
— |
— |
508 |
916 |
|
Total liabilities |
132 092 |
5 |
1 400 |
18 702 |
150 939 |
|
Net liquidity position at 31 December 2007 |
245 476 |
3 510 |
96 673 |
580 914 |
926 479 |
|
Net liquidity position at 31 December 2006 |
162 115 |
1 518 |
17 272 |
385 276 |
566 181 |
Market risk
A sensitivity analysis to be prepared for each type of market risk:
1) Interest rate risk
The table below summarizes the Investment Facility's exposure to interest rate risk through its investments.
|
(in EUR '000) |
||
|
|
2007 |
2006 |
|
Fixed rate interest |
291 468 |
170 790 |
|
Floating rate interest |
270 283 |
164 423 |
|
Total |
561 751 |
335 213 |
2) Currency risk (or Foreign exchange risk)
|
(in EUR '000) |
|||||
|
|
EUR |
USD |
CAD |
ACP/OCT Currencies |
Total |
|
ASSETS |
|||||
|
Cash and cash equivalents |
178 097 |
6 675 |
— |
— |
184 772 |
|
Derivative financial instruments |
24 609 |
670 |
— |
— |
25 279 |
|
Loans and receivables |
277 084 |
264 765 |
— |
30 681 |
572 530 |
|
Financial investments — available-for-sale |
|
|
|
|
— |
|
Equity investment — available-for-sale |
31 697 |
63 906 |
3 397 |
10 363 |
109 363 |
|
Amounts receivable from contributors |
181 183 |
|
|
|
181 183 |
|
Other assets |
711 |
2 722 |
— |
858 |
4 291 |
|
Total assets |
693 381 |
338 738 |
3 397 |
41 902 |
1 077 418 |
|
LIABILITIES |
|||||
|
Derivative financial instruments |
841 |
— |
— |
— |
841 |
|
Deferred income |
18 030 |
— |
— |
— |
18 030 |
|
Amount owed to third parties |
131152 |
— |
— |
— |
131 152 |
|
Other liabilities |
408 |
— |
— |
508 |
916 |
|
Total liabilities |
150 431 |
— |
— |
508 |
150 939 |
|
EQUITY |
|||||
|
Facility Member States Contribution called |
830 000 |
— |
— |
— |
830 000 |
|
Retained earnings |
77 167 |
— |
— |
— |
77 167 |
|
Fair value reserve |
7 094 |
5 570 |
6 857 |
(209) |
19 312 |
|
Total equity |
914 261 |
5 570 |
6 857 |
(209) |
926 479 |
|
Currency position as at 31 December 2007 |
(371 311) |
333 168 |
(3 460) |
41 603 |
— |
|
Currency position as at 31 December 2006 |
(244 924) |
206 935 |
3 797 |
34 192 |
— |
|
COMMITMENTS |
|||||
|
Undisbursed loans and equity investments |
573 913 |
183 408 |
— |
— |
757 321 |
|
Guarantees drawn |
10 116 |
— |
— |
— |
10 116 |
|
CONTIGENT LIABILITIES |
|||||
|
Guarantees undrawn |
113 875 |
— |
— |
— |
113 875 |
4. SEGMENT INFORMATION
In accordance with IAS 14, the primary segment of the Investment Facility is business operation and the secondary segment is geographical.
By business segment
The activity of the Investment Facility is divided into two main business segments on a worldwide basis:
|
— |
Banking operations — incorporating investments in projects which are made with the purpose of supporting investments of private and commercially run public sector entities. The main investment products are loans, available-for-sale equity investments and financial guarantees. |
|
— |
Treasury activities — including investing surplus liquidity and managing the Investment Facility foreign exchange risk. |
|
(in EUR '000) |
|||
|
At 31 December 2007 |
Treasury |
Banking |
Total |
|
Revenue from segments |
5 365 |
43 638 |
49 003 |
|
Expenses and charges from segments |
(9 442) |
(3 578) |
(13 020) |
|
Profit for the year |
|
|
35 983 |
|
Segment assets |
213 436 |
682 798 |
896 234 |
|
Unallocated assets |
|
|
181 184 |
|
Total assets |
|
|
1 077 418 |
|
Segment liabilities |
1 241 |
18 546 |
19 787 |
|
Unallocated liabilities |
|
|
131 152 |
|
Total liabilities |
|
|
150 939 |
|
Other segment information |
|||
|
Contingent liabilities and commitments |
— |
881 312 |
881 312 |
|
(in EUR '000) |
|||
|
At 31 December 2006 |
Treasury |
Banking |
Total |
|
Revenue from segments |
2 098 |
26 084 |
28 182 |
|
Expenses and charges from segments |
(2 646) |
(1 823) |
(4 469) |
|
Profit for the year |
|
|
23 713 |
|
Segment assets |
200 186 |
406 445 |
606 631 |
|
Unallocated assets |
|
|
103 913 |
|
Total assets |
|
|
710 544 |
|
Segment liabilities |
1 247 |
8 691 |
9 938 |
|
Unallocated liabilities |
|
|
134 425 |
|
Total liabilities |
|
|
144 363 |
|
Other segment information |
|||
|
Contingent liabilities and commitments |
- |
939 594 |
939 594 |
By geographical segment
The Investment Facility's activities are divided into five regions for internal management purposes.
|
(in EUR '000) |
||||
|
At 31 December 2007 |
Revenues (29) |
Total assets |
Total liabilities |
Contingents liabilities and commitments |
|
Caribbean and Pacific |
4 881 |
63 089 |
— |
102 658 |
|
Central and Eastern Africa |
4 560 |
114 401 |
15 837 |
414 592 |
|
Regional Africa and ACP states |
4 253 |
77 923 |
— |
163 377 |
|
Southern Africa and Indian ocean |
16 787 |
216 175 |
707 |
82 803 |
|
West Africa and Sahel |
9 631 |
187 602 |
2 003 |
117 882 |
|
Others (30) |
— |
418 228 |
132 392 |
— |
|
Total |
40 112 |
1 077 418 |
150 939 |
881 312 |
|
(in EUR '000) |
||||
|
At 31 December 2006 |
Revenues (31) |
Total assets |
Total liabilities |
Contingents liabilities and commitments |
|
Caribbean and Pacific |
4 217 |
42 558 |
— |
69 801 |
|
Central and Eastern Africa |
2 216 |
57 161 |
8 155 |
296 819 |
|
Regional Africa and ACP states |
2 536 |
54 944 |
— |
192 882 |
|
Southern Africa and Indian ocean |
12 990 |
161 006 |
51 |
124 241 |
|
West Africa and Sahel |
2 502 |
75 509 |
150 |
255 851 |
|
Others (32) |
— |
319 366 |
136 007 |
— |
|
Total |
24 461 |
710 544 |
144 363 |
939 594 |
5. NET INTEREST INCOME
The main components of interest and similar income are as follows:
|
(in EUR '000) |
||
|
|
2007 |
2006 |
|
Cash and short term funds |
5 755 |
2 098 |
|
Loans and receivables |
40 192 |
21 556 |
|
Interest subsidies |
633 |
162 |
|
Total interest and similar income |
46 580 |
23 816 |
The main components of interest and similar expense are as follows:
|
(in EUR '000) |
||
|
|
2007 |
2006 |
|
Due to banks |
(441) |
— |
|
Derivative financial instruments |
(738) |
(2 483) |
|
Remuneration paid to EC |
(39) |
— |
|
Other |
— |
(10) |
|
Total interest and similar expense |
(1 218) |
(2 493) |
6. NET FEE AND COMMISSION INCOME
The main components of net fee and commission income are as follows:
|
(in EUR '000) |
||
|
|
2007 |
2006 |
|
Loans and receivables |
1 136 |
4 168 |
|
Financial guarantees |
260 |
198 |
|
Total fee and commission income |
1 396 |
4 366 |
7. NET RESULT ON FINANCIAL OPERATIONS
The main components of net result on financial operations are as follows:
|
(in EUR '000) |
||||
|
|
2007 |
2006 |
||
|
Fair value movement on derivatives |
15 965 |
14 057 |
||
|
Foreign exchange |
(24 631) |
(14 210) |
||
|
Dividend income from financial investments |
||||
|
Equity investments — available-for-sale |
||||
|
— |
— |
||
|
24 |
— |
||
|
Gains less losses from financial investments |
||||
|
Equity investments — available-for-sale |
637 |
(130) |
||
|
Net result on financial operations |
(8 005) |
(283) |
||
8. GENERAL ADMINISTRATIVE EXPENSES
General administrative expenses represent the actual costs incurred by the European Investment Bank (the ‘EIB’) for managing the Investment Facility less income generated from standard appraisal fees directly charged by the EIB to clients of the Investment Facility.
|
(in EUR '000) |
||
|
|
2007 |
2006 |
|
Actual cost incurred by the EIB |
(34 260) |
(35 413) |
|
Income from appraisal fees charged to clients of the Facility |
1 504 |
1 500 |
|
Net general administrative expenses |
(32 756) |
(33 913) |
Under Council Decision of 8 April 2003, the Member states agreed to cover in full the expenses incurred by the EIB for the management of the Investment Facility for the first 5 years of the 9th European Development Fund.
9. CASH AND CASH EQUIVALENT
For the purposes of the cash flow statement, cash and cash equivalents comprise the following balances with less than three months maturity from the date of acquisition.
The cash and cash equivalents can be broken down between the funds received from the Member States and not yet disbursed and the funds from the Investment Facility's operational and financial activities.
|
(in EUR '000) |
||
|
|
2007 |
2006 |
|
Member states contributions received and not yet disbursed |
23 566 |
69 720 |
|
Funds from the Facility's financial and operational activities |
161 206 |
121 060 |
|
Cash and cash equivalents |
184 772 |
190 780 |
10. DERIVATIVE FINANCIAL INSTRUMENTS
|
(in EUR '000) |
|||
|
At 31 December 2007 |
Assets |
Liabilities |
Notional amount |
|
Cross currency swaps |
16 433 |
(729) |
114 124 |
|
Cross currency interest rate swaps |
8 176 |
(112) |
137 261 |
|
Warrants |
670 |
— |
1 350 |
|
Total |
25 279 |
(841) |
|
|
(in EUR '000) |
|||
|
At 31 December 2006 |
Assets |
Liabilities |
Notional amount |
|
Cross currency swaps |
6 165 |
(119) |
114 597 |
|
Cross currency interest rate swaps |
2 427 |
— |
86 963 |
|
Total |
8 592 |
(119) |
|
11. LOANS AND RECEIVABLES
|
(in EUR '000) |
||||
|
|
Global loans |
Senior loans |
Subordinated loans |
Total |
|
At 1st January 2007 |
96 840 |
129 550 |
108 823 |
335 213 |
|
Impairment |
— |
(2 770) |
— |
(2 770) |
|
Change in amortised cost |
(378) |
(580) |
(64) |
(1 022) |
|
Disbursement |
155 013 |
111 242 |
19 773 |
286 028 |
|
Interest capitalised |
446 |
33 |
6 268 |
6 747 |
|
Repayments |
(13 310) |
(15 405) |
(5 499) |
(34 214) |
|
Foreign exchange difference |
(15 325) |
(10 693) |
(2 213) |
(28 231) |
|
At 31st December 2007 |
223 286 |
211 377 |
127 088 |
561 751 |
|
Accrued interest income |
|
|
|
10 779 |
|
Loans and receivables at 31st December 2007 |
|
|
|
572 530 |
|
At 1st January 2006 |
50 314 |
61 279 |
82 416 |
194 009 |
|
Impairment |
— |
(1 693) |
— |
(1 693) |
|
Change in amortised cost |
— |
(350) |
34 |
(316) |
|
Disbursement |
55 467 |
79 375 |
22 162 |
157 004 |
|
Interest capitalised |
— |
— |
4 303 |
4 303 |
|
Repayments |
(3 585) |
— |
— |
(3 585) |
|
Foreign exchange difference |
(5 356) |
(9 061) |
(92) |
(14 509) |
|
At 31st December 2006 |
96 840 |
129 550 |
108 823 |
335 213 |
|
Accrued interest income |
|
|
|
3 784 |
|
Loans and receivables at 31st December 2006 |
|
|
|
338 997 |
At 31st December 2007, 2 operations were impaired for a total of EUR 4,4 million, of which 1,7 million were already accounted for as per 31st December 2006, at the rates prevailing at this date.
12. FINANCIAL INVESTMENTS
Equity investments — available-for-sale
The main components of available-for-sale equity investments are as follows:
|
(in EUR '000) |
||
|
Equity investments available-for-sale |
2007 |
2006 |
|
At 1st January |
66 449 |
30 886 |
|
Movement in fair value |
9 315 |
3 554 |
|
Impairment |
(366) |
(130) |
|
Disbursement |
43 143 |
31 965 |
|
Proceeds |
(8 248) |
(25) |
|
Foreign exchange difference |
(930) |
199 |
|
At 31st December |
109 363 |
66 449 |
13. AMOUNTS RECEIVABLE FROM CONTRIBUTORS
The main components of amounts receivable from contributors are as follows:
|
(in EUR '000) |
||
|
|
2007 |
2006 |
|
Contribution called but not paid |
148 427 |
70 000 |
|
Special contribution to general administrative expenses |
32 756 |
33 913 |
|
Total amount receivable from contributors |
181 183 |
103 913 |
14. OTHER ASSETS
The main components of other assets are as follows:
|
(in EUR '000) |
||
|
|
2007 |
2006 |
|
Interest on loans not yet collected |
397 |
551 |
|
Amounts receivable from EIB |
3 386 |
814 |
|
Financial guarantees |
508 |
448 |
|
Total amount of other assets |
4 291 |
1 813 |
15. DEFERRED INCOME
The main components of deferred income are as follows:
|
(in EUR '000) |
||
|
|
2007 |
2006 |
|
Deferred interest subsidies |
17 947 |
7 687 |
|
Deferred commissions on loans and receivables |
83 |
221 |
|
Total deferred income |
18 030 |
7 908 |
16. AMOUNT OWED TO THIRD PARTIES
The main components of amount owed to third parties are as follows:
|
(in EUR '000) |
||
|
|
2007 |
2006 |
|
Net general administrative expense payable to EIB |
32 756 |
33 913 |
|
Interest subsidies not yet disbursed |
98 396 |
100 512 |
|
Total amount owed to third parties |
131 152 |
134 425 |
17. OTHER LIABILITIES
The main components of other liabilities are as follows:
|
(in EUR '000) |
||
|
|
2007 |
2006 |
|
Remuneration repayable to the Commission with regard to the Contribution account |
27 |
538 |
|
Amount repayable to EIB |
— |
925 |
|
Financial guarantees |
508 |
448 |
|
Other |
381 |
— |
|
Total amount of other liabilities |
916 |
1 911 |
18. INVESTMENT FACILITY MEMBER STATES CONTRIBUTION CALLED
|
(in EUR '000) |
||||
|
Member States |
Contribution to the Facility |
Contribution to interest subsidies |
Total contributed |
Called and not paid (33) |
|
Austria |
21 995 |
3 180 |
25 175 |
4 505 |
|
Belgium |
32 536 |
4 704 |
37 240 |
6 664 |
|
Denmark |
17 762 |
2 568 |
20 330 |
3 638 |
|
Finland |
12 284 |
1 776 |
14 060 |
2 516 |
|
France |
201 690 |
29 160 |
230 850 |
41 310 |
|
Germany |
193 888 |
28 032 |
221 920 |
39 712 |
|
Greece |
10 375 |
1 500 |
11 875 |
2 125 |
|
Ireland |
5 146 |
744 |
5 890 |
1 054 |
|
Italy |
104 082 |
15 048 |
119 130 |
21 318 |
|
Luxembourg |
2 407 |
348 |
2 755 |
493 |
|
Netherlands |
43 326 |
6 264 |
49 590 |
8 874 |
|
Portugal |
8 051 |
1 164 |
9 215 |
1 649 |
|
Spain |
48 472 |
7 008 |
55 480 |
9 928 |
|
Sweden |
22 659 |
3 276 |
25 935 |
4 641 |
|
United Kingdom |
105 327 |
15 228 |
120 555 |
— |
|
Total |
830 000 |
120 000 |
950 000 |
148 427 |
19. CONTINGENT LIABILITIES AND COMMITMENTS
|
(in EUR '000) |
||
|
|
2007 |
2006 |
|
Commitments |
||
|
Undisbursed loans |
669 117 |
779 241 |
|
Undisbursed commitment in respect of equity investments |
88 204 |
88 552 |
|
Guarantees drawn |
10 116 |
7 925 |
|
Contingent liabilities |
||
|
Guarantees undrawn |
113 875 |
63 876 |
|
Total |
881 312 |
939 594 |
20. SUBSEQUENT EVENTS
There have been no material post balance sheet events which could require disclosure or adjustment to the 31 December 2007 financial statements.
On a proposal from the Management Committee, the Board of Directors reviewed these financial statements on 11 March 2008 and decided to submit them to the Board of Governors for approval at their meeting to be held on 3 June 2008.
(1) OJ L 320, 6.12.2007 p. 31-32.
(2) OJ L 83, 1.4.2003 p. 1-31.
(3) Includes the Economic result of the closed 6th EDF for the financial year 2006 amounting to EUR 10 million.
(4) OJ L 83, 1.4.2003 p. 1-31.
(5) OJ L 266, 21.9.1991, p. 1.
(6) OJ L 191, 7.7.1998, pp. 53-70.
(7) OJ L 156, 29.5.1998, p. 3-106.
(8) COM(2008)224
(10) Internal Agreement on the financing and administration of Community aid under the fourth ACP-EEC Convention (OJ L 229, 17/08/1991), applicable to the 7th EDF; Internal Agreement on the financing and administration of the Community aid under the Second Financial Protocol to the fourth ACP-EC Convention (OJ L 156, 29/05/1998), applicable to the 8th EDF and Internal Agreement on the Financing and Administration of Community Aid under the Cotonou agreement (OJ L 317, 15/12/2000), applicable to 9th EDF.
(11) Council Decision 2004/289/CE, decisions 6/2005 and 7/2005 of the ACP-EC Council of Ministers of 22.11.2005.
(12) Joint Council Decision 2/2007 of 25th May 2007: on the position to be adopted by the Community within the ACP-EC Council of Ministers to allow additional bilateral contributions, to be managed by the Commission, in support of the objectives of the African Peace Facility.
(13) The unallocated resources from the previous EDFs include the balance of the Sysmin funds, which by Decision 3/2000 of the ACP-EC Committee of Ministers was set at EUR 410,926 million. Commission Decision PE/410/2001 includes these resources in programming for the national indicative allocations (part B) under the financial protocol to the ACP-EC Partnership Agreement.
(14) Annex I(5) to the Cotonou Agreement.
(15) Council Decision 2005/446/EC of 30 May 2005 (OJ L 156, 18.6.2005, p. 19).
(16) Annex 1a(1) and Annex 1b (Second Financial Protocol (now called the Multiannual Financial Framework)) to the Cotonou Agreement.
(17) Interest subsidies.
(18) Interest subsidies.
(19) Council Decision 2005/446/EC of 30 May 2005, OJ L 156, 18.6.2005 p. 19-20. see section 1.1.
(20) Transfer to 9th EDF following the entry in force of Cotonou (Commission Decision of 16 April 2003)
(21) Transfer to 9th EDF following the entry in force of Cotonou (Commission Decision of 16 April 2003)
(22) The negative amount is due to recovery of an advance on a 6th EDF project transferred with a zero balance.
(23) Transfer to 9th EDF following the entry in force of Cotonou (Commission Decision of 16 April 2003).
(24) Ref Commission Decision C(2007) 3856 16.8.2007.
(25) Transfer to 9th EDF following the entry in force of Cotonou (Commission Decision of 16 April 2003).
(26) % of appropriations.
(27) Amount entered in Authorising Officer Accounts.
(28) Balance of accounts closed plus annual interest on the ‘administrative expenditure’ account.
(29) Revenues represent the net profit on the Investment Facility's operational activity (i.e. interest and similar income, interest subsidies, net fee and commission income, credit loss expense and impairment losses on financial investments).
(30) Under geographical segment ‘Other’ is considered the amount payable to or receivable from the Member States or the European Investment Bank and the Investment Facility cash and cash equivalent.
(31) Revenues represent the net profit on the Investment Facility's operational activity (i.e. interest and similar income, interest subsidies, net fee and commission income, credit loss expense and impairment losses on financial investments).
(32) Under geographical segment ‘Other’ is considered the amount payable to or receivable from the Member States or the European Investment Bank and the Investment Facility cash and cash equivalent.
(33) On the 20th December 2007, the Council fixed the amount of financial contributions to be paid by each Member State by 21st January 2008.
4. APPENDIX — SITUATION BY COUNTRY AND BY INSTRUMENT
Table 3.1.1
7th EDF
Cumulative 2007
GLOBAL SITUATION BY STATE
|
(EUR million) |
|||||||||||||
|
|
Lome |
Cotonou |
Total |
||||||||||
|
NIP |
National indicative programmes |
Other aid |
Regional decisions |
||||||||||
|
Decisions |
As % of NIP |
Payments |
As % of NIP |
Decisions |
As % of NIP |
Payments |
As % of NIP |
Decisions |
Assigned funds |
Payments |
|||
|
ANGOLA |
109,43 |
109,43 |
100,00 % |
105,95 |
96,81 % |
39,63 |
36,22 % |
39,53 |
36,13 % |
|
149,07 |
147,76 |
145,48 |
|
BENIN |
88,02 |
88,02 |
100,00 % |
87,72 |
99,67 % |
60,45 |
68,68 % |
60,45 |
68,68 % |
|
148,46 |
148,44 |
148,17 |
|
BURKINA FASO |
147,17 |
147,17 |
100,00 % |
143,75 |
97,68 % |
149,79 |
101,78 % |
149,79 |
101,78 % |
|
296,96 |
296,02 |
293,54 |
|
BOTSWANA |
30,09 |
30,09 |
100,00 % |
30,08 |
99,98 % |
55,15 |
183,32 % |
55,15 |
183,30 % |
|
85,24 |
85,23 |
85,23 |
|
BURUNDI |
78,16 |
78,16 |
100,00 % |
77,41 |
99,05 % |
86,11 |
110,18 % |
86,08 |
110,14 % |
|
164,27 |
164,24 |
163,49 |
|
CENTRAL AFRICAN REPUBLIC |
71,28 |
71,28 |
100,00 % |
71,22 |
99,91 % |
33,11 |
46,45 % |
33,11 |
46,45 % |
|
104,40 |
104,33 |
104,33 |
|
CHAD |
98,93 |
98,93 |
100,00 % |
98,55 |
99,61 % |
34,07 |
34,44 % |
34,07 |
34,44 % |
|
133,00 |
132,97 |
132,62 |
|
CAMEROON |
104,41 |
104,41 |
100,00 % |
104,41 |
100,00 % |
287,71 |
275,55 % |
287,71 |
275,55 % |
|
392,13 |
392,13 |
392,13 |
|
CONGO |
29,64 |
29,64 |
100,00 % |
28,95 |
97,66 % |
7,26 |
24,49 % |
7,26 |
24,49 % |
|
36,90 |
36,42 |
36,21 |
|
COMOROS |
20,24 |
20,24 |
100,00 % |
20,17 |
99,65 % |
13,82 |
68,25 % |
13,82 |
68,25 % |
|
34,06 |
33,99 |
33,99 |
|
CAPE VERDE |
24,06 |
24,06 |
100,00 % |
23,22 |
96,49 % |
13,34 |
55,43 % |
13,34 |
55,43 % |
|
37,40 |
37,32 |
36,56 |
|
DJIBOUTI |
17,43 |
17,43 |
100,00 % |
17,42 |
100,00 % |
5,67 |
32,55 % |
5,67 |
32,55 % |
|
23,10 |
23,10 |
23,10 |
|
EQUATORIAL GUINEA |
12,12 |
12,12 |
100,00 % |
12,12 |
100,00 % |
7,98 |
65,88 % |
7,98 |
65,88 % |
|
20,10 |
20,10 |
20,10 |
|
ERITREA |
46,15 |
46,15 |
100,00 % |
45,89 |
99,44 % |
13,48 |
29,20 % |
13,48 |
29,20 % |
|
59,62 |
59,38 |
59,36 |
|
ETHIOPIA |
204,83 |
204,83 |
100,00 % |
199,08 |
97,19 % |
343,94 |
167,91 % |
327,85 |
160,06 % |
|
548,78 |
547,84 |
526,92 |
|
GABON |
29,31 |
29,31 |
100,00 % |
29,31 |
100,00 % |
24,75 |
84,45 % |
24,75 |
84,45 % |
|
54,06 |
54,06 |
54,06 |
|
GHANA |
95,28 |
95,28 |
100,00 % |
94,12 |
98,78 % |
164,02 |
172,13 % |
163,96 |
172,08 % |
|
259,30 |
258,90 |
258,08 |
|
GAMBIA |
21,57 |
21,57 |
100,00 % |
21,55 |
99,90 % |
11,44 |
53,02 % |
11,40 |
52,85 % |
|
33,01 |
33,01 |
32,95 |
|
GUINEA-BISSAU |
35,17 |
35,17 |
100,00 % |
34,95 |
99,37 % |
21,94 |
62,38 % |
21,94 |
62,38 % |
|
57,11 |
57,04 |
56,89 |
|
GUINEA |
121,70 |
121,70 |
100,00 % |
120,78 |
99,25 % |
158,82 |
130,50 % |
151,59 |
124,57 % |
|
280,52 |
276,44 |
272,37 |
|
CÔTE D'IVOIRE |
103,23 |
103,23 |
100,00 % |
103,17 |
99,94 % |
371,49 |
359,86 % |
371,49 |
359,86 % |
|
474,72 |
474,72 |
474,66 |
|
KENYA |
129,89 |
129,89 |
100,00 % |
126,30 |
97,24 % |
155,96 |
120,07 % |
155,28 |
119,55 % |
|
285,85 |
284,49 |
281,58 |
|
LIBERIA |
|
|
|
|
|
33,20 |
|
33,13 |
|
|
33,20 |
33,20 |
33,13 |
|
LESOTHO |
45,41 |
45,41 |
100,00 % |
45,41 |
100,00 % |
54,34 |
119,67 % |
54,34 |
119,67 % |
|
99,75 |
99,75 |
99,75 |
|
MADAGASCAR |
130,33 |
130,33 |
100,00 % |
130,33 |
100,00 % |
86,55 |
66,41 % |
86,55 |
66,41 % |
|
216,89 |
216,89 |
216,89 |
|
MALAWI |
124,48 |
124,48 |
100,00 % |
123,38 |
99,12 % |
133,23 |
107,03 % |
133,06 |
106,90 % |
|
257,71 |
257,64 |
256,44 |
|
MAURITIUS |
31,63 |
31,63 |
100,00 % |
31,63 |
100,00 % |
17,85 |
56,45 % |
17,85 |
56,45 % |
|
49,48 |
49,48 |
49,48 |
|
MAURITANIA |
62,73 |
62,73 |
100,00 % |
62,34 |
99,38 % |
127,77 |
203,70 % |
127,77 |
203,70 % |
|
190,50 |
190,16 |
190,11 |
|
MALI |
141,35 |
141,35 |
100,00 % |
141,17 |
99,87 % |
112,77 |
79,78 % |
109,33 |
77,35 % |
|
254,12 |
253,75 |
250,50 |
|
MOZAMBIQUE |
161,32 |
161,32 |
100,00 % |
158,84 |
98,46 % |
94,04 |
58,29 % |
94,04 |
58,29 % |
|
255,37 |
254,79 |
252,88 |
|
NAMIBIA |
46,81 |
46,81 |
100,00 % |
46,65 |
99,67 % |
53,61 |
114,53 % |
53,61 |
114,53 % |
|
100,42 |
100,27 |
100,27 |
|
NIGER |
138,22 |
138,22 |
100,00 % |
138,22 |
100,00 % |
61,43 |
44,44 % |
61,43 |
44,44 % |
|
199,64 |
199,64 |
199,64 |
|
RWANDA |
115,86 |
115,86 |
100,00 % |
115,63 |
99,81 % |
83,38 |
71,96 % |
83,38 |
71,96 % |
|
199,23 |
199,08 |
199,01 |
|
SENEGAL |
106,05 |
106,05 |
100,00 % |
104,58 |
98,61 % |
88,25 |
83,21 % |
87,94 |
82,92 % |
|
194,30 |
192,58 |
192,52 |
|
SEYCHELLES |
5,26 |
5,26 |
100,00 % |
5,26 |
100,00 % |
3,05 |
58,09 % |
3,05 |
58,09 % |
|
8,31 |
8,31 |
8,31 |
|
SIERRA LEONE |
73,47 |
73,47 |
100,00 % |
70,79 |
96,35 % |
42,91 |
58,41 % |
42,91 |
58,41 % |
|
116,38 |
115,72 |
113,70 |
|
SOMALIA |
|
|
|
|
|
18,44 |
|
18,44 |
|
|
18,44 |
18,44 |
18,44 |
|
SAO TOME & PRINCIPE |
7,89 |
7,89 |
100,00 % |
7,89 |
99,94 % |
10,63 |
134,64 % |
10,63 |
134,64 % |
|
18,52 |
18,52 |
18,52 |
|
SUDAN |
|
|
|
|
|
144,19 |
|
141,39 |
|
|
144,19 |
144,05 |
141,39 |
|
SWAZILAND |
25,15 |
25,15 |
100,00 % |
24,04 |
95,55 % |
17,42 |
69,25 % |
17,26 |
68,63 % |
|
42,57 |
42,55 |
41,30 |
|
TANZANIA |
156,19 |
156,19 |
100,00 % |
155,75 |
99,72 % |
224,36 |
143,65 % |
224,34 |
143,64 % |
|
380,55 |
380,28 |
380,09 |
|
TOGO |
59,67 |
59,67 |
100,00 % |
50,83 |
85,19 % |
25,75 |
43,16 % |
25,13 |
42,11 % |
|
85,42 |
82,93 |
75,96 |
|
UGANDA |
154,51 |
154,51 |
100,00 % |
154,12 |
99,74 % |
244,46 |
158,21 % |
244,42 |
158,19 % |
|
398,97 |
398,96 |
398,54 |
|
NIGERIA |
237,18 |
237,18 |
100,00 % |
195,59 |
82,46 % |
14,74 |
6,22 % |
14,43 |
6,08 % |
|
251,93 |
233,18 |
210,02 |
|
ZAMBIA |
99,94 |
99,94 |
100,00 % |
99,94 |
100,00 % |
215,59 |
215,72 % |
215,58 |
215,71 % |
|
315,53 |
315,52 |
315,51 |
|
ZIMBABWE |
84,07 |
84,07 |
100,00 % |
84,07 |
100,00 % |
102,67 |
122,12 % |
102,67 |
122,12 % |
|
186,74 |
186,74 |
186,74 |
|
DEMOCRATIC REPUBLIC CONGO |
154,53 |
154,53 |
100,00 % |
122,29 |
79,14 % |
41,43 |
26,81 % |
41,22 |
26,67 % |
|
195,97 |
181,34 |
163,51 |
|
* TOTAL AFRICA |
3 780,19 |
3 780,19 |
100 % |
3 664,86 |
97 % |
4 112,00 |
109 % |
4 079,61 |
108 % |
|
7 892,18 |
7 841,66 |
7 744,47 |
|
ANTIGUA-BARBUDA |
2,94 |
2,94 |
100,00 % |
2,94 |
100,00 % |
0,70 |
23,96 % |
0,70 |
23,96 % |
|
3,64 |
3,64 |
3,64 |
|
BARBADOS |
2,86 |
2,86 |
100,00 % |
2,86 |
100,00 % |
6,34 |
222,19 % |
6,34 |
222,19 % |
|
9,20 |
9,20 |
9,20 |
|
BELIZE |
8,98 |
8,98 |
100,00 % |
8,98 |
100,00 % |
8,75 |
97,51 % |
8,75 |
97,51 % |
|
17,73 |
17,73 |
17,73 |
|
BAHAMAS |
4,29 |
4,29 |
100,00 % |
4,29 |
100,00 % |
7,27 |
169,42 % |
7,27 |
169,42 % |
|
11,57 |
11,57 |
11,57 |
|
DOMINICAN REPUBLIC |
80,72 |
80,72 |
100,00 % |
80,01 |
99,12 % |
68,77 |
85,19 % |
68,77 |
85,19 % |
|
149,49 |
149,43 |
148,77 |
|
DOMINICA |
5,36 |
5,36 |
100,00 % |
4,34 |
80,98 % |
19,59 |
365,64 % |
19,59 |
365,64 % |
|
24,95 |
24,27 |
23,93 |
|
GRENADA |
5,38 |
5,38 |
100,00 % |
5,38 |
100,00 % |
14,78 |
274,96 % |
14,78 |
274,96 % |
|
20,16 |
20,16 |
20,16 |
|
GUYANA (STATE) |
31,68 |
31,68 |
100,00 % |
31,68 |
100,00 % |
31,75 |
100,21 % |
31,75 |
100,21 % |
|
63,44 |
63,44 |
63,44 |
|
HAITI |
80,60 |
80,60 |
100,00 % |
80,57 |
99,97 % |
68,37 |
84,82 % |
62,37 |
77,38 % |
|
148,96 |
148,94 |
142,94 |
|
JAMAICA |
46,39 |
46,39 |
100,00 % |
46,35 |
99,92 % |
144,11 |
310,65 % |
91,38 |
196,98 % |
|
190,51 |
190,04 |
137,73 |
|
ST CHRISTOPHE (KITTS) & NEVIS |
2,49 |
2,49 |
100,00 % |
2,48 |
99,77 % |
2,23 |
89,74 % |
2,23 |
89,59 % |
|
4,72 |
4,72 |
4,71 |
|
SAINT LUCIA |
1,94 |
1,94 |
100,00 % |
1,77 |
91,48 % |
30,75 |
1587,38 % |
30,75 |
1587,38 % |
|
32,69 |
32,53 |
32,53 |
|
SURINAME |
16,12 |
16,12 |
100,00 % |
16,10 |
99,87 % |
5,74 |
35,57 % |
5,73 |
35,56 % |
|
21,86 |
21,86 |
21,83 |
|
SAINT VINCENT & GRENADINES |
3,22 |
3,22 |
100,00 % |
3,22 |
100,00 % |
36,67 |
1139,76 % |
36,67 |
1139,76 % |
|
39,89 |
39,89 |
39,89 |
|
TRINIDAD & TOBAGO |
9,27 |
9,27 |
100,00 % |
9,27 |
100,00 % |
32,71 |
352,86 % |
30,71 |
331,28 % |
|
41,98 |
41,98 |
39,98 |
|
* TOTAL CARIBBEAN |
302,23 |
302,23 |
100 % |
300,24 |
99 % |
478,55 |
158 % |
417,81 |
138 % |
|
780,78 |
779,38 |
718,05 |
|
FIJI |
21,90 |
21,90 |
100,00 % |
21,87 |
99,87 % |
3,20 |
14,63 % |
3,14 |
14,32 % |
|
25,10 |
25,00 |
25,00 |
|
KIRIBATI |
5,83 |
5,83 |
100,00 % |
5,83 |
100,00 % |
1,78 |
30,51 % |
1,78 |
30,51 % |
|
7,60 |
7,60 |
7,60 |
|
PAPUA-NEW GUINEA |
42,96 |
42,96 |
100,00 % |
42,82 |
99,66 % |
134,97 |
314,13 % |
134,97 |
314,13 % |
|
177,93 |
177,78 |
177,78 |
|
SOLOMON ISLANDS |
19,55 |
19,55 |
100,00 % |
19,52 |
99,84 % |
9,88 |
50,53 % |
9,88 |
50,53 % |
|
29,42 |
29,42 |
29,39 |
|
TONGA |
5,56 |
5,56 |
100,00 % |
5,56 |
100,00 % |
3,26 |
58,69 % |
3,26 |
58,69 % |
|
8,82 |
8,82 |
8,82 |
|
TUVALU |
1,06 |
1,06 |
100,00 % |
1,06 |
100,00 % |
0,58 |
54,27 % |
0,38 |
35,42 % |
|
1,64 |
1,64 |
1,44 |
|
VANUATU |
7,44 |
7,44 |
100,00 % |
7,44 |
100,00 % |
4,01 |
53,87 % |
4,01 |
53,87 % |
|
11,45 |
11,45 |
11,45 |
|
SAMOA |
8,92 |
8,92 |
100,00 % |
8,92 |
100,00 % |
11,62 |
130,32 % |
11,62 |
130,32 % |
|
20,54 |
20,54 |
20,54 |
|
* TOTAL PACIFIC |
113,21 |
113,21 |
100 % |
113,00 |
100 % |
169,29 |
150 % |
169,03 |
149 % |
|
282,50 |
282,25 |
282,03 |
|
INTRA ACP BUDGET |
50,00 |
50,00 |
100,00 % |
|
0,00 % |
|
0,00 % |
|
0,00 % |
50,00 |
50,00 |
50,00 |
50,00 |
|
ACP REGIONAL COOPERATION |
1 081,31 |
1 081,31 |
100,00 % |
1 053,05 |
97,39 % |
98,52 |
9,11 % |
97,04 |
8,97 % |
|
1 179,84 |
1 166,68 |
1 150,10 |
|
* TOTAL ACP REGIONAL COOPERATION |
1 131,31 |
1 131,31 |
100 % |
1 053,05 |
93 % |
98,52 |
9 % |
97,04 |
9 % |
50,00 |
1 229,84 |
1 216,68 |
1 200,10 |
|
ALL ACP COUNTRIES |
|
|
|
|
|
260,49 |
|
260,07 |
|
|
260,49 |
260,33 |
260,07 |
|
ADMINISTRATIVE & FINANCIAL COSTS |
2,66 |
2,66 |
100,00 % |
2,66 |
100,00 % |
5,05 |
189,77 % |
5,05 |
189,77 % |
|
7,72 |
7,72 |
7,72 |
|
* TOTAL ACP |
5 329,60 |
5 329,60 |
100 % |
5 133,82 |
96 % |
5 123,91 |
96 % |
5 028,61 |
94 % |
50,00 |
10 453,51 |
10 388,02 |
10 212,43 |
|
MAYOTTE |
6,69 |
6,69 |
100,00 % |
6,69 |
100,00 % |
5,39 |
80,57 % |
5,39 |
80,57 % |
|
12,08 |
12,08 |
12,08 |
|
NEW CALEDONIA |
12,44 |
12,44 |
100,00 % |
12,43 |
99,87 % |
11,59 |
93,13 % |
11,14 |
89,50 % |
|
24,03 |
23,82 |
23,56 |
|
FRENCH POLYNESIA |
12,96 |
12,96 |
100,00 % |
12,82 |
98,93 % |
7,37 |
56,90 % |
7,37 |
56,90 % |
|
20,33 |
20,24 |
20,20 |
|
SAINT PIERRE & MIQUELON |
3,00 |
3,00 |
100,00 % |
3,00 |
100,00 % |
0,54 |
17,94 % |
0,54 |
17,94 % |
|
3,54 |
3,54 |
3,54 |
|
FRENCH SOUTHERN TERRITORIES |
0,00 |
0,00 |
100,00 % |
0,00 |
100,00 % |
|
0,00 % |
|
0,00 % |
|
0,00 |
0,00 |
0,00 |
|
WALLIS & FUTUNA |
4,57 |
4,57 |
100,00 % |
4,57 |
100,00 % |
0,09 |
1,99 % |
0,09 |
1,99 % |
|
4,66 |
4,66 |
4,66 |
|
* TOTAL FRENCH OCT |
39,66 |
39,66 |
100 % |
39,51 |
100 % |
24,98 |
63 % |
24,53 |
62 % |
|
64,64 |
64,34 |
64,04 |
|
ARUBA |
6,99 |
6,99 |
100,00 % |
6,97 |
99,60 % |
0,17 |
2,44 % |
0,17 |
2,44 % |
|
7,16 |
7,14 |
7,14 |
|
DUTCH ANTILLES |
14,63 |
14,63 |
100,00 % |
14,25 |
97,39 % |
10,44 |
71,37 % |
10,44 |
71,36 % |
|
25,08 |
25,08 |
24,69 |
|
* TOTAL DUTCH OCT |
21,63 |
21,63 |
100 % |
21,22 |
98 % |
10,61 |
49 % |
10,61 |
49 % |
|
32,24 |
32,21 |
31,83 |
|
ANGUILLA |
2,72 |
2,72 |
100,00 % |
2,72 |
100,00 % |
0,35 |
12,69 % |
0,35 |
12,69 % |
|
3,07 |
3,07 |
3,07 |
|
CAYMANS |
|
|
|
|
|
1,17 |
|
1,17 |
|
|
1,17 |
1,17 |
1,17 |
|
FALKLANDS |
|
|
|
|
|
5,69 |
|
5,69 |
|
|
5,69 |
5,69 |
5,69 |
|
MONTSERRAT |
3,65 |
3,65 |
100,00 % |
3,65 |
100,00 % |
0,59 |
16,13 % |
0,59 |
16,13 % |
|
4,24 |
4,24 |
4,24 |
|
SAINT HELENA |
1,10 |
1,10 |
100,00 % |
1,10 |
100,00 % |
0,05 |
4,42 % |
0,05 |
4,42 % |
|
1,15 |
1,15 |
1,15 |
|
TURKS & CAICOS |
3,89 |
3,89 |
100,00 % |
3,89 |
99,99 % |
0,06 |
1,47 % |
0,06 |
1,47 % |
|
3,95 |
3,95 |
3,95 |
|
BRITISH VIRGIN ISLANDS |
2,40 |
2,40 |
100,00 % |
2,39 |
99,81 % |
1,41 |
58,66 % |
1,41 |
58,66 % |
|
3,80 |
3,80 |
3,80 |
|
* TOTAL BRITISH OCT |
13,76 |
13,76 |
100 % |
13,75 |
100 % |
9,31 |
68 % |
9,31 |
68 % |
|
23,07 |
23,06 |
23,06 |
|
OCT REGIONAL COOPERATION |
8,12 |
8,12 |
100,00 % |
8,02 |
98,78 % |
0,47 |
5,83 % |
0,44 |
5,37 % |
|
8,59 |
8,56 |
8,46 |
|
* OCT REGIONAL COOPERATION |
8,12 |
8,12 |
100 % |
8,02 |
99 % |
0,47 |
6 % |
0,44 |
5 % |
|
8,59 |
8,56 |
8,46 |
|
ALL OCT |
|
|
|
|
|
0,96 |
|
0,96 |
|
|
0,96 |
0,96 |
0,96 |
|
* TOTAL OCT |
83,17 |
83,17 |
100 % |
82,50 |
99 % |
46,34 |
56 % |
45,85 |
55 % |
|
129,50 |
129,13 |
128,34 |
|
* TOTAL ACP + OCT |
5 412,77 |
5 412,77 |
100 % |
5 216,32 |
96 % |
5 170,24 |
96 % |
5 074,46 |
94 % |
50,00 |
10 583,01 |
10 517,15 |
10 340,78 |
Table 3.1.2
7th EDF
Annual 2007
GLOBAL SITUATION BY STATE
|
(EUR million) |
|||||||||||||
|
|
Lome |
Cotonou |
Total |
||||||||||
|
NIP |
National indicative programmes |
Other aid |
Regional decisions |
||||||||||
|
Decisions |
As % of Nip |
Payments |
As % of Nip |
Decisions |
As % of Nip |
Payments |
As % of Nip |
Decisions |
Assigned funds |
Payments |
|||
|
ANGOLA |
109,43 |
– 0,00 |
0,00 % |
1,36 |
1,24 % |
– 0,07 |
– 0,07 % |
|
0,00 % |
|
– 0,07 |
– 1,11 |
1,36 |
|
BENIN |
88,02 |
– 0,34 |
– 0,39 % |
0,38 |
0,43 % |
|
0,00 % |
|
0,00 % |
|
– 0,34 |
0,12 |
0,38 |
|
BURKINA FASO |
147,17 |
|
0,00 % |
1,59 |
1,08 % |
|
0,00 % |
|
0,00 % |
|
|
0,47 |
1,59 |
|
BOTSWANA |
30,09 |
|
0,00 % |
|
0,00 % |
|
0,00 % |
|
0,00 % |
|
|
– 0,01 |
|
|
BURUNDI |
78,16 |
– 6,03 |
– 7,72 % |
– 0,59 |
– 0,75 % |
– 0,24 |
– 0,31 % |
8,23 |
10,53 % |
|
– 6,27 |
– 5,55 |
7,65 |
|
CENTRAL AFRICAN REPUBLIC |
71,28 |
|
0,00 % |
– 0,02 |
– 0,02 % |
|
0,00 % |
|
0,00 % |
|
|
– 0,07 |
– 0,02 |
|
CHAD |
98,93 |
|
0,00 % |
0,24 |
0,24 % |
|
0,00 % |
|
0,00 % |
|
|
0,12 |
0,24 |
|
CAMEROON |
104,41 |
– 0,03 |
– 0,03 % |
– 0,00 |
0,00 % |
– 2,00 |
– 1,92 % |
|
0,00 % |
|
– 2,03 |
– 2,03 |
– 0,00 |
|
CONGO |
29,64 |
– 0,10 |
– 0,32 % |
0,06 |
0,21 % |
|
0,00 % |
|
0,00 % |
|
– 0,10 |
– 0,57 |
0,06 |
|
COMOROS |
20,24 |
|
0,00 % |
– 0,07 |
– 0,35 % |
|
0,00 % |
|
0,00 % |
|
|
– 0,07 |
– 0,07 |
|
CAPE VERDE |
24,06 |
– 0,30 |
– 1,26 % |
|
0,00 % |
|
0,00 % |
|
0,00 % |
|
– 0,30 |
0,52 |
|
|
DJIBOUTI |
17,43 |
|
0,00 % |
|
0,00 % |
|
0,00 % |
|
0,00 % |
|
|
|
|
|
EQUATORIAL GUINEA |
12,12 |
|
0,00 % |
|
0,00 % |
|
0,00 % |
|
0,00 % |
|
|
|
|
|
ERITREA |
46,15 |
– 1,03 |
– 2,23 % |
0,14 |
0,30 % |
|
0,00 % |
|
0,00 % |
|
– 1,03 |
– 0,35 |
0,14 |
|
ETHIOPIA |
204,83 |
– 6,02 |
– 2,94 % |
11,97 |
5,84 % |
– 0,27 |
– 0,13 % |
3,28 |
1,60 % |
|
– 6,29 |
– 1,21 |
15,25 |
|
GABON |
29,31 |
– 0,20 |
– 0,69 % |
|
0,00 % |
|
0,00 % |
|
0,00 % |
|
– 0,20 |
– 0,05 |
|
|
GHANA |
95,28 |
– 0,61 |
– 0,64 % |
0,26 |
0,27 % |
|
0,00 % |
|
0,00 % |
|
– 0,61 |
– 0,57 |
0,26 |
|
GAMBIA |
21,57 |
– 0,14 |
– 0,64 % |
|
0,00 % |
– 0,14 |
– 0,65 % |
0,02 |
0,10 % |
|
– 0,28 |
– 0,14 |
0,02 |
|
GUINEA– BISSAU |
35,17 |
– 1,38 |
– 3,91 % |
0,01 |
0,01 % |
– 0,09 |
– 0,26 % |
|
0,00 % |
|
– 1,47 |
– 0,54 |
0,01 |
|
GUINEA |
121,70 |
– 0,01 |
– 0,01 % |
|
0,00 % |
– 9,77 |
– 8,03 % |
3,02 |
2,48 % |
|
– 9,78 |
– 3,74 |
3,02 |
|
CÔTE D'IVOIRE |
103,23 |
– 0,19 |
– 0,18 % |
|
0,00 % |
|
0,00 % |
|
0,00 % |
|
– 0,19 |
– 0,19 |
|
|
KENYA |
129,89 |
– 0,60 |
– 0,46 % |
– 0,47 |
– 0,36 % |
|
0,00 % |
0,08 |
0,06 % |
|
– 0,60 |
– 0,97 |
– 0,39 |
|
LIBERIA |
|
|
|
|
|
|
|
|
|
|
|
|
|
|
LESOTHO |
45,41 |
– 0,30 |
– 0,66 % |
|
0,00 % |
– 0,10 |
– 0,23 % |
|
0,00 % |
|
– 0,41 |
– 0,24 |
|
|
MADAGASCAR |
130,33 |
|
0,00 % |
|
0,00 % |
|
0,00 % |
|
0,00 % |
|
|
|
|
|
MALAWI |
124,48 |
– 1,42 |
– 1,14 % |
0,16 |
0,13 % |
|
0,00 % |
|
0,00 % |
|
– 1,42 |
– 0,66 |
0,16 |
|
MAURITIUS |
31,63 |
– 0,05 |
– 0,16 % |
– 0,00 |
0,00 % |
|
0,00 % |
|
0,00 % |
|
– 0,05 |
– 0,04 |
– 0,00 |
|
MAURITANIA |
62,73 |
|
0,00 % |
0,05 |
0,08 % |
|
0,00 % |
|
0,00 % |
|
|
|
0,05 |
|
MALI |
141,35 |
|
0,00 % |
0,12 |
0,08 % |
|
0,00 % |
3,31 |
2,34 % |
|
|
1,41 |
3,43 |
|
MOZAMBIQUE |
161,32 |
– 1,07 |
– 0,66 % |
0,52 |
0,32 % |
– 0,10 |
– 0,06 % |
– 0,00 |
0,00 % |
|
– 1,17 |
– 0,85 |
0,52 |
|
NAMIBIA |
46,81 |
|
0,00 % |
0,00 |
0,00 % |
|
0,00 % |
|
0,00 % |
|
|
– 0,01 |
0,00 |
|
NIGER |
138,22 |
|
0,00 % |
|
0,00 % |
– 0,31 |
– 0,22 % |
0,10 |
0,07 % |
|
– 0,31 |
– 0,15 |
0,10 |
|
RWANDA |
115,86 |
|
0,00 % |
0,37 |
0,32 % |
|
0,00 % |
|
0,00 % |
|
|
0,01 |
0,37 |
|
SENEGAL |
106,05 |
– 0,53 |
– 0,50 % |
0,03 |
0,02 % |
– 0,75 |
– 0,71 % |
|
0,00 % |
|
– 1,28 |
– 1,57 |
0,03 |
|
SEYCHELLES |
5,26 |
|
0,00 % |
|
0,00 % |
|
0,00 % |
|
0,00 % |
|
|
|
|
|
SIERRA LEONE |
73,47 |
– 2,68 |
– 3,64 % |
0,53 |
0,72 % |
|
0,00 % |
|
0,00 % |
|
– 2,68 |
– 1,80 |
0,53 |
|
SOMALIA |
|
|
|
|
|
|
|
|
|
|
|
|
|
|
SAO TOME & PRINCIPE |
7,89 |
– 0,08 |
– 0,95 % |
– 0,00 |
– 0,06 % |
|
0,00 % |
|
0,00 % |
|
– 0,08 |
– 0,07 |
– 0,00 |
|
SUDAN |
|
|
|
|
|
|
|
|
|
|
|
|
|
|
SWAZILAND |
25,15 |
|
0,00 % |
0,10 |
0,39 % |
|
0,00 % |
|
0,00 % |
|
|
0,04 |
0,10 |
|
TANZANIA |
156,19 |
|
0,00 % |
– 0,05 |
– 0,03 % |
|
0,00 % |
– 0,01 |
0,00 % |
|
|
– 0,26 |
– 0,06 |
|
TOGO |
59,67 |
– 1,88 |
– 3,16 % |
3,56 |
5,97 % |
– 0,19 |
– 0,32 % |
0,29 |
0,49 % |
|
– 2,07 |
1,82 |
3,86 |
|
UGANDA |
154,51 |
– 0,40 |
– 0,26 % |
0,49 |
0,32 % |
– 0,15 |
– 0,10 % |
|
0,00 % |
|
– 0,55 |
0,06 |
0,49 |
|
NIGERIA |
237,18 |
– 8,19 |
– 3,45 % |
18,60 |
7,84 % |
|
0,00 % |
|
0,00 % |
|
– 8,19 |
8,67 |
18,60 |
|
ZAMBIA |
99,94 |
– 0,40 |
– 0,40 % |
|
0,00 % |
|
0,00 % |
|
0,00 % |
|
– 0,40 |
– 0,23 |
|
|
ZIMBABWE |
84,07 |
– 0,10 |
– 0,12 % |
– 0,05 |
– 0,06 % |
– 0,01 |
– 0,01 % |
– 0,01 |
– 0,01 % |
|
– 0,11 |
– 0,06 |
– 0,06 |
|
DEMOCRATIC REPUBLIC CONGO |
154,53 |
– 1,11 |
– 0,72 % |
15,91 |
10,30 % |
– 0,42 |
– 0,27 % |
|
0,00 % |
|
– 1,53 |
16,47 |
15,91 |
|
* TOTAL AFRICA |
3 780,19 |
– 35,18 |
– 1 % |
55,19 |
1 % |
– 14,62 |
0 % |
18,32 |
0 % |
|
– 49,81 |
6,59 |
73,51 |
|
ANTIGUA-BARBUDA |
2,94 |
|
0,00 % |
|
0,00 % |
|
0,00 % |
|
0,00 % |
|
|
|
|
|
BARBADOS |
2,86 |
|
0,00 % |
|
0,00 % |
|
0,00 % |
|
0,00 % |
|
|
|
|
|
BELIZE |
8,98 |
|
0,00 % |
|
0,00 % |
|
0,00 % |
|
0,00 % |
|
|
|
|
|
BAHAMAS |
4,29 |
|
0,00 % |
|
0,00 % |
|
0,00 % |
|
0,00 % |
|
|
|
|
|
DOMINICAN REPUBLIC |
80,72 |
|
0,00 % |
– 0,26 |
– 0,32 % |
|
0,00 % |
|
0,00 % |
|
|
– 0,00 |
– 0,26 |
|
DOMINICA |
5,36 |
|
0,00 % |
0,08 |
1,58 % |
|
0,00 % |
|
0,00 % |
|
|
0,03 |
0,08 |
|
GRENADA |
5,38 |
|
0,00 % |
|
0,00 % |
|
0,00 % |
|
0,00 % |
|
|
|
|
|
GUYANA (STATE) |
31,68 |
– 0,85 |
– 2,69 % |
– 0,08 |
– 0,26 % |
|
0,00 % |
|
0,00 % |
|
– 0,85 |
– 0,50 |
– 0,08 |
|
HAITI |
80,60 |
– 0,49 |
– 0,61 % |
|
0,00 % |
|
0,00 % |
|
0,00 % |
|
– 0,49 |
– 0,11 |
|
|
JAMAICA |
46,39 |
– 0,02 |
– 0,05 % |
0,04 |
0,10 % |
– 1,15 |
– 2,47 % |
14,03 |
30,25 % |
|
– 1,17 |
– 1,52 |
14,08 |
|
ST CHRISTOPHE (KITTS) & NEVIS |
2,49 |
|
0,00 % |
|
0,00 % |
|
0,00 % |
|
0,00 % |
|
|
|
|
|
SAINT LUCIA |
1,94 |
|
0,00 % |
|
0,00 % |
|
0,00 % |
|
0,00 % |
|
|
– 0,00 |
|
|
SURINAME |
16,12 |
– 0,73 |
– 4,56 % |
– 0,01 |
– 0,09 % |
– 0,40 |
– 2,49 % |
|
0,00 % |
|
– 1,14 |
– 0,39 |
– 0,01 |
|
SAINT VINCENT & GRENADINES |
3,22 |
|
0,00 % |
|
0,00 % |
|
0,00 % |
|
0,00 % |
|
|
|
|
|
TRINIDAD & TOBAGO |
9,27 |
|
0,00 % |
|
0,00 % |
|
0,00 % |
1,00 |
10,79 % |
|
|
|
1,00 |
|
* TOTAL CARIBBEAN |
302,23 |
– 2,10 |
– 1 % |
– 0,23 |
0 % |
– 1,55 |
– 1 % |
15,03 |
5 % |
|
– 3,65 |
– 2,49 |
14,81 |
|
FIJI |
21,90 |
|
0,00 % |
|
0,00 % |
|
0,00 % |
|
0,00 % |
|
|
|
|
|
KIRIBATI |
5,83 |
|
0,00 % |
|
0,00 % |
|
0,00 % |
|
0,00 % |
|
|
|
|
|
PAPUA– NEW GUINEA |
42,96 |
– 0,85 |
– 1,99 % |
|
0,00 % |
– 0,00 |
– 0,01 % |
|
0,00 % |
|
– 0,86 |
– 0,29 |
|
|
SOLOMON ISLANDS |
19,55 |
– 0,02 |
– 0,09 % |
– 0,00 |
– 0,01 % |
|
0,00 % |
|
0,00 % |
|
– 0,02 |
– 0,02 |
– 0,00 |
|
TONGA |
5,56 |
– 0,21 |
– 3,80 % |
– 0,02 |
– 0,37 % |
|
0,00 % |
|
0,00 % |
|
– 0,21 |
– 0,21 |
– 0,02 |
|
TUVALU |
1,06 |
|
0,00 % |
|
0,00 % |
|
0,00 % |
|
0,00 % |
|
|
|
|
|
VANUATU |
7,44 |
|
0,00 % |
|
0,00 % |
|
0,00 % |
|
0,00 % |
|
|
|
|
|
SAMOA |
8,92 |
|
0,00 % |
|
0,00 % |
|
0,00 % |
|
0,00 % |
|
|
|
|
|
* TOTAL PACIFIC |
113,21 |
– 1,08 |
– 1 % |
– 0,02 |
0 % |
– 0,00 |
0 % |
|
0 % |
|
– 1,09 |
– 0,52 |
– 0,02 |
|
INTRA ACP BUDGET |
50,00 |
|
0,00 % |
|
0,00 % |
|
0,00 % |
|
0,00 % |
|
|
|
|
|
ACP REGIONAL COOPERATION |
1 081,31 |
– 12,44 |
– 1,15 % |
7,86 |
0,73 % |
– 0,04 |
0,00 % |
– 0,49 |
– 0,05 % |
|
– 12,48 |
– 6,21 |
7,37 |
|
* TOTAL ACP REGIONAL COOPERATION |
1 131,31 |
– 12,44 |
– 1 % |
7,86 |
1 % |
– 0,04 |
0 % |
– 0,49 |
0 % |
|
– 12,48 |
– 6,21 |
7,37 |
|
ALL ACP COUNTRIES |
|
|
|
|
|
– 1,47 |
|
|
|
|
– 1,47 |
– 1,61 |
|
|
ADMINISTRATIVE & FINANCIAL COSTS |
2,66 |
|
0,00 % |
|
0,00 % |
– 0,04 |
– 1,65 % |
|
0,00 % |
|
– 0,04 |
– 0,04 |
|
|
* TOTAL ACP |
5 329,60 |
– 50,80 |
– 1 % |
62,80 |
1 % |
– 17,73 |
0 % |
32,86 |
1 % |
|
– 68,54 |
– 4,28 |
95,66 |
|
MAYOTTE |
6,69 |
|
0,00 % |
|
0,00 % |
|
0,00 % |
|
0,00 % |
|
|
|
|
|
NEW CALEDONIA |
12,44 |
|
0,00 % |
|
0,00 % |
|
0,00 % |
0,76 |
6,13 % |
|
|
0,01 |
0,76 |
|
FRENCH POLYNESIA |
12,96 |
|
0,00 % |
|
0,00 % |
|
0,00 % |
|
0,00 % |
|
|
0,05 |
|
|
SAINT PIERRE & MIQUELON |
3,00 |
|
0,00 % |
|
0,00 % |
|
0,00 % |
|
0,00 % |
|
|
|
|
|
FRENCH SOUTHERN TERRITORIES |
0,00 |
|
0,00 % |
|
0,00 % |
|
0,00 % |
|
0,00 % |
|
|
|
|
|
WALLIS & FUTUNA |
4,57 |
|
0,00 % |
|
0,00 % |
|
0,00 % |
|
0,00 % |
|
|
|
|
|
NAT. AID PROGR. RESERVE OCT F |
|
|
0,00 % |
|
0,00 % |
|
0,00 % |
|
0,00 % |
|
|
|
|
|
* TOTAL FRENCH OCT |
39,66 |
|
0 % |
|
0 % |
|
0 % |
0,76 |
2 % |
|
|
0,06 |
0,76 |
|
ARUBA |
6,99 |
– 0,02 |
– 0,22 % |
|
0,00 % |
|
0,00 % |
|
0,00 % |
|
– 0,02 |
– 0,03 |
|
|
DUTCH ANTILLES |
14,63 |
– 1,66 |
– 11,36 % |
0,24 |
1,63 % |
– 0,97 |
– 6,60 % |
|
0,00 % |
|
– 2,63 |
– 1,10 |
0,24 |
|
* TOTAL DUTCH OCT |
21,63 |
– 1,68 |
– 8 % |
0,24 |
1 % |
– 0,97 |
– 4 % |
|
0 % |
|
– 2,64 |
– 1,13 |
0,24 |
|
ANGUILLA |
2,72 |
|
0,00 % |
|
0,00 % |
|
0,00 % |
|
0,00 % |
|
|
|
|
|
CAYMANS |
|
|
|
|
|
|
|
|
|
|
|
|
|
|
FALKLANDS |
|
|
|
|
|
|
|
|
|
|
|
|
|
|
MONTSERRAT |
3,65 |
– 0,14 |
– 3,90 % |
|
0,00 % |
|
0,00 % |
|
0,00 % |
|
– 0,14 |
– 0,14 |
|
|
SAINT HELENA |
1,10 |
|
0,00 % |
|
0,00 % |
|
0,00 % |
|
0,00 % |
|
|
|
|
|
TURKS & CAICOS |
3,89 |
|
0,00 % |
|
0,00 % |
|
0,00 % |
|
0,00 % |
|
|
|
|
|
BRITISH VIRGIN ISLANDS |
2,40 |
|
0,00 % |
|
0,00 % |
|
0,00 % |
|
0,00 % |
|
|
|
|
|
* TOTAL BRITISH OCT |
13,76 |
– 0,14 |
– 1,03 % |
|
0,00 % |
|
0,00 % |
|
0,00 % |
|
– 0,14 |
– 0,14 |
|
|
OCT REGIONAL COOPERATION |
8,12 |
– 0,59 |
– 7,28 % |
|
0,00 % |
|
0,00 % |
|
0,00 % |
|
– 0,59 |
– 0,02 |
|
|
* OCT REGIONAL COOPERATION |
8,12 |
– 0,59 |
– 7 % |
|
0 % |
|
0 % |
|
0 % |
|
– 0,59 |
– 0,02 |
|
|
ALL OCT |
|
|
|
|
|
|
|
|
|
|
|
|
|
|
* TOTAL OCT |
83,17 |
– 2,41 |
– 3 % |
0,24 |
0 % |
– 0,97 |
– 1 % |
0,76 |
1 % |
|
– 3,38 |
– 1,23 |
1,00 |
|
* TOTAL ACP + OCT |
5 412,77 |
– 53,21 |
– 1 % |
63,04 |
1 % |
– 18,70 |
0 % |
33,62 |
1 % |
|
– 71,91 |
– 5,51 |
96,66 |
Table 3.1.3
7th EDF
Decisions cumulative 2007
SITUATION BY INSTRUMENT AND STATE
|
(EUR million) |
||||||||||||||
|
|
Lome |
Total |
Cotonou |
Total state |
||||||||||
|
NIP |
Non NIP |
|||||||||||||
|
Grants |
Interest subsidies |
Emergency aid |
Refugee aid |
Risk capital |
Stabex |
Sysmin |
Tranfers from others funds |
SAF |
Heavily indebted poor countries |
Total non Nip |
||||
|
ANGOLA |
109,43 |
|
28,31 |
9,41 |
1,91 |
|
|
|
|
|
39,63 |
149,07 |
|
149,07 |
|
BENIN |
88,02 |
|
0,92 |
|
12,00 |
1,31 |
|
7,12 |
39,10 |
|
60,45 |
148,46 |
|
148,46 |
|
BURKINA FASO |
147,17 |
|
0,84 |
|
22,44 |
18,63 |
21,60 |
2,87 |
83,41 |
|
149,79 |
296,96 |
|
296,96 |
|
BOTSWANA |
30,09 |
16,45 |
|
0,23 |
2,53 |
|
33,72 |
2,23 |
|
|
55,15 |
85,24 |
|
85,24 |
|
BURUNDI |
78,16 |
|
17,05 |
|
|
54,56 |
|
2,59 |
11,92 |
|
86,11 |
164,27 |
|
164,27 |
|
CENTRAL AFRICAN REPUBLIC |
71,28 |
|
|
0,23 |
|
18,37 |
|
4,66 |
9,85 |
|
33,11 |
104,40 |
|
104,40 |
|
CHAD |
98,93 |
|
0,98 |
|
|
11,31 |
|
2,20 |
19,58 |
|
34,07 |
133,00 |
|
133,00 |
|
CAMEROON |
104,41 |
0,27 |
|
|
6,61 |
244,19 |
|
3,04 |
33,61 |
|
287,71 |
392,13 |
|
392,13 |
|
CONGO |
29,64 |
|
|
|
|
|
|
0,66 |
6,60 |
|
7,26 |
36,90 |
|
36,90 |
|
COMOROS |
20,24 |
|
|
|
2,43 |
4,29 |
|
0,60 |
6,50 |
|
13,82 |
34,06 |
|
34,06 |
|
CAPE VERDE |
24,06 |
|
0,18 |
|
11,71 |
1,20 |
|
0,25 |
|
|
13,34 |
37,40 |
|
37,40 |
|
DJIBOUTI |
17,43 |
|
0,42 |
0,47 |
0,50 |
|
|
0,19 |
4,10 |
|
5,67 |
23,10 |
|
23,10 |
|
EQUATORIAL GUINEA |
12,12 |
|
|
|
|
7,60 |
|
0,38 |
|
|
7,98 |
20,10 |
|
20,10 |
|
ERITREA |
46,15 |
|
1,75 |
3,73 |
8,00 |
|
|
|
|
|
13,48 |
59,62 |
|
59,62 |
|
ETHIOPIA |
204,83 |
|
6,95 |
7,07 |
68,51 |
179,49 |
|
3,80 |
78,13 |
|
343,94 |
548,78 |
|
548,78 |
|
GABON |
29,31 |
0,40 |
|
|
0,60 |
|
13,96 |
1,65 |
8,15 |
|
24,75 |
54,06 |
|
54,06 |
|
GHANA |
95,28 |
11,81 |
1,28 |
|
1,65 |
50,58 |
0,15 |
11,49 |
87,06 |
|
164,02 |
259,30 |
|
259,30 |
|
GAMBIA |
21,57 |
|
|
|
4,30 |
0,35 |
|
0,58 |
6,20 |
|
11,44 |
33,01 |
|
33,01 |
|
GUINEA-BISSAU |
35,17 |
|
1,20 |
|
4,63 |
1,28 |
|
5,35 |
9,48 |
|
21,94 |
57,11 |
|
57,11 |
|
GUINEA |
121,70 |
3,28 |
2,37 |
1,49 |
48,06 |
|
70,40 |
7,56 |
25,66 |
|
158,82 |
280,52 |
|
280,52 |
|
CÔTE D'IVOIRE |
103,23 |
6,12 |
0,83 |
2,53 |
11,55 |
269,68 |
|
3,66 |
77,12 |
|
371,49 |
474,72 |
|
474,72 |
|
KENYA |
129,89 |
10,65 |
9,31 |
0,86 |
44,53 |
84,80 |
|
5,81 |
|
|
155,96 |
285,85 |
|
285,85 |
|
LIBERIA |
|
|
16,09 |
4,32 |
|
|
|
12,78 |
|
|
33,20 |
33,20 |
|
33,20 |
|
LESOTHO |
45,41 |
6,89 |
|
|
17,18 |
3,71 |
|
4,98 |
21,59 |
|
54,34 |
99,75 |
|
99,75 |
|
MADAGASCAR |
130,33 |
|
1,65 |
|
12,71 |
55,50 |
|
5,90 |
10,80 |
|
86,55 |
216,89 |
|
216,89 |
|
MALAWI |
124,48 |
|
1,30 |
14,34 |
44,79 |
8,69 |
|
11,76 |
52,34 |
|
133,23 |
257,71 |
|
257,71 |
|
MAURITIUS |
31,63 |
12,15 |
|
|
5,10 |
|
|
0,60 |
|
|
17,85 |
49,48 |
|
49,48 |
|
MAURITANIA |
62,73 |
3,47 |
1,36 |
0,08 |
18,40 |
16,15 |
57,85 |
6,00 |
24,46 |
|
127,77 |
190,50 |
|
190,50 |
|
MALI |
141,35 |
5,02 |
1,21 |
0,68 |
20,81 |
0,94 |
15,06 |
7,74 |
61,32 |
|
112,77 |
254,12 |
|
254,12 |
|
MOZAMBIQUE |
161,32 |
|
6,16 |
26,08 |
28,16 |
3,64 |
|
|
30,00 |
|
94,04 |
255,37 |
|
255,37 |
|
NAMIBIA |
46,81 |
9,42 |
0,17 |
|
6,42 |
|
37,60 |
|
|
|
53,61 |
100,42 |
|
100,42 |
|
NIGER |
138,22 |
|
0,46 |
0,09 |
4,67 |
|
29,38 |
4,44 |
22,40 |
|
61,43 |
199,64 |
|
199,64 |
|
RWANDA |
115,86 |
|
24,43 |
0,64 |
14,00 |
41,62 |
|
2,69 |
|
|
83,38 |
199,23 |
|
199,23 |
|
SENEGAL |
106,05 |
2,35 |
0,65 |
0,87 |
13,10 |
32,27 |
|
6,51 |
32,50 |
|
88,25 |
194,30 |
|
194,30 |
|
SEYCHELLES |
5,26 |
|
|
|
3,00 |
|
|
0,05 |
|
|
3,05 |
8,31 |
|
8,31 |
|
SIERRA LEONE |
73,47 |
|
9,53 |
0,81 |
8,00 |
10,01 |
0,18 |
2,48 |
11,90 |
|
42,91 |
116,38 |
|
116,38 |
|
SOMALIA |
|
|
|
|
|
|
|
18,44 |
|
|
18,44 |
18,44 |
|
18,44 |
|
SAO TOME & PRINCIPE |
7,89 |
|
|
|
5,60 |
2,89 |
|
0,07 |
2,07 |
|
10,63 |
18,52 |
|
18,52 |
|
SUDAN |
|
|
39,97 |
|
|
103,83 |
|
0,38 |
|
|
144,19 |
144,19 |
|
144,19 |
|
SWAZILAND |
25,15 |
|
|
|
16,00 |
|
|
1,42 |
|
|
17,42 |
42,57 |
|
42,57 |
|
TANZANIA |
156,19 |
|
2,84 |
|
50,96 |
57,74 |
|
9,52 |
103,30 |
|
224,36 |
380,55 |
|
380,55 |
|
TOGO |
59,67 |
|
0,41 |
|
|
20,77 |
0,06 |
4,51 |
|
|
25,75 |
85,42 |
|
85,42 |
|
UGANDA |
154,51 |
0,78 |
1,41 |
0,75 |
38,86 |
144,07 |
|
2,34 |
51,65 |
4,59 |
244,46 |
398,97 |
|
398,97 |
|
NIGERIA |
237,18 |
9,97 |
1,03 |
|
2,50 |
|
|
1,24 |
|
|
14,74 |
251,93 |
|
251,93 |
|
ZAMBIA |
99,94 |
|
1,25 |
1,10 |
49,85 |
|
60,16 |
6,82 |
96,41 |
|
215,59 |
315,53 |
|
315,53 |
|
ZIMBABWE |
84,07 |
13,72 |
0,64 |
1,78 |
16,15 |
26,97 |
0,09 |
7,30 |
36,00 |
|
102,67 |
186,74 |
|
186,74 |
|
DEMOCRATIC REPUBLIC CONGO |
154,53 |
|
13,54 |
5,30 |
|
|
|
22,59 |
|
|
41,43 |
195,97 |
|
195,97 |
|
* TOTAL AFRICA |
3 780,19 |
112,75 |
196,52 |
82,86 |
628,22 |
1 476,42 |
340,20 |
207,24 |
1 063,20 |
4,59 |
4 112,00 |
7 892,18 |
|
7 892,18 |
|
ANTIGUA-BARBUDA |
2,94 |
|
0,66 |
|
|
|
|
0,05 |
|
|
0,70 |
3,64 |
|
3,64 |
|
BARBADOS |
2,86 |
5,40 |
|
|
|
|
|
0,95 |
|
|
6,34 |
9,20 |
|
9,20 |
|
BELIZE |
8,98 |
0,46 |
0,74 |
0,50 |
3,50 |
|
|
3,56 |
|
|
8,75 |
17,73 |
|
17,73 |
|
BAHAMAS |
4,29 |
6,91 |
|
|
|
|
|
0,36 |
|
|
7,27 |
11,57 |
|
11,57 |
|
DOMINICAN REPUBLIC |
80,72 |
1,15 |
|
|
25,23 |
|
19,61 |
|
22,78 |
|
68,77 |
149,49 |
|
149,49 |
|
DOMINICA |
5,36 |
|
|
|
2,50 |
14,94 |
|
0,00 |
2,15 |
|
19,59 |
24,95 |
|
24,95 |
|
GRENADA |
5,38 |
0,68 |
|
|
1,50 |
10,59 |
|
0,02 |
1,98 |
|
14,78 |
20,16 |
|
20,16 |
|
GUYANA (STATE) |
31,68 |
|
|
|
13,30 |
|
0,24 |
4,07 |
7,70 |
6,44 |
31,75 |
63,44 |
|
63,44 |
|
HAITI |
80,60 |
|
4,89 |
|
14,00 |
32,51 |
|
|
16,97 |
|
68,37 |
148,96 |
|
148,96 |
|
JAMAICA |
46,39 |
20,69 |
|
|
17,99 |
|
70,11 |
32,83 |
2,50 |
|
144,11 |
190,51 |
|
190,51 |
|
ST CHRISTOPHE (KITTS) & NEVIS |
2,49 |
|
|
|
2,00 |
|
|
0,23 |
|
|
2,23 |
4,72 |
|
4,72 |
|
SAINT LUCIA |
1,94 |
2,23 |
0,08 |
|
1,50 |
26,83 |
|
0,12 |
|
|
30,75 |
32,69 |
|
32,69 |
|
SURINAME |
16,12 |
|
|
0,50 |
0,65 |
|
0,16 |
4,42 |
|
|
5,74 |
21,86 |
|
21,86 |
|
SAINT VINCENT & GRENADINES |
3,22 |
|
|
|
5,00 |
31,57 |
|
0,10 |
|
|
36,67 |
39,89 |
|
39,89 |
|
TRINIDAD & TOBAGO |
9,27 |
15,46 |
|
|
10,07 |
|
|
0,98 |
6,20 |
|
32,71 |
41,98 |
|
41,98 |
|
* TOTAL CARIBBEAN |
302,23 |
52,96 |
6,36 |
1,00 |
97,24 |
116,46 |
90,13 |
47,69 |
60,28 |
6,44 |
478,55 |
780,78 |
|
780,78 |
|
FIJI |
21,90 |
1,20 |
1,00 |
|
0,06 |
|
|
0,95 |
|
|
3,20 |
25,10 |
|
25,10 |
|
KIRIBATI |
5,83 |
|
|
|
1,00 |
0,63 |
|
0,15 |
|
|
1,78 |
7,60 |
|
7,60 |
|
PAPUA-NEW GUINEA |
42,96 |
4,97 |
0,11 |
|
21,33 |
84,58 |
|
3,47 |
20,50 |
|
134,97 |
177,93 |
|
177,93 |
|
SOLOMON ISLANDS |
19,55 |
|
|
|
1,30 |
8,10 |
|
0,48 |
|
|
9,88 |
29,42 |
|
29,42 |
|
TONGA |
5,56 |
0,64 |
|
|
0,22 |
2,02 |
|
0,39 |
|
|
3,26 |
8,82 |
|
8,82 |
|
TUVALU |
1,06 |
|
|
|
0,50 |
0,03 |
|
0,04 |
|
|
0,58 |
1,64 |
|
1,64 |
|
VANUATU |
7,44 |
|
0,15 |
|
1,00 |
2,69 |
|
0,17 |
|
|
4,01 |
11,45 |
|
11,45 |
|
SAMOA |
8,92 |
|
0,30 |
|
5,50 |
5,78 |
|
0,04 |
|
|
11,62 |
20,54 |
|
20,54 |
|
* TOTAL PACIFIC |
113,21 |
6,80 |
1,57 |
|
30,91 |
103,82 |
|
5,69 |
20,50 |
|
169,29 |
282,50 |
|
282,50 |
|
INTRA ACP BUDGET |
|
|
|
|
|
|
|
|
|
|
|
|
50,00 |
50,00 |
|
ACP REGIONAL COOPERATION |
1 081,31 |
12,86 |
|
|
44,76 |
|
|
40,90 |
|
|
98,52 |
1 179,84 |
|
1 179,84 |
|
* TOTAL ACP REGIONAL COOPERATION |
1 081,31 |
12,86 |
|
|
44,76 |
|
|
40,90 |
|
|
98,52 |
1 179,84 |
50,00 |
1 229,84 |
|
ALL ACP COUNTRIES |
|
13,12 |
198,82 |
|
12,25 |
|
0,21 |
7,11 |
|
28,97 |
260,49 |
260,49 |
|
260,49 |
|
ADMINISTRATIVE & FINANCIAL COSTS |
2,66 |
|
|
|
|
|
|
0,36 |
4,69 |
|
5,05 |
7,72 |
|
7,72 |
|
* TOTAL ACP |
5 279,60 |
198,49 |
403,27 |
83,86 |
813,38 |
1 696,69 |
430,54 |
309,00 |
1 148,67 |
40,00 |
5 123,91 |
10 403,51 |
50,00 |
10 453,51 |
|
MAYOTTE |
6,69 |
|
0,49 |
|
4,90 |
|
|
|
|
|
5,39 |
12,08 |
|
12,08 |
|
NEW CALEDONIA |
12,44 |
0,64 |
0,25 |
|
6,00 |
|
2,50 |
2,20 |
|
|
11,59 |
24,03 |
|
24,03 |
|
FRENCH POLYNESIA |
12,96 |
0,92 |
0,11 |
|
3,91 |
0,93 |
|
1,50 |
|
|
7,37 |
20,33 |
|
20,33 |
|
SAINT PIERRE & MIQUELON |
3,00 |
|
|
|
|
|
|
0,54 |
|
|
0,54 |
3,54 |
|
3,54 |
|
FRENCH SOUTHERN TERRITORIES |
0,00 |
|
|
|
|
|
|
|
|
|
|
0,00 |
|
0,00 |
|
WALLIS & FUTUNA |
4,57 |
|
0,08 |
|
|
|
|
0,02 |
|
|
0,09 |
4,66 |
|
4,66 |
|
NAT. AID PROGR. RESERVE OCT F |
|
|
|
|
|
|
|
|
|
|
|
|
|
|
|
* TOTAL FRENCH OCT |
39,66 |
1,56 |
0,92 |
|
14,81 |
0,93 |
2,50 |
4,26 |
|
|
24,98 |
64,64 |
|
64,64 |
|
ARUBA |
6,99 |
0,07 |
|
|
|
|
|
0,10 |
|
|
0,17 |
7,16 |
|
7,16 |
|
DUTCH ANTILLES |
14,63 |
0,67 |
|
|
6,59 |
|
|
3,19 |
|
|
10,44 |
25,08 |
|
25,08 |
|
* TOTAL DUTCH OCT |
21,63 |
0,74 |
|
|
6,59 |
|
|
3,29 |
|
|
10,61 |
32,24 |
|
32,24 |
|
ANGUILLA |
2,72 |
|
|
|
|
|
|
0,35 |
|
|
0,35 |
3,07 |
|
3,07 |
|
CAYMANS |
|
1,07 |
|
0,09 |
|
|
|
|
|
|
1,17 |
1,17 |
|
1,17 |
|
FALKLANDS |
|
0,62 |
|
|
|
5,07 |
|
0,01 |
|
|
5,69 |
5,69 |
|
5,69 |
|
MONTSERRAT |
3,65 |
|
0,38 |
0,20 |
|
|
|
0,01 |
|
|
0,59 |
4,24 |
|
4,24 |
|
SAINT HELENA |
1,10 |
|
|
|
|
|
|
0,05 |
|
|
0,05 |
1,15 |
|
1,15 |
|
TURKS & CAICOS |
3,89 |
|
|
|
|
|
|
0,06 |
|
|
0,06 |
3,95 |
|
3,95 |
|
BRITISH VIRGIN ISLANDS |
2,40 |
0,19 |
|
|
1,10 |
|
|
0,12 |
|
|
1,41 |
3,80 |
|
3,80 |
|
* TOTAL BRITISH OCT |
13,76 |
1,88 |
0,38 |
0,29 |
1,10 |
5,07 |
|
0,59 |
|
|
9,31 |
23,07 |
|
23,07 |
|
OCT REGIONAL COOPERATION |
8,12 |
|
|
|
|
|
|
0,47 |
|
|
0,47 |
8,59 |
|
8,59 |
|
* OCT REGIONAL COOPERATION |
8,12 |
|
|
|
|
|
|
0,47 |
|
|
0,47 |
8,59 |
|
8,59 |
|
ALL OCT |
|
|
0,96 |
|
|
|
|
|
|
|
0,96 |
0,96 |
|
0,96 |
|
* TOTAL OCT |
83,17 |
4,18 |
2,26 |
0,29 |
22,49 |
6,00 |
2,50 |
8,61 |
|
|
46,34 |
129,50 |
|
129,50 |
|
* TOTAL ACP + OCT |
5 362,77 |
202,67 |
405,53 |
84,15 |
835,88 |
1 702,69 |
433,04 |
317,61 |
1 148,67 |
40,00 |
5 170,24 |
10 533,01 |
50,00 |
10 583,01 |
TABLE 3.1.4
7th EDF
Decisions annual 2007
SITUATION BY INSTRUMENT AND STATE
|
(EUR million) |
||||||||||||||
|
|
Lome |
Total |
Cotonou |
Total state |
||||||||||
|
NIP |
Non NIP |
|||||||||||||
|
Grants |
Interest subsidies |
Emergency aid |
Refugee aid |
Risk capital |
Stabex |
Sysmin |
Tranfers from others funds |
SAF |
Heavily indebted poor countries |
Total non Nip |
||||
|
ANGOLA |
– 0,00 |
|
– 0,07 |
|
|
|
|
|
|
|
– 0,07 |
– 0,07 |
|
– 0,07 |
|
BENIN |
– 0,34 |
|
|
|
|
|
|
|
|
|
|
– 0,34 |
|
– 0,34 |
|
BURKINA FASO |
|
|
|
|
|
|
|
|
|
|
|
|
|
|
|
BOTSWANA |
|
|
|
|
|
|
|
|
|
|
|
|
|
|
|
BURUNDI |
– 6,03 |
|
|
|
|
|
|
– 0,16 |
– 0,08 |
|
– 0,24 |
– 6,27 |
|
– 6,27 |
|
CENTRAL AFRICAN REPUBLIC |
|
|
|
|
|
|
|
|
|
|
|
|
|
|
|
CHAD |
|
|
|
|
|
|
|
|
|
|
|
|
|
|
|
CAMEROON |
– 0,03 |
|
|
|
– 2,00 |
|
|
|
|
|
– 2,00 |
– 2,03 |
|
– 2,03 |
|
CONGO |
– 0,10 |
|
|
|
|
|
|
|
|
|
|
– 0,10 |
|
– 0,10 |
|
COMOROS |
|
|
|
|
|
|
|
|
|
|
|
|
|
|
|
CAPE VERDE |
– 0,30 |
|
|
|
|
|
|
|
|
|
|
– 0,30 |
|
– 0,30 |
|
DJIBOUTI |
|
|
|
|
|
|
|
|
|
|
|
|
|
|
|
EQUATORIAL GUINEA |
|
|
|
|
|
|
|
|
|
|
|
|
|
|
|
ERITREA |
– 1,03 |
|
|
|
|
|
|
|
|
|
|
– 1,03 |
|
– 1,03 |
|
ETHIOPIA |
– 6,02 |
|
|
|
|
|
|
|
– 0,27 |
|
– 0,27 |
– 6,29 |
|
– 6,29 |
|
GABON |
– 0,20 |
|
|
|
|
|
|
|
|
|
|
– 0,20 |
|
– 0,20 |
|
GHANA |
– 0,61 |
|
|
|
|
|
|
|
|
|
|
– 0,61 |
|
– 0,61 |
|
GAMBIA |
– 0,14 |
|
|
|
|
|
|
– 0,14 |
|
|
– 0,14 |
– 0,28 |
|
– 0,28 |
|
GUINEA– BISSAU |
– 1,38 |
|
|
|
|
|
|
– 0,09 |
|
|
– 0,09 |
– 1,47 |
|
– 1,47 |
|
GUINEA |
– 0,01 |
|
|
|
|
|
– 9,77 |
|
|
|
– 9,77 |
– 9,78 |
|
– 9,78 |
|
CÔTE D'IVOIRE |
– 0,19 |
|
|
|
|
|
|
|
|
|
|
– 0,19 |
|
– 0,19 |
|
KENYA |
– 0,60 |
|
|
|
|
|
|
|
|
|
|
– 0,60 |
|
– 0,60 |
|
LIBERIA |
|
|
|
|
|
|
|
|
|
|
|
|
|
|
|
LESOTHO |
– 0,30 |
|
|
|
|
|
|
– 0,10 |
|
|
– 0,10 |
– 0,41 |
|
– 0,41 |
|
MADAGASCAR |
|
|
|
|
|
|
|
|
|
|
|
|
|
|
|
MALAWI |
– 1,42 |
|
|
|
|
|
|
|
|
|
|
– 1,42 |
|
– 1,42 |
|
MAURITIUS |
– 0,05 |
|
|
|
|
|
|
|
|
|
|
– 0,05 |
|
– 0,05 |
|
MAURITANIA |
|
|
|
|
|
|
|
|
|
|
|
|
|
|
|
MALI |
|
|
|
|
|
|
|
|
|
|
|
|
|
|
|
MOZAMBIQUE |
– 1,07 |
|
– 0,00 |
– 0,10 |
|
|
|
|
|
|
– 0,10 |
– 1,17 |
|
– 1,17 |
|
NAMIBIA |
|
|
|
|
|
|
|
|
|
|
|
|
|
|
|
NIGER |
|
|
|
|
|
|
– 0,31 |
|
|
|
– 0,31 |
– 0,31 |
|
– 0,31 |
|
RWANDA |
|
|
|
|
|
|
|
|
|
|
|
|
|
|
|
SENEGAL |
– 0,53 |
|
|
|
|
|
|
– 0,75 |
|
|
– 0,75 |
– 1,28 |
|
– 1,28 |
|
SEYCHELLES |
|
|
|
|
|
|
|
|
|
|
|
|
|
|
|
SIERRA LEONE |
– 2,68 |
|
|
|
|
|
|
|
|
|
|
– 2,68 |
|
– 2,68 |
|
SOMALIA |
|
|
|
|
|
|
|
|
|
|
|
|
|
|
|
SAO TOME & PRINCIPE |
– 0,08 |
|
|
|
|
|
|
|
|
|
|
– 0,08 |
|
– 0,08 |
|
SUDAN |
|
|
|
|
|
|
|
|
|
|
|
|
|
|
|
SWAZILAND |
|
|
|
|
|
|
|
|
|
|
|
|
|
|
|
TANZANIA |
|
|
|
|
|
|
|
|
|
|
|
|
|
|
|
TOGO |
– 1,88 |
|
|
|
|
|
|
– 0,19 |
|
|
– 0,19 |
– 2,07 |
|
– 2,07 |
|
UGANDA |
– 0,40 |
|
|
|
|
|
|
– 0,00 |
– 0,15 |
|
– 0,15 |
– 0,55 |
|
– 0,55 |
|
NIGERIA |
– 8,19 |
|
|
|
|
|
|
|
|
|
|
– 8,19 |
|
– 8,19 |
|
ZAMBIA |
– 0,40 |
|
|
|
|
|
|
|
|
|
|
– 0,40 |
|
– 0,40 |
|
ZIMBABWE |
– 0,10 |
|
|
|
|
|
|
– 0,01 |
|
|
– 0,01 |
– 0,11 |
|
– 0,11 |
|
DEMOCRATIC REPUBLIC CONGO |
– 1,11 |
|
|
|
|
|
|
– 0,42 |
|
|
– 0,42 |
– 1,53 |
|
– 1,53 |
|
* TOTAL AFRICA |
– 35,18 |
|
– 0,07 |
– 0,10 |
– 2,00 |
|
– 10,08 |
– 1,87 |
– 0,50 |
|
– 14,62 |
– 49,81 |
|
– 49,81 |
|
ANTIGUA– BARBUDA |
|
|
|
|
|
|
|
|
|
|
|
|
|
|
|
BARBADOS |
|
|
|
|
|
|
|
|
|
|
|
|
|
|
|
BELIZE |
|
|
|
|
|
|
|
|
|
|
|
|
|
|
|
BAHAMAS |
|
|
|
|
|
|
|
|
|
|
|
|
|
|
|
DOMINICAN REPUBLIC |
|
|
|
|
|
|
|
|
|
|
|
|
|
|
|
DOMINICA |
|
|
|
|
|
|
|
|
|
|
|
|
|
|
|
GRENADA |
|
|
|
|
|
|
|
|
|
|
|
|
|
|
|
GUYANA (STATE) |
– 0,85 |
|
|
|
|
|
|
|
|
|
|
– 0,85 |
|
– 0,85 |
|
HAITI |
– 0,49 |
|
|
|
|
|
|
|
|
|
|
– 0,49 |
|
– 0,49 |
|
JAMAICA |
– 0,02 |
|
|
|
– 1,13 |
|
|
– 0,02 |
|
|
– 1,15 |
– 1,17 |
|
– 1,17 |
|
ST CHRISTOPHE (KITTS) & NEVIS |
|
|
|
|
|
|
|
|
|
|
|
|
|
|
|
SAINT LUCIA |
|
|
|
|
|
|
|
|
|
|
|
|
|
|
|
SURINAME |
– 0,73 |
|
|
|
|
|
|
– 0,40 |
|
|
– 0,40 |
– 1,14 |
|
– 1,14 |
|
SAINT VINCENT & GRENADINES |
|
|
|
|
|
|
|
|
|
|
|
|
|
|
|
TRINIDAD & TOBAGO |
|
|
|
|
|
|
|
|
|
|
|
|
|
|
|
* TOTAL CARIBBEAN |
– 2,10 |
|
|
|
– 1,13 |
|
|
– 0,42 |
|
|
– 1,55 |
– 3,65 |
|
– 3,65 |
|
FIJI |
|
|
|
|
|
|
|
|
|
|
|
|
|
|
|
KIRIBATI |
|
|
|
|
|
|
|
|
|
|
|
|
|
|
|
PAPUA– NEW GUINEA |
– 0,85 |
|
|
|
|
|
|
– 0,00 |
|
|
– 0,00 |
– 0,86 |
|
– 0,86 |
|
SOLOMON ISLANDS |
– 0,02 |
|
|
|
|
|
|
|
|
|
|
– 0,02 |
|
– 0,02 |
|
TONGA |
– 0,21 |
|
|
|
|
|
|
|
|
|
|
– 0,21 |
|
– 0,21 |
|
TUVALU |
|
|
|
|
|
|
|
|
|
|
|
|
|
|
|
VANUATU |
|
|
|
|
|
|
|
|
|
|
|
|
|
|
|
SAMOA |
|
|
|
|
|
|
|
|
|
|
|
|
|
|
|
* TOTAL PACIFIC |
– 1,08 |
|
|
|
|
|
|
– 0,00 |
|
|
– 0,00 |
– 1,09 |
|
– 1,09 |
|
INTRA ACP BUDGET |
|
|
|
|
|
|
|
|
|
|
|
|
|
|
|
ACP REGIONAL COOPERATION |
– 12,44 |
|
|
|
|
|
|
– 0,04 |
|
|
– 0,04 |
– 12,48 |
|
– 12,48 |
|
* TOTAL ACP REGIONAL COOPERATION |
– 12,44 |
|
|
|
|
|
|
– 0,04 |
|
|
– 0,04 |
– 12,48 |
|
– 12,48 |
|
ALL ACP COUNTRIES |
|
|
|
|
|
|
|
– 1,47 |
|
|
– 1,47 |
– 1,47 |
|
– 1,47 |
|
ADMINISTRATIVE & FINANCIAL COSTS |
|
|
|
|
|
|
|
– 0,04 |
|
|
– 0,04 |
– 0,04 |
|
– 0,04 |
|
* TOTAL ACP |
– 50,80 |
|
– 0,07 |
– 0,10 |
– 3,13 |
|
– 10,08 |
– 3,85 |
– 0,50 |
|
– 17,73 |
– 68,54 |
|
– 68,54 |
|
MAYOTTE |
|
|
|
|
|
|
|
|
|
|
|
|
|
|
|
NEW CALEDONIA |
|
|
|
|
|
|
|
|
|
|
|
|
|
|
|
FRENCH POLYNESIA |
|
|
|
|
|
|
|
|
|
|
|
|
|
|
|
SAINT PIERRE & MIQUELON |
|
|
|
|
|
|
|
|
|
|
|
|
|
|
|
FRENCH SOUTHERN TERRITORIES |
|
|
|
|
|
|
|
|
|
|
|
|
|
|
|
WALLIS & FUTUNA |
|
|
|
|
|
|
|
|
|
|
|
|
|
|
|
NAT. AID PROGR. RESERVE OCT F |
|
|
|
|
|
|
|
|
|
|
|
|
|
|
|
* TOTAL FRENCH OCT |
|
|
|
|
|
|
|
|
|
|
|
|
|
|
|
ARUBA |
– 0,02 |
|
|
|
|
|
|
|
|
|
|
– 0,02 |
|
– 0,02 |
|
DUTCH ANTILLES |
– 1,66 |
|
|
|
|
|
|
– 0,97 |
|
|
– 0,97 |
– 2,63 |
|
– 2,63 |
|
* TOTAL DUTCH OCT |
– 1,68 |
|
|
|
|
|
|
– 0,97 |
|
|
– 0,97 |
– 2,64 |
|
– 2,64 |
|
ANGUILLA |
|
|
|
|
|
|
|
|
|
|
|
|
|
|
|
CAYMANS |
|
|
|
|
|
|
|
|
|
|
|
|
|
|
|
FALKLANDS |
|
|
|
|
|
|
|
|
|
|
|
|
|
|
|
MONTSERRAT |
– 0,14 |
|
|
|
|
|
|
|
|
|
|
– 0,14 |
|
– 0,14 |
|
SAINT HELENA |
|
|
|
|
|
|
|
|
|
|
|
|
|
|
|
TURKS & CAICOS |
|
|
|
|
|
|
|
|
|
|
|
|
|
|
|
BRITISH VIRGIN ISLANDS |
|
|
|
|
|
|
|
|
|
|
|
|
|
|
|
* TOTAL BRITISH OCT |
– 0,14 |
|
|
|
|
|
|
|
|
|
|
– 0,14 |
|
– 0,14 |
|
OCT REGIONAL COOPERATION |
– 0,59 |
|
|
|
|
|
|
|
|
|
|
– 0,59 |
|
– 0,59 |
|
* OCT REGIONAL COOPERATION |
– 0,59 |
|
|
|
|
|
|
|
|
|
|
– 0,59 |
|
– 0,59 |
|
ALL OCT |
|
|
|
|
|
|
|
|
|
|
|
|
|
|
|
* TOTAL OCT |
– 2,41 |
|
|
|
|
|
|
– 0,97 |
|
|
– 0,97 |
– 3,38 |
|
– 3,38 |
|
* TOTAL ACP + OCT |
– 53,21 |
|
– 0,07 |
– 0,10 |
– 3,13 |
|
– 10,08 |
– 4,82 |
– 0,50 |
|
– 18,70 |
– 71,91 |
|
– 71,91 |
Table 3.1.5
7th EDF
Assigned funds cumulative 2007
SITUATION BY INSTRUMENT AND STATE
|
(EUR million) |
||||||||||||||
|
|
Lome |
Total |
Cotonou |
Total state |
||||||||||
|
NIP |
Non NIP |
|||||||||||||
|
Grants |
Interest subsidies |
Emergency aid |
Refugee aid |
Risk capital |
Stabex |
Sysmin |
Tranfers from others funds |
SAF |
Heavily indebted poor countries |
Total non NIP |
||||
|
ANGOLA |
108,12 |
|
28,31 |
9,41 |
1,91 |
|
|
|
|
|
39,63 |
147,76 |
|
147,76 |
|
BENIN |
87,99 |
|
0,92 |
|
12,00 |
1,31 |
|
7,12 |
39,10 |
|
60,45 |
148,44 |
|
148,44 |
|
BURKINA FASO |
146,23 |
|
0,84 |
|
22,44 |
18,63 |
21,60 |
2,87 |
83,41 |
|
149,79 |
296,02 |
|
296,02 |
|
BOTSWANA |
30,08 |
16,45 |
|
0,23 |
2,53 |
|
33,71 |
2,23 |
|
|
55,15 |
85,23 |
|
85,23 |
|
BURUNDI |
78,13 |
|
17,05 |
|
|
54,56 |
|
2,59 |
11,92 |
|
86,11 |
164,24 |
|
164,24 |
|
CENTRAL AFRICAN REPUBLIC |
71,22 |
|
|
0,23 |
|
18,37 |
|
4,66 |
9,85 |
|
33,11 |
104,33 |
|
104,33 |
|
CHAD |
98,91 |
|
0,98 |
|
|
11,31 |
|
2,20 |
19,58 |
|
34,07 |
132,97 |
|
132,97 |
|
CAMEROON |
104,41 |
0,27 |
|
|
6,61 |
244,19 |
|
3,04 |
33,61 |
|
287,71 |
392,13 |
|
392,13 |
|
CONGO |
29,16 |
|
|
|
|
|
|
0,66 |
6,60 |
|
7,26 |
36,42 |
|
36,42 |
|
COMOROS |
20,17 |
|
|
|
2,43 |
4,29 |
|
0,60 |
6,50 |
|
13,82 |
33,99 |
|
33,99 |
|
CAPE VERDE |
23,98 |
|
0,18 |
|
11,71 |
1,20 |
|
0,25 |
|
|
13,34 |
37,32 |
|
37,32 |
|
DJIBOUTI |
17,43 |
|
0,42 |
0,47 |
0,50 |
|
|
0,19 |
4,10 |
|
5,67 |
23,10 |
|
23,10 |
|
EQUATORIAL GUINEA |
12,12 |
|
|
|
|
7,60 |
|
0,38 |
|
|
7,98 |
20,10 |
|
20,10 |
|
ERITREA |
45,91 |
|
1,75 |
3,73 |
8,00 |
|
|
|
|
|
13,48 |
59,38 |
|
59,38 |
|
ETHIOPIA |
203,90 |
|
6,95 |
7,07 |
68,51 |
179,49 |
|
3,80 |
78,13 |
|
343,94 |
547,84 |
|
547,84 |
|
GABON |
29,31 |
0,40 |
|
|
0,60 |
|
13,96 |
1,65 |
8,15 |
|
24,75 |
54,06 |
|
54,06 |
|
GHANA |
94,91 |
11,81 |
1,28 |
|
1,65 |
50,58 |
0,15 |
11,45 |
87,06 |
|
163,98 |
258,90 |
|
258,90 |
|
GAMBIA |
21,57 |
|
|
|
4,30 |
0,35 |
|
0,58 |
6,20 |
|
11,44 |
33,01 |
|
33,01 |
|
GUINEA-BISSAU |
35,10 |
|
1,20 |
|
4,63 |
1,28 |
|
5,35 |
9,48 |
|
21,94 |
57,04 |
|
57,04 |
|
GUINEA |
120,96 |
3,28 |
2,37 |
1,49 |
48,06 |
|
70,06 |
4,56 |
25,66 |
|
155,47 |
276,44 |
|
276,44 |
|
CÔTE D'IVOIRE |
103,23 |
6,12 |
0,83 |
2,53 |
11,55 |
269,68 |
|
3,66 |
77,12 |
|
371,49 |
474,72 |
|
474,72 |
|
KENYA |
128,74 |
10,65 |
9,31 |
0,86 |
44,53 |
84,80 |
|
5,60 |
|
|
155,75 |
284,49 |
|
284,49 |
|
LIBERIA |
|
|
16,09 |
4,32 |
|
|
|
12,78 |
|
|
33,20 |
33,20 |
|
33,20 |
|
LESOTHO |
45,41 |
6,89 |
|
|
17,18 |
3,71 |
|
4,98 |
21,59 |
|
54,34 |
99,75 |
|
99,75 |
|
MADAGASCAR |
130,33 |
|
1,65 |
|
12,71 |
55,50 |
|
5,90 |
10,80 |
|
86,55 |
216,89 |
|
216,89 |
|
MALAWI |
124,44 |
|
1,30 |
14,34 |
44,79 |
8,69 |
|
11,73 |
52,34 |
|
133,20 |
257,64 |
|
257,64 |
|
MAURITIUS |
31,63 |
12,15 |
|
|
5,10 |
|
|
0,60 |
|
|
17,85 |
49,48 |
|
49,48 |
|
MAURITANIA |
62,39 |
3,47 |
1,36 |
0,08 |
18,40 |
16,15 |
57,85 |
6,00 |
24,46 |
|
127,77 |
190,16 |
|
190,16 |
|
MALI |
141,32 |
5,02 |
1,21 |
0,68 |
20,81 |
0,94 |
14,72 |
7,74 |
61,32 |
|
112,43 |
253,75 |
|
253,75 |
|
MOZAMBIQUE |
160,75 |
|
6,16 |
26,08 |
28,16 |
3,64 |
|
|
30,00 |
|
94,04 |
254,79 |
|
254,79 |
|
NAMIBIA |
46,65 |
9,42 |
0,17 |
|
6,42 |
|
37,60 |
|
|
|
53,61 |
100,27 |
|
100,27 |
|
NIGER |
138,22 |
|
0,46 |
0,09 |
4,67 |
|
29,38 |
4,44 |
22,40 |
|
61,43 |
199,64 |
|
199,64 |
|
RWANDA |
115,70 |
|
24,43 |
0,64 |
14,00 |
41,62 |
|
2,69 |
|
|
83,38 |
199,08 |
|
199,08 |
|
SENEGAL |
104,59 |
2,35 |
0,65 |
0,69 |
13,10 |
32,27 |
|
6,43 |
32,50 |
|
87,99 |
192,58 |
|
192,58 |
|
SEYCHELLES |
5,26 |
|
|
|
3,00 |
|
|
0,05 |
|
|
3,05 |
8,31 |
|
8,31 |
|
SIERRA LEONE |
72,81 |
|
9,53 |
0,81 |
8,00 |
10,01 |
0,18 |
2,48 |
11,90 |
|
42,91 |
115,72 |
|
115,72 |
|
SOMALIA |
|
|
|
|
|
|
|
18,44 |
|
|
18,44 |
18,44 |
|
18,44 |
|
SAO TOME & PRINCIPE |
7,89 |
|
|
|
5,60 |
2,89 |
|
0,07 |
2,07 |
|
10,63 |
18,52 |
|
18,52 |
|
SUDAN |
|
|
39,97 |
|
|
103,83 |
|
0,24 |
|
|
144,05 |
144,05 |
|
144,05 |
|
SWAZILAND |
25,13 |
|
|
|
16,00 |
|
|
1,42 |
|
|
17,42 |
42,55 |
|
42,55 |
|
TANZANIA |
155,92 |
|
2,84 |
|
50,96 |
57,74 |
|
9,51 |
103,30 |
|
224,35 |
380,28 |
|
380,28 |
|
TOGO |
57,19 |
|
0,41 |
|
|
20,77 |
0,06 |
4,50 |
|
|
25,74 |
82,93 |
|
82,93 |
|
UGANDA |
154,51 |
0,78 |
1,41 |
0,75 |
38,86 |
144,07 |
|
2,34 |
51,65 |
4,59 |
244,45 |
398,96 |
|
398,96 |
|
NIGERIA |
218,50 |
9,97 |
1,03 |
|
2,50 |
|
|
1,18 |
|
|
14,68 |
233,18 |
|
233,18 |
|
ZAMBIA |
99,94 |
|
1,25 |
1,10 |
49,85 |
|
60,16 |
6,81 |
96,41 |
|
215,58 |
315,52 |
|
315,52 |
|
ZIMBABWE |
84,07 |
13,72 |
0,64 |
1,78 |
16,15 |
26,97 |
0,09 |
7,30 |
36,00 |
|
102,67 |
186,74 |
|
186,74 |
|
DEMOCRATIC REPUBLIC CONGO |
140,12 |
|
13,54 |
5,30 |
|
|
|
22,38 |
|
|
41,22 |
181,34 |
|
181,34 |
|
* TOTAL AFRICA |
3 734,33 |
112,75 |
196,52 |
82,67 |
628,22 |
1 476,42 |
339,51 |
203,46 |
1 063,20 |
4,59 |
4 107,33 |
7 841,66 |
|
7 841,66 |
|
ANTIGUA-BARBUDA |
2,94 |
|
0,66 |
|
|
|
|
0,05 |
|
|
0,70 |
3,64 |
|
3,64 |
|
BARBADOS |
2,86 |
5,40 |
|
|
|
|
|
0,95 |
|
|
6,34 |
9,20 |
|
9,20 |
|
BELIZE |
8,98 |
0,46 |
0,74 |
0,50 |
3,50 |
|
|
3,56 |
|
|
8,75 |
17,73 |
|
17,73 |
|
BAHAMAS |
4,29 |
6,91 |
|
|
|
|
|
0,36 |
|
|
7,27 |
11,57 |
|
11,57 |
|
DOMINICAN REPUBLIC |
80,67 |
1,15 |
|
|
25,23 |
|
19,61 |
|
22,78 |
|
68,77 |
149,43 |
|
149,43 |
|
DOMINICA |
4,68 |
|
|
|
2,50 |
14,94 |
|
0,00 |
2,15 |
|
19,59 |
24,27 |
|
24,27 |
|
GRENADA |
5,38 |
0,68 |
|
|
1,50 |
10,59 |
|
0,02 |
1,98 |
|
14,78 |
20,16 |
|
20,16 |
|
GUYANA (STATE) |
31,68 |
|
|
|
13,30 |
|
0,24 |
4,07 |
7,70 |
6,44 |
31,75 |
63,44 |
|
63,44 |
|
HAITI |
80,57 |
|
4,89 |
|
14,00 |
32,51 |
|
|
16,97 |
|
68,37 |
148,94 |
|
148,94 |
|
JAMAICA |
46,39 |
20,69 |
|
|
17,99 |
|
69,64 |
32,83 |
2,50 |
|
143,64 |
190,04 |
|
190,04 |
|
ST CHRISTOPHE (KITTS) & NEVIS |
2,48 |
|
|
|
2,00 |
|
|
0,23 |
|
|
2,23 |
4,72 |
|
4,72 |
|
SAINT LUCIA |
1,77 |
2,23 |
0,08 |
|
1,50 |
26,83 |
|
0,12 |
|
|
30,75 |
32,53 |
|
32,53 |
|
SURINAME |
16,12 |
|
|
0,50 |
0,65 |
|
0,16 |
4,42 |
|
|
5,73 |
21,86 |
|
21,86 |
|
SAINT VINCENT & GRENADINES |
3,22 |
|
|
|
5,00 |
31,57 |
|
0,10 |
|
|
36,67 |
39,89 |
|
39,89 |
|
TRINIDAD & TOBAGO |
9,27 |
15,46 |
|
|
10,07 |
|
|
0,98 |
6,20 |
|
32,71 |
41,98 |
|
41,98 |
|
* TOTAL CARIBBEAN |
301,30 |
52,96 |
6,36 |
1,00 |
97,24 |
116,46 |
89,66 |
47,69 |
60,28 |
6,44 |
478,08 |
779,38 |
|
779,38 |
|
FIJI |
21,87 |
1,20 |
1,00 |
|
0,06 |
|
|
0,88 |
|
|
3,14 |
25,00 |
|
25,00 |
|
KIRIBATI |
5,83 |
|
|
|
1,00 |
0,63 |
|
0,15 |
|
|
1,78 |
7,60 |
|
7,60 |
|
PAPUA-NEW GUINEA |
42,82 |
4,97 |
0,11 |
|
21,33 |
84,58 |
|
3,47 |
20,50 |
|
134,97 |
177,78 |
|
177,78 |
|
SOLOMON ISLANDS |
19,54 |
|
|
|
1,30 |
8,10 |
|
0,48 |
|
|
9,88 |
29,42 |
|
29,42 |
|
TONGA |
5,56 |
0,64 |
|
|
0,22 |
2,02 |
|
0,39 |
|
|
3,26 |
8,82 |
|
8,82 |
|
TUVALU |
1,06 |
|
|
|
0,50 |
0,03 |
|
0,04 |
|
|
0,58 |
1,64 |
|
1,64 |
|
VANUATU |
7,44 |
|
0,15 |
|
1,00 |
2,69 |
|
0,17 |
|
|
4,01 |
11,45 |
|
11,45 |
|
SAMOA |
8,92 |
|
0,30 |
|
5,50 |
5,78 |
|
0,04 |
|
|
11,62 |
20,54 |
|
20,54 |
|
* TOTAL PACIFIC |
113,03 |
6,80 |
1,57 |
|
30,91 |
103,82 |
|
5,63 |
20,50 |
|
169,23 |
282,25 |
|
282,25 |
|
INTRA ACP BUDGET |
|
|
|
|
|
|
|
|
|
|
|
|
50,00 |
50,00 |
|
ACP REGIONAL COOPERATION |
1 068,75 |
12,37 |
|
|
44,76 |
|
|
40,79 |
|
|
97,93 |
1 166,68 |
|
1 166,68 |
|
* TOTAL ACP REGIONAL COOPERATION |
1 068,75 |
12,37 |
|
|
44,76 |
|
|
40,79 |
|
|
97,93 |
1 166,68 |
50,00 |
1 216,68 |
|
ALL ACP COUNTRIES |
|
13,12 |
198,82 |
|
12,25 |
|
0,21 |
6,95 |
|
28,97 |
260,33 |
260,33 |
|
260,33 |
|
ADMINISTRATIVE & FINANCIAL COSTS |
2,66 |
|
|
|
|
|
|
0,36 |
4,69 |
|
5,05 |
7,72 |
|
7,72 |
|
* TOTAL ACP |
5 220,07 |
198,00 |
403,27 |
83,67 |
813,38 |
1 696,69 |
429,37 |
304,88 |
1 148,67 |
40,00 |
5 117,95 |
10 338,02 |
50,00 |
10 388,02 |
|
MAYOTTE |
6,69 |
|
0,49 |
|
4,90 |
|
|
|
|
|
5,39 |
12,08 |
|
12,08 |
|
NEW CALEDONIA |
12,44 |
0,64 |
0,25 |
|
6,00 |
|
2,29 |
2,20 |
|
|
11,38 |
23,82 |
|
23,82 |
|
FRENCH POLYNESIA |
12,87 |
0,92 |
0,11 |
|
3,91 |
0,93 |
|
1,50 |
|
|
7,37 |
20,24 |
|
20,24 |
|
SAINT PIERRE & MIQUELON |
3,00 |
|
|
|
|
|
|
0,54 |
|
|
0,54 |
3,54 |
|
3,54 |
|
FRENCH SOUTHERN TERRITORIES |
0,00 |
|
|
|
|
|
|
|
|
|
|
0,00 |
|
0,00 |
|
WALLIS & FUTUNA |
4,57 |
|
0,08 |
|
|
|
|
0,02 |
|
|
0,09 |
4,66 |
|
4,66 |
|
NAT. AID PROGR. RESERVE OCT F |
|
|
|
|
|
|
|
|
|
|
|
|
|
|
|
* TOTAL FRENCH OCT |
39,57 |
1,56 |
0,92 |
|
14,81 |
0,93 |
2,29 |
4,26 |
|
|
24,77 |
64,34 |
|
64,34 |
|
ARUBA |
6,97 |
0,07 |
|
|
|
|
|
0,10 |
|
|
0,17 |
7,14 |
|
7,14 |
|
DUTCH ANTILLES |
14,63 |
0,67 |
|
|
6,59 |
|
|
3,19 |
|
|
10,44 |
25,08 |
|
25,08 |
|
* TOTAL DUTCH OCT |
21,60 |
0,74 |
|
|
6,59 |
|
|
3,29 |
|
|
10,61 |
32,21 |
|
32,21 |
|
ANGUILLA |
2,72 |
|
|
|
|
|
|
0,35 |
|
|
0,35 |
3,07 |
|
3,07 |
|
CAYMANS |
|
1,07 |
|
0,09 |
|
|
|
|
|
|
1,17 |
1,17 |
|
1,17 |
|
FALKLANDS |
|
0,62 |
|
|
|
5,07 |
|
0,01 |
|
|
5,69 |
5,69 |
|
5,69 |
|
MONTSERRAT |
3,65 |
|
0,38 |
0,20 |
|
|
|
0,01 |
|
|
0,59 |
4,24 |
|
4,24 |
|
SAINT HELENA |
1,10 |
|
|
|
|
|
|
0,05 |
|
|
0,05 |
1,15 |
|
1,15 |
|
TURKS & CAICOS |
3,89 |
|
|
|
|
|
|
0,06 |
|
|
0,06 |
3,95 |
|
3,95 |
|
BRITISH VIRGIN ISLANDS |
2,39 |
0,19 |
|
|
1,10 |
|
|
0,12 |
|
|
1,41 |
3,80 |
|
3,80 |
|
* TOTAL BRITISH OCT |
13,75 |
1,88 |
0,38 |
0,29 |
1,10 |
5,07 |
|
0,59 |
|
|
9,31 |
23,06 |
|
23,06 |
|
OCT REGIONAL COOPERATION |
8,12 |
|
|
|
|
|
|
0,44 |
|
|
0,44 |
8,56 |
|
8,56 |
|
* OCT REGIONAL COOPERATION |
8,12 |
|
|
|
|
|
|
0,44 |
|
|
0,44 |
8,56 |
|
8,56 |
|
ALL OCT |
|
|
0,96 |
|
|
|
|
|
|
|
0,96 |
0,96 |
|
0,96 |
|
* TOTAL OCT |
83,04 |
4,18 |
2,26 |
0,29 |
22,49 |
6,00 |
2,29 |
8,57 |
|
|
46,09 |
129,13 |
|
129,13 |
|
* TOTAL ACP + OCT |
5 303,11 |
202,18 |
405,53 |
83,97 |
835,88 |
1 702,69 |
431,67 |
313,45 |
1 148,67 |
40,00 |
5 164,04 |
10 467,15 |
50,00 |
10 517,15 |
Table 3.1.6
7th EDF
Assigned funds annual 2007
SITUATION BY INSTRUMENT AND STATE
|
(EUR million) |
||||||||||||||
|
|
Lome |
Total |
Cotonou |
Total state |
||||||||||
|
NIP |
Non NIP |
|||||||||||||
|
Grants |
Interest subsidies |
Emergency aid |
Refugee aid |
Risk capital |
Stabex |
Sysmin |
Tranfers from others funds |
SAF |
Heavily indebted poor countries |
Total non NIP |
||||
|
ANGOLA |
– 1,11 |
|
|
|
|
|
|
|
|
|
|
– 1,11 |
|
– 1,11 |
|
BENIN |
0,12 |
|
|
|
|
|
|
|
|
|
|
0,12 |
|
0,12 |
|
BURKINA FASO |
0,47 |
|
|
|
|
|
|
|
|
|
|
0,47 |
|
0,47 |
|
BOTSWANA |
– 0,01 |
|
|
|
|
|
– 0,01 |
|
|
|
– 0,01 |
– 0,01 |
|
– 0,01 |
|
BURUNDI |
– 5,55 |
|
|
|
|
|
|
|
|
|
|
– 5,55 |
|
– 5,55 |
|
CENTRAL AFRICAN REPUBLIC |
– 0,07 |
|
|
|
|
|
|
|
|
|
|
– 0,07 |
|
– 0,07 |
|
CHAD |
0,12 |
|
|
|
|
|
|
|
|
|
|
0,12 |
|
0,12 |
|
CAMEROON |
– 0,03 |
|
|
|
– 2,00 |
|
|
|
|
|
– 2,00 |
– 2,03 |
|
– 2,03 |
|
CONGO |
– 0,57 |
|
|
|
|
|
|
|
|
|
|
– 0,57 |
|
– 0,57 |
|
COMOROS |
– 0,07 |
|
|
|
|
|
|
|
|
|
|
– 0,07 |
|
– 0,07 |
|
CAPE VERDE |
0,52 |
|
|
|
|
|
|
|
|
|
|
0,52 |
|
0,52 |
|
DJIBOUTI |
|
|
|
|
|
|
|
|
|
|
|
|
|
|
|
EQUATORIAL GUINEA |
|
|
|
|
|
|
|
|
|
|
|
|
|
|
|
ERITREA |
– 0,35 |
|
|
|
|
|
|
|
|
|
|
– 0,35 |
|
– 0,35 |
|
ETHIOPIA |
– 1,13 |
|
|
|
|
|
|
|
– 0,08 |
|
– 0,08 |
– 1,21 |
|
– 1,21 |
|
GABON |
– 0,05 |
|
|
|
|
|
|
|
|
|
|
– 0,05 |
|
– 0,05 |
|
GHANA |
– 0,57 |
|
|
|
|
|
|
|
|
|
|
– 0,57 |
|
– 0,57 |
|
GAMBIA |
– 0,14 |
|
|
|
|
|
|
|
|
|
|
– 0,14 |
|
– 0,14 |
|
GUINEA-BISSAU |
– 0,54 |
|
|
|
|
|
|
|
|
|
|
– 0,54 |
|
– 0,54 |
|
GUINEA |
– 0,04 |
|
|
|
|
|
– 0,70 |
– 3,00 |
|
|
– 3,70 |
– 3,74 |
|
– 3,74 |
|
CÔTE D'IVOIRE |
– 0,19 |
|
|
|
|
|
|
|
|
|
|
– 0,19 |
|
– 0,19 |
|
KENYA |
– 0,97 |
|
|
|
|
|
|
|
|
|
|
– 0,97 |
|
– 0,97 |
|
LIBERIA |
|
|
|
|
|
|
|
|
|
|
|
|
|
|
|
LESOTHO |
– 0,18 |
|
|
|
|
|
|
– 0,06 |
|
|
– 0,06 |
– 0,24 |
|
– 0,24 |
|
MADAGASCAR |
|
|
|
|
|
|
|
|
|
|
|
|
|
|
|
MALAWI |
– 0,74 |
|
|
|
|
|
|
0,08 |
|
|
0,08 |
– 0,66 |
|
– 0,66 |
|
MAURITIUS |
– 0,04 |
|
|
|
|
|
|
|
|
|
|
– 0,04 |
|
– 0,04 |
|
MAURITANIA |
|
|
|
|
|
|
|
|
|
|
|
|
|
|
|
MALI |
0,05 |
|
|
|
|
|
1,35 |
|
|
|
1,35 |
1,41 |
|
1,41 |
|
MOZAMBIQUE |
– 0,85 |
|
– 0,00 |
|
|
|
|
|
|
|
– 0,00 |
– 0,85 |
|
– 0,85 |
|
NAMIBIA |
– 0,01 |
|
|
|
|
|
|
|
|
|
|
– 0,01 |
|
– 0,01 |
|
NIGER |
|
|
|
|
|
|
– 0,15 |
|
|
|
– 0,15 |
– 0,15 |
|
– 0,15 |
|
RWANDA |
0,01 |
|
|
|
|
|
|
|
|
|
|
0,01 |
|
0,01 |
|
SENEGAL |
– 1,38 |
|
|
– 0,18 |
|
|
|
|
|
|
– 0,18 |
– 1,57 |
|
– 1,57 |
|
SEYCHELLES |
|
|
|
|
|
|
|
|
|
|
|
|
|
|
|
SIERRA LEONE |
– 1,80 |
|
|
|
|
|
|
|
|
|
|
– 1,80 |
|
– 1,80 |
|
SOMALIA |
|
|
|
|
|
|
|
|
|
|
|
|
|
|
|
SAO TOME & PRINCIPE |
– 0,07 |
|
|
|
|
|
|
|
|
|
|
– 0,07 |
|
– 0,07 |
|
SUDAN |
|
|
|
|
|
|
|
|
|
|
|
|
|
|
|
SWAZILAND |
0,04 |
|
|
|
|
|
|
|
|
|
|
0,04 |
|
0,04 |
|
TANZANIA |
– 0,26 |
|
|
|
|
|
|
– 0,01 |
|
|
– 0,01 |
– 0,26 |
|
– 0,26 |
|
TOGO |
1,60 |
|
|
|
|
|
|
0,22 |
|
|
0,22 |
1,82 |
|
1,82 |
|
UGANDA |
0,06 |
|
|
|
|
|
|
|
|
|
|
0,06 |
|
0,06 |
|
NIGERIA |
8,67 |
|
|
|
|
|
|
|
|
|
|
8,67 |
|
8,67 |
|
ZAMBIA |
– 0,23 |
|
|
|
|
|
|
– 0,00 |
|
|
– 0,00 |
– 0,23 |
|
– 0,23 |
|
ZIMBABWE |
– 0,05 |
|
|
|
|
|
|
– 0,01 |
|
|
– 0,01 |
– 0,06 |
|
– 0,06 |
|
DEMOCRATIC REPUBLIC CONGO |
16,69 |
|
|
|
|
|
|
– 0,22 |
|
|
– 0,22 |
16,47 |
|
16,47 |
|
* TOTAL AFRICA |
11,36 |
|
– 0,00 |
– 0,18 |
– 2,00 |
|
0,50 |
– 3,00 |
– 0,08 |
|
– 4,77 |
6,59 |
|
6,59 |
|
ANTIGUABARBUDA |
|
|
|
|
|
|
|
|
|
|
|
|
|
|
|
BARBADOS |
|
|
|
|
|
|
|
|
|
|
|
|
|
|
|
BELIZE |
|
|
|
|
|
|
|
|
|
|
|
|
|
|
|
BAHAMAS |
|
|
|
|
|
|
|
|
|
|
|
|
|
|
|
DOMINICAN REPUBLIC |
– 0,00 |
|
|
|
|
|
|
|
|
|
|
– 0,00 |
|
– 0,00 |
|
DOMINICA |
0,03 |
|
|
|
|
|
|
|
|
|
|
0,03 |
|
0,03 |
|
GRENADA |
|
|
|
|
|
|
|
|
|
|
|
|
|
|
|
GUYANA (STATE) |
– 0,50 |
|
|
|
|
|
|
|
|
|
|
– 0,50 |
|
– 0,50 |
|
HAITI |
– 0,11 |
|
|
|
|
|
|
|
|
|
|
– 0,11 |
|
– 0,11 |
|
JAMAICA |
|
|
|
|
– 1,13 |
|
– 0,38 |
– 0,00 |
|
|
– 1,52 |
– 1,52 |
|
– 1,52 |
|
ST CHRISTOPHE (KITTS) & NEVIS |
|
|
|
|
|
|
|
|
|
|
|
|
|
|
|
SAINT LUCIA |
– 0,00 |
|
|
|
|
|
|
|
|
|
|
– 0,00 |
|
– 0,00 |
|
SURINAME |
– 0,28 |
|
|
|
|
|
|
– 0,11 |
|
|
– 0,11 |
– 0,39 |
|
– 0,39 |
|
SAINT VINCENT & GRENADINES |
|
|
|
|
|
|
|
|
|
|
|
|
|
|
|
TRINIDAD & TOBAGO |
|
|
|
|
|
|
|
|
|
|
|
|
|
|
|
* TOTAL CARIBBEAN |
– 0,86 |
|
|
|
– 1,13 |
|
– 0,38 |
– 0,11 |
|
|
– 1,62 |
– 2,49 |
|
– 2,49 |
|
FIJI |
|
|
|
|
|
|
|
|
|
|
|
|
|
|
|
KIRIBATI |
|
|
|
|
|
|
|
|
|
|
|
|
|
|
|
PAPUANEW GUINEA |
– 0,29 |
|
|
|
|
|
|
|
|
|
|
– 0,29 |
|
– 0,29 |
|
SOLOMON ISLANDS |
– 0,02 |
|
|
|
|
|
|
|
|
|
|
– 0,02 |
|
– 0,02 |
|
TONGA |
– 0,21 |
|
|
|
|
|
|
|
|
|
|
– 0,21 |
|
– 0,21 |
|
TUVALU |
|
|
|
|
|
|
|
|
|
|
|
|
|
|
|
VANUATU |
|
|
|
|
|
|
|
|
|
|
|
|
|
|
|
SAMOA |
|
|
|
|
|
|
|
|
|
|
|
|
|
|
|
* TOTAL PACIFIC |
– 0,52 |
|
|
|
|
|
|
|
|
|
|
– 0,52 |
|
– 0,52 |
|
INTRA ACP BUDGET |
|
|
|
|
|
|
|
|
|
|
|
|
|
|
|
ACP REGIONAL COOPERATION |
– 5,62 |
– 0,49 |
|
|
|
|
|
– 0,11 |
|
|
– 0,60 |
– 6,21 |
|
– 6,21 |
|
* TOTAL ACP REGIONAL COOPERATION |
– 5,62 |
– 0,49 |
|
|
|
|
|
– 0,11 |
|
|
– 0,60 |
– 6,21 |
|
– 6,21 |
|
ALL ACP COUNTRIES |
|
|
|
|
|
|
|
– 1,61 |
|
|
– 1,61 |
– 1,61 |
|
– 1,61 |
|
ADMINISTRATIVE & FINANCIAL COSTS |
|
|
|
|
|
|
|
– 0,04 |
|
|
– 0,04 |
– 0,04 |
|
– 0,04 |
|
* TOTAL ACP |
4,36 |
– 0,49 |
– 0,00 |
– 0,18 |
– 3,13 |
|
0,11 |
– 4,86 |
– 0,08 |
|
– 8,64 |
– 4,28 |
|
– 4,28 |
|
MAYOTTE |
|
|
|
|
|
|
|
|
|
|
|
|
|
|
|
NEW CALEDONIA |
|
|
|
|
|
|
0,01 |
|
|
|
0,01 |
0,01 |
|
0,01 |
|
FRENCH POLYNESIA |
0,05 |
|
|
|
|
|
|
|
|
|
|
0,05 |
|
0,05 |
|
SAINT PIERRE & MIQUELON |
|
|
|
|
|
|
|
|
|
|
|
|
|
|
|
FRENCH SOUTHERN TERRITORIES |
|
|
|
|
|
|
|
|
|
|
|
|
|
|
|
WALLIS & FUTUNA |
|
|
|
|
|
|
|
|
|
|
|
|
|
|
|
NAT. AID PROGR. RESERVE OCT F |
|
|
|
|
|
|
|
|
|
|
|
|
|
|
|
* TOTAL FRENCH OCT |
0,05 |
|
|
|
|
|
0,01 |
|
|
|
0,01 |
0,06 |
|
0,06 |
|
ARUBA |
– 0,03 |
|
|
|
|
|
|
|
|
|
|
– 0,03 |
|
– 0,03 |
|
DUTCH ANTILLES |
– 0,83 |
|
|
|
|
|
|
– 0,27 |
|
|
– 0,27 |
– 1,10 |
|
– 1,10 |
|
* TOTAL DUTCH OCT |
– 0,86 |
|
|
|
|
|
|
– 0,27 |
|
|
– 0,27 |
– 1,13 |
|
– 1,13 |
|
ANGUILLA |
|
|
|
|
|
|
|
|
|
|
|
|
|
|
|
CAYMANS |
|
|
|
|
|
|
|
|
|
|
|
|
|
|
|
FALKLANDS |
|
|
|
|
|
|
|
|
|
|
|
|
|
|
|
MONTSERRAT |
– 0,14 |
|
|
|
|
|
|
|
|
|
|
– 0,14 |
|
– 0,14 |
|
SAINT HELENA |
|
|
|
|
|
|
|
|
|
|
|
|
|
|
|
TURKS & CAICOS |
|
|
|
|
|
|
|
|
|
|
|
|
|
|
|
BRITISH VIRGIN ISLANDS |
|
|
|
|
|
|
|
|
|
|
|
|
|
|
|
* TOTAL BRITISH OCT |
– 0,14 |
|
|
|
|
|
|
|
|
|
|
– 0,14 |
|
– 0,14 |
|
OCT REGIONAL COOPERATION |
– 0,02 |
|
|
|
|
|
|
|
|
|
|
– 0,02 |
|
– 0,02 |
|
* OCT REGIONAL COOPERATION |
– 0,02 |
|
|
|
|
|
|
|
|
|
|
– 0,02 |
|
– 0,02 |
|
ALL OCT |
|
|
|
|
|
|
|
|
|
|
|
|
|
|
|
* TOTAL OCT |
– 0,97 |
|
|
|
|
|
0,01 |
– 0,27 |
|
|
– 0,26 |
– 1,23 |
|
– 1,23 |
|
* TOTAL ACP + OCT |
3,38 |
– 0,49 |
– 0,00 |
– 0,18 |
– 3,13 |
|
0,12 |
– 5,13 |
– 0,08 |
|
– 8,90 |
– 5,51 |
|
– 5,51 |
Table 3.1.7
7th EDF
Payments cumulative 2007
SITUATION BY INSTRUMENT AND STATE
|
(EUR million) |
||||||||||||||
|
|
Lome |
Total |
Cotonou |
Total state |
||||||||||
|
NIP |
Non NIP |
|||||||||||||
|
Grants |
Interest subsidies |
Emergency aid |
Refugee aid |
Risk capital |
Stabex |
Sysmin |
Tranfers from others funds |
SAF |
Heavily indebted poor countries |
Total non NIP |
||||
|
ANGOLA |
105,95 |
|
28,31 |
9,31 |
1,91 |
|
|
|
|
|
39,53 |
145,48 |
0,00 |
145,48 |
|
BENIN |
87,72 |
|
0,92 |
|
12,00 |
1,31 |
|
7,12 |
39,10 |
|
60,45 |
148,17 |
0,00 |
148,17 |
|
BURKINA FASO |
143,75 |
|
0,84 |
|
22,44 |
18,63 |
21,60 |
2,87 |
83,41 |
|
149,79 |
293,54 |
0,00 |
293,54 |
|
BOTSWANA |
30,08 |
16,45 |
|
0,23 |
2,53 |
|
33,71 |
2,23 |
|
|
55,15 |
85,23 |
0,00 |
85,23 |
|
BURUNDI |
77,41 |
|
17,05 |
|
|
54,56 |
|
2,56 |
11,92 |
|
86,08 |
163,49 |
0,00 |
163,49 |
|
CENTRAL AFRICAN REPUBLIC |
71,22 |
|
|
0,23 |
|
18,37 |
|
4,66 |
9,85 |
|
33,11 |
104,33 |
0,00 |
104,33 |
|
CHAD |
98,55 |
|
0,98 |
|
|
11,31 |
|
2,20 |
19,58 |
|
34,07 |
132,62 |
0,00 |
132,62 |
|
CAMEROON |
104,41 |
0,27 |
|
|
6,61 |
244,19 |
|
3,04 |
33,61 |
|
287,71 |
392,13 |
0,00 |
392,13 |
|
CONGO |
28,95 |
|
|
|
|
|
|
0,66 |
6,60 |
|
7,26 |
36,21 |
0,00 |
36,21 |
|
COMOROS |
20,17 |
|
|
|
2,43 |
4,29 |
|
0,60 |
6,50 |
|
13,82 |
33,99 |
0,00 |
33,99 |
|
CAPE VERDE |
23,22 |
|
0,18 |
|
11,71 |
1,20 |
|
0,25 |
|
|
13,34 |
36,56 |
0,00 |
36,56 |
|
DJIBOUTI |
17,42 |
|
0,42 |
0,47 |
0,50 |
|
|
0,19 |
4,10 |
|
5,67 |
23,10 |
0,00 |
23,10 |
|
EQUATORIAL GUINEA |
12,12 |
|
|
|
|
7,60 |
|
0,38 |
|
|
7,98 |
20,10 |
0,00 |
20,10 |
|
ERITREA |
45,89 |
|
1,75 |
3,73 |
8,00 |
|
|
|
|
|
13,48 |
59,36 |
0,00 |
59,36 |
|
ETHIOPIA |
199,08 |
|
6,95 |
7,07 |
52,43 |
179,49 |
|
3,80 |
78,10 |
|
327,85 |
526,92 |
0,00 |
526,92 |
|
GABON |
29,31 |
0,40 |
|
|
0,60 |
|
13,96 |
1,65 |
8,15 |
|
24,75 |
54,06 |
0,00 |
54,06 |
|
GHANA |
94,12 |
11,81 |
1,28 |
|
1,65 |
50,58 |
0,15 |
11,43 |
87,06 |
|
163,96 |
258,08 |
0,00 |
258,08 |
|
GAMBIA |
21,55 |
|
|
|
4,30 |
0,35 |
|
0,55 |
6,20 |
|
11,40 |
32,95 |
0,00 |
32,95 |
|
GUINEA-BISSAU |
34,95 |
|
1,20 |
|
4,63 |
1,28 |
|
5,35 |
9,48 |
|
21,94 |
56,89 |
0,00 |
56,89 |
|
GUINEA |
120,78 |
3,28 |
2,37 |
1,49 |
48,06 |
|
66,18 |
4,56 |
25,66 |
|
151,59 |
272,37 |
0,00 |
272,37 |
|
CÔTE D'IVOIRE |
103,17 |
6,12 |
0,83 |
2,53 |
11,55 |
269,68 |
|
3,66 |
77,12 |
|
371,49 |
474,66 |
0,00 |
474,66 |
|
KENYA |
126,30 |
10,65 |
9,31 |
0,86 |
44,53 |
84,80 |
|
5,13 |
|
|
155,28 |
281,58 |
0,00 |
281,58 |
|
LIBERIA |
|
|
16,09 |
4,32 |
|
|
|
12,72 |
|
|
33,13 |
33,13 |
0,00 |
33,13 |
|
LESOTHO |
45,41 |
6,89 |
|
|
17,18 |
3,71 |
|
4,98 |
21,59 |
|
54,34 |
99,75 |
0,00 |
99,75 |
|
MADAGASCAR |
130,33 |
|
1,65 |
|
12,71 |
55,50 |
|
5,90 |
10,80 |
|
86,55 |
216,89 |
0,00 |
216,89 |
|
MALAWI |
123,38 |
|
1,30 |
14,34 |
44,79 |
8,69 |
|
11,60 |
52,34 |
|
133,06 |
256,44 |
0,00 |
256,44 |
|
MAURITIUS |
31,63 |
12,15 |
|
|
5,10 |
|
|
0,60 |
|
|
17,85 |
49,48 |
0,00 |
49,48 |
|
MAURITANIA |
62,34 |
3,47 |
1,36 |
0,08 |
18,40 |
16,15 |
57,85 |
6,00 |
24,46 |
|
127,77 |
190,11 |
0,00 |
190,11 |
|
MALI |
141,17 |
5,02 |
1,21 |
0,68 |
20,81 |
0,94 |
11,61 |
7,74 |
61,32 |
|
109,33 |
250,50 |
0,00 |
250,50 |
|
MOZAMBIQUE |
158,84 |
|
6,16 |
26,08 |
28,16 |
3,64 |
|
|
30,00 |
|
94,04 |
252,88 |
0,00 |
252,88 |
|
NAMIBIA |
46,65 |
9,42 |
0,17 |
|
6,42 |
|
37,60 |
|
|
|
53,61 |
100,27 |
0,00 |
100,27 |
|
NIGER |
138,22 |
|
0,46 |
0,09 |
4,67 |
|
29,38 |
4,44 |
22,40 |
|
61,43 |
199,64 |
0,00 |
199,64 |
|
RWANDA |
115,63 |
|
24,43 |
0,64 |
14,00 |
41,62 |
|
2,69 |
|
|
83,38 |
199,01 |
0,00 |
199,01 |
|
SENEGAL |
104,58 |
2,35 |
0,65 |
0,69 |
13,10 |
32,27 |
|
6,38 |
32,50 |
|
87,94 |
192,52 |
0,00 |
192,52 |
|
SEYCHELLES |
5,26 |
|
|
|
3,00 |
|
|
0,05 |
|
|
3,05 |
8,31 |
0,00 |
8,31 |
|
SIERRA LEONE |
70,79 |
|
9,53 |
0,81 |
8,00 |
10,01 |
0,18 |
2,48 |
11,90 |
|
42,91 |
113,70 |
0,00 |
113,70 |
|
SOMALIA |
|
|
|
|
|
|
|
18,44 |
|
|
18,44 |
18,44 |
0,00 |
18,44 |
|
SAO TOME & PRINCIPE |
7,89 |
|
|
|
5,60 |
2,89 |
|
0,07 |
2,07 |
|
10,63 |
18,52 |
0,00 |
18,52 |
|
SUDAN |
|
|
39,83 |
|
|
101,32 |
|
0,24 |
|
|
141,39 |
141,39 |
0,00 |
141,39 |
|
SWAZILAND |
24,04 |
|
|
|
16,00 |
|
|
1,26 |
|
|
17,26 |
41,30 |
0,00 |
41,30 |
|
TANZANIA |
155,75 |
|
2,84 |
|
50,96 |
57,74 |
|
9,50 |
103,30 |
|
224,34 |
380,09 |
0,00 |
380,09 |
|
TOGO |
50,83 |
|
0,41 |
|
|
20,77 |
0,06 |
3,88 |
|
|
25,13 |
75,96 |
0,00 |
75,96 |
|
UGANDA |
154,12 |
0,78 |
1,41 |
0,75 |
38,86 |
144,07 |
|
2,34 |
51,61 |
4,59 |
244,42 |
398,54 |
0,00 |
398,54 |
|
NIGERIA |
195,59 |
9,97 |
1,03 |
|
2,50 |
|
|
0,93 |
|
|
14,43 |
210,02 |
0,00 |
210,02 |
|
ZAMBIA |
99,94 |
|
1,25 |
1,10 |
49,85 |
|
60,16 |
6,81 |
96,41 |
|
215,58 |
315,51 |
0,00 |
315,51 |
|
ZIMBABWE |
84,07 |
13,72 |
0,64 |
1,78 |
16,15 |
26,97 |
0,09 |
7,30 |
36,00 |
|
102,67 |
186,74 |
0,00 |
186,74 |
|
DEMOCRATIC REPUBLIC CONGO |
122,29 |
|
13,54 |
5,30 |
|
|
|
22,38 |
|
|
41,22 |
163,51 |
0,00 |
163,51 |
|
* TOTAL AFRICA |
3 664,86 |
112,75 |
196,38 |
82,57 |
612,14 |
1 473,90 |
332,52 |
201,61 |
1 063,14 |
4,59 |
4 079,61 |
7 744,47 |
|
7 744,47 |
|
ANTIGUA-BARBUDA |
2,94 |
|
0,66 |
|
|
|
|
0,05 |
|
|
0,70 |
3,64 |
0,00 |
3,64 |
|
BARBADOS |
2,86 |
5,40 |
|
|
|
|
|
0,95 |
|
|
6,34 |
9,20 |
0,00 |
9,20 |
|
BELIZE |
8,98 |
0,46 |
0,74 |
0,50 |
3,50 |
|
|
3,56 |
|
|
8,75 |
17,73 |
0,00 |
17,73 |
|
BAHAMAS |
4,29 |
6,91 |
|
|
|
|
|
0,36 |
|
|
7,27 |
11,57 |
0,00 |
11,57 |
|
DOMINICAN REPUBLIC |
80,01 |
1,15 |
|
|
25,23 |
|
19,61 |
|
22,78 |
|
68,77 |
148,77 |
0,00 |
148,77 |
|
DOMINICA |
4,34 |
|
|
|
2,50 |
14,94 |
|
0,00 |
2,15 |
|
19,59 |
23,93 |
0,00 |
23,93 |
|
GRENADA |
5,38 |
0,68 |
|
|
1,50 |
10,59 |
|
0,02 |
1,98 |
|
14,78 |
20,16 |
0,00 |
20,16 |
|
GUYANA (STATE) |
31,68 |
|
|
|
13,30 |
|
0,24 |
4,07 |
7,70 |
6,44 |
31,75 |
63,44 |
0,00 |
63,44 |
|
HAITI |
80,57 |
|
4,89 |
|
8,00 |
32,51 |
|
|
16,97 |
|
62,37 |
142,94 |
0,00 |
142,94 |
|
JAMAICA |
46,35 |
20,69 |
|
|
3,99 |
|
31,38 |
32,83 |
2,50 |
|
91,38 |
137,73 |
0,00 |
137,73 |
|
ST CHRISTOPHE (KITTS) & NEVIS |
2,48 |
|
|
|
2,00 |
|
|
0,23 |
|
|
2,23 |
4,71 |
0,00 |
4,71 |
|
SAINT LUCIA |
1,77 |
2,23 |
0,08 |
|
1,50 |
26,83 |
|
0,12 |
|
|
30,75 |
32,53 |
0,00 |
32,53 |
|
SURINAME |
16,10 |
|
|
0,50 |
0,65 |
|
0,16 |
4,42 |
|
|
5,73 |
21,83 |
0,00 |
21,83 |
|
SAINT VINCENT & GRENADINES |
3,22 |
|
|
|
5,00 |
31,57 |
|
0,10 |
|
|
36,67 |
39,89 |
0,00 |
39,89 |
|
TRINIDAD & TOBAGO |
9,27 |
15,46 |
|
|
8,07 |
|
|
0,98 |
6,20 |
|
30,71 |
39,98 |
0,00 |
39,98 |
|
* TOTAL CARIBBEAN |
300,24 |
52,96 |
6,36 |
1,00 |
75,24 |
116,46 |
51,39 |
47,68 |
60,28 |
6,44 |
417,81 |
718,05 |
|
718,05 |
|
FIJI |
21,87 |
1,20 |
1,00 |
|
0,06 |
|
|
0,88 |
|
|
3,14 |
25,00 |
0,00 |
25,00 |
|
KIRIBATI |
5,83 |
|
|
|
1,00 |
0,63 |
|
0,15 |
|
|
1,78 |
7,60 |
0,00 |
7,60 |
|
PAPUA-NEW GUINEA |
42,82 |
4,97 |
0,11 |
|
21,33 |
84,58 |
|
3,47 |
20,50 |
|
134,97 |
177,78 |
0,00 |
177,78 |
|
SOLOMON ISLANDS |
19,52 |
|
|
|
1,30 |
8,10 |
|
0,48 |
|
|
9,88 |
29,39 |
0,00 |
29,39 |
|
TONGA |
5,56 |
0,64 |
|
|
0,22 |
2,02 |
|
0,39 |
|
|
3,26 |
8,82 |
0,00 |
8,82 |
|
TUVALU |
1,06 |
|
|
|
0,30 |
0,03 |
|
0,04 |
|
|
0,38 |
1,44 |
0,00 |
1,44 |
|
VANUATU |
7,44 |
|
0,15 |
|
1,00 |
2,69 |
|
0,17 |
|
|
4,01 |
11,45 |
0,00 |
11,45 |
|
SAMOA |
8,92 |
|
0,30 |
|
5,50 |
5,78 |
|
0,04 |
|
|
11,62 |
20,54 |
0,00 |
20,54 |
|
* TOTAL PACIFIC |
113,00 |
6,80 |
1,57 |
|
30,71 |
103,82 |
|
5,63 |
20,50 |
|
169,03 |
282,03 |
|
282,03 |
|
INTRA ACP BUDGET |
|
|
|
|
|
|
|
|
|
|
|
0,00 |
50,00 |
50,00 |
|
ACP REGIONAL COOPERATION |
1 053,05 |
12,37 |
|
|
44,76 |
|
|
39,91 |
|
|
97,04 |
1 150,10 |
0,00 |
1 150,10 |
|
* TOTAL ACP REGIONAL COOPERATION |
1 053,05 |
12,37 |
|
|
44,76 |
|
|
39,91 |
|
|
97,04 |
1 150,10 |
50,00 |
1 200,10 |
|
ALL ACP COUNTRIES |
|
13,12 |
198,82 |
|
12,25 |
|
0,21 |
6,70 |
|
28,97 |
260,07 |
260,07 |
0,00 |
260,07 |
|
ADMINISTRATIVE & FINANCIAL COSTS |
2,66 |
|
|
|
|
|
|
0,36 |
4,69 |
|
5,05 |
7,72 |
0,00 |
7,72 |
|
* TOTAL ACP |
5 133,82 |
198,00 |
403,13 |
83,57 |
775,11 |
1 694,18 |
384,13 |
301,88 |
1 148,61 |
40,00 |
5 028,61 |
10 162,43 |
50,00 |
10 212,43 |
|
MAYOTTE |
6,69 |
|
0,49 |
|
4,90 |
|
|
|
|
|
5,39 |
12,08 |
0,00 |
12,08 |
|
NEW CALEDONIA |
12,43 |
0,64 |
0,25 |
|
6,00 |
|
2,05 |
2,20 |
|
|
11,14 |
23,56 |
0,00 |
23,56 |
|
FRENCH POLYNESIA |
12,82 |
0,92 |
0,11 |
|
3,91 |
0,93 |
|
1,50 |
|
|
7,37 |
20,20 |
0,00 |
20,20 |
|
SAINT PIERRE & MIQUELON |
3,00 |
|
|
|
|
|
|
0,54 |
|
|
0,54 |
3,54 |
0,00 |
3,54 |
|
FRENCH SOUTHERN TERRITORIES |
0,00 |
|
|
|
|
|
|
|
|
|
|
0,00 |
0,00 |
0,00 |
|
WALLIS & FUTUNA |
4,57 |
|
0,08 |
|
|
|
|
0,02 |
|
|
0,09 |
4,66 |
0,00 |
4,66 |
|
NAT. AID PROGR. RESERVE OCT F |
|
|
|
|
|
|
|
|
|
|
|
0,00 |
0,00 |
0,00 |
|
* TOTAL FRENCH OCT |
39,51 |
1,56 |
0,92 |
|
14,81 |
0,93 |
2,05 |
4,26 |
|
|
24,53 |
64,04 |
|
64,04 |
|
ARUBA |
6,97 |
0,07 |
|
|
|
|
|
0,10 |
|
|
0,17 |
7,14 |
0,00 |
7,14 |
|
DUTCH ANTILLES |
14,25 |
0,67 |
|
|
6,59 |
|
|
3,18 |
|
|
10,44 |
24,69 |
0,00 |
24,69 |
|
* TOTAL DUTCH OCT |
21,22 |
0,74 |
|
|
6,59 |
|
|
3,29 |
|
|
10,61 |
31,83 |
|
31,83 |
|
ANGUILLA |
2,72 |
|
|
|
|
|
|
0,35 |
|
|
0,35 |
3,07 |
0,00 |
3,07 |
|
CAYMANS |
|
1,07 |
|
0,09 |
|
|
|
|
|
|
1,17 |
1,17 |
0,00 |
1,17 |
|
FALKLANDS |
|
0,62 |
|
|
|
5,07 |
|
0,01 |
|
|
5,69 |
5,69 |
0,00 |
5,69 |
|
MONTSERRAT |
3,65 |
|
0,38 |
0,20 |
|
|
|
0,01 |
|
|
0,59 |
4,24 |
0,00 |
4,24 |
|
SAINT HELENA |
1,10 |
|
|
|
|
|
|
0,05 |
|
|
0,05 |
1,15 |
0,00 |
1,15 |
|
TURKS & CAICOS |
3,89 |
|
|
|
|
|
|
0,06 |
|
|
0,06 |
3,95 |
0,00 |
3,95 |
|
BRITISH VIRGIN ISLANDS |
2,39 |
0,19 |
|
|
1,10 |
|
|
0,12 |
|
|
1,41 |
3,80 |
0,00 |
3,80 |
|
* TOTAL BRITISH OCT |
13,75 |
1,88 |
0,38 |
0,29 |
1,10 |
5,07 |
|
0,59 |
|
|
9,31 |
23,06 |
|
23,06 |
|
OCT REGIONAL COOPERATION |
8,02 |
|
|
|
|
|
|
0,44 |
|
|
0,44 |
8,46 |
0,00 |
8,46 |
|
* OCT REGIONAL COOPERATION |
|
|
|
|
|
|
|
0,44 |
|
|
0,44 |
8,46 |
|
8,46 |
|
ALL OCT |
|
|
0,96 |
|
|
|
|
|
|
|
0,96 |
0,96 |
0,00 |
0,96 |
|
* TOTAL OCT |
82,50 |
4,18 |
2,26 |
0,29 |
22,49 |
6,00 |
2,05 |
8,57 |
|
|
45,85 |
128,34 |
|
128,34 |
|
* TOTAL ACP + OCT |
5 216,32 |
202,18 |
405,39 |
83,87 |
797,60 |
1 700,18 |
386,18 |
310,45 |
1 148,61 |
40,00 |
5 074,46 |
10 290,78 |
50,00 |
10 340,78 |
Table 3.1.8
7th EDF
Payments annual 2007
SITUATION BY INSTRUMENT AND STATE
|
(EUR million) |
||||||||||||||
|
|
Lome |
Total |
Cotonou |
Total state |
||||||||||
|
NIP |
Non NIP |
|||||||||||||
|
Grants |
Interest subsidies |
Emergency aid |
Refugee aid |
Risk capital |
Stabex |
Sysmin |
Transfers from others funds |
SAF |
Heavily indebted poor countries |
Total non NIP |
||||
|
ANGOLA |
1,36 |
|
|
|
|
|
|
|
|
|
|
1,36 |
|
1,36 |
|
BENIN |
0,38 |
|
|
|
|
|
|
|
|
|
|
0,38 |
|
0,38 |
|
BURKINA FASO |
1,59 |
|
|
|
|
|
|
|
|
|
|
1,59 |
|
1,59 |
|
BOTSWANA |
|
|
|
|
|
|
|
|
|
|
|
|
|
|
|
BURUNDI |
– 0,59 |
|
|
|
|
8,23 |
|
|
|
|
8,23 |
7,65 |
|
7,65 |
|
CENTRAL AFRICAN REPUBLIC |
– 0,02 |
|
|
|
|
|
|
|
|
|
|
– 0,02 |
|
– 0,02 |
|
CHAD |
0,24 |
|
|
|
|
|
|
|
|
|
|
0,24 |
|
0,24 |
|
CAMEROON |
– 0,00 |
|
|
|
|
|
|
|
|
|
|
– 0,00 |
|
– 0,00 |
|
CONGO |
0,06 |
|
|
|
|
|
|
|
|
|
|
0,06 |
|
0,06 |
|
COMOROS |
– 0,07 |
|
|
|
|
|
|
|
|
|
|
– 0,07 |
|
– 0,07 |
|
CAPE VERDE |
|
|
|
|
|
|
|
|
|
|
|
|
|
|
|
DJIBOUTI |
|
|
|
|
|
|
|
|
|
|
|
|
|
|
|
EQUATORIAL GUINEA |
|
|
|
|
|
|
|
|
|
|
|
|
|
|
|
ERITREA |
0,14 |
|
|
|
|
|
|
|
|
|
|
0,14 |
|
0,14 |
|
ETHIOPIA |
11,97 |
|
|
|
3,28 |
|
|
|
|
|
3,28 |
15,25 |
|
15,25 |
|
GABON |
|
|
|
|
|
|
|
|
|
|
|
|
|
|
|
GHANA |
0,26 |
|
|
|
|
|
|
|
|
|
|
0,26 |
|
0,26 |
|
GAMBIA |
|
|
|
|
|
|
|
0,02 |
|
|
0,02 |
0,02 |
|
0,02 |
|
GUINEA-BISSAU |
0,01 |
|
|
|
|
|
|
|
|
|
|
0,01 |
|
0,01 |
|
GUINEA |
|
|
|
|
|
|
3,02 |
|
|
|
3,02 |
3,02 |
|
3,02 |
|
CÔTE D'IVOIRE |
|
|
|
|
|
|
|
|
|
|
|
|
|
|
|
KENYA |
– 0,47 |
|
|
|
|
|
|
0,08 |
|
|
0,08 |
– 0,39 |
|
– 0,39 |
|
LIBERIA |
|
|
|
|
|
|
|
|
|
|
|
|
|
|
|
LESOTHO |
|
|
|
|
|
|
|
|
|
|
|
|
|
|
|
MADAGASCAR |
|
|
|
|
|
|
|
|
|
|
|
|
|
|
|
MALAWI |
0,16 |
|
|
|
|
|
|
|
|
|
|
0,16 |
|
0,16 |
|
MAURITIUS |
– 0,00 |
|
|
|
|
|
|
|
|
|
|
– 0,00 |
|
– 0,00 |
|
MAURITANIA |
0,05 |
|
|
|
|
|
|
|
|
|
|
0,05 |
|
0,05 |
|
MALI |
0,12 |
|
|
|
|
|
3,31 |
|
|
|
3,31 |
3,43 |
|
3,43 |
|
MOZAMBIQUE |
0,52 |
|
– 0,00 |
|
|
|
|
|
|
|
– 0,00 |
0,52 |
|
0,52 |
|
NAMIBIA |
0,00 |
|
|
|
|
|
|
|
|
|
|
0,00 |
|
0,00 |
|
NIGER |
|
|
|
|
|
|
0,10 |
|
|
|
0,10 |
0,10 |
|
0,10 |
|
RWANDA |
0,37 |
|
|
|
|
|
|
|
|
|
|
0,37 |
|
0,37 |
|
SENEGAL |
0,03 |
|
|
|
|
|
|
|
|
|
|
0,03 |
|
0,03 |
|
SEYCHELLES |
|
|
|
|
|
|
|
|
|
|
|
|
|
|
|
SIERRA LEONE |
0,53 |
|
|
|
|
|
|
|
|
|
|
0,53 |
|
0,53 |
|
SOMALIA |
|
|
|
|
|
|
|
|
|
|
|
|
|
|
|
SAO TOME & PRINCIPE |
– 0,00 |
|
|
|
|
|
|
|
|
|
|
– 0,00 |
|
– 0,00 |
|
SUDAN |
|
|
|
|
|
|
|
|
|
|
|
|
|
|
|
SWAZILAND |
0,10 |
|
|
|
|
|
|
|
|
|
|
0,10 |
|
0,10 |
|
TANZANIA |
– 0,05 |
|
|
|
|
|
|
– 0,01 |
|
|
– 0,01 |
– 0,06 |
|
– 0,06 |
|
TOGO |
3,56 |
|
|
|
|
|
|
0,29 |
|
|
0,29 |
3,86 |
|
3,86 |
|
UGANDA |
0,49 |
|
|
|
|
|
|
|
|
|
|
0,49 |
|
0,49 |
|
NIGERIA |
18,60 |
|
|
|
|
|
|
|
|
|
|
18,60 |
|
18,60 |
|
ZAMBIA |
|
|
|
|
|
|
|
|
|
|
|
|
|
|
|
ZIMBABWE |
– 0,05 |
|
|
|
|
|
|
– 0,01 |
|
|
– 0,01 |
– 0,06 |
|
– 0,06 |
|
DEMOCRATIC REPUBLIC CONGO |
15,91 |
|
|
|
|
|
|
|
|
|
|
15,91 |
|
15,91 |
|
* TOTAL AFRICA |
55,19 |
|
– 0,00 |
|
3,28 |
8,23 |
6,43 |
0,38 |
|
|
18,32 |
73,51 |
|
73,51 |
|
ANTIGUA-BARBUDA |
|
|
|
|
|
|
|
|
|
|
|
|
|
|
|
BARBADOS |
|
|
|
|
|
|
|
|
|
|
|
|
|
|
|
BELIZE |
|
|
|
|
|
|
|
|
|
|
|
|
|
|
|
BAHAMAS |
|
|
|
|
|
|
|
|
|
|
|
|
|
|
|
DOMINICAN REPUBLIC |
– 0,26 |
|
|
|
|
|
|
|
|
|
|
– 0,26 |
|
– 0,26 |
|
DOMINICA |
0,08 |
|
|
|
|
|
|
|
|
|
|
0,08 |
|
0,08 |
|
GRENADA |
|
|
|
|
|
|
|
|
|
|
|
|
|
|
|
GUYANA (STATE) |
– 0,08 |
|
|
|
|
|
|
|
|
|
|
– 0,08 |
|
– 0,08 |
|
HAITI |
|
|
|
|
|
|
|
|
|
|
|
|
|
|
|
JAMAICA |
0,04 |
|
|
|
1,00 |
|
13,02 |
0,01 |
|
|
14,03 |
14,08 |
|
14,08 |
|
ST KITTS & NEVIS |
|
|
|
|
|
|
|
|
|
|
|
|
|
|
|
SAINT LUCIA |
|
|
|
|
|
|
|
|
|
|
|
|
|
|
|
SURINAME |
– 0,01 |
|
|
|
|
|
|
|
|
|
|
– 0,01 |
|
– 0,01 |
|
SAINT VINCENT & GRENADINES |
|
|
|
|
|
|
|
|
|
|
|
|
|
|
|
TRINIDAD & TOBAGO |
|
|
|
|
1,00 |
|
|
|
|
|
1,00 |
1,00 |
|
1,00 |
|
* TOTAL CARIBBEAN |
– 0,23 |
|
|
|
2,00 |
|
13,02 |
0,01 |
|
|
15,03 |
14,81 |
|
14,81 |
|
FIJI |
|
|
|
|
|
|
|
|
|
|
|
|
|
|
|
KIRIBATI |
|
|
|
|
|
|
|
|
|
|
|
|
|
|
|
PAPUA-NEW GUINEA |
|
|
|
|
|
|
|
|
|
|
|
|
|
|
|
SOLOMON ISLANDS |
– 0,00 |
|
|
|
|
|
|
|
|
|
|
– 0,00 |
|
– 0,00 |
|
TONGA |
– 0,02 |
|
|
|
|
|
|
|
|
|
|
– 0,02 |
|
– 0,02 |
|
TUVALU |
|
|
|
|
|
|
|
|
|
|
|
|
|
|
|
VANUATU |
|
|
|
|
|
|
|
|
|
|
|
|
|
|
|
SAMOA |
|
|
|
|
|
|
|
|
|
|
|
|
|
|
|
* TOTAL PACIFIC |
– 0,02 |
|
|
|
|
|
|
|
|
|
|
– 0,02 |
|
– 0,02 |
|
INTRA ACP BUDGET |
|
|
|
|
|
|
|
|
|
|
|
|
|
|
|
ACP REGIONAL COOPERATION |
7,86 |
– 0,49 |
|
|
|
|
|
|
|
|
– 0,49 |
7,37 |
|
7,37 |
|
* TOTAL ACP REGIONAL COOPERATION |
7,86 |
– 0,49 |
|
|
|
|
|
|
|
|
– 0,49 |
7,37 |
|
7,37 |
|
ALL ACP COUNTRIES |
|
|
|
|
|
|
|
|
|
|
|
|
|
|
|
ADMINISTRATIVE & FINANCIAL COSTS |
|
|
|
|
|
|
|
|
|
|
|
|
|
|
|
* TOTAL ACP |
62,80 |
– 0,49 |
– 0,00 |
|
5,28 |
8,23 |
19,45 |
0,39 |
|
|
32,86 |
95,66 |
|
95,66 |
|
MAYOTTE |
|
|
|
|
|
|
|
|
|
|
|
|
|
|
|
NEW CALEDONIA |
|
|
|
|
|
|
0,76 |
|
|
|
0,76 |
0,76 |
|
0,76 |
|
FRENCH POLYNESIA |
|
|
|
|
|
|
|
|
|
|
|
|
|
|
|
SAINT PIERRE & MIQUELON |
|
|
|
|
|
|
|
|
|
|
|
|
|
|
|
FRENCH SOUTHERN TERRITORIES |
|
|
|
|
|
|
|
|
|
|
|
|
|
|
|
WALLIS & FUTUNA |
|
|
|
|
|
|
|
|
|
|
|
|
|
|
|
NAT. AID PROGR. RESERVE OCT F |
|
|
|
|
|
|
|
|
|
|
|
|
|
|
|
* TOTAL FRENCH OCT |
|
|
|
|
|
|
0,76 |
|
|
|
0,76 |
0,76 |
|
0,76 |
|
ARUBA |
|
|
|
|
|
|
|
|
|
|
|
|
|
|
|
DUTCH ANTILLES |
0,24 |
|
|
|
|
|
|
|
|
|
|
0,24 |
|
0,24 |
|
* TOTAL DUTCH OCT |
0,24 |
|
|
|
|
|
|
|
|
|
|
0,24 |
|
0,24 |
|
ANGUILLA |
|
|
|
|
|
|
|
|
|
|
|
|
|
|
|
CAYMANS |
|
|
|
|
|
|
|
|
|
|
|
|
|
|
|
FALKLANDS |
|
|
|
|
|
|
|
|
|
|
|
|
|
|
|
MONTSERRAT |
|
|
|
|
|
|
|
|
|
|
|
|
|
|
|
SAINT HELENA |
|
|
|
|
|
|
|
|
|
|
|
|
|
|
|
TURKS & CAICOS |
|
|
|
|
|
|
|
|
|
|
|
|
|
|
|
BRITISH VIRGIN ISLANDS |
|
|
|
|
|
|
|
|
|
|
|
|
|
|
|
* TOTAL BRITISH OCT |
|
|
|
|
|
|
|
|
|
|
|
|
|
|
|
OCT REGIONAL COOPERATION |
|
|
|
|
|
|
|
|
|
|
|
|
|
|
|
* OCT REGIONAL COOPERATION |
|
|
|
|
|
|
|
|
|
|
|
|
|
|
|
ALL OCT |
|
|
|
|
|
|
|
|
|
|
|
|
|
|
|
* TOTAL OCT |
0,24 |
|
|
|
|
|
0,76 |
|
|
|
0,76 |
1,00 |
|
1,00 |
|
* TOTAL ACP + OCT |
63,04 |
– 0,49 |
– 0,00 |
|
5,28 |
8,23 |
20,21 |
0,39 |
|
|
33,62 |
96,66 |
|
96,66 |
Table 3.2.1
8th EDF
Cumulative 2007
GLOBAL SITUATION BY STATE
|
(EUR million) |
|||||||||||||
|
|
Lome |
Cotonou |
Total |
||||||||||
|
NIP |
National indicative programmes |
Other aid |
|||||||||||
|
Decisions |
As % of NIP |
Payments |
As % of NIP |
Decisions |
As % of NIP |
Payments |
As % of NIP |
Decisions |
Decisions |
Assigned funds |
Payments |
||
|
ANGOLA |
83,99 |
83,99 |
100 % |
58,64 |
70 % |
27,55 |
33 % |
25,99 |
31 % |
|
111,54 |
98,38 |
84,63 |
|
BENIN |
113,80 |
113,80 |
100 % |
111,21 |
98 % |
59,54 |
52 % |
59,49 |
52 % |
|
173,33 |
171,45 |
170,70 |
|
BURKINA FASO |
174,32 |
174,32 |
100 % |
160,62 |
92 % |
103,26 |
59 % |
102,40 |
59 % |
117,96 |
395,54 |
391,38 |
373,64 |
|
BOTSWANA |
34,94 |
34,94 |
100 % |
29,32 |
84 % |
2,21 |
6 % |
0,96 |
3 % |
33,88 |
71,03 |
68,59 |
49,31 |
|
BURUNDI |
13,06 |
13,06 |
100 % |
13,06 |
100 % |
53,84 |
412 % |
50,60 |
388 % |
|
66,90 |
66,31 |
63,65 |
|
CENTRAL AFRICAN REPUBLIC |
56,76 |
56,76 |
100 % |
53,46 |
94 % |
29,61 |
52 % |
29,61 |
52 % |
|
86,37 |
84,68 |
83,07 |
|
CHAD |
149,20 |
149,20 |
100 % |
134,64 |
90 % |
74,17 |
50 % |
67,41 |
45 % |
|
223,36 |
221,58 |
202,06 |
|
CAMEROON |
103,54 |
103,54 |
100 % |
97,50 |
94 % |
134,14 |
130 % |
124,71 |
120 % |
|
237,68 |
235,07 |
222,21 |
|
CONGO |
11,82 |
11,82 |
100 % |
6,18 |
52 % |
3,63 |
31 % |
3,63 |
31 % |
|
15,45 |
11,77 |
9,81 |
|
COMOROS |
10,94 |
10,68 |
98 % |
10,49 |
96 % |
5,66 |
52 % |
5,60 |
51 % |
|
16,34 |
16,20 |
16,09 |
|
CAPE VERDE |
30,18 |
30,18 |
100 % |
25,73 |
85 % |
26,63 |
88 % |
25,99 |
86 % |
|
56,82 |
54,82 |
51,73 |
|
DJIBOUTI |
17,96 |
17,96 |
100 % |
15,75 |
88 % |
11,00 |
61 % |
10,68 |
59 % |
|
28,96 |
27,90 |
26,43 |
|
EQUATORIAL GUINEA |
3,63 |
3,63 |
100 % |
2,86 |
79 % |
0,79 |
22 % |
0,79 |
22 % |
|
4,42 |
4,37 |
3,65 |
|
ERITREA |
2,25 |
2,25 |
100 % |
2,25 |
100 % |
18,59 |
826 % |
17,38 |
772 % |
|
20,84 |
20,31 |
19,63 |
|
ETHIOPIA |
149,42 |
149,42 |
100 % |
115,46 |
77 % |
192,39 |
129 % |
164,88 |
110 % |
0,04 |
341,85 |
339,26 |
280,39 |
|
GABON |
37,39 |
37,39 |
100 % |
37,17 |
99 % |
39,91 |
107 % |
39,91 |
107 % |
35,00 |
112,30 |
107,16 |
88,98 |
|
GHANA |
124,82 |
124,82 |
100 % |
117,21 |
94 % |
95,64 |
77 % |
95,62 |
77 % |
40,00 |
260,47 |
252,61 |
232,47 |
|
GAMBIA |
19,22 |
19,22 |
100 % |
16,10 |
84 % |
13,52 |
70 % |
12,40 |
65 % |
|
32,73 |
30,94 |
28,50 |
|
GUINEA-BISSAU |
42,44 |
42,44 |
100 % |
33,37 |
79 % |
4,44 |
10 % |
4,08 |
10 % |
35,00 |
81,88 |
77,22 |
64,86 |
|
GUINEA |
110,80 |
110,80 |
100 % |
83,40 |
75 % |
21,36 |
19 % |
21,36 |
19 % |
|
132,16 |
121,56 |
104,76 |
|
CÔTE D'IVOIRE |
58,05 |
58,05 |
100 % |
28,83 |
50 % |
104,46 |
180 % |
102,89 |
177 % |
|
162,52 |
155,88 |
131,72 |
|
KENYA |
72,54 |
72,54 |
100 % |
59,38 |
82 % |
116,23 |
160 % |
116,23 |
160 % |
|
188,77 |
185,91 |
175,61 |
|
LIBERIA |
|
|
|
|
|
22,04 |
|
19,25 |
|
|
22,04 |
21,32 |
19,25 |
|
LESOTHO |
51,00 |
51,00 |
100 % |
47,56 |
93 % |
15,88 |
31 % |
15,87 |
31 % |
|
66,88 |
66,57 |
63,43 |
|
MADAGASCAR |
162,29 |
162,29 |
100 % |
157,87 |
97 % |
113,02 |
70 % |
112,34 |
69 % |
55,00 |
330,31 |
329,52 |
325,21 |
|
MALAWI |
189,21 |
189,21 |
100 % |
172,95 |
91 % |
73,41 |
39 % |
72,43 |
38 % |
35,00 |
297,62 |
291,74 |
264,80 |
|
MAURITIUS |
30,07 |
30,07 |
100 % |
30,07 |
100 % |
14,22 |
47 % |
3,34 |
11 % |
|
44,29 |
44,29 |
33,41 |
|
MAURITANIA |
59,95 |
59,95 |
100 % |
56,49 |
94 % |
75,21 |
125 % |
74,79 |
125 % |
45,00 |
180,17 |
134,90 |
131,79 |
|
MALI |
203,07 |
203,07 |
100 % |
191,21 |
94 % |
89,77 |
44 % |
89,77 |
44 % |
|
292,84 |
289,10 |
280,97 |
|
MOZAMBIQUE |
176,68 |
176,68 |
100 % |
153,25 |
87 % |
221,76 |
126 % |
221,18 |
125 % |
142,03 |
540,47 |
534,31 |
516,46 |
|
NAMIBIA |
50,63 |
50,63 |
100 % |
48,68 |
96 % |
22,89 |
45 % |
22,89 |
45 % |
|
73,52 |
72,93 |
71,57 |
|
NIGER |
115,61 |
115,61 |
100 % |
104,35 |
90 % |
39,86 |
34 % |
39,86 |
34 % |
55,57 |
211,04 |
195,78 |
177,17 |
|
RWANDA |
95,00 |
95,00 |
100 % |
93,02 |
98 % |
81,13 |
85 % |
74,99 |
79 % |
|
176,13 |
174,77 |
168,01 |
|
SENEGAL |
103,00 |
103,00 |
100 % |
95,36 |
93 % |
142,58 |
138 % |
125,00 |
121 % |
|
245,59 |
241,25 |
220,36 |
|
SEYCHELLES |
5,48 |
5,48 |
100 % |
5,46 |
100 % |
1,77 |
32 % |
1,77 |
32 % |
|
7,25 |
7,23 |
7,23 |
|
SIERRA LEONE |
64,60 |
64,60 |
100 % |
53,94 |
83 % |
35,78 |
55 % |
35,71 |
55 % |
|
100,39 |
93,09 |
89,65 |
|
SOMALIA |
50,00 |
50,00 |
100 % |
43,25 |
86 % |
|
0 % |
|
0 % |
|
50,00 |
48,81 |
43,25 |
|
SAO TOME & PRINCIPE |
9,09 |
9,09 |
100 % |
8,47 |
93 % |
3,71 |
41 % |
3,71 |
41 % |
|
12,80 |
12,78 |
12,18 |
|
SUDAN |
|
|
|
|
|
122,00 |
|
75,73 |
|
|
122,00 |
111,96 |
75,73 |
|
SWAZILAND |
23,48 |
23,48 |
100 % |
21,33 |
91 % |
36,99 |
158 % |
23,66 |
101 % |
4,00 |
64,47 |
64,35 |
46,45 |
|
TANZANIA |
203,67 |
203,67 |
100 % |
185,37 |
91 % |
277,22 |
136 % |
268,06 |
132 % |
|
480,89 |
476,48 |
453,43 |
|
TOGO |
|
|
|
|
|
9,71 |
|
1,24 |
|
|
9,71 |
1,24 |
1,24 |
|
UGANDA |
197,47 |
197,47 |
100 % |
156,81 |
79 % |
223,57 |
113 % |
223,28 |
113 % |
|
421,04 |
416,12 |
380,09 |
|
NIGERIA |
|
|
|
|
|
5,00 |
|
5,00 |
|
|
5,00 |
5,00 |
5,00 |
|
ZAMBIA |
137,97 |
137,97 |
100 % |
128,23 |
93 % |
293,66 |
213 % |
287,72 |
209 % |
|
431,63 |
425,86 |
415,95 |
|
ZIMBABWE |
87,29 |
87,29 |
100 % |
86,94 |
100 % |
18,54 |
21 % |
15,52 |
18 % |
|
105,84 |
105,31 |
102,46 |
|
DEMOCRATIC REPUBLIC CONGO |
20,96 |
20,96 |
100 % |
19,35 |
92 % |
29,20 |
139 % |
27,61 |
132 % |
|
50,16 |
48,50 |
46,96 |
|
* TOTAL AFRICA |
3 457,60 |
3 457,34 |
100 % |
3 072,57 |
89 % |
3 107,50 |
90 % |
2 923,35 |
85 % |
598,48 |
7 163,32 |
6 956,54 |
6 435,92 |
|
ANTIGUA-BARBUDA |
0,65 |
0,65 |
100 % |
0,50 |
76 % |
|
0 % |
|
0 % |
|
0,65 |
0,62 |
0,50 |
|
BARBADOS |
4,46 |
4,46 |
100 % |
3,18 |
71 % |
4,26 |
95 % |
2,71 |
61 % |
|
8,72 |
8,40 |
5,90 |
|
BELIZE |
10,51 |
10,51 |
100 % |
10,36 |
99 % |
8,70 |
83 % |
6,54 |
62 % |
0,13 |
19,34 |
19,19 |
17,03 |
|
BAHAMAS |
2,20 |
2,20 |
100 % |
2,20 |
100 % |
|
0 % |
|
0 % |
|
2,20 |
2,20 |
2,20 |
|
DOMINICAN REPUBLIC |
98,91 |
98,91 |
100 % |
86,92 |
88 % |
40,35 |
41 % |
32,38 |
33 % |
|
139,26 |
138,35 |
119,30 |
|
DOMINICA |
6,21 |
6,47 |
104 % |
6,24 |
101 % |
31,95 |
515 % |
31,87 |
514 % |
|
38,42 |
38,16 |
38,11 |
|
GRENADA |
0,57 |
0,57 |
100 % |
0,49 |
86 % |
2,87 |
502 % |
2,52 |
441 % |
|
3,45 |
3,41 |
3,02 |
|
GUYANA (STATE) |
31,26 |
31,26 |
100 % |
19,84 |
63 % |
25,09 |
80 % |
18,93 |
61 % |
|
56,35 |
52,57 |
38,77 |
|
HAITI |
64,25 |
64,25 |
100 % |
60,51 |
94 % |
24,80 |
39 % |
14,80 |
23 % |
|
89,05 |
88,54 |
75,31 |
|
JAMAICA |
54,01 |
54,01 |
100 % |
42,68 |
79 % |
90,87 |
168 % |
83,79 |
155 % |
27,74 |
172,62 |
167,77 |
153,35 |
|
ST CHRISTOPHE (KITTS) & NEVIS |
2,72 |
2,72 |
100 % |
2,72 |
100 % |
4,00 |
147 % |
4,00 |
147 % |
|
6,72 |
6,72 |
6,72 |
|
SAINT LUCIA |
1,36 |
1,36 |
100 % |
1,26 |
93 % |
52,85 |
3897 % |
34,36 |
2534 % |
|
54,21 |
52,92 |
35,63 |
|
SURINAME |
20,50 |
20,50 |
100 % |
9,11 |
44 % |
0,20 |
1 % |
0,20 |
1 % |
|
20,69 |
19,88 |
9,31 |
|
SAINT VINCENT & GRENADINES |
2,28 |
2,28 |
100 % |
1,62 |
71 % |
32,81 |
1436 % |
28,58 |
1251 % |
|
35,10 |
34,37 |
30,20 |
|
TRINIDAD & TOBAGO |
9,44 |
9,44 |
100 % |
6,25 |
66 % |
7,78 |
82 % |
4,78 |
51 % |
|
17,22 |
14,86 |
11,03 |
|
* TOTAL CARIBBEAN |
309,33 |
309,59 |
100 % |
253,89 |
82 % |
326,53 |
106 % |
265,46 |
86 % |
27,87 |
663,99 |
647,98 |
546,36 |
|
FIJI |
16,94 |
16,94 |
100 % |
16,91 |
100 % |
2,41 |
14 % |
2,41 |
14 % |
|
19,36 |
19,35 |
19,32 |
|
KIRIBATI |
9,35 |
9,35 |
100 % |
9,12 |
98 % |
0,78 |
8 % |
0,78 |
8 % |
|
10,13 |
10,04 |
9,90 |
|
PAPUA-NEW GUINEA |
43,85 |
43,85 |
100 % |
38,69 |
88 % |
11,13 |
25 % |
10,43 |
24 % |
50,00 |
104,99 |
99,14 |
69,79 |
|
SOLOMON ISLANDS |
14,22 |
14,22 |
100 % |
13,52 |
95 % |
76,82 |
540 % |
76,82 |
540 % |
|
91,05 |
90,72 |
90,34 |
|
TONGA |
5,03 |
5,03 |
100 % |
5,03 |
100 % |
0,47 |
9 % |
0,38 |
8 % |
|
5,50 |
5,49 |
5,41 |
|
TUVALU |
1,90 |
1,90 |
100 % |
1,90 |
100 % |
0,50 |
26 % |
0,35 |
19 % |
|
2,40 |
2,40 |
2,25 |
|
VANUATU |
10,23 |
10,23 |
100 % |
10,23 |
100 % |
5,54 |
54 % |
5,54 |
54 % |
5,27 |
21,04 |
21,04 |
20,96 |
|
SAMOA |
14,07 |
14,07 |
100 % |
14,07 |
100 % |
5,03 |
36 % |
5,03 |
36 % |
3,52 |
22,62 |
22,62 |
22,54 |
|
* TOTAL PACIFIC |
115,60 |
115,60 |
8,00 |
109,47 |
7,81 |
102,70 |
7,14 |
101,75 |
7,02 |
58,79 |
277,09 |
270,80 |
240,52 |
|
WESTERN AFRICA REGION |
211,35 |
211,35 |
100 % |
176,64 |
84 % |
59,57 |
28 % |
59,57 |
28 % |
|
270,92 |
260,51 |
236,22 |
|
CENTRAL AFRICA REGION |
77,46 |
77,46 |
100 % |
75,26 |
97 % |
5,30 |
7 % |
5,00 |
6 % |
|
82,76 |
81,54 |
80,26 |
|
EASTERN AFRICA REGION |
165,38 |
165,38 |
100 % |
119,64 |
72 % |
|
0 % |
|
0 % |
|
165,38 |
140,01 |
119,64 |
|
SOUTHERN AFRICA REGION |
66,98 |
66,98 |
100 % |
54,30 |
81 % |
16,40 |
24 % |
16,40 |
24 % |
|
83,38 |
80,17 |
70,70 |
|
INDIAN OCEAN REGION |
13,42 |
13,42 |
100 % |
10,72 |
80 % |
10,94 |
82 % |
6,91 |
51 % |
|
24,36 |
22,98 |
17,63 |
|
CARIBBEAN REGION |
45,14 |
45,14 |
100 % |
39,16 |
87 % |
24,68 |
55 % |
14,79 |
33 % |
|
69,82 |
68,47 |
53,94 |
|
PACIFIC REGION |
33,97 |
33,97 |
100 % |
30,90 |
91 % |
|
0 % |
|
0 % |
|
33,97 |
33,76 |
30,90 |
|
MULTI-REGIONAL (PALOP) |
10,83 |
10,83 |
100 % |
9,73 |
90 % |
|
0 % |
|
0 % |
|
10,83 |
10,83 |
9,73 |
|
INTRA ACP BUDGET |
749,80 |
749,80 |
100 % |
545,80 |
73 % |
|
0 % |
|
0 % |
|
749,80 |
672,32 |
545,80 |
|
* TOTAL ACP REGIONAL COOPERATION |
1 374,31 |
1 374,31 |
100 % |
1 062,15 |
77 % |
116,90 |
9 % |
102,67 |
7 % |
|
1 491,21 |
1 370,60 |
1 164,82 |
|
ALL ACP COUNTRIES |
0,00 |
|
|
|
|
1 155,30 |
|
1 140,59 |
|
|
1 155,30 |
1 155,30 |
1 140,59 |
|
ADMINISTRATIVE & FINANCIAL COSTS |
0,00 |
|
|
|
|
|
|
|
|
|
37,38 |
35,54 |
33,20 |
|
* TOTAL ACP |
5 256,84 |
5 256,84 |
100 % |
4 498,08 |
86 % |
4 808,92 |
91 % |
4 533,82 |
86 % |
685,15 |
10 788,30 |
10 436,77 |
9 561,39 |
|
MAYOTTE |
0,89 |
0,89 |
100 % |
0,86 |
97 % |
1,18 |
133 % |
1,18 |
133 % |
|
2,07 |
2,05 |
2,05 |
|
NEW CALEDONIA |
7,49 |
7,49 |
100 % |
7,45 |
99 % |
2,83 |
38 % |
2,24 |
30 % |
|
10,31 |
10,25 |
9,69 |
|
FRENCH POLYNESIA |
10,10 |
10,10 |
100 % |
10,10 |
100 % |
3,29 |
33 % |
3,29 |
33 % |
|
13,39 |
13,39 |
13,39 |
|
SAINT PIERRE & MIQUELON |
3,47 |
3,47 |
100 % |
3,47 |
100 % |
|
0 % |
|
0 % |
|
3,47 |
3,47 |
3,47 |
|
WALLIS & FUTUNA |
1,47 |
1,47 |
100 % |
1,43 |
97 % |
|
0 % |
|
0 % |
|
1,47 |
1,43 |
1,43 |
|
* TOTAL FRENCH OCT |
23,41 |
23,41 |
100 % |
23,31 |
100 % |
7,30 |
31 % |
6,72 |
29 % |
|
30,72 |
30,60 |
30,03 |
|
ARUBA |
0,40 |
0,40 |
100 % |
0,40 |
100 % |
0,50 |
125 % |
|
0 % |
|
0,90 |
0,90 |
0,40 |
|
DUTCH ANTILLES |
5,21 |
5,21 |
100 % |
3,19 |
61 % |
|
0 % |
|
0 % |
|
5,21 |
4,50 |
3,19 |
|
* TOTAL DUTCH OCT |
5,61 |
5,61 |
100 % |
3,59 |
64 % |
0,50 |
9 % |
|
|
|
6,11 |
5,40 |
3,59 |
|
ANGUILLA |
0,80 |
0,80 |
100 % |
0,80 |
100 % |
|
0 % |
|
0 % |
|
0,80 |
0,80 |
0,80 |
|
MONTSERRAT |
1,70 |
1,70 |
100 % |
1,58 |
93 % |
|
0 % |
|
0 % |
|
1,70 |
1,65 |
1,58 |
|
SAINT HELENA |
0,06 |
0,06 |
100 % |
0,06 |
100 % |
|
0 % |
|
0 % |
|
0,06 |
0,06 |
0,06 |
|
TURKS & CAICOS |
|
|
|
|
|
3,00 |
|
3,00 |
|
|
3,00 |
3,00 |
3,00 |
|
BRITISH VIRGIN ISLANDS |
|
|
|
|
|
0,51 |
|
0,51 |
|
|
0,51 |
0,51 |
0,51 |
|
* TOTAL BRITISH OCT |
2,56 |
2,56 |
100 % |
2,44 |
95 % |
3,51 |
137 % |
3,51 |
137 % |
|
6,08 |
6,02 |
5,96 |
|
OCT F REGIONAL COOPERATION |
5,42 |
5,42 |
1,00 |
4,03 |
74 % |
|
0 % |
|
0 % |
|
5,42 |
5,37 |
4,03 |
|
OCT N REGIONAL COOPERATION |
1,00 |
1,00 |
1,00 |
0,46 |
45 % |
|
0 % |
|
0 % |
|
1,00 |
0,46 |
0,46 |
|
PTU REGIONAL COOPERATION |
1,64 |
1,64 |
1,00 |
|
0 % |
|
0 % |
|
0 % |
|
1,64 |
|
|
|
* OCT REGIONAL COOPERATION |
8,06 |
8,06 |
100 % |
4,48 |
56 % |
|
|
|
|
|
8,06 |
5,83 |
4,48 |
|
* TOTAL OCT |
39,65 |
39,65 |
4,00 |
33,82 |
3,14 |
11,31 |
1,77 |
10,23 |
1,66 |
|
50,96 |
47,85 |
44,05 |
|
* TOTAL ACP + OCT |
5 296,49 |
5 296,49 |
100 % |
4 531,90 |
86 % |
4 820,24 |
91 % |
4 544,05 |
86 % |
685,15 |
10 839,26 |
10 484,62 |
9 605,45 |
Table 3.2.2
8th EDF
Annual 2007
GLOBAL SITUATION BY STATE
|
(EUR million) |
|||||||||||||
|
|
Lome |
Cotonou |
Total |
||||||||||
|
NIP |
National indicative programmes |
Other aid |
|||||||||||
|
Decisions |
As % of NIP |
Payments |
As % of NIP |
Decisions |
As % of NIP |
Payments |
As % of NIP |
Decisions |
Decisions |
Assigned funds |
Payments |
||
|
ANGOLA |
83,99 |
– 0,08 |
0 % |
4,90 |
6 % |
– 0,00 |
0 % |
– 0,00 |
0 % |
|
– 0,08 |
4,42 |
4,90 |
|
BENIN |
113,80 |
– 4,22 |
– 4 % |
5,13 |
5 % |
0,00 |
0 % |
|
0 % |
|
– 4,22 |
– 2,08 |
5,13 |
|
BURKINA FASO |
174,32 |
– 4,04 |
– 2 % |
8,17 |
5 % |
0,01 |
0 % |
0,78 |
0 % |
|
– 4,02 |
7,05 |
11,08 |
|
BOTSWANA |
34,94 |
– 1,80 |
– 5 % |
9,29 |
27 % |
|
0 % |
0,85 |
2 % |
|
– 1,80 |
15,25 |
13,11 |
|
BURUNDI |
13,06 |
– 0,02 |
0 % |
|
0 % |
0,66 |
5 % |
18,76 |
144 % |
|
0,64 |
1,78 |
18,76 |
|
CENTRAL AFRICAN REPUBLIC |
56,76 |
– 0,00 |
0 % |
1,59 |
3 % |
– 0,00 |
0 % |
– 0,00 |
0 % |
|
– 0,00 |
– 0,08 |
1,58 |
|
CHAD |
149,20 |
– 0,48 |
0 % |
5,34 |
4 % |
– 1,15 |
– 1 % |
0,01 |
0 % |
|
– 1,64 |
3,84 |
5,35 |
|
CAMEROON |
103,54 |
– 0,33 |
0 % |
2,14 |
2 % |
– 0,33 |
0 % |
5,52 |
5 % |
|
– 0,66 |
0,21 |
7,66 |
|
CONGO |
11,82 |
– 10,06 |
– 85 % |
0,50 |
4 % |
– 0,71 |
– 6 % |
|
0 % |
|
– 10,76 |
1,17 |
0,50 |
|
COMOROS |
10,94 |
– 0,31 |
– 3 % |
0,18 |
2 % |
0,00 |
0 % |
|
0 % |
|
– 0,31 |
– 0,37 |
0,18 |
|
CAPE VERDE |
30,18 |
– 0,36 |
– 1 % |
3,44 |
11 % |
– 0,23 |
– 1 % |
|
0 % |
|
– 0,59 |
2,23 |
3,44 |
|
DJIBOUTI |
17,96 |
– 1,47 |
– 8 % |
2,26 |
13 % |
|
0 % |
|
0 % |
|
– 1,47 |
1,63 |
2,26 |
|
EQUATORIAL GUINEA |
3,63 |
– 0,53 |
– 15 % |
0,15 |
4 % |
|
0 % |
|
0 % |
|
– 0,53 |
– 0,01 |
0,15 |
|
ERITREA |
2,25 |
|
0 % |
|
0 % |
|
0 % |
– 0,44 |
– 20 % |
|
|
– 0,44 |
– 0,44 |
|
ETHIOPIA |
149,42 |
– 0,68 |
0 % |
9,91 |
7 % |
– 5,81 |
– 4 % |
1,00 |
1 % |
|
– 6,48 |
0,58 |
10,91 |
|
GABON |
37,39 |
– 0,07 |
0 % |
0,90 |
2 % |
– 1,00 |
– 3 % |
– 0,00 |
0 % |
|
– 1,06 |
5,65 |
5,06 |
|
GHANA |
124,82 |
– 0,81 |
– 1 % |
11,18 |
9 % |
– 0,20 |
0 % |
0,02 |
0 % |
|
– 1,01 |
1,23 |
18,47 |
|
GAMBIA |
19,22 |
– 2,81 |
– 15 % |
0,06 |
0 % |
– 4,34 |
– 23 % |
|
0 % |
|
– 7,15 |
– 1,68 |
0,06 |
|
GUINEA– BISSAU |
42,44 |
– 4,70 |
– 11 % |
5,22 |
12 % |
0,01 |
0 % |
|
0 % |
|
– 4,68 |
1,20 |
15,91 |
|
GUINEA |
110,80 |
– 9,04 |
– 8 % |
8,91 |
8 % |
– 12,00 |
– 11 % |
|
0 % |
|
– 21,04 |
– 10,96 |
8,91 |
|
CÔTE D'IVOIRE |
58,05 |
– 1,08 |
– 2 % |
10,39 |
18 % |
0,40 |
1 % |
14,73 |
25 % |
|
– 0,68 |
12,27 |
25,11 |
|
KENYA |
72,54 |
– 0,89 |
– 1 % |
7,45 |
10 % |
– 0,13 |
0 % |
– 0,13 |
0 % |
|
– 1,02 |
4,30 |
7,32 |
|
LIBERIA |
|
0,00 |
|
|
|
– 2,96 |
|
0,37 |
|
|
– 2,96 |
– 0,86 |
0,37 |
|
LESOTHO |
51,00 |
– 2,72 |
– 5 % |
1,07 |
2 % |
– 2,22 |
– 4 % |
|
0 % |
|
– 4,93 |
– 0,49 |
1,07 |
|
MADAGASCAR |
162,29 |
|
0 % |
6,40 |
4 % |
0,03 |
0 % |
1,73 |
1 % |
|
0,03 |
2,69 |
8,13 |
|
MALAWI |
189,21 |
– 2,78 |
– 1 % |
3,25 |
2 % |
– 0,27 |
0 % |
– 0,00 |
0 % |
|
– 3,05 |
10,02 |
8,43 |
|
MAURITIUS |
30,07 |
– 0,26 |
– 1 % |
0,03 |
0 % |
|
0 % |
|
0 % |
|
– 0,26 |
– 0,24 |
0,03 |
|
MAURITANIA |
59,95 |
– 2,69 |
– 4 % |
2,63 |
4 % |
0,71 |
1 % |
18,56 |
31 % |
|
– 1,99 |
1,93 |
21,71 |
|
MALI |
203,07 |
– 0,23 |
0 % |
10,19 |
5 % |
|
0 % |
— |
0 % |
|
– 0,23 |
1,66 |
10,19 |
|
MOZAMBIQUE |
176,68 |
– 12,89 |
– 7 % |
6,43 |
4 % |
– 0,85 |
0 % |
35,00 |
20 % |
|
– 13,74 |
3,73 |
41,43 |
|
NAMIBIA |
50,63 |
– 0,00 |
0 % |
0,76 |
1 % |
|
0 % |
|
0 % |
|
– 0,00 |
0,11 |
0,76 |
|
NIGER |
115,61 |
– 4,27 |
– 4 % |
8,08 |
7 % |
|
0 % |
|
0 % |
|
– 4,27 |
6,31 |
11,23 |
|
RWANDA |
95,00 |
– 1,97 |
– 2 % |
5,90 |
6 % |
0,24 |
0 % |
|
0 % |
|
– 1,73 |
2,14 |
5,90 |
|
SENEGAL |
103,00 |
– 4,95 |
– 5 % |
5,09 |
5 % |
– 4,05 |
– 4 % |
0,05 |
0 % |
|
– 9,00 |
– 8,04 |
5,15 |
|
SEYCHELLES |
5,48 |
– 0,09 |
– 2 % |
0,42 |
8 % |
|
0 % |
|
0 % |
|
– 0,09 |
– 0,08 |
0,42 |
|
SIERRA LEONE |
64,60 |
– 1,34 |
– 2 % |
5,45 |
8 % |
0,12 |
0 % |
3,19 |
5 % |
|
– 1,22 |
– 2,59 |
8,64 |
|
SOMALIA |
50,00 |
|
0 % |
3,00 |
6 % |
|
0 % |
|
0 % |
|
|
– 1,17 |
3,00 |
|
SAO TOME & PRINCIPE |
9,09 |
– 2,40 |
– 26 % |
0,10 |
1 % |
– 0,26 |
– 3 % |
|
0 % |
|
– 2,66 |
– 0,51 |
0,10 |
|
SUDAN |
|
|
|
|
|
1,91 |
|
7,83 |
|
|
1,91 |
|
7,83 |
|
SWAZILAND |
23,48 |
– 1,05 |
– 4 % |
1,46 |
6 % |
|
0 % |
0,62 |
3 % |
|
– 1,05 |
0,52 |
2,39 |
|
TANZANIA |
203,67 |
|
0 % |
22,70 |
11 % |
0,23 |
0 % |
15,73 |
8 % |
|
0,23 |
0,63 |
38,43 |
|
TOGO |
|
|
|
|
|
– 3,69 |
|
|
|
|
– 3,69 |
|
0,00 |
|
UGANDA |
197,47 |
– 2,26 |
– 1 % |
18,10 |
9 % |
– 1,64 |
– 1 % |
9,78 |
5 % |
|
– 3,90 |
7,12 |
27,88 |
|
NIGERIA |
|
|
|
|
|
|
|
|
|
|
|
|
0,00 |
|
ZAMBIA |
137,97 |
– 2,16 |
– 2 % |
5,48 |
4 % |
– 1,22 |
– 1 % |
1,65 |
1 % |
|
– 3,38 |
– 1,60 |
7,13 |
|
ZIMBABWE |
87,29 |
– 3,74 |
– 4 % |
– 0,42 |
0 % |
0,12 |
0 % |
|
0 % |
|
– 3,63 |
– 3,39 |
– 0,42 |
|
DEMOCRATIC REPUBLIC CONGO |
20,96 |
– 0,88 |
– 4 % |
0,33 |
2 % |
– 1,69 |
– 8 % |
0,37 |
2 % |
|
– 2,58 |
– 2,96 |
0,70 |
|
* TOTAL AFRICA |
3 457,60 |
– 90,45 |
– 3 % |
203,53 |
6 % |
– 40,32 |
– 1 % |
135,98 |
4 % |
|
– 130,77 |
62,12 |
375,89 |
|
ANTIGUA– BARBUDA |
0,65 |
|
0 % |
0,06 |
9 % |
|
0 % |
|
0 % |
|
|
|
0,06 |
|
BARBADOS |
4,46 |
– 0,42 |
– 9 % |
1,54 |
34 % |
|
0 % |
|
0 % |
|
– 0,42 |
– 0,00 |
1,54 |
|
BELIZE |
10,51 |
– 0,06 |
– 1 % |
– 0,02 |
0 % |
|
0 % |
|
0 % |
|
– 0,06 |
– 0,14 |
– 0,02 |
|
BAHAMAS |
2,20 |
|
0 % |
|
0 % |
|
0 % |
|
0 % |
|
|
|
0,00 |
|
DOMINICAN REPUBLIC |
98,91 |
– 2,83 |
– 3 % |
10,12 |
10 % |
|
0 % |
– 0,02 |
0 % |
|
– 2,83 |
3,02 |
10,09 |
|
DOMINICA |
6,21 |
– 0,05 |
– 1 % |
1,88 |
30 % |
0,00 |
0 % |
0,19 |
3 % |
|
– 0,04 |
– 0,16 |
2,07 |
|
GRENADA |
0,57 |
– 1,02 |
– 178 % |
0,00 |
0 % |
0,01 |
2 % |
|
0 % |
|
– 1,00 |
– 0,08 |
0,00 |
|
GUYANA (STATE) |
31,26 |
|
0 % |
5,10 |
16 % |
– 20,00 |
– 64 % |
1,07 |
3 % |
|
– 20,00 |
– 16,05 |
6,17 |
|
HAITI |
64,25 |
– 6,62 |
– 10 % |
12,30 |
19 % |
|
0 % |
|
0 % |
|
– 6,62 |
– 5,67 |
12,30 |
|
JAMAICA |
54,01 |
– 1,34 |
– 2 % |
1,15 |
2 % |
0,02 |
0 % |
4,14 |
8 % |
– 2,26 |
– 3,58 |
– 1,47 |
6,59 |
|
ST CHRISTOPHE (KITTS) & NEVIS |
2,72 |
|
0 % |
|
0 % |
|
0 % |
|
0 % |
|
|
|
0,00 |
|
SAINT LUCIA |
1,36 |
|
0 % |
|
0 % |
0,56 |
41 % |
|
0 % |
|
0,56 |
|
0,00 |
|
SURINAME |
20,50 |
– 1,46 |
– 7 % |
1,29 |
6 % |
|
0 % |
|
0 % |
|
– 1,46 |
– 0,94 |
1,29 |
|
SAINT VINCENT & GRENADINES |
2,28 |
|
0 % |
0,03 |
1 % |
0,16 |
7 % |
|
0 % |
|
0,16 |
|
0,03 |
|
TRINIDAD & TOBAGO |
9,44 |
– 0,32 |
– 3 % |
1,37 |
14 % |
|
0 % |
1,00 |
11 % |
|
– 0,32 |
– 0,21 |
2,37 |
|
* TOTAL CARIBBEAN |
309,33 |
– 14,12 |
– 5 % |
34,82 |
11 % |
– 19,23 |
– 6 % |
6,37 |
2 % |
– 2,26 |
– 35,61 |
– 21,71 |
42,50 |
|
FIJI |
16,94 |
– 0,36 |
– 2 % |
0,13 |
1 % |
|
0 % |
|
0 % |
|
– 0,36 |
0,09 |
0,13 |
|
KIRIBATI |
9,35 |
– 2,41 |
– 26 % |
0,32 |
3 % |
|
0 % |
|
0 % |
|
– 2,41 |
0,10 |
0,32 |
|
PAPUA– NEW GUINEA |
43,85 |
– 2,83 |
– 6 % |
2,15 |
5 % |
0,00 |
0 % |
|
0 % |
|
– 2,83 |
2,26 |
13,60 |
|
SOLOMON ISLANDS |
14,22 |
– 0,26 |
– 2 % |
0,01 |
0 % |
0,00 |
0 % |
0,08 |
1 % |
|
– 0,25 |
– 0,37 |
0,09 |
|
TONGA |
5,03 |
– 0,54 |
– 11 % |
|
0 % |
0,00 |
0 % |
|
0 % |
|
– 0,53 |
– 0,54 |
0,00 |
|
TUVALU |
1,90 |
|
0 % |
|
0 % |
|
0 % |
|
0 % |
|
|
|
0,00 |
|
VANUATU |
10,23 |
|
0 % |
|
0 % |
|
0 % |
|
0 % |
– 0,00 |
– 0,00 |
0,25 |
0,63 |
|
SAMOA |
14,07 |
|
0 % |
|
0 % |
|
0 % |
|
0 % |
– 0,76 |
– 0,76 |
– 0,64 |
0,30 |
|
* TOTAL PACIFIC |
115,60 |
– 6,39 |
– 6 % |
2,61 |
2 % |
0,01 |
0 % |
0,08 |
0 % |
– 0,76 |
– 7,14 |
1,16 |
15,07 |
|
WESTERN AFRICA REGION |
211,35 |
– 3,35 |
– 2 % |
6,07 |
3 % |
|
0 % |
|
0 % |
|
– 3,35 |
0,26 |
6,07 |
|
CENTRAL AFRICA REGION |
77,46 |
– 0,25 |
0 % |
2,09 |
3 % |
|
0 % |
1,25 |
2 % |
|
– 0,25 |
0,47 |
3,34 |
|
EASTERN AFRICA REGION |
165,38 |
– 1,01 |
– 1 % |
13,31 |
8 % |
|
0 % |
|
0 % |
|
– 1,01 |
– 3,53 |
13,31 |
|
SOUTHERN AFRICA REGION |
66,98 |
– 5,50 |
– 8 % |
3,21 |
5 % |
|
0 % |
|
0 % |
|
– 5,50 |
– 3,71 |
3,21 |
|
INDIAN OCEAN REGION |
13,42 |
– 0,42 |
– 3 % |
0,86 |
6 % |
|
0 % |
0,35 |
3 % |
|
– 0,42 |
– 1,29 |
1,21 |
|
CARIBBEAN REGION |
45,14 |
– 0,71 |
– 2 % |
2,24 |
5 % |
– 1,62 |
– 4 % |
1,44 |
3 % |
|
– 2,33 |
– 0,63 |
3,68 |
|
PACIFIC REGION |
33,97 |
– 0,65 |
– 2 % |
3,09 |
9 % |
|
0 % |
|
0 % |
|
– 0,65 |
– 0,61 |
3,09 |
|
MULTI– REGIONAL (PALOP) |
10,83 |
– 1,09 |
– 10 % |
1,20 |
11 % |
|
0 % |
|
0 % |
|
– 1,09 |
1,24 |
1,20 |
|
INTRA ACP BUDGET |
749,80 |
– 10,83 |
– 1 % |
23,70 |
3 % |
|
0 % |
|
0 % |
|
– 10,83 |
8,17 |
23,70 |
|
* TOTAL ACP REGIONAL COOPERATION |
1 374,31 |
– 23,81 |
– 2 % |
55,77 |
4 % |
– 1,62 |
|
3,04 |
0 % |
|
– 25,42 |
0,37 |
58,81 |
|
ALL ACP COUNTRIES |
|
|
|
|
|
– 7,82 |
|
– 11,69 |
|
|
– 7,82 |
– 7,82 |
– 11,69 |
|
ADMINISTRATIVE & FINANCIAL COSTS |
0,00 |
|
|
|
|
|
|
|
|
|
|
0,51 |
0,75 |
|
* TOTAL ACP |
5 256,84 |
– 134,77 |
– 3 % |
296,73 |
6 % |
– 68,99 |
– 1 % |
133,78 |
3 % |
– 3,02 |
– 206,77 |
34,62 |
481,32 |
|
MAYOTTE |
0,89 |
|
0 % |
0,03 |
3 % |
|
0 % |
|
0 % |
|
— |
– 0,00 |
0,03 |
|
NEW CALEDONIA |
7,49 |
– 2,71 |
– 36 % |
0,01 |
0 % |
|
0 % |
0,43 |
6 % |
|
– 2,71 |
– 0,55 |
0,44 |
|
FRENCH POLYNESIA |
10,10 |
– 0,07 |
– 1 % |
– 0,04 |
0 % |
|
0 % |
|
0 % |
|
– 0,07 |
– 0,04 |
– 0,04 |
|
SAINT PIERRE & MIQUELON |
3,47 |
|
0 % |
|
0 % |
|
0 % |
|
0 % |
|
|
|
0,00 |
|
WALLIS & FUTUNA |
1,47 |
|
0 % |
– 0,00 |
0 % |
|
0 % |
|
0 % |
|
|
|
0,00 |
|
* TOTAL FRENCH OCT |
23,41 |
– 2,78 |
– 12 % |
– 0,01 |
0 % |
0,00 |
0 % |
0,43 |
2 % |
|
– 2,78 |
– 0,60 |
0,42 |
|
ARUBA |
0,40 |
|
0 % |
|
0 % |
|
0 % |
|
0 % |
|
|
|
0,00 |
|
DUTCH ANTILLES |
5,21 |
– 0,17 |
– 3 % |
0,97 |
19 % |
|
0 % |
|
0 % |
|
– 0,17 |
1,10 |
0,97 |
|
* TOTAL DUTCH OCT |
5,61 |
– 0,17 |
– 3 % |
0,97 |
17 % |
|
|
|
|
|
– 0,17 |
1,10 |
0,97 |
|
ANGUILLA |
0,80 |
– 0,95 |
– 120 % |
|
0 % |
|
0 % |
|
0 % |
|
– 0,95 |
|
0,00 |
|
MONTSERRAT |
1,70 |
– 0,35 |
– 21 % |
0,33 |
20 % |
|
0 % |
|
0 % |
|
– 0,35 |
– 0,09 |
0,33 |
|
SAINT HELENA |
0,06 |
|
0 % |
|
0 % |
|
0 % |
|
0 % |
|
|
|
0,00 |
|
TURKS & CAICOS |
|
|
|
|
|
|
|
|
|
|
|
|
0,00 |
|
BRITISH VIRGIN ISLANDS |
|
|
|
|
|
|
|
|
|
|
|
|
0,00 |
|
* TOTAL BRITISH OCT |
2,56 |
– 1,31 |
– 51 % |
0,33 |
13 % |
|
|
|
|
|
– 1,31 |
– 0,09 |
0,33 |
|
OCT F REGIONAL COOPERATION |
5,42 |
|
0,00 |
0,37 |
7 % |
|
0 % |
|
0 % |
|
|
– 0,00 |
0,37 |
|
OCT N REGIONAL COOPERATION |
1,00 |
|
0,00 |
|
0 % |
|
0 % |
|
0 % |
|
|
|
0,00 |
|
PTU REGIONAL COOPERATION |
1,64 |
|
0,00 |
|
0 % |
|
0 % |
|
0 % |
|
|
|
0,00 |
|
* OCT REGIONAL COOPERATION |
8,06 |
0,00 |
0 % |
0,37 |
5 % |
|
|
|
|
|
|
0,00 |
0,37 |
|
* TOTAL OCT |
39,65 |
– 4,26 |
– 0,66 |
1,66 |
0,35 |
0,00 |
|
0,43 |
0,02 |
|
– 4,26 |
0,40 |
2,09 |
|
* TOTAL ACP + OCT |
5 296,49 |
– 139,03 |
– 3 % |
298,39 |
6 % |
– 68,99 |
– 1 % |
134,21 |
3 % |
– 3,02 |
– 211,03 |
35,03 |
483,42 |
Table 3.2.3
8th EDF
Decisions cumulative 2007
SITUATION BY INSTRUMENT AND STATE
|
(EUR million) |
||||||||||||||||
|
|
Lome |
Cotonou |
Total State |
|||||||||||||
|
NIP |
Non NIP |
Interests |
Total |
Envelope A |
Envelope B |
Total |
||||||||||
|
Grants |
Interest subsidies |
Emergency aid |
Refugee aid |
Risk capital |
Stabex |
Sysmin |
SAF |
Heavily indebted poor countries |
Total non NIP |
|||||||
|
ANGOLA |
83,99 |
|
11,25 |
16,30 |
|
|
|
|
|
27,55 |
|
111,54 |
|
|
|
111,54 |
|
BENIN |
113,80 |
|
|
|
5,76 |
1,02 |
|
52,76 |
|
59,54 |
|
173,33 |
|
|
|
173,33 |
|
BURKINA FASO |
174,32 |
|
0,10 |
|
14,00 |
1,56 |
|
87,60 |
|
103,26 |
|
277,58 |
117,96 |
|
117,96 |
395,54 |
|
BOTSWANA |
34,94 |
2,10 |
|
|
|
|
0,11 |
|
|
2,21 |
|
37,15 |
3,88 |
30,00 |
33,88 |
71,03 |
|
BURUNDI |
13,06 |
|
|
25,00 |
|
19,59 |
|
9,25 |
|
53,84 |
|
66,90 |
|
|
|
66,90 |
|
CENTRAL AFRICAN REPUBLIC |
56,76 |
|
0,40 |
|
|
6,31 |
|
22,90 |
|
29,61 |
|
86,37 |
|
|
|
86,37 |
|
CHAD |
149,20 |
|
0,89 |
|
22,30 |
|
|
50,98 |
|
74,17 |
|
223,36 |
|
|
|
223,36 |
|
CAMEROON |
103,54 |
|
|
|
72,68 |
17,41 |
|
44,05 |
|
134,14 |
|
237,68 |
|
|
|
237,68 |
|
CONGO |
11,82 |
|
|
3,63 |
|
|
|
|
|
3,63 |
|
15,45 |
|
|
|
15,45 |
|
COMOROS |
10,94 |
|
0,71 |
|
|
4,95 |
|
|
|
5,66 |
|
16,34 |
|
|
|
16,34 |
|
CAPE VERDE |
30,18 |
2,58 |
|
|
4,77 |
0,66 |
|
18,62 |
|
26,63 |
|
56,82 |
|
|
|
56,82 |
|
DJIBOUTI |
17,96 |
|
|
2,00 |
|
|
|
9,00 |
|
11,00 |
|
28,96 |
|
|
|
28,96 |
|
EQUATORIAL GUINEA |
3,63 |
|
|
|
|
0,79 |
|
|
|
0,79 |
|
4,42 |
|
|
|
4,42 |
|
ERITREA |
2,25 |
|
9,61 |
8,98 |
|
|
|
|
|
18,59 |
|
20,84 |
|
|
|
20,84 |
|
ETHIOPIA |
149,42 |
|
1,79 |
6,67 |
66,00 |
5,33 |
|
112,60 |
|
192,39 |
|
341,81 |
0,04 |
|
0,04 |
341,85 |
|
GABON |
37,39 |
|
|
|
32,85 |
|
0,45 |
6,60 |
|
39,91 |
|
77,30 |
|
35,00 |
35,00 |
112,30 |
|
GHANA |
124,82 |
|
|
|
17,05 |
|
|
78,59 |
|
95,64 |
|
220,47 |
|
40,00 |
40,00 |
260,47 |
|
GAMBIA |
19,22 |
|
|
|
|
4,44 |
|
9,07 |
|
13,52 |
|
32,73 |
|
|
|
32,73 |
|
GUINEA-BISSAU |
42,44 |
|
2,68 |
|
|
0,36 |
|
1,41 |
|
4,44 |
|
46,88 |
35,00 |
|
35,00 |
81,88 |
|
GUINEA |
110,80 |
|
|
|
|
|
|
21,36 |
|
21,36 |
|
132,16 |
|
|
|
132,16 |
|
CÔTE D'IVOIRE |
58,05 |
0,33 |
|
|
|
82,44 |
|
21,70 |
|
104,46 |
|
162,52 |
|
|
|
162,52 |
|
KENYA |
72,54 |
8,09 |
4,23 |
|
35,86 |
51,05 |
|
17,00 |
|
116,23 |
|
188,77 |
|
|
|
188,77 |
|
LIBERIA |
|
|
|
22,04 |
|
|
|
|
|
22,04 |
|
22,04 |
|
|
|
22,04 |
|
LESOTHO |
51,00 |
1,10 |
|
|
|
|
|
14,78 |
|
15,88 |
|
66,88 |
|
|
|
66,88 |
|
MADAGASCAR |
162,29 |
|
1,71 |
|
45,81 |
20,78 |
|
44,73 |
|
113,02 |
|
275,31 |
55,00 |
|
55,00 |
330,31 |
|
MALAWI |
189,21 |
|
1,39 |
|
10,71 |
11,51 |
|
49,80 |
|
73,41 |
|
262,62 |
35,00 |
|
35,00 |
297,62 |
|
MAURITIUS |
30,07 |
12,23 |
|
|
1,99 |
|
|
|
|
14,22 |
|
44,29 |
|
|
|
44,29 |
|
MAURITANIA |
59,95 |
3,92 |
|
0,22 |
25,02 |
18,98 |
0,15 |
26,92 |
|
75,21 |
|
135,17 |
|
45,00 |
45,00 |
180,17 |
|
MALI |
203,07 |
|
4,66 |
|
5,70 |
|
|
79,41 |
|
89,77 |
|
292,84 |
|
|
|
292,84 |
|
MOZAMBIQUE |
176,68 |
5,24 |
|
|
85,31 |
|
|
131,21 |
|
221,76 |
|
398,44 |
142,03 |
|
142,03 |
540,47 |
|
NAMIBIA |
50,63 |
17,36 |
|
1,11 |
4,23 |
|
0,20 |
|
|
22,89 |
|
73,52 |
|
|
|
73,52 |
|
NIGER |
115,61 |
|
0,28 |
|
|
|
0,14 |
39,44 |
|
39,86 |
|
155,47 |
0,99 |
54,58 |
55,57 |
211,04 |
|
RWANDA |
95,00 |
|
|
|
|
25,73 |
|
55,40 |
|
81,13 |
|
176,13 |
|
|
|
176,13 |
|
SENEGAL |
103,00 |
4,12 |
|
|
45,94 |
39,37 |
0,46 |
52,68 |
|
142,58 |
|
245,59 |
|
|
|
245,59 |
|
SEYCHELLES |
5,48 |
|
|
|
1,77 |
|
|
|
|
1,77 |
|
7,25 |
|
|
|
7,25 |
|
SIERRA LEONE |
64,60 |
|
|
|
|
5,38 |
|
30,40 |
|
35,78 |
|
100,39 |
|
|
|
100,39 |
|
SOMALIA |
50,00 |
|
|
|
|
|
|
|
|
|
|
50,00 |
|
|
|
50,00 |
|
SAO TOME & PRINCIPE |
9,09 |
|
|
|
|
|
|
3,71 |
|
3,71 |
|
12,80 |
|
|
|
12,80 |
|
SUDAN |
|
|
19,22 |
|
|
102,78 |
|
|
|
122,00 |
|
122,00 |
|
|
|
122,00 |
|
SWAZILAND |
23,48 |
8,43 |
|
|
28,56 |
|
|
|
|
36,99 |
|
60,47 |
4,00 |
|
4,00 |
64,47 |
|
TANZANIA |
203,67 |
|
|
3,50 |
102,14 |
34,68 |
|
136,89 |
|
277,22 |
|
480,89 |
|
|
|
480,89 |
|
TOGO |
|
|
|
|
|
9,71 |
|
|
|
9,71 |
|
9,71 |
|
|
|
9,71 |
|
UGANDA |
197,47 |
|
1,61 |
|
92,03 |
35,57 |
|
94,36 |
|
223,57 |
|
421,04 |
|
|
|
421,04 |
|
NIGERIA |
|
|
|
|
5,00 |
|
|
|
|
5,00 |
|
5,00 |
|
|
|
5,00 |
|
ZAMBIA |
137,97 |
|
3,64 |
|
102,56 |
|
96,76 |
90,70 |
|
293,66 |
|
431,63 |
|
|
|
431,63 |
|
ZIMBABWE |
87,29 |
|
|
|
3,25 |
15,17 |
0,13 |
|
|
18,54 |
|
105,84 |
|
|
|
105,84 |
|
DEMOCRATIC REPUBLIC CONGO |
20,96 |
|
1,91 |
21,79 |
|
|
|
5,50 |
|
29,20 |
|
50,16 |
|
|
|
50,16 |
|
* TOTAL AFRICA |
3 457,60 |
65,50 |
66,09 |
111,24 |
831,29 |
515,57 |
98,39 |
1 419,42 |
0,00 |
3 107,50 |
|
6 564,84 |
393,91 |
204,58 |
598,48 |
7 163,32 |
|
ANTIGUA-BARBUDA |
0,65 |
|
|
|
|
|
|
|
|
|
|
0,65 |
|
|
|
0,65 |
|
BARBADOS |
4,46 |
4,26 |
|
|
|
|
|
|
|
4,26 |
|
8,72 |
|
|
|
8,72 |
|
BELIZE |
10,51 |
|
|
|
8,70 |
|
|
|
|
8,70 |
|
19,21 |
0,13 |
|
0,13 |
19,34 |
|
BAHAMAS |
2,20 |
|
|
|
|
|
|
|
|
|
|
2,20 |
|
|
|
2,20 |
|
DOMINICAN REPUBLIC |
98,91 |
8,85 |
0,17 |
|
30,98 |
|
0,34 |
|
|
40,35 |
|
139,26 |
|
|
|
139,26 |
|
DOMINICA |
6,21 |
|
|
|
2,78 |
29,18 |
|
|
|
31,95 |
|
38,42 |
|
|
|
38,42 |
|
GRENADA |
0,57 |
|
|
|
|
2,87 |
|
|
|
2,87 |
|
3,45 |
|
|
|
3,45 |
|
GUYANA (STATE) |
31,26 |
|
|
|
1,90 |
|
12,50 |
10,69 |
|
25,09 |
|
56,35 |
|
|
|
56,35 |
|
HAITI |
64,25 |
|
|
|
10,00 |
3,10 |
|
11,70 |
|
24,80 |
|
89,05 |
|
|
|
89,05 |
|
JAMAICA |
54,01 |
6,41 |
|
|
32,00 |
9,45 |
|
43,00 |
|
90,87 |
|
144,88 |
27,74 |
|
27,74 |
172,62 |
|
ST CHRISTOPHE (KITTS) & NEVIS |
2,72 |
|
|
|
4,00 |
|
|
|
|
4,00 |
|
6,72 |
|
|
|
6,72 |
|
SAINT LUCIA |
1,36 |
0,84 |
|
|
3,00 |
49,01 |
|
|
|
52,85 |
|
54,21 |
|
|
|
54,21 |
|
SURINAME |
20,50 |
0,20 |
|
|
|
|
|
|
|
0,20 |
|
20,69 |
|
|
|
20,69 |
|
SAINT VINCENT & GRENADINES |
2,28 |
0,28 |
|
|
|
32,53 |
|
|
|
32,81 |
|
35,10 |
|
|
|
35,10 |
|
TRINIDAD & TOBAGO |
9,44 |
0,78 |
|
|
7,00 |
|
|
|
|
7,78 |
|
17,22 |
|
|
|
17,22 |
|
* TOTAL CARIBBEAN |
309,33 |
21,62 |
0,17 |
0,00 |
100,36 |
126,14 |
12,84 |
65,39 |
0,00 |
326,53 |
|
636,12 |
27,87 |
|
27,87 |
663,99 |
|
FIJI |
16,94 |
|
0,41 |
|
2,00 |
|
|
|
|
2,41 |
|
19,36 |
|
|
|
19,36 |
|
KIRIBATI |
9,35 |
|
|
|
0,50 |
0,28 |
|
|
|
0,78 |
|
10,13 |
|
|
|
10,13 |
|
PAPUA-NEW GUINEA |
43,85 |
|
0,08 |
|
|
0,70 |
0,48 |
9,88 |
|
11,13 |
|
54,99 |
|
50,00 |
50,00 |
104,99 |
|
SOLOMON ISLANDS |
14,22 |
|
|
|
|
74,64 |
|
2,18 |
|
76,82 |
|
91,05 |
|
|
|
91,05 |
|
TONGA |
5,03 |
|
|
|
|
0,47 |
|
|
|
0,47 |
|
5,50 |
|
|
|
5,50 |
|
TUVALU |
1,90 |
|
|
|
0,50 |
0,00 |
|
|
|
0,50 |
|
2,40 |
|
|
|
2,40 |
|
VANUATU |
10,23 |
|
0,14 |
|
3,00 |
0,81 |
|
1,59 |
|
5,54 |
|
15,77 |
5,27 |
|
5,27 |
21,04 |
|
SAMOA |
14,07 |
|
|
|
5,00 |
0,03 |
|
|
|
5,03 |
|
19,10 |
3,52 |
|
3,52 |
22,62 |
|
* TOTAL PACIFIC |
115,60 |
0,00 |
0,64 |
0,00 |
11,00 |
76,95 |
0,48 |
13,64 |
0,00 |
102,70 |
|
218,30 |
8,79 |
50,00 |
58,79 |
277,09 |
|
WESTERN AFRICA REGION |
211,35 |
1,71 |
|
|
57,86 |
|
|
|
|
59,57 |
|
270,92 |
|
|
|
270,92 |
|
CENTRAL AFRICA REGION |
77,46 |
|
|
|
5,30 |
|
|
|
|
5,30 |
|
82,76 |
|
|
|
82,76 |
|
EASTERN AFRICA REGION |
165,38 |
|
|
|
|
|
|
|
|
|
|
165,38 |
|
|
|
165,38 |
|
SOUTHERN AFRICA REGION |
66,98 |
|
|
|
16,40 |
|
|
|
|
16,40 |
|
83,38 |
|
|
|
83,38 |
|
INDIAN OCEAN REGION |
13,42 |
|
|
|
10,94 |
|
|
|
|
10,94 |
|
24,36 |
|
|
|
24,36 |
|
CARIBBEAN REGION |
45,14 |
|
|
|
24,68 |
|
|
|
|
24,68 |
|
69,82 |
|
|
|
69,82 |
|
PACIFIC REGION |
33,97 |
|
|
|
|
|
|
|
|
|
|
33,97 |
|
|
|
33,97 |
|
MULTI-REGIONAL (PALOP) |
10,83 |
|
|
|
|
|
|
|
|
|
|
10,83 |
|
|
|
10,83 |
|
INTRA ACP BUDGET |
749,80 |
|
|
|
|
|
|
|
|
|
|
749,80 |
|
|
|
749,80 |
|
* TOTAL ACP REGIONAL COOPERATION |
1 374,31 |
1,71 |
0,00 |
0,00 |
115,19 |
0,00 |
0,00 |
0,00 |
0,00 |
116,90 |
|
1 491,21 |
|
|
|
1 491,21 |
|
ALL ACP COUNTRIES |
|
4,87 |
69,48 |
|
20,95 |
|
|
|
1 060,00 |
1 155,30 |
|
1 155,30 |
|
|
|
1 155,30 |
|
ADMINISTRATIVE & FINANCIAL COSTS |
|
|
|
|
|
|
|
|
|
|
37,38 |
37,38 |
|
|
|
37,38 |
|
* TOTAL ACP |
5 256,84 |
93,70 |
136,38 |
111,24 |
1 078,78 |
718,65 |
111,71 |
1 498,45 |
1 060,00 |
4 808,92 |
37,38 |
10 103,15 |
430,57 |
254,58 |
685,15 |
10 788,30 |
|
MAYOTTE |
0,89 |
|
|
|
|
1,18 |
|
|
|
1,18 |
|
2,07 |
|
|
|
2,07 |
|
NEW CALEDONIA |
7,49 |
0,33 |
|
|
|
|
2,49 |
|
|
2,83 |
|
10,31 |
|
|
|
10,31 |
|
FRENCH POLYNESIA |
10,10 |
0,29 |
|
|
3,00 |
|
|
|
|
3,29 |
|
13,39 |
|
|
|
13,39 |
|
SAINT PIERRE & MIQUELON |
3,47 |
|
|
|
|
|
|
|
|
|
|
3,47 |
|
|
|
3,47 |
|
WALLIS & FUTUNA |
1,47 |
|
|
|
|
|
|
|
|
|
|
1,47 |
|
|
|
1,47 |
|
* TOTAL FRENCH OCT |
23,41 |
0,63 |
0,00 |
0,00 |
3,00 |
1,18 |
2,49 |
0,00 |
0,00 |
7,30 |
|
30,72 |
|
|
|
30,72 |
|
ARUBA |
0,40 |
|
|
|
0,50 |
|
|
|
|
0,50 |
|
0,90 |
|
|
|
0,90 |
|
DUTCH ANTILLES |
5,21 |
|
|
|
|
|
|
|
|
|
|
5,21 |
|
|
|
5,21 |
|
* TOTAL DUTCH OCT |
5,61 |
|
|
|
0,50 |
|
|
|
|
0,50 |
|
6,11 |
|
|
|
6,11 |
|
ANGUILLA |
0,80 |
|
|
|
|
|
|
|
|
|
|
0,80 |
|
|
|
0,80 |
|
MONTSERRAT |
1,70 |
|
|
|
|
|
|
|
|
|
|
1,70 |
|
|
|
1,70 |
|
SAINT HELENA |
0,06 |
|
|
|
|
|
|
|
|
|
|
0,06 |
|
|
|
0,06 |
|
TURKS & CAICOS |
|
|
|
|
3,00 |
|
|
|
|
3,00 |
|
3,00 |
|
|
|
3,00 |
|
BRITISH VIRGIN ISLANDS |
|
0,51 |
|
|
|
|
|
|
|
0,51 |
|
0,51 |
|
|
|
0,51 |
|
* TOTAL BRITISH OCT |
2,56 |
0,51 |
|
|
3,00 |
|
|
|
|
3,51 |
|
6,08 |
|
|
|
6,08 |
|
OCT F REGIONAL COOPERATION |
5,42 |
|
|
|
|
|
|
|
|
|
|
5,42 |
|
|
|
5,42 |
|
OCT N REGIONAL COOPERATION |
1,00 |
|
|
|
|
|
|
|
|
|
|
1,00 |
|
|
|
1,00 |
|
PTU REGIONAL COOPERATION |
1,64 |
|
|
|
|
|
|
|
|
|
|
1,64 |
|
|
|
1,64 |
|
* OCT REGIONAL COOPERATION |
8,06 |
|
|
|
|
|
|
|
|
|
|
8,06 |
|
|
|
8,06 |
|
* TOTAL OCT |
39,65 |
1,14 |
|
|
6,50 |
1,18 |
2,49 |
|
|
11,31 |
|
50,96 |
|
|
|
50,96 |
|
* TOTAL ACP + OCT |
5 296,49 |
94,84 |
136,38 |
111,24 |
1 085,28 |
719,84 |
114,20 |
1 498,45 |
1 060,00 |
4 820,24 |
37,38 |
10 154,11 |
430,57 |
254,58 |
685,15 |
10 839,26 |
Table 3.2.4
8th EDF
Decisions annual 2007
SITUATION BY INSTRUMENT AND STATE
|
(EUR million) |
||||||||||||||||
|
|
Lome |
Cotonou |
Total State |
|||||||||||||
|
NIP |
Non NIP |
Interests |
Total |
Envelope A |
Envelope B |
Total |
||||||||||
|
Grants |
Interest subsidies |
Emergency aid |
Refugee aid |
Risk capital |
Stabex |
Sysmin |
SAF |
Heavily indebted poor countries |
Total non NIP |
|||||||
|
ANGOLA |
– 0,08 |
|
– 0,00 |
|
|
|
|
|
|
– 0,00 |
|
– 0,08 |
|
|
|
– 0,08 |
|
BENIN |
– 4,22 |
|
|
|
|
0,00 |
|
|
|
0,00 |
|
– 4,22 |
|
|
|
– 4,22 |
|
BURKINA FASO |
– 4,04 |
|
|
|
|
0,01 |
|
|
|
0,01 |
|
– 4,02 |
|
|
|
– 4,02 |
|
BOTSWANA |
– 1,80 |
|
|
|
|
|
|
|
|
|
|
– 1,80 |
|
|
|
– 1,80 |
|
BURUNDI |
– 0,02 |
|
|
|
|
1,01 |
|
– 0,35 |
|
0,66 |
|
0,64 |
|
|
|
0,64 |
|
CENTRAL AFRICAN REPUBLIC |
– 0,00 |
|
– 0,00 |
|
|
|
|
|
|
– 0,00 |
|
0,00 |
|
|
|
0,00 |
|
CHAD |
– 0,48 |
|
|
|
|
|
|
– 1,15 |
|
– 1,15 |
|
– 1,64 |
|
|
|
– 1,64 |
|
CAMEROON |
– 0,33 |
|
|
|
– 0,35 |
0,02 |
|
|
|
– 0,33 |
|
– 0,66 |
|
|
|
– 0,66 |
|
CONGO |
-10,06 |
|
|
– 0,71 |
|
|
|
|
|
– 0,71 |
|
– 10,76 |
|
|
|
– 10,76 |
|
COMOROS |
– 0,31 |
|
|
|
|
0,00 |
|
|
|
0,00 |
|
– 0,31 |
|
|
|
– 0,31 |
|
CAPE VERDE |
– 0,36 |
|
|
|
– 0,23 |
|
|
|
|
– 0,23 |
|
– 0,59 |
|
|
|
– 0,59 |
|
DJIBOUTI |
– 1,47 |
|
|
|
|
|
|
|
|
|
|
– 1,47 |
|
|
|
– 1,47 |
|
EQUATORIAL GUINEA |
– 0,53 |
|
|
|
|
|
|
|
|
|
|
– 0,53 |
|
|
|
– 0,53 |
|
ERITREA |
|
|
|
|
|
|
|
|
|
|
|
0,00 |
|
|
|
0,00 |
|
ETHIOPIA |
– 0,68 |
|
|
|
|
0,04 |
|
– 5,85 |
|
– 5,81 |
|
– 6,48 |
|
|
|
– 6,48 |
|
GABON |
– 0,07 |
|
|
|
|
|
|
– 1,00 |
|
– 1,00 |
|
– 1,06 |
|
|
|
– 1,06 |
|
GHANA |
– 0,81 |
|
|
|
|
|
|
– 0,20 |
|
– 0,20 |
|
– 1,01 |
|
|
|
– 1,01 |
|
GAMBIA |
– 2,81 |
|
|
|
|
0,04 |
|
– 4,38 |
|
– 4,34 |
|
– 7,15 |
|
|
|
– 7,15 |
|
GUINEA-BISSAU |
– 4,70 |
|
|
|
|
0,01 |
|
|
|
0,01 |
|
– 4,68 |
|
|
|
– 4,68 |
|
GUINEA |
– 9,04 |
|
|
|
-12,00 |
|
|
|
|
-12,00 |
|
– 21,04 |
|
|
|
– 21,04 |
|
CÔTE D'IVOIRE |
– 1,08 |
|
|
|
|
0,40 |
|
|
|
0,40 |
|
– 0,68 |
|
|
|
– 0,68 |
|
KENYA |
– 0,89 |
|
– 0,13 |
|
|
|
|
|
|
– 0,13 |
|
– 1,02 |
|
|
|
– 1,02 |
|
LIBERIA |
|
|
— |
– 2,96 |
|
|
|
|
|
– 2,96 |
|
– 2,96 |
|
|
|
– 2,96 |
|
LESOTHO |
– 2,72 |
|
|
|
|
|
|
– 2,22 |
|
– 2,22 |
|
– 4,93 |
|
|
|
– 4,93 |
|
MADAGASCAR |
|
|
|
|
|
0,03 |
|
|
|
0,03 |
|
0,03 |
|
|
|
0,03 |
|
MALAWI |
– 2,78 |
|
– 0,00 |
|
– 0,30 |
0,04 |
|
|
|
– 0,27 |
|
– 3,05 |
|
|
|
– 3,05 |
|
MAURITIUS |
– 0,26 |
|
|
|
|
|
|
|
|
|
|
– 0,26 |
|
|
|
– 0,26 |
|
MAURITANIA |
– 2,69 |
|
|
|
|
0,71 |
|
|
|
0,71 |
|
– 1,99 |
|
|
|
– 1,99 |
|
MALI |
– 0,23 |
|
|
|
|
|
|
|
|
|
|
– 0,23 |
|
|
|
– 0,23 |
|
MOZAMBIQUE |
-12,89 |
– 0,85 |
|
|
|
|
|
|
|
– 0,85 |
|
– 13,74 |
|
|
|
– 13,74 |
|
NAMIBIA |
– 0,00 |
|
|
|
|
|
|
|
|
|
|
0,00 |
|
|
|
0,00 |
|
NIGER |
– 4,27 |
|
|
|
|
|
|
|
|
|
|
– 4,27 |
|
|
|
– 4,27 |
|
RWANDA |
– 1,97 |
|
|
|
|
0,24 |
|
|
|
0,24 |
|
– 1,73 |
|
|
|
– 1,73 |
|
SENEGAL |
– 4,95 |
|
|
|
– 4,47 |
0,41 |
|
|
|
– 4,05 |
|
– 9,00 |
|
|
|
– 9,00 |
|
SEYCHELLES |
– 0,09 |
|
|
|
|
|
|
|
|
|
|
– 0,09 |
|
|
|
– 0,09 |
|
SIERRA LEONE |
– 1,34 |
|
|
|
|
0,12 |
|
|
|
0,12 |
|
– 1,22 |
|
|
|
– 1,22 |
|
SOMALIA |
|
|
|
|
|
|
|
|
|
|
|
0,00 |
|
|
|
0,00 |
|
SAO TOME & PRINCIPE |
– 2,40 |
|
|
|
|
|
|
– 0,26 |
|
– 0,26 |
|
– 2,66 |
|
|
|
– 2,66 |
|
SUDAN |
|
|
|
|
|
1,91 |
|
|
|
1,91 |
|
1,91 |
|
|
|
1,91 |
|
SWAZILAND |
– 1,05 |
|
|
|
|
|
|
|
|
|
|
– 1,05 |
|
|
|
– 1,05 |
|
TANZANIA |
|
|
|
|
|
0,23 |
|
|
|
0,23 |
|
0,23 |
|
|
|
0,23 |
|
TOGO |
|
|
|
|
|
– 3,69 |
|
|
|
– 3,69 |
|
– 3,69 |
|
|
|
– 3,69 |
|
UGANDA |
– 2,26 |
|
– 0,00 |
|
– 1,27 |
0,04 |
|
– 0,41 |
|
– 1,64 |
|
– 3,90 |
|
|
|
– 3,90 |
|
NIGERIA |
|
|
|
|
|
|
|
|
|
|
|
0,00 |
|
|
|
0,00 |
|
ZAMBIA |
– 2,16 |
|
|
|
– 0,94 |
|
|
– 0,28 |
|
– 1,22 |
|
– 3,38 |
|
|
|
– 3,38 |
|
ZIMBABWE |
– 3,74 |
|
|
|
|
0,12 |
|
|
|
0,12 |
|
– 3,63 |
|
|
|
– 3,63 |
|
DEMOCRATIC REPUBLIC CONGO |
– 0,88 |
|
|
– 1,69 |
|
|
|
|
|
– 1,69 |
|
– 2,58 |
|
|
|
– 2,58 |
|
* TOTAL AFRICA |
– 90,45 |
– 0,85 |
– 0,14 |
– 5,36 |
– 19,55 |
1,68 |
|
– 16,09 |
|
– 40,32 |
|
– 130,77 |
|
|
|
– 130,77 |
|
ANTIGUA-BARBUDA |
|
|
|
|
|
|
|
|
|
|
|
0,00 |
|
|
|
0,00 |
|
BARBADOS |
– 0,42 |
|
|
|
|
|
|
|
|
|
|
– 0,42 |
|
|
|
– 0,42 |
|
BELIZE |
– 0,06 |
|
|
|
|
|
|
|
|
|
|
– 0,06 |
|
|
|
– 0,06 |
|
BAHAMAS |
|
|
|
|
|
|
|
|
|
|
|
0,00 |
|
|
|
0,00 |
|
DOMINICAN REPUBLIC |
– 2,83 |
|
|
|
|
|
|
|
|
|
|
– 2,83 |
|
|
|
– 2,83 |
|
DOMINICA |
– 0,05 |
|
|
|
|
0,00 |
|
|
|
0,00 |
|
– 0,04 |
|
|
|
– 0,04 |
|
GRENADA |
– 1,02 |
|
|
|
|
0,01 |
|
|
|
0,01 |
|
– 1,00 |
|
|
|
– 1,00 |
|
GUYANA (STATE) |
— |
|
|
|
-20,00 |
|
|
|
|
-20,00 |
|
– 20,00 |
|
|
|
– 20,00 |
|
HAITI |
– 6,62 |
|
|
|
|
|
|
|
|
|
|
– 6,62 |
|
|
|
– 6,62 |
|
JAMAICA |
– 1,34 |
|
|
|
|
0,02 |
|
|
|
0,02 |
|
– 1,32 |
– 2,26 |
|
– 2,26 |
– 3,58 |
|
ST CHRISTOPHE (KITTS) & NEVIS |
|
|
|
|
|
|
|
|
|
|
|
0,00 |
|
|
|
0,00 |
|
SAINT LUCIA |
|
|
|
|
|
0,56 |
|
|
|
0,56 |
|
0,56 |
|
|
|
0,56 |
|
SURINAME |
– 1,46 |
|
|
|
|
|
|
|
|
|
|
– 1,46 |
|
|
|
– 1,46 |
|
SAINT VINCENT & GRENADINES |
|
|
|
|
|
0,16 |
|
|
|
0,16 |
|
0,16 |
|
|
|
0,16 |
|
TRINIDAD & TOBAGO |
– 0,32 |
|
|
|
|
|
|
|
|
|
|
– 0,32 |
|
|
|
– 0,32 |
|
* TOTAL CARIBBEAN |
– 14,12 |
0,00 |
|
|
– 20,00 |
0,77 |
|
|
|
– 19,23 |
|
– 33,36 |
– 2,26 |
|
– 2,26 |
– 35,61 |
|
FIJI |
– 0,36 |
|
|
|
|
|
|
|
|
|
|
– 0,36 |
|
|
|
– 0,36 |
|
KIRIBATI |
– 2,41 |
|
|
|
|
|
|
|
|
|
|
– 2,41 |
|
|
|
– 2,41 |
|
PAPUA-NEW GUINEA |
– 2,83 |
|
|
|
|
0,03 |
– 0,02 |
|
|
0,00 |
|
– 2,83 |
|
|
|
– 2,83 |
|
SOLOMON ISLANDS |
– 0,26 |
|
|
|
|
0,00 |
|
|
|
0,00 |
|
– 0,25 |
|
|
|
– 0,25 |
|
TONGA |
– 0,54 |
|
|
|
|
0,00 |
|
|
|
0,00 |
|
– 0,53 |
|
|
|
– 0,53 |
|
TUVALU |
|
|
|
|
|
|
|
|
|
|
|
|
|
|
|
0,00 |
|
VANUATU |
|
|
|
|
|
|
|
|
|
|
|
|
|
|
|
0,00 |
|
SAMOA |
|
|
|
|
|
|
|
|
|
|
|
|
– 0,76 |
|
– 0,76 |
– 0,76 |
|
* TOTAL PACIFIC |
– 6,39 |
|
|
|
|
0,03 |
– 0,02 |
0,00 |
|
0,01 |
|
– 6,38 |
– 0,76 |
|
– 0,76 |
– 7,14 |
|
WESTERN AFRICA REGION |
– 3,35 |
|
|
|
|
|
|
|
|
|
|
– 3,35 |
|
|
|
– 3,35 |
|
CENTRAL AFRICA REGION |
– 0,25 |
|
|
|
|
|
|
|
|
|
|
– 0,25 |
|
|
|
– 0,25 |
|
EASTERN AFRICA REGION |
– 1,01 |
|
|
|
|
|
|
|
|
|
|
– 1,01 |
|
|
|
– 1,01 |
|
SOUTHERN AFRICA REGION |
– 5,50 |
|
|
|
|
|
|
|
|
|
|
– 5,50 |
|
|
|
– 5,50 |
|
INDIAN OCEAN REGION |
– 0,42 |
|
|
|
|
|
|
|
|
|
|
– 0,42 |
|
|
|
– 0,42 |
|
CARIBBEAN REGION |
– 0,71 |
|
|
|
– 1,62 |
|
|
|
|
– 1,62 |
|
– 2,33 |
|
|
|
– 2,33 |
|
PACIFIC REGION |
– 0,65 |
|
|
|
|
|
|
|
|
|
|
– 0,65 |
|
|
|
– 0,65 |
|
MULTI-REGIONAL (PALOP) |
– 1,09 |
|
|
|
|
|
|
|
|
|
|
– 1,09 |
|
|
|
– 1,09 |
|
INTRA ACP BUDGET |
-10,83 |
|
|
|
|
|
|
|
|
|
|
– 10,83 |
|
|
|
– 10,83 |
|
* TOTAL ACP REGIONAL COOPERATION |
– 23,81 |
|
|
|
– 1,62 |
|
|
|
|
– 1,62 |
|
– 25,42 |
|
|
|
– 25,42 |
|
ALL ACP COUNTRIES |
|
|
|
|
– 7,82 |
|
|
|
|
– 7,82 |
|
– 7,82 |
|
|
|
– 7,82 |
|
ADMINISTRATIVE & FINANCIAL COSTS |
|
|
|
|
|
|
|
|
|
|
|
0,00 |
|
|
|
0,00 |
|
* TOTAL ACP |
– 134,77 |
– 0,85 |
– 0,14 |
– 5,36 |
– 48,99 |
2,48 |
– 0,02 |
– 16,09 |
|
– 68,99 |
|
– 203,75 |
– 3,01 |
|
– 3,01 |
– 206,77 |
|
MAYOTTE |
|
|
|
|
|
|
|
|
|
|
|
0,00 |
|
|
|
0,00 |
|
NEW CALEDONIA |
– 2,71 |
|
|
|
|
|
|
|
|
|
|
– 2,71 |
|
|
|
– 2,71 |
|
FRENCH POLYNESIA |
– 0,07 |
|
|
|
|
|
|
|
|
|
|
– 0,07 |
|
|
|
– 0,07 |
|
SAINT PIERRE & MIQUELON |
|
|
|
|
|
|
|
|
|
|
|
0,00 |
|
|
|
0,00 |
|
WALLIS & FUTUNA |
|
|
|
|
|
|
|
|
|
|
|
0,00 |
|
|
|
0,00 |
|
* TOTAL FRENCH OCT |
– 2,78 |
|
|
|
|
|
0,00 |
|
|
0,00 |
|
– 2,78 |
|
|
|
– 2,78 |
|
ARUBA |
|
|
|
|
|
|
|
|
|
|
|
0,00 |
|
|
|
0,00 |
|
DUTCH ANTILLES |
– 0,17 |
|
|
|
|
|
|
|
|
|
|
– 0,17 |
|
|
|
– 0,17 |
|
* TOTAL DUTCH OCT |
– 0,17 |
|
|
|
|
|
|
|
|
|
|
– 0,17 |
|
|
|
– 0,17 |
|
ANGUILLA |
– 0,95 |
|
|
|
|
|
|
|
|
|
|
– 0,95 |
|
|
|
– 0,95 |
|
MONTSERRAT |
– 0,35 |
|
|
|
|
|
|
|
|
|
|
– 0,35 |
|
|
|
– 0,35 |
|
SAINT HELENA |
|
|
|
|
|
|
|
|
|
|
|
0,00 |
|
|
|
0,00 |
|
TURKS & CAICOS |
|
|
|
|
|
|
|
|
|
|
|
0,00 |
|
|
|
0,00 |
|
BRITISH VIRGIN ISLANDS |
|
|
|
|
|
|
|
|
|
|
|
0,00 |
|
|
|
0,00 |
|
* TOTAL BRITISH OCT |
– 1,31 |
|
|
|
|
|
|
|
|
|
|
– 1,31 |
|
|
|
– 1,31 |
|
OCT F REGIONAL COOPERATION |
|
|
|
|
|
|
|
|
|
|
|
0,00 |
|
|
|
0,00 |
|
OCT N REGIONAL COOPERATION |
|
|
|
|
|
|
|
|
|
|
|
0,00 |
|
|
|
0,00 |
|
PTU REGIONAL COOPERATION |
|
|
|
|
|
|
|
|
|
|
|
0,00 |
|
|
|
0,00 |
|
* OCT REGIONAL COOPERATION |
0,00 |
|
|
|
|
|
|
|
|
|
|
0,00 |
|
|
|
0,00 |
|
* TOTAL OCT |
– 4,26 |
|
|
|
|
|
0,00 |
|
|
0,00 |
|
– 4,26 |
|
|
|
– 4,26 |
|
* TOTAL ACP + OCT |
– 139,03 |
– 0,85 |
– 0,14 |
– 5,36 |
– 48,99 |
2,48 |
– 0,02 |
– 16,09 |
0,00 |
– 68,99 |
0,00 |
– 208,02 |
– 3,01 |
0,00 |
– 3,01 |
– 211,03 |
Table 3.2.5
8th EDF
Assigned funds cumulative 2007
SITUATION BY INSTRUMENT AND STATE
|
(EUR million) |
||||||||||||||||
|
|
Lome |
Cotonou |
Total state |
|||||||||||||
|
NIP |
Non NIP |
Interests |
Total |
Envelope A |
Envelope B |
Total |
||||||||||
|
Grants |
Interest subsidies |
Emergency aid |
Refugee aid |
Risk capital |
Stabex |
Sysmin |
SAF |
Heavily indebted poor countries |
Total non NIP |
|||||||
|
ANGOLA |
71,20 |
|
11,25 |
15,93 |
|
|
|
|
|
27,18 |
|
98,38 |
|
|
|
98,38 |
|
BENIN |
111,91 |
|
|
|
5,76 |
1,02 |
|
52,76 |
|
59,53 |
|
171,45 |
|
|
|
171,45 |
|
BURKINA FASO |
172,83 |
|
0,10 |
|
14,00 |
1,54 |
|
87,60 |
|
103,24 |
|
276,07 |
115,31 |
|
115,31 |
391,38 |
|
BOTSWANA |
33,70 |
2,10 |
|
|
|
|
0,11 |
|
|
2,21 |
|
35,91 |
3,67 |
29,01 |
32,68 |
68,59 |
|
BURUNDI |
13,06 |
|
|
25,00 |
|
19,00 |
|
9,25 |
|
53,25 |
|
66,31 |
|
|
|
66,31 |
|
CENTRAL AFRICAN REPUBLIC |
55,06 |
|
0,40 |
|
|
6,31 |
|
22,90 |
|
29,61 |
|
84,68 |
|
|
|
84,68 |
|
CHAD |
147,41 |
|
0,89 |
|
22,30 |
|
|
50,98 |
|
74,17 |
|
221,58 |
|
|
|
221,58 |
|
CAMEROON |
100,95 |
|
|
|
72,68 |
17,39 |
|
44,05 |
|
134,12 |
|
235,07 |
|
|
|
235,07 |
|
CONGO |
8,14 |
|
|
3,63 |
|
|
|
|
|
3,63 |
|
11,77 |
|
|
|
11,77 |
|
COMOROS |
10,55 |
|
0,71 |
|
|
4,94 |
|
|
|
5,66 |
|
16,20 |
|
|
|
16,20 |
|
CAPE VERDE |
28,83 |
2,58 |
|
|
4,77 |
0,66 |
|
17,98 |
|
25,99 |
|
54,82 |
|
|
|
54,82 |
|
DJIBOUTI |
16,90 |
|
|
2,00 |
|
|
|
9,00 |
|
11,00 |
|
27,90 |
|
|
|
27,90 |
|
EQUATORIAL GUINEA |
3,57 |
|
|
|
|
0,79 |
|
|
|
0,79 |
|
4,37 |
|
|
|
4,37 |
|
ERITREA |
2,25 |
|
9,60 |
8,47 |
|
|
|
|
|
18,06 |
|
20,31 |
|
|
|
20,31 |
|
ETHIOPIA |
146,95 |
|
1,79 |
6,64 |
66,00 |
5,24 |
|
112,60 |
|
192,27 |
|
339,22 |
0,04 |
|
0,04 |
339,26 |
|
GABON |
37,37 |
|
|
|
32,85 |
|
0,45 |
6,60 |
|
39,91 |
|
77,27 |
|
29,89 |
29,89 |
107,16 |
|
GHANA |
123,82 |
|
|
|
17,05 |
|
|
78,59 |
|
95,64 |
|
219,46 |
|
33,15 |
33,15 |
252,61 |
|
GAMBIA |
17,53 |
|
|
|
|
4,35 |
|
9,06 |
|
13,41 |
|
30,94 |
|
|
|
30,94 |
|
GUINEA-BISSAU |
41,57 |
|
2,68 |
|
|
0,32 |
|
1,41 |
|
4,41 |
|
45,98 |
31,24 |
|
31,24 |
77,22 |
|
GUINEA |
100,20 |
|
|
|
|
|
|
21,36 |
|
21,36 |
|
121,56 |
|
|
|
121,56 |
|
CÔTE D'IVOIRE |
51,81 |
0,33 |
|
|
|
82,04 |
|
21,70 |
|
104,07 |
|
155,88 |
|
|
|
155,88 |
|
KENYA |
69,67 |
8,09 |
4,23 |
|
35,86 |
51,05 |
|
17,00 |
|
116,23 |
|
185,91 |
|
|
|
185,91 |
|
LIBERIA |
|
|
|
21,32 |
|
|
|
|
|
21,32 |
|
21,32 |
|
|
|
21,32 |
|
LESOTHO |
50,70 |
1,10 |
|
|
|
|
|
14,77 |
|
15,87 |
|
66,57 |
|
|
|
66,57 |
|
MADAGASCAR |
161,86 |
|
1,71 |
|
45,81 |
20,41 |
|
44,73 |
|
112,65 |
|
274,52 |
55,00 |
|
55,00 |
329,52 |
|
MALAWI |
188,51 |
|
1,39 |
|
10,71 |
11,42 |
|
49,80 |
|
73,33 |
|
261,84 |
29,90 |
|
29,90 |
291,74 |
|
MAURITIUS |
30,07 |
12,23 |
|
|
1,99 |
|
|
|
|
14,22 |
|
44,29 |
|
|
|
44,29 |
|
MAURITANIA |
59,06 |
3,92 |
|
0,22 |
25,02 |
18,56 |
0,15 |
26,92 |
|
74,79 |
|
133,85 |
|
1,05 |
1,05 |
134,90 |
|
MALI |
199,34 |
|
4,66 |
|
5,70 |
|
|
79,41 |
|
89,77 |
|
289,10 |
|
|
|
289,10 |
|
MOZAMBIQUE |
170,52 |
5,24 |
|
|
85,31 |
|
|
131,21 |
|
221,76 |
|
392,28 |
142,03 |
|
142,03 |
534,31 |
|
NAMIBIA |
50,04 |
17,36 |
|
1,11 |
4,23 |
|
0,20 |
|
|
22,89 |
|
72,93 |
|
|
|
72,93 |
|
NIGER |
112,40 |
|
0,28 |
|
|
|
0,14 |
39,44 |
|
39,86 |
|
152,26 |
0,99 |
42,52 |
43,51 |
195,78 |
|
RWANDA |
94,18 |
|
|
|
|
25,20 |
|
55,40 |
|
80,59 |
|
174,77 |
|
|
|
174,77 |
|
SENEGAL |
99,60 |
4,12 |
|
|
45,94 |
38,43 |
0,46 |
52,68 |
|
141,65 |
|
241,25 |
|
|
|
241,25 |
|
SEYCHELLES |
5,46 |
|
|
|
1,77 |
|
|
|
|
1,77 |
|
7,23 |
|
|
|
7,23 |
|
SIERRA LEONE |
57,37 |
|
|
|
|
5,31 |
|
30,40 |
|
35,71 |
|
93,09 |
|
|
|
93,09 |
|
SOMALIA |
48,81 |
|
|
|
|
|
|
|
|
|
|
48,81 |
|
|
|
48,81 |
|
SAO TOME & PRINCIPE |
9,08 |
|
|
|
|
|
|
3,71 |
|
3,71 |
|
12,78 |
|
|
|
12,78 |
|
SUDAN |
|
|
19,22 |
|
|
92,74 |
|
|
|
111,96 |
|
111,96 |
|
|
|
111,96 |
|
SWAZILAND |
23,47 |
8,43 |
|
|
28,56 |
|
|
|
|
36,99 |
|
60,46 |
3,89 |
|
3,89 |
64,35 |
|
TANZANIA |
200,68 |
|
|
3,50 |
102,14 |
33,27 |
|
136,89 |
|
275,80 |
|
476,48 |
|
|
|
476,48 |
|
TOGO |
|
|
|
|
|
1,24 |
|
|
|
1,24 |
|
1,24 |
|
|
|
1,24 |
|
UGANDA |
192,59 |
|
1,61 |
|
92,03 |
35,56 |
|
94,32 |
|
223,53 |
|
416,12 |
|
|
|
416,12 |
|
NIGERIA |
|
|
|
|
5,00 |
|
|
|
|
5,00 |
|
5,00 |
|
|
|
5,00 |
|
ZAMBIA |
135,26 |
|
3,64 |
|
102,56 |
|
93,69 |
90,70 |
|
290,60 |
|
425,86 |
|
|
|
425,86 |
|
ZIMBABWE |
87,03 |
|
|
|
3,25 |
14,90 |
0,13 |
|
|
18,28 |
|
105,31 |
|
|
|
105,31 |
|
DEMOCRATIC REPUBLIC CONGO |
20,54 |
|
1,91 |
21,35 |
|
|
|
4,69 |
|
27,96 |
|
48,50 |
|
|
|
48,50 |
|
* TOTAL AFRICA |
3 361,87 |
65,50 |
66,08 |
109,16 |
831,29 |
491,72 |
95,33 |
1 417,91 |
|
3 076,98 |
|
6 438,85 |
382,07 |
135,62 |
517,69 |
6 956,54 |
|
ANTIGUA-BARBUDA |
0,62 |
|
|
|
|
|
|
|
|
|
|
0,62 |
|
|
|
0,62 |
|
BARBADOS |
4,14 |
4,26 |
|
|
|
|
|
|
|
4,26 |
|
8,40 |
|
|
|
8,40 |
|
BELIZE |
10,36 |
|
|
|
8,70 |
|
|
|
|
8,70 |
|
19,06 |
0,13 |
|
0,13 |
19,19 |
|
BAHAMAS |
2,20 |
|
|
|
|
|
|
|
|
|
|
2,20 |
|
|
|
2,20 |
|
DOMINICAN REPUBLIC |
98,00 |
8,85 |
0,17 |
|
30,98 |
|
0,34 |
|
|
40,35 |
|
138,35 |
|
|
|
138,35 |
|
DOMINICA |
6,29 |
|
|
|
2,78 |
29,10 |
|
|
|
31,87 |
|
38,16 |
|
|
|
38,16 |
|
GRENADA |
0,57 |
|
|
|
|
2,84 |
|
|
|
2,84 |
|
3,41 |
|
|
|
3,41 |
|
GUYANA (STATE) |
27,72 |
|
|
|
1,90 |
|
12,27 |
10,69 |
|
24,86 |
|
52,57 |
|
|
|
52,57 |
|
HAITI |
63,74 |
|
|
|
10,00 |
3,10 |
|
11,70 |
|
24,80 |
|
88,54 |
|
|
|
88,54 |
|
JAMAICA |
49,36 |
6,41 |
|
|
32,00 |
9,40 |
|
43,00 |
|
90,81 |
|
140,17 |
27,60 |
|
27,60 |
167,77 |
|
ST CHRISTOPHE (KITTS) & NEVIS |
2,72 |
|
|
|
4,00 |
|
|
|
|
4,00 |
|
6,72 |
|
|
|
6,72 |
|
SAINT LUCIA |
1,35 |
0,84 |
|
|
3,00 |
47,74 |
|
|
|
51,58 |
|
52,92 |
|
|
|
52,92 |
|
SURINAME |
19,69 |
0,20 |
|
|
|
|
|
|
|
0,20 |
|
19,88 |
|
|
|
19,88 |
|
SAINT VINCENT & GRENADINES |
1,92 |
0,28 |
|
|
|
32,16 |
|
|
|
32,44 |
|
34,37 |
|
|
|
34,37 |
|
TRINIDAD & TOBAGO |
7,08 |
0,78 |
|
|
7,00 |
|
|
|
|
7,78 |
|
14,86 |
|
|
|
14,86 |
|
* TOTAL CARIBBEAN |
295,76 |
21,62 |
0,17 |
|
100,36 |
124,34 |
12,61 |
65,39 |
|
324,49 |
|
620,25 |
27,73 |
|
27,73 |
647,98 |
|
FIJI |
16,94 |
|
0,41 |
|
2,00 |
|
|
|
|
2,41 |
|
19,35 |
|
|
|
19,35 |
|
KIRIBATI |
9,26 |
|
|
|
0,50 |
0,28 |
|
|
|
0,78 |
|
10,04 |
|
|
|
10,04 |
|
PAPUA-NEW GUINEA |
42,87 |
|
0,08 |
|
|
0,64 |
0,48 |
9,88 |
|
11,07 |
|
53,95 |
|
45,19 |
45,19 |
99,14 |
|
SOLOMON ISLANDS |
13,89 |
|
|
|
|
74,64 |
|
2,18 |
|
76,82 |
|
90,72 |
|
|
|
90,72 |
|
TONGA |
5,03 |
|
|
|
|
0,46 |
|
|
|
0,46 |
|
5,49 |
|
|
|
5,49 |
|
TUVALU |
1,90 |
|
|
|
0,50 |
0,00 |
|
|
|
0,50 |
|
2,40 |
|
|
|
2,40 |
|
VANUATU |
10,23 |
|
0,14 |
|
3,00 |
0,81 |
|
1,59 |
|
5,54 |
|
15,77 |
5,27 |
|
5,27 |
21,04 |
|
SAMOA |
14,07 |
|
|
|
5,00 |
0,03 |
|
|
|
5,03 |
|
19,10 |
3,52 |
|
3,52 |
22,62 |
|
* TOTAL PACIFIC |
114,19 |
|
0,64 |
|
11,00 |
76,88 |
0,48 |
13,64 |
|
102,63 |
|
216,82 |
8,79 |
45,19 |
53,98 |
270,80 |
|
WESTERN AFRICA REGION |
200,94 |
1,71 |
|
|
57,86 |
|
|
|
|
59,57 |
|
260,51 |
|
|
|
260,51 |
|
CENTRAL AFRICA REGION |
76,24 |
|
|
|
5,30 |
|
|
|
|
5,30 |
|
81,54 |
|
|
|
81,54 |
|
EASTERN AFRICA REGION |
140,01 |
|
|
|
|
|
|
|
|
|
|
140,01 |
|
|
|
140,01 |
|
SOUTHERN AFRICA REGION |
63,77 |
|
|
|
16,40 |
|
|
|
|
16,40 |
|
80,17 |
|
|
|
80,17 |
|
INDIAN OCEAN REGION |
12,04 |
|
|
|
10,94 |
|
|
|
|
10,94 |
|
22,98 |
|
|
|
22,98 |
|
CARIBBEAN REGION |
43,79 |
|
|
|
24,68 |
|
|
|
|
24,68 |
|
68,47 |
|
|
|
68,47 |
|
PACIFIC REGION |
33,76 |
|
|
|
|
|
|
|
|
|
|
33,76 |
|
|
|
33,76 |
|
MULTI-REGIONAL (PALOP) |
10,83 |
|
|
|
|
|
|
|
|
|
|
10,83 |
|
|
|
10,83 |
|
INTRA ACP BUDGET |
672,32 |
|
|
|
|
|
|
|
|
|
|
672,32 |
|
|
|
672,32 |
|
* TOTAL ACP REGIONAL COOPERATION |
1 253,70 |
1,71 |
|
|
115,19 |
|
|
|
|
116,90 |
|
1 370,60 |
|
|
|
1 370,60 |
|
ALL ACP COUNTRIES |
|
4,87 |
69,48 |
|
20,95 |
|
|
|
1 060,00 |
1 155,30 |
|
1 155,30 |
|
|
|
1 155,30 |
|
ADMINISTRATIVE & FINANCIAL COSTS |
|
|
|
|
|
|
|
|
|
|
35,54 |
35,54 |
|
|
|
35,54 |
|
* TOTAL ACP |
5 025,52 |
93,70 |
136,37 |
109,16 |
1 078,78 |
692,93 |
108,41 |
1 496,94 |
1 060,00 |
4 776,30 |
35,54 |
9 837,36 |
418,60 |
180,81 |
599,41 |
10 436,77 |
|
MAYOTTE |
0,87 |
|
|
|
|
1,18 |
|
|
|
1,18 |
|
2,05 |
|
|
|
2,05 |
|
NEW CALEDONIA |
7,49 |
0,33 |
|
|
|
|
2,43 |
|
|
2,76 |
|
10,25 |
|
|
|
10,25 |
|
FRENCH POLYNESIA |
10,10 |
0,29 |
|
|
3,00 |
|
|
|
|
3,29 |
|
13,39 |
|
|
|
13,39 |
|
SAINT PIERRE & MIQUELON |
3,47 |
|
|
|
|
|
|
|
|
|
|
3,47 |
|
|
|
3,47 |
|
WALLIS & FUTUNA |
1,43 |
|
|
|
|
|
|
|
|
|
|
1,43 |
|
|
|
1,43 |
|
* TOTAL FRENCH OCT |
23,36 |
0,63 |
|
|
3,00 |
1,18 |
2,43 |
|
|
7,24 |
|
30,60 |
|
|
|
30,60 |
|
ARUBA |
0,40 |
|
|
|
0,50 |
|
|
|
|
0,50 |
|
0,90 |
|
|
|
0,90 |
|
DUTCH ANTILLES |
4,50 |
|
|
|
|
|
|
|
|
|
|
4,50 |
|
|
|
4,50 |
|
* TOTAL DUTCH OCT |
4,90 |
|
|
|
0,50 |
|
|
|
|
0,50 |
|
5,40 |
|
|
|
5,40 |
|
ANGUILLA |
0,80 |
|
|
|
|
|
|
|
|
|
|
0,80 |
|
|
|
0,80 |
|
MONTSERRAT |
1,65 |
|
|
|
|
|
|
|
|
|
|
1,65 |
|
|
|
1,65 |
|
SAINT HELENA |
0,06 |
|
|
|
|
|
|
|
|
|
|
0,06 |
|
|
|
0,06 |
|
TURKS & CAICOS |
|
|
|
|
3,00 |
|
|
|
|
3,00 |
|
3,00 |
|
|
|
3,00 |
|
BRITISH VIRGIN ISLANDS |
|
0,51 |
|
|
|
|
|
|
|
0,51 |
|
0,51 |
|
|
|
0,51 |
|
* TOTAL BRITISH OCT |
2,51 |
0,51 |
|
|
3,00 |
|
|
|
|
3,51 |
|
6,02 |
|
|
|
6,02 |
|
OCT F REGIONAL COOPERATION |
5,37 |
|
|
|
|
|
|
|
|
|
|
5,37 |
|
|
|
5,37 |
|
OCT N REGIONAL COOPERATION |
0,46 |
|
|
|
|
|
|
|
|
|
|
0,46 |
|
|
|
0,46 |
|
PTU REGIONAL COOPERATION |
|
|
|
|
|
|
|
|
|
|
|
0,00 |
|
|
|
0,00 |
|
* OCT REGIONAL COOPERATION |
5,83 |
|
|
|
|
|
|
|
|
|
|
5,83 |
|
|
|
5,83 |
|
* TOTAL OCT |
36,60 |
1,14 |
|
|
6,50 |
1,18 |
2,43 |
|
|
11,25 |
|
47,85 |
|
|
|
47,85 |
|
* TOTAL ACP + OCT |
5 062,12 |
94,84 |
136,37 |
109,16 |
1 085,28 |
694,11 |
110,84 |
1 496,94 |
1 060,00 |
4 787,55 |
35,54 |
9 885,21 |
418,60 |
180,81 |
599,41 |
10 484,62 |
|
31.10.2008 |
EN |
Official Journal of the European Union |
C 277/243 |
STATEMENT OF ASSURANCE BY THE COURT OF AUDITORS ON THE 7TH, 8TH AND 9TH EUROPEAN DEVELOPMENT FUNDS (EDFS) FOR THE FINANCIAL YEAR 2007
(2008/C 277/02)
|
I. |
Pursuant to the provisions of Article 248 of the Treaty the Court has audited
|
Management's responsibility
|
II. |
In accordance with the Financial Regulations applicable to the seventh, eighth and ninth EDFs, management (3) is responsible for the preparation and fair presentation of the final annual accounts of the EDFs and the legality and regularity of the underlying transactions:
|
Auditor's responsibility
|
III. |
The Court's responsibility is to provide, on the basis of its audit, the European Parliament and the Council with a statement of assurance as to the reliability of the accounts and the legality and regularity of the underlying transactions. The Court conducted its audit in accordance with the IFAC and INTOSAI International Auditing Standards and Codes of Ethics, in so far as these are applicable in the EDF context. These standards require that the Court plans and performs the audit to obtain reasonable assurance whether the final annual accounts of the EDFs are free from material misstatement and the underlying transactions, taken as a whole, are legal and regular. |
|
IV. |
In the context described under paragraph III, an audit involves performing procedures to obtain audit evidence about the amounts and disclosures in the final consolidated accounts and the legality and the regularity of the underlying transactions. The procedures selected depend on the auditor's judgement, including the assessment of the risks of material misstatement of the final consolidated accounts and of material non-compliance of the underlying transactions with the requirements of the legal framework of the EDFs, whether due to fraud or error. In making those risk assessments, the auditor considers internal control relevant to the preparation and fair presentation of the final consolidated accounts, and supervisory and control systems implemented to ensure legality and regularity of underlying transactions, in order to design audit procedures that are appropriate in the circumstances. An audit in this context also includes evaluating the appropriateness of accounting policies used and reasonableness of accounting estimates made, as well as evaluating the overall presentation of the final consolidated accounts and the annual activity reports. |
|
V. |
The Court considers that the audit evidence obtained is sufficient and appropriate to provide a basis for its statement of assurance. |
Opinion on the reliability of the accounts
|
VI. |
In the Court's opinion, the final annual accounts of the seventh, eighth and ninth EDFs present fairly, in all material respects, the financial position of the EDFs as of 31 December 2007, and the results of their operations and cash flows for the year then ended, in accordance with the provisions of the Financial Regulation and the accounting rules adopted by the accounting officer. |
|
VII. |
Without qualifying the opinion expressed in paragraph VI, the Court draws attention to the fact that the validity of the assumptions used for the estimate of the provision for costs incurred has not been demonstrated by the Commission and that they may lead to an understatement of accrued expenditure, as well as to an overstatement of the amount of guarantees disclosed in the notes to the financial statements. |
Opinion on the legality and regularity of the underlying transactions
|
VIII. |
In the Court's opinion, except for the effects of the matter described in paragraph IX, the transactions underlying the revenue and commitments for the financial year are, taken as a whole, legal and regular. |
|
IX. |
The Court's audit revealed a material level of errors affecting transactions underlying payments. |
|
X. |
Without calling into question the opinion expressed in paragraph VIII, the Court draws attention to the high fiduciary risk with regard to budget support resulting from the Commission's ‘dynamic interpretation’ of the eligibility criteria, which does not provide for countries to meet minimum standard of credible management of public finances before budget support is undertaken. |
|
XI. |
The Court notes the improvements introduced by the Commission as regards its supervisory and control systems but underlines the need to continue to pursue efforts to clarify certain important elements of the overall control strategy and improve the design and/or implementation of certain systems. |
18 September 2008
Vítor Manuel da SILVA CALDEIRA
President
European Court of Auditors
12, rue Alcide De Gasperi, L-1615 Luxembourg
(1) The consolidated financial statements comprise the balance sheet, the statement of economic outturn, the statement of cash flow and the table of items payable to the European Development Funds. The financial statements and information supplied by the EIB are not covered by this Statement of Assurance (see footnote 11).
(2) Pursuant to Articles 1 and 103(3) of the Financial Regulation applicable to the ninth EDF, the Statement of Assurance does not extend to the part of the ninth EDF resources that is managed by the EIB and for which it is responsible.
(3) At the level of the Commission management includes the Members of the Institution, Authorising Officers by delegation and sub-delegation, the Accounting Officer and the leading staff of financial, audit or control units. At the level of Beneficiary States, management includes National Authorising Officers, Accounting Officers, Paying Agents and the leading staff of implementing organisations.
(4) The accounting rules adopted by the EDF accounting officer are derived from International Public Sector Accounting Standards (IPSAS) issued by the International Federation of Accountants or, in their absence, International Accounting Standards (IAS)/International Financial Reporting Standards (IFRS) issued by the International Accounting Standards Board. In accordance with the Financial Regulation, the ‘Consolidated financial statements’ for the financial year 2007 are prepared on the basis of these accounting rules adopted by the EDF accounting officer, which adapt accruals based accounting principles to the specific environment of the Communities, while the consolidated reports on implementation of the EDFs continue to be primarily based on movements of cash.
|
31.10.2008 |
EN |
Official Journal of the European Union |
C 277/s3 |
NOTE TO THE READER
The institutions have decided no longer to quote in their texts the last amendment to cited acts.
Unless otherwise indicated, references to acts in the texts published here are to the version of those acts currently in force.