 EUROPEAN COMMISSION
Brussels, 20.7.2017
SWD(2017) 266 final
COMMISSION STAFF WORKING DOCUMENT
Statistical evaluation of irregularities reported for 2016
Own Resources, Natural Resources, Cohesion Policy, Pre-accession and Direct expenditure
Accompanying the document
REPORT FROM THE COMMISSION TO THE EUROPEAN PARLIAMENT AND THE COUNCIL
Protection of the European Union's financial interests - Fight against Fraud
Annual Report 2016
{COM(2017) 383 final}
{SWD(2017) 267 final}
{SWD(2017) 268 final}
{SWD(2017) 269 final}
{SWD(2017) 270 final}
TABLE OF CONTENTS
COMMISSION STAFF WORKING DOCUMENT Statistical evaluation of irregularities reported for 2016 Own Resources, Natural Resources, Cohesion Policy, Pre-accession and Direct expenditure
4.The European Structural and Investment Funds (ESIF)
4.1.Trend analysis
4.1.1.Irregularities reported as fraudulent
4.1.2.Irregularities not reported as fraudulent
4.2.Specific Analysis – Irregularities reported in relation to the Programming Period 2007-13
4.2.1.Objectives concerned by the reported irregularities
4.2.1.1.Irregularities reported as fraudulent by Objective
4.2.1.2.Fraud and Irregularity Detection Rates by Objective
4.2.2.Priorities concerned by the reported irregularities
4.2.2.1.Irregularities reported as fraudulent (fisheries not included)
4.2.2.2.Irregularities not reported as fraudulent (fisheries not included)
4.2.2.3.Irregularities related to the priority 'R&TD'
4.2.2.4.Types of irregularities / modus operandi detected related to the priority 'R&TD'
4.2.2.5.Geographical distribution of irregularities (fraudulent and non-fraudulent) detected in relation to the 'R&TD' priority
4.3.Anti-fraud activities by Member States – programming period 2007-13
4.3.1.Duration of irregularities
4.3.2.Detection of irregularities reported as fraudulent by Member State in relation to the programming period 2007-13
4.3.3.Fraud detection rate
4.3.4.Irregularity Detection Rate
4.3.5.Ratio of established fraud (programming period 2007-13)
5.Pre-Accession Policy (Pre-Accession Assistance and Instrument for Pre-Accession I and II)
5.1.The Pre-accession Assistance (PAA), 2000-06
5.2.The Instrument for Pre-accession 2007-13 – IPA I
5.3.The Instrument for Pre-accession 2014-20 – IPA II
5.4.General analysis – Trend analysis
5.4.1.Trend analysis – Pre-accession assistance (PAA)
5.4.2.Trend analysis Instrument for Pre-Accession (IPA I)
5.5.Specific analysis – Financial year 2015
5.5.1.Pre-Accession Assistance (PAA)
5.5.2.Instrument for Pre-Accession (IPA)
6.Direct Management
6.1.Introduction
6.2.General analysis
6.2.1.Five year analysis 2012-2016
6.3.Specific analysis
6.3.1.Recoveries according policy areas
6.3.2.Recoveries according to legal entity residence
6.3.3.Method of detection
6.3.4.Types of irregularity
6.3.5.Time delay
6.3.6.Recovery
COUNTRY FACTSHEETS
Belgium - Belgique/België
Bulgaria - България
Czech Republic - Česká republika
Denmark - Danmark
Germany - Deutschland
Estonia - Eesti
Ireland - Éire
Greece - Ελλάδα
Spain - España
France
Croatia - Hrvatska
Italy - Italia
Cyprus - Κύπρος
Latvia - Latvija
Lithuania - Lietuva
Luxembourg
Hungary - Magyarország
Malta
Netherlands - Nederland
Austria - Österreich
Poland - Polska
Portugal
Romania - România
Slovenia - Slovenija
Slovakia - Slovensko
Finland – Suomi-Finland
Sweden - Sverige
United Kingdom
ANNEXES
European Structural and Investment Funds
4.The European Structural and Investment Funds (ESIF)
Over half of EU funding is channelled through the 5 European structural and investment funds (ESIF). They are jointly managed by the European Commission and the EU countries.
The purpose of all these funds is to invest in job creation and a sustainable and healthy European economy and environment.
The ESIF mainly focus on 5 areas:
–research and innovation
–digital technologies
–supporting the low-carbon economy
–sustainable management of natural resources
–small businesses.
The European structural and investment funds are:
–European regional development fund (ERDF) – promotes balanced development in the different regions of the EU.
–European social fund (ESF) - supports employment-related projects throughout Europe and invests in Europe’s human capital – its workers, its young people and all those seeking a job.
–Cohesion fund (CF) – funds transport and environment projects in countries where the gross national income (GNI) per inhabitant is less than 90% of the EU average. In 2014-20, these are Bulgaria, Croatia, Cyprus, the Czech Republic, Estonia, Greece, Hungary, Latvia, Lithuania, Malta, Poland, Portugal, Romania, Slovakia and Slovenia.
–European agricultural fund for rural development (EAFRD) – focuses on resolving the particular challenges facing EU's rural areas.
–European maritime and fisheries fund (EMFF) – helps fishermen to adopt sustainable fishing practices and coastal communities to diversify their economies, improving quality of life along European coasts.
Due to the rules of functioning of the EMFF and EFF, which are very similar to those of the other structural funds, irregularities reported by Member States in relation to fisheries policies are treated in this chapter jointly with the funds for cohesion and economic convergence.
All these funds are managed by the EU countries themselves, by means of partnership agreements.
Each country prepares an agreement, in collaboration with the European Commission, setting out how the funds will be used during the current funding period 2014-20.
Partnership agreements lead to a series of investment programmes channelling the funding to the different regions and projects in policy areas concerned.
For 2014-2020, EUR 454 billion in ESIF funding has been allocated to promote job creation and growth. National co-financing is expected to amount to at least EUR 183 billion, with total investment reaching EUR 637 billion.
These resources will contribute to:
·Strengthening Research and Innovation
·Supporting the digital single market
·Supporting the growth of Europe’s small and medium-sized enterprises (SMEs)
·Supporting the energy union and the low-carbon economy
·Investing in environmental protection and resource efficiency
·Climate change and risk prevention
·Supporting sustainable transport
·Promoting sustainable and quality employment
·Promoting social inclusion
·Investing in education and training
·Support youth employment
·Strengthening institutional capacity and efficient public administration
However, the following paragraphs will be mainly dealing with previous programming periods, as only a very limited part of irregularities detected and reported refer to the period 2014-2020.
4.1.Trend analysis
In comparison with the other budget sectors, the analysis of Cohesion policy poses a higher level of complexity, given the fact that the information received is related to different programming periods, which are regulated by different rules.
Table CP1 offers an overview of the irregularities (both fraudulent and non-fraudulent) reported from 2012 to 2016, by programming period. The table also details, for each programming period, the funds to which irregularities were related.
The chart does not suggest any major diversion from known trends and patterns in detection and reporting of irregularities, with the exception of the year 2015 (see next page).
Table CP1: Trend of the number of irregularities reported between 2012 and 2016 by programming period – Cohesion and Fisheries Policies


There is a sudden increase from 2014 to 2015 in the number of reported irregularities, which have doubled, but then it decreases in the following year. Two elements can be pointed out in this respect:
1)The increase is mainly related to the programming period 2007-13.
a.This increase is for the greatest part linked to the reporting of irregularities from one Member State (Spain), which covers almost half of the total number of irregularities reported in 2015.
b.As already clarified in the PIF Report 2015, the Spanish anomalous increase is due to belated reporting of irregularities detected throughout the programming period. If they are excluded, the number of reported irregularities would still be higher than in 2014. However, this increase would follow the natural behaviour of the programming cycle of the funds.
2)A minor, yet still striking increase of reporting is observed in relation to the irregularities related to the programming period 2000-06, whose numbers have also almost doubled between 2014 and 2015. In this respect, the explanation is again linked to a belated reporting by a single Member State (Ireland).
Table CP2 highlights the trends in terms of financial value of the irregularities detected and reported to the Commission over the last five years.
The only significant aspect to be highlighted in this respect is that, despite the minor decrease between 2015 and 2016 (-5%), the average financial amount per irregularity is significantly higher for the year 2016 (i.e. EUR 229 725 against EUR 195 496 of 2015, 17.5% more). This is mainly due to the high value of the irregularities affecting the Cohesion Fund, which finances infrastructure projects of very high value and in relation to which, sometimes, individual cases of irregularities involving very high amounts can be detected.
Table CP2: Trend of the financial amounts related to irregularities reported between 2012 and 2016 by programming period – Cohesion and Fisheries Policies


4.1.1.Irregularities reported as fraudulent
4.1.1.1.Trend by programming period
Table CP3 analyses the trend linked to the communication of the irregularities reported as fraudulent in the last five years (2012-2016), making a distinction by Fund involved and the relevant programming period.
In the last five years, while the fraudulent irregularities linked to the PP2000-06 have been decreasing, those linked to the PP2007-13 follow an increasing trend, albeit inconsistent, as they have been decreasing between 2013 – 2014, and 2015 - 2016. These trends are linked to the current implementation of the latter period and the closure of the previous.
Irregularities reported as fraudulent have increased by 62% since 2012 and they have decreased by 10% in comparison with 2015. This decrease is due to the reclassification of cases initially reported as non-fraudulent in 2015.
Table CP3: trend of the number of irregularities reported as fraudulent between 2012 and 2016 by programming period – Cohesion and Fisheries Policies


Table CP3 and its associated chart do not include irregularities reported as fraudulent related to programming periods previous to 2000-06.
Table CP4 provides in the same form of Table CP3 information about the trends linked to the amounts involved in cases reported as fraudulent. As already indicated on several occasions, the trend of the financial amounts is far less consistent, resulting from fluctuations which can be significant as individual cases involving high amounts can distort the overall picture. Between 2012 and 2016 the financial amounts involved in irregularities reported as fraudulent have been decreasing by 20% and by 54% in comparison to 2015. However, in 2012 the financial amounts linked to irregularities reported as fraudulent were significantly high due to cases detected in relation to projects co-financed by the Cohesion Fund, which affect, in general, high financial amounts, as already mentioned.
Table CP4: Trend of financial amounts linked to the irregularities reported as fraudulent between 2012 and 2016 by programming period – Cohesion and Fisheries Policies


4.1.1.2.Trend by Fund
The analysis of the same data presented in Table CP4 but focussed on the distribution of the irregularities reported as fraudulent by Fund (Table CP5), highlights the following situations:
(1)The highest number of cases relates to the ERDF. The trend increases overall , despite two years when it slowed down: 2014 and 2016;
(2)Cases related to the ESF have been constantly increasing until 2015 and their share on the total is significant;
(3)Potential frauds affecting the Cohesion fund are now reported regularly (since 2010), and they are quite stable from one year to another. Fluctuations of the amounts, however, can be particularly significant in respect of these cases.
Table CP5: Trend of the number of irregularities reported as fraudulent between 2012 and 2016 by Fund – Cohesion and Fisheries Policies


Table CP6 analyses the trends related to the financial amounts linked to the irregularities reported as fraudulent in the reference period.
The year 2015 appears as a special year, considering the high financial volume of irregularities linked to the most represented funds: ERDF and ESF. Considering that the number of the irregularities reported as fraudulent is only slightly lower in 2016 than in 2015, the average financial value of the detected fraudulent irregularities is indeed significantly higher in 2015.
Table CP6: Trend of financial amounts linked to the irregularities reported as fraudulent between 2012 and 2016 by fund – Cohesion and Fisheries Policies


4.1.2.Irregularities not reported as fraudulent
Table CP7 analyses the trend linked to the communication of the irregularities not reported as fraudulent in the last five years (2012-2016), making a distinction by Fund involved and the relevant programming period.
The reasons behind the increases related to both periods 2000-06 and 2007-13 between 2014 and 2015 have already been explained under paragraph 4.1.
Table CP7: Trend of the number of irregularities not reported as fraudulent between 2012 and 2016 by programming period – Cohesion and Fisheries Policies


The sum between the totals of Tables CP7 and CP5 differ by one unit in comparison with the total showed in Table CP1.
Table CP8 shows the trend related to the financial amounts linked to the irregularities not reported as fraudulent. Once more, as already mentioned several times in relation to the trends of the financial amounts, fluctuations can happen more often, as they are linked to individual irregularities or groups of irregularities of significant value, which produce distortive effects from one year to the next.
In 2016, for instance, financial amounts linked to irregularities not reported as fraudulent is higher than in 2015, despite the significant decrease in the number of notified cases. For the Cohesion Fund, programming period 2007-13, the related financial amounts have almost doubled in comparison with the previous years. They have significantly increased also for the ESF, while, in relation to the ERDF, they have remained stable despite the decrease of reported irregularities. Considering the fact that irregularities reported as fraudulent usually imply higher financial amounts, one may wonder whether some of the cases notified as non-fraudulent will be reclassified later as potentially fraudulent.
Table CP8: Trend of financial amounts linked to the irregularities not reported as fraudulent between 2012 and 2016 by programming period – Cohesion Policy


4.2.Specific Analysis – Irregularities reported in relation to the Programming Period 2007-13
This section of the analysis focuses on the irregularities reported in relation to the programming period 2007-13 exclusively. The closure for the programming period started in March 2017; it therefore offers an ideal opportunity to present a complete overview of what has happened. Consequently, the analysis will cover a greater time span than the previous paragraph (2012 to 2016), to examine all information available, which dates back to 2008.
It will cover the following aspects:
·Objective;
·Priorities and themes affected;
·Types of irregularity
4.2.1.Objectives concerned by the reported irregularities
The trend by objective of the reported irregularities follows a foreseeable pattern as showed in Table CP9. The majority of the irregularities were notified over the last three years of the reference period and mainly concern the Convergence objective (70% of the total), in line with the fact that this is the objective to which the greatest financial resources are allocated and in relation to which higher risks are associated. The anomaly concerning the year 2015 has already been explained.
Table CP9: Trend of the number of irregularities reported in relation to the programming period 2007-13 by objective – Cohesion Policy


180 irregularities do not correctly indicate the objective.
Table CP10 analyses the trend followed by the financial amounts linked to the reported irregularities, which broadly follows the same line as that showed in Table CP9, with the exception of the amounts linked to the Convergence objective reported in 2012, which exceed those related to the following two years, and those related to 2016, which are higher than those reported in 2015.
In 2016, irregular amounts reported in relation to the Cohesion Fund are significantly high, as already showed in Table CP8 and highlighted in section 4.1.
Table CP10: Trend of the financial amounts linked to irregularities reported in relation to the programming period 2007-13 by objective – Cohesion and Fisheries Policies


4.2.1.1.Irregularities reported as fraudulent by Objective
Table CP11 and CP12 show the trends presented in the previous paragraph taking into consideration only the irregularities reported as fraudulent during the programming period 2007-13. The trends are similar, although in relation to the financial amounts reported it is more evident the distorting impact that high profile cases can have.
The higher share represented by the Convergence objective in comparison with that presented in the previous paragraph is also significant.
Table CP11: Trend of the number of irregularities reported as fraudulent in relation to the programming period 2007-13 by objective – Cohesion and Fisheries Policies


Irregularities reported as fraudulent represent about 5% of the total number of irregularities reported for the programming period 2007-13. The highest share (Fraud Frequency Level – FFL) is related to the Fisheries (8.1%), the European Territorial Cooperation (7.5%) and to the Convergence (5.7%) objectives. Regional competitiveness and Employment has the lowest FFL (2.9%).
Table CP12: Trend of the financial amounts linked to the irregularities reported as fraudulent in relation to the programming period 2007-13 by objective – Cohesion and Fisheries Policies


Financial amounts linked to irregularities reported as fraudulent represent about 17% of the total reported for the programming period 2007-13. The highest share (Fraud Amount Level – FAL) is related to the Fisheries (19.3%), the Convergence (18.5%) and the European Territorial Cooperation (17.8%) objectives. Regional competitiveness and Employment has the lowest FFL (6.1%).
The difference between FFL and FAL, almost three times higher, indicates the higher financial impact of fraudulent irregularities compared to the non-fraudulent infringements. As a matter of fact, the average financial value linked to the irregularities reported as fraudulent is almost four times higher than that related to the non-fraudulent types.
Case study: Criminal investigation in Latvia about possible misuse of structural funds
Criminal case No. XX was started in 2014 by ECED, classified under Article 177 clause 3 of the Criminal Law (for fraud, if committed on a large scale, or in an organised group), by examining the submission of the Latvian Rural Support Service (RSS) regarding possible fraudulent activities of the Latvian company (Ltd.) responsible officials during project implementation, in order to embezzle EU structural funds on a large scale.
In 2016 the criminal proceedings were transferred to the Riga District Court Prosecutor’s Office for criminal prosecution according to the Article 15 clause 4 (for an attempted crime), Article 177 clause 3 and Article 275 clause 2 (falsification of documents for the purpose of acquiring property by an organized group) of the Criminal Law against two suspect. Loss was prevented (EUR 140 000 was to be paid in funding).
Conditions of the case:
In 2012 Ltd. X officials submitted a project for the purchase of metal processing equipment to the RSS to receive financial support amounting to EUR 140 000. When evaluating the submitted project documentation RSS employees doubted that the documents submitted were genuine.
RSS sent the obtained documentation for further inspection to ECED.
Police investigation showed and proved that Ltd. X officials had provided false information about the company’s financial condition – forged bank documentation was submitted for the project (including from a bank which is located in Russia) on the company’s financial resources in order to acquire necessary equipment and receive co-financing from EU structural funds.
4.2.1.2.Fraud and Irregularity Detection Rates by Objective
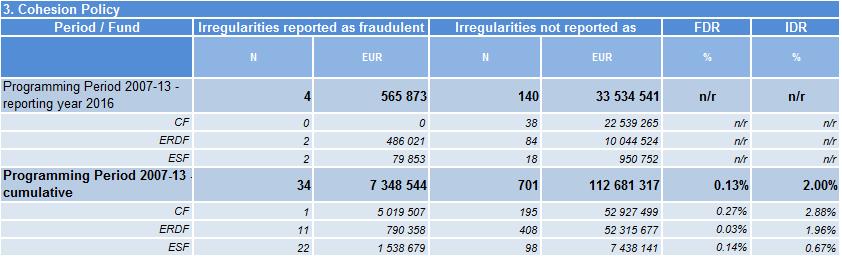
Table CP13 shows the FDR and the IDR per objective. Further details about this calculation can be found in paragraph 4.4.2.
Looking at the overall detection rate (FDR + IDR), Regional competitiveness and employment programmes show a low level of detections. European Territorial Cooperation programmes, however, show an anomalously low level of detections (four times lower than the previous objective), especially if one considers that the previous two indicators (FFL and FAL) were high. The situation is different for Convergence, Multiobjective and Fisheries programmes. Interestingly, the "Total detection rate" is almost equal to that of rural development and market measures in the agricultural policy. (see chapter 3.3.2).
Table CP13: FDR and IDR by Objective

4.2.2.Priorities concerned by the reported irregularities
4.2.2.1.Irregularities reported as fraudulent (fisheries not included)
The operational programmes financed by the Cohesion Policy are implemented in relation to the already mentioned objectives, but also along identified Priorities and Themes.
The information provided by Member States allows for an analysis of the priority areas in relation to which Member States have identified projects affected by potentially fraudulent practices.
Table CP14 shows the number of reported fraudulent irregularities by priority area since the beginning of the programming period 2007-13, their related financial amounts, the average amount per irregularity, FFL and FAL.
In terms of numbers, the 'Priorities' most concerned were 'Research and Technological Development (RTD)', 'Improving access to employment and sustainability' and 'Increasing the adaptability of workers and firms, enterprises and entrepreneurs'.
Fraudulent irregularities linked to these three priorities represent about 37% of the total.
FFL is highest for 'Strengthening institutional capacity' and 'Tourism' (10%), while the top three priorities in the table are all between 9.1 and 9.7%.
From the financial amounts point of view, the most significant results concern ‘R&TD’, 'Transport' and 'Investment in Social Infrastructure'. ‘Transport’ retains also the highest average value, almost eight times higher than that related to R&TD and 22 times higher than the overall average.
Financial amounts linked to the irregularities reported as fraudulent in relation to these three priorities represent 58% of the total.
FAL is highest for 'Investment in social infrastructure' (41.3%), 'Tourism' (25%) and 'R&TD' (21.6%).
The FDR is highest for the same priorities and in exactly the same order: 'Investment in social infrastructure' (0.84%), 'Tourism' (0.74%) and 'R&TD' (0.55%)
Table CP14: PP2007-13 - Irregularities reported as fraudulent by Priority

Irregularities linked to the EFF have not been included. Reference to 'Technical assistance Fisheries' and 'Measures of common interest – fisheries' in the Table may depend on errors in encoding by Member States.
Less than one third of the irregularities used for this analysis did not provide information about the priority area concerned, decreasing in comparison with previous years.
4.2.2.2.Irregularities not reported as fraudulent (fisheries not included)
The same analysis showed in the previous paragraph for the irregularities reported as fraudulent is presented here for the irregularities not reported as fraudulent in relation to the programming period 2007-13.
Table CP15 shows the number of reported fraudulent irregularities by priority area since the beginning of the programming period 2007-13, their related financial amounts and average amount per irregularity.
Again, ‘Research and Technological Development (R&TD)’ is the priority with the highest number of occurrences, followed by ‘Environmental protection and risk prevention’ and ‘Transport’. In terms of financial amounts involved, 'Transport' comes first, followed by the other two priorities.
Therefore, irregularities linked to these three priorities together represent 21.6% of the total number and 45.4% of the total amounts.
Table CP15: PP2007-13 - Irregularities not reported as fraudulent by Priority

Irregularities linked to the EFF have not been included. Reference to priorities specific referred to this policy area, therefore, may depend on errors in encoding by national authorities.
Also in relation to the irregularities not reported as fraudulent the constant improvement in the completeness of data is confirmed, although to a lesser extent than for the fraudulent irregularities.
4.2.2.3.Irregularities related to the priority 'R&TD'
As showed in the previous two sub-paragraphs of this section, 'R&TD' is the priority for which the highest number of irregularities, fraudulent and non-fraudulent, have been detected and reported: in total, 3 995 cases, involving over EUR 1.7 billion.
Figure CP1 below, details the specific priority themes which were affected by these irregularities. Please note that the larger the square, the higher the number of irregularities; the darker the colour, the higher the financial amounts involved.
Two "residual" themes are those showing the highest number of reported irregularities: 'Other investment in firms' and 'Other measures to stimulate research and innovation and entrepreneurship in SMEs'. Together they represent 46% of the reported irregularities, but only 21% of the related financial amounts. Conversely, the themes 'Investment in firms directly linked to research and innovation (innovative technologies, establishment of new firms by universities, existing R&TD centres and firms, etc.)' and 'R&TD activities in research centres' represent only 23.5% of the total number of reported irregularities, but account for almost 51% of the total financial amounts involved.
Figure CP1: PP2007-13 - Irregularities (fraudulent and non-fraudulent) reported in relation to the 'R&TD' Priority by theme

Figure CP2 shows the same level of detail for the irregularities reported as fraudulent.
Similarly to the overall picture, the two "residual" themes present the highest number of occurrences. However, again, the theme 'Investment in firms directly linked to research and innovation (innovative technologies, establishment of new firms by universities, existing R&TD centres and firms, etc.)' has the highest financial amounts, followed by the theme 'R&TD infrastructure (including physical plant, instrumentation and high-speed computer networks linking research centres) and centres of competence in a specific technology'. These two themes together represent only 24% of the number of irregularities reported as fraudulent in relation to the 'R&TD' priority, but more than 52% of the total financial volume of these cases.
Figure CP2: PP2007-13 - Irregularities reported as fraudulent in relation to the 'R&TD' Priority by theme

4.2.2.4.Types of irregularities / modus operandi detected related to the priority 'R&TD'
The analysis of categories of irregularities detected and reported in connection with the priority 'R&TD' shows a fragmented situation. Detected fraudulent attempts mainly happen during the implementation of a project and are made through falsified documents or declarations (in about 35% of the cases as the main violation or in conjunction with other types of infringement), or by infringing the commitments entered into through the signature of the financing contract (occurring in 38% of the cases, alone or with other), which implies that the project is not implemented according to what was initially agreed.
Violation of public procurement rules in connection with irregularities reported as fraudulent have been detected in 8% of the cases but impact on 14% of the total amounts involved.
Irregularities concerning ethics and integrity (including possible cases of corruption and conflict of interest) concern 3% of the cases and 6% of the total amounts affected by irregularities are reported as fraudulent. The related amounts for this category are particularly significant despite the low number of cases, as showed by the fact that, associated to this category, there is the highest average irregular amount.
Table CP16: Programming Period 2007-13 - Types of irregularity/Modus operandi detected in relation to priority "R&TD"


The data population used in this paragraph consists of all irregularities reported in relation to the priority "R&TD" and the programming period 2007-13 until the end of 2016.
The row for totals has been omitted due to the fact that the same irregularity reported may be associated with several typologies of infringements and therefore the total sum of values in Table CP16 would result in multiple counting of the same irregularity notification.
The category “Infringement of contract provision / rules” includes all irregularities related to implementation of the contract, i.e. irregularities such as ‘action not implemented’, ‘action not completed’, ‘action not carried out in accordance with rules’, ‘Failure to respect other contract provisions/rules’.
The category “Eligibility / Legitimacy of expenditure / measure” refers to all irregularities concerning the eligibility of the project or of the expenditure claimed, such as ‘Not-eligible expenditure’, ‘Expenditure not-legitimate’, ‘Expenditure outside of eligibility period’,
The category “Infringements concerning the request” refers to all types of irregularities associated with the request of aid/financing, such as ‘Incorrect request for aid’, ‘Request for aid false or falsified’.
The category “Ethics and Integrity” refers to violations such as ‘Conflict of interest’, ‘Bribery – active’, ‘Bribery – passive’, ‘Corruption’, ‘Other irregularities concerning integrity and ethics’.
The “other irregularities” category is a residual category to be used when all others do not provide an adequate description of the detected irregularity.
4.2.2.5.Geographical distribution of irregularities (fraudulent and non-fraudulent) detected in relation to the 'R&TD' priority
Map CP1 shows the geographical distribution of the irregularities (fraudulent and non-fraudulent) detected and reported in relation to the theme 'R&TD'.
Map CP1: Number of irregularities (fraudulent and non-fraudulent) reported by Member State in relation to the theme 'R&TD' – programming period 2007-13

4.3.Antifraud and control activities by Member States – programming period 2007-2013
Previous paragraphs have examined the trend and main characteristics of the reported irregularities.
The present paragraph aims at examining some aspects linked to the antifraud and control activities and results of Member States. Four elements are taken into account:
·the duration of irregularities, meant as the time that runs between the beginning of the fraudulent practice and its detection/establishment by the competent authority;
·the number of irregularities reported as fraudulent by each Member State;
·the fraud detection rate (the ratio between the amounts involved in cases reported as fraudulent and the payments occurred in relation to the programming period 2007-13) and the irregularity detection rate (the ratio between the amounts involved in cases not reported as fraudulent and the payments occurred in relation to the programming period 2007-13;
·the ratio of cases of established fraud on the total number of irregularities reported as fraudulent.
4.3.1.Duration of irregularities
Of the 37 110 detected irregularities (fraudulent and non-fraudulent) reported by Member States in relation to the programming period 2007-13, 18 142 (47% of the total) involve infringements that have been protracted during a given span of time. For the 1 750 irregularities reported as fraudulent this percentage is higher at 60%. The remaining part of the datasets refers to irregularities/breaches which consisted of a single act identifiable on a precise date (19% of the whole dataset and 26% of that represent exclusively by the fraudulent irregularities) or for which no information has been provided (34% of the whole dataset, but only 14% of the irregularities reported as fraudulent).
Taking into account only those irregularities which have been protracted in time, their average duration is almost 20 months (i.e. almost 1 year and 8 months). For the irregularities reported as fraudulent, this average is just one month less: 19.
4.3.2.Detection of irregularities reported as fraudulent by Member State in relation to the programming period 2007-13
Map CP2 shows the number of irregularities reported as fraudulent by Member State in relation to the programming period 2007-13.
Only Luxembourg has notified no irregularity as fraudulent; fourteen (14) Member States reported less than 30 fraudulent irregularities; four (4) countries reported between 30 and 60; three (3) Member States between 60 and 90 fraudulent irregularities and six (6) more than 90.
Poland, Romania and Germany are the three countries which have reported the highest numbers.
Case study: Cohesion policy, ERDF – undue receipt of EU funds relating to a soil conservation project. Operation ‘Hulk’ carried out by the Catanzaro Guardia di Finanza
The Catanzaro Guardia di Finanza’s Tax Investigation Unit carried out a complex investigation aimed at tackling multiple offences concerning a regional body set up for the purpose of integrated implementation of all forestry and soil conservation measures in the region’s territory.
The main line of investigation concerned checking whether two project items complied with the corresponding rules. These items were co-financed with monies from the European Union budget, specifically the European Regional Development Fund (ERDF) 2007/2013, for securing riverbeds and addressing landslide risks in the region.
The investigations uncovered fraudulent conduct on the part of various persons involved in the management of the body, whereby some EUR 80 million of public funding (half of it EU funds) were unduly obtained, out of an initial allocation of more than EUR 100 million.
Against this backdrop, it was discovered that a part of the monies made available by the Union was used for purposes other than financing project targets, namely covering the ordinary expenditure of the beneficiary undertaking, including the regular and ongoing payment of the salaries of the regional body’s employees.
Further inquiries also brought to light other offences at the expense of the public administration, perpetrated over the same period by members of the body’s management team relating to, for example:
-
the use of workers for private ends (during their working hours, thus taking them away from their contractual activities), as well as of the body’s assets and funds;
-
the attribution of a remunerated task to a person lacking the necessary qualifications to carry out the duties involved.
With respect to these criminal acts, in September 2016 the above-mentioned unit of the Guardia di Finanza, authorised by the local Public Prosecutor’s office, took restraining measures against five managers, officials and consultants of the publicly-owned entity which had been responsible to varying degrees for embezzlement of public monies, misuse of official positions, forgery and aggravated fraud.
Map CP2: Number of irregularities reported as fraudulent by Member State in relation to the programming period 2007-13 – Cohesion Policy

4.3.3.Fraud detection rate
The fraud detection rate compares the results obtained by Member States in their fight against fraud with the related commitment appropriations. Considering the multi-annual nature of the cohesion policy spending programmes, no annual analysis has been prepared, concentrating instead on the whole programming period 2007-13, for which commitment appropriations have almost reached 100% and the number of fraudulent irregularities reported by Member States is significant.
The fraud detection rate is the highest (>0.3%) for Slovakia, Italy, Latvia, the Czech Republic, Romania, Slovenia, Poland, Portugal and Croatia.
Table CP16: Number of irregularities reported as fraudulent, amounts involved and fraud detection rate by Member State – Programming Period 2007-13

Programmes under the Territorial Cooperation Programme (designated in the table under the country code 'CB', last row before the total) can involve several countries and, therefore, paid amounts are spread among the beneficiaries in various Member States. However, in general, irregularities for these programmes are reported by the Member State in which is located the managing authority. For this reason, the sums paid have been included in the total, while the irregularities reported as fraudulent and the related amounts have already been computed in relation to the country having reported them. The numbers have been included in the table to calculate the FDR related to these programmes, but they are not summed in the total row to avoid a double counting.
4.3.4.Irregularity Detection Rate
The irregularity detection rate compares the results obtained by Member States in detecting non-fraudulent irregularities with the related commitment appropriations. Considering the multi-annual nature of the cohesion policy spending programmes, no annual analysis has been prepared, concentrating instead on the whole programming period 2007-13, for which commitment appropriations have almost reached 100% and the number of irregularities detected and reported by Member States is significant.
Table CP17: Number of irregularities not reported as fraudulent, amounts involved and irregularity detection rate by Member State – Programming Period 2007-13

Programmes under the Territorial Cooperation Programme (designated in the table under the "country-code" 'CB', last row before the total) can involve several countries and, therefore, paid amounts are spread among the beneficiaries in various Member States. However, in general, irregularities for these programmes are reported by the Member State in which is located the managing authority. For this reason, the sums paid have been included in the total, while the irregularities not reported as fraudulent and the related amounts have already been computed in relation to the country having reported them. The numbers have been included in the table to calculate the IDR related to these programmes, but they are not summed in the total row to avoid a double counting.
4.3.5.Ratio of established fraud (programming period 2007-13)
Table CP22 shows the ratio between the cases of established fraud and the total number of irregularities reported as fraudulent (including suspected and established fraud) in the period 2009-13. Taking into account only cases reported in 2015 would be meaningless, as the criminal proceedings leading to a conviction for fraud may take several years, while using the period 2010-14 would be misleading as it will be impossible to make a sound comparison with figures published in the 2013 and 2014 Report.
Table CP18 is integrated with the ‘Dismissal ratio’, calculated by the differences between the total number of irregularities reported as fraudulent published in the corresponding table in the 2013 Report (TOTAL 2013) and the total calculated taking into account the updates received until the end of 2016. When the ratio is positive, it means that Member States have classified as ‘suspected’ or ‘established fraud’ an irregularity appearing as non-fraudulent in 2013.
In this respect, the average ratio of established fraud at EU level is 14%, increasing from 11% of 2013. The dismissal ratio is 5%.
If one considers exclusively the “decisions” (established + dismissed), of the 128 decided cases (91 established fraud and 37 dismissals), 71% is the ‘conviction rate’ and 29% the ‘dismissal rate’.
Table CP18: Number of cases of suspected and established fraud, ratio of established fraud, dismissal ratio – cases reported until 2013

Case study: European Fisheries Fund - Use of Spain’s system of public-private partnerships to circumvent the application of public procurement rules
Spanish public procurement law, specifically the Royal Legislative Decree 3/2011 of 14 November 2011 approving the recast Law on public sector contracts, expressly excludes from its scope a specific type of legal agreement called a convenio de colaboración (public-private partnership), as laid down in Article 4(1)(c) and (d) of the aforementioned recast Law.
These legal agreements differ from public procurement contracts in that they do not relate to a mutual exchange of services between the parties for consideration, but rather they set up a partnership between the parties to achieve an objective of common interest to them both. For a legal agreement to be considered a public-private partnership in the strictest sense and for it to be exempt from public procurement rules, bearing in mind the subject of the agreement, and irrespective of the name the parties give to the agreement, the following conditions must be met:
-
both parties must be involved in actually carrying out the activity to which the agreement relates;
-
both parties must be involved in financing the activity;
-
the result of the activities to which the agreement relates must be jointly owned or used by both parties.
A public-private partnership agreement differs from a public procurement contract in all of these respects; in the latter, one of the parties (the contractor) has sole responsibility for carrying out the activities, while the other party (public body) has sole responsibility for financing these activities, and the result of these activities is owned or used exclusively by the public body.
The specific case we wish to highlight here relates to a public body that was in receipt of European funding. In order to benefit from the less stringent rules that apply to public-private partnerships in Spain (specifically, the rules do not require a competitive procedure to be held to select the public body’s partner), the public body handled a legal agreement as a public-private partnership (meaning that it selected its partner directly without a competitive procedure). However, in view of the subject of the agreement, it should have been considered as a service contract and the awarding of the contract should therefore have taken place in accordance with the competitive procedures laid down in the public procurement rules.
Section II - Decentralised Management
The EU as a global player / Pre-Accession Policy
The goal of the EU as a global player is also promoted through direct management. Pre-Accession Assistance (PAA) is provided through decentralised management where third countries distribute funds but account to the EU for how it is spent. In the last stages new Member States manage pre-accession funds under shared management to help them complete the transition.
5.Pre-Accession Policy (Pre-Accession Assistance and Instrument for Pre-Accession I and II)
The assistance in pre-accession is provided on the basis of the European Partnerships of the potential candidates and the Accession Partnerships of the candidate countries. The current candidate countries are Albania, the Former Yugoslav Republic of FYROM, Montenegro, Serbia and Turkey. Potential candidate countries are Bosnia and Herzegovina and Kosovo.
5.1.The Pre-accession Assistance (PAA), 2000-06
The old Pre-accession Assistance (PAA), regarding the period 2000-06, was financed by series of European Union programmes and financial instruments for candidate countries or potential candidate countries, namely the programmes for candidate countries,
PHARE
,
SAPARD
and
ISPA
, Phare Cross-Border Cooperation (CBC) and Coordination, Pre-accession financial assistance for Turkey, Assistance for reconstruction, development and stabilisation for potential candidate countries (
CARDS
) and Transition facility.This assistance has nearly been closed except for a few payments in CARDS.
5.2.The Instrument for Pre-accession 2007-13 – IPA I
The Instrument for Pre-Accession Assistance (IPA), which covers the period 2007-2013, is delivered through five components. The policy and programming of IPA consists of
Multi-Annual Indicative Financial Framework
(MIFF) on a three year basis, established by country, component and a theme, and
Multi-Annual Indicative Planning Documents
(MIPDs) per country or per groups of countries (regional and horizontal programmes). The Candidate Countries submit also Strategic Coherence Frameworks (SCF) and Multi-annual Operational Programmes, both regarding IPA Components III and IV. Their principal aim is to prepare beneficiary countries for the future use of the Cohesion policy instruments by imitating closely its strategic documents, National Strategic Reference Framework (NSRF) and Operational Programmes (OP), and management modes.
The financing of IPA is provided by the five following different components and DG Enlargement leads in the coordination of the instrument:
(4)Component I, Transition Assistance and Institution Building (TAIB), is managed by the European Commission's
Directorate General for Enlargement
;
(5)Component II, Cross-Border Cooperation, is managed by the European Commission's
Directorate General for Enlargement
and part is managed, under shared management with Member States, by European Commission's
Directorate General for Regional
Policy;
(6)Component III, Regional Development, is managed by the European Commission's
Directorate General for Regional
Policy;
(7)Component IV, Human Resources Development, is managed by the European Commission's
Directorate General for Employment and Social Affairs
; and
(8)Component V - Rural Development is managed by the European Commission's
Directorate General for Agriculture
.
The pre- and post-accession assistance is implemented through a variety of management modes which take into account different levels of preparedness of the beneficiary countries. The assistance under IPA is designed also to prepare the beneficiary countries to assume full responsibility for the management of financial assistance granted by the EU.
The eligibility for IPA components differs depending on the state of preparedness. In the use of funds the IPA beneficiary countries are divided into two categories. Croatia and the EU candidate countries: the Former Yugoslav Republic of FYROM, Serbia and Turkey; are eligible for all five components of IPA. While the new candidate countries, Albania and Montenegro (candidate status awarded in 2010), currently remain outside the scope of intervention of IPA Component III, the regional development. The Potential candidate countries in the Western Balkans (Albania, Bosnia and Herzegovina, Montenegro and Kosovo under UN Security Council Resolution 1244/99) are eligible only for the first two components.
Implementation of Components I and II falls under the responsibility of DG Enlargement, which initiates the components under a centralised management mode, with a view to transferring implementation management powers to the beneficiary countries as soon as their administrative capacities are considered sufficiently developed to ensure sound financial management. The EU Delegations play a major role in the delivery of IPA, in particular under the de-concentrated and decentralised management modes.
The implementation can be handled:
·directly by central management: funds are managed by DG Enlargement at headquarters;
·directly de-concentrated: funds are managed by EU Delegations under the supervision;
·directly centralised: cross-delegated when funds are managed by another service of the Commission through cross sub-delegation;
·indirectly in a centralised indirect management: funds are managed by executive agencies, specialised Community bodies (such as the European Investment Bank or the European Investment Fund) and national or international public-sector bodies or bodies governed by private law with a public-service mission;
·indirectly decentralised with ex ante control: funds are managed by accredited national authorities of the beneficiary country, but procurement is subject to ex ante control by the EC Delegation;
·decentralised without ex ante control: funds are managed by accredited national authorities of the beneficiary country and are not subject to ex ante controls by an EC Delegation;
·joint: funds are jointly managed with International Organisations (EBRD, EIB, Sigma, UN agencies, etc.)
5.3.The Instrument for Pre-accession 2014-20 – IPA II
Prepared in partnership with the beneficiaries, IPA II sets a new framework for providing pre-accession assistance for the period 2014-2020.
The most important novelty of IPA II is its strategic focus. Country Strategy Papers are the specific strategic planning documents made for each beneficiary for the 7-year period. These will provide for a stronger ownership by the beneficiaries through integrating their own reform and development agendas. A Multi-Country Strategy Paper will address priorities for regional cooperation or territorial cooperation.
IPA II targets reforms within the framework of pre-defined sectors. These sectors cover areas closely linked to the enlargement strategy, such as democracy and governance, rule of law or growth and competitiveness. This sector approach promotes structural reform that will help transform a given sector and bring it up to EU standards. It allows a move towards a more targeted assistance, ensuring efficiency, sustainability and focus on results.
IPA II also allows for a more systematic use of sector budget support. Finally, it gives more weight to performance measurement: indicators agreed with the beneficiaries will help assess to what extent the expected results have been achieved.
·The priorities outlined in the Strategy Papers are translated into detailed actions, which are included in annual or multi-annual Action Programmes. IPA II Action Programmes take the form of Financing Decisions adopted by the European Commission.
·The bulk of the assistance is channelled through the Country Action Programmes for IPA II Beneficiaries, which are the main vehicles for addressing country-specific needs in priority sectors as identified in the indicative Strategy Papers.
·Multi-Country Action Programmes aim at enhancing regional cooperation (in particular in the Western Balkans) and at adding value to the Country Action Programmes through other multi-beneficiary actions.
·Cross-Border Cooperation Programmes represent the focus of assistance in the area of territorial cooperation between IPA II beneficiaries, another important form of financial assistance.
Assistance for agriculture and rural development is also addressed via Rural Development Programmes.
IPA II funded activities are implemented and managed in various ways, in accordance with the Financial Regulation:
·Under direct management; i.e. the implementation of the budget is carried out directly by the Commission until the relevant national authorities are accredited to manage the funds.
·Under indirect management; i.e. budget implementation tasks are delegated to and carried out by entities entrusted by the Commission; they can be:
-the IPA II beneficiary or an entity designated by it (one of the main objectives of IPA II is to encourage beneficiaries to take ownership and responsibility for implementation; indirect management by the IPAII beneficiary is therefore expected to become the norm);
-an agency of a Member State or, exceptionally, of a third donor country;
-an international organisation; or
-an EU specialised (but not executive) agency.
In other words, the Commission delegates the management of certain actions to external entities, while still retaining overall final responsibility for the general budget execution.
·Shared management; i.e. implementation tasks are delegated to EU member states (only for cross–border cooperation programmes with EU countries).
In the context of direct management, Sector Budget Support is yet another tool for delivering pre-accession assistance and achieving sustainable results under IPA II. It consists of financial transfers to the national treasury account of an IPA II beneficiary and requires performance assessment and capacity development, based on partnership and mutual accountability. It is delivered through Sector Reform Contracts.
Implementation of IPA II will include a comprehensive monitoring mechanism. It will contain a review of overall performance of the progress in achieving resultsat the strategic, sector and action levels (i.e. results-based performance), in addition to monitoring of financial execution. Performance measurement will be based on indicators set out in the indicative Strategy Papers and the Programmes.
Joint monitoring committees (Commission and beneficiaries) will continue to monitor the implementation of financial assistance programmes, as was the case for the previous period of IPA.
The Commission publishes an annual report on pre-accession assistance. This report covers the previous budget year.
5.4.General analysis – Trend analysis
5.4.1.Trend analysis – Pre-accession assistance (PAA)
Regarding the Pre-Accession Assistance (PAA), the number of reported irregularities decreased in 2016 compared to the previous year. The downward trend, which started since 2009, is confirmed for the last five years, as showed by Table PA1.
With the phasing out of the pre-accession programmes, also the number of detected and reported fraudulent irregularities is continuously decreasing, with the only exception of the year 2013.
Table PA1 – Reported irregularities (PAA), 2012-16


In the past five years, most of the irregularities, fraudulent and non-fraudulent (97% of the total) and the highest aggregate amount (99% of the total) were reported by Romania and Bulgaria. In relation to the distribution of irregularities according to funds, the highest numbers relate to SAPARD (64%), while the most amounts concerned relate to SAPARD and ISPA (47% each).
5.4.2.Trend analysis Instrument for Pre-Accession (IPA I)
Generally it can be said that the trend of IPA reporting (financial framework 2007-13) has begun to develop in a stable upward curve which means a continuous increase in the number of irregularities reported and involved amounts only since 2010. The increasing trend can be considered within the norm as the reporting of irregularities of IPA has only begun in recent years.
Table PA2 details the underlining data and shows the evolution of reporting of all the irregularities (reported and not reported as fraudulent) since 2012. Irregularities reported as fraudulent have been increasing over the last two years.
Table PA2 – Reported irregularities (IPA), 2012-16


During the last five years, the highest number of reported irregularities was communicated by Turkey, Bulgaria and Croatia. The highest number of irregularities was recorded in relation to IPARD and Cross-Border Cooperation. IPARD and Regional Development score the highest in monetary value.
5.5.Specific analysis – Financial year 2015
5.5.1.Pre-Accession Assistance (PAA)
In 2016 a total number of 3 irregularities were reported as fraudulent with the amount affected of EUR 1.8 million as shown in Table PA3.
Table PA3 – Reported irregularities per country (PAA), 2016

These fraudulent irregularities were reported by Romania. Bulgaria reported 3 non-fraudulent irregularities.
Like in the previous years, in 2015 the majority of cases concern again SAPARD, the Special Accession Programme for Agriculture and Rural Development.
The 3 irregular fraudulent cases reported are related to the SAPARD, which remains the most affected by fraud among all the PAA funds.
Table PA4 – Reported irregularities per fund (PAA), 2016

5.5.2.Instrument for Pre-Accession (IPA)
In relation to IPA I (2007-13), there were 25 irregularities reported as fraudulent in 2016, for an overall financial impact of more than EUR 1.2 million. Tables PA5 and PA6 show, respectively, the breakdown per country and per component.
Table PA5 – Reported irregularities per country (IPA), 2016

In 2016 Turkey was the country reporting the highest number of irregularities and the related financial amounts. Concerning the 20 irregularities reported as fraudulent, these were reported by five countries.
Cross-Border Cooperation programmes record the highest number of irregularities reported, while Rural Development programmes account for the highest amounts involved.
Table PA6 – Reported irregularities per component (IPA), 2016

No real pattern emerges from the analysis of the reported modus operandi for the fraudulent irregularities.
When it comes to the irregularities not reported as fraudulent, the most frequent infringements detected are related to 'irregularities concerning the operator' and the 'documentary proof'.
Section III – Direct Management
6.Direct Management
6.1.Introduction
This chapter contains a descriptive analysis of the data on recovery orders issued by Commission services in relation to expenditures managed under ‘direct management’ mode, which is one of the three implementation modes the Commission can use to implement the budget.
According to the Financial Regulation, ‘direct management’ means that the Commission implements the budget by its departments, including its staff in the Union Delegations under the authority of their respective Head of Delegation, or through executive agencies.
For financial year 2016, a total of EUR 18.9 billion has been effectively disbursed under the ‘direct management’ mode. Table DM1 presents the actual payments made in financial year 2016 for the twenty policy areas corresponding to 97.7% of the overall operational payments made under ‘direct management’.
Table DM1 – Payments made in financial year 2016 per policy area

6.2.General analysis
In 2016, for the twenty policy areas, the Commission services registered 1910 recovery items in ABAC that were qualified as irregularities for a total financial value EUR 84.25 million. Among these recovery items, 49 have been reported as fraudulent, involving EUR 6.25 million irregular amounts.
However, it has to be underlined that qualifications attributed to recovery items may change over the years: it may happen that cases of irregularities are turned to suspicions of fraud or the other way round, suspicions of fraud are reclassified as non-fraudulent irregularities upon the closure of the OLAF investigation. As a consequence, no direct conclusion can be drawn from the data with regard to the general trend of irregularities or fraud in this budget area.
6.2.1.Five year analysis 2012-2016
The below analysis gives an overview of recovery data recorded in the ABAC system in the last five years. From a purely statistical point of view, it can be said that between 2012 and 2016, the average number of recovery items qualified as ‘irregularities reported as fraudulent’ was 43. The peak so far has been reached in 2014, when 89 recovery items were qualified as fraudulent. However, with regard to the recovery amounts, it has been 2016 when the highest overall amount of EUR 6.25 million were recorded as irregular amounts linked to recovery items qualified as fraudulent.
Over the five year period, the ratio between the amounts related to irregularities reported as fraudulent’ and relative expenditure is very small, as it remains close to zero (0.025%). The figures are presented in Table DM2 below.
Table DM2 – Irregularities reported as fraudulent and related amounts, financial years 2012-2016

At the same time, we can experience a steady increase of the recorded number of ‘irregularities not reported as fraudulent’ as well as of the associated financial amounts until 2015. However, figures drop for 2016, as it is demonstrated by table DM3 below.
Table DM3 – Irregularities not reported as fraudulent and related amounts, financial years 2012-2016

Between 2012 and 2016, there were all together 8676 registered recovery items qualified as ‘irregularities not reported as fraudulent’ with the aggregate recovery amount of EUR 431.31 million.
The ratio between the aggregate irregular amounts corresponding to the recovery items (classified as ‘irregularities not reported as fraudulent’ between 2012 and 2016) and the reference figure of the related expenditure is about half a percent (0.572%).
These figures demonstrate the efficiency of the irregularity detection and recovery mechanisms in place.
6.3.Specific analysis
6.3.1.Recoveries according policy areas
Table DM4 provides a picture of irregularity statistics with a breakdown of the twenty policy areas for year 2016.
Table DM4 – Irregularities reported by policy areas and related amounts, 2016

In the financial year 2016, the highest numbers of recovery items qualified as 'irregularities not reported as fraudulent' were recorded in the ‘Research and innovation’ budget area. In terms of irregular amounts related to these irregularities, it was also the policy field ‘Research and innovation’ that scored by far with the highest amount of EUR 22.03 million, which is followed by budget areas ‘Mobility and transport’ (EUR 8.45 million) and ‘Communications networks, content and technology’ (EUR 8.24 million). Furthermore, substantial irregular amounts have been recovered in areas of ‘Neighbourhood and enlargement negotiations’ (EUR 7.34 million), ‘International cooperation and development’ (EUR 6.54 million) and ‘Foreign Policy Instruments’ (EUR 6.26 million). These six policy areas account for 58.9 % of the total irregular amounts recovered.
Regarding ‘irregularities reported as fraudulent’, there were 49 recovery items registered mostly concerning budget area ‘Communications networks, content and technology’ (29 items), followed by ‘Foreign policy instruments’ (9 items) and ‘Research and innovation’ (7 items) budget areas.
The total relate irregular amounts were EUR 6.25 million, out of which alone policy area ‘Communications networks, content and technology’ counts for EUR 4.97 million.
The five year perspective of irregularities regarding the twenty policy fields is presented hereunder by table DM5.
Table DM5 – Irregularities reported by policy areas and related amounts, financial years 2012-2016

The above table demonstrates that ‘Communications networks, content and technology’ policy field recorded the highest aggregate recovery amounts (EUR 8.56 million) over the past five years in relation to ‘irregularities reported as fraudulent’ followed by policy areas ‘Education and culture’, ‘Foreign Policy Instruments’ and ‘Research and innovation’ (each amounting to around EUR 2 million). These four policy areas account for four fifths of the total recovery amounts related to ‘irregularities reported as fraudulent’ between 2012 and 2016.
Regarding ‘irregularities not reported as fraudulent’, the highest aggregate recovery amounts (EUR 98.56 million) were recorded in the policy area of ‘Mobility and transport’ during the last five years. It is followed by ‘Research and innovation’ (EUR 84.52 million) and then by ‘Communications networks, content and technology’ (EUR 64.59 million) policy fields. These three policy areas account for over the half (57.4%) of the total recovery amounts related to ‘irregularities not reported as fraudulent’ over the past five years. A further one fifth (19.3%) of the aggregate recovery amounts were recorded in relation to policy fields ‘International Cooperation and Development’, ‘Education and culture’, and ‘Energy’. However, one has to bear in mind that compared to the overall payments made for the twenty policy fields, the irregularity rate remains close to zero, on average 0.572% for the period 2012-2016.
6.3.2.Recoveries according to legal entity residence
87.5% of the total number of recovery items qualified as irregular (whether reported as fraudulent or not) concerned legal entities resident of the European Union. It should be noted however, that the residence of the legal entity is not necessarily the same as that of the main beneficiary. Nevertheless, in 75.5% of these irregularities, the main beneficiary was also an EU Member State.
Table DM6 – Recoveries per country of residence of the legal entity, 2012-2016

Table DM6 above summarises the total recoveries made in the past five years according to the legal entity country to which the payment was unduly disbursed.
6.3.3.Method of detection
For each recovery item, the Commission service issuing the recovery order has to indicate how the irregularity has been detected. Six different categories are pre-defined for this purpose, two of which fall under the direct responsibility of the European Commission: ‘Ex-ante controls’ and ‘Ex-post controls’. Table DM7 gives a breakdown of the recoveries by source of detection and by qualification in the last five years.
Table DM7 – Irregularities reported by source of detection and by qualification, 2012-2016

Regarding the ‘irregularities reported as fraudulent’, ‘OLAF’ has been marked as the source of detection in relation to 58.0% of recovery items corresponding to 67.2% of total recovery amounts. Meanwhile ‘Ex-post controls’ was the source of detection of 73 recovery items corresponding to also one quarter of the recovery amounts.
The 80% of ‘irregularities not reported as fraudulent’ were detected through Commission controls. There is an increasing tendency over the past five years both in terms of number and of financial value of cases detected due to the effective ex-ante and ex-post controls. Year 2016 represents so far the peak, 80.4% of recovery items (all irregularities) were detected by such controls involving 90.5% of total related irregular amounts.
6.3.4.Types of irregularity
The Commission services also have to indicate the type of irregularity in the recovery context for the respective recovery item in question. Several types can be attributed to one recovery item. It can be observed that irregularity type ‘Amount ineligible’ appears the most frequently in the past five years, followed by types ‘Documents missing’ and ‘Under-performance / non-performance’. Table DM8 provides the full picture regarding the frequency of occurrence of each type.
Table DM8 – Types of irregularity, 2012-2016

The same pattern of irregularity type frequency was observed last year taking into account the 2011-2015 periods.
6.3.5.Time delay
For the recovery items qualified as irregularities (both reported as fraudulent and not reported as fraudulent) issued between 2012 and 2016, the average delay between the occurrence of the irregularity and its detection is about 3 years. It should be noted however, that the average time delay is slightly lower for recovery items qualified as fraudulent (2.9 years) than for other non-fraudulent irregularities (3.2 years).
6.3.6.Recovery
Once a recovery order is issued, the beneficiary is requested to pay back the amount unduly received or the amount is offset from remaining payments for the beneficiary.
For the recovery orders issued between 2012 and 2016, 63.2% of the total irregular amounts have already been recovered. This percentage is exactly the same as for period 2011-2015. This means that about EUR 284 million out of the total recovery amount EUR 450 million has already been cashed. Yet, there are differences between the recovery rates for irregularities reported as fraudulent and those not reported as fraudulent. The recovery rate for ‘irregularities reported as fraudulent’ remains well below the recovery rate for ‘irregularities not reported as fraudulent’. When looking at the five year period, the recovery rate for ‘irregularities reported as fraudulent’ is only 20.9%, meanwhile for ‘irregularities not reported as fraudulent’ it is higher, 65.0%.
COUNTRY FACTSHEETS
Belgium - Belgique/België


Bulgaria - България


Czech Republic - Česká republika


Denmark - Danmark


Germany - Deutschland


Estonia - Eesti


Ireland - Éire


Greece - Ελλάδα


Spain - España


France


Croatia - Hrvatska


Italy - Italia


Cyprus - Κύπρος


Latvia - Latvija


Lithuania - Lietuva


Luxembourg


Hungary - Magyarország


Malta


Netherlands - Nederland


Austria - Österreich


Poland - Polska


Portugal


Romania - România


Slovenia - Slovenija


Slovakia - Slovensko


Finland – Suomi-Finland


Sweden - Sverige


United Kingdom


ANNEXES
ANNEX 1

ANNEX 2
(The number of irregularities reported as fraudulent measures the results of efforts by Member States to counter fraud and other illegal activities affecting EU financial interests; it should not be interpreted as the level of fraud in their territories)

ANNEX 3

ANNEX 4

ANNEX 5

ANNEX 6

ANNEX 7

ANNEX 8

ANNEX 9

ANNEX 10

ANNEX 11
Legenda
EAFRD: European Agricultural Fund for Rural Development
EAGF: European Agricultural Guarantee Fund
GUID: European Agricultural Guarantee and Guidance Fund – Section Guidance
EFF: European Fisheries Fund
EMFF: European Maritime and Fisheries Fund
CF: Cohesion Fund
ERDF: European Regional and Development Fund
ESF: European Social Fund
FEAD: European Fund for Aid to the most Deprived
ISF: Internal Security Fund
HRD: pre-accession, Human Resources Development component
REGD: pre-accession, Regional Development component
IPARD: Instrument for Pre-Accession for Rural Development
PHARE: Pre-accession assistance programme
SAPARD: Special Accession Programme for Agriculture and Rural Development
CBC: pre-accession, Cross-Border Cooperation component
TAIB: Transition Assistance and Institution Building
Irregularities reported by Member States and Beneficiary Countries in 2016
The number of irregularities reported measures the results of Member States’ work to counter fraud and other illegal activities affecting the EU’s financial interests. Therefore, the figures should not be interpreted as indicating the level of fraud in the Countries’ territories.

Irregular amounts related to irregularities reported by Member States and Beneficiary Countries in 2016


