 EUROPEAN COMMISSION
Brussels, 31.7.2015
SWD(2015) 156 final
COMMISSION STAFF WORKING DOCUMENT
Statistical evaluation of irregularities reported for 2014
Own Resources, Natural Resources, Cohesion Policy, Pre-accession and Direct expenditure
Accompanying the document
REPORT FROM THE COMMISSION TO THE EUROPEAN PARLIAMENT AND THE COUNCIL
Protection of the European Union's financial interests - Fight against Fraud
Annual Report 2014
{COM(2015) 386 final}
{SWD(2015) 151 final}
{SWD(2015) 152 final}
{SWD(2015) 153 final}
{SWD(2015) 154 final}
{SWD(2015) 155 final}
TABLE OF CONTENTS
COMMISSION STAFF WORKING DOCUMENT Statistical evaluation of irregularities reported for 2014 Own Resources, Natural Resources, Cohesion Policy, Pre-accession and Direct expenditure
LIST OF ABBREVIATIONS
8
1.Introduction10
1.1.Scope of the document10
1.2.Structure of the document10
Part I - REVENUES
11
2.Traditional Own Resources11
2.1.Introduction11
2.2.General analysis – Trend analysis11
2.2.1.Reporting Years 2010-2014: Cases of fraud and irregularities11
2.2.1.1.Irregularities reported as fraudulent12
2.2.1.2.Irregularities not reported as fraudulent12
2.2.2.Established and estimated amounts13
2.2.3.Recovery14
2.2.3.1.Recovery rates15
2.3.Specific analysis15
2.3.1.Irregularities reported as fraudulent15
2.3.1.1.Modus operandi15
2.3.1.2.Method of detection of fraud cases16
2.3.1.3.Smuggled cigarettes17
2.3.1.4.Articles of iron and steel – mutual assistance18
2.3.1.5.Cases reported as fraudulent by amount18
2.3.2.Irregularities not reported as fraudulent18
2.3.2.1.Modus operandi18
2.3.2.2.Method of detection of non-fraudulent cases19
2.3.2.3.Footwear and textiles vulnerable to irregularities20
2.3.2.4.Articles of iron and steel – mutual assistance20
2.3.2.5.Cases not reported as fraudulent by amount20
2.4.Member States’ activities21
2.4.1.Classification of cases as fraudulent and non-fraudulent and related rates21
2.4.2.Recovery rates21
2.4.2.1.Cases reported as fraudulent21
2.4.2.2.Cases not reported as fraudulent21
2.4.2.3.Historical recovery rate22
2.4.3.Commission’s monitoring22
2.4.3.1.Examination of the write off reports22
2.4.3.2.Commission’s inspections22
2.4.3.3.Particular cases of Member State failure to recover TOR23
Part II - EXPENDITURE
24
Section I - Shared Management
24
Natural Resources
24
3.Common Agricultural Policy (CAP)24
3.1.Introduction24
3.2.General analysis – Trend analysis25
3.2.1.Irregularities reported as fraudulent25
3.2.2.Irregularities not reported as fraudulent27
3.3.Specific analysis29
3.3.1.Irregularities reported as fraudulent29
3.3.1.1.Modus operandi29
3.3.1.2.Type of control / method of detection of irregularities reported as fraudulent30
3.4.Anti-fraud activities of Member States31
3.4.1.Duration of irregularities, Detection and Reporting Efficiency32
3.4.2.Detection of irregularities reported as fraudulent in 2014 by Member State33
3.4.3.Fraud detection rate34
3.4.4.Ratio of established fraud / Dismissal ratio35
3.5.Recovery cases37
3.5.1.Legal Framework37
3.5.2.Amounts recovered in 2014 for the EAGF38
3.5.3.Amounts recovered by the Member States in financial year 2014 for the EAFRD39
3.5.4.Application of the 50/50 Rule40
3.5.5.Commission’s Audits42
4.Common Fisheries Policy (CFP)44
4.1.General analysis44
4.2.Specific analysis45
4.2.1.Types of irregularity detected45
4.2.2.Method of detection45
4.3.Control activity by Member States45
Cohesion for growth and employment
48
5.Cohesion Policy48
5.1.Trend analysis49
5.1.1.Irregularities reported as fraudulent49
5.1.1.1.Trend by programming period49
5.1.1.2.Trend by Fund51
5.1.1.3.Trend by objective53
5.1.2.Irregularities not reported as fraudulent55
5.2.Specific Analysis – Irregularities reported in relation to the Programming Period 2007-1357
5.2.1.Priorities concerned by the irregularities reported as fraudulent57
5.2.2.Priorities concerned by the irregularities not reported as fraudulent59
5.2.3.Types of irregularities / modus operandi detected - Irregularities reported as fraudulent61
5.2.4.Type of control / method of detection – Irregularities reported as fraudulent63
5.2.5.Type of irregularities not reported as fraudulent64
5.3.Anti-fraud activities by Member States64
5.3.1.Duration of irregularities, Detection and Reporting Efficiency65
5.3.2.Detection of irregularities reported as fraudulent in 2014 by Member State66
5.3.3.Fraud detection rate67
5.3.4.Fraud Prevention Rate68
5.3.5.Ratio of established fraud 2008-201469
Section II - Decentralised Management
72
The EU as a global player / Pre-Accession Policy
72
6.Pre-Accession Policy (Pre-Accession Assistance and Instrument for Pre-Accession)72
6.1.The Pre-accession Assistance (PAA), 2000-06 and Instrument for Pre-Accession (IPA), 2007-1372
6.2.General analysis – Trend analysis74
6.2.1.Trend analysis74
6.2.2.Trend analysis IPA75
6.2.3.Reporting efforts75
6.3.Specific analysis – Financial year 201476
6.3.1.Pre-Accession Assistance (PAA)76
6.3.2.Instrument for Pre-Accession (IPA)77
6.3.3.Method of detection77
Section III – Direct Management
78
7.Direct Management78
7.1.Introduction78
7.2.General analysis78
7.2.1.Five year analysis 2010-201479
7.3.Specific analysis80
7.3.1.Recoveries according policy areas80
7.3.2.Recoveries according to legal entity residence81
7.3.3.Method of detection82
7.3.4.Types of error83
7.3.5.Time delay83
7.3.6.Recovery83
COUNTRY FACTSHEETS85
Belgium85
Bulgaria86
Czech Republic87
Denmark88
Germany89
Estonia90
Ireland91
Greece92
Spain93
France94
Croatia95
Italy96
Cyprus97
Latvia98
Lithuania99
Luxembourg100
Hungary101
Slovenia108
Slovakia109
Finland110
Sweden111
United Kingdom112
ANNEXES113
ANNEX 1
114
ANNEX 2
115
ANNEX 3
116
ANNEX 4
117
ANNEX 5
118
ANNEX 6
119
ANNEX 7
120
ANNEX 8
122
ANNEX 9
123
ANNEX 10
124
ANNEXES 11-15
125
ANNEX 11
126
ANNEX 12
127
ANNEX 13
128
ANNEX 14
129
LIST OF ABBREVIATIONS
|
CAP
|
Common Agricultural Policy
|
|
CF
|
Cohesion Fund
|
|
CFP
|
Common Fishery Policy
|
|
CN
|
Combined Nomenclature (Customs)
|
|
CP
|
Cohesion Policy
|
|
DetE
|
Detection Efficiency
|
|
DG
|
Directorate General
|
|
EAFRD
|
European Agricultural Fund for Rural Development
|
|
EAGF
|
European Agricultural Guarantee Fund
|
|
EC
|
European Commission
|
|
EFF
|
European Fishery Fund
|
|
ER
|
Error Rate
|
|
ERDF
|
European Regional Development Fund
|
|
ESIF
|
European Structural and Investment Funds
|
|
ESF
|
European Social Fund
|
|
EU
|
European Union
|
|
EU-10
|
The ten Member States having acceded the EU in 2004
|
|
EU-12
|
The twelve Member States having acceded the EU between 2004 and 2007
|
|
EU-15
|
The fifteen Member States of the EU before the 2004 accession
|
|
EU-2
|
Bulgaria and Romania
|
|
EU-27
|
The 27 Member States before Croatian accession
|
|
EUR
|
Euro
|
|
FDR
|
Fraud Detection Rate
|
|
FFL
|
Fraud Frequency Level
|
|
IMS
|
Irregularity Management System
|
|
GNI
|
Gross National Income
|
|
HRR
|
Historical Recovery Rate
|
|
NR
|
Natural Resources
|
|
OLAF
|
European Anti-Fraud Office (Office pour la Lutte Anti-Fraude)
|
|
OWNRES
|
Web application for communication of irregularities in the field of Traditional Own Resources
|
|
RepE
|
Reporting Efficiency
|
|
RR
|
Recovery Rate
|
|
SME
|
Small and Medium Sized Enterprise
|
|
TFEU
|
Treaty on the Functioning of the European Union
|
|
TOR
|
Traditional Own Resources
|
Statistical evaluation of irregularities reported for 2014
Own Resources, Natural Resources, Cohesion Policy, Pre-accession and Direct expenditure
1.Introduction
1.1.Scope of the document
The present document is based on the analysis of the notifications provided by national authorities of cases of irregularities and suspected or established fraud. The reporting is performed in fulfilment of a legal obligation enshrined in sectoral European legislation.
The document accompanies the Annual Report adopted on the basis of article 325 of the Treaty on the Functioning of the European Union (TFEU), according to which “The Commission, in cooperation with Member States, shall each year submit to the European Parliament and to the Council a report on the measures taken for the implementation of this article”.
For this reason, this document should be regarded as an analysis of the achievements of Member States.
The methodology (including the definition of terms and indicators), the data sources and the data capture systems are explained in detail in the Commission Staff Working Document – Methodology for the Statistical Evaluation of Irregularities.
1.2.Structure of the document
The present document is divided in two parts.
The first part is dedicated to the analysis of irregularities reported in the area of the Traditional Own Resources (Revenues).
The second part, concerning the expenditure part of the budget, is composed of three sections, dedicated, respectively, to shared, decentralised and centralised management modes.
The section dedicated to shared management, covers the natural resources (agriculture, rural development and fisheries) and the cohesion policy. Decentralised management refers to the pre-accession policy, while the centralised management section mainly deals with internal and external policies for which the Commission directly manages the implementation.
The document is completed by 28 country factsheets, which summarise, for each Member State, the main indicators and information that have been recorded through the analyses.
15 Annexes complement the information and data of this document, providing a global overview of the irregularities reported according to the relevant sector regulations. Annexes from 1 to 10 concern Traditional Own Resources, Annexes 11 and 12 Natural Resources and Annexes from 13 to 15 the Cohesion Policy.
Part I - REVENUES
2.Traditional Own Resources
2.1.Introduction
See part B ‘Methodology’.
Charts TOR1 –TOR4 provide an overview of the number of cases of fraud and irregularities per reporting year, established amounts and recovery rates as published in the previous years’ reports and to compare them with the reporting trends observed for the 2010-2014 period.
The following analysis is based on the data available on the cut-off date (8 April 2015) and aims to provide an overview of the reported cases of fraud and irregularities reported for 2014 together with their financial impact.
2.2.General analysis – Trend analysis
2.2.1.Reporting Years 2010-2014: Cases of fraud and irregularities
The number of cases reported via OWNRES for 2014 (5 185) is about 8 % higher than the average number of cases of irregular cases reported for the 2010-2014 period (4 799).
The total established amount of TOR involved (EUR 957 million) is about 92 % higher than the average established amount for years 2010-2014 (EUR 499 million).
In 2014, 14 big cases totalling to the amount exceeding EUR 516 million were reported comparing to 2013, when two big cases with a total established amount of about EUR 29 million affected the total established amount.
CHART TOR1: Total number of OWNRES cases and the related established amount (2010-2014)

When the number of cases reported as fraudulent and as non-fraudulent are compared with those published in the previous report, it appears that there is a time gap between the detection of the cases and their reporting via the OWNRES application. Only 9 Member States did not report any change in the number of cases reported for 2013. The quality of the data and the timely reporting remains therefore to be further tackled. The higher number of cases reported for 2014 suggest that the Member States took the Commission's recommendation seriously and reviewed their procedures for reporting irregularity cases.
Annex 1 shows the situation on the cut-off date (8 April 2015) for years 2010-2014.
2.2.1.1.Irregularities reported as fraudulent
The number of cases reported as fraudulent registered in OWNRES for 2014 (710) is currently 2 % lower than the average number of cases reported for the 2010-2014 period (726).
The total established amount of TOR involved (EUR 157 million) represents an increase of 54 % of the average established amount for the years 2010-2014 (EUR 102 million).
For 2014, the Czech Republic and Luxemburg did not communicate any fraudulent case exceeding an amount of EUR 10 000.
CHART TOR2: OWNRES cases reported as fraudulent and the related established amount (2010-2014)

On the cut-off date, 14 % of all cases detected in 2014 were classified as fraudulent. The percentage remained quite stable in comparison to 2013.
Annex 2 shows the situation on the cut-off date for years 2010-2014.
2.2.1.2.Irregularities not reported as fraudulent
At the same time, the number of cases not reported as fraudulent communicated via OWNRES for 2014 (4 475) was 10 % higher than the average number reported for 2010-2014 (4 073).
The total established amount of TOR (EUR 800 million) was 101 % higher than the average established amounts for the years 2010-2014 (EUR 398 million).
Luxemburg and Malta did not report any case of irregularity exceeding an amount of EUR 10 000 for 2014.
CHART TOR3: OWNRES cases not reported as fraudulent and the related established amount (2010-2014)

Annex 3 shows the situation on the cut-off date for years 2010-2014.
2.2.2.Established and estimated amounts
In 2014, the total established amount of TOR (gross) was EUR 22.9 billion and the greater part of it (about 96 %) was recovered without any particular problem and made available to the Commission via the A-account. In comparison with the total amount established and collected, according to the OWNRES data, around EUR 979 million has been established and estimated by the Member States in connection with cases reported as fraudulent and not reported as fraudulent where the amount at stake exceeds EUR 10 000.
The total established and estimated amounts reported in OWNRES represent 4.47 % of the total established amount of TOR (gross) for 2014. This proportion has increased compared with 2013 when it was 1.86 %. A percentage of 4.47 % indicates that of every EUR 100 of TOR (gross) established, an amount of EUR 4.47 is registered as irregular (fraudulent or non-fraudulent) in OWNRES. There are differences among the Member States. In 5 Member States, the percentage is above the average of 4.47 %. The highest percentage for 2014 can be seen in the United Kingdom and Bulgaria with 15.81 % and 14.20 % respectively. For the Netherlands, the proportion of established and estimated OWNRES amounts to established TOR remained almost stable in 2014 compared to the previous year. For Belgium, Germany, Estonia, Lithuania, Cyprus, Malta, Finland, Slovakia and Sweden the proportion of established and estimated OWNRES amounts to established TOR decreased in 2014 compared to the previous year.
For the six Member States which established and made available most of the TOR amounts, the percentage of the established and estimated OWNRES amounts to established TOR for 2014 was equal to 2.16 %. In comparison with the previous year, this represents an increase of 0.25 percentage points.
TOR MAP1: Showing the percentage of established and estimated amounts in OWNRES of established TOR for 2014 (to be prepared by OLAF and updated)

2.2.3.Recovery
The fraud and irregularity cases detected in 2014 show an established amount of EUR 957 million. EUR 191 million of this was recovered in cases where an irregularity was at stake and EUR 38 million in fraudulent cases. In total EUR 229 million was recovered by all Member States for all cases which were detected in 2014. In absolute numbers, Germany recovered the highest amount in 2014 (EUR 62 million) followed by the United Kingdom (EUR 53 million). This is a starting point for the recovery. Analysis shows that lengthy recovery procedures spread over several years are usually required due to administrative and judicial procedures in complex cases or cases with huge financial impact.
In addition, Member States continued their recovery actions related to the detected cases of previous years. The EU-28 recovered EUR 203 million in 2014 which related to cases detected between 1990 and 2013.
2.2.3.1.Recovery rates
Over the past, five years the annual RR has varied between 24 % and 62 % (see Chart TOR4). The recovery rate for 2014 is currently 24 %. The overall recovery rate is at present low due to correlation between the high detection rate, the high established amount and the current recovery stage of individual cases (high additional duty claims undergo more frequently long lasting administrative and criminal procedures).
In other words, of every amount over EUR 10 000 of duties established and reported for 2014 in OWNRES, approximately EUR 2 400 has already been paid.
On the cut-off date, the overall RR for all years 1989-2014 was 53 %.
CHART TOR4: Annual recovery rates (2010-2014)

Recovery rates vary among the Member States. The highest recovery rates for 2014 are in Slovakia (98 %), Sweden (97 %), Portugal (96 %), Bulgaria (94 %), Finland (91 %) and Estonia (89 %). Differences in recovery results may arise from factors such as the type of fraud or irregularity, or the type of debtor involved. Because recovery is ongoing, it can be expected that the recovery rate for 2014 will also go up in the future.
2.3.Specific analysis
2.3.1.Irregularities reported as fraudulent
2.3.1.1.Modus operandi
A breakdown of fraud by mechanism type reveals that most fraudulent cases relate to smuggling of goods. Incorrect origin or country of dispatch, incorrect value or classification are frequently mentioned in 2014.
In 2014, the customs procedure ‘release for free circulation remained the procedure most vulnerable to fraud. A total of 9 % of all cases reported as fraudulent and 6 % of all established amounts in OWNRES cases registered as fraudulent for 2014 involve the transit procedure.
Member States reported a number of temporary increases in fraudulent operations and the discovery of isolated cases of fraud involving particularly high amounts. Inward processing and processing under customs control represent 1 % and 10 % of all cases reported as fraudulent and 30 % and 1 % of the related established amounts respectively. Other procedures account for 11% of all fraudulent cases and for 2 % of the related established amounts.
Of all cases reported as fraudulent about 62% concern such goods as tobacco, articles of iron and steel, footwear and textiles, electrical machinery and equipment, vegetable and mineral oils. In monetary terms those groups of goods represent about 82% of all amounts established for cases reported as fraudulent. Evaluation of the origin of goods subject to fraud and irregularity reveals that goods originating from China, Tunisia, USA and Russia were very much affected in monetary terms.
2.3.1.2.Method of detection of fraud cases
In 2014, most fraudulent cases were revealed during a customs control at the time of clearance of goods (40 %) and during an inspection by anti-fraud services (36 %). Other methods that featured frequently were post-clearance controls (15 %) and tax audits (6 %).
CHART TOR5: Method of detection 2014 – Cases reported as fraudulent – by number of cases

In monetary terms, of the EUR 157 million established in fraudulent cases registered for 2014, around 43 % were discovered during a post-clearance control, 27 % during an inspection by anti-fraud services, 15 % by a tax audit and 13 % during a clearance control. Only in Spain, were tax audits the most important detection method for fraudulent cases in monetary terms. In Belgium, Greece, Estonia, France, Lithuania and Slovakia more than 50 % of all established amounts in fraudulent cases were detected by anti-fraud services. As regards amounts, controls at the time of clearance of goods were the most important method for detecting fraudulent instances in Bulgaria, Denmark, Latvia, Slovenia and Finland. In Poland 49 % of all established amounts in fraudulent cases were detected by an inspection by services or bodies other than customs.
CHART TOR6: Method of detection 2014 – Cases reported as fraudulent – by established amounts

2.3.1.3.Smuggled cigarettes
In 2014, there were 201 cases of smuggled cigarettes registered (CN code 24 02 20 90) involving estimated TOR of around EUR 22 million. In 2013 the number of cases of smuggled cigarettes was 133, totalling around EUR 7 million.
The highest number of cases was reported by the UK (42). The highest amount was reported by Greece (EUR 7.9 million).
No cases were reported by Belgium, the Czech Republic, Denmark, Estonia, Cyprus, Luxembourg, Portugal, Slovakia and Sweden.
Table TOR1: Cases of smuggled cigarettes in 2014

In the past, Member States were alerted by the fact of decreasing number of cases of cigarette smuggling. Review of the cases of smuggled cigarettes reported in the previous years led to update of the data in OWNRES for some Member States. This has also had a positive effect on data for 2014.
2.3.1.4.Articles of iron and steel – mutual assistance
In 2014, 100 cases reported as fraudulent concerned articles of iron and steel amounting to EUR 27 million. In all, 78 cases totalling to 25 million were detected following a Mutual Assistance notices issued by OLAF. This underlines the importance of investigations conducted by OLAF in this particular field.
2.3.1.5.Cases reported as fraudulent by amount
In 2014, the established amount was below EUR 50 000 in 502 cases reported as fraudulent (71 % of all fraud cases), whereas it was above EUR 50 000 in 208 cases (29 %).
The total established amount in cases reported as fraudulent where the amount at stake was above EUR 50 000 amounted to EUR 149 million (95 % of the total established amount for cases reported as fraudulent).
Table TOR2: Cases reported as fraudulent by amount category in 2014

2.3.2.Irregularities not reported as fraudulent
2.3.2.1.Modus operandi
A breakdown of irregularities by mechanism type shows that most cases of irregularity relate to incorrect declarations (incorrect value, classification, country of origin or use of preferential arrangements) and formal shortcomings (failure to fulfil obligations or commitments).
Not all customs procedures are equally susceptible to irregularities. The vulnerability of particular procedures may change over time as certain economic sectors become, temporarily, affected. In 2014 most of the established amounts in OWNRES in the EU-28 (93 %) for cases reported as non-fraudulent related to the customs procedure ‘release for free circulation’. In all, 3 % of all amounts established in cases not reported as fraudulent in 2014 involved inward processing, 1 % related to customs warehousing and to transit procedures, respectively. Other customs procedures were only marginally affected in 2014.
The customs procedure ‘release for free circulation’ is the procedure most affected by irregularities, as, at the time of release for free circulation, there are a range of different irregularities which may constitute non-compliance, e.g. the tariff, CN code, origin or preferential origin and incorrect value. In customs suspension regimes (e.g. warehousing or transit, where the payment of duties is suspended), however, the only irregularity that can occur is the subtraction of the goods from customs supervision. It is therefore to be expected that the majority of cases involving frauds and irregularities are reported in connection with the procedure ‘release for free circulation’.
Of all cases reported as non-fraudulent about 60 % concern such goods as textiles and footwear, electrical and mechanical machinery, articles of iron and steel, vehicles, plastics, glassware and prepared foodstuffs. In monetary terms those groups of goods represent about 87 % of all amounts established for cases reported as non-fraudulent. Evaluation of the origin of goods subject to fraud and irregularity reveals that goods originating from China, USA, Japan and Malaysia were very much affected in monetary terms.
2.3.2.2.Method of detection of non-fraudulent cases
In 2014, most non-fraudulent cases (54 %) were revealed during post-clearance customs controls. Other methods of detection for non-fraudulent cases that featured frequently were voluntary admission (13 %), clearance controls (11 %), tax audits (11 %) followed by anti-fraud services (9 %).
CHART TOR7: Method of detection 2014 – Cases not reported as fraudulent – by number of cases

Considering the established amounts, around 81 % of all irregularity cases registered for 2014 were discovered during a post-clearance control, 6 % during an inspection by anti-fraud services, whereas 5 % were related to voluntary admission, 4 % to a tax audit, and 2 % to a control at the time of clearance of goods. In 11 Member States, more than 50 % of all non-fraudulent cases — in amounts — were detected by post-clearance controls. In Bulgaria, France, Lithuania, Poland, Portugal and Romania more than 50 % of the amounts relating to non-fraudulent cases were detected by anti-fraud services. Significant amounts were reported as non-fraudulent following voluntary admission by Germany (EUR 17 million) and the UK (EUR 16 million). In 14 Member States voluntary admission was stated as a method of detection of cases reported as non-fraudulent.
CHART TOR8: Method of detection 2014 – Cases not reported as fraudulent – by established amounts

2.3.2.3.Footwear and textiles vulnerable to irregularities
Footwear and textiles originating in China were especially vulnerable to non-fraudulent irregularities in 2014. Over half of the total amount of TOR established as due in relation to non-fraudulent irregularities was from cases involving these goods. The most commonly reported type of infringement was undervaluation. The United Kingdom was particularly affected by irregularities involving these goods and this type of infringement – of every EUR 10 000 reported as due in cases of non-fraudulent irregularities, around EUR 8 567 involved undervalued footwear and textiles. Thirteen other Member States also reported cases of undervaluation of footwear and textiles of lower financial value. These detections can be considered as a result of the Commission’s work in the field of customs valuation.
2.3.2.4.Articles of iron and steel – mutual assistance
In 2014, 418 cases reported as non-fraudulent concerned articles of iron and steel amounting to EUR 36 million. In all, 175 cases totalling to 22 million were detected following a Mutual Assistance notices issued by OLAF. This underlines the importance of investigations conducted by OLAF in this particular field.
2.3.2.5.Cases not reported as fraudulent by amount
In 2014, the established amount was below EUR 50 000 in 3 386 non-fraudulent cases (76 % of all irregularity cases), whereas it was above EUR 50 000 in 1 089 cases (24 %).
The total established amount in non-fraudulent cases where the amount at stake was above EUR 50 000 amounted to EUR 735 million (92 % of the total established amount for non-fraudulent cases).
Table TOR3: Cases not reported as fraudulent by amount category in 2014

2.4.Member States’ activities
2.4.1.Classification of cases as fraudulent and non-fraudulent and related rates
For 2014, Member States classified 710 cases as fraudulent out a total of 5 185 cases reported via OWNRES, which indicates a Fraud Frequency Level (FFL) of 14 %. The differences between Member States are relatively large. In 2014 most Member States categorised between 10-50 % of all cases reported as fraudulent. However, the Czech Republic did not categorise any cases reported as fraudulent. Ten Member States categorised less than 10 % of cases as fraudulent. Six Member States registered more than 50 % of cases as fraudulent.
In 2014, the total established and estimated amount affected by fraud in the EU was EUR 176 million and the overall fraud detection rate was 0.8 %. For 2014, the highest percentages can be seen in Bulgaria with 13.96 % and Greece 5.02 %.
The total established and estimated amount affected by irregularities was more than EUR 802 million which indicates an irregularity detection rate of 3.66 %. The highest percentages can be seen in the United Kingdom (15.73 %), Romania (5.71 %) and the Czech Republic (4.38 %).
There are large differences between Member States’ classifications, which may partly depend on their classification practices. This can influence the comparison of the amounts involved in cases reported as fraudulent and as non-fraudulent by Member States. Moreover, individual bigger cases detected in a specific year may affect annual rates significantly. Factors such as the type of traffic, type of trade, the level of compliance of the economic operators, the location of a Member State can influence the rates significantly. Bearing in mind these variable factors, the detection rates can also be affected by the way a Member State’s customs control strategy is set up to target risky imports and to detect TOR-related fraud and irregularities.
2.4.2.Recovery rates
2.4.2.1.Cases reported as fraudulent
Over the 1989-2014 period, OWNRES shows that, on average, 18 % of the initially established amount was corrected (cancelled). The recovery rate (RR) for all years (1989-2014) is 30 %. The RR for cases reported as fraudulent and detected in 2014 was 24 % which is below the average rate of 35% for fraudulent cases for the 2010-2014 period. In general, the RR in cases reported as fraudulent is clearly much lower than that for cases not reported as fraudulent.
2.4.2.2.Cases not reported as fraudulent
OWNRES shows that on the cut-off date, on average 34 % (1989-2014) of the initially established amount in relation to cases not reported as fraudulent has been corrected (cancelled) since 1989. The RR for non-fraudulent cases reported for 2014 is 24 %. On the cut-off date, the annual RR for the last five years has varied between 24 % and 79 %. The overall RR for all years (1989-2014) for all cases not reported as fraudulent is 63 %.
2.4.2.3.Historical recovery rate
Also in the long term, the HRR reveals an equally strong relation as annual recovery rates, showing that recovery in cases reported as fraudulent is generally much less successful than in cases not reported as fraudulent (see table TOR4). Classification of a case as fraudulent is thus a strong indicator for forecasting short- and long-term recovery results.
Table TOR4: Historical recovery rate (HRR)

2.4.3.Commission’s monitoring
2.4.3.1.Examination of the write off reports
In 2014, 19 Member States submitted 145 new write-off reports to the Commission. In 2014, the Commission processed 279 cases in all totalling EUR 104 million, including cases that had been reported previously for which Member States had sent additional information. In 110 of these cases amounting to EUR 37 million, Member States were asked to pay the outstanding amounts as they were not considered diligent in recovering the debts.
Examination of Member States’ diligence in write-off cases constitutes a very effective mechanism for gauging their activity in the field of recovery. It encourages national administrations to step up the regularity, efficiency and effectiveness of their recovery activity, since any lack of diligence leading to failure to recover results in individual Member States having to foot the bill.
2.4.3.2.Commission’s inspections
In its TOR inspections, the Commission has put a special emphasis on Member States’ customs control strategies and closely monitors their actions in relation to the observations made during the inspections. Member States show their willingness to adapt their control strategies and to progressively implement systems that provide for efficient and effective risk analysis to protect the EU’s financial interests. Also adjustments of the procedures for detection and reporting of irregular cases are applied by Member States with the aim to improve the quality of the information on irregular cases. In 2014, 'Fraud and irregularities' was the general inspection themes of the on-the-spot customs inspections by the Commission services in Member States.
Thematic reports consolidating the results of the inspections and evaluating and comparing Member States’ performance are frequently prepared and discussed with the Member States with a view to remedying the individual shortcomings found. One general conclusion drawn by the Commission from its inspections in Member States in recent years is that their control strategies are increasingly shifting from customs controls at the time of clearance of goods to post-clearance customs controls. The customs controls at the time of clearance of goods are indispensable for detecting new types of fraud or irregularities and new patterns in the use of certain types of fraud. Member States’ customs control strategies should, therefore, be frequently reviewed, taking into account recent cases detected or new risks identified.
In view of the risk of fraud being diverted from one Member State to another, and of the spread of specific types of fraud, cooperation at EU and international level is becoming increasingly essential for the detection of irregularities.
2.4.3.3.Particular cases of Member State failure to recover TOR
If TOR are not established because of an administrative error by a Member State, the Commission applies the principle of financial liability. Member States have been held financially liable in 2014 for over EUR 10 million, and new cases are being given appropriate follow-up.
Part II - EXPENDITURE
Section I - Shared Management
Natural Resources
Success in previous decades in guaranteeing sufficient food production, has led to a shift in emphasis to, producing higher quality food for consumers, increasing farms' profitability, diversifying the rural economy and protecting the natural environment. There is a direct management component but the majority of expenditure is disbursed by Member States under the following shared management funds.
The European Agricultural Guarantee Fund (EAGF) which finances direct payments to farmers and measures to respond to market disturbances, such as private or public storage and export refunds.
The European Agricultural Fund for Rural Development (EAFRD) which finances the rural development programmes of the Member States.
The European Fishery Fund (EFF) which provides funding and technical support for initiatives that can make the fishery industry more sustainable.
Table NR1 shows the financial resources available for this policy area.
Table NR1: Financial instruments and 2014 appropriations for the Natural Resources Policies

3.Common Agricultural Policy (CAP)
3.1.Introduction
For the last 50 years the Common Agricultural Policy (CAP) has been the European Union's (EU) most important common policy. This explains why traditionally it has taken a large part of the EU's budget, although the percentage has steadily declined over recent years.
The CAP is financed by two funds, EAGF and EAFRD, which form part of the EU's general budget.
Under the basic rules for the financial management of the CAP, the Commission is responsible for the management of the EAGF and the EAFRD. However, the Commission itself does not make payments to beneficiaries. According to the principle of shared management, this task is delegated to the Member States, who themselves work through national or regional paying agencies. Before these paying agencies can claim any expenditure from the EU-budget, they must be accredited on the basis of a set of criteria laid down by the Commission.
The paying agencies are, however, not only responsible for making payments to the beneficiaries. Prior to doing so, they must, either themselves or through delegated bodies, satisfy themselves of the eligibility of the aid applications. The exact checks to be carried out are laid down in the different sectorial regulations of the CAP and vary from one sector to another.
The expenditure made by the paying agencies is then reimbursed by the Commission to the Member States, in the case of the EAGF on a monthly basis and in the case of EAFRD on a quarterly basis. Those reimbursements are, however, subject to possible financial corrections which the Commission may make under the clearance of accounts procedures.
Table NR2 shows the financial resources available for the CAP.
Table NR2: Financial instruments and 2013 appropriations for the CAP

3.2.General analysis – Trend analysis
3.2.1.Irregularities reported as fraudulent
Table NR3 presents the trend of the irregularities reported as fraudulent by Member States for the period 2010-14 in relation to the fund concerned. This shows an overall decrease in comparison to 2013 by almost 11%. However, while the fraudulent irregularities related to the EAGF have decreased by almost 40%, those linked to the EARDF have kept on increasing by 86% and for the third consecutive year. Those irregularities related to beneficiaries of both funds, which have committed violations in relations to both schemes have returned to the levels of 2011 and 2012.
As a result, for the first time in the last five years, the irregularities reported as fraudulent related to the EAFRD have the highest share on the total, representing two thirds and reaching 42% on the whole reference period 2010-14 (up from 36% in the previous analysis for 2009-13). The share of irregularities committed by beneficiaries of both funds remains stable at 12% on the five years analysis.
Table NR3: Irregularities reported as fraudulent by Fund –2010-14 for the CAP


Similar to 2013, the irregularities notified by four Member States (Hungary, Poland, Romania and Italy) represent about 71% of the total number of irregularities reported as fraudulent.
For Hungary, the reported cases originate from an investigation of the European Anti-Fraud Office (OLAF). Poland, Ireland, Latvia, Lithuania, Portugal, United Kingdom have reported an increasing number of fraudulent cases.
The first ten countries taken together have reported 466 of potential fraudulent cases, which represents almost 92% of the total (in 2013 the first nine together had reported about 94% of the total fraudulent irregularities).
Table NR4 provides in the same form of Table NR3 information about the trends linked to the financial amounts involved in cases reported as fraudulent, which have decrease by 17% in comparison with the previous year. For the monetary value, the largest share in 2014 is still represented by the EAGF component. The EAFRD becomes relatively predominant, if one bears in mind that it represents 20% of the total resources for the CAP and the financial value of the irregularities reported as fraudulent represent 32% of the total amount in 2014. For the period 2010-2014, however, the distribution remains roughly in line with the share of the resources between the funds.
Table NR4: Financial amounts involved in irregularities reported as fraudulent by Fund –2010-14 for the CAP


The trend analysis about the financial amounts can be misleading as it can be greatly influenced by single observations of significant value. For instance, the 'distance' observed in 2011 between the two funds, finds entire explanation in very few cases involving high amounts linked to the EAGF, which determine the divergence from the trend highlighted in Table NR3. In the period 2011-14, the share of the EAFRD on the total is 27%.
3.2.2.Irregularities not reported as fraudulent
Regarding irregularities not reported as fraudulent, the number of those reported relating to EAFRD has been constantly increasing (see Table NR5), while those related to EAGF has remained relatively stable. Consistently with this trend, also the irregular financial amounts linked to the rural development instrument have been increasing (as highlighted in Table NR6), but with a trend that is more evident in the last three years.
Contrary to the irregularities reported as fraudulent, only 2% of those not reported as fraudulent involves violations in both funds. This share shrinks to 1% in relation to the financial impact of these irregularities (see Table NR6).
Table NR5: Irregularities not reported as fraudulent by Fund – 2010-14 for the CAP


Unlike fraudulent irregularities the largest share, in terms of numbers, is for the EAFRD since 2012, and in the two last years of the period 2010-14 the irregularities linked to this fund have almost doubled those related to the EAGF.
The irregular financial amounts related to the EAFRD are also progressively increasing since 2011 and in 2014 they represented the highest share.
Table NR6 shows the information concerning the years 2010-14.
Table NR6: Financial amounts linked to irregularities not reported as fraudulent by Fund – 2010-14 for the CAP


3.3.Specific analysis
3.3.1.Irregularities reported as fraudulent
3.3.1.1.Modus operandi
Table NR7 compares the types of irregularity / modi operandi linked to fraudulent cases detected in 2014 with those detected from 2010 to 2014 (included) in relation to the EAGF.
The most recurrent modus operandi is related to infringements linked to the documentary proofs requested, and in particular, to the use of 'false or falsified declarations', 'false or falsified documents' and 'false or falsified request for aid', ‘declaration of fictitious product, species and/or land’ in line with what reported in general for the whole period 2010-2014. ‘Quantities outside permitted limits, quotas or thresholds (related, respectively to products, species or land)’ remained a significant reported type of breach.
Table NR7: Types of irregularities in relation to EAGF

Table NR8 compares the types of irregularity / modi operandi linked to fraudulent cases detected in 2014 with those detected from 2010 to 2014 (included) in relation to the EAFRD.
In 2014, 141 irregularities reported as fraudulent indicated that breaches had occurred in relation to the 'quality of the beneficiary', to the 'implementation' of the action and to the 'documentary proof' supporting the request for aid. Otherwise, the other irregularities reported as fraudulent follow the pattern of the previous years, with infringements linked to the 'documentary proof' being the most recurrent, followed by those related to the nature/quality of the beneficiary.
Table NR8: Types of irregularities in relation to EAFRD

The 141 irregularities reported as fraudulent in 2014 mentioned above were reported by Hungary and were the result of an investigation coordinated by OLAF.
3.3.1.2.Type of control / method of detection of irregularities reported as fraudulent
Also in 2014 the trend highlighted in the past two Reports was confirmed, with 'administrative controls' detecting the majority of the irregularities reported as fraudulent. A significant difference, however, has a substantial impact on the overall situation for 2014: it is represented by the number of irregularities reported as fraudulent detected by an EU body, in particular OLAF. Table NR9 shows the types of control having identified the irregularities reported as fraudulent.
This trend is, nonetheless, confirmed when looking at the results for the analysed period 2010-14, when administrative controls detected about 46% of potentially fraudulent infringements.
The impact in monetary terms of anti-fraud controls and criminal investigations remain significant and counts for 66% of the total detections in 2014 and 38% for the period 2010-14, without including the results from OLAF.
Table NR9: Control methods having identified the irregularities reported as fraudulent in 2014


Of the 145 fraudulent notifications identified by EU-body controls, 141 were reported by Hungary, following the conclusion of an OLAF investigation.
3.4.Anti-fraud activities of Member States
Previous paragraphs have examined the trend and main features and characteristics of the irregularities reported as fraudulent.
The present paragraph aims at examining some aspects linked to the anti-fraud activities and results of Member States. Five elements are taken into account:
(1)the time that runs between the beginning of the fraudulent practice and its detection/establishment by the competent authority and reporting to the Commission (Detection / Reporting Efficiency);
(2)the number of irregularities reported as fraudulent by each Member State;
(3)the fraud detection rate (the ratio between the amounts involved in cases reported as fraudulent and the payments occurred in the financial year 2014);
(4)the fraud prevention rate (the ratio between the amounts involved in cases reported as fraudulent which have been detected before payments were executed);
(5)the ratio of cases of established fraud on the total number of irregularities reported as fraudulent.
3.4.1.Duration of irregularities, Detection and Reporting Efficiency
Of the 3 835 detected irregularities reported by Member States in 2014, 62% involve infringements that have been protracted during a given span of time. For the irregularities reported as fraudulent this percentage is higher at 68%. The remaining part of the datasets refers to irregularities/breaches which consisted of a single act identifiable on a precise date.
Taking into account only those irregularities which have been protracted in time, their average duration is of 63 months (i.e. about 5 years and 4 months).
The two subsets (irregularities reported as fraudulent and those not reported as fraudulent) have two different patterns.
The average duration of those reported as fraudulent is 80 months (i.e. over 6 and half years) while that of those not reported as fraudulent is 61 months (i.e. just over 5 years).
Looking at the detection and reporting efficiencies of Member States, Table NR10 provides includes the average duration (in months) occurring between the time at which the irregularity began or was committed and when it was detected (detection efficiency), the average time gap (in months) between detection and reporting and their sum. This information is completed with the minimum and maximum values for each of the three categories.
Average detection efficiency is 28 months (2 years and 4 months), while reporting efficiency is at 16 months (1 year and 4 months) improving in comparison with 2013 (down from 22 months).
Table NR10: Detection and Reporting Efficiency of Member States

The data set used for Table NR10 includes all irregularities (fraudulent and non-fraudulent) reported by Member States in 2014.
3.4.2.Detection of irregularities reported as fraudulent in 2014 by Member State
Map NR1 divides Member States in four groups, depending on the number of irregularities reported as fraudulent in 2014:
(1)Group 1: no irregularities reported as fraudulent irregularities in 2014;
(2)Group 2: between 1 and 9 such cases reported in 2014;
(3)Group 3: 10 to 30 irregularities reported as fraudulent;
(4)Group 4: more than 30 cases reported.
Five (5) Member States have notified no irregularity as fraudulent; twelve (12) Member States belong to Group 2; Group 3 is composed of five (5) Member States, as Group 4.
Notably, Denmark passed from Group 4 to Group 2 and Hungary and Ireland from Group 1 to Group 4.
Italy, Poland and Romania confirmed their position in Group 4.
Map NR1: Number of irregularities reported as fraudulent in 2014 by Member State - CAP

The detailed figures of Map NR1 are showed in Table NR10.
3.4.3.Fraud detection rate
The fraud detection rate compares the results obtained by Member States in their fight against fraud with the payments received by them in a given financial year. This implies that a single case reported as fraudulent and involving a significant financial amount can produce a better result that that achieved by the sum of the financial impact of several irregularities affecting lower amounts. For this reason, this indicator should be read in conjunction with the number of irregularities reported as fraudulent and for this reason they are presented together in Table NR11.
In 2014, the highest fraud detection rates are referred to Estonia, Poland, Romania, Malta, Hungary, Latvia and Lithuania.
Table NR11: number of irregularities reported as fraudulent in 2014, amounts involved and fraud detection rate by Member State

3.4.4.Ratio of established fraud / Dismissal ratio
Table NR11 shows the ratio between the cases of established fraud and the total number of irregularities reported as fraudulent (including suspected and established fraud) in the period 2009-13. Taking into account only cases reported in 2014 would be meaningless, as the criminal proceedings leading to a conviction for fraud may take several years, while using the period 2010-14 would be misleading as it will be impossible to make a sound comparison with figures published in the 2013 Report. However information concerning the years 2010-14 is published (for reference for the next years) in Table NR12.
Table NR12 has been completed with the ‘Dismissal ratio’, calculated by the differences between the total number of irregularities reported as fraudulent published in the corresponding table in the 2013 Report (TOTAL 2013) and the total calculated taking into account the updates received in 2014. When the ratio is positive, it means that Member States have classified as ‘suspected’ or ‘established fraud’ an irregularity appearing as fraudulent in 2013.
In this respect, the average ratio of established fraud at EU level is 8%, increasing from 7% of 2013. The dismissal ratio is 4%.
Table NR12: number of cases of suspected and established fraud and ratio of established fraud – cases reported between 2009-13 in the CAP
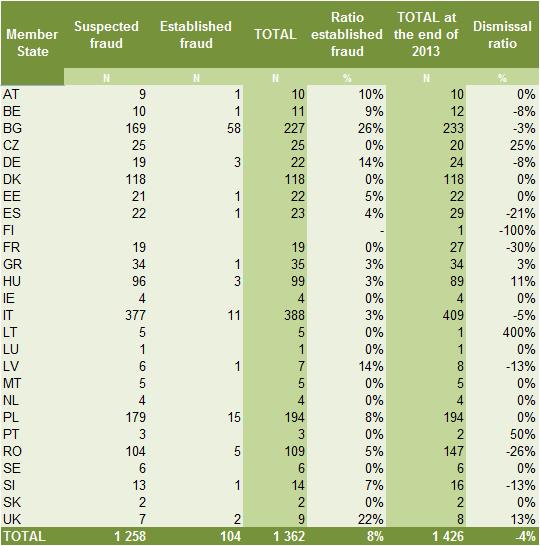
Table NR13 provides the information concerning the number of cases of suspected and established fraud and ratio of established fraud calculated for the years 2010-14. It will be used in the coming reports for comparability.
Table NR13: number of cases of suspected and established fraud and ratio of established fraud – cases reported between 2010-14 in the CAP

3.5.Recovery cases
3.5.1.Legal Framework
Regulation (EU) No 1306/2013 on the financing of the CAP requires the Member States to recover sums lost as a result of detected irregular payments. However, the recovery procedures, in accordance with the principle of subsidiarity, are wholly the responsibility of the Member States concerned and, thus, subject to their individual administrative and judicial procedures. Therefore, while some procedures deliver rapid results, others take more time.
In order to address delays by some Member States in recovering undue payments, the legislator introduced an automatic clearing mechanism under which 50 % of any undue payments which the Member States have not recovered from the beneficiaries within 4 years or, in the case of legal proceedings, 8 years, would be charged to their national budgets (50/50 rule).
Even after the application of this mechanism, Member States are, however, obliged to pursue their recovery procedures and, if they fail to do so with the necessary diligence, the Commission may decide to charge the entire outstanding amounts to the Member States concerned. Moreover, Member States are required to off-set any outstanding debts against future payments to the debtor (compulsory compensation).
With the entry into force of the new legal framework, the 50/50 rule now has to be applied to EAFRD in the financial year when it occurs and not at the closure of the programme. Consequently, for financial year 2014, the Member States are required to indicate amounts to be charged under the 50/50 rule also for EAFRD 2007-2013 for the first time.
Undue payments that are the result of administrative errors committed by the national authorities also have to be deducted from the annual accounts of the Paying Agencies concerned and, thus, excluded from EU financing.
3.5.2.Amounts recovered in 2014 for the EAGF
Table NR14 below sets out the amounts recovered in 2014 from the beneficiaries by the Member States for the EAGF.
The total amount recovered is EUR 150.3 million. This corresponds to the amount declared by DG AGRI in note 6 to the consolidated accounts for 2014.
Amounts recovered in respect of cross-compliance infringements are indicated separately and deducted to show the amount of recoveries for 2014 which DG AGRI considers to be relevant for its corrective capacity – i.e. an amount of EUR 112.4 million.
Table NR14: EAGF - Recoveries by the Member States from the final beneficiaries of unduly paid amounts in 2014

3.5.3.Amounts recovered by the Member States in financial year 2014 for the EAFRD
Table NR15 below sets out the amounts recovered in 2014 from the beneficiaries by the Member States for the EAFRD.
Table NR15: EAFRD - Recoveries from the final beneficiaries of unduly paid amounts in 2014

*The total amount recovered is EUR 168.6 million. This amount differs slightly from that provided for note 6 (point 6.1.2) to the (provisional) Consolidated Annual Accounts (EUR 167 million), which was based on preliminary data that has been subsequently updated.
For the purpose of calculating corrective capacity, recoveries in respect of SAPARD and TRDI are excluded as they are not relevant to EAFRD. Also deducted are recovered amounts in respect of cross-compliance infringements. The resulting amount of recoveries for 2014 which DG AGRI considers relevant for its corrective capacity is EUR 121.9 million.
Table NR16: EAFRD - Recoveries by the Member States from the final beneficiaries of unduly paid amounts in 2014

3.5.4.Application of the 50/50 Rule
The financial consequences of non-recovery for cases dating from 2010 (4 year deadline for recovery) or 2006 (8 year deadline if legal proceedings) will be determined for 2014 in accordance with the 50/50 rule mentioned above by charging approximately 18.5 million EUR to the Member States concerned.48 Moreover, around 17.6 million EUR will be borne by the EU budget for cases reported irrecoverable during financial year 201449. The final figures will be established in May 2015 when the financial clearance decision for financial year 2014 will be adopted. Due to the application of the 50/50 rule, important non-recovered sums have already been charged to the Member States for EAGF expenditure.
The overall outstanding amount still to be recovered from the beneficiaries at the end of that financial year was 1 588.5 million EUR. Of this amount, 1 348.8 million EUR is outstanding to the EU budget (the difference having already been charged to the Member States via the 50/50 mechanism).
The clearance mechanism (50/50 rule), referred to above, provides a strong incentive for Member States to recover undue payments from the beneficiaries as quickly as possible. As a result, by the end of financial year 2014, 45 % of the new EAGF debts from 2007 and thereafter had already been recovered, which is a significant improvement compared to the past. The detailed breakdown of this recovery rate has developed as indicated in Table NR17.
Table NR17: Rate of recovery from beneficiaries of irregularities detected since 2007 - EAGF

It is worth noting that some of these new debt amounts were already written off by Member States in the period 2007-2013 (91.4 million EUR) and therefore they will most likely not be recovered. For more details on the recovery rates at Member State level, see Table NR18.
Table NR18: Recoveries (EUR) from beneficiaries for cases detected since 2007 - EAGF

3.5.5.Commission’s Audits
During the period 2008-2014, DG AGRI audited the correct application of the new clearance mechanism through 32 audit missions in 19 Member States (including all EU-15 Member States with a low recovery rate for the cases detected since 2007). Except for two cases (IT and IE), in general the Member States' authorities have adequate procedures in place to protect the financial interest of the European Union. Deficiencies found during these audits are being followed in the context of conformity clearance procedures.
The diligence of the Member States' authorities in the recovery of the most significant individual irregularity cases is assessed in the context of a further 25 on-going conformity clearance procedures (desk audits).
In 2012, an OLAF investigation revealed for the Italian Paying Agency some serious issues regarding the completeness of the debtors' ledger, the prescription of certain debts, and some national schemes allegedly funded by the EU budget.
In addition, the European Court of Auditors, in the framework of the DAS 2013 exercise, also raised serious concerns regarding the debt management systems implemented in IT (AGEA), and IE (DAFF). DG AGRI took this into account in its risk analysis and carried out an audit mission in Italy in September 2014 while an audit to Ireland will take place in the 2015-2016 audit year.
Concerning the audit of the debt management system implemented by the Italian Paying Agency AGEA (IT01), the audit confirmed the serious concerns regarding the management of irregularities and other debts for financial year 2010 and earlier, and more generally all irregularities and debts for which the payment of origin was made in financial year 2007 or before. A number of weaknesses concerning the accreditation criteria for debts were noted (improper internal environment; insufficient control activities and monitoring mechanisms). Based on its findings, DG AGRI considered that the non-recovery of the debts in financial year 2010 and earlier was attributable to the negligence of the Italian authorities in the recovery procedure and therefore intends to propose financial corrections for these financial years.
4.Common Fisheries Policy (CFP)
As the activities of each fishing fleet affect the opportunities of other fleets, the EU countries have decided to manage their fisheries in collaboration, through the common fisheries policy (CFP). This policy brings together a range of measures designed to achieve a thriving and sustainable European fishing industry.
Among the most important areas of action of the CFP is the provision of funding and technical support for initiatives that can make the industry more sustainable. These actions are supported by the European Fisheries Fund (EFF).
4.1.General analysis
Implementation of programmes financed by the EFF has been implemented more slowly than that of other policies under shared management in the first years of the programming period 2007-2013. For this reason, the number of irregularities reported by Member States in relation to this fund is limited and has started in 2010.
Table NR19 shows the overall number of irregularities (fraudulent and non-fraudulent reported by year and the related financial amounts.
The increase from one year to the other simply reflects the increased level of implementation of the programmes.
The share of irregularities reported as fraudulent on the total is more important in 2014 (14% and 39% of the related amounts) than in the reference period 2010-2014 (10% and 30% of the related amounts).
Table NR19: EFF - Irregularities (fraudulent and non-fraudulent reported by year – 2010-2014


4.2.Specific analysis
Given the limited number of irregularities reported so far, the analysis covers the whole period 2010-14.
4.2.1.Types of irregularity detected
The number of irregularities reported in relation to the EFF is limited and to some extent incomplete in relation to the typologies of irregularities detected by national authorities.
This is reflected by the circumstance that of the 386 detected irregularities (fraudulent and non-fraudulent), 116 do not indicate the modus operandi (30% of the total, up from 23% of 2013).
The most detected typology is 'Not eligibility for aid of the action/project’, followed ‘Other irregularities’, 'Infringements of public procurement rules' and ‘Other infringements concerning the implementation of the project/action’ and 'Documents missing and/or not provided'. These types plus those for which no modus operandi has been reported cover 81% of the reported irregularities.
In relation to the 40 irregularities reported as fraudulent, there is no real pattern emerging from the reported information, also taking into account that in 23 cases no information has been provided.
4.2.2.Method of detection
In relation to the methods of detection, the most frequently reported are 'Control of accounts', 'Initial inquiry/control of documents' and 'On-the-spot checks'. Specific information is missing in 99 cases (26%).
In relation to the irregularities reported as fraudulent, information is missing in twenty-five (25) cases; eleven (10) occurrences are linked to ‘judicial inquiries’ and in eight (8) cases the method used was the ‘control of documents’.
4.3.Control activity by Member States
Table NR20 shows the results of the control activities in the Member States in 2014.
Irregularities have been detected and reported by 18 Member States; fraudulent irregularities by 5 Member States. In terms of numbers of irregularities, the majority has been detected by Portugal, Spain and Bulgaria, while in terms of amounts the highest results have been obtained by Romania and Bulgaria.
Bulgaria is the Member State having detected and reported the highest number of fraudulent irregularities. The 5 Bulgaria cases represent 45% of the total number of irregularities reported as fraudulent. However the single irregularity reported as fraudulent by Romania accounts for 45% of the related amounts.
Table NR20: EFF – Irregularities (fraudulent and non-fraudulent) reported by Member State – 2014

Table NR21 shows the overall results for the whole programming period 2007-13.
Irregularities have been detected and reported by 24 Member States; 6 Member States have reported fraudulent irregularities during this period. Spain, Poland and the United Kingdom are the countries having reported the highest number of irregularities (fraudulent and non-fraudulent). Italy is the Member State having detected and reported the highest number of fraudulent irregularities and related amounts.
The established fraud ratio in the Fishery sector is calculated at 7.5% with only two Member States reporting of finalised procedures (Italy and Estonia).
Table NR21: EFF – Irregularities (fraudulent and non-fraudulent) reported by Member State – 2010-14

Cohesion for growth and employment
Cohesion for growth and employment’ covers the Structural Funds, i.e. the European Regional Development Fund (ERDF) and the European Social Fund (ESF), as well as the Cohesion Fund (CF).
It relates essentially to the following policy areas:
–regional policy, for the ERDF and the CF, and
–employment and social affairs, for the ESF.
The principal objective of cohesion policy is to strengthen economic, social and territorial cohesion between regions and Member States of the EU by providing additional resources for those regions and countries whose economic development is lagging behind. The Structural Funds also aim at strengthening regions’ competitiveness and attractiveness, as well as employment, and at strengthening cross-border, transnational and interregional cooperation. The resources available are concentrated on promoting economic convergence, in particular on sustainable growth, competitiveness and employment in line with the Europe 2020 strategy. These resources are also essential tools to fight financial, economic and social crises.
Cohesion policy is promoted using three shared management instruments, with individual EU countries actually distributing funds and managing expenditure.
Sustainable growth is also promoted through centralised direct management by the Commission and centralised indirect management where the Commission distributes funds to EU and other agencies (see chapter 6).
5.Cohesion Policy
The resources for the Cohesion policy support three main objectives:
Convergence: aims to modernise and diversify regional economic structures, to support sustainable integrated economic development and create sustainable jobs.
Regional competitiveness and employment: covers environment and risk prevention, access to transport and telecommunications services; Innovation and the knowledge economy.
The European Territorial Cooperation objective: focuses on development of economic and social cross-border activities; transnational cooperation, and networking and exchange of experiences between regional and local authorities.
Three financial instruments are the vehicles to achieve the goals of this policy:
–The European Regional Development Fund (ERDF) is the largest fund and aims to support the development and structural adjustment of less developed regions in all Member States through investments in research, infrastructure, business support or direct financial support to SMEs.
–The European Social Fund (ESF) prevents and fights unemployment, by making Europe's workforce and companies better equipped to face new challenges and preventing people losing touch with the labour market. Training programs are the primary method; however advice, coordination and sometimes microfinance are also provided to entrepreneurs and SMEs.
–The Cohesion Fund promotes sustainable development in Member states with a per person GNI below 90% of the EU average. The fund has two components: Transport and Environment.
Table CP1 shows the financial resources available for the Cohesion Policy under the different financial instruments. The table also shows that, even if there are virtually no more commitments related to the programming period 2000-06, payments linked to it, although limited, are still part of the picture.
Table CP1: Financial instruments and 2014 appropriations for the Cohesion Policy by programming period and financial instruments

5.1.Trend analysis
In comparison with the other budget sectors, the analysis of the Cohesion policy poses a higher level of complexity, given by the fact that the information received is related to different programming periods, which are regulated by different rules.
5.1.1.Irregularities reported as fraudulent
5.1.1.1.Trend by programming period
Table CP2 analyses the trend linked to the communication of the irregularities reported as fraudulent in the last five years (2010-2014), making a distinction by Fund involved and the relevant programming period.
In the last five years, while the fraudulent irregularities linked to the PP2000-06 have been decreasing (although this decrease is less evident between 2012 and 2013), those linked to the PP2007-13 have been constantly increasing. These trends are linked to the current implementation of the latter period and the closure of the previous. They also reflect the increasing attention and resources deployed to combat fraud in relation to the programming period 2007-13. No case has been so far notified in relation to the programming period 2014-20 whose implementation and spending on projects will effectively take off only in the coming years.
Table CP2: trend of the number of irregularities reported as fraudulent between 2010 and 2014 by programming period – Cohesion Policy


Table CP2 and its associated chart do not include irregularities reported as fraudulent related to previous programming periods, which have been communicated until 2011.
Table CP3 provides in the same form of Table CP2 information about the trends linked to the amounts involved in cases reported as fraudulent, confirming the continuous increase related to the PP2007-13, although, concerning involved amounts, fluctuations can be much more significant as individual cases involving high amounts can easily distort the overall picture. This is clearly the case concerning the years 2011 to 2013, with the intermediate showing the highest amounts.
Table CP3: trend of financial amounts linked to the irregularities reported as fraudulent between 2009 and 2013 by programming period – Cohesion Policy


5.1.1.2.Trend by Fund
The analysis of the same data presented in Table CP2 but focussed on the distribution of the irregularities reported as fraudulent by Fund (Table CP4), highlights the following situations:
(1)The continuous increase since 2010 of cases concerning the ERDF has stopped in 2014;
(2)Potential frauds affecting the Cohesion fund are reported regularly since 2010, while only one case has been reported (in 2013) in relation to the whole programming period 2000-2006;
(3)After a significant decrease, between the years 2009-2011, of the cases related to the ESF, these have remained quite stable between 2012 and 2014;
(4)Since 2013, no more cases concerning the FIFG have been reported (see chapter 4 on the EFF for the programming period 2007-2014).
Table CP4: trend of the number of irregularities reported as fraudulent between 2010 and 2014 by Fund – Cohesion Policy


Table CP5 analyses these trends examining the financial amounts linked to the irregularities reported as fraudulent in the reference period.
The analysis of the period under consideration shows an interesting distribution of the amounts involved between the ERDF, Cohesion Fund and ESF, which, to a certain extent resembles the distribution of the resources among the funds, with an underrepresentation of ESF and an overrepresentation of the Cohesion fund. The latter, in particular has been the fund with the highest amounts involved in the last year. As one could expect, similarly to the number of reported fraudulent irregularities, the EAGGF-Guidance is progressively shrinking, while in the last two years no reported cases concern the FIFG.
Table CP5: trend of financial amounts linked to the irregularities reported as fraudulent between 2010 and 2014 by fund – Cohesion Policy


5.1.1.3.Trend by objective
Specific to the Cohesion Policy is that programmes and financial resources available to implement them are closely linked to the geographical dimension, that is to say that the objectives that they pursue depend on the region (and its level of economic development) in which they are implemented. For this reason, the analysis by objective is important.
From this point of view, the analysis of irregularities reported as fraudulent in the last five years does not change the trend already highlighted in past reports.
As showed in Table CP6, the fraudulent irregularities detected and reported by Member States mainly concern programmes implemented under the Convergence objective (previously Objective 1), linked to the less economically developed regions in Europe.
Their notifications have progressed in a linear way until 2013 and their increase has only slowed down in 2014.
Nonetheless, the distribution among the various objectives is remarkably similar to the distribution of the resources among the objectives, at least in relation to the overall situation 2010-2014.
This parallelism is however lost in relation to the distribution of the involved amounts as showed in Table CP7.
Table CP6: trend of irregularities reported as fraudulent between 2010-14 by Objective


The analysis by objective presented above is exclusively referred to the programming period 2007-13.
Table CP7 analyses the trend in relation to the reported amounts linked to the irregularities showed in Table CP6.
The Convergence objective shows an absolute predominance in this respect, as it represents about 95% of the total amounts linked to fraudulent irregularities in the reference period.
After the decrease in the involved amounts in 2013, these have been increasing again in 2014.
Table CP7: trend of amounts related to irregularities reported as fraudulent between 2010-14 by Objective


The analysis by objective presented above is exclusively referred to the programming period 2007-13.
5.1.2.Irregularities not reported as fraudulent
Table CP8 analyses the trend linked to the communication of the irregularities not reported as fraudulent in the last five years (2010-2014), making a distinction by Fund involved and the relevant programming period.
Data confirm the increasing results of checks performed on the project financed in the framework of the programming period 2007-13 due to its mounting level of implementation and the progressive phasing-out from the actions linked to the previous programming phase.
The level of reporting related to the programming period 2007-13 has already almost reached the levels of reporting that in the previous programming cycle were recorded at closure.
Table CP8: trend of the number of irregularities not reported as fraudulent between 2010 and 2014 by programming period – Cohesion Policy


Table CP9 shows the trend related to the amounts linked to the reported non-fraudulent irregularities. Once more, as already mentioned several times in relation to the trends of the financial amounts, fluctuations can happen more often, as they are linked to individual irregularities or group of irregularities of significant value, which produce distortive effects from one year to the other.
Table CP9: trend of financial amounts linked to the irregularities not reported as fraudulent between 2010 and 2014 by programming period – Cohesion Policy


5.2.Specific Analysis – Irregularities reported in relation to the Programming Period 2007-13
5.2.1.Priorities concerned by the irregularities reported as fraudulent
The operational programmes financed by the Cohesion Policy are implemented in relation to the already mentioned objectives, but also along identified Priorities and Themes.
The information provided by Member States allows for an analysis of the priority areas in relation to which Member States have identified projects affected by potentially fraudulent practices.
Table CP10 shows the number of reported fraudulent irregularities per reporting year since the beginning of the programming period 2007-13.
In terms of numbers, the 'Priorities' most concerned were 'Research and Technological Development (RTD)', 'Improving access to employment and sustainability' and 'Improving human capital'.
Table CP10: PP2007-13 - Irregularities reported as fraudulent by Priority

About 44% of the irregularities used for this analysis did not provide information in relation to the priority area concerned, decreasing from 45% of last year. However the sample used for the irregularities reported in 2013 (published in last year’s Report) was including only data concerning the two most recent years. Should the same method be applied the result would be 28% with an improvement of over 17 percentage points.
Table CP11 shows the amounts linked to the irregularities reported as fraudulent and their minimum, maximum and average value.
From the amounts point of view, the most significant results concern 'Transport', ‘RTD’ and 'Investment in Social Infrastructure'. ‘Transport’ retains also the highest maximum and average values.
Table CP11: PP2007-13 – Amounts involved in irregularities reported as fraudulent by Priority

5.2.2.Priorities concerned by the irregularities not reported as fraudulent
The same analysis showed in paragraph 1.2.1 for the irregularities reported as fraudulent is presented here for the irregularities not reported as fraudulent in relation to the programming period 2007-13.
Table CP12 shows the number of reported fraudulent irregularities per reporting year since the beginning of the programming period 2007-13.
Again, ‘Research and Technological Development (RTD)’ is the priority with the highest number of occurrences, followed by ‘Environmental protection and risk prevention’ and ‘Transport’.
Table CP12: PP2007-13 - Irregularities not reported as fraudulent by Priority

Also in relation to the irregularities not reported as fraudulent the constant improvement in the completeness of data is confirmed, although to a lesser extent than for the fraudulent irregularities.
Table CP13 shows the amounts linked to the irregularities not reported as fraudulent and their minimum, maximum and average value.
In this case, the category displaying the highest total amount involved and maximum value is that of the irregularities for which no indication has been given as to the priority affected. The highest average amount is linked to the priority ‘Transport’.
Table CP13: PP2007-13 – Amounts involved in irregularities not reported as fraudulent by Priority

5.2.3.Types of irregularities / modus operandi detected - Irregularities reported as fraudulent
The analysis of the detected practices used in connection with the irregularities reported as fraudulent in 2014 (Table CP14) reveals a consolidation of existing trends. Detected fraudulent attempts mainly happen during the implementation of a project and are made through falsified documents or declarations (in 27%of the cases), or by infringing the commitments entered into (through the signature of the financing contract), which implies that the project is not implemented according to what agreed.
Violation of public procurement rules in connection with irregularities reported as fraudulent have been detected in 9% of the cases in 2014 and 8% of the total number of fraudulent irregularities reported in relation to the programming period 2007-13.
Irregularities concerning ethics and integrity (within which are included possible cases of corruption and conflict of interest) have recorded a significant increase with the 22 cases reported in 2014, considering that, until 2013 included only 15 had been notified to the Commission. The related amounts for this category are particularly significant despite the low number of cases on the total.
Table CP14: Programming Period 2007-13 - Types of irregularity/Modus operandi detected in relation to irregularities reported as fraudulent


The data population used in this paragraph consists of all irregularities reported as fraudulent in relation to the programming period 2007-13 until the end of 2014.
The row for totals has been omitted in consideration of the fact that to the same irregularity reported may be associated several typologies of infringements and therefore the total sum of value in Table CP14 would result in multiple counting of the same irregularity notification.
The category “Infringement of contract provision / rules” includes all irregularities related to implementation of the contract, i.e. irregularities such as ‘action not implemented’, ‘action not completed’, ‘action not carried out in accordance with rules’, ‘Failure to respect other contract provisions/rules’.
The category “Eligibility / Legitimacy of expenditure / measure” refers to all irregularities concerning the eligibility of the project or of the claimed expenditure, such as ‘Not-eligible expenditure’, ‘Expenditure not-legitimate’, ‘Expenditure outside of eligibility period’, but also types of irregularities associated with the request of aid/financing, such as ‘Incorrect request for aid’, ‘Request for aid false or falsified’.
The category “Ethics and Integrity” refers to violations like ‘Conflict of interest’, ‘Bribery – active’, ‘Bribery – passive’, ‘Corruption’, ‘Other irregularities concerning integrity and ethics’.
5.2.4.Type of control / method of detection – Irregularities reported as fraudulent
The analysis of the information concerning the Programming Period 2007-13 shows an important shift in relation to the previous programming period. The number of fraudulent irregularities detected by administrative controls is proportionally significantly higher than what was the case in the previous period, where the administrative verifications, on the spot checks and audit of operations would detect less than 20% of the cases, while in the current period they detect about 64%.
Table CP15: Programming Period 2007-13 - Type of checks having detected the irregularities reported as fraudulent


The results of this analysis may be influenced by the accuracy of the information reported by Member States, which may have highlighted the subsequent activity of bodies in charge of the management and control of the funds and neglected the detection activity of the anti-fraud bodies.
Another element to be kept into account is that for 215 cases reported until the end of 2014, it was not possible to determine the type of check.
The number of cases linked to investigations by EU bodies (including OLAF) is not accurate.
5.2.5.Type of irregularities not reported as fraudulent
Table CP16 provides an overview of the types of irregularities detected in relation to non-fraudulent irregularities.
It confirms some of the main trends highlighted in previous years, as the infringements most frequently detected (over 38% of the total) and those involving the highest amounts are those concerned with public procurement (over 49% of the total value of the irregularities).
Table CP16: Programming period 2007-13 - types of non-fraudulent irregularities

5.3.Anti-fraud activities by Member States
Previous paragraphs have examined the trend and main features and characteristics of the irregularities reported as fraudulent.
The present paragraph aims at examining some aspects linked to the anti-fraud activities and results of Member States. Five elements are taken into account:
(1)the time that runs between the beginning of the fraudulent practice and its detection/establishment by the competent authority and reporting to the Commission (Detection / Reporting Efficiency);
(2)the number of irregularities reported as fraudulent by each Member State;
(3)the fraud detection rate (the ratio between the amounts involved in cases reported as fraudulent and the payments occurred in the financial year 2012);
(4)the fraud prevention rate (the ratio between the amounts involved in cases reported as fraudulent which have been detected before payments were executed);
(5)the ratio of cases of established fraud on the total number of irregularities reported as fraudulent.
5.3.1.Duration of irregularities, Detection and Reporting Efficiency
Of the 5 283 detected irregularities (fraudulent and non-fraudulent) reported by Member States in 2014, 58% involve infringements that have been protracted during a given span of time. For the 306 irregularities reported as fraudulent this percentage is slightly higher at 60%. The remaining part of the datasets refers to irregularities/breaches which consisted of a single act identifiable on a precise date.
Taking into account only those irregularities which have been protracted in time, their average duration is of 56 months (i.e. about 4 years and 7 months).
The two subsets (irregularities reported as fraudulent and those not reported as fraudulent) have very similar patterns, the average duration of those reported as fraudulent being 55 months (i.e. about 4 and half years) while that of those not reported as fraudulent is 56 months.
Table CP17 shows the average number of months between the moment in which the fraudulent practice begins and when it is detected/established (Detection Efficiency – DetE) and then the average number of months between its establishment and the reporting to the Commission (Reporting Efficiency – RepE). For each of these indicators, the table also shows the maximum and minimum values.
The EU average is about three years and four months (40 months) between the first and the last of those events (DetE + RepE).
The duration of the DetE should not be seen as a sign of inefficiency per se. More relevant, in this respect, the RepE, which is about 8 and half months in average.
Table CP17: Cohesion Policy – Detection and Reporting Efficiency

Luxembourg have reported no sufficient information to calculate the DetE and the RepE.
Table CP18 shows the same information but limited to the irregularities reported as fraudulent between 2010 and 2014.
The overall time gap between the initial moment and reporting (DetE + RepE) is increasing in 2014 in comparison with previously reported information, but this is due to the DetE, as the RepE is slightly decreasing. This is normal as the programming period implementation goes forward and potential fraud is increasingly detected after payment.
The RepE is improving, from 14 months (calculated on the whole period) to 12 months. Eighteen (18) Member States show a RepE lower than the average.
Table CP18: Cohesion Policy – Detection and Reporting Efficiency – Irregularities reported as fraudulent between 2010 and 2014

Denmark and Luxembourg have reported no fraudulent irregularities during the period taken into consideration. For Ireland, information provided in relation to reported cases did not allow calculating any average time gap.
5.3.2.Detection of irregularities reported as fraudulent in 2014 by Member State
Map CP1 divides Member States in four groups, depending on the number of irregularities reported as fraudulent in 2014:
(1)Group 1: no irregularities reported as fraudulent irregularities in 2014. 6 Member States belong to this group.
(2)Group 2: between 1 and 9 such cases reported in 2014. 13 Member States belong to this group;
(3)Group 3: 10 to 30 irregularities reported as fraudulent. 5 countries are included in this group;
(4)Group 4: more than 30 cases reported. It counts 3 Member States.
Map CP1: Number of irregularities reported as fraudulent in 2014 by Member State – Cohesion Policy

5.3.3.Fraud detection rate
The fraud detection rate compares the results obtained by Member States in their fight against fraud with the payments received by them in a given financial year. This implies that a single case reported as fraudulent and involving a significant financial amount can produce a better result than that achieved by the sum of the financial impact of several irregularities affecting lower amounts. For this reason, this indicator should be read in conjunction with the number of irregularities reported as fraudulent and for this reason they are presented together in Table CP19.
In 2014, the highest fraud detection rates are referred to Belgium, Czech Republic, Estonia, Latvia, Netherlands, Poland, Romania and Slovenia (all above 0.3%).
A second important element is the stock of reported irregularities and involved amounts and their relation to the payments occurred in the reference period.
The highest number of detected fraudulent irregularities for the period 2007-13 originates from Poland, Germany, the Czech Republic, Romania, Latvia and Italy.
The accumulated fraud detection rate (2008-2014) is the highest (>0.3%) for Czech Republic, Italy, Latvia, Poland, Romania and Slovenia.
Table CP19: number of irregularities reported as fraudulent, amounts involved and fraud detection rate by Member State – Programming Period 2007-13

5.3.4.Fraud Prevention Rate
The fraud prevention rate (FPR) compares the percentage of the amounts detected before payment with the total amounts related to irregularities reported as fraudulent.
The calculation is performed on the whole stock of irregularities reported as fraudulent in the years from 2008 to 2014 and not exclusively on those reported in 2014.
The FPR can easily result higher in the case of Member States having reported a low number of fraudulent irregularities and therefore should be ‘read’ and interpreted together with the overall number of irregularities reported as fraudulent and the fraud detection rate, as showed in Table CP20.
The overall FPR is 53%, indicating that almost half of the amounts involved in fraudulent irregularities are detected before payment.
In this respect, the most effective Member States, which satisfy the two conditions of having FPR and FDR above the average are the Czech Republic and Latvia.
Table CP20: number of irregularities reported as fraudulent between 2008 and 2014, amounts involved, irregular amounts paid out and fraud prevention rate by Member State

5.3.5.Ratio of established fraud 2008-2014
Table CP21 shows the ratio between the cases of established fraud and the total number of irregularities reported as fraudulent (including suspected and established fraud) in the period 2009-13. Taking into account only cases reported in 2014 would be meaningless, as the criminal proceedings leading to a conviction for fraud may take several years, while using the period 2010-14 would be misleading as it will be impossible to make a sound comparison with figures published in the 2013 Report. However information concerning the years 2010-14 is published (for reference for future years) in Table CP19.
Table CP21 has been completed with the ‘Dismissal ratio’, calculated by the differences between the total number of irregularities reported as fraudulent published in the corresponding table in the 2013 Report (TOTAL 2013) and the total calculated taking into account the updates received in 2014. When the ratio is positive, it means that Member States have classified as ‘suspected’ or ‘established fraud’ an irregularity appearing as fraudulent in 2013.
In this respect, the average ratio of established fraud at EU level is 10%, decreasing from 11% of 2013. The dismissal ratio is 1%.
Table CP21: number of cases of suspected and established fraud, ratio of established fraud, dismissal ratio – cases reported until 2013

However, this decrease is mainly due to a miscalculation in the previous Report due to incorrect reporting from one Member State (Greece), which had erroneously classified as established fraud almost all the cases reported in 2013.
Table CP22 provides the information concerning the number of cases of suspected and established fraud and ratio of established fraud calculated including also the fraudulent irregularities reported in 2014. It will be used in the coming reports for comparability.
Table CP19: number of cases of suspected and established fraud and ratio of established fraud – cases reported between 2008-2014 in the Cohesion policy

Of the 74 cases of established fraud, 61 (82%) were reported by three Member States: Germany, Poland and Slovenia.
Section II - Decentralised Management
The EU as a global player / Pre-Accession Policy
The goal of the EU as a global player is also promoted through direct management. Pre-Accession Assistance (PAA) is provided through decentralised management where third countries distribute funds but account to the EU for how it is spent. In the last stages new member states manage pre-accession funds under shared management to help them complete the transition.
6.Pre-Accession Policy (Pre-Accession Assistance and Instrument for Pre-Accession)
The assistance in pre-accession is provided on the basis of the European Partnerships of the potential candidates and the Accession Partnerships of the candidate countries. The current candidate countries are Croatia, Iceland, the Former Yugoslav Republic of FYROM, Montenegro, Serbia and Turkey. Accession negotiations were opened with Croatia and Turkey in October 2005, and with Iceland in July 2010.
6.1.The Pre-accession Assistance (PAA), 2000-06 and Instrument for Pre-Accession (IPA), 2007-13
The old Pre-accession Assistance (PAA), regarding the period 2000-06, was financed by series of European Union programmes and financial instruments for candidate countries or potential candidate countries, namely the programmes for candidate countries,
PHARE
,
SAPARD
and
ISPA
, Phare Cross-Border Cooperation (CBC) and Coordination, Pre-accession financial assistance for Turkey, Assistance for reconstruction, development and stabilisation for potential candidate countries (
CARDS
) and Transition facility.This assistance has nearly been closed except for a few payments in CARDS.
The current Instrument for Pre-Accession Assistance (IPA), which covers the period 2007-2013, is delivered through five components. The policy and programming of IPA consists of
Multi-Annual Indicative Financial Framework
(MIFF) on a three year basis, established by country, component and a theme, and
Multi-Annual Indicative Planning Documents
(MIPDs) per country or per groups of countries (regional and horizontal programmes). The Candidate Countries submit also Strategic Coherence Frameworks (SCF) and Multi-annual Operational Programmes, both regarding IPA Components III and IV. Their principal aim is to prepare beneficiary countries for the future use of the Cohesion policy instruments by imitating closely its strategic documents, National Strategic Reference Framework (NSRF) and Operational Programmes (OP), and management modes.
The financing of IPA is provided by the five following different components and DG Enlargement leads in the coordination of the instrument:
(1)Component I, Transition Assistance and Institution Building (TAIB), is managed by the European Commission's
Directorate General for Enlargement
;
(2)Component II, Cross-Border Cooperation, is managed by the European Commission's
Directorate General for Enlargement
and part is managed, under shared management with Member States, by European Commission's
Directorate General for Regional
Policy;
(3)Component III, Regional Development, is managed by the European Commission's
Directorate General for Regional
Policy;
(4)Component IV, Human Resources Development, is managed by the European Commission's
Directorate General for Employment and Social Affairs
; and
(5)Component V - Rural Development is managed by the European Commission's
Directorate General for Agriculture
.
The pre- and post-accession assistance is implemented through a variety of management modes which take into account different levels of preparedness of the beneficiary countries. The assistance under IPA is designed also to prepare the beneficiary countries to assume full responsibility for the management of financial assistance granted by the EU.
The eligibility for IPA components differs depending on the state of preparedness. In the use of funds the IPA beneficiary countries are divided into two categories. The EU candidate countries Croatia, the Former Yugoslav Republic of FYROM, Serbia and Turkey are eligible for all five components of IPA. While the new candidate countries, Iceland and Montenegro (candidate status awarded in 2010), currently remain outside the scope of intervention of IPA Component III, the regional development. The Potential candidate countries in the Western Balkans (Albania, Bosnia and Herzegovina, Montenegro and Kosovo under UN Security Council Resolution 1244/99) are eligible only for the first two components.
Implementation of Components I and II falls under the responsibility of DG Enlargement, which initiates the components under a centralised management mode, with a view to transferring implementation management powers to the beneficiary countries as soon as their administrative capacities are considered sufficiently developed to ensure sound financial management. The EU Delegations play a major role in the delivery of IPA, in particular under the de-concentrated and decentralised management modes.
The implementation can be handled:
directly by central management: funds are managed by DG Enlargement at headquarters;
directly de-concentrated: funds are managed by EU Delegations under the supervision;
directly centralised: cross-delegated when funds are managed by another service of the Commission through cross sub-delegation;
indirectly in a centralised indirect management: funds are managed by executive agencies, specialised Community bodies (such as the European Investment Bank or the European Investment Fund) and national or international public-sector bodies or bodies governed by private law with a public-service mission;
indirectly decentralised with ex ante control: funds are managed by accredited national authorities of the beneficiary country, but procurement is subject to ex ante control by the EC Delegation;
decentralised without ex ante control: funds are managed by accredited national authorities of the beneficiary country and are not subject to ex ante controls by an EC Delegation;
joint: funds are jointly managed with International Organisations (EBRD, EIB, Sigma, UN agencies, etc.)
6.2.General analysis – Trend analysis
6.2.1.Trend analysis
Regarding the Pre-Accession Assistance (PAA), the number of irregularities reported as fraudulent decreased in 2014 compared to the previous year. The downward trend since 2009 is confirmed as Table PA2 and Chart PA1 show.
Table PA1 – Reported irregularities (PAA), 2010-14


For the total number of irregularities (reported as fraudulent and not reported as fraudulent) for the PAA, there were 76 irregularities reported in 2014 and the amount affected EUR 13.5 million (down from 181 and EUR 55.1 million respectively).
In the past five years, most of the irregularities (reported as fraudulent and not reported as fraudulent) and the highest aggregate amount concern first Romania and secondly Bulgaria. In relation to the distribution of irregularities according to funds it can be said that most of the fraudulent irregularities concern SAPARD, however in terms of non-fraudulent irregularities the latter is preceded by ISPA.
6.2.2.Trend analysis IPA
Generally it can be said that the trend of IPA reporting (financial framework 2007-13) has begun to develop in a stable upward curve which means a continuous increase in the number of irregularities reported and involved amounts since 2010. The increasing trend can be considered within the norm as the reporting of irregularities of IPA has only begun in recent years.
Table PA2 details the underlining data, while Chart PA2 shows the evolution of reporting of all the irregularities (reported and not reported as fraudulent) since 2010.
Table PA2 – Reported irregularities (IPA), 2010-14


During the past few years, the highest number of irregularities reported as fraudulent was communicated by Turkey followed by FYROM. The highest fraudulent amounts were recorded in relation to Cross-Border Cooperation and secondly to Transition Assistance and Institution Building. However, Regional Development and Transition Assistance scores the highest in monetary value with regard to irregularities not reported as fraudulent.
6.2.3.Reporting efforts
In general the communications received regarding IPA via IMS are complete and in terms of timeliness the reporting behaviour is satisfactory. Reporting happens, in average, after 3 and half months following detection of an irregularity, which, in general, intervenes after 3 years it is committed.
The level of completeness of the reported information has been improving depending on experience with reporting, but Beneficiary Countries need to better specify and detail information concerning irregular practices, in particular in relation to irregularities reported as fraudulent.
Serbia and FYROM have reported irregular cases in the IMS system during 2013. The information provided by these countries is complete and detailed, moreover the classification of the irregularities is accurate.
Turkey and Croatia have continued the consistent reporting. Croatia increased significantly the number of reported irregularities since its connection to IMS in October 2012.
6.3.Specific analysis – Financial year 2014
6.3.1.Pre-Accession Assistance (PAA)
In 2014 a total number of 22 irregularities were reported as fraudulent with the amount affected of EUR 7.0 million as shown in Table PA3.
Table PA3 – Reported irregularities per country (PAA), 2014

These fraudulent irregularities were reported by Bulgaria and Romania. Regarding irregularities not reported as fraudulent, it was Romania communicating the highest number of cases with EUR 8.6 million amounts affected.
Like in the previous years, in 2014 the majority of cases concern again SAPARD, the Special Accession Programme for Agriculture and Rural Development.
With 15 irregular fraudulent cases reported and over EUR 5.6 million involved, the SAPARD fund remains the most affected by fraud among all the PAA funds, followed by PHARE with 7 cases and EUR 1.4 million affected.
Table PA4 – Reported irregularities per fund (PAA), 2014

The practices repeatedly employed in committing fraudulent irregularities are mainly ‘falsified supporting documents’ and ‘other irregular documents’, which together represent 41% of the cases and 72%% of the irregular amounts.
With regard to irregularities not reported as fraudulent, the highest irregular amounts have been reported in relation to ISPA fund (EUR 3.6 million), followed by SAPARD (EUR 2.6 million). The most frequent modus operandi are: ‘failure to respect other regulations/contract conditions’ (46% of the cases and 25% of the irregular amounts) and ‘Non-eligible expenditure’ (11% of the cases and 55% of the irregular amounts).
6.3.2.Instrument for Pre-Accession (IPA)
In IPA (2007-13), there were 9 irregularities reported as fraudulent involving EUR 120K irregular amounts. Tables PA5 and PA6 show the breakdown per country and per component respectively.
Table PA5 – Reported irregularities per country (IPA), 2014

In 2014 Turkey was the country reporting the highest number of irregularities and aggregate amounts involved in irregularities. Concerning the 9 irregularities reported as fraudulent, these are spread among four reporting countries.
Table PA6 – Reported irregularities per component (IPA), 2014

The modus operandi for the irregularities reported as fraudulent has been specified only in relation to three cases.
When it comes to other irregularities not reported as fraudulent, the most frequent practice employed are: ‘Infringement of rules concerning public procurement’ (concerns 22 % of the cases and only 4 % of the irregular amounts), ‘Failure to respect other regulations/contract conditions’ (concerns 8 %cases but concerns 29 % of the irregular amounts) and finally ‘Non-eligible expenditure’ (concerns 13 % of the cases and 6 % of the irregular amounts).
6.3.3.Method of detection
In 2014, Regarding PAA, most of the irregularities were detected by EU bodies or on information sent by EU bodies (21% of the cases). Judicial inquiries have been the most frequent method of detection in relation to fraudulent irregularities (41% of the cases and 64% of irregular amounts).
In case of IPA, the low number of occurrences limits the possibilities of a meaningful analysis.
Section III – Direct Management
7.Direct Management
7.1.Introduction
This chapter contains a descriptive analysis of the data on recovery orders issued by Commission services in relation to expenditures managed under ‘direct management’ mode, which is one of the three implementation modes the Commission can use to implement the budget.
According to the Financial Regulation, ‘direct management’ means that the Commission implements the budget by its departments, including its staff in the Union Delegations under the authority of their respective Head of Delegation, or through executive agencies.
For financial year 2014, a total of EUR 11.9 billion has been effectively disbursed under the ‘direct management’ mode. Table DM1 presents the actual payments made in financial year 2014 for the eighteen policy areas corresponding to 96.5% of the overall operational payments made under ‘direct management’.
Table DM1 – Payments made in financial year 2014 per policy area

7.2.General analysis
In 2014, for the eighteen policy areas, the Commission services registered 1897 recovery items in ABAC that were qualified as irregularities for a total financial value EUR 100.76 million. Among these recovery items, 83 have been reported as fraudulent, involving EUR 4.67 million irregular amounts.
7.2.1.Five year analysis 2010-2014
As a trend analysis, the comparison between five years, from 2010 to 2014 will be hereunder provided. The below analysis gives an overview of recovery data recorded in the ABAC system. It has to be noted that qualifications attributed to recovery items may change over the years: especially, there are situations when cases of irregularities are turned to suspicions of fraud. As a consequence, no direct conclusion can be drawn with regard to the general evolution of irregularities, nor predictions can be made on future trends.
From a purely statistical point of view, it can be said that between 2010 and 2013, the number and related financial value of ‘irregularities reported as fraudulent’ have steadily decreased. However, in 2014 there was a sudden increase both in terms of number and related financial value of the ‘irregularities reported as fraudulent’. At the same time, we can experience a steady increase of number of ‘irregularities not reported as fraudulent’ and associated financial amounts over the past five years.
Table DM2 and DM3 summarise these figures for irregularities during the five-year term.
Table DM2 – Irregularities reported as fraudulent and related amounts, financial years 2010-2014

Table DM3 – Irregularities not reported as fraudulent and related amounts, financial years 2010-2014

As far as ‘irregularities reported as fraudulent’ are concerned, the fraud detection rate over the five year period is close to zero (0.03%).
At the same time, there were almost seven thousand registered recovery items qualified as ‘irregularities not reported as fraudulent’ with a total recovery amount of EUR 345.64 million.
The aggregate irregular amounts, when compared to the reference figure of the total operational payments of the five financial years (EUR 67 795 million), gives the overall irregularity detection rate of around half a percent (0.54%).
The registered irregulariy figures demonstrate the efficient irregularity detection and reporting systems in place.
7.3.Specific analysis
7.3.1.Recoveries according policy areas
Table DM4 provides a picture of irregularity statistics with a breakdown of the policy areas for year 2014.
Table DM4 – Irregularities reported by policy areas and related amounts, 2014

In financial year 2014, the highest numbers of 'irregularities reported as fraudulent' were recorded in the ‘Research’ budget area, followed by ‘Education and Culture’. However, in terms of irregular amounts related to these irregularities, the policy field ‘Education and Culture’ scored with EUR 1.69 million, which is closely followed by budget areas ‘Enterprise’ (EUR 1.09 million) and ‘Research’ (EUR 0.99 million). These three policy areas account for 80% of fraudulent amounts recovered.
Regarding 'irregularities not reported as fraudulent', most of the irregularities were registered in the area of ‘Research’ followed by ‘Education and Culture’ and ‘Information society and media’. In terms of irregular amounts related to these irregularities, the policy field ‘Information society and media’ recorded the highest irregular amounts (EUR 22.00 million), followed by ‘Mobility and transport’ (EUR 18.49 million), ‘Enterprise’ (EUR 15.30 million) and ‘Research’ (EUR 12.46 million). These four policy areas account for 71% of the non-fraudulent amounts recovered in 2014.
The five year perspective is presented by table DM5
Table DM5 – Irregularities reported by policy areas and related amounts, financial years 2010-2014

The above table demonstrates that ‘External relations’ policy field recorded the highest aggregate recovery amounts (EUR 7.16 million) in relation to 'irregularities reported as fraudulent'. At the same time, this policy field has the highest fraud detection rate (0.09%) over a five-year period. The second largest aggregate fraudulent amounts were recovered in the fields of ‘Information society and media’ (EUR 2.95 million), followed by ‘Development and relations with ACP States’ (EUR 2.18 million) and ‘Education and culture’ (EUR 2.01 million). These four policy areas account for 75% of the total recovery amounts related to 'irregularities reported as fraudulent' over the past five years.
Regarding 'irregularities not reported as fraudulent', policy area ‘Information society and media’ recorded the highest aggregate recovery amounts (EUR 81.42 million) between 2010 and 2014. It is followed by ‘Research’ (EUR 55.00 million), ‘Mobility and transport’ (EUR 45.52 million) and ‘External relations’ (EUR 35.72 million). These four policy areas account for 62% of the total recovery amounts related to 'irregularities not reported as fraudulent' over the past five years.
It can also be said that some policy areas registered increasing irregular amounts over the five years. These are notably the following: ‘Enterprise’, ‘Mobility and transport’, ‘Research’, Information society and media’, ‘Education and culture’, ‘Development and relations with ACP States’, ‘Humanitarian aid’ and ‘Energy’. On the other hand, decreasing trend can be observed in the following policy fields: ‘Home affairs’ and ‘External relations’. The remaining eight policy areas had fluctuating irregular amounts over the past five years.
7.3.2.Recoveries according to legal entity residence
The legal entity was resident in one of the 28 Member States of the European Union in 88.7% of the total number of irregular cases (reported as fraudulent and not reported as fraudulent together) between 2010 and 2014. It should be noted however, that the residence of the legal entity is not necessarily the same as that of the main beneficiary.
Table DM6 – Recoveries per country of residence of the legal entity, 2010-2014

Table DM6 above summarises the total recoveries made in the past five years according to the legal entity country to which the payment was unduly disbursed. EU Member States are listed; other countries are grouped under the ‘non-EU’ category.
7.3.3.Method of detection
For each recovery item, the Commission service that issues the order has to indicate how the irregularity has been detected. Six different categories have been pre-defined, two of which fall under the direct responsibility of the European Commission: On-the-spot checks and the verification of documents by desk officers and financial officers responsible for the implementation of the commitment. Table DM7 gives a breakdown of the recoveries by source of detection and by qualification in 2014.
Table DM7 – Irregularities reported by source of detection and by qualification, 2014

Regarding the ‘irregularities reported as fraudulent’, ‘OLAF’ has been marked as the source of detection in relation to 33 recovery items in 2014; meanwhile ‘Community control / Check on the spot’ was the source of detection of 43 recovery items. There are over EUR 4 million recovery amounts (91% of total amounts) associated to these two sources of detection.
The vast majority of the cases ‘irregularities not reported as fraudulent’ were detected through ‘Community controls’ (on-the-spot checks and desk checks of documents). There is an increasing tendency over the past five years: every year there is an increasing number of cases detected due to the effective ex-ante and ex-post ‘Community controls’. In 2014 alone, 77.6% of recoveries that were qualified as ‘irregularities not reported as fraudulent’ were detected by ‘Community controls’ involving 74.4% of total related irregular amounts.
7.3.4.Types of error
The Commission services also have to indicate the type of error in the recovery context for the respective irregularity in question. Several types of error can be attributed to one irregular case. Largely it can be observed that error ‘Action not in accordance with the rules’ and error ‘Expenditure not covered by the legal base’ appear most frequently every year, (reported as fraudulent or not) during the past five years. Besides, regarding ‘irregularities reported as fraudulent’, error type ‘Falsified documents’ appears to be the most frequent error type associated to recoveries.
7.3.5.Time delay
For the recoveries qualified as irregularities (both reported as fraudulent and not reported as fraudulent) issued between 2010 and 2014, the average delay between the occurrence of the irregularity and its detection is 3.27 years. It should be noted however, that the average time delay is lower for ‘irregularities reported as fraudulent’ (2.82 years) than for ‘irregularities not reported as fraudulent’ (3.28 years).
7.3.6.Recovery
This paragraph describes the payments made to the Commission further to the issuing of the recovery orders. Once a recovery order is issued, the beneficiary is requested to pay back the amount unduly received or the amount is offset from remaining payments for the beneficiary.
For the recovery orders issued in 2014, 57.1% of the total irregular amounts have already been recovered. This means that an amount of EUR 43.33 million (out of EUR 100.76 million) has already been cashed. Yet there are differences between the recovery rates for irregularities reported as fraudulent and those not reported as fraudulent. The recovery rate for ‘irregularities reported as fraudulent’ remains below the recovery rate for ‘irregularities not reported as fraudulent’. When looking at the five year period, the recovery rate for ‘irregularities reported as fraudulent’ is 41.8%, meanwhile for ‘irregularities not reported as fraudulent’ it is higher, 59.6%.
COUNTRY FACTSHEETS
Belgium


Bulgaria


Czech Republic


Denmark


Germany


Estonia


Ireland


Greece


Spain


France


Croatia


Italy


Cyprus


Latvia


Lithuania


Luxembourg


Hungary


Malta


Netherlands


Austria


Slovenia


Slovakia


Finland


Sweden


United Kingdom


ANNEXES
ANNEX 1

ANNEX 2
(The number of irregularities reported as fraudulent measures the results of efforts by Member States to counter fraud and other illegal activities affecting EU financial interests; it should not be interpreted as the level of fraud in their territories)

ANNEX 3

ANNEX 4

ANNEX 5

ANNEX 6

ANNEX 7

ANNEX 8

ANNEX 9
 +
+
ANNEX 10

ANNEXES 11-15
Legenda
IRQ0: cancelled communication
IRQ2: Irregularities not reported as fraudulent
IRQ3: suspected fraud
IRQ5: established fraud
ANNEX 11
Expenditure - Irregularities reported in 2014 by Member State

ANNEX 12
Irregularities reported in 2014 – financial amounts in EUR

ANNEX 13
Natural resources – Classification of irregularities reported in 2014 by Member State
(The number of irregularities reported as fraudulent measures the results of efforts by Member States to counter fraud and other illegal activities affecting EU financial interests; it should not be interpreted as the level of fraud in their territories)

ANNEX 14
Cohesion policy – Classification of irregularities reported in 2014 by Member State
The number of irregularities reported as fraudulent measures the results of efforts by Member States to counter fraud and other illegal activities affecting EU financial interests; it should not be interpreted as the level of fraud in their territories)


