 EUROPEAN COMMISSION
Brussels, 17.5.2018
SWD(2018) 189 final
COMMISSION STAFF WORKING DOCUMENT
IMPACT ASSESSMENT
Accompanying the document
Proposal for a Regulation of the European Parliament and of the Council
on the labelling of tyres with respect to fuel efficiency and other essential parameters, and repealing Regulation (EC) No 1222/2009
{COM(2018) 296 final}
{SEC(2018) 234 final}
{SWD(2018) 188 final}
ANNEXES OF THE IMPACT ASSESSMENT
ON THE REVIEW OF THE TYRE LABELLING
REGULATION (EC) No 1222/2009/EC
Table of Content
Annex 1: Procedural information3
Annex 2: Stakeholder consultation6
1.Overview of the respondents to the OPC6
2.Overall results8
3.Detailed results9
3.1.Evaluation of existing tyre label9
3.2.Possible Improvements and additions14
4.In extenso comments from all respondents34
Annex 3: Who is affected and how?56
1.Practical implications of the initiative56
2.Summary of costs and benefits57
3.Estimation of administrative costs58
Annex 4: Analytical methods64
1.General assumptions64
2.Information effect65
3.Stock model assumption65
4.BAU Scenario assumptions66
5.Policy Option 2 scenario assumptions70
6.Policy Option 3 Scenario assumptions70
7.Policy Option 4 scenario assumptions72
8.Effect of Rolling resistance on fuel consumption72
9.Effect of Wet grip on safety74
10.Societal costs78
11.Economy and employment78
12.Label re-adjustment81
12.1Wet Grip81
12.2Rolling Resistance / Fuel Efficiency82
12.3Rolling resistance / Wet grip cross distributions84
12.4Noise (dB)85
12.5Noise (Classes)86
13.Proposal to new label intervals87
13.1Scenario 187
13.2Scenario 292
Annex 5: Evaluation96
1.Introduction - Purpose and scope of the evaluation98
2.Background to the intervention99
2.1.Description of the intervention and its objectives99
2.2.Baseline and points of comparison (BAU)102
3.Implementation / state of Play104
4.Method105
4.1.Short description of methodology105
4.2.Interviews and end-user survey107
4.3.Limitations and robustness of findings108
5.Analysis and answers to the evaluation questions108
5.1.Effectiveness108
5.2.Efficiency116
5.3.Relevance123
5.4.Coherence128
5.5.EU added value132
6.Conclusions134
6.1.What is/is not working and why?134
6.2.The Lessons learnt135
6.3.Actual performance compared to expectations135
6.4.Actions to be taken136
Appendix 1: Stakeholder consultation137
Appendix 2: Methods and analytical models179
Annex 6: Results193
1.List of policy options, including modified policy option193
2.End user expenditure193
3.Economy: Business turnover197
4.Safety and safety costs200
5.Energy and GHG emissions204
Annex 7: Glossary206
Annex 1: Procedural information
1. Lead DG, Decide Planning/CWP references:
Lead DG: Directorate-General for Energy (DG ENER).
The initiative is included in the Commission Work Programme 2018 as agenda planning item: 2016/ENER/040
2. Organisation and timing:
The Inter Service Steering Group met three times: 29 January, 21 February and 6 March 2018. The Inter Service Steering Group included representatives of DGs Internal Market, Industry, Entrepreneurship and SMEs (GROW), Mobility and Transport (MOVE), Justice and Consumers (JUST), Environment (ENV), Climate Action (CLIMA), the Joint Research Centre (JRC) and the Secretariat General (SG).
3. Consultation of the RSB: The Regulatory Scrutiny Board (RSB) delivered a positive opinion with reservations on a draft of the Impact Assessment on 23 March 2018 after the meeting on 21 March. The following table gives an overview of its main comments and how they have been addressed in the report.
|
RSB Opinion 23.03.2018 : Main comments
|
Where and how the comments have been taken into account
|
|
The report does not adequately present the context of the Tyre Labelling Regulation (TLR), e.g. how it works together with the General Safety Regulation (GSR), Energy Labelling Directive and market surveillance frameworks. It does not present the actual and potential contribution of the labelling scheme to the efficiency and safety of tyres, beyond the requirements put in place by the GSR.
|
An explanation of the Energy Labelling Regulation and the Market Surveillance Regulation, and their relevance, has been added to Section 1.2 on page 4.
The actual contribution of the TLR has been added to the problem definition on page 7.
|
|
The presentation of policy options is not sufficiently clear, nor does it appear to cover the full range of policy issues addressed in the proposal.
|
The table at the beginning of section 5 (page 15) now presents the all the options, and the presentation of the options in section 5.2 (pages 15-26) has been improved. A new Table 4 has been added (page 28) to summarise the options that were discarded at an early stage and options that were modelled.
A more detailed explanation of why Option 4 is the preferred option has been added at page 41 and Table 18 has been made more exact (the mathematical calculations from Table 17 have been translated into half “+” s).
|
|
The report calculates impacts using behavioural assumptions that are neither transparently presented nor accompanied by a sensitivity analysis.
|
A summary of the underlying assumptions of the modelling has been added at the beginning of section 6 (page 29).
A sensitivity analysis on the key behavioural assumptions of consumers has been added to section 8 on the preferred option.
|
|
Specific objectives are missing, as are a good representation of stakeholder views on the different policy options.
|
The specific policy options have been added at the beginning of section 4.2 on page 12. Their monitoring and evaluation has been added to section 9.
A summary of the views of stakeholders by category (industry, Member States and consumers) has been added to Annex 2. Views of stakeholders, from the consumer survey during the review study and the OPC have been added throughout the text where appropriate.
|
4. Evidence, sources and quality:
The impact assessment draws on an extensive amount of desk research, external studies, targeted consultations, interviews, focus groups, workshops and other
This impact assessment is based on the findings from the Review Study carried out in 2016 and the subsequent Open Public Consultation (OPC) , but with market data updated to 2017. The calculations are based on a stock model, determining the number of tyres of each type (C1, C2, C3) in the EU, which is built on annual sales provided by the European Tyre and Rubber Manufacturers Association, ETRMA, combined with ACEA’s (European Automobile Manufacturers Association) annual numbers on vehicles in use in the EU. As part of the 2016 Review Study an extensive stakeholder consultation was performed to assess the efficiency and effectiveness of the label scheme. Stakeholders from across the supply chain were approached to assess their role and whether the TLR was serving its intended purpose. The stakeholder consultation thus included:
·Tyre suppliers;
·Tyre distributors;
·Vehicle suppliers and distributors;
·End users in each tyre segment: C1, C2 and C3.
Interviews and questionnaires were conducted with organisations in each segment, and a more thorough consumer survey was carried out in the largest end-user segment: private car owners of C1 vehicles. The C1 consumer survey included 6,000 respondents, a thousand from each of the following six Member States:
•
Germany (~42 million cars)
•
England (~29 million cars)
•
France (~32 million cars)
•
Italy (~37 million cars)
•
Sweden (~4.5 million cars)
•
Finland (~3 million cars)
External expertise was used where necessary, for example the Expert Group on Laboratory alignment for the measurement of tyre rolling resistance under Regulation (EC) No 1222/2009, the International Organization for Standardization, tyre specialists, the European Tyre & Rubber Manufacturers’ Association, the Platform for cooperation between National Road Authorities as well as other studies.
https://www.iso.org/standard/65530.html
,
https://www.iso.org/obp/ui/#iso:std:iso:23671:ed-2:v1
:
http://www.etrma.org
http://www.retyre-project.eu
http://www.transportengineer.org.uk/transport-engineer-news/goodyear-unveils-first-aa-grade-steer-concept-tyre/45469
http://www.cedr.eu
https://www.ecofys.com/files/files/fraunhofer-ecofys-2014-impact-of-ecodesign-energy-labelling-on-innovation.pdf
Annex 2: Stakeholder consultation
The stakeholder consultation took the form of the publication of the combined Evaluation Roadmap and the Inception Impact Assessment for the review of the tyres labelling Regulation in July 2017 and the Open Public Consultation (OPC) that ran from 10 October 2017 to 8 January 2018. The Review study also included an extensive stakeholder consultation, details are given in Appendix 1 to Annex 5.
A.Combined Evaluation Roadmap and Inception Impact Assessment
The roadmap was published on 12 July 2017 with a feedback period till 9 August 2017. Eight feedbacks were received from the following stakeholders:
·Consumer organisations: ANEC and BEUC (Belgium), Deutsche Umwelthilfe e.V. (Germany),
·Company/business organisations: ExxonMobil Petroleum & Chemical B.V.B.A. (Belgium), ENPA & EMMA (Belgium)
·Business associations: Imported Tyre Manufacturers' Association (United Kingdom), BIPAVER (Netherlands), European Tyre & Rubber Manufacturers Association (Belgium), EurEau European Federation of NAtional Associations of Water Services (Belgium)
Stakeholder comments in extenso are available at
http://ec.europa.eu/info/law/better-regulation/initiatives/ares-2017-3509962_en
.
B.Open Public Consultation (OPC)
The Open Public Consultation (OPC) was launched on 10 October 2017 and ended on 8 January 2018 (
https://ec.europa.eu/info/consultations/public-consultation-evaluation-and-review-eu-tyres-labelling-scheme_en
).
1.Overview of the respondents to the OPC
70 responses were received. 20 respondents identified themselves as citizens/consumers (one anonymous), 7 identified themselves as representing commercial tyre business, and 44 identified themselves as working for either an interest organisation or local/national authority (one anonymous). In addition, one stakeholder provided only a written statement (The Association of European Radios). See the list of stakeholder respondents in
Table
1.
Table 1 Overview of stakeholder respondents
|
Category
|
Stakeholder ID
|
Member State
|
|
Tyre suppliers
|
1.Apollo Tyres
|
International
|
|
|
2.Continental Reifen Deutschland GmbH
|
Germany
|
|
|
3.ExxonMobil Petroleum & Chemical BVBA
|
International
|
|
|
4.Goodyear Dunlop Tires B.V.
|
Netherlands
|
|
|
5.Michelin Nordic AB
|
Sweden
|
|
|
6.Nokian Tyres Plc
|
International
|
|
Retailer
|
7.BOVAG
|
Netherlands
|
|
Market surveillance authority
|
8.Swedish Energy Agency in cooperation with other agencies
|
Sweden
|
|
|
9.Swedish Transport Agency
|
Sweden
|
|
Member State government
|
10.Federal Ministry of Environment
|
Belgium
|
|
|
11.Ministry of Infrastructure and Water Management
|
Netherlands
|
|
Member State regional or local government authority
|
12.City of Helsinki
|
Finland
|
|
|
13.DCMR EPA/EUROCITIES
|
Netherlands
|
|
|
14.Federal Office for the Environement (FOEN)
|
Switzerland
|
|
|
15.Gemeente Den Haag
|
Netherlands
|
|
|
16.The City of Oslo, Department for Urban Environment
|
Norway
|
|
Non-governmental organisations representing societal interests
|
17.ACP Automóvel Clube
|
Portugal
|
|
|
18.Allgemeiner Deutscher Automobil Club e.V. (ADAC e.V.)
|
Germany
|
|
|
19.ANEC and BEUC
|
EU
|
|
|
20.Association of Austrian Newspapers
|
Austria
|
|
|
21.Association of Dutch Water Companies and the Association of Dutch Water Authorities
|
Netherlands
|
|
|
22.Austrian Journal and Trade Association (ÖZV)
|
Austria
|
|
|
23.Deutscher Verkehrssicherheitsrat e.V.
|
Germany
|
|
|
24.European Association for Accident Research and Analysis (EVU)
|
Austria
|
|
|
25.European Environmental Citizen's Organisation for Standardisation
|
EU
|
|
|
26.Fédération Internationale de l’Automobile (FIA Region I)
|
Luxembourg
|
|
|
27.Quercus ANCN
|
Portugal
|
|
|
28.The European Environmental Bureau
|
EU
|
|
|
29.Transport & Environment (T & E)
|
EU
|
|
|
30.ZERO - Associação Sistema Terrestre Sustentável
|
Portugal
|
|
Industry organisations
|
31.Advertising Association
|
United Kingdom
|
|
|
32.Advertising Information Group
|
Germany
|
|
|
33.BDEW Bundesverband der Energie- und Wasserwirtschaft
|
Germany
|
|
|
34.Däckbranschen Sverige AB
|
Sweden
|
|
|
35.European association of television and radio sales houses (EGTA)
|
EU
|
|
|
36.European Caravan Federation
|
Germany
|
|
|
37.European Magazine Media Association
and European Newspaper Publishers' Association (EMMA& ENPA)
|
EU
|
|
|
38.European Tyre & Rubber Manufacturers Association (ETRMA)
|
EU
|
|
|
39.German Insurance Association (GDV)
|
Germany
|
|
|
40.Nordic Logistics Association
|
Norway, Denmark, Sweden
|
|
|
41.Swedish Water and Wastewater Association
|
Sweden
|
|
|
42.The Danish Chamber of Commerce
|
Denmark
|
|
|
43.The European Federation of National Association of Water Services (EurEau)
|
EU
|
|
|
44.Verband der TÜV e.V.
|
Germany
|
|
|
45.Wirtschaftsverband der deutschen Kautschukindustrie e.V.
|
Germany
|
|
|
46.Zentralverband der deutschen Werbewirtschaft ZAW e.V.
|
Germany
|
|
Other
|
47.Commodity producer for tires
|
Germany
|
|
|
48.Solvay Silica (Manufacture of silica for the tire industry)
|
Belgium
|
|
|
49.Type Approval Authority
|
Netherlands
|
|
|
50.Water supply plant
|
Finland
|
|
Citizens / consumers
|
20 respondents identified themselves as citizens and/or private consumers
|
|
Respondents mainly originate from northern/western European countries which are not fully representative of the whole European Union. However it provides some basis for full extrapolation to the rest of EU-28 countries.
2.Overall results
The first part of the questionnaire (question 7 to 10) covered the respondent’s opinion on and experience with the current tyre label. A clear majority of respondents found the label useful and helpful when making a purchasing decision and 83% of respondents found an EU-wide label covering all EU countries a good thing. Understanding the label and its parameters is essential in order for the label to have its intended effect. For people having problems understanding the label parameters, the external noise parameter was the most difficult. 77% did not have any problem understanding any label parameters. 29% considered the wet grip parameter the most important, compared to 16% for rolling resistance and 4% for external noise.
The awareness of the label is high, and a majority of respondents had seen the label in use when purchasing tyres. However, this may be expected given the high share of stakeholder respondents and the results should therefore not be used as a general consumer opinion. 43% did not even see the label beforehand in relation to their last tyre purchase. Either they have purchased through an online shop, which is not covered by the regulation, or the physical shop simply did not have the tyre on display and had to order from stock, in which case the consumer will only see the label when receiving the tyre. A final possibility is that the dealer simply did not comply with the regulation, hence not showing the label.
The second part of the questionnaire (question 11 to 21) covered the respondents' opinion on measures and parameters which could improve the current label. Other safety parameters such as snow and ice grip were considered important to include by the respondents, but opinion was divided whether this information should be mandatory or voluntary. The emphasis on safety parameters is consistent with respondents finding the wet grip parameter the most important in the current label, oppose to environmental and economic parameters such as rolling resistance and external noise. 67% of respondents agreed that re-treaded tyres should be included in the labelling scheme, but only if a reliable methodology can be developed. Opinion was divided on whether studded tyres should be included. The possible reason is that this tyre type is not widespread throughout the EU and therefore only relevant in some countries.
Only 21% believed abrasion was an important parameter to include, the remaining respondents considered it more appropriate to regulate abrasion through other forms of regulation or only include it if accuracy of measurements can be ensured. A slight majority were against mileage being included in the label and respondents in favour emphasized the need for an accurate and economically viable testing method.
The consensus was a need to improve awareness of the label through awareness campaigns, mandatory online labelling, and labelling of OEM
tyres. To improve consumer confidence, respondents agreed on increasing market surveillance and creating a better platform for the authorities to enforce and coordinate activities. Almost all respondents were in favour of establishing a digital registration database. Another measure to improve confidence would be by introducing third-party verification of tyre test results. It was widely agreed by the respondents that this would improve confidence and should be made mandatory.
3.Detailed results
As described in the previous section, the first part of the questionnaire covers the opinion on and experience with the current tyre label used in the evaluation. The second part covers opinion on improvements and additions for a revised regulation subject to this impact assessment. Relevant comments have been selected for each theme. Full comments from all respondents are listed in the end of the annex. Comments from respondents wishing anonymity have been excluded. Questions and selected comments have been themed as follows.
3.0.Evaluation of existing tyre label
Question 7a: Are you aware of the EU labelling scheme for tyres?
Question 7b: In your opinion, is the label a helpful piece of information when deciding which tyres to buy?
Question 7c: Do you think it is a good thing that a single EU-wide label covers tyres sold in all EU countries?
Question 8: Clarity of label. The study found that some consumers did not understand the pictures on the label representing different characteristics of the label (see images below). Which, if any, of the images below do you think is difficult to understand?
Please tick the box(es) above the image(s), if difficult to understand:
|
Figure_1_-
_Fuel_efficiency_pictogram.png

|
Figure_2_-
_Wet_grip_pictogram.png

|
Figure_3_-
_External_rolling_noise_pictogram. png

|
Question 9a: When purchasing your last tyre, did you see the tyre itself beforehand?
Question 9b: Did you see the EU label?
Question 10: Relative importance of label characteristics. Which of the tyre's characteristics currently shown on the label do you consider to be the most important when purchasing a tyre?
Comments on question 10
|
Respondent ID
|
Respondent category
|
|
|
Fazilet Cinaralp
|
An organisation representing industry views
|
All three performances are key for informed decision by the consumer.
|
|
Stephan Rau
|
An organisation representing industry views
|
All three performances are key for informed decision making by the consumer.
|
|
Jos de Gier
|
An organisation representing industry views
|
Most important Wet Grip, secondly RR and less Noise. Overall, these key performances are a good basis for a well-founded buy-decision.
|
|
Christoffer Greenfort
|
An organisation representing industry views
|
Road safety performance.
|
|
Soren Larsen
|
An organisation representing industry views
|
We believe fuel efficiency, wet and winter grip and noise are important characteristics.
|
|
Martina Petkova
|
A business manufacturing or involved in the trading of tyres
|
All three performances contribute to increase the safety as well as the economic and environmental efficiency of road transport and are thus equally important. Consumers should decide based on needs.
|
|
Susanne Buchholz
|
A business manufacturing or involved in the trading of tyres
|
As in tyre development various performances need to be balanced, it is important to show at least two conflicting characteristics - e.g. fuel efficiency (environment) and wet grip (safety).
|
|
Andrew Bassett
|
A business manufacturing or involved in the trading of tyres
|
A critical parameter is absent that affects all aspects of tire performance: air retention. This parameter could be accounted for without necessarily being shown as an additional label criterion.
|
|
Hans Norén
|
Swedish Transport Agency, regulatory authority for tires (MSA)
|
Ice grip.
|
|
Schneuwly Dominique
|
A Member State regional or local government authority
|
One characteristic is only valuable if the others are visible too.
|
|
Johan Sliggers
|
A Member State government
|
It is customer choice what characteristic he finds most important. In the tyre awareness campaign in the NLs the choice is often safety (wet grip).
|
|
Marina Lukovnikova
|
A Member State government
|
We provide the answer as the authority, not as a consumer. All parameters are important, in different aspects.
|
|
Guido Gielen
|
A non-governmental organisation representing societal interests (for example, environmental or consumer interests)
|
1) Its wet grip performance; 2) wear/life and 3) price seem to be the most important considerations for many
|
|
|
Citizen/consumer (NL)
|
All three characteristics, as well as the wear factor.
|
|
|
Citizen/consumer (IT)
|
Its grip on dry surfaces, its grip on wet surfaces and its performance in terms of fuel economy.
|
General comments related to evaluation of existing tyre label
ANEC/BEUC (Consumer association): “External rolling noise performance does not deliver useful consumer information.”
FOEN (Member State regional or local government authority):“Reconsider noise pictogram (smileys? :-) / :-I / :-( , add colour?)”
3.1.Possible Improvements and additions
3.1.0.Awareness and online labelling
The following table gives an overview of the answers provided by each main stakeholder group regarding awareness raising and online labelling. Detailed answers can be seen after the summary table.
|
Respondent category
|
Summary of answers
|
|
Industry
|
Most of the respondents representing industry agree that label information should always be provided before purchase, also by businesses selling vehicles. To improve the awareness of the label they believe the most beneficial option would be to encourage Member States to run awareness campaigns and that online labelling would improve the visibility of the label.
|
|
Governmental organisations
|
Most of the respondents representing governmental organisations agree that label information should always be provided before purchase, also by businesses selling vehicles and that online labelling would improve the visibility of the label. Regarding how to improve the awareness of the label the governmental organisations have no preferred option as their answers are divided on different suggestions.
|
|
Non-governmental organisations
|
Most of the respondents representing non-governmental organisations agree that label information should always be provided before purchase, also by businesses selling vehicles. To improve the awareness of the label they believe the most beneficial option would be to encourage Member States to run awareness campaigns and that online labelling would improve the visibility of the label.
|
|
Consumers
|
Most of the consumers agree that label information should always be provided before purchase, also by businesses selling vehicles. To improve the awareness of the label they believe the most beneficial option would be to encourage Member States to run awareness campaigns and that online labelling would improve the visibility of the label.
|
Survey results:
Question 11: Information on all tyres. The study found that most people are not offered a choice of tyres when purchasing a vehicle. Do you agree that businesses selling a vehicle should always provide tyre labelling information for the tyres fitted on that vehicle, including in situations when the customer is not given a choice of tyres?
Question 12: Raising awareness. The study found that some consumers and organisations were not aware of tyre labelling or the benefits of investing in fuel-efficient tyres. Which of the following options (if any) would you like to see included in the Regulation in order to raise awareness?
Comments on question 12
|
Respondent ID
|
Respondent category
|
|
|
Bertrand Vallet
|
An organisation representing industry views
|
Microplastics release during the use phase
|
|
Soren Larsen
|
An organisation representing industry views
|
Marking 3PMSF for winter tyres, tested in accordance with UNECE R117 Annex 7. And categorise tyres in general: A, B, C...
|
|
Ines Nitsche
|
An organisation representing industry views
|
There should be no extension of the system to other types of advertising media as this would threaten the refinancing of the media and thus the editorial reporting.
|
|
Katja Heintschel von Heinegg
|
An organisation representing industry views
|
Under no circumstances should the requirement to disclose relevant environmental properties in media advertising be extended in the course of any revision of the Regulation.
|
|
Marie De Cordier
|
An organisation representing industry views
|
Raise awareness through more effective provision of information at the point of sales when the consumer is in the process of making a purchasing decision.
|
|
Martina Petkova
|
A business manufacturing or involved in the trading of tyres
|
Further encourage Member States to offer purchasing incentives for tyres of label grades A-C (rolling resistance, wet grip) and aim for such tyres in public procurement.
|
|
Andrew Bassett
|
A business manufacturing or involved in the trading of tyres
|
Label criteria should be tested under 'in-use' conditions. Most tyres in the EU don't run at optimum pressure. Consumer confidence will increase if reported performance is closer to actual performance
|
|
Johan Sliggers
|
A Member State government
|
The NLs is facilitating a campaign to raise awareness of the importance of tyres: www.kiesdebesteband.nl
|
|
Schneuwly Dominique
|
A Member State regional or local government authority
|
Reconsider information on the tyres (is everything still needed?), add and highlight label data ON tyre.
|
|
Guido Gielen
|
A non-governmental organisation representing societal interests (for example, environmental or consumer interests)
|
Tyre choice has some influence on fuel economy but tyre pressures and driver behaviour are bigger, more significant factors. Label would need to offer better consumer relevant information
|
|
Aline Maigret
|
An NGO representing societal interests (for example, environmental or consumer interests)
|
There is a need for campaigns promoting the label but also explaining the meaning of the parameters/logos (including the safety and environmental benefits) especially if new parameters are added.
|
|
Verband Österreichischer Zeitungen
|
Other
|
Awareness-raising measures are useful, but should be carried out on a private-sector basis, not by additional. Labelling rules relating to advertising media.
|
Question 13: Pre-sale provision of information. The study found that the label is often not visible to customers when they buy tyres. Which of the following options (if any) would in your opinion improve the visibility of the label to customers?
General comment related to awareness and online labelling
ANEC/BEUC (Consumer association):“There is a need for better visibility of the label, hence awareness raising campaigns are necessary.”
3.1.1.Market surveillance and third-party verification
The following table gives an overview of the answers provided by each main stakeholder group regarding market surveillance and third-party verification. Detailed can be seen after the summary table.
|
Respondent category
|
Summary of answers
|
|
Industry
|
The industry respondents are divided in terms of whether third-party verification would improve the accuracy of the information on the label and whether to introduce third-party verification as a requirement. Furthermore, they are divided on how to improve market surveillance and no preferred option for industry can be identified.
|
|
Governmental organisations
|
Most of the respondents representing a governmental organisation believe that third-party verification would improve the accuracy of the information on the label and it should be introduced as a requirement. Regarding market surveillance they believe that better sharing of results between surveillance authorities could improve market surveillance.
|
|
Non-governmental organisations
|
Most of the non-governmental organisation respondents believe that third-party verification would improve the accuracy of the information on the label and it should be introduced as a requirement. Regarding market surveillance they believe it would be beneficial if the wet grip testing is updated and the results between surveillance authorities are shared with the industry.
|
|
Consumers
|
Most of the consumers believe that third-party verification would improve the accuracy of the information on the label and it should be introduced as a requirement. Regarding market surveillance they believe that better sharing of result between surveillance authorities could improve market surveillance.
|
Survey results
Question 14a: Would you be more confident of the accuracy of the label's information if third-party verification of tyre test results were mandatory?
Question 14b: In your opinion, should third-party verification of tyre test results be introduced as a requirement?
Question 15: Market surveillance. The study found that some areas and some Member State authorities were not as good as others at checking if labels were accurate or were being shown to customers. Which of the following options (if any) would in your opinion improve market surveillance?
Comments on question 15
|
Respondent ID
|
Respondent category
|
|
|
Fazilet
Cinaralp
|
An organisation representing industry views
|
MSAs should build skills and testing capabilities to make regular, more coordinated and more visible enforcement actions through market surveillance. This market surveillance activity should involve all 28 MSAs. Meaningful penalties must be established by Member States in case of non-compliance
|
|
Stephan Rau
|
An organisation representing industry views
|
MSAs should build up skills and testing capabilities. This to make regular, more coordinated and more visible enforcement actions through market surveillance. This market surveillance activity should involve all 28 MSAs in Europe. Meaningful penalties must be established by Member States in case of non-compliance.
|
|
Jos de Gier
|
An organisation representing industry views
|
Test spread reduction of the current Wet Grip test, by modifying the test method and/or calculation method for the final result. Meaningful penalties in case of non-compliance.
|
|
Martina Petkova
|
A business manufacturing or involved in the trading of tyres
|
The further development of market surveillance capability and capacity at member state level would best support to improve market surveillance. The launch of the joint market surveillance initiative MSTyr15 is an excellent tool to enhance a high level surveillance system in Europe.
|
|
Susanne Buchholz
|
A business manufacturing or involved in the trading of tyres
|
Continental is convinced that market surveillance of label performance through regular spot check testing (not simply verification of documents) with meaningful penalties provide the most effective and efficient tool to ensure reliable labelling and a level playing field. The self-certification requirements reflect the available testing infrastructure. If only third party testing was allowed, this would create unacceptable delays/costs for the tyre industry and disadvantages also to consumers.
|
|
Johan Sliggers
|
A Member State government
|
On testing: Fuel efficiency and noise get better when tyres wear. This is not the case with wet grip. There, the braking distance increases with wear. The standard for wet grip should include a maximum detoriation for worn tyres.
On labels on each batch: every new batch need new testing and possibly a different label
On better sharing of test results: make all test data available in an uniform format on the internet.
See document Tyres in Europe for more detail.
|
|
Henk Wolfert
|
A Member State regional or local government authority
|
Maybe tests under real driving conditions could change the order of A-G labels?
|
|
Aline Maigret
|
A non-governmental organisation representing societal interests (for example, environmental or consumer interests)
|
-A centralised registration database that provides solid information to consumers in order to make an informed choice. As the Commission is setting up a database for the Energy label, the possibility of using it to tyre labelling information should be investigated.
-Non-compliant manufacturers should be fined with penalties that are dissuasive and in proportion to the damage caused to consumers and the environment. Several consumer tests have shown discrepancies with manufacturer's test results
|
|
Nerea Ruiz
|
A non-governmental organisation representing societal interests (for example, environmental or consumer interests)
|
Inclusion on the automotive database
|
|
Stephane Arditi
|
A non-governmental organisation representing societal interests (for example, environmental or consumer interests)
|
For better sharing of results, go beyond industry and make them available to all, notably by publishing on the automotive database
|
|
Laura Carvalho
|
A non-governmental organisation representing societal interests (for example, environmental or consumer interests)
|
Inclusion in the automotive database
|
|
|
Citizen/consumer (NL)
|
Does enforcement also monitor the values on the label? Perhaps EU-wide joint check and publish results (perhaps à la EURO-NCAP by a consumer organization)
|
|
|
Citizen/consumer (FI)
|
Randomly check if the claimed performance on the label matches the performance of the tyres when sold.
|
General comments related to market surveillance and third-party verification
Consumer: “[…] it was a suspicion that lower quality brands were not as diligent when obtaining data; this needs to be thoroughly audited in all companies supplying the EU.”
ETRMA (industry organisation):“Industry does not support introducing independent third party testing of the tyre performance. [Instead market surveillance should be] “Increased, more coordinated, more visible enforcement actions through market surveillance is needed.”
ANEC/BEUC (consumer association): "Market surveillance is not adequately carried out and therefore enforcement of the legislation must be improved. Sanctions must be applied in case of non-compliances.”
Goodyear (manufacturer): "[…] efforts should be dedicated to further increase awareness and market surveillance efforts. […] A highly developed market surveillance system with regular surveillance activities at Member States’ level as well as a meaningful set of penalties is important to ensure compliance with the regulation. […] third party testing might be disproportionate to the available infrastructure of testing institutes/type approval authorities’ laboratories, [and] create unacceptable delays and costs for the tyre industry […]”
FOEN (other):“Independent testing is needed in order to guarantee some degree of credibility of the label information.”
Verband der TÜV e.V. (industry association): A label based on the neutrality and competence of a third party organization would make a positive contribution to the confidence of market participants and provide the consumer with a valuable means of orientation, enabling them to compare products realistically. Therefore a system of mandatory confirmation tests such as Conformity of Production (CoP), performed by third-party laboratories, should be implemented.
3.1.2.Ice and snow grip
The following table gives an overview of the answers provided by each main stakeholder group regarding ice and snow. The detailed answers can be found after the summary table.
|
Respondent category
|
Summary of answers
|
|
Industry
|
The respondents representing industry think that information on snow and ice performance of a tyre should be included in the label, but are divided on whether it should be mandatory or voluntary.
|
|
Governmental organisations
|
The respondents representing governmental organisations think that information on snow and ice performance of a tyre should be included in the label but are divided on whether it should be mandatory or voluntary.
|
|
Non-governmental organisations
|
The respondents representing non-governmental organisations think that information on snow and ice performance of a tyre should be included in the label but are divided on whether it should be mandatory or voluntary.
|
|
Consumers
|
Consumers think that information on snow and ice performance of a tyre should be included in the label as a mandatory requirement.
|
Survey results:
Question 16: Snow and ice performance. The tyre label does not currently include information on tyres primarily designed to perform better in ice and/or snow conditions. Do you think that information on snow and ice performance of a tyre should be included in the label?
General comments related to ice and snow grip
ANEC/BEUC (consumer association):“Although good grip on icy road is one of the most important characteristic, there is no information on this in the current label. According to a study from Nokia tyres, the wet grip pictogram is misleading in Nordic countries.”
Goodyear (manufacturer):“[…] either category of winter tyres, i.e. snowflake-marked tyres, and ice tyres (with their future official marking) should be entitled to only one extra logo on the EU label. [and] should be added to the EU tyre label on a voluntary basis […]”
Solvay (“To ensure people safety (wet grip) in winter conditions, we recommend to create a Snow and Ice label”
Swedish Energy/Chemical/Transport Agencies: “Without complementary information about tyre performance under snowy and icy conditions, consumers could choose the wrong type of winter tyre. This is particularly true when consumers buy tyres on the internet without the possibility of speaking with a representative who can answer questions about the product.”
3.1.3.Studded and retreaded tyres
The following table gives an overview of the answers provided by each main stakeholder group regarding studded and retreaded tyres. Detailed answers and question phrasings can be seen after the summary table.
|
Respondent category
|
Summary of answers
|
|
Industry
|
Most respondents representing the industry suggest including retreated tyres if accuracy of the measurement methods can be ensured. Regarding studded tyres most industry respondents had no opinion.
|
|
Governmental organisations
|
Most respondents representing a governmental organisation suggest including retreated tyres if the accuracy of the measurement can be ensured, but they do not believe that studded tyres should be included.
|
|
Non-governmental organisations
|
Most respondents representing a non-governmental organisation suggest including retreated tyres if the accuracy of the measurement can be ensured but they have no opinion whether studded tyres should be included.
|
|
Consumers
|
Most consumers suggest including retreated tyres if the accuracy of the measurement can be ensured but they have no clear opinion whether studded tyres should be included.
|
Survey results:
Question 17: Re-treaded bus and truck/lorry tyres ("C3"). Currently, a label is not required for re-treaded tyres. Re-treading tyres can extend the life of used tyres by replacing worn-out tyre tread, contributing to the circular economy. The study found that there was currently no widely accepted method for measuring the fuel efficiency of re-treaded tyres. Should re-treaded tyres be included in the labelling scheme?
Question 20: Studded tyres. The study found that in countries where studded tyres are used frequently, national measures to ensure their safety and reduce their environmental impact already exist. In some EU Member States, studded tyres are banned. In addition, no method exists for comparing studded tyres to regular tyres for fuel efficiency and wet grip. Should studded tyres be included in the labelling scheme?
General comments related to studded and retreaded tyres:
City of Helsinki: “In Helsinki, 75-80% of C1 and C2 vehicles use studded tyres during winter. This has significant local environmental impacts mainly in the form of elevated noise levels and PM10 dust particles from road and tyre wear. City of Helsinki aims to mitigate the harmful effects of studded tyre use by raising awareness on the matter and providing citizens with fact-based information to help them make more environmentally friendly decisions when choosing winter tyres (non-studded winter tyres over studded tyres). Providing information on snow and ice performance, and possibly abrasion in the tyre label, as well as including studded tyres in the labelling scheme would contribute to that cause.”
3.1.4.Mileage and abrasion
The following table gives an overview of the answers provided by each main stakeholder group regarding mileage and abrasion. Detailed answers and question phrasings can be seen after the summary table.
|
Respondent category
|
Summary of answers
|
|
Industry
|
Most respondents representing the industry do not suggest including mileage information or abrasion information on the label, and there is general agreement that concerns about abrasion are more appropriately addressed through other forms of regulation.
|
|
Governmental organisations
|
Respondents representing a governmental organisation suggest including abrasion information if the accuracy of the measurement can be ensured. The governmental organisation respondents are divided regarding whether mileage information should be included on the label.
|
|
Non-governmental organisations
|
Most respondents representing a non-governmental organisation suggest including both mileage information and abrasion information on the label.
|
|
Consumers
|
The consumers answers are very divided and there is no clear opinion on information on mileage and abrasion on the label.
|
Survey results
Question 18: Mileage. Currently, tyre mileage information (the total distance that tyres can be expected to last for) is not included in the label. The study found that mileage in tyres is very difficult to test or monitor accurately. The tests that do exist are expensive and tend to be bad at measuring "real-life" mileage (that is, outside laboratory conditions). Should mileage information be included in the label?
Question 19: Abrasion and microplastics. Currently, information about abrasion (the removal of material from the tyre when it interacts with the road surface) is not included in the label. Abrasion contributes to a significant percentage of microplastics (small plastic particulates) in the ocean and to air pollution through so-called tyre road wear particles. The study found that there was currently no accurate way of measuring abrasion, and that other legislation already exists to regulate the chemical content of tyre materials. Should abrasion information be included in the label?
General comments related to mileage and abrasion
T&E (NGO): “As regards test methodology on mileage, much progress has been made at UNECE level since the Commission study on the EU Tyre Label was commissioned. […] the Real-world Driving Emissions (RDE) tests recently introduced for cars, it is possible to test tyres' durability in real world conditions and the costs will come down as the tests are more widely used.”
ETRMA (industry organisation):"ETRMA believes that the labelling scheme is by no means appropriate to address this [abrasion] complex question.”
ZERO - Associação Sistema Terrestre Sustentável (NGO):“If these [mileage and abrasion] parameters are not included in the current regulation, the Commission should now, at the very least, request that robust and representative methods are developed for these parameters.”
The European Environmental Bureau (NGO):“As regards measurement methodologies not being developed or agreed yet, a mandate should be issued asap to standardisation bodies by EC to make sure this situation will not be perpetuated and used as an argument to not take action in the future. In the meantime, transitional methods could be suggested and/or simple information provided (e.g on abrasion and microplastics).”
BDEW Bundesverband der Energie- und Wasserwirtschaft (industry organisation):“Incentives should be created to develop tires with less microplastic abrasion. With regard to microplastic abrasion, grading / differentiation in labelling would be important in order to provide the consumer with information for a purchase decision.” [Machine translated]
EurEau (industry organisation):“We would highlight that abrasion contibutes to microplastics in WATER RESOURCES, and not directly water supply. Since the tyres are an important source of microplastics emitted to the aquatic environment, the labelling scheme should include microplastics emissions during normal wear and tear as an indicator.”
3.1.5.Digital registration database
The following table gives an overview of the answers provided by each main stakeholder group regarding a digital registration database. Detailed answers can be seen after the summary table.
|
Respondent category
|
Summary of answers
|
|
Industry
|
The majority of respondents representing industry are in favour of setting up a digital registration database and providing public information about tyres to inform consumers and also provide information about tyres to make it easier for authorities to check that labels are correct.
|
|
Governmental organisations
|
All respondents representing governmental organisations suggest that a digital registration database should be set up and provide public information about tyres to inform consumers and also provide information about tyres to make it easier for authorities to check that labels are correct.
|
|
Non-governmental organisations
|
Most respondents representing a non-governmental organisation suggest that a digital registration database should be set up and provide public information about tyres to inform consumers and also provide information about tyres to make it easier for authorities to check that labels are correct.
|
|
Consumers
|
The vast majority of consumers suggest that a digital registration database should be set up and provide public information about tyres to inform consumers and also provide information about tyres to make it easier for authorities to check that labels are correct.
|
Survey results
Question 21a: Should a digital registration database providing information about tyres be set up?
Question 21b: If a digital registration database should be set up, what sort of information should it provide?
General comments related to digital registration database
ANEC/BEUC (consumer association):“The possibility of using the database currently being set up for the EU energy label should be investigated for the tyre labelling scheme.”
Goodyear (manufacturer):“[…] in light of additional management and administrative cost involved we do not deem it necessary to introduce another database at European level.“
FOEN (Swiss federal office for environment):“A public database containing data of all sold tyres is needed (for information AND controlling purpose) […]”.
3.1.6.Small and Medium Sized Enterprises (SMEs)s
General comments related to SMEs:
European Caravan Federation (industry organisation):“Motor caravans are generally built by SMEs using multi-stage builds. The tyres for the completed vehicle are provided as part of the base vehicle and not by the final stage manufacturer. Any requirements for provision of information to the consumer must therefore be carefully considered in respect of these vehicles to ensure that undue burden is not placed onto these SMEs.”
3.1.7.Advertisement
General comments related to advertisement
The Association of European Radios“AER believes that, especially when it comes to radio, advertising is not the right place to insert detailed information. It does not and cannot provide all information necessary for the final purchase decision. The consumers’ decision is based on many other sources, such as brochures and websites, and information collected at the point of sale. […] Consequently, AER calls for the status quo regarding advertising rules contained in the Tyre Labelling Regulation: i.e. no labels or terms and conditions inserted in tyre advertisements in billboards, newspapers, magazines, radio broadcasting, television and similar online formats.”
EMMA/ENPA (industry organisation):“We would in particular like to comment on the suggestion to extend technical information on tyre efficiency to advertising, specifically in magazines and newspapers. It is our view that a mandatory inclusion of such information would be inefficient and would in the process have negative effects on the value of advertising in both print media and digital media.”
ÖZV (NGO): “A widening of the requirements for compulsory information in advertisements leads to a situation that makes the advertising as a whole unattractive.” [Machine translated]
European association of television and radio sales houses (industry organisation):“[…] TV and radio advertisements [..] are not optimal platforms for conveying technical information in a meaningful way to consumers. […] the potential negative impact that mandatory information messages would have on TV and radio revenues could be significant”
Zentralverband der deutschen Werbewirtschaft (industry organisation):“[The label should be] made available to the consumer only where he / she takes note of the information in a manner relevant to the purchase decision. This does not usually take place via the media advertising […]”
3.1.8.Rescaling
General comments related to readjustment:
ETRMA (industry organisation):“It is considered premature to revise the labelling scale requirements for both wet grip and fuel efficiency, and even noise, while efforts should be dedicated to increase awareness and market surveillance efforts”
Goodyear (manufacturer):“Goodyear supports the conclusion of the Viegand Maagoe study stating that it is premature to revise the labelling scale for any of the three tyre label performances […]”
3.1.9.Testing standards
General comments related to testing standards
“The boundary conditions are too broadly defined (road test surface, temperatures, test vehicle.”, “The label says nothing about the absolute, achievable braking distances” [FIA]
ExxonMobil Petroleum & Chemical BVBA (tyre supplier):“A revised rolling resistance coefficient (RRC) standard test and rating that requires RRC average over time vs. a single data point under optimal conditions”
ETRMA (industry organisation): ETRMA is recommending introducing the new revised test method [for wet grip] at the current planned revision of the tyre label scheme.”
3.1.10.Additional suggestions
Däckbranschen Sverige AB (industry organisation):“It would be desirable to investigate the possibility of also obtaining information in the tire label regarding performance throughout the lifetime.”
Solvay Silicia“It is important to monitor how the overall tire performances (Rolling Resistance, Wet Grip, Noise) age during the tire lifecycle (e.g.: performance variation after 10 000 Km, 20 000 Km, above 30 000 Km)”.
ExxonMobil Petroleum & Chemical BVBA (tyre supplier):“A key aspect is inflation pressure loss rate (IPLR) performance. Specifying tyres with a maximum IPLR of e.g. 2% or 2.5% (which could also be progressively reduced in response to market demands and technology developments) should promote improved IPLR performance of tyres in the EU.
“The regulation should integrate a clear obligation to manufacturer (supplier) to fulfil compliance evaluation procedure, including periodical control of production.”
“The text of regulation may be improved for more clarity. Market surveillance authorities and even laboratories have sometimes difficulties to interpret the text in the same way.” [Federal Ministry of Environment]
4.In extenso comments from all respondents
“As an ex-employee of a large tyre company, I know the vast sums of money invested in getting data for these types of test & it was a suspicion that lower quality brands were not as diligent when obtaining data; this needs to be thoroughly audited in all companies supplying the EU.” [Consumer]
The European Caravan Federation (ECF) is the umbrella organisation representing the national organisations of the European Caravanning Industry. Membership of the ECF consists of 12 caravanning federations and numerous national members of the caravanning industry within the EU member states. These members are involved in the production, the sales and the use of touring caravans, motor caravans and the supply of specialist parts and services to the industry.Motor caravans are manufactured by small and medium sized manufacturers in quantities from 10 to 10.000 annually. Motor caravans are generally built by SMEs using multi-stage builds. The tyres for the completed vehicle are provided as part of the base vehicle and not by the final stage manufacturer. Any requirements for provision of information to the consumer must therefore be carefully considered in respect of these vehicles to ensure that undue burden is not placed onto these SMEs. [European Caravan Federation]
In Helsinki, 75-80% of C1 and C2 vehicles use studded tyres during winter. This has significant local environmental impacts mainly in the form of elevated noise levels and PM10 dust particles from road and tyre wear. City of Helsinki aims to mitigate the harmful effects of studded tyre use by raising awareness on the matter and providing citizens with fact-based information to help them make more environmentally friendly decisions when choosing winter tyres (non-studded winter tyres over studded tyres). Providing information on snow and ice performance, and possibly abrasion in the tyre label, as well as including studded tyres in the labelling scheme would contribute to that cause. [City of Helsinki]
As regards test methodology on mileage, much progress has been made at UNECE level since the Commission study on the EU Tyre Label was commissioned. Thus Question 18 above somewhat prejudges the answers and influences the audience by claiming that the tests are "expensive and inaccurate"; this is a subjective view. Similarly to the Real-world Driving Emissions (RDE) tests recently introduced for cars, it is possible to test tyres' durability in real world conditions and the costs will come down as the tests are more widely used. Most drivers fall within the 70-80% of all driving conditions, and so called boundary conditions to mirror the on-road use can be introduced, as was successfully done in RDE. As regards question 21 on database, synergies should be sought with the provisions on online exchange platforms agreed as part of the new Type Approval and Market Surveillance regulation - the information on tyres should be added into one common EU database on type approval of vehicles, their parts and components. [Transport & Environment]
An ice-labelling mark is very important for the Nordic market [Michelin Nordic AB]
“Although the tyre label is an important tool for consumers across Europe to take an informed decision, there is a need to review the current regulation, and to launch the impact assessment. We reiterate our position:
- the methodology used to define the energy classes of tyres must reflect real life performance, hence providing accurate and transparent information to consumers. Currently, we fear that manufacturers are often using loopholes in the methodology as well as tolerances in order to reach higher energy classes. It is misleading information for consumers. The methodology needs to be updated.
-There is a need for better visibility of the label, hence awareness raising campaigns are necessary.
-Market surveillance is not adequately carried out and therefore enforcement of the legislation must be improved. Sanctions must be applied in case of non-compliances.
-Regarding the current criteria, we believe that wet grip performance is the most important parameter because of its impact on safety. Fuel efficiency performance is important as long as there is no trade-off between rolling resistance and wet breaking because they can put conflicting demands on tyres which should be prevented. Innovation in recent years has shown that it is possible to improve wet grip and fuel efficiency simultaneously. External rolling noise performance does not deliver useful consumer information.
-The range of performance parameters on the label is too limited. The label could be extended to snow and ice grip. Although good grip on icy road is one of the most important characteristic, there is no information on this in the current label. According to a study from Nokia tyres, the wet grip pictogram is misleading in Nordic countries.
-the impact assessment should consider sustainability and that additional comprehensive tyre wear tests are needed.
- the logo representing the parameter must be tested among consumers to ensure the comprehensibility. Overall the whole label should be tested upfront through consumer survey.
- Manufacturers and dealers need to make the label available to consumers before the purchase decision (alignment with the Energy labelling Directive).
- the possibility of using the database currently being set up for the EU energy label should be investigated for the tyre labelling scheme.” [ANEC/BEUC]
For the parameters where it is indicated that measurement methods do not exist, or are not accepted/reliable, further investigation may be required. If these parameters are not included in the current regulation, the Commission should now, at the very least, request that robust and representative methods are developed for these parameters. Considering that the standardisation community might not be interested in developing those without a request (or may even not have an interest in “widely accepting” methods that are available), such a Commission request would at least attempt to avoid facing exactly the same situation when a future review or revision takes place.Additionally, consumer understanding of the label should remain a priority, and hence, we invite the Commission to have a consumer understanding assessment, as for other Energy Labels under discussion. [European Environmental Citizen's Organisation for Standardisation]
The Label aims to encourage the market uptake of energy saving products and aims to encourage the manufactures in technological development. However, the tyre particularity is safety: tyre is the only contact between the vehicle and road. Therefore it is necessary to have a safety performance presented in the EU tyre labelling. Currently it is the information on the wet grip performance of a tyre. Wet grip and ice grip are technically nearly opposite tyre performances and in Nordic winter weather conditions the ice grip is the most critical tyre performance. From this it follows that the Label may offer a wrong view compared to what Nordic citizens need and the consumer may become mislead and buy a wrong tyre for his or hers needs. In this way the winter time road traffic safety is decreased and the inapplicability of the tyre Label may question the credibility of the EU energy efficiency policy in Nordic countries. The above-mentioned, however, concerns mainly the C1 class tyres. Tyres in class C2 could be added in the scope later when such test method specification has been developed. Tyres in class C3 should be left out of the ice grip marking.Winter tyre technologies improve road traffic safety and help to decrease the number of traffic accidents. There are big differences between different types of winter tyres. EU Tyre Labelling may create a safety risk in Nordic countries’ winter time road traffic. Snow and/or ice grip markings should be added to the EU Tyre Label. According to the Article 11 of the Reg. EC/1222/2009 it is possible to amend the Regulation to add information regarding ice and/or snow performance through delegated powers of the European Commission. [Nokian Tyres Plc]
“General Comment on Market Transformation: Goodyear supports the conclusion of the Viegand Maagoe study stating that it is premature to revise the labelling scale for any of the three tyre label performances, while efforts should be dedicated to further increase awareness and market surveillance efforts. Tyre development faces a multiple set of customer-oriented performance requirements which often conflict with each other. Tyre technology has been evolving and the EU tyre label has been a driver for that. According to the report from the European Commission (COM 2017-658/final) market penetration for the best energy efficiency classes (A and B) in fuel efficiency and wet grip is still very low (<1% for all tyre types). This reflects that the current scaling system of the three performance categories is already challenging and will remain such in the foreseeable future.
Third Party Verification: A highly developed market surveillance system with regular surveillance activities at Member States’ level as well as a meaningful set of penalties is important to ensure compliance with the regulation. In this context third party testing might be disproportionate to the available infrastructure of testing institutes/type approval authorities’ laboratories, while not proven as a need from effectiveness and efficiency perspectives. If only third party was allowed, this would create unacceptable delays and costs for the tyre industry, with disadvantages also to customers and end-consumers.
Snow/Ice Performance: When an ice performance test and logo are available, either category of winter tyres, i.e. snowflake-marked tyres, and ice tyres (with their future official marking) should be entitled to only one extra logo on the EU label. This is important to ensure parity in information for users of winter tyres in the Continental part of Europe and in Scandinavia. This is the finding of a consumer survey that Goodyear conducted in 2015 on consumers’ reactions to possible winter tyre information on the official tyre label. An extra logo (either an ice performance or the existing three-peak-mountain snowflake logo) should be added to the EU tyre label on a voluntary basis, provided that tyres pass the legal thresholds for relevant performance, with official test methods.
Registration Database: Consumers already have comprehensive access to tyre label grades through various tools in the current system: physical stickers (for C1 and C2 tyres), and availability of the label grades in the digital systems of tyre manufacturers, distributors, and dealers. Market surveillance authorities already have opportunity to share information on market surveillance initiatives via the existing ICSMS tool. Therefore and in light of additional management and administrative cost involved we do not deem it necessary to introduce another database at European level.“ [Goodyear]
“Independent testing is needed in order to guarantee some degree of credibility of the label information.
A public database containing data of all independently tested tyre with results and divergences (pressure on the manufacturers).
A public database containing data of all sold tyres is needed (for information AND controlling purpose), please check “Swiss solution”, established by the TCS (www.tcs.ch): http://www.bfe.admin.ch/energieetikette/00886/04758/05701/index.html).
Label information of each tyre belongs ON that specific tyre: not all the “same” tyres really are the “same” (year or even season/week of the production, country of origin of components, tyres already mounted on new cars SERIOUSLY! vary from the “same” tyres one can purchase…).
IDEA: as manufacturer, you can “certify” your tyre if tested by an independent authority, add shiny symbol to the label.
Reconsider noise pictogram (smileys? :-) / :-I / :-( , add colour?)
Reconsider noise evaluation scheme: make it absolute, not relative to the tyre dimension. Loud is loud, e.g. >71dB. Why should a loud tyre outperform a quieter one just because it’s wider? In terms of health annoyance, this makes no sense.
Please NOTE: as long as label values cannot be trusted (aka today’s situation), it is impossible to enforce “hard” and efficient measures (e.g. tax cuts).” [FOEN]
“Criticism of the EU tire labelling:
Wet grip characteristics: Basically, it can be stated that direct mapping of EU tire label data is not or only partially possible within the ADAC tire test, although the specific test procedures (wet braking from 80 to 20 km / h) are largely similar , This means that the ranking determined in the ADAC tire test by direct comparison of several tire models under identical conditions does not or only partially corresponds to the EU tire label classification of these tires. This highlights a specific weakness of the EU tire label classification method. The manufacturer's own tests of tires for the EU tire label classification cannot be carried out under the same conditions as in the ADAC tire test. The tests are carried out at different locations on routes with different coefficients of friction and under different climatic conditions. Admitted limits are given for the friction coefficients of the roadways and the climatic conditions. Also, the properties of the test tracks were set in relation to each other by means of ring comparisons. Nevertheless, the allowed differences should be normalized by using correction factors. When comparing the ADAC tire test results with the tire label classifications, it does not always appear to be guaranteed that these corrections to the raw data can adequately compensate for the differences in the framework conditions mentioned. This applies in particular to the correction factors of temperature and road friction coefficient.
Rolling resistance / fuel efficiency: The rolling resistance and fuel efficiency data also show differences between the ADAC tire test ranking and the EU tire label classifications. However, there are sometimes significantly different measuring methods in this test point. While determining the fuel efficiency classification of the EU tire label, the rolling resistance coefficient of the test tire is determined on a certified chassis dynamometer. The ADAC directly measures the fuel consumption of the same vehicle (within one test dimension) with the different test tires under the same conditions, The tires are loaded with 50 to 60%. Regardless of these differences in measurement methods, it remains to be proposed to reduce the tire load in rolling resistance measurements from the current 80% to a more realistic 50 to 60%.” [ADAC] [Machine translated]
As a representative of the media industry, we are fundamentally critical of labelling requirements insofar as they concern advertisements. In recent years, such EU legal acts have repeatedly intervened in protected fundamental rights positions - the right to freedom of communication and the right to freedom of occupation - by compelling the advertising industry to provide compulsory information on all kinds of products. A widening of the requirements for compulsory information in advertisements leads to a situation that makes the advertising as a whole unattractive.
If the European Commission considers that there is a need for media education to promote tire labelling, this should not happen again as a result of the burdensome media industry. Even if labelling requirements in technical advertising media can make sense in order to provide interested consumers with information about the product, they must by no means be extended to classic advertising media. In our opinion, e.g. also the creation of an online database (see question 21), where all relevant information for consumers can be retrieved, an appropriate measure to relieve the provisions on compulsory disclosures.
A more fundamental, proportionate and, on top of that, strengthening the European media sector's access to awareness raising and information for citizens would also be information campaigns by the European Union or its member states on classical media channels on a private-sector basis. [Verband Österreichischer Zeitungen] [Machine translated]
“As a representative of the media industry, we are fundamentally critical of labelling requirements insofar as they concern advertisements. In recent years, such EU legal acts have repeatedly intervened in protected fundamental rights positions - the right to freedom of communication and the right to freedom of occupation - by compelling the advertising industry to provide compulsory information on all kinds of products. A widening of the requirements for compulsory information in advertisements leads to a situation that makes the advertising as a whole unattractive.
If the European Commission considers that there is a need for media education to promote tire labelling, this should not happen again as a result of the burdensome media industry. Even though labelling requirements in technical advertising media may well make sense in order to provide interested consumers with information about the product, they must by no means be extended to classic advertising media. In our opinion, e.g. also the creation of an online database (see question 21), where all relevant information for consumers can be retrieved, an appropriate measure to relieve the provisions on compulsory disclosures.
A more fundamental, proportionate and, on top of that, strengthening the European media sector's access to awareness raising and information for citizens would also be information campaigns by the European Union or its member states on classical media channels on a private-sector basis.” [Österreichischer Zeitschriften- und Fachmedienverband (ÖZV)] [Machine translated]
The evaluation and update of the Regulation on Tyre labelling is closely linked to the Regulation on General Safety (EC no 661/2009). In the Regulation on General Safety the tyre limits for fuel efficiency, wet grip and noise are set. In July 2017 the Netherlands ministry of environment sent a letter to 4 director generals of the European Commission asking to start working on strengthening of the tyre limits and interest the Commission to a number of other tyre related issues among which improving the tyre label. Q 7b: The information on the label is limited to letters and colours. One of the reasons to start an public awareness raising campaign in the Netherlands is that the label gives very little information. We propose more information on the label to encourage a discussion between people buying tyres and retail. See the background document ‘Tyres in Europe’ that was attached to the letter to the Commission for an example how this can be done. Having a label as proposed by the Netherland would almost make the campaign redundant.Q 9a/b: In the Netherlands the tyre label is mandatory both in the shops and on the internet. That is not a problem. Another thing is whether garages/workshops advise people when their car is brought for inspection/maintenance and new tyres are necessary. Then usually just a phone call is made and information on label values is not transmitted. The customer would in most cases not be informed about the tyre label of the new tyres when picking up the car.Q 16: See the background document Tyres in Europe attached to the letter to the Commission for an example how this can be done.Q 18: The Netherlands is greatly concerned about microplastics in the environment. We do favour a limit on abrasion of tyres but not on mileage. And we would like to see a proposal for that from the Commission. Yet, we are very reluctant to put anything on the tyre label. The most important argument would be that the consumer would look at any indicator regarding wear/durability/abrasion as an indicator for mileage. Tyre manufacturers could get a better label when they increase the tyre tread. And as a result the emission of microplastics would increase. See for more details the document Tyres in Europe.Q 19: See the comment to Q 18 above. An argument of a lesser importance is that the label would be more difficult to understand and to interpret. Including an indicator for snow/ice (see answer to Q16) would make five indicators on the label. A5th indicator on the tyre label would be too much information. “[Dutch Ministry of Infrastructure and Water Management]
“Tyre labelling scheme should follow the same rules as any other energy label, notably be tested on consumers to check proper understanding when being designed/reviewed.
As regards measurement methodologies not being developed or agreed yet, a mandate should be issued asap to standardisation bodies by EC to make sure this situation will not be perpetuated and used as an argument to not take action in the future. In the meantime, transitional methods could be suggested and/or simple information provided (e.g. on abrasion and microplastics).” [The European Environmental Bureau]
We need to promote these tyres more and more by means of campaigning under municipalities that could start with including this in their public procurement procedures, see also
www.better-tyres-now.eu
[DCMR EPA/EUROCITIES]
“A tyre labelling should be designed in a way allowing consumers to make a careful decision, giving incentives to tyre manufactures to improve their products and raising public awareness. In general, the information concerning safety, energy efficiency and environmental protection provided to end costumer must be more reliable. The Tyre Labelling Regulation has implemented a “self-declaration system”. Tyre manufacturers assess the performance criteria of their own products according to defined rules of testing and inform consumers about their own results. In contrary to the type approval system for tyres, using the same test procedures, there is no certification by a third party (independent verification). No evidence on competence for testing is required, e.g. accreditation as test laboratory or designation as a Technical Service. A label based on the neutrality and competence of a third party organization would make a positive contribution to the confidence of market participants and provide the consumer with a valuable means of orientation, enabling them to compare products realistically. Therefore a system of mandatory confirmation tests such as Conformity of Production (CoP), performed by third-party laboratories, should be implemented. Concerning the implementation of new procedures for the assessment of tyres we refer to the new European regulations on emissions and fuel consumption. According to these regulations “certified values” like the tyre rolling resistance coefficient are implemented to provide a more realistic label on emissions and fuel consumption of new vehicles. The tyre manufacturer may test in a laboratory of the Technical Services (TS), as defined in Article 41 of Directive 2007/46/EC, where the TS performs the testing in its own facility as referred to in paragraph 3.1. Or the tyre manufacturer may test in its own facilities under the condition that:
a.
A representative of a Technical Service designated by an approval authority is present, or
b.
The tyre manufacturer is appointed as a Technical Service of Category A in accordance with Directive 2007/46/EC Art. 41” [Verband der TÜV e.V.]
” For the parameters where it is indicated that measurement methods do not exist, or are not accepted/reliable, further investigation may be required. If these parameters are not included in the current regulation, the Commission should now, at the very least, request that robust and representative methods are developed for these parameters. Considering that the standardization community might not be interested in developing those without a request (or may even not have an interest in “widely accepting” methods that are available), such a Commission request would at least attempt to avoid facing exactly the same situation when a future review or revision takes place. Additionally, consumer understanding of the label should remain a priority, and hence, we invite the Commission to have a consumer understanding assessment, as for other Energy Labels under discussion.” [ZERO - Associação Sistema Terrestre Sustentável]
Continental welcomes the introduction of the EU Tyre Labelling Scheme as a powerful tool promoting tire design innovation that balances environmental and safety criteria and encouraging respective consumer choices. Prerequisite for a positive effect of tire labels is broad awareness and that they are well enforced, so customers consider them and can be sure that the actual tire performance meets the declared grading, when they buy a tire. Ensuring consumer awareness and understanding as well as enforcement should be the overall objectives when considering potential amendments of the Labelling Scheme.Q 14+15: Third party verification and market surveillanceContinental is convinced that market surveillance of label performance through regular spot check testing (not simply verification of documents) with meaningful penalties in case of proven non-compliance provide the most effective and efficient tool to ensure reliable labelling and a level playing field. The self-certification requirements reflect the available testing infrastructure. If only third party testing was allowed, this would create unacceptable delays and costs for the tyre industry, with disadvantages also to consumers. Continental welcomes and encourages more visible enforcement actions and an EU wide coordination of activities, e.g. the exchange of information on candidates tested among EU Member State Authorities.Q 16: Snow and Ice PerformanceHaving the option to indicate on the EU Tyre Label that the respective tyre is suitable for winter conditions, would be a valuable consumer information. This should be done by adding a respective "marking", which is based on a legally defined test (e.g. the Three-Peak-Mountain-Snowflake Symbol) to the Label. Continental does not support adding complexity to the Label through the addition snow or ice performance "grading" to the label. Q 17: Re-treaded bus, truck/ lorry tyresPrerequisite of including re-treaded C3 tyres in the EU Tyre Labelling Scheme is that it improves comparability of the performances of re-treaded and new tyres. The requirements for Label class setting of retreaded tires need to be set accordingly.Q 19: Abrasion and MicroplasticsThe contribution of tire road wear particles to microplastics in different environmental compartments is an important and complex question which the tire industry investigates with urgency. At present, many uncertainties prevail, while it is acknowledged that abrasion largely depends on external factors such as road surface and topology, driving behaviour etc. Appropriate mitigation measures need to be defined once a more robust scientific understanding has been built. [Continental Reifen Deutschland GmbH]
For the parameters where it is indicated that measurement methods do not exist, or are not accepted/reliable, further investigation may be required. If these parameters are not included in the current regulation, the Commission should now, at the very least, request that robust and representative methods are developed for these parameters. Considering that the standardization community might not be interested in developing those without a request (or may even not have an interest in “widely accepting” methods that are available), such a Commission request would at least attempt to avoid facing exactly the same situation when a future review or revision takes place. Additionally, consumer understanding of the label should remain a priority, and hence, we invite the Commission to have a consumer understanding assessment, as for other Energy Labels under discussion. [Quercus ANCN]
”The preparatory study to this consultation shows that awareness of the label has increased from 30% in 2012 to 53% in 2015 (p.27). This is significant, given that the Regulation has only applied since 2012. It is thus difficult to argue that there is an awareness deficit; a few basic steps such as informing customers even when they are not given a choice of tyres appear as simple, logical and efficient steps to further improve awareness.
Furthermore, TV and radio advertisements (by and large 30-second spots) are not optimal platforms for conveying technical information in a meaningful way to consumers. The study recognises that including labels in advertisements would present a number of obstacles as “tyres of the same model with different dimensions often have different label values” (p.76). Conversely, the potential negative impact that mandatory information messages would have on TV and radio revenues could be significant (less time available for advertising and less attractiveness for advertisers).
Hence, not only do mandatory mentions of the label in advertisements seem inefficient in terms of raising awareness, they could also have critical unintended consequences on the broadcasting industry. Technical promotional material should therefore remain the natural vehicle for information on tyre labels. We remain available to provide additional information on this matter.” [European association of television and radio sales houses]
I. Request for modification of Article 1, (2), 3, of Regulation (EU) No 1235/2011 of 29. Nov 2011, amending Regulation (EC) No 1222/2009 by:1. Cancelling the Subtrahend – 0,03 in Formula G = G(T) - 0.03, Calculation of wet grip index (G), where G(T) = wet grip index of the candidate tyre as measured in one test cycle.2. Cancelling Wet Grip Classes E and F for C1, C2 and C3 tyres in current Tyre Label table.Reason: Formula G = G(T) – 0.03 in (EU) No 1235/2011 causes wet grip class F for C3 tyres to violate, and classes E for C3, and F for C1 and C2 tyres being only 0.02 G above Type-Release with Regulation No 117 (UNECE) [2016/1350]. Required Minimum Type Release Wet Grip Index for Normal Tyres:6.2.1 Class C1, with (G) ≥ 1,16.2.2, Class C2, with (G) ≥ 0,95 6.2.3, Class C3, with (G) ≥ 0,80.Comparison of Wet Grip Class F, normal C1 Tyres,:UNECE Type Release, Wet Grip Index G, with G ≥ 1,1 (larger or equal), and correspondingEU Tyre Label, Wet Grip Index G with G ≤ 1,09 (smaller or equal).II. Request for permanent marking of the Tyre Label classification C1, C2 and C3 by each Tyre Manufacturer on their new tyres for identification. Loose paper identification is uncontrollable. [European Association for Accident Research and Analysis (EVU), Graz, Austria]
“Current marking applies only to new tires. Today there are no test methods and information about how tire properties change in wear and tear. It would be desirable to investigate the possibility of also obtaining information in the tire label regarding performance throughout the lifetime.” [Däckbranschen Sverige AB] [Machine Translated]
“In principle, the ZAW supports the objective of Regulation (EC) No. 1222/2009 (hereinafter referred to as the "Regulation") to provide consumers with environmentally relevant information on tires that enable them to make informed purchasing decisions. As correctly stated in the VO (EG 17), the time and place of the purchase decision must be taken into account. Therefore, it must be ensured that all environmentally relevant information, including any graphic prescriptions (labels), is made available to the consumer only where he / she takes note of the information in a manner relevant to the purchase decision. This does not usually take place via the media advertising, but in the course of the further information process significantly via other sources, especially brochures, test reports, information on seller or manufacturer websites and at the point of sale.
The ZAW therefore rejects compulsory information in media advertising as a means of informing and informing the purchaser of disproportionate and not expedient. Forced information in advertising significantly curtails the legitimate communication interests of the advertising economy and the need for advertising financing essential to free and independent media. Mandatory information inevitably leads to the reduction of freely designable content and thus to censorship. At the same time, this endangers the financing of the media and thus also those editorial contents that are indispensable for public opinion formation and private behavioural change on environmental and climate issues.
These correlations have been taken into account by the current regulation with its differentiated regulations on compulsory information in an appropriate manner. These are then provided at the point of sale and in technical promotional material. On the other hand, media advertising is rightfully explicitly excluded from the information obligations provided for in the regulation (see EC 18). From the point of view of the German advertising industry, this is the right way to ensure an informed purchasing decision by the consumer without jeopardizing the refinancing of the media and thus the information of the consumers through the media
This balanced information system must therefore be retained and in the future transferred to other energy labelling regimes (notably the EU Car Labelling Directive 1999/94 / EC).
In any case, in the context of a possible revision of the Regulation, the obligation to disclose environmentally relevant characteristics may be extended to media advertising. An extension to media advertising would curtail the legitimate communication interests of the advertising industry and damage the existence of advertising financing necessary for free and independent media without an informational added value for the consumers.” [Zentralverband der deutschen Werbewirtschaft] [Machine translated]
“As Solvay, a key player in silica for the tire industry, we want to emphasize 3 points:
1) To ensure people safety (wet grip) in winter conditions, we recommend to create a Snow and Ice label
2) To raise people awareness on tire labelling and performance, we suggest to improve the transparency of the tire park evolution by creating and publishing a yearly outlook of the number of tires sold with their label characteristics: Rolling Resistance at A, B or C ...level, Wet Grip at A, B or C....level, etc....
3) It is important to monitor how the overall tire performances (Rolling Resistance, Wet Grip, Noise) age during the tire lifecycle (e.g.: performance variation after 10 000 Km, 20 000 Km, above 30 000 Km)” [Solvay]
ANWB: Revision standardised measurement methodology required, because now not always covering reality e.g.- Wet grip in range +5 - +30 degr. C, range too big;- Rolling resistance measured with straight wheel camber, this is not the reality;- Only one single reference tyre;- May be tested with specially prepared test vehiclesTCS: The mobility Club tyre tests show that manufacturers' EU label declarations often significantly deviate from the real measured values. It should be noted that not only better, but also lesser tires compared to the labelled ones are commercially available.Reasons can be:- The label is a self-certification of the manufacturer and can follow a targeted marketing strategy;- Control possibilities of the label values by the authority are questionable;- The classification of summer, winter, and all-season tires is determined during measurements applying temperature windows;- A uniqueness of the label values are not always given:o Cautious vs. Optimistic interpretation of the measured values;o The boundary conditions are too broadly defined (road test surface, temperatures, test vehicle ...);o All tire dimensions are compared with a reference tire (SRTT) dimension 225/60 R16 in the test criterion wet grip. With this classification, no difference is made between different tire dimensions.o This means that (even with the same product quality) narrower tires can systematically fall into worse wet grip classes than wider ones;o The label says nothing about the absolute, achievable braking distances;o It may happen that narrower narrow tires have a shorter braking distance than better rated wide tires (when measuring on the respective tires for the tire)."That's why the EU tire label is today only use-able for the consumer within very narrow limits as purchasing orientation."Upon request from the EC the TCS test report (in German) can be made available in which TCS has compared their own proprietary tyre test results with the EU label values for the Swiss authorities [Fédération Internationale de l’Automobile (FIA Region I)]
“Under-inflated tyres can increase rolling resistance, which in turn can increase fuel consumption by up to 4% and increase CO2 and other emissions. Under-inflated tyres can also reduce tyre lifespan by up to 45%, and is the leading cause of tyre failure. Consumers are reliant on the tyre pressure monitoring system (TPMS) present within modern vehicles, instead of regularly checking and maintaining tyre pressure which would require frequent, inconvenient, intervention from the consumer. While the TPMS provides an effective indication of significant pressure loss e.g. in the case of a puncture or blowout, it does not provide an effective system for optimizing air pressure on a day-to-day basis including the gradual tyre pressure loss which occurs over time under real in-use conditions.
Tackling the issue of under-inflation at source (by maintaining optimal pressure for longer, via improved air retention of the tyre itself) would reduce the need for consumer monitoring and intervention. As tyre regulations and standards continue to progress, the goal should be to drive consistent and reliable performance and efficiency improvements over the lifetime of the tyre under real use conditions. A key aspect is inflation pressure loss rate (IPLR) performance. Specifying tyres with a maximum IPLR of e.g. 2% or 2.5% (which could also be progressively reduced in response to market demands and technology developments) should promote improved IPLR performance of tyres in the EU.
A simple and cost effective solution is already available with conventional materials, equipment and tyre building technology. Material composition of the tyre inner liner is key to IPLR performance, with increasing halo-butyl content being the most important factor. Gauge also has an effect but is only a secondary contributor. Other components such as oils, fillers and recycled scrap can also have a negative impact. It is also advisable to review the current rolling resistance test procedure (currently performed at optimum pressure) to fully assess actual in-use performance.
Under-inflation will be even more important as electrical and autonomous vehicles enter the market place. As internal combustion engines are less efficient than electric vehicles from an energy conversion standpoint, losses from rolling resistance have hitherto had less of an impact. However, hybrids and electric vehicle powertrains are more efficient and therefore tyre rolling resistance has a greater overall impact on energy use.
ExxonMobil recommends the Commission gives due consideration to:
• Tyre air retention criterion / specification within a targeted amended, or fully revised, EU Tyre Labelling Regulation
• A revised rolling resistance coefficient (RRC) standard test and rating that requires RRC average over time vs. a single data point under optimal conditions
• Providing e.g. CO2 credits for OEMs to increase the adoption of tyre technologies that can help improve in-use tyre performance” [ExxonMobil Petroleum & Chemical BVBA]
“Sweden’s recommendation on consumer information regarding tyre performance during winter conditions
The energy label for tyres should include consumer information on tyre performance during winter conditions. Such information is necessary to help the consumer choose the right type of winter tyre. Today the energy label for unstudded tyres includes information on tyre performance on wet surfaces, but does not include information about tyre performance on snowy or icy surfaces. Therefore, when Swedish consumers receive information that Central European unstudded tyres perform better than Nordic unstudded tyres in wet conditions, but receives no equivalent information on the performance of such tyres on snow or ice, such consumers may be inclined to believe that the tyres even perform better in typical Nordic winter conditions. In other words, without complementary information about tyre performance under snowy and icy conditions, such consumers could choose the wrong type of winter tyre. This is particularly true when consumers buy tyres on the internet without the possibility of speaking with a representative who can answer questions about the product.
Furthermore, consumer information should clarify that tyres that are not within the scope of the regulation, such as studded tyres, may not bear an energy label. During market surveillance, the Swedish Energy Agency observed that many studded tyres are nonetheless labelled, which could confuse the consumer.” [Swedish Energy/Chemical/Transport Agencies]
One of our main concerns it to improve knowledge about, quality and marking of winter tyres and to ensure that these tyres are used. The UNECE R117 Annex 7 Alpine symbol fulfils the requirement for winter tyres. [Nordic Logistics Association]
“The Advertising Association supports the Regulation’s objective of providing consumers with the relevant environmental information that enables them to make informed purchasing decisions.
The Regulation acknowledges that relevant information should be provided to consumers at the appropriate point during the purchase process, i.e. the time and place of the purchasing decision. Advertising is generally only the starting point of the purchase process, meaning that it is more appropriate for relevant environmental information to be provided via technical promotional material and at the point of sale. Indeed, media advertising is explicitly excluded from the information obligations set out in the Regulation (Recitals 17 and 18).
We therefore reject any extension of compulsory information requirements in media advertising as a disproportionate and inefficient measure. An independent and pluralistic media ecosystem depends on advertising. Any extension of information requirements for advertising would put the financing of the media at risk. There is only a limited amount of information that can practically be included in advertisements, and extending the requirements would result in advertisers choosing alternative ways to promote their products rather than through placing advertisements in the media.
We support the rules set out in the current Regulation as the most appropriate way to ensure a consumer makes an informed purchasing decision, without jeopardising the financing of the wider media ecosystem. This balanced system must be retained in this Regulation, and in the future should be reflected in other energy labelling regulations (notably the EU Car Labelling Directive 1999/94/EC).” [Advertising Association]
“In principle, the AIG supports the objective of Regulation (EC) No. 1222/2009 (hereinafter referred to as the "Regulation") to provide consumers with the relevant environmental information on tyres that enables them to make informed purchasing decisions.
As stated in the Regulation (recital 17), the time and place of a purchase decision must be taken into account. Relevant environmental information, including any graphic information (labels), is therefore made available to the consumer only at the appropriate point during the purchase decision process. This is usually provided through brochures, test reports, information on seller or manufacturer websites, and at the point of sale, rather than through media advertising.
AIG therefore rejects the notion of extending compulsory information requirements in media advertising (Question 12.3) as disproportionate and inexpedient. Mandatory information requirements in advertising significantly curtail the legitimate communication interests of the advertising economy through reducing advertisers’ ability to design content freely. Ultimately, this impacts the advertising revenue which is essential to supporting the free and independent media content that plays a vital role in public opinion-forming and behavioural change on environmental and climate issues.
This has been taken into account in the current Regulation, which includes differentiated requirements on the provision of mandatory information via appropriate means, i.e. this information must be provided at the point of sale and in technical promotional material but not in media advertising. Indeed, media advertising is explicitly excluded from the information obligations set out in the Regulation (recital 18).
The AIG believes this is the right way to ensure a consumer makes an informed purchasing decision without jeopardising the refinancing of the media ecosystem. This balanced system must be retained in this Regulation, and in the future transferred to other energy labelling regulations (notably the EU Car Labelling Directive 1999/94 / EC).
Under no circumstances should the requirement to disclose relevant environmental properties in media advertising be extended in the course of any revision of the Regulation. The Regulation’s objective of enabling consumers to make an informed purchase decision can and has been achieved through the current information requirements. Extending these requirements to media advertising would curtail the legitimate communication interests of the advertising industry and severely damage the financing of the media, without providing added value for consumers.” [Advertising Information Group]
“Incentives should be created to develop tires with less microplastic abrasion. With regard to microplastic abrasion, grading / differentiation in labelling would be important in order to provide the consumer with information for a purchase decision.” [BDEW Bundesverband der Energie- und Wasserwirtschaft] [Machine translated]
“1.The regulation should integrate a clear obligation to manufacturer (supplier) to fulfil compliance evaluation procedure, including periodical control of production (to ensure the declared values are still valid). Regulation does oblige the manufacturer to provide technical documentation on request (art.4), but it is not sufficient. In practice the documentation is often just compiled on request, sometimes it is just an mail, explaining how the declared values are defined. Such an approach (although compliant with an obligation "to provide" a technical documentation) does not contribute to reliability of tyre labelling.
2. The text of regulation may be improved for more clarity. Market surveillance authorities and even laboratories have sometimes difficulties to interpret the text in the same way (experience from the recent cross-border market surveillance campagne). Examples of points to ameliorate: content of technical documentation (should be more precise), verification procedure (not clear which values should be taken, corrected or not), alignment procedure (more accessible language is necessary, results of alignment readily available). Also the meaning "laboratory" should be clarified. Which laboratories are allowed to perform activities under regulation?” [Federal Ministry of Environment]
“EMMA and ENPA are happy to submit a short contribution as many European publications today include advertising from tyre manufacturers. We would in particular like to comment on the suggestion to extend technical information on tyre efficiency to advertising, specifically in magazines and newspapers. It is our view that a mandatory inclusion of such information would be inefficient and would in the process have negative effects on the value of advertising in both print media and digital media. Including technical information in advertising spots is ineffective for several reasons: there is very limited space to allow the inclusion of detailed information in an ad displayed in a publication, therefore a prominent space-consuming label would render the ad valueless for advertisers. Essentially, the purpose of advertising is to inform the consumer of the existence of the product. The moment when consumers decide to buy a product happens at a later stage in the purchase decision process, for instance in the sales room or in the online shop. Therefore it would make sense to include detailed technical information at that time in the process. In that connection the current directive imposes stringent information obligations. Nevertheless, the Review study on the Regulation (EC) No 1222/2009 on the labelling of tyres pointed to several weaknesses in terms of enforcement of the information obligation in chapter 7 and 8 (lack of clarity on the responsibility of dealers in terms of information obligations, difficulties for market surveillance authorities (MSAs) to inspect how information is provided, information not displayed in the shop itself as many of the tyres are in the stock rooms, consumers not aware of the labels etc.). Finally, if mandatory information in advertising is introduced, companies producing inefficient tyres will simply abstain from using traditional advertising methods in the press and will revert to other marketing techniques to the detriment of publishers.For all these reasons we would argue that core progress can only come from either greater consumer responsibility which can be encouraged through more awareness-raising on environmental issues (in that regard the press sector contributes to inform and educate citizens through its editorial content) and/or better enforcement of information obligations at the point of sales.” [EMMA & ENPA]
“Labelling the tires can be of great benefit to consumers. In order for this benefit to actually exist, the manufacturer's information must, however, be checked by the state, so that the labels do not endorse and often spoil the advertising of tire manufacturers! The last ADAC winter tire test showed numerous differences between tire markings and actually determined test results!” [Consumer] [Machine translated]
As tyres are characterised by a number of parameters which are interrelated, improving one parameter may have an adverse impact on others. Those issues are essential, especially when it comes to road safety and to the customer’s welfare. In that sense, AER supports the principle of helping consumers to make informed choices when purchasing tyres or a product containing tyres.
In the current Tyres Labelling Regulation No 1222/2009, obligations are imposed on the vehicles suppliers and vehicle distributors in article 6. The latter are, inter alia, responsible for providing end-users with information for each of the tyres offered. In addition, it is stressed that this information shall be at least included in the technical promotional material. An exception is however made in Recital 18 which outlines that this obligation does not include advertisement in radio broadcasting formats.
AER supports the current phrasing and calls for the European Commission to maintain it. Indeed, AER believes that, especially when it comes to radio, advertising is not the right place to insert detailed information. It does not and cannot provide all information necessary for the final purchase decision. The consumers’ decision is based on many other sources, such as brochures and websites, and information collected at the point of sale. Information is therefore much more useful to the consumer in dedicated information materiel, at the point of sale or online, when the decision to purchase is being performed.
AER questions the effectiveness of mandatory information in media in general, and especially on the radio. In the spirit of Better Regulation, AER would like to stress that the arguments set forward in this submission can be transposed to any piece of regulation dealing with advertising, especially with regard to radio: advertising is not the right place to insert detailed information. This argument is particularly relevant, considering the recently adopted Energy Labelling Regulation, where radio was singled-out and recognised as different from any other medium when it comes to terms and conditions / warning messages inserted in advertising.
AER can only answer in an efficient manner the question set forth by the public consultation with regard to advertising (question 12).
Question 12. Raising awareness. The study found that some consumers and organisations were not aware of tyre labelling or the benefits of investing in fuel efficient tyres. Which of the following options (if any) would you like to see included in the Regulation in order to raise awareness?
Whilst AER believes it is key to help consumers in making informed choices when purchasing tyres or a product containing tyres, it rejects the idea of extending the label’s display to advertising. Indeed, findings show that consumers, when searching for detailed information before making a purchase decision, do not seek such information in advertising. Information is perceived to be much more useful at a later stage than when advertising: through websites, in information brochures or at the point of sale – Information is more useful when the decision is taken to perform the purchase.
Besides, radio is a non-visual medium: warning requirements / terms and conditions (or labels) in advertising are particularly burdensome – when detailed messages are to be communicated in an advertisement, these are to be broadcasted in an added time-space to the latter. This increases the amount of time, hence the price, of the considered commercial message. In addition, needless to say, it lessens the commercial impact of the advertisement (a usual ad lasts for 15-40 seconds). These combined effects impact broadcast media, and radio in particular, and constitute factors that can deter advertisers away from using radio.
However, commercially funded radio can only broadcast programmes free of charge to millions of European citizens thanks to the revenues it collects by means of advertising – The only viable business model for radio nowadays and for a foreseeable future is broadcasting of free-to-air programmes. Advertising is the prerequisite to produce useful and attractive content, and to ensure radio is the most intimate medium. Radio listeners can thereby access for free to entertaining and informative content. In that sense, radio plays a fundamental role in today’s society: it is entrusted with many public interest obligations, and it is an essential actor of cultural diversity, media pluralism, access to creativity, social inclusion and disaster relief.
Inserting compulsory information / labels / terms and conditions in advertising, and especially radio advertising, does not only hinder commercially funded radios’ ability to produce content, it is also bound to miss its aim – informing the consumer. Consequently, AER calls for the status quo regarding advertising rules contained in the Tyre Labelling Regulation: i.e. no labels or terms and conditions inserted in tyre advertisements in billboards, newspapers, magazines, radio broadcasting, television and similar online formats.
Radios consist of a myriad of small and medium sized enterprises. Moreover, on-air broadcasting radios reach massive audience on a daily basis in all EU Member States: 80% of the EU population on average listens to radio for at least 2 or 3 hours per day, as shown by national audience measurement. Commercially-funded radios indeed constitute a unique network of small and medium-sized enterprises (SMEs), contributing to cultural diversity, media pluralism, access to creativity, social inclusion. They also offer free-to-air services of general interest:
- they evolve in highly competitive environments
- their programmes encompass, broadly speaking, all possible formats, from debates to music-only- As for the music broadcast, within one market, as soon as there is demand expressed, it has to be fulfilled; so, most of the musical expressions are represented
- most of them are non-politically affiliated, and certainly keep the freedom to express their opinion or to participate to the public expression of the opinions of their listeners
- their audiences are local, regional, or national
- they strive to develop on all possible platforms
- during natural, major or minor disasters, radio is one of the first tool to inform the
Public. Radio is the most intimate medium, and has been so for the past 50 years at least: it is indeed ubiquitous, mobile, simple-to-use and free-to-air. All these features enable our audience to cultivate a personal relationship with our programmes, our DJs, our hosts, and our brands. Our listeners thereby access programming they enjoy, and useful information. [The Association of European Radios]
“ETRMA would like to elaborate on the following specific questions from the Questionnaire:
ETRMA firmly believes that Tyre Labelling has encouraged tyre manufacturers to upgrade their products in a context of increased competition on the European market, and has offered the possibility for producers to benefit from product differentiation, based also on product performance quality.
The measure has the potential to increase informed choices in tyres by empowering consumers and fleet owners to focus more on a set of important, standardised performances when purchasing a tyre.
However, as it was demonstrated in the Viegand Study, “it is considered premature to revise the labelling scale requirements for both wet grip and fuel efficiency, and even noise, while efforts should be dedicated to increase awareness and market surveillance efforts„; ETRMA supports this analysis.
Moreover, the EU tyre industry has taken a proactive approach in reducing CO2 emissions through advanced technologies, while promoting road safety and other key performances at the same time. Because tyres are technologically complex products, tyre development faces a multiple set of customer-oriented performance requirements which often conflict with each other. It is worth mentioning that the performances rated on the tyre label are the results of complex engineering developments that consider background antagonistic factors.
Finally, ETRMA stresses the need for a holistic market study that looks at the current tyre distribution – in terms both of units and volume – at least in the top three classes for both rolling resistance and wet grip.
Specific comments:
Adaptation to technical progress – necessary revision to wet grip test method C1:
The experience accumulated so far by the Industry and by the MSAs on wet grip test method for passenger car tyres, indicates an opportunity and the need for further improving the accuracy of the method.
The tyre industry has engaged serious activities (1) to improve the reproducibility of the current C1 wet grip test method, keeping on average similar wet grip indexes values and ratings as current test procedure (to avoid gaps with the current regulatory framework); and (2) drive the global standardization (ISO) towards this improvement of reproducibility, while promoting harmonization in the different countries (especially EU / US / Japan).
ETRMA is recommending introducing the new revised test method at the current planned revision of the tyre label scheme.
(Q11): Information in Vehicle documentation:
We would like to stress the fact that information provided in the vehicle documentation need to be more accurate. Today - despite the fact that the text of the regulation is clear – the customer has no chance to make any choice. The accuracy of the information is important when the consumer buys a new vehicle and when he will replace his tyres (at least with the same grades or better). See an example below of what one vehicle manufacturer provides in the brochure when you have the option to select alternative sizes (=tyres):
(Q12): Raising Awareness
Member States should be encouraged to ensure that their Central Governments as well as local authorities are aware of the requirement to purchase tyres in the both highest fuel efficiency and safety class and to include these aspects in their tenders for service contracts in accordance with the requirements in tyre label regulation as well as in Annex III of the Energy Efficiency Directive1.
These measures are clearly requested under the Clean Vehicle Directive!
(Q13): Pre-sale provision of information
Dealers and Points of Sale must show the label to the customer for each tyre under consideration.
(Q14): Third party testing
Industry does not support introducing independent third party testing of the tyre performance:
- the testing requirements are clearly defined in the regulatory texts;
- the national authorities have familiarized with the testing requirements since the introduction of the label scheme;
- should regular market surveillance activities with meaningful penalties in case of found non-compliance be deployed, ETRMA is of the opinion that there is no need for introducing third party testing. In fact, this might be disproportionate to the available infrastructure of testing institutes/type approval authorities labs, while not proven as a need from effectiveness and efficiency perspectives. If only third party was allowed, this would create unacceptable delays and costs for the tyre industry, with disadvantaged also to consumer.
- the European tyre industry does not see any benefit and does not recommend to replace the current self-certification requirements .
The tyre industry acknowledges the need for, on the one hand, increased awareness and use of the tyre label by users and professional operators, and on the other hand continuous and effective market surveillance. In other words, there is still a large potential for the full establishment of the current label scheme on the EU market and its delivering on the original policy objectives of the tyre labelling regulation.
(Q15): Market Surveillance
Increased, more coordinated, more visible enforcement actions through market surveillance is needed. To do so, national authorities need a sound infrastructure, good organisation, appropriate legal powers, suitable facilities and skilled officers, benefiting from high quality training. Meaningful penalties must be established by Member States in case of non-compliance.
(Q19): Abrasion
The Report from the Commission to EP/Council (COM 2017-658/final) states that abrasion depends largely on external factors (i.e. tyre pressure, road surface, load, driving styles, etc.). While the European Tyre industry fully contributes to research on TRWP, ETRMA believes that the labelling scheme is by no means appropriate to address this complex question.
Furthermore, there is currently no harmonised and standardized test method. Industry has launched an ambitious programme that will require efforts and resources in the coming years, to assess the feasibility of establishing a standardized test method measuring tyre tread abrasion rate.
(Q21): Adding a requirement for suppliers and distributors to upload tyre information to a digital registration database:
ETRMA supports all initiatives that will positively influence/facilitate the consumer purchasing behaviour, while also strengthening market surveillance in a cost-effective way. The change in consumer behaviour will encourage increased innovation and research for high performing tyres, including the parameters for fuel efficiency and safety. However, it is essential that such a tool is thoroughly defined and assessed in terms of objectives, final users, workload, process, accessibility and data security, management costs, etc.[ETRMA]
From inception IA Feedback:
We welcome the long-awaited evaluation1 of Regulation (EC) No 1222/2009. In order to ensure the desired prescription success, the EU regulation, which is directly applicable in all member states, urgently needs to be supplemented and substantiated in some respects.
We therefore demand in particular:
·Inclusion of further labelling requirements for advertising material
·Specification of the information requirements at the point of sale
·Specification of concrete and ambitious tasks for the market surveillance authorities
·Introduction of reporting obligations to the EU Commission
·Commitment to fraud-proof and realistic testing procedures
Based on our own market surveillance activity, regulatory compliant tire labelling is sluggish. Market surveillance takes place only marginally. There are hardly any incentives for consumer information. At the same time, the field of application of the labelling obligations has been kept very tight so far and is significantly behind the comparable labelling regulations. We also note that the market share of fuel-efficient tires is increasing only hesitantly.
There is no doubt about the raison d'être of the regulation. Legislative requirements at EU level are necessary to achieve important Community objectives. 20% to 30% of the fuel consumption of vehicles is attributable to the tires. As the EU Commission points out in recital 4 of the Regulation, the regulation can reduce tire rolling resistance significantly in terms of energy efficiency in road transport and thus reduce pollutant emissions. Information measures are included in the EU's energy efficiency and climate change policies. Information about external rolling noise enables the inclusion of harmful traffic noise in the purchase decision. Information on wet grip is used for road safety.
According to recital 2, the regulation aims to reduce total energy consumption by 20% by 2020. This common objective of significant energy savings in the area of tires through informational measures by economic operators towards consumers is thus far missed. Nor does the Regulation, as it stands, take into account the need for effective monitoring of obligations on manufacturers, suppliers and distributors.
Specifically, we therefore consider the following remedial measures necessary:
Incorporate additional labelling requirements for promotional material to improve informed consumer choices.
A clear tire marking must be used for all advertising measures. Any tire purchased or directly offered for sale is well-perceived by the end user, clearly visible, legible, uniquely identifiable to the tire and accessible to the end user. This applies to both print advertising and advertising in electronic media. The labelling requirements for tires should be based on those for passenger cars in accordance with Directive 1999/94 / EC and Recommendation 2003/217 / EC. On websites, the marking must take place immediately at the moment when concrete tire characteristics such as advantages, price or technical features are advertised, in order to prevent the labelling from being hidden on bottom and following pages. If possible - for example when advertising on the Internet - the label should be displayed at the same time.
Complete illustration of the tire label in distance selling using remote communication means.
If consumers can purchase tires directly without first seeing them, complete information must be guaranteed. This requires, in particular, an image of the label due to its recognition value and graphic underlines to enable comparisons. Therefore, the label must be displayed clearly visible in the immediate context of the sale offer the label. The labelling requirements for advertising must also be met in the case of direct purchase opportunity.
Specification of the information requirements at the point of sale
There is a need to anchor expanded information requirements at the point of sale and exhibition to ensure informed purchasing decisions.
The marking at the point of sale and exhibition must be clearly visible, legible, clearly identifiable to the tire and accessible to the end user.
Inclusion of mandatory labelling of tires on new vehicles
Vehicle manufacturers, suppliers and / or dealers must also be held accountable in order to fully exploit savings potential at an early stage and to set incentives for energy-related improvements.
Defining concrete and ambitious tasks for market surveillance authorities to increase the efficiency of market surveillance
Authorities must be required to carry out periodic random checks on the fulfilment of legal requirements for tire marking and others. by the obligated parties in a statistically significant number. By means of supplementary laboratory tests, the content accuracy of the label must also be checked. Violations must be punished with appropriate sanctions (in particular by means of dissuasive fines). Market surveillance needs to focus on the effective enforcement of the Regulation and the removal of existing enforcement deficits. Necessarily, enforcement rules must therefore aim at a discretionary exercise aimed at improving environmental and consumer protection ("target" intending a certain behaviour rather than "can").
Introduction of annual reporting obligations to the Commission
The nature and number of their inspections must be reported by market surveillance authorities in annual reports from the EU Commission.
Fraud-proof and realistic test procedures
In view of corresponding negative experiences in the field of car type approval and the energy consumption labelling of energy-related products, we call for a review of the test procedures for fraud-proofing and realistic modelling of consumer driving behaviour. It must be ensured that the test methods for energy efficiency, wet grip and rolling noise reflect the actual consumer behaviour. Any bypasses in tests by special software or hardware or similar must be avoided by taking precautions. The test methods and standards must be able to recognize intentional or unintentional circumvention.
Introduction of a publicly accessible product database
Similar to the requirements set out in the new EU Energy Labelling Regulation, obliged parties are required to place the required product information on the tires they have made available on the market into a European product database. The database must be free and fully accessible to public authorities, consumers and consumer protection associations.[Deutsche Umwelthilfe e.V.] [Machine translated]
”BIPAVER would like to contribute with its opinion to the Ex-post evaluation of the European Tyre Labelling Scheme in regard to a possible integration of retreaded tyres.
BIPAVER, as the representation of the independent retreading industry in Europe, generally supports the European Labelling Scheme, although retreaded tyres are at the moment not part of it. The international member associations with their national members are in favour of creating a transparent and neutral tool to inform their end user and fleet customers about the ecological, environmental and safety relevant features and properties of tyres, retreaded in particular.
The EC statement that “the cheapest, cleanest, and most secure energy is the energy that is not used at all”, extend by the ecological use of resources and the prevention of unnecessary waste absolutely corresponds with the principle of tyre retreading. It is a known fact that reusing a used tyre/casing implicitly contributes importantly to the sustainability. Reuse leads directly to less waste into the environment, as well as an important reduction of raw materials. Approximately 100 litres of crude oil and 69 kg of other materials are required to manufacture an average new truck tyre, a retread only needs 30 litres of crude oil and merely 15-20 kg of materials. Therefore, the carbon footprint diminishes from 220 kg of CO2 emission to only 39 kg, also due to the need of less energy. In addition a modern quality retread delivers comparable performances to a new tyre at a fraction of its price.
That makes the retreaded tyre per definition an ecological, economical and sustainable product which should be generally supported by the EC and its member states. Taking into consideration that the “base” of a high quality retreaded tyre is a retreadable high quality casing it is also common sense to motivate new tyre manufacturers to build appropriate tyres ensuring a possible second or third life as retread instead of distribution
“cheap one-way” products. Enabling the retreaded commercial tyre to “visually” prove its capabilities by integrating into the EC’s labelling schema will promote its market acceptance and competitiveness. Therefore BIPAVER, in cooperation with ETRMA/ETRTO, proactively works to find an adequate system for the integration. With the RETRYE project, an EU co-funded analysis about the impact of retreading parameters to Rolling Resistance, Wet Grip and Noise, BIPAVER and the especially created consortium gained fundamental supporting know-how. Due to the aftermarket share of 35- 40% in Europe retreaded truck and bus tyres have an important contribution in the segment of commercial vehicles providing a huge positive impact and added value to the circular economy. The constraints of an integration are the vast diversity of possible products combinations in a retreading plant/workshop due to the combinations of tyre sizes, casings and tread pattern and the typical SME character of the independent retreading industry. Unlike a type homologated new tyre, million times produced the same way, it is the individuality of each retreaded tyre that makes it so difficult to find an appropriate labelling method. Accurate, reliable and repeatable in relation to the required label performance parameters but affordable and economically feasible for the SME retreader. Not being a threat but certainly a challenge for the complete retreading business, new tyre industry driven or independent, BIPAVER constructively participates in the solution process. Underlining the fact that the retreaded tyres, as an ecological, environment friendly and sustainable product deserves more support and attention than actually given in society and politics.
For further consultation regarding this subject we recommend the EY study about “The socio-economic impact of truck tyre retreading in Europe – The circular economy of tyres in danger”, from October 2016. The document is available as download under
http://www.etrma.org/library-2
[BIPAVER]
Annex 3: Who is affected and how?
1.Practical implications of the initiative
The revised Tyre Labelling Regulation will include the following new measures:
For tyre manufacturers:
·to re-adjust the tyre label classes for both fuel efficiency, wet grip and external rolling noise.
·to register all new tyre models placed on the market in a product registration database and at the same time make electronic versions of the label, product information sheet and technical documentation available in the database.
·to test tyres in laboratories approved under the type-approval process in the General Safety Regulation and use the results for establishing of the label performance parameters.
·on a voluntary basis to include icons for snow and ice performance on the label.
·to provide along with the label a product information sheet (as also provided for energy related products covered by the Framework Energy Labelling Regulation).
For suppliers:
·to show the label when tyres are offered for sale online.
For vehicle dealers:
·to provide the label for tyres on new vehicles offered for sale and in case of purchase through leasing contracts or as part of a fleet solution.
Member States:
·to carry out information campaigns in cooperation with European Commission.
·to give higher priority to joint enforcement actions.
The requirements described above will result in substantial benefits for citizens, society, manufacturers and wholesalers/retailers. Citizens will receive benefits in the form of saved fuel (lower fuel costs) and increased safety and health. Society will receive high benefits in terms of substantial reductions of CO2 emissions and reduced costs related to accidents and noise pollution. In addition, manufacturer and wholesalers/retailers will benefit from increased turnover and employment.
The requirements will also increase administrative burdens for manufacturers, dealers (of tyres and vehicles), Member States and the European Commission. The estimated administrative costs are described in more details below the summary tables.
2.Summary of costs and benefits
Overview of benefits total for all preferred options. All benefits are direct benefits.
|
I. Overview of Benefits (total for all provisions) – Preferred Option
|
|
Description
|
Amount
|
Comments
|
|
Reduction of CO2 emissions
|
10 MT per year in 2030
|
Society receives the benefits
|
|
Increased safety (reduction of fatalities)
|
€737 million per year in 2030
|
Society receives the benefits, but also citizens
|
|
End-user net savings
|
€2.2 billion in 2030
|
Citizens (and end-users) receive the benefits in terms of reduced fuel costs
|
|
Increased employment
|
235 673 more jobs in 2030
|
Manufacturers, wholesalers and retailers will have this benefit
|
|
Increased turnover
|
€ 8.7 billion in 2030
|
Manufacturers, wholesalers and retailers will have this benefit
|
Overview of administrative costs (all costs are direct costs) compared to baseline. Numbers are in million EUR. Where no figures are mentioned the extra cost are considered insignificant. In addition “n.a.” indicates that it has not been possible to estimate the costs.
|
II. Overview of costs – Preferred option
|
|
Options
|
Manufacturers
|
Dealers
|
Member States
|
EU/Commission
|
|
Information campaigns
|
|
|
10
(only once)
|
2
(only once)
|
|
Joint enforcement actions
|
|
|
0.02 per year
|
0.5-1 per year
|
|
Mandate to revise testing methods
|
n.a.
|
|
|
n.a.
|
|
Online labelling
|
|
|
3
(only once)
|
|
|
Labelling of tyres delivered with vehicles at all times
|
|
50 per year
|
|
|
|
Provision of label for C3 tyres
|
6 per year
|
|
|
|
|
Inclusion of snow and ice performance
|
|
|
|
|
|
Re-adjustment of the label
|
40
(only once)
|
30
(only once)
|
|
|
|
Tyre registration database
|
0.25 per year
|
|
|
0.1 (only once) and 0.01 per year
|
|
Technical documentation and product fiche content
|
120 per year
|
|
|
|
|
Amendment of current Annex V on test methods for wet grip of C1 tyres
|
|
|
|
|
|
Amendment of current Annex IVa on laboratory alignment procedure for the RRC
|
|
|
|
|
|
Extension of type approval procedure
|
0.65 per year
|
|
|
|
|
Total
|
127 per year
40 only once
|
50 per year
30 only once
|
0.02 per year
13 (only once)
|
0.5-1 (per year)
2.1 (only once)
|
3.Estimation of administrative costs
Administrative and compliance costs have been estimated for each of the measures included in the preferred option. Administrative costs are defined as “the cost incurred by enterprises, the voluntary sector, public authorities and citizens in meeting legal obligation to provide information on their action or production, either to public authorities or to private parties
”.
Information campaigns (EU/national)
It is very difficult to estimate the costs for information campaigns EU-wide. The costs will depend of the type of campaign and the possibilities for cooperation with manufacturers and dealers. In practice the costs will also depend on the available budget in the individual Member States. For this purpose, it is estimated that the average Member State cost for information campaigns will be €0.3 million corresponding to €8.4 million in EU-28 (rounded to 10 million in the table above). Member States’ costs could eventually be reduced if the Commission support this action through a funding programme.
Joint enforcement actions
This measure includes activities to foster cooperation as well as exchange of information between MSAs to extend and improve market surveillance and enforcement. The measure will require more involvement from Member States and allocation of additional resources for market surveillances and related activities. The Commission will take an increased role in the market surveillance for tyres by supporting of activities to enhance EU level cooperation. It is estimated that all Member States allocate three working days per year for market surveillance for tyres in addition to the current allocation. This will correspond to around €0.020 million per year in EU-28
. In addition the Commission will contribute with around €0.5-1 million per year.
Mandate to revise the testing method
The Commission will draft and submit a standardisation request (mandate) to initiate development of more reliable, accurate, repeatable and reproducible test methods for the tyre performance parameters on the label and development of test methods related to mileage and abrasion.
The administrative costs for drafting and submission of the mandate will primarily be on the Commission. But a wide group of interested stakeholder (including social partners, consumers, SMEs, industry associations and EU Member States) will be involved through a consultation process before the mandate is finalized. Also, the European Standardisation Organisations (ESOs) will be involved as they have the right to refuse a mandate if they do not think the standard can be produced. Even though various stakeholders are involved the working hours per stakeholder is relatively limited and no stakeholders (except the ESOs) are obliged to contribute. The costs for the mandate will appear only once and are considered as insignificant.
However, the development of the standard(s) will require a considerable amount of work in the relevant European standardisation organisations and among various stakeholders involved in European standardisation such as national standardisation bodies, Small Business Standards
(SBS), Environmental NGOs (ECOS
), consumer interest groups (ANEC
), interested manufacturers and Member States.
It is not possible to quantify the costs because the work to be carried out is not yet known in detail. The administrative burden from some of the stakeholders will be limited because their participation in the standardisation work is funded by the European Commission Union and EFTA (SBS, ECOS and ANEC). Traditionally industry plays an important role in the development of standards. However, participation in standardisation work is voluntary and no manufacturer is obliged to bear the costs. Online labelling
This measure is not expected to give rise to significant implementation costs. The costs of producing graphics and other electronic files required to convey the necessary label are already covered when complying with the existing regulation. The proposed requirement to show the label when products are offered for sale online is expected to require very little extra work for dealers. Due to the product registration database dealers will have easy access to the necessary electronic files.
For Member State MSAs, the Impact Assessment with regard to labelling of energy-related products on the Internet
estimates that there could be transitional costs to add new capabilities or to obtain shared use of services from other agencies charged with on-line market surveillance. These costs will vary by country; they are provisionally estimated at €0.1 million per Member State
corresponding to €2.8 million in EU-28 (rounded to 3 million in the table above).
Labelling of tyres delivered with vehicles at all times (new tyres on new vehicles)
Today, vehicle suppliers and dealers are only obliged to inform end-users about the tyre performance parameters of the tyre on a new vehicle for sale in case the end-user can choose between different tyres to be fitted to the new vehicle. By this measure the obligation is extended to cover all new tyres on new vehicles for sale. In addition, leasing companies will be responsible for providing the relevant tyre label information and the label itself to the lessees of new vehicles. Tyres provided with vehicles will primarily be tyres delivered as OEM tyres. There will be no extra costs for the manufacturers of OEM C1 and C2 tyres because they are already obliged to provide the label information and the label for all tyres in the scope of the regulation (there is no exemption for OEM tyres). Suppliers of C3 tyres are only obliged to provide the label information not the label itself. Therefore, the measure will result in some increased costs for the manufacturers of OEM C3 tyres
.
There will be some additional costs for vehicle dealers and leasing companies because they will be obliged to provide the end-users with the label for the tyres on the vehicle for sale or available for leasing (for new vehicles). The additional time spend for delivering of this information is considered marginal compared to the time spent delivering other information in connection with sale or leasing of vehicles. If vehicle sellers and lessors for each vehicle spend 5 minutes on the provision of the tyre label information and the label the total extra costs will be around €50 million per year
. This estimate is based on the number of OEM tyres (C1, C2 and C3) sold per year and the number of tyres per vehicle. It is not possible to divide the costs between vehicle sellers and leasing companies due to lack of data. Often the same company provides both services.
Provision of label for C3 tyres
In the TLR, the label information (information about the tyre performance parameters) should be delivered for C3 tyres but not the actual printed label. Implementation of this measure will lead to extra costs for manufacturers of C3 tyres for printing the label but not for establishment of the tyre performance parameters. The costs for printing the label are estimated to be €0.3 per tyre corresponding to around €6 million per year in EU28 (sale of C3 tyres is 18.8 million including OEM tyres). In practice C3 tyres are sold in batches of up to 10 tyres. If only one printed label is printed per batch the costs could be reduced significantly. This estimation covers both sale of replacement tyres and sale of OEM tyres. The replacement sale also includes C3 tyres provided for fleet solutions.
Snow and ice performance on the label
The obligation to show the snow performance (3-PMSF-logo) and/or ice performance on the label is voluntary, so that only tyres designed for winter conditions could bear the logos. The 3-PMSF logo is already used today on the side of the tyre thread for snow tyres that meet the minimum level of performance on snow (braking and traction) determined in the UNECE Regulation 117
. The test cost required for use of the 3-PMSF logo varies between € 6.400 – 10.000 depending and the tyre type. But because the logo is already widely used the extra costs for manufacturers are considered being low.
While safety is of a major concern for the consumers the manufacturers providing safe tyres for winter conditions should be able to pass their extra costs for application of the logo on to consumers. There will be no additional costs for the dealers.
Re-adjustment of the label
The current label is no longer accurate because of the GSR banning bottom classes and the fact that for wet grip the current label has an empty class in the middle of the A-G range.
This measure does not involve a full “rescaling” of the label as envisaged under the Energy Labelling Framework Regulation for products where the top class was overpopulated and A+, A++ and A+++ classes had to be added. It would be similar to the situation where a more stringent tier of requirements is introduced after a certain date in current energy labelling regulations. When this happens, suppliers have to print out the new label and fix it to the product. There is no requirement to change the labels on products that are already placed on the market.
The cost for manufacturers to print the new labels will be around €42 million (rounded to €40 million in the table above) for replacement sale of C1 and C2 tyres
at a cost of €0.3 to print the label
.
Tyre registration database
In the Impact Assessment accompanying the framework Energy Labelling Regulation it is estimated that the time required for suppliers to register data in the product registration database will be 2 hours per product taking into account that the manufacturers are already obliged to assemble all the required information and documentation and to make this information available to authorities on request. With around 4.000 new models
of C1, C2 and C3 tyres placed on the market per year the estimated costs for registration in the product database will be around € 0.2 million per year. For labour costs an average tariff of EU-28 of 25.4 Euro/hour
is used. Training of staff to become acquainted with the system is a one-time investment and not considered significant.
The burden for Member States’ MSAs to obtain documents is significantly reduced by this measure. The extra costs for the Commission will be low because it is already obliged to establish and maintain a database for energy related products under the Energy Labelling framework Regulation. It is foreseen that tyres will be included in this database. In the Impact Assessment accompanying the framework energy labelling regulation it is estimated that the cost of establishment of a database for 30 product groups will be €3 million in investment and € 300.000 annual in maintenance costs. It is estimated that the costs for extending the database to tyres will be 1/30 of this amount corresponding to €100.000 for establishment and €10.000 per year for maintaining the database.
Technical documentation and product fiche content
Clarification of the required content of the technical documentation will not cause additional costs because the manufacturers already have to draft technical documentation (but the content is not defined). It is considered that a clear description of the required content will make it easier for the manufacturers to compile the documentation, however the savings will not be significant. In addition, it will probably be easier for Member States to evaluate the received documentation and Member States’ costs for market surveillance could be reduced. It is however assumed that they spend the freed-up time on other market surveillance activities instead thereby contributing to higher compliance rates.
According to the current TLR manufacturers are not obliged to provide a product information sheet. If the manufacturers get an obligation for provision of a product information sheet their costs will increase. The costs are assumed to correspond to the cost of printing of an additional label i.e. €0.3 per sheet. It is assumed that the information that should be included in the product information sheet is already available. It could for instance be the fuel efficiency expressed as the measured value (only the fuel efficiency performance class is on the label). If the manufacturer provides one sheet per tyre sold the extra costs will be €116 million per year (rounded to 120 in the table above). In principle it could be enough to provide a product information sheet per batch of tyre (typically 4 tyres). In this case the additional costs could be reduced to €30 million per year.
There will be no extra costs for dealers or Member States.
Amendment of current Annex V on test methods for wet grip of C1 tyres
For C1 tyres it is proposed to change the wet grip measurement method in the TLR to ISO 23671:2015. The ISO standard to some extent builds upon the ATSM standards applied in the current TLR. In addition, a reference tyre is used to limit the variability in line with the procedure in the current methodology. Against this background assumed that there will be only minor extra testing costs related to the amendment.
However, some initial extra cost could probably be expected for some testing laboratories.
Amendment of Annex IV on laboratory alignment procedure for the measurements of Rolling Resistance Coefficient (RRC)
These measures could require some extra costs for testing laboratories to implement new testing routines and calculation methods. However, the methods have been developed in cooperation with manufacturers and testing laboratories and it is considered that the procedures are already known and could be implemented with only marginal extra costs. There will be no extra costs for Member States, dealers or the Commission.
Mandatory and independent third-party testing (testing in approved laboratories)
It is proposed that tests carried out on approved laboratories according to the type-approval process in the General safety Regulation
should also be used for energy labelling of tyres. The extra costs on manufacturers could be low because tyres must already be tested on the approved laboratories according to the type-approval process in the General safety Regulation. However, it is assumed that more tests are required per product family group to establish the tyre performance parameters with the accuracy needed for labelling. It is assumed that the manufactures must carry out additional tests for 20% of new models on the market each year. This will correspond to extra costs for the manufactures of €3.5 million per year
(rounded to €4 million in the table above).
For Member States, the use of approved testing laboratories is expected to reduce the need for verification tests. In principle few Member States are currently conducting testing, so there will be few savings, but the need to increase the market surveillance budget in Member States is less.
Annex 4: Analytical methods
The quantitative modelling in Excel files for the Impact Assessment was prepared by the external consultant, Viegand Maagøe A/S. The calculations were prepared in several Excel files with data gathered from European databases, the tyre industry, scientific articles and other studies. This Annex describes in detail the data and assumptions the models are based on.
1.General assumptions
-The development of RRC and WG are based on expected market shares of each label class in the future, which differs in each scenario.
-vehicles with C1 tyres, fleet consists of 41% diesel and 59% petrol (ACEA
, 2017)
-vehicles with C2 tyres, fleet consists of 88% diesel and 12% petrol (ACEA, 2017)
-vehicles with C3 tyres, fleet consist of 96% diesel and 4% petrol (ACEA, 2017)
-vehicles with C1 tyres are driven 13,500 km per year on average
-vehicles with C2 tyres are driven 21,000 km per year on average
-vehicles with C3 tyres are driven 57,500 km per year on average
-EU HICP (Harmonised Index of Consumer Prices) rates are used to convert all prices to 2017 fixed prices:
http://ec.europa.eu/eurostat/tgm/table.do?tab=table&init=1&language=en&pcode=tec00118&plugin=1
-Vehicle fleet data was obtained from ACEA:
http://www.acea.be/statistics/article/Report-Vehicles-in-Use
-Fuel prices were obtained from:
https://www.eea.europa.eu/data-and-maps/indicators/fuel-prices-and-taxes/assessment-7
-Road safety and accident data was obtained from:
https://ec.europa.eu/transport/road_safety/specialist/statistics_en#
-Road safety costs was obtained from:
https://ec.europa.eu/transport/road_safety/specialist/knowledge/measures/monetary_valuation_of_road_safety_en
and
http://heatco.ier.uni-stuttgart.de/HEATCO_D5.pdf
2.Information effect
The methodology to assess effect of label information on purchase behaviour is based on the article “The Impact of Sustainability Information on Consumer Decision Making”
. In that article over 40,000 online purchases were assessed, and it was found that certain types of sustainability information had a significant impact on purchase intentions. Direct users—those who intentionally sought out sustainability information—were most strongly influenced by sustainability information, with an average purchase intention rate increase of 1.15 percentage points for each point increase in overall product score, reported on a zero to ten scale. However, sustainability information had, on average, no impact on non-direct users.
-Direct users were assumed to be those finding the label parameter in question “very important” according to the 2016 consumer survey.
oFind fuel efficiency “very important”: 34%
oFind wet grip “Very important”: 62%
oFind external rolling noise “very important”: 21%
-Also, for each scenario it was considered how many already end-users the label in their purchasing decision, and only the additional influenced end-users were assumed to be impacted.
3.Stock model assumption
Sales figures were received from the industry organisation ETRMA
back to 2003 and backed up by sales data from the market research organisation GfK
. The sales data are seen in the table below.
Table 1: Tyre sales in million units
|
Sales in millions
|
2006
|
2008
|
2010
|
2012
|
2014
|
2016
|
2017
|
|
C1 replacement
|
231.46
|
224.30
|
249.72
|
226.42
|
236.60
|
248.10
|
253.31
|
|
C1 OEM
|
59.09
|
77.61
|
74.64
|
71.12
|
73.80
|
79.47
|
80.06
|
|
C2 replacement
|
25.72
|
24.92
|
27.75
|
25.16
|
26.29
|
27.57
|
28.15
|
|
C2 OEM
|
4.96
|
7.51
|
4.98
|
4.98
|
5.35
|
6.68
|
6.72
|
|
C3 replacement
|
12.76
|
11.42
|
11.56
|
9.61
|
12.19
|
13.97
|
14.88
|
|
C3 OEM
|
3.35
|
4.74
|
2.72
|
3.33
|
3.20
|
3.65
|
3.94
|
|
Total
|
337.33
|
350.50
|
371.36
|
340.62
|
357.44
|
379.44
|
387.06
|
Source: ETRMA and GfK
Average tyre lifespans were based on assumptions of the expected tyre life in km and km driven per year for each vehicle type as shown in the table below. The assumptions were primarily based on background data from the Ecodesign Impact Accounting
.
Table 2: Assumption on tyre lifespans and mileage
|
Tyre type
|
Expected life in km
|
Average distance driven per year, km
|
Average tyre lifespan, years
|
|
C1
|
56 700
|
13 500
|
4.2
|
|
C2
|
71 400
|
21 000
|
3.4
|
|
C3
|
200 000
|
57 500
|
3.5
|
Source: Ecodesign Impact Accounting background calculation model, 2017.
Further assumptions used in the stock model:
Table 3: Further assumptions made in the stock model
|
C1 share out of C1 + C2 sales
|
90%
|
|
Share of C1 OEM
|
21% of C1 replacement market
|
|
Share of C2 OEM
|
25% of C2 replacement market
|
|
Share of C3 OEM
|
25% of C3 replacement market
|
|
Number of tyres per vehicle in stock – C1 (Calculated)
|
5.7 (approx. 1/3 have two sets of tyres)
|
|
Number of tyres per vehicle in stock – C2 (Calculated)
|
4.1 (approx. 2,5% have two sets of tyres)
|
|
Number of tyres per vehicle in stock – C3 (Calculated)
|
12.7 (different number of wheels on different trucks/busses)
|
Sources: ETRMA, Ecodesign Impact Accounting
4.BAU Scenario assumptions
The following data and assumptions were used in the modelling of the current tyre labelling framework:
-The OEM performance level for RRC, WG and Noise was assumed equal to the no-label performance levels (based on 2008 Impact Assessment). I.e. only the replacement tyres are affected by the label (because very few users are actually offered a choice between different tyres when purchasing a new car, and are thus not shown the label / label values)
-2012-2017 based on real-life data from TOL (<1% difference from GfK data) giving market distributions for rolling resistance, wet grip and noise (see tables below)
-From 2004 to 2012: Linear interpolation from 2008 Impact Assessment estimated performance in 2004 to actual data in 2012.
The review study showed a low degree of market surveillance, and the few tests that have been performed show a high rate of non-compliance. The preliminary results from the MSTyr15 project
showed that the non-compliance was at the magnitude of 15%. This low compliance rate is taken into account in the BAU Scenario, and an assumption regarding the magnitude of non-compliance of two classes was made:
-15% of tyres on the market do not live up to the declared performance.
-The non-compliant tyres are on average 2 classes lower than stated on the label.
Table 4: Current label Rolling resistance market shares for C1 tyres
|
RRC class
|
A
|
B
|
C
|
E
|
F
|
G
|
Market
average
|
Market average with non-compliance
|
|
Class average
|
6.3
|
7.4
|
8.7
|
10
|
11.5
|
12.4
|
|
|
|
2012
|
0%
|
3%
|
29%
|
42%
|
24%
|
1%
|
9.92
|
10.28
|
|
2013
|
1%
|
6%
|
36%
|
39%
|
17%
|
1%
|
9.64
|
10.01
|
|
2014
|
0%
|
5%
|
36%
|
43%
|
15%
|
1%
|
9.63
|
10.00
|
|
2015
|
0%
|
5%
|
38%
|
42%
|
14%
|
0%
|
9.57
|
9.93
|
|
2016
|
0%
|
5%
|
34%
|
43%
|
17%
|
1%
|
9.68
|
10.05
|
|
2017
|
0%
|
6%
|
37%
|
42%
|
15%
|
1%
|
9.59
|
9.96
|
Source: Data from TOL (Tyres On-Line, Germany).
Table 5: Current label Rolling resistance market shares for C2 tyres
|
RRC class
|
A
|
B
|
C
|
E
|
F
|
G
|
Market
average
|
Market average with non-compliance
|
|
Class average
|
5.3
|
6.4
|
7.7
|
8.9
|
10.2
|
10.8
|
|
|
|
2012
|
0%
|
1%
|
26%
|
56%
|
15%
|
2%
|
8.80
|
9.13
|
|
2013
|
0%
|
4%
|
20%
|
44%
|
28%
|
3%
|
8.97
|
9.30
|
|
2014
|
0%
|
6%
|
25%
|
41%
|
25%
|
2%
|
8.82
|
9.15
|
|
2015
|
0%
|
5%
|
29%
|
40%
|
24%
|
1%
|
8.77
|
9.10
|
|
2016
|
0%
|
4%
|
25%
|
42%
|
27%
|
3%
|
8.92
|
9.25
|
|
2017
|
0%
|
4%
|
28%
|
41%
|
25%
|
2%
|
8.83
|
9.16
|
Source: Data from TOL (Tyres On-Line, Germany).
Table 6: Current label Rolling resistance market shares for C3 tyres
|
RRC class
|
A
|
B
|
C
|
D
|
E
|
F
|
Market
average
|
Market average with non-compliance
|
|
Class average
|
3.8
|
4.7
|
5.7
|
6.7
|
7.7
|
8.6
|
|
|
|
2012
|
2%
|
10%
|
33%
|
37%
|
16%
|
3%
|
6.07
|
6.43
|
|
2013
|
2%
|
11%
|
33%
|
37%
|
15%
|
2%
|
6.34
|
6.70
|
|
2014
|
1%
|
10%
|
36%
|
36%
|
14%
|
2%
|
6.30
|
6.66
|
|
2015
|
1%
|
7%
|
29%
|
38%
|
20%
|
5%
|
6.28
|
6.64
|
|
2016
|
1%
|
7%
|
29%
|
40%
|
18%
|
4%
|
6.54
|
6.90
|
|
2017
|
0%
|
16%
|
44%
|
26%
|
13%
|
1%
|
6.50
|
6.86
|
Source: Data from TOL (Tyres On-Line, Germany).
The rolling resistance values from 2017 to 2030 in the BAU Scenario was forecasted based on historic data on market distributions of label classes. The forecasts were made for the years 2025 and 2030, and a linear interpolation of average market values was used in between.
Table 7: Forecast of fuel efficiency label distribution in the BAU scenario for C1 tyres
|
RRC class
|
A
|
B
|
C
|
E
|
F
|
G
|
Market
average
|
Market average with non-compliance
|
|
Class average
|
5.3
|
6.4
|
7.7
|
8.9
|
10.2
|
10.8
|
|
|
|
2025
|
3%
|
11%
|
45%
|
40%
|
1%
|
0%
|
9.03
|
9.40
|
|
2030
|
3%
|
14%
|
48%
|
35%
|
0%
|
0%
|
8.90
|
9.27
|
Source: estimated based on historical development
Table 8: Forecast of fuel efficiency label distribution in the BAU scenario for C2 tyres
|
RRC class
|
A
|
B
|
C
|
E
|
F
|
G
|
Market
average
|
Market average with non-compliance
|
|
Class average
|
5.3
|
6.4
|
7.7
|
8.9
|
10.2
|
10.8
|
|
|
|
2025
|
0%
|
6%
|
40%
|
54%
|
1%
|
0%
|
8.37
|
8.70
|
|
2030
|
0%
|
6%
|
43%
|
50%
|
1%
|
0%
|
8.25
|
8.58
|
Source: estimated based on historical development
Table 9: Forecast of fuel efficiency label distribution in the BAU scenario for C3 tyres
|
RRC class
|
A
|
B
|
C
|
D
|
E
|
F
|
Market
average
|
Market average with non-compliance
|
|
Class average
|
3.8
|
4.7
|
5.7
|
6.7
|
7.7
|
8.6
|
|
|
|
2025
|
2%
|
8%
|
33%
|
54%
|
3%
|
0%
|
6.18
|
6.54
|
|
2030
|
2%
|
9%
|
34%
|
54%
|
1%
|
0%
|
6.13
|
6.49
|
Source: estimated based on historical development
The wet grip market averages and forecasts were calculated in a similar way:
Table 10: Current label Wet grip market shares for C1 tyres
|
Wet grip class
|
A
|
B
|
C
|
E
|
F
|
Market
average
|
Market average with non-compliance
|
|
Class average
|
1.6
|
1.47
|
1.32
|
1.17
|
1.04
|
|
|
|
2012
|
9%
|
24%
|
55%
|
8%
|
3%
|
1.36
|
1.32
|
|
2013
|
15%
|
31%
|
44%
|
7%
|
3%
|
1.39
|
1.35
|
|
2014
|
17%
|
31%
|
43%
|
7%
|
2%
|
1.40
|
1.35
|
|
2015
|
19%
|
33%
|
41%
|
7%
|
1%
|
1.41
|
1.36
|
|
2016
|
18%
|
31%
|
41%
|
9%
|
2%
|
1.40
|
1.35
|
|
2017
|
20%
|
32%
|
38%
|
7%
|
2%
|
1.41
|
1.36
|
Source: Data from TOL (Tyres On-Line, Germany).
Table 11: Current label Wet grip market shares for C2 tyres
|
Wet grip class
|
A
|
B
|
C
|
E
|
F
|
Market
average
|
Market average with non-compliance
|
|
Class average
|
1.45
|
1.32
|
1.17
|
1.02
|
0.9
|
|
|
|
2012
|
2%
|
29%
|
61%
|
8%
|
1%
|
1.21
|
1.16
|
|
2013
|
3%
|
27%
|
56%
|
13%
|
1%
|
1.20
|
1.15
|
|
2014
|
5%
|
31%
|
49%
|
15%
|
1%
|
1.21
|
1.16
|
|
2015
|
6%
|
32%
|
45%
|
17%
|
0%
|
1.21
|
1.16
|
|
2016
|
6%
|
30%
|
43%
|
20%
|
1%
|
1.20
|
1.16
|
|
2017
|
8%
|
34%
|
38%
|
18%
|
1%
|
1.22
|
1.17
|
Source: Data from TOL (Tyres On-Line, Germany).
Table 12: Current label Wet grip market shares for C3 tyres
|
Wet grip class
|
A
|
B
|
C
|
D
|
E
|
Market
average
|
Market average with non-compliance
|
|
Class average
|
1.3
|
1.14
|
1
|
0.85
|
0.7
|
|
|
|
2012
|
11%
|
65%
|
21%
|
3%
|
0%
|
1.12
|
1.07
|
|
2013
|
4%
|
46%
|
47%
|
2%
|
0%
|
1.07
|
1.03
|
|
2014
|
5%
|
47%
|
45%
|
3%
|
0%
|
1.08
|
1.03
|
|
2015
|
6%
|
53%
|
38%
|
3%
|
0%
|
1.09
|
1.04
|
|
2016
|
2%
|
39%
|
54%
|
4%
|
0%
|
1.06
|
1.01
|
|
2017
|
3%
|
42%
|
51%
|
4%
|
0%
|
1.06
|
1.02
|
Source: Data from TOL (Tyres On-Line, Germany).
Table 13: Forecast of wet grip label distribution in the BAU scenario for C1 tyres
|
Wet grip class
|
A
|
B
|
C
|
E
|
F
|
Market
average
|
Market average with non-compliance
|
|
Class average
|
1.6
|
1.44
|
1.3
|
1.14
|
1
|
|
|
|
2025
|
35%
|
30%
|
30%
|
4%
|
1%
|
1.44
|
1.39
|
|
2030
|
40%
|
31%
|
25%
|
3%
|
1%
|
1.46
|
1.41
|
Source: estimated based on historical development
Table 14: Forecast of wet grip label distribution in the BAU scenario for C2 tyres
|
Wet grip class
|
A
|
B
|
C
|
E
|
F
|
Market
average
|
Market average with non-compliance
|
|
Class average
|
1.45
|
1.3
|
1.14
|
1.0
|
0.9
|
|
|
|
2025
|
10%
|
45%
|
37%
|
8%
|
0%
|
1.23
|
1.19
|
|
2030
|
12%
|
47%
|
34%
|
7%
|
0%
|
1.24
|
1.20
|
Source: estimated based on historical development
Table 15: Forecast of wet grip label distribution in the BAU scenario for C3 tyres
|
Wet grip class
|
A
|
B
|
C
|
D
|
E
|
F
|
Market
average
|
Market average with non-compliance
|
|
Class average
|
1.3
|
1.14
|
1
|
0.85
|
0.7
|
0.6
|
|
|
|
2025
|
5%
|
47%
|
44%
|
4%
|
0%
|
0%
|
1.07
|
1.03
|
|
2030
|
5%
|
49%
|
42%
|
4%
|
0%
|
0%
|
1.08
|
1.04
|
Source: estimated based on historical development
The noise levels were calculated based on average measured values, and likewise forecasted to 2030 based on historical data:
Table 16: Average market noise levels in Current label scenario
|
Year
|
C1
|
C2
|
C3
|
|
2012
|
70.81
|
71.93
|
71.78
|
|
2013
|
70.67
|
71.98
|
72.19
|
|
2014
|
70.86
|
72.07
|
72.05
|
|
2015
|
70.80
|
72.03
|
71.71
|
|
2016
|
70.84
|
72.15
|
71.71
|
|
2017
|
70.73
|
71.97
|
71.69
|
Source: Data from TOL (Tyres On-Line, Germany).
Table 17: Forecast of average market noise levels in BAU scenario
|
Year
|
C1
|
C2
|
C3
|
|
2025
|
70.59
|
72.02
|
71.55
|
|
2030
|
70.50
|
72.05
|
71.46
|
Source: estimated based on historical development
5.Policy Option 2 scenario assumptions
-The same development of performance as BAU until 2017.
-Non-legislative scenario, which means the scope will not change, and hence it will only affect replacement tyres.
-Information campaigns will affect the choice only for end-users who find the parameter in question important, and who were not aware of the label beforehand. These shares were based on a consumers survey from 2016:
oNot aware of the label: 59%
§Assumed that the “aware” share go up from 41% to 60% → increase 19%.
§For replacement tyres only (OEM not included).
-OEM tyres will stay on the BAU level.
-The non-compliance will decrease slightly, to 14% (with 2 classes lower than stated on the label) due to the concerted market surveillance activities
The rolling resistance values from 2017 to 2030 in the policy option 2 scenario is the same as for the BAU scenario, however, due to the information and increased market surveillance effects, the RRC changes. The same is true for Wet grip and noise levels.
6.Policy Option 3 Scenario assumptions
Inclusion of snow and ice indicators on the label:
-Assume that including the 3-PMSF logo on the label will cause fewer and less severe accidents on snowy roads.
-Assume that the ice indicator on the label will cause fewer and less severe accidents on icy roads, since the ice grip performance of the tyre is oppositely correlated to the its wet grip performance, and this will inform customers to buy the correct tyres for the icy conditions.
Require all OEM tyres to be labelled / information to be given to the end-user:
-Assume that OEM tyres will improve in addition to the improvement of replacement tyres.
oBy 2025 they will follow the same development as replacement tyres.
Alignment with the Energy Labelling Framework Regulation (online labelling, registration database etc.):
-Assume that online labelling will affect the purchase for users buying online.
-The effect for each parameter affects those who found the parameter “very important” in the 2016 consumer survey, and who purchase online and / or would use the registration database to search for information:
oShare that would use the database to search for information: 51%
.
oExpecting to purchase online: 21%.
§Average of 21% and 51% = 36%.
-Re-adjustment of the label for wet grip and rolling resistance:
oAdding a new class “A” on top means a few percent of users will buy these improved tyres (see tables below).
-Increased market surveillance and information and extension of the type approval process:
oThe non-compliance rate will fall to 7% (from 15% in BAU).
The rolling resistance values from 2017 to 2030 in the policy option 3 scenario is based on a re-adjustment the label with a new class A on top of the scale. Furthermore, the mandatory labelling of OEM tyres means that they will reach the same performance level as replacement tyres by 2025. The forecast of rolling resistance and wet grip levels for both OEM and replacement tyres are shown in the tables below. Note that these values are then affected by the additional information requirements and the changes in non-compliance.
Table 18: Forecast of fuel efficiency label distribution in the PO3 scenario for C1 tyres
|
RRC class
|
New
|
A
|
B
|
C
|
D
|
E
|
Market
average
|
|
Class average
|
5.1
|
6.3
|
7.4
|
8.7
|
10
|
11.5
|
|
|
2025
|
1%
|
4%
|
10%
|
44%
|
40%
|
1%
|
8.99
|
|
2030
|
2%
|
4%
|
13%
|
47%
|
34%
|
0%
|
8.81
|
Source: estimated based on historical development
Table 19: Forecast of fuel efficiency label distribution in the BAU scenario for C2 tyres
|
RRC class
|
New
|
A
|
B
|
C
|
D
|
E
|
Market
average
|
|
Class average
|
4.1
|
5.3
|
6.4
|
7.7
|
8.9
|
10.2
|
|
|
2025
|
0%
|
1%
|
5%
|
39%
|
54%
|
1%
|
8.28
|
|
2030
|
0%
|
2%
|
5%
|
42%
|
50%
|
1%
|
8.21
|
Source: estimated based on historical development
Table 20: Forecast of fuel efficiency label distribution in the BAU scenario for C3 tyres
|
RRC class
|
New
|
A
|
B
|
C
|
D
|
E
|
Market
average
|
|
Class average
|
2.8
|
3.8
|
4.7
|
5.7
|
6.7
|
7.7
|
|
|
2025
|
0%
|
1%
|
8%
|
30%
|
57%
|
4%
|
6.25
|
|
2030
|
1%
|
1%
|
8%
|
32%
|
56%
|
2%
|
6.17
|
Source: estimated based on historical development
Table 21: Forecast of wet grip label distribution in the PO3scenario for C1 tyres
|
Wet grip class
|
New A
|
A
|
B
|
C
|
D
|
E
|
Market
average
|
|
Class average
|
1.71
|
1.6
|
1.44
|
1.3
|
1.14
|
1.0
|
|
|
2025
|
5%
|
34%
|
28%
|
29%
|
3%
|
1%
|
1.45
|
|
2030
|
10%
|
38%
|
29%
|
20%
|
2%
|
1%
|
1.49
|
Source: estimated based on historical development
Table 22: Forecast of wet grip label distribution in the PO3 scenario for C2 tyres
|
Wet grip class
|
New A
|
A
|
B
|
C
|
D
|
E
|
Market
average
|
|
Class average
|
1.56
|
1.45
|
1.3
|
1.14
|
1.0
|
0.85
|
|
|
2025
|
3%
|
10%
|
44%
|
36%
|
7%
|
0%
|
1.24
|
|
2030
|
6%
|
11%
|
45%
|
32%
|
6%
|
0%
|
1.26
|
Source: estimated based on historical development
Table 23: Forecast of wet grip label distribution in the PO3 scenario for C3 tyres
|
Wet grip class
|
A+
|
A
|
B
|
C
|
D
|
E
|
Market
average
|
|
Class average
|
1.41
|
1.3
|
1.14
|
1.0
|
0.85
|
0.7
|
|
|
2025
|
2%
|
5%
|
46%
|
45%
|
2%
|
0%
|
1.08
|
|
2030
|
4%
|
3%
|
51%
|
40%
|
2%
|
0%
|
1.09
|
Source: estimated based on historical development
7.Policy Option 4 scenario assumptions
Policy option 4 is a combination of policy option 2 and policy option 3, and the quantification is thus based on a model including all of the impacts form the two scenarios.
The rolling resistance values from 2017 to 2030 in the policy option 4 scenario is the same as for the policy option 2 scenario, however, due to the information and increased market surveillance effects, the RRC changes. The same is true for wet grip and noise levels.
8.Effect of Rolling resistance on fuel consumption
-Based on the calculations from the official “fuel savings calculator”
.
-Fuel savings calculator is based on measurements performed by IDIADA for the European Commission
.
-In the calculations a share of 50% urban driving and 50% non-urban driving was assumed.
The following formula correlating fuels savings (in %) and change in rolling resistance from the basis of the fuel savings calculator, and is the one used in this study:
Where RRCold in this case refers to BAU1 (actual data), RRCnew refers to BAU0 rolling resistance and K is a factor calculated by IDIADA based on actual measurements of cars driven on a test lane with different tyres. The K factor depends on the type of tyre (and thus vehicle), the share of urban and non-urban driving and whether the rolling resistance is increasing or decreasing. K-factors are shown in
Table 24
. In the scenario calculations 50/50 share of urban and non-urban driving was assumed.
Table 24: K-factors used in calculation of fuel consumption from RRC development
|
RRC development
|
Road type
|
C1
|
C2
|
C3
|
|
Increase in RRC
|
Urban
|
0.104
|
0.098
|
0.095
|
|
|
Non-urban
|
0.158
|
0.118
|
0.112
|
|
Decrease in RRC
|
Urban
|
0.145
|
0.109
|
0.106
|
|
|
Non-urban
|
0.183
|
0.125
|
0.118
|
Source: IDIADA background report on the fuel savings calculator
9.Effect of Wet grip on safety
The societal costs related to a change in tyre wet grip rating were estimated using a methodology from a 2014 study by TNO on Potentials benefits of Triple-A tyres in the Netherlands
. The general approach is shown in the figure below. It shows a relation between the grip level of the tyre, the braking distance and the resulting impact speed of an accident. The degree of personal injury (fatal, severe, slight) can be described as a function of impact speed. Consequently, the distribution between fatal, severe and slightly injured people can be translated into societal costs.
Figure 1 Methodology flow diagram

Data and assumptions
-Data was gathered through a number of sources but are all based on data from the CARE database - Community database on Accidents on the Roads in Europe. Direct sources are referenced in footnote when relevant.
-Road accident fatalities
are divided into mode of transportation:
oPassenger cars (C1 tyres)
oLorries <3.5 tons (C2 tyres)
oHeavy goods vehicles >3.5 tons (C3 tyres)
oBuses (C3 tyres)
oPedestrians and bicycles (assumed to be inflicted by vehicles)
·Number of injuries is not distributed by mode of transportation
and is therefore assumed to be the same as for fatalities. The distribution between severe and slight injuries is based on severe injuries reported in 2014
:
o10% Severely injured
o90% slightly injured
·The distribution of accidents by road type is divided into the following based on 2015 numbers
:
oUrban – 37,3%
oRural – 55,0%
oMotorway – 7,8%
oThe distribution is assumed to be the same through the whole modelling period.
·Projections of fatalities and injuries in the baseline up to 2030 are based on historic trends.
Wet grip
Wet grip refers to the capacity of a tyre to brake on a wet road. The wet grip is applicable to all tyre types (C1, C2, C3), and is determined based on the wet grip index (G) according to the A-G scale specified in
Table 25
. The value of the wet grip index should be calculated based on either the average deceleration in m/s2 or the peak brake force coefficient, which is unitless, and compared to a Standard Reference Test Tyre (SRTT).
Table 25: G limit values for wet grip scales of the three tyre types C1, C2 and C3
|
C1 tyres
|
C2 tyres
|
C3 tyres
|
|
G
|
Wet grip class
|
G
|
Wet grip class
|
G
|
Wet grip class
|
|
1,55 ≤ G
|
A
|
1,40 ≤ G
|
A
|
1,25 ≤ G
|
A
|
|
1,40 ≤G ≤ 1,54
|
B
|
1,25 ≤ G ≤ 1,39
|
B
|
1,10 ≤ G ≤ 1,24
|
B
|
|
1,25 ≤ G ≤ 1,39
|
C
|
1,10 ≤ G ≤ 1,24
|
C
|
0,95 ≤ G ≤ 1,09
|
C
|
|
Empty
|
D
|
Empty
|
D
|
0,8 ≤ G ≤ 0,94
|
D
|
|
1,10 ≤ G ≤ 1,24
|
E
|
0,95 ≤ G ≤ 1,09
|
E
|
0,65 ≤ G ≤ 0,79
|
E
|
|
G ≤ 1,09
|
F
|
G ≤ 0,94
|
F
|
G ≤ 0,64
|
F
|
Regulation 661/2009 sets out minimum wet grip requirements for C1 tyres only. For normal tyres the limit value is ≥1.1.
Braking distance
There is a clear relation between wet grip level and braking distance as seen in the table below. E.g. wet grip level F has a 55% longer braking distance than wet grip level A. To simplify the calculations a linear trend has been assumed making it possible to calculate the change in braking distance as a function of wet grip index (G). The ratio is assumed equal for all three tyre types (C1, C2, C3), but will of course vary due to different wet grip intervals.
Table 26: Braking distance for different wet grip levels compared to rating A. Assumed equal for C1, C2 and C3 tyres.
|
Tyre label
|
Increased braking distance (index A=100)
|
|
A
|
100
|
|
B
|
111
|
|
C
|
124
|
|
D
|
132
|
|
E
|
141
|
|
F
|
155
|
Impact speed
The TNO study acquired data on the average impact speed for accidents at three different road types: urban, rural and motorway as seen in the table below. This data is assumed to be the reference in the baseline scenario.
Table 27: Average initial vehicle speed and impact speed of different accident scenarios.
|
Accident scenario
|
Urban road car to car
|
Rural road car to car
|
Motorway car to car
|
|
Initial speed (km/h)
|
50
|
80
|
120
|
|
Impact speed (km/h)
|
30
|
46
|
91
|
For simplification it is assumed that a change in braking length will give an equal change in impact speed. E.g. a 10% reduction in braking length will reduce the impact speed in an accident by 10%. In reality, the relation between braking distance and impact speed will have an exponential trend and will vary depending on the initial speed.
Personal injury
The impact speed can be translated into injury risk for different levels of injuries (slight, serious, fatal) as seen in the figure below. The higher the impact speed the higher is the risk of a fatal accident.
Figure 2 Injury risk of passenger car occupants as a function of impact speed (km/h).

Based on the average accident impact speed the distribution of injury types has been calculated in the table below. This is the baseline injury distribution. Since this is a theoretic distribution it is only used to determine the relative change for the three injury types between the baseline and each scenario. When the relative change has been calculated it can be coupled with the absolute number of fatalities, seriously injured and slightly injured in the baseline.
Table 28 Baseline distribution of injury types based on average accident impact speeds for different road types.
|
Road type
|
Impact speed (km/h)
|
Fatalities
|
Serious injuries
|
Slight injuries
|
No injury
|
|
Urban
|
30
|
1.6%
|
7.1%
|
63.4%
|
27.9%
|
|
Rural
|
46
|
1.8%
|
22.7%
|
62.8%
|
12.7%
|
|
Motorway
|
91
|
23.7%
|
61.2%
|
13.8%
|
1.4%
|
Ice and snow label
It has not been possible to acquire data on the effect of ice and snow tyres compared to regular tyres on accidents. Unlike wet grip, the ice and snow labels do not include a scale, meaning there is either a constant effect or no effect with and without the labels. As for wet grip it is assumed that improved snow and ice grip only affects accident on snowy and icy roads. The share of accidents on snowy roads were in 2015 1%
. There are no data for accidents on icy roads, but it has been assumed to be of the same extent as for snowy roads, being 1%. There are no data on injury type distribution (fatal, severe, slight), impact speed or braking distance from accidents on snowy and icy roads. In the baseline these are assumed equal to those used for wet road accidents. For scenarios including the ice and snow labels the effect on fatal, severe and slight accidents are assumed equal to that of wet road accidents.
10.Societal costs
Estimations of societal costs of accidents are based on values from the 2006 HEATCO report
recommended by the Commission for monetary valuation of road safety. It includes estimates for three different injury types – fatal, severe and slight – for individual countries in the EU-25. The values vary greatly between Member States and correlates to the GDP of the Member State. The valuation of the three remaining MSs has therefore been estimated based on GDP. The modelling approach uses a weighted average cost value for each injury type covering the whole of EU-28. The number of fatalities and injuries for each MS has been used as weighting factors.
Values given in the HEATCO report are 2002 prices and have therefore been converted to the current price level based on the inflation rate (see
Table 29
).
Table 29 Societal costs based on injury types
|
Injury type
|
Societal costs thousand EUR (2017)
|
|
Fatal
|
1,673
|
|
Severe
|
251
|
|
Slight
|
19
|
11.Economy and employment
The industry turnover has been used as a measure of economic impact and used to quantify employment changes within the industry.
Turnover and employment have been divided into three sectors:
·Manufacturer
·Wholesale
·Retail
Manufacturer
Data for manufacturer turnover has been acquired from EUROSTAT
for 2012-2016 (see Table 30). Data for number of employees are from ETRMA
, which has been up scaled to EU-28 based on ETRMA’s market share.
Table 30 Turnover and employees - tyre manufacturers
|
Year
|
Turnover million EUR
|
Employees
|
Turnover/ employee EUR
|
|
2012
|
17,634
|
257,434
|
68,501
|
|
2013
|
16,800
|
258,440
|
65,007
|
|
2014
|
16,813
|
260,124
|
64,635
|
|
2015
|
16,801
|
272,018
|
61,764
|
|
2016
|
16,836
|
281,839
|
59,738
|
|
Avg.
|
16,977
|
265,971
|
63,929
|
The average turnover of 63,929 EUR/employee was fixed throughout the whole modelling period and therefore assumed to be constant. Similarly the mark-up factor relative to the retail turnover, calculated to an average of 2, is assumed to be constant through the whole modelling period.
Wholesale
It was not possible to acquire data for either turnover or employment for the tyre wholesale sector. Instead estimates on turnover are based on a suggested mark-up factor of 1.25 relative to manufacturer turnover. Number of employees is calculated based on a labour productivity of 59,241 EUR/employee
, which is an average for all industries. It is unknown if the tyre wholesale industry deviates from this.
Retail
The yearly retail turnover was estimated based on tyre prices and total sales numbers. The price of a tyre is determined by its combination of rolling resistance and wet grip category. The general trend is the higher the category the higher the price. Prices for C1, C2 and C3 tyres are seen in the following three tables. C1 and C2 prices are based on total sales numbers and total turnover for five major EU markets
giving an accurate estimate of the individual unit prices.
Some label class combinations have limited sales which were considered too small to give a representative estimate of the unit price. These have been adjusted based on linear interpolation and marked with a (*) in the tables below.
Similar data were not available for C3 tyres, which were therefore collected through an online web shop
, giving a relatively low sample size. Results should therefore be considered with caution.
Table 31 Unit price matrix - 2017 EUR – GfK data – C1 tyres. *Identified as an outlier and adjusted
|
RRC – WG
|
A
|
B
|
C
|
E
|
F
|
|
A
|
121.8
|
92.2
|
|
|
|
|
B
|
94.6
|
91.0
|
86.2
|
|
|
|
C
|
101.4
|
89.9
|
86.4
|
78.1
|
66.3
|
|
E
|
124.5
|
96.6
|
76.0
|
73.7
|
73.7*
|
|
F
|
115.0
|
107.8
|
63.0
|
70.7
|
70.7*
|
|
G
|
80.7
|
103.3
|
80.0
|
61.8
|
|
Table 32 Unit price matrix - 2017 EUR – GfK data – C2 tyres. *Identified as an outlier and adjusted
|
RRC - WG
|
A
|
B
|
C
|
E
|
F
|
|
A
|
|
|
|
|
|
|
B
|
140.6
|
126.8
|
125.4*
|
124.6*
|
123.9
|
|
C
|
119.7
|
124.4
|
106.0
|
104.5
|
117.1
|
|
E
|
112.1
|
121.5
|
94.8
|
100.4
|
70.3
|
|
F
|
116.9
|
114.5
|
95.1
|
100.5
|
100.5*
|
|
G
|
77.1
|
77.4
|
81.4*
|
85.3
|
|
Table 33 Unit price matrix - 2018 EUR – C3 tyres. *Identified as an outlier and adjusted
|
RRC - WG
|
A
|
B
|
C
|
D
|
E
|
|
A
|
581,00*
|
555,25*
|
503,72
|
|
|
|
B
|
520,50*
|
535,81
|
519,41
|
|
382,93
|
|
C
|
505,24
|
532,66
|
535,44
|
506,99
|
410,08
|
|
D
|
491,38*
|
477,60
|
529,07
|
360,48
|
368,68
|
|
E
|
|
|
546,86
|
|
|
The division of each label class is too broad to track yearly developments. Therefore, the modelling is based on the exact rolling resistance coefficient (RRC) and wet grip index for each year. Consequently, unit prices must be subdivided as well, making it possible to identify a certain unit price based on a specific combination of RRC and wet grip index. The relation between label class and RRC/WG can be seen in the tables below. It is assumed that the unit price of a specific label class corresponds to the middle of the interval (given in brackets below). To calculate a specific unit price in between label classes a linear interpolation has been applied.
Table 34 Relation between label class, rolling resistance and wet grip – C1 tyres.
|
Label Class
|
RRC
|
WG
|
|
A
|
<6.6 (6.3)
|
>1.54 (1.6)
|
|
B
|
6.6 – 7.7 (7.2)
|
1.54 – 1.40 (1.47)
|
|
C
|
7.8 – 9.0 (8.4)
|
1.39 – 1.25 (1.32)
|
|
E
|
9.1 – 10.5 (9.8)
|
1.24 – 1.10 (1.17)
|
|
F
|
10.6 – 12.0 (11.3)
|
<1.10 (1.04)
|
|
G
|
>12 (12.4)
|
|
Table 35 Relation between label class, rolling resistance and wet grip – C2 tyres
|
Label Class
|
RRC
|
WG
|
|
A
|
<5.5 (5.3)
|
>1.39 (1.45)
|
|
B
|
5.6 – 6.7 (6.2)
|
1.39 – 1.25 (1.32)
|
|
C
|
6.8 – 8.0 (7.4)
|
1.24 – 1.1 (1.17)
|
|
E
|
8.1 – 9.2 (8.7)
|
1.09 – 0.95 (1.02)
|
|
F
|
9.3 – 10.5 (9.9)
|
<0.95 (0.89)
|
|
G
|
>10.5 (10.8)
|
|
Table 36 Relation between label class, rolling resistance and wet grip – C3 tyres
|
Label Class
|
RRC
|
WG
|
|
A
|
<4.1 (3.8)
|
>1.24 (1.3)
|
|
B
|
4.1 – 5.0 (4.6)
|
1.24 – 1.1 (1.17)
|
|
C
|
5.1 – 6.0 (5.6)
|
1.09 – 0.95 (1.02)
|
|
D
|
6.1 – 7.0 (6.6)
|
0.94 – 0.8 (0.87)
|
|
E
|
7.1 – 8.0 (7.6)
|
<0.8 (0.72)
|
|
F
|
>8.0 (8.5)
|
|
The average tyre unit price for a specific year is coupled with annual sales data acquired from ETRMA giving an estimate of the turnover in the retail sector. This is done for all three tyre types C1, C2 and C3. Subsequently, it is possible to calculate market turnovers for the manufacturer and wholesale sector based on estimated mark-up factors seen in the table below. Coupled with productivity data (turnover/employee) seen in the same table, the number of employees is calculated.
Table 37 Labour productivity and mark-up factors used in the modelling
|
Sector
|
Turnover/employee EUR
|
Mark-up factors
|
|
Retail
|
25,511
|
2
|
|
Wholesale
|
59,241
|
1.25
|
|
Manufacturer
|
63,929
|
1
|
12.Label re-adjustment
12.1
Wet Grip
The current distribution of tyres in wet grip class A is 20% of all C1 tyres and 8% of all C2 tyres sold in 2017, cf.
Figure 3
. The ongoing trend from 2015-2017 is that more tyres are placed in the top 3 classes. For C3 tyres, the trend has been opposite for class A and B. The distribution of C3 tyres in class A and B has lowered from 2012-2017, while tyres in class C-F have increased.
Figure 3a/b: Wet grip label distribution for all sold tyres 2015-2017, for C1(a) and C2(b) tyres. Source: GfK
Figure 4: Wet grip label distribution for all sold C3 tyres 2015-2017. Source: TOL
12.2
Rolling Resistance / Fuel Efficiency
For C1/C2 tyres, the trend is similar to the wet grip performance development, as more products are placed in the top 3 categories. The A class is however currently almost empty.
For C3 tyres, the trend is again opposite. From 2012-2017, the market share of tyres in class D-F have increased from 39% in 2012, to 63% in 2017.
Figure 5a/b: Rolling resistance label distribution for all sold tyres 2015-2017, for C1(a) and C2(b) tyres. Source: TOL
Figure 6: Rolling resistance label distribution for all sold C3 tyres 2015-2017. Source: TOL
The wet grip and rolling resistance / Fuel efficiency are to some extent negatively correlated. This means that very few products are in class A in both categories.
Table 39
/
Table 40
shows the current distribution of the tyres with both wet grip and fuel efficiency class for C1, C2, and C3 tyres respectively. While the wet grip classes are heavily distributed in classes A-C (for C1 and C2 tyres), the fuel efficiency is more evenly spaced out.
12.3
Rolling resistance / Wet grip cross distributions
Table 38: Current distribution of Rolling Resistance (RR) and Wet Grip (WG) labels for C1 tyres sold in 2017. Source: TOL
|
|
|
Wet Grip
|
|
|
|
C1
|
A
|
B
|
C
|
D
|
E
|
F
|
G
|
sum
|
|
Rolling resistance
|
A
|
0,2%
|
0,2%
|
0%
|
0%
|
0,0%
|
0,0%
|
0%
|
0%
|
|
|
B
|
2%
|
3%
|
1,1%
|
0%
|
0,1%
|
0,1%
|
0%
|
6%
|
|
|
C
|
11%
|
13%
|
11%
|
0%
|
1%
|
0,6%
|
0%
|
37%
|
|
|
D
|
0%
|
0%
|
0%
|
0%
|
0%
|
0%
|
0%
|
0%
|
|
|
E
|
6,5%
|
13%
|
18%
|
0%
|
4%
|
0,8%
|
0%
|
41%
|
|
|
F
|
1,0%
|
4%
|
7%
|
0%
|
2%
|
0,8%
|
0%
|
15%
|
|
|
G
|
0%
|
0,1%
|
0,3%
|
0%
|
0,2%
|
0,1%
|
0%
|
1%
|
|
|
sum
|
20%
|
32%
|
38%
|
0%
|
7%
|
2%
|
0%
|
|
Table 39: Current distribution of Rolling Resistance (RR) and Wet Grip (WG) labels for C2 tyres sold in 2017. Source: TOL
|
|
|
Wet Grip
|
|
|
|
C2
|
A
|
B
|
C
|
D
|
E
|
F
|
G
|
sum
|
|
Rolling resistance
|
A
|
0,0%
|
0,0%
|
0%
|
0%
|
0,0%
|
0,0%
|
0%
|
0%
|
|
|
B
|
1%
|
2%
|
0,2%
|
0%
|
0,3%
|
0,1%
|
0%
|
4%
|
|
|
C
|
6%
|
14%
|
6%
|
0%
|
2%
|
0,1%
|
0%
|
28%
|
|
|
D
|
0%
|
0%
|
0%
|
0%
|
0%
|
0%
|
0%
|
0%
|
|
|
E
|
1,2%
|
11%
|
24%
|
0%
|
5%
|
0,2%
|
0%
|
41%
|
|
|
F
|
0,3%
|
7%
|
7%
|
0%
|
9%
|
0,5%
|
0%
|
25%
|
|
|
G
|
0%
|
0,5%
|
1,1%
|
0%
|
0,6%
|
0,0%
|
0%
|
2%
|
|
|
sum
|
8%
|
34%
|
38%
|
0%
|
18%
|
1%
|
0%
|
|
Table 40: Current distribution of Rolling Resistance (RR) and Wet Grip (WG) labels for C3 tyres sold in 2017. Source: TOL
|
|
|
Wet Grip
|
|
|
|
C3
|
A
|
B
|
C
|
D
|
E
|
F
|
G
|
sum
|
|
Rolling resistance
|
A
|
0,1%
|
0,3%
|
0%
|
0%
|
0,0%
|
0,0%
|
0%
|
1%
|
|
|
B
|
1%
|
5%
|
2,2%
|
0%
|
0,0%
|
0,0%
|
0%
|
7%
|
|
|
C
|
2%
|
17%
|
11%
|
0%
|
0%
|
0,0%
|
0%
|
29%
|
|
|
D
|
1%
|
14%
|
23%
|
1%
|
0%
|
0%
|
0%
|
40%
|
|
|
E
|
0,4%
|
5%
|
12%
|
1%
|
0%
|
0,0%
|
0%
|
18%
|
|
|
F
|
0,1%
|
1%
|
2%
|
1%
|
0%
|
0,0%
|
0%
|
4%
|
|
|
G
|
0%
|
0,0%
|
0,0%
|
0%
|
0,0%
|
0,0%
|
0%
|
0%
|
|
|
sum
|
3%
|
42%
|
51%
|
4%
|
0%
|
0%
|
0%
|
|
12.4
Noise (dB)
The noise level distributions are generally more stable than the WG/RR developments. A minor overall decrease in average noise levels at 0.03%, 0.18%, and 0.03% for C1/C2/C3 tyres respectively is seen from 2015-2017. The raw dB distributions are shown in
Figure 7
and
Figure 8
. The average values are shown in
Table 41
.
Figure 7a/b: Noise level distribution for all sold tyres 2015-2017, for C1(a) and C2(b) tyres. Source: GfK
Figure 8: Noise level distribution for all available C3 tyres 2015-2017. Source: TOL
Table 41: Average noise levels for C1-C3 tyres from 2015-2017. Source: GfK/TOL
|
Avg. Noise level
|
2015
|
2016
|
2017
|
|
C1
|
70,13
|
70,09
|
70,11
|
|
C2
|
71,64
|
71,59
|
71,51
|
|
C3
|
71,71
|
71,71
|
71,69
|
12.5
Noise (Classes)
Besides the raw noise in dB, 3 noise classes are available on the Ecolabel. The vast majority of C1+C2 tyres are in the middle category. For C3 tyres, an almost equal distribution between categories 1 and 2 exists. All tyre types have generally progressed towards lower noise emissions, which is consistent with the findings in
Table 41
. The noise level class (1-3) distribution is shown in
Figure 9
-
Figure 11
for C1, C2, and C3 tyres respectively.
Figure 9: Noise class distributions for available C1 tyres in 2016-2017. Source: TOL
Figure 10: Noise class distributions for available C2 tyres in 2016-2017. Source: TOL
Figure 11: Noise class distributions for available C3 tyres in 2016-2017. Source: TOL
13.Proposal to new label intervals
In order to ensure future relevancy, and to remove the worst performing tyres on the market, new label class intervals are proposed. New top classes are introduced for each parameter, and the worst performing class is removed entirely. All stated stage 2 requirements as per the tyre-approval regulation No. 661/2009 are used as lower boundaries if available.
As current performance testing procedures have many naturally occurring uncertainties, the class interval sizes should remain constant.
Two different scenarios are proposed; Scenario 1 will introduce a new A class and readjust the remaining classes. The interval sizes will remain as they are now. The empty D class is removed. For wet grip and rolling resistance, the new A class will follow the tendency of having a mean value with +/- ~5% as upper- and lower bounds, and with top classes having narrower bands than the lower classes. The new upper boundary is hence based on a linear extrapolation on the differences (in percentages) between the other classes
Scenario 2 will restructure the intervals to 4 classes (A-D). For C1 and C2 tyres, the current intervals are kept without introducing a new A class. The empty D class is removed, and current E and F classes are restructured to fit the tier 2 requirement in the Type Approval Regulation (TAR). For C3 tyres, the classes are redistributed dependent on the current market distribution, shown in Table 59).
13.1
Scenario 1
a.
Proposal to new Wet Grip index label intervals (Scenario 1)
For C1 and C2 tyres, the currently empty D class is removed, leaving both F and G classes empty. For C3 tyres, the current intervals are shifted one class down.
Table 42
, 43 and 44 shows the label interval shifts for C1-C3 tyres respectively, and
Table 45
and
Table
46
shows the summarized current and new WG label class intervals.
Table 42: Current and new label class intervals for wet grip in C1 tyres.
|
Current
|
|
≥1,55
|
1,54-1,40
|
1,39–1,25
|
Empty
|
1,24–1,10
|
≤1,09
|
Empty
|
|
|
|
A
|
B
|
C
|
D
|
E
|
F
|
G
|
|
|
|
|
|
|
|
|
|
|
|
New
|
A
|
B
|
C
|
D
|
E
|
F
|
G
|
C1 WG
|
|
|
≥1,68
|
1,67-1,55
|
1,54-1,40
|
1,39–1,25
|
1,24–1,10
|
Empty
|
Empty
|
|
Table 43: Current and new label class intervals for wet grip in C2 tyres
|
Current
|
|
≥1,40
|
1,39–1,25
|
1,24–1,10
|
Empty
|
1,09–0,95
|
≤0,94
|
Empty
|
|
|
|
A
|
B
|
C
|
D
|
E
|
F
|
G
|
|
|
|
|
|
|
|
|
|
|
|
New
|
A
|
B
|
C
|
D
|
E
|
F
|
G
|
C2 WG
|
|
|
≥1,53
|
1,52-1,40
|
1,39–1,25
|
1,24–1,10
|
1,09–0,95
|
Empty
|
Empty
|
|
Table 44: Current and new label class intervals for wet grip in C3 tyres
|
Current
|
|
≥1,25
|
1,24–1,10
|
1,09–0,95
|
0,94–0,80
|
0,79–0,65
|
≤0,64
|
Empty
|
|
|
|
A
|
B
|
C
|
D
|
E
|
F
|
G
|
|
|
|
|
|
|
|
|
|
|
|
New
|
A
|
B
|
C
|
D
|
E
|
F
|
G
|
C3 WG
|
|
|
≥1,38
|
1,37–1,25
|
1,24–1,10
|
1,09–0,95
|
0,94–0,80
|
0,79–0,65
|
Empty
|
|
Table 45: Current Wet grip class intervals
|
C1 tyres (Current)
|
C2 tyres (Current)
|
C3 tyres (Current)
|
|
G
|
Wet grip class
|
G
|
Wet grip class
|
G
|
Wet grip class
|
|
1,55 ≤ G
|
A
|
1,40 ≤ G
|
A
|
1,25 ≤ G
|
A
|
|
1,40 ≤ G ≤ 1,54
|
B
|
1,25 ≤ G ≤ 1,39
|
B
|
1,10 ≤ G ≤ 1,24
|
B
|
|
1,25 ≤ G ≤ 1,39
|
C
|
1,10 ≤ G ≤ 1,24
|
C
|
0,95 ≤ G ≤ 1,09
|
C
|
|
Empty
|
D
|
Empty
|
D
|
0,8 ≤ G ≤ 0,94
|
D
|
|
1,10 ≤ G ≤ 1,24
|
E
|
0,95 ≤ G ≤ 1,09
|
E
|
0,65 ≤ G ≤ 0,79
|
E
|
|
G ≤ 1,09
|
F
|
G ≤ 0,94
|
F
|
G ≤ 0,64
|
F
|
|
Empty
|
G
|
Empty
|
G
|
Empty
|
G
|
Table 46: Proposed Wet grip class intervals
|
C1 tyres (Proposed)
|
C2 tyres (Proposed)
|
C3 tyres (Proposed)
|
|
G
|
Wet grip class
|
G
|
Wet grip class
|
G
|
Wet grip class
|
|
1,68 ≤ G
|
A
|
1,53 ≤ G
|
A
|
1,38 ≤ G
|
A
|
|
1,55 ≤ G ≤ 1,67
|
B
|
1,40 ≤ G ≤ 1,52
|
B
|
1,25 ≤ G ≤ 1,37
|
B
|
|
1,40 ≤ G ≤ 1,54
|
C
|
1,25 ≤ G ≤ 1,39
|
C
|
1,10 ≤ G ≤ 1,24
|
C
|
|
1,25 ≤ G ≤ 1,39
|
D
|
1,10 ≤ G ≤ 1,24
|
D
|
0,95 ≤ G ≤ 1,09
|
D
|
|
1,10 ≤ G ≤ 1,24
|
E
|
0,95 ≤ G ≤ 1,09
|
E
|
0,80 ≤ G ≤ 0,94
|
E
|
|
Empty
|
F
|
Empty
|
F
|
0,65 ≤ G ≤ 0,79
|
F
|
|
Empty
|
G
|
Empty
|
G
|
Empty
|
G
|
b.
Proposal to new Rolling Resistance index label intervals (scenario 1)
Even though the current A classes are almost empty, redistribution is nonetheless proposed so as to ensure future relevancy. The rolling resistance redistributions follow the same trend as the wet grip classes, with the currently empty D class being removed C1 and C2 tyres and shifting the C3 tyres intervals up one class.
Table 47
to Table 49 shows the label interval shifts for C1-C3 tyres respectively, and
Table 50
and
Table 51
shows the summarized current and new label RR class intervals.
Table 47: Current and new label class intervals for rolling resistance in C1 tyres
|
Current
|
|
≤6,5
|
6,6–7,7
|
7,8–9,0
|
Empty
|
9,1–10,5
|
10,6–12,0
|
≥12,1
|
|
|
|
A
|
B
|
C
|
D
|
E
|
F
|
G
|
|
|
|
|
|
|
|
|
|
|
|
New
|
A
|
B
|
C
|
D
|
E
|
F
|
G
|
C1 RR
|
|
|
≤5,4
|
5,5–6,5
|
6,6–7,7
|
7,8–9,0
|
9,1–10,5
|
Empty
|
Empty
|
|
Table 48: Current and new label class intervals for rolling resistance in C2 tyres
|
Current
|
|
≤5,5
|
5,6–6,7
|
6,8–8,0
|
Empty
|
8,1–9,0
|
9,3–10,5
|
≥10,6
|
|
|
|
A
|
B
|
C
|
D
|
E
|
F
|
G
|
|
|
|
|
|
|
|
|
|
|
|
New
|
A
|
B
|
C
|
D
|
E
|
F
|
G
|
C2 RR
|
|
|
≤4,4
|
4,5–5,5
|
5,6–6,7
|
6,8–8,0
|
8,1–9,0
|
Empty
|
Empty
|
|
Table 49: Current and new label class intervals for rolling resistance in C3 tyres
|
Current
|
|
≤4,0
|
4,1–5,0
|
5,1–6,0
|
6,1–7,0
|
7,1–8,0
|
≥8,1
|
Empty
|
|
|
|
A
|
B
|
C
|
D
|
E
|
F
|
G
|
|
|
|
|
|
|
|
|
|
|
|
New
|
A
|
B
|
C
|
D
|
E
|
F
|
G
|
C3 RR
|
|
|
≤3,1
|
3,2–4,0
|
4,1–5,0
|
5,1–6,0
|
6,1–6,5
|
Empty
|
Empty
|
|
Table 50: Current rolling resistance class intervals
|
C1 tyres (current)
|
C2 tyres (current)
|
C3 tyres (current)
|
|
RRC in kg/t
|
Energy efficiency class
|
RRC in kg/t
|
Energy efficiency class
|
RRC in kg/t
|
Energy efficiency class
|
|
RRC ≤ 6,5
|
A
|
RRC ≤ 5,5
|
A
|
RRC ≤ 4,0
|
A
|
|
6,6 ≤RRC ≤ 7,7
|
B
|
5,6 ≤RRC ≤ 6,7
|
B
|
4,1 ≤RRC ≤ 5,0
|
B
|
|
7,8 ≤RRC ≤ 9,0
|
C
|
6,8 ≤RRC ≤ 8,0
|
C
|
5,1 ≤RRC ≤ 6,0
|
C
|
|
Empty
|
D
|
Empty
|
D
|
6,1 ≤RRC ≤ 7,0
|
D
|
|
9,1 ≤RRC ≤ 10,5
|
E
|
8,1 ≤RRC ≤ 9,2
|
E
|
7,1 ≤RRC ≤ 8,0
|
E
|
|
10,6 ≤RRC ≤ 12,0
|
F
|
9,3 ≤RRC ≤ 10,5
|
F
|
RRC ≥ 8,1
|
F
|
|
RRC ≥ 12,1
|
G
|
RRC ≥ 10,6
|
G
|
Empty
|
G
|
Table 51: Proposed rolling resistance class intervals
|
C1 tyres (proposed)
|
C2 tyres (proposed)
|
C3 tyres (proposed)
|
|
RRC in kg/t
|
Energy efficiency class
|
RRC in kg/t
|
Energy efficiency class
|
RRC in kg/t
|
Energy efficiency class
|
|
RRC ≤ 5,4
|
A
|
RRC ≤ 4,4
|
A
|
RRC ≤ 3,1
|
A
|
|
5,5 ≤RRC ≤ 6,5
|
B
|
4,5 ≤RRC ≤ 5,5
|
B
|
3,2 ≤RRC ≤ 4,0
|
B
|
|
6,6 ≤RRC ≤ 7,7
|
C
|
5,6 ≤RRC ≤ 6,7
|
C
|
4,1 ≤RRC ≤ 5,0
|
C
|
|
7,8 ≤RRC ≤ 9,0
|
D
|
6,8 ≤RRC ≤ 8,0
|
D
|
5,1 ≤RRC ≤ 6,0
|
D
|
|
9,1 ≤RRC ≤ 10,5
|
E
|
8,1 ≤RRC ≤ 9,0
|
E
|
6,1 ≤RRC ≤ 6,5
|
E
|
|
Empty
|
F
|
Empty
|
F
|
Empty
|
F
|
|
Empty
|
G
|
Empty
|
G
|
Empty
|
G
|
Table 52: Current and 'Scenario 1' - proposed distribution of wet grip and rolling resistance of C1/C2/C3 tyres. Source: GfK and TOL
For C1:
|
|
Current
|
Wet Grip
|
|
|
RR/WG
|
A
|
B
|
C
|
D
|
E
|
F
|
G
|
sum
|
|
Rolling resistance
|
A
|
0,2%
|
0,2%
|
0%
|
0%
|
0,0%
|
0,0%
|
0%
|
0%
|
|
|
B
|
2%
|
3%
|
1,1%
|
0%
|
0,1%
|
0,1%
|
0%
|
6%
|
|
|
C
|
11%
|
13%
|
11%
|
0%
|
1%
|
0,6%
|
0%
|
37%
|
|
|
D
|
0%
|
0%
|
0%
|
0%
|
0%
|
0%
|
0%
|
0%
|
|
|
E
|
6,5%
|
13%
|
18%
|
0%
|
4%
|
0,8%
|
0%
|
41%
|
|
|
F
|
1,0%
|
4%
|
7%
|
0%
|
2%
|
0,8%
|
0%
|
15%
|
|
|
G
|
0%
|
0,1%
|
0,3%
|
0%
|
0,2%
|
0,1%
|
0%
|
1%
|
|
|
sum
|
20%
|
32%
|
38%
|
0%
|
7%
|
2%
|
0%
|
|
|
|
Proposed (S1)
|
Wet Grip
|
|
|
RR/WG
|
A
|
B
|
C
|
D
|
E
|
F
|
G
|
sum
|
|
Rolling resistance
|
A
|
0%
|
0,2%
|
0%
|
0%
|
0,0%
|
0,0%
|
0%
|
0%
|
|
|
B
|
0%
|
2%
|
2,7%
|
1%
|
0,1%
|
0,0%
|
0%
|
6%
|
|
|
C
|
0%
|
11%
|
13%
|
11%
|
1%
|
0,0%
|
0%
|
36%
|
|
|
D
|
0%
|
0%
|
0%
|
0%
|
0%
|
0%
|
0%
|
0%
|
|
|
E
|
0%
|
6%
|
13%
|
18%
|
4%
|
0,0%
|
0%
|
41%
|
|
|
F
|
0%
|
1%
|
4%
|
7%
|
2%
|
0,0%
|
0%
|
14%
|
|
|
G
|
0%
|
0,0%
|
0,1%
|
0%
|
0,2%
|
0,0%
|
0%
|
1%
|
|
|
sum
|
0%
|
20%
|
32%
|
38%
|
7%
|
0%
|
0%
|
|
For C2:
|
|
Current
|
Wet Grip
|
|
|
|
RR / WG
|
A
|
B
|
C
|
D
|
E
|
F
|
G
|
sum
|
|
Rolling Resistance
|
A
|
0,0%
|
0,0%
|
0%
|
0%
|
0,0%
|
0,0%
|
0%
|
0%
|
|
|
B
|
1%
|
2%
|
0,2%
|
0%
|
0,3%
|
0,1%
|
0%
|
4%
|
|
|
C
|
6%
|
14%
|
6%
|
0%
|
2%
|
0,1%
|
0%
|
28%
|
|
|
D
|
0%
|
0%
|
0%
|
0%
|
0%
|
0%
|
0%
|
0%
|
|
|
E
|
1,2%
|
11%
|
24%
|
0%
|
5%
|
0,2%
|
0%
|
41%
|
|
|
F
|
0,3%
|
7%
|
7%
|
0%
|
9%
|
0,5%
|
0%
|
25%
|
|
|
G
|
0%
|
0,5%
|
1,1%
|
0%
|
0,6%
|
0,0%
|
0%
|
2%
|
|
|
sum
|
8%
|
34%
|
38%
|
0%
|
18%
|
1%
|
0%
|
|
|
|
Proposed (S1)
|
Wet Grip
|
|
|
|
RR / WG
|
A
|
B
|
C
|
D
|
E
|
F
|
G
|
sum
|
|
Rolling Resistance
|
A
|
0%
|
0,0%
|
0%
|
0%
|
0,0%
|
0,0%
|
0%
|
0%
|
|
|
B
|
0%
|
1%
|
1,8%
|
0%
|
0,3%
|
0,0%
|
0%
|
4%
|
|
|
C
|
0%
|
6%
|
14%
|
6%
|
2%
|
0,0%
|
0%
|
29%
|
|
|
D
|
0%
|
0%
|
0%
|
0%
|
0%
|
0%
|
0%
|
0%
|
|
|
E
|
0%
|
1%
|
11%
|
24%
|
5%
|
0,0%
|
0%
|
41%
|
|
|
F
|
0%
|
0%
|
7%
|
7%
|
10%
|
0,0%
|
0%
|
24%
|
|
|
G
|
0%
|
0,0%
|
0,5%
|
1%
|
0,6%
|
0,0%
|
0%
|
2%
|
|
|
sum
|
0%
|
9%
|
35%
|
39%
|
18%
|
0%
|
0%
|
|
For C3:
|
|
Current
|
Wet Grip
|
|
|
|
RR / WG
|
A
|
B
|
C
|
D
|
E
|
F
|
G
|
sum
|
|
Rolling resistance
|
A
|
0,1%
|
0,3%
|
0%
|
0%
|
0,0%
|
0,0%
|
0%
|
1%
|
|
|
B
|
1%
|
5%
|
2,2%
|
0%
|
0,0%
|
0,0%
|
0%
|
7%
|
|
|
C
|
2%
|
17%
|
11%
|
0%
|
0%
|
0,0%
|
0%
|
29%
|
|
|
D
|
1%
|
14%
|
23%
|
1%
|
0%
|
0%
|
0%
|
40%
|
|
|
E
|
0,4%
|
5%
|
12%
|
1%
|
0%
|
0,0%
|
0%
|
18%
|
|
|
F
|
0,1%
|
1%
|
2%
|
1%
|
0%
|
0,0%
|
0%
|
4%
|
|
|
G
|
0%
|
0,0%
|
0,0%
|
0%
|
0,0%
|
0,0%
|
0%
|
0%
|
|
|
sum
|
3%
|
42%
|
51%
|
4%
|
0%
|
0%
|
0%
|
|
|
|
Proposed
(S1)
|
Wet Grip
|
|
|
|
RR / WG
|
A
|
B
|
C
|
D
|
E
|
F
|
G
|
sum
|
|
Rolling resistance
|
A
|
0,0%
|
0,1%
|
0%
|
1%
|
0,0%
|
0,0%
|
0%
|
1%
|
|
|
B
|
0%
|
1%
|
4,7%
|
2%
|
0,2%
|
0,0%
|
0%
|
8%
|
|
|
C
|
0%
|
2%
|
17%
|
11%
|
0%
|
0,0%
|
0%
|
31%
|
|
|
D
|
0%
|
1%
|
15%
|
24%
|
1%
|
0%
|
0%
|
41%
|
|
|
E
|
0,0%
|
0%
|
5%
|
12%
|
1%
|
0,2%
|
0%
|
19%
|
|
|
F
|
0,0%
|
0%
|
0%
|
0%
|
0%
|
0,0%
|
0%
|
0%
|
|
|
G
|
0%
|
0,0%
|
0,0%
|
0%
|
0,0%
|
0,0%
|
0%
|
0%
|
|
|
sum
|
0%
|
3%
|
43%
|
51%
|
3%
|
0%
|
0%
|
|
c.
Proposal to new Noise level label intervals (Scenario 1 and 2)
The noise class intervals are based on the limit value (LV) set out in Part C of Annex II of Regulation (EC) No 661/2009, and the actual external rolling noise measured value (N). The proposed redistribution shown in
Table
removes all tyres surpassing the rolling noise limit value. Furthermore, it introduces a new top class.
Table 53: Current and new label class intervals for noise for all tyre types
|
Class
|

|

|

|
|
Current
|
N ≤ LV – 3
|
LV – 3 < N ≤ LV
|
N > LV
|
|
New
|
N ≤ LV – 6
|
LV – 6 < N < LV – 3
|
LV – 3 < N ≤ LV
|
13.2
Scenario 2
a.
Proposal to new Wet Grip index label intervals (Scenario 2)
For C1/C2 tyres, the empty D class is removed. Classes E and F are combined into a new D class. For C3 tyres, the classes are combined based on the current market distributions (See Table 58). This will combine classes A and B into a new A class, and classes E and F into a new D class, visualized in
Table
. The current and proposed wet grip classes can be seen in Table 54 and Table 55.
Table 54: Current and new label class intervals for wet grip in C3 tyres. Scenario 2
|
Current
|
≥1,25
|
1,24–1,10
|
1,09–0,95
|
0,94–0,80
|
0,79–0,65
|
≤0,64
|
Empty
|
|
|
|
A
|
B
|
C
|
D
|
E
|
F
|
G
|
|
|
|
|
|
|
|
|
|
|
|
|
New
|
A
|
B
|
C
|
D
|
E
|
F
|
G
|
C3 WG
S2
|
|
|
≥1,10
|
1,09–0,95
|
0,94–0,80
|
≤0,79
|
Empty
|
Empty
|
Empty
|
|
Table 55: Current Wet grip class intervals
|
C1 tyres (Current)
|
C2 tyres (Current)
|
C3 tyres (Current)
|
|
G
|
Wet grip class
|
G
|
Wet grip class
|
G
|
Wet grip class
|
|
1,55 ≤ G
|
A
|
1,40 ≤ G
|
A
|
1,25 ≤ G
|
A
|
|
1,40 ≤ G ≤ 1,54
|
B
|
1,25 ≤ G ≤ 1,39
|
B
|
1,10 ≤ G ≤ 1,24
|
B
|
|
1,25 ≤ G ≤ 1,39
|
C
|
1,10 ≤ G ≤ 1,24
|
C
|
0,95 ≤ G ≤ 1,09
|
C
|
|
Empty
|
D
|
Empty
|
D
|
0,8 ≤ G ≤ 0,94
|
D
|
|
1,10 ≤ G ≤ 1,24
|
E
|
0,95 ≤ G ≤ 1,09
|
E
|
0,65 ≤ G ≤ 0,79
|
E
|
|
G ≤ 1,09
|
F
|
G ≤ 0,94
|
F
|
G ≤ 0,64
|
F
|
|
Empty
|
G
|
Empty
|
G
|
Empty
|
G
|
Table 56: Proposed Wet grip class intervals. Scenario 2
|
C1 tyres (Proposed)
|
C2 tyres (Proposed)
|
C3 tyres (Proposed)
|
|
G
|
Wet grip class
|
G
|
Wet grip class
|
G
|
Wet grip class
|
|
1,55 ≤ G
|
A
|
1,40 ≤ G
|
A
|
1,10 ≤ G
|
A
|
|
1,40 ≤ G ≤ 1,54
|
B
|
1,25 ≤ G ≤ 1,39
|
B
|
0,95 ≤ G ≤ 1,09
|
B
|
|
1,25 ≤ G ≤ 1,39
|
C
|
1,10 ≤ G ≤ 1,24
|
C
|
0,8 ≤ G ≤ 0,94
|
C
|
|
G ≤ 1,24
|
D
|
G ≤ 1,09
|
D
|
G ≤ 0,79
|
D
|
|
Empty
|
E
|
Empty
|
E
|
Empty
|
E
|
|
Empty
|
F
|
Empty
|
F
|
Empty
|
F
|
|
Empty
|
G
|
Empty
|
G
|
Empty
|
G
|
b.
Proposal to new Rolling Resistance index label intervals (Scenario 2)
For C1/C2 tyres, the empty D class is removed. Regulation No. 661/2009 naturally removes classes F and G. The current E class is thus renamed to the new D class.
For C3 tyres, the regulation removes classes E and F, which results in 4 total classes. The current and proposed rolling resistance classes can be seen in
Table
and 57.
Table 57: Current rolling resistance class intervals
|
C1 tyres (current)
|
C2 tyres (current)
|
C3 tyres (current)
|
|
RRC in kg/t
|
Energy efficiency class
|
RRC in kg/t
|
Energy efficiency class
|
RRC in kg/t
|
Energy efficiency class
|
|
RRC ≤ 6,5
|
A
|
RRC ≤ 5,5
|
A
|
RRC ≤ 4,0
|
A
|
|
6,6 ≤RRC ≤ 7,7
|
B
|
5,6 ≤RRC ≤ 6,7
|
B
|
4,1 ≤RRC ≤ 5,0
|
B
|
|
7,8 ≤RRC ≤ 9,0
|
C
|
6,8 ≤RRC ≤ 8,0
|
C
|
5,1 ≤RRC ≤ 6,0
|
C
|
|
Empty
|
D
|
Empty
|
D
|
6,1 ≤RRC ≤ 7,0
|
D
|
|
9,1 ≤RRC ≤ 10,5
|
E
|
8,1 ≤RRC ≤ 9,2
|
E
|
7,1 ≤RRC ≤ 8,0
|
E
|
|
10,6 ≤RRC ≤ 12,0
|
F
|
9,3 ≤RRC ≤ 10,5
|
F
|
RRC ≥ 8,1
|
F
|
|
RRC ≥ 12,1
|
G
|
RRC ≥ 10,6
|
G
|
Empty
|
G
|
Table 58: Proposed rolling resistance class intervals. Scenario 2
|
C1 tyres (proposed)
|
C2 tyres (proposed)
|
C3 tyres (proposed)
|
|
RRC in kg/t
|
Energy efficiency class
|
RRC in kg/t
|
Energy efficiency class
|
RRC in kg/t
|
Energy efficiency class
|
|
RRC ≤ 6,5
|
A
|
RRC ≤ 5,5
|
A
|
RRC ≤ 4,0
|
A
|
|
6,6 ≤RRC ≤ 7,7
|
B
|
5,6 ≤RRC ≤ 6,7
|
B
|
4,1 ≤RRC ≤ 5,0
|
B
|
|
7,8 ≤RRC ≤ 9,0
|
C
|
6,8 ≤RRC ≤ 8,0
|
C
|
5,1 ≤RRC ≤ 6,0
|
C
|
|
RRC ≥ 9,1
|
D
|
RRC ≥ 8,1
|
D
|
RRC ≥ 6,1
|
D
|
|
Empty
|
E
|
Empty
|
E
|
Empty
|
E
|
|
Empty
|
F
|
Empty
|
F
|
Empty
|
F
|
|
Empty
|
G
|
Empty
|
G
|
Empty
|
G
|
Table 59: Current and 'Scenario 2' - proposed distribution of wet grip and rolling resistance of C1/C2/C3 tyres. Source: GfK and TOL
For C1:
|
|
Current
|
Wet Grip
|
|
|
RR/WG
|
A
|
B
|
C
|
D
|
E
|
F
|
G
|
sum
|
|
Rolling resistance
|
A
|
0,2%
|
0,2%
|
0%
|
0%
|
0,0%
|
0,0%
|
0%
|
0%
|
|
|
B
|
2%
|
3%
|
1,1%
|
0%
|
0,1%
|
0,1%
|
0%
|
6%
|
|
|
C
|
11%
|
13%
|
11%
|
0%
|
1%
|
0,6%
|
0%
|
37%
|
|
|
D
|
0%
|
0%
|
0%
|
0%
|
0%
|
0%
|
0%
|
0%
|
|
|
E
|
6,5%
|
13%
|
18%
|
0%
|
4%
|
0,8%
|
0%
|
41%
|
|
|
F
|
1,0%
|
4%
|
7%
|
0%
|
2%
|
0,8%
|
0%
|
15%
|
|
|
G
|
0%
|
0,1%
|
0,3%
|
0%
|
0,2%
|
0,1%
|
0%
|
1%
|
|
|
sum
|
20%
|
32%
|
38%
|
0%
|
7%
|
2%
|
0%
|
|
|
|
Proposed (S2)
|
Wet Grip
|
|
|
RR/WG
|
A
|
B
|
C
|
D
|
E
|
F
|
G
|
sum
|
|
Rolling resistance
|
A
|
0,2%
|
0,2%
|
0,1%
|
0,0%
|
0,0%
|
0,0%
|
0%
|
0%
|
|
|
B
|
1,8%
|
2,7%
|
1,1%
|
0,2%
|
0,0%
|
0,0%
|
0%
|
6%
|
|
|
C
|
10,9%
|
12,9%
|
11,3%
|
1,8%
|
0%
|
0,0%
|
0%
|
37%
|
|
|
D
|
7,5%
|
16,5%
|
25,4%
|
7,4%
|
0%
|
0%
|
0%
|
57%
|
|
|
E
|
0,0%
|
0%
|
0%
|
0%
|
0%
|
0,0%
|
0%
|
0%
|
|
|
F
|
0,0%
|
0%
|
0%
|
0%
|
0%
|
0,0%
|
0%
|
0%
|
|
|
G
|
0%
|
0,0%
|
0,0%
|
0%
|
0,0%
|
0,0%
|
0%
|
0%
|
|
|
sum
|
20%
|
32%
|
38%
|
9%
|
0%
|
0%
|
0%
|
|
For C2:
|
|
Current
|
Wet Grip
|
|
|
|
RR / WG
|
A
|
B
|
C
|
D
|
E
|
F
|
G
|
sum
|
|
Rolling Resistance
|
A
|
0,0%
|
0,0%
|
0%
|
0%
|
0,0%
|
0,0%
|
0%
|
0%
|
|
|
B
|
1%
|
2%
|
0,2%
|
0%
|
0,3%
|
0,1%
|
0%
|
4%
|
|
|
C
|
6%
|
14%
|
6%
|
0%
|
2%
|
0,1%
|
0%
|
28%
|
|
|
D
|
0%
|
0%
|
0%
|
0%
|
0%
|
0%
|
0%
|
0%
|
|
|
E
|
1,2%
|
11%
|
24%
|
0%
|
5%
|
0,2%
|
0%
|
41%
|
|
|
F
|
0,3%
|
7%
|
7%
|
0%
|
9%
|
0,5%
|
0%
|
25%
|
|
|
G
|
0%
|
0,5%
|
1,1%
|
0%
|
0,6%
|
0,0%
|
0%
|
2%
|
|
|
sum
|
8%
|
34%
|
38%
|
0%
|
18%
|
1%
|
0%
|
|
|
|
Proposed (S2)
|
Wet Grip
|
|
|
|
RR / WG
|
A
|
B
|
C
|
D
|
E
|
F
|
G
|
sum
|
|
Rolling Resistance
|
A
|
0,0%
|
0,0%
|
0,0%
|
0,0%
|
0,0%
|
0,0%
|
0%
|
0%
|
|
|
B
|
1,5%
|
1,8%
|
0,2%
|
0,3%
|
0,0%
|
0,0%
|
0%
|
4%
|
|
|
C
|
5,5%
|
14,3%
|
6,1%
|
2,4%
|
0%
|
0,0%
|
0%
|
28%
|
|
|
D
|
1,5%
|
18,3%
|
32,0%
|
16,1%
|
0%
|
0%
|
0%
|
68%
|
|
|
E
|
0,0%
|
0%
|
0%
|
0%
|
0%
|
0,0%
|
0%
|
0%
|
|
|
F
|
0,0%
|
0%
|
0%
|
0%
|
0%
|
0,0%
|
0%
|
0%
|
|
|
G
|
0%
|
0,0%
|
0,0%
|
0%
|
0,0%
|
0,0%
|
0%
|
0%
|
|
|
sum
|
8%
|
34%
|
38%
|
19%
|
0%
|
0%
|
0%
|
|
For C3:
|
|
Current
|
Wet Grip
|
|
|
|
RR / WG
|
A
|
B
|
C
|
D
|
E
|
F
|
G
|
sum
|
|
Rolling resistance
|
A
|
0,1%
|
0,3%
|
0%
|
0%
|
0,0%
|
0,0%
|
0%
|
1%
|
|
|
B
|
1%
|
5%
|
2,2%
|
0%
|
0,0%
|
0,0%
|
0%
|
7%
|
|
|
C
|
2%
|
17%
|
11%
|
0%
|
0%
|
0,0%
|
0%
|
29%
|
|
|
D
|
1%
|
14%
|
23%
|
1%
|
0%
|
0%
|
0%
|
40%
|
|
|
E
|
0,4%
|
5%
|
12%
|
1%
|
0%
|
0,0%
|
0%
|
18%
|
|
|
F
|
0,1%
|
1%
|
2%
|
1%
|
0%
|
0,0%
|
0%
|
4%
|
|
|
G
|
0%
|
0,0%
|
0,0%
|
0%
|
0,0%
|
0,0%
|
0%
|
0%
|
|
|
sum
|
3%
|
42%
|
51%
|
4%
|
0%
|
0%
|
0%
|
|
|
|
Proposed
(S2)
|
Wet Grip
|
|
|
|
RR / WG
|
A
|
B
|
C
|
D
|
E
|
F
|
G
|
sum
|
|
Rolling resistance
|
A
|
0,4%
|
0,5%
|
0,0%
|
0,0%
|
0,0%
|
0,0%
|
0%
|
1%
|
|
|
B
|
5,1%
|
2,2%
|
0,1%
|
0,0%
|
0,0%
|
0,0%
|
0%
|
7%
|
|
|
C
|
18,2%
|
10,7%
|
0,4%
|
0,0%
|
0%
|
0,0%
|
0%
|
29%
|
|
|
D
|
21,4%
|
37,5%
|
3,0%
|
0,4%
|
0%
|
0%
|
0%
|
62%
|
|
|
E
|
0,0%
|
0%
|
0%
|
0%
|
0%
|
0,0%
|
0%
|
0%
|
|
|
F
|
0,0%
|
0%
|
0%
|
0%
|
0%
|
0,0%
|
0%
|
0%
|
|
|
G
|
0%
|
0,0%
|
0,0%
|
0%
|
0,0%
|
0,0%
|
0%
|
0%
|
|
|
sum
|
45%
|
51%
|
4%
|
0%
|
0%
|
0%
|
0%
|
|


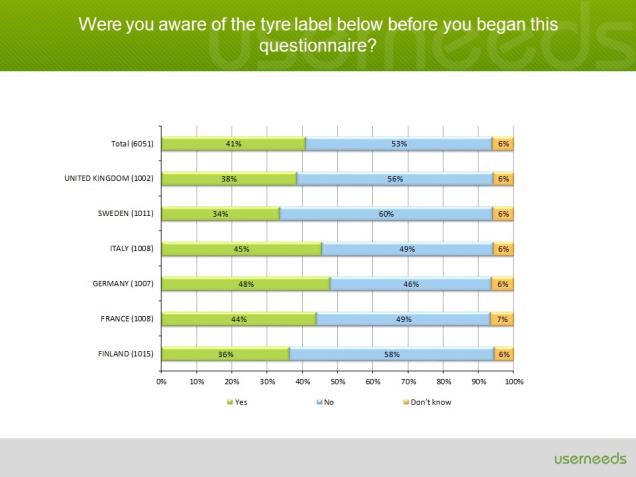


