 EUROPEAN COMMISSION
Brussels, 30.11.2016
SWD(2016) 410 final
COMMISSION STAFF WORKING DOCUMENT
IMPACT ASSESSMENT
Accompanying the document
Proposal for a Directive of the European Parliament and of the Council on common rules for the internal market in electricity (recast)
Proposal for a Regulation of the European Parliament and of the Council on the electricity market (recast)
Proposal for a Regulation of the European Parliament and of the Council establishing a European Union Agency for the Cooperation of Energy Regulators (recast)
Proposal for a Regulation of the European Parliament and of the Council on risk preparedness in the electricity sector
{COM(2016) 861 final}
{SWD(2016) 411 final}
{SWD(2016) 412 final}
{SWD(2016) 413 final}
Abstract of the Impact Assessment of the Market Design Initiative
I.
POLICY CONTEXT AND KEY CHALLENGES
The Energy Union framework strategy puts forward a vision of an energy market 'with citizens at its core, where citizens take ownership of the energy transition, benefit from new technologies to reduce their bills, participate actively in the market, and where vulnerable consumers are protected'.
Well-functioning energy markets that ensure secure and sustainable energy supplies at competitive prices are essential for achieving growth and consumer welfare in the European Union and hence are at the heart of EU energy policy.
To live up to this vision, a series of legislative proposals have been prepared, following the objectives of secure and competitive energy supplies and building on the EU's 2030 climate commitments reconfirmed in Paris last year.
The electricity sector will be one of the main contributors to decarbonise the economy. Currently, 27.5% of Europe's electricity is produced using renewable energy and the modelling shows that close to half of our electricity will come from renewables by 2030. With increasing use of electricity in sectors like transport or heating and cooling, traditionally dominated by fossil fuels, it is ever more important to further increase the share of renewable energies in electricity and to unlock flexible demand, generation and storage solutions.
A new regulatory framework is needed to address these challenges and opportunities. The new proposals for a revised Renewable Energy Directive and for a new Market Design will precisely do this, by deepening integration of the internal energy market, empowering consumers, stepping up regional and EU-wide cooperation and providing the right signals for investment, thus ensuring secure, sustainable and competitive electricity systems.
A successful transition of the energy system delivering on the ambition to become world leader in renewables will require substantial investment in the sector, and in particular investments in low-carbon generation assets as well as network infrastructure. This requires a revised Emissions Trading System in order to address the current surplus of allowances and to deliver a strong investment signal to reach 40% greenhouse gas emissions reductions by 2030, but also specific rules to complement market revenues if those are not sufficient to attract investments in renewable electricity. In addition, measures to promote renewable energies in sectors like transport or heating and cooling are also crucial. Reaching the 2030 framework targets and achieving an Energy Union will be underpinned by a strong Energy Union governance, which will ensure the necessary ambition level in an iterative dialogue between the Commission and all Member States. Finally, a successful transition of the energy system will also require continued commitment and support for infrastructure development both locally as well as across borders.
At the same time the transition will only be successful if consumers are given the information, opportunities and rewards to actively participate in it. The availability of new technologies that allow consumers to both consume electricity in a smarter way as well as produce it themselves at costs which are more and more competitive opens up manifold possibilities. What is still needed to fully reap these opportunities is the appropriate regulatory framework accompanying the digital transformation and technological development that will empower consumers to take part in the energy transition by becoming active market participants. Empowering consumers in this way will also contribute to a more efficient use of energy and is therefore an integral part of implementing the efficiency first principle.
Finally, the EU will only be able to manage the energy transition successfully and cost-effectively in a more deeply integrated internal electricity market. Only a more competitive and better interconnected market will allow Europe to drive cost-efficient investment and in particular to integrate the rising share of renewable energy production in a cost-efficient and secure manner into the system, profiting fully from complementarities between Member States and broader regions.
Such a deeply integrated and competitive market is also a key building block for guaranteeing security of supply and policies and mechanisms intended to reach this objective should follow a cooperative logic. National security of supply policies need to be better coordinated and aligned. This will ensure that Member States are duly prepared to tackle possible crisis situations, in particular those that affect several countries at the same time.
The present package of legislative measures directly contributes to the Energy Union dimensions of energy security, solidarity and trust, a fully integrated internal energy market as well as decarbonisation of the economy, while also indirectly contributing to the other two.
II.
LESSON LEARNED AND PROBLEM DEFINITION
Three consecutive legislative packages have transformed what used to be fragmented energy markets in Europe into a more integrated Internal Electricity Market, thus increasing competition. However, Europe's energy markets are undergoing further profound changes.
The transition towards a low-carbon electricity production poses a number of challenges for the secure and cost-effective organisation and operation of Europe’s power grids and electricity markets. The increasing penetration of variable and decentralised renewable energy – driven inter alia by the EU’s goals for climate change and energy in line with the 2020 and 2030 targets – requires the electricity sector to be operated more flexibly and efficiently.
Today, most new installed capacity is based on wind and solar power which are inherently more variable and less predictable when compared to conventional sources of energy (predictable central, large-scale fossil fuel-based power plants) or flexible renewable energy technologies (e.g. biomass, geothermal or hydropower). By 2030, this trend is expected to be ever more pronounced. As a result, there will be times when variable renewables could cover a very large share - even 100% - of electricity demand and times when they only cover a minor share of total consumption. The overall electricity supply and demand needs to be in balance in physical terms at any given point in time (including production or storage of electricity). This balance is a precondition for the secure operation and stability of the electricity grid, thus avoiding the risk of black-outs.
Current market arrangements do not adequately incentivize all market participants – including renewable energy generation - to adjust their portfolios by revising production and consumption plans on short notice. The manner in which the trading of electricity is arranged and in which the methods for allocating the network capacity to transport electricity are organized, allow only for efficient trading of electricity in timeframes of one or more days ahead of physical delivery. Yet, the increasing penetration of variable renewable sources of electricity ('RES E') requires efficient and liquid short-term markets that can operate as close to real time as possible – until very shortly before the time of physical delivery (i.e. the moment when electricity is consumed). Indeed, most renewable generation can only be accurately predicted shortly before the actual production (due to weather uncertainties). Flexibility is essential to deal effectively with an increased share of variable renewable generation. Besides, these markets do not fully take into account possible contribution of cross-border resources.
Retail markets for energy in most parts of the EU suffer from persistently low levels of competition, consumer choice and engagement. In spite of falling prices on wholesale markets, retail prices have risen steadily for households as a result of significantly increased network charges, taxes and levies in recent years. Market concentration remains generally high due to persisting barriers to new entrants. Switching related fees such as contract termination charges continue to constitute a significant financial barrier to consumer engagement. In addition, the high number of complaints related to billing suggests that there is still scope to improve the comparability, clarity and accuracy of billing information.
Despite technical innovations that allow consumers to better and more easily manage their energy use – smart grids, smart homes, rooftop solar panels and storage, for example – consumers are not sufficiently able to actively participate in electricity markets and match demand with supply during peak times, particularly through demand-response. This is because households and businesses often have scarce knowledge and little or no incentive to change the amount of electricity they use or produce in response to changing prices in the markets. Indeed, a host of issues such as a slow roll out of fully functional smart metering systems, regulated prices, lacklustre competition between retailers and an increasing portion of fixed charges in energy bills mean that real-time price signals are usually not passed on to final consumers.
In some Member States, up to 90% of renewable electricity generation is connected at distribution level, putting more pressure on distribution system operators ('DSOs') to actively manage their grids and to efficiently adjust to the increasing share of variable and decentralized renewable electricity injected into their networks. However – in contrast to transmission system operators ('TSOs') – the current regulatory framework does not always provide appropriate tools to DSOs to do this, resulting in network charges that are often higher than they could be for end consumers. Ensuring that all DSOs become more flexible would create a level playing field for the deployment of renewable generation that would make attaining the EU's climate and energy objectives easier.
The deployment of information technology offers the possibility to address these issues, facilitating the development of new services, improving consumer's comfort and making the market more contestable and efficient. However, to fully benefit from the digitalisation of the electricity market we need a non-discriminatory data management framework that makes the right information immediately available to the right market actors, while at the same time ensuring a high level of data protection.
With regard to consumer protection, there is a need to ensure that the move towards more efficient retail markets does not lead to any group of consumers being left behind. In particular, rising energy poverty as well as a lack of clarity on the most appropriate means of tackling consumer vulnerability and energy poverty can hamper the further deepening of the internal energy market.
In the current context, wholesale electricity prices have been decreasing due to number of coinciding drivers: a decline in primary energy prices, a surplus of carbon allowances and an overcapacity of power generation facilities in some regions of the EU caused by a drop in electricity demand, rising investments in renewables driven by EU policies and increased sharing of resources among Member States through market coupling.
For most regions in Europe, current electricity wholesale prices do not indicate the need for new investments into electricity generation. However, in the current market arrangement, prices often do not reflect the real value of electricity due to regulatory failures such as the lack of scarcity pricing and inadequately delimited price (or bidding) zones. These regulatory failures, taken together with the increasing penetration of electricity generated from renewable sources with low operating costs, affect the remuneration of conventional electricity generation units that operate less often but contribute to providing security and flexibility to the system – alongside non-conventional flexible generation, interconnections, storage and demand response.
In light of the 2030 objective for renewable energy, considerable new investment in electricity generation capacity will be required. The largest part will be provided by variable renewable generation, complemented to a certain extent by more predictable, flexible, less carbon-intensive forms of power generation. Independently of current overcapacities, there are growing concerns in some areas of Europe that current average wholesale prices may not provide appropriate signals for the necessary investments into future generation or for keeping sufficient capacity in the market. A number of Member States anticipate inadequate generation capacity in future years and introduce capacity mechanisms at national level to support investment in capacity and ensure system adequacy (i.e. the ability of the electricity system to serve demand at all times). When uncoordinated and designed without a proper assessment of the appropriate level of supply security, capacity mechanisms may risk affecting cross-border trade, distorting investment signals, affecting thus the ability of the market to deliver any new investments in conventional and low-carbon generation, and strengthening market power of incumbents by not allowing alternative providers to enter the market.
Despite best efforts to build an integrated and resilient power market, crisis situations can never be excluded. The potential for crisis situation increases with climate change (e.g. extreme weather conditions) and the emergence of new areas that are subject to criticalities such as malicious attacks and cyber-threats. Such crises tend to often have an immediate cross-border effect in electricity. Where systems are interconnected, incidents that start locally can rapidly spread beyond borders and crisis situations might also affect several Member States at the same time (e.g. prolonged heat waves or cold spells).
Today, risk assessments as well as plans and actions for dealing with electricity crisis situations focus on the national context only and there is insufficient information-sharing and transparency across Member States. In addition, there are different views on what is to be considered as a risk to security of supply. In an increasingly inter-connected electricity market, the lack of common approach and coordination can seriously imperil security of supply across borders and dangerously undermine the functioning of the internal electricity market.
In addition, missing opportunities to exchange energy with neighbours remains a key obstacle to the internal energy market. Even where interconnectors are in place, they often remain unused due to a lack of coordination between Member States. Rules are therefore needed that ensure that the use of interconnection is not unduly limited by national interventions.
Based on the above-mentioned shortcomings and underlying drivers, the present impact assessment has identified four key problem areas that are addressed in the proposed initiative: i) the current market design is not fit for integrating an increasing share of variable, decentralised generation and for reaping the potential of technological developments; ii) uncertainty about sufficient future generation investments and uncoordinated capacity mechanisms; iii) Member States do not take sufficient account of what happens across their borders when preparing for and managing electricity crisis situations; and iv) as regards retail markets, there is a slow deployment and low levels of services and poor market performance are wide-spread in the EU.
III.
SUBSIDIARITY
Article 194 of the Treaty of the Functioning of the EU consolidated and clarified the competences of the EU in the field of energy and is the legal basis of the current proposal.
Electricity markets have become more integrated and interdependent physically, economically and from a regulatory point of view, due to increasing cross-border electricity trade, growing share of renewable energy sources and more interconnections in the European electricity grid. The challenges can no longer be addressed as effectively by individual Member States. New frameworks to further integrate the internal energy market and improve the conditions for competition while at the same time adjusting to the decarbonisation targets and ensuring a more coordinated policy response to security of supply, can most effectively be achieved at European level.
IV.
SCOPE AND OBJECTIVES
Against this background and in line with the Union's policy on climate change and energy, the general policy objective of the present initiative is to make electricity markets more secure, efficient and competitive, while ensuring that electricity is generated in a sustainable way and remains affordable to all consumers. The present impact assessment reflects and analyses the need and policy options for a possible revision of the main framework governing electricity markets and security of supply policies in Europe.
There are four specific objectives: i) adapt the market design for the cost effective operation of variable and often decentralised generation, taking into account technological developments; ii) facilitate investments in generation capacity in the right amount and type of resources for the EU: iii) improve Member States' resilience on each other in times of system stress and reinforce their coordination and cooperation regarding crisis situations; and iv) address the root causes of weak competition on energy retail markets and improve consumer protection and engagement.
Interlinkages with parallel initiatives
The proposed initiative is strongly linked to other energy and climate related legislative proposals brought forward in parallel, including the renewable energy package which covers a number of measures deemed necessary to attain the EU binding objective of reaching a level of at least 27% renewables in final EU energy consumption by 2030. The renewable energy directive has synergies with the present initiative, which seeks to adapt the current market design to the increasing share of variable decentralised generation and technological development and to create an environment conducive for investments in renewables.
In particular, the reflections on a revised Renewables Energy Directive will include framework principles on support schemes for market-oriented, cost-effective and more regionalised support to RES E up to 2030, in case Member States were opting to have them as a tool to facilitate target achievement. Conversely, measures aimed at the integration of RES E in the market, such as provisions on priority dispatch and access previously contained in the Renewables Directive are part of the present market design initiative. The Renewable Package also deals with legal and administrative barriers for self-consumption, whereas the present package addresses market related barriers to self-consumption.
Both the market design and renewable energy impact assessments come to the conclusion that the improved electricity market, supported through a revised Emission Trading System ('ETS'), could, under certain conditions, by 2030 deliver investments in the most mature low-carbon technologies (such as PV and onshore wind). However, until such conditions materialise, market-based support schemes will still be needed in order to provide investment certainty. Less mature RES E technologies, such as offshore wind, will likely need some form of support throughout the transitional period.
The Energy Union governance initiative also has synergies with the present initiative and will contribute to ensure policy coherence and reduce administrative impact. It will also streamline the reporting obligations by Member States and the Commission that are presently enshrined in the Third Package.
In general terms, energy efficiency measures also interact with the present initiative as they affect the level and structure of electricity demand. In addition, energy efficiency measures can alleviate energy poverty and consumer vulnerability. Besides consumer income and energy prices, energy efficiency is one of the major drivers of energy poverty. The provisions previously contained in the energy efficiency legislation on demand response, billing and metering will be set out in the present initiative.
The present initiative is furthermore consistent with the findings of the sector inquiry on capacity mechanisms. Pointing out that there is a lack of adequate assessment of the actual need for capacity mechanisms, the sector inquiry emphasizes that where needed capacity mechanisms need to be designed with transparent and open rules of participation that does not undermine the functioning of the electricity market, taking into account cross border participation.
The Commission Regulation establishing a Guideline on Electricity Balancing ('Balancing Guideline') is also closely related to the present initiative as it aims to harmonise certain aspects of the EU's balancing markets and to optimise cross-border usage. Indeed, efficient, integrated balancing markets are an important building block for the consistent functioning and flexibility of the market which in turn is needed for a cost effective integration of RES E into the electricity market.
V.
DESCRIPTION OF POLICY OPTIONS AND METHODOLOGY
In assessing all possible options (ranging from non-regulatory to legislative policy options) the following approach was taken:
-
Identification of a set of high level options for each problem area. Each of these high level options contains sub-options for specific measures;
-
Assessment of each specific measure, comparing a number of options in order to select the preferred approach.
The following policy options have been considered:
Regarding Problem Area I: the need to adapt the market design to the increasing share of variable decentralised generation and technological developments,
Option 0+ (Non-regulatory approach) provides little scope for improving the market and the level-playing field among resources. Indeed, the current EU regulatory framework is limited in certain areas (e.g., balancing and intraday markets) and even non-existent for other areas (e.g., role of DSOs in data management). Besides, voluntary cooperation may not provide for the appropriate levels of harmonisation or certainty to the market and legislation. This option was therefore discarded.
Two possible paths going beyond the baseline scenario were however identified and assessed: (i) enhancing current market rules through EU regulatory action in order to increase the flexibility of the system, retaining to a certain extent the national operation of the systems (Option 1) and, (2) moving to a fully integrated approach via relatively far-reaching changing to the current regulatory framework (Option 2).
Option 1 of enhancing the current market rules comprises three different sub-options:
Option 1(a)
Creating a level-playing field among all generation technologies and resources and remove existing market distortions. It addresses rules that discriminate between resources and which limit or favour the access of certain technologies to the electricity grid (such as so-called 'must-run' provisions and rules on priority dispatch and access). In addition, all market participants would bear financial responsibility for the imbalances caused on the grid and all resources would be remunerated in the market on equal terms. Barriers to demand-response would be removed. Exemptions from certain regulatory provisions may, in some cases, be required, notably for certain small-scale installations and emerging technologies.
Option 1(b)
(In addition to sub-option (a)) Strengthening the short-term markets by bringing them closer to real-time in order to provide maximum opportunity to meet the flexibility needs and balance the market. The sizing of balancing reserves and their use would be harmonised in larger balancing zones in order to optimally exploit interconnections and cross-border exchange in shorter term markets.
Option 1(c)
(In addition to sub-option (a) and (b)) Pulling all flexible distributed resources concerning generation, demand and storage, into the market via proper incentives and a market framework better adapted to them. This would be based on smart-metering allowing consumers to directly react to price signals and measures to incentivise DSOs to manage their networks in a flexible and cost-efficient way.
Option 2 (fully integrated market) considers measures that would aim to deliver a truly integrated pan-European electricity market through the adoption of far-reaching measures changing the current regulatory framework.
Regarding Problem Area II: uncertainty about sufficient future generation investments and uncoordinated capacity mechanisms, four options were considered.
As regards Option 0+ (Non-regulatory approach), existing provisions under EU legislation are not sufficiently clear and robust to cope with the challenges facing the European electricity system. In addition, voluntary cooperation may not provide for appropriate levels of harmonisation across all Member States or certainty to the market. Legislation is needed in this area to address the issues in a consistent way. This Option was therefore discarded.
Various policy options going beyond the baseline scenario were assessed. They differ according to which extent market participants can rely on energy market payments. Each policy option also considers varying degrees of alignment and coordination among Member States at EU-level.
Option 1 (energy-only market without capacity mechanisms) builds upon Option 1(a) to 1(c) under problem area I and would be based on additional measures to further strengthen the internal electricity market. Under this option, it is assumed that European markets, if sufficiently interconnected and undistorted, can provide for the necessary price signals to incentivise investments in new generation thus also reducing the need for government interventions in support thereof. This option consists of improving price signals by removing price caps in order to allow scarcity pricing during peak time. At the same time, price signals could drive the geographical location of new investments and production decisions, via price zones aligned with structural congestion in the transmission grid.
Option 2 and 3 include the measures presented in Option 1, but allow capacity mechanisms under certain conditions and propose possible measures to better align them among Member States in order to avoid negative consequences for the functioning of the internal market. These options build on the European Commission's 'EEAG' state aid Guidelines and the Sector Inquiry on capacity mechanisms. In Option 2, capacity mechanisms are based on a transparent and EU-wide resource adequacy assessment carried-out by the European Network of Transmission System Operators for electricity ('ENTSO-E'). Such EU-wide assessment would also allow for effective cross-border participation. Additionally, Option 3 would provide for common design features for better compatibility between national capacity mechanisms and harmonised cross-border cooperation.
Under Option 4 based on regional or EU-wide generation adequacy assessments, entire regions or ultimately all EU Member States would be required to roll out capacity mechanisms on a mandatory basis. This option was found to be disproportionate and was discarded.
Regarding Problem Area III: the lack of coordination among Member States when preparing for and managing electricity crisis situations, five policy options ranging from the baseline scenario (Option 0) to the full harmonization and decision making at regional level have been identified.
Option 0+ (Non-regulatory approach). As current legislative provisions do not prescribe how Member States should prevent and manage crisis situations nor mandate any form of cross-border co-operation, better implementation and enforcement actions will be of no avail. In addition, whilst there is some voluntary cross-border cooperation in this area, it is limited to a few regional parts of the EU. This option was discarded.
Under Option 1 (Common minimum EU rules), Member States would have to respect a set of common rules and principles regarding crisis prevention and management, agreed at the European level ('minimum harmonisation'). Accordingly, non-market measures should only be introduced as a means of last resort, when duly justified. Member States would be obliged to address electricity crisis situations, in particular situations of a simultaneous crisis, in a spirit of co-operation and solidarity. Member States should inform each other and the Commission without undue delay when they see a crisis situation coming or when being in a crisis situation. Member States would be obliged to develop national Risk Preparedness Plans ('Plan') with the aim to avoid or better tackle crisis situations. Plans could be prepared by TSOs, but need to be endorsed at the political level. On cyber-security, Member States would need to set out in the Plan how they will prevent and manage cyberattack situations.
Option 2 (EU rules + regional cooperation) would include all common rules included in Option 1. In addition, it would put in place rules and tools to ensure that effective cross-border co-operation takes place in a regional and EU context. Thus, there would be a systematic assessment of rare/extreme risks at the regional level. The identification of crisis scenarios would be carried out by ENTSO-E in a regional context and tasks would be delegated to Regional Operation Centres (ROCs). For cybersecurity, the Commission would propose the development of a network code/guideline which would ensure a minimum level of harmonization in the energy sector throughout the EU. The Risk Preparedness Plans would contain two parts – a part reflecting national measures and a part reflecting measures to be pre-agreed in a regional context (including regional 'stress tests', procedures for cooperation in different crisis scenarios and agreement on how to deal with simultaneous electricity crisis situations).
Option 3 (Full harmonisation) entails full harmonisation and decision-making at regional level. The risk preparedness plans would be developed on regional level in order to allow a harmonised response to potential crisis situation in each region. On cybersecurity, Option 3 would go one step further and nominate a dedicated body (agency) to deal with cybersecurity in the energy sector. Crisis would have to be managed according to the regional plans agreed among Member States. A detailed 'emergency rulebook' for crisis handling would be put in place, containing an exhaustive list of measures that can be taken by Member States in crisis situations.
Regarding Problem Area IV: retail markets and the slow deployment and low levels of services and poor market performance, four policy options have been considered ranging from baseline scenario (Option 0) to full harmonization and extensive safeguards for consumers.
Option 0+ (Improved implementation/enforcement and non-regulatory approach) consists in sharing of good practices and increasing the efforts to correctly implement the legislation. This non-regulatory approach addresses competition and consumer engagement issues by strengthening the enforcement of the existing legislation as well as through bilateral consultation with Member States to progressively phase-out price regulation, starting with prices below costs. It also considers developing a Recommendation on energy bills. However, this option does not tackle the third problem driver of the market failures that prevent effective data flow between market actors.
Under Option 1 (Flexible legislation), all problem drivers are addressed through new legislation. To improve competition, Member States progressively phase-out blanket price regulation by a deadline specified in new EU legislation, starting with prices below costs, while allowing transitional price regulation for vulnerable consumers. To increase consumer engagement, the use of contract termination fees is restricted. Consumer confidence in comparison websites is fostered through national authorities implementing a certification tool. In addition, high-level principles ensure that energy bills are clear and easy to understand, through minimum content requirements. A generic adaptable, definition of energy poverty based on household income and energy expenditure is proposed in the legislation for the first time. Finally, to allow the development of new services by new entrants and energy service companies, non-discriminatory access to consumer data is ensured.
Building on Option 1, Option 2 (Full harmonisation and extensive consumer safeguards) aims to provide maximum safeguards for consumers and extensive harmonisation of Member States action throughout the EU. Exemptions to price regulation are defined at EU level on the basis of either a consumption threshold or a price threshold. A standard data handling model is enforced and assigns the responsibility to a neutral market actor such as a TSO. All switching fees including contract termination fees are banned and the content of energy bills is partially harmonized. Finally, an EU framework to monitor energy poverty based on an energy efficiency survey done by Member States of the housing stock as well as preventive measures to avoid disconnections are put in place.
VI
POLICY TRADE-OFFS
The measures considered in this impact assessment are highly complementary. Most of the different options considered in each problem area would reinforce the effect of options in other problem areas, with little trade-offs between the different areas. The overall beneficial effects will be achieved only if all measures are implemented as a package
The measures under Problem Area I and II are strongly linked in that they collectively aim at improving market functioning, including the delivery of investment by the market. Measures under Problem Area I and Option 1 of Problem area II thus reduce the need for market government intervention by means of capacity mechanisms. The other measures under Problem Area II reduce their distortive effects if such mechanisms are nonetheless justified.
Scarcity pricing and capacity mechanisms can to a certain degree be seen as alternative measures to foster investments. With assets remunerated by capacity mechanisms, the effectiveness of scarcity prices may be reduced. It needs also to be noted that scarcity prices and market-wide capacity mechanisms incentivise different investment decisions: whereas such capacity mechanisms may reward any firm capacity, scarcity pricing will improve remuneration of flexible capacity in particular.
The measures aiming at providing adequate price signals (measures under Problem Area I and Problem Area Option 1) are no-regret options. Until these conditions are achieved and under specific circumstances (like energy isolation), State intervention in the form of some type of capacity mechanism may be necessary. That is why it is essential that such mechanisms are properly designed, taking into account the wider regional and European resources and allowing cross-border participation in a technology-neutral manner.
The measures assessed under various options in the impact assessment seek to improve the overall flexibility of the electricity system. However, they do this by employing different means. Investment in new interconnection capacity may reduce the need for new generation and vice-versa, new generation can reduce the incentives for new interconnector capacity. Similarly, pulling demand response into the market will reduce the profits of generation capacity. Ultimately, the efficient markets should opt for the most cost-efficient solutions.
Energy poverty safeguards whose costs directly accrue to suppliers – particularly, the disconnection safeguards considered in Option 2 (Harmonization and extensive consumer safeguards) of Problem Area IV (Retail markets) – may act as a barrier to retail-level competition, and diminish the associated benefits to consumers, including lower prices, new and innovative products, and higher levels of service. Although the implementation costs of these safeguards will be passed on to consumers, and therefore socialized, different energy suppliers may have different abilities to do this, and to deal with the additional consumer engagement costs. Some may therefore choose not to enter markets with such safeguards in place.
VII.
ANALYSIS OF IMPACTS AND CONCLUSIONS
All options have been compared against each other using, the baseline scenario as a reference and applying the following criteria:
-
Effectiveness: the options proposed should first and foremost be effective and thus be suitable to addressing the specified problem;
-
Efficiency: this criterion assesses the extent to which objectives can be achieved at the least cost (benefits versus the costs).
Policy options regarding the need to adapt the market design to the increasing share of variable decentralised generation and technological developments (Problem Area I)
Options 1(a) (level playing field), 1(b) (strengthening short-term markets) and 1(c) (demand response/distributed resources) represent an interlinked set of measures regarding the integration of the national electricity markets and present a compromise between bottom-up initiatives and top-down steering of the market development, without substituting the role of national governments, regulators and TSOs by a centralised and fully harmonised system.
However, Option 1(a) (level playing field) and Option 1(b) (strengthening short-term markets) do not cover measures to pull all distributed flexible resources (demand-response, renewable electricity and storage) into the market. These options do not take advantage of the potential offered by these resources to efficiently operate and decarbonise the electricity market.
In this context, Option 1(c) (demand response/distributed resources) provides a more holistic, effective and efficient package of solutions. While this option may lead to minor additional administrative impacts for Member States and competent authorities regarding the implementation and monitoring of the measures, these impacts will be offset by lower barriers to entry to start-ups and SMEs, by the benefits to market parties from more stable regulatory frameworks and new business opportunities as well as by the benefits to consumers from more competition and access to wider choice.
As regards Option 2 (fully integrated market), while having advantages in terms of less coordination requirements (i.e., a fully integrated EU-market can be operated more efficiently), the results of the assessment indicate that the move towards a more integrated European approach has less significant economic added value since most of the benefits will have already been reaped under the regional, more decentralised approach under option. In addition, it has significant impacts on stakeholders, Member States and competent authorities since it requires significant changes to established practices.
Preferred option for Problem Area I: Option 1(c) (demand response/distributed resources, also encompassing options 1(a) (level playing field) and 1(b) (strengthening short-term markets))
Policy options regarding uncertainty about sufficient future generation investments and uncoordinated capacity mechanisms (Problem Area II)
Option 1 (reinforced energy only market without capacity mechanisms) can in principle provide the right signals for market operation and ensure system adequacy and ensure better utilisation of resources across borders, demand participation and renewable integration without subsidies. Improving the functioning of electricity markets will improve the conditions for investment in the electricity market to ensure reliable and effective supply of electricity, even in times of scarcity. This will in turn decrease the need for capacity mechanisms.
However, markets are today still characterised by manifold regulatory distortions today and removing the distortive effects will not be possible with immediate effects in many Member States. Besides under such option, uncertainty about future policy directions or governmental interventions still exists. Such uncertainty may hamper investment and in turn create the need for mechanisms that address the lack of investments ('missing money').
It should be noted that undistorted energy price signals are fundamental irrespective of whether generators are solely relying on energy market incomes or also receive capacity payments. Therefore the measures aimed at removing distortions from energy-only markets discussed under Option 1(a) to 1(c) (e.g. scarcity pricing or reinforced locational signals) are 'no-regrets' and assumed as being integral parts of Options 2, 3 and 4.
Option 2 (Improved energy markets – Capacity Mechanisms ('CM's) only when needed, based on a common EU-wide adequacy assessment can improve the overall cost-efficiency of the electricity sector through establishing an EU-wide approach to system adequacy assessments as opposed to national-based adequacy assessments. At the same time Option 2 does not allow reaping the full benefits of cross-border participation in capacity mechanisms.
A more coordinate approach to state interventions across Member States is needed and is a clear priority for reform. Placing capacity mechanisms into a more regional/EU context is a pre-requisite to reduce market distortions. It is indeed necessary that the schemes Member States introduce are compatible with internal market rules.
Option 3 (Improved energy market – CMs only when needed, plus cross-border participation) proposes additional measures to avoid fragmentation of capacity mechanisms and ensures that foreign resource providers can effectively participate in national capacity mechanisms and avoids competition and market distortions resulting from capacity payments which are reserved to domestic participants. As a result, it reduces investment distortions that might be present in Option 2 because of uncoordinated approaches to cross-border participation.
Preferred option for Problem Area II: Option 3 (Improved energy market – CMs only when needed, plus cross-border participation) (encompassing also Options 1 and 2)
Policy options regarding the lack of coordination among Member States when preparing for and managing electricity crisis situations (Problem Area III)
Based on a set of clear common rules, Option 1 (Common minimum EU rules) would improve the level of transparency and crisis management across Europe and is likely to reduce the chances of premature market intervention. The policy tools proposed under this option would bring economic benefits to businesses and consumers by helping to prevent costly blackout situations. However, this option does not solve the issue of uncoordinated planning and preparation ahead of a crisis since Member State are not required to take into account cross-border risks and crisis.
Under Option 2 (EU rules + regional cooperation), the regionally coordinated plans ensure the regional identification of risks and the consistency of the measures for prevention and managing crisis situations while respecting national differences and competences. This significantly improves the level of preparedness (compared to Option 1) at national, regional and EU level, as the cross border considerations are duly taken into account since the beginning. A regional approach to security of supply results in a better utilisation of power plants and guarantees risk preparedness at a lesser cost.
Under Option 3 (Full harmonisation), the estimated impact on cost is likely to be high (notably with the creation of an EU agency on cyber-security) and the measures put forward appear disproportionate compared to the expected effectiveness. Indeed, this option represents a highly intrusive approach – with significant administrative impact - by resorting to a full harmonisation of principles and the prescription of concrete solutions.
Preferred option for Problem Area III: Option 2 (EU rules + regional cooperation)
Policy options regarding retail markets and the slow deployment and low levels of services and poor market performance (Problem Area IV)
Given its low implementation costs, Option 0+ (Non-regulatory approach) is a highly efficient option. However, the effectiveness of Option 0+ is significantly limited by the fact that non-regulatory measures are not suitable for tackling the poor data flow between retail market actors that constitutes both a barrier to entry and a barrier to higher levels of service to consumers. In addition, shortcomings in the existing legislation make it impossible to significantly improve consumer engagement and energy poverty safeguards. They also introduce great uncertainty around the drive to phase out price regulation which does not provide sufficient incentives to consumers to play an active role in the market and which also limits competition and new entrants into the market.
Option 1 (Flexible legislation) would lead to substantial economic benefits. Retail competition would be improved as a result of the progressive phase-out of blanket price regulation, non-discriminatory access to consumer data, and increased consumer engagement. In addition, consumers would see direct benefits through improved switching.
In Option 2 (Harmonization and extensive consumer safeguards) there is uncertainty over the size of the economic benefits. This uncertainty stems from the tension some of the measures in Option 2 may have with competition (stronger disconnection safeguards, an outright ban on all switching-related charges), and from the difficulty of prescribing EU-level solutions in certain areas (defining exceptions to price deregulation, implementing a standard EU bill design). Besides, a single EU data management model would have high implementation costs, thus reducing the efficiency of the option.
Preferred option for Problem Area IV: Option 1 (Flexible legislation)
***
Table of contents
1.
Introduction
1.1.
Background and scope of the market design initiative
1.1.1.
Context of the initiative
1.1.1.1.
The gradual process of creating an internal electricity market
1.1.1.2.
The Union's policy concerning climate change
1.1.1.3.
Paradigm shift in the electricity sector
1.1.1.4.
The vision for the EU electricity market in 2030 and beyond
1.1.2.
Scope of the initiative
1.1.2.1.
Current relevant legislative framework
1.1.2.2.
Policy development subsequent to the Third Package
1.1.2.3.
Scope and summary of the initiative
1.1.3.
Organisation and timing
1.1.3.1.
Follow up on the Third Package
1.1.3.2.
Consultation and expertise
1.2.
Interlinkages with parallel initiatives
1.2.1.
The Renewable Energy Package comprising the new Renewable Energy Directive and bioenergy sustainability policy for 2030 ('RED II')
1.2.2.
Commission guidance on regional cooperation
1.2.3.
The Energy Union governance initiative
1.2.4.
The Energy Efficiency legislation ('EE') and the related Energy Performance of Buildings Directive ('EPBD') including the proposals for their amendment.
1.2.5.
The Commission Regulation establishing a Guideline on Electricity Balancing ('Balancing Guideline')
1.2.6.
Other relevant instruments
2.
Problem Description
2.1.
Problem Area I: Market design not fit for an increasing share of variable decentralized generation and technological developments
2.1.1.
Driver 1: Short-term markets, as well as balancing markets, are not efficiently organised
2.1.2.
Driver 2: Exemptions from fundamental market principles
2.1.3.
Driver 3: Consumers do not actively engage in the market and demand response potential remains largely untapped
2.1.4.
Driver 4: Distribution networks are not actively managed and grid users are poorly incentivised
2.2.
Problem Area II: Uncertainty about sufficient future generation investments and uncoordinated capacity markets
2.2.1.
Driver 1: Lack of adequate investment signals due to regulatory failures and imperfections in the electricity market
2.2.2.
Driver 2: Uncoordinated state interventions to deal with real or perceived capacity problems
2.3.
Problem Area III: Member States do not take sufficient account of what happens across their borders when preparing for and managing electricity crisis situations
2.3.1.
Driver 1: Plans and actions for dealing with electricity crisis situations focus on the national context only
2.3.2.
Driver 2: Lack of information-sharing and transparency
2.3.3.
Driver 3: No common approach to identifying and assessing risks
2.4.
Problem Area IV: The slow deployment of new services, low levels of service and questionable market performance on retail markets
2.4.1.
Driver 1: Low levels of competition on retail markets
2.4.2.
Driver 2: Possible conflicts of interest between market actors that manage and handle data
2.4.3.
Driver 3: Low levels of consumer engagement
2.5.
What is the EU dimension of the problem?
2.6.
How would the problem evolve, all things being equal?
2.6.1.
The projected development of the current regulatory framework
2.6.2.
Expected evolution of the problems under the current regulatory framework
2.7.
Issues identified in the evaluation of the Third Package
3.
Subsidiarity
3.1.
The EU's right to act
3.2.
Why could Member States not achieve the objectives of the proposed action sufficiently by themselves?
3.3.
Added-value of action at EU-level
4.
Objectives
4.1.
Objectives and sub-objectives of the present initiative
4.2.
Consistency of objectives with other EU policies
5.
Policy options
5.1.
Options to address Problem Area I (Market design not fit for an increasing share of variable decentralized generation and technological developments)
5.1.1.
Overview of the policy options
5.1.2.
Option 0: Baseline Scenario – Current Market Arrangements
5.1.3.
Option 0+: Non-regulatory approach
5.1.4.
Option 1: EU Regulatory action to enhance market flexibility
5.1.4.1.
Sub-option 1(a): Level playing field amongst participants and resources
5.1.4.2.
Sub-option 1(b): Strengthening short-term markets
5.1.4.3.
Sub-option 1(c): Pulling demand response and distributed resources into the market
5.1.5.
Option 2: Fully Integrated EU market
5.1.6.
For Option 1 and 2: Institutional framework as an enabler
5.1.7.
Summary of specific measures comprising each Option
5.2.
Options to address Problem Area II (Uncertainty about sufficient future generation investments and uncoordinated capacity markets)
5.2.1.
Overview of the policy options
5.2.2.
Option 0: Baseline Scenario – Current Market Arrangements
5.2.3.
Option 0+: Non-regulatory approach
5.2.4.
Option 1: Improved energy market - no CMs
5.2.5.
Option 2: Improved energy market – CMs only when needed, based on a common EU-wide adequacy assessment)
5.2.6.
Option 3: Improved energy market - CMs only when needed, based on a common EU-wide adequacy assessment, plus cross-border participation
5.2.7.
Option 4: Mandatory EU-wide or regional CMs
5.2.8.
Discarded Options
5.2.9.
Summary of specific measures comprising each Option
5.3.
Options to address Problem Area III (When preparing or managing crisis situations, Member States tend to disregard the situation across their borders)
5.3.1.
Overview of the policy options
5.3.2.
Option 0: Baseline scenario – Purely national approach to electricity crises
5.3.3.
Option 0+: Non-regulatory approach
5.3.4.
Option 1: Common minimum rules to be implemented by Member States
5.3.5.
Option 2: Common minimum rules to be implemented by Member States, plus regional co-operation
5.3.6.
Option 3: Full harmonisation and decision-making at regional level
5.3.7.
Discarded Options
5.3.8.
Summary of specific measures comprising each Option
5.4.
Options to address Problem Area IV (Slow deployment and low levels of services and poor market performance)
5.4.1.
Overview of the policy options
5.4.2.
Option 0: Baseline Scenario - Non-competitive retail markets with poor consumer engagement and poor data flows
5.4.3.
Option 0+: Non-regulatory approach to address competition and consumer engagement
5.4.4.
Option 1: Flexible legislation addressing all problem drivers
5.4.5.
Option 2: EU Harmonization and extensive safeguards for consumers addressing all problem drivers
5.4.6.
Summary of specific measures comprising each Option
6.
Assessment of the impacts of the various policy options
6.1.
Assessment of economic impacts for Problem Area I (Market design not fit for an increasing share of variable decentralized generation and technological developments
6.1.1.
Methodological Approach
6.1.1.1.
Impacts Assessed
6.1.1.2.
Modelling and use of studies
6.1.1.3.
Summary of Main Impacts
6.1.1.4.
Overview of Baseline (Current Market Arrangements)
6.1.2.
Policy Sub-option 1(a) (Level playing field amongst participants and resources)
6.1.2.1.
Economic impacts
6.1.2.2.
Who would be affected and how
6.1.2.3.
Administrative impact on businesses and public authorities
6.1.3.
Impacts of Policy Sub-option 1(b) (Strengthening short-term markets)
6.1.3.1.
Economic Impacts
6.1.3.2.
Who would be affected and how
6.1.3.3.
Administrative impact on businesses and public authorities
6.1.4.
Impacts of Policy Sub-option 1(c) (Pulling demand response and distributed resources into the market)
6.1.4.1.
Economic Impacts
6.1.4.2.
Who would be affected and how
6.1.4.3.
Impact on businesses and public authorities
6.1.5.
Impacts of Policy Option 2 (Fully integrated EU market)
6.1.5.1.
Economic Impacts
6.1.5.2.
Who would be affected and how
6.1.5.3.
Impact on businesses and public authorities
6.1.6.
Environmental impacts of options related to Problem Area I
6.1.7.
Summary of modelling results for Problem Area I
6.2.
Impact Assessment for Problem Area II (Uncertainty about future generation investments and fragmented capacity mechanisms)
6.2.1.
Methodological Approach
6.2.1.1.
Impacts Assessed
6.2.1.2.
Modelling
6.2.1.3.
Overview of Baseline (Current Market Arrangements)
6.2.2.
Impacts of Policy Option 1 (Improved energy markets - no CMs )
6.2.2.1.
Economic Impacts
6.2.2.2.
Who would be affected and how
6.2.2.3.
Administrative impact on businesses and public authorities
6.2.3.
Impacts of Policy Option 2 (Improved energy markets – CMs only when needed, based on a common EU-wide adequacy assessment)
6.2.3.1.
Economic Impacts
6.2.3.2.
Who would be affected and how
6.2.3.3.
Impact on businesses and public authorities
6.2.4.
Impacts of Policy Option 3 (Improved energy market – CMs only when needed, plus cross-border participation)
6.2.4.1.
Economic Impacts
6.2.4.2.
Who would be affected and how
6.2.4.3.
Impact on businesses and public authorities
6.2.5.
Environmental impacts of options related to Problem Area II
6.2.6.
Overview of modelling results for Problem Area II
6.2.6.1.
Improved Energy Market as a no-regret option
6.2.6.2.
Comparison of Options 1 to 3
6.2.6.3.
Delivering the necessary investments
6.2.6.4.
Level and volatility of wholesale prices
6.3.
Impact Assessment for problem Area III (reinforce coordination between Member States for preventing and managing crisis situations)
6.3.1.
Methodological Approach
6.3.2.
Impacts of Policy Option 1 (Common minimum rules to be implemented by Member States)
6.3.2.1.
Economic impacts
6.3.2.2.
Who would be affected and how
6.3.2.3.
Impact on businesses and public authorities
6.3.3.
Impacts of Policy Option 2 (Common minimum rules to be implemented by Member States plus regional co-operation)
6.3.3.1.
Economic impacts
6.3.3.2.
Who would be affected and how
6.3.3.3.
Impact on businesses and public authorities
6.3.4.
Impacts of Policy Option 3 (Full harmonisation and full decision-making at regional level)
6.3.4.1.
Economic impacts
6.3.4.2.
Who would be affected and how
6.3.4.3.
Impact on businesses and public authorities
6.4.
Impact Assessment for Problem Area IV (Increase competition in the retail market)
6.4.1.
Methodological Approach
6.4.2.
Impacts of Policy Option 0+ (Non-regulatory approach to improving competition and consumer engagement)
6.4.2.1.
Economic Impacts
6.4.2.2.
Who would be affected and how
6.4.2.3.
Impact on businesses and public authorities
6.4.3.
Impacts of Policy Option 1 (Flexible legislation addressing all problem drivers)
6.4.3.1.
Economic Impacts
6.4.3.2.
Who would be affected and how
6.4.3.3.
Impact on businesses and public authorities
6.4.4.
Impacts of Policy Option 2 (Harmonization and extensive safeguards for consumers addressing all problem drivers)
6.4.4.1.
Economic Impacts
6.4.4.2.
Who would be affected and how
6.4.4.3.
Impact on businesses and public authorities
6.4.5.
Environmental impacts
6.4.6.
Impacts on fundamental rights regarding data protection
6.5.
Social impacts
7.
Comparison of the options
7.1.
Comparison of options for adapting market design for the cost-effective operation of variable and often decentralised generation, taking into account technological developments
7.2.
Comparison of Options for facilitating investments in the right amount and in the right type of resources for the EU
7.3.
Comparison of options for improving Member States' reliance on each other in times of system stress and reinforcing coordination between Member States for preventing and managing crisis situations
7.4.
Comparison of options for addressing the causes and symptoms of weak competition in the energy retail market
7.5.
Synergies, trade-offs between Problem Areas and sequencing
7.5.1.
Synergies
7.5.2.
Trade-offs
7.5.3.
Sequencing of measures
8.
Monitoring and evaluation
8.1.
Future monitoring and evaluation plan
8.2.
Annual reporting by ACER and evaluation by the Commission
8.2.1.
Annual reporting by ACER
8.2.2.
Evaluation by the Commission
8.3.
Monitoring by the Electricity Coordination Group
8.4.
Operational objectives
8.5.
Monitoring indicators and benchmarks
9.
Glossary and Acronyms
1.Introduction
1.1.Background and scope of the market design initiative
1.1.1.Context of the initiative
1.1.1.1.The gradual process of creating an internal electricity market
Well-functioning energy markets that ensure secure energy supplies at competitive prices are key for achieving growth and consumer welfare in the European Union.
Since 1996, the European Union has put in place legislation to enable the transition from an electricity system traditionally dominated by vertically integrated national incumbents that owned and operated all the generation and network assets in their territories to competitive, well-functioning and integrated electricity markets. The first step was the adoption of the First Energy Package (1996 for the electricity sector and 1998 for the gas sector), which allowed for the partial opening of the market where the largest consumers were given the right to choose their supplier. The Second Energy Package (2003) introduced changes concerning the structure of the vertically integrated companies (legal unbundling), the preparation of the full opening of the market by 1 July 2007 and the reinforcement of the powers of the national regulators. The most recent comprehensive reform of European energy market rules, the Third Internal Energy Market Package (2009)
('Third Package') has principally aimed at improving the functioning of the internal energy market and resolving structural problems.
Since the adoption of the Third Package, electricity policy decisions have enabled competition and increasing cross-border flows of electricity, notably with the introduction of so called "market coupling"
and "flow-based" capacity allocation. In spite of significant differences in the maturity of markets in Europe, overall electricity wholesale markets are increasingly characterised by fair and open competition, and – though still insufficient – competition is also taking root at the retail level.
1.1.1.2.The Union's policy concerning climate change
The decarbonisation of EU economies is at the core of the EU’s agenda for climate change and energy. The targets in the Climate and Energy Package (2007) require Member States to cut their greenhouse gas emissions by 20% (from 1990 levels), to produce 20% of their energy from renewable energy sources (RES), and to improve energy efficiency by 20 % (the '2020 targets').
In 2011, the European Union committed to reduce greenhouse gas emissions to 80-95% below 1990 levels by 2050. For this purpose, the European Commission adopted an Energy Roadmap
and a roadmap for moving to a competitive low carbon economy exploring the transition of the energy system in ways that would be compatible with this greenhouse gas reductions target while also increasing competitiveness and security of supply. The 2050 roadmap will require a higher degree of decarbonisation from the electricity sector compared to other economic sectors.
These ambitions were reaffirmed by the European Council of October 2014, which endorsed targets for 2030 of at least 40 % for domestic greenhouse gas emissions reduction (compared to 1990 levels), at least 27 % for the share of renewable energy consumption, binding at EU level and at least 27 % energy savings, to be reviewed by 2020, having in mind an EU level of 30% (the '2030 targets').
At the Paris climate conference (COP21) in December 2015, 195 countries adopted the first-ever legally binding global climate deal. The European Council of March 2016 confirmed the EU's commitment to implement the 2030 targets. The Paris Agreement was ratified by the European Union and entered into force on 4 November 2016..
1.1.1.3.Paradigm shift in the electricity sector
The Union's goals for climate change and energy have led to a paradigm shift in the means employed to generate electricity: since the adoption of the Third Package, there has been a move towards the deployment of capital-intensive low marginal cost, variable and often decentralised electricity from RES E (mostly from solar and wind technologies) that is expected to become more pronounced by 2030.
The increasing penetration of RES E is driven inter alia by the objective to reduce greenhouse gas emissions in line with the 2020 and 2030 targets. The 2030 greenhouse gas emission reduction target is to be delivered through reducing emissions by 43% compared to 2005 for the sectors in the EU's ETS
(including the electricity sector and industry) and by 30% compared to 2005 for the sectors outside the ETS. Within the electricity sector, the reduction of greenhouse gas emissions is supported by the Renewable Energy Directive
, the ETS and the additional national policies by Member States to increase the share of renewables in the energy mix.
The Renewable Energy Directive established a European framework for the promotion of renewable energy, setting mandatory national renewable energy targets for achieving a 20% EU share of renewable energy in the final energy consumption and a 10% share of energy from renewable sources in transport by 2020. These objectives have translated into a need to foster the increased production of electricity from reneweble energy sources.
In parallel with the increased deployment of variable and decentralized RES E, the increasing digitalisation of electricity networks and the environment behind the meter now enables many elements of the electricity system to be operated more flexibly and efficiently in the context of RES E generation. It also allows smaller actors to play an increasingly important part in the market on both the supply side and – crucially – the demand side, potentially untapping a vast new system resource.
From the consumer's perspective, increasingly intelligent grids unlock a host of other possibilities, including innovative new products and services, lower entry barriers for new suppliers, and improved billing and switching. This promises to unlock value and improve the consumer experience – provided the legislative framework adapts to the changing needs and possibilities. Indeed, fully engaging end consumers will be essential to realizing the full benefits that the digital transformation can bring in terms of grid flexibility.
Moreover, electricity demand will progressively reflect the increasing electrification of transport and heating.
The challenges the EU's electricity systems face are reflected in the European Commission Communication of February 2015 on “A Framework Strategy for a Resilient Energy Union with a Forward-Looking Climate Change Policy”
where the Commission announced a new electricity market design linking wholesale and retail markets. As part of the legislative reform process needed to establish the Energy Union, it also announced new legislation on security of electricity supply.
In the light of the Energy Union Framework Strategy, the present impact assessment reflects and analyses the need and policy options for a possible revision of the main framework governing electricity markets and security of electricity supply policies in Europe. The new electricity market design contributes strongly to the overall Energy Union objectives of securing low carbon energy supplies to the European consumers at least costs.
1.1.1.4.The vision for the EU electricity market in 2030 and beyond
The Energy Union Framework Strategy sets out the vision of an Energy Union "with citizens at its core, where citizens take ownership of the energy transition, benefit from new technologies to reduce their bills, participate actively in the market, and where vulnerable consumers are protected". Well-functioning energy markets that ensure secure energy supplies at competitive prices are important for achieving growth and consumer welfare in the European Union. The future of the entire energy sector will, to a significant extent, be shaped by the evolution of the electricity sector, which is key to addressing climate change. With the quick ratification of the global Paris Agreement on climate change and its subsequent entry into force, it becomes clear how important it is for all parties to the agreement, including the EU, to deliver on the clean energy transition on the ground. In fact, amongst all sectors that make up our energy system, electricity is the most cost-effective to decarbonise. Currently 27.5% of Europe's electricity is produced from renewable energy sources. The share of RES E in electricity generation needs to almost double by 2030 in order for the EU to meet its 2030 energy and climate targets cost-effectively. This will require creating the right conditions for the massive amount of investment needed for this energy transition to come about. At the same time electricity markets will have to adapt to the radical change in the structure of the generation pattern which will foremost require creating a more flexible market, going across borders, that is able to allow more active participation of a much wider range of actors.
The EU's vision of the electricity system in 2030 is therefore based on a functioning market that is adapted to implementing the decarbonisation agenda at least cost together with a revised EU ETS. A well-functioning electricity market is also the most efficient tool to ensure secure electricity supplies at the lowest reasonable cost.
The transition of the energy system towards the 2030 vision
The starting point is the existing reality, which dates back to an era with large-scale, centralised power plants, largely fuelled by fossil fuels, had the key aim of supplying every home and business in a delineated area – typically a Member State – with as much electricity as they wanted, and in which consumers – households, businesses and industry – were passive users.
However, the electricity market is undergoing profound change and requires a new set of rules to ensure secure supplies, competitiveness while enabling cost-effective decarbonisation. The electricity market of the next decade will be characterised by more variable and decentralised electricity production, an increased interdependence between Member States and new technological opportunities for customers to reduce their bills and actively participate in electricity markets through demand response, self-consumption or storage.
The electricity market design initiative aims to improve the functioning of the internal electricity market in order to allow electricity to move freely to where and when it is most needed, empower consumers, reap maximum benefits for society from cross-border competition and provide the right signals and incentives to drive the right investments compatible with climate change, renewable energy and energy efficiency ambitions.
The proposed initiative constitutes a next-step in a wider and longer evolutionary process that will guide the EU's electricity markets towards the 2030 vision.
The 2030 electricity market is highly flexible and provides a level playing field amongst all forms of generation as well as demand response…
The bulk of the new generation capacity is likely to come from renewable sources, mainly wind and sun that are variable and predictable only to a limited extent. The future electricity market will therefore need to be more flexible and liquid than today and allow for integrated short-term trading. This would also set the ground for renewable energy producers – who will over time acquire increasing share in generation - to equally access energy wholesale markets and to compete on an equal footing with conventional energy producers. Short-term markets will also allow Member States to share their resources across all "time frames" (forward trading, day-ahead, intraday and balancing), taking advantage of the fact that peaks and weather conditions across Europe do not occur at the same time. This would provide maximum opportunity to meet the flexibility needs and balance the market. The sequence of forward markets and spot markets - day-ahead, intraday and balancing - will optimise prices and the system in the short-run and will reveal the true value of electricity and, therefore, provide appropriate investments signals in the long-run.
The closer to real time electricity is traded (supply and demand matched), the less the need for costly interventions by TSOs to maintain a stable electricity system. Although TSOs would have less time to react to schedule deviations and unexpected events and forecast errors, the liquid, better interconnected balancing markets, together with the regional procurement of balancing reserves and more balancing actors and products available from both demand and supply side, would be expected to provide them adequate and more efficient resources in order to manage the grid and facilitate RES E integration.
All this will help to create a level playing field not only among all modes of generation but also the demand side. At the same time market distortions and rules that artificially limit or favour the access of certain technologies to the grid would be removed. All market participants would become gradually responsible for balancing their position in the market, bearing financial responsibility for the imbalances they cause and would, therefore, be incentivised to reduce the risk of such imbalances. The most cost-efficient sources of electricity would be used first, curtailment of generation due to limited transmission and distribution infrastructure would be a measure of last resort and confined to situations in which no market-based responses (including storage and demand response) are available, and subject to transparent rules known in advance to all market actors and adequate financial compensation. All resources would be remunerated in the market on equal terms.
…and active consumers.
Ensuring that all consumers – big and small – can actively participate in the energy market would unlock a vast system resource that could play an important role in reducing system costs. Technology – including smart grids and smart homes - is already available and will further develop to enable consumers to modulate their demand while maintaining comfort and reducing costs.
In the future, consumers would be sufficiently incentivised to benefit from these opportunities and thus demand response would be provided by all willing consumer groups, including residential and commercial consumers either directly or through intermediaries (like aggregators). This would further increase the flexibility of the electricity system and the resources for the TSOs and DSOs to manage it. At the same time it should lead to a much more efficient operation of the whole energy system.
Consumers would be able to react to price signals on electricity markets both in terms of consumption and production; they would consume when prices are low, when there is plenty of electricity available, and reduce their consumption at times of low electricity production and high prices. To make this possible, consumers have access to a fit-for-purpose smart metering system, smart homes and storage as well as electricity supply contracts with prices linked dynamically to the wholesale markets.
More and more consumers would produce their own electricity. Such decentralised production further strengthens security of supply and helps to implement the decarbonisation agenda as most of this production comes from renewable sources. If combined with local storage solutions, consumers could significantly contribute to balancing the distribution grids at local level. Analysis suggests that this development will be progressive, and that most consumers would still remain connected to the distribution grid to use it as back-up for when the prosumers' own generation is inadequate (e.g. for sustained periods of low sunlight) or for the opportunity to sell excess electricity to the market (e.g. during prolonged sunny periods when their installed storage is at full capacity).
Reducing barriers to market entry for electricity suppliers and consumer engagement – notably phasing out price regulation – results in increased competition at the retail level allowing consumers to save money through better information and a wider choice of action. This also helps drive the uptake of innovative new products and services that increase system flexibility through demand response whilst catering to consumers' changing needs and abilities.
In addition, DSOs would be enabled and incentivised, without compromising their neutrality as system operators, to manage their networks in a flexible and cost-efficient way – inter alia through revised tariff structures.
Increased cross-border trade is a pillar of the electricity market.
Competition and cross-border flows of electricity would further increase, with fully coupled markets where price differences between Member States are smoothened out. Electricity wholesale markets will be characterised by fair and open competition, including across borders. Cooperation between TSOs will be enhanced by regional operational centres. The cross-border cooperation of TSOs would be accompanied by an increased level of cooperation between regulators and governments. An adequate cross-border infrastructure remains crucial to underpin a well-functioning electricity market.
Increasingly investments are triggered by the market with a decreasing need for state subsidies.
The enhanced market design, the revised renewables directive and the strengthened ETS will all help to improve the viability of RES E investments, in particular as follows:
-Where the marginal producer is a fossil fired power plant, a higher carbon price translates into higher average wholesale prices. The existing surplus of allowances is expected to decrease due to the implementation of the Market Stability Reserve and the higher Linear Reduction Factor, reducing the current imbalance between supply and demand for allowances;
-greater system flexibility will be critical for better integration of RES E in the system, reducing their hours of curtailment and the related forgone revenues; improving overall system flexibility is equally essential to limit the merit-order effect and thus in avoiding the erosion of the market value of RES E produced electricity;
-the revision of priority dispatch rules, removal of must-run units, increasing demand response and storage, together with the better functioning of the short-term markets will strongly reduce or even eliminate the occurrence of negative prices – leading again to higher average wholesale prices (especially during the hours with significant variable RES E generation);
-improved rules for intraday and balancing markets will increase their liquidity and allow access to those markets for all resources, thus helping generators reduce their balancing costs;
-removing existing (explicit or implicit) restrictions for the participation of all resources to the reserve and ancillary services markets will allow RES E to generate additional revenues from these markets;
-price signals reflecting the actual value of electricity at each point of time, as well as the value of flexibility, will ensure that the flexible assets most needed for the system are invested in or, at least, are less likely to be decommissioned.
-Low exit barriers to facilitate exit of overcapacities.
The above mentioned changes will all help to improve the competitive situation of RES E and reduce the need for dedicated support.
The results of the modelling for this Impact Assessment indicate that investments in the most mature renewable technologies could be driven by the market by 2030 (such as certain solar PV and onshore wind). At the beginning of the period, generation over-capacity in certain areas, weaker investment signal from the ETS and low wholesale market prices and still high RES E technology costs, make the case for investments in RES E technologies more difficult. The underpinning modelling and analysis, points that the RES E funding gap in 2020 is gradually reducing towards 2030 as the market conditions improve. Less mature RES E technologies, needed for meeting the 2030 and 2050 energy and climate objectives, such as off-shore wind, will likely need some form of support to cover at least a fraction of total project costs (complementing the revenues obtained from the energy markets) throughout the 2021-2030 period.
The picture also depends on regions. RES E technologies could be more easily financed by the market in the regions with the highest potential (e.g. onshore wind in the Nordic region or solar in Southern Europe), while RES E could continue to require support in the British Isles and in Central Europe. Conditions however also depend on the cost of capital.
At the same time it has to be acknowledged that whether and what point in time financing of RES E through markets alone will actually take off remains difficult to predict. This is because financing of capital intensive technologies such as most RES E through markets based on marginal cost pricing will remain challenging. In the absence of measures that address system flexibility, higher penetration of RES with low marginal cost could reduce the market value that such RES E can actually achieve. Removing barriers to the flexibilisation of demand and improving the responsiveness of demand and supply to price signals stands out as a key measure in this regards in order to further stabilise the revenue of RES E producers from the market.
On the other hand the future capacity of RES to be financed through the market will also depend on certain conditions outside of the market design and ETS prices, such as continued decrease in the costs of technologies, availability of capital at a reasonable price, social acceptance and sufficiently high and stable fossil fuel prices.
While the market reforms described above are therefore no regret options to facilitate RES investment, support schemes will still be needed at least for a transitional period. It is therefore essential to further reform such schemes to make them as market-oriented as possible.
… with a market-based and more Europeanised approach to support schemes to cover any investment gap .
Where needed, support will be (i) cost-effective and kept to a minimum, and (ii) will create as little distortions as possible to the functioning of electricity markets, and to competition between technologies and between Member States. The legal frame for RES E support schemes would ensure sufficient investor certainty over the 2021-2030 period and require the use (where needed) of market-based and cost-effective schemes, based on the design of emerging best practices. Auctions could introduce competitive forces to determine the level of support needed on top of market revenues and incentivise RES E producers to develop business models that maximise market-based revenues. The use of tenders would imply a natural phase-out mechanism for support, determining the remaining level of support required to bridge any financing gap. The continued participation of small and local actors, including energy communities, in the energy transition should be ensured in this process.
The market should also provide, as a principle, security of supply.
By 2030, the market, as described above, could in principle successfully attract the required investments to ensure adequate matching of supply and demand.
Today, most of the EU's power markets have more capacity than needed. However, with demand increasing, e.g. due to E-Mobility and heat pumps, and older power plants retiring supply margins are likely to get tighter. Therefore, a legal framework needs to be in place to allow for the formation of electricity prices that send the signals for tomorrow's investments. In this context, scarcity prices will become more and more important to provide the right incentives for the operation of resources (including for demand response) when they are most needed. Hedging products which suppliers can buy to protect themselves against peaks are already available now and more innovative tools are expected to be brought forward by market participants without the need for additional intervention by national authorities. This will also provide opportunities for generators (who will be natural provider of such hedging tools) to secure further revenues.
In the new market framework capacity mechanisms might only be considered if a residual risk to security of supply can be proven after underlying market distortions have been removed and the contribution of market integration to security of supply has been taken into account.
The legal framework will provide tools to facilitate an objective case-by-case judgement on whether the introduction of capacity mechanisms is needed and set out measures to ensure that their potentially distortive effects are kept at a minimum, while placing them in a more regional context. Accordingly, their need would have to be proven against an EU-wide system adequacy assessment and they would have to allow for cross-border participation to minimise distortions of investment incentives across the borders. Capacity mechanisms would be designed in a way as to not discriminate against different generation technologies and demand side capacities. Additionally, where need has been demonstrated for such mechanisms, Member States should take into account how such mechanisms would impact the achievement of the decarbonisation objectives.
Member States should regularly review their resource adequacy situation and phase out capacity mechanisms once the underlying market or regulatory concerns have been resolved.
Despite best efforts to build an integrated and resilient power market, crisis situations can never be excluded. The potential for crisis situation increases with climate change (i.e. extreme weather conditions) and with the emergence of new areas that are subject to criticalities (i.e. malicious attacks, cyber-threats). Such crises tend to often have an immediate cross-border effect in electricity. The legal framework would provide tools to ensure that national security of supply policies are better coordinated and aligned to tackle possible crisis situations, in particular those that affect several countries at the same time.
1.1.2.Scope of the initiative
1.1.2.1.Current relevant legislative framework
EU's electricity markets are currently regulated at EU level by a series of acts collectively referred to as the "Third Package"
.
The main objectives of the Third Package were:
-Improving competition through better regulation, unbundling and reducing asymmetric information;
-Improving security of supply by strengthening the incentives for sufficient investment in transmission and distribution capacities; and,
-Improving consumer protection and preventing energy poverty.
The Third Package mainly focused on improving the conditions for competition as resulting from previous generations of legislation by improving the level playing field. The most important root cause for the lack of competition identified at the time
was the existence of vertically integrated companies, which not only controlled essential facilities (such as electricity transmission systems) but also enjoyed significant market power in the wholesale and, often, retail markets. Many of the measures associated with the Third Package sought to directly or indirectly address this issue, such as by improving the unbundling regime, strengthening regulatory oversight, improving the conditions for cross-border market integration and lowering entry barriers such as by improving transparency.
The Third Package also created the possibility to enact secondary legislation concerning cross-border issues, often referred to as network codes or guidelines ('network codes')
, and provided a mandate for developing these network codes (as well as other tasks related to the EU's electricity markets) to transmission system operators within the ENTSO-E
and to national regulatory authorities, within the Agency for the Cooperation of Energy Regulators ('ACER')
.
The main framework for electricity security of supply in the Union is currently Directive 2005/89/EC ("Security of Electricity Supply Directive' or 'SoS Directive'")
. This SoS Directive requires Member States to take certain measures with the view to ensuring security of supply, but leaves it by and large to the Member States how to implement these measures. The Third Package complemented the SoS Directive and superseded de facto some of its provisions.
1.1.2.2.Policy development subsequent to the Third Package
The present initiative builds on previous related policy initiatives and reports that intervened since the adoption of the Third Package and the Security of Electricity Supply Directive, in particular:
-"Report on the progress concerning measures to safeguard security of electricity supply and infrastructure investment" COM (2010) 330 final
;
-"Delivering the internal electricity market and making the most of public interventions" (C(2013) 7243). This Communication was accompanied inter alia by a Commission Staff working document (SWD(2013)438) entitled "Generation Adequacy in the internal electricity market – guidance on public intervention";
-Communication on the "Progress towards completing the Internal Energy Market" COM(2014) 634 final. This Communication emphasized that energy market integration has delivered many positive results but that, at the same time, further steps are needed to complete the internal market;
-"Communication on Energy Security" (COM(2014)330). This Communication emphasised inter alia the need achieve a better functioning and a more integrated energy market;
-Special Report by the European Court of Auditors "Improving the security of energy supply by developing the internal energy market: more efforts needed". This special report made nine recommendations to reap the benefits of market integration
;
-"Communication on energy prices and costs in Europe" (COM(2014) 21 /2) and the accompanying "Energy prices and costs report" (SWD(2014)020 final 2) highlighting inter alia the competiveness of the EU's retail electricity markets, the missing link between wholesale and retail prices and the need for EU cooperation by DSOs as well as the Energy prices and costs report (SWD(2016)XX
, this report inter alia that shed light on the drivers of retail and wholesale price developments;
-"Delivering a new deal for energy consumers" (COM(2015) 339). This Communication laid out the Commission's intention to enable all consumers to fully participate in the energy transition, taking advantage of new technologies that enable wholesale and retail markets to be better linked.
-The Commisison published a study on "Investment perspectives in electricity markets"
-Technical Report
by the European Commission on "The economic impact of enforcement of competition policies on the functioning of EU energy markets". The report includes an assessment of the intensity of competition in the energy markets
(both wholesale and retail) and points out that, between 2005 and 2012, the intensity of competition in European energy markets may have declined
.
-The Commission Staff working document (SWD(2015)249) entitled "Energy Consumer Trends 2010 - 2015" presents market research into the problems that energy consumers continue to be confronted with.
-The Commission launched a a sector inquiry into national capacity mechanisms, The resulting "Interim Report of the Sector Inquiry on Capacity Mechanisms" (SWD SWD(2016) 119 final) points out that there is a lack of adequate assessment of the actual need for capacity mechanisms. It also appears that some capacity mechanisms in place could be better targeted and more cost effective. It emphasizes the need to design capacity mechanisms with transparent and open rules of participation and a capacity product that does not undermine the functioning of the electricity market, taking into account cross-border participation.
1.1.2.3.Scope and summary of the initiative
In line with the Union's policy on climate change and energy, the proposed initiative aims at deepening energy markets and setting a framework governing security of supply policies that enables the transition towards a low carbon electricity production.
The transition towards a low carbon electricity sector as well as technical progress will have profound implications on the manner in which the electricity sector is organised and the roles of market actors and consumers, not all of which can be foreseen with accuracy today. As it cannot be predicted how the electricity markets and progress of innovation will look like in a few decades from now, the proposed initiative constitutes a next step in a wider and longer evolutionary process that will guide the EU's electricity markets towards the future. The initiative will consequently not address the challenges that might arise when operating a fully decarbonised power system.
This initiative also aims at improving consumer protection and engagement for both electricity and gas consumers.
1.1.3.Organisation and timing
1.1.3.1.Follow up on the Third Package
Full and timely transposition of the Directives of the Third Package has been a challenge for the vast majority of the Member States. In fact, by the end of the transposition deadline (March 2011), none of the Member States had achieved full transposition. However, progess has been made and at present all of the infringement proceedings
for partial transposition of the Electricity Directive have been closed as the Member States achieved full transposition in the course of the proceedings.
In addition to ensuring compliance of national rules with the Third Package, the Commission has carried out assessments to identify and resolve problems concerning incorrect transposition or bad application of the Third Package. On this basis, the Commission has opened EU Pilot cases against a number of Member States. As of 7th July 2016, 8 of these EU Pilot cases have resulted in infringement procedures where, inter alia, the violation of the EU electricity market rules is at stake.
In January 2014 the Directorate General for Energy of the European Commission ('DG ENER') launched a public consultation on retail markets for energy.
Whilst preparing the single market progress report (COM(2014) 634 final), published on 13 October 2014, DG ENER decided to study a number of changes to the current legislation.
The Commission (DG ENER) started in 2015 the preparatory work for the present impact assessment to assess policy options related to the internal energy market for electricity and to security of electricity supply and consulted in July 2015 the public on a new energy market design (COM(2015) 340 final)
.
In April 2015, the Commission (DG Competition) launched a sector inquiry into national capacity mechanisms. The Commission interim report and the accompanying Commission staff working document, adopted on 13 April 2016 have provided a significant input for the proposed initiative. This will be further completed by the final report.
1.1.3.2.Consultation and expertise
The Commission has conducted a number of wide public consultations on the different policy areas covered by the present Impact assessment which took place between 2014 and 2016. In addition to the public consultations, it has organised a number of targeted consultations with stakeholders throughout 2015 and 2016
.
Given the cross-cutting nature of the planned impact assessment work, the Commission set up an inter-service steering group which included representatives from a selected number of Commission Directorate Generals. The inter-service steering group held regular meetings to discuss the policy options of the proposed initiatives and the preparation of the impact assessment
.
In parallel, the Commission has also conducted a number of studies mainly or specifically for this impact assessment
.
1.2.Interlinkages with parallel initiatives
The proposed initiatives are strongly linked to other energy and climate related legislative proposals brought forward in parallel with the present initiative equally aimed at delivering upon the five dimensions of the Energy Union, namely energy security, solidarity and trust, a fully integrated European energy market, energy efficiency contributing to moderation of demand, decarbonisation, research, innovation and competitiveness. These other energy related legislative proposals include:
1.2.1.The Renewable Energy Package comprising the new Renewable Energy Directive and bioenergy sustainability policy for 2030 ('RED II')
The RED II covers a number of measures deemed necessary to attain the EU binding objective of reaching a level of at least 27% RES in final energy consumption by 2030 across the electricity, heating and cooling, and transport sectors. As regards electricity in particular, the Renewables Directive proposes a framework for the design of support schemes for renewable electricity, a framework for renewable self-consumption and renewable energy communities, as well as various measures to reduce administrative costs and burden.
Conversely, measures aimed at the integration of RES E in the market, such as provisions on priority dispatch and access previously contained in the renewables directive are part of the present market design initiative. The reflections on a revised Renewables Energy Directive will include specific initiatives on support schemes for market-oriented, cost-effective and more regionalised support to RES up to 2030 in case Member States were opting to have them as a tool to facilitate target achievement. The Renewable Package is expected to deal with legal and administrative barriers for self-consumption, whereas the present package will address market related barriers to self-consumption.
The Renewable Energy package has synergies with the present initiative as it seeks to adapt the current market design, optimised for large-scale, centralised power plants, to a suitable one for the cost-effective operation of variable, decentralised generation of electricity whilst taking into account technological progress creating the conditions for a cost efficient achievement of the binding EU RES target in the electricity sector.
The enhanced market design will improve the viability of RES E investments, but electricity market revenues alone might not prove sufficient in attracting renewable investments in a timely manner and at the required scale to meet EU's 2030 targets. The MDI and RED II impact assessments thus jointly come to the conclusion that the improved electricity market, in conjunction with a reformed EU ETS could, under certain conditions, deliver investments in the most mature renewable technologies (such as solar PV and onshore wind). The underpinning modelling and analysis, points that the RES E funding gap in 2020 is gradually reducing towards 2030 as market conditions improve. Less mature RES E technologies, needed for meeting the 2030 and 2050 energy and climate objectives, such as off-shore wind, will likely need some form of support to cover at least a fraction of total project costs (complementing the revenues obtained from the energy markets) throughout the 2021-2030 period. These technologies are required if RES E technologies are to be deployed to the extent required for meeting the 2030 and 2050 energy and climate objectives, and provide an important basis for the long-term competitiveness of an energy system based on RES E.
Similarly, the progressive reform of RES E support schemes as proposed by the RED II initiative, building on the Guidelines on State aid for environmental protection and energy 2014-2020 ('EEAG'), is a prerequisite for the results of the present initiative to come about. In order to ensure that a market can function, it is necessary that market participants are progressively exposed to the same price signals and risks. Support schemes based on feed-in-tariffs prevent this and would need to be phased-out – with limited exemptions – and replaced by schemes that expose all resources to price signals, as for instance by means of premium based schemes. Such schemes would be made even more efficient by setting aid-levels through auctioning as RES E investments projects will then be incentivised to develop business models that optimise market based returns.
The issue is explored in more detail in section 6.2 of the present impact assessment and, in particular, the RED II impact assessment.
1.2.2.Commission guidance on regional cooperation
The forthcoming guidance on regional cooperation may set out general principles for regional cooperation across all five dimensions of the Energy Union, described how these principles are being addressed in this initiative and other legislative proposal for Renewables and Energy Union governance, and will offer suggestions on how regional co-operation, where it applies, can be made to work in practice.
The present initiative seeks to improve market functioning, and calls for a more regional approach to system operation and security of supply. The guidance document should help Member States best achieve regional co-operation, including in areas where the present initiative mandates effective co-operation (e.g. the initiative calls on Member States to prepare risk preparedness plans in a regional context, cf. infra).
1.2.3.The Energy Union governance initiative
The Energy Union governance initiative aims at ensuring a coordinated and coherent implementation of the Energy Union Strategy across its five dimensions with emphasis on the EU's energy and climate targets for 2030. This is established through a coherent combination of EU-level and national action, a strengthened political process and with reduced administrative burden.
With these objectives in mind, the draft Regulation is based on two pillars:
-Streamlining and integration of existing planning, reporting and monitoring obligations in the energy and climate fields, in order to reduce unnecessary administrative burden;
-A political process between Member States and the Commission with close involvement of other EU institutions to support the achievement of the Energy Union objectives, including notably the 2030 targets for greenhouse gas emission reductions, renewable energy and energy efficiency.
In relation to this initiative the governance initiative will also streamline reporting obligations by Member States and the Commission that are presently enshrined in the Third Package.
1.2.4.The Energy Efficiency legislation ('EE')
and the related Energy Performance of Buildings Directive ('EPBD')
including the proposals for their amendment.
In general terms, energy efficiency measures interact with the present initiative as they affect the level and structure of electricity demand. In addition, energy efficiency measures can alleviate energy poverty and consumer vulnerability. Besides consumer income and energy prices, energy efficiency is one of the major drivers of energy poverty.
The provisions currently still in the current energy efficiency legislation concerning metering and billing (to the extent related to electricity) may become part of the present initiative as these relate to consumer conduct and their participation in the market which are important issues in the context of the present initiative. This logic is reinforced by the fact that the Third Package already contains closely related provisions on smart metering deployment and fuel mix and comparability provisions in billing.
Similarly, all provisions on priority dispatch for Combined Heat and Power ('CHP') previously contained in the energy efficiency legislation will be set out in the present initiative as these provisions relate to the integration of these resources in the market and as they are very similar to the priority dispatch provisions for RES E, also dealt with in the present initiative.
The provisions previously contained in the energy efficiency legislation on demand response will be set out in the present initiative
because these relate to incentivising flexibility in the market and participation of consumers in the market, both core subjects of the present initiative. This logic is reinforced by the fact that the Third Package already contains related provisions on demand response.
1.2.5.The Commission Regulation establishing a Guideline on Electricity Balancing ('Balancing Guideline')
The Balancing Guideline constitutes an implementing act that will be adopted using the Electricity Regulation as a legal basis. The Balancing Guideline is closely related to the present initiative. This is because efficient, integrated balancing markets are an important building block for the consistent functioning of wholesale markets which in turn are needed for a cost effective integration of RES E into the electricity market.
The Balancing Guideline aims at harmonising certain aspects of the EU's balancing markets, with a focus on optimising the cross-border usage that TSOs make of the balancing reserves that each have decided to contract individually, such as harmonisation of the pricing methodology for balancing; standardisation of balancing products and merit-order activation of balancing energy.
The present initiative seeks in contrast to focus on a more integrated approach to deciding and contracting of the balancing reserves, as opposed to their usage, which touches upon the optimal allocation of the cross-border transmission capacities and a regional approach to balancing reserves.
Thus, the Balancing Guideline deals principally with exchanges of balancing energy whereas the present initiative focusses on the exchange and sharing of balancing capacity. The latter issue is much more political than the exchange of balancing energy and closely related to other questions dealt with in the present initiative, such as regional TSO cooperation or the reservation of transmission capacities. The assessments of the two initiatives are fully coherent. Indeed, the implementation of the guidelines on electricity balancing is part of the baseline for the present impact assessment.
1.2.6.Other relevant instruments
Other relevant instruments are the Commission proposal for setting national targets for 2030 for the sectors outside the EU's ETS, the revision of the EU's ETS for the period after 2020, EU's competition instruments and the EU state aid rules applicable to the energy sector and clarified in the EEAG. and the decarbonisation of the transport sector initiative. The manner in which this policy context is interacting with the present initiative is explored further in section 4.2.
2.Problem Description
2.1.Problem Area I: Market design not fit for an increasing share of variable decentralized generation and technological developments
The European Union's policy to fight global warming will require the electricity systems to shift from a generation mix that is mostly based on fossil fuels to a virtually decarbonised power sector by 2050. Indeed, with the 2030 targets agreed by the October 2014 European Council (EuCo 169/14) the share of electricity generated from renewable sources is projected to be close to 49% of total electricity produced, while their share in total net installed capacity is projected to be 62.45%
.
|
Table 1: RES E % share in total net electricity generation
|
|
Year
|
2000
|
2005
|
2010
|
2015
|
2020
|
2025
|
2030
|
|
RES E total (TWh)
|
422
|
467
|
683
|
916
|
1,193
|
1,443
|
1,654
|
|
Total net generation (TWh)
|
2,844
|
3,119
|
3,168
|
3,090
|
3,221
|
3,317
|
3,397
|
|
RES E
|
15%
|
15%
|
22%
|
30%
|
37%
|
43%
|
49%
|
|
Source: PRIMES; based on EUCO27 scenario
|
Whereas renewable electricity can be produced by a variety of technologies, most new installed capacity today is based on wind and solar power. By 2030, this is expected to be even more pronounced.
|
Table 2: Share of variable RES E (solar and wind power) in RES E and total net generation
|
|
Year
|
2000
|
2005
|
2010
|
2015
|
2020
|
2025
|
2030
|
|
Variable RES E (TWh)
|
22
|
72
|
171
|
378
|
618
|
820
|
995
|
|
Total RES E (TWh)
|
422
|
467
|
683
|
916
|
1,193
|
1,443
|
1,654
|
|
Variable RES E in RES E
|
5%
|
16%
|
25%
|
43%
|
52%
|
57%
|
62%
|
|
Variable RES E in total net generation
|
1%
|
2%
|
5%
|
12%
|
19%
|
25%
|
29%
|
|
Source: PRIMES; based on EUCO27 scenario
|
The patterns of electricity production from wind and sun are inherently more variable and less predictable when compared to conventional sources of energy (e.g. fossil-fuel-fired power stations) or flexible RES E technologies (e.g. biomass, geothermal or hydropower). Weather-dependent production also implies that output does not follow demand. Consequently, there will be times when renewables could cover a very large share – even 100% – of electricity demand and times when they only cover a minor share of total consumption. While the demand-side and decentralized power storage could in theory react to the availability of renewable energy sources and even to extreme variations, current market arrangements do not enable most consumers to actively participate in electricity markets either directly through price signals or indirectly through aggregation.
While renewable technologies and individual projects differ significantly in size (from rooftop solar on households with 5 to 20 kW to several hundreds of MW for large offshore wind parks), the majority of renewable investments are developed at comparatively small scale. Given that the typical installation size of an onshore wind farm or a solar park is generally multiple times smaller than of a conventional power station, the number of power producing units and operators will increase significantly. Consequently, the transition towards more renewables implies that more and more power will be generated in a decentralised way. Market roles and responsibilities will have to be adapted.
Finally, these new installations will not necessarily be located next to consumption centres but where there are favourable natural resources. This can create grid congestion and local oversupply.
The transition towards a low carbon electricity production poses a number of challenges for the cost-effective organisation and operation of Europe's power system and its electricity markets. The existing market framework was designed in an era in which large-scale, centralised power stations, primarily fired by fossil fuels, supplied passive customers at any time with as much electricity as they wanted in a geographically limited area – typically a Member State. This framework is not fit for taking up large amounts of variable, often decentralised electricity generation nor for actively involving more consumers in electricity markets.
The main underlying drivers are: (i) the inefficient organisation of short-term electricity markets and balancing markets, (ii) exemptions from fundamental market principles, (iii) consumers that do not actively engage in the market, (iv) consumers do not actively engage in the market and demand response potential remains largely untapped; and (v) distribution networks that are not actively managed and grid users are poorly incentivised.

2.1.1.Driver 1: Short-term markets, as well as balancing markets, are not efficiently organised
Today's short-term markets are not efficiently organised, because they do not give all resources – conventional power, renewables, the demand-side, storage – equal opportunities to access these markets and because they do not fully take into account the possible contribution of cross-border resources. The latter problem often originates from a lack of coordination between national entities and a lack of harmonisation of rules, while the former relates to the trading products themselves, e.g. their commitment period, which sometimes are too restrictive to allow for a level playing field of all kinds of resources.
Short-term markets play a major role in any liberalised power system due to the characteristics of electricity as a product. Electricity must be generated and transmitted as it is consumed. The overall supply and demand needs to be in balance in physical terms at any given point in time. This balance guarantees the secure operation of the electricity grid at a constant frequency. Imbalances between injections and withdrawals of electricity render the system unstable and, ultimately, may give rise to a black-out.
As a consequence, market participants need to be incentivised to have a portfolio of electricity injections into and withdrawals from the network that net-out. Market participants can adjust their portfolio by revising production and consumption plans and selling or buying electricity
. Efficient and liquid markets with robust price signals are crucial to guide these decisions.
The fact that the production patterns from weather dependent RES E can only be predicted with acceptable accuracy within hours, creates challenges for market parties and for system operation. In the absence of efficient and liquid short-term electricity wholesale markets, system operators have to take actions to balance the system and manage network congestions once the production forecasts become more precise. Moreover, operators of RES E are unable to adjust their portfolios once the production forecasts become more precise, leaving them exposed to risks and costs, when they deviate from their plans. An increasing penetration of RES E thus requires efficient and liquid short-term markets that can operate until very shortly before the time of physical delivery i.e. the moment when electricity is consumed. The entire electricity system must become more flexible, also through the progressive introduction of new flexible resources such as storage, to accommodate variations in RES E production.
Current trading arrangements are however not optimised for a world in which market participants have to adjust portfolios on short notice. The manner in which the trading of electricity is arranged and the methods for allocating the network capacity to transmit electricity are organised, allow for efficient trading of electricity in timeframes of one or more days ahead of physical delivery. These arrangements befit well a world of conventional electricity production that can be predictably steered but not the new electricity landscape with a high share of renewables with limited forecasting abilities in a day-ahead timeframe.
The current market framework already envisages that these short-term adjustments can be made in intraday markets to correct. However, whilst liquidity has increased over the past few years, there remains significant scope for further increases in these markets. As way of illustration, in 2014, in the intraday timeframe, only five markets in Europe had a ratio of traded energy to demand of greater than 1%. Further, progress remains in connecting ('coupling') national intraday markets in the same way as day-ahead markets. This can lead to a low level of cross-border competition in intraday markets. In 2014 only 4.1% of available interconnection capacity at the intraday stage was used, compared to 40% at day-ahead.
Improving liquidity of intraday markets requires addressing various issues, including removing the barriers that today exist for trading power across borders as well as providing proper incentives to rebalance portfolios by trading until short notice before markets close. In addition, technical rules of the market (i.e. products, bid sizes, gate closure times) are often not defined with renewables or demand response in mind creating de facto barriers for its participation.
Specific issues include a variation in commitment periods across Europe, with some Member States choosing 15-minute and other Member States choosing 60-minute products, and the time to which market participants can trade, which can be as short as 5 minutes or, in some instances, upto several hours before real time. There is also a difference in how markets are organised: in continuously traded markets, transactions are concluded throughout the trading period every time there is a match between bids and offers. Transactions are concluded differently in auction markets, where previously collected bids and offers are all matched at once at the end of the trading period.
The last market-based measure to net out imbalances between injections and withdrawals of electricity is the balancing market. As such, the balancing market is not solely a technicality ensuring system stability but has significant commercial implications and, in turn, implications for competition. Procurement rules often fit large, centralised power stations but do not allow for equal access opportunities for smaller (decentralised) resources, renewables, demand-side and batteries. ACER's market monitoring reports revealed high levels of concentration within national balancing markets. TSOs are often faced with few suppliers or (in case of vertically integrated TSOs) procure balancing reserves from their affiliate companies. This, combined with a low degree of integration, enables a limited number of generators to influence the balancing market outcome. Moreover, the procurement rules can lower the overall economic efficiency of the power system by creating so-called must-run capacity, i.e. capacity that does not (need to) react to price signals from other markets, because it generates sufficient revenues from balancing markets.
Beside procurement rules, there is a potential issue with procurement volumes due to national sizing of reserves. Possible contributions of neighbouring resources are not properly taken into account, thus over-estimating the amount of reserves to be procured nationally.
2.1.2.Driver 2: Exemptions from fundamental market principles
Two fundamental principles of today's market framework are that (i) market participants should be financially responsible for any imbalance in their portfolio and that (ii) the operation of generation facilities should be driven by market prices. For a number of reasons a wide range of exceptions from these principles exist today which could lead to distortions, thus diminishing market efficiency.
The principle of financial responsibility for imbalances is often referred to as balancing obligation. In many Member States, some market participants are fully or partly exempted from this obligation, notably many renewable energy but also CHP generators. Exemptions are typically granted on policy grounds, e.g. the existence of policy targets for renewables. Such a special treatment constitutes a challenge for the cost-effective functioning of electricity markets, because these technologies represent a significant share in total power generation already and are expected to further grow in importance in the forthcoming decade. For RES E, exemptions from balancing responsibility were initially justified on the basis of significant errors in production forecasts being unavoidable (as production for many RES E technologies is based on wheather) and on the absence of liquid short-term markets which would have allowed RES E generators to trade electricity closer to real time, thus reducing the error margin. Significant improvements have been made in wheather forecasts, reducing the error margin. Part of these improvements was based on financial incentives from increased balancing responsibilities. Furthermore, cross-border integration and liquidity of short-term markets has improved over the last years, with further progress expected over the coming years, such as through the progressive penetration of storage, and following the present proposal. Thus, the underlying reasons for the exemption of RES E from this principle have to be revisited.
A consequence of this lack of balancing obligation is that plant operators have no incentive to maintain a balanced portfolio. The balancing obligation is typically passed on to the responsible system operator, a regulated party, meaning that their balancing costs will be socialised. This represents a market distortion and lowers the liquidity and efficiency of short-term markets as the concerned market operators do not become active on the short-term market to balance their portfolio. So the absence of full balancing responsibility is in fact a major driver preventing the emergence of liquid and efficient short-term markets. Moreover, costs arising from forecast errors for renewables are likely higher than necessary due to a lack of incentive to minimise them by short-term market operations. This creates a higher than necessary burden on consumers' electricity bills.
The principle that the operation of generation facilities should be driven by market prices is also referred to as economic dispatch. When a unit's variable production costs are below market price, it is economically efficient to dispatch it first, because the operator generates (gross) profits from selling electricity. This principle guarantees that power is produced at the lowest cost to reliably serve consumers, while taking into account operational limits. However, priority dispatch deviates from this principle, by giving certain technologies priority independent of their marginal cost. This represents a market distortion and leads to a sub-optimal market outcome.
Given the expected massive increase in share of wind and solar technologies, it is likely that unconditional dispatch incentives for these technologies will aggravate the situation, as will the fact that certain RES E technologies and often CHP have positive variable production costs. The review of priority dispatch rules for RES E is thus closely related to the review of rules on public support in the RED II. Compared to the impact on RES E from low marginal cost technologies, fully merit order-based dispatch has more significant impact on conventional generation (CHP and indigenous fuels) and high marginal cost RES E (e.g. RES E based on biomass), as these technologies will not be dispatched first under the normal merit order. Achieving merit order based dispatch will in these cases allow to use flexibility resources to their maximum extent, creating e.g. incentives for CHP to use back-up boilers or heat storage to satisfy heat demand in case of low electricity demand, and use flexible biomass generation to satisfy demand peaks rather than producing as baseload generation.
Similarly, the principle of priority access reduces system efficiency in situations of network congestion. When individual grid elements are congested, the most efficient solution is often to change the dispatch of power generation or demand located as closely as possible to the congested grid element. Priority rules deviate from this principle, forcing the use of other, potentially much less efficient resources. With sufficient transparency and legal certainty on the process for curtailment and redispatch, and financial compensation where required, priority access should be limited to where it remains strictly necessary.
R&D results: In relation to dispatching and curtailment, the Integral project showed that load-shedding based on software tools and remote control can be a useful tool to manage grid constraints and prevent network problems. It demonstrated that load-shedding can be done on a procurement basis by the grid operator and is a viable alternative to RES E curtailment. Thus, the grid operator can find the most cost-efficient solution on market based terms as opposed to taking recourse to simply curtailing certain sources of generation.
2.1.3.Driver 3: Consumers do not actively engage in the market and demand response potential remains largely untapped
The active participation of consumers in the market is currently not being promoted, despite technical innovation such as smart grids, self-generation and storage equipment that allow consumers – even smaller commercial and residential consumers – to generate their own electricity, store it, and manage their consumption more easily than ever. While more and more consumers have access to smart meters and distributed renewable energy resources such as roof-top solar panels, heat pumps and batteries, a minor share manages their consumption and these resources actively.
Large-scale industrial consumers already are active participants in electricity markets. However, the vast majority of other consumers neither has the ability nor the incentive to take consumption, production and investment decisions based on price signals that reflect the actual value of electricity and grid infrastructure. The metering and billing of consumers does not allow them to react to prices within the time frames in which wholesale markets operate. And even where technically possible, many electricity suppliers appear reluctant to offer consumer tariffs that enable this. This leads to the overconsumption/underproduction of electricity at times when it is scarce and the underutilisation/overproduction of electricity at times when it is abundant.
Indeed, current markets do not enable us to reap the full benefits of technological progress in terms of reducing transaction costs, reducing information asymmetries, and (thereby) reducing barriers to market participation for smaller commercial and residential consumers.
Periods of abundance and scarcity will increasingly be driven by high levels of RES E generation. To deal with an increased share of variable renewables generation in an efficient way, flexibility is key. Traditionally, almost all flexibility was provided in the electricity systems by controlling the supply side. However, it is now possible to provide demand side flexibility cost effectively. New technological developments such as smart metering systems, home automation, etc. but also new flexible loads such as heat pumps and electric vehicles allow for the reduction of demand peaks and, hence, significantly reduce system costs.
The current theoretical potential of demand response adds up to approximately 100,000 MW and is expected to increase to 160,000 MW in 2030. This potential lies mainly with residential consumers, and its increase will greatly depend on the uptake of new flexible loads such as electric vehicles and heat pumps.
Figure 1: Theoretical demand response potential 2016 (in MW)
 Source: Impact Assessment support Study on downstream flexibility, demand response and smart metering, COWI, 2016
For the industrial sector demand response is mainly related to flexible loads in electric steel makings. In the commercial sector, a high theoretical potential exist for ventilation of commercial buildings while in the residential sector mainly freezers and refrigerators, and the electric heater with storage capacity show a high theoretical potential.
Figure 2: Theoretical potential of demand response per appliance
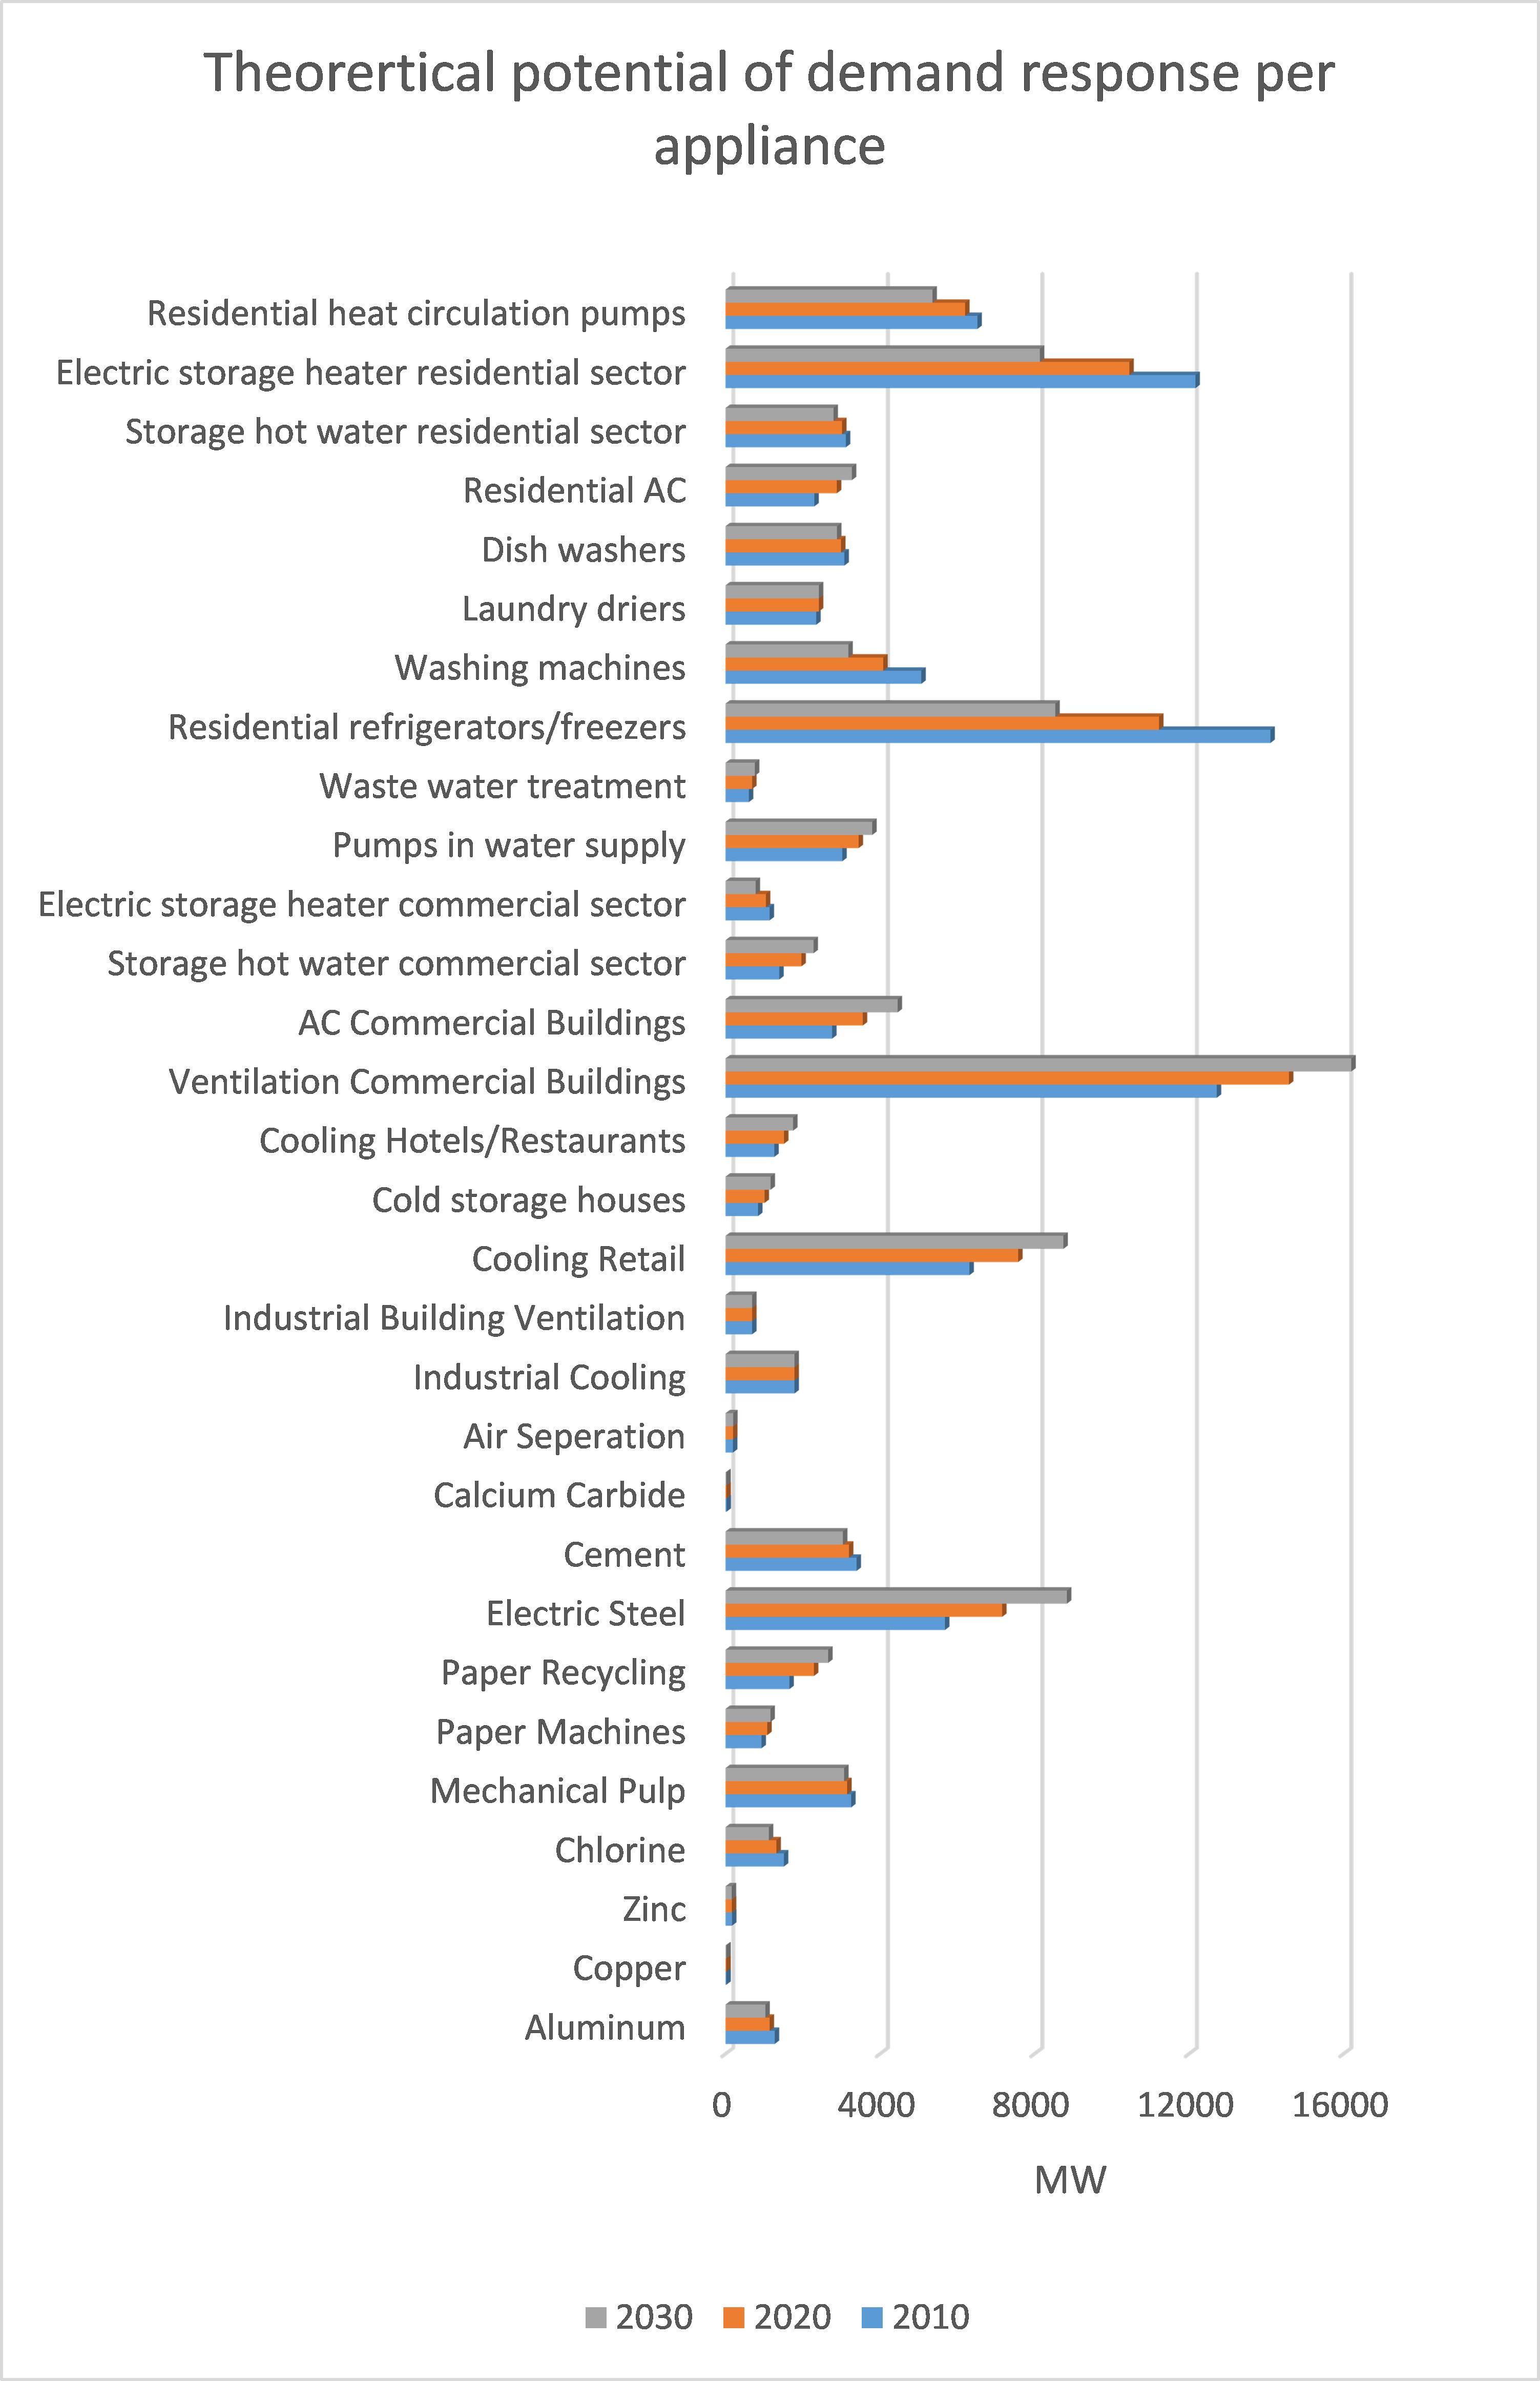
Source: Impact Assessment support Study on downstream flexibility, demand response and smart metering, COWI, 2016
Approximately 30-40% of this potential can be considered technically and economically viable and, hence, can expected to be activated if the right technologies, incentivising mechanisms and market arrangements are in place. Demand response service providers (often referred to as aggregators) can play an important role in activating this potential by enabling smaller consumers and distributed generation in general to interact with the market and have their resources being managed based on price signals, or provide balancing or grid congestion services. These aggregators effectively reduce transaction costs and information asymmetries in the market, enabling a large number of smaller and/or distributed resources to praticipate.
Of this potential, currently only around 21,000 MW demand response is used in the market. Approx. 15,000 MW are contracted from large industrial consumers through direct participation in the market while approx. 6,000 MW come from residential consumers who are on traditional time of use tariff (usually just differentiating between day and night). Only in the Nordic markets a slow uptake of dynamic price contracts linked to the wholesale market is taking place. This shows that especially in the residential and commercial sector with a theoretical potential of more than 70,000 MW the uptake of deman dresponse is slow.
The main reasons for residential and commercial consumers not taking part in the demand response schemes are mostly technical but can also be explained by currently relative small benefits for those consumer groups:
-The technological prerequisites are not yet installed and even where smart meters are being rolled out they do not always have the functionalities necessary for consumers to take active control of their consumption;
-Dynamic electricity price contracts are only available for commercial/residential consumers in very few Member States and hence consumers do not have a financial incentive to shift consumption;
-In many Member States, third-party service providers helping consumers to manage their consumption can not freely engage with consumers and do not have full access to the markets;
-In many European markets price spreads are reletively small and price peaks either not incur often or only lead to peak prices that are slightly higher than the average price which makes demand response currently not very interesting from a financial point of view. However, with an increase in renewables generation this price spreads are likely to increase and participating in demand response will become more profitable for consumers in the future. Variable network tariffs can equally contribute to increasing the price spread;
-Consumers are more likely to participate in demand response when they have significant single loads such as electric heating or electric boilers that are easy to shift. In that respect the uptake of electric vehicles and heat pumps will also open new opportunities for consumers to engage in demand response;
-Finally, automatisation is key to untap the full potenial of demand response in the residential and commercial sector. Considering the relatively small economic benefit residential consumers are likley to realise by participating in demand response it is essential that theparticipation does not require active efforts but devices can react automatically to price signals. Hence, interoperability of smart metering systems will be crucial for the uptake of demand response.
In addition, the current design of the electricity market has not evolved to fully accomodate demand side flexibility. It was meant for a world where consumers are passive consumers of electricity that do not actively participate in the market. Hence, current market arrangements at both the wholesale and retail level often make it very difficult for demand-side flexibility to compete on a level playing field with generation:
-Similar to RES E, consumption is variable and subject to forecast errors. As a consequence, it is often infeasible for most individual customers to offer demand-response many days ahead of the moment when electricity is actually consumed
-The liquidity of intraday markets – where demand response at short notice can fetch a high price – is currently limited, providing little incentive to offer demand-side flexibility;
-Procurement timeframes for balancing reserves capacity have generally long lead times (week-, month- or year-ahead) for which demand response cannot always secure firm capacity.
-Balancing markets often require that units can offer both upward regulation (i.e. increasing power output) and downward regulation (i.e. reducing power output; offering demand reduction) at the same time, making it difficult for demand response to participate in those markets;
-And finally, product definitions make it difficult for aggregated loads to compete in many markets.
The table below summarizes in which Member States markets are open to demand response and the volume of demand response contracted. While demand response is allowed to participate in most Member States, volumes of more than 100MW can only be found in 13 Member States.
Table 3: Participation of explicit Demand Response in different markets
|
Member State
|
Demand Response in energy markets
|
Demand Response in balancing markets
|
Demand Response in Capacity mechanisms
|
Estimated Demand Response for 2016 (in MW)
|
|
Austria
|
Yes
|
Yes
|
|
104
|
|
Belgium
|
Yes
|
Yes
|
Yes
|
689
|
|
Bulgaria
|
No
|
No
|
|
0
|
|
Croatia
|
No
|
No
|
|
0
|
|
Cyprus
|
No market
|
No market
|
|
0
|
|
Czech Republic
|
Yes
|
Yes
|
|
49
|
|
Denmark
|
Yes
|
Yes
|
|
566
|
|
Estonia
|
Yes
|
No
|
|
0
|
|
Finland
|
Yes
|
Yes
|
Yes
|
810
|
|
France
|
Yes
|
Yes
|
Yes
|
1689
|
|
Germany
|
Yes
|
Yes
|
Yes
|
860
|
|
Greece
|
No (2015)
|
No
|
|
1527
|
|
Hungary
|
Yes
|
Yes
|
|
30
|
|
Ireland
|
Yes
|
Yes
|
Yes
|
48
|
|
Italy
|
Yes
|
No
|
Yes
|
4131
|
|
Latvia
|
Yes
|
No
|
Yes
|
7
|
|
Lithuania
|
unclear
|
No
|
|
0
|
|
Luxembourg
|
No information
|
No information
|
|
|
|
Malta
|
No market
|
No market
|
|
|
|
Netherlands
|
Yes
|
Yes
|
|
170
|
|
Poland
|
Yes
|
Yes
|
No
|
228
|
|
Portugal
|
Yes
|
No
|
|
40
|
|
Romania
|
Yes
|
Yes
|
|
79
|
|
Slovakia
|
Yes
|
Yes
|
|
40
|
|
Slovenia
|
No
|
Yes
|
|
21
|
|
Spain
|
Yes
|
No
|
Yes
|
2083
|
|
Sweden
|
Yes
|
Yes
|
Yes
|
666
|
|
UK
|
Yes
|
Yes
|
Yes
|
1792
|
|
Total
|
|
|
|
15628
|
Source: Impact Assessment support Study on downstream flexibility, demand response and smart metering, COWI, 2016
R&D results: VSync demonstrated that PV or wind generation, if equipped with a technology as demonstrated in the VSync project, can replace the inertia that large power plants possess that is needed to reduce frequency variations. Therefore, such technologies could in principle be used to provide balancing services to the TSO.
EvolvDSO has identified and worked-out the details of future roles for actors active in the management of power systems at the distribution level. The project identifies ways in which flexibility of resources connected at distribution level could be revealed, valorised, contracted and exploited by various actors of the power system. It identified roles that could be fulfilled by DSOs and by market parties and asks that these are clarified
Several European demonstration projects such as ECOGRID-EU, Integral, EEPOS, V-Sync and S3C have provided evidence that demand response is sufficiently mature from a technical point of view, while stressing the need to removing market related barriers to its deployment.
In particular, Integral and ECOGRID-EU show that valuing flexibility through price signals is possible and easy, that local assets can participate and earn money in the wholesale market, and that the economic viability depends on the value of flexibility. Integral also demonstrated that flexibility of a household's energy consumption (and hence the ability to provide demand response) was higher than initially expected, probably due to the automated response that did not require active consumer participation. ECOGRID-EU showed that a customer with manual control gave a 60 kW total peak load reduction while automated or semi-automated customers gave an average peak reduction of 583 kW.
RES E and flexible electricity systems
Demand response, like other measures that improve the degree of flexibility in the system, have an connection to the ability of RES E to finance itself in the market, through what is often referred to as the 'merit order effect'.
During windy and sunny days the additional electricity supply reduces the prices. Because the drop is larger with more installed capacity, the market value of variable renewable electricity falls with higher penetration rate, translating into a gap to the average market value of all electricity generators over a given period. Inflexible markets where demand and generation are non-responsive to price signals (including through measures such as priority dispatch or 'must-run' obligations) render this effect more pronounced. This effect is already visible today in certain Member States, and in the absence of measures, can be expected to become even more relevant as renewables penetration increases further.
At the one hand, this implies that as renewables are further gaining market shares in the coming decade, the regulatory framework should not only incentivise the deployment of renewables where costs are low (e.g. due to abundant wind or solar resources), but also where and when the value of the produced electricity is the highest. On the other hand, by improving the market framework in which RES E operates by rendering it more flexible, unnecesarry erosion of the value of RES E assets can be prevented.
Reference is made to the box in Section 6.2.6.3 and Section 6.2.6.4 for further information.
2.1.4.Driver 4: Distribution networks are not actively managed and grid users are poorly incentivised
Most of the time, the present regulatory framework does not provide appropiate tools to distribution network operators to actively manage the electricity flows in their networks. It also does not provide incentives to customers connected to distribution grids to use the network more efficiently. Because smaller consumers have historically participated in the broader electricity system only to a limited extent, currently no framework exists that puts such incentives in place. This has led to fears over the impact that the deployment of distributed resources could have at system-level (e.g. that the costs of upgrading the network to integrate them would outweigh their combined benefits in other terms). Moreover, the regulatory framework for DSOs, which most of the times is based on cost-plus regulation, does not provide proper incentives for investing in innovative solutions which promote energy efficiency or demand-response and fails to recognise the use of flexibility as an alternative to grid expansion.
With RES E being a source of electricity generation that is often decentralised in nature, DSOs are gradually being transformed from passive network operators primarily concerned with passing-on electricity from the transmission grid to end-consumers, to network operators that, not unlike TSOs, actively have to manage their grids. At the same time, technological progress allows distribution system operators to reduce network investments by managing locally the challenges that more decentralised generation brings about. However, outdated national regulatory frameworks may not incentivise or even permit DSOs to make these savings by operating more innovatively and efficiently because they reflect the technological possibilities of yesteryear. The resulting inflexibility of distribution networks significantly increases the cost of integrating more RES E generation, particulary in terms of investment.
R&D results: Reduced network investment by managing locally decentralised generation is demonstrated in European projects like: SuSTAINABLE, MetaPV, evolvDSO, PlanGridEV, BRIDGE and REServices.
According to EvolvDSO, flexibility procurement and activation by DSOs are not addressed in the regulatory framework in most Member States: they are not excluded in principle but not incentivised either and, because they are not explicitly addressed, this creates uncertainty for the DSO to apply them.
The REServices study has analysed the possible services that wind and solar PV energy can provide to the grid in theory but concludes that they are not able to (in the Member States analysed) due to the way the market rules are defined.
The project SuSTAINABLE demonstrated that intelligent management supported by more reliable load and weather forecast can optimise the operation of the grid. The results show that using the distributed flexibility provided by demand-side response can bring an increase of RES E penetration while, at the same time, avoid investments in network reinforcement, and this leads to a decrease in the investment costs of distribution lines and substations.
The BRIDGE project recommended that products for ancillary services should be consistent and standardized from transmission and down to the local level in the distribution network. Such harmonization will facilitate the participation of demand-side response and small-scale RES in the markets for these services, and thereby increase the availability of the services, enable cross-border exchanges and lower system costs.
Tests in the project PlanGridEV with controllable loads (demand response, electric vehicles) performed in a large variety of grid constellations have shown that peak loads could be reduced (up to 50%) and more renewable electricity could be transported over the grid compared to scenarios with traditional distribution grid scenarios. As a result, critical power supply situations can be avoided, and grids, consequently, do not call for reinforcement
Both MetaPV and EvolvDSO suggest that a DSO makes a multiannual investment plan that takes into account flexibility it can purchase from connected demand-side response or self-producers and consumers (MetaPV suggests to do this through a cost-based analysis)
MetaPV also demonstrated that remotely controllable inverters connecting PV-panels to the distribution grid can offer congestion management services to the distribution grid (in the form of voltage control obtained via reactive power modulation). This increases the capacity of the distribution grid to integrate intermittent RES by 50%, at less than 10% of the costs of ‘traditional’ investments in hardware such as copper.
2.2.Problem Area II: Uncertainty about sufficient future generation investments and uncoordinated capacity markets
In light of the 2030 objectives, considerable new investment in electricity generation capacity will be required. The power sector is likely to play a central role in the energy transition. First, it has been the main sector experiencing decarbonisation since the last decade and its challenges still remain high. Second, in the near future, the power sector is expected to support the economy in reducing its dependence on fossil fuels, notably in the transport and heating and cooling sectors.
Generation capacity in the EU increased sharply from 2009 onwards due to the addition of new renewables technologies to the already existing capacity. The composition of the capacity mix progressively changed. Nuclear capacity started declining in recent years (2010-2013) due to phasing out decisions in some Member States. Other conventional capacity showed a decline in 2012-2013 as well.
The largest part of the required new capacity will be variable wind and solar based, complemented by more firm, flexible and less carbon-intensive forms of power generation. At the same time, in light of the ageing power generation fleet in Europe with more than half of the current capacity expected to be decommissioned by 2040, it is important to maintain sufficient capacity online to guarantee security of supply. The modelling results nevertheless indicate that investment needs in additional thermal capacity will be limited especially in the period 2021-2030. According to PRIMES EUCO27, about 81% of net power capacity investments will be in low-carbon technologies, of which 59% in RES E and 22% in nuclear generation.
|
Table 4: Investment Expenditure (including new construction, life-time extension end refurbishment) in generation capacity by technology (average over 5 year period) in MEuro'13
|
|
Period
|
2000-2005
|
2005-2010
|
2010-2015
|
2015-2020
|
2020-2025
|
2025-2030
|
|
Nuclear
|
1,502
|
739
|
270
|
6,291
|
11,011
|
14,312
|
|
Renewable energy
|
16,789
|
28,672
|
43,393
|
38,957
|
25,217
|
21,911
|
|
Hydro (pumping excl.)
|
5,995
|
2,557
|
3,289
|
2,239
|
354
|
633
|
|
Wind
|
9,238
|
17,095
|
19,614
|
28,553
|
14,059
|
14,219
|
|
Solar
|
1,556
|
9,019
|
20,487
|
7,870
|
10,581
|
6,728
|
|
Other renewables
|
-
|
2
|
3
|
295
|
223
|
332
|
|
Biomass-waste fired
|
2,626
|
3,438
|
4,157
|
11,779
|
465
|
433
|
|
Geothermal heat
|
100
|
90
|
110
|
182
|
-
|
-
|
|
Thermal
|
11,989
|
14,019
|
13,391
|
17,151
|
3,355
|
3,274
|
|
Solids fired
|
1,029
|
1,237
|
5,333
|
2,610
|
870
|
192
|
|
Oil fired
|
639
|
373
|
362
|
75
|
33
|
9
|
|
Gas fired
|
7,595
|
8,880
|
3,427
|
2,505
|
1,987
|
2,641
|
|
Hydrogen plants
|
-
|
-
|
1
|
-
|
-
|
-
|
|
Total (incl. CHP)
|
30,280
|
43,430
|
57,054
|
62,399
|
39,583
|
39,497
|
|
Source: PRIMES; based on EUCO27 scenario
|
At the same time, short-term market prices at wholesale level have decreased substantially over the past years. In parallel with high fossil fuel prices, European wholesale electricity prices peaked in the third quarter of 2008; then fell back as the economic crisis broke out, and slightly recovered between 2009 and 2012. However, since 2012 wholesale prices have been decreasing again. Compared to the average of 2008, the pan-European benchmark for wholesale electricity prices were down by 55% in the first quarter of 2016, reaching 33 EUR/MWh on average, which was the lowest in the last twelve years
.
Figure 3 on pan-European wholesale market prices

Source: Platts and European power exchanges
Prices declined for a number of reasons including (i) a decrease in primary energy prices (e.g. coal, and more recently also natural gas), (ii) an increasing imbalance between the supply and demand for carbon allowances, leading to a surplus of over 2 billion allowances by 2012 and a corresponding decrease in carbon allowance prices, and (iii) an overcapacity of power generation facilities, putting a downward pressure on wholesale prices.
Overcapacity was, in turn, caused by: (i) a drop in electricity demand as electricity consumption decoupled from an already low economic growth, (ii) over-investments in thermal plants, (iii) the increasing proportion of renewables with low marginal costs driven by EU policies, (iv) barriers to decommission capacity, and (v) continuing improvement in the field of coupling national electricity markets
, leading to an increased sharing of resources among Member States.
As a result, for most regions in Europe current electricity wholesale prices do not indicate the need for new investments into generation capacity. There are, however, doubts whether the market, as currently designed, would be able to produce investment signals in case generation capacities were needed. Independently of current overcapacities of most regions in Europe, a number of Member States anticipate inadequate generation capacity in future years and introduce capacity mechanisms at national level.

2.2.1.Driver 1: Lack of adequate investment signals due to regulatory failures and imperfections in the electricity market
The internal energy market is built on competitive (short and long-term) wholesale power markets where price signals are central to guide market participants production and consumption decisions. Short-term prices signal prevailing supply and demand conditions while long-term prices are formed according to expectations about future supply and demand. Conditions, such as for example shortages or oversupply that are expected to prevail in the future will not only determine short-term (spot) prices but also impact long-term (forward, futures) prices.
In around half of Member States sales achieved at short and long term markets determine the bulk of generators' income. This income is required to cover their full costs, mainly fuel, maintenance and amortisation of assets (i.e. investments). These arrangements are often referred to as energy-only markets. In the other half of Member States there are also measures (either market based or non-market based) in place to pay generators for keeping their capacity available (capacity mechanisms or 'CM's), regardless as to whether they are producing electricity or not. For generators who operate on the market these payments represent an additional income next to their earnings on the wholesale markets for energy. Capacity payments, thus, represent additional support to maintain and/or develop capacity.
Irrespective whether generators are expected to earn their investments solely on the 'energy-only' market or whether they can also rely on additional payments for capacity, wholesale power prices are central to provide the right signals for efficient market operations. For the EU-target model
to function properly, prices need to be able to properly reflect market conditions.
Price signals and long-term confidence that costs can be recovered in reasonable payback times are essential ingredients for well-functioning market. In a market which is not distorted by external interventions, the variability of the spot price on the wholesale market, plays a role in signalling the need of investment in new resources. In the absence of the right short- and long-term price signals, it is more likely that inappropriate investment or divestment decisions are taken, i.e. too-late decisions or technology choices that turn out to be inefficient in the long run. Price differentials between different bidding zones should determine where generation and demand should ideally be located,.
In 2013 the Commission published an assessment identifying reasons why the market may fail to deliver sufficient new investment to ensure generation adequacy
. These reasons are a combination of market failures and regulatory failures. For example when consumers cannot indicate the value they place on uninterrupted electricity supply, the market may not be effective performing its coordination function. Equally however, regulatory interventions, as well as the fear of such interventions, such as price caps and bidding restrictions (regardless as to whether effectively restricting price formation at that moment or only later) limit the price signal for new investments. Likewise the prices on balancing markets operated by TSOs should not undermine the price signals from wholesale markets.
Power generators and investors have argued that regulatory uncertainty and the lack of a stable regulatory framework undermine the investment climate in the Union compared to other parts of the world and to other industries.
In fact, current market arrangements often do not allow prices to reflect the real value of electricity, especially when supply conditions are tight and when prices should reflect its scarcity, affecting the remuneration of electricity generation units that operate less often but provide security and flexibility to the system.
These regulatory failures are amplified by the increasing penetration of RES E. RES E is capacity that often has a cost structure typified by low operational costs, resulting in more frequent periods with low wholesale prices. The variability of RES E production moreover decreases the number and predictability of the periods when conventional electricity generators are used, thereby increasing the risk profile and risk premiums of all investments in electricity resources
. Whereas market participants are used to hedging risks, and market trading arrangements are adapting to allow more risks to be covered, the risk profile of investments will become more pronounced. This increases the need to ensure that prices reflect the real value of electricity to ensure plants can cover their full costs, even if they are operating less frequently.
The current market arrangements are constructed around the notion of price zones delimited by network constraints. The price differences between such zones should drive investments to be located where they relieve congestion by rewarding investments in areas typified by high prices. The congestion rents collected by network operators to transport electricity from low to high price zones are meant to be used to relieve congestion by maintaining and constructing interconnection capacity.
However, today the delineation of price zones in practice does not reflect actual congestion, but national borders. This prevents the establishment of prices that reflect local supply and demand, which leads to the phenomenom of loop flows, which can reduce the interconection capacity made available for cross-border trading and leads to expensive out-of-market redispatching and significant distortions to prices and investment signals in neighbouring bidding zones. To illustrate this, ACER has estimated, in their Market Monitoring Report, that reductions in cross-border capacity due to loop flows resulted in a welfare loss of EUR 445 million in 2014. Further, the costs of re-dispatch and countertrading to deal with inaccurate dispatch can be high. In 2015 the total cost for redispatching within the German-Austria-Luxembourg bidding zone was approximately EUR 930 million
. There is also evidence that cross-border capacity is being limited in order to deal with internal contraints, again limiting cross-border trading opportunities. The impacts of this can be significant. For example, when looking at the capacity between Germany and the Nordic power system, the Swedish regulatory authority noted significant capacity limitations, concluding that these were mostly due to internal contraints, and found that losses amounted to a total of EUR 20 million per annum in Norway and Sweden.
A further issue that can potentially distort investment is that of network charges on generators. This includes charges for use of the network, both at distribution-level and transmission-level (tariffs), as well as the charges applied to generators for their connection (connection charges). There is significant variation across the EU on the structure of these charges, which are set at Member State-level. For instance, some Member States do not apply any tariffs to generators, others apply them based on connected capacity and others based on the amount of electricity produced. Some include locational signals within the tariff, some do not. With regards to connection charges, some calculate them based only on the direct costs of accessing the system (shallow) and others include wider costs, such as those of any grid reinforecement required (deep). Such variations can serve to distort both investment and dispatch signals.
2.2.2.Driver 2: Uncoordinated state interventions to deal with real or perceived capacity problems
The uncertainty on whether the market will bring forward sufficient investment, or keep existing assets in the market, has, in a number of Member States, fuelled concerns about system adequacy, i.e. the ability of the electricity system to serve demand at all times. Certain Member States have reacted by introducing CMs designed to support investment in the capacity that they deem necessary to ensure a secure and acceptable level of system adequacy.
These measures often take the form of either dedicated generation assets kept in reserve or a system of market wide payments to generators for availability when needed.
Figure 4: Capacity Mechanisms in Europe – 2015

Source: "Market Monitoring Report 2014" (2015) ACER.
These initiatives by Member States are based on non-aligned perceptions and expectations as to the degree the electricity system can serve electricity demand at all times and a reluctance to rely on the contribution the EU system as a whole can make to the adequacy of the system of a given Member State.
As reflected in the Interim Report of the Sector Enquiry
led by DG Competition, many existing CMs have been designed without a proper assessment of whether a security of supply problem existed in the relevant market. Many Member States have not adequately established what should be their appropriate level of supply security (as expressed by their 'reliability standard') before putting in place a CM.
Methods of assessing resource adequacy vary widely between Member States, which make comparison and cooperation across borders difficult. Many resource adequacy assessments take a purely national perspective and may substantially differ depending on the underlying assumptions made and the extent to which foreign capacities as well as demand side flexibility are taken into account. This, in turn, means some Member States force consumers to over-pay for 'extra' capacities they do not really need.
Table 5: Deterministic vs probabilistic approaches to adequacy assessments

Source: European Commission based on replies to sector inquiry, see below for a description of capacity margin, LOLP, LOLE, and EENS
The introduction of CMs fundamentally change wholesale electricity markets because generators and other capacity providers are no longer paid only for the electricity they generated but also for their availability. Worse however is that CMs when introduced in an uncoordinated manner can be inefficient and distort cross-border trade on wholesale electricity markets.
In the short-term, CMs may lead to distortions if their design affects natural price formation in the energy market (e.g. bidding behaviour of generators) and therefore alter production decisions (operation of power generating plants) and cross-border competition. For instance, a possible distortion is when generators in a market applying a CM, receive (capacity) payments which are determined in a way that affects their electricity generation bids into the market, while in a neighbouring "energy-only" market generators do not. This may tilt the playing field for generators on either sides of the border. Another example might be if strategic reserves (a particular form of CMs) are dispatched 'too-early' impeding the market's ability to establish equilibrium between supply and demand. This can cause or contribute to a 'missing money' problem as strategic reserves would outcompete existing (or future) generators who, at least partly, rely on scarcity rents to cover their costs.
CMs may also influence investment decisions (investment in plants and their locations), with potential impacts in the long term. If contributions from cross-border capacity are not appropriately taken into account, they may lead to over-procurement of capacity in countries implementing CMs, with a detrimental impact on consumers.
CMs may also cause a number of competition concerns. In this respect, the Sector Inquiry identifies substantial issues in relation to the design of CMs in a number of Member States. First, many CMs do not allow all potential capacity providers or technologies to participate, which may unnecessarily limit competition among suppliers or raise the price paid for the capacity
.
Second, capacity mechanisms are also likely to lead to over-compensation of the capacity providers – often to the benefit of the incumbents – if they are badly designed and non-competitive. In many Member States the price paid for capacity is not determined through a competitive process but set by the Member State or negotiated bilaterally between the Member State and the capacity provider. This creates a serious risk of overpayment
.
Third, the inquiry revealed that capacity providers from other Member States (foreign capacity) are rarely allowed to directly or indirectly participate in national CMs. This leads to market distortions as additional revenues from CMs remain reserved to national companies. This is particularly problematic in case of dominant national incumbents whose dominant position may even be strengthened by a national CM.
Lastly, although there is a challenge to design penalties that avoid undermining electricity price signals which are important for demand response and imports, where obligations are weak and penalties for non-compliance are low, there are insufficient incentives for plants to be reliable.
All in all, the Sector Inquiry highlights that "a patchwork of mechanisms across the EU risks affecting cross-border trade and distorting investment signals in favour of countries with more ‘generous’ capacity mechanisms. Nationally determined generation adequacy targets risk resulting in the over-procurement of capacities unless imports are fully taken into account. Capacity mechanisms may strengthen market power if they for instance, do not allow new or alternative providers to enter the market. Capacity mechanisms are also likely to lead to over-compensation of the capacity providers – often to the benefit of incumbents – if they are badly designed and non-competitive." All of these issues can undermine the functioning of the internal energy market and increase energy costs for consumers.
As reflected in the Sector Inquiry, the heterogeneous development of capacity mechansims has led to fragmented markets across the EU. The Sector Inquiry highlights that "the different types of capacity mechanisms are not equally well suited to address problems of security of supply in the most cost effective and least distortive way".
The Sector Inquiry concludes that capacity payment schemes are generally problematic as they risk over-compensating capacity providers because they rely on administrative price setting rather than competitive allocation procedures. The risk for overcompensation is lower for market-wide and volume-based schemes and strategic reserves. What matters is the design of the support scheme, which can make it more or less distortive.
Several stakeholders have proposed to address investment uncertainty by dedicated regulatory provisions encouraging and clarifying the use of long-term contracts ('LTC's) between generators and suppliers or consumers. They argue that such rules could help mitigating the investment risk for the capital-intensive investments required in the electricity sector, facilitating access to capital in particular for low-carbon technologies at reasonable costs.
While mandatory LTCs may involve a risk transfer to consumers unless they are certain they will have enduring future electricity demand, such contracts may allow them to benefit from less volatile retail prices as electricity would be purchased long time ahead of delivery. In terms of market functioning, it has to be stressed that current EU electricity legislation does not discourage the conclusion of long-term electricity purchase contracts. Even absent dedicated legislation, LTCs between a buyer and seller to exchange electricity on negotiated terms, can anyway be freely agreed on by interested parties without any need for further intervention by governments or regulators. Tradable wholesale contracts are already available to market parties (albeit with limited liquidity for contracts of more than three years). A dedicated framework for hedging price risks over longer terms has just been created with the EU Guideline on Forward Trading ("FCA Guidelines"). The only regulatory restriction to the use of LTCs may result, in exceptional situations, from EU Treaty rules on competition law (e.g. if they are used by by dominant companies to prevent new market entry).
It may also be noted that experience has shown that regulatory encouragement of LTCs under EU law may also entail the risk of "lock-in risk" in the fast developing electricity markets.
Options suggested to facilitate long-term contracting include (i) socialising the costs of guaranteeing delivery of bilateral contracts (to reduce the default risk) or (ii) introducing long-term contracts with a regulated counterparty. Both models might, however, be considered to be capacity mechanisms and would have to be scrutinised under the relevant State aid rules.
2.3.Problem Area III: Member States do not take sufficient account of what happens across their borders when preparing for and managing electricity crisis situations
In spite of best efforts to build an integrated and resilient power system, electricity crisis situations may occur. Whilst most incidents are minor
, the likelihood of larger-scale incidents affecting the European electricity system might well be on the rise due to extreme weather conditions, climate change (giving rise to extreme and unpredictable weather conditions, which already today constitute a major challenge to electricity systems)
, fuel shortage and a growing exposure to cybercrime and terrorist attacks in Europe. Already in 2014 a series of cyberattacks by the so-called "Energetic Bear" targeted several energy companies in Europe and US, highlighting the increasing vulnerability of the energy sector
.
Where crisis situations occur, they often have a cross-border effect. Even where incidents start locally, they may rapidly proliferate across borders. Thus, a black-out in Italy in 2003 due to a tree flashover affected the electricity systems of its neighbouring states as well, and in 2006 the tripping of an electricity line by a cruise ship in Germany affected 15 million people and had an impact on the entire continental power system
.
Crisis situations may also affect several Member States at the same time as it was the case during the prolonged cold spell in February 2012
, which led to a series of uncoordinated emergency measures across Europe. Given the increasing interconnectivity of the EU's electricity systems and linkage of electricity markets, the risk of electricity crisis situations simultaneously affecting several Member States are set to further rise.
It should be noted that risks of cross-border electricity incidents do not stop at the European Union's borders, given increasing links between the electricity systems of EU Member States and those of some of its neighbours (e.g., synchronisation with Western Balkans, common infrastructure projects between e.g., Italy-Montenegro, Romania-Moldova, Poland-Ukraine).
Given the key role of electricity to society, electricity crisis situations entail serious costs – both economically and for the society at large
.
Both when preparing for and dealing with crisis situations, Member States take very different approaches and tend to focus on their national territories and customers only, ignoring the possible assistance of and the impact on neighbouring countries and customers. This entails serious risks for security of supply and can also lead to undue interferences with the internal energy market.

2.3.1.Driver 1: Plans and actions for dealing with electricity crisis situations focus on the national context only
First, whilst most Member States have plans to prevent and deal with electricity crisis situations, the content and scope of these plans varies considerably and plans tend to focus on the national situation only
. Cross-border cooperation in the planning phase is scarce and where it takes place at all, it is often limited to cooperation at the level of TSOs
. This is largely due to a regulatory failure: the existing EU legal framework does not prescribe a common approach, and rules and structures for cross-border co-operation are almost entirely absent. Cross-border cooperation is also hindered by divergent national rules. Cooperation with Member States outside the EU is even more limited.
Further, where crisis situations do arise, Member States also tend to react on the basis of their own national set of rules, and without taking much account of the cross-border context. Evidence shows, for instance, that Member States have different concepts of what an emergency situation is and entails
, and who should do what and when in such situations. In particular, there is considerable uncertainty and divergence as regards what public authorities can do in emergency situations
.
The fact that Member States tend to adopt national, 'going alone' approaches when preparing for and managing crisis situations stands in strong contrast with the reality of today's interconnected electricity market, where the likelihood of crisis situations affecting several Member States at the same time, is on the rise.
Where crisis situations stretch across borders (or have the potential of doing so), joint action is needed, as well as clear rules on who does what, and when, in a cross-border context. Uncoordinated actions and decisions in one Member State (for instance on what to do to prevent a further deterioration of a crisis situations or on where to shed load, when and to whom), can have serious negative effects:
For instance, as to date, several Member States still legally foresee 'export bans' (curtailing interconnectors) in times of crisis. This undermines the proper functioning of markets and can seriously aggravate security of supply problems in neigbouring Member States, who might no longer be able to ensure that electricity is delivered to those that need it most. The reverse situation is also true: where in a crisis situation an interconnected state does not restrict its own electricity consumption, it risks propagating the crisis situation beyond its own borders.
The dangers related to a purely national, inward-looking management of electricity crisis situations, are illustrated by an incident that occurred during a prolonged cold spell in February 2012. Confronted with a situation of unexpected shortage, one Member State decided to resort to an export ban in an effort to protect its national consumption. This aggravated however problems in other, neighbouring Member States, who in turn also resorted to export bans. The ensuring cascade of export bans seriously imperiled security of supply in an entire region of Europe
.
Purely national approaches to crisis prevention and management can also lead to premature (and therefore unnecessary) market interventions, such as for instance a premature recourse to an emergency extra reserve capacity, or to a demand interruption scheme.
Finally, different approaches to crisis prevention and management might also lead to cases of 'under-protection. For instance, where Member States do not take the measures needed to prevent (e.g., cyber-incidents), the entire region or even synchronous area is likely to suffer. A similar problem might arise if Member States do not take the measures necessary to protect assets that are critical from a security of supply perspective against possible take-overs by foreign entities, in circumstances in which such take-overs could lead to any undue political influence. Experience with recent take-overs (or planned take-overs) of certain strategic energy assets in Europe shows that such risks are serious, notably where the buyer is controlled by a third country. At this stage however, Member States address this issue from a purely national perspective, based on national rules, without taking necessarily account of the wider European implications possible problems could have. This could lead to situations wherein some Member States take foreign ownership risks too lightly, whilst other Member States might overreact.
Evidence shows that in an inter-connected market, stronger co-operation on how to prevent and manage crisis situations brings clear benefits: it leads to a better security of supply overall, at a lesser cost. The recent METIS results point in this direction, as well as experiences with a few voluntary arrangements in place in parts of Europe
.
2.3.2.Driver 2: Lack of information-sharing and transparency
Today, national plans to prepare for crisis situations are not always public, nor shared across Member States. It is not clear who will act in crisis situations, and what the roles are of the different actors (governments, TSOs, DSOs, NRAs). This makes any cross-border co-operation in times of crisis very difficult
.
In addition, Member States do not systematically inform each other or the Commission when they see crisis situations emerge. In fact, whilst ENTSO-E's seasonal outlooks already point at the likelihood of upcoming crisis situations in Europe, Member States affected by such crisis situations do not systematically communicate on actions they intend to take, nor on the possible effect of such actions on the functioning of the internal market or the electricity situation in neighbouring Member States. In fact, in spite of the fact that Member States are legally obliged to notify the Commission in case they take 'safeguard measures', such notifications have been very rare, and tend to take place ex post (e.g., Poland in 2015)
.
Likewise, there is no systematic exchange of information on how past crisis situations have been handled.
Such lack of information-sharing and transparency limits the capacity of reaction of potential Member States affected, may lead to premature interventions in the market, and reduces the possible benefits that cooperation can bring.
In addition, even though the Electricity Coordination Group could be used as a tool to discuss how to prevent and mitigate crisis situations
, this does not happen in practice, in the absence of clear and proper roles given to the group, and clear obligations on Member States to report on how they address electricity crisis situations, both ex ante (before incidents occur) and ex post.
2.3.3.Driver 3: No common approach to identifying and assessing risks
Whilst all Member States identify and assess risks that can affect security of supply, there are many different understandings of what constitutes a 'risk' and methods for assessing and addressing such risks vary considerably.
Different risks are assessed in different ways, by different people, and in different time horizons.
There is also no common agreement on what indicators to use to assess security of supply overall.
In the absence of a common approach to risk identification and assessment, it is difficult to get an exact picture of what risks are likely to occur, in a cross-border context. This, in turn, seriously hampers the possibility for relevant actors – TSOs, NRAs, Member States – to prevent and manage crisis situations in a cross-border context.
2.4.Problem Area IV: The slow deployment of new services, low levels of service and questionable market performance on retail markets
Retail markets for energy in most parts of the EU suffer from persistently low levels of competition and consumer engagement. In addition, whilst information technology now offers the possibility of greatly improving the consumer experience and making the market more contestable, realising these benefits could be hampered by the lack of a data-management framework that unlocks the full benefits of smart energy management to all market actors – incumbents and new entrants alike.
These closely inter-related issues result in the slow deployment of innovative products that would help to make the electricity system function better in today's changing context, as well as excessive prices for some end-consumers and/or poor levels of service.
R&D results: Retail level innovative products and services such as dynamic pricing, self-consumption incentives, and local flexibility and energy markets, have been tested in European projects, EEPOS, ECOGRID-EU, Grid4EU, INTrEPID, INCREASE, DREAM, Integral.
For example, ECOGRID-EU showed that the highest cost is in the installation of the automation technologies, control systems and sensors in the household. These costs could be virtually zero in the future when appliances are connected anyway.
Integral states that large scale implementation of demand-side response services based on a market for flexibility requires standardised solutions (for the communication of the devices (smart meters and devices controllers…) and for the framework within which market players communicate to each other) to reduce the cost per household and to lower the price of the smart energy services.

2.4.1.Driver 1: Low levels of competition on retail markets
Competition on retail markets is multifaceted, and recent trends in several indicators suggest that it can be improved in many Member States.
The price of energy for end consumer can be broken down into three main components: i) energy, ii) network and iii) taxes and levies. The energy component typically includes cost elements such as the wholesale price of the commodity and various costs of the supply companies, including their operating costs and profit margins. The network component mainly consists of transmission and distribution tariffs. It might also include further cost elements such as ancillary services. The taxes & levies component includes a wide range of cost elements that significantly vary from country to country. Levies are typically designated to specific technology, market or socially bound policies, while taxes are general fiscal instruments feeding into the state budget. On average in the EU in 2015 energy made up 36% of the final household consumer price, the network component 26%, and taxes and levies 38%.
In spite of falling prices on wholesale markets (analysed earlier), overall electricity prices for household consumers rose steadily between 2008 and 2015 at an annual rate of around 3%. This trend was largely driven by increased network charges, taxes and levies, the various causes of which have been touched upon in the preceeding sections: the over reliance of RES E assets on government support due to barriers to fully participating in all markets; inflexible distribution networks that increase the cost of integrating RES E; and fragmented balancing markets that increase the costs of ancillary services, amongst others.
However, a proxy for mark-ups
on the energy component of consumer bills in several Member States also seem to be higher than could be expected, posing questions about the extent of price competition. Indeed, whereas there has been a significant reduction in wholesale prices between 2008 and 2015, the nominal level of the energy component of household electricity bills actually increased in 13 Member States during this period
. In these countries, the fall in wholesale prices has not translated into a reduction in the energy component of retail prices despite the fact that this is the part of the energy bill (representing around 36% of average household prices) where energy suppliers should be able to compete.
Figure 5: Relationship between the wholesale price and the energy component of the retail price in household segments in countries with non-regulated retail prices from 2008 to 2014 for electricity and from 2012 to 2014 in gas (EUR/MWh)

Source: ACER Database, Eurostat, NRAs and European power exchanges data (2014) and ACER calculations. Note: Gas data are available only for the period 2012-2014.
Abnormally low mark-ups are equally problematic as they make it difficult or impossible for a new supplier to compete against an incumbent. A reasonable mark-up is necessary for a new entrant to cover consumer acquisition and retention costs which are higher than those of the incumbent who usually retains the most loyal (‘sticky’) customers. Mark-ups that are too low and low levels of competition can be observed in several markets with regulated prices (developed further on the next page).
As for non-price competition, whilst sampling data from European capitals suggest that 'choice' for consumers in European capitals widened in recent years, a closer inspection reveals that this has largely been driven by just two products – 'green' and dual-fuel (electricity + gas) tariffs
. The offer and uptake of other, more innovative consumer products, such as aggregation services or dynamic price tariffs linked to wholesale markets
, remains limited.
Facilitating competition can be seen as means of improving consumer satisfaction. However, the data indicate that there is clearly scope for improvement in this dimension, too. According to the 2016 edition of the Commission's Consumer Scoreboard – a comprehensive study measuring consumer conditions – electricity services rank 26th and gas services 14th among the 29 markets for services across the EU. Indeed, the total detriment to EU electricity consumers has recently been quantified at over EUR 5 billion annually
. Both markets can therefore be considered low performing from the consumer standpoint.
High levels of market concentration also suggest that competition could be improved: The cumulative market share of the three largest household suppliers (CR3) is greater than 70% in 21 out of 28 Member States for electricity and in 20 out of 28 Member States for gas. CR3 values above 70% are indicative of possible competition problems.
Also significant is the fact that some form of non-targeted price regulation for electricity and/or gas still exists in 17 out of 28 Member States
. The regulation of electricity and gas prices may result in an environment that strongly impairs healthy competition, particularly in terms of the level of customer service, or the development and provision of innovative new services that consumers would be willing to pay extra for. Reliance on the government to set prices can result in consumer disengagement. In addition, regulatory intervention in price setting can have a direct impact on suppliers' ability to offer products that are differentiated in terms of pricing-related aspects – dynamic price tariffs that reflect the minute-by-minute fluctuations on wholesale markets, for example
When justifying price regulation Member States cite the need to protect the vulnerable and energy poor along with the need to protect all customers against the risk of market abuse. Around 10.2% of the EU population might be affected by the problem of energy poverty, based on a proxy indicator measuring "the inability to keep home adequately warm". If energy prices continue to increase, it is likely that energy poverty across the EU will increase and therefore more pressure to maintain energy price regulation.
Under the existing provisions in the Electricity and Gas Directive, Member States have to address energy poverty where identified. The evaluation of the provisions found important shortcomings stemming from the unclarity of the term energy poverty, particularly in relation to consumer vulnerability, and the lack of transparency with regards to the number of households suffering from energy poverty across Member States.
Addressing the issue of energy poverty through blanket price regulation can be disproportionate as it affects all consumers big or small, rich or poor. It can also lead to a chicken-and-egg problem whereby price regulation leads to distortions to the market and low competition, which are in turn used to justify the continuation of price regulation. Resolving this impasse would allow one of the most fundamental aspects of the market – the price mechanism – to function properly.
ACER's Retail Competition Index – a composite indicator that draws upon many of the abovementioned statistics, as well as others – was developed to achieve a full picture of retail market competitiveness which is not dependent on a single indicator. It illustrates the disparities in retail markets that still exist between Member States, and clearly suggests that competition can be improved in a number of them (see Graph 3).
Figure 6: ACER Retail Competition Index (ARCI) for electricity household markets in 2014

Source: ACER
2.4.2.Driver 2: Possible conflicts of interest between market actors that manage and handle data
High levels of information asymmetry (between incumbents and potential entrants) and high transaction costs impede competition and the provision of high levels of service on retail markets for energy.
For example, studies from NRAs cite discriminatory access to information on potential customers as a key barrier for new entrants to EU retail energy markets (
Box 1
below
). As most DSOs are also energy suppliers, safeguards are necessary to prevent them using privileged access to consumer data – especially smart metering data – to gain a competitive advantage in their supply operations.
In addition, "unjustified" or "incorrect" invoices are one of the largest sources of electricity and gas consumer complaints reported to the Commission
– an issue that can be largely resolved if accurate metering information were made quickly and readily available to suppliers and consumers.
Information technology could directly address these issues, making the market more contestable, facilitating the development of new services and improving the customer experience around day-to-day operations such as billing and switching. Although 80% of EU consumers should have smart meters by 2020, the experience from Member States that have already rolled them out indicates that robust rules are necessary to ensure the full benefits of smart metering data are realised, and that data privacy is respected. Such rules, however, are not fully developed in the existing EU legislation, and the diverse interests of market actors who may be involved in data handling mean that they are unlikely to emerge without regulatory intervention.
Box 1: Data management as a market entry barrier
Data management comprises the processes by which data is sourced, validated, stored, protected and processed and by which it can be accessed by suppliers or customers
The necessity to adapt to different data management models for each market can have an impact on the resources of the potential market newcomers. Non-discriminatory and smooth accessibility of data is naturally most important during the pre-contractual phase as well as for running contractual situations. The fact that not all countries have rolled out smart meters yet also creates significant differences in the availability and accessibility of data.
A standardised approach to the provision and exchange of data creates a level playing field among stakeholders and helps to encourage new challenging market actors to enter a new market.
2.4.3.Driver 3: Low levels of consumer engagement
Consumer engagement is essential for the proper functioning of the market. As such, it is closely inter related with competition (Driver 1). However, consumers are also put-off from engaging in the market by behavioural biases and bounded rationality that make it harder for them to take the decision to search for, and to switch to, the best offer.
In particular, three key barriers to consumer engagement have been identified. First, the broad variety of fees that consumers may be charged when they switch diminishes the (perceived) financial gains of moving to a cheaper tariff in what is already a marginal decision for many consumers. The evidence suggests around 20% of electricity consumers in the EU currently face a fee of between EUR 5 and EUR 90 associated with switching suppliers. A portion of those fees – affecting around 4% of consumers – may be illegal under existing EU legislation (see Section 2.6.2).
Secondly, whereas online comparison websites play an important role in helping consumers to make an informed decision about switching suppliers, recent reports of unscrupulous practices have damaged consumer trust in them. Identified issues include the default presentation of deals by some websites, the use of misleading language, and a lack of transparency about commission arrangements. Indeed, a third of respondents to a recent EU survey somewhat or strongly agreed that they did not trust comparison websites because they were not impartial and independenct.
And thirdly, consumer groups report that consumers have difficulties understanding their energy bills and comparing offers in spite of existing EU legislation aiming to facilitate this. There is a broad divergence in national requirements around billing and consumer satisfaction with their bills varies significantly between different Member States. Whereas energy bills are the foremost means through which suppliers communicate with their customers, consumers' inability to correctly answer simple questions about their own electricity use reveals that bills are not effective in providing information that could facilitate effective consumer choice. Addressing this will be increasingly important with the shift to more varied consumer products.
R&D results: The project S3C has developed a toolkit for the active engagement of end users and identifies improvements to the way and content of the communication of energy system actors with customers and citizens.
2.5.What is the EU dimension of the problem?
The EU's electricity market is strongly integrated physically, economically and from a regulatory point of view. The discretion of Member States to act individually has been substantially reduced by the resulting interdependencies and, in fact, can create significant externalities if not adequately framed within an EU-wide context.
RES E deployment is expected to increase in all Member States. The need to spur the emergence of a more flexible electricity system thus exists EU-wide. Moreover, as the EU electricity system is both physically and economically integrated, non-coordinated action is likely to increase the costs of RES E integration.
The same applies to CMs where the externalities of non-coordinated action are one of the underlying reasons for the proposed measures. It is true that not all Member States have enacted CMs, however the benefits of a more coordinated approach will benefit all Member States. Member States that have implemented a CM will be able to lower their costs by increased cross-border competition whereas the avoidance of negative spill-over effects will benefit all Member States regardless as to whether they enacted a CM or not.
In an integrated electricity market, considering the prevention and management of electricity crisis a purely national issue leads to serious problems. Where crisis situations occur, they often have a cross-border effect, and can entail serious adverse consequences for the EU as a whole. Evidence shows that non-coordinated approaches to preventing and managing electricity crisis may seriously distort the internal electricity market and put at risk the security of supply of neighbouring Member States.
Well designed and implemented consumer policies with a European dimension can enable consumers to make informed choices that reward them through healthy competition, and support the European goal of sustainable and resource-efficient growth, whilst taking account of the needs of all consumers. Increasing confidence and ensuring that unfair trading practices do not bring a competitive advantage will also have a positive impact in terms of stimulating growth. The consumer-related measures undertaken as part of this initiative therefore play an essential role in the establishment and functioning of the internal market.
2.6.How would the problem evolve, all things being equal?
2.6.1.The projected development of the current regulatory framework
In the absence of additional measures, the electricity market would continue to be governed by the Third Package and the Electricity Security of Supply Directive. Various network codes may still be adopted and implemented
, such as the draft Network Code on Emergency and Restoration and the Balancing Guideline. Whilst these network codes will help address some of the issues identified above, they will not offer a sufficient remedy on their own.
Solving the above-identified problems requires measures that cannot be addressed in the current legal framework. As the network codes constitute secondary implementing legislation designed to amend non-essential elements of the Third Package by supplementing it, their scope is confined to the same limits drawn by the Third Package and hence, developing new network codes cannot be expected to provide for adequate solutions either.
In view of the fact that the proposals in essence develop new areas for which currently no clear legal basis exist in the Third Package or in the Electricity Security of Supply Directive, stronger enforcement is not an option either (with some limited exceptions, which are further developed below).
Member States have developed forms of voluntary collaboration that attempt to address some of the problems identified. However, these initiatives cannot be expected to resolve all problems and with the same effectiveness as EU action (See also EU value added).
Regarding security of supply in particular, both the evaluation and the results of the public consultation clearly show that Directive 2009/89 is outdated. It does not take account of the current, fast evolving situation of the electricity market. And it offers no framework for coordinating national policies in the area of security of electricity supply.
With regards to consumer issues, the Commission may develop guidance to tackle implementation issues caused by difficulties in interpreting the existing legislation. In particular, it may issue an interpretative note on the existing provisions in the Electricity and Gas Directives covering switching-related fees, as well as further guidance on how the dozen or so consumer Directives relevant to comparison tools should be applied.
On energy poverty, the Commission will already set up the EU Energy Poverty Observatory using funds already secured from the European Parliament. However, the extent to which the Observatory continues to share good practices and improve data gathering is uncertain, as continued funding is not secured beyond the first year of operation. Moreover, the impact of this measure may be limited as the current legislation does not require Member States to measure energy poverty and hence to address it.
2.6.2.Expected evolution of the problems under the current regulatory framework
Both this and the impact assessment for the parallel RED II initiative come to the conclusion that the electricity market, provided that it is improved, together with projected CO2 prices, may deliver investments in most mature low-carbon technologies such as solar PV and onshore wind by 2030. However, in the absence of a market optimised for increasing levels of renewable penetration, achieving the 2030 objectives will only be possible at significantly higher costs.
In the absence of a better defined framework for government interventions, the current trend of non-coordinated implementation of national resource adequacy measures risks proliferating, undermining the efficiency of the market to deliver efficient production and investment decisions and defragmenting its regulatory framework.
In fact, in the absence of measures that will improve investment incentives and efficient market functioning, it is likely that more Member States will have to take recourse to means other than the market to secure sufficient investments for resource adequacy purposes, setting in motion a negative spiral in which government interventions increase the need for the subsequent one.
Failing to integrate all participants in the market means that their decisions will not be guided by market signals, entailing the risks that their investment and production decisions will be sub-optimal from a welfare perspective, if not distort markets.
In addition, in the absence of a clear framework for co-ordinated action between Member States when it comes to preventing and managing crisis situations, the EU's electricity system risks being increasingly exposed to risks of serious incidents, without the EU or its Member States having any means to properly tackle them. There is a real risk that Member States will continue to do as they see fit in crisis situations, thus undermining the proper functioning of the internal electricity market.
Regarding active consumer engagement, Member States have committed to deploying smart meters to around two thirds of the population while access to innovative services such as demand response or in the area of self generation remains limited in many Member States. Individual action by Member States would perpetuate current differences in the Union regarding consumer awareness, choice and access to dynamic prices, demand response and integrated smart services. Consumer-friendly functionalities would be taken up partially and the flexibility consumers can provide to the electricty system would remain largely untapped.
With regards to consumer protection and engagement, enforcement could help diminish the illegal switching-related costs currently faced by an estimated 4% of all EU electricity consumers. And some Member States may also voluntarily cease or reduce excessive regulatory interventions in price-setting as their retail markets mature. However, shortcomings in the existing legislation will greatly limit the Commission's ability to tackle these and other consumer-related problem drivers more effectively.
The issue of energy poverty is likely to remain relevant. Pressure on energy prices may continue as a result of the efforts to decarbonise the energy system. If energy prices grow faster than household income, more and more households will find it difficult to pay their energy bills. This may have a knock-on effect on Member States willingness to lift price regulation which will ultimately impact suppliers' ability to innovate, competition and consumer welfare. Thus, the greater the importance of enhanced transparency to estimate the number of energy poor households.
And whilst many Member States may seek to ensure the neutral, expedient, and secure management of consumer data, it is highly likely that national requirements will vary significantly, leading to an uneven playing field for new suppliers and energy service companies in the EU. Here, the only credible approach to effectively tackling the potential conflicts of interest among market actors is a legislative one.
2.7.Issues identified in the evaluation of the Third Package
A retrospective evaluation was carried out in parallel with the present impact assessment and has been added as Annex VI. Its main conclusions are:
-That the initiative of the Third Package to further increase competition and to remove obstacles to cross-border competition in electricity markets has generally been effective and that active enforcement of the legislation has led to positive results for electricity markets and consumers. Markets are in general less concentrated and more integrated than in 2009. As regards retail markets, the set of new consumer rights introduced by the Third Energy Package have clearly improved the position of consumer in energy markets.
-However, the success of the rules of the Third Package in developing the internal electricity market further to the benefit of customers remains limited in a number of fields concerning wholesale and retail electricity markets.
-Moreover, while the principles of the Third Package achieved its main purposes (e.g. more supplier competition), new developments in electricity markets such as the increase of RES E, the increase of state interventions into the electricity markets and the changes taking place on the technological side have led to significant changes in the market functioning in the last five years and have dampened the positive effect of the reforms for customers. There is a gap in the existing legislation regarding how to deal with these developments.
The conclusions of the evalution are also reflected in section 3 of each of the Annexes 1.1 throught to 7.6 to the present impact assessment.
3.Subsidiarity
3.1.The EU's right to act
In order to create an internal energy market, the EU has adopted three consecutive packages of measures between 1996 and 2009 aiming at the integration and liberalisation of the national electricity and gas markets and addressing a wide range of elements such as market access, the improvement of the level playing field, transparency, increased rights for consumers, stronger independence of regulatory authorities, etc. In February 2011, the European Council set the objective of completing the internal energy market by 2014 and of developing interconnections to put an end to any isolation of Member States from the European gas and electricity grids by 2015. In June 2016, the European Council called for Single Market strategies, including on energy, and action plans to be proposed by the Commission and to be completed and implemented by 2018.
Article 194 of the Treaty on the Functioning of the European Union ('TFEU') consolidated and clarified the competences of the EU in the field of energy. According to Article 194 TFEU, the main aims of the EU’s energy policy are to: ensure the functioning of the energy market; ensure security of energy supply in the Union; promote energy efficiency and energy saving and the development of new and renewable forms of energy; and promote the interconnection of energy networks.
The planned measures of the present intiative further progress towards the objective of improving the conditions for competition by improving the level playing field, while at the same time adjusting to the decarbonisation targets and enhancing the solidarity between Member States in relation to security of supply.
Therefore, Article 194 TFEU is the legal basis of the current proposal.
3.2.Why could Member States not achieve the objectives of the proposed action sufficiently by themselves?
The section below provides a high-level summary of the necessity of EU action, based on the four problem areas identified in section 2.
The issue of subsidiarity is also discussed in section 6 of Annexes 1.1 to 7.6 to the present impact assessment.
As regards the issue concerning a market design that is not fit for taking up large amounts of variable, decentralised electricity generation and allowing for new technical developments, it is important to note that EU action is necessary to ensure that national markets are comparable in order to improve the functioning of the internal electricity market and enable maximum cross-border trading to happen. EU-action is also necessary in order to enhance the transparency in the functioning of the electricity markets and avoid discrimination between market parties. Moreover, a number of the measures proposed to address this issue (e.g., measures for the common sizing and procurement of balancing reserves) require full cooperation of neighbouring TSOs and NRAs, and hence individual Member States might not be able to deliver a workable system or might only provide suboptimal solutions. Moreover, existing provisions under the Third Package are arguably not sufficiently clear and robust and their implementation of such rules has highlighted areas with room for improvement and hence EU action will be necessary to address the identified shortcomings.
With specific respect to DSOs, distribution grids will have to integrate even greater amounts of RES E generation in the future, and so ensuring all DSOs can efficiently manage their networks will help to reduce distribution costs and thereby support the achievement of EU RES targets. In addition, widely divergent distribution tariff regimes may affect the development of the internal energy market as they affect the conditions under which RES E generation or other resources can access the grid and participate in the national and cross-border energy markets. EU action in these areas would thereby facilitate the deployment of RES E and create a level playing field for flexibility services such as demand response by ensuring a coherent approach by Member States based on common principles. Developing this through independent Member State action would not be feasible given the heterogeneity of current national networks and regulations.
Concerning the uncertainty about future investments in generation capacity and uncoordinated government interventions, the measures in the proposed initiative aim at improving the functioning of the electricity markets and at improving the coordination between Member States for capacity mechanisms. The necessity of EU action derives from the fact that as regards the measures for improving the functioning of the electricity markets, these are already covered by EU legislation, although not sufficiently clearly, and therefore an amendment to such measures to address the distortions and deficiencies identified would require EU action. For the measures concerning the improvement of the coordination between Member States for capacity mechanisms, given that the aim is to address the shortcomings identified from resource adequacy assessments carried out at national level and to develop the cross-border participation in capacity mechanisms, the EU is best placed to provide for a harmonised framework.
In relation to the problem that Member States do not take into account of what happens across their borders when preparing for and managing electricity crisis situations, the necessity of EU action is based on the evidence that uncoordinated national approaches not only lead to the adoption of suboptimal measures but that they also make the impacts of a crisis more accute. Given the interdependency between the electricity systems of Member States, the risk of a blackout is not confined to national boundaries and could directly or indirectly affect several Member States. Therefore, the actions concerning preparedness and mitigation of crisis situations cannot be defined only nationally, given the potential impact on the level of security of supply of a neighboring Member State and/or on the availability of measures to tackle scarcity situations.
Regarding the slow deployment of new services, low quality of services and increasing mark-ups on retail markets, there is a clear need for EU action to ensure convergence of national rules, which is a precondition for the development of cross-border activity in the retail markets. Moreover, national regulations have in some instances led to distortions, weakening the internal energy market. Such distortions can be observed in relation to the protection of vulnerable and energy poor consumers which is a policy area characterised by a great variety in types of public internvention across Member States, both in terms of the definitions used and in terms of the levels of protection established. In that case EU action is justified not only to ensure customer protection and enhanced transparency but also to improve the functioning of the internal market through a more cohesive approach across all markets.
3.3.Added-value of action at EU-level
The initiative aims at amending existing EU legislation and at creating new frameworks for cross-border cooperation, which can legally and practically only be achieved at the European level.
National policy interventions in the electricity sector have direct impact on neighbouring Member States. This even more than in the past as the increasing cross-border trade, the spread of decentralised generation and more enhanced consumer participation increases spill-over effects. No state can effectively act alone and the externalities of unilateral action have become more important.
To illustrate, uncoordinated national policies for distribution tariffs may distort the internal market for distributed resources such as distributed generation or storage, as such resources will increasingly participate in energy markets and provide ancillary services to the system, including across borders. Furthermore, the lack of appropriate incentives for DSOs may slow down the integration of RES E, and the uptake of innovative technologies and energy services. EU action therefore has significant added value by ensuring a coherent approach in all Member States.
It is true that certain Member States collaborate on a voluntarily basis in order to address certain of the identified problems (e.g. Pentalateral Energy Forum –PLEF-, CEEE). However, these fora are characterised by different levels of ambition and effectiveness and are held-back by the fact that no means exist to enforce agreements on market design related arrangements. Moreover, even if one would presume that they would be fully effective in these regards, they geographically cover only part of the EU electricity market.
It should be added that clear synergies exist between the present initiative and other EU policy objectives, notably the EU's climate policies and other policy objectives in the energy field. Indeed, a well-functioning market is the base upon which the ETS can most efficiently deliver its goals and will permit a cost effective integration of RES E in the EU's electricity markets.
Consequently, the objectives of this initiative cannot be achieved only by Member States themselves and this is where action at EU-level provides an added value.
4.Objectives
4.1.Objectives and sub-objectives of the present initiative

4.2.Consistency of objectives with other EU policies
The consistency of the present initiative with various parallel initiatives in the energy policy area was already explored in section 1.2.
The ETS constitutes a cornerstone of the European Union's policy to combat climate change and its key tool for reducing industrial and electricity sector greenhouse gas emissions cost-effectively. To achieve the at least 40% greenhouse gas emission reduction target, the sectors covered by the ETS, which includes electricity generation, have to reduce their emissions by 43% compared to 2005. The ETS interacts with the electricity markets as it places a price on emissions of CO2, which is proportional to the emissions' intensity of electricity production. This can be taken into account for both operational decisions as well as for investment decisions, in which price expectations for the future will also play a larger role due to the long-term nature of investments in the electricity sector. (By contrast, decommissioning decisions may be primarily driven by short-term considerations relating primarily to operational costs and revenues). The ETS thus functions by affecting production and investment decision of electricity market actors. It follows that an ETS can only function if its is complemented by an efficient electricity market is. The objectives of the ETS and the present proposals are hence complementary to one another and mutually reinforcing.
The Effort Sharing Decision establishes binding annual greenhouse gas emissions for Member States for the period 2013-2020 in sectors not covered by the ETS and forms part of the climate and energy package. As part of the 2030 climate and energy framework, a similar binding emission reduction framework is proposed for the period 2021-2030. Reducing greenhouse gas emissions by 30% in effort sharing sectors below 2005 levels can have an indirect impact on the projection for the demand of electricity in 2030 and this has been taken into account in the Impact Assessment by using the EUCO27 scenario in the baseline against which the impacts of the present initiative is being assessed.
The Communication on the decarbonisation of transport in 2030 aims at setting out a strategy covering several legislative and non-regulatory initiatives covering the transport sector which will be subsequently proposed to contribute to meeting the agreed 2030 greenhouse gas reduction targets. The decarbonisation of transport in 2030 has an impact on the projection for the demand of electricity in 2030, primarily via the electrification of transport, and this has been taken into account in the Impact Assessment by using the EUCO27 scenario in the baseline against which the impacts of the present initiative is being assessed. The efficient integration of electric vehicles into the electricity system requires incentivising their charging to take place at times of low electricity demand and/or high supply. The present initiative aims at enabling and rewarding consumers to manage their consumption, including when charging their electric vehicles, actively via demand response thus enabling smart charging. In essence, electric vehicles will thus become part of the supply of flexibility to the electricity system.
EU's competition instruments and, in particular, the EU state aid rules are applicable to the energy sector. They have been clarified in the Guidelines on State aid for environmental protection and energy 2014-2020
. These EEAG aim at supporting Member States in reaching their 2020 targets while addressing the market distortions that may result from subsidies granted to RES. To this end, the EEAG promote a gradual move to market-based support for RES E. They also include provisions on aid to energy infrastructure and rules on aid to secure adequate electricity capacity, allowing Member States to introduce CMs when there is a real risk of insufficient electricity generation capacity. The objectives and the rules of the EEAG are set to avoid undue competition distortions from national support provided in the energy sector. The proposed initiative to strenghten efficient, integrated and functioning electricity markets is complementary to this framework.
The existing EEAG already go a considerable way in guiding CMs. The present initiaitve intends to complement this framework. For instance:
-The EEAG require that state intervention in support of resource adequacy must be necessary. The MDI impact assessment thus explores options for creating a robust framework for assessing the EU's adequacy situation which could give a good sense how much intermittent renewables can contribute to security of supply or to what extent Member States can rely on supplies from their neighbours. Today, Member States introduce capacity mechanisms based on national reports which assess these factors very differently and underestimate the contribution of RES E or foreign supplies to a Member States' security of supply. Therefore a genuine and high quality assessment which will help assessing real needs and question unfounded national claims.
-The EEAG already require that national capacity markets are open to foreign resources. However, organising effective foreign participation in national mechanism requires active contributions of several parties. The MDI impact assessment explores options for defining clear roles and responsibilities to capacity providers, transmission system operators and regulators so that foreign participation becomes effective and that investment incentives are not distorted across the borders.
The proposed changes on the new performance based remuneration framework for DSOs would also support the Digital Single Market Strategy in the sense that those would provide further incentives to enable cross sector synergies in electronic communication infrastructure deployment allowing win win solutions for the cost efficient and timely smartening of grids and high speed connectivity for EU citizens, also decreasing the digital divide and providing the backbone for digital products and services which have the potential to support all aspects of the lives of EU citizens, and drive Europe's economic recovery. The proposed measures would complement from the energy regulatory side the measures already introduced with Directive
2014/61/EU
which aims at reducing the cost of high speed broadband infrastructure deployment partly via cross sector synergies.
The proposed measures do in general have no interaction with the fundamental rights laid down in the Charter of Fundamental Rights, with the exception of the processing of personal data and improvement of consumer protection. These elements are discussed in more detail in section 6.4.6, Annex 7.1 and Annex 7.3.
The New Skills Agenda for Europe focuses on skills as an elevator to people's employability and prosperity, in line with the objective of a "social triple-A" for Europe. It will promote life-long investment in people, from vocational training and higher education through to digital and high-tech expertise and the life skills needed for citizens' active engagement in changing workplaces and societies. The energy transition will bring significant shifts in employment and skill sets required for employees active in the energy sector as traditional means of generation will be replaced by RES E. This transition is however primarily driven by EE and RED II related measures as well as national choices as to the generation mix. More relevant for the present initiative are the measures aiming at inducing the development of the retail markets from electricity supply markets towards including more service oriented product offerings facilitating the participation of consumers in the electricity market.
As regards consumer rights, the Unfair Commercial Practices Directive is the overarching piece of EU legislation regulating unfair commercial practices in business-to-consumer transactions. It applies to all commercial practices that occur before (i.e. during advertising or marketing), during and after a business-to-consumer transaction has taken place. Where sector-specific EU law is in place and its provisions overlap with the provisions of the UCPD, the corresponding provisions of the sector-specific EU rules prevail, so no contradictions exist.
Research, Innovation and Competitiveness being Energy Union's 5th dimension, cuts across all its elements. The Strategic Energy Technology Plan implements the energy union's fifth dimension, promotes research and innovation for low carbon technologies, contributing to the transformation of the EU's energy system and creating jobs, growth and global export opportunities in the fast-growing clean-technology sector. Technological developments create opportunities for citizens to turn from being passive consumers of electricity into prosumers that actively manage their consumption, storage and production of electricity and participate in the market and allow for the increasing penetration of distributed resources. A new Research, Innovation and competitiveness strategy, encompassing energy, transport and industrial competitiveness aspects is expected to be presented in the months to come. This strategy builds on the achievements of the SET Plan and further addresses the R&I challenges particularly towards industrialisation of innovative low carbon technologies.
The present initiative is fully coherent as it seeks to remove barriers for the participation of consumers, for bringing new resources to the market and seeks to improve price formation with a view to create the conditions for new business models to emerge and for innovative products to be absorbed by the market.
5.Policy options
A fully functioning European wide electricity market is the best means to ensure that electricity can be delivered to consumers in the most cost-efficient way at any time. To continue fulfilling that purpose, the electricity market needs to be able to adapt to the significant increase of variable renewable electricity production, integrate new enabling technologies such as smart grids, smart metering, smart-home, self-generation and storage equipment, empower citizens to take ownership of the energy transition and assure security of electricity supply at least costs. Market mechanisms may need to be complemented by initiatives which help preventing and managing electricity crisis situations.
Any EU action aimed at strengthening the market should build on the gradual liberalisation of the EU energy markets resulting from the three Energy Packages described earlier in this document.
The following policy options have been considered to address the problems of today's electricity market and to meet the broad energy policy objective of ensuring low carbon electricity supply to European customers at least costs. In assessing all possible options to achieve this broad objective, the following approach was taken:
-Identification of the main areas where initiatives might be needed to achieve the main objectives of a new electricity market design. These Problem Areas are set out in Box 2 below: "Overview of Problem Areas".
-To address each Problem Area a set of high level options was identified (set-out in the following paragraphs). Each of these high level options groups options for specific measures.
-A bottom-up assessment was performed for each specific measure, comparing a number of options in order to select the preferred approach. The assessments of the specific measures can be found in the Annexes to the present impact assessment.
To help the reader, a table matching the assumed measures for each high level option is included at the end of each problem area with references to the Annexes.
Box 2: Overview of Problem Areas
Problem Area I:
Market design not fit for taking up large amounts of variable, decentralised electricity generation and allowing for new technological developments
Problem Area II:
Uncertainty about sufficient future investments in generation capacity and un-coordinated government interventions
Problem Area III:
Member States do not take sufficient account of what happens across their borders when preparing for and managing electricity crisis situations
Problem Area IV:
The slow deployment of new services, low levels of service and poor retail market performance
5.1.Options to address Problem Area I (Market design not fit for an increasing share of variable decentralized generation and technological developments)
5.1.1.Overview of the policy options
With a significant part of the produced electricity coming from variable renewable sources and distributed resources, new challenges will be arising in terms of security of supply and electricity price volatility. The options examined here aim to address these challenges in the most cost-effective way for the whole European electricity system. These system cost savings will be passed on to consumers by way of lower network charges. They will also make it easier for RES E assets to earn a higher fraction of its revenues through the market.
Two possible paths were identified: the path of enhancing current market rules in order to increase the flexibility of the system, retaining to a certain extent the national operation of the systems (with more or less coordination assumed depending on the related sub-options) and the path of moving to a fully integrated approach.
Box 3: Overview of the Policy Options for Problem Area I

Each policy option consists of a package of measures which address the drivers of the problem. In the following sub-sections, the high level policy options and the packages of measures they contain are described. Details on the individual measures are included in the Annexes. It is then explained if any of those options are to be discarded at this stage, prior to assessment, or whether other options were considered but were discarded from the outset. The section is closed by a table summarising all specific measures included in each option and references to the Annexes where each measure is described and asessed in more detail.
The relevant Annexes addressing the policy options below in more detail are: 1.1 to 3.4.
5.1.2.Option 0: Baseline Scenario – Current Market Arrangements
Under this option no new legislation is adopted, but there is some effort to implement existing legislation including via the adoption of so-called network codes or guidelines. The network codes, provided for in Article 6 and the guidelines provided for in Article 18 of the Electricity Regulation specify technical rules on the operation of European electricty markets. They are, as such, only designed to amend non-essential elements of the Electricity Regulation and can only be adopted in areas specifically mentioned in the above mentioned Articles.
Under these limitiations, network codes/guidelines are not the suitable instrument to achieve all objectives of this initiative. For instance, whereas the implementation of the Guideline on Capacity Allocation and Congestion Management ('CACM Guideline') will bring a certain degree of harmonisation of cross-border intraday markets, gate closure times and products for the intraday, as well as a market clearing, there is no guarantee that the local market will adapt to reflect the cross-border approach and practices (auctions / continuous trading) and local intraday markets across Europe will continue to remain non-harmonised. This means that the EU-wide intraday market coupling envisaged by the CACM Guideline will not be able to reach its full potential.
The Balancing Guideline is expected to bring certain improvements to the balancing market, namely the common merit order list for activation of balancing energy, the standardisation of balancing products and the harmonisation of the pricing methodology for balancing. Nonetheless, other important areas like balancing capacity procurement rules, frequency, geographical scope and sizing will not be affected by this regulation.
Priority dispatch rules, must-run priorities and other technology specific rules related to the scheduling and operation of the system do not change at all with the adoption of network codes. The same applies for the possibility for demand and distributed resources to access the markets, and to compete on a level playing field with thermal generation. The baseline assumes that demand response exists only in countries where it currently has access to the market, with only industrial consumers being able to participate.
Overall, this option assumes that the future situation will remain more or less the same as today, except from some specific measures included in the network codes (as above). The baseline does not consider explicitly any type of existing support schemes for power generation plants, neither in the form of RES E subsidies nor in the form of CMs.
Stakeholders' opinions: None of the respondents to the public consultation expressed the opinion that there is no need for further upgrade of the current market arrangements.
5.1.3.Option 0+: Non-regulatory approach
Whilst systematically considered
, no such option could be identified
.
Stronger enforcement provides little scope for improving the level playing field among resources. To the extent the lack of a level playing field is due to the variety of provisions in national law, a clear and transparent EU framework is a prerequisite for any improvement. If the lack of a level playing field is due to exemptions in the EU regulatory framework, stronger enforcement of these would actually be counter productive. In this regard, the Evaluation report indicates that the rules of the Third Energy Package appear to be insufficient to cope with the challenges facing the European electricity system.
Moreover, voluntary cooperation has resulted in significant developments in the market and a lot of benefits. However, it it unlikely to provide for appropriate levels of harmonisation or certainty to the market and legislation is needed in this area to address the issues in a consistent way.
The current EU regulatory framework contains very limited rules on balancing and intraday markets in a manner that allow to strengthening these short-term markets. In particular, the Third Package does not address regional sizing and procurement of balancing reserves nor contain rules allowing achieving a larger degree of harmonisation of intraday trading arrangements.
Given that the existence of Regional Security Coordinators ('RSCs') depends on the implementation of the System Operation Guideline, RSCs may only be fully operational around mid-2019. Hence, stronger enforcement is currently not a possible option. Any progress beyond the framework in the System Operation Guideline and the application of other network codes would depend on the voluntary initiatives of TSOs. However, these voluntary initiatives would be limited due to constraints deriving from differing national legal frameworks.
As to demand response, stronger enforcement of existing provisions in the electricity and energy efficiency directives are unlikely to untap the potential of flexibility. This is because the existing provisions give Member States a high degree of freedom that has proven not to be specific enough to ensure a full removal of existing market barriers.
Evidence suggests that voluntary cooperation will not result in progress in this area, as there has been to date already significant opportunity to effect the necessary changes voluntarily.
In the case of DSOs the current EU regulatory framework does not provide a clear set of rules when it comes to additional tools that DSOs can employ to improve their efficiency in terms of costs and quality of service provided to system users. Moreover, the current framework does not address the role of DSOs in activities which are expected to have a key impact in the development of the market (e.g. data management).
5.1.4.Option 1: EU Regulatory action to enhance market flexibility
Electricity production from wind and sun is more variable and less predictable than electricity production from conventional sources of energy. Due to this, there will be times when renewables cover a very large share of electricity demand and times when they only cover a minor share of it. The large scale integration of such variable electricity production thus requires a more flexible electricity system, one which matches the variable production.
Options to deliver the desired flexibility may comprise:
a.Abolishing (i) those measures that enhance the inflexibility of the current system, namely priority dispatch for certain technologies (e.g. RES E, CHP, indigenous fuels) and "must-runs" of conventional generation, (Creating a level playing field) and (ii) barriers preventing demand response from participating in the energy and reserve markets;
b.In addition to the measures under a), better integrating short-term markets, harmonizing their gate closure times and bringing them closer to real-time, in order to take advantage of the diversity of generation resources and demand across the EU and to improve the estimation and signalling of actual flexibility needs (Strengthening the short-term markets);
c.In addition to the measures under a) and b), pulling all flexible distributed resources concerning generation, demand and storage, into the market via proper incentives and a market framework better adapted to them, based on active aggregators, roll-out of smart-metering and time-of-use supply tariffs linked to the wholesale prices.
The sub-options described above reflect a different degree of ambition to change the market, as well as the different views expressed among stakeholders on how strong the proposed interventions should be. Sub-option 1(a) (level playing field) retains a more national status of the markets, Sub-option 1(b) (strengthening short-term markets) moves also to more regionally coordinated markets, while Sub-option 1(c) (demand response/distributed resources) makes an additional step towards a more decentralised electricity market and system.
European Parliament: "…[I]n order to achieve the climate and energy targets, the energy system of the future will need more flexibility, which requires investment in all four flexibility solutions – flexible production, network development, demand flexibility and storage"[.]
European Economic and Social Committee: "The goal of a low-carbon energy supply, with a high proportion of adjustable renewable energy sources, can only be achieved in the short to medium term if all market participants (including new ones) have at their disposal enough options that afford flexibility, such as sufficient storage capacity, flexible, consumer-friendly demand options and flexible power generation technologies (e.g. cogeneration), as well as adequately upgraded and interconnected power distribution infrastructure. Other conditions are that consumers must receive adequate, timely and correct information, they must have the chance to develop their own marketing opportunities and the necessary investments in technology and infrastructure should pay off. None of this is currently the case"
.
Stakeholders' opinions: In the public consultation on Market Design Initiative most stakeholders supported full integration of renewable energy sources into the market e.g. through full balancing obligation and phasing-out priority dispatch. Also, most stakeholders agree with the need to speed up the development of integrated short-term, balancing and intraday, markets.
5.1.4.1.Sub-option 1(a): Level playing field amongst participants and resources
The first group of measures aims at removing market distortions resulting from manifold different regulatory rules for generation from different sources. Creating a level playing field among all generation modes and restoring the economic merit order curve is an important prerequisite for a well-functioning electricity market with prices that reflect properly actual demand and supply conditions. For this reason the measures described here are an integral part of all sub-options under Option 1.
The measures considered under this option would mainly target the removal of existing market distortions and create a level playing field among technologies and resources. This could involve abolishing rules that artificially limit or favour the access of certain technologies to the electricity market (such as so-called "must-run" provisions, rules on priority dispatch and access and any other rules discriminating between resources). Industrial consumers would become active in the wholesale markets, both for energy and reserves, in all Member States. All market participants would become balance responsible, bearing financial responsibility for the imbalances caused and thus being incentivized to reduce the risk of such imbalances. Dispatch and redispatch decisions would be based on using the most efficient resources available, curtailment should be a measure of last resort which is limited to situations in which no market-based resources are available (including storage and demand response), and only subject to transparent rules.
Therefore, all resources would be remunerated in the market on equal terms. This would not mean that all resources earn the same revenues, but that different resources face the same prices for equal services. In most cases the TSO should follow the merit order, allowing the market to define the dispatch of available resources, using the inherent flexibility of resources to the maximum potential (e.g. by significantly reducing must-run generation, creating incentives for the use of heat storage combined with CHP and the use of biomass generation in periods of peak demand rather than as baseload, and using demand response or storage where it is more efficient than generation). Where resources are used on the basis of merit order (thus on the basis of the marginal cost for using a particular resource at a given point in time), supply costs are reduced.
Imposing additional obligations increases the risk and hence the financing costs of some technologies such as RES E. Part of this risk will be hedged through the more liquid intraday and balancing markets resulting from the full implementation of the Network Codes, in combination with the increased participation of resources due to the removal of must-run and priority dispatch provisions. These obligations should be also accompanied by measures that reduce their costs of compliance, such as the introduction of transparent curtailment rules. Additionally, exemptions from certain regulatory provisions may, in some cases, be required. This can e.g. be the case for emerging technologies, which, although they are not yet competitive, need to reach a minimum number of running hours to gather experience. For certain generators, particularly small RES E (e.g. rooftop solar), exemptions can be furthermore justified to avoid excessive administrative efforts related to being active on the wholesale markets.
Stakeholders' opinions:
Most stakeholders support the full integration of all technologies into the market, e.g. through full balancing obligations for all technologies, phasing-out priority dispatch and removing subsidies during negative price periods.
Also stakeholders from the renewable sector often recognize the need to review the priority dispatch framework. However, in their view, a phase-out of priority dispatch for renewable energy sources should only be considered if (i) this is done also for all other forms of power generation, (ii) liquid intraday markets with gate closure near real-time exist, (iii) balancing markets allow for a competitive participation of wind producers; (short gate closure time, separate up/downwards products, etc.), and (iv) curtailment rules and congestion management are transparent to all market parties.
Cogeneration sector stakeholder seek for a least parity between CHP and RES E.
European Parliament: "European Parliament […]stresses that a new market design for electricity as part of an increasingly decentralised energy system must be based on market principles, which would stimulate investment, ensure that SMEs have access to the energy market and unlock a sustainable and efficient electricity supply through a stable, integrated and smart energy system[...]"
"European Parliament […] [i]nsists that, with the increasing technical maturity and widespread use of renewable energy sources, subsidy rules must be geared to market conditions, such as feed-in premiums, in order to keep costs for energy consumers within reasonable bounds[.]"
"European Parliament […] recalls the existing provisions of the Renewable Energy Directive, which grant priority access and dispatch for renewables; suggests that these provisions should be evaluated and revised once a redesigned electricity market has been implemented which ensures a more level playing field and takes greater account of the characteristics of renewable energy generation[.]"
Council: "[…] Renewable energy sources should become an integrated part of the electricity market by ensuring a level playing field for all market participants and enabling renewable energy producers to be fully involved in the market, including in balancing their portfolio and reacting to market price signals."
European Electricity Regulatory Forum, Florence: "The Forum stresses that the renewables framework for the post 2020 period should be based on an enhanced market design, fit for the full integration of renewables, a strong carbon price signal through a strengthened ETS, and specific support for renewables, that when and if needed, should be market based and minimise market distortions. To this end, the Forum encourages the Commission to develop common rules on support schemes as a part of the revision of the Renewables Directive that facilitate a market based and more regionalised approach to renewables."
5.1.4.2.Sub-option 1(b): Strengthening short-term markets
Sub-option 1(b) (strengthening short-term markets) includes the measures described under 1(a) (level playing field ) and a set of additional measures, further enhancing the measures foreseen in the CACM and EB Guidelines (and are assumed as part of the baseline). As explained above, variable RES E have fundamentally different generation characteristics compared to traditional fuel based generation (e.g. variability, only short-term predictability). An important additional step would therefore be to have more liquid and better integrated short-term markets, going beyond what the implementation of technical implementing legislation ("Network Codes") will achieve, setting the ground for renewable energy producers to better access energy wholesale markets and to compete on an equal footing with conventional energy producers. Short-term markets will also allow Member States to share their resources across all "time frames" (forward trading, day-ahead, intraday and balancing), taking advantage of the fact that peaks and weather conditions across Europe do not occur at the same time.
Also, the closer to real time electricity is traded (supply and demand matched), the less the need for costly TSO interventions to maintain a stable electricity system. Although TSOs would have less time to react to deviations and unexpected events and forecast errors, the liquid, better interconnected balancing markets, together with the regional procurement of balancing reserves, would be expected to provide them with adequate and more efficient resources in order to manage the grid and facilitate RES E integration.
In order to support these actions and mainly in order to be able to optimally exploit interconnections along all "time frames", a number of measures are assumed to be taken: gate closure times could be brought closer to real-time to provide maximum opportunity for the market to balance its positions before it becomes a TSO responsibility and some harmonisation would be brought to trading products for intraday markets in order to further incentivize cross-border participation of market parties. The sizing of balancing reserves and their procurement would be harmonized in larger balancing zones, allowing to reap benefits of cross-border exchange of reserves and use of the most efficient reserves available.
At the same time, the integration of national electricity systems, from the market and operational perspectives, requires the enhancement of cooperation between TSOs. The creation of a number of regional operational centres ('ROCs'), with an enlarged scope of functions, an optimised geographical coverage compared to the existing regional security coordinators and with an enhanced advisory role for all functions, including the possibility to entrust them decision-making responsibilities for a number of relevant issues, could contribute to better TSO cooperation at regional level. Measures on enhanced cooperation between TSOs could be accompanied by an increased level of cooperation between regulators and governments.
All these options would be expected to strongly incentivize participation in the intraday and balancing markets, further increasing their liquidity, while at the same time minimizing TSOs' interventions.
Stakeholders' opinions: Most stakeholders agree with the need to speed up the development of integrated short-term (intraday and balancing) markets. A significant number of stakeholders argue that there is a need for legal measures, in addition to the technical network codes under development, to speed up the development of cross-border balancing markets. Many stakeholders note that the regulatory framework should enable RES E to participate in the market, e.g. by adapting gate closure times and aligning product specifications.
European Parliament: "European Parliament […][c]alls for the completion of the integration of internal market and balancing and reserve services by fostering liquidity and cross-border trading in all market timeframes; urges that efforts to achieve the ambitious goals of the Target Model regarding intraday and balancing markets be speeded up, starting with the harmonisation of gate closure times and the balancing of energy products[.]"
Council: "An integrated European electricity market requires well-functioning short term markets and an increased level of cross-border cooperation with regard to day-ahead, intraday and balancing markets, without hampering the proper functioning of the networks, as this will enhance security of supply at lower costs for the system and consumers".
European Economic and Social Committee: "The EESC underlines the particular importance of intraday trade as a way of ensuring meaningful trade involving VREs[variable renewable energies]".
European Electricity Regulatory Forum, Florence: "The Forum supports the view that further steps are needed beyond agreement and implementation of the Balancing Guideline. In particular, further efforts should be made on coordinated sizing and cross--‐border sharing of reserve capacity. It invites the Commission to develop proposals as part of the energy market design initiative, if the impact assessment demonstrates a positive cost--‐benefit, which also ensures the effectiveness of intraday markets".
"The Forum Acknowledges the significant progress being made on the integration of cross - border markets in the intraday and day--‐ahead timeframes, and considers that market coupling should be the foundation for such markets. Nevertheless, the Forum recognises that barriers may continue to exist to the creation of prices that reflect scarcity and invites the Commission, as part of the energy market design initiative, to identify measures needed to overcome such barriers".
"[T]he Forum invites the Commission to identify those aspects of national intraday markets that would benefit from consistency across the EU, for example on within--‐zone gate closure time and products that should be offered to the market. It also requests for action to increase transparency in the calculation of cross--‐zonal capacity, with a view to maximising use of existing capacity and avoiding undue limitation and curtailment of cross--‐border capacity for the purposes of solving internal congestions".
"The Forum stresses that, whilst scarcity pricing in short--‐term markets is critical to creating the right signals, the importance of hedging opportunities and forward/future markets in creating more certainty for investors and alleviating risks for consumers must not be overlooked. Further, it considers that the Commission must recognise the risks of State Interventions undermining scarcity pricing signals".
5.1.4.3.Sub-option 1(c): Pulling demand response and distributed resources into the market
Sub-option 1(c) (demand response/distributed resources) includes the measures described under 1(a) (level playing field) and 1(b) (strengthening short-term markets), as well as a set of additional measures, aiming at using the full potential of demand response, storage and distributed generation. The previous options would introduce a level playing field for all resources and improve the short-term market framework. They would, however, not include any measure intending to pull all the additional available potential from distributed resources into the market. Such resources are most importantly demand response, distributed RES E and storage.
A significant part of the current costs for the electricity system stem from the new challenges of variable generation for the system, notably the increased need to deal with supply peaks and unexpected generation gaps. As the elecricity grid requires a constant balance of demand and supply, grid operators need to take costly measures. Demand response, distributed RES E and storage can play an important role to reduce these costs.
The measures considered under Option 1(c) bring demand response from all consumer groups, including residential and commercial consumers, and storage as additional resources into the market, especially to the balancing market. This would even further increase the flexibility of the electricity system and the resources for the TSOs to manage it. At the same time it should lead to much more efficient operation of the whole energy system.
This option would include more in particular:
Enabling consumers to directly react to price signals on electricity markets both in terms of consumption and production, by giving consumers access to a fit-for-purpose smart metering system, enabling suppliers to measure and settle electricity consumption close to real time, as well as requiring suppliers to offer consumers electricity supply contracts with prices linked dynamically to the wholesale spot market that will enable consumers to directly react to price signals on electricity markets both in terms of consumption and production.
Box 4: Benefits and risks of dynamic electricity pricing contracts
The preferred policy option is to provide all consumers the possibility to voluntarily choose to sign up to a dynamic electricity price contract and to participate in demand response schemes. All consumers will however have the right to keep their traditional electricity price contract.
Dynamic electricity prices reflect – to varying degrees – marginal generation costs and thus incentivise consumers to change their consumption in response to price signals. This reduces peak demand and hence reduces the price of electricity at the wholesale market. Those price reductions can be passed on to all consumers. At the same time, suppliers can pass parts of their wholesale price risk on to those consumers who are on dynamic contracts. Both aspects can explain why, according to the ACER/CEER monitoring report 2015, on average existing dynamic electricity price offers in Europe are 5% cheaper than the average offer.
While consumers on dynamic price contracts can realise additional benefits from shifting their consumption to times of low wholesale prices they also risk facing higher bills in case they are consuming during peak hours. Such a risk is deemed to be acceptable if taking this risk is the free choice of the consumer and if he is informed accurately about the potential risks and benefits of dynamic prices before signing up to such a contract.
Aggregators are companies that act as intermediaries between the electricity system and distinct agents in the electricity system, mainly small, individual resoures but that exist in large numbers, and which are usually located in the distribution grid (consumers, prosumers and producers). Developing a comprehensive framework for demand, supply and storage aggregators would facilitate their participation in the market and thus increase flexibility in the energy system and complement large generation connected to the transmission grid. Larger storage facilities can be connected at distribution or transmission level, and provide services on a peer basis with other providers.
R&D results: The economic and technical viability of the concept of aggregation has already been demonstrated in European projects like: Integral, IDE4L, Grid4eu, INTrEPID, INCREASE, DREAM. The ability of small-scale RES to participate in the balancing market or contribute to solving grid congestion has been demonstrated in European projects like: V-Sync and MetaPV.
In order to pull all available resources into the market, it is also important to enable and incentivise DSOs, without compromising their neutrality as system operators, to manage their networks in a flexible and cost-efficient way, This could be achieved by establishing a performance-based remuneration framework for DSOs that would reward them for innovating and improving overall efficiency of their networks through synergies with other actors, making full use of energy storage, and/or investing in electronic communication infrastructure. This would be enabled by the deployment of intelligent infrastructure and by ensuring coherence with other Commission policies in the field of the Digital Single Market and the General Data Protection Regulation.
Measures under this option would also include defining the conditions under which DSOs may acquire flexibility services without distorting the markets for such services, and putting in place distribution tariff structures that send accurate price signals to all grid users. Such initiative would be aimed at facilitating the integration of the increasing amounts of variable RES E generation that will be connected directly to distribution grids in the future.
Stakeholders' opinions: Many stakeholders identified a lack of smart metering systems offering the full functionalities to consumers and dynamic electricity pricing (more flexible consumer prices, reflecting the actual supply and demand of electricity) as one of the main obstacles to kick-starting demand side response, along with the distortion of retail prices by taxes/levies and price regulation.
Other factors include market rules that discriminate against consumers or aggregators who want to offer demand response, network tariff structures that are not adapted to demand response and the slow roll-out of smart metering. Some stakeholders underline that demand response should be purely market driven, where the potential is greater for industrial customers than for residential customers. Many replies point at specific regulatory barriers to demand response, primarily with regards to the lack of a standardised and harmonised framework for demand reponse (e.g. operation and settlement). A number of respondents also underline the need to support the development of aggregators by removing obstacles for their activity to allow full market participation of renewables. Many submissions highlight the crucial role of scarcity pricing for kick-starting demand response at industrial and household level.
Regarding the role of DSOs, the respondents consider active system operation, neutral market facilitation and data hub management as possible functions for DSOs. Some stakeholders point at a potential conflict of interests for DSOs who are able to actively menage their networks where these DSOs are also active in the supply business, emphasizing that the neutrality of DSOs should be ensured. A large number of the stakeholders stressed the importance of data protection and privacy, and consumer's ownership of data. Furthermore, a high number of respondents stressed the need of specific rules regarding access to data. As concerns a European approach on distribution tariffs, the views are mixed; the usefulness of some general principles is acknowledged by many stakeholders, while others stress that the concrete design should generally considered to be subject to national regulation.
European Parliament: "European Parliament […] considers that this framework should promote and reward flexible storage solutions, demand-side response technologies, flexible generation, increased interconnections and further market integration, which will help to promote a growing share of renewable energy sources and integrate them into the market[.]"
"European Parliament[…] recalls that the transition to scarcity pricing implies improved mobilisation of demand response and storage, along with effective market monitoring and controls to address the risk of market power abuse, in particular to protect consumers; believes that consumer engagement is one of the most important objectives in the pursuit of energy efficiency, and that whether prices that reflect the actual scarcity of supply in fact lead to adequate investment in electricity production capacity should be evaluated on a regular basis[.]"
"European parliament […][c]onsiders that energy storage has numerous benefits, not least enabling demand-side response, assisting in balancing the grid and providing a means to store excess renewable power generation; calls for the revision of the existing regulatory framework to promote the deployment of energy storage systems and other flexibility options, which allow a larger share of intermittent renewable energy sources (RES), whether centralised or distributed, with lower marginal costs to be fed into the energy system; stresses the need to establish a separate asset category for electricity or energy storage systems in the existing regulatory framework, given the dual nature – generation and demand – of energy storage systems[.]"
Council: "The future electricity retail markets should ensure access to new market players (such as aggregators and ESCO’s) on an equal footing and facilitate introduction of innovative technologies, products and services in order to stimulate competition and growth. It is important to promote further reduction of energy consumption in the EU and inform and empower consumers, households as well as industries, as regards possibilities to participate actively in the energy market and respond to price signals, control their energy consumption and participate in cost-effective demand response solutions. In this regard, cost efficient installation of smart meters and relevant data systems are essential. Barriers that hamper the delivery of demand response services should be removed".
European Electricity Regulatory Forum, Florence: "The Forum recognises that the development of a holistic EU framework is key to unlocking the potential of demand Response and to enabling it to provide flexibility to the system. It notes the large convergence of views among stakeholders on how to approach the regulation of demand response, including: the need to engage consumers; the need to remove existing barriers to market access, including to third--‐party aggregators; the need to make available dynamic market--‐based pricing; the importance of both implicit and explicit demand response; and the cost--‐efficient installation of the required technology".
5.1.5.Option 2: Fully Integrated EU market
This option considers measures that would aim to deliver a single truly pan-European electricity market via relatively far-reaching changes to the current regulatory framework, aiming at the full integration of electricity markets and system operation, and at mobilising all available flexibility of the EU-wide system.
For a fully integrated EU market, one would need to significantly change the current regulatory approach of the internal market. The current EU wholesale market design of the Third Package provides for a coordination framework between grid operators and national regulators and sets some rules for certain issues which are relevant for cross-border exchange of electricity (e.g. coordinated electricity trading and grid operation measures). However, under the Third Package, regulatory decisions are in principle left to Member States, the 28 national regulators and the 42 European grid operators if not otherwise provided in the Third Package.
Leaving scope for national decision-making on trading and system operation may lead to inefficiencies due to unsufficiently coordinated and contradicting decisions. A more centralised regulatory approach could therefore be considered to achieve more integrated EU markets.
Under this option, procurement of balancing reserves would be performed directly at EU level, instead of a regional level. For system operation, this could mean shifting from a system of separate national TSOs to an integrated system managed by a single European Independent System Operator ("EU ISO"). System operation (including real time operation) and planning functions could be performed by this EU ISO, which would be competent for the whole Union.
In order to optimally deal with congestion between countries and to let the market transmit the right price signals, this option would entail to move from zonal to nodal pricing. The values of available transmission capacities would be calculated centrally and could be closely coordinated across market regions, thereby taking advantage of all information available among the TSOs in different grid arreas and also taking into account the interrelationship between different interconnectors. As a result, it is assumed that more interconnector capacity is made available to the market(s) and resources are expected to be utilized more efficiently across regions.
In general, Option 2 would not only entail coordination, approximation and harmonisation of selected topics relevant for national market and grid operation rules, but also to apply the same rules and specifications for products and services across the EU, including centrally fixed rules for electricity trading, for common EU-wide procurement of reserves and central system planning and operation. Such centralised integrated market would also provide for mandatory smart meter roll-out and a full EU framework for incentive-based demand response to better exploited demand reponse. Under Option 2, also distribution tariff structures would be harmonised, stronger unbundling rules for DSOs be created as well as harmonised renumeration methodologies that ensure DSOs' incentives to invest in innovative and efficient technologies.
ACER would need to gain significant competences and take over most NRAs' responsibilities directly or indirectly related to cross-border and EU-level issues. ENTSO-E would need to be formally separated from its members' interest and take up more competences.
Such measures, intended to optimise the cost-efficiency and flexibility of the European electricity system, would involve going significantly beyond the measures described under Option 1, requiring also particularly far-reaching institutional changes.
Stakeholders' opinions: No stakeholder expressed support for the possibility of designing measures leading to the creation of a fully integrated EU electricity market. For example, as regards the establishment of an EU Independent System Operator, a number of stakeholders emphasized that while it is necessary to reinforce TSO coordination, this should take place through a step-wise regional integration of system operation
5.1.6.For Option 1 and 2: Institutional framework as an enabler
Each set of proposed measures under Options 1(a) to 1(c), as well as (2), will necessitate a different degree of reinforcement of the institutional framework of the EU's electricity markets. Since the harmonisation of regulatory aspects (e.g. gate closure times, rules for the curtailment of cross-border capacities, bidding zones etc.) often has different economic impacts in different Member States, an institutional framework is needed to find the necessary compromises. Experience has shown that it will generally be more difficult to achieve ambitious harmonisation goals with an institutional framework that grants veto rights to each national regulator or TSO (i.e. in cooperative institutions applying unanimous decision-making). An alignment or harmonisation of aspects concerning the electricity market design is therefore more likely to happen with an institutional framework which applies (qualified) majority decision-making or which replaces the decision-making by 28 different regulators/TSOs by a central body which takes the decision in the European interest.
A robust institutional framework constitutes a pre-requisite for the integration and proper functioning of the EU market. For this reason, it is necessary that the institutional framework reflects the realities of the electricity system and the resulting need for regional cooperation as well as that it addresses existing and anticipated regulatory gaps in the energy market.
In order to effectively establish a level playing field between all potential market participants and resources (Sub-option 1(a) (level playing field)), it is necessary to reinforce ACER's competences at EU level in order to address regulatory gaps already identified in the implementation of the Third Package and ensure the oversight over entities and functions with relevance at EU level.
When markets and market regulation achieve a regional dimension (Sub-option 1(b)(strenghening short-term markets)), the institutional framework needs to be adapted accordingly, if it is to remain efficient and effective. Currently, the EU institutional framework is based on the complementarity of regulation at national and EU law. Hence, the regulatory framework would then need to be reinforced to address the need for additional regional cooperation. In this regard, ACER's competences and NRAs' cooperation at regional level should be enhanced, corresponding to increased regional TSO cooperation and to the implementation of network codes and guidelines at regional level. The mandate of ENTSO-E could be clarified to strengthen its obligation to take a European / internal market perspective and to emphasize its transparency and monitoring obligations. The role of power exchanges in cross-border electricity issues should be acknowledged and they should be involved in all regulatory procedures relevant for them. Finally the use of congestion income should be altered, increasing the proportion spent on investments that maintain or increase interconnection, thus creating the basis for the regional co-operation through a strongly interconnected system.
In order to facilitate distributed resources to participate in the market (Sub-option 1(c) demand response/distributed resources), DSOs must become more active at European level and have increased responsibilities and tasks, similar to those of the TSOs. Their role should be formalised into a European organisation with an efficient working structure to render their participation effective and independent. In particular, whereas DSOs are currently represented at EU level by four associations (Eurelectric, Geode, CEDEC and EDSO), none of these has the necessary characteristics to represent the sector by engaging in tasks that might include the codification of formal EU market rules: Either they or their members are listed as lobbyists on the EU Transparency Register, none of their memberships is representative of all EU DSOs, and none has the explicit mandate to represent EU DSOs in such activities.
Finally, Option 2 requires significantly restructuring the institutional framework, going beyond addressing the regulatory gaps and moving towards more centralised institutional structures with additional power and responsibilities, particularly for ACER and ENTSO-E.
Stakeholders' opinions: Opinions with regard to strengthening ACER’s powers are divided. There is clear support for increasing ACER's legal powers by many stakeholders. However, the option to keep the status quo is also visibly present, notably in the submissions from Member States and national energy regulators. While some stakeholders mentioned a need for making ACER'S decisions more independent from national interests, others highlighted rather the need for appropriate financial and human resources for ACER to fulfil its tasks.
With regard to ENTSO-E, stakeholders' positions are divided as to whether ENTSO-E needs strengthening remain divided. Some stakeholders mention a possible conflict of interest in ENTSO-E’s role – being at the same time an association called to represent the public interest, involved e.g. in network code drafting, and a lobby organisation with own commercial interests – and ask for measures to address this conflict. Some stakeholders have suggested in this context that the process for developing network codes should be revisited in order to provide a greater a balance of in interests.
Some submissions advocate for including DSOs and stakeholders in the network code drafting process. While a majority of stakeholders support governance and regulatory oversight of power exchanges, particularly as regards the market coupling operator function, other stakeholders are sceptical whether additional rules are needed for power exchanges given the existing rules in legislation on market coupling (in the CACM Guideline).
European Parliament: "European Parliament […][n]otes the importance of effective, impartial and ongoing market monitoring of European energy markets as a key tool to ensure a true internal energy market characterised by free competition, proper price signals and supply security; underlines the importance of ACER in this connection, and looks forward to the Commission’s position on new and strengthened powers for ACER on cross-border issues[.]"
"European Parliament […][s]tresses that in most cases renewables are fed in at distribution system level, close to the level of consumption, and therefore calls for DSOs to play a greater role as facilitators and to be more closely involved in the design of European regulatory framework and in the relevant bodies when it comes to drawing up guidelines on issues of concern to them, such as demand-side management, flexibility and storage, and for closer cooperation between DSOs and TSOs at the European level[.]"
5.1.7.Summary of specific measures comprising each Option
The following table summarizes the specific measures comprising each package of measures, as well the corresponding specific measure option considered under each high level option. The detailed presentation and assessment of each measure can be found in the indicated Annex.
Table 6: Summary of Specific Measures investigated for Problem Area I
|
Specific Measures
|
Option 0
|
Option 1(a)
|
Option 1(b)
|
Option 1(c)
|
Option 2
|
|
|
Baseline
|
Level playing field
|
Option (a) +
Strengthening short-term markets
|
Option 1(a), 1(b) +
Demand response/distributed resources
|
Fully integrated markets
|
|
Priority Access and Dispatch
(Annex 1.1)
|
Maintain priority dispatch for RES, indigenous fuels and CHP
(Annex 1.1.4 Option 0)
|
Abolish priority dispatch and introduce clear curtailment rules to replace priority access, with the exception of emerging technologies and small CHP and RES E plants
(Annex 1.1.4 Options 2 and 3)
|
Fully abolish priority dispatch and access
(Annex 1.1.4 Option 1)
|
|
+ Balancing Responsibility
(Annex 1.2)
|
Financial balancing responsibility under EEAG (Annex 1.2.4 Option 0)
|
Balancing responsibility for all parties, with the exception of emerging technologies and small CHP and RES E plants
( Annex 1.2.4 Option 2)
|
Full balancing responsibilities for all parties
(Annex 1.2.4 Option 1)
|
|
+ RES providing non-frequency ancillary services
(Annex 1.3)
|
Services continue to be provided by large conventional generation
(Annex 1.3.4 Option 0)
|
Principles for transparent, non-discriminatory market-based framework for the provision of these services
(Annex 1.3.4 Option 2)
|
EU market framework for such services
(Annex 1.3.4 Option 1)
|
|
+ Reserves Sizing and Procurement
(Annex 2.1)
|
National sizing of balancing reserves, frequency of procurement as today (e.g. many products, not necessarily separete upwards/downwards products)
(Annex 2.1.4 Option 0)
|
Regional sizing and procurement of balancing reserves, daily procurement of upward/downward products
(Annex 2.1.4 Option 2)
|
European sizing and procurement of balancing reserves, daily procurement of upward/downward products
(Annex 2.1.4 Option 3)
|
|
+ Remove distortions for liquid short-term markets
(Annex 2.2)
|
National non-harmonised intraday markets
(Annex 2.2.4 Option 0)
|
Selected harmonisation of national intraday markets of gate closure times and products, with gradual implementation
(Annex 2.2.4 Option 2)
|
Full harmonisation and coupling of intraday markets
(Annex 2.2.4 Option 1)
|
|
+ TSO Co-operation (Annex 2.3)
|
Regional Security Coordinators (RSCs) to perform five tasks at regional level for national TSOs
(Annex 2.3.4 Option 0)
|
Upgrade RSCs to Regional Operational Centres (ROCs) centralising additional functions over relevant geographical areas
(Annex 2.3.4 Option 0)
|
Creation of Regional or EU Independent System Operators
(Annex 2.3.4 Options 2 and 3)
|
|
+ Demand Response (Annex 3.1)
|
Smart meter rollout remains limited in geographical scope and functionalities, market barriers to aggregators persist, and the full potential of demand response and self-consumption remains untapped
(Annex 3.1.4 Option 0)
|
Give consumers access to enabling technologies that will expose them to market price signals and a common European framework defining roles and responsibilities of aggregators
(Annex 3.1.4 Option 2)
|
Mandatory smart meter roll out and full EU framework for incentive based demand response
(Annex 3.1.4 Option 3)
|
|
+ Ensuring that DSOs become active and remain neutral towards other market actors (Annex 3.2)
|
Broad variety of national approaches to DSO roles and responsibilities
(Annex 3.2.4 Option 0)
|
Specific requirements and conditions for 'active' DSOs; Clarification of DSO's role in specific tasks; Enhanced DSO-TSO cooperation (Annex 3.2.4 Option 1)
|
EU framework for a specific set of DSO tasks and stricter unbundling rules (Annex 3.2.4 Option 2)
|
|
+ A performance-based remuneration framework for DSOs
(Annex 3.3)
|
Broad variety of national approaches to DSO compensation
(Annex 3.3.4 Option 0)
|
EU-wide principles on remuneration schemes; NRAs monitor the performance of DSOs (Annex 3.3.4 Option 1)
|
Fully harmonize remuneration methodologies (Annex 3.3.4 Option 2)
|
|
+ Distribution tariffs that send accurate price signals to grid users (Annex 3.3)
|
Broad variety of national approaches to distribution tariffs
(Annex 3.3.4 Option 0)
|
EU wide principles to make tariffs structures become more transparent and more accurately reflect the impact of each system user on the grid, especially during different times of the day; NRAs to implement more detailed requirements
(Annex 3.3.4 Option 1)
|
Fully harmonize distribution tariff structures through concrete requirements (Annex 3.3.4 Option 2)
|
|
+ Adapting Institutional Framework to reality of integrated markets (Annex 3.4 institutional framework)
|
Retain Status Quo (no change)
(Annex 3.4.4 Option 0)
|
Adapt institutional framework to the new realities of the electricity system and the resulting need for additional regional cooperation and to address regulatory gaps (relevant to each respective policy sub-option)
(Annex 3.4.4 Option 1)
|
Restructure the EU Institutional Framework providing for more centralised institutional structures
(Annex 3.4.4 Option 2)
|
5.2.Options to address Problem Area II (Uncertainty about sufficient future generation investments and uncoordinated capacity markets)
5.2.1.Overview of the policy options
A number of Member States anticipate inadequate generation capacity in future years and plan to introduce or have already introduced unilateraly, unaligned capacity mechanisms. Capacity mechanisms remunerate the guaranteed availability of electricity resources (e.g. generation or demand response) rather than paying for electricity actually delivered. The current regulatory market design does provide for rules on capacity mechanisms. While it does not prohibit nor encourage capacity mechanisms, the Third Package is, in principle, built on the concept of an "energy-only" market, in which generators are remunerated mainly based on the energy delivered. Undistorted cross-border markets should provide for the necessary investment signals to ensure stable generation at all times. Price signals should drive production and investment decisions, whereas price differentials between different bidding zones should determine where facilities should ideally be located, provided that all assets are treated equally in terms of the risks and costs to which they are exposed and the opportunities for earning revenues from producing electricity i.e. they operate within a level playing field.
Several Options will be considered to address the concerns regarding investment certainty and fragmented approaches to CMs:
Box 5: Overview of the Policy Options for Problem Area II

Each policy option consists of a package of measures which act upon the drivers of the problem. Some of the options differ according to whether generators can only rely on energy market payments or whether they receive additional remuneration from CMs. Option 1 (Improved energy-only markets) would be based on additional measures to further strengthen the internal electricity market (complementing the measures described above in options 1(a) (level playing field), 1(b) (strengthening short-term markets) and (c) (demand response/distributed resources) presented in Problem Area I). Under this option, CMs would no longer be allowed. Option 2 and 3 would also include the proposed measures to strengthen the internal energy market as presented in Option 1, but also propose possible measures to better align national CMs. The possibility to set up a mandatory EU-wide CM is described in Option 4.
The following sub-sections describe the policy options and the packages of measures they comprise. It then explains which options can be discarded at this stage, prior to assessment, as well as present other options that were considered but were discarded from the beginning. A table summarising all specific measures for each option is provided at the end of this section.
The relevant Annexes addressing the policy options below are: 4.1 to 5.2.
5.2.2.Option 0: Baseline Scenario – Current Market Arrangements
Under the baseline scenario, price formation on electricity wholesale markets is constrained, e.g. through price caps. Prices may not be able to reach levels which truly reflect the value of energy when the demand and supply balance is tight and, hence, electricity is scarce. Therefore price signals from wholesale markets would, in times of scarcity, be distorted and revenue streams of generators cannot properly reflect their value to the system. This affects, in particular, the remuneration of assets that can provide flexibility to the electricity system, regardless to whether this concerns flexible generation capacity, electricity storage or demand response.
At this stage most electricity markets in Europe face generation overcapacities. In this situation, price caps do in practice not matter – scarcity prices cannot be expected anyway. However, once old capacities will have exited the market and the power mix has adjusted (see in this regard the analyses presented in section 6.2.6.3), true price formation would be essential to produce signals for new investments. This could not happen as long as price caps exist.
Price signals are also not aligned with structural congestion in the transmission grid, thus not revealing the locations where investments would relieve congestion and production decisions. TSOs then can only operate sub-optimally the existing network and need to take frequent congestion management measures. Although the CACM Guideline provides a process for reviewing price or bidding zones, the current process lends itself to maintaining the status quo (mostly price zones along Member State borders), making this the most plausible assumption for the baseline. This is because there are likely to be competing interests at stake. In particular, some Member States are unlikely to want to amend bidding zones where it would create price differentials within their borders; it is sometimes considered to be right for all consumers to pay the same price within a Member State, and for all producers to receive the same price. The current legislation does not, therefore, provide for the socially optimal solution to be agreed.
Based on perceived or real resource adequacy concerns, several Member States take actions concerning the introduction of national resource adequacy measures or the imposition of regulatory barriers to decommissioning. These measures are usually based on national resource adequacy assessments and projections, which may substantially differ depending on the underlying assumptions made and the extent to which foreign capacities as well as demand side flexibility are taken into account in calculations. Some of these concerns and projections are a result of the current market arrangements.
The Commission's current tool to assess whether government interventions in support of resource adequacy are legitimate is state aid scrutiny. The EEAG require among others a proof that the measure is necessary, technological neutral and allows for explicit cross-border participation. However, the EEAG do not clarify how an effective cross-border CM regime could be deployed.
The baseline is common with the one presented in 5.1.2, with only two differences: (a) presence of price caps based on current practices and (b) existence of structural congestion in the transmission grid.
Stakeholders' opinions: None of the respondents to the public consultation took the view that the current market arrangements were sufficient and no further measures are required.
5.2.3.Option 0+: Non-regulatory approach
Whilst systematically considered
, no such policy option could be identified.
This option would entail relying on existing legislation to improve the current market arrangements. The likelihood of seeing any meaningful change as a result of this process is minimal. Existing provisions under EU legislation are arguably not sufficiently clear and robust. In this regard, the Evaluation report indicates that the rules of the Third Energy Package appear to be insufficient to cope with the challenges facing the European electricity system. In addition, certain areas, like resource adequacy, are not addressed in the Third Package. Consequently, the Evaluation report concludes that the Third Package does not not ensure sufficient incentives for private investments in the new generation capacities and network because of the minor attention in it to effective short-term markets and prices which would reflect actual scarcity.
Voluntary cooperation has resulted in significant developments and a lot of benefits (e.g., the PLEF, whereby some Member States have voluntarily decided to cooperate and deliver a regional resource adequacy assessment). However it may not provide for appropriate levels of harmonisation across all Member States and certainty to the market and legislation is needed in this area to address the issues in a consistent way.
5.2.4.Option 1: Improved energy market - no CMs
Option 1 assumes that European electricity markets, if sufficiently interconnected and undistorted, can provide for the necessary price signals to incentivise investments into new generation. Wholesale markets would be strengthened by a set of specific measures aiming at improving price signals so as to deliver the necessary investments based only on price signals. CMs, whether at national, regional or European level would not be justifiable to secure electricity supplies under this option as the market should be incentivising investments.
Even if such price signals concern the spot price on the wholesale market corresponding to the day-ahead market, these prices are the reference for the forward market and would thus have a long-term effect. Having as a starting point the reformed market design as described in section 5.1.4.3
, it is additionaly assumed that no administrative mechanisms directly affecting investments and price signals are allowed to be in place, in the form of CMs or (below Value of Lost Load or 'VoLL') price caps. In the case of the latter this would be effected by ensuring that any technical limits imposed by power exchanges are merely that, and are raised in the event they are reached, and, in order to provide maximum investor confidence, an end-date, after which such limits must not be below VoLL.
The strengthened short and long-term markets and the participation of distributed generation offer the necessary flexibility required to integrate variable RES E into the market. Combined with the removal of (below VoLL) price caps, the market should be able to drive investments towards the needed flexible assets, such as storage and demand response, and sufficient generating capacity. Furthermore, proper incentives are introduced aiming to unlock the flexibility that can be provided by existing assets, such as demand response and storage.
At the same time price signals could drive the geographical location of new investments and production decisions, via price zones aligned with structural congestion in the transmission grid. The location of the price zone borders would be decided through a robust regulatory decision-making process. Price differentials between these price zones should help determine where investments are needed and make the best use of natural resources (particularly important for RES E, but also for interconnectors) and, for those assets already deployed, which one will be producing. Such locational prices would also provide efficient signals for the location of demand – for example new energy intensive industries would choose to locate in areas where there is excess generation and therefore low prices. Measures would also be taken to further restrict the practice of limiting cross-border capacity in order to deal with internal network contraints and, finally, measures would be taken to minimise, in the long-term, the most significant investment and operational distortions on generators arising as a result of network charges.
Stakeholder's opinions: A majority of answering stakeholders is in favour an "energy-only" market (possibly augmented however with a strategic reserve, which is a form of a capacity market). Many stakeholders share the view that properly designed energy markets would make capacity mechanisms gradually redundant. Many generators and some governments disagree and are in favour of capacity remuneration mechanisms (assessed in Options 2, 3 and 4).
A large majority of stakeholders agreed that scarcity pricing is an important element in the future market design. While single answers point at risks of more volatile pricing and price peaks (e.g. political acceptance, abuse of market power), others stress that those respective risks can be avoided (e.g. by hedging against volatility).
A large number of stakeholders agreed that scarcity pricing should not only relate to time, but also to locational differences in scarcity (e.g. by meaningful price zones or locational transmission pricing). While some stakeholders criticised the current price zone practice for not reflecting actual scarcity and congestions within bidding zones, leading to missing investment signals for generation, new grid connections and to limitations of cross-border flows, others recalled the complexity of prices zone changes and argued that large price zones would increase liquidity.
Many submissions highlight the crucial role of scarcity pricing for kick-starting demand response at industrial and household level.
European Parliament:"…[N]ational capacity markets make it harder to integrate electricity markets and run contrary to the objectives of the common energy policy, and should only be used as a last resort once all other options have been considered, including increased interconnection with neighbouring countries, demand-side response measures and other forms of regional market integration[.]""European Parliament […] [i]s sceptical of purely national and non-market-based capacity mechanisms and markets, which are incompatible with the principles of an internal energy market and which lead to market distortions, indirect subsidies for mature technologies and high costs for endconsumers; stresses, therefore, that any capacity mechanism in the EU must be designed from the perspective of cross-border cooperation following the completion of thorough studies on its necessity, and must comply with EU rules on competition and State aid; believes that better integration of national energy production into the EU energy system and the reinforcement of interconnections could reduce the need for, and cost of, capacity mechanisms[.]"
5.2.5.Option 2: Improved energy market – CMs only when needed, based on a common EU-wide adequacy assessment)
This Option includes the measures to strenghten the internal energy market (as described in Option 1 above), i.e. every Member State is assumed to have in place a well-functioning energy market.
In addition to Option 1 however, Member States would be allowed to implement national CMs, but only under certain conditions. Additional measures are proposed in order to avoid negative consequences of uncoordinated CMs for the functioning of the internal market, building on the EEAG' state aid Guidelines and the Sector Inquiry on CMs.
To address the problem of diverging and purely national assessments of the needs for CMs, ENTSO-E would be required under this option to propose a methodology for an EU-wide resource adequacy assessment. The upgraded methodology should be based on transparent and common assumptions and ENTSO-E would carry out the assessment anually. The prerequisite for a Member State to implement a CM or prohibit capacity from exiting the market would be that ENTSO-E's assessment indicated a lack of generation capacity and where markets cannot be expected to close the gap. This would avoid that back-up capacities are developed based on a purely national perspective (i.e. national adequacy assessments, using different methodologies and not taking into account the generation potential across borders).
When proposing or applying CMs, Member States would need to introduce resource adequacy targets, which can be diverging (as an expression of their diverging preference for resource adequacy). The standards should be expressed in a unique format to become comparable across the EU – as Expected Energy Non Served ('EENS'), and it should be derived following a methodology provided by ENTSO-E which takes into account the value that average customers in each bidding zone put on electricity supplies (Value of Lost Load – 'VoLL').
Stakeholders' opinions: There is almost a consensus amongst stakeholders on the need for a more aligned method for resource adequacy assessment. A majority of answering stakeholders supports the idea that any legitimate claim to introduce CMs should be based on a common methodology. When it comes to the geographical scope of the harmonized assessment, a vast majority stakeholders call for regional or EU-wide resource adequacy assessment, while only a minority favour a national approach. There is also support for the idea to align adequacy standards across Member States.
European Parliament: "[…]stresses the importance of a common analysis of resource adequacy at regional level, facilitated by the Agency for the Cooperation of Energy Regulators (ACER) and the European Network of Transmission System Operators (ENTSO-E), and calls for the transmission system operators (TSOs) of neighbouring markets to devise a common methodology, approved by the Commission, to that end; highlights the enormous potential of strengthened regional cooperation[…]"
Council: "Member States considering implementing capacity mechanism should take into account synergies of cross-border regional cooperation and avoid any disincentive for investment in interconnection, while minimising market distortion".
5.2.6.Option 3: Improved energy market - CMs only when needed, based on a common EU-wide adequacy assessment, plus cross-border participation
Option 3 includes the measures to strenghten the internal energy market as described in Option 1 above. It also includes the requirement for national CMs to be justified by a European adequacy assessment (see Option 2). In addition, Option 3 would however provide for design rules for better compatibility between national CMs, also building on the EEAG state aid guidelines and the Sector Inquiry on CMs notably in order to facilitate cross-border participation ('blue-print') .
To date, in order to comply with EEAG, Member States have to individually organise, for each of their borders separately, the necessary cross-border arrangements involving a multitude of parties (e.g. resource providers, regulators, TSOs).
This option would provide a harmonised cross-border participation scheme across the EU by setting out procedures including roles and responsibilities for the involved parties (e.g. resource providers, regulators, TSOs).
Stakeholders' opinions: Most of the stakeholders including Member States agree that a regional/European framework for CMs are preferable. Indeed, 85% of market participant respondents and 75% of public body respondents to the sector inquiry on Capacity Mechanisms felt that rules should be developed at EU level to limit as much as possible any distortive impact of CMs on cross national integration of energy markets. Member States might instinctively want to rely more on national assets and favour them over cross-border assets. It is often claimed that in times of simultaneous stress, governments might choose to 'close borders' putting other Member States who might actually be in bigger need in trouble.
European Parliament: "[…][c]alls for cross-border capacity mechanisms to be authorised only when the following criteria, inter alia, are met: a. the need for them is confirmed by a detailed regional adequacy analysis of the production and supply situation, including interconnections, storage, demandside response and cross-border generation resources, on the basis of a homogeneous, standardised and transparent EU-wide methodology which identifies a clear risk to uninterrupted supply; b. there is no possible alternative measure that is less costly and less market-intrusive, such as full regional market integration without restriction of cross-border exchanges, combined with targeted network/strategic reserves; c. their design is market-based and is such that they are nondiscriminatory in respect of the use of electricity storage technologies, aggregated demand-side response, stable sources of renewable energy and participation by undertakings in other Member States, so that there is no crossborder cross-subsidisation or discrimination against industry or other customers, and it is ensured that they only remunerate the capacity strictly necessary for security of supply; d. their design includes rules to ensure that capacity is allocated sufficiently in advance to provide adequate investment signals in respect of less polluting plants; e. sustainability and air quality rules are incorporated in order to eliminate the most polluting technologies (consideration could be given to an emissions performance standard in this connection) […]"
5.2.7.Option 4: Mandatory EU-wide or regional CMs
Under this option based on regional or EU-wide resource adequacy assessments, entire regions or ultimately all EU Member States would be required to roll-out CMs on a mandatory basis. The design of the CMs would follow a EU 'blue print' (i.e. a set of design requirements for CMs), with the required resource adequacy target to be set at regional or EU level. This approach would assess and address adequacy concerns at a regional or EU level. Decisions on whether to introduce CMs or not would no longer be left with individual Member States, but an EU-wide CM would be created, as a mandatory additional layer to the "energy-only" market. Differences between Member States (e.g. whether all areas within larger regions actually face adequacy challenges, or network congestions) would not justify exception from the obligation to introduce a CM.
5.2.8.Discarded Options
Option 0+ will not be further analysed as no means were identified to implement it.
Option 4 does not consider the significant regional differences when it comes to resource adequacy. The EU-wide or region-wide roll-out would disregard existing congestions in the European network and it would consequently over- or underestimate the resource adequacy in single bidding zones/ Member States belonging to a wider region. As a result CMs might need to be introduced in bidding zones/Member States that do not face any adequacy concerns. Alternatively, emerging resource adequacy problems in certain bidding zones/Member States might not be identified and addressed appropriately. In addition, as a number of Member States rely on energy-only markets to provide for the necessary investments in their power systems it would not be appropriate to force them to adopt CMs.
5.2.9.Summary of specific measures comprising each Option
The following table summarizes the specific measures comprising each package of measures, as well the corresponding specific measure option considered under each high level option. The detailed presentation and assessment of each measure can be found in the indicated Annex.
Table 7: Summary of Specific Measures Examined for Problem Area II
|
Specific Measures
|
Option 0
|
Option 1
|
Option 2
|
Option 3
|
Option 4
|
|
|
Baseline (Current market arrangements)
|
Improved energy market/ no CM
|
Improved energy market/ CMs only when needed, based on a common EU-wide adequacy assessment)
|
Improved energy market/ CMs only when needed, plus cross-border participation)
|
Mandatory EU-wide or regional CMs
|
|
Specific Measures related to the Energy Market
|
As in section 5.1.2
|
As in section 5.1.4.3
|
|
+ Price Caps
(Annex 4.1)
|
Lower than VoLL
(Annex 4.1.4 Option 0)
|
At VoLL
(Annex 4.1.4 Option 2)
|
|
+ Locational Price Signals
(Annex 4.2)
|
Price Zones defined based on arrangements in CACM Guideline
(4.2.4 Option 0)
|
Strengthened process for deciding on price zones, leading to the definition of zones based on systematic congestion in networks
(4.2.4 Option 3)
|
Nodal Pricing
(4.2.4 Option 1)
|
|
+ Transmission Tariff Structures
(Annex 4.3)
|
Limited harmonisation of the methodologies setting transmission tariffs
(Annex 4.3.4 Option 0)
|
More concrete principles on the setting of transmission tariffs and other network charges.
(Annex 4.3.4 Option 2)
|
Full harmonisation of the methodologies setting transmission tariffs
(Annex 4.3.4 Option 3)
|
|
+ Congestion Income (Annex 4.4)
|
Limited restrictions on the use of congestion income
(Annex 4.4.4 Option 0)
|
Further prescription on the use of congestion income, with the aim of an even more European approach
(Annex 4.4.4 Option 1)
|
|
+ Resource Adequacy Plans
(Annex 5.1)
|
National plans following different methodologies
(Annex 5.1.4 Option 0)
|
Common EU-wide assessment by ENTSO-E becomes the basis for MS to introduce CMs
(Annex 5.1.4 Option 3)
|
|
+ Cross-border Participation of CMs
(Annex 5.2)
|
No EU framework with rules for cross-border participation
(Annex 5.2.4 Option 0)
|
N/A
|
No EU framework with rules for cross-border participation
(Annex 5.2.4 Option 0)
|
Harmonized EU framework for cross-border participation
(Annex 5.2.4 Option 1)
|
5.3.Options to address Problem Area III (When preparing or managing crisis situations, Member States tend to disregard the situation across their borders)
5.3.1.Overview of the policy options
With the intention to meet the objectives set out in the previous section, the Commission services have identified several policy options ranging from an enhanced implementation of the existing legislation to the full harmonization and decision making at regional level. Option 0 represents the baseline or the measures currently in place. Each policy option consists of a package of measures combining existing tools, possible updated and improved tools and new tools which act upon the drivers of the problem. This section finalizes with a table summarising all specific measures comprising each option.
The relevant Annex addressing the policy options below is Annex 6.
Table 8: Overview of the Policy Options for Problem Area III

5.3.2.Option 0: Baseline scenario – Purely national approach to electricity crises
Under the baseline scenario, Member States would continue identifying and addressing possible crisis situations based on a national approach, in accordance with their own national rules and requirements.
There would be no rules or structures facilitating and guaranteeing a proper identification of cross-border crisis situations and ensuring that Member States take the necessary action to deal with them, in co-operation with one another. Whilst some co-operation between Member states could take place (e.g., between the Nordic countries as well as within the context of the PLEF
), in practice such cooperation would remain entirely voluntary, and might be hampered in practice by different national rules and procedures, and a lack of appropriate structures at regional and EU level.
Innovative tools have been also developed for TSOs in the area of the system security in the last years, improving monitoring, prediction and managing secure interconnected power systems and preventing, in particular, cascading failures. In addition, the recently adopted network codes and guidelines bring a certain degree of harmonisation on how to deal with electricity systems in different states (normal state, alert state, emergency state, black-out and restoration) and should bring more clarity as to how TSOs should act in crisis situations, and as to how they should co-operate with one another. However, network codes and guidelines focus on technical issues and co-operation between TSOs (in implementation of the current legal framework). They do not offer a framework ensuring a proper co-ordination and co-operation between Member States on how to prepare for and handle electricity crisis situations, in particular in situations of simultaneous scarcity.
For instance, political decisions such as where to curtail, to whom and when, would still be taken nationally, by reference to very different national rules and regulations. In addition, any cross-border assistance in times of crisis would be hampered by a lack of common principles and rules governing co-operation, assistance and cost compensation. Finally, risks would still assessed and adressed on the basis of very different methods, and from a national perspective only.
Stakeholders' opinions: Stakeholders agree that the current framework does not offer sufficient guarantees that electricity crisis situations are properly prepared for and handled in Europe. They also take the view that, whilst network codes and guidelines will offer some solutions at the technical level, there is a need for a better alignment of national rules and cooperation at the political level
.
5.3.3.Option 0+: Non-regulatory approach
As current legislative framework established by the SoS Directive set general principles rather than requires Member States to take concrete measures, better implementation and enforcement actions will be of no avail.
In fact, as the progress report of 2010 shows
, the SoS Directive has been implemented across Europe, but such implementation did not result in better co-ordinated or clearer national policies regarding risk preparedness.
In addition, the evaluation of the SoS Directive has revealed the existence of numerous deficiencies in the current legal framework. It highlights the ineffectiveness of the SoS Directive in achieving the objectives pursued, notably contributing to a better security of supply in Europe. Whilst some of its provisions have been overtaken by subsequent legislation (notably the Third Package and the TEN-E Regulation), there are still regulatory gaps notably when it comes to preventing and managing crisis situations.
The evaluation also reveals that the SoS Directive intervention is no longer relevant today as it does not match the current needs on security of supply. As electricity systems are increasingly interlinked, purely national approaches to preventing and managing crisis situations can no longer be considered appropriate. It also concludes that its added value has been very limited as it created a general framework but left it by and large to Member States to define their own security of supply standard. Whilst electricity markets are increasingly intertwined within Europe, there is still no common European framework governing the prevention and mitigation of electricity crisis situations. National authorities tend to decide, one-sidedly, on the degree of security they deem desirable, on how to assess risks (including emerging ones, such as cyber-security) and on what measures to take to prevent or mitigate them.
The recently adopted network codes and guidelines offer some improvements at the technical level, but do not address the main problems identified.
In addition, today voluntary cooperation in prevention and crisis management is scarce across Europe and where it takes place at all, it is often limited to cooperation at the level of TSOs. It is true that certain Member States collaborate on a voluntary basis in order to addresss certain of the problems identified (e.g. Nord-BER, PLEF). However, these initiatives have different levels of ambition and effectiveness, and they geografically cover only part of the EU electricity market. Therefore, voluntary cooperation will not be an effective tool to solve the problems identified timely in the whole EU.
5.3.4.Option 1: Common minimum rules to be implemented by Member States
Under Option 1, Member States would have to respect a set of common rules and principles regarding crisis prevention and management, agreed at the European level ('minimum harmonisation'). In particular, Member States would be obliged to develop national Risk Preparedness Plans ('Plan') with the aim to avoid or better tackle crisis situations. Plans could be prepared by TSOs, but need to be endorsed at the political level. Plans should be based on an assessment of the most relevant crisis scenarios originated by rare/extreme risks. Such assesment would be carried out in a national context (as is the case today), but would have to based on a common set of rules. In particular, Member States would be required, for instance, to consider at least the following risks: a) rare/extreme natural hazards, b) accidental hazards which go beyond N-1, c) consequential hazards such as fuel shortage, d) malicious attacks (terrorist attacks, cyberattacks).
Plans would have to respect a set of common minimum requirements. They would need to set out who does what to prevent and to manage crisis situations, including in a situation of a crisis affecting more than one countrry at the same time. More specifically on cybersecurity, Member States would need to set out in the Plans how they will prevent and manage cyberattack situations. This would be combined with soft guidance on cybersecurity in the energy sector, based on the NIS Directive. Member States would also be required to set out how they ensure that assets that are important from a security of supply perspective, are protected against undue influences in case ownership control changes.
Plans should be adopted by relevant governments / ministries, following an inclusive process, and (at least some parts of the Plans) should be rendered public. Plans should be updated on a regular basis.
In addition, under Option 1 there would be new common rules and principles governing crisis management, in replacement of the current Article 42 of the Electricity Directive, which allows Member States to take 'safeguard measures' in crisis situations. All crisis management actions (whether taken at the level of the TSOs or at the level of governments) would need to respect three principles:
-'Market comes first': Non-market measures (such as obligatory demand reduction schemes) should only be introduced as a means of last resort, when duly justified, and should be temporary in nature. Use of such measures should not undermine market and system functioning;
-'Duty to offer assistance': Member States would be obliged to address electricity crisis situations, in particular situations of a simultaneous crisis, in a spirit of co-operation and solidarity. This means agreeing in advance on practical solutions on e.g. where to shed load and how much in cross-border crisis situations, subject to financial compension (which is also to be agreed upon in advance).
-'Transparency and information exchange': Member States should inform each other and the Commission without undue delay when they see a crisis situation coming (e.g., as a result of a seasonal outlook pointing at upcoming problems) or when being in a crisis situation. They should also be transparent about measures taken and their effect, both when taking them and afterwards.
The main benefits this option would bring is better preparedness, due to the fact that a common approach is followed across Europe, thus excluding the risk that some Member States being 'under-prepare'. In addition, better preparedness is likely to reduce the chances of premature market interventions, where Member States act in a transparent manner and on the basis of a clear set of rules. By imposing obligations to cooperate and lend assistance, Member States are also less likely to 'over-protect' themselves against possible crisis situations, which in turn will contribute to more security of supply at a lesser cost. Since a 'minimum' harmonisation approach would be followed, Member States would have still room to take account of national specificities, where needed and appropriate.
Stakeholders' opinions: A large majority of stakeholders is in favour of risk preparedness plans based on common rules and principles, as a tool to ensure a more common and more transparent approach. Consulted stakeholders
agree on the need for a common approach what Member States can do in crisis situations and call for more transparency.
5.3.5.Option 2: Common minimum rules to be implemented by Member States, plus regional co-operation
Option 2 would build on Option 1. It would include all common rules included in Option 1 (i.e., define a set of minimum obligations Member States would need to respect). In addition, it would put in place rules and tools to ensure that effective cross-border co-operation takes place, in a regional and EU context. Given the interlinked nature of EU's electricity systems, enhanced regional co-operation brings clear benefits when it comes to preventing and managing crisis situations.
First, under Option 2, there would be a systematic assessment of rare/ extreme risks at the regional level. The identification of crisis scenarios would be carried out by ENTSO-E, who would carry out such assessments in a regional context. To achieve this, ENTSO-E would be able to delegate all or part of its tasks to the ROCs. This regional approach would ensure that the risks originating across borders, including scenarios of a possible simultaneous crisis, are taken into account. The crisis scenarios identified by ENTSO-E would be also discussed in the Electricity Coordination Group, to ensure that a coherent and transparent approach is followed across Europe. For cybersecurity, building on Option 1, the Commission would propose the development of a network code/guidelines which would ensure a minimum level of harmonization in the energy sector throughout the EU
.
The Risk Preparedness Plans would contain two parts – a part reflecting national measures and a part reflecting measures to be pre-agreed in a regional context. The latter part includes in particular preparatory measures such as simulations of simultaneous crisis situations in neighbouring Member States ("stress tests" in regional context organised by ENTSO-E who can delegate all or part of its tasks to the ROCs); procedures for cooperation with other Member States in different crisis scenarios, as well as agreements on how to deal with simultaneous electricity crisis situations. Through such regional agreements, Member States would be required to define in advance, in a regional context, how information will be shared, how they will ensure that markets can work as long as possible, and what kind of assistance will be offered accross borders, For instance, Member States would be required to agree in advance in which situations and according to what priorities customers would be curtailed in simultaneous crisis situations. The regional coordination of plans would build trust and confidence between Member States, which is crucial in times of crisis. It would also allow optimising scarce resources in times of crisis, whilst ensuring that markets can work as long as possible.
The regional parts of the Plans should be pre-agreed in a regional context. Such regionally co-ordinated plans would help ensure that increased TSO cooperation is effectively matched by a more structured cooperation between Member States. For this reason, Member States would be called upon to co-operate and agree in the context of the same regional settings as are used for the ROCs. Effective regional co-operation and agreements would help ensure that electricity crisis situations are dealt with in the most effective manner, whilst respecting the needs of electricity consumers and systems at large.
To facilitate cross-border cooperation, Member States should designate one 'competent authority', belonging either to the national administration or to the NRA.
Additionally, ENTSO-E would be required to develop a common method for carrying out short-term risk assessments, to be used in the context of seasonal outlooks and weekly risk assessments by TSOs.
To allow for a precise monitoring, ex-ante and ex-post, of how well Member States' systems perform in the area of security of supply, harmonised security of supply indicators would be introduced, as well as obligation on Member States to inform the Electricity Coordination Group and the Commission on crisis situations, their impact and the measures taken. This would enhance transparency, comparability and mutual trust in neighbours.
Further, in this option, the role of the Electricity Coordination Group would be reinforced, so that it can act as an effective forum to monitor security of supply in Europe and oversee the way (possible) electricity crisis situations are dealt with. For instance, the Group would be asked to review the cross-border crisis scenario's developed by ENTSO-E and to review ex ante risk preparedness plans put in place by Member States. The Group could issue recommendations and develop best practice. Overall, the reinforcement of its tasks and powers would contribute to enhance cooperation and to build trust and confidence among Member States.
Figure 7: Overview of measures in Option 2

Stakeholders' opinions: The majority of consulted stakeholders are in favour of regional coodination of risk preparedness plans
and a stronger co-ordinating role of the Electricity Coordination Group
. Various stakeholders make the case for a common methodology for assessing risks in various time horizons, to detect cross-border crisis situations and guarantee comparability of results
. Several stakeholders also see a need for clear rules and ex-ante cross-border agreements to ensure that markets function as long as possible in (simultaneous) crisis situations.
The European Electricity Regulatory Forum, Florence: The Florence Forum welcomes a more co-ordinated approach to risk preparedness based on risk preparendess plans and a common framework for how to deal with (simultaneous) crisis situations, including the principle that the market should act first.
"The Forum recognises the need for more co-ordination across Member States and clearer rules on coping with electricity crisis situations. It encourages the Commission to quickly bring the draft Emergency and Restoration Network Code forward for discussion with the Member States. It also welcomes the Commission's work on a new proposal on risk preparedness in the electricity sector and considers that risk preparedness plans and common framework for how to deal with critical situations should be its key builing blocks. It stresses the need that all action on risk preparedness should respect the principle that the market should act first."
The European Parliament calls for more regional co-operation, notably as regards 'action to be taken in the event of an electricity crisis, in particular when such a crisis has cross-border effects,' and calls on the Commission 'to propose a revised framework to that end".
Council: The Council recognizes the responsibility of Member States for ensuring security of supply but sees a "benefit from a more coordinated and efficient approach", "a necessity to work on a further harmonization of of methods for assessing norms and indicators for security of supply" and "a need to develop a more common approach to preparing for and managing crisis situations within the EU".
5.3.6.Option 3: Full harmonisation and decision-making at regional level
Building on Option 2, under Option 3 the risk preparedness plans would be developed on regional level. This would allow a harmonised response to potential crisis situations in each region. On cybersecurity, Option 3 would go one step further and nominate a dedicated body (agency) to deal with cybersecurity in the energy sector. The creation of the agency would guarantee full harmonisation on risk preparedness, communication, coordination and a coordinated cross-border reaction on cyberincidents.
Crisis would have to be managed according to the regional plans agreed among Member States. The Commission would determine the key elements of the regional plans such as: commonly agreed regional load-shedding plans, rules on customer categorisation, a harmonised definition of protected customers at regional level or specific rules on crisis information exchanges in the region.
Regarding crisis handling, under Option 3, a detailed 'emergency rulebook' would be put in place, containing an exhaustive list of measures that can be taken by Member States in crisis situations, with detailed indications as regards what measures can be taken, in what circumstances and when.
Stakeholders' opinions: The results of the public consultation showed that only few stakeholders were in favour of regional or EU wide plans. Some stakeholders mentioned the possibility to have plans on all three levels (national, regional and EU)
.
Whilst stakeholders generally acknowledge the need for more commonality and more regional co-operation on risk prevention and management, there is no support for a fully harmonised approach based on rulebooks
.
5.3.7.Discarded Options
Option 0+ was disregarded as no means for enhanced implementing of the existing acquis were identified.
5.3.8.Summary of specific measures comprising each Option
The following table summarizes the specific measures to be taken under each option. A more detailed discussion can be found in annex.
|
Table 8: Sumary of Specific Measures Examined for Problem Area III
|
|
Specific Measures
|
Option 0
|
Option 0+
|
Option 1
|
Option 2
|
Option 3
|
|
|
Baseline
|
Non-regulatory approach
|
Common minimum EU rules for prevention and crisis management
|
Common minimum EU rules plus regional cooperation, building on Option 1
|
Full harmonisation and full decision-making at regional level, building on Option 2
|
|
Assessments
|
Rare/extreme risks and short-term risks related to security of supply are assessed from a national perspective.
Risk identification & assessment methods differ across Member States.
|
This option was disregarded as no means for enhanced implementing of the existing acquis nor for enhanced voluntary cooperation were identified.
|
Member States to identify and assess rare/extreme risks based on common risk types.
|
ENTSO-E to identify cross-border electricity crisis scenarios caused by rare/extreme risks, in a regional context. Resulting crisis scenarios to be discussed in the Electricity Coordination Group.
Common methodology to be followed for short-term risk assessments (ENTSO-E Seasonal Outlooks and week-ahead assessments of the RSCs).
|
All rare/extreme risks undermining security of supply assessed at the EU level, which would be prevailing over national assessment.
|
|
Plans
|
Member States take measures to prevent and prepare for electricity crisis situations focusing on national approach, and without sufficiently taking into account cross-border impacts.
No common approach to risk prevention & preparation (e.g., no common rules on how to tackle cybersecurity risks).
|
-
|
-Member States to develop mandatory national Risk Preparedness Plans setting out who does what to prevent and manage electricity crisis situations.
-Plans to be submitted to the Commission and other Member States for consultation.
-Plans need to respect common minimum requirements. As regards cybersecurity, specific guidance would be developed.
|
Mandatory Risk Preparedness Plans including a national and a regional part. The regional part should address cross-border issues (such as joint crisis simulations, and joint arrangements for how to deal with situations of simultaneous crisis) and needs to be agreed by Member States within a region.
Plans to be consulted with other Member States in the relevant region and submitted for prior consultation and recommendations by the Electricity Coordination Group.
Member States to designate a 'competent authority' as responsible body for coordination and cross-border cooperation in crisis situations.
Development of a network code/guideline addressing specific rules to be followed for the cybersecurity.
Extension of planning & cooperation obligations to Energy Community partners.
|
Mandatory Regional Risk Preparedness Plans, subject to binding opinions from the European Commission.
Detailed templates for the plans to be followed.
A dedicated body would be created to deal with cybersecurity in the energy sector.
|
|
Crisis management
|
Each Member State takes measures in reaction to crisis situations based on its own national rules and technical TSO rules.
No co-ordination of actions and measures beyond the technical (system operation) level. In particular, there are no rules on how to coordinate actions in simultaneous crisis situations between adjacent markets.
No systematic information-sharing (beyond the technical level).
|
|
Minimum common rules on crisis prevention and management (including the management of joint electricity crisis situations) requiring Member States to:
(i) not to unduly interference with markets;
(ii) to offer assistance to others where needed, subject to financial compensation, and to;
(iii) inform neighbouring Member States and the Commission, as of the moment that there are serious indications of an upcoming crisis or during a crisis.
|
Minimum obligations as set out in Option 1.
Cooperation and assistance in crisis between Member States, in particular simultaneous crisis situations, should be agreed ex-ante; also agreements needed regarding financial compensation. This also includes agreements on where to shed load, when and to whom. Details of the cooperation and assistance arrangements and resulting compensation should be described in the Risk Preparedness Plans.
|
Crisis is managed according to the regional plans, including regional load-shedding plans, rules on customer categorisation, a harmonized definition of 'protected customers' and a detailed 'emergency rulebook' set forth at the EU level.
|
|
Monitoring
|
Monitoring of security of supply predominantly at the national level.
ECG as a voluntary information exchange platform.
|
-
|
-Systematic discussion of ENTSO-E Seasonal Outlooks in ECG and follow up of their results by Member States concerned.
|
Systematic monitoring of security of supply in Europe, on the basis of a fixed set of indicators and regular outlooks and reports produced by ENTSO-E, via the Electricity Coordination Group.
Systematic reporting on electricity crisis events and development of best practices via the Electricity Coordination Group.
|
A European Standard (e.g. for EENS and LOLE) on Security of Supply could be developed to allow performance monitoring of Member States.
|
5.4.Options to address Problem Area IV (Slow deployment and low levels of services and poor market performance)
5.4.1.Overview of the policy options
To recap, the drivers in this Problem Area are:
-Low levels of competition on retail markets;
-Low levels of consumer engagement;
-Market failures that prevent effective data flow between market actors.
Each policy option consists of a package of measures that addresses the problem drivers in a different way and to a different extent. They aim to tackle the existing competition and technical barriers to the emergence of new services, better levels of service, and lower consumer prices, whilst ensuring the protection of energy poor consumers.
Box 5: Overview of the Policy Options for Problem Area IV

In the following sub-sections the policy options and the packages of measures they comprise are described. This section is closed by a table summarising all specific measures comprising each option.
The relevant annexes addressing the policy options below are: 7.1 to 7.6.
5.4.2.Option 0: Baseline Scenario - Non-competitive retail markets with poor consumer engagement and poor data flows
Under this option no new legislation is adopted, there are no further efforts to clarify the existing legislation through guidance, and no additional work through non-regulatory means to address the problem drivers. It assumes that the future situation will remain more or less the same as today.
Stakeholders' opinions: A significant number of stakeholders consider that the level of competition in retail markets is too low and there is no record of significant support for current market arrangements and their organic development. The sole exception is on billing information, where energy suppliers and industry associations indicate that there may be little scope for EU action to ensure bills facilitate consumer engagement in the market due to subsidiarity considerations.
5.4.3.Option 0+: Non-regulatory approach to address competition and consumer engagement
Under this option, the problem drivers are addressed to the greatest extent possible without resorting to new legislation. This means strengthening enforcement to tackle cases of the non-transposition or incorrect application of existing legislation, new Commission guidance to tackle implementation issues related to difficulties in interpreting the existing legislation, and examining new soft law provisions to address gaps in the legislation itself.
To improve competition, bilateral consultations are held with Member States to progressively phase out price regulation, starting with prices below costs. Should it be clear that Member State interventions in price setting are not proportionate, justified by the general economic interest or not compliant with any other condition specified in the current EU acquis, then enforcement action is taken under the existing acquis and recent Court judgements, which require these criteria. Section 7.1.1 of the Evaluation argues that the regulation of electricity and gas prices limits consumer choice, restricts competition, and discourages investment.
To improve consumer engagement, the Commission issues an interpretative note on the existing provisions in the Electricity and Gas Directives covering switching-related fees. Section 7.1.1 and Annex IV of the Evaluation show that the current framework remains both complex and open to interpretation with regard to the nature and scope of certain key obligations.
The Commission works to ensure the dissemination and uptake of the key cross-sectorial principles for comparison tools. Enforcement action follows. Nevertheless, Section 7.3.5 and Annex V of the Evaluation show that the relevance of the existing legislation is challenged by the fact that it is not adapted to reflect new ways of consumer-market interaction, such as through comparison tools.
The Commission also develops a Recommendation on energy bills that builds upon the recommendations prepared by the Citizen's Energy Forum's Working Group on e-Billing and Personal Energy Data Management
. Section 7.1.1 and Annex V of the Evaluation show that there is poor consumer satisfaction with energy bills, and poor awareness of information conveyed in bills. This suggests that there may still be scope to improve the comparability and clarity of billing information.
Finally, to better protect energy poor and vulnerable consumers, the Commission establishes the EU Energy Poverty Observatory which will contribute to the sharing of good practices and strengthens enforcement around existing requirements for National Regulatory Authorities to monitor disconnection rates – an area identified as lacking in the Evaluation (Section 7.1.1 and Annex III).
However, no action is taken to address the market failures that prevent effective data flow between market actors. As this involves tackling possible conflicts of interest among market actors, non-regulatory measures were not deemed appropriate to credibly addressing this problem driver. Section 7.3.6 and Annex IX of the Evaluation show that the current legislation was not designed to address currently known challenges in managing large, commercially valuable consumption data flows.
By tackling regulatory interventions in price setting, this option would enable suppliers to profitably develop value-added products, thus fostering innovation in energy retail markets. It would also promote the consumer-driven uptake of such innovative products by addressing switching fees, unreliable comparison tools and unclear bills – each a key barrier to consumer engagement.
Stakeholders' opinions: There are no explicit opinions among the stakeholders on a non-regulatory approach. However, some of the points raised by the stakeholders, like increased transparency on switching suppliers, exit fees, comparison tools as well as transparent bills, may be addressed by non-regulatory measures.
5.4.4.Option 1: Flexible legislation addressing all problem drivers
Under this option, all problem drivers are addressed through new legislation that provides Member States leeway to adapt their laws to the conditions in national markets.
To improve competition, Member States progressively phase out blanket price regulation by a deadline specified in new EU legislation, starting with prices below costs. Transitional, targeted price regulation for vulnerable consumers is permitted (e.g. in the form of social tariffs), allowing a case-by-case assessment of the proportionality of exemptions to price regulation that takes into account the social and economic particularities in Member States.
To both improve competition and reduce transaction costs in the market, consumer data management rules that can be applied independently of the national data-management model are put in place. These include criteria and measures to ensure the impartiality of market actors involved in data handling, as well as the implementation of standardised, national data formats to facilitate data access. These measures aim at eliminating barriers to entry associated with data access, and helping all market actors provide a higher level of service to consumers through the efficiencies that information technology offers.
To increase consumer engagement, the use of contract termination fees is restricted. Such fees are only permissible for the early termination of fixed-term contracts, and they must be cost-reflective. Consumer confidence in comparison websites is fostered through national authorities implementing a certification tool for the most useful and reliable websites in their markets. In addition, high-level principles ensure that energy bills are clear, easy to understand, and free from unnecessary information, whilst leaving Member States some scope to tailor billing format and content to national requirements. Certain information elements in bills would be mandatory and would need to be prominently displayed to facilitate the comparison of offers and switching.
Finally, to better protect energy poor and vulnerable consumers, an improved, principle-based EU legal framework to support Member State action on vulnerable and energy poor consumers is put in place. A generic adaptable, definition of energy poverty based on household income and energy expenditure is included in the legislation for the first time. Member States would measure and report energy poverty with reference to household income and energy expenditure, and NRAs would publish the number of disconnections due to non-payment – figures they should already be collecting under the current legislation. These actions are taken cumulatively, on top of the non-regulatory measures on energy poverty described in Section 5.4.3.
These measures build upon the existing provisions on energy poverty in the Electricity and Gas Directives which state that Member States must adress energy poverty where it is identified. They offer the necessary clarity about the meaning of energy poverty, as well as, the transparency with regards to the number of household in energy poverty. Better monitoring of energy poverty across the EU will, on one hand, help Member States to be more alert about the number of households falling into energy poverty, and on the other hand, peer pressure will also encourage Member States to put in place measures to reduce energy poverty. Since currently available data can be used to measure energy poverty, the administrative cost is limited
. Likewise, the actions proposed do not condition Member States on their primary competence of social policy, hence, respecting the principle of subsidiarity.
Taken together, this option would strongly promote innovation on retail markets by ensuring that new entrants and energy service companies receive non-discriminatory access to consumer data – access that will allow these market actors to develop and offer the value-added products that (integrated) incumbents have not. A firm commitment to phase out blanket price regulation would enable suppliers in many Member States to differentiate their offers to consumers through non-price competition. And by tackling financial barriers to switching, improving the availability of comparison tools and helping consumers understand important information in their bills; this option would increase consumer engagement with the market and the selective pressure for new services.
Stakeholders' opinions: Feedback indicates that the general principles put forward as part of Option 1 would likely enjoy broad support amongst stakeholders. The sole exception would be the measures on billing information, where energy suppliers and industry associations have stated that there may be little scope for EU action. However, even here, the general principles proposed in this option would give broad leeway to Member States to tailor national requirements to the conditions and consumer preferences in each market.
5.4.5.Option 2: EU Harmonization and extensive safeguards for consumers addressing all problem drivers
Under this option, all problem drivers are addressed through new legislation that aims to provide maximum safeguards for consumers and the extensive harmonisation of Member State action throughout the EU.
To improve competition, Member States progressively phase out all blanket price regulation, starting with prices below costs, by a deadline specified in new EU legislation, as per Option 1 (flexible legislation). However, exemptions to price regulation are defined at the EU level in terms of either: a) a price threshold to be defined based on principles ensuring coverage of the cost incurred by the energy undertakings above which Member States may set retail prices; and/or b) a consumption threshold below which household may benefit from a regulated tariff.
To both improve competition and reduce transaction costs in the market, a standard consumer data handling model is enforced. This assigns the responsibility for data handling to a neutral market actor, such as a TSO or independent third-party, eliminating all possibility of conflicts of interest. Nationally standardised formats are devised to facilitate data access to all market actors concerned, including cross-border access.
To increase consumer engagement, all switching-related fees are banned, including contract termination fees. NRAs establish comparison websites to ensure consumers have access to at least one neutral comparison resource, alongside private sector offerings. In addition, the format and content of energy bills is partially harmonized through the inclusion of a standard 'comparability box' that prescriptively presents key information in exactly the same way in every EU bill.
Finally, to better protect energy poor and vulnerable consumers, a uniform EU framework to monitor energy poverty and reduce disconnections is put in place. A specific, harmonised definition of energy poverty is included in EU legislation referring to households that fall below the poverty line after meeting their required energy needs. In order to measure energy poverty, Member States survey the energy efficiency of their national housing stock and calculate the amount of energy, and costs, required to make all housing comfortable. These survey results are reported to the Commission.
In addition, a host of preventive measures on disconnections are put in place: (i) Member States are to give all customers at least two months (approximately 40 working days) notice before a disconnection from the first unpaid bill; (ii) before a disconnection, all customers receive information on sources of support, and are offered the possibility to delay payments or restructure their debts; and (iii) the disconnection of vulnerable consumers is prohibited in winter. These actions are taken cumulatively, on top of the non-regulatory measures on energy poverty described in Sections 5.4.3.
As with Option 1 (Flexible legislation), this option would strongly promote innovation on retail markets through non-discriminatory access to consumer data, a firm commitment to phase out blanket price regulation, and by tackling barriers to consumer engagement. However, any negative impacts to competition resulting from the stronger, and more costly, safeguards for the vulnerable and energy poor may also reduce the availability of new services. In addition, Member States may be better suited to design disconnection safeguard schemes to ensure that synergies between general national social service provisions and disconnection safeguards are achieved.
Stakeholders' opinions: Whilst many stakeholders support the objectives Option 2 aims to achieve, several have flagged reservations regarding the prescriptive approach to achieving them. In particular, NRAs have voiced their unease over an over-prescriptive EU billing format, and recommend that the decision on whether or not to allow contract exit fees is best taken at the national level. NRAs also point out that it is their role to define the appropriate methodologies for applicable price regulation. Most of the Member States consider that the model for data handling should be best decided at national level. And finally, whilst many stakeholders have supported comparison tool accreditation schemes (Option 1 – flexible legislation), none have called for government authorities to provide comparison tools exclusively.
5.4.6.Summary of specific measures comprising each Option
The following table summarizes the specific measures comprising each package of measures, as well the corresponding specific measure option considered under each high level option. The detailed presentation and assessment of each measure can be found in the indicated Annex.
Table 9: Summary of Specific Measures Examined for Problem Area IV
|
Specific Measures
|
Option 0
|
Option 0+
|
Option 1
|
Option 2
|
|
|
Baseline
|
Non-regulatory approach
|
Flexible legislation
|
Harmonization and extensive consumer safeguards
|
|
Energy poverty and disconnection protection (Annex 7.1)
|
Sharing of good practices(Annex 7.1.4 Option 0)
|
EU observatory for energy poverty. Sharing of good practices and increase efforts to correctly implement legislation (Annex 7.1.4 Option 0+)
|
Introducing a generic adaptable, definition of energy poverty in EU legislation, and setting an EU framework to monitor energy poverty (Annex 7.1.4 Option 1)
|
Introducing a specific, harmonised definition of energy poverty in EU legislation, a comprehensive EU framework to monitor energy poverty based on an energy efficiency survey of the housing stock, and a host of preventive measures to avoid disconnections (Annex 7.1.4 Option 2)
|
|
Price regulation (Annex 7.2)
|
Making use of existing acquis to continue bilateral consultations and enforcement actions to restrict price regulation to proportionate situations justified by manifest public interest
(Annex 7.2.4 Option 0)
|
Requiring MS to progressively phase out price regulation for households, starting with prices below costs, by a deadline specified in new EU legislation, while allowing transitional, targeted price regulation for vulnerable customers (Annex 7.2.4 Option 1)
|
Requiring MS to progressively phase out price regulation for households below a certain consumption threshold to be defined in new EU legislation or by MS, with support from Commission services
(Annex 7.2.4 Option 2a)
|
Requiring MS to phase out below cost price regulation by a deadline specified in new EU legislation (Annex 7.2.4Option 2b)
|
|
Data management (Annex 7.3)
|
Member States are primarily responsible on deciding roles and responsibilities in data handling (Annex 7.3.4 Option 0)
|
EU data management rules that can be applied independently of the national data-management model (Annex 7.3.4 Option 1)
|
A standard EU data management model (data hub) (Annex 7.3.4 Option 2)
|
|
Consumer engagement (Annexes 7.4, 7.5 and 7.6)
|
Lacklustre consumer engagement persists, diminishing the demand for new services and competitive pressure in the market
|
Improved EU guidance and Recommendations on switching-related charges and comparison tools (Annexes 7.4.4, and 7.5.4 Option 0+)
|
Flexible legislative measures to further limit switching-related charges, establishing a certification scheme to improve consumer confidence in comparison tools, and making information in bills clearer through minimum content requirements (not format) (Annexes 7.4.4, 7.5.4 and 7.6.4 Option 1)
|
Outlawing all switching-related charges, making all national authorities offer (or fund) an independent comparison tool, and full EU harmonization of the presentation of certain information in bills (Annexes 7.4.4, 7.5.4 and 7.6.4 Option 2)
|
6.Assessment of the impacts of the various policy options
This section assesses the impacts of the options under each Problem Area. The analysis focuses on the broad impacts of those options. The impacts of the specific measures included in each option are assessed in more detail in separate annexes attached to this impact assessment.
Each option was assessed both quantitatively and qualitatively, in an effort to capture at the highest possible detail the impacts of the underlying measures within each option. When reliable quantitative analysis or information was not available, the assessment could only be performed qualitatively, based on specific criteria.
6.1.Assessment of economic impacts for Problem Area I (Market design not fit for an increasing share of variable decentralized generation and technological developments
6.1.1.Methodological Approach
6.1.1.1.Impacts Assessed
The market design options are examined on the basis of their effectiveness in addressing the identified problems and achieving the desired objectives, while at the same time facilitating the delivery of the 2030 climate and energy targets in a cost-efficient and secure way for the whole of Europe.
As the examined measures focus on the better functioning of the electricity markets
, economic impacts are in particular analysed with respect to competition, cost-efficiency, better utilization of resources, as well as impacts on security of electricity supply.
The effect of the measures on the wholesale markets will induce indirect social impacts and have limited effect on innovation and research. The effects of energy market related polices on employment are primarily associated with the policy measures seeking to secure the achievement of the 2030 decarbonisation objectives. They will therefore not be assessed in-depth for all options.
Some indirect environmental impacts are also expected, due to the different types of fuel used for power generation, as a well-functioning flexible electricity market would incentivize the increase of low carbon generation.
Other significant impacts, direct or indirect, are not expected for the examined options, unless specifically noted.
The assessment is presented individually for each option, with qualitative analysis and interpretation of quantitative results. Summary tables reporting the modelling results for all options are included in section 6.1.6.
6.1.1.2.Modelling and use of studies
For most of the quantitative analysis, the METIS
modelling software was used to underpin the findings on the impact of the different options. METIS is a modular energy modelling software covering with high granularity (geographical, time) the whole European power system and markets. Simulations adopted a Member State-level spatial granularity and an hourly temporal resolution for year 2030 (8760 consecutive time-steps per year), capturing also the uncertainty related to demand and RES E power generation.
For consistency with all parallel European Commission work on the 2030 Energy and Climate Framework, in the Red II, EE and Effort Sharing Regulation impact assessments, METIS was set-up (calibrated) such as to reflect as close as possible
the year 2030 projection of the power sector in the PRIMES EUCO27 scenario. The PRIMES EUCO27 scenario
, built on the EU Reference Scenario 2016, ensures a cost-efficient achievement of at least 40% GHG reduction (including agreed split of reductions between ETS and non-ETS), 27% RES and 27% EE target.
A stand-alone analysis of the impact of potential policies promoting downstream price and incentive based demand response, at all customer segments (industrial, commercial, residential), has also been undertaken (detailed information hereon can be found in Annex 3.1). The options analysed looked at how to reach the full potential of demand response in order to reduce overall system costs, considering (i) both price and incentive based demand response, and their combination, as well as (ii) the level of access of demand service providers to the market (access rules and incentives), and (iii) customers' ability to react (by means of access to required technologies-smart metering, tariff structures and knowledge) for engaging in price based demand response. The analysis focused on the assessment of the theoretical potential of demand response, based on the nature of the electricity use/ability to shift demand by different clusters of consumers, its current level, and how the different options are likely to increase the share of the theoretical potential being realised, as well as in the estimation of associated cost and benefits.
6.1.1.3.Summary of Main Impacts
Figure 8 below summarizes the annual quantified benefits of the assessed options for 2030
, as presented in detail in sections 6.1.2 to 6.1.5. It illustrates the significant benefits of the measures under Options 1 to adapt the market design, with annual savings in 2030 of EUR 5.9 billion only for Sub-option 1(a) (level playing field), EUR 8.6 billion for 1(b) (strengthening short-term markets) and EUR 9.5 billion for Sub-option 1(c) (demand response/distributed resources). For Option 2 (fully integrated market) the calculated benefits would amount to EUR 10.6 billion.
Figure 8: Annual cost savings for Problem Area I in 2030 by option

Source: METIS
6.1.1.4.Overview of Baseline (Current Market Arrangements)
Under the baseline, the power system in 2030 relies heavily for energy on RES E generators, as well as conventional generation which is to a large degree inflexible. In particular, the share of RES E in electricity generation has almost reached 50%, thus being equal to the share of all other conventional generation together (i.e. gas, coal, lignite, nuclear, oil). The share of variable generation (solar and wind) in total generation approaches 30% across Europe. Concerning conventional generation, nuclear holds a 22% share, coal and lignite a 15% share, and natural gas 13%. The respective shares tend to differentiate across EU regions, based on the particularities of each region (Figure 9).
Figure 9: Shares of Electricity Generation per Region
in EU in the Baseline
Source: METIS
A number of rules affecting dispatch remain in place, most notably priority dispatch
for RES E and that certain technologies are considered as must-run
, reflecting current practices and nominations in the market. In fact special dispatch rules concern 60% of total installed capacity (752 GW on a total of 1,247 GW).
Figure 10: Projected Generation Capacity in 2030 per Member State in GW
Source: METIS
Another factor reducing the flexibility of the European power system is the limited allocation of interconnection capacity during intraday and balancing time frames, as well as the varying gate closures and products, which in practice reduce the opportunities for trading in the short-term markets and thus their liquidity.
Reserves are procured on a national level and in many cases in infrequent intervals, with corresponding services mainly provided by (large) thermal generators and only in some Member States by industrial consumers.
Demand response, storage (excl. hydro) and distributed generation have very limited participation in the market. In most cases available products are not customized for these resources, minimum thresholds exist for participating in the market, etc. At the same time, a large part of the generation, mainly RES E, are not balance responsible and do not have a strong incentive to perform accurate forecasts and declare accurate schedules in the day-ahead market (the share of variable generation is about 42% of total generation capacity). As a consequence, the observed imbalances are large, leading to increased needs for frequency reserves.
The deficiencies of the current regulatory framework create significant inflexibility to the system operation; the inflexibility in turn increases further the need for reserves (notably so-called replacement reserves)
. Close to real-time, the TSOs can mainly rely either on units providing replacement reserves or on very flexible (and expensive) units to avoid loss of load (peakers). In this context, in METIS replacement reserves provide than 600 GWh of electricity in the baseline, mainly in Poland and South East Europe. The same applies for RES E curtailment, as curtailment is the only alternative to the encountered stress of the system and the lack of available flexible resources: 13.0 TWh of RES E is found to be curtailed on an annual basis, mainly in the Iberian Peninsula (8.3 TWh) and UK/Ireland (4.1 TWh).
6.1.2.Policy Sub-option 1(a) (Level playing field amongst participants and resources)
6.1.2.1.Economic impacts
The restoration of the economic merit order curve in the wholesale electricity market has a direct and significant positive impact to the cost-efficient operation of the power system, leading to tangible reductions of the costs consumers. It would also allow to feed in (and remunerate from the market) more RES E (notably from wind and solar) to the system.
With special rules concerning unit dispatching eliminated (i.e. must-runs, priority dispatch), the TSOs are able to schedule and re-dispatch units more efficiently. As a result (in conjunction with the other measures under this option):
-total costs of the power system are reduced by 7%;
-the activation of replacement reserves is reduced by about 500 GWh;
-RES E curtailments (e.g. wind and solar) decline by 4.7 TWh; and,
-the occurrence of negative prices is completely eliminated.
Figure 11 - which presents the merit order at a given hour - illustrates how preferential dispatch rules for certain technologies shift the merit order to the right, resulting in price decreases but at the same time in an increase of the overall costs for the system. The example shown for biomass priority dispatch is also applicable for must-runs and priority dispatch of other (expensive) technologies. Restoring the economic merit order thus reduces the overall costs for the power system at times where these technologies would be out-of-the-money, while increasing the electricity price during these hours.
Figure 11: Merit order effect of priority dispatch
 Source: METIS
Focusing on priority dispatch, which was found to be the main distortion for the day-ahead market scheduling for the modelling, the biggest impacts on generation would be observed in Denmark, UK and Finland, where biomass holds a large share of generation capacity. The removal of priority of dispatch would have a considerable effect on expensive biomass production
, which in most cases is dispatched out of the merit order. It can also be expected that the share of CHP generation would be negatively affected, due to the relatively inflexible character of CHP production. On the other hand, removing priority dispatch rules would benefit variable RES E which could expand its production (due to the reduction in curtailments). More importantly, variable RES E producers could significantly increase their revenues due to the increase of the wholesale prices (partly due to the elimination of negative prices). Overall, the removal of priority dispatch and must-runs helps better integrating variable RES E generation and leads to significant system costs reductions and thus cost savings for consumers.
Figure 12: Effect of removal of special dispatch rules to negative prices
 Source: METIS
The above also leads to an increase of the share of Combined Cycle Gas Turbines ('CCGTs') in power generation
. RES E generation enters the market merit order, thus catering for more efficient price formation in the day-ahead and intraday markets. The removal of priority dispatch will offer access on equal terms to all resources. Moreover, it will more than double the competitive segment of the market, which in the baseline was only 40% of the market.
As more resources participate under the same competitive rules in the markets, markets would become more competitive. This implies an increase in wholesale prices as they will now reflect the actual marginal cost of generation instead of one technically lowered via rules affecting dispatch. As a result, this will lead to a much more cost-efficient operation of the power system, and consequently to a 7% decrease of its total cost.
Finally, the extension of balance responsibility to all generating and consuming entities, offers a strong incentive for variable RES E and other balance responsible parties to improve their forecasting, bid more accurately in the day-ahead market and be more active in the intraday markets. This leads to smaller imbalances and a lower requirement for reserve procurement by the TSOs. In particular the needs for mFRR are reduced by around 30%. This, combined with the capability of the demand response to also participate
in the reserve procurement and balancing markets, leads to a more cost-efficient reserve procurement process.
6.1.2.2.Who would be affected and how
Abolishing priority dispatch and priority access would mainly affect RES E producers using biofuels and CHP and operators that benefit from priority dispatch when producing using indigenous resources fuels (if their marginal costs are substantial). For low marginal cost, variable generators, such as wind and solar power plants, the impact is actually positive, which will be amplified by measures to enable RES E access to ancillary services markets.
In any event, all generators will benefit from increased transparency and legal certainty on redispatch and curtailment rules. For TSOs, the removal of priority dispatch and priority access would also facilitate grid operation.
Introducing balancing responsibilities (with exemption possibilities for emerging technologies and or small installations) will mainly impact generators currently exempted or partly shielded from balancing responsibility. Accordingly, this measure will mean they have to increase their efforts to remain in balance (e.g. through better use of weather forecasts) though at the costs of being exposed to financial risks.
6.1.2.3.Administrative impact on businesses and public authorities
The removal of priority dispatch, priority access and ensuring compliance with the balancing rules would give rise to administrative impacts for RES E (and CHP) generators, in particular for operators of very small installations. This administrative impact can however be significantly reduced by facilitating aggregation, allowing the joint operation and management of a large number of small plants (as discussed in more detail under Option 1(c)).
6.1.3.Impacts of Policy Sub-option 1(b) (Strengthening short-term markets)
6.1.3.1.Economic Impacts
Strengthening short-term electricity markets improves market coupling across time-frames, leads to a more efficient utilization of interconnector capacity and reduces the amount of required reserves, as well as their cost.
The efficiency of the intraday markets is improved due to the harmonization of their market specifications, including the transition to continuous trade and harmonisation of gate closures, as well as by an improved allocation of interconnector capacity across time-frames. Harmonising intraday markets across Europe allows to further reduce RES E curtailment by 460 GWh and the utilisation of replacement reserves by 100 GWh. Note that curtailment is not only reduced in countries where implicit auctions were not implemented in Option 1(a) (level playing field), but in already implicitly coupled regions too. Thus, extending the coupled area also benefits already coupled countries such as Germany, since it can export more of its variable RES generation. The effects are illustrated in Figure 13.
Figure 13: Positive impacts of harmonising intraday markets across Europe
 Source: METIS
By improving the methodologies for reserve dimensioning and procurement of balancing reserves, the need for balancing reserves is further reduced compared to Option 1(a). Certain improvement comes from the separation of the bids and prices for up and down regulation in order to reflect their true underlying marginal costs, which may be different both for generation and load. The separate provision of downwards reserves greatly improves the efficiency of the system, as now thermal plants are not forced to be online to provide such reserves. Another means is via the procurement of reserves on a day-ahead basis, thus their sizing being able to reflect the hourly needs for these services, while at the same time allowing the most efficient resources at a given hour to be procured as reserves by the TSO.
The reduction in the reserve needs though is mainly achieved by the regional reserve dimensioning and more efficient exchange and sharing of balancing capacity among TSOs, as the generation and consumption patterns differs between Member States according to the generation mix, renewable energy sources and differences in energy consumption. Thus, the 79.6 GW of reserve needs (FCR + FRR) in Option 0, is reduced to 65.8 GW in Option 1(a) (level playing field) and to only 42.3 GW in Option 1(b) (strengthening short-term markets) (a reduction of 47% compared to the baseline).
It is important to note that the reduction in FRR is stronger in the well-interconnected regions (about 50% reduction), namely Central Europe, the Nordics and South / South East Europe, while the benefits for UK/Ireland and Spain/Portugal are smaller due to their limited interconnection (about 20% reduction). In order to achieve these reductions from the sharing of reserves, the Member States need to ensure that sufficient interconnection capacity is reserved for this purpose, in order to ensure that despite the lower reserve requirements, the national ability to balance the system remains the same. The amount of capacity that needs to be reserved for this purpose is on average approximately 6%
of the Net Transfer Capacities ('NTCs'), with actual values varying significantly per interconnector and per hour of the day.
Similarly, different market areas have different access to flexible resources and such flexible resources are vital to the cost-efficient integration of renewable electricity generation. TSOs may not only procure smaller volumes of reserves but providers of relatively cheap flexibility resources may supply a larger volume thereof. Hence, overall balancing market payments are reduced, while at the same time more interconnection capacity can be given to the market by reducing transmission reliability margins ('TRMs').
An interesting observation coming from the assessment is the increased generation by baseload thermal plants, compared to more flexible thermal plants. In particular, the electricity generation of nuclear, CCGTs, coal and lignite plants increases by 10%, while the generation of gas and oil peakers reduces by 50% compared to the baseline. The reason is that by sharing resources between countries and decreasing reserve needs, the baseload plants do not need to retain part of their capacity on stand-by for supplying reserves and thus can increase the quantities of energy they generate. At the same time, though, flexible plants end up competing for reduced amounts of reserve needs, thus their revenues are significantly reduced compared to Option 0 (baseline) and Option 1(a) (level playing field)/ Therefore, better interconnecting markets and making them more flexible serves as a second option for bringing more flexibility into the system, complementary to but also competing with flexible generation plants.
Enhancing TSO regional coordination through the establishment of regional operational centres and by optimising market, operational, risk preparedness and network functions from the national to the regional level will entail significant efficiency gains and increase social welfare. For example, the regional sizing and procurement of reserves via ROCs could lead to benefits of EUR 3.4 billion compared to benefits of EUR 1.8 billion from national sizing and procurement of reserves based on daily probabilistic methodologies. Significant welfare benefits would, inter alia, derive from the more efficient use of infrastructure and from a decrease of financial losses that would otherwise result from the disconnection of demand in case of generation shortages.
6.1.3.2.Who would be affected and how
Improving short-term markets will affect all generation operators to a certain extent but it will in particular improve the ability of variable RES E operators to participate in the market.
Improving intraday and balancing markets would impact the work of the TSOs and Power Exchanges, because of their involvement in the operation of these markets. On the one hand this will require operating the system and organising trade within shorter timeframes. On the other hand, the shorter timeframe will allow TSOs to benefit from significant efficiencies and to reduce the risk of system problems. TSOs will also be affected through the need to collaborate closer with neighbouring TSOs through ROCs and through the changes to the balancing markets which they operate. This has the positive effect of requiring TSOs to consider systematically the impact of their actions on their neighbouring TSOs.
6.1.3.3.Administrative impact on businesses and public authorities
The administrative impact on businesses is marginal as compared with the baseline.
Power exchanges and TSOs would have to review and adapt their business practises to facilitate the changes to the market functioning as envisaged under this option. Notably, changes will have to be made to trading arrangements for intraday and balancing products. TSOs would collaborate through ROCs, which will have to be set up. The setting up of the ROCs can be estimated to cost between 9.9 and 35.6 million Euros per entity, depending on the functions and degree of responsibilities attributed to the ROCs.
Whereas these costs are not insignificant, these costs of several million Euros (which would be covered and compensated by grid fees) are minor when compared with the benefits this option will bring.
6.1.4.Impacts of Policy Sub-option 1(c) (Pulling demand response and distributed resources into the market)
6.1.4.1.Economic Impacts
The series of measures assumed in this Option include (i) the adaptation of balancing products closer to what distributed resources like demand response, variable RES and small scale storage can provide, (ii) the facilitation of the participation of distributed resources in the market mainly via aggregators and (iii) stronger incentives for the roll-out of smart-meters. These measures significantly improve the efficiency of the market and the reduce costs.
The market set-up under Option 1(c) provides the opportunity to variable RES E to better manage their imbalances due to forecast errors at lower cost (due to more competitive prices), but also to receive additional revenues for any flexibility they can provide to the market. Similarly, demand is offered the incentives and capability to respond to market prices and thus complete existing electricity markets. This can be achieved by either shifting load from hours of peak demand to hours with low demand (e.g. via storage or changing consumption partterns) or by simply adjusting consumption (when load cannot be shifted or is not really needed).
Available data coming from a standalone analysis
performed on the impact of potential policies promoting downstream price- and incentive-based demand response, at all customer segments (industrial, commercial, residential), show that demand response can be of great service, and deliver net benefits to the system as a whole while engaging all consumer segments. More in particular, it has been demonstrated that demand response schemes can lead to a reduction of the peak demand and thereby of the required backup capacity in both the transmission and distribution networks. This also translates into lower investment needs.
The analysis has shown that in a business as usual scenario (reflected in Option 0) demand response can account for approximately 34 GW, of which 19 GW will come from incentive and 15GW from price based demand response. With a supporting policy framework in place, as in Option 1(c), demand response can account for approximately 57 GW in 2030, of which 39 GW will come from incentive and 18 GW from price based demand response.
Allowing small-scale producers, storage and consumers to participate in the market, e.g., through aggregated bids, creates incentives for demand side response and flexible solutions, pulls the above potential in the market and creates a more dynamic market. New flexible resources are made available for reserve procurement and balancing market. These resources bring significant short-term and mid-term flexibility
to the system, contributing to the more efficient handling of scarcity situations and integrating variable RES E. This abundance of available resources significantly reduces the cost of the power system and, most importantly, the load payments to EUR 253 billion, from EUR 278 billion in the baseline and EUR 293 billion in Option 1(a).
These reported savings are mainly a result of a significant shift in the provision of reserves from thermal plants to demand side response (incl. storage) and wind. For example, while in Option 1(b) (strengthening short-term markets), gas was providing about 20 GW of reserves, hydro 19 GW and coal 3 GW, under Option 1(c) demand response partly replaces the above plants by providing 5 GW of reserves. In particular demand response and small scale storage (electric vehicles and heating storage) become the main providers of upward synchronized reserves, providing 33% of corresponding needs. Wind provides an additional 90 MW of upwards synchronized reserves and 330 MW of downward synchronized reserves.
6.1.4.2.Who would be affected and how
The new provisions opening up the markets to aggregated loads and demand response will bring business opportunities for aggregators, new energy service providers, and suppliers who choose to expand their portfolio of services, but will also affect generators who are likely to face reduced turnover from lower peak prices and from providing reserves.
Furthermore, demand side flexibility, along with access to real time data coming from smart metering, will help the network operators optimise their network investments and cost-effectively manage their systems. In the case of TSOs, it also allows for the better calculation of settlements and balancing penalties based on real consumption data. On the other hand, suppliers may face higher imbalances and resulting penalties as their customers change consumption patterns.
Finally, end consumers are expected to benefit from more competition, access to wider choice, and the possibility to actively engage in price based and incentive based demand response, and hence from reduced energy bills. Even those end users who choose not to participate in demand response schemes could still profit from lower wholesale prices that result from demand response, assuming that the respective price reductions are passed on to consumers.
Box 6: The possibility of large-scale grid disconnection
Looking forward, our modelling (the EUCO27 scenario) shows a continuation of the general trend of rising retail electricity prices through to 2030, stabilising from 2035 onwards. Given the decreasing costs of small-scale renewable generation and storage technologies, concerns have been raised that this trend could result in a growing number of prosumers becoming self-sustainable and disconnecting from the electricity network – a development that could have several consequences.
On the one hand, this potential 'flight from the grid' could see the remaining connected ratepayers bear an increasing share of the burden of contributing to public finances and financing the electricity network. On the other, grid costs may actually fall as distributed generation and storage assets enable network operators to more efficiently manage the grid and connect remote customers.
Predicting the full extent and implications of this trend is difficult given the current uncertainties, including regarding future cost reductions in small scale renewables and storage technologies, and the lack of real-world case studies. Nevertheless, our analysis suggests that this development will be progressive, and that the risks of large scale disconnections are limited given the difficulties of achieving complete self-sufficiency throughout the year.
In particular, even if decentralised generation and storage becomes competitive, it is questionable whether self-sufficient prosumers will fully disconnect from the grid. Disconnecting would imply losing the grid as back-up for when their own generation is inadequate (e.g. for sustained periods of low sunlight). It would also mean that prosumers forego the opportunity to sell excess electricity to the market (e.g. during prolonged sunny periods when their installed storage is at full capacity). This is one of the reasons why the MDI aims at ensuring full access of prosumers to electricity markets.
It should be added that the discussion of disruptive large scale disconnections is not only connected with distributed resources but to the perception that consumers are increasingly confronted with perverse incentives and hidden subsidies. To address this, the initiative includes measures that should lead to more cost-reflective distribution tariffs i.e. tariffs that allocate the costs of the grid fairly amongst system users. Cost-reflective tariffs will send the right long-term economic signals to system users and allow a market-driven move towards a more efficient electricity system, which will contribute to limiting network tariffs and lead to investments that are economically rational and efficient.
What is certain is that public authorities and network operators will have to adapt in order to effectively manage the challenges of any transition towards a more decentralized electricity system, and make the most of the opportunities this presents. Completely self-sufficient consumers who do not wish to be connected to the grid should not contribute to the grid costs.
6.1.4.3.Impact on businesses and public authorities
The measures proposed to enable the uptake of demand response are designed to reduce market barriers for new entrants and provide them with a stable operating framework. This is particularly important for start-ups and small and medium-sized enterprises ('SMEs') who typically offer innovative energy services and products. However, these measures may introduce an additional administrative impact for Member States and their competent authorities that will be required to clearly define in such a new setting: (i) roles and responsibilities of aggregators, as well as (ii) arrangements for consumers' entitlement to participate in price based demand response schemes, including their access to the enabling smart metering infrastructure. At the same time, access to smart metering will support consumer engagement, with better informed and more selective consumers also making it easier for NRAs to ensure proper functioning of the national (retail) energy markets.
Moreover, thanks to the wider deployment of smart metering, the distribution system operators will be in a position to lighten, and improve, some of their administrative processes (linked to meter reading, billing, dis/re-connection, switching, identification of system problems, commercial losses), and offer increased customer services. Similarly, transmission system operators will optimise their settlement and balancing penalty calculations, as they can make use of real time data coming from smart metering.
6.1.5.Impacts of Policy Option 2 (Fully integrated EU market)
6.1.5.1.Economic Impacts
By creating a centralised, fully integrated European market with market design features and procedures in place in order to deal with grid constraints and increase the available interconnection capacity offered to the market (e.g. due to the further reduction of security margins and the implementation of flow based market coupling across time-frames), the European power system can be operated even more efficiently than in the options above.
Benefits coming from the further improvements in the dimensioning and procurement of balancing reserves, now on a European level, as well as the better utilization of interconnectors by the EU Independent System Operator, lead to further reductions of the total costs compared to Option 1(c) by 1.5%. Reserve needs are further reduced by 30% compared to Option 1(c) and 63% compared to the baseline, although downwards reserves, which have a low procurement cost, are mainly procured on a national level, in order to use interconnectors mainly for exchanging electricity instead of reserving it for potential assistance to/from the neighbours.
The results indicate that although the economic benefits of moving from a national to a regional approach (Option 1(b) (strengthening short-term markets)) are significant, the move towards a more integrated European approach (Option 2) has a less significant economic value-added, as most of the benefits have already been harvested by moving towards a regional approach. On the other hand this result is also subject to the limitations of the modelling, not being able to capture the positive impacts from the more efficient operation of the network (since METIS does not include detailed network modelling).
6.1.5.2.Who would be affected and how
Under this option, TSOs, DSOs, power exchanges, electricity undertakings in general as well as Member States and competent authorities would be subject to far-reaching organisational changes (e.g. EU ISO and EU Regulator instead of national TSOs and regulators), and bound by fully harmonised rules setting out the full integration of the EU electricity market. This increases the likelihood that these rules may be difficult to implement in specific countries. This could lead to high resource requirements amongst these stakeholders, public authorities and Member States, that may be ultimately borne by consumers.
6.1.5.3.Impact on businesses and public authorities
The creation of a fully integrated European electricity market can be considered the most efficient of all the options and could, in the long run, avoid frictions from coordination and provide for a high quality electricity system with a high degree of security of supply. Under this option, it could be argued that in the long run the impact on stakeholders (e.g., TSOs, DSOs, power exchanges, electricity undertakings, etc.) may be reduced, since the integration of the electricity market would ensure a high degree of consistency.
However, this option would entail significant changes compared to the current state of the art of the electricity systems across the EU. It would be necessary to build new entities, processes and methods without being able to draw upon established practice (e.g., for the establishment of an EU ISO). Hence, there is a risk that this would lead to disruptions and would require a significant amount of time to become operational.
This option would also reduce the scope to take into account regional specificities and to draw upon established regional actors. This option would reduce the scope to develop rules at the regional level between the parties involved in organising the cross-border trade and system operation. This is because the key framework as well as the institutional structure would already be set out at the pan-European level.
In light of the above, it should be noted that the political and administrative effort required under this option would be considerable.
6.1.6.Environmental impacts of options related to Problem Area I
The measures proposed in this Problem Area aim to improve the cost-efficiency and the flexibility of the power system. By doing so, climate-friendly variable RES E can be better integrated in the market; resources are used more efficiently, and unnecessary fuel-based generation (e.g. backup generation needed because of missing rules for cross-border short-term markets) can be avoided by better using the aggregation potential of the internal market. Using the full potential of demand response has also a positive effect on the environment. If consumption can be shifted more easily to off-peak times, less backup generation from fuel-based plants is needed.
On the other hand, the removal of privileged rules for certain production forms may lead to a shift from some RES E production (i.e. biomass) to other generation types which will not only be wind and solar, but also fossil fuel-based. Therefore, although direct CO2 emissions from the power sector decrease while moving from Option 1(a) to Option 1(c), from 615 Mt CO2 to 600 Mt C02, METIS results show an increase when moving from the baseline to Option 1(a) by 60 Mt CO2. The analysis of the impact on emissions is, however, complex.
The removal of priority dispatch from biomass (as well as from any other resource, including must-run generation) is pivotal in restoring the economic merit order in the power markets and significantly increasing their economic efficiency. Such a measure would discontinue the use of expensive biomass as baseload generation, replacing it by the marginal technologies (mainly coal and gas). Expensive biomass would then mainly be used in the power sector as a flexible generation technology, as well as for providing reserves.
The replacement of biomass by gas and coal could lead in the short-term to increasing emissions. The environmental impacts of the market design measures cannot though be examined in isolation from all other complementary energy and climate policies. At the EU level, the reduction in greenhouse gas emissions within the sectors covered by the EU ETS is guaranteed by the declining cap which in turn ensures that the emissions reductions objective is met cost-effectively. In the event of an increase in emissions from certain changes in the power sector mix, the corresponding increase in demand for allowances would raise the carbon price leading to an increase in abatement through other means, whether this is through a fuel switch in power generation elsewhere or an emissions reduction in other ETS sectors. Due to the binding limit on overall emissions a reduction in the use of biomass would therefore eventually result in the same amount of GHG emissions over time, with a different fuel mix at a lower total system cost.
The main effects of removing priority dispatch for biomass are therefore:
-only cheaper fractions of biomass are being used (such as waste streams), while the more expensive one is being used as flexible dispatchable generation, rather than subsidised baseload;
-overall higher CO2 prices and lower generation costs, and higher wholesale electricity prices (but most likely lower retail prices, as no subsidies will need to be recuperated outside the wholesale market).
-more favourable conditions for gas, with more operating hours;
The possible increase in emissions in the power sector is in reality the effect of current energy policies for RES E (and specifically the incentives given by the subsidization of biomass) and not of electricity market related policies. By removing the distortions currently present in the electricity markets, the market is able to give clearer signals on the interactions between climate and energy policies and help identify the right balance between cost and resource efficiency and emissions reduction.
6.1.7.Summary of modelling results for Problem Area I
The analysis shows that although today electricity markets function much better than in the past, there are still significant gains to be harvested. Restoring the merit order and creating a level-playing field for all technologies can reduce the operational cost
from EUR 83.4 billion in Option 0 to EUR 77.5 billion in Option 1(a). Another EUR 2.7 billion can be saved by further strengthening and linking the short-term markets; EUR 0.9 billion by better integrating demand response and RES E into the market; and EUR 1.1 billion from fully integrating EU markets. Overall, the measures under Option 1(c) can lead to cost reductions up to 11.4% compared to the baseline, while the additional measures under Option 2 would raise this to 12.7%.
When considering the above results, three important points need to be made. First of all the cost saving estimates for each option are directly related to the volume of traded energy (and reserves) they concern. Option 1(a) (level playing field) affects all market frames, but most notably the day-ahead, where the largest volume of trades takes place. Options 1(b) (strengthening short-term markets) and Option 2 (fully integrated markets) focus on interconnections (for all market time frames), intraday and balancing; traded volumes there are only a fraction of the ones of the day-ahead. Option 1(c) (demand response/distributed resources) concerns mainly the balancing and reserve markets. Secondly, the effect of the measures on the intraday and balancing traded volumes is much greater, but more difficult to quantify, as it is bi-directional (upwards and downwards compared to the day-ahead scheduled energy) and complementary to the day ahead market. Finally the proposed blocks of measures were deemed as the most efficient ones, but also were found to have limited impact on the reported results.
Apart from the cost savings, which relate only to the generation side costs, it is important to also examine the final cost of the wholesale market for the consumers, referred to below as 'Load Payments' (see Glossary). With the removal of all special rules affecting dispatch, the wholesale price begins reflecting the actual marginal value of electricity and thus increases; this affects also the Load Payments which increase by 5%. Subsequent Options though bring more resources into the market, better utilizing the interconnections and further improving the cost-efficiency of the market, gradually reducing the Load payments by 6% in Option 1(b) (strengthening short-term markets), 9% for Option 1(c) (demand response/distributed resources) and 11.5% for Option 2 (fully integrated market) compared to the baseline. The above are equivalent to a reduction of the wholesale market cost for the consumer from 78 EUR/MWh in the baseline to 71 EUR/MWh for Option 1(c) and 70 EUR/MWh for Option 2.
Table 10: Monetary Impacts (in billion EUR) of the assessed Options (for EU28+NO+CH in 2030)
|
Monetary Impacts (billion EUR)
|
|
|
Option 0
|
Option 1(a)
|
Option 1(b)
|
Option 1(c)
|
Option 2
|
|
|
Baseline
|
Level playing field
|
Strengthening short-term markets
|
Demand response/ distributed resources
|
Fully integrated markets
|
|
Cost day-ahead
|
82.5
|
76.9
|
73.5
|
72.7
|
72.4
|
|
Cost intraday
|
1.4
|
0.9
|
1.2
|
1.1
|
0.3
|
|
Cost balancing
|
-0.5
|
-0.3
|
0.1
|
0.1
|
0.1
|
|
upwards
|
0.7
|
0.5
|
0.7
|
0.7
|
0.7
|
|
downwards
|
-1.2
|
-0.8
|
-0.6
|
-0.6
|
-0.6
|
|
Total cost
|
83.4
|
77.5
|
74.8
|
73.9
|
72.8
|
|
Cost savings
|
-
|
5.9
|
8.6
|
9.5
|
10.6
|
|
Load Payments
day-ahead
|
278
|
293
|
262
|
253
|
246
|
|
Load Payment Savings
|
-
|
-15
|
16
|
25
|
32
|
Source: METIS
The monetary impacts described in Table 10 are very closely linked to the impacts of the measures on the wholesale prices. In Option 1(a) (level playing field) the increase of the competitive segment of the market from 40% (due to priority dispatch and must-runs) to 100% is the main driver for a more cost-efficient operation of the system, with no negative prices observed in the performed model runs, leading in the end to higher day-ahead prices. In parallel the reserve prices are generally lowered, due to the reduction of the inflexibility in the system. Only mFRR upwards prices increase, as these services are now primarily offered by peaking units.
In Options 1(b) (strengthening short-term markets) the trends reverse, as more resources enter the market, thus lowering day-ahead prices. The better utilized interconnection capacity and the improved functioning of the reserve markets allows baseload plants to produce more electricity in the day-ahead, while the more flexible (and expensive) plants become the main providers of reserves. As a consequence, balancing prices tend to increase (together with intraday prices). Subsequently, the introduction of demand response and the provision of reserves by RES E in Option 1(c) (pulling demand response and distributed resourced into the market) further lower wholesale prices (as more resources enter the market), with the exception of downwards reserve prices which increase. Finally the impacts of Option 2 (fully integrated markets) are similar to the ones of Option 1(b) (strengthening short-term markets).
Table 11: Impacts (EUR/MWh) to Average Annual Wholesale Prices (for EU28 in 2030)
|
Average Wholesale Prices (EUR/MWh)
|
|
|
Option 0
|
Option 1(a)
|
Option 1(b)
|
Option 1(c)
|
Option 2
|
|
|
Baseline
|
Level playing field
|
Strengthening short-term markets
|
Demand response/ distributed resources
|
Fully integrated markets
|
|
Day-ahead Market Price
|
78.4
|
82.5
|
73.9
|
71.3
|
69.6
|
|
Balancing Price - aFRR upwards
|
71.9
|
58.3
|
76.2
|
71.3
|
72.3
|
|
Balancing Price - aFRR downwards
|
52.8
|
52.5
|
54.4
|
59.8
|
60.6
|
|
Balancing Price - mFRR upwards
|
72.1
|
82.3
|
85.6
|
76.3
|
76.3
|
|
Balancing Price - mFRR downwards
|
70.1
|
65.2
|
64.7
|
58.4
|
58.3
|
Source: METIS
An interesting aspect to examine is the distributional impact of the various options on the generator surplus (i.e. revenues above cost) and consumer surplus (i.e. cost below VoLL). It is important to note that this should not be interpreted as an investment or "missing money" analysis, since the modelling used here is static (based on the same set of capacities across the options). The issue of investments is analysed in Section 6.2.6.3, using a dynamic investment model (PRIMES/OM).
With the day-ahead prices significantly affected by the measures, so does generator surplus (i.e. revenues above cost). The distributional impacts on the market players though are concentrated on thermal generators, with competitive RES E generators even increasing their day-ahead revenues (not considering the additional revenues from the other markets).
Although in the baseline thermal generation seems to be making reasonable revenues, sufficient in many cases to cover fixed costs – especially for gas units – the improvements in the market design introduced in Options 1(b) (strengthening short-term markets), 1(c) (demand response/distributed resources) and 2 (fully integrated markets) lead to a significant decrease of their revenues, turning their operation to loss-making. Note, this result is a large extent due to the static modelling approach followed here and the increased competition in the market, as a result of bringing more resources into it and better utilising interconnections (thus better sharing national resources across EU). With the power generation capacities remaining constant across Options, this leads to a market with increasing resources participating (to the point of oversupply) and more intense competition, thus shrinking revenues.
Table 12: Generator Surplus (in EUR/kW) for different plant categories (for EU28 in 2030)
|
Generator Surplus (EUR/kW)
|
|
|
Option 0
|
Option 1(a)
|
Option 1(b)
|
Option 1(c)
|
Option 2
|
|
|
Baseline
|
Level playing field
|
Strengthening short-term markets
|
Demand response/ distributed resources
|
Fully integrated markets
|
|
Solids
|
394
|
393
|
146
|
124
|
108
|
|
OCGT
|
112
|
102
|
34
|
19
|
9
|
|
CCGT
|
191
|
178
|
39
|
29
|
22
|
|
Nuclear
|
451
|
490
|
435
|
418
|
413
|
|
Hydro
|
204
|
215
|
200
|
194
|
190
|
|
Solar
|
65
|
73
|
74
|
74
|
75
|
|
Wind onshore
|
117
|
133
|
137
|
137
|
137
|
|
Wind offshore
|
176
|
204
|
211
|
213
|
213
|
Source: METIS
Similarly, the introduced measures have certain consequences on the generation production, although these tend to be relatively limited. Summarizing what has already been discussed in the dedicated assessment of each option, and presented in Table 13:
-The main impact on the electricity generation patterns appears in Option 1(a), when dispatch begins reflecting the economic merit order. Most notably, biomass generation is replaced mainly by gas and coal generation.
-Otherwise, generation patterns remain relatively stable across Options, except for some shifting of gas generation to nuclear in Option 1(b) (strengthening short-term markets). This comes as a result of the more efficient interconnection allocation and procurement of reserves, which leads to the utilisation of nuclear and lignite plants mainly for producing energy, while the more expensive gas plants are used more for reserves and balancing.
-RES E curtailment and activation of replacement reserves is steadily reduced across all options, as all measures introduce more and more flexibility to the system. In fact replacement reserves are no longer needed in Option 2.
-Procurement of Balancing Reserves also decreases substantially, from 79.6 GW in the baseline to only 29.6 GW in Option 2. The gradual drop in the required reserves is an outcome of the specific measures assumed in each case and explained in more detail in the assessment of the respective options.
Table 13: System Operation Results (for EU28+NO+CH in 2030)
|
|
Option 0
|
Option 1(a)
|
Option 1(b)
|
Option 1(c)
|
Option 2
|
|
|
Baseline
|
Level playing field
|
Strengthening short-term markets
|
Demand response/ distributed resources
|
Fully integrated markets
|
|
Net Electricity Generation (TWh)
|
|
Total
|
3618
|
3606
|
3599
|
3588
|
3586
|
|
Biomass & Waste
|
236
|
78
|
73
|
72
|
71
|
|
Hydro
|
632
|
623
|
618
|
609
|
607
|
|
Wind
|
722
|
726
|
728
|
729
|
729
|
|
Solar
|
303
|
303
|
303
|
303
|
303
|
|
Lignite
|
269
|
274
|
278
|
279
|
280
|
|
Nuclear
|
755
|
775
|
800
|
803
|
804
|
|
Coal
|
237
|
272
|
274
|
268
|
266
|
|
Gas
|
455
|
545
|
515
|
516
|
515
|
|
Others
|
10
|
10
|
10
|
10
|
10
|
|
RES Curtailment (GWh)
|
13.0
|
8.3
|
6.0
|
5.0
|
4.6
|
|
Balancing Procurement (GW)
|
|
Reserve Dimensioning
|
79.6
|
65.8
|
42.3
|
42.3
|
29.6
|
|
of which FCR
|
12.4
|
12.4
|
12.4
|
12.4
|
12.4
|
|
of which aFRR
|
20.5
|
20.4
|
10.1
|
10.1
|
6.0
|
|
of which mFRR
|
46.6
|
33.1
|
19.8
|
19.8
|
11.1
|
|
Reserves via interconnections
|
-
|
-
|
12.2
|
11.7
|
18.7
|
|
Replacement Reserves Activation (GWh)
|
600
|
100
|
80
|
60
|
0
|
Source: METIS
In terms of distributional impacts across the EU regions, results are strongly related to the respective generation mix of each region, as well as to how well interconnected each region is to the others. For the regions with significant biomass generation (e.g. region 3), there are significant cost savings when moving from the baseline to Option 1(a) (level playing field). Similarly, the benefits of Option 1(b) (strengthening short-term markets) and Option 2 (fully integrated markets) are more significant for the Member States that are better interconnected (Regions 1 and 2). Option 1(c) (demand response and distributed resources) reduces costs for all regions, except for Region 5, as the competition with additional reserve resource decreases the cost for reserve procurement. Similar observations apply for the load payments and the wholesale prices. It is also worth noting how wholesale prices tend to converge as markets become more harmonised and better functioning, with the exception of Region 4 (Spain & Portugal), which has a limited interconnection to the rest of EU only via France.
Table 14: Distributional Impacts – regional perspective(for EU28 in 2030)
|
|
Option 0
|
Option 1(a)
|
Option 1(b)
|
Option 1(c)
|
Option 2
|
|
|
Baseline
|
Level playing field
|
Strengthening short-term markets
|
Demand response/distributed resources
|
Fully integrated markets
|
|
Total cost – Day Ahead Market (billion EUR)
|
|
Region 1
|
42.1
|
40.3
|
39.4
|
38.9
|
38.6
|
|
Region 2
|
6.9
|
5.5
|
4.8
|
4.5
|
4.4
|
|
Region 3
|
13.3
|
10.7
|
9.6
|
9.4
|
9.3
|
|
Region 4
|
5.5
|
5.3
|
5.0
|
4.9
|
5.0
|
|
Region 5
|
14.3
|
14.9
|
14.6
|
14.9
|
14.9
|
|
Total Load Payments – Day-Ahead Market (billion EUR)
|
|
Region 1
|
157
|
161
|
138
|
131
|
126
|
|
Region 2
|
36
|
40
|
34
|
32
|
30
|
|
Region 3
|
26
|
31
|
30
|
30
|
30
|
|
Region 4
|
17
|
18
|
19
|
19
|
19
|
|
Region 5
|
37
|
37
|
36
|
36
|
37
|
|
Average Day-Ahead Market Price (EUR/MWh)
|
|
Region 1
|
88.1
|
90.6
|
77.3
|
73.3
|
70.6
|
|
Region 2
|
87.6
|
97.2
|
81.6
|
78.0
|
73.6
|
|
Region 3
|
63.3
|
75.5
|
73.8
|
73.0
|
73.0
|
|
Region 4
|
49.6
|
53.2
|
55.2
|
54.6
|
55.5
|
|
Region 5
|
70.9
|
71.8
|
70.6
|
70.6
|
70.8
|
Source: METIS
6.2.Impact Assessment for Problem Area II (Uncertainty about future generation investments and fragmented capacity mechanisms)
6.2.1.Methodological Approach
6.2.1.1.Impacts Assessed
Similarly to Problem Area I, the assessment focused on the economic impacts of the examined options. The emphasis though is not on the operation of the power system and the integration of RES E, but on whether the market revenues can incentivize the necessary investments and – most importantly – on the relevant cost for the consumer. Inefficiencies resulting from fragmented approaches to CMs are also considered.
The impacts of the options to the environment and the society, excluding their economic aspects, are directly linked with the changes in the generation capacities of each option. Other significant, direct or indirect, impacts for the examined options were not identified.
The assessment is presented individually for each option, with qualitative analysis and references to quantitative results. The detailed modelling results for the various options, along with their interpretation, are presented in section 6.2.6.
6.2.1.2.Modelling
The modelling for this part was performed using PRIMES/OM, a specific version of the PRIMES model that can assume different types of competition in the electricity market, as well as model how CMs affect the investment decisions of the market participants. PRIMES/OM was selected over METIS for this part of the analysis, because it can model in detail the investment decisions of the market participants over an extended time-period, namely until 2050, while at the same time being able to capture the effect of different bidding behaviours from the side of the market participants (necessary to assess the impact of scarcity pricing).
In addition, PRIMES/IEM (a day-ahead and unit commitment simulator developed by NTUA) was used to assess in more detail the benefits of the energy-only market. Contrary to METIS
, PRIMES/IEM places more emphasis on accurately simulating the market behaviour of generators by assuming specific bidding strategies followed by the market participants and departing from the usual marginal cost assumption
. Moreover, PRIMES/IEM was able to capture the effect of introducing locational price signals, as it includes a network model. Further details on both models and the methodological approach followed can be found in Annex IV, as well as in the relevant NTUA report
.
The above tools were complemented by a study performed using METIS, analysing the revenue related (weather-driven) risks faced by conventional generation and how these could be mitigated, while also identifying the value of co-ordinated solutions.
6.2.1.3.Overview of Baseline (Current Market Arrangements)
The baseline reflects the current market arrangements of Problem Area I, similar to what is described in section 6.1.1.4. In addition it is assumed that Member States put in place price caps, as well as that there may be systemic congestion in the transmission grid.
Comparing the baselines of Problem Areas I and II in modelling terms, certain differences exist in terms of figures and assumptions, mainly reflecting the differences in the respective modelling approaches intended to better capture the options assessed in each Problem Area, as well as their calibration to a different version of EUCO27. Under this baseline:
-Price caps apply as today
;
-Units bid according to bidding functions by plant category
and not marginal costs;
-The unit commitment simulator applies a flow-based allocation of interconnections;
-Modelling includes more detailed information on generation capacities, including vintages, technology types and technical characteristics of plants;
-The day-ahead market covers only part of the load, as is the case today. A large part of the energy (especially produced by inflexible units) is nominated.
-The baseline of this Problem Area fully reflects EUCO27.
Nevertheless, both models identify similar trends concerning the operation and the revenues of the various generation types, as already presented in Problem Area I.
6.2.2.Impacts of Policy Option 1 (Improved energy markets - no CMs )
6.2.2.1.Economic Impacts
Option 1 assumes that Member States can no longer put in place CMs. The analysis is hence solely based on a strengthened energy-only market.
With sufficient economic certainty, investments should in principle be able to take place based on the electricity price signal alone, provided that the price signal is not significantly distorted. Further, the electricity price, and its behaviour, should stimulate not only investment in sufficient capacity when needed (be it production or demand), but also in the right type of capacity. A steady electricity price, one that does not vary significant on an hour-to-hour basis, should steer investment to the types of capacity that can operate steadily at lowest production cost. A rapidly fluctuating electricity price should steer investment to capacity that can ramp-up and ramp-down very quickly and can take advantage of high prices at short notice and avoid operation when prices are too low. The shift to variable generation will increasingly require fast-ramping and highly flexible generation and cause the market exit of less flexible types of generation capacity. Investment uncertainty and varying prices are not a unique feature to the electricity industry.
In this way, the effect of variable renewables, insofar as their deployment will increase the variability of the electricity price, should stimulate investment in the flexible capacity needed to keep the system in balance at all times. Ensuring that prices can reflect market fundamentals is key to this and removing as many potential distortions on electricity prices is critical to enabling it to play this function.
Indeed, the analysis performed with PRIMES/OM supports the arguments above, showing that an energy-only market can in general deliver cost-efficiently the necessary investments in thermal capacity (especially flexible one). The enhanced market design will also improve the viability of RES E investments, but electricity market revenues alone might not prove sufficient in attracting investments in RES E in a timely manner and at the required scale to meet EU's 2030 targets. (See in this regard also the box on RES E investments in Section 6.2.6.3).
Moreover, PRIMES/IEM results show that undistorted, energy-only markets can significantly decrease load payments by around EUR 50 billion in 2030. The largest part of these savings is attributable to the improvements in the short-term markets and the participation of demand response in the market, representing EUR 20 billion and EUR 26 billion savings respectively in 2030. The implementation of measures introducing a level playing for all technologies and removing price caps brings EUR 5 billion savings in 2030 and at the same significant more cost-efficiency to the system, as explained in Section 6.1.2.1.
As resources are better utilised across the borders compared to the baseline, and demand can better participate in markets, undistorted energy-only markets are able to improve the overall cost-efficiency of the power sector significantly. Equally, it can ensure resource adequacy (See in the regard also Section 6.2.6.3).
It thus follows that by improving the energy markets, the need of government intervention to support investments in electricity resources is reduced
6.2.2.2.Who would be affected and how
As this option encompasses to the largest extent the options discussed under Problem Area 1, the assessment made there as to who would be affected and how applies here as well.
With regard to more variable pricing, they will benefit owners of flexible resources, such as flexible generation capacity, storage and demand response, and incentivise them to come to or stay in the market. In this end, they will provide the motor for more innovative services and assets to be deployed.
End consumers will be affected insofar as changes to the wholesale price are passed on to them in their retail price. However, more variable prices will not necessarily be felt by end-consumers as they can be hedged (particularly households) against this volatility in their retail contracts or through wholesale market arrangements. In fact, more variable pricing will incentivise the development of more sophisticated energy wholesale market products allowing price and volume risks to be hedged more effectively. Power exchanges would be impacted by removal of price caps as they will be required to introduce changes to systems and practices.
Minimising investments and dispatch distortions due to transmission tariff structures would mostly affect generators. Positive impacts on their revenues would be expected due to lower connection charges or tarrifs.
TSOs will be affected by improvements in locational price signals as it would likely mean that they hold and operate networks over more than one price zone. To a lesser extent this applies to power exchanges as these are often already operating in different price zones today.
Spending of the congestion income to increase cross-border capacity may have impact on end consumers, where the congestion income is used for the reduction of tariffs. But this should be outweighed by the positive effect of more cross-border capacity being available, and the benefit this has on competition and energy prices.
6.2.2.3.Administrative impact on businesses and public authorities
As this option encompasses to the largest extent the options discussed under Problem Area I, the assessment made there as regards administrative impacts made there also applies here.
Overall, the administrative impact on businesses and public authorities should be limited as, even if the measures associated with Option 1 (in addition to those assessed under Problem Area I) require changes, they are not fundamentally different from the tasks performed already under the baseline scenario.
More variable pricing will incite the development of more sophisticated energy wholesale market products allowing price and volume risks to be hedged more effectively. This should help reduce lower overall risks to businesses.
6.2.3.Impacts of Policy Option 2 (Improved energy markets – CMs only when needed, based on a common EU-wide adequacy assessment)
6.2.3.1.Economic Impacts
This option builds on a strengthened energy market (Option 1). Indeed, as developed in Section 2.2.1, undistorted energy price signals are fundamental irrespective of whether generators are solely relying on energy market income or also receive capacity payments. Therefore, the measures aimed at removing distortions from energy-only markets are 'no-regrets' and assumed as being integral parts of Options 2 and 3.
In addition, the option assumes the presence of CMs but only in those Member States for which a resource adequacy assessment performed at European level has demonstrated a resource adequacy problem. As no restrictions are placed on these CMs, it is assumed they foresee implicit cross-border participation (i.e. only taking into account imports and exports in the dimensioning of the CM, without any remuneration of foreign capacity).
In order to highlight the importance of considering the regional aspects in a generation adequacy assessment, Artelys performed an independent study
assessing the capacity savings that can be obtained from a European approach in capacity dimensioning for resource adequacy in comparison to a resource adequacy assessment conducted at Member State level.
The mode used jointly optimises peak capacities given security of supply criteria for two reference cases – without cooperation (capacities are optimised for each country individually, as if countries could not benefit from the capacities of their neighbours) vs. with cooperation (capacities are optimised jointly for all countries, taking into account interconnection capacities (i.e. NTCs). The difference in installed capacity between the two cases reveals the savings could be made from cooperation in investments.
Results show that almost 80 GW of capacity savings across the EU can be achieved with cooperation in investments. This represents a gain of EUR 4.8 billion per year of investments when comparing the two extremes. A reason for these savings is that Member States have different needs in terms of capacity with peak demands that are not necessarily simultaneous. Therefore, they can benefit from cooperation in the production dispatch and in investments. It should be noted that this figure does not assess at which stage Member States are currently (i.e. whether some Member States already benefit from the capacities of their neighbours), as the benefits have already been reaped by some. It should also be noted that this figure does not include savings on production dispatch, which could lead to much higher monetary benefits.
PRIMES/OM was used to assess the impact of introducing CMs on a certain number of countries, with the CMs foreseeing implicit cross-border participation. The runs assumed that four countries were justified based on a EU-wide adequacy assessment, to have a CM: UK, Italy, Ireland and France. This assumption was based on a selection of countries from the Sector Inquiry on Capacity Mechanisms (as the model always ensures that the expected security of supply levels are always met).
The analysis shows that the introduction of CMs lowers wholesale prices, but to a limited degree, primarily in the MS introducing CMs, but also to all EU countries due to the assumed well-functioning markets. On the other hand this does not translate to reduced Load Payments for the consumers on a EU level, as the CM related costs slightly exceed the reductions in the cost of the wholesale energy market in 2030. This difference though becomes quite significant in the longer term, making Option 1 cheaper than Option 2 by an average of EUR 4 billion/annum when comparing over the period 2021-2050. Interestingly enough, the consumers of the Member States introducing CMs face a EUR 7 billion increase in costs in 2030, while the cost for all other EU Member States drop by a similar amount.
6.2.3.2. Who would be affected and how
EU-wide resource adequacy assessments would benefit consumers through maintaining high standards of security of supply while lowering costs through reduced risk of over procurement of local assets as foreign contribution to national demand and demand side flexibility would be sufficiently taken into account.
ENTSO-E would be required to carry out an EU-wide resource adequacy assessment based on national raw data provided by TSOs (as opposed to a compilation of national assessments). ENTSO-E would also have to provide an updated methodology with probabilistic calculations, appropriate coverage of interdependencies, availability of RES E and demand side flexibility and availability of cross-border infrastructure. NRAs/ ACER would be required to approve the methodology used by ENTSO-E for the resource adequacy methodology and potentially endorse the assessment. TSOs would be obliged to provide national raw data to ENTSO-E which will be used in the EU-wide resource adequacy assessment.
Member States would be better informed about the likely development of security of supply and would have to exclusively rely on the EU-wide resource adequacy assessment carried out by ENTSO-E when arguing for CMs.
With the updated methodology provided by ENTSO-E, intermittent RES generators/ demand-side flexibility would be less likely to be excluded from contributing to resource adequacy.
6.2.3.3.Impact on businesses and public authorities
The main burden would be for ENTSO-E having to provide for a single 'upgraded' methodology and to carry out the assessment for all EU countries. Important to note is that ENTSO-E has already been carrying out an EU-level resource adequacy assessment based on Union legislation. However, the methodology used has to be upgraded which would require increased manpower. Nonetheless, the administrative costs of this 'updated' assessment are expected to be marginal compared to the economic benefits that would be reaped. It is estimated that these these costs
would range from EUR 4-6 million per year (representing mainly personnel and IT costs).
6.2.4.Impacts of Policy Option 3 (Improved energy market – CMs only when needed, plus cross-border participation)
6.2.4.1.Economic Impacts
This option builds on Option 2, i.e. a strengthened energy market and CMs only in Member States where justified by a European adequacy assessment. In addition, this option provides an EU framework for explicit cross-border participation in CMs.
Explicit cross-border participation lowers overall system costs compared to implicit participation, as it corrects investment signals and enables a choice between local generation and alternatives. As more capacity will be participating in the CM, than in the implicit participation case, competition will be more intense and thus CM payments lower. In addition, the enhanced competition will extend also to the wholesale market, thus leading to lower market clearing prices.
Based on the same setup as in Option 2 (Improved energy market – CMs only when needed, based on EU resource adequacy assessment) only now with explicit cross-border participation (i.e. remunerating foreign resources for their services) instead of only implicit (i.e. only taking into account imports and exports in the dimensioning of the CM, without any remuneration of foreign capacity), PRIMES/OM estimates that explicit cross-border participation would result in significant savings. Results show that explicit participation brings savings of EUR 2 billion (in 2030) compared to implicit participation, with savings significantly increasing in the long run to more than EUR 100 billion over the whole projectin period of 2021-2050 (i.e. about EUR 3.5 billion per annum). The main reason is enhancement of competition in the CM auction and the resulting lower auction prices.
By remunerating foreign resources for their services, this option is likely to better ensure that the investment distortions of uncoordinated national mechanisms present in Option 2 are corrected and that the internal market able to deliver the benefits to consumers.
6.2.4.2.Who would be affected and how
A positive impact of cross-border capacity mechanism would be expected on the foreign capacity providers, generators, interconnectors and aggregators. They would receive the possibility to participate directly in a national capacity auction, with availability obligations imposed on the foreign capacity providers and the interconnecting cross-border infrastructure. Foreign capacity providers/ interconnectors would be remunerated for the security of supply benefits that they deliver to the CM zone and but would also receive penalties in case of non-availability.
NRAs/ACER would be required to set the obligations and penalties for non-availability for both participating generation/demand resources and cross-border transmission infrastructure. ENTSO-E would be required to establish an appropriate methodology for calculating suitable capacity values up to which cross-border participation would be possible. Based on the ENTSO-E methodology, TSOs would be required to calculate the capacity values for each of their borders. They might potentially be penalized for non-availability of transmission infrastructure. TSOs would also be required to check effective availability of participating resources.
6.2.4.3.Impact on businesses and public authorities
Providing an EU framework with roles and responsibilities of the involved parties would enable explicit cross-border participation (as already required by the EEAG). Although the cost of designing cross-border participation in CM depends to some extent on the design of the CMs, an expert study estimated that such cost corresponds roughly to 10% of the overall cost of the design of a CM. In addition, they estimate costs associated with the operation of a cross-border scheme i.e. additional costs if cross-border participation is facilitated to amount to 6-30 FTEs for TSOs and regulators combined. Providing for an EU framework would remove the need for each Member State to design a separate solution and potentially reduce the need for bilateral negotiations between TSOs and NRAs, reducing the overall impact on these authorities. According to the same study, TSOs and NRAs bear the main costs related to cross-border participation as they have to check eligibility and ensure compliance. The study estimates cost savings of 30% on these eligibility and compliance costs compared to the baseline. It would also reduce complexity and the administrative impact for businesses operating in more than one zone.
6.2.5.Environmental impacts of options related to Problem Area II
The impacts of these measures to the environment are very limited, as they mainly influence the generating capacity but not so much the operation of the units, which is the source of emissions. The actual emissions depend on the merit order and the relation of the marginal cost of coal in comparison to the marginal cost of gas. This in turn depends on the CO2 price and the relation of coal versus gas price, and not on whether there is a CM in place or not.
6.2.6.Overview of modelling results for Problem Area II
6.2.6.1.Improved Energy Market as a no-regret option
Several facts speak in favour of market design which relies on an improved energy market as the driver for investment and operation. As already described in the assessment of Problem Area I, the improvements in the wholesale market described under Option 1 of Problem Area I (level playing field, strengthening short-term markets, pulling demand response and distributed resources into the market) are expected to bring significant benefits and reduce the need to correct market failures with capacity markets. These benefits are further enhanced when considering the additional measures considered in this Option (e.g. removal of price caps, a process which leads to the introduction of locational price signals reflecting systematic congestion, limiting curtailments of interconnector capacity).
The benefits of further improving the market in this way, assessed this time using the PRIMES/IEM model, are presented in Table 15 below. The level of the reported figures in Table 15 are higher compared to Table 10 due to the inclusion of more distortions in the baseline of PRIMES/IEM, as well as the use of scarcity bidding, instead of marginal cost bidding in METIS.
Table 15: Cost of supply in the wholesale market in the year 2030
|
Load Payments (billion EUR)
|
|
|
Day-ahead Market
|
Intra Day Market
|
Reserves and balancing
|
Total
|
|
Current Market Arrangements
(in context of low price caps, systematic congestion)
|
326.2
|
22.1
|
7.7
|
356.0
|
|
Level playing field + removal of low price caps
|
327.5
|
17.1
|
6.8
|
351.4
|
|
Strengthening short-term markets + removal of low price caps, locational price signals
|
317.6
|
11.6
|
1.9
|
331.2
|
|
Demand response / distributed resources into the market + removal of low price caps, locational price signals, demand response in day-ahead
|
300.4
|
4.0
|
1.0
|
305.4
|
Source: NTUA modelling (PRIMES/IEM)
Overall, despite differences in the modelling approaches, results of PRIMES/IEM are fairly consistent with METIS results used to access the options from Problem Area I, especially concerning the ranking of the respective options. The results indicate that the "improved energy market" Option could significantly decrease wholesale supply costs by around EUR 50 billion in the year 2030. As a consequence, the unit cost of generation paid by the consumers would drop from 102.9 EUR/MWh to 94.7 EUR/MWh, the largest part of which is attributable to the participation of demand response in the market.
The above analysis highlights the importance of an improved market design, with all the measures described under Option 1(c) of Problem Area I, together with scarcity pricing and the proper locational signals (as added under Option 1 of Problem Area II), irrespective of whether generators are solely relying on energy market income or also receive capacity payments. Therefore the measures aimed at removing distortions from energy markets are considered as 'no-regrets'.
6.2.6.2.Comparison of Options 1 to 3
In order to better assess the dynamic behaviour of markets and how markets can also provide investment signals, modelling analysis was performed using PRIMES/OM, . Option 1 assumes an improved energy-only market for all Member States. Options 2 and 3 assume that the improved energy-only market is complemented in certain cases by a national CM, as a means for the Member States to address possible forecasted resource adequacy problems in their markets, on the basis of a resource adequacy assessment performed at the European level. The difference between the two options is that Option 3 assumes that the CM foresees rules for effective, explicit cross-border participation, while Option 2 does not.
For the scope of this assessment, four countries were assumed to be in need of a CM: France, Ireland, Italy and UK. This hypothesis was not based on a resource adequacy analysis, but on the CMs examined under DG COMP's Sector Inquiry, focusing specifically on countries with market-wide CMs. (Results could differ if different countries were selected, which is why a sensitivity, presented below, was performed).
The main conclusions when comparing Options 1-3 are presented in Table 16 and can be summarized in the following:
-The load payments for the three Options are very comparable when assessed at the EU28 level. For the year 2030, Option 3 (Improved energy market – CMs only when needed, plus cross-border participation) is slightly cheaper by EUR 1 billion compared to Option 1 (Improved energy markets - no CMs) and by EUR 2 billion compared to Option 2 (Improved energy markets – CMs only when needed, based on a common EU-wide adequacy assessment);
-Results actually show that Option 3 is consistently cheaper than Option 2 throughout the projection horizon until 2050 and on a EU28 level. This is mainly due to the lower cost of the CMs, as through the cross-border participation more resources can compete for the relevant payments;
-As a result of the above, the average annual cost of total demand is very close for Option 1 and Option 3, with the lowest cost option alternating along the years. Option 3 is always less costly for the consumer than Option 2 though.
-When comparing the Options for the whole projection period, i.e. 2021-2050, Option 1 is found to be EUR 17 billion cheaper than Option 3 (on average about EUR 0.5 billion/annum) and EUR 120 billion cheaper than Option 2 (on average EUR 4 billion/annum). The main reason for this difference is that CMs provide incentives to retain capacity on the system that otherwise would have exited the market. This cost is somewhat balanced by the slightly lower energy prices observed in the market, although the final cost to the consumer comprises of both the energy and the CM cost.
Table 16: Main Impacts over the projection period 2020-2050 on EU28 level
|
|
2020
|
2025
|
2030
|
2035
|
2040
|
2045
|
2050
|
|
Load Payments (billion EUR)
|
|
Option 1
|
241
|
316
|
351
|
419
|
447
|
557
|
516
|
|
Option 2
|
241
|
312
|
352
|
428
|
454
|
560
|
530
|
|
Option 3
|
241
|
306
|
350
|
426
|
452
|
553
|
526
|
|
Load Payments for energy and reserves (billion EUR)
|
|
Option 1
|
241
|
316
|
351
|
419
|
447
|
557
|
516
|
|
Option 2
|
241
|
302
|
340
|
417
|
443
|
548
|
518
|
|
Option 3
|
241
|
297
|
340
|
417
|
443
|
543
|
516
|
|
Load Payments to capacity mechanisms (billion EUR)
|
|
Option 1
|
-
|
-
|
-
|
-
|
-
|
-
|
-
|
|
Option 2
|
-
|
11
|
11
|
11
|
11
|
11
|
12
|
|
Option 3
|
-
|
9
|
10
|
9
|
10
|
10
|
10
|
|
Average SMP (billion EUR)
|
|
Option 1
|
74
|
95
|
103
|
118
|
115
|
135
|
122
|
|
Option 2
|
74
|
91
|
100
|
117
|
114
|
133
|
123
|
|
Option 3
|
74
|
89
|
100
|
117
|
114
|
132
|
122
|
|
Average cost of total net demand (EUR/MWh)
|
|
Option 1
|
80
|
102
|
111
|
127
|
125
|
146
|
132
|
|
Option 2
|
80
|
101
|
111
|
129
|
127
|
147
|
135
|
|
Option 3
|
80
|
99
|
110
|
129
|
126
|
145
|
134
|
Source: NTUA Modelling (PRIMES/OM)
Note:Option 1: Improved energy markets - no CMs
Option 2: Improved energy markets – CMs only when needed, based on a common EU-wide adequacy assessment
Option 3: Improved energy market – CMs only when needed, plus cross-border participation
In order to better understand the impacts of the CMs and the effect of cross-border participation, Table 17 presents the impacts in 2030 for the three following groups of countries: (a) the countries implementing a CM, (b) their direct neighbours and (c) the rest of the EU countries.
Results for Option 2 shows that by introducing a CM in the assumed four countries, the actual distribution of cost varies among the different groups of countries. Countries implementing a CM are significantly burdened, mainly due to the cost of the CM, while their neighbours benefit from it.
In particular countries implementing the CM are burdended with an additional EUR 6.8 billion of costs, while the cost of their neighbours drops by EUR 3.6 billion. Even the cost of the rest of the EU countries drops by EUR 2.9 billion. The cost of energy and reserves is reduced for all countries. In the countries implementing a CM the cost is reduced about two times more than in the rest coutries, thus leading to lower payments for energy and reserves. However, these reductions are outbalanced by the CM costs, borne solely by the countries introducing CMs. The CMs induce an additional EUR 11 billion of payments, part of which are attributed to the 5 GW of capacity which would otherwise have retired early in the absence of CMs.
Moving to Option 3, i.e. assuming explicit cross-border participation in the CMs, the results compared to Option 2 improve in terms of cost-efficiency, not only for the whole EU as presented above, but also for the countries implementing CMs. On the other hand the benefits for the countries without a CM are slightly reduced.
In particular, the analysis for the year 2030 shows that explicit cross-border participation is still worse-off for the countries with a CM compared to the energy-only market, costing EUR 3.6 billion more then the energy-only market, but better than implicit cross-border participation, which costs an additional EUR 3.2 billion to the countries with CM.
In general, modelling results indicate that a CM, compared to an energy-only market, is likelier to keep more capacity in the system, part of which would have otherwise exited due to making losses in the energy market. As more capacity is kept in the Member States with a CM, less capacity is needed in the other Member States, especially the neighbouring ones, which then rely more on imports.
As it was discussed above, these results are influenced by the specific choice of countries assumed to have a CM. To address this issue, an additional sensitivity was performed, comparing the cases of all Member States introducing a CM, either with implicit or explicit cross-border participation (same applying for all). Results show that the case of CMs with explicit cross-border participation is less costly, with load payments being EUR 7 billion less (about 2%) in the year 2030. Half of this benefit is coming from the reduced CM payments and half from the reduced energy and reserve payments.
Table 17: Distributional Impacts of Options for Member States in 2030
|
|
Option 1
|
Option 2
|
Option 3
|
|
|
Improved energy markets - no CMs
|
Improved energy markets – CMs only when needed, based on a common EU-wide adequacy assessment
|
Improved energy market – CMs only when needed, plus cross-border participation
|
|
Load Payments in 2030 (billion EUR)
|
|
MS with CMs
|
133
|
140
|
137
|
|
MS directly neighbouring MS with CM
|
135
|
131
|
132
|
|
Rest of the MS
|
82
|
79
|
80
|
|
Load Payments for energy and reserves (billion EUR)
|
|
MS with CMs
|
133
|
129
|
127
|
|
MS directly neighbouring MS with CM
|
135
|
132
|
132
|
|
Rest of the MS
|
82
|
80
|
80
|
|
Load Payments to capacity mechanisms (billion EUR)
|
|
MS with CMs
|
0
|
11
|
10
|
|
MS directly neighbouring MS with CM
|
0
|
0
|
0
|
|
Rest of the MS
|
0
|
0
|
0
|
|
Average SMP (EUR/MWh)
|
|
MS with CMs
|
104
|
100
|
98
|
|
MS directly neighbouring MS with CM
|
102
|
100
|
100
|
|
Rest of the MS
|
103
|
101
|
101
|
|
Cancelling of Investments or Early Retirements of Capacity in 2021-2030 (GW)
|
|
MS with CMs
|
18
|
9
|
9
|
|
MS directly neighbouring MS with CM
|
35
|
41
|
42
|
|
Rest of the MS
|
10
|
10
|
11
|
Source: NTUA modelling (PRIMES/OM)
The main reason for the overall improved performance and reduced costs of Option 3 compared to Option 2 is the enhancement of competition in the CM auction and the resulting lower auction prices when allowing for explicit cross-border participation. This reduction lowers the revenues of generators from a CM, but the probability of capacity reduction does not significantly increase, compared to the case with implicit cross-border participation. Explicit cross-border participation in the CM auctions implies that competition is stengthened not only in the CM, but also in the electricity wholesale market.
6.2.6.3.Delivering the necessary investments
Despite the different modelling approaches followed, the analysis with both METIS and PRIMES/IEM reach a similar conclusion: improving the electricity market design is a no regret option for the society as a whole. It is expected to reduce both the cost of operating the power system, as well as the final cost for the consumers.
At the same time though the two models showed that these savings come to the detriment of the thermal generator revenues, which are expected to be reduced compared to the baseline. This modelling conclusion is a consequence mainly of the following two reasons:
-on one hand, the improved market design increases competition in the market, by bringing more resources into the market and better utilisation of interconnections;
-on the other hand, capacities are assumed to be constant due to the nature of the modelling (static, focusing on 2030 based on the same capacities across all options).
The combination of the two points above leads to a market with overcapacity and thus low prices, since there is no scarcity and there is sufficient capacity of flexible resources. In reality though, the low prices in a well-functioning market would serve as a signal for lower investments and exit of loss-making generators. Therefore this overcapacity should either never appear or only be temporary.
The above dynamic interactions were better captured with PRIMES/OM, which simulated investment behaviour till 2050. In an energy-only market context, PRIMES/OM projected that 63 GW of capacity would either be retired early or the relevant investments would be cancelled in the period 2021-2030. About half of it would come from (mainly old) coal plants and another half from peaking units or steam turbines fuelled by oil and gas.
The reason for retiring capacity and cancelling investments is the unprofitable operation of the units. From the results it is indicated that the market can be successful in maintaining CCGT in operation and, partly, peak devices. On the other hand it does not provide sufficient incentives to retain old coal and old oil/gas steam turbine power plants, which are loss-making.
Table 18: Power generation capacity in EU28
|
|
Power Generation Capacity (GW)
|
Cancelling of Investments or Early Retirements of Capacity (GW)
|
|
|
2030
|
2040
|
2050
|
2021-2030
|
2031-2040
|
2041-2050
|
|
Total
|
1,094
|
1,271
|
1,504
|
63
|
68
|
48
|
|
Coal & Lignite
|
77
|
45
|
14
|
32
|
45
|
33
|
|
Peakers & Steam turbines (oil/gas)
|
12
|
6
|
6
|
28
|
16
|
8
|
|
CCGT
|
158
|
165
|
175
|
0.3
|
7
|
4
|
|
Nuclear
|
110
|
124
|
122
|
2
|
0
|
2
|
Source: NTUA Modelling (PRIMES/OM)
In this context of adjusting capacities, the profitability of thermal generation changes significantly for the better. Scarcity pricing and the reduction of overcapacity are the main drivers for this. Table 19 below shows how the adjustment of capacities, together with scarcity pricing, would affect wholesale prices and allow thermal plants to at least recover their total costs from the market.
Table 19: Effect of adjusting capacities to wholesale market prices in 2030
|
|
Day-Ahead Market Price
Before Adjusting Capacities
|
Day-Ahead Market Price
After Adjusting Capacities
|
|
Average Price (EUR/MWh)
|
89
|
103
|
|
Baseload
|
80
|
93
|
|
Mid-merit
|
90
|
103
|
|
Peak load
|
94
|
137
|
|
Spread (EUR/MWh)
|
14
|
44
|
Source: NTUA Modelling (PRIMES/IEM, PRIMES/OM)
In this context, the market seems able to deliver to a large extent the necessary investments for all competitive technologies in the long term. A new CCGT plant, which is the marginal technology, constructed post-2025 (when overcapacity is gradually resolving) will likely remain profitable over the following 20 years of its operation. If this plant is part of a larger portfolio, especially if it includes competitive RES E technologies, then it will be able to better hedge its risks and further increase the likelihood that the whole portfolio will be profitable.
More specifically per technology:
|
CCGT
|
Scarcity bidding succeeds in maintaining the vast majority of CCGT capacity, a large part of it being new investments in the period 2021-2030. These plants have a variety of revenue sources (day-ahead, intraday, balancing, reserves) and the projected increase in ETS prices makes them economically more attractive to operate. As a result CCGT plants are dispatched more often at full capacity.
|
|
Nuclear
|
Nuclear plants do not have any revenue issues, due to their low marginal cost. Note that new investments in nuclear appear only in the long-term.
|
|
Coal / Lignite
|
These plants have the biggest revenue problems, as market revenues prove insufficient even to cover their fuel and variable (non-fuel) costs. There was very limited new investment in the projections even in the baseline, so this issue mainly concerns decisions for the refurbishment of coal plants.
|
|
Peak devices
|
Peak units and steam turbines (many of them old) do not produce comfortable revenues until 2035. Around that period though and due to the strong investments in variable RES E and the increasing needs for flexible capacity, the situation turns around, rendering these units very profitable.
|
|
RES E (excl. biomass)
|
The situation for RES E is contrasted, depending on the level of maturity of RES E technologies. Even if some less advanced RES E technologies would need support to emerge as part of the power generation mix towards 2030, this is not the case for many competitive RES E technologies, such as hydro, onshore wind and solar PV (at least in some parts of Europe). For a more elaborate discussion on this point see the text box below on RES E investments and market design.
|
|
CHP (incl. biomass)
|
CHP remains unprofitable over the whole projection period when considering only their electricity market related revenue streams. It should be considered though that the main use of these plants is assumed to be the production of industrial steam/heat, with electricity being a side-product. Therefore, no conclusion should be made based on these partial results. Similar for biomass (outside industrial CHP), additional revenues are assumed to come from support schemes and the value of heat when producing heat for district heating.
|
The following table summarizes the projected profitability for all generation technologies over the period 2020-2050:
Table 20: Average profits or losses for different plant categories in the case of an energy only market over the projected horizon 2020 – 2050 in EUR/kW for EU28

Source: NTUA modelling (PRIMES/OM)
It is important to highlight that the above analysis has been performed per individual plant basis. Although this reflects project finance type of decisions, it does not reflect portfolio-based decisions, which are closer to the usual power sector business model for utilities, due to economies of scale. The portfolio approach (e.g. investing in both wind and peak generators) allows the sharing of risks between different technologies, directly improving the performance of the investments.
Similarly the above analysis does not consider the existence of any type of contracts between supply and demand, be it long-term contracts, futures (e.g. EEX hedging products) or even typical contracts between utilities and residential/commercial consumers. Such contracts, concluded on a purely voluntary market basis, would again transfer part of the risk of the generators to consumers, in exchange of higher security of supply, protection against price spikes and more stable payments, allowing both sides to better manage their risks. This would in turn increase the likelihood of the investments turning out to be profitable.
The above analyses also highlights that the market, of improved along the lines with the measures assessed in the present impact assessment, can deliver to a large extent the necessary investments for a wide range of technologies in the long term, thereby reducing the need for government intervention to support investment in electricity resources.
Box 7: RES E investments and market design
Amongst all sectors that make up our energy system, electricity is the most cost-effective to decarbonize. Currently about one fourth of Europe's electricity is produced from renewable energy sources. Modelling indicates that the share of RES E in electricity generation needs to almost double by 2030 in order for the EU to meet its 2030 energy and climate targets.
A functioning market is the most efficient tool to implement the decarbonisation agenda at least costs while securing electricity supplies at all times.
The Commission's ambition for the post-2020 context is that renewable electricity generators can earn an increasingly larger fraction of their revenues from the energy markets.
This ambition requires adapting the market design for the cost-effective operation of variable, decentralised generation, and improving the market as the catalyst for investments by removing regulatory failures and market imperfections. In a nutshell, markets will need to:
(a)
be more focused on short-term trading, including cross-border trading, to allow electricity from wind and solar energy to effectively compete in the market;
(b)
link wholesale and retail markets to increase the flexibility of the system, let consumers benefit from times of cheap electricity, let them engage in demand response systems and produce electricity themselves; and,
(c)
become even better at generating investment signals – as a matter of principle, it should be the market through its price signals triggering investments.
In this context, the present impact assessment investigates a number of options that improve market functioning by removing market distortions between different types of generation, that render the market's operation more flexible and adapted to the cost-effective operation of variable generation and improving the conditions for the participation of decentralised, flexible resources, such as demand and storage, into the market. Moreover, it investigates various means to improve price signals inciting investment in the right resources and location and investments in infrastructure.
The enhanced market design will improve the viability of RES E investments, but electricity market revenues alone might not prove sufficient in attracting renewable investments in a timely manner and at the required scale to meet EU's 2030 targets.
The enhanced market design and the strengthened ETS will improve the viability of RES E investments, in particular through the following channels:
-Where the marginal producer is a fossil fired power plant, a higher carbon price translates into higher average wholesale prices. The existing surplus of allowances is expected to decrease due to the implementation of the Market Stability Reserve and the higher Linear Reduction Factor, reducing the current imbalance between supply and demand for allowances;
-Greater system flexibility will be critical for a better integration of RES E in the system, reducing their hours of curtailment and the related forgone revenues; improving overall system flexibility is equally essential to limit the merit-order effect and thus in avoiding the erosion of the market value of RES E produced electricity
-The revision of priority dispatch rules and the better functioning of the short-term markets will strongly reduce (even eliminate according to the analysis) the occurrence of negative prices – leading again to higher average wholesale prices (especially during the hours with significant variable RES E generation);
-Improved market rules for intraday and balancing markets will increase their liquidity and allow access to those markets for all resources, thus helping RES E generators reduce their balancing costs;
-Removing existing (explicit or implicit) restrictions for the participation of all resources to the reserve and ancillary services markets will allow RES E to generate additional revenues from these markets.
-Price signals reflecting the actual value of electricity at each point of time, as well as the value of flexibility, will help ensure that flexible capacity is properly rewarded, channelling investment into such capacities or prevent its decommissioning.
With technology costs gradually reducing, ETS price increasing and the electricity market prices better reflecting the value of electricity, RES E investments in the electricity market will gradually become more and more market-based, reflecting the balance of supply and demand for the coming years and the associated costs to each technology.
The present impact assessment and the one on the RED II thus jointly come to the conclusion that the improved electricity market, in conjunction with a revised ETS could, under these conditions, deliver investments in the most mature renewable technologies (such as solar PV and onshore wind).
However, despite best efforts in market integration, electricity market revenues alone might not prove sufficient in attracting renewable investments in a timely manner and at the required scale to meet EU's 2030 targets. This investment gap is analysed in more details in the RES II impact assessment. The analysis shows that the picture is dynamic, with the enhanced market design and the strengthened ETS gradually and increasingly improving RES E profitability over the 2021-2030 period. At the beginning of the period, over-capacity, low ETS and wholesale market prices and still high RES E technology costs, make the case for investments in RES E technologies more difficult. However, an increasing ETS price, a more flexible and dynamic electricity market, technology costs reductions and adjustments in capacity increasingly facilitate investments over this period
.
The impact assessment for RED II concludes that over the period 2021-2030 around half of the additional RES E capacity will still need some kind of support, but with significant decrease in the number of investments needing support towards 2030.
In particular, less mature RES E technologies, such as off-shore wind, will likely need some form of support throughout the 2021-2030 period. These technologies are required if RES E technologies are to be deployed to the extent required for meeting the 2030 and 2050 energy and climate objectives, and provide an important basis for the long-term competitiveness of an energy system based on RES E.
The picture also depends on regions. RES E technologies are more easily financed from the market in the regions with the highest potential (e.g. onshore wind in the Nordic region or solar in Southern Europe), while RES E continue to largely require support in the British Isles and in Central Europe.
Additionally, it should be noted that the speed at which RES E parity
is reached, in addition to the successful implementation of the MDI and ETS, also depends on factors that lay outside of the scope of these initiatives, including: (i) continued decrease in technology costs for RES E as well as complementary technologies (e.g. storage); (ii) the availability of (reasonably cheap) capital, which is a function of many variables, including project-specific and RES E framework-specific risks, but also general country risk; (iii) continued social acceptance; (iv) sufficiently high and stable fossil fuel prices.
The need for a framework for RES E support schemes
In order to address the risks associated with investments in RES E and the chance of failing to meet EU's 2030 target for RES, the MDI and the RED II impact assessments jointly consider that electricity market and ETS policies need to be complemented by an improved policy framework on RES E support schemes.
Against this background, the RED II impact assessment investigates options to ensure that, if and where support is needed, support is only applied where needed in a manner that is: (i) cost-effective and kept to a minimum, and (ii) creates as little distortions as possible to the functioning of electricity markets, and to competition between technologies and between Member States. Indeed, the market can only deliver the full benefits sketched above, if policies fostering RES E are compatible with the market environment in which they operate.
In particular, the RED II impact assessment suggests creating a common European framework for support schemes. The framework would be effective as it would define design principles (i) that ensure sufficient investor certainty over the 2021-2030 and (ii) require the use (where needed) of market-based and cost-effective schemes based on emerging best practice design (including principles that are not covered by the current State Aid guidelines).
At the same time, the framework would be proportionate by leaving actual implementation to the State Aid guidelines (e.g. for the definition of thresholds applicable for any foreseen exemptions) and, most importantly, to the case by case, evidence-based, in-depth assessment of individual schemes by the services of DG Competition .Importantly, the framework would enshrine in legislation and expand the requirement to tender support; it would define tender design principles, based on emerging best practice, to ensure the highest cost-efficiency gains and to ensure market incentives are least distorted by the support mechanism.
The framework would thus strengthen the use of tenders as a natural phase-out mechanism for support, by which a competitive bidding process determines the remaining level of support required to bridge any financing gap – such level of support being expected to disappear for the most mature technologies over the course of the 2021-2030 period.
The importance of a framework for RES E support schemes for the present initiative.
It is also important to note that the progressive reform of RES E support schemes as proposed by the RED II initiative, building on the EEAG, is a prerequisite for the results of the present initiative to come about. In order to ensure that a market can function, it is necessary that market participants are progressively exposed to the same price signals and risks. Support schemes based on feed-in-tariffs prevent this and would need to be phased-out, with limited exemptions, and replaced by schemes that expose RES E to price signals, as for instance premium based schemes. This would be further supported by setting aid-levels through auctioning as RES E investment projects will then be incentivised to develop business models that optimise market-based returns.
How different types of CMs might affect RES E remuneration in the market
In market-wide, volume-based CMs, assets are remunerated if they can respond to specific technical performance criteria (i.e. in practice if they are dispatchable). Hence, it is likely that variable RES E producers (wind and solar) cannot participate in such schemes to the same extent as dispatchable generators. As the introduction of a market-wide volume-based scheme might render scarcity-based pricing less effective, RES E producers might receive less income then they would otherwise be able to earn on energy-only markets. A well-designed strategic reserve (provided it is activated (only at value of lost load and activated as a measure of last resort (see above)), is less likely to have a negative impact on market revenues for intermittent RES E, as such a scheme relies on commodity price signals only and does not interact with scarcity-based pricing.
6.2.6.4.Level and volatility of wholesale prices
The analysis performed using all three models (METIS, PRIMES/IEM, PRIMES/OM) confirms that the projected investments in low carbon technologies, combined with increased demand response participation, are not expected to lead to the collapse of the wholesale market prices in the short and medium term. Although there will be hours with low (or even negative) prices, the wholesale prices will most probably be set by the marginal thermal generation technology during most hours of the year. Table 21 presents the distribution of wholesale prices in 2030, assessed for the various options of Problem Area I with PRIMES/IEM. Results indicate that the wholesale prices will fluctuate, but within reasonable limits on an EU level.
Table 21: Distribution of load weighted day-ahead market prices in 2030
|
Day-ahead price
in 2030 (EUR/MWh)
|
Number of Hours
|
|
|
Option 0
|
Option 1(a)
|
Option 1(b)
|
Option 1(c)
|
|
|
Baseline
|
Level playing field
|
Strengthening short-term markets
|
Fully integrated markets
|
|
Below 60
|
0
|
0
|
84
|
0
|
|
Between 60-80
|
0
|
0
|
1155
|
1572
|
|
Between 80-90
|
2482
|
2642
|
2394
|
3169
|
|
Between 90-100
|
3254
|
3290
|
2870
|
3121
|
|
Between 100-110
|
2197
|
2013
|
1288
|
484
|
|
Between 110-120
|
372
|
555
|
528
|
0
|
|
Between 120-140
|
455
|
260
|
88
|
150
|
|
Above 140
|
0
|
0
|
353
|
264
|
Source: NTUA Modelling (PRIMES/IEM)
The above results do indicate that the improved market design will lead to more volatile average hourly prices, partly due to the introduction of locational signals which reveal the different value of electricity in the various nodes. This volatility though will be fairly restricted and will not be the result of extreme price fluctuations between zero and VoLL. The observed price ranges will be fairly constrained, as long as the share of variable RES E remains within certain limits. When the share of RES E, and specifically of variable RES E technologies, exceeds these rough limits though, price volatility may increase significantly if other resources like storage are not in place yet to absorb a large part of it.
As can be seen in the table below, in 2050 the share of RES E is projected to approach 60%. In this case the spread between the baseload and peak load prices increases significantly, mainly due to the lower baseload prices compared to the previous periods. The average day-ahead market prices though remain high throughout the projection horizon, as thermal generation is still expected to be marginal (thus setting the day-ahead market price) during most hours of the year.
Table 22: Average wholesale prices and RES E Shares
|
|
2020
|
2025
|
2030
|
2035
|
2040
|
2045
|
2050
|
|
Average wholesale market prices (EUR 13/MWh)
|
|
Average day-ahead market prices
|
74
|
95
|
103
|
118
|
115
|
135
|
122
|
|
baseload
|
74
|
83
|
93
|
98
|
89
|
108
|
71
|
|
mid-merit
|
74
|
95
|
103
|
118
|
116
|
137
|
122
|
|
peak load
|
93
|
98
|
137
|
135
|
134
|
149
|
138
|
|
Spread between average
baseload and peak load SMP
|
19
|
15
|
44
|
38
|
45
|
41
|
67
|
|
Share of RES E in net electricity generation (%)
|
|
Share of variable RES E
|
30.8
|
36.0
|
40.4
|
43.0
|
49.6
|
53.2
|
57.5
|
|
Solar
|
4.8
|
7.7
|
8.9
|
9.4
|
9.9
|
11.1
|
13.6
|
|
Wind
|
14.4
|
17.0
|
20.4
|
22.7
|
29.3
|
32.1
|
34.1
|
Source: NTUA modelling (PRIMES/OM)
6.3.Impact Assessment for problem Area III (reinforce coordination between Member States for preventing and managing crisis situations)
6.3.1.Methodological Approach
In this section the impacts of the different policy options are identified and assessed. The options proposed should first and foremost be effective in improving trust of Member States to rely on neighbours' electricity markets in times of system stress. They should also lead to a more effective functioning of markets, with less undue market distortions. Additionally, reinforced coordination and cooperation between Member States in the identification and mitigation of risks and the management of crisis have also been identified as specific objectives.
The methodological approach followed for this analysis is mostly qualitative; however some quantitative analysis is provided as well, notably via the METIS simulations.
As regards the impacts, given the administrative nature of the measures and the objectives pursued, the most relevant impacts in terms of magnitude are the economic impacts.
The measures proposed (e.g. enhanced regional coordination and information exchange) anticipates a very limited impact, if any, on the environment. Therefore, the assessment does not examine the impact of the proposed measures on the environment.
6.3.2.Impacts of Policy Option 1 (Common minimum rules to be implemented by Member States)
6.3.2.1.Economic impacts
Overall, the policy tools proposed under this option should have positive effects. Putting in place a more common approach to crisis prevention and management would not entail additional costs for businesses and consumers. It would, by contrast, bring clear benefits to them.
First, a more common approach would help better prevent blackout situations, which are extremely costly. The immense costs of large-scale blackouts provide an indication of potential benefits of improved preparation and prevention
.
|
Table 23: Overview over most severe blackouts in Europe
|
|
Country & year
|
Number of end-consumers interrupted
|
Duration, energy not served
|
Estimated costs to whole society
|
|
Sweden/Denmark, 2003
|
0.86 million (Sweden); 2.4 million (Denmark)
|
2.1 hours, 18 GWh
|
EUR 145 – 180 million
|
|
France, 1999
|
1.4 - 3.5 million
|
2 days–2 weeks, 400 GWh
|
EUR 11.5 billion
|
|
Italy/Switzerland, 2003
|
55 million
|
18 hours
|
|
|
Sweden, 2005
|
0.7 million
|
1 day – 5 weeks, 11 GWh
|
EUR 400 million
|
|
Central Europe, 2006
|
45 million
|
Less than 2 hours
|
|
Source: SESAME: Securing the European Electricity Supply Against Malicious and Accidental Threats
A more common approach to emergency handling, with an obligation for Member States to help each other, would help to avoid or limit the effects of potential blackouts. A more common approach, with clear obligations to e.g., follow up on the results of seasonal outlooks, would also reduce the costs of remedial actions TSOs have to face today. This, in turn, should have a positive effect with a reduction of costs overall.
In addition, improving transparency and information exchange would facilitate coordination, leading to a more efficient and less costly measures.
By ensuring that electricity markets operate as long as possible also in stress situations, cost-efficient measures to prevent and resolve crisis are prioritized.
6.3.2.2.Who would be affected and how
Option 1 is expected to have a positive effect on society at large and electricity consumers in particular, since it helps prevent crisis situations and avoid unnecessary cut-offs. Given the nature of the measures proposed, no major other impact on market participants and consumers is expected.
On cybersecurity, given the voluntary approach of this option, several stakeholders (TSOs, DSOs, generators, suppliers and aggregators) could be affected, as long as they implement the guidance proposed. However, the impact is estimated limited as the costs of cybersecurity for regulated entities merely need to get considered and taken into account by the regulatory authority. Thus, the TSOs and DSOs affected could recover their costs via grid tariffs. In that case, the pass through of costs would have an impact on consumers that could see a slightly increased in the final prices of electricity.
6.3.2.3.Impact on businesses and public authorities
The preparation of risk preparedness plans as well as the increased transparency and information exchange in crisis management imply a certain administrative effort
. However, the impact in terms of administrative impact would remain low, as currently Member States already assess risks relating to security of supply, and all have plans in place for dealing with electricity crisis situations.
In addition, it is foreseen to withdraw the current legal obligation for Member States to draw up reports monitoring security of supply, as such reporting obligation will no longer be necessary where national plans reflect a common approach and are made transparent. This would reduce administrative impacts.
6.3.3.Impacts of Policy Option 2 (Common minimum rules to be implemented by Member States plus regional co-operation)
6.3.3.1.Economic impacts
This option would lead to better preparedness for crisis situations at a lesser cost through enhanced regional coordination. The results of METIS simulations
show that well integrated markets and regional coordination during periods of extreme weather conditions (i.e. very low temperature
) are crucial in addressing the hours of system stress (i.e. hours of extreme electricity demand), and minimizing the probability of loss of load (interruption of electricity supply).
Most importantly, while a national level approach to security of supply disregards the contribution of neighboring countries in resolving a crisis situation, a regional approach to security of supply results in a better utilization of power plants and more likely avoidance of loss of load. This is due to the combined effect of the following three factors: (i) the variability of renewable production is partly smoothed out when one considers large geographical scales, (ii) the demands of different countries tend to peak at different times, and (iii) the power supply mix of different countries can be quite different, leading to synergies in their utilization.
The following table compares the security of supply indicator, EENS, assessed by METIS for the three levels of coordination (national, regional, European). It highlights the highest value of the loss of load (electricity non-served expressed as percentage of annual load) when it is measured in a scenario of non-coordinated approach, which does not take into account the potential mutual assistance between countries. When cooperation takes place among Member States, the percentage of electricity non-served significantly decreases.
Table 24 - Global expected energy non-served as part of global demand within the three approaches for scenario ENTSO-E 2030 v1 with CCGT/OCGT current generation capacities
|
Level
|
EENS (% of annual load) – ENTSO-E V1 scenario
|
|
National level
|
0,36 %
|
|
Regional level
|
0,02 %
|
|
European level
|
0,01 %
|
ENTSO-E 2030 v1: vision for 2030 "Slowest progress". The perspective of Vision 1 is a scenario where no common European decision regarding how to reach the CO2-emission reductions has been reached. Each country has its own policy and methodology for CO2, RES and resource adequacy.
Source: METIS
The EENS for the three levels of coordination are represented on the figure below. When the security of supply is assessed at the national level, many countries of central Europe seem to present substantial levels of loss of load. However, since these countries are interconnected, a regional assessment of security of supply (taking into account power exchanges within this region) significantly decreases the loss of load levels.
Figure 14 - EENS (%) estimation by country for scenario ENTSO-E 2030 v1 with CCGT/OCGT current generation capacities. From left to right: EENS estimated at European, regional and national levels

CCGT: Combined Cycle Gas Turbine OCGT: Open Cycle Gas Turbine
ENTSO-E 2030 v1: vision for 2030 "Slowest progress". The perspective of Vision 1 is a scenario where no common European decision regarding how to reach the CO2-emission reductions has been reached. Each country has its own policy and methodology for CO2, RES and resource adequacy.
Source: METIS
METIS simulations also show that thanks to regional cooperation the stress situations would decrease and concentrate in a limited number of hours that may occur simultaneously. Therefore, it highlights the need for specific rules on how Member States should proceed in these particular circumstances, as proposed in this Option 2.
As the overall cost of the system would decrease thanks to enhanced coordination this could have a positive impact on prices for consumers.
On the contrary, a lack of coordination on how to prevent and manage crisis situations would imply significant opportunity costs. A recent study also evidenced that the integration of the European electricity market could deliver significant benefits of EUR 12.5 to 40 billion until 2030. However, this amount would be reduced by EUR 3 to 7.5 billion when Member States pursue security of electricity supply objectives following going alone approaches
.
6.3.3.2.Who would be affected and how
As in the case for Option 1, Option 2 is expected to have a positive effect on society at large and electricity consumers in particular, since it helps prevent crisis situations and avoid unnecessary cut-offs. Given that, under Option 2, Member States would be required to effectively cooperate, and tools would be in place to monitor security of supply via the Electricity Coordination Group, such crisis prevention and management would be even more effective.
The measures would also have a positive effect on the business community, as there would be much more transparency and comparability as regards how Member States prepare for and intend to manage crisis situations. This will increase legal certainty for investors, power generators, power exchanges but also for TSOs when managing short-term crisis situations.
Among the stakeholders the most affected would be the competent authorities (e.g. Ministry, NRA) as actors responsible for the preparation of the risk preparedness plans (see below, assessment of impacts on public authorities).
6.3.3.3.Impact on businesses and public authorities
The assessment of this option shows a limited increase in administrative impact, although it would be to some extent higher than Option 1, given that national authorities would be required to pre-agree part of their risk preparedness plans in a regional context.
However, existing experiences show that a more regional approach to risk assessment and risk preparedness is technically and legally feasible. Further, since the regional parts of the plans would in practice be prepared by regional co-ordination centres between TSOs, the overall impact on Member States' administrations in terms of 'extra burdens' would be limited, and be clearly offset by the advantages such co-operation would bring in practice.
In addition, more regional cooperation would also allow Member States to create synergies, to learn from each other, and jointly develop best practices. This should, overtime, lead to a reduction in administrative impacts.
Finally, European actors such as the Commission and ENTSO-E would provide guidance and facilitate the process of risk preparation and management. This would also help reduce impacts on Member States.
It should be noted, that under Option 2 (as is the case for Option 1) no new body or new reporting obligation is being created, and that existing obligations are being streamlined. Thus, the Electricity Coordination Group is an existing body meeting regularly, for the future it is foreseen to make this group more effective by giving it concrete tasks. Further, national reporting obligations would be reduced (e.g. repealing the obligation of Article 4 of Electricity Directive) and EU-level reporting would take place within the context of existing reports and existing reporting obligations (e.g. ACER annual report Monitoring the Internal Electricity and Natural Gas Markets).
6.3.4.Impacts of Policy Option 3 (Full harmonisation and full decision-making at regional level)
6.3.4.1.Economic impacts
The regional coordination through the regional plans would have a positive impact in term of cost as the number of plans would be necessary less than twenty-eight plans and limited to the number of regions. In addition, the coordination at European level would decrease slightly the loss of load level compared to the regional coordination (EENS 0.01% compared to 0.02%).
On the contrary, on cybersecurity, the creation of a dedicated agency at EU level would have important economic implications as this agency would be a new body that does not exist yet and which is also not foreseen in the NIS Directive. The costs of creating this new agency are not only limited to the creation of a new agency itself, but the costs would also have to include the roll-out of a whole security infrastructure. For example, the estimated costs of putting in place the necessary security infrastructure and related services to establish a comparable national body - cross-sectorial governmental Computer Emergency Response Team ("CERT") with the similar duties and responsibilities at national level as the planned pan-European sector-specific agency - would be approximately EUR 2.5 million
per national body. This means that the costs for the security infrastructure would be manifold for a pan-European body. In terms of human resources, for the proper functioning of the new agency with minimum scope and tasks at EU level, it is estimated a staff of 168 full time equivalents (considering 6 full time equivalents per Member State sent to the EU agency). The representation from all Member States in the agency is essential in order to ensure trust and confidence on the institution. However, the availability of network and information security experts who are also well-versed in the energy sector is limited.
6.3.4.2.Who would be affected and how
The obligation of regional plans would have important implications for the competent authorities as the coordination and agreement of common issues (e.g. load shedding plan, harmonised definition of protected customers) would be a lengthy and complex process.
On cybersecurity, the creation of the new agency at EU level would mobilize highly qualified human resources with skills in both energy and information and communication technologies. This could have a potential impact on national administrations and energy companies as long as some of the experts in the field could be recruited by the new institution. However, the impact would be limited as the representation for all Member States should be guaranteed. Therefore, a small number of experts (around 6) per country could be recruited.
6.3.4.3.Impact on businesses and public authorities
Overall Option 3 would imply significantly administrative impact in the preparation of the regional plans. It would require important efforts to gather information related to national and regional circumstances and contribute to the joint task of assessing the risks and identifying the measures to be included in the plans. In any case, it would seem difficult to coordinate within a region the national specificities and risks originate mostly in one Member State.
The creation of a new agency on cybersecurity would imply significant administrative impacts in the preparation and set-up of the agency, as well as in the communication structure with already existing cross-sectorial bodies of Member States (CERTs/ Computer Security Incident Response Teams "CSIRTs").
6.4.Impact Assessment for Problem Area IV (Increase competition in the retail market)
6.4.1.Methodological Approach
This section compares the costs and benefits of each of the policy options to address this Problem Area in a semi-quantitative manner.
No data or methodology exists that would allow us to accurately quantify all the benefits of the measures examined.
However, this section draws on behavioural experiments from a controlled environment to evaluate the impact of some policy options on consumer decision-making. Where economic impacts cannot be quantified, quantitative desktop research and case studies are used to inform estimates of the extent of possible impacts, as well as possible winners and losers. Where appropriate, this section aims to illustrate the possible direct benefit to consumers assuming certain conditions. Implementation costs in terms of the impact on businesses and public authorities were estimated using the standard cost model for estimating administrative costs. And finally, this section also highlights important qualitative evidence that policymakers should also incorporate into their analysis of costs and benefits.
6.4.2.Impacts of Policy Option 0+ (Non-regulatory approach to improving competition and consumer engagement)
6.4.2.1.Economic Impacts
Option 0+ would lead to an estimated EUR 415 million in benefits to consumers for the period 2020-2030, which come as a result of an enforcement drive to tackle the switching costs currently faced by an estimated 4% of all EU electricity consumers that do not comply with EU law
.
Other unquantifiable economic benefits include improved retail level competition resulting from the phase-out of regulated prices in some Member States
, and more comparison tools that comply with the Unfair Commercial Practices Directive.
In addition, one may expect modest, indirect improvements to the health and well-being of energy poor consumers from the exchange of good practices stemming from the activities of the EU Observatory for energy poverty.
In spite of these considerations, it is unlikely that Option 0+ (Non-regulatory approach) would most effectively address the problems identified.
First, this option does not address the poor data flow between retail market actors that constitutes both a barrier to entry and a barrier to higher levels of service to consumers. Whereas Option 0+ is non-regulatory, a credible policy to tackle conflicts of interest among market actors around data handling would require a legislative intervention.
Secondly, as a non-regulatory option, the effectiveness of Option 0+ is significantly limited by shortcomings in the existing legislation. This significantly reduces the ability to address contract termination fees (which are currently legal under EU law), the partial availability of comparison websites in Member States, as well as energy poverty, which the current legislation does not require Member States to measure, and hence address it.
And finally, a non-regulatory approach to tackling price-regulation may lead to a fragmented regulatory framework across the EU given: (i) the uncertainty that surrounds the Commission's ability to convince hold-out Member States to voluntarily cease excessive regulatory interventions in price-setting; and (ii) the uncertainty that surrounds the success of any subsequent legal measures to infringe Member States on the issue.
6.4.2.2.Who would be affected and how
Consumers will benefit from more easily being able to compare offers in the market, as well as lower financial barriers to switching. Whilst consumer prices may rise in Member States phasing out price regulation, this would be offset by higher levels of service and the greater availability of value added products on the market.
Member States will benefit from a clearer understanding and measurement of energy poverty will have indirect positive impacts on energy poor consumers.
Suppliers would benefit from increased access to the market of any Member State phasing out price regulation. However, certain suppliers would also face tougher competition and increased pressure on margins as the result of the modestly greater consumer engagement expected.
Any increase in consumer switching would increase the administrative impacts to DSOs. However, these costs would be passed through to end consumers.
NRAs in any Member States phasing out price regulation will need to significantly step up efforts to monitor the market, ensure efficient competition, and guarantee consumer protection. They will need to more closely monitor and report the number of disconnections. However, this may be offset by a reduction in price setting interventions, and increased competition resulting from greater consumer engagement.
6.4.2.3.Impact on businesses and public authorities
Option 0+ (Non-regulatory approach) would lead to quantifiable implementation costs of around EUR 0.9 million for the period 2020-2030, all resulting from setting up and running an EU Observatory for energy poverty
. It is anticipated that the soft law and enforcement measures associated with making better use of the existing legislation on regulated prices, switching fees and comparison tools would not result in significant additional costs compared with a business as usual scenario.
6.4.3.Impacts of Policy Option 1 (Flexible legislation addressing all problem drivers)
6.4.3.1.Economic Impacts
Option 1 would lead to an estimated EUR 2.2 billion in direct benefits to consumers for the period 2020-2030, which come as a result of: (i) reducing the switching-related charges faced by 21% of household electricity consumers, and so helping them realize the potentially significant gains of moving to a cheaper tariff
; (ii) further improvements to the switching rate for both electricity and gas household consumers as a result of the improved availability of price comparison tools
; (iii) an improved ability for consumers to identify the best offer in the market through improved access to information on the bill (although the gains of this latter intervention are not easy to quantify compared for instance with interventions aimed at making switching less costly for consumers)
.
Other unquantifiable economic benefits include significantly improved retail competition resulting from the definitive phase-out of blanket price regulation in the 17 Member States still practicing it
. The impact of phasing out price regulation on retail price levels is impossible to quantify. However, the evidence strongly suggests it will lead to higher levels of consumer satisfaction. Indeed, even the energy component of retail bills does increase slightly in the short-term, consumer surplus (the difference between the price of the service and the price a consumer would be willing to pay for that service) may actually increase too as a result of the better service levels consumers receive in the non-regulated market. In addition, retail price competition is an important prerequisite for new services that would increase system flexibility (benefits examined in Section 6.1.4), and should lead to lower system costs that are passed through to consumers in both the energy and network components of bills in the longer term.
Non-discriminatory access to consumer data and nationally harmonized data formats will also help new suppliers and service providers to enter the market and develop innovative new products, resulting in further competition benefits and facilitating the transition to a more flexible electricity system
.
Greater consumer engagement will also drive retail competition improvements, as competitive suppliers and service providers find it easier to take market share from less competitive alternatives. Other benefits come in terms of the higher levels of service electricity consumers can expect from more efficient data handling, and greater consumer awareness of the market and their own energy situation.
In addition, one may expect improvements in the targeting of measures to tackle energy poverty. Better measurement of the number of households on energy poverty will allow Member States and the EU to design better policies and exchange good practices. A generic definition of energy poverty in the legislation will clarify the concept of energy poverty, improving the functioning of the current provision and further helping knowledge dissemination and synergies across EU policies in energy efficiency and consumer protection.
6.4.3.2.Who would be affected and how
Consumers will benefit significantly from more easily being able to compare offers in the market, as well as lower financial barriers to switching. Whilst consumer prices may rise in the Member States phasing out price regulation, this would be offset by higher levels of service and the greater availability of value added products on the market. Consumers would also benefit from increased competition and higher levels of service resulting from rules that ensure quick and non-discriminatory access to data.
Box 8: Impacts on different groups of consumers
The benefits of the vast majority of the measures contained in the preferred options in Problem Areas I, II and III would manifest through lower system costs and greater system reliability, and therefore accrue to all consumers in an even manner. However, most of the measures contained in the preferred option of Problem Area IV, above, would benefit certain kinds of consumers more than others.
For example, whereas energy poor households would be the chief beneficiaries of new obligations to measure energy poverty levels, the marginally increased burdens of these obligations would be socialized amongst other ratepayers/taxpayers. In addition, whereas phasing out price regulation would free public finances to better protect households who qualify for targeted social support measures (i.e. vulnerable and/or energy poor consumers), the biggest losers from this policy would be high-volume, often higher-income consumers who have hitherto benefitted from retail prices that have been set at artificially low levels. Both these measures can therefore be considered progressive in nature i.e. they tend to redistribute surplus from relatively high-income ratepayers/taxpayers in order to increase the welfare of lower-income ratepayers.
The measures on switching-related fees and comparison tools would predominantly benefit consumers who are engaged in the market i.e. those who compare offers and/or switch regularly. Whilst the measures would also increase consumer engagement levels, and whilst the increased competition engendered by the measures would lead to more competitive offers on the market, disengaged consumers, including consumers who may be vulnerable, will not reap as many direct benefits.
And finally, the benefits of the billing measures would accrue predominantly to consumers who do not engage in the market or better control their energy consumption because of insufficient billing information or confusing bills. This may include a varied range of consumers, including certain vulnerable consumers, or those who are time poor.
Many Member States will benefit from a clearer understanding of energy poverty, which will have indirect positive impacts on energy poor consumers. However, Member States will also need to collect and report more information on energy poverty as a result of requirements in this option.
Suppliers would benefit from increased access to the market of the Member States phasing out price regulation. New entrants and energy service companies offering innovative products would also benefit from quick and non-discriminatory access to data. However, suppliers would also likely face increased pressure on margins as the result of the modestly greater consumer engagement expected. Certain suppliers may need to adjust contractual conditions and reformat their consumer bills in order to comply with new requirements on contract termination fees and billing information. And they would likely also bear the brunt of the significant costs to protect energy poor consumers.
As TSOs and DSOs are normally the market actors charged with data management, they would be the most affected by the new data management requirements – particularly the DSOs who currently fall below the unbundling threshold as they would need to implement further measures to ensure non-discriminatory data handling. Any increase in consumer switching would also increase the administrative impacts to DSOs. However, all these costs would be passed through to end consumers. In addition, network operators would benefit from the anticipated entrance of aggregators and other energy service companies who facilitate network flexibility, as a result of non-discriminatory data flows.
NRAs in the 17 Member States phasing out price regulation will need to significantly step up efforts to monitor the market, ensure efficient competition, and guarantee consumer protection. However, these impacts may be offset by increased consumer engagement, which would naturally foster competition in the market.
6.4.3.3.Impact on businesses and public authorities
It is estimated that implementing the consumer-related elements of Option 1 (Flexible legislation) would lead to quantifiable costs of between EUR 21 million and EUR 24 million for the period 2020-2030. These would mainly stem from national authorities having to set up and run certification schemes for energy comparison tools or an independently run energy comparison tool themselves
. However, many suppliers would also bear costs associated with modifying their consumer bills to comply with the modest requirements in this option
. Unquantifiable impacts come in the form of the reduced contractual freedom that suppliers have, which is associated with the restriction on contract termination fees for certain kinds of contracts only
.
Implementing the energy poverty provisions in Option 1 (Flexible legislation) would result in quantifiable costs of EUR 2.3 million for the period 2020-2030. These primarily result from measuring energy poverty making reference to household income and household energy expenditure using data already collected by Member States
.
Significant, albeit unquantifiable costs are associated with creating a level playing field for access to data in Option 1 (Flexible legislation). In particular, ensuring that Member States implement a standardised data format at the national level will significantly impact many market actors (suppliers, DSOs, third parties such as energy service companies, data administrators), who would have to redesign their IT systems to accommodate this format. However, these costs will be mitigated by the fact that measures can be applied independently of the data management model that each Member State has chosen. This reduces the potentially very significant scope for sunk costs if Member States were to all conform to a common data management model
.
6.4.4.Impacts of Policy Option 2 (Harmonization and extensive safeguards for consumers addressing all problem drivers)
6.4.4.1.Economic Impacts
Option 2 (Harmonization and extensive safeguards) could lead up to up to EUR 3.5 billion in direct benefits to consumers for the period 2020-2030, which come as a result of: (i) an outright ban on all switching-related charges
; (ii) further improvements to the switching rate as a result of every Member State establishing a government (funded) price comparison tool guaranteed to work in the consumer's interest
; (iii) an improved ability for consumers to identify the best offer in the market through fully standardised billing information
.
However, there is greater uncertainty surrounding the benefits that stem from these interventions. Whilst an outright ban on all switching-related charges would increase the financial incentive to switch, it could also make it more difficult to finance certain energy service investments (i.e. solar panels or energy efficiency upgrades packaged with energy supply contracts) if implemented poorly. It might also result in a smaller range of tariffs available to consumers. Not all government (funded) price comparison tools may work better for consumers than the comparison tools already available on the market. And it may be difficult, if not impossible, to devise a standard EU bill design that accommodates differences in consumer preferences and market conditions in all Member States.
Whilst phasing-out blanket price regulation in the 17 Member States still practicing it would lead to improved retail competition, defining the conditions under which price regulation could continue at the EU level would be problematic. In particular, permitting price regulation for households who consume below a certain price threshold would not accurately target those most in need of assistance. In addition, permitting regulators to only set price caps above cost would be difficult to enforce due to opaque cost structures. It also risks holding back investments in product innovation and service quality, which require higher margins
. As with Option 1 (Flexible legislation), the impact of phasing out price regulation on retail price levels is impossible to quantify, whereas the evidence strongly suggests it will lead to higher levels of consumer satisfaction.
Defining a specific EU data management model for all Member States, such as an independent central data hub, would bring similar benefits to Option 1 in terms of helping new suppliers and service providers to enter the market. In addition, it would be easier to enforce at the EU level
.
6.4.4.2.Who would be affected and how
Consumers will benefit from more easily being able to compare offers in the market, as well as lower financial barriers to switching. However, these gains may be tempered by a reduction in the availability of beneficial products on the market. Whilst consumer prices may rise in the Member States phasing out price regulation, this would be offset by higher levels of service and the greater availability of value added products on the market. Consumers would also benefit from increased competition and higher levels of service resulting from rules that ensure quick and non-discriminatory access to data.
Energy poor consumers in many Member States would enjoy significant benefits from the comprehensive set of disconnection safeguards outlined as they are more likely to be on risk of disconnection. Whilst many Member States will benefit from a prescriptive EU definition of energy poverty and from better information on the energy efficiency of the housing stock, the benefits of better measurement may not composite for the significant resources required to survey the housing stock at national level. Energy poor and vulnerable consumers may also be impacted by more poorly targeted support as the result of permissible instances of price setting being defined at the EU-level, rather than being assessed on a case by case basis.
Suppliers would benefit from increased access to the market of the Member States phasing out price regulation. However, all suppliers would need to significantly reformat their bills in order to comply with a standard EU bill design. They would likely also bear the brunt of the very significant costs to protect energy poor consumers introduced under Option 2 (Harmonization and extensive safeguards) – in particular the complete ban on winter disconnections. However, new entrants and energy service companies offering innovative products would benefit from quick and non-discriminatory access to data.
As TSOs and DSOs are normally the market actors charged with data management, they would be the most affected by the requirement to establish a standard EU data management model that all Member States. Indeed, since many would incur significant sunk costs in adopting a model different from their own, the impacts could be significant. However, all these costs would be passed through to end consumers. In addition, network operators would benefit from the anticipated entrance of aggregators and other energy service companies who facilitate network flexibility, as a result of non-discriminatory data flows.
NRAs in the 17 Member States phasing out price regulation will need to significantly step up efforts to monitor the market, ensure efficient competition, and guarantee consumer protection. However, these impacts may be offset by increased consumer engagement, which would naturally foster competition in the market.
6.4.4.3. Impact on businesses and public authorities
It is estimated that implementing the consumer-related elements of Option 2 ((Harmonization and extensive safeguards) would lead to quantifiable costs of between EUR 42 million and EUR 51 million for the period 2020-2030. These would mainly stem from national authorities having to set up and run energy comparison tools
, and energy suppliers having to heavily modify their consumer bills to comply with the requirements in this option
. Unquantifiable impacts come in the form of the greatly reduced contractual freedom that suppliers have, which is associated with the ban on contract termination fees
.
Implementing the energy poverty provisions in Option 2 (Harmonization and extensive safeguards) would result in quantifiable costs of between EUR 1.2 billion and EUR 3.8 billion for the period 2020-2030. Unless public authorities step in, these costs would most likely fall on suppliers and result from: (i) the additional costs of unpaid bills resulting from the requirement for suppliers to give all customers a disconnection notice of at least two months; (ii) the additional costs of unpaid bills resulting from the cessation of winter disconnections; and (iii) refinancing costs resulting from the obligation to offer all consumers the possibility to delay payments or restructure their debt prior to disconnection
.
As these costs associated with disconnection safeguards are large, it is likely that this option would result in distortions to competition in Member States where the public does not cover these costs. Whilst suppliers active in such markets could raise margins to socialize losses from unpaid bills, certain suppliers – especially smaller ones who are less well equipped to deal with the additional pressure on their operations – may seek to avoid entering markets where there are likely to be significant risks of disconnections.
Member States may be better suited to design these schemes to ensure that synergies between national social services and disconnection safeguards are achieved. These synergies may also result in public sector savings which may be significant given the substantial costs of these measures and the overlap between social policy and disconnections for non-payment.
Very significant costs are associated with creating a level playing field for access to data in Option 2 (Harmonization and extensive safeguards). A mandatory data handling model will imply the administrative costs of defining and designing such a model, and more importantly high sunk costs for existing data models and additional costs for rebuilding a new one, both in terms of personnel costs and IT infrastructure. Designing and building a new data handling model is a complex procedure and may well take several years of planning and implementation. For example, in Denmark alone, the central data hub took more than 4 years to design and develop in its simple form, and 7 years in its enhanced form, and is estimated to a cost of approximately EUR 165 million, where approximately EUR 65 million accrued to the data hub administrator (the TSO), and around EUR 100 million accrued to DSOs and energy suppliers
.
6.4.5.Environmental impacts
The legislative options examined above – Option 1 (Flexible legislation) and Option 2 (Harmonization and extensive safeguards) – can each be expected to have significant, albeit indirect, environmental benefits because they enable the uptake of technologies that help the electricity system become more flexible, thus enabling higher levels of variable and decentralized RES E penetration. Non-discriminatory access to consumer data and a phase-out of regulated prices will allow new entrants and energy service companies to develop and offer value-added products such as dynamic price supply contracts, incentive-based demand response services, green tariffs, and supply contracts with bundled energy efficiency or rooftop solar investments. In addition, tackling the barriers to consumer engagement will increase the selective pressure for such new services. The measures will benefit smaller consumers in particular, the group of market actors which the analysis has shown represents the greatest remaining source of low hanging fruit in terms of system flexibility potential.
In addition, phasing out blanket price regulation – particularly in Member States with very low margins – will help address the high levels of electricity and gas consumption caused by artificially low prices. This will make it easier to achieve climate objectives and provide a proper price signal for energy efficiency investments.
6.4.6.Impacts on fundamental rights regarding data protection
A key building block for the completion of the Digital Single Market and the Energy Union includes strong and efficient protection of fundamental rights in a developing digital environment. The proposed policy measures on data management were developed in this context, to ensure widespread access and use of digital technologies while at the same time guaranteeing a high level of the right to private life and to the protection of personal data as enshrined in Articles 7 and 8 of the Charter of Fundamental Rights of the EU.
As data on individual consumers' consumption and billing become central to the deployment of distributed energy resources and the development of new flexibility services, the measures on data management in the various policy options proposed (from compliance with data protection legislation and the Third Energy Package - Option 0 (Baseline); to further introduction of specific requirements on data handling responsibilities based on principles of transparency and non-discrimination – Option 1 (Flexible legislation); and implementation of a specific data management model to be described in EU legislation – Option 2 (Harmonization and extensive consumer safeguards)) seek to ensure the impartiality of the entity which handles data and to ensure uniform rules under which data can be shared. Indeed, consumers must be reassured that their consumption and metering data remain under their control. Access to a consumer's metering or billing details can only happen when authorised by that consumer and under the condition that the personal data protection and privacy are guaranteed.
In this light, the data management policy options are therefore fully aligned and further substantiate the fundamental rights to privacy and protection of personal data of Articles 7 and 8 of the Charter of Fundamental Rights of the EU, as well as with the General Data Protection Regulation and with the Commission Recommendation on the Data Protection Impact Assessment Template for Smart Grid and Smart Metering Environments.
Box 9: External factors and the assessment of the impacts
Price signals and long-term confidence that costs can be recovered in reasonable payback times are essential ingredients for a well-functioning market. In a market which is not distorted by external costs and interventions, the level and variability of the spot price on the wholesale market, plays a role in signalling the need for investments in new resources. With external costs and in the absence of the right short- and long-term price signals, it is more likely that inappropriate investment or divestment decisions are taken, i.e. too-late decisions or technology choices that turn out to be inefficient in the long run. It also renders it more likely that capacity exits that is valuable for the system as a whole.
The impact assessment demonstrates that an improved market design can lead to a much more efficient utilisation of resources and establish the market as a main driver of investments in generation assets (even if only progressively and not fully for all RES E technologies (See Box 7)). This will be mainly driven by the restoration of the economic merit order curve (see Section 6.1.2, Figure 11) and the improved reflection of scarcity in short term electricity prices (see Section 6.2.6.4, Table 21), both resulting from the measures proposed by the current initiative, combined with the exit of non-economical units as a result of the transition towards a market equilibrium (See section 6.2.6.3, Table 18) from the current overcapacity.
Market exit should be brought about by market forces and the initiative generally aims at removing existing obstacles to this in regulation. Market exit is framed to some degree by the measures proposed under Problem Area II. The extent to which a system with capacity remuneration exacerbate or not existing excess capacity depends on how the capacity requirement is set within the mechanism. If the system is correctly calibrated by means of a genuine resource adequacy assessment (See Problem Area II, Option 2) there will be no overcapacities. This is both important to ensure that CMs do not incite lower than economically optimal wholesale prices, which would inhibit investments, and prevent delays upon the transition path by preventing exit of non-essential resources. Moreover, the measures under Problem Area I and Problem Area II, option I, will ensure that prices better reflect the real value of electricity, affecting specifically the remuneration of electricity generation units that operate less often but provide security and flexibility to the system. For the same reason, it is important that TSOs (as responsible entities for overall operation of the system) define and remunerate ancillary services appropriately, remunerating generators for the full range of services they provide. These market improvements affect exit in the sense that they ensure that only those resources will exit that genuinely have no value for the system as a whole.
It is true that overall price developments in the electricity sector will also depend on cost factors beyond the present initiative, such as the carbon prices, prices for primary fuels or technological costs.
These external factors would mainly impact the level of wholesale prices, possibly affecting to a certain extent the overall level of benefits to be expected from the present initiative or their distribution among individual options (in manners which are not easily predictable in view of the many interactions that take place). However, such changes are not expected to affect the order of preferred options. Indeed, the proposed measures in essence derive their benefits from the removal of current market distortions and imperfections, while at the same time having comparably small implementation costs. These are benefits that are inherent to the measures themselves and do not depend on the precise context in which they are implemented. Moreover, strong synergies exist between the sets of options within the package (See Section 7.5.1), meaning that the overall benefits of a given option are more affected by the coherence of the package as a whole, than by its interactions with factors outside the present initiative.
Low wholesale prices though would affect investments in electricity resources such as demand response, RES E and peaking plant investments. Concerning demand response, the aim of the initiative is to offer to the consumers the opportunity to participate in the market if they wish to, either directly (e.g. industrial consumers) or indirectly (e.g. via aggregators). The initiative is not aiming to affect the level and variability of wholesale prices, but to make the functioning of the markets more efficient so that it can deliver price signals reflecting the value of electricity at each moment of time and the need for future investments (and in what type). Although persistent low electricity wholesale prices could lead to low investments, this is a normal outcome if it is a result of market dynamics and not distortions. For example a system characterized by overcapacity should have low prices to signal that investments are not needed.
It is equally noteworthy that the modelling work (as presented in section 6.2.6.4) indicates that in the mid-long term, even in the presence of larger shares of variable RES E, conventional generators will set the marginal price in a sufficient number of hours to produce meaningful price signals to guide overall market operations. Increasing RES E penetration therefore does not necessarily give rise to low(er) average wholesale market prices.
The assessment of the benefits also depends to a certain degree on the progress made in the implementation of measures proposed by parallel initiatives, considered as part of the baseline for the present initiative, most notably the REDII. In this context, it is important to note that the assessment of the present initiative assumes the full phase-out of non-market based support mechanisms by 2030 for RES E, i.e. feed-in-tariffs would be phased-out and replaced by schemes that expose RES E to price signals, as for instance premium based schemes. Such investments would be further triggered by setting support-levels through auctioning as RES E investments projects would then be incentivised to develop business models that optimise market based returns. These are reasonable assumptions in view of the rules that are expected to be in place well before 2030 (see in particular Annex IV).
The success or failure to implement such measures for RES E in time would have a direct impact on the effectiveness of the present initiative. A partial or delayed implementation of the closely associated policies, as proposed in the revised Renewable Energy Directive, especially if combined with the prolongation of existing distortions, would reduce the efficiency of the market design initiative in the medium term and postpone its expected benefits further into the future. On the contrary, an expedient implementation would achieve the establishment of efficient markets and the delivery of the associated benefits sooner.
6.5.Social impacts
European social partner's joint position:
"Citizens and especially low-income households should be able to pay their bills"
The new market design should be: "ensuring that the provision of electricity is secure, safe, reliable and reasonably priced"
It was also underlines that: "workers in and outside of the electricity sector are relying on a stable electricity market for their jobs. There is currently a precarious situation for many workers in the electricity sector, especially among power plant workers. Many plants are not adequately remunerated for the services they provide (e.g. flexibility, security of supply) and therefore several companies foresee closure. Workers could lose their jobs".
A shown above, more efficiently organised cross-border electricity markets can avoid significant costs for energy customers. Given the importance of energy costs for many companies and for individual households, realising the possible cost savings can be expected to improve competitiveness of commercial players (with positive impact on jobs and growth) and on private customers (especially relevant for low-income households).
The electricity industry (i.e. production, transmission, distribution and trade of electricity) is a key economic sector with a turnover amounting to not less than EUR 1.182 billion in 2014. EU households spent EUR 148.2 billion on electricity bills (EUR 97.4 billion on gas), which means that every household had to pay EUR 686,- per year for electricity (EUR 451,- for gas) on average, with important variations between single Member States. Especially for low-income households, costs for electricity can eat up large parts of the available income. Also for many industries, especially those in competition at a world-wide scale, energy costs are an important factor for competitiveness. EU wholesale electricity prices are still higher than in other regions in the world (e.g. around 30% compared to the U.S.). Avoiding unnecessary prices increases by an intelligent organisation of electricity markets (e.g. market-based solutions and using advantages of aggregation across borders) can therefore save jobs and create growth in the EU.
The possible measures analysed to better adapt the current market rules to decarbonised electricity markets through revised legislation (See options in 'Problem Area I' e.g. re-establishing the level playing field, improving short-term markets and removing barriers for demand response and distributed resources) would allow to integrate electricity generated from RES E at lower costs. They would also increase the potential for cross-border trade, leading to more competition and better possibilities to level out production and demand differences across larger areas.
Grid fees and other system costs have increased in recent years due to the suboptimal organisation of markets, but also through the need to adapt the infrastructure to decentralised generation. Better organised electricity markets would therefore not only save costs for electricity, but also keep grid costs in check (e.g. by limiting the necessary costs for TSO-interventions to keep the grid stable, so-called 're-dispatching'). Measures to keep the further expansion of grid fees in check can therefore bring tangible benefits to industry and private (low-income) customers.
The analysed measures to improve investors' certainty and limit state interventions ('Problem Area II', e.g. better co-ordinating capacity mechanisms between countries) can also be expected to have a positive impact on competitiveness and on energy bills to of households. As shown above, fragmented adequacy planning and capacity mechanisms leads to higher energy costs and network charges. If each Member State builds its backup generation in its own country without taking into account generation from neighbours, this will necessarily lead to inefficiencies through unnecessary duplication of investments. Notably Options 2 (regional adequacy assessment) and Option 3 (cross-border openness of capacity mechanisms) would help to keep the prices for state interventions concerning capacity mechanism in check.
In a similar manner, the analysed measures to improve risk preparedness ('Problem Area III', e.g. better co-ordinated planning and rules to better coordinate possible load shedding in case of crises) options are likely to have a positive impact for EU citizens and businesses. Previous blackouts have shown that even in the "traditional" electricity market with low shares of RES E so-called "cascade blackouts" resulting from problems in other Member States can seriously harm businesses and customers, in particular those depending on electrical heating (see on the system blackouts in 2003 and 2006 above, section 6.3.2.1). Amounts of variable RES E have increased ever since, and so has the importance of a reliable electricity grid for citizens and customers (e.g. increased risks of blackouts for internet-driven businesses and private communication). Minimising blackout risks through better regional coordination will therefore contribute to avoid negative impacts on businesses and households.
Finally, the analysed measures to enhance performance of retail markets (Problem Area IV, e.g. measures facilitating to change suppliers, more targeted support for "energy-poor") customers in the transition to market-based prices, etc.) will also have a positive impact on businesses and households. In addition, the proposals relative to the phasing out of regulated prices, should incentivise Member States which currently use blanket price regulation to provide targeted support for vulnerable and energy poor consumers instead of providing an indirect support to all consumers regardless of their circumstances as is currently often the case.
Improvements to the health and well-being of energy poor consumers, savings to the health sector
, and economy-wide productivity gains
can be expected from the packages of energy poverty measures evaluated above. Due to the indirect nature of the way these measures would address energy poverty, and a lack of specific data on their impact, these benefits are impossible to quantify.
Health impacts most commonly associated with energy poverty and under-heated dwellings can be fatal, resulting in higher mortality during winter period. Benefits of effective action to reduce excess winter mortality could be substantial given the scale of the issue. In fact independent research shows that over 200,000 excess winter deaths have occurred across 11 Western European countries alone during the winter of 2014/2015. In addition to the physical impacts, cold homes are directly related to mental health problems.
The energy transition and decarbonisation policies play a key role in developing Europe’s competitive edge internationally as growth and jobs increasingly will have to come from innovative products and services which are closely linked to sustainable and smart solutions. Recent studies on the impact of EU’s energy and climate targets suggest a net increase in job demand in the power generation market as a result of the transition of the energy system. One factor behind this is the higher labour intensity in power generation from renewable sources compared to gas or nuclear. There will also be a change in the employment structure as many of the jobs associated with the energy transition require higher skills and increased supply of workers that outweigh job losses in somewhat less qualified jobs in conventional energy generation. The total number of jobs in the power sector (operation, maintenance, construction, installation, and manufacturing) is forecast to increase by around a half by 2030. Further positive impacts are expected in the indirect and substitution effects.
Whereas these effects are related to the energy transition as such and cannot be attributed solely to the measures assessed here, by ensuring a cost effective transition in more smoothly functioning markets, these beneficial social effects stand a much increased chance of being realised and retained.
7.Comparison of the options
Taking into account the impacts of the options and the assessment presented in Section 6, the following section compares the different options against each other using, the baseline scenario as the reference and applying the following criteria:
-Effectiveness: the options proposed should first and foremost be effective and thus be suitable to addressing the specified problem;
-Efficiency: this criterion assesses the extent to which objectives can be achieved at the least cost (benefits versus the costs).
The tables provide a summary of the assessment of the policy options against these criteria. The options are measures against the criteria applied for the assessment of the impacts specified for options developed to address each Problem Area (See Sections 6.1, 6.2, 6.3 and 6.4 respectively) and the comparison of the options below. Each policy option is rated between "---" (very negative), 0 (neutral) and "+++" (very positive).
The options are not compared here on the basis of their coherence with parallel initiatives. The design of the baseline already assures that all option are compatible with parallel initiatives. In particular, the baseline in the present impact assessment ensures that under all investigated options, the RES E targets (as well as other policy targets) are met. Consequently, comparing options on the basis of their compatibility with the RED II initiative is meaningless.
7.1.Comparison of options for adapting market design for the cost-effective operation of variable and often decentralised generation, taking into account technological developments
All options, except for Option 0 (baseline scenario) can contribute to achieving to a degree the objective of adapting the market design to make it suitable for the cost-effective operation of variable, often decentralised generation of electricity and capture some of the potential social welfare and environmental opportunities (e.g. lower wholesale electricity prices; incentivise the increase of low carbon electricity generation). However, the effectiveness and efficiency of the different options, as well as their impact, vary significantly.
Table 25: Summary of assessment of policy options
|
Criteria →
---------
Options ↓
|
Effectiveness
|
Efficiency
|
Impacts
|
|
|
|
|
Economic impact
|
Impact on stakeholders
|
Impact on business and public authorities
|
|
Policy Option 0 (Baseline)
|
0
|
0
|
0
|
0
|
0
|
|
Policy Option 1(a) (level playing field)
|
+
|
+
|
+
|
-
|
-
|
|
Policy Option 1(b) (strengthening short-term markets)
|
++
|
++
|
++
|
--
|
--
|
|
Policy Option 1(c) (demand response/ distributed resources )
|
+++
|
++
|
+++
|
--
|
--
|
|
Policy Option 2
(fully integrated markets)
|
+++
|
+++
|
++
|
---
|
---
|
Source: DG ENER
In summary:
Option 0 (baseline scenario): will fall short in providing for the adaptation of the market design to the new realities of the interconnected electricity system and will not allow the internal electricity market to reach its full potential.
Options 1(a) (level playing field), 1(b) (strengthening short-term markets) and 1(c) (demand response/distributed resources) reflect an increasing degree of ambition regarding the integration of the national electricity markets, with Option 1(c) building on the packages of measures covered under Options 1(a) and 1(b) and including additional measures. All these options present a compromise between bottom-up initiatives and top-down steering of the market development, without substituting the role of national governments, regulators and TSOs by a centralised and fully harmonised system. Option 1(a) and Option 1(b) are significantly more efficient than Option 0 but cannot be expected to fully meet the specific objectives, given that these options do not cover measures for including additional resources (i.e., demand response, distributed RES E and storage) in the electricity markets to further increase the flexibility of the electricity system and the resources for the TSOs to manage it. The value of these additional resources for the efficient operation of decarbonised electricity markets and hence for the energy transition should not be underestimated. Option 1(c) provides a more holistic, effective and efficient package of solutions and has the added value that it will not lead to significant additional impacts on stakeholders or on businesses and public authorities. Indeed, while Option 1(c) may lead to additional administrative impacts for Member States and competent authorities regarding the implementation and monitoring of the measures, these impacts will be offset by lower barriers to entry to start-ups and SMEs, by the benefits to market parties from more stable regulatory frameworks and new business opportunities as well as by the benefits to consumers from more competition and access to wider choice.
As regards Option 2 (fully integrated market), while having advantages in terms of lower coordination requirements (i.e., a fully integrated EU-market can be operated more efficiently), the results of the assessment indicate that the move towards a more integrated European approach has less significant economic added value since most of the benefits will have already been reaped under the regional, more decentralised approach under Option 1(c) (demand response/distributed resources). Moreover, Option 2 (fully integrated market) has the disadvantage of requiring significant changes to established practices, systems and processes and hence a significant impact on stakeholders, businesses, Member States and competent authorities. Such profound changes of national competences in favour of centralised powers "across the board" would also raise serious questions concerning the subsidiarity of the measure. Therefore, in view that for Option 2 (fully integrated market) the efficiency gains are not significantly higher compared to Option 1(c) (demand response/distributed resources) but the impacts and required changes to national competences much greater, it appears disproportionate and not the most appropriate option at the current stage of development of the internal electricity market.
In the light of the previous assessment, the preferred option would be Option 1(c) (pulling demand response and distributed resources in the market) (which encompasses Options 1(a) (level playing field) and 1(b) (strengthening short-term markets). This option is the best in terms of effectiveness and, given its impacts, has been demonstrated to be the most efficient as well as consistent with other policy areas.
This preferred Option has large support among stakeholders. No support exists for retaining the status quo (i.e. Option 0 or 0+) whereas Option 2 (fully integrated market) was generally deemed a step too far. It is noted that hesitations by stakeholders on aspects of the preferred option, such as the removal of priority dispatch provisions under Option 1(a) (level playing field), are based on the notion that this should go hand in hand with a reform rendering the market more adapted to RES E resources, which is what is foreseen under Option 1(b) (strengthening short-term markets) and Option 1(c) (demand response/distributed resources).
7.2.Comparison of Options for facilitating investments in the right amount and in the right type of resources for the EU
All options, except for Option 0 (baseline scenario), can improve the overall cost-efficiency of the electricity sector and contribute towards achieving the objective of facilitating investments in the right amount and in the right type of resources for the EU. However, the effectiveness and efficiency of the different options, as well as their viability and impact, vary significantly.
Table 26: Summary of assessment of policy options
|
Criteria →
---------
Options ↓
|
Effectiveness
|
Efficiency
|
Impacts
|
|
|
|
|
Economic impact
|
Impact on stakeholders
|
Impact on business and public authorities
|
|
Policy Option 0 (Baseline scenario)
|
0
|
0
|
0
|
0
|
0
|
|
Policy Option 1 (Reinforced energy-only market without CMs)
|
+
|
+
|
+
|
+/-
|
-
|
|
Policy Option 2 (reinforced energy-only market + EU adequacy assessment for CMs)
|
+
|
+
|
+
|
+
|
+
|
|
Policy Option 3 (reinforced energy-only market + EU adequacy assessment for CMs + EU framework on cross-border participation CMs)
|
++
|
++
|
++
|
++
|
++
|
Source: DG ENER
In summary:
Option 0 (baseline scenario), which would assume the existence of national capacity mechanisms without coordination at EU-level will fall short of achieving the specific objectives of improving market functioning to reduce the need to have recourse to state intervention and of ensuring that state-interventions, where needed, are more coordinated, efficient and compatible with the EU's internal energy market.
Option 1 (reinforced energy-only market without CMs) can improve the overall cost-efficiency of the electricity sector significantly. The analysis shows that undistorted energy-only markets increase overall system efficiency as make sure that resources are better utilized across the borders, demand can better participate in markets, and renewables can be better integrated into the system without additional need for subsidies. This will in turn decrease the need for capacity mechanisms (which are often introduced as a reaction to markets which do not produce correct price signals due to state interventions).
The analysis also shows that reinforced energy-only markets can in principle provide the right signals for market operation and ensure resource adequacy. Option 1 also has slightly more positive environmental impacts than any of the other options.
However, markets are still characterised by manifold regulatory distortions today, and removing the distortive effects will not be possible with immediate effects in many Member States. The observation that undistorted markets can provide the necessary investment signals has therefore to be weighed against the observation that a significant transition time to phase out the existing distortions will be necessary. Furthermore, some national distortions (e.g. resulting from differences in taxation) cannot be addressed by a reform of energy law and are therefore likely to continue.
Investors also do not have perfect foresight of market conditions, and confidence that they will not be distorted for the economic lifetime of their investments. Such certainty is increasingly difficult to find, often due to uncertainty as to the regulatory measures that could be taken in the future that may supress prices and reduce the load factors of plants compared to the assumptions made when the investment decision is taken. In a market that requires more and more varied sources of funding that in many cases are competing with other, non-electricity, projects for capital, relying solely on the energy price as a basis for investment is not always easy. Uncertainty about future policy developments or the perception thereof can create 'missing money' that may require addressing.
The legislator should also take into account that the level of interconnection is markedly different among Member States. This militates for a more nuanced approach than a straightforward EU-wide prohibition of CMs.
In this perspective, not allowing Member States to introduce any type of CMs would mean that Member States would be prevented from addressing adequacy concerns with CMs. As those concerns might be legitimate, this option is not considered to be appropriate.
But, as developed in Chapter 2.2.1 undistorted energy price signals are fundamental irrespective of whether generators are solely relying on energy market incomes or also receive capacity payments. Therefore the measures aimed at removing distortions from energy-only markets discussed under Option 1 (e.g. scarcity pricing or reinforced locational signals) are 'no-regrets' and assumed as being integral parts of Options 2 (CMs + EU adequacy assessment) and 3 (CMs + EU framework on cross-border participation)..
When compared with the baseline, Option 2 (CMs + EU adequacy assessment) can improve the overall cost-efficiency of the electricity sector as significant savings can be achieved through establishing an EU-wide approach to resource adequacy assessments as opposed to national-based adequacy assessments. At the same time Option 2 does not allow reaping the full benefits of cross-border participation in CMs.
Option 3 (CMs + EU framework on cross-border participation) (which includes the market reforms under Option 1 and the regional assessment under Option 2) goes beyond Option 2 as it proposes additional measures to avoid fragmentation of CMs. This would achieve significant additional net benefits when compared with Option 2. This is because it makes sure that foreign resource providers can effectively participate in national capacity mechanisms and avoids competition and market distortions resulting from capacity payments which are reserved to domestic participants. By remunerating foreign resources for their services this option reduces investment distortions that might be present in Option 2 as a result from uncoordinated approaches to cross-border participation.
In view of the assessment above, Option 3 (CMs + EU framework on cross-border participation) (encompassing options 1 and 2) is the preferred option.
This preferred Option has large support among stakeholders. There is almost a consensus amongst stakeholders on the need for a more aligned method for generation adequacy assessment. A majority of stakeholders support the idea that any legitimate claim to introduce CMs should be based on a common methodology. When it comes to the geographical scope of the harmonised assessment, a vast majority of stakeholders call for regional or EU-wide adequacy assessments, while only a minority favour a national approach. There is also support for the idea to align adequacy standards across Member States. Stakeholders clearly support a common EU framework for cross-border participation in CMs.
Most stakeholders including Member States agree that a regional/ European framework for CMs is preferable. Member States, however, might want to keep a large degree of freedom when proposing a CM. They might claim that beyond a revamped regional/ EU generation adequacy assessment, there is legitimacy for a national assessment based on which they can claim the necessity of their CM. Similarly Member States might instinctively want to rely more on national assets and favour them over cross-border assets.
7.3.Comparison of options for improving Member States' reliance on each other in times of system stress and reinforcing coordination between Member States for preventing and managing crisis situations
All options, except for Option 0 (baseline scenario), can contribute to achieve the objective of improving Member State's reliance on each other in times of system stress and reinforcing their coordination and cooperation at times of crisis situation. However, the effectiveness and efficiency of the different options, as well as their viability and impact, vary significantly.
Table 27: Summary of assessment of policy options
|
Criteria →
---------
Options ↓
|
Effectiveness
|
Efficiency
|
Impacts
|
|
|
|
|
Economic impact
|
Impact on stakeholders
|
Impact on business and public authorities
|
|
Policy Option 0 (Baseline scenario)
|
0
|
0
|
0
|
0
|
0
|
|
Policy Option 1
(Common minimum EU rules)
|
++
|
++
|
+
|
+
|
0/-
|
|
Policy Option 2
(EU rules + regional cooperation)
|
+++
|
+++
|
++
|
++
|
0/-
|
|
Policy Option 3
(Full harmonisation)
|
+++
|
--
|
+
|
+
|
0/--
|
From the point of view of impacts, particularly costs and administrative impact, Option 1 (Common minimum EU rules) could in principle appear as preferred option. However, the performance in terms of effectiveness and efficiency is limited compared to Option 2 (EU rules + regional cooperation) and Option 3 (Full harmonisation). Additionally, impacts associated with Option 3 (Full harmonisation) are neither proportionate nor fully justified by the effectiveness of the solutions, which makes Option 3 (Full harmonisation) perform poorly in terms of efficiency compared to Option 2 (EU rules + regional cooperation).
Overall, the more harmonized approach to security of supply through minimum rules pursued by Option 1 (Common minimum EU rules) would not solve all the problems identified, in particular, the uncoordinated planning and preparation ahead of a crisis. As regards Option 1 (Common minimum EU rules), the main drawback of this approach is that each Member State would be drafting and adoption the national risk preparedness plans under its own responsibility. While the regionally coordinated plans with crisis scenarios identified at regional level and the agreement of some aspects of the plan (e.g. load shedding plan) in a regional context, aim at ensuring that all regional specificities are fully considered. Given the urgency to enhance the level of protection against cyber threats and vulnerabilities, it must be concluded that Option 1 (Common minimum EU rules) regarding cybersecurity is not recommended, because it is not viable for reaching the policy objectives, given that the effectiveness would depend on whether the voluntary approach would actually deliver a sufficient level of security.
Option 2 (EU rules + regional cooperation) addresses many of the shortcomings of Option 1 (Common minimum EU rules) providing a more effective package of solutions. In particular, the regionally coordinated plans ensure the regional identification of risks and the consistency of the measures for prevention and managing crisis situations. For cybersecurity this option creates a harmonised level of preparedness in the energy sector and ensures that all players have the same understanding of risks and that all operators of essential services follow the same selection criteria for the energy sector throughout Europe.
Overall, Option 3 (Full harmonisation) represents a highly intrusive approach that tries to address possible risks by resorting to a full harmonisation of principles and the prescription of concrete solutions. For example, the preparation of risk preparedness plans at regional level ensures full coherence of actions ahead and during a crisis. However, the major limitation is that national specificities could not be addressed through regional plans. The detailed "emergency rulebook" with an exhaustive list of measures would also reduce the room of manoeuvre of Member States to tackle local problems. The creation of a dedicated agency on cybersecurity at EU level would be also a costly solution. The assessment of impacts in Option 3 (Full harmonisation) shows that the estimated impact on cost is likely to be high and looking at the performance in terms of effectiveness, it makes Option 3 (Full harmonisation) a disproportionate and not very efficient option.
In the light of the previous assessment, the preferred option would be Option 2 (EU rules + regional cooperation). This option is the best in terms of effectiveness and, given its economic impacts, has been demonstrated to be the most efficient as well as consistent with other policy areas.
This preferred Option has large support among stakeholders. The majority of stakeholders are in favour of regional coordination of risk preparedness plans and ex-ante cross-border agreements to ensure that markets function as long as possible in crisis situations. No support exists for retaining the status quo (i.e. Option 0 or 0+), as stakeholders agree that the current framework does not offer sufficient guarantees that electricity crisis situations are properly prepared for and handled in Europe. Option 3 (Full harmonisation) was deemed a step too far; stakeholders did not support a fully harmonised approached based on rulebooks.
7.4.Comparison of options for addressing the causes and symptoms of weak competition in the energy retail market
Although there is a significant level of uncertainty in quantifying the benefits of the options in this Problem Area, all options, except for Option 0 (baseline scenario), are expected to improve retail competition. However, the anticipated effectiveness and efficiency of the different options vary markedly.
Table 28: Summary of assessment of policy options
|
Criteria →
---------
Options ↓
|
Effectiveness
|
Efficiency
|
Impacts
|
|
|
|
|
Economic impact
|
Impact on stakeholders
|
Implementation costs
|
|
Policy Option 0 (Baseline scenario)
|
0
|
0
|
0
|
0
|
0
|
|
Policy Option 0+ (Non-regulatory approach)
|
+
|
+++
|
+
|
+/0
|
-
|
|
Policy Option 1 (Flexible legislation)
|
+++
|
++
|
+++
|
+++/--
|
--
|
|
Policy Option 2 (Harmonization and extensive consumer safeguards)
|
+++ / ++
|
-
|
+++ / ++
|
++/---
|
---
|
Option 0+ (Non-regulatory approach) can be expected to lead to modest, albeit tangible, economic benefits primarily as a result of the voluntary phase-out of regulated prices in some Member States and the drive to tackle illegal switching costs. Given its low implementation costs, it is a highly efficient option. And the few stakeholders that will be affected will be affected positively. However, the effectiveness of Option 0+ is significantly limited by the fact that non-regulatory measures are not suitable for tackling the poor data flow between retail market actors that constitutes both a barrier to entry and a barrier to higher levels of service to consumers. In addition, shortcomings in the existing legislation make it impossible to significantly improve consumer engagement and energy poverty. They also introduce great uncertainty around the drive to phase out price regulation.
Option 1 (Flexible legislation) would probably lead to substantial economic benefits. Retail competition would be improved as a result of the definitive phase-out of blanket price regulation, non-discriminatory access to consumer data, and increased consumer engagement. In addition, consumers would see direct benefits through improved switching. And the energy poor would be better protected, leading to knock-on benefits to the broader economy. Given that Option 1 would entail moderate implementation costs (these stem primarily from ensuring a standardised format for consumer data, and the various burdens associated with improving consumer engagement) it is an efficient option as these costs are considerably outweighed by the benefits. Many stakeholder groupings are likely to be positively and negatively affected by the collection of policy measures in Option 1. But none would bear a disproportionate burden that would not be offset by commensurate benefits. Likewise, the proposed measures in Option 1 respect the principle and limits of subsidiarity.
Option 2 (Harmonization and extensive consumer safeguards) would also lead to substantial economic benefits, albeit with a greater degree of uncertainty over the size of these benefits. This uncertainty stems from the tension some of the measures in Option 2 may have with competition (stronger disconnection safeguards, an outright ban on all switching-related charges), and from the difficulty of prescribing EU-level solutions in certain areas (defining exceptions to price deregulation, implementing a standard EU bill design). Whilst a single EU data management model would be just as effective and easier to enforce, and whilst the energy poor would be even better protected by the stronger safeguards proposed, the high implementation cost of these measures would reduce the efficiency of Option 2 compared with Option 1. Disconnection safeguards may be better designed by Member States to ensure synergies between national social services. As social policy is a primary competence of Member States, Option 2 may go beyond the boundaries of subsidiarity. Finally, many stakeholders will be affected by the collection of policy measures in Option 1, both positively and negatively. Suppliers and DSOs in particular would face significant burdens that they would at least partially pass on to consumers i.e. socialise.
In the light of the analysis, the preferred option is Option 1 (Flexible legislation). This option is most likely to be the most effective, is efficient, and is consistent with other policy areas.
Most stakeholders would support (or at least be indifferent to) the measures in preferred Option 1 (Flexible legislation). This is due to the fact that a flexible legislative approach allows the problems identified to be largely addressed while accommodating: 1) the broad range of national differences that still exist in retail markets for energy; and 2) the specific concerns aired in the stakeholder outreach. Nevertheless, some Member States practising blanket price regulation will likely oppose a phase out of this, and industry associations representing energy suppliers have stated that they would not welcome any EU legislation addressing the content of bills.
Almost no support exists for retaining the status quo (i.e. Option 0) or for tackling the issues in the Problem Area through soft law (Option 0+), except for isolated instances already mentioned. Several measures in Option 2 (Harmonization and extensive consumer safeguards) were generally deemed a step too far by a number of stakeholders, including stakeholders such as ACER, or NRAs who represent the interest of the public.
7.5.Synergies, trade-offs between Problem Areas and sequencing
The measures considered in this impact assessment are highly complementary. Most of the different Options considered in each Problem Area would reinforce the effect of options in other Problem Areas, with little trade-offs between the different areas.
7.5.1.Synergies
The measures to make intraday and balancing markets more flexible such as pursued under Problem Area I, in particular Option 1(b) (strenghening short-term markets) and Problem Area II , Option 1 (reinforced energy-only market) will foster a price signal that better reflects the value of electricity, notably when it is scarce. It will hence provide a price signal benefical for flexible resources, in particular demand response and storage and improve the business case for innovative assets and service models to enter the market as assessed under Problem Area I Option 1(c) (demand response/distributed resources). It will also reinforce liquidity and competition in the electricity wholesale electricity markets. As choice on the wholesale market is a pre-condition for more competition on retail markets, more liquid wholesale markets will also contribute to improving competition in retail markets (Problem Area VI).
Helping RES E resources to be remunerated through the market as fostered with the measures under Problem Area I will ultimately reduce the high level of taxes and levies currently necessary to drive RES E deployment, decreasing overall system costs and making energy more affordable compared with a scenario where markets remain poorly adapted to RES E.
The measures proposed to improve the functioning of the electricity markets as discussed under Problem Areas I and II, in particular Option 1 (reinforced energy market/No CMs), will also lead to a more robust formation of price signals. Robust price signals will reduce the need for assets to be remunerated by alternative revenue streams to be a credible investment opportunity or avoid its decommissioning and hence reduce the need for government intervention in the form of CMs or otherwise to ensure resource adequacy such as discussed under Problem Area II, Option 3. Moreover, the measures assessed Problem area II, in particular the preferred Option 3 will reduce market distorition caused by genuinly justifed CMs and improve the ability of the market to operate optimally. In other words, improving the energy markets will reduce the need for governement intervention to ensure investments in electricity resources.
Measures to improve retail competition, consumer engagement and data handling as fostered with the measures under Problem Area IV (Retail markets) will increase system flexibility as targeted by the measures under Problem Area I, in particuler Option 1(c) (pulling demand response and distributed resources into the market). This is because the majority of untapped demand response potential originates from smaller consumers and because retail price regulation can have a detrimental effect on the deployment of innovative consumer products such as dynamic price supply contracts.
Improving the market in its ability to renumerate (in particular, flexible) resources and removing the distortions that prevent resources to reacte to proper price signals (such as those aimed at in Problem I area I and Option 1 of Problem Area II) will overall improve the robustness of the system to satisfy demand at all times and, hence, the freqeuncy and overall number of hours that recourse has to be taken to out-of-market measures to operate the system, such as the demand curtailment, as discussed under Problem Area III (Crisis situations).
Phasing out price regulation as fostered with the measures under Problem Area IV (particularly in Member States with very low retail margins) will help address the high levels of electricity and gas consumption caused by artificially low prices and provide an accurate price signal for energy efficiency investments that would ultimately mitigate the effects of security of supply events as targeted by the measures under Problem Area III (Crisis situations). Removing price regulation will also allow for a more flexible organisation of the market and increase the incentives to participate in the market through demand response as fostered by the measures assessed un Problem Area I. Option 1(c) (pulling demand response and distributed resources into the market)
Measures to improve retail competition as discussed under Problems Area IV, will ensure that all benefits, including those expected under Problem Areas I, II and III are transferred to end-consumers, ultimately increasing the beneficial effects on social welfare and competiveness.
Overall, market improvement measures will address increasing energy poverty as discussed in Problem Area IV. Indeed, one of the three main drivers of energy poverty has been the gradual increase in retail prices.
Measures to ensure a common approach to crisis prevention and management as is the objective under Problem Area III avoid unduly interventions in market functioning. Better preparedness, transparency and clear rules on crisis management will build trust between Member States to rely on the internal electicity market for resource adequacy, helping the achievement of the objectives under Problem Area II. By imposing obligations to cooperate and lend assistance, Member States are also less likely to "over-protect" themselves againt possible crisis situations.
7.5.2.Trade-offs
The mesures selected as the preferred option under Problem Area I and II are mutually reinforcing in that they collectively aim at improving market functioning, thereby reducing the need for market gouvernment intervention through CMs, and reducing their distortive effects if nonetheless required. However, scarcity pricing and CMs to a certain degree can be seen as alternative measures to foster investments. Even if CM deployment rules and design principles are ringfenced, the mere fact that resources are also renumerated by CMs means that the effectiveness of scarcity prices to drive investment may be reduced as the number of hours that scarcity occurs and thus the profits that more flexible resources can earn from selling energy in the market is reduced. It needs also to be noted that scarcity prices and CMs (at least in its market-wide version) act differently on investment decision in a crucial manner. Whereas such CMs rewards any capacity, removing barriers for scarcity pricing will improve remuneration of flexible capacity in particular.
The measures assessed under various options in the impact assessment seek to improve the overall flexibilty of the electricity system. However, they do this by employing different means. It can therefore be expected that some trade-offs exist between these options. Improvements in the usage of interconnection capacity (as assessed under Problem Area I, Option 1(b) (strenghening short-term markets)) allow a given plant to exploit variations in production and demand over a larger geographcial area allowing for a more stable intertemporal production pattern of the plant. Improving the usage of interconnection capacity will hence favour the usage of less flexible resources over flexible ones. Similarly, pulling demand response into the market will reduce the profits of generation capacity and, in particular, flexible generation capacity which may amplify the amount of capacity that needs to exit the market into the transition towards 2030. Ultimately, efficient markets should select the most cost-efficient solutions.
Energy poverty safeguards whose costs directly accrue to suppliers – particularly, the costly disconnection safeguards considered in Option 2 (Harmonization and extensive consumer safeguards) of Problem Area IV (Retail markets) – may act as a barrier to retail-level competition, and diminish the associated benefits to consumers, including lower prices, new and innovative products, and higher levels of service. Although the implementation costs of these safeguards will be passed on to consumers, and therefore socialized, different energy suppliers may have different abilities to do this, and to deal with the additional consumer engagement costs. Some may therefore choose not to enter markets with such safeguards in place. A uniform level of such safeguards throughout the market would help create a level playing field and address such competition impacts.
7.5.3.Sequencing of measures
Over all, the synergies between the measures are large and the temporal dependency low, the overall beneficial effects will be achieved only if all measures are implemented as a package.
A sequencing of measures is not necessarily appropriate to establish at EU level. The judgement of moving to a next stage of market development much depends on the development stage of the electricity market at hand. The reality is that Member States are at different, sometimes even very different stages, in the development of their market arrangements. As an example only, as a result of the individual characteristics of national markets, the timing of the phase out of price regulation may differ on a case-by-case basis. This is to enable national authorities to ensure that the necessary prerequisites of a smooth transition are in place before all regulatory interventions in price setting are discontinued. Such prerequisites may include, for example, the number of suppliers in the market, the market share of the largest suppliers, or retail price levels. The same is true for other measures proposed.
The EU legislation ultimately adopted should therefore need to find the appropriate balance between setting out a well-defined endpoint whilst allowing sufficient space for Member States to manage their transition thereon.
8.Monitoring and evaluation
8.1.Future monitoring and evaluation plan
The Commission will systematically monitor the transposition and compliance of the Member States and other actors with the finally adopted measures and take enforcement measures if and when required and report on the progress made in this regard on a regular basis. For this purpose, the Commission will be supported by ACER as described below.
In addition, as it has already done in the context of the implementation of the Third Package, the Commission will provide guidance documents providing assistance on the implementation of the adopted measures.
Parallel to the proposed initiatives, the Commission will bring forward an initiative concerning the governance of the Energy Union that will streamline the monitoring and reporting requirements. Based on the initiative of the governance of the Energy Union, the current monitoring and reporting requirements of Commission and Member States' reporting obligations in the Third Energy Package will be integrated in a horizontal monitoring report. More information on the streamlining of the monitoring and reporting requirements can be found in the impact assessment for the governance of the European Union.
The annual reporting by ACER and the evaluation by the Commission, together with the reporting from the Electricity Coordination Group are part of the proposed initiatives and described in the sections below.
8.2.Annual reporting by ACER and evaluation by the Commission
The monitoring of the proposed initiatives will be carried out following a two tier approach: annual reporting by ACER and an evaluation by the Commission.
8.2.1.Annual reporting by ACER
ACER's duties
under the Third Package include the monitoring of and reporting on the internal electricity market. ACER prepares and publishes an annual market monitoring report that tracks the progress of the integration process and the performance of electricity markets and identifies any barriers to the completion of the internal electricity retail and wholesale markets.
The sources of data on which ACER relies to compile its annual market monitoring report are: the Commission, NRAs, ENTSO-E, the Bureau Européen des Unions de Consommateurs (BEUC) and other relevant organisations. ACER's annual report is based on publicly available information and the information provided by these entities.
Based on the present proposals, ACER will continue to monitor and report on the internal electricity market on an annual basis after the adoption of the proposals. ACER's annual reporting will replace the Commission's reporting obligations that are currently still existing under the Electricity Directive. The present proposals also foresee extending ACER's monitoring mandate to include matters related to security of supply.
8.2.2.Evaluation by the Commission
The Commission will carry out a fully-fleged evaluation of the impact of the proposed initiatives, including the effectiveness, efficiency, continuing coherence and relevance of the proposals, within a given timeline after the entry into force of the adopted measures (indicatively, 5 years).
In the context of this evaluation, the Commission will pay particular attention as to whether the assumptions underlying its analyses in the present impact assessment were valid.
The evaluation report will be developed by the Commission with the assistance of external experts, on the basis of terms of reference developed by the Commission services. Stakeholders will be informed of and consulted on the evaluation report, and they will also be regularly informed of the progress of the evaluation and its findings. The evaluation report will be made public.
8.3.Monitoring by the Electricity Coordination Group
The Electricity Coordination Group will be also a tool to monitor developments in the internal electricity market and in particular as regards security of supply more closely. To this end a concrete mandate will be given to the Electricity Coordination Group, in particular to monitor the security of supply in the EU on the basis of a set of indicators (e.g. EENS, LoLE) and regular outlooks and reports produced by ENTSO-E.
8.4.Operational objectives
The key objective of the present initiative is to make electricity markets more secure, efficient and competitive whilst ensuring that electricity is generated in a sustainable way and remains affordable to all. The operational objectives for the preferred options are listed as follows:
Problem Area I (market design not fit for an increasing share of variable decentralised generation and technological developments):
-Adoption of measures directed at removing market distortions deriving from the different treatment to generation from different sources;
-Adoption of measures aiming at providing for liquid and better integrated short-term markets;
-Adoption of measures directed at removing barriers preventing demand response from participating in energy and reserve markets;
-Adoption of measures aiming at strengthening the role of ACER, clarifying the role of NRAs at regional level, criteria for enhancing ENTSO-E's transparency and monitoring obligations, rules for formalising the role of DSOs at European level.
Problem Area II (uncertainty about sufficient future generation investments and uncoordinated capacity markets):
-Adoption of measures aiming at improving the price signals of the electricity markets;
-Specific requirements to align national CMs by requiring ENTSO-E to propose a methodology for an EU-wide resource adequacy assessment and requiring Member States to rely on the assessment.
-Adoption of rules aiming at enhancing the compatibility between CMs.
Problem Area III (reinforce coordination between Member States for preventing and managing crisis situations):
-Adoption of measures aiming at improving risk assessment and preparedness;
-Adoption of rules aiming at improving coordination in emergency;
-Adoption of measures aiming at improving transparency and information sharing.
Problem Area IV (retail markets):
-Adoption of measures aiming at reducing regulatory intervention in retail price setting;
-Adoption of measures aiming at protecting energy poor and vulnerable consumers;
-Adoption of measures directed at removing barriers to market entry for new supply and service companies;
-Adoption of measures aimed at increasing consumer engagement and choice.
8.5.Monitoring indicators and benchmarks
As of 2021, ACER will be invited to review its current monitoring indicators with a view to ensure their continuing relevance for monitoring progress towards the objectives underlying the present proposals. ACER will continue relying on the same sources of data used for the preparation of the market monitoring report. It will be tasked to cover in that report the security of supply dimension as well. Monitoring indicators could include:
Problem Area I (market design not fit for an increasing share of variable decentralised generation and technological developments):
-Indicators relating to market and regulatory barriers that affect the level playing field between market participant and types of resources, such as the degree of capacity dispatched - fully, partially or not at all - on the basis of price signals only, and the usage of market and non-market based curtailment;
-Indicators related to the degree of flexibility available within the electricity system and the development of intraday and balancing markets, such the level of market liquidity in intraday and balancing markets and the allocation and use of cross-border capacity for these time-frames, and related efficiency gains;
-Indicators related to the participation of distributed resources and demand in the market (including use from system operators), energy service operators such as aggregators and barriers to market participation. Such for example, the capacity and production by distributed RES E and storage, the capacity of demand response available and its activation, the number of facilities and their capacity operated by aggregators;
-Indicators related to consumer access to smart metring systems, their functionalities and availability/uptake of dynamic electricity pricing contracts;
-Indicators related to the evaluation of the performance by ACER, ENTSO-E and NRAs of their duties.
Problem Area II (uncertainty about sufficient future generation investments and uncoordinated capacity markets):
-Indicators pointing to the effectiveness of market arrangements in providing locational signals and reflecting the value of electricity, also in times of scarcity, such as the extent to which market prices have been contrained by any implicit or explict limits on prices, levels of investment and correlation with price in different bidding zones.
-State interventions to support resource adequacy and their interaction with the EU's electricity markets, such as their incidence, design features and degree of participation of cross-border capacity;
Problem Area III (reinforce coordination between Member States for preventing and managing crisis situations):
-Indicators for monitoring security of supply, such as expected energy non-served (EENS) and loss of load expectation (LoLE);
-In the case that electricity crisis situations occur, the lessons learnt from these stress situations should also feed in the analysis of security of supply.
Problem Area IV (retail markets):
-The incidence of regulated prices and the progress towards their phase-out;
-Market developments regarding consumer switching, switching facilitation such as switching rates, costs and incidence of price and non-price barriers to switching.
-Key performance indicators measuring the economic and technical effectiveness of DSOs and impact on system users (level of distribution charges).
9.Glossary and Acronyms
ACER
The Agency for the Cooperation of Energy Regulators, a European Union Agency that was created by the
Third Energy Package
to further progress the completion of the internal energy market both for electricity and natural gas.
ACER Regulation:
Regulation (EC) No 713/2009 of the European Parliament and of the Council of 13 July 2009 establishing an Agency for the Cooperation of Energy Regulators, OJ L 211, 14.8.2009, p. 1–14.
Adequacy
(Resource) adequacy can be defined as the ability of the system to meet the aggregate power and energy requirements of all consumers at virtually all times. In this impact assessment the term resource adequacy is favoured over other terms often used in this context, such as generation or system adequacy
aFFR
See FFR
Aggregator
A service provider that combines multiple consumer loads (flexibility or energy) and/or supplied energy units for sale or auction in organised energy markets.
Ancillary Services:
Services necessary to support the transmission of capacity and energy from resources to loads while maintaining reliable operation of the transmission service provider. They refer to a range of functions which TSOs contract so that they can guarantee system security. These include services like the provision of mFFR and aFFR or reactive power.
Balancing
The situation after markets have closed (gate closure) in which a TSO acts to ensure that demand is equal to supply, in and near real time.
Balancing Guideline
Commission Regulation establishing a Guideline on Electricity Balancing, one of the legal acts to be adopted under Article 18 of the Electricity Regulation.
Balancing reserves
All resources, if procured ex ante or in real time, or according to legal obligations, which are available to the TSO for balancing purposes.
BAU
Business As Usual, i.e. the state of the world if no additional action is taken.
Bidding zone
A bidding Zone means a geographical area within which electricity market wholesale prices are uniform and market participants not have to take into account grid constraints. Market participants who wish to buy or sell electricity in another bidding zone have to take into account grid constraints and related congestion rent payments.
BRPs
Balance responsible parties, such as producers and suppliers, keep their individual supply and demand in balance in commerical terms.
BSPs
Balancing Service Providers, such as generators or demand facilities, balance-out unforeseen fluctuations on the electricity grid by rapidly increasing or reducing their power output.
CACM Guideline
Guideline on Capacity Allocation and Congestion Management, one of the legal acts adopted under Article 6 of the Electricity Regulation.
CCGT
Combined Cycle Gas Turbine, a common type of gas-fired generation plant
CEEE
Central Eastern European Electricity Forum, a platform for cooperation between certain EU Member States.
CERT
Computer Emergency Response Team.
CHP
Combined Heat and Power units produce heat and electricity simultaneously. Their production of electricity is not necesarrily deterined only by prices for electricity.
CM
Capacity Mechanism, a regulatory intervention that remunerates the availability of electricity resources instead of the production of electricity (or the avoidance of electricity consumption).
Congestion
Means a situation in which an interconnection linking national transmission networks cannot accommodate all physical flows resulting from international trade requested by market participants, because of a lack of capacity of the interconnectors and / or the national transmission systems concerned.
Conventional generation
The non-low carbon technologies, based on fossil fuels (lignite, hard coal, natural gas, oil). They usually constitute the mid-range and peaking plants.
Cross-zonal transmission capacity:
The capability of the interconnected system to accommodate energy transfers between bidding zones.
CSIRT
Computer Security Incident Response Team.
CT
Comparison Tools, websites that help consumers to compare different offers in the market.
Curtailment
Curtailment means a reduction in the scheduled capacity or energy delivery.
Day-ahead market
The market timeframe where commercial electricity transactions are executed the day prior to the day of delivery of traded products.
DER
Distributed Energy Resources, a generic term referring electricity assets such as small-scale RES E, storage connected to distribution grids or by end-consumers on their premises.
Digital Single Market
EU policy strategy aimed at: (i) helping to make the EU's digital world a seamless and level marketplace to buy and sell; (ii) designing rules which match the pace of technology and support infrastructure development; and (iii) ensuring that Europe's economy, industry and employment take full advantage of what digitalisation offers.
DR
Demand (side) response, the ability of consumers of electricity to actively adapt their consumption to market conditions.
DSO
Distribution System Operator, the entity that operates, maintains and develops the low voltage networks in a given area to which most consumers are connected.
ECG
The Electricity Coordination Group was created in 2012 by Commission Decision of 15 November 2012. The Group is a platform for the exchange of information and coordination of electricity policy measures having a cross-border impact. It also aims to facilitate the exchange of information and cooperation on security of electricity supply, including the coordination of action in case of an emergency within the Union.
EE
Energy Efficiency Directive. Directive 2012/27/EU of the European Parliament and of the Council of 25 October 2012 on energy efficiency, amending Directives 2009/125/EC and 2010/30/EU and repealing Directives 2004/8/EC and 2006/32/EC. This directive establishes a set of binding measures to help the EU reach its 20% energy efficiency target by 2020.
EEAG
Communication from the Commission - Guidelines on State aid for environmental protection and energy 2014-2020, OJ C 200, 28.6.2014, p. 1–55. The Guidelines aim to help Member States design state aid measures that contribute to reaching their 2020 climate targets. The guidelines will be in force until the end of 2020.
EENS
Expected Energy Non Served, a metric to measure security of supply and to set a reliability standard.
EESC
The European Economic and Social Committee.
Electricity Directive
Directive 2009/72 of the European Parliament and of the Council of 13 July 2009 concerning common rules for the internal market in electricity and repealing Directive 2003/54/EC, OJ L 211, 14.8.2009, p. 55–93. Together with the Electricity Regulation, the Electricity Directive sets the main parts of the legal framework for the EU's electricity markets.
Electricity Regulation
Regulation (EC) No 714/2009 of the European Parliament and of the Council of 13 July 2009 on conditions for access to the network for cross-border exchanges in electricity repealing Regulation (EC) No 1228/2003, OJ L 211, 14.8.2009, p. 15–35. Together with the Electricity Directive, the Electricity Regulation sets the main parts of the legal framework for the EU's electricity markets.
End-customer
End-customers procure electricity for their own use.
ENTSO-E
European Network of Transmission System Operators for Electricity. ENTSO-E was established and given legal mandates by Third Package.
ENTSO-G
European Network of Transmission System Operators for Gas. ENTSOG was established and given legal mandates by Third Package.
EPBD
Energy Performance of Buildings Directive or Directive 2010/31/EU of the European Parliament and of the Council of 19 May 2010 on the energy performance of buildings. OJ L 153, 18.6.2010, p. 13–35, concerning energy efficiency of building. Modifications are being proposed to the EPBD.
ETS
Emmission Trading System, works on the 'cap and trade' principle. A
'cap', or limit
, is set on the total amount of certain greenhouse gases that can be emitted by the factories, power plants and other installations in the system. The cap is reduced over time so that total emissions fall. This policy instrument equally fosters penetration of RES E as it renders production of electricity from non- or less-emitting generation capacity more economical.
EU Target Model:
Term refering to the current design of the EU's electricity markets. The EU target model is based on two broad principles: (i) the development of integrated regional wholesale markets, preferably established on a zonal basis, in which prices provide important signals for generators' operational and investment decisions; and (ii) market coupling based on the so-called "flow-based" capacity calculation, a method that takes into account that electricity can flow via different paths and optimises the representation of available capacities in meshed electricity grids.
EUCO27
The central policy scenario modelled by PRIMES, reflecting the agreed 2030 climate and energy targets (and the 2050 EU's decarbonisation objectives).
FCR
Frequency Containment Reserve are reserves from reserve providers (generators, storage, demand response) used by TSOs to maintain frequency stable in the whole synchronous area (e.g. continental Europe). This category typically includes automatically activated reserves with the activation time up to 30 seconds.
Florence Forum
The
Florence Forum
was set up to discuss the creation of a true internal electricity market in Europe. The participants are national regulatory authorities, Member States, the European Commission, international organisations in the area of energy and European-wide associations representing transmission and distribution system operators, electricity traders, consumers, network users and power exchanges.
FRR
Frequency Restoration Reserve are reserves from reserve providers (generators, storage, demand response) used by TSOs to restore system frequency and power balance after sudden system imbalance occurrence (e.g. the outage of a power plant). Those reserves replace FCR if the frequency deviation lasts longer than 30 seconds. This category includes operating reserves with an activation time typically between 30 seconds up to 15 minutes. FRR can be distinguished between reserves with automatic activation (aFRR) and reserves with manual activation (mFRR).
Gas Directive:
Directive 2009/73 of the European Parliament and of the Council of 13 July 2009 concerning common rules for the internal market in gas and repealing Directive 2003/55/EC, OJ L 211, 14.8.2009, p. 94–136. Together with the Gas Regulation, the Gas Directive sets the main parts of the legal framework for the EU's gas markets.
Gas Regulation:
Regulation (EC) No 715/2009 of the European Parliament and of the Council of 13 July 2009 on conditions for access to the natural gas transmission networks and repealing Regulation (EC) No 1775/2005, OJ L 211, 14.8.2009, p. 36-54. Together with the Gas Directive, the Gas Regulation sets the main parts of the legal framework for the EU's gas markets.
Gate closure
The moment when contracts are frozen. After gate closure, no trading is allowed anymore. At this point, parties are expected to adhere to the physical data submitted to the System Operator and to the contracted volumes submitted before Gate Closure.
G-charges
Charges for network usage imposed on generators
Generator
A generator produces electricity and sells this to suppliers or end-customers
Independent aggregator
Aggregator that is not affiliated to a supplier or any other market participant.
ITC Regulation
Commission Regulation (EU) No 838/2010 of 23 September 2010 on laying down guidelines relating to the inter-transmission system operator compensation mechanism and a common regulatory approach to transmission charging
LFC block
Load-Frequency Control block or balancing zone, defines the size of the network area for which the balancing reserves are being procured.
Load
The total electricity demand
Load Payments
Load Payments correspond to the amount of money retail companies/consumers need to pay to generators for the electricity bought from the wholesale market. For each hour, it corresponds to the product of served demand with the electricity price.
LoLE
Loss of load expectation, a metric to measure security of supply and to set a reliability standard
LTC
Long-term contract.
METIS
A modelling tool used by the Commission, described in more detail in Annex IV.
mFFR
See FFR
NC ER
Network Code on Emergency and Restoration
NEMO
Nominated Electricity Market Operator; an entity designated by competent authroities to perform tasks related to single day-ahead and intraday coupling as defined in the Guideline on Capacity Allocation and Congestion Management, one of the legal acts adopted under Article 6 of the Electricity Regulation.
Electricity network codes and guidelines: a legal act adopted under Articles 6, 8 and 18 of the Electricity Regulation. Examples of such codes and guidelines are the NC ER, the CACM guideline, the RfG, the System Operation Guideline or the Balancing guideline. For a full overview of these network codes and guidelines, reference is made to Annex VII.
NIS Directive
Directive (EU) 2016/1148 of the European Parliament and of the Council of 6 July 2016 concerning measures for a high common level of security of network and information systems across the Union, OJ L 194, 19.07.2016, p. 1-30.
NRAs
National Regulatory Authorities, are national authorties set up and empowered by the Third Package to over see national electricity (and gas) markets.
NTC
Net Transfer Capacity, a metric to measure the capacity available on interconnectors to transfer electricity.
Plan
Risk Preparedness Plans, a measure proposed under Problem Area III
PLEF
Pentalateral Energy Forum, a platform for collaboration consisting of the Ministries, NRAs and TSOs of the BENELUX, DE, FR, AT, CH as well as a market parties platform and the European Commission.
Power exchange
Power exchanges facilitate the trading of electricity at wholesale level, often for delivery the next day or at even shorter intervals (intraday). They cooperate with TSOs in optimising interconnection capacity in the contex of market coupling.
PRIMES
A modelling tool used by the Commission, described in more detail in Annex IV.
PV
Photovoltaic
RED II
The Renewable Energy Package comprising the new Renewable Energy Directive and bioenergy sustainability policy for 2030
Redispatching
A measure activated by one or several system operators by altering the generation and/or load pattern in order to change physical flows in the transmission system and relieve a physical network congestion.
Regional platform
A platform or regionally coordinated platforms for the attribution of Long Term Cross Zonal Capacity for a single border or set of borders.
RES E
Renewable sources of electricity
RfG
Network code on Requirements for Grid Connection of Generators
ROC
Regional Operational Centre
RR
Replacement Reserve are reserves from reserve providers (generators, storage, demand response) used by TSOs to restore the required level of FCR and FRR due to their earlier usage. Contrary to FCR and FRR, not all TSOs in the EU maintain RR. This category includes operating reserves with activation time from several minutes up to hours.
RSC
Regional Security Coordinators, an entity foreseen under the System Operation Guidelines to assist TSOs in maintaining the operational security of the electricity system.
Sector Inquiry
The sector inquiry into capacity mechanisms as conducted by DG Competition of the European Commission
Smart meter
An
electronic
device that records consumption of
electric energy
in intervals of an hour or less and
communicates that information
at least daily back to the
utility
for monitoring and billing. Smart meters enable two-way communication between the meter and the central system.
SME
Small and Medium-sized Enterprises as defined in the Commission Recommendation of 6 May 2003 concerning the definition of micro, small and medium-sized enterprises (notified under document number C(2003) 1422), OJ L 124, 20.05.2003, p. 36-41.
SoS Directive
Security of Electricity Supply Directive or Directive 2005/89/EC of the European Parliament and of the Council of 18 January 2006 concerning measures to safeguard security of electricity supply and infrastructure investment, OJ L 33, 4.2.2006, p. 22–27
Supplier
Suppliers are active in the retail segment of the market and supply electricity to end-consumers
Switching rate
The percentage of consumers changing suppliers in any given year.
System Operation Guideline:
Draft Commission Regulation which will set down rules relating to the maintenance of the secure operation of the interconnected transmission system in real time.
TFEU
Treaty of the Functioning of the European Union
Third Package:
A package of legislation adopted in 2009 comprising the Electricity Directive, the Electricity Regulation, the ACER Regulation as well as similar legislation concerning the gas markets.
ToU tariffs
Time-of-Use tariffs: Time-based pricing is a pricing strategy where the provider of a service or supplier of a commodity, may vary the price depending on the time-of-day when the service is provided or the commodity is delivered.
Transmission capacity
The transmission capacity, also called TTC (Total Transfer Capacity), is the maximum transmission of active power in accordance with the system security criteria which is permitted in transmission cross-sections between the subsystems/areas or individual installations.
TRM
Transmission Reliability Margin, a metric to capture the amount of transmission transfer capability necessary to provide reasonable assurance that the interconnected transmission system will be secure during changing system conditions
TSO
Transmission System Operator, the entity that operates, maintains and develops the high voltage networks in a given area.
TYNDP
Ten-Year Network Development Plan
VCWG
The Vulnerable Consumer Working Group provides advice to the European Commission on the topics of consumer vulnerability and energy poverty, its membership comprising industry, consumer associations, regulators and Member States representatives.
VoLL
Value of Lost Load is a projected value reflecting the maximum price consumers are willing to pay to be supplied with electricity. VoLL is typically quite high (e.g. several thousands of EUR/MWh) and not necessarily the same for each (group of) consumer, thus enabling DR activation by consumers before the VoLL is reached.


